Table of Contents
SECURITIES AND EXCHANGE COMMISSION
Washington, D.C. 20549

FORM 6-K
REPORT OF FOREIGN PRIVATE ISSUER
Pursuant to Rule 13a-16 or 15d-16 of
the Securities Exchange Act of 1934
For the month of February, 2006
IMSA GROUP
(Translation of Registrant’s name into English)
GRUPO IMSA, S.A. DE C.V.
Ave. Batallón de San Patricio No. 111, Piso 26
Fracc. Valle Oriente
San Pedro Garza García, N.L. 66269, México
(Address of principal executive offices)
(Indicate by check mark whether the registrant files or will file annual reports under cover of Form 20-F or Form 40-F.)
Form 20-F x Form 40-F ¨
(Indicate by check mark whether the registrant by furnishing the information contained in this Form is also thereby furnishing the information to the Commission pursuant to Rule 12g3-2(b) under the Securities Exchange Act of 1934.)
Yes ¨ No x
Table of Contents
| 1. | Press Release issued on February 20, 2006, announcing results for the fourth quarter of 2005. |
Table of Contents
| Fourth Quarter 2005
BMV |
GRUPO IMSA ANNOUNCES FOURTH QUARTER 2005 RESULTS
Monterrey, Mexico, February 20, 2006 - Grupo Imsa, S.A. de C.V. (BMV: IMSA) today announced results for the fourth quarter of 2005.1
FOURTH QUARTER 2005 HIGHLIGHTS
 | After the restructuring announced in September 2005, this is the first quarter for which Grupo Imsa is posting results under the new organizational structure with two business segments: IMSA ACERO and IMSATEC. | |
| Once the spin-off of Grupo Imsa comes into effect, which is expected to occur in March 2006, the information presented on Grupo Imsa, S.A. de C.V. will correspond only to the IMSA ACERO segment of this report. All information presented on Verzatec, S.A. de C.V. will correspond to the IMSATEC segment. | |
| Fourth quarter 2005 primary cash flow (EBITDA) grew considerably for the third consecutive quarter, rising quarter-over-quarter in dollar terms by 36.9% toUS$141 and in pesos by 40.5% to a total ofPs 1,546. | |
| IMSA ACERO’s sales volume, which totaled 837 thousand tonnes, grew 25.2% compared to fourth quarter 2004 and 5.2% vs. the previous quarter. | |
| For fourth quarter 2005, IMSA ACERO posted a historic maximum EBITDA in dollar terms ofUS$129, representing a growth of 31.6% compared to fourth quarter 2004 and 50.0% vs. the previous quarter. | |
| Fourth quarter 2005 revenues in dollar terms totaledUS$945, an increase of 11.2% compared to the same period of 2004. In peso terms, revenues grew 4.1% year-over-year and 2.1% quarter-over-quarter toPs 10,229. | |
| As a result of Grupo Imsa’s ongoing efforts to enhance operating efficiency, operating expenses as a percent of sales declined from 8.3% in 2004 to 7.8% in 2005, while operating expenses in peso terms fell 2.0% in 2005. | |
| Net interest coverage defined as primary cash flow (EBITDA) divided by net interest expense was 16.7 times for the twelve months ended December 31, 2005, while the total debt to EBITDA ratio for the same period was1.02. | |
| Credit-rating agencies ratified their global scale rating of BBB and the Mexican domestic rating of AA+ for Grupo Imsa. | |
| 1 | Unless otherwise stated, all figures are presented in millions of December 31, 2005 pesos (Ps), or in millions of nominal U.S. dollars (US$). |
Please refer to the last page of this document for definitions of terms, U.S. dollar conversion methodology and other disclosures.
Page 1 of 15
Table of Contents
 | CONSOLIDATED FINANCIAL RESULTS |
Mr. Eugenio Clariond, Grupo Imsa’s Chairman of the Board and Chief Executive Officer, explained, “Grupo Imsa’s financial and operating results for fourth quarter 2005 were very promising, with the Company posting record levels in sales and profits. We have been able to increase the productivity and efficiency of our operations, particularly those of the IMSA ACERO companies where we posted a historic record EBITDA of US$129 for 4Q05.”
SALES
In dollar terms, Grupo Imsa’s revenues for the fourth quarter of 2005 (4Q05) grew 11.2% compared to fourth quarter 2004 (4Q04) and 0.4% vs. the third quarter of 2005 (3Q05), to US$945. In peso terms, net sales for 4Q05 totaled Ps 10,229, a growth of 4.1% over 4Q04 and 2.1% above 3Q05. The year-over-year revenue growth in dollar terms reflects an increase in sales volume for most steel-related products, as well as a rise in the price of some products. The quarter-over-quarter upswing in sales reflects growth in demand in the steel market.
For 4Q05, domestic sales amounted to Ps 5,490, 4.3% above 4Q04 and 10.4% more than 3Q05. Foreign sales for 4Q05 totaled Ps 4,739, an increase of 3.9% from 4Q04 but a decline of 6.1% compared to 3Q05. Foreign sales for the quarter represented 46.3% of total net sales.
The following is a breakdown by business segment for the quarter:
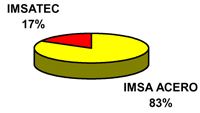
Sales | 4Q05 | 3Q05 | 4Q04 | 2005 | 2004 | |||||
IMSA ACERO | Ps 8,525 | Ps 8,355 | Ps 8,171 | Ps 32,638 | Ps 31,449 | |||||
IMSATEC | 1,704 | 1,663 | 1,654 | 6,544 | 6,348 | |||||
Total Net Sales | Ps 10,229 | Ps 10,018 | Ps 9,825 | Ps 39,182 | Ps 37,797 | |||||
TOTAL US$ Average | 945 | 941 | 850 | 3,572 | 3,234 |
OPERATING INCOME
Operating income in nominal dollar terms for 4Q05 grew 57.1% year-over-year and 52.8% quarter-over-quarter to US$110. Operating income for 4Q05 in peso terms was Ps 1,186, a growth of 41.4% vs. 4Q04 and of 50.9% over 3Q05. Grupo Imsa’s operating margin for the quarter was 11.6%, compared to 8.5% for 4Q04 and 7.9% for 3Q05.
Please refer to the last page of this document for definitions of terms, U.S. dollar conversion methodology and other disclosures.
Page 2 of 15
Table of Contents
OPERATING INCOME PLUS DEPRECIATION AND AMORTIZATION (EBITDA)
EBITDA in dollars for the fourth quarter of 2005 increased 30.6% year-over-year and 36.9% quarter-over-quarter to US$141. In pesos, EBITDA totaled Ps 1,546, a growth of 19.8% compared to 4Q04 and of 40.5% over 3Q05.
EBITDA contribution per business segment in 4Q05 was as follows:
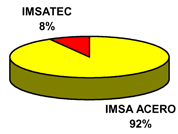
EBITDA | 4Q05 | 3Q05 | 4Q04 | 2005 | 2004 | ||||||||||
IMSA ACERO | Ps 1,417 | Ps 916 | Ps 1,172 | Ps 3,624 | Ps 4,727 | ||||||||||
IMSATEC | 129 | 184 | 118 | 571 | 555 | ||||||||||
TOTAL | Ps 1,546 | Ps 1,100 | Ps 1,290 | Ps 4,195 | Ps 5,282 | ||||||||||
TOTAL US$ Avg. | 141 | 103 | 108 | 381 | 449 | ||||||||||
EBITDA Margin | 15.1 | % | 10.9 | % | 13.1 | % | 10.7 | % | 13.9 | % |
INTEGRAL FINANCING COST (INCOME)
The integral financing cost for 4Q05 was Ps 30, compared to an income of Ps 100 in 4Q04 and a cost of Ps 10 in 3Q05. The main reason for the change in integral financing result compared to 3Q05 was a decline in the gain from monetary position because of the increase in cash and cash equivalents during 4Q05.
Interest expense for 4Q05 increased 28.6% from 4Q04 and 19.6% vs. 3Q05. The year-over-year and quarter-over-quarter growth in interest expense reflects rises in the Libor reference rate to which all the Company’s debt is linked.
Integral Financing Cost (Income) | 4Q05 | 3Q05 | 4Q04 | 2005 | 2004 | |||||||||||||||
Interest expense | $ | 90 | $ | 75 | $ | 70 | $ | 302 | $ | 349 | ||||||||||
Interest income | (22 | ) | (16 | ) | (12 | ) | (52 | ) | (60 | ) | ||||||||||
Foreign exchange loss (gain) | (17 | ) | (10 | ) | (69 | ) | (291 | ) | 25 | |||||||||||
Gain from monetary position | (21 | ) | (39 | ) | (89 | ) | (121 | ) | (297 | ) | ||||||||||
Integral financing cost (income) | $ | 30 | $ | 10 | $ | (100 | ) | $ | (162 | ) | $ | 17 | ||||||||
Please refer to the last page of this document for definitions of terms, U.S. dollar conversion methodology and other disclosures.
Page 3 of 15
Table of Contents
MAJORITY NET INCOME
For 4Q05, majority net income was Ps 766, compared to incomes of Ps 1,101 for 4Q04 and Ps 493 for 3Q05. The year-over-year decline in majority net income reflects an increase in integral financing cost and in the effective rate of the provision for taxes.
Majority Net Income | 4Q05 | 3Q05 | 4Q04 | 2005 | 2004 | |||||
Majority net income | Ps 766 | Ps 493 | Ps 1,101 | Ps 1,965 | Ps 2,991 | |||||
Majority net income per equity unit | Ps 1.37 | Ps 0.88 | Ps 1.97 | Ps 3.51 | Ps 5.34 |
As of December 31, 2005, Grupo Imsa had 2,800.1 million shares outstanding, equivalent to 560,031,158 UBC equity units.
FINANCIAL POSITION
Net debt as of December 31, 2005 was US$224, a decline of US$142 compared to net debt presented in the balance sheet as of September 30, 2005 and of US$163 compared to net debt as of December 31, 2004. Total debt as of December 31, 2005 was US$396, compared to a total debt of US$419 as of December 31, 2004 and of US$418 as of September 30, 2005.
Net interest coverage – defined as primary cash flow (EBITDA) divided by net interest expense – was 16.7 times for the twelve months ended December 31, 2005. The total debt to EBITDA ratio for the past twelve months was 1.02 as of December 31, 2005.
| Financial Results by Segment |
IMSA ACERO
As a result of the reorganization, the businesses making up IMSA ACERO are IMSA, APM, Multypanel, Varco Pruden México, Imsa Chile, Ingasa, Metl-Span, Steelscape, ASC Profiles and VP Buildings.
Sales
4Q05 sales volume was 837 thousand tonnes, an increase of 25.2% over 4Q04 and of 5.2% compared to 3Q05. Domestic shipments for the quarter totaled 534 thousand tonnes, 32.2% above 4Q04 and 6.7% more than 3Q05. Foreign volume amounted to 303 thousand tonnes for 4Q05, a growth of 14.6% over 4Q04 and of 2.8% versus 3Q05.
The year-over-year and quarter-over-quarter increases in sales volume largely reflect the increase in activity in the commercial, construction and industrial markets, particularly in applications for the appliance, automotive and electric motor sectors in Mexico.
The quarter-over-quarter rise in foreign volume was a result of factors that included the winter in the United States being relatively mild, so that non-residential construction and therefore the activities of IMSA ACERO’s businesses in the United States did not contract as they usually do in the fourth quarter of the year.
Please refer to the last page of this document for definitions of terms, U.S. dollar conversion methodology and other disclosures.
Page 4 of 15
Table of Contents
Net sales for 4Q05 reached Ps 8,525, an increase of 4.3% over 4Q04 and of 2.0% compared to 3Q05. The revenue growth reflects IMSA ACERO’s success in continuing to penetrate industrial sectors involved in new projects and in supplying new steel-consuming facilities.
Operating Income and EBITDA
Operating income was Ps 1,086, a growth of 46.6% over 4Q04 and of 71.8% versus 3Q05. 4Q05 operating margin was 12.7%, compared to margins of 9.1% for 4Q04 and 7.6% for 3Q05. EBITDA for 4Q05 was Ps 1,417, an increase of 20.9% with respect to 4Q04 and of 54.7% versus 3Q05.
IMSA ACERO’s 4Q05 results reflect an improvement in margins as a consequence of a decline in raw material costs. Additionally, IMSA ACERO began to implement a number of commercial strategies developed during 4Q05 as a result of the reorganization. These strategies will produce benefits that will be visible in the quarters to come.
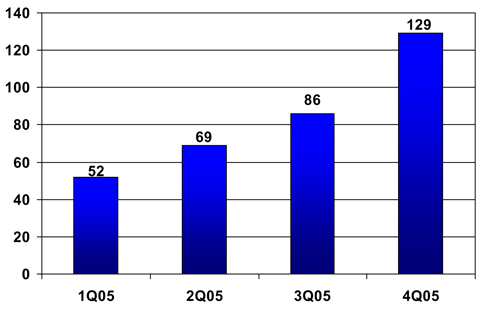
IMSA ACERO’s quarterly EBITDA grew continuously during 2005, with 4Q05 results being the highest of the year. The company expects first quarter 2006 EBITDA similar to that of 4Q05.
Quarterly EBITDA for 2005
(Millions of U.S. dollars)
Please refer to the last page of this document for definitions of terms, U.S. dollar conversion methodology and other disclosures.
Page 5 of 15
Table of Contents
IMSATEC
As a result of the reorganization, IMSATEC is now made up of the following businesses: Cuprum, Tiendas Alutodo, Ventanas, Louisville Ladder, Stabilit, Formet and Valmont Formet.
Sales
4Q05 revenues for IMSATEC totaled Ps 1,704, representing increases of 3.0% over 4Q04 and 2.5% versus 3Q05.
IMSATEC’s 4Q05 sales grew year-over-year and quarter-over-quarter in general terms as a consequence of most of its businesses posting increased sales volumes. Additionally, the construction market in Mexico has remained very strong and the prices of certain finished products have increased to reflect part of the rise in the cost of raw materials such as aluminum. However, sales fell quarter-over-quarter in the United States as a result of the third quarter of the year being seasonally stronger than the fourth for the U.S. ladder business.
During the past months, IMSATEC has redoubled its efforts to enhance customer service, which has resulted in growing sales and customer loyalty.
Operating Income and EBITDA
Operating income for 4Q05 was Ps 100, an increase of 2.0% over 4Q04 but a decline of 35.1% compared to 3Q05. Operating margin for the quarter was 5.9%, almost the same as in 4Q04 but lower than the 9.3% posted for 3Q05. EBITDA for the quarter was Ps 129, an increase of 9.3% vs. 4Q04 but a reduction of 29.9% with respect to 3Q05.
The year-over-year growth in IMSATEC’s operating income reflects economies of scale that were generated by increased sales. This business unit’s quarter-over-quarter performance was affected by the normal seasonal reduction in the industries in which it participates, combined with a significant rise in input costs, which limited the improvement in financial results.
IMSATEC expects to recover an important part of the margin lost in 4Q05 through a series of initiatives in the aluminum and reinforced plastic sheet businesses, such as an expense-reducing effort, the redesign of production processes and an increase in the sale of differentiated products.
IMSATEC will continue to reinforce its continuous improvement programs in its efforts to enhance its level of service, productivity and efficiency and to reduce operating expenses.
Please refer to the last page of this document for definitions of terms, U.S. dollar conversion methodology and other disclosures.
Page 6 of 15
Table of Contents
| Recent Corporate Developments |
Stockholders’ Meetings
In December 2005 Grupo Imsa held a number of Stockholders’ Meetings which approved the following points:
| 1. | The actualization of the registration of Grupo Imsa shares in the National Securities Registry, by virtue of the following resolutions adopted at the aforementioned Meetings: |
| a. | The conversion of Grupo Imsa’s Series C shares without voting rights into common or ordinary nominative shares with full voting rights, without the expression of par value and with free subscription; |
| b. | The separation and elimination of Grupo Imsa’s UBC equity units. |
| c. | The cancellation of the registration of Grupo Imsa’s Series C shares by virtue of their conversion to common shares. |
| d. | The consolidation or inverse split of Grupo Imsa’s capital structure, without any reduction in its capital stock, as a consequence of which currently existing Grupo Imsa shares will be exchanged for new shares in a five to one ratio. |
| 2. | The Grupo Imsa spin-off; with Grupo Imsa remaining after the split and with the creation of a new spun-off company called Verzatec, S.A. de C.V. |
| 3. | The payment of a cash dividend of Ps 0.35713 per outstanding share; this dividend was paid on January 4, 2006. |
It is important to note that the spin-off of Grupo Imsa is subject to authorization by the regulatory authorities, so that Verzatec, S.A. de C.V. will not be formally constituted until such authorization is received.
Ratification of Grupo Imsa’s Credit Rating
After the announcement of the spin-off from Grupo Imsa, the rating agencies ratified their credit rating of the splitting company. In December 2005, Standard & Poor’s confirmed its BBB global scale rating and its Mexican domestic rating of MxAA+. Fitch México also confirmed its Mexican domestic rating of AA+(mex) (Double A Plus).
Marcelo Canales, Grupo Imsa’s CFO, explained, “This rating reflects the strength of our business model and the Company’s capacity to generate cash flow.”
IMSA ACERO Invests in Capacity Expansion
IMSA ACERO will invest US$120 million to increase its production capacity of galvanized, pre-painted and cold-rolled steel sheet. The additional capacity will be installed at the company’s current facilities in Monterrey, Mexico.
The project includes a new continuous industrial line to galvanize and paint high-specification steel, thereby positioning the company to offer enhanced service to industrial markets such as the automotive, appliance and refrigeration sectors. The new production line will have the capacity to galvanize 300,000 tonnes of steel per year and will have the flexibility to paint 130,000 tonnes of
Please refer to the last page of this document for definitions of terms, U.S. dollar conversion methodology and other disclosures.
Page 7 of 15
Table of Contents
the total capacity. The company will begin implementing this project at the beginning of 2006 in order to have the new line operational by mid-2007. At the same time, IMSA ACERO will increase its cold-rolling capacity by 260,000 tonnes, which will be used to feed the new galvanizing and painting line.
Mr. Santiago Clariond, President and CEO of IMSA ACERO, explained, “This line, which will be the most advanced steel galvanizing and painting line in Mexico, reinforces IMSA ACERO’s commitment to serve the highest specification markets. Over the past few years, the domestic market for coated steel has grown considerably, driven by growth in industrial markets, where we have seen plants from other countries being relocated to Mexico in order to better serve the North American market. Additionally, we have been very successful in certifying our operations to supply these target markets, so it is very important that we plan the expansion of our installed capacity in order to continue capitalizing on market growth without affecting our level of service.”
* * *
Grupo Imsa, a holding company, dates back to 1936 and is today one of Mexico’s leading diversified industrial companies. With manufacturing and distribution facilities in Mexico, the United States, Spain, and throughout Central and South America, Grupo Imsa exports to all continents. In 2004 the Company’s sales reached 3.3 billion dollars, of which close to 50% was generated outside Mexico. Grupo Imsa shares are quoted on the Mexican Stock Market (IMSA).
Contacts:
Ruy Zavala, (52-81) 8153-8366
rzavala@grupoimsa.com
| Oscar | Villalobos, (52-81) 8153-8369 |
| oscar.villalobos@grupoimsa.com |
TABLES TO FOLLOW
Please refer to the last page of this document for definitions of terms, U.S. dollar conversion methodology and other disclosures.
Page 8 of 15
Table of Contents
GRUPO IMSA, S.A. DE C.V. AND SUBSIDIARIES
CONSOLIDATED BALANCE SHEETS
(Millions of Mexican pesos of
purchasing power as of December 31, 2005)
| December 2005 | December 2004 | |||||
ASSETS | ||||||
Current: | ||||||
Cash and cash equivalents | 1,847 | 366 | ||||
Accounts receivable-trade, net | 5,037 | 5,024 | ||||
Inventories | 7,574 | 8,959 | ||||
Other current assets | 1,853 | 1,235 | ||||
| 16,311 | 15,584 | |||||
Investments in shares | 14 | 126 | ||||
Property, plant and equipment | 18,003 | 18,665 | ||||
Other assets | 280 | 298 | ||||
Excess of cost over fair value of net assets acquired of subsidiaries | 1,134 | 1,158 | ||||
TOTAL ASSETS | 35,742 | 35,831 | ||||
LIABILITIES AND STOCKHOLDERS’ EQUITY | ||||||
Current: | ||||||
Current portion of long-term debt | 1,166 | 285 | ||||
Bank loans | 396 | 312 | ||||
Accounts payable-trade | 3,012 | 3,038 | ||||
Advances from clients | 296 | 492 | ||||
Other accounts payable and accrued liabilities | 3,315 | 1,794 | ||||
| 8,185 | 5,921 | |||||
Lont-term debt | 2,702 | 4,210 | ||||
Deferred taxes | 4,329 | 4,576 | ||||
Other long-term liabilities | 467 | 343 | ||||
| 7,498 | 9,129 | |||||
TOTAL LIABILITIES | 15,683 | 15,050 | ||||
Excess of fair value of net assets acquired over cost of subsidiaries | 58 | 56 | ||||
Stockholders’ equity: | ||||||
Common stock | 5,398 | 5,398 | ||||
Additional paid-in capital | 3,165 | 3,165 | ||||
Reserve for repurchase of own shares | 142 | 142 | ||||
Retained earnings | 23,520 | 22,964 | ||||
Insufficiency in capital restatement | (8,275 | ) | (6,995 | ) | ||
Initial deferred tax effect | (3,949 | ) | (3,949 | ) | ||
Majority interest | 20,001 | 20,725 | ||||
Minority interest | — | — | ||||
TOTAL STOCKHOLDERS’ EQUITY | 20,001 | 20,725 | ||||
TOTAL LIABILITIES AND STOCKHOLDERS’ EQUITY | 35,742 | 35,831 | ||||
Please refer to the last page of this document for definitions of terms, U.S. dollar conversion methodology and other disclosures.
Page 9 of 15
Table of Contents
GRUPO IMSA, S.A. DE C.V. AND SUBSIDIARIES
CONSOLIDATED STATEMENTS OF OPERATIONS
(Millions of Mexican pesos of purchasing power
as of December 31, 2005)
| % Change | ||||||||||||||||||||||||
| 4Q05 | 3Q05 | 4Q04 | 2005 | 2004 | 4Q05/4Q04 | 4Q05/3Q05 | 2005 /2004 | |||||||||||||||||
Net sales | 10,229 | 10,018 | 9,825 | 39,182 | 37,797 | 4.1 | % | 2.1 | % | 3.7 | % | |||||||||||||
Domestic sales | 5,490 | 4,973 | 5,262 | 20,045 | 19,132 | 4.3 | % | 10.4 | % | 4.8 | % | |||||||||||||
Foreign sales | 4,739 | 5,045 | 4,563 | 19,137 | 18,665 | 3.9 | % | -6.1 | % | 2.5 | % | |||||||||||||
Cost of sales | 8,178 | 8,487 | 8,135 | 33,247 | 30,932 | 0.5 | % | -3.6 | % | 7.5 | % | |||||||||||||
Operating expenses | 865 | 745 | 851 | 3,063 | 3,125 | 1.6 | % | 16.1 | % | -2.0 | % | |||||||||||||
OPERATING INCOME | 1,186 | 786 | 839 | 2,872 | 3,740 | 41.4 | % | 50.9 | % | -23.2 | % | |||||||||||||
Interest expense | 90 | 75 | 70 | 302 | 349 | 28.6 | % | 19.6 | % | -13.5 | % | |||||||||||||
Interest income | (22 | ) | (16 | ) | (12 | ) | (52 | ) | (60 | ) | 83.3 | % | 38.8 | % | -13.3 | % | ||||||||
Foreign exchange loss (gain) | (17 | ) | (10 | ) | (69 | ) | (291 | ) | 25 | 72.1 | % | |||||||||||||
Gain from monetary position | (21 | ) | (39 | ) | (89 | ) | (121 | ) | (297 | ) | -76.4 | % | -46.5 | % | -59.3 | % | ||||||||
INTEGRAL FIN. COST, NET | 30 | 10 | (100 | ) | (162 | ) | 17 | -130.0 | % | |||||||||||||||
Other expenses net | 46 | 24 | 74 | 79 | 164 | -37.8 | % | 91.7 | % | -51.8 | % | |||||||||||||
INCOME BEFORE INCOME TAXES AND EMPLOYEES’ PROFIT SHARING | 1,110 | 752 | 865 | 2,955 | 3,559 | 28.3 | % | 47.7 | % | -17.0 | % | |||||||||||||
Income Taxes | 361 | 245 | (148 | ) | 963 | 768 | -343.9 | % | 47.6 | % | 25.4 | % | ||||||||||||
Employees’ profit sharing | (17 | ) | 14 | (11 | ) | 27 | 13 | 54.5 | % | -221.4 | % | 107.7 | % | |||||||||||
INCOME BEFORE DISCONTINUED OPERATIONS | 766 | 493 | 1,024 | 1,965 | 2,778 | -25.2 | % | 55.3 | % | -29.3 | % | |||||||||||||
Discontinued operations | 0 | 0 | 76 | 0 | 323 | |||||||||||||||||||
CONSOLIDATED NET INCOME | 766 | 493 | 1,100 | 1,965 | 3,101 | -30.4 | % | 55.3 | % | -36.6 | % | |||||||||||||
Net income of minority interest | 0 | 0 | (1 | ) | 0 | 110 | ||||||||||||||||||
Net income of majority interest | 766 | 493 | 1,101 | 1,965 | 2,991 | -30.4 | % | 55.3 | % | -34.3 | % | |||||||||||||
Please refer to the last page of this document for definitions of terms, U.S. dollar conversion methodology and other disclosures.
Page 10 of 15
Table of Contents
GRUPO IMSA, S.A. DE C.V. AND SUBSIDIARIES
CONSOLIDATED STATEMENTS OF CHANGES IN FINANCIAL POSITION
(Millions of Mexican pesos of
purchasing power as of December 31, 2005)
| December 2005 | December 2004 | |||||
OPERATING ACTIVITIES: | ||||||
CONSOLIDATED NET INCOME | 1,965 | 3,101 | ||||
ITEMS NOT (GENERATING) REQUIRING RESOURCES: | ||||||
Depreciation and amortization | 1,323 | 1,542 | ||||
Amoritzation of excess of fair value of net assets acquired over cost of subsidiaries, net | — | 18 | ||||
Others | 54 | 572 | ||||
| 3,342 | 5,233 | |||||
CHANGES IN CURRENT ASSETS AND LIABILITIESNET OF EFFECTS FROM BUSINESSES ACQUIRED: | ||||||
Accounts receivable-trade | (12 | ) | (1,111 | ) | ||
Inventories | 423 | (3,581 | ) | |||
Other current assets | (617 | ) | (142 | ) | ||
Accounts payable-trade | (27 | ) | (335 | ) | ||
Advances from clients | (196 | ) | 227 | |||
Other accounts payable and accrued liabilities | 521 | 811 | ||||
| 92 | (4,131 | ) | ||||
RESOURCES GENERATED FROM OPERATING ACTIVITIES | 3,434 | 1,102 | ||||
FINANCING ACTIVITIES: | ||||||
Proceeds (Payments) of short-term bank loans | 964 | 2 | ||||
Proceeds (Payments) from borrowings from banks and issuance of long-term debt | (1,508 | ) | (4,219 | ) | ||
Common dividends paid | (402 | ) | (1,014 | ) | ||
Others | — | (1,093 | ) | |||
RESOURCES GENERATED FROM FINANCING ACTIVITIES | (946 | ) | (6,324 | ) | ||
INVESTING ACTIVITIES: | ||||||
Acquisition of property, plant and equipment | (1,093 | ) | (1,263 | ) | ||
Acquisition of companies and minority interest | — | 3,225 | ||||
Other assets | 86 | 2,735 | ||||
RESOURCES USED IN INVESTING ACTIVITIES | (1,007 | ) | 4,697 | |||
(DECREASE) INCREASE IN CASH AND CASH EQUIVALENTS | 1,481 | (527 | ) | |||
Cash and cash equivalents at beginning of period | 366 | 893 | ||||
CASH AND CASH EQUIVALENTS AT END OF PERIOD | 1,847 | 366 | ||||
Please refer to the last page of this document for definitions of terms, U.S. dollar conversion methodology and other disclosures.
Page 11 of 15
Table of Contents
GRUPO IMSA S.A. DE C.V. AND SUBSIDIARIES
RELATED BUSINESS GROUP INFORMATION
(Millions of Mexican pesos of purchasing power as of December 31, 2005)
| 4Q05 | 3Q05 | 4Q04 | 2005 | 2004 | 4Q05/4Q04 | 4Q05/3Q05 | 2005/2004 | |||||||||||||||||
IMSA ACERO | ||||||||||||||||||||||||
DOMESTIC SALES | 4,574 | 4,186 | 4,452 | 16,777 | 16,132 | 2.7 | % | 9.3 | % | 4.0 | % | |||||||||||||
FOREIGN SALES | 3,951 | 4,169 | 3,719 | 15,861 | 15,317 | 6.2 | % | -5.2 | % | 3.6 | % | |||||||||||||
% Export/Sales | 46.3 | % | 49.9 | % | 45.5 | % | 48.6 | % | 48.7 | % | ||||||||||||||
NET SALES | 8,525 | 8,355 | 8,171 | 32,638 | 31,449 | 4.3 | % | 2.0 | % | 3.8 | % | |||||||||||||
COST OF SALES | 6,813 | 7,187 | 6,769 | 27,972 | 25,824 | 0.7 | % | -5.2 | % | 8.3 | % | |||||||||||||
OPERATING EXPENSES | 626 | 536 | 661 | 2,256 | 2,350 | -5.3 | % | 16.8 | % | -4.0 | % | |||||||||||||
OPERATING INCOME | 1,086 | 632 | 741 | 2,410 | 3,275 | 46.6 | % | 71.8 | % | -26.4 | % | |||||||||||||
OPERATING MARGIN | 12.7 | % | 7.6 | % | 9.1 | % | 7.4 | % | 10.4 | % | ||||||||||||||
EBITDA | 1,417 | 916 | 1,172 | 3,624 | 4,727 | 20.9 | % | 54.7 | % | -23.3 | % | |||||||||||||
EBITDA MARGIN | 16.6 | % | 11.0 | % | 14.3 | % | 11.1 | % | 15.0 | % | ||||||||||||||
IMSATEC | ||||||||||||||||||||||||
DOMESTIC SALES | 916 | 787 | 810 | 3,268 | 3,000 | 13.1 | % | 16.4 | % | 8.9 | % | |||||||||||||
FOREIGN SALES | 788 | 876 | 844 | 3,276 | 3,348 | -6.6 | % | -10.0 | % | -2.2 | % | |||||||||||||
% Export/Sales | 46.2 | % | 52.7 | % | 51.0 | % | 50.1 | % | 52.7 | % | ||||||||||||||
NET SALES | 1,704 | 1,663 | 1,654 | 6,544 | 6,348 | 3.0 | % | 2.5 | % | 3.1 | % | |||||||||||||
COST OF SALES | 1,366 | 1,300 | 1,367 | 5,275 | 5,108 | -0.1 | % | 5.1 | % | 3.3 | % | |||||||||||||
OPERATING EXPENSES | 238 | 209 | 189 | 807 | 774 | 25.9 | % | 13.9 | % | 4.3 | % | |||||||||||||
OPERATING INCOME | 100 | 154 | 98 | 462 | 466 | 2.0 | % | -35.1 | % | -0.9 | % | |||||||||||||
OPERATING MARGIN | 5.9 | % | 9.3 | % | 5.9 | % | 7.1 | % | 7.3 | % | ||||||||||||||
EBITDA | 129 | 184 | 118 | 571 | 555 | 9.3 | % | -29.9 | % | 2.9 | % | |||||||||||||
EBITDA MARGIN | 7.6 | % | 11.1 | % | 7.1 | % | 8.7 | % | 8.7 | % | ||||||||||||||
Please refer to the last page of this document for definitions of terms, U.S. dollar conversion methodology and other disclosures.
Page 12 of 15
Table of Contents
SALES VOLUME
| 4Q05 | 3Q05 | 4Q04 | 2005 | 2004 | ||||||
STEEL PROCESSING IMSA ACERO (Tonnes) | ||||||||||
Domestic Sales Volume | 533,876 | 500,517 | 403,960 | 1,847,573 | 1,680,285 | |||||
Exports and Foreign Subsidiaries | 303,356 | 294,995 | 264,804 | 1,163,666 | 1,204,804 | |||||
Sales Volume | ||||||||||
TOTAL IMSA ACERO | 837,232 | 795,512 | 668,763 | 3,011,239 | 2,885,089 | |||||
| 4Q05 | 3Q05 | 4Q04 | 2005 | 2004 | ||||||
IMSATEC Aluminum (Tonnes) | ||||||||||
TOTAL ALUMINUM | 15,329 | 14,660 | 14,534 | 57,996 | 59,574 | |||||
Please refer to the last page of this document for definitions of terms, U.S. dollar conversion methodology and other disclosures.
Page 13 of 15
Table of Contents
Selected Financial Information
Income Statement
US$ Millions(1)
| 4Q05 | 3Q05 | 2Q05 | 1Q05 | 4Q04 | 2005 | 2004 | ||||||||
Net Sales | ||||||||||||||
IMSA ACERO | 788 | 785 | 731 | 678 | 707 | 2,982 | 2,691 | |||||||
IMSATEC | 157 | 156 | 147 | 130 | 143 | 590 | 543 | |||||||
Grupo Imsa | 945 | 941 | 878 | 808 | 850 | 3,572 | 3,234 | |||||||
Operating Income | ||||||||||||||
IMSA ACERO | 101 | 58 | 43 | 24 | 62 | 226 | 280 | |||||||
IMSATEC | 9 | 14 | 9 | 3 | 8 | 35 | 37 | |||||||
Grupo Imsa | 110 | 72 | 52 | 27 | 70 | 261 | 317 | |||||||
EBITDA | ||||||||||||||
IMSA ACERO | 129 | 86 | 69 | 52 | 98 | 336 | 404 | |||||||
IMSATEC | 12 | 17 | 11 | 5 | 10 | 45 | 45 | |||||||
Grupo Imsa | 141 | 103 | 80 | 57 | 108 | 381 | 449 | |||||||
| (1) | Peso figures converted into dollars by dividing the monthly nominal pesos by the average monthly exchange rate. |
Please refer to the last page of this document for definitions of terms, U.S. dollar conversion methodology and other disclosures.
Page 14 of 15
Table of Contents
Disclosures and Definitions
Methodology used for consolidation and presentation of results and other important disclosures
Grupo Imsa consolidates its results in Mexican pesos using Mexican generally accepted accounting principles (Mexican GAAP). Figures in this document are presented in millions of Mexican pesos as of December 31, 2005 (Ps), unless otherwise specified.
In compliance with Bulletin B-15, “Foreign Currency Translation of Foreign Currency Financial Statements,” the restatement factors applied to financial statements of prior periods are calculated on the basis of a weighted average index that takes into consideration the inflation rates of the countries in which Grupo Imsa’s subsidiaries operate and changes in the exchange rates of each country vis-à-vis the Mexican peso. The restatement factor for the twelve-month period of December 2004 – December 2005 was 1.019472; for the three-month period of September 2005 – December 2005, it was 1.0050971.
For the convenience of the reader, this document contains U.S. dollar amounts for Grupo Imsa and its business segments. The conversion from Mexican pesos to U.S. dollars is carried out by dividing nominal monthly peso amounts of the financial statements by the average Mexican peso – U.S. dollar exchange rate for that month, and then adding the results of the divisions into quarterly or accumulated figures. U.S. dollar (US$) figures in this document are presented in millions, unless otherwise specified.
Fourth quarter 2005 (4Q05) inflation was 1.5%, resulting in an inflation rate of 3.3% for the last twelve months. The Mexican peso depreciated 0.6% against the U.S. dollar during 4Q05 but has appreciated 4.3% over the past twelve months. The exchange rate used as of December 31, 2005 was 10.7777 pesos per dollar. Since the price and cost structure of Grupo Imsa is mainly denominated in dollars, the performance of the Company is affected when financial information is expressed in real pesos.
The term EBITDA is used throughout this document because Grupo Imsa believes it is a widely accepted financial indicator of its ability to generate cash flow to operate, fund capital expenditures, pay taxes, service or incur debt, and pay dividends. EBITDA should not be considered as an indicator of Grupo Imsa’s financial performance, as a measure of liquidity or as a substitute for the statement of changes in financial position. EBITDA can be reconciled by adding operating income to depreciation and operating amortization, all of which are concepts accepted under Mexican GAAP.
Effective on July 1, 2004, Grupo Imsa, through its battery subsidiary Enermex, S.A. de C.V., divested its automotive battery business, ceding its interest to Johnson Controls, Inc., the company that had been its minority partner since 1998. In accordance with the interpretation of the related accounting bulletins, this transaction was classified as a stockholders’ equity operation and therefore is presented as part of the stockholders’ equity. For purposes of analysis and comparability, the results of the divested companies are presented under a single heading in the Income Statement as “Discontinued operations”. Additionally, all prior years’ operations of such companies were restructured as “Discontinued operations” and are presented as such in the attached financial statements.
This document contains forward-looking statements relating to Grupo Imsa’s future performance or its current expectations or beliefs. These include statements regarding the intent, belief or current expectations of the Company and its management. Investors are cautioned that any such forward-looking statements are not guarantees of future performance and involve a number of risks and uncertainties pertaining to the industries in which the Company participates. Grupo Imsa does not intend, and does not assume any obligation, to update these forward-looking statements.
Definition of terms
EBITDA: Operating income plus depreciation and operating amortization
Net Debt: Total debt, minus cash and cash equivalents
Net Interest Coverage: EBITDA divided by (interest expense minus interest income)
Please refer to the last page of this document for definitions of terms, U.S. dollar conversion methodology and other disclosures.
Page 15 of 15
Table of Contents
SIGNATURE
Pursuant to the requirements of the Securities Exchange Act of 1934, the registrant has duly caused this report to be signed on its behalf by the undersigned, thereunto duly authorized.
| GRUPO IMSA, S.A. DE C.V. | ||||
| (Registrant) | ||||
| Dated: February 23, 2006 | By: | /s/ MARCELO CANALES CLARIOND | ||
Name: Title: | Marcelo Canales Clariond Chief Financial Officer | |||