UNITED STATES
SECURITIES AND EXCHANGE COMMISSION
Washington, D.C. 20549
FORM N-CSRS
CERTIFIED SHAREHOLDER REPORT OF REGISTERED MANAGEMENT
INVESTMENT COMPANIES
Investment Company Act file number 811-07923
City National Rochdale Funds
(Exact name of registrant as specified in charter)
400 North Roxbury Drive
Beverly Hills, California 90210
(Address of principal executive offices) (Zip code)
Leigh Muniz, Esq.
400 North Roxbury Drive
Beverly Hills, CA 90210
(Name and address of agent for service)
Registrant’s telephone number, including area code: 1-888-889-0799
Date of fiscal year end: September 30, 2019
Date of reporting period: March 31, 2019
Item 1. Reports to Stockholders.
The registrant’s schedules as of the close of the reporting period, as set forth in §§ 210.12-12 through 210.12-14 of Regulation S-X [17 CFR §§ 210-12.12-12.14], are attached hereto.
Beginning on January 1, 2021, as permitted by regulations adopted by the Securities and Exchange Commission, paper copies of each Fund’s shareholder reports will no longer be sent by mail, unless you specifically request paper copies of the reports from the Fund, if you hold your shares directly with the Fund, or from your financial intermediary, such as a broker-dealer or bank, if you hold your shares through a financial intermediary. Instead, the reports will be made available on a website, and you will be notified by mail each time a report is posted and provided with a website link to access the report.
If you already elected to receive shareholder reports electronically, you will not be affected by this change and you need not take any action. If you hold your shares directly with a Fund, you may elect to receive shareholder reports and other communications from the Fund electronically by contacting the Fund at (866) 209-1967 or, if you hold your shares through a financial intermediary, contacting your financial intermediary.
You may elect to receive all future reports in paper free of charge. If you hold your shares directly with a Fund, you can inform the Fund that you wish to continue receiving paper copies of your shareholder reports by contacting the Fund at (866) 209-1967 or, if you hold your shares through a financial intermediary, by contacting your financial intermediary. Your election to receive reports in paper will apply to all of the City National Rochdale Funds you hold directly or through your financial intermediary, as applicable.
TABLE OF CONTENTS
| | City National Rochdale Funds Semi-Annual Report |
| | |
2 | Schedule of Investments/Consolidated Schedule of Investments |
115 | Statements of Assets and Liabilities/Consolidated Statement of Assets and Liabilities |
118 | Statements of Operations/Consolidated Statement of Operations |
122 | Statements of Changes in Net Assets/Consolidated Statements of Changes in Net Assets |
126 | Consolidated Statement of Cash Flows |
128 | Financial Highlights/Consolidated Financial Highlights |
131 | Notes to Financial Statements/Consolidated Notes to Financial Statements |
145 | Disclosure of Fund Expenses |
148 | Board Approval of Advisory and Sub-Advisory Agreements |
The Funds file their complete schedules of portfolio holdings with the Securities and Exchange Commission (the “Commission”) for the first and third quarters of each fiscal year on Form N-Q within 60 days after the end of the period. The Funds’ Form N-Q filings are available on the Commission’s website at http://www.sec.gov, and may be reviewed and copied at the Commission’s Public Reference Room in Washington, DC. Information on the operation of the Public Reference Room may be obtained by calling 1-800-SEC-0330. The most current Form N-Q filing is also available on the Funds’ website at www.citynationalrochdalefunds.com and without charge, upon request, by calling 1-888-889-0799. After April 1, 2019, the Funds will begin submitting their complete schedules of portfolio holdings on Form N-PORT with the Commission for each month in a fiscal quarter within 60 days after the end of that fiscal quarter, and the Funds will no longer utilize Form N-Q.
A description of the policies and procedures that the Funds use to determine how to vote proxies relating to the Funds’ portfolio securities, and information on how the Funds voted proxies relating to portfolio securities during the most recent 12-month period ended June 30 is available (1) without charge, upon request, by calling 1-888-889-0799, (2) on the Funds’ website at www.citynationalrochdalefunds.com, and (3) on the Commission’s website at www.sec.gov.
CITY NATIONAL ROCHDALE FUNDS | PAGE 1
schedule of investments |
March 31, 2019 (Unaudited) |
City National Rochdale Government Money Market Fund |
Description | | Face Amount (000) | | | Value (000) | |
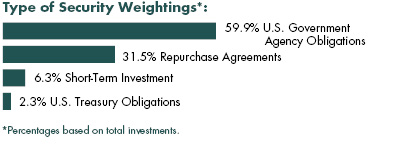
U.S. Government Agency Obligations [59.9%] |
FAMC, MTN | | | | | | | | |
2.436%, VAR ICE LIBOR USD 1 Month+-0.050%, 06/25/19 | | $ | 50,000 | | | $ | 50,000 | |
FFCB | | | | | | | | |
2.385%, VAR US Federal Funds Effective Rate+-0.025%, 04/25/19 | | | 50,000 | | | | 50,000 | |
2.500%, VAR US Treasury 3 Month Bill Money Market Yield+0.075%, 11/01/19 | | | 50,000 | | | | 49,998 | |
2.446%, VAR ICE LIBOR USD 1 Month+-0.040%, 06/25/20 | | | 56,000 | | | | 55,987 | |
FHLB | | | | | | | | |
2.491%, 05/24/19 | | | 50,000 | | | | 50,003 | |
2.396%, VAR ICE LIBOR USD 1 Month+-0.100%, 05/28/19 | | | 50,000 | | | | 50,000 | |
2.356%, VAR ICE LIBOR USD 1 Month+-0.125%, 06/07/19 | | | 50,000 | | | | 50,000 | |
2.396%, VAR ICE LIBOR USD 1 Month+-0.090%, 07/25/19 | | | 50,000 | | | | 50,000 | |
2.449%, VAR ICE LIBOR USD 3 Month+-0.245%, 08/16/19 | | | 50,000 | | | | 50,000 | |
2.411%, VAR ICE LIBOR USD 1 Month+-0.075%, 10/25/19 | | | 50,000 | | | | 50,000 | |
2.436%, VAR ICE LIBOR USD 1 Month+-0.060%, 10/28/19 | | | 100,000 | | | | 100,000 | |
2.419%, VAR ICE LIBOR USD 1 Month+-0.080%, 11/13/19 | | | 11,000 | | | | 11,000 | |
2.495%, VAR United States Secured Overnight Financing Rate+0.065%, 11/15/19 | | | 20,000 | | | | 20,000 | |
2.395%, VAR ICE LIBOR USD 1 Month+-0.095%, 01/02/20 | | | 50,000 | | | | 50,000 | |
2.417%, VAR ICE LIBOR USD 1 Month+-0.065%, 02/05/20 | | | 50,000 | | | | 50,000 | |
2.493%, VAR ICE LIBOR USD 3 Month+-0.200%, 02/14/20 | | | 50,000 | | | | 50,000 | |
2.423%, VAR ICE LIBOR USD 1 Month+-0.065%, 02/20/20 | | | 50,000 | | | | 50,000 | |
2.475%, VAR ICE LIBOR USD 1 Month+-0.015%, 06/04/20 | | | 50,000 | | | | 50,000 | |
FHLB DN (A) | | | | | | | | |
2.437%, 04/10/19 | | | 100,000 | | | | 99,940 | |
2.414%, 04/17/19 | | | 98,000 | | | | 97,895 | |
2.423%, 04/22/19 | | | 150,000 | | | | 149,789 | |
2.420%, 04/24/19 | | | 150,000 | | | | 149,769 | |
2.421%, 04/26/19 | | | 100,000 | | | | 99,833 | |
2.437%, 05/03/19 | | | 150,000 | | | | 149,677 | |
2.466%, 05/10/19 | | | 114,000 | | | | 113,698 | |
2.472%, 05/15/19 | | | 100,000 | | | | 99,700 | |
2.516%, 05/17/19 | | | 50,000 | | | | 49,841 | |
5.522%, 05/22/19 | | | 50,000 | | | | 49,824 | |
2.527%, 05/24/19 | | | 100,000 | | | | 99,633 | |
2.484%, 05/29/19 | | | 100,000 | | | | 99,604 | |
2.442%, 05/31/19 | | | 50,000 | | | | 49,798 | |
2.542%, 06/05/19 | | | 28,000 | | | | 27,873 | |
2.435%, 06/07/19 | | | 100,000 | | | | 99,550 | |
2.512%, 06/19/19 | | | 15,000 | | | | 14,918 | |
FNMA | | | | | | | | |
2.530%, VAR United States Secured Overnight Financing Rate+0.100%, 04/30/20 | | | 40,000 | | | | 40,000 | |
2.450%, VAR United States Secured Overnight Financing Rate+0.060%, 07/30/20 | | | 25,000 | | | | 25,000 | |
Tennessee Valley Authority DN (A) | | | | | | | | |
2.412%, 04/02/19 | | | 100,000 | | | | 99,994 | |
2.423%, 04/09/19 | | | 100,000 | | | | 99,946 | |
| | | | | | | | | |
Total U.S. Government Agency Obligations |
(Cost $2,603,270) | | | 2,603,270 | |
| | | | | | | | | |
U.S. Treasury Obligation [2.3%] |
United States Treasury Bill, 2.371%(A) | | | 100,000 | | | | 99,993 | |
| | | | | | | | | |
Total U.S. Treasury Obligation |
(Cost $99,993) | | | 99,993 | |
| | | | | | | | | |
See accompanying notes to financial statements.
CITY NATIONAL ROCHDALE FUNDS | PAGE 2
schedule of investments |
March 31, 2019 (Unaudited) |
City National Rochdale Government Money Market Fund(concluded) |
Description | | Shares/Face Amount (000) | | | Value (000) | |
Short-Term Investment [6.3%] |
Morgan Stanley Institutional Liquidity Funds - Government Portfolio, 2.290%** | | | 275,581,441 | | | $ | 275,582 | |
| | | | | | | | | |
Total Short-Term Investment |
(Cost $275,582) | | | 275,582 | |
| | | | | | | | | |
Repurchase Agreements [31.5%] |
Daiwa (B) | | | | | | | | |
2.500%, dated 3/29/19, repurchased on 4/1/19, repurchase price $60,012,000 (collateralized by various U.S. Government obligations, par values ranging from $20,400 to $14,161,000, 0.000% - 6.000%, 4/30/19 - 3/20/49; with a total market value of $61,393,360) | | $ | 60,000 | | | | 60,000 | |
Barclays (B) | | | | | | | | |
2.550%, dated 3/29/19, repurchased on 4/1/19, repurchase price $75,015,000 (collateralized by U.S. Government obligations, par value $66,133,500, 3.625%, 2/15/44; with a total market value of $76,500,111) | | | 75,000 | | | | 75,000 | |
Barclays (B) | | | | | | | | |
2.400%, dated 3/29/19, repurchased on 4/1/19, repurchase price $457,091,400 (collateralized by various U.S. Government obligations, par values ranging from $133,220,700 to $309,140,300, 3.000%, 9/30/25 - 2/15/47; with a total market value of $466,140,022) | | | 457,000 | | | | 457,000 | |
Goldman Sachs (B) | | | | | | | | |
2.510%, dated 3/29/19, repurchased on 4/1/19, repurchase price $125,026,146 (collateralized by various U.S. Government obligations, par values ranging from $2 to $100,000,000, 0.000% - 6.250%, 6/22/21 - 11/16/37; with a total market value of $127,500,000) | | | 125,000 | | | | 125,000 | |
| | | | | | | |
Description | | Face Amount (000) | | | Value (000) | |
Wells Fargo (B) | | | | | | | | |
2.610%, dated 3/29/19, repurchased on 4/1/19, repurchase price $650,130,000 (collateralized by various U.S. Government obligations, par values ranging from $1,000 to $250,748,226, 0.000% - 6.000%, 4/5/19 - 4/1/49; with a total market value of $663,000,000) | | $ | 650,000 | | | | 650,000 | |
| | | | | | | | | |
Total Repurchase Agreements |
(Cost $1,367,000) | | | 1,367,000 | |
| | | | | | | | | |
Total Investments [100.0%] |
(Cost $4,345,845) | | $ | 4,345,845 | |
Percentages are based on net assets of $4,343,975 (000).
** | The rate reported is the 7-day effective yield as of March 31, 2019. |
(A) | Zero coupon security. The rate reported is the effective yield at time of purchase. |
(B) | Tri-party Repurchase Agreement. |
DN — Discount Note
FAMC — Federal Agriculture Mortgage Corporation
FFCB — Federal Farm Credit Bank
FHLB — Federal Home Loan Bank
FNMA — Federal National Mortgage Association
ICE — Intercontinental Exchange
LIBOR — London Interbank Offered Rates
MTN — Medium Term Note
USD — U.S. Dollar
VAR — Variable
The following is a list of the inputs used as of March 31, 2019, in valuing the Fund’s investments carried at value (000):
Investments in Securities | | Level 1 | | | Level 2 | | | Level 3 | | | Total | |
U.S. Government Agency Obligations | | $ | — | | | $ | 2,603,270 | | | $ | — | | | $ | 2,603,270 | |
U.S. Treasury Obligation | | | — | | | | 99,993 | | | | — | | | | 99,993 | |
Short-Term Investment | | | 275,582 | | | | — | | | | — | | | | 275,582 | |
Repurchase Agreements | | | — | | | | 1,367,000 | | | | — | | | | 1,367,000 | |
Total Investments in Securities | | $ | 275,582 | | | $ | 4,070,263 | | | $ | — | | | $ | 4,345,845 | |
For the period ended March 31, 2019, there have been no transfers between any of the fair value hierarchy levels. Transfers between levels are recognized at period end.
Amounts designated as “—” are either $0 or have been rounded to $0.
For more information on valuation inputs, see Note 2 – Significant Accounting Policies in the Notes to Financial Statements.
See accompanying notes to financial statements.
CITY NATIONAL ROCHDALE FUNDS | PAGE 3
schedule of investments |
March 31, 2019 (Unaudited) |
City National Rochdale Government Bond Fund |
Description | | Face Amount (000) | | | Value (000) | |
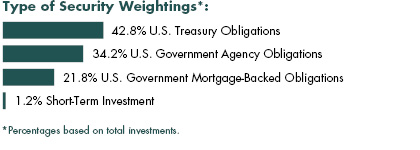
U.S. Treasury Obligations [42.8%] |
U.S. Treasury Inflation Indexed Bonds | | | | | | | | |
0.125%, 04/15/20 | | $ | 830 | | | $ | 888 | |
U.S. Treasury Notes | | | | | | | | |
2.375%, 12/31/20 | | | 1,655 | | | | 1,657 | |
2.000%, 11/30/20 | | | 2,500 | | | | 2,486 | |
1.875%, 05/31/22 | | | 4,365 | | | | 4,317 | |
1.875%, 08/31/24 | | | 2,805 | | | | 2,749 | |
1.500%, 01/31/22 | | | 5,500 | | | | 5,388 | |
1.375%, 10/31/20 | | | 1,500 | | | | 1,477 | |
| | | | | | | | | |
Total U.S. Treasury Obligations |
(Cost $19,145) | | | 18,962 | |
| | | | | | | | | |
U.S. Government Agency Obligations [34.3%] |
FFCB | | | | | | | | |
2.678%, VAR ICE LIBOR USD 1 Month+0.190%, 09/20/19 | | | 4,900 | | | | 4,905 | |
FHLB | | | | | | | | |
3.375%, 09/08/23 | | | 1,585 | | | | 1,658 | |
3.125%, 09/09/22 | | | 1,610 | | | | 1,654 | |
1.375%, 09/13/19 | | | 2,095 | | | | 2,085 | |
FNMA | | | | | | | | |
1.250%, 08/17/21 | | | 5,000 | | | | 4,878 | |
| | | | | | | | | |
Total U.S. Government Agency Obligations |
(Cost $15,261) | | | 15,180 | |
| | | | | | | | | |
U.S. Government Mortgage-Backed Obligations [21.8%] |
FHLMC, Ser 2016-4635, Cl EG, Pool FHR 4635 EG | | | | | | | | |
2.500%, 12/15/46 | | | 2,175 | | | | 2,154 | |
FNMA | | | | | | | | |
2.625%, 09/06/24 | | | 1,400 | | | | 1,420 | |
FNMA, Pool AL5866 | | | | | | | | |
2.669%, 08/01/22 | | | 1,740 | | | | 1,749 | |
FNMA, Pool AS4877 | | | | | | | | |
3.000%, 04/01/30 | | | 1,610 | | | | 1,625 | |
FNMA, Pool FN0004 | | | | | | | | |
3.619%, 12/01/20 | | | 2,453 | | | | 2,494 | |
Description | | Face Amount (000)/Shares | | | Value (000) | |
FNMA ARM, Pool 766620 | | | | | | | | |
4.214%, VAR ICE LIBOR USD 12 Month+1.650%, 03/01/34 | | $ | 71 | | | $ | 74 | |
GNMA, Pool 329656 | | | | | | | | |
8.000%, 08/15/22 | | | 2 | | | | 2 | |
GNMA, Pool 376533 | | | | | | | | |
7.500%, 06/15/24 | | | — | | | | 1 | |
GNMA, Pool 398660 | | | | | | | | |
7.500%, 05/15/26 | | | 1 | | | | 1 | |
GNMA, Pool 497411 | | | | | | | | |
6.000%, 01/15/29 | | | 2 | | | | 3 | |
GNMA ARM, Pool G2 81318 | | | | | | | | |
3.625%, VAR US Treas Yield Curve Rate T Note Const Mat 1 Yr+1.500%, 04/20/35 | | | 100 | | | | 104 | |
GNMA ARM, Pool G2 81447 | | | | | | | | |
3.750%, VAR US Treas Yield Curve Rate T Note Const Mat 1 Yr+1.500%, 08/20/35 | | | 25 | | | | 26 | |
| | | | | | | | | |
Total U.S. Government Mortgage-Backed Obligations |
(Cost $9,702) | | | 9,653 | |
| | | | | | | | | |
Short-Term Investment** [1.2%] |
SEI Daily Income Trust Government Fund, Cl F, 2.220% | | | 536,093 | | | | 536 | |
| | | | | | | | | |
Total Short-Term Investment |
(Cost $536) | | | 536 | |
| | | | | | | | | |
Total Investments [100.1%] |
(Cost $44,644) | | $ | 44,331 | |
| | | | | | | | | |
Percentages are based on net assets of $44,275 (000).
** | The rate reported is the 7-day effective yield as of March 31, 2019. |
ARM — Adjustable Rate Mortgage
Cl — Class
FFCB — Federal Farm Credit Bank
FHLB — Federal Home Loan Bank
FHLMC — Federal Home Loan Mortgage Corporation
FNMA — Federal National Mortgage Association
GNMA — Government National Mortgage Association
ICE — Intercontinental Exchange
LIBOR — London Interbank Offered Rate
Ser — Series
USD — U.S. Dollar
VAR — Variable
See accompanying notes to financial statements.
CITY NATIONAL ROCHDALE FUNDS | PAGE 4
schedule of investments |
March 31, 2019 (Unaudited) |
City National Rochdale Government Bond Fund(concluded) |
The following is a list of the inputs used as of March 31, 2019, in valuing the Fund’s investments carried at value (000):
Investments in Securities | | Level 1 | | | Level 2 | | | Level 3 | | | Total | |
U.S. Treasury Obligations | | $ | — | | | $ | 18,962 | | | $ | — | | | $ | 18,962 | |
U.S. Government Agency Obligations | | | — | | | | 15,180 | | | | — | | | | 15,180 | |
U.S. Government Mortgage-Backed Obligations | | | — | | | | 9,653 | | | | — | | | | 9,653 | |
Short-Term Investment | | | 536 | | | | — | | | | — | | | | 536 | |
Total Investments in Securities | | $ | 536 | | | $ | 43,795 | | | $ | — | | | $ | 44,331 | |
For the period ended March 31, 2019, there have been no transfers between any of the fair value hierarchy levels. Transfers between levels are recognized at period end.
Amounts designated as “—” are $0 or have been rounded to $0.
For more information on valuation inputs, see Note 2 – Significant Accounting Policies in the Notes to Financial Statements.
See accompanying notes to financial statements.
CITY NATIONAL ROCHDALE FUNDS | PAGE 5
schedule of investments |
March 31, 2019 (Unaudited) |
City National Rochdale Corporate Bond Fund |

Description | | Face Amount (000) | | | Value (000) | |
Corporate Bonds [74.1%] |
Automotive [7.6%] |
American Honda Finance, MTN | | | | | | | | |
1.700%, 09/09/21 | | $ | 2,500 | | | $ | 2,441 | |
Daimler Finance North America | | | | | | | | |
3.128%, VAR ICE LIBOR USD 3 Month+0.430%, 02/12/21(A) | | | 2,500 | | | | 2,489 | |
General Motors Financial | | | | | | | | |
5.250%, 03/01/26 | | | 1,250 | | | | 1,290 | |
Hyundai Capital America, MTN | | | | | | | | |
3.615%, VAR ICE LIBOR USD 3 Month+1.000%, 09/18/20(A) | | | 1,000 | | | | 1,003 | |
Toyota Motor Credit, MTN | | | | | | | | |
2.250%, 10/18/23 | | | 3,000 | | | | 2,941 | |
| | | | | | | | | |
Total Automotive | | | 10,164 | |
| | | | | | | | | |
Banks [11.9%] |
Bank of Montreal, MTN | | | | | | | | |
3.231%, VAR ICE LIBOR USD 3 Month+0.630%, 09/11/22 | | | 1,200 | | | | 1,202 | |
BPCE | | | | | | | | |
4.000%, 04/15/24 | | | 1,800 | | | | 1,852 | |
Cooperatieve Rabobank UA | | | | | | | | |
3.263%, VAR ICE LIBOR USD 3 Month+0.480%, 01/10/23 | | | 2,500 | | | | 2,481 | |
Mizuho Financial Group | | | | | | | | |
3.481%, VAR ICE LIBOR USD 3 Month+0.880%, 09/11/22 | | | 2,600 | | | | 2,611 | |
National Australia Bank | | | | | | | | |
4.375%, 12/10/20(A) | | | 751 | | | | 770 | |
PNC Bank | | | | | | | | |
2.700%, 11/01/22 | | | 2,500 | | | | 2,487 | |
Svenska Handelsbanken | | | | | | | | |
2.955%, VAR ICE LIBOR USD 3 Month+0.360%, 09/08/20 | | | 2,000 | | | | 2,001 | |
Wells Fargo Bank, MTN | | | | | | | | |
2.910%, VAR United States Secured Overnight Financing Rate+0.480%, 03/25/20 | | | 2,500 | | | | 2,503 | |
| | | | | | | | | |
Total Banks | | | 15,907 | |
| | | | | | | | | |
Broadcasting & Cable [3.9%] |
CBS | | | | | | | | |
4.300%, 02/15/21 | | | 1,400 | | | | 1,430 | |
Comcast | | | | | | | | |
3.700%, 04/15/24 | | | 1,500 | | | | 1,549 | |
Comcast Cable Communications Holdings | | | | | | | | |
9.455%, 11/15/22 | | | 1,800 | | | | 2,211 | |
| | | | | | | | | |
Total Broadcasting & Cable | | | 5,190 | |
| | | | | | | | | |
Computer System Design & Services [1.2%] |
Apple | | | | | | | | |
3.450%, 05/06/24 | | | 1,500 | | | | 1,548 | |
| | | | | | | | | |
Drugs [0.7%] |
AbbVie | | | | | | | | |
2.500%, 05/14/20 | | | 1,000 | | | | 997 | |
| | | | | | | | | |
Food, Beverage & Tobacco [0.9%] |
Molson Coors Brewing | | | | | | | | |
1.450%, 07/15/19 | | | 1,250 | | | | 1,245 | |
| | | | | | | | | |
Insurance [1.5%] |
Berkshire Hathaway | | | | | | | | |
2.750%, 03/15/23 | | | 2,000 | | | | 2,012 | |
| | | | | | | | | |
See accompanying notes to financial statements.
CITY NATIONAL ROCHDALE FUNDS | PAGE 6
schedule of investments |
March 31, 2019 (Unaudited) |
City National Rochdale Corporate Bond Fund(continued) |
Description | | Face Amount (000) | | | Value (000) | |
Investment Bank/Broker-Dealer [1.0%] |
Jefferies Group | | | | | | | | |
5.125%, 01/20/23 | | $ | 1,300 | | | $ | 1,377 | |
| | | | | | | | | |
Machinery [1.9%] |
Caterpillar Financial Services, MTN | | | | | | | | |
3.198%, VAR ICE LIBOR USD 3 Month+0.590%, 06/06/22 | | | 2,500 | | | | 2,508 | |
| | | | | | | | | |
Medical Products & Services [1.9%] |
Gilead Sciences | | | | | | | | |
3.700%, 04/01/24 | | | 2,500 | | | | 2,581 | |
| | | | | | | | | |
Medical-HMO [2.3%] |
UnitedHealth Group | | | | | | | | |
2.875%, 03/15/23 | | | 3,000 | | | | 3,017 | |
| | | | | | | | | |
Multi-line Insurance [0.6%] |
MetLife | | | | | | | | |
4.750%, 02/08/21 | | | 794 | | | | 823 | |
| | | | | | | | | |
Petroleum & Fuel Products [7.9%] |
BP Capital Markets | | | | | | | | |
3.814%, 02/10/24 | | | 2,500 | | | | 2,599 | |
Shell International Finance BV | | | | | | | | |
3.400%, 08/12/23 | | | 2,500 | | | | 2,570 | |
Sunoco Logistics Partners Operations | | | | | | | | |
4.650%, 02/15/22 | | | 1,300 | | | | 1,351 | |
Total Capital International | | | | | | | | |
2.875%, 02/17/22 | | | 4,000 | | | | 4,033 | |
| | | | | | | | | |
Total Petroleum & Fuel Products | | | 10,553 | |
| | | | | | | | | |
Real Estate [2.0%] |
Prologis | | | | | | | | |
4.250%, 08/15/23 | | | 2,500 | | | | 2,642 | |
| | | | | | | | | |
Real Estate Investment Trusts [2.3%] |
HCP | | | | | | | | |
3.150%, 08/01/22 | | | 1,000 | | | | 1,001 | |
Simon Property Group | | | | | | | | |
3.375%, 10/01/24 | | | 2,000 | | | | 2,045 | |
| | | | | | | | | |
Total Real Estate Investment Trusts | | | 3,046 | |
| | | | | | | | | |
Regional Authority [1.5%] |
Province of Ontario Canada | | | | | | | | |
4.400%, 04/14/20 | | | 2,000 | | | | 2,037 | |
| | | | | | | | | |
Retail [3.3%] |
AutoZone | | | | | | | | |
4.000%, 11/15/20 | | | 1,400 | | | | 1,417 | |
Costco Wholesale | | | | | | | | |
2.150%, 05/18/21 | | | 3,000 | | | | 2,989 | |
| | | | | | | | | |
Total Retail | | | 4,406 | |
| | | | | | | | | |
Security Brokers & Dealers [16.7%] |
Bank of Nova Scotia | | | | | | | | |
2.450%, 03/22/21 | | | 2,500 | | | | 2,488 | |
Citigroup | | | | | | | | |
4.056%, VAR ICE LIBOR USD 3 Month+1.430%, 09/01/23 | | | 1,000 | | | | 1,017 | |
Credit Suisse Group Funding Guernsey | | | | | | | | |
3.450%, 04/16/21 | | | 1,250 | | | | 1,263 | |
Deutsche Bank, MTN | | | | | | | | |
2.850%, 05/10/19 | | | 1,450 | | | | 1,450 | |
Goldman Sachs Group, MTN | | | | | | | | |
3.951%, VAR ICE LIBOR USD 3 Month+1.300%, 11/23/24 | | | 2,700 | | | | 2,703 | |
HSBC Holdings | | | | | | | | |
3.400%, 03/08/21 | | | 2,500 | | | | 2,522 | |
JPMorgan Chase | | | | | | | | |
3.300%, 04/01/26 | | | 3,000 | | | | 3,004 | |
Macquarie Group | | | | | | | | |
6.000%, 01/14/20(A) | | | 2,000 | | | | 2,045 | |
Morgan Stanley, MTN | | | | | | | | |
3.750%, 02/25/23 | | | 2,000 | | | | 2,051 | |
Royal Bank of Scotland Group | | | | | | | | |
4.519%, VAR ICE LIBOR USD 3 Month+1.550%, 06/25/24 | | | 1,250 | | | | 1,278 | |
Sumitomo Mitsui Financial Group | | | | | | | | |
2.846%, 01/11/22 | | | 2,500 | | | | 2,502 | |
| | | | | | | | | |
Total Security Brokers & Dealers | | | 22,323 | |
| | | | | | | | | |
Telephones & Telecommunications [5.0%] |
America Movil | | | | | | | | |
5.000%, 03/30/20 | | | 2,600 | | | | 2,651 | |
AT&T | | | | | | | | |
3.600%, 02/17/23 | | | 2,000 | | | | 2,039 | |
See accompanying notes to financial statements.
CITY NATIONAL ROCHDALE FUNDS | PAGE 7
schedule of investments |
March 31, 2019 (Unaudited) |
City National Rochdale Corporate Bond Fund(continued) |
Description | | Face Amount (000) | | | Value (000) | |
Verizon Communications | | | | | | | | |
3.784%, VAR ICE LIBOR USD 3 Month+1.100%, 05/15/25 | | $ | 2,000 | | | $ | 2,000 | |
| | | | | | | | | |
Total Telephones & Telecommunications | | | 6,690 | |
| | | | | | | | | |
Total Corporate Bonds |
(Cost $98,774) | | | 99,066 | |
| | | | | | | | | |
Municipal Bonds [9.7%] |
California [4.0%] |
California State, Various Purpose, GO | | | | | | | | |
3.500%, 04/01/28 | | | 3,700 | | | | 3,886 | |
University of California, Ser AX, GO | | | | | | | | |
Callable 04/01/25 @ 100 | | | | | | | | |
3.063%, 07/01/25 | | | 1,400 | | | | 1,425 | |
| | | | | | | | | |
Total California | | | 5,311 | |
| | | | | | | | | |
New York [5.7%] |
New York City, Build America Bonds, GO | | | | | | | | |
5.424%, 03/01/25 | | | 2,500 | | | | 2,835 | |
New York State, Urban Development, RB | | | | | | | | |
3.100%, 03/15/24 | | | 3,500 | | | | 3,556 | |
New York State, Urban Development, RB | | | | | | | | |
2.790%, 03/15/21 | | | 1,205 | | | | 1,212 | |
| | | | | | | | | |
Total New York | | | 7,603 | |
| | | | | | | | | |
Total Municipal Bonds |
(Cost $12,531) | | | 12,914 | |
| | | | | | | | | |
Commercial Paper [5.6%] |
CME Group | | | | | | | | |
2.463%, 04/09/19 | | | 3,000 | | | | 2,998 | |
NASDAQ | | | | | | | | |
2.731%, 04/02/19 | | | 2,000 | | | | 1,999 | |
Nissan Motor Acceptance Corp | | | | | | | | |
2.782%, 05/28/19 | | | 2,500 | | | | 2,490 | |
| | | | | | | | | |
Total Commercial Paper |
(Cost $7,487) | | | 7,487 | |
| | | | | | | | | |
Description | | Face Amount (000)/Shares | | | Value (000) | |
Mortgage-Backed Security [2.7%] |
Carmax Auto Owner Trust, Ser 2018-4, Cl A3 | | | | | | | | |
3.360%, 09/15/23 | | $ | 3,500 | | | $ | 3,559 | |
| | | | | | | | | |
Total Mortgage-Backed Security |
(Cost $3,500) | | | 3,559 | |
| | | | | | | | | |
Affiliated Registered Investment Company [2.1%] |
City National Rochdale Fixed Income Opportunities Fund, Cl N | | | 116,460 | | | | 2,847 | |
| | | | | | | | | |
Total Affiliated Registered Investment Company |
(Cost $3,000) | | | 2,847 | |
| | | | | | | | | |
Asset-Backed Security [1.5%] |
Ford Credit Floorplan Master Owner Trust A, Ser 2016-3, Cl A1 | | | | | | | | |
1.550%, 07/15/21 | | | 2,000 | | | | 1,993 | |
| | | | | | | | | |
Total Asset-Backed Security |
(Cost $2,000) | | | 1,993 | |
| | | | | | | | | |
Closed-End Fund [1.0%] |
Stone Ridge Reinsurance Risk Premium Interval Fund | | | 172,288 | | | | 1,411 | |
| | | | | | | | | |
Total Closed-End Fund |
(Cost $1,744) | | | 1,411 | |
| | | | | | | | | |
Short-Term Investment** [2.9%] |
SEI Daily Income Trust Government Fund, Cl F, 2.220% | | | 3,851,771 | | | | 3,852 | |
| | | | | | | | | |
Total Short-Term Investment |
(Cost $3,852) | | | 3,852 | |
| | | | | | | | | |
Total Investments [99.6%] |
(Cost $132,888) | | $ | 133,129 | |
| | | | | | | | | |
Percentages are based on net assets of $133,624 (000).
** | The rate reported is the 7-day effective yield as of March 31, 2019. |
(A) | Security exempt from registration under Rule 144A of the Securities Act of 1933. These securities may be resold in transactions exempt from registration normally to qualified institutions. On March 31, 2019, the value of these securities amounted to $6,307 (000), representing 4.7% of the net assets of the Fund. |
See accompanying notes to financial statements.
CITY NATIONAL ROCHDALE FUNDS | PAGE 8
schedule of investments |
March 31, 2019 (Unaudited) |
City National Rochdale Corporate Bond Fund(concluded) |
Cl — Class
GO — General Obligation
ICE— Intercontinental Exchange
LIBOR — London Inter-bank Offered Rate
MTN — Medium Term Note
RB — Revenue Bond
Ser — Series
USD — U.S. Dollar
VAR — Variable Rate
The following is a list of the inputs used as of March 31, 2019, in valuing the
Fund’s investments carried at value (000):
Investments in Securities | | Level 1 | | | Level 2 | | | Level 3 | | | Total | |
Corporate Bonds | | $ | — | | | $ | 99,066 | | | $ | — | | | $ | 99,066 | |
Municipal Bonds | | | — | | | | 12,914 | | | | — | | | | 12,914 | |
Commercial Paper | | | — | | | | 7,487 | | | | — | | | | 7,487 | |
Mortgage-Backed Security | | | — | | | | 3,559 | | | | — | | | | 3,559 | |
Affiliated Registered Investment Company | | | 2,847 | | | | — | | | | — | | | | 2,847 | |
Asset-Backed Security | | | — | | | | 1,993 | | | | — | | | | 1,993 | |
Closed-End Fund | | | 1,411 | | | | — | | | | — | | | | 1,411 | |
Short-Term Investment | | | 3,852 | | | | — | | | | — | | | | 3,852 | |
Total Investments in Securities | | $ | 8,110 | | | $ | 125,019 | | | $ | — | | | $ | 133,129 | |
For the period ended March 31, 2019, there have been no transfers between any of the fair value hierarchy levels. Transfers between levels are recognized at period end.
The following is a summary of the transactions with affiliates for the period ended March 31, 2019:
| | | City National
Rochdale
Fixed Income
Opportunities
Fund, Class N
(000) | |
Beginning balance as of 10/1/18 | | $ | 2,877 | |
Purchases at Cost | | | 0 | |
Unrealized Gain (Loss) | | | (30 | ) |
Ending balance as of 3/31/19 | | $ | 2,847 | |
Dividend Income | | $ | 2 | |
Amounts designated as “—” are $0 or have been rounded to $0.
For more information on valuation inputs, see Note 2 – Significant Accounting Policies in the Notes to Financial Statements.
See accompanying notes to financial statements.
CITY NATIONAL ROCHDALE FUNDS | PAGE 9
schedule of investments |
March 31, 2019 (Unaudited) |
City National Rochdale California Tax Exempt Bond Fund |
Description | | Face Amount (000) | | | Value (000) | |
Municipal Bonds [94.5%] |
California [89.9%] |
Bay Area, Water Supply & Conservation Agency, Ser A, RB | | | | | | | | |
Callable 04/01/23 @ 100 | | | | | | | | |
5.000%, 10/01/23 | | $ | 600 | | | $ | 685 | |
Brea, Redevelopment Agency Successor, Redevelopment Project, TA | | | | | | | | |
5.000%, 08/01/20 | | | 500 | | | | 524 | |
Brea, Redevelopment Agency Successor, Redevelopment Project, TA | | | | | | | | |
Callable 08/01/23 @ 100 | | | | | | | | |
5.000%, 08/01/25 | | | 500 | | | | 573 | |
California State, Department of Water Resources, Ser AX, RB | | | | | | | | |
Callable 12/01/27 @ 100 | | | | | | | | |
5.000%, 12/01/29 | | | 500 | | | | 627 | |
California State, Educational Facilities Authority, Chapman University, RB | | | | | | | | |
Callable 04/01/25 @ 100 | | | | | | | | |
5.000%, 04/01/26 | | | 100 | | | | 119 | |
California State, Educational Facilities Authority, Chapman University, RB | | | | | | | | |
Callable 04/01/25 @ 100 | | | | | | | | |
5.000%, 04/01/27 | | | 100 | | | | 118 | |
California State, GO | | | | | | | | |
5.250%, 09/01/22 | | | 1,000 | | | | 1,124 | |
California State, GO | | | | | | | | |
5.000%, 11/01/19 | | | 1,000 | | | | 1,021 | |
California State, GO | | | | | | | | |
5.000%, 09/01/20 | | | 1,000 | | | | 1,050 | |
California State, GO | | | | | | | | |
5.000%, 12/01/21 | | | 1,000 | | | | 1,091 | |
California State, GO | | | | | | | | |
5.000%, 10/01/22 | | | 1,000 | | | | 1,118 | |
California State, GO | | | | | | | | |
Callable 11/01/20 @ 100 | | | | | | | | |
5.000%, 11/01/22 | | | 1,025 | | | | 1,083 | |
California State, GO | | | | | | | | |
5.000%, 11/01/24 | | | 1,000 | | | | 1,177 | |
California State, GO | | | | | | | | |
5.000%, 08/01/26 | | | 1,000 | | | | 1,220 | |
California State, GO | | | | | | | | |
Callable 12/01/23 @ 100 | | | | | | | | |
5.000%, 12/01/26 | | | 1,000 | | | | 1,147 | |
California State, GO | | | | | | | | |
Callable 11/01/23 @ 100 | | | | | | | | |
5.000%, 11/01/27 | | | 500 | | | | 571 | |
California State, GO | | | | | | | | |
5.000%, 04/01/32 | | | 500 | | | | 647 | |
California State, GO | | | | | | | | |
4.000%, 04/01/23 | | | 1,000 | | | | 1,094 | |
California State, Health Facilities Financing Authority, Ser A, RB | | | | | | | | |
Callable 11/15/22 @ 100 | | | | | | | | |
5.000%, 11/15/25 | | | 665 | | | | 740 | |
California State, Health Facilities Financing Authority, St. Joseph Health System, Ser D, RB | | | | | | | | |
5.000%, 07/01/43(A) | | | 975 | | | | 1,023 | |
California State, Infrastructure & Economic Development Bank, RB | | | | | | | | |
5.000%, 01/01/28 | | | 800 | | | | 989 | |
California State, Infrastructure & Economic Development Bank, Ser B, RB | | | | | | | | |
5.000%, 07/01/23 | | | 1,000 | | | | 1,137 | |
California State, Municipal Finance Authority, RB | | | | | | | | |
5.000%, 06/01/23 | | | 200 | | | | 230 | |
California State, Municipal Finance Authority, RB | | | | | | | | |
5.000%, 10/01/23 | | | 225 | | | | 255 | |
California State, Public Works Board, Department of Corrections and Rehab Project, Ser A, RB | | | | | | | | |
5.000%, 09/01/22 | | | 1,000 | | | | 1,114 | |
See accompanying notes to financial statements.
CITY NATIONAL ROCHDALE FUNDS | PAGE 10
schedule of investments |
March 31, 2019 (Unaudited) |
City National Rochdale California Tax Exempt Bond Fund(continued) |
Description | | Face Amount (000) | | | Value (000) | |
California State, Public Works Board, Department of Corrections-State Prisons, Ser A, RB, AMBAC | | | | | | | | |
5.000%, 12/01/19 | | $ | 230 | | | $ | 235 | |
California State, Public Works Board, Judicial Council, Ser B, RB | | | | | | | | |
5.000%, 10/01/23 | | | 475 | | | | 545 | |
California State, Public Works Board, RB | | | | | | | | |
5.000%, 09/01/25 | | | 1,500 | | | | 1,793 | |
California State, Public Works Board, Ser B, RB | | | | | | | | |
5.000%, 10/01/25 | | | 225 | | | | 269 | |
California State, Public Works Board, Ser C, RB | | | | | | | | |
Callable 03/01/27 @ 100 | | | | | | | | |
5.000%, 03/01/28 | | | 500 | | | | 612 | |
California State, Public Works Board, Ser S, RB | | | | | | | | |
Callable 04/01/27 @ 100 | | | | | | | | |
5.000%, 04/01/28 | | | 800 | | | | 980 | |
California State, Public Works Board, Various Capital Projects, Ser G1, RB | | | | | | | | |
Pre-Refunded @ 100 | | | | | | | | |
5.250%, 10/01/19(B) | | | 250 | | | | 255 | |
California State, Statewide Communities Development Authority, Cottage Health System, RB | | | | | | | | |
Callable 11/01/24 @ 100 | | | | | | | | |
5.000%, 11/01/25 | | | 350 | | | | 408 | |
California State, University Systemwide Revenue, Ser A, RB | | | | | | | | |
5.000%, 11/01/24 | | | 900 | | | | 1,072 | |
California State, University Systemwide Revenue, Ser A, RB | | | | | | | | |
Callable 05/01/26 @ 100 | | | | | | | | |
5.000%, 11/01/27 | | | 240 | | | | 294 | |
Chula Vista, Police Facility Project, COP | | | | | | | | |
5.000%, 10/01/21 | | | 360 | | | | 392 | |
Contra Costa, Transportation Authority, Ser A, RB | | | | | | | | |
5.000%, 03/01/27 | | | 420 | | | | 528 | |
East Bay, Municipal Utility District, Water System Revenue, Ser A, RB | | | | | | | | |
Callable 06/01/25 @ 100 | | | | | | | | |
5.000%, 06/01/29 | | | 850 | | | | 1,016 | |
Gilroy, Public Facilities Financing Authority, RB | | | | | | | | |
5.000%, 11/01/21 | | | 940 | | | | 1,027 | |
Golden State Tobacco Securitization, Ser A, RB | | | | | | | | |
5.000%, 06/01/19 | | | 1,000 | | | | 1,005 | |
Golden State Tobacco Securitization, Ser A, RB | | | | | | | | |
5.000%, 06/01/21 | | | 1,000 | | | | 1,070 | |
Inglewood, Redevelopment Agency Successor Agency, TA, BAM | | | | | | | | |
5.000%, 05/01/23 | | | 500 | | | | 565 | |
Jurupa, Unified School District, GO, AGM | | | | | | | | |
5.000%, 08/01/22 | | | 1,000 | | | | 1,120 | |
Long Beach, Harbor Revenue, Ser A, RB | | | | | | | | |
5.000%, 12/15/20 | | | 1,000 | | | | 1,061 | |
Long Beach, Harbor Revenue, Ser A, RB, AMT | | | | | | | | |
5.000%, 05/15/27 | | | 500 | | | | 612 | |
Long Beach, Unified School District, Election of 2008, Ser S, GO | | | | | | | | |
Pre-Refunded @ 100 | | | | | | | | |
5.250%, 08/01/19(B) | | | 2,010 | | | | 2,036 | |
Long Beach, Unified School District, GO | | | | | | | | |
5.000%, 08/01/26 | | | 1,000 | | | | 1,244 | |
Los Angeles County, Disney Parking Hall Project, COP | | | | | | | | |
5.000%, 09/01/22 | | | 500 | | | | 559 | |
Los Angeles County, Metropolitan Transportation Authority, Ser A, RB | | | | | | | | |
Callable 07/01/25 @ 100 | | | | | | | | |
5.000%, 07/01/26 | | | 500 | | | | 605 | |
Los Angeles, Department of Airports, RB, AMT | | | | | | | | |
Callable 05/15/26 @ 100 | | | | | | | | |
5.000%, 05/15/29 | | | 400 | | | | 474 | |
Los Angeles, Department of Airports, Ser C, RB | | | | | | | | |
5.000%, 05/15/25 | | | 550 | | | | 664 | |
Los Angeles, Department of Water & Power, Power System Project, Ser A, RB | | | | | | | | |
5.000%, 07/01/19 | | | 500 | | | | 504 | |
Los Angeles, Department of Water & Power, Power System Project, Ser C, RB | | | | | | | | |
5.000%, 07/01/23 | | | 500 | | | | 575 | |
See accompanying notes to financial statements.
CITY NATIONAL ROCHDALE FUNDS | PAGE 11
schedule of investments |
March 31, 2019 (Unaudited) |
City National Rochdale California Tax Exempt Bond Fund(continued) |
Description | | Face Amount (000) | | | Value (000) | |
Los Angeles, Municipal Improvement Authority, Capital Equipment, Ser A, RB | | | | | | | | |
4.000%, 11/01/19 | | $ | 575 | | | $ | 584 | |
Los Angeles, Sanitation Districts Financing Authority, Ser A, RB | | | | | | | | |
Callable 10/01/25 @ 100 | | | | | | | | |
5.000%, 10/01/28 | | | 500 | | | | 600 | |
Los Angeles, Ser A, GO, ETM | | | | | | | | |
5.000%, 09/01/21 | | | 270 | | | | 294 | |
Los Angeles, Water & Power Resource Authority, Sub-Ser B-3, RB | | | | | | | | |
Callable 04/01/19 @ 100 | | | | | | | | |
1.310%, 07/01/34(A) | | | 2,000 | | | | 2,000 | |
Orange County, Redevelopment Agency Successor Agency, TA, AGM | | | | | | | | |
5.000%, 09/01/23 | | | 320 | | | | 369 | |
Redding, Electric System Revenue, RB | | | | | | | | |
5.000%, 06/01/24 | | | 600 | | | | 706 | |
Redding, Electric System Revenue, RB | | | | | | | | |
5.000%, 06/01/25 | | | 250 | | | | 301 | |
Riverside County, Infrastructure Financing Authority, Ser A, RB | | | | | | | | |
Callable 11/01/26 @ 100 | | | | | | | | |
4.000%, 11/01/29 | | | 500 | | | | 567 | |
Riverside County, Transportation Commission, Ser A, RB | | | | | | | | |
Pre-Refunded @ 100 | | | | | | | | |
5.250%, 06/01/23(B) | | | 500 | | | | 578 | |
Riverside, Electric System Revenue, Ser A | | | | | | | | |
5.000%, 10/01/23 | | | 1,000 | | | | 1,155 | |
Riverside, Public Financing Authority, Ser A, RB | | | | | | | | |
5.000%, 11/01/21 | | | 1,000 | | | | 1,089 | |
Sacramento County, Sanitation District Financing Authority, Sewer Revenue, Ser A, RB | | | | | | | | |
5.000%, 12/01/20 | | | 500 | | | | 531 | |
San Diego, Association of Governments South Bay Expressway Revenue, Ser A, RB | | | | | | | | |
Callable 07/01/27 @ 100 | | | | | | | | |
5.000%, 07/01/28 | | | 350 | | | | 431 | |
San Diego, Public Facilities Financing Authority, Sewer Revenue, RB | | | | | | | | |
5.000%, 05/15/25 | | | 1,000 | | | | 1,210 | |
San Francisco City & County, Airport Commission, RB, AMT | | | | | | | | |
5.000%, 05/01/27 | | | 2,000 | | | | 2,439 | |
San Francisco City & County, Airport Commission, Ser D, AMT | | | | | | | | |
5.000%, 05/01/21 | | | 1,000 | | | | 1,068 | |
San Francisco City & County, Public Utilities Commission, Water Revenue, Ser A, RB | | | | | | | | |
Callable 10/01/25 @ 100 | | | | | | | | |
5.000%, 10/01/27 | | | 1,000 | | | | 1,214 | |
San Francisco City & County, Public Utilities Commission, Water Revenue, Ser A, RB | | | | | | | | |
Callable 11/01/24 @ 100 | | | | | | | | |
5.000%, 11/01/28 | | | 500 | | | | 590 | |
San Francisco, State Building Authority, RB | | | | | | | | |
4.000%, 12/01/20 | | | 1,000 | | | | 1,043 | |
San Jose, International Airport, Ser A, RB, AMT | | | | | | | | |
5.000%, 03/01/24 | | | 500 | | | | 573 | |
San Leandro, Unified School District, GO, BAM | | | | | | | | |
5.000%, 08/01/24 | | | 325 | | | | 383 | |
San Mateo County, Joint Powers Financing Authority, Maple Street Correctional Center, RB | | | | | | | | |
Callable 06/15/24 @ 100 | | | | | | | | |
5.000%, 06/15/26 | | | 1,035 | | | | 1,214 | |
San Mateo County, Transportation Authority, Ser A, RB, NATL, ETM | | | | | | | | |
5.250%, 06/01/19 | | | 755 | | | | 760 | |
San Pablo County, Redevelopment Agency, Ser A, TA, AGM | | | | | | | | |
5.000%, 06/15/21 | | | 480 | | | | 516 | |
Santa Clara County, Financing Authority, Lease Revenue Capital Project, Ser A, RB | | | | | | | | |
5.000%, 02/01/20 | | | 500 | | | | 515 | |
Santa Clara Valley, Transportation Authority, Ser B, RB | | | | | | | | |
5.000%, 06/01/26 | | | 200 | | | | 248 | |
See accompanying notes to financial statements.
CITY NATIONAL ROCHDALE FUNDS | PAGE 12
schedule of investments |
March 31, 2019 (Unaudited) |
City National Rochdale California Tax Exempt Bond Fund(continued) |
Description | | Face Amount (000) | | | Value (000) | |
Southern California, Public Power Authority, Ser B, RB | | | | | | | | |
Callable 11/01/20 @ 100 | | | | | | | | |
1.750%, 07/01/40(A) | | $ | 3,000 | | | $ | 2,987 | |
Tahoe-Truckee, Unified School District, Ser B, GO | | | | | | | | |
Callable 08/01/26 @ 100 | | | | | | | | |
5.000%, 08/01/27 | | | 200 | | | | 247 | |
Tahoe-Truckee, Unified School District, Ser B, GO | | | | | | | | |
Callable 08/01/26 @ 100 | | | | | | | | |
5.000%, 08/01/28 | | | 200 | | | | 246 | |
Tustin, Unified School District, SPL Tax, BAM | | | | | | | | |
5.000%, 09/01/24 | | | 500 | | | | 588 | |
University of California, Regents of the University of California Medical Center Pooled Revenue, Ser J, RB | | | | | | | | |
Pre-Refunded @ 100 | | | | | | | | |
5.000%, 05/15/23(B) | | | 495 | | | | 565 | |
University of California, Regents of the University of California Medical Center Pooled Revenue, Ser J, RB | | | | | | | | |
Callable 05/15/23 @ 100 | | | | | | | | |
5.000%, 05/15/26 | | | 110 | | | | 125 | |
University of California, Revenues Limited Project, Ser E, RB | | | | | | | | |
Callable 05/15/20 @ 100 | | | | | | | | |
5.000%, 05/15/22 | | | 500 | | | | 520 | |
University of California, Ser AT, RB | | | | | | | | |
Callable 11/15/20 @ 100 | | | | | | | | |
1.400%, 05/15/46(A) | | | 2,500 | | | | 2,485 | |
University of California, Ser AY, RB | | | | | | | | |
Callable 05/15/27 @ 100 | | | | | | | | |
5.000%, 05/15/28 | | | 2,000 | | | | 2,509 | |
University of California, Ser G, RB | | | | | | | | |
Pre-Refunded @ 100 | | | | | | | | |
5.000%, 05/15/22(B) | | | 230 | | | | 256 | |
University of California, Ser G, RB | | | | | | | | |
Callable 05/15/22 @ 100 | | | | | | | | |
5.000%, 05/15/26 | | | 270 | | | | 299 | |
Description | | Face Amount (000)/Shares | | | Value (000) | |
Westlands, Water District, Ser A, RB, AGM | | | | | | | | |
Callable 09/01/26 @ 100 | | | | | | | | |
5.000%, 09/01/27 | | $ | 1,000 | | | $ | 1,218 | |
| | | | | | | | | |
Total California | | | 75,020 | |
| |
Colorado [1.2%] |
Colorado State, Housing & Finance Authority, Ser B-2, RB | | | | | | | | |
Callable 03/29/19 @ 100 | | | | | | | | |
2.430%, 11/01/44(A) | | | 1,000 | | | | 1,000 | |
| | | | | | | | | |
Florida [0.6%] |
Davie, Eastern University Project, RB | | | | | | | | |
5.000%, 04/01/25 | | | 400 | | | | 465 | |
| | | | | | | | | |
Illinois [2.8%] |
Illinois State, Ser A, RB | | | | | | | | |
5.000%, 10/01/21 | | | 1,000 | | | | 1,059 | |
Illinois State, Ser A, RB | | | | | | | | |
5.000%, 10/01/23 | | | 1,200 | | | | 1,300 | |
| | | | | | | | | |
Total Illinois | | | 2,359 | |
| | | | | | | | | |
Total Municipal Bonds |
(Cost $77,096) | | | 78,844 | |
| | | | | | | | | |
Short-Term Investment** [0.8%] |
SEI Daily Income Trust Government Fund, Cl F, 2.196% | | | 689,765 | | | | 690 | |
| | | | | | | | | |
Total Short-Term Investment |
(Cost $690) | | | 690 | |
See accompanying notes to financial statements.
CITY NATIONAL ROCHDALE FUNDS | PAGE 13
schedule of investments |
March 31, 2019 (Unaudited) |
City National Rochdale California Tax Exempt Bond Fund(concluded) |
Description | | Face Amount (000) | | | Value (000) | |
Repurchase Agreement [3.6%] |
Barclays (C) | | | | | | | | |
2.400%, dated 3/29/19, repurchased on 4/1/19, repurchase price $3,000,600 (collateralized by U.S. Government obligations, par value $3,003,400, 2.875%, 8/15/45; with a total market value of $3,060,019) | | $ | 3,000 | | | $ | 3,000 | |
| | | | | | | | | |
Total Repurchase Agreement |
(Cost $3,000) | | | 3,000 | |
| | | | | | | | | |
Total Investments [98.9%] |
(Cost $80,786) | | $ | 82,534 | |
| | | | | | | | | |
Percentages are based on net assets of $83,431 (000).
** | The rate reported is the 7-day effective yield as of March 31, 2019. |
(A) | Variable or floating rate security, the interest rate of which adjusts periodically based on prevailing interest rates. |
(B) | Pre-Refunded Security — The maturity date shown is the pre-refunded date. |
(C) | Tri-party Repurchase Agreement. |
AGM — Assured Guarantee Municipal
AMBAC — American Municipal Bond Assurance Company
AMT — Alternative Minimum Tax (subject to)
BAM — Build America Mutual
Cl — Class
COP — Certificate of Participation
ETM — Escrowed to Maturity
GO — General Obligation
NATL — National Public Finance Guarantee Corporation
RB — Revenue Bond
Ser — Series
SPL Tax — Special Tax
TA — Tax Allocation
The following is a list of the inputs used as of March 31, 2019, in valuing the Fund’s investments carried at value (000):
Investments in Securities | | Level 1 | | | Level 2 | | | Level 3 | | | Total | |
Municipal Bonds | | $ | — | | | $ | 78,844 | | | $ | — | | | $ | 78,844 | |
Short-Term Investment | | | 690 | | | | — | | | | — | | | | 690 | |
Repurchase Agreement | | | — | | | | 3,000 | | | | — | | | | 3,000 | |
Total Investments in Securities | | $ | 690 | | | $ | 81,844 | | | $ | — | | | $ | 82,534 | |
For the period ended March 31, 2019, there have been no transfers between any of the fair value hierarchy levels. Transfers between levels are recognized at period end.
The following is a summary of the transactions with affiliates for the period ended March 31, 2019:
| | | City National
Rochdale
Municipal High
Income Fund,
Class N
(000) | |
Beginning balance as of 10/1/18 | | $ | 992 | |
Purchases at Cost | | | — | |
Proceeds from Sales | | | (987 | ) |
Realized Gain (Loss) | | | (13 | ) |
Unrealized Gain (Loss) | | | 8 | |
Ending balance as of 3/31/19 | | $ | — | |
Dividend Income | | $ | 1 | |
Amounts designated as “—” are either $0 or have been rounded to $0.
For information on the Fund’s policy regarding valuation of investments and other significant accounting policies, please refer to the Fund’s most recent semi-annual or annual financial statements.
See accompanying notes to financial statements.
CITY NATIONAL ROCHDALE FUNDS | PAGE 14
schedule of investments |
March 31, 2019 (Unaudited) |
City National Rochdale Municipal High Income Fund |
Description | | Face Amount (000) | | | Value (000) | |
Municipal Bonds [93.2%] |
Alabama [1.4%] |
Alabama State, Southeast Gas Supply District, Ser A, RB | | | | | | | | |
Callable 03/01/24 @ 100 | | | | | | | | |
4.000%, 06/01/49(A) | | $ | 5,000 | | | $ | 5,377 | |
Jefferson County, Sewer Revenue, RB | | | | | | | | |
Callable 10/01/23 @ 105 | | | | | | | | |
0.826%, 10/01/23 | | | 2,500 | | | | 2,298 | |
Jefferson County, Sewer Revenue, Ser D, RB | | | | | | | | |
Callable 10/01/23 @ 105 | | | | | | | | |
6.000%, 10/01/42 | | | 9,000 | | | | 10,467 | |
| | | | | | | | | |
Total Alabama | | | 18,142 | |
| | | | | | | | | |
Alaska [0.9%] |
Northern Arkansas, Tobacco Securitization, Ser A, RB | | | | | | | | |
Callable 04/15/19 @ 100 | | | | | | | | |
5.000%, 06/01/46 | | | 12,500 | | | | 12,136 | |
| | | | | | | | | |
Arizona [1.1%] |
Arizona State, Industrial Development Authority, RB | | | | | | | | |
Callable 07/01/29 @ 100 | | | | | | | | |
5.000%, 01/01/54 | | | 375 | | | | 399 | |
Glendale, Industrial Development Authority, Glencroft Retirement Community, RB | | | | | | | | |
Callable 11/15/26 @ 100 | | | | | | | | |
5.250%, 11/15/46 | | | 1,000 | | | | 1,027 | |
Glendale, Industrial Development Authority, Glencroft Retirement Community, RB | | | | | | | | |
Callable 11/15/26 @ 100 | | | | | | | | |
5.250%, 11/15/51 | | | 1,850 | | | | 1,894 | |
Glendale, Industrial Development Authority, Glencroft Retirement Community, RB | | | | | | | | |
Callable 11/15/26 @ 100 | | | | | | | | |
5.000%, 11/15/36 | | | 600 | | | | 619 | |
Phoenix, Industrial Development Authority, Legacy Traditional School Projects, RB | | | | | | | | |
5.750%, 07/01/24(B) | | | 1,400 | | | | 1,496 | |
Phoenix, Industrial Development Authority, Legacy Traditional School Projects, RB | | | | | | | | |
Callable 07/01/25 @ 100 | | | | | | | | |
5.000%, 07/01/45(B) | | | 3,300 | | | | 3,387 | |
Pima County, Industrial Development Authority, Noah Webster School Project, RB | | | | | | | | |
Callable 12/15/23 @ 100 | | | | | | | | |
7.000%, 12/15/43 | | | 1,500 | | | | 1,623 | |
Tempe, Industrial Development Authority, Mirrabella at ASU Project, Ser A, RB | | | | | | | | |
Callable 10/01/27 @ 100 | | | | | | | | |
6.125%, 10/01/52(B) | | | 1,200 | | | | 1,317 | |
Yavapai County, Industrial Development Authority, Ser A, RB | | | | | | | | |
Callable 03/01/25 @ 100 | | | | | | | | |
5.000%, 09/01/34(B) | | | 2,015 | | | | 2,101 | |
| | | | | | | | | |
Total Arizona | | | 13,863 | |
| | | | | | | | | |
California [7.5%] |
Adelanto, Public Utility Authority, Utility System Project, Ser A, RB | | | | | | | | |
Pre-Refunded @ 100 | | | | | | | | |
6.750%, 07/01/19(C) | | | 6,500 | | | | 6,585 | |
California County, Tobacco Securitization Agency, Sub-Ser A, RB | | | | | | | | |
Callable 04/15/19 @ 18 | | | | | | | | |
6.542%, 06/01/46(D) | | | 10,000 | | | | 1,760 | |
See accompanying notes to financial statements.
CITY NATIONAL ROCHDALE FUNDS | PAGE 15
schedule of investments |
March 31, 2019 (Unaudited) |
City National Rochdale Municipal High Income Fund(continued) |
Description | | Face Amount (000) | | | Value (000) | |
California State, GO | | | | | | | | |
Callable 12/01/23 @ 100 | | | | | | | | |
5.000%, 12/01/31 | | $ | 1,500 | | | $ | 1,701 | |
California State, Health Facilities Financing Authority, Ser A, RB | | | | | | | | |
Callable 11/15/27 @ 100 | | | | | | | | |
4.000%, 11/15/40 | | | 5,000 | | | | 5,384 | |
California State, Municipal Finance Authority, California Baptist University, Ser A, RB | | | | | | | | |
Callable 11/01/25 @ 100 | | | | | | | | |
5.500%, 11/01/45(B) | | | 4,000 | | | | 4,527 | |
California State, Municipal Finance Authority, Ser A, RB | | | | | | | | |
Callable 11/01/26 @ 100 | | | | | | | | |
5.250%, 11/01/36 | | | 255 | | | | 285 | |
California State, Municipal Finance Authority, Ser A, RB | | | | | | | | |
Callable 11/01/26 @ 100 | | | | | | | | |
5.000%, 11/01/47 | | | 1,005 | | | | 1,079 | |
California State, Pollution Control Financing Authority, Calplant I Project, RB, AMT | | | | | | | | |
Callable 07/01/27 @ 100 | | | | | | | | |
8.000%, 07/01/39(B) | | | 5,000 | | | | 5,416 | |
California State, Public Works Board, Department of Corrections and Rehab Project, Ser A, RB | | | | | | | | |
Callable 09/01/24 @ 100 | | | | | | | | |
5.000%, 09/01/31 | | | 5,000 | | | | 5,730 | |
California State, Public Works Board, Various Capital Projects, Ser A, RB | | | | | | | | |
Callable 04/01/22 @ 100 | | | | | | | | |
5.000%, 04/01/37 | | | 1,000 | | | | 1,082 | |
California State, School Finance Authority, KIPP LA Project, Ser A, RB | | | | | | | | |
Callable 07/01/27 @ 100 | | | | | | | | |
5.000%, 07/01/47(B) | | | 500 | | | | 554 | |
California State, School Finance Authority, View Park Elementary & Middle School Project, Ser A, RB | | | | | | | | |
Callable 10/01/24 @ 100 | | | | | | | | |
6.000%, 10/01/49 | | | 1,120 | | | | 1,212 | |
California State, School Finance Authority, View Park Elementary & Middle School Project, Ser A, RB | | | | | | | | |
Callable 10/01/24 @ 100 | | | | | | | | |
5.875%, 10/01/44 | | | 1,000 | | | | 1,078 | |
California State, School Finance Authority, View Park Elementary & Middle School Project, Ser A, RB | | | | | | | | |
Callable 10/01/24 @ 100 | | | | | | | | |
5.625%, 10/01/34 | | | 575 | | | | 625 | |
California State, Statewide Communities Development Authority, RB | | | | | | | | |
Callable 06/01/25 @ 100 | | | | | | | | |
7.000%, 06/01/45(E) | | | 3,155 | | | | 1,902 | |
California State, Statewide Communities Development Authority, RB | | | | | | | | |
Callable 06/01/28 @ 100 | | | | | | | | |
5.250%, 12/01/43(B) | | | 500 | | | | 563 | |
California State, Statewide Communities Development Authority, RB | | | | | | | | |
Callable 06/01/28 @ 100 | | | | | | | | |
5.250%, 12/01/48(B) | | | 2,000 | | | | 2,244 | |
California State, Statewide Communities Development Authority, Ser A, RB | | | | | | | | |
Callable 06/01/26 @ 100 | | | | | | | | |
5.250%, 12/01/56(B) | | | 1,500 | | | | 1,640 | |
California State, Statewide Financing Authority, Ser C, RB | | | | | | | | |
Callable 04/15/19 @ 8 | | | | | | | | |
13.601%, 06/01/55(D) | | | 50,000 | | | | 2,334 | |
Central Basin, Municipal Water District, Ser A, RB | | | | | | | | |
Callable 08/01/28 @ 100 | | | | | | | | |
5.000%, 08/01/44 | | | 2,000 | | | | 2,230 | |
Folsom Ranch, Financing Authority, SPL Tax | | | | | | | | |
Callable 09/01/27 @ 100 | | | | | | | | |
5.000%, 09/01/37 | | | 1,435 | | | | 1,617 | |
Folsom Ranch, Financing Authority, SPL Tax | | | | | | | | |
Callable 09/01/27 @ 100 | | | | | | | | |
5.000%, 09/01/47 | | | 2,000 | | | | 2,214 | |
Golden State, Tobacco Securitization, Ser A-1, RB | | | | | | | | |
Callable 06/01/22 @ 100 | | | | | | | | |
5.000%, 06/01/47 | | | 7,000 | | | | 6,965 | |
Inland Empire, Tobacco Securitization Authority, RB | | | | | | | | |
Callable 04/15/19 @ 33 | | | | | | | | |
8.267%, 06/01/36(D) | | | 25,000 | | | | 7,895 | |
See accompanying notes to financial statements.
CITY NATIONAL ROCHDALE FUNDS | PAGE 16
schedule of investments |
March 31, 2019 (Unaudited) |
City National Rochdale Municipal High Income Fund(continued) |
Description | | Face Amount (000) | | | Value (000) | |
M-S-R, Energy Authority, Ser C, RB | | | | | | | | |
7.000%, 11/01/34 | | $ | 2,500 | | | $ | 3,689 | |
Northern California, Gas Authority No. 1, Ser B, RB | | | | | | | | |
2.594%, 07/01/27(A) | | | 5,000 | | | | 4,862 | |
Northern California, Tobacco Securitization Authority, Ser A-1, RB | | | | | | | | |
Callable 04/15/19 @ 100 | | | | | | | | |
5.375%, 06/01/38 | | | 4,650 | | | | 4,671 | |
Orange County, Community Facilities District, SPL Tax | | | | | | | | |
Callable 08/15/28 @ 100 | | | | | | | | |
5.000%, 08/15/47 | | | 1,000 | | | | 1,100 | |
Oroville City, RB | | | | | | | | |
Callable 04/01/29 @ 100 | | | | | | | | |
5.250%, 04/01/39 | | | 750 | | | | 855 | |
Oroville City, RB | | | | | | | | |
Callable 04/01/29 @ 100 | | | | | | | | |
5.250%, 04/01/49 | | | 3,000 | | | | 3,365 | |
Palomar Pomerado, Health Care District, COP | | | | | | | | |
Pre-Refunded @ 100 | | | | | | | | |
6.000%, 11/01/20(C) | | | 3,920 | | | | 4,198 | |
San Buenaventura, Community Memorial Health System Project, RB | | | | | | | | |
Callable 12/01/21 @ 100 | | | | | | | | |
7.500%, 12/01/41 | | | 1,000 | | | | 1,112 | |
San Buenaventura, Community Memorial Health System Project, RB | | | | | | | | |
Callable 12/01/21 @ 100 | | | | | | | | |
7.000%, 12/01/26 | | | 1,000 | | | | 1,111 | |
San Mateo, Community Facilities District, Community Facilities District No. 2008-1-Bay, SPL Tax | | | | | | | | |
Callable 09/01/22 @ 100 | | | | | | | | |
5.500%, 09/01/44 | | | 1,000 | | | | 1,077 | |
Southern California, Tobacco Securitization Authority, Ser A-1, RB | | | | | | | | |
Callable 04/15/19 @ 100 | | | | | | | | |
5.000%, 06/01/37 | | | 3,000 | | | | 3,000 | |
Westminster School District, GO, BAM | | | | | | | | |
Callable 08/01/39 @ 100 | | | | | | | | |
1.803%, 08/01/34 (F) | | | 4,540 | | | | 2,904 | |
| | | | | | | | | |
Total California | | | 98,566 | |
| | | | | | | | | |
Colorado [8.0%] |
9th Avenue Metropolitan District No. 2, GO | | | | | | | | |
Callable 12/01/23 @ 103 | | | | | | | | |
5.000%, 12/01/48 | | | 1,000 | | | | 1,025 | |
Amber Creek, Metropolitan District, Ser A, GO | | | | | | | | |
Callable 12/01/22 @ 103 | | | | | | | | |
5.125%, 12/01/47 | | | 1,065 | | | | 1,074 | |
Amber Creek, Metropolitan District, Ser A, GO | | | | | | | | |
Callable 12/01/22 @ 103 | | | | | | | | |
5.000%, 12/01/37 | | | 750 | | | | 757 | |
Arkansas State, River Power Authority, Colorado Improvement Project, RB | | | | | | | | |
Callable 10/01/20 @ 100 | | | | | | | | |
6.125%, 10/01/40 | | | 2,500 | | | | 2,609 | |
Base Village Metropolitan District No. 2, Ser A, GO | | | | | | | | |
Callable 12/01/21 @ 103 | | | | | | | | |
5.750%, 12/01/46 | | | 3,055 | | | | 3,111 | |
Belleview Station Metropolitan District No. 2, GO | | | | | | | | |
Callable 12/01/21 @ 103 | | | | | | | | |
5.125%, 12/01/46 | | | 3,375 | | | | 3,466 | |
Belleview Station Metropolitan District No. 2, GO | | | | | | | | |
Callable 12/01/21 @ 103 | | | | | | | | |
5.000%, 12/01/36 | | | 1,500 | | | | 1,542 | |
Big Dry Creek Metropolitan District, Ser A, GO | | | | | | | | |
Callable 12/01/22 @ 103 | | | | | | | | |
5.750%, 12/01/47 | | | 2,910 | | | | 2,945 | |
Brighton Crossing Metropolitan District No. 4, Ser A, GO | | | | | | | | |
Callable 12/01/22 @ 103 | | | | | | | | |
5.000%, 12/01/37 | | | 525 | | | | 542 | |
Brighton Crossing Metropolitan District No. 4, Ser A, GO | | | | | | | | |
Callable 12/01/22 @ 103 | | | | | | | | |
5.000%, 12/01/47 | | | 1,720 | | | | 1,768 | |
Buffalo Highlands Metropolitan District, Ser A, GO | | | | | | | | |
Callable 12/01/23 @ 103 | | | | | | | | |
5.375%, 12/01/48 | | | 1,775 | | | | 1,802 | |
Canyons Metropolitan District No. 5, Ser A, GO | | | | | | | | |
Callable 12/01/22 @ 103 | | | | | | | | |
6.125%, 12/01/47 | | | 1,000 | | | | 1,019 | |
See accompanying notes to financial statements.
CITY NATIONAL ROCHDALE FUNDS | PAGE 17
schedule of investments |
March 31, 2019 (Unaudited) |
City National Rochdale Municipal High Income Fund(continued) |
Description | | Face Amount (000) | | | Value (000) | |
Canyons Metropolitan District No. 5, Ser A, GO | | | | | | | | |
Callable 12/01/22 @ 103 | | | | | | | | |
6.000%, 12/01/37 | | $ | 2,000 | | | $ | 2,049 | |
Castle Oaks, Metropolitan District No. 3, GO | | | | | | | | |
Pre-Refunded @ 100 | | | | | | | | |
6.250%, 12/01/20(C) | | | 2,860 | | | | 3,160 | |
Castle Oaks, Metropolitan District No. 3, GO | | | | | | | | |
Pre-Refunded @ 100 | | | | | | | | |
5.500%, 12/01/20(C) | | | 2,345 | | | | 2,562 | |
Clear Creek Station Metropolitan District No. 2, Ser A, GO | | | | | | | | |
Callable 12/01/22 @ 103 | | | | | | | | |
5.000%, 12/01/47 | | | 1,000 | | | | 1,021 | |
Colorado State, Educational & Cultural Facilities Authority, Aspen Ridge School Project, RB | | | | | | | | |
Callable 07/01/25 @ 100 | | | | | | | | |
5.250%, 07/01/46(B) | | | 1,930 | | | | 1,955 | |
Colorado State, Educational & Cultural Facilities Authority, Aspen Ridge School Project, RB | | | | | | | | |
Callable 07/01/25 @ 100 | | | | | | | | |
5.000%, 07/01/36(B) | | | 915 | | | | 929 | |
Colorado State, Educational & Cultural Facilities Authority, Charter School Preparatory School Project, RB | | | | | | | | |
Callable 04/01/25 @ 100 | | | | | | | | |
5.250%, 04/01/45(B) | | | 2,655 | | | | 2,690 | |
Colorado State, Educational & Cultural Facilities Authority, Charter School Preparatory School Project, RB | | | | | | | | |
Callable 04/01/25 @ 100 | | | | | | | | |
5.125%, 04/01/35(B) | | | 1,515 | | | | 1,546 | |
Colorado State, Health Facilities Authority, Sunny Vista Living Center, Ser A, RB | | | | | | | | |
Callable 12/01/25 @ 100 | | | | | | | | |
6.125%, 12/01/45(B) | | | 1,000 | | | | 1,046 | |
Colorado State, High Performance Transportation Enterprise, U.S. 36 & I-25 Managed Lanes Project, RB, AMT | | | | | | | | |
Callable 01/01/23 @ 100 | | | | | | | | |
5.750%, 01/01/44 | | | 2,000 | | | | 2,182 | |
Colorado State, Public Energy Authority, RB | | | | | | | | |
6.500%, 11/15/38 | | | 6,000 | | | | 8,739 | |
Denver County, Health & Hospital Authority, Ser A, RB | | | | | | | | |
Callable 12/01/27 @ 100 | | | | | | | | |
4.000%, 12/01/35(B) | | | 1,835 | | | | 1,901 | |
Denver County, Health & Hospital Authority, Ser A, RB | | | | | | | | |
Callable 12/01/27 @ 100 | | | | | | | | |
4.000%, 12/01/36(B) | | | 2,305 | | | | 2,386 | |
Denver, Regional Transportation District, Denver Transportation Partners Project, RB | | | | | | | | |
Callable 07/15/20 @ 100 | | | | | | | | |
6.000%, 01/15/41 | | | 1,000 | | | | 1,028 | |
Erie Highlands Metropolitan District No. 1, GO | | | | | | | | |
Callable 12/01/20 @ 103 | | | | | | | | |
5.750%, 12/01/45 | | | 2,000 | | | | 2,036 | |
Erie Highlands Metropolitan District No. 2, Ser A, GO | | | | | | | | |
Callable 12/01/23 @ 103 | | | | | | | | |
5.250%, 12/01/48 | | | 5,725 | | | | 5,826 | |
Flatiron Meadows Metropolitan District, GO | | | | | | | | |
Callable 12/01/21 @ 103 | | | | | | | | |
5.125%, 12/01/46 | | | 2,000 | | | | 1,990 | |
Great Western Park Metropolitan District No. 2, Ser A, GO | | | | | | | | |
Callable 12/01/21 @ 100 | | | | | | | | |
5.000%, 12/01/46 | | | 1,825 | | | | 1,837 | |
Green Gables Metropolitan District No. 1, Ser A, GO | | | | | | | | |
Callable 12/01/21 @ 103 | | | | | | | | |
5.300%, 12/01/46 | | | 2,500 | | | | 2,547 | |
Lewis Pointe, Metropolitan District, Ser A, GO | | | | | | | | |
Callable 12/01/20 @ 100 | | | | | | | | |
6.000%, 12/01/44 | | | 2,590 | | | | 2,604 | |
Leyden Rock Metropolitan District No. 10, Ser A, GO | | | | | | | | |
Callable 12/01/21 @ 103 | | | | | | | | |
5.000%, 12/01/45 | | | 2,500 | | | | 2,544 | |
Leyden Rock Metropolitan District No. 10, Ser A, GO | | | | | | | | |
Callable 12/01/21 @ 103 | | | | | | | | |
4.375%, 12/01/33 | | | 1,500 | | | | 1,505 | |
See accompanying notes to financial statements.
CITY NATIONAL ROCHDALE FUNDS | PAGE 18
schedule of investments |
March 31, 2019 (Unaudited) |
City National Rochdale Municipal High Income Fund(continued) |
Description | | Face Amount (000) | | | Value (000) | |
North Holly, Metropolitan District, Ser A, GO | | | | | | | | |
Callable 12/01/23 @ 103 | | | | | | | | |
5.500%, 12/01/48 | | $ | 1,755 | | | $ | 1,763 | |
Overlook Metropolitan District, GO | | | | | | | | |
Callable 12/01/21 @ 103 | | | | | | | | |
5.500%, 12/01/46 | | | 1,230 | | | | 1,206 | |
Serenity Ridge, Metropolitan District No. 2, Ser A, GO | | | | | | | | |
Callable 12/01/23 @ 103 | | | | | | | | |
5.125%, 12/01/37 | | | 550 | | | | 568 | |
Serenity Ridge, Metropolitan District No. 2, Ser A, GO | | | | | | | | |
Callable 12/01/23 @ 103 | | | | | | | | |
5.125%, 12/01/43 | | | 1,000 | | | | 1,026 | |
Sierra Ridge Metropolitan District No. 2, Ser A, GO | | | | | | | | |
Callable 12/01/21 @ 103 | | | | | | | | |
5.500%, 12/01/46 | | | 1,500 | | | | 1,541 | |
Solaris, Metropolitan District No. 3, Ser A, GO | | | | | | | | |
5.000%, 12/01/36 | | | 700 | | | | 721 | |
Solaris, Metropolitan District No. 3, Ser A, GO | | | | | | | | |
Callable 12/01/21 @ 103 | | | | | | | | |
5.000%, 12/01/46 | | | 2,530 | | | | 2,587 | |
Southglenn, Metropolitan District, GO | | | | | | | | |
Callable 12/01/21 @ 103 | | | | | | | | |
5.000%, 12/01/46 | | | 3,675 | | | | 3,715 | |
Southglenn, Metropolitan District, GO | | | | | | | | |
Callable 12/01/21 @ 103 | | | | | | | | |
3.500%, 12/01/26 | | | 1,750 | | | | 1,699 | |
Southlands, Metropolitan District No. 1, Ser A-1, GO | | | | | | | | |
Callable 12/01/27 @ 100 | | | | | | | | |
5.000%, 12/01/37 | | | 500 | | | | 539 | |
Southlands, Metropolitan District No. 1, Ser A-1, GO | | | | | | | | |
Callable 12/01/27 @ 100 | | | | | | | | |
5.000%, 12/01/47 | | | 3,000 | | | | 3,184 | |
Stone Creek Metropolitan District, Ser A, GO | | | | | | | | |
Callable 12/01/23 @ 103 | | | | | | | | |
5.625%, 12/01/47 | | | 2,000 | | | | 2,019 | |
Villas Metropolitan District, Ser A, GO | | | | | | | | |
Callable 12/01/23 @ 103 | | | | | | | | |
5.125%, 12/01/48 | | | 1,250 | | | | 1,259 | |
Water Valley, Metropolitan District No. 01, GO | | | | | | | | |
Callable 12/01/26 @ 100 | | | | | | | | |
5.250%, 12/01/40 | | | 300 | | | | 321 | |
Water Valley, Metropolitan District No. 01, GO | | | | | | | | |
Callable 12/01/26 @ 100 | | | | | | | | |
5.000%, 12/01/35 | | | 100 | | | | 106 | |
Water Valley, Metropolitan District No. 01, GO | | | | | | | | |
Callable 12/01/26 @ 100 | | | | | | | | |
4.000%, 12/01/33 | | | 375 | | | | 372 | |
Water Valley, Metropolitan District No. 02, GO | | | | | | | | |
Callable 12/01/26 @ 100 | | | | | | | | |
5.250%, 12/01/40 | | | 1,045 | | | | 1,118 | |
Water Valley, Metropolitan District No. 02, GO | | | | | | | | |
Callable 12/01/26 @ 100 | | | | | | | | |
4.000%, 12/01/33 | | | 250 | | | | 242 | |
Westcreek Metropolitan District No. 2, Ser A, GO | | | | | | | | |
Callable 06/01/24 @ 103 | | | | | | | | |
5.375%, 12/01/48(B) | | | 1,300 | | | | 1,303 | |
Whispering Pines Metropolitan District No. 1, Ser A, GO | | | | | | | | |
Callable 12/01/22 @ 103 | | | | | | | | |
5.000%, 12/01/37 | | | 1,685 | | | | 1,717 | |
Whispering Pines Metropolitan District No. 1, Ser A, GO | | | | | | | | |
Callable 12/01/22 @ 103 | | | | | | | | |
5.000%, 12/01/47 | | | 2,500 | | | | 2,530 | |
| | | | | | | | | |
Total Colorado | | | 105,279 | |
| | | | | | | | | |
Connecticut [0.4%] |
Tender Option Bond Trust Receipts/Certificates, Ser 2016-XM0449, RB | | | | | | | | |
Callable 06/01/26 @ 100 | | | | | | | | |
8.650%, 12/01/45(A) (B) (G) | | | 3,335 | | | | 4,647 | |
| | | | | | | | | |
Delaware [0.2%] |
Delaware State, Economic Development Authority, Indian River Power Project, RB | | | | | | | | |
Callable 10/01/20 @ 100 | | | | | | | | |
5.375%, 10/01/45 | | | 2,000 | | | | 2,077 | |
| | | | | | | | | |
See accompanying notes to financial statements.
CITY NATIONAL ROCHDALE FUNDS | PAGE 19
schedule of investments |
March 31, 2019 (Unaudited) |
City National Rochdale Municipal High Income Fund(continued) |
Description | | Face Amount (000) | | | Value (000) | |
District of Columbia [0.3%] |
District of Columbia, Tobacco Settlement Financing, Ser A, RB | | | | | | | | |
Callable 04/29/19 @ 19 | | | | | | | | |
7.502%, 06/15/46(D) | | $ | 8,000 | | | $ | 1,251 | |
Metropolitan Washington, Airports Authority, Dulles Toll Road Revenue, Ser B, RB | | | | | | | | |
Callable 10/01/28 @ 100 | | | | | | | | |
6.500%, 10/01/44 | | | 2,000 | | | | 2,586 | |
| | | | | | | | | |
Total District of Columbia | | | 3,837 | |
| | | | | | | | | |
Florida [5.1%] |
Alachua County, Health Facilities Authority, East Ridge Retirement Village Project, RB | | | | | | | | |
Callable 11/15/24 @ 100 | | | | | | | | |
6.250%, 11/15/44 | | | 2,690 | | | | 2,345 | |
Alachua County, Health Facilities Authority, East Ridge Retirement Village Project, RB | | | | | | | | |
Callable 11/15/24 @ 100 | | | | | | | | |
6.000%, 11/15/34 | | | 2,500 | | | | 2,269 | |
Brevard County, Industrial Development Authority, TUFF Florida Tech Project, RB | | | | | | | | |
Callable 11/01/19 @ 100 | | | | | | | | |
6.750%, 11/01/39 | | | 960 | | | | 976 | |
Capital Trust Agency, RB | | | | | | | | |
Callable 01/01/29 @ 100 | | | | | | | | |
5.375%, 07/01/54(B) | | | 1,500 | | | | 1,520 | |
Capital Trust Agency, RB | | | | | | | | |
Callable 01/01/29 @ 100 | | | | | | | | |
5.125%, 07/01/39(B) | | | 1,500 | | | | 1,520 | |
Florida State, Capital Trust Agency, Silver Creek St. Augustine, RB | | | | | | | | |
Callable 04/29/19 @ 100 | | | | | | | | |
7.000%, 01/01/35(A) (E) | | | 815 | | | | 774 | |
Florida State, Capital Trust Agency, Silver Creek St. Augustine, RB | | | | | | | | |
Callable 04/29/19 @ 100 | | | | | | | | |
5.750%, 01/01/50(E) | | | 945 | | | | 898 | |
Florida State, Capital Trust Agency, Silver Creek St. Augustine, Ser A, RB | | | | | | | | |
Callable 01/01/21 @ 103 | | | | | | | | |
8.250%, 01/01/44(E) | | | 3,390 | | | | 2,373 | |
Florida State, Capital Trust Agency, Silver Creek St. Augustine, Ser A, RB | | | | | | | | |
Callable 01/01/21 @ 103 | | | | | | | | |
8.250%, 01/01/49(E) | | | 1,000 | | | | 700 | |
Florida State, Development Finance, Renaissance Charter School Project, RB | | | | | | | | |
Callable 06/15/25 @ 100 | | | | | | | | |
6.125%, 06/15/46(B) | | | 4,930 | | | | 5,129 | |
Florida State, Development Finance, Renaissance Charter School Project, Ser A, RB | | | | | | | | |
Callable 06/15/22 @ 100 | | | | | | | | |
6.125%, 06/15/43(B) | | | 1,000 | | | | 1,015 | |
Florida State, Development Finance, Renaissance Charter School Project, Ser A, RB | | | | | | | | |
Callable 06/15/24 @ 100 | | | | | | | | |
6.125%, 06/15/44 | | | 3,000 | | | | 3,181 | |
Florida State, Development Finance, Renaissance Charter School Project, Ser A, RB | | | | | | | | |
Callable 06/15/24 @ 100 | | | | | | | | |
6.000%, 06/15/34 | | | 2,110 | | | | 2,257 | |
Florida State, Village Community Development District No. 10, SAB | | | | | | | | |
Callable 05/01/23 @ 100 | | | | | | | | |
6.000%, 05/01/44 | | | 940 | | | | 1,064 | |
Florida State, Village Community Development District No. 12, SAB | | | | | | | | |
Callable 05/01/26 @ 100 | | | | | | | | |
3.875%, 05/01/47 | | | 2,965 | | | | 2,972 | |
Jacksonville, Jacksonville University Project, Ser B, RB | | | | | | | | |
Callable 06/01/28 @ 100 | | | | | | | | |
5.000%, 06/01/53(B) | | | 1,000 | | | | 1,054 | |
Lakewood Ranch, Stewardship District, SAB | | | | | | | | |
Callable 05/01/27 @ 100 | | | | | | | | |
5.250%, 05/01/37 | | | 1,815 | | | | 1,910 | |
Miami-Dade County, Educational Facilities Authority, Ser A, RB | | | | | | | | |
Callable 04/01/28 @ 100 | | | | | | | | |
4.000%, 04/01/53 | | | 1,500 | | | | 1,554 | |
Miami-Dade County, Industrial Development Authority, Pinecrest Academy Project, RB | | | | | | | | |
Callable 09/15/24 @ 100 | | | | | | | | |
5.250%, 09/15/44 | | | 4,300 | | | | 4,578 | |
See accompanying notes to financial statements.
CITY NATIONAL ROCHDALE FUNDS | PAGE 20
schedule of investments |
March 31, 2019 (Unaudited) |
City National Rochdale Municipal High Income Fund(continued) |
Description | | Face Amount (000) | | | Value (000) | |
Miami-Dade County, Industrial Development Authority, Youth CO-OP Charter Schools Project, Ser A, RB | | | | | | | | |
Callable 09/15/25 @ 100 | | | | | | | | |
5.750%, 09/15/35(B) | | $ | 1,605 | | | $ | 1,648 | |
Mid-Bay, Bridge Authority, Ser A, RB | | | | | | | | |
Pre-Refunded @ 100 | | | | | | | | |
7.250%, 10/01/21(C) | | | 5,200 | | | | 5,911 | |
Mid-Bay, Bridge Authority, Ser A, RB | | | | | | | | |
Callable 10/01/25 @ 100 | | | | | | | | |
5.000%, 10/01/35 | | | 5,000 | | | | 5,573 | |
Osceola County, Finance Authority, Poinciana Parkway Project, Ser A, RB | | | | | | | | |
Callable 10/01/24 @ 100 | | | | | | | | |
5.375%, 10/01/47 | | | 5,000 | | | | 5,385 | |
Palm Beach County, Health Facilities Authority, Sinai Residences Project, Ser A, RB | | | | | | | | |
Callable 06/01/22 @ 102 | | | | | | | | |
7.500%, 06/01/49 | | | 2,000 | | | | 2,257 | |
Palm Beach County, Health Facilities Authority, Sinai Residences Project, Ser A, RB | | | | | | | | |
Callable 06/01/22 @ 102 | | | | | | | | |
7.250%, 06/01/34 | | | 500 | | | | 561 | |
Saint Johns County, Industrial Development Authority, Presbyterian Retirement Project, Ser A, RB | | | | | | | | |
Pre-Refunded @ 100 | | | | | | | | |
6.000%, 08/01/20(C) | | | 3,000 | | | | 3,172 | |
Village Community Development District No. 12, SAB | | | | | | | | |
Callable 05/01/28 @ 100 | | | | | | | | |
4.250%, 05/01/43(B) | | | 2,500 | | | | 2,564 | |
Village Community Development District No. 12, SAB | | | | | | | | |
Callable 05/01/28 @ 100 | | | | | | | | |
4.000%, 05/01/33(B) | | | 1,500 | | | | 1,538 | |
| | | | | | | | | |
Total Florida | | | 66,698 | |
| | | | | | | | | |
Georgia [1.1%] |
Atlanta, Department of Aviation, Ser A, RB | | | | | | | | |
Callable 01/01/24 @ 100 | | | | | | | | |
5.000%, 01/01/31 | | | 2,500 | | | | 2,845 | |
DeKalb County, Hospital Authority, Dekalb Medical Center Project, RB | | | | | | | | |
Pre-Refunded @ 100 | | | | | | | | |
6.125%, 09/01/20(C) | | | 1,000 | | | | 1,062 | |
Gainesville & Hall County, Development Authority, Riverside Military Academy, RB | | | | | | | | |
Callable 03/01/27 @ 100 | | | | | | | | |
5.125%, 03/01/52 | | | 2,925 | | | | 3,085 | |
Gainesville & Hall County, Development Authority, Riverside Military Academy, RB | | | | | | | | |
Callable 03/01/27 @ 100 | | | | | | | | |
5.000%, 03/01/47 | | | 500 | | | | 525 | |
Greene County, Development Authority, GLEN-I Project, RB | | | | | | | | |
Callable 01/01/25 @ 100 | | | | | | | | |
7.250%, 01/01/46(B) | | | 3,400 | | | | 3,060 | |
Main Street Natural Gas, Ser A, RB | | | | | | | | |
Callable 05/15/29 @ 100 | | | | | | | | |
5.000%, 05/15/43 | | | 600 | | | | 669 | |
Main Street Natural Gas, Ser A, RB | | | | | | | | |
5.000%, 05/15/49 | | | 1,000 | | | | 1,217 | |
Rockdale County, Development Authority, Pratt Paper Project, RB, AMT | | | | | | | | |
Callable 01/01/28 @ 100 | | | | | | | | |
4.000%, 01/01/38(B) | | | 1,000 | | | | 1,013 | |
Savannah, Economic Development Authority, Marshes Skidaway Island Project, RB | | | | | | | | |
Callable 01/01/24 @ 100 | | | | | | | | |
7.250%, 01/01/49 | | | 810 | | | | 903 | |
| | | | | | | | | |
Total Georgia | | | 14,379 | |
| | | | | | | | | |
Hawaii [0.2%] |
Hawaii State, Department of Budget & Finance, 15 Craigside Project, Ser A, RB | | | | | | | | |
Pre-Refunded @ 100 | | | | | | | | |
8.750%, 11/15/19(C) | | | 2,055 | | | | 2,144 | |
| | | | | | | | | |
Illinois [10.2%] |
Aurora, Tax Increase Revenue, Ser A, RB | | | | | | | | |
5.000%, 12/30/27 | | | 1,000 | | | | 1,017 | |
See accompanying notes to financial statements.
CITY NATIONAL ROCHDALE FUNDS | PAGE 21
schedule of investments |
March 31, 2019 (Unaudited) |
City National Rochdale Municipal High Income Fund(continued) |
Description | | Face Amount (000) | | | Value (000) | |
Bridgeview Village, Ser A, GO | | | | | | | | |
Callable 12/01/25 @ 100 | | | | | | | | |
5.750%, 12/01/35 | | $ | 2,000 | | | $ | 2,052 | |
Bridgeview Village, Ser A, GO | | | | | | | | |
Callable 06/01/24 @ 100 | | | | | | | | |
5.500%, 12/01/43 | | | 4,880 | | | | 4,922 | |
Chicago, Board of Education, Ser A, GO | | | | | | | | |
Callable 12/01/28 @ 100 | | | | | | | | |
5.000%, 12/01/34 | | | 1,000 | | | | 1,077 | |
Chicago, Board of Education, Ser A, GO | | | | | | | | |
Callable 12/01/28 @ 100 | | | | | | | | |
5.000%, 12/01/35 | | | 1,250 | | | | 1,341 | |
Chicago, Board of Education, Ser B, GO | | | | | | | | |
Callable 12/01/27 @ 100 | | | | | | | | |
7.000%, 12/01/42(B) | | | 5,000 | | | | 6,068 | |
Chicago, Board of Education, Ser D, GO | | | | | | | | |
Callable 12/01/28 @ 100 | | | | | | | | |
5.000%, 12/01/46 | | | 2,000 | | | | 2,096 | |
Chicago, Board of Education, Ser G, GO | | | | | | | | |
Callable 12/01/27 @ 100 | | | | | | | | |
5.000%, 12/01/34 | | | 2,000 | | | | 2,149 | |
Chicago, Midway International Airport, Ser B, RB | | | | | | | | |
Callable 01/01/23 @ 100 | | | | | | | | |
5.000%, 01/01/35 | | | 2,000 | | | | 2,176 | |
Chicago, Midway International Airport, Ser B, RB | | | | | | | | |
Callable 01/01/24 @ 100 | | | | | | | | |
5.000%, 01/01/35 | | | 3,000 | | | | 3,315 | |
Chicago, Ser A, GO | | | | | | | | |
Callable 01/01/27 @ 100 | | | | | | | | |
6.000%, 01/01/38 | | | 9,000 | | | | 10,267 | |
Chicago, Ser A, GO | | | | | | | | |
Callable 01/01/29 @ 100 | | | | | | | | |
5.500%, 01/01/49 | | | 2,000 | | | | 2,207 | |
Chicago, Ser A, GO | | | | | | | | |
Callable 01/01/29 @ 100 | | | | | | | | |
5.000%, 01/01/44 | | | 1,500 | | | | 1,591 | |
Cook County, Ser A, GO | | | | | | | | |
Callable 11/15/26 @ 100 | | | | | | | | |
5.000%, 11/15/30 | | | 2,050 | | | | 2,312 | |
Illinois State, Finance Authority, Admiral at Lake Project, RB | | | | | | | | |
Callable 05/15/24 @ 103 | | | | | | | | |
5.250%, 05/15/42 | | | 3,000 | | | | 3,027 | |
Illinois State, Finance Authority, Admiral at Lake Project, Ser A, RB | | | | | | | | |
Pre-Refunded @ 100 | | | | | | | | |
8.000%, 05/15/20(C) | | | 1,825 | | | | 1,951 | |
Illinois State, Finance Authority, Admiral at Lake Project, Ser A, RB | | | | | | | | |
Pre-Refunded @ 100 | | | | | | | | |
8.000%, 05/15/20(C) | | | 4,000 | | | | 4,277 | |
Illinois State, Finance Authority, Columbia College Chicago, Ser S, RB | | | | | | | | |
Callable 12/01/25 @ 100 | | | | | | | | |
4.125%, 12/01/30 | | | 1,505 | | | | 1,542 | |
Illinois State, Finance Authority, Lutheran Home and Services Project, RB | | | | | | | | |
Callable 05/15/22 @ 100 | | | | | | | | |
5.625%, 05/15/42 | | | 5,000 | | | | 5,125 | |
Illinois State, Finance Authority, Presence Health Network, Ser C, RB | | | | | | | | |
Callable 02/15/27 @ 100 | | | | | | | | |
5.000%, 02/15/36 | | | 4,535 | | | | 5,235 | |
Illinois State, Finance Authority, Presence Health Network, Ser C, RB | | | | | | | | |
Callable 02/15/27 @ 100 | | | | | | | | |
5.000%, 02/15/41 | | | 1,000 | | | | 1,138 | |
Illinois State, Finance Authority, Roosevelt University Project, RB | | | | | | | | |
Pre-Refunded @ 100 | | | | | | | | |
6.500%, 10/01/19(C) | | | 3,445 | | | | 3,529 | |
Illinois State, Finance Authority, Roosevelt University Project, RB | | | | | | | | |
Pre-Refunded @ 100 | | | | | | | | |
6.250%, 10/01/19(C) | | | 1,000 | | | | 1,023 | |
Illinois State, Finance Authority, Wesleyan University, RB | | | | | | | | |
Callable 09/01/26 @ 100 | | | | | | | | |
4.000%, 09/01/41 | | | 6,640 | | | | 6,719 | |
Illinois State, GO | | | | | | | | |
Callable 05/01/24 @ 100 | | | | | | | | |
5.000%, 05/01/27 | | | 1,500 | | | | 1,601 | |
Illinois State, GO | | | | | | | | |
Callable 11/01/26 @ 100 | | | | | | | | |
5.000%, 11/01/36 | | | 5,000 | | | | 5,298 | |
See accompanying notes to financial statements.
CITY NATIONAL ROCHDALE FUNDS | PAGE 22
schedule of investments |
March 31, 2019 (Unaudited) |
City National Rochdale Municipal High Income Fund(continued) |
Description | | Face Amount (000) | | | Value (000) | |
Illinois State, Housing Development Authority, Stonebridge Gurnee Project, Ser A, RB | | | | | | | | |
Callable 01/01/26 @ 100 | | | | | | | | |
5.600%, 01/01/56(B) | | $ | 2,500 | | | $ | 2,317 | |
Illinois State, Housing Development Authority, Stonebridge Gurnee Project, Ser A, RB | | | | | | | | |
Callable 01/01/26 @ 100 | | | | | | | | |
5.450%, 01/01/46(B) | | | 2,500 | | | | 2,308 | |
Illinois State, Ser A, GO | | | | | | | | |
5.000%, 10/01/28 | | | 2,000 | | | | 2,227 | |
Illinois State, Ser A, GO | | | | | | | | |
Callable 12/01/27 @ 100 | | | | | | | | |
5.000%, 12/01/34 | | | 5,000 | | | | 5,372 | |
Illinois State, Ser A, GO | | | | | | | | |
Callable 01/01/22 @ 100 | | | | | | | | |
4.000%, 01/01/23 | | | 3,000 | | | | 3,073 | |
Illinois State, Ser D, GO | | | | | | | | |
5.000%, 11/01/25 | | | 3,000 | | | | 3,307 | |
Illinois State, Ser D, GO | | | | | | | | |
3.250%, 11/01/26 | | | 8,175 | | | | 7,936 | |
Romeoville Village, Lewis University, Ser B, RB | | | | | | | | |
Callable 04/01/25 @ 100 | | | | | | | | |
4.125%, 10/01/41 | | | 1,250 | | | | 1,255 | |
Romeoville Village, Lewis University, Ser B, RB | | | | | | | | |
Callable 04/01/25 @ 100 | | | | | | | | |
4.125%, 10/01/46 | | | 1,500 | | | | 1,503 | |
Sales Tax Securitization, RB | | | | | | | | |
Callable 01/01/28 @ 100 | | | | | | | | |
5.000%, 01/01/30 | | | 1,000 | | | | 1,161 | |
Sales Tax Securitization, Ser A, RB | | | | | | | | |
Callable 01/01/28 @ 100 | | | | | | | | |
5.000%, 01/01/31 | | | 1,000 | | | | 1,154 | |
Sales Tax Securitization, Ser A, RB | | | | | | | | |
Callable 01/01/28 @ 100 | | | | | | | | |
5.000%, 01/01/32 | | | 1,000 | | | | 1,147 | |
Southern Illinois University, Ser B, RB | | | | | | | | |
Callable 10/01/22 @ 100 | | | | | | | | |
5.000%, 04/01/26 | | | 2,105 | | | | 2,211 | |
Southwestern Illinois, Development Authority, Collinsville Project, RB | | | | | | | | |
Callable 04/29/19 @ 100 | | | | | | | | |
5.350%, 03/01/31 | | | 75 | | | | 55 | |
University of Illinois, Ser B, COP | | | | | | | | |
Callable 10/01/26 @ 100 | | | | | | | | |
5.000%, 10/01/27 | | | 1,500 | | | | 1,771 | |
Upper Illinois, River Valley Development Authority, RB | | | | | | | | |
Callable 12/01/28 @ 100 | | | | | | | | |
5.000%, 12/01/43 | | | 2,000 | | | | 2,207 | |
Village of Bolingbrook, Special Service Area No. 1, SPL Tax | | | | | | | | |
Callable 03/01/28 @ 100 | | | | | | | | |
5.250%, 03/01/41 | | | 3,500 | | | | 3,555 | |
Village of Gilberts, RB | | | | | | | | |
5.000%, 11/15/34 | | | 3,250 | | | | 3,342 | |
Village of Hodgkins, Redevelopment Project Area #4, TA | | | | | | | | |
Callable 01/01/27 @ 100 | | | | | | | | |
5.625%, 01/01/37 | | | 5,200 | | | | 5,243 | |
| | | | | | | | | |
Total Illinois | | | 134,199 | |
| | | | | | | | | |
Indiana [1.3%] |
Allen County, Storypoint Fort Wayne Project, RB | | | | | | | | |
Callable 01/15/24 @ 104 | | | | | | | | |
6.875%, 01/15/52(B) | | | 1,265 | | | | 1,348 | |
Carmel, Barrington Carmel Project, Ser A, RB | | | | | | | | |
Callable 11/15/22 @ 100 | | | | | | | | |
7.125%, 11/15/47(E) | | | 3,000 | | | | 2,400 | |
Carmel, Barrington Carmel Project, Ser A, RB | | | | | | | | |
Callable 11/15/22 @ 100 | | | | | | | | |
7.000%, 11/15/32(E) | | | 1,650 | | | | 1,320 | |
Chesterton, Storypoint Chesterton Project, RB | | | | | | | | |
Callable 01/15/24 @ 104 | | | | | | | | |
6.375%, 01/15/51(B) | | | 2,100 | | | | 2,177 | |
Indianapolis, Ritter Affordable Assisted Living Project, RB | | | | | | | | |
Callable 12/01/22 @ 102 | | | | | | | | |
6.900%, 12/01/33 | | | 4,000 | | | | 4,040 | |
Lafayette City, Finance Authority, Glasswater Creek Project, RB | | | | | | | | |
Callable 07/01/26 @ 101 | | | | | | | | |
5.800%, 01/01/37 | | | 3,310 | | | | 3,453 | |
See accompanying notes to financial statements.
CITY NATIONAL ROCHDALE FUNDS | PAGE 23
schedule of investments |
March 31, 2019 (Unaudited) |
City National Rochdale Municipal High Income Fund(continued) |
Description | | Face Amount (000) | | | Value (000) | |
Terre Haute, Westminster Village Project, RB | | | | | | | | |
Callable 08/01/22 @ 100 | | | | | | | | |
6.000%, 08/01/39 | | $ | 2,355 | | | $ | 2,384 | |
| | | | | | | | | |
Total Indiana | | | 17,122 | |
| | | | | | | | | |
Iowa [0.6%] |
Iowa State, Finance Authority, Child Serve Project, Ser B, RB | | | | | | | | |
Callable 06/01/25 @ 100 | | | | | | | | |
5.000%, 06/01/36 | | | 2,000 | | | | 2,124 | |
Iowa State, Finance Authority, RB | | | | | | | | |
Callable 12/01/20 @ 103 | | | | | | | | |
3.125%, 12/01/22 | | | 750 | | | | 755 | |
Iowa State, Finance Authority, Ser A, RB | | | | | | | | |
Callable 05/15/27 @ 100 | | | | | | | | |
5.000%, 05/15/43 | | | 2,000 | | | | 2,130 | |
Iowa State, Tobacco Settlement Authority, Ser C, RB | | | | | | | | |
Callable 04/29/19 @ 100 | | | | | | | | |
5.625%, 06/01/46 | | | 1,665 | | | | 1,665 | |
Iowa State, Tobacco Settlement Authority, Ser C, RB | | | | | | | | |
Callable 04/29/19 @ 100 | | | | | | | | |
5.500%, 06/01/42 | | | 1,180 | | | | 1,180 | |
| | | | | | | | | |
Total Iowa | | | 7,854 | |
| | | | | | | | | |
Kansas [1.3%] |
Arkansas City, Public Building Commission, South Central Regional Medical Center, RB | | | | | | | | |
Callable 09/01/19 @ 100 | | | | | | | | |
7.000%, 09/01/29 | | | 2,550 | | | | 2,584 | |
Kansas State, Development Finance Authority, Village Shalom Project, Ser A, RB | | | | | | | | |
Callable 11/15/23 @ 104 | | | | | | | | |
5.500%, 11/15/38 | | | 500 | | | | 534 | |
Kansas State, Development Finance Authority, Village Shalom Project, Ser A, RB | | | | | | | | |
Callable 11/15/23 @ 104 | | | | | | | | |
5.250%, 11/15/53 | | | 4,050 | | | | 4,170 | |
University of Kansas, Hospital Authority, Ser A, RB | | | | | | | | |
Callable 03/01/27 @ 100 | | | | | | | | |
4.000%, 03/01/42 | | | 5,000 | | | | 5,244 | |
Wichita City, Masonic Home, Ser II-A, RB | | | | | | | | |
Callable 12/01/26 @ 100 | | | | | | | | |
5.375%, 12/01/46 | | | 2,500 | | | | 2,637 | |
Wichita City, Masonic Home, Ser II-A, RB | | | | | | | | |
Callable 12/01/26 @ 100 | | | | | | | | |
5.250%, 12/01/36 | | | 500 | | | | 531 | |
Wyandotte County-Kansas City Unified Government, RB | | | | | | | | |
Callable 09/01/25 @ 100 | | | | | | | | |
5.750%, 09/01/32 | | | 1,880 | | | | 2,031 | |
| | | | | | | | | |
Total Kansas | | | 17,731 | |
| | | | | | | | | |
Kentucky [1.4%] |
Kentucky State, Economic Development Finance Authority, Masonic Home Independent Living, RB | | | | | | | | |
Callable 05/15/26 @ 100 | | | | | | | | |
5.000%, 05/15/46 | | | 2,500 | | | | 2,568 | |
Kentucky State, Economic Development Finance Authority, Masonic Home Independent Living, RB | | | | | | | | |
Callable 05/15/26 @ 100 | | | | | | | | |
5.000%, 05/15/51 | | | 2,000 | | | | 2,048 | |
Kentucky State, Economic Development Finance Authority, Owensboro Medical Health System Project, Ser A, RB | | | | | | | | |
Pre-Refunded @ 100 | | | | | | | | |
6.500%, 06/01/20(C) | | | 2,960 | | | | 3,127 | |
Kentucky State, Economic Development Finance Authority, Owensboro Medical Health System Project, Ser A, RB | | | | | | | | |
Pre-Refunded @ 100 | | | | | | | | |
6.375%, 06/01/20(C) | | | 1,000 | | | | 1,055 | |
Kentucky State, Public Transportation Infrastructure Authority, Downtown Crossing Project, RB | | | | | | | | |
Callable 07/01/23 @ 100 | | | | | | | | |
5.750%, 07/01/49 | | | 5,650 | | | | 6,166 | |
Louisville, Louisville Gas and Electric Company Project, RB | | | | | | | | |
1.500%, 10/01/33(A) | | | 3,000 | | | | 3,000 | |
| | | | | | | | | |
Total Kentucky | | | 17,964 | |
| | | | | | | | | |
See accompanying notes to financial statements.
CITY NATIONAL ROCHDALE FUNDS | PAGE 24
schedule of investments |
March 31, 2019 (Unaudited) |
City National Rochdale Municipal High Income Fund(continued) |
Description | | Face Amount (000) | | | Value (000) | |
Louisiana [1.0%] |
Juban Crossing, Economic Development District, General Infrastructure Project, Ser C, RB | | | | | | | | |
Callable 03/15/25 @ 100 | | | | | | | | |
7.000%, 09/15/44(B) | | $ | 5,665 | | | $ | 5,773 | |
Louisiana State, Local Government Environmental Facilities & Community Development Authority, Ser S, RB | | | | | | | | |
Callable 06/01/25 @ 100 | | | | | | | | |
5.625%, 06/01/45 | | | 2,000 | | | | 2,047 | |
Louisiana State, Public Facilities Authority, Loyola University Project, RB | | | | | | | | |
Callable 10/01/21 @ 100 | | | | | | | | |
5.000%, 10/01/41 | | | 5,000 | | | | 5,186 | |
Louisiana State, Public Facilities Authority, Pellets Project, RB, AMT | | | | | | | | |
Callable 07/01/23 @ 100 | | | | | | | | |
10.500%, 07/01/39(E) | | | 1,435 | | | | — | |
Louisiana State, Public Facilities Authority, Pellets Project, RB, AMT | | | | | | | | |
7.000%, 07/01/24(B) (E) | | | 1,319 | | | | — | |
Louisiana State, Public Facilities Authority, Pellets Project, Ser A, RB, AMT | | | | | | | | |
Callable 07/01/24 @ 100 | | | | | | | | |
8.375%, 07/01/39(E) | | | 3,474 | | | | — | |
| | | | | | | | | |
Total Louisiana | | | 13,006 | |
| | | | | | | | | |
Maine [0.1%] |
Maine State, Financing Authority, Casella Waste Systems Project, RB, AMT | | | | | | | | |
4.375%, 08/01/35(A) (B) | | | 1,000 | | | | 1,022 | |
| | | | | | | | | |
Maryland [1.4%] |
Baltimore, Harbor Point Project, RB | | | | | | | | |
Callable 06/01/26 @ 100 | | | | | | | | |
5.000%, 06/01/36 | | | 1,000 | | | | 1,036 | |
Howard County, Annapolis Junction Town Center Project, TA | | | | | | | | |
Callable 02/15/24 @ 100 | | | | | | | | |
6.100%, 02/15/44 | | | 1,425 | | | | 1,463 | |
Howard County, Annapolis Junction Town Center Project, TA | | | | | | | | |
Callable 02/15/24 @ 100 | | | | | | | | |
5.800%, 02/15/34 | | | 725 | | | | 741 | |
Howard County, Downtown Columbia Project, Ser A, TA | | | | | | | | |
Callable 02/15/26 @ 100 | | | | | | | | |
4.500%, 02/15/47(B) | | | 1,250 | | | | 1,271 | |
Howard County, Downtown Columbia Project, Ser A, TA | | | | | | | | |
Callable 02/15/26 @ 100 | | | | | | | | |
4.375%, 02/15/39(B) | | | 1,000 | | | | 1,016 | |
Maryland State, Economic Development, RB | | | | | | | | |
Callable 09/01/20 @ 100 | | | | | | | | |
5.750%, 09/01/25 | | | 3,000 | | | | 3,091 | |
Prince George’s County, RB | | | | | | | | |
Callable 07/01/28 @ 100 | | | | | | | | |
5.250%, 07/01/48(B) | | | 2,000 | | | | 2,073 | |
Prince George’s County, RB | | | | | | | | |
Callable 07/01/28 @ 100 | | | | | | | | |
5.125%, 07/01/39(B) | | | 1,000 | | | | 1,045 | |
Westminster, Luther Village Millers Grant Project, RB | | | | | | | | |
Callable 07/01/24 @ 100 | | | | | | | | |
6.250%, 07/01/44 | | | 3,780 | | | | 4,062 | |
Westminster, Luther Village Millers Grant Project, RB | | | | | | | | |
Callable 07/01/24 @ 100 | | | | | | | | |
6.125%, 07/01/39 | | | 750 | | | | 802 | |
Westminster, Luther Village Millers Grant Project, RB | | | | | | | | |
Callable 07/01/24 @ 100 | | | | | | | | |
6.000%, 07/01/34 | | | 1,205 | | | | 1,283 | |
| | | | | | | | | |
Total Maryland | | | 17,883 | |
| | | | | | | | | |
Massachusetts [0.9%] |
Massachusetts Development Finance Agency, Ser A, RB | | | | | | | | |
Callable 01/01/29 @ 100 | | | | | | | | |
5.000%, 07/01/44 | | | 500 | | | | 568 | |
Massachusetts State, Development Finance Agency, Emmanuel College, Ser A, RB | | | | | | | | |
Callable 10/01/26 @ 100 | | | | | | | | |
5.000%, 10/01/36 | | | 2,305 | | | | 2,579 | |
Massachusetts State, Development Finance Agency, Emmanuel College, Ser A, RB | | | | | | | | |
Callable 10/01/26 @ 100 | | | | | | | | |
4.000%, 10/01/46 | | | 4,120 | | | | 4,170 | |
See accompanying notes to financial statements.
CITY NATIONAL ROCHDALE FUNDS | PAGE 25
schedule of investments |
March 31, 2019 (Unaudited) |
City National Rochdale Municipal High Income Fund(continued) |
Description | | Face Amount (000) | | | Value (000) | |
Massachusetts State, Development Finance Agency, Ser A, RB | | | | | | | | |
Callable 10/01/26 @ 100 | | | | | | | | |
5.000%, 10/01/43 | | $ | 2,000 | | | $ | 2,206 | |
Massachusetts State, Development Finance Agency, Western New England University, RB | | | | | | | | |
Callable 09/01/28 @ 100 | | | | | | | | |
5.000%, 09/01/43 | | | 2,000 | | | | 2,248 | |
| | | | | | | | | |
Total Massachusetts | | | 11,771 | |
| | | | | | | | | |
Michigan [1.6%] |
Detroit Michigan, GO | | | | | | | | |
Callable 04/01/28 @ 100 | | | | | | | | |
5.000%, 04/01/38 | | | 625 | | | | 665 | |
Michigan State, Finance Authority, Hospital Presbyterian Village, RB | | | | | | | | |
Callable 11/15/25 @ 100 | | | | | | | | |
5.250%, 11/15/35 | | | 2,340 | | | | 2,410 | |
Michigan State, Finance Authority, Old Redford School Project, Ser A, RB | | | | | | | | |
Callable 12/01/20 @ 100 | | | | | | | | |
6.500%, 12/01/40 | | | 3,745 | | | | 3,769 | |
Michigan State, Finance Authority, Public School Academy - Cesar Chavez Project, RB | | | | | | | | |
Callable 02/01/20 @ 101 | | | | | | | | |
5.750%, 02/01/33 | | | 4,000 | | | | 4,044 | |
Michigan State, Public Educational Facilities Authority, Old Redford Project, Ser A, RB | | | | | | | | |
Callable 04/29/19 @ 100 | | | | | | | | |
5.875%, 12/01/30 | | | 2,000 | | | | 2,000 | |
Michigan State, Tobacco Settlement Finance Authority, Ser A, RB | | | | | | | | |
Callable 04/15/19 @ 100 | | | | | | | | |
6.000%, 06/01/34 | | | 4,000 | | | | 4,000 | |
Michigan State, Tobacco Settlement Finance Authority, Ser A, RB | | | | | | | | |
Callable 04/15/19 @ 100 | | | | | | | | |
5.125%, 06/01/22 | | | 2,620 | | | | 2,620 | |
Michigan State, Tobacco Settlement Finance Authority, Turbo Project, Ser A, RB | | | | | | | | |
Callable 04/15/19 @ 100 | | | | | | | | |
6.875%, 06/01/42 | | | 2,000 | | | | 2,001 | |
| | | | | | | | | |
Total Michigan | | | 21,509 | |
| | | | | | | | | |
Minnesota [1.0%] |
Anoka, Housing Revenue Authority, Homestead Project, RB | | | | | | | | |
Callable 11/01/24 @ 103 | | | | | | | | |
4.750%, 11/01/35 | | | 3,000 | | | | 3,126 | |
Bethel, Senior Housing Revenue, Lodge at Lakes at Stillwater Project, RB | | | | | | | | |
Callable 06/01/23 @ 102 | | | | | | | | |
5.250%, 06/01/58 | | | 2,840 | | | | 2,955 | |
Bethel, Senior Housing Revenue, Lodge at Lakes at Stillwater Project, RB | | | | | | | | |
Callable 06/01/23 @ 102 | | | | | | | | |
5.000%, 06/01/48 | | | 1,000 | | | | 1,033 | |
Minneapolis State, Riverton Community Housing Project, RB | | | | | | | | |
Callable 08/01/24 @ 102 | | | | | | | | |
5.000%, 08/01/53(B) | | | 500 | | | | 519 | |
Minneapolis State, Riverton Community Housing Project, RB | | | | | | | | |
Callable 08/01/24 @ 102 | | | | | | | | |
4.750%, 08/01/43(B) | | | 1,600 | | | | 1,651 | |
Rochester, RB | | | | | | | | |
Callable 05/15/28 @ 100 | | | | | | | | |
4.000%, 11/15/48 | | | 2,000 | | | | 2,127 | |
West Saint Paul, Walker Westwood Ridge Camp, RB | | | | | | | | |
Callable 11/01/25 @ 100 | | | | | | | | |
5.000%, 11/01/49 | | | 1,150 | | | | 1,192 | |
| | | | | | | | | |
Total Minnesota | | | 12,603 | |
| | | | | | | | | |
Missouri [3.3%] |
Blue Springs, Improvement Adams Farm Project, TA | | | | | | | | |
Callable 06/01/24 @ 100 | | | | | | | | |
5.250%, 06/01/39 | | | 3,400 | | | | 3,428 | |
See accompanying notes to financial statements.
CITY NATIONAL ROCHDALE FUNDS | PAGE 26
schedule of investments |
March 31, 2019 (Unaudited) |
City National Rochdale Municipal High Income Fund(continued) |
Description | | Face Amount (000) | | | Value (000) | |
Hanley, Transportation Development, Eager Road Transportation Development District, Ser A, SAB | | | | | | | | |
Callable 03/01/21 @ 100 | | | | | | | | |
4.000%, 03/01/42 | | $ | 1,000 | | | $ | 966 | |
Hanley, Transportation Development, Eager Road Transportation Development District, Ser A, SAB | | | | | | | | |
Callable 03/01/21 @ 100 | | | | | | | | |
3.625%, 03/01/33 | | | 500 | | | | 477 | |
Hanley, Transportation Development, Eager Road Transportation Development District, Ser A, SAB | | | | | | | | |
Callable 03/01/21 @ 100 | | | | | | | | |
3.000%, 03/01/26 | | | 500 | | | | 483 | |
Kansas City, Industrial Development Authority, Ser A, RB | | | | | | | | |
Callable 04/01/26 @ 100 | | | | | | | | |
5.000%, 04/01/36(B) | | | 1,000 | | | | 1,020 | |
Kansas City, Industrial Development Authority, Ser A, RB | | | | | | | | |
Callable 04/01/26 @ 100 | | | | | | | | |
5.000%, 04/01/46(B) | | | 1,150 | | | | 1,157 | |
Kirkwood, Industrial Development Authority, Aberdeen Heights Project, RB | | | | | | | | |
Callable 05/15/27 @ 100 | | | | | | | | |
5.250%, 05/15/37 | | | 1,000 | | | | 1,092 | |
Kirkwood, Industrial Development Authority, Aberdeen Heights Project, RB | | | | | | | | |
Callable 05/15/27 @ 100 | | | | | | | | |
5.250%, 05/15/42 | | | 1,000 | | | | 1,081 | |
Kirkwood, Industrial Development Authority, Aberdeen Heights Project, RB | | | | | | | | |
Callable 05/15/27 @ 100 | | | | | | | | |
5.250%, 05/15/50 | | | 2,000 | | | | 2,149 | |
Kirkwood, Industrial Development Authority, Aberdeen Heights Project, Ser A, RB | | | | | | | | |
Pre-Refunded @ 100 | | | | | | | | |
8.250%, 05/15/20(C) | | | 3,000 | | | | 3,216 | |
Lees Summit, Industrial Development Authority, John Knox Village, Ser A, RB | | | | | | | | |
Callable 08/15/24 @ 102 | | | | | | | | |
5.000%, 08/15/51 | | | 8,000 | | | | 8,273 | |
Poplar Bluff, Ser A, TA | | | | | | | | |
Callable 11/01/23 @ 100 | | | | | | | | |
5.125%, 11/01/35(B) | | | 5,000 | | | | 4,970 | |
St. Joseph, Industrial Development Authority, Living Community Saint Joseph Project, RB | | | | | | | | |
Callable 04/29/19 @ 100 | | | | | | | | |
7.000%, 08/15/32 | | | 940 | | | | 940 | |
St. Louis County, Industrial Development Authority, Manchester Ballas Community, RB | | | | | | | | |
Callable 09/01/24 @ 100 | | | | | | | | |
5.250%, 09/01/45(B) | | | 3,000 | | | | 2,991 | |
St. Louis County, Industrial Development Authority, Manchester Ballas Community, RB | | | | | | | | |
Callable 09/01/24 @ 100 | | | | | | | | |
5.000%, 09/01/38(B) | | | 2,000 | | | | 2,000 | |
St. Louis County, Industrial Development Authority, Senior Living Facilities Friendship Village, RB | | | | | | | | |
Callable 09/01/25 @ 103 | | | | | | | | |
5.125%, 09/01/48 | | | 2,000 | | | | 2,146 | |
St. Louis, Industrial Development Authority, Ballpark Village Development Project, RB | | | | | | | | |
Callable 11/15/26 @ 100 | | | | | | | | |
4.375%, 11/15/35 | | | 2,250 | | | | 2,317 | |
St. Louis, Industrial Development Authority, Ballpark Village Development Project, RB | | | | | | | | |
Callable 11/15/26 @ 100 | | | | | | | | |
3.875%, 11/15/29 | | | 1,405 | | | | 1,459 | |
St. Louis, Industrial Development Authority, Innovation District Project, TA | | | | | | | | |
Callable 05/15/24 @ 100 | | | | | | | | |
4.375%, 05/15/36 | | | 2,500 | | | | 2,500 | |
| | | | | | | | | |
Total Missouri | | | 42,665 | |
| | | | | | | | | |
Nebraska [0.5%] |
Central Plains Energy Project, Project No. 3, RB | | | | | | | | |
Callable 09/01/22 @ 100 | | | | | | | | |
5.250%, 09/01/37 | | | 1,000 | | | | 1,090 | |
See accompanying notes to financial statements.
CITY NATIONAL ROCHDALE FUNDS | PAGE 27
schedule of investments |
March 31, 2019 (Unaudited) |
City National Rochdale Municipal High Income Fund(continued) |
Description | | Face Amount (000) | | | Value (000) | |
Central Plains Energy Project, Project No. 3, RB | | | | | | | | |
Callable 09/01/22 @ 100 | | | | | | | | |
5.000%, 09/01/42 | | $ | 5,500 | | | $ | 5,955 | |
| | | | | | | | | |
Total Nebraska | | | 7,045 | |
| | | | | | | | | |
Nevada [0.8%] |
Clark County, Department of Aviation, Sub-Ser A-2, RB | | | | | | | | |
Callable 07/01/24 @ 100 | | | | | | | | |
5.000%, 07/01/35 | | | 3,000 | | | | 3,375 | |
Las Vegas, Finance Authority, RB | | | | | | | | |
Callable 06/15/21 @ 100 | | | | | | | | |
4.375%, 06/15/35(B) | | | 3,500 | | | | 3,266 | |
Las Vegas, Special Improvement District No. 812, SAB | | | | | | | | |
Callable 12/01/25 @ 100 | | | | | | | | |
5.000%, 12/01/35 | | | 1,000 | | | | 1,024 | |
Nevada State, Department of Business & Industry, Green-Fulcrum Sierra Biofuels, RB, AMT | | | | | | | | |
Callable 12/15/27 @ 100 | | | | | | | | |
6.250%, 12/15/37(B) | | | 100 | | | | 108 | |
Nevada State, Department of Business & Industry, Sumerset Academy, Ser A, RB | | | | | | | | |
Callable 12/15/25 @ 100 | | | | | | | | |
5.000%, 12/15/35(B) | | | 1,595 | | | | 1,692 | |
Nevada State, Department of Business & Industry, Sumerset Academy, Ser A, RB | | | | | | | | |
Callable 12/15/25 @ 100 | | | | | | | | |
5.000%, 12/15/48(B) | | | 1,000 | | | | 1,040 | |
| | | | | | | | | |
Total Nevada | | | 10,505 | |
| | | | | | | | | |
New Jersey [2.1%] |
New Jersey State, Economic Development Authority, Continental Airlines Project, RB, AMT | | | | | | | | |
Callable 08/20/22 @ 101 | | | | | | | | |
5.250%, 09/15/29 | | | 1,000 | | | | 1,092 | |
New Jersey State, Economic Development Authority, Port Newark Container, RB, AMT | | | | | | | | |
Callable 10/01/27 @ 100 | | | | | | | | |
5.000%, 10/01/47 | | | 6,000 | | | | 6,494 | |
New Jersey State, Economic Development Authority, Ser A, RB | | | | | | | | |
Callable 12/15/27 @ 100 | | | | | | | | |
5.000%, 06/15/42 | | | 1,155 | | | | 1,249 | |
New Jersey State, Economic Development Authority, Ser A, RB | | | | | | | | |
Callable 12/15/27 @ 100 | | | | | | | | |
5.000%, 06/15/47 | | | 1,230 | | | | 1,324 | |
New Jersey State, Transportation Trust Fund Authority, Ser S, RB | | | | | | | | |
Callable 12/15/28 @ 100 | | | | | | | | |
5.250%, 06/15/43 | | | 15,000 | | | | 16,722 | |
New Jersey State, Transportation Trust Fund Authority, Ser S, RB | | | | | | | | |
Callable 12/15/28 @ 100 | | | | | | | | |
5.000%, 06/15/46 | | | 1,000 | | | | 1,087 | |
| | | | | | | | | |
Total New Jersey | | | 27,968 | |
| | | | | | | | | |
New Mexico [0.5%] |
Lower Petroglyphs Public Improvement District, RB | | | | | | | | |
Callable 10/01/27 @ 100 | | | | | | | | |
5.000%, 10/01/33 | | | 500 | | | | 524 | |
Lower Petroglyphs Public Improvement District, RB | | | | | | | | |
Callable 10/01/27 @ 100 | | | | | | | | |
5.000%, 10/01/38 | | | 500 | | | | 516 | |
Lower Petroglyphs Public Improvement District, RB | | | | | | | | |
Callable 10/01/27 @ 100 | | | | | | | | |
5.000%, 10/01/48 | | | 1,750 | | | | 1,790 | |
New Mexico State, Hospital Equipment Loan Council, RB | | | | | | | | |
Callable 07/01/22 @ 100 | | | | | | | | |
5.500%, 07/01/42 | | | 3,110 | | | | 3,342 | |
| | | | | | | | | |
Total New Mexico | | | 6,172 | |
| | | | | | | | | |
New York [4.9%] |
Nassau County, Industrial Development Agency, Amsterdam at Harborside, Ser A, RB | | | | | | | | |
Callable 01/01/25 @ 101 | | | | | | | | |
6.700%, 01/01/49 | | | 4,789 | | | | 4,822 | |
See accompanying notes to financial statements.
CITY NATIONAL ROCHDALE FUNDS | PAGE 28
schedule of investments |
March 31, 2019 (Unaudited) |
City National Rochdale Municipal High Income Fund(continued) |
Description | | Face Amount (000) | | | Value (000) | |
Nassau County, Industrial Development Agency, Amsterdam at Harborside, Ser C, RB | | | | | | | | |
Callable 04/29/19 @ 100 | | | | | | | | |
2.000%, 01/01/49 | | $ | 1,728 | | | $ | 283 | |
Nassau County, Tobacco Settlement, RB | | | | | | | | |
Callable 04/15/19 @ 100 | | | | | | | | |
5.125%, 06/01/46 | | | 4,120 | | | | 4,017 | |
New York Counties, Tobacco Trust IV, Ser A, RB | | | | | | | | |
Callable 04/15/19 @ 100 | | | | | | | | |
5.000%, 06/01/45 | | | 5,800 | | | | 5,741 | |
New York State, Liberty Development, World Trade Center, RB | | | | | | | | |
Callable 11/15/24 @ 100 | | | | | | | | |
5.000%, 11/15/44(B) | | | 10,000 | | | | 10,659 | |
New York State, Transportation Development, American Airlines, RB, AMT | | | | | | | | |
Callable 08/01/21 @ 100 | | | | | | | | |
5.000%, 08/01/26 | | | 3,000 | | | | 3,148 | |
New York State, Transportation Development, LaGuardia Airport Terminal B, RB, AMT | | | | | | | | |
Callable 07/01/24 @ 100 | | | | | | | | |
5.000%, 07/01/41 | | | 1,500 | | | | 1,630 | |
Niagara, Area Development, Ser A, RB, AMT | | | | | | | | |
Callable 07/01/23 @ 100 | | | | | | | | |
4.750%, 11/01/42(B) | | | 4,750 | | | | 4,854 | |
Niagara, Tobacco Asset Securitization, RB | | | | | | | | |
Callable 05/15/24 @ 100 | | | | | | | | |
5.250%, 05/15/34 | | | 1,000 | | | | 1,066 | |
Niagara, Tobacco Asset Securitization, RB | | | | | | | | |
Callable 05/15/24 @ 100 | | | | | | | | |
5.250%, 05/15/40 | | | 1,000 | | | | 1,059 | |
Suffolk, Tobacco Asset Securitization, Ser C, RB | | | | | | | | |
Callable 06/01/22 @ 100 | | | | | | | | |
6.625%, 06/01/44 | | | 6,000 | | | | 6,320 | |
TSASC, RB | | | | | | | | |
Callable 06/01/27 @ 100 | | | | | | | | |
5.000%, 06/01/45 | | | 9,000 | | | | 9,009 | |
TSASC, Ser A, RB | | | | | | | | |
Callable 06/01/27 @ 100 | | | | | | | | |
5.000%, 06/01/41 | | | 2,000 | | | | 2,158 | |
Westchester Tobacco Asset Securitization, Ser B, RB | | | | | | | | |
Callable 06/01/27 @ 100 | | | | | | | | |
5.000%, 06/01/41 | | | 2,485 | | | | 2,660 | |
Westchester, Tobacco Asset Securitization, Sub-Ser C, RB | | | | | | | | |
Callable 06/01/27 @ 100 | | | | | | | | |
5.125%, 06/01/51 | | | 7,000 | | | | 7,166 | |
| | | | | | | | | |
Total New York | | | 64,592 | |
| | | | | | | | | |
North Carolina [0.2%] |
North Carolina State, Department of Transportation, I-77 Hot Lanes Project, RB, AMT | | | | | | | | |
Callable 06/30/25 @ 100 | | | | | | | | |
5.000%, 12/31/37 | | | 1,405 | | | | 1,528 | |
North Carolina State, Medical Care Commission, United Church Homes and Services, RB | | | | | | | | |
Callable 09/01/24 @ 100 | | | | | | | | |
5.000%, 09/01/37 | | | 1,155 | | | | 1,210 | |
| | | | | | | | | |
Total North Carolina | | | 2,738 | |
| | | | | | | | | |
North Dakota [0.8%] |
Burleigh County, Education Facilities, University of Mary Project, RB | | | | | | | | |
Callable 04/15/26 @ 100 | | | | | | | | |
5.200%, 04/15/46 | | | 2,000 | | | | 2,029 | |
Grand Forks County, Red River Biorefinery Project, RB | | | | | | | | |
Callable 09/15/28 @ 100 | | | | | | | | |
5.375%, 09/15/38(B) | | | 2,000 | | | | 1,913 | |
Mandan, Public Facilities Authority, Park Facilities, Ser A, RB | | | | | | | | |
Callable 09/01/24 @ 100 | | | | | | | | |
3.250%, 09/01/41 | | | 2,450 | | | | 2,365 | |
Ward County, Ser C, RB | | | | | | | | |
Callable 06/01/28 @ 100 | | | | | | | | |
5.000%, 06/01/48 | | | 2,500 | | | | 2,715 | |
Ward County, Ser C, RB | | | | | | | | |
Callable 06/01/28 @ 100 | | | | | | | | |
5.000%, 06/01/53 | | | 1,500 | | | | 1,619 | |
| | | | | | | | | |
Total North Dakota | | | 10,641 | |
| | | | | | | | | |
See accompanying notes to financial statements.
CITY NATIONAL ROCHDALE FUNDS | PAGE 29
schedule of investments |
March 31, 2019 (Unaudited) |
City National Rochdale Municipal High Income Fund(continued) |
Description | | Face Amount (000) | | | Value (000) | |
Ohio [5.6%] |
Buckeye, Tobacco Settlement Financing Authority, Ser A-2, RB | | | | | | | | |
Callable 04/15/19 @ 100 | | | | | | | | |
6.500%, 06/01/47 | | $ | 7,500 | | | $ | 7,517 | |
Buckeye, Tobacco Settlement Financing Authority, Ser A-2, RB | | | | | | | | |
Callable 04/15/19 @ 100 | | | | | | | | |
5.875%, 06/01/30 | | | 9,870 | | | | 9,645 | |
Buckeye, Tobacco Settlement Financing Authority, Ser A-2, RB | | | | | | | | |
Callable 04/15/19 @ 100 | | | | | | | | |
5.875%, 06/01/47 | | | 6,000 | | | | 5,851 | |
Buckeye, Tobacco Settlement Financing Authority, Ser A-2, RB | | | | | | | | |
Callable 04/15/19 @ 100 | | | | | | | | |
5.750%, 06/01/34 | | | 11,340 | | | | 10,943 | |
Buckeye, Tobacco Settlement Financing Authority, Ser A-2, RB | | | | | | | | |
Callable 04/15/19 @ 100 | | | | | | | | |
5.125%, 06/01/24 | | | 4,000 | | | | 3,815 | |
Butler County, Port Authority, Storypoint Fairfield Project, RB | | | | | | | | |
Callable 01/15/24 @ 104 | | | | | | | | |
6.375%, 01/15/43(B) | | | 500 | | | | 524 | |
Cuyahoga County, Hospital Revenue, Metrohealth System, RB | | | | | | | | |
Callable 02/15/27 @ 100 | | | | | | | | |
5.250%, 02/15/47 | | | 3,800 | | | | 4,165 | |
Cuyahoga County, Hospital Revenue, Metrohealth System, RB | | | | | | | | |
Callable 02/15/27 @ 100 | | | | | | | | |
5.000%, 02/15/52 | | | 5,000 | | | | 5,382 | |
Muskingum County, Hospital Facilities Authority, Genesis Healthcare Systems Project, RB | | | | | | | | |
Callable 02/15/23 @ 100 | | | | | | | | |
5.000%, 02/15/33 | | | 1,000 | | | | 1,056 | |
Muskingum County, Hospital Facilities Authority, Genesis Healthcare Systems Project, RB | | | | | | | | |
Callable 02/15/23 @ 100 | | | | | | | | |
5.000%, 02/15/44 | | | 1,000 | | | | 1,045 | |
Muskingum County, Hospital Facilities Authority, Genesis Healthcare Systems Project, RB | | | | | | | | |
Callable 02/15/23 @ 100 | | | | | | | | |
5.000%, 02/15/48 | | | 4,390 | | | | 4,573 | |
Ohio State, Air Quality Development Authority, Pratt Paper Project, RB, AMT | | | | | | | | |
Callable 01/15/28 @ 100 | | | | | | | | |
4.500%, 01/15/48(B) | | | 4,250 | | | | 4,428 | |
Ohio State, Air Quality Development Authority, Pratt Paper Project, RB, AMT | | | | | | | | |
Callable 01/15/28 @ 100 | | | | | | | | |
4.250%, 01/15/38(B) | | | 1,800 | | | | 1,857 | |
Ohio State, Housing Finance Agency, Sanctuary at Springboro Project, RB | | | | | | | | |
Callable 10/01/25 @ 101 | | | | | | | | |
5.450%, 01/01/38(B) | | | 2,500 | | | | 2,539 | |
Southeastern Ohio, Port Authority, Memorial Health System Project, RB | | | | | | | | |
Callable 12/01/22 @ 100 | | | | | | | | |
6.000%, 12/01/42 | | | 7,000 | | | | 7,442 | |
Toledo-Lucas County, Port Authority, Storypoint Waterville Project, RB | | | | | | | | |
Callable 01/15/24 @ 104 | | | | | | | | |
6.375%, 01/15/51(B) | | | 2,500 | | | | 2,592 | |
| | | | | | | | | |
Total Ohio | | | 73,374 | |
| | | | | | | | | |
Oklahoma [1.2%] |
Oklahoma County, Finance Authority, Epworth Village Project, Ser A, RB | | | | | | | | |
Callable 04/01/22 @ 100 | | | | | | | | |
5.125%, 04/01/42 | | | 4,000 | | | | 3,712 | |
Oklahoma State, Development Finance Authority, Inverness Village Community, RB | | | | | | | | |
Callable 01/01/22 @ 100 | | | | | | | | |
6.000%, 01/01/32(E) | | | 3,030 | | | | 1,969 | |
Oklahoma State, Development Finance Authority, RB | | | | | | | | |
Callable 08/01/27 @ 100 | | | | | | | | |
5.000%, 08/01/47 | | | 4,000 | | | | 3,700 | |
Oklahoma State, Development Finance Authority, Ser B, RB | | | | | | | | |
Callable 08/15/28 @ 100 | | | | | | | | |
5.500%, 08/15/57 | | | 3,000 | | | | 3,436 | |
See accompanying notes to financial statements.
CITY NATIONAL ROCHDALE FUNDS | PAGE 30
schedule of investments |
March 31, 2019 (Unaudited) |
City National Rochdale Municipal High Income Fund(continued) |
Description | | Face Amount (000) | | | Value (000) | |
Payne County, Economic Development Authority, Epworth Living at the Ranch, RB | | | | | | | | |
Callable 11/01/26 @ 100 | | | | | | | | |
6.875%, 11/01/46(E) | | $ | 5,775 | | | $ | 2,223 | |
Payne County, Economic Development Authority, Epworth Living at the Ranch, RB | | | | | | | | |
Callable 11/01/26 @ 100 | | | | | | | | |
6.625%, 11/01/36(E) | | | 2,500 | | | | 963 | |
| | | | | | | | | |
Total Oklahoma | | | 16,003 | |
| | | | | | | | | |
Pennsylvania [3.7%] |
Allentown, Neighborhood Improvement Zone Development Authority, City Center Project, RB | | | | | | | | |
Callable 05/01/28 @ 100 | | | | | | | | |
5.000%, 05/01/33(B) | | | 500 | | | | 555 | |
Allentown, Neighborhood Improvement Zone Development Authority, City Center Project, RB | | | | | | | | |
Callable 05/01/28 @ 100 | | | | | | | | |
5.000%, 05/01/42(B) | | | 2,000 | | | | 2,166 | |
Allentown, Neighborhood Improvement Zone Development Authority, RB | | | | | | | | |
Callable 05/01/28 @ 100 | | | | | | | | |
5.375%, 05/01/42(B) | | | 3,000 | | | | 3,162 | |
Allentown, Neighborhood Improvement Zone Development Authority, RB | | | | | | | | |
Callable 05/01/28 @ 100 | | | | | | | | |
5.125%, 05/01/32(B) | | | 1,000 | | | | 1,051 | |
Berks County, Industrial Development Authority, RB | | | | | | | | |
Callable 11/01/27 @ 100 | | | | | | | | |
4.000%, 11/01/47 | | | 8,345 | | | | 8,585 | |
Chester County, Industrial Development Authority, Woodlands at Graystone Project, RB | | | | | | | | |
Callable 03/01/28 @ 100 | | | | | | | | |
5.125%, 03/01/48(B) | | | 1,000 | | | | 1,031 | |
Chester County, Industrial Development Authority, Woodlands at Graystone Project, RB | | | | | | | | |
Callable 03/01/28 @ 100 | | | | | | | | |
5.000%, 03/01/38(B) | | | 525 | | | | 542 | |
Dauphin County, General Authority, Harrisburg University of Science and Technology Project, RB | | | | | | | | |
Callable 10/15/27 @ 100 | | | | | | | | |
5.125%, 10/15/41(B) | | | 4,185 | | | | 4,324 | |
Dauphin County, General Authority, RB | | | | | | | | |
Callable 10/15/27 @ 100 | | | | | | | | |
5.000%, 10/15/34(B) | | | 2,320 | | | | 2,425 | |
Delaware County, Industrial Development Authority, Covanta Project, RB | | | | | | | | |
Callable 07/01/20 @ 100 | | | | | | | | |
5.000%, 07/01/43 | | | 2,500 | | | | 2,528 | |
DuBois, Hospital Authority, RB | | | | | | | | |
Callable 01/15/28 @ 100 | | | | | | | | |
4.000%, 07/15/43 | | | 2,370 | | | | 2,440 | |
Montgomery County, Higher Education & Health Authority, Philadelphia Presbyterian Hospital, RB | | | | | | | | |
Callable 12/01/24 @ 103 | | | | | | | | |
4.000%, 12/01/48 | | | 860 | | | | 848 | |
Pennsylvania State, Economic Development Financing Authority, PPL Energy Supply, Ser A-RE, RB | | | | | | | | |
Callable 09/01/25 @ 100 | | | | | | | | |
6.400%, 12/01/38 | | | 3,000 | | | | 3,064 | |
Pennsylvania State, Turnpike Commission, Convertible Capital Appreciation Project, Sub-Ser E, RB | | | | | | | | |
Callable 12/01/27 @ 100 | | | | | | | | |
6.375%, 12/01/38 | | | 2,000 | | | | 2,531 | |
Pennsylvania State, Turnpike Commission, Ser A, RB | | | | | | | | |
Callable 12/01/24 @ 100 | | | | | | | | |
5.000%, 12/01/33 | | | 1,500 | | | | 1,695 | |
Philadelphia, Authority for Industrial Development, Mariana Bracetti Academy, RB | | | | | | | | |
Callable 12/15/21 @ 100 | | | | | | | | |
7.625%, 12/15/41 | | | 1,000 | | | | 1,096 | |
Philadelphia, Authority for Industrial Development, Mariana Bracetti Academy, RB | | | | | | | | |
Callable 12/15/21 @ 100 | | | | | | | | |
7.150%, 12/15/36 | | | 2,280 | | | | 2,478 | |
See accompanying notes to financial statements.
CITY NATIONAL ROCHDALE FUNDS | PAGE 31
schedule of investments |
March 31, 2019 (Unaudited) |
City National Rochdale Municipal High Income Fund(continued) |
Description | | Face Amount (000) | | | Value (000) | |
Philadelphia, Hospitals & Higher Education Facilities Authority, Temple University Health Systems Project, Ser A, RB | | | | | | | | |
Callable 07/01/22 @ 100 | | | | | | | | |
5.625%, 07/01/42 | | $ | 3,000 | | | $ | 3,214 | |
Pottsville, Hospital Authority, Schuykill Health System Project, RB | | | | | | | | |
Pre-Refunded @ 100 | | | | | | | | |
6.500%, 07/01/24(B) (C) | | | 3,000 | | | | 3,722 | |
Washington County, Redevelopment Authority, TA | | | | | | | | |
Callable 01/01/28 @ 100 | | | | | | | | |
5.000%, 07/01/35 | | | 1,235 | | | | 1,271 | |
| | | | | | | | | |
Total Pennsylvania | | | 48,728 | |
| | | | | | | | | |
Rhode Island [0.3%] |
Rhode Island State, Health & Educational Building, RB | | | | | | | | |
Callable 05/15/26 @ 100 | | | | | | | | |
5.000%, 05/15/39 | | | 1,000 | | | | 1,106 | |
Tobacco Settlement Financing, Ser B, RB | | | | | | | | |
Callable 04/15/19 @ 14 | | | | | | | | |
9.484%, 06/01/52(D) | | | 26,270 | | | | 2,508 | |
| | | | | | | | | |
Total Rhode Island | | | 3,614 | |
| | | | | | | | | |
South Carolina [1.1%] |
South Carolina State, Jobs-Economic Development Authority, The Woodlands at Furman, RB | | | | | | | | |
Callable 11/15/24 @ 103 | | | | | | | | |
5.250%, 11/15/47 | | | 8,375 | | | | 9,011 | |
South Carolina State, Jobs-Economic Development Authority, The Woodlands at Furman, RB | | | | | | | | |
Callable 11/15/24 @ 103 | | | | | | | | |
5.250%, 11/15/52 | | | 5,405 | | | | 5,796 | |
| | | | | | | | | |
Total South Carolina | | | 14,807 | |
| | | | | | | | | |
Tennessee [0.7%] |
Chattanooga, Health Educational & Housing Facility Board, RB | | | | | | | | |
Callable 10/01/25 @ 100 | | | | | | | | |
5.000%, 10/01/35 | | | 1,000 | | | | 1,090 | |
Johnson City, Health & Educational Facilities Board, Mountain States Health Alliance Project, RB | | | | | | | | |
Pre-Refunded @ 100 | | | | | | | | |
6.000%, 07/01/20(C) | | | 2,000 | | | | 2,109 | |
Nashville Metropolitan Development & Housing Agency, RB | | | | | | | | |
Callable 06/01/28 @ 100 | | | | | | | | |
5.125%, 06/01/36(B) | | | 900 | | | | 963 | |
Nashville Metropolitan Development & Housing Agency, RB | | | | | | | | |
4.500%, 06/01/28(B) | | | 650 | | | | 691 | |
Shelby County, Health Educational & Housing Facilities Board, Trezevant Manor Project, Ser A, RB | | | | | | | | |
Callable 09/01/23 @ 100 | | | | | | | | |
5.500%, 09/01/47 | | | 1,000 | | | | 990 | |
Shelby County, Health Educational & Housing Facilities Board, Trezevant Manor Project, Ser A, RB | | | | | | | | |
Callable 09/01/26 @ 100 | | | | | | | | |
5.000%, 09/01/31(B) | | | 2,750 | | | | 2,720 | |
Shelby County, Health Educational & Housing Facilities Board, Trezevant Manor Project, Ser A, RB | | | | | | | | |
Callable 09/01/26 @ 100 | | | | | | | | |
5.000%, 09/01/37(B) | | | 1,145 | | | | 1,089 | |
| | | | | | | | | |
Total Tennessee | | | 9,652 | |
| | | | | | | | | |
Texas [9.7%] |
Arlington, Higher Education Finance, Universal Academy Project, Ser A, RB | | | | | | | | |
Callable 03/01/24 @ 100 | | | | | | | | |
7.125%, 03/01/44 | | | 2,300 | | | | 2,372 | |
Arlington, Higher Education Finance, Universal Academy Project, Ser A, RB | | | | | | | | |
Callable 03/01/24 @ 100 | | | | | | | | |
7.000%, 03/01/34 | | | 400 | | | | 414 | |
Bexar County, Health Facilities Development, Army Retirement Residence Project, RB | | | | | | | | |
Pre-Refunded @ 100 | | | | | | | | |
6.200%, 07/01/20(C) | | | 3,250 | | | | 3,431 | |
See accompanying notes to financial statements.
CITY NATIONAL ROCHDALE FUNDS | PAGE 32
schedule of investments |
March 31, 2019 (Unaudited) |
City National Rochdale Municipal High Income Fund(continued) |
Description | | Face Amount (000) | | | Value (000) | |
Celina, Cambridge Crossing Public Improvement Project, SAB | | | | | | | | |
Callable 09/01/28 @ 100 | | | | | | | | |
5.250%, 09/01/47(B) | | $ | 500 | | | $ | 504 | |
Celina, Cambridge Crossing Public Improvement Project, SAB | | | | | | | | |
Callable 09/01/28 @ 100 | | | | | | | | |
5.125%, 09/01/38(B) | | | 1,500 | | | | 1,516 | |
Celina, Lakes at Mustang Ranch Public Improvement District Phase 1 Project, SAB | | | | | | | | |
Callable 09/01/20 @ 103 | | | | | | | | |
5.875%, 09/01/40 | | | 600 | | | | 611 | |
Celina, Lakes at Mustang Ranch Public Improvement District Phase 1 Project, SAB | | | | | | | | |
Callable 09/01/20 @ 103 | | | | | | | | |
5.500%, 09/01/32 | | | 250 | | | | 255 | |
Celina, Lakes at Mustang Ranch Public Improvement District Phase 1 Project, SAB | | | | | | | | |
Callable 09/01/20 @ 103 | | | | | | | | |
5.375%, 09/01/28 | | | 375 | | | | 383 | |
Celina, Sutton Fields II Public Improvement Project, SAB | | | | | | | | |
Callable 03/01/23 @ 103 | | | | | | | | |
7.250%, 09/01/45 | | | 500 | | | | 504 | |
Central Texas, Regional Mobility Authority, RB | | | | | | | | |
Callable 01/01/23 @ 100 | | | | | | | | |
5.000%, 01/01/33 | | | 1,000 | | | | 1,087 | |
Central Texas, Regional Mobility Authority, RB | | | | | | | | |
Callable 01/01/23 @ 100 | | | | | | | | |
5.000%, 01/01/42 | | | 1,000 | | | | 1,074 | |
Clifton, Higher Education Finance, Ser D, RB | | | | | | | | |
Callable 08/15/25 @ 100 | | | | | | | | |
6.125%, 08/15/48 | | | 4,245 | | | | 4,500 | |
Grand Parkway, Transportation, Toll Revenue, Sub-Ser B, RB | | | | | | | | |
Callable 10/01/23 @ 100 | | | | | | | | |
5.000%, 04/01/53 | | | 2,000 | | | | 2,165 | |
Hackberry, Public Improvement District No. 3, SAB | | | | | | | | |
Pre-Refunded @ 100 | | | | | | | | |
7.000%, 09/01/19(C) | | | 475 | | | | 500 | |
Hackberry, Public Improvement District No. 3, SAB | | | | | | | | |
Pre-Refunded @ 100 | | | | | | | | |
6.750%, 09/01/19(C) | | | 500 | | | | 525 | |
Hackberry, Public Improvement District No. 3, SAB | | | | | | | | |
Pre-Refunded @ 100 | | | | | | | | |
6.750%, 09/01/19(C) | | | 525 | | | | 552 | |
Hackberry, Public Improvement District No. 3, SAB | | | | | | | | |
Pre-Refunded @ 100 | | | | | | | | |
6.625%, 09/01/19(C) | | | 450 | | | | 473 | |
Houston, Airport System Revenue, United Airlines Project, RB, AMT | | | | | | | | |
5.000%, 07/15/28 | | | 3,000 | | | | 3,495 | |
Houston, Airport System Revenue, United Airlines Project, RB, AMT | | | | | | | | |
Callable 07/01/24 @ 100 | | | | | | | | |
5.000%, 07/01/29 | | | 3,000 | | | | 3,314 | |
Houston, Higher Education Finance, Cosmos Foundation Project, Ser A, RB | | | | | | | | |
Pre-Refunded @ 100 | | | | | | | | |
6.875%, 05/15/21(C) | | | 5,300 | | | | 5,863 | |
Leander, Oak Creek Public Improvement District, SAB | | | | | | | | |
Callable 09/01/19 @ 103 | | | | | | | | |
5.875%, 09/01/44 | | | 475 | | | | 476 | |
Leander, Oak Creek Public Improvement District, SAB | | | | | | | | |
Callable 09/01/19 @ 103 | | | | | | | | |
5.750%, 09/01/38 | | | 500 | | | | 501 | |
McLendon-Chisholm, Sonoma Public Improvement District Project, SAB | | | | | | | | |
Callable 09/15/20 @ 103 | | | | | | | | |
5.500%, 09/15/40 | | | 375 | | | | 377 | |
McLendon-Chisholm, Sonoma Public Improvement District Project, SAB | | | | | | | | |
Callable 09/15/20 @ 103 | | | | | | | | |
5.375%, 09/15/35 | | | 400 | | | | 403 | |
McLendon-Chisholm, Sonoma Public Improvement District Project, SAB | | | | | | | | |
Callable 09/15/20 @ 103 | | | | | | | | |
5.125%, 09/15/28 | | | 500 | | | | 504 | |
Mission, Economic Development, RB, AMT | | | | | | | | |
Callable 10/01/21 @ 105 | | | | | | | | |
4.625%, 10/01/31(B) | | | 3,250 | | | | 3,376 | |
See accompanying notes to financial statements.
CITY NATIONAL ROCHDALE FUNDS | PAGE 33
schedule of investments |
March 31, 2019 (Unaudited) |
City National Rochdale Municipal High Income Fund(continued) |
Description | | Face Amount (000) | | | Value (000) | |
New Hope, Cultural Education Facilities Finance, Carillon LifeCare Community Project, RB | | | | | | | | |
Callable 07/01/24 @ 102 | | | | | | | | |
5.000%, 07/01/36 | | $ | 1,250 | | | $ | 1,253 | |
New Hope, Cultural Education Facilities Finance, Carillon LifeCare Community Project, RB | | | | | | | | |
Callable 07/01/24 @ 102 | | | | | | | | |
5.000%, 07/01/46 | | | 3,410 | | | | 3,292 | |
New Hope, Cultural Education Facilities Finance, E Grand Preparatory Academy, RB | | | | | | | | |
Callable 08/15/21 @ 100 | | | | | | | | |
5.500%, 08/15/46 | | | 1,000 | | | | 1,021 | |
New Hope, Cultural Education Facilities Finance, E Grand Preparatory Academy, RB | | | | | | | | |
Callable 08/15/21 @ 100 | | | | | | | | |
5.500%, 08/15/51 | | | 2,500 | | | | 2,549 | |
New Hope, Cultural Education Facilities Finance, Jubilee Academic Center Project, Ser A, RB | | | | | | | | |
Callable 08/15/21 @ 100 | | | | | | | | |
5.000%, 08/15/36(B) | | | 4,000 | | | | 4,040 | |
New Hope, Cultural Education Facilities Finance, MRC Senior Living - Langford Project, RB | | | | | | | | |
Callable 11/15/26 @ 100 | | | | | | | | |
5.500%, 11/15/46 | | | 1,000 | | | | 1,016 | |
New Hope, Cultural Education Facilities Finance, MRC Senior Living - Langford Project, RB | | | | | | | | |
Callable 11/15/26 @ 100 | | | | | | | | |
5.500%, 11/15/52 | | | 1,200 | | | | 1,215 | |
New Hope, Cultural Education Facilities Finance, MRC Senior Living - Langford Project, RB | | | | | | | | |
Callable 11/15/26 @ 100 | | | | | | | | |
5.375%, 11/15/36 | | | 500 | | | | 507 | |
New Hope, Cultural Education Facilities Finance, MRC Senior Living - Langford Project, RB | | | | | | | | |
5.000%, 11/15/26 | | | 400 | | | | 407 | |
New Hope, Cultural Education Facilities Finance, RB | | | | | | | | |
5.000%, 08/15/46 | | | 4,500 | | | | 4,520 | |
Newark, Higher Education Finance, Ser A, RB | | | | | | | | |
Callable 08/15/25 @ 100 | | | | | | | | |
5.750%, 08/15/45(B) | | | 1,700 | | | | 1,810 | |
Newark, Higher Education Finance, Ser A, RB | | | | | | | | |
Callable 08/15/25 @ 100 | | | | | | | | |
5.500%, 08/15/35(B) | | | 900 | | | | 955 | |
North Texas, Tollway Authority, Convertible Capital Appreciation Project, Ser C, RB | | | | | | | | |
Pre-Refunded @ 100 | | | | | | | | |
0.545%, 09/01/31(C) | | | 5,000 | | | | 5,852 | |
Sanger, Industrial Development Authority, Texas Pellets Project, Ser B, RB, AMT | | | | | | | | |
Callable 07/01/22 @ 100 | | | | | | | | |
8.000%, 07/01/38(E) | | | 4,950 | | | | 1,584 | |
Tarrant County, Cultural Education Facilities Finance, Buckingham Senior Living Community Project, RB | | | | | | | | |
Callable 11/15/25 @ 100 | | | | | | | | |
5.500%, 11/15/45 | | | 5,315 | | | | 4,199 | |
Tarrant County, Cultural Education Facilities Finance, Buckingham Senior Living Community Project, RB | | | | | | | | |
Callable 04/29/19 @ 100 | | | | | | | | |
4.500%, 11/15/21 | | | 2,840 | | | | 2,244 | |
Tarrant County, Cultural Education Facilities Finance, Buckingham Senior Living Community Project, Ser Senior, RB | | | | | | | | |
Callable 04/29/19 @ 100 | | | | | | | | |
5.750%, 11/15/37 | | | 6,000 | | | | 4,740 | |
Tarrant County, Cultural Education Facilities Finance, Buckner Senior Living Ventana Project, Ser Senior, RB | | | | | | | | |
Callable 05/15/27 @ 100 | | | | | | | | |
6.750%, 11/15/47 | | | 2,000 | | | | 2,248 | |
Tarrant County, Cultural Education Facilities Finance, Buckner Senior Living Ventana Project, Ser Senior, RB | | | | | | | | |
Callable 05/15/27 @ 100 | | | | | | | | |
6.750%, 11/15/52 | | | 2,200 | | | | 2,465 | |
See accompanying notes to financial statements.
CITY NATIONAL ROCHDALE FUNDS | PAGE 34
schedule of investments |
March 31, 2019 (Unaudited) |
City National Rochdale Municipal High Income Fund(continued) |
Description | | Face Amount (000) | | | Value (000) | |
Tarrant County, Cultural Education Facilities Finance, Buckner Senior Living Ventana Project, Ser Senior, RB | | | | | | | | |
Callable 05/15/27 @ 100 | | | | | | | | |
6.625%, 11/15/37 | | $ | 3,500 | | | $ | 3,968 | |
Tarrant County, Cultural Education Facilities Finance, C.C. Young Memorial Home Project, RB | | | | | | | | |
Callable 02/15/27 @ 100 | | | | | | | | |
6.375%, 02/15/48 | | | 9,000 | | | | 9,784 | |
Tarrant County, Cultural Education Facilities Finance, Edgemere Project, Ser A-REF, RB | | | | | | | | |
Callable 11/15/25 @ 100 | | | | | | | | |
5.000%, 11/15/45 | | | 5,000 | | | | 4,542 | |
Tarrant County, Cultural Education Facilities Finance, Northwest Senior Housing Edgemere Project, RB | | | | | | | | |
Callable 05/15/27 @ 100 | | | | | | | | |
5.250%, 11/15/47 | | | 6,720 | | | | 6,259 | |
Tarrant County, Cultural Education Facilities Finance, Trinity Basin Preparatory Project, Ser A, RB | | | | | | | | |
Pre-Refunded @ 100 | | | | | | | | |
7.300%, 06/01/19(C) | | | 555 | | | | 560 | |
Temple, Ser A-REV, RB | | | | | | | | |
Callable 08/01/25 @ 100 | | | | | | | | |
5.000%, 08/01/38(B) | | | 2,000 | | | | 2,134 | |
Tender Option Bond Trust Receipts, Ser 2019-XM0722, GO | | | | | | | | |
Callable 06/15/27 @ 100 | | | | | | | | |
11.050%, 06/15/42(A) (B) | | | 3,330 | | | | 4,978 | |
Texas State, Private Activity Bond Surface Transportation, LBJ Infrastructure Project, Ser Senior, RB | | | | | | | | |
Callable 06/30/20 @ 100 | | | | | | | | |
7.000%, 06/30/40 | | | 1,000 | | | | 1,061 | |
Texas State, Private Activity Bond Surface Transportation, NTE Mobility Project, Ser Senior, RB | | | | | | | | |
Callable 12/31/19 @ 100 | | | | | | | | |
6.875%, 12/31/39 | | | 5,350 | | | | 5,541 | |
Texas State, Private Activity Bond Surface Transportation, SH 288 Toll Lanes Project, RB, AMT | | | | | | | | |
Callable 12/31/25 @ 100 | | | | | | | | |
5.000%, 12/31/40 | | | 1,745 | | | | 1,907 | |
Texas State, Private Activity Bond Surface Transportation, SH 288 Toll Lanes Project, RB, AMT | | | | | | | | |
Callable 12/31/25 @ 100 | | | | | | | | |
5.000%, 12/31/45 | | | 1,000 | | | | 1,087 | |
Texas State, Transportation Commission, RB | | | | | | | | |
Callable 02/01/29 @ 73 | | | | | | | | |
4.449%, 08/01/36(D) | | | 1,000 | | | | 492 | |
| | | | | | | | | |
Total Texas | | | 127,405 | |
| | | | | | | | | |
Vermont [0.1%] |
Vermont State, Economic Development Authority, Casella Waste Systems Project, RB, AMT | | | | | | | | |
4.625%, 04/01/36(A) (B) | | | 1,000 | | | | 1,021 | |
| | | | | | | | | |
Virgin Islands [0.4%] |
Virgin Islands, Public Finance Authority, RB | | | | | | | | |
Callable 10/01/19 @ 100 | | | | | | | | |
5.000%, 10/01/22 | | | 2,000 | | | | 1,915 | |
Virgin Islands, Public Finance Authority, Ser Senior, RB | | | | | | | | |
Callable 10/01/20 @ 100 | | | | | | | | |
5.000%, 10/01/25 | | | 3,155 | | | | 3,052 | |
| | | | | | | | | |
Total Virgin Islands | | | 4,967 | |
| | | | | | | | | |
Virginia [1.3%] |
Cherry Hill, Community Development Authority, Potomac Shores Project, SAB | | | | | | | | |
Callable 03/01/25 @ 100 | | | | | | | | |
5.400%, 03/01/45(B) | | | 2,000 | | | | 2,067 | |
Cherry Hill, Community Development Authority, Potomac Shores Project, SAB | | | | | | | | |
Callable 03/01/25 @ 100 | | | | | | | | |
5.150%, 03/01/35(B) | | | 1,000 | | | | 1,033 | |
Farmville, Industrial Development Authority, RB | | | | | | | | |
Callable 01/01/29 @ 100 | | | | | | | | |
5.000%, 01/01/48 | | | 2,000 | | | | 2,163 | |
See accompanying notes to financial statements.
CITY NATIONAL ROCHDALE FUNDS | PAGE 35
schedule of investments |
March 31, 2019 (Unaudited) |
City National Rochdale Municipal High Income Fund(continued) |
Description | | Face Amount (000) | | | Value (000) | |
Lower Magnolia Green, Community Development Authority, SAB | | | | | | | | |
Callable 03/01/25 @ 100 | | | | | | | | |
5.000%, 03/01/45(B) | | $ | 4,020 | | | $ | 4,069 | |
Peninsula Town Center, Community Development Authority, RB | | | | | | | | |
Callable 09/01/27 @ 100 | | | | | | | | |
5.000%, 09/01/37(B) | | | 2,750 | | | | 2,925 | |
Peninsula Town Center, Community Development Authority, RB | | | | | | | | |
Callable 09/01/27 @ 100 | | | | | | | | |
5.000%, 09/01/45(B) | | | 3,700 | | | | 3,903 | |
Virginia State, Small Business Financing Authority, Elizabeth River Project, RB, AMT | | | | | | | | |
Callable 07/01/22 @ 100 | | | | | | | | |
6.000%, 01/01/37 | | | 820 | | | | 900 | |
| | | | | | | | | |
Total Virginia | | | 17,060 | |
| | | | | | | | | |
Washington [0.9%] |
Kalispel Tribe of Indians, Ser A, RB | | | | | | | | |
Callable 01/01/28 @ 100 | | | | | | | | |
5.250%, 01/01/38(B) | | | 400 | | | | 434 | |
Washington State, Health Care Facilities Authority, RB | | | | | | | | |
Callable 01/01/28 @ 100 | | | | | | | | |
4.000%, 07/01/42 | | | 3,500 | | | | 3,667 | |
Washington State, Housing Finance Commission, Judson Park Project, RB | | | | | | | | |
Callable 07/01/25 @ 102 | | | | | | | | |
5.000%, 07/01/38(B) | | | 325 | | | | 342 | |
Washington State, Housing Finance Commission, Judson Park Project, RB | | | | | | | | |
Callable 07/01/25 @ 102 | | | | | | | | |
5.000%, 07/01/48(B) | | | 750 | | | | 781 | |
Washington State, Housing Finance Commission, Presbyterian Retirement Communities Northwest Projects, RB | | | | | | | | |
Callable 01/01/25 @ 102 | | | | | | | | |
5.000%, 01/01/46(B) | | | 4,330 | | | | 4,616 | |
Washington State, Housing Finance Commission, Rockwood Retirement Community Project, RB | | | | | | | | |
Callable 01/01/24 @ 100 | | | | | | | | |
7.500%, 01/01/49(B) | | | 2,000 | | | | 2,282 | |
| | | | | | | | | |
Total Washington | | | 12,122 | |
| | | | | | | | | |
West Virginia [0.1%] |
West Virginia State, Economic Development Authority, Morgantown Energy, RB, AMT | | | | | | | | |
2.875%, 12/15/26 | | | 1,560 | | | | 1,531 | |
| | | | | | | | | |
Wisconsin [5.4%] |
Hartford, Public Finance Authority, RB | | | | | | | | |
Callable 09/01/24 @ 100 | | | | | | | | |
5.000%, 09/01/38(B) | | | 1,580 | | | | 1,641 | |
Pine Lake, Public Finance Authority, RB | | | | | | | | |
Callable 03/01/25 @ 100 | | | | | | | | |
5.500%, 03/01/45(B) | | | 3,460 | | | | 3,636 | |
Pine Lake, Public Finance Authority, RB | | | | | | | | |
Callable 03/01/25 @ 100 | | | | | | | | |
5.250%, 03/01/35(B) | | | 1,250 | | | | 1,317 | |
Public Finance Authority, RB | | | | | | | | |
Callable 01/01/28 @ 100 | | | | | | | | |
6.375%, 01/01/48(B) | | | 1,000 | | | | 1,054 | |
Public Finance Authority, RB | | | | | | | | |
Callable 01/01/28 @ 100 | | | | | | | | |
6.250%, 01/01/38(B) | | | 1,000 | | | | 1,061 | |
Public Finance Authority, RB | | | | | | | | |
Callable 01/01/28 @ 100 | | | | | | | | |
6.125%, 01/01/33(B) | | | 1,525 | | | | 1,636 | |
Public Finance Authority, RB | | | | | | | | |
Callable 06/15/29 @ 100 | | | | | | | | |
5.000%, 06/15/49 | | | 500 | | | | 549 | |
Wisconsin State, Health & Educational Facilities Authority, Dickson Hollow Project, RB | | | | | | | | |
Callable 10/01/22 @ 102 | | | | | | | | |
5.500%, 10/01/49 | | | 2,500 | | | | 2,678 | |
Wisconsin State, Health & Educational Facilities Authority, RB | | | | | | | | |
Callable 04/01/27 @ 100 | | | | | | | | |
4.000%, 04/01/39 | | | 2,500 | | | | 2,588 | |
See accompanying notes to financial statements.
CITY NATIONAL ROCHDALE FUNDS | PAGE 36
schedule of investments |
March 31, 2019 (Unaudited) |
City National Rochdale Municipal High Income Fund(continued) |
Description | | Face Amount (000) | | | Value (000) | |
Wisconsin State, Health & Educational Facilities Authority, Woodland Hill Senior Housing Project, RB | | | | | | | | |
Callable 12/01/22 @ 102 | | | | | | | | |
5.250%, 12/01/49 | | $ | 5,000 | | | $ | 5,264 | |
Wisconsin State, Public Finance Authority, Bancroft Neurohealth Project, RB | | | | | | | | |
Callable 06/01/26 @ 100 | | | | | | | | |
5.125%, 06/01/48(B) | | | 4,000 | | | | 4,071 | |
Wisconsin State, Public Finance Authority, Bancroft Neurohealth Project, RB | | | | | | | | |
Callable 06/01/26 @ 100 | | | | | | | | |
5.000%, 06/01/36(B) | | | 1,500 | | | | 1,529 | |
Wisconsin State, Public Finance Authority, Bancroft Neurohealth Project, RB | | | | | | | | |
Callable 06/01/26 @ 100 | | | | | | | | |
4.625%, 06/01/36(B) | | | 3,100 | | | | 3,040 | |
Wisconsin State, Public Finance Authority, Coral Academy Project, RB | | | | | | | | |
Callable 07/01/24 @ 100 | | | | | | | | |
5.625%, 07/01/44 | | | 3,500 | | | | 3,811 | |
Wisconsin State, Public Finance Authority, Coral Academy Project, RB | | | | | | | | |
Callable 07/01/24 @ 100 | | | | | | | | |
5.375%, 07/01/34 | | | 2,000 | | | | 2,179 | |
Wisconsin State, Public Finance Authority, Cornerstone Christian Project, RB | | | | | | | | |
Callable 02/01/26 @ 100 | | | | | | | | |
5.000%, 02/01/36(B) | | | 3,000 | | | | 3,048 | |
Wisconsin State, Public Finance Authority, Denver International Airport, RB, AMT | | | | | | | | |
Callable 09/30/27 @ 100 | | | | | | | | |
5.000%, 09/30/49 | | | 2,000 | | | | 2,215 | |
Wisconsin State, Public Finance Authority, Las Ventanas Retirement Community Project, RB | | | | | | | | |
Callable 10/01/20 @ 102 | | | | | | | | |
7.000%, 10/01/42 | | | 5,400 | | | | 5,296 | |
Wisconsin State, Public Finance Authority, National Gypsum, RB, AMT | | | | | | | | |
Callable 08/01/26 @ 100 | | | | | | | | |
4.000%, 08/01/35 | | | 3,000 | | | | 3,036 | |
Wisconsin State, Public Finance Authority, Roseman University Health Sciences, RB | | | | | | | | |
Callable 04/01/25 @ 100 | | | | | | | | |
5.875%, 04/01/45 | | | 6,000 | | | | 6,568 | |
Wisconsin State, Public Finance Authority, Senior Trips Obligation Group Project, Ser B, RB, AMT | | | | | | | | |
Callable 07/01/22 @ 100 | | | | | | | | |
5.000%, 07/01/42 | | | 1,000 | | | | 1,059 | |
Wisconsin State, Public Finance Authority, Ser A, RB | | | | | | | | |
Callable 06/15/25 @ 100 | | | | | | | | |
5.500%, 06/15/35(B) | | | 3,000 | | | | 3,073 | |
Wisconsin State, Public Finance Authority, Ser A, RB | | | | | | | | |
Callable 06/15/25 @ 100 | | | | | | | | |
5.500%, 06/15/45(B) | | | 4,280 | | | | 4,333 | |
Wisconsin State, Public Finance Authority, Ser C, RB, AMT | | | | | | | | |
5.000%, 07/01/22 | | | 1,160 | | | | 1,229 | |
Wisconsin State, Public Finance Authority, Ser E, RB, AMT | | | | | | | | |
Callable 07/01/22 @ 100 | | | | | | | | |
5.000%, 07/01/23 | | | 4,655 | | | | 4,947 | |
| | | | | | | | | |
Total Wisconsin | | | 70,858 | |
| | | | | | | | | |
Puerto Rico [1.6%] |
Puerto Rico Commonwealth, Aqueduct & Sewer Authority, Ser A, RB | | | | | | | | |
Callable 07/01/22 @ 100 | | | | | | | | |
5.250%, 07/01/42 | | | 9,000 | | | | 8,842 | |
Puerto Rico, Sales Tax Financing Sales Tax Revenue, Ser A-1, RB | | | | | | | | |
Callable 07/01/28 @ 41 | | | | | | | | |
6.709%, 07/01/46(D) | | | 5,501 | | | | 1,183 | |
Puerto Rico, Sales Tax Financing Sales Tax Revenue, Ser A-1, RB | | | | | | | | |
Callable 07/01/28 @ 100 | | | | | | | | |
5.000%, 07/01/58 | | | 5,167 | | | | 5,105 | |
Puerto Rico, Sales Tax Financing Sales Tax Revenue, Ser A-1, RB | | | | | | | | |
Callable 07/01/28 @ 100 | | | | | | | | |
4.750%, 07/01/53 | | | 2,856 | | | | 2,708 | |
See accompanying notes to financial statements.
CITY NATIONAL ROCHDALE FUNDS | PAGE 37
schedule of investments |
March 31, 2019 (Unaudited) |
City National Rochdale Municipal High Income Fund(continued) |
Description | | Face Amount (000) | | | Value (000) | |
Puerto Rico, Sales Tax Financing Sales Tax Revenue, Ser A-1, RB | | | | | | | | |
Callable 07/01/28 @ 100 | | | | | | | | |
4.550%, 07/01/40 | | $ | 2,113 | | | $ | 2,079 | |
Puerto Rico, Sales Tax Financing Sales Tax Revenue, Ser A-1, RB | | | | | | | | |
Callable 07/01/25 @ 100 | | | | | | | | |
4.500%, 07/01/34 | | | 228 | | | | 231 | |
Puerto Rico, Sales Tax Financing Sales Tax Revenue, Ser A-2, RB | | | | | | | | |
Callable 07/01/28 @ 100 | | | | | | | | |
5.000%, 07/01/58 | | | 474 | | | | 415 | |
Puerto Rico, Sales Tax Financing Sales Tax Revenue, Ser A-2, RB | | | | | | | | |
Callable 07/01/28 @ 100 | | | | | | | | |
4.750%, 07/01/53 | | | 31 | | | | 27 | |
Puerto Rico, Sales Tax Financing Sales Tax Revenue, Ser A-2, RB | | | | | | | | |
Callable 07/01/28 @ 100 | | | | | | | | |
4.550%, 07/01/40 | | | 1,186 | | | | 1,047 | |
| | | | | | | | | |
Total Puerto Rico | | | 21,637 | |
| | | | | | | | | |
Guam [0.8%] |
Territory of Guam, Government Waterworks Authority, RB | | | | | | | | |
Pre-Refunded @ 100 | | | | | | | | |
5.625%, 07/01/20(C) | | | 2,000 | | | | 2,101 | |
Territory of Guam, Ser A, GO | | | | | | | | |
Pre-Refunded @ 100 | | | | | | | | |
7.000%, 11/15/19(C) | | | 5,000 | | | | 5,169 | |
Territory of Guam, Ser A, RB | | | | | | | | |
Callable 12/01/26 @ 100 | | | | | | | | |
5.000%, 12/01/34 | | | 2,500 | | | | 2,733 | |
| | | | | | | | | |
Total Guam | | | 10,003 | |
| | | | | | | | | |
American Samoa [0.2%] |
American Samoa, Economic Development Authority, Ser A, RB | | | | | | | | |
Callable 09/01/25 @ 100 | | | | | | | | |
6.625%, 09/01/35 | | | 3,000 | | | | 3,051 | |
| | | | | | | | | |
Total Municipal Bonds |
(Cost $1,198,359) | | | 1,222,591 | |
| | | | | | | | | |
Description | | Shares/Face Amount (000) | | | Value (000) | |
Short-Term Investment** [2.9%] |
SEI Daily Income Trust Government Fund, Cl F, 2.196% | | | 38,389,524 | | | $ | 38,390 | |
| | | | | | | | | |
Total Short-Term Investment |
(Cost $38,390) | | | 38,390 | |
| | | | | | | | | |
Repurchase Agreement [3.1%] |
Barclays (B) | | | | | | | | |
2.400%, dated 3/29/19, repurchased on 4/1/19, repurchase price $40,045,100 (collateralized by various U.S. Government obligations, par value $40,045,100, 2.875%, 8/15/45; with a total market value of $40,800,016) | | $ | 40,000 | | | | 40,000 | |
| | | | | | | | | |
Total Repurchase Agreement |
(Cost $40,000) | | | 40,000 | |
| | | | | | | | | |
Total Investments [99.2%] |
(Cost $1,276,749) | | $ | 1,300,981 | |
| | | | | | | | | |
Percentages are based on net assets of $1,312,026 (000).
** | The rate reported is the 7-day effective yield as of March 31, 2019. |
(A) | Variable or floating rate security, the interest rate of which adjusts periodically based on prevailing interest rates. |
(B) | Step Bonds – Represents the current rate, the step rate, the step date and the final maturity date. |
(C) | Security exempt from registration under Rule 144A of the Securities Act of 1933. These securities may be resold in transactions exempt from registration normally to qualified institutions. On March 31, 2019, the value of these securities amounted to $234,573 (000), representing 17.9% of the net assets of the Fund. |
(D) | Pre-Refunded Security — The maturity date shown is the pre-refunded date. |
(E) | Zero coupon security. The rate reported is the effective yield at time of purchase. |
(F) | In default on interest payments. Rate shown represents the last coupon rate prior to default. |
(G) | Represents an investment in a tender option bond residual interest certificate purchased in a secondary market transaction. The interest rate shown bears an inverse relationship to the interest rate on a tender option bond floating rate certificate. The interest rate disclosed reflects the rate in effect on March 31, 2019. |
See accompanying notes to financial statements.
CITY NATIONAL ROCHDALE FUNDS | PAGE 38
schedule of investments |
March 31, 2019 (Unaudited) |
City National Rochdale Municipal High Income Fund(concluded) |
AMT — Alternative Minimum Tax (subject to)
BAM — Build America Mutual
Cl — Class
COP — Certificate of Participation
GO — General Obligation
RB — Revenue Bond
SAB — Special Assessment Board
Ser — Series
SPL Tax — Special Tax
TA — Tax Allocation
Amounts designated as “—” are either $0 or have been rounded to $0.
The following is a list of the inputs used as of March 31, 2019, is valuing the Fund’s investments carried at value (000):
Investments in Securities | | Level 1 | | | Level 2 | | | Level 3 | | | Total | |
Municipal Bonds | | $ | — | | | $ | 1,222,591 | | | $ | — | | | $ | 1,222,591 | |
Repurchase Agreement | | | — | | | | 40,000 | | | | — | | | | 40,000 | |
Short-Term Investment | | | 38,390 | | | | — | | | | — | | | | 38,390 | |
Total Investments in Securities | | $ | 38,390 | | | $ | 1,262,591 | | | $ | — | | | $ | 1,300,981 | |
For the period ended March 31, 2019, there have been no transfers between any of the fair value hierarchy levels. Transfers between levels are recognized at period end.
Amounts designated as “—“ are either $0 or have been rounded to $0.
For more information on valuation inputs, see Note 2 ---- Significant Accounting Policies in the Notes to Financial Statements.
See accompanying notes to financial statements.
CITY NATIONAL ROCHDALE FUNDS | PAGE 39
schedule of investments |
March 31, 2019 (Unaudited) |
City National Rochdale High Yield Bond Fund |
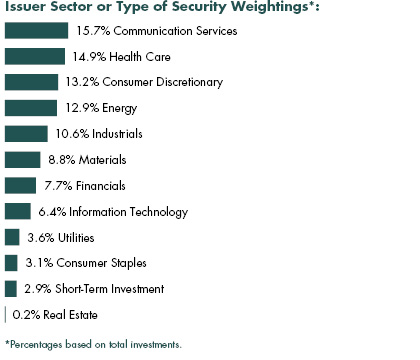
Description | | Face Amount (000) | | | Value (000) | |
Corporate Bonds [96.4%] |
Aerospace & Defense [1.3%] |
TransDigm | | | | | | | | |
6.500%, 05/15/25 | | $ | 275 | | | $ | 279 | |
6.375%, 06/15/26 | | | 25 | | | | 25 | |
6.250%, 03/15/26(A) | | | 175 | | | | 182 | |
TransDigm UK Holdings | | | | | | | | |
6.875%, 05/15/26(A) | | | 275 | | | | 274 | |
| | | | | | | | | |
Total Aerospace & Defense | | | 760 | |
| | | | | | | | | |
Apparel/Textiles [0.3%] |
Hanesbrands | | | | | | | | |
4.625%, 05/15/24(A) | | | 150 | | | | 150 | |
William Carter | | | | | | | | |
5.625%, 03/15/27(A) | | | 25 | | | | 26 | |
| | | | | | | | | |
Total Apparel/Textiles | | | 176 | |
| | | | | | | | | |
Applications Software [0.7%] |
Nuance Communications | | | | | | | | |
5.625%, 12/15/26 | | | 200 | | | | 205 | |
SS&C Technologies | | | | | | | | |
5.500%, 09/30/27(A) | | | 175 | | | | 177 | |
| | | | | | | | | |
Total Applications Software | | | 382 | |
| | | | | | | | | |
Auto Rent & Lease [0.7%] |
United Rentals North America | | | | | | | | |
6.500%, 12/15/26 | | | 400 | | | | 421 | |
| | | | | | | | | |
Auto-Med and Heavy Duty Trks [0.4%] |
JB Poindexter | | | | | | | | |
7.125%, 04/15/26(A) | | | 200 | | | | 201 | |
| | | | | | | | | |
Autoparts [2.1%] |
Adient Global Holdings | | | | | | | | |
4.875%, 08/15/26(A) | | | 225 | | | | 165 | |
American Axle & Manufacturing | | | | | | | | |
6.500%, 04/01/27 | | | 225 | | | | 218 | |
6.250%, 03/15/26 | | | 25 | | | | 24 | |
Dana Financing Luxembourg Sarl | | | | | | | | |
5.750%, 04/15/25(A) | | | 250 | | | | 250 | |
IHO Verwaltungs GmbH | | | | | | | | |
4.750% cash/0% PIK, 09/15/26(A) | | | 300 | | | | 285 | |
Panther BF Aggregator 2 | | | | | | | | |
8.500%, 05/15/27(A) | | | 250 | | | | 251 | |
6.250%, 05/15/26(A) | | | 25 | | | | 25 | |
| | | | | | | | | |
Total Autoparts | | | 1,218 | |
| | | | | | | | | |
Batteries/Battery Sys [0.4%] |
Energizer Holdings | | | | | | | | |
7.750%, 01/15/27(A) | | | 25 | | | | 27 | |
6.375%, 07/15/26(A) | | | 125 | | | | 128 | |
5.500%, 06/15/25(A) | | | 75 | | | | 74 | |
| | | | | | | | | |
Total Batteries/Battery Sys | | | 229 | |
| | | | | | | | | |
Beauty Products [0.3%] |
First Quality Finance | | | | | | | | |
5.000%, 07/01/25(A) | | | 150 | | | | 146 | |
| | | | | | | | | |
Broadcasting & Cable [11.1%] |
AMC Networks | | | | | | | | |
5.000%, 04/01/24 | | | 200 | | | | 201 | |
4.750%, 08/01/25 | | | 100 | | | | 99 | |
CCO Holdings | | | | | | | | |
5.875%, 04/01/24(A) | | | 750 | | | | 784 | |
5.750%, 01/15/24 | | | 150 | | | | 154 | |
5.750%, 02/15/26(A) | | | 75 | | | | 78 | |
5.000%, 02/01/28(A) | | | 200 | | | | 197 | |
Clear Channel Worldwide Holdings | | | | | | | | |
6.500%, 11/15/22 | | | 225 | | | | 230 | |
CSC Holdings | | | | | | | | |
7.500%, 04/01/28(A) | | | 200 | | | | 214 | |
5.500%, 05/15/26(A) | | | 200 | | | | 206 | |
5.500%, 04/15/27(A) | | | 400 | | | | 409 | |
See accompanying notes to financial statements.
CITY NATIONAL ROCHDALE FUNDS | PAGE 40
schedule of investments |
March 31, 2019 (Unaudited) |
City National Rochdale High Yield Bond Fund(continued) |
Description | | Face Amount (000) | | | Value (000) | |
5.250%, 06/01/24 | | $ | 200 | | | $ | 203 | |
5.125%, 12/15/21(A) | | | 200 | | | | 200 | |
DISH DBS | | | | | | | | |
7.750%, 07/01/26 | | | 500 | | | | 435 | |
Gray Television | | | | | | | | |
7.000%, 05/15/27(A) | | | 250 | | | | 266 | |
Nexstar Broadcasting | | | | | | | | |
5.625%, 08/01/24(A) | | | 375 | | | | 381 | |
Sinclair Television Group | | | | | | | | |
5.125%, 02/15/27(A) | | | 375 | | | | 359 | |
TEGNA | | | | | | | | |
6.375%, 10/15/23 | | | 400 | | | | 413 | |
Telenet Finance Luxembourg Notes Sarl | | | | | | | | |
5.500%, 03/01/28(A) | | | 200 | | | | 196 | |
Tribune Media | | | | | | | | |
5.875%, 07/15/22 | | | 250 | | | | 255 | |
Unitymedia GmbH | | | | | | | | |
6.125%, 01/15/25(A) | | | 250 | | | | 259 | |
Virgin Media Finance | | | | | | | | |
6.000%, 10/15/24(A) | | | 225 | | | | 233 | |
Virgin Media Secured Finance | | | | | | | | |
5.250%, 01/15/26(A) | | | 250 | | | | 251 | |
Ziggo BV | | | | | | | | |
5.500%, 01/15/27(A) | | | 350 | | | | 346 | |
| | | | | | | | | |
Total Broadcasting & Cable | | | 6,369 | |
| | | | | | | | | |
Building & Construction [1.3%] |
Masonite International | | | | | | | | |
5.750%, 09/15/26(A) | | | 200 | | | | 204 | |
NCI Building Systems | | | | | | | | |
8.000%, 04/15/26(A) | | | 175 | | | | 157 | |
Standard Industries | | | | | | | | |
5.000%, 02/15/27(A) | | | 100 | | | | 97 | |
4.750%, 01/15/28(A) | | | 275 | | | | 263 | |
| | | | | | | | | |
Total Building & Construction | | | 721 | |
| | | | | | | | | |
Chemicals [1.8%] |
Alpha 3 | | | | | | | | |
6.250%, 02/01/25(A) | | | 275 | | | | 265 | |
Element Solutions | | | | | | | | |
5.875%, 12/01/25(A) | | | 125 | | | | 125 | |
Hexion | | | | | | | | |
6.625%, 04/15/20 | | | 225 | | | | 190 | |
PQ | | | | | | | | |
6.750%, 11/15/22(A) | | | 200 | | | | 208 | |
5.750%, 12/15/25(A) | | | 25 | | | | 24 | |
Starfruit Finco BV | | | | | | | | |
8.000%, 10/01/26(A) | | | 225 | | | | 227 | |
| | | | | | | | | |
Total Chemicals | | | 1,039 | |
| | | | | | | | | |
Circuit Boards [0.2%] |
TTM Technologies | | | | | | | | |
5.625%, 10/01/25(A) | | | 125 | | | | 120 | |
| | | | | | | | | |
Commercial Serv-Finance [0.5%] |
Refinitiv US Holdings | | | | | | | | |
8.250%, 11/15/26(A) | | | 300 | | | | 294 | |
| | | | | | | | | |
Commercial Services [0.8%] |
Nielsen Luxembourg SARL | | | | | | | | |
5.000%, 02/01/25(A) | | | 150 | | | | 144 | |
Star Merger Sub | | | | | | | | |
10.250%, 02/15/27(A) | | | 250 | | | | 256 | |
6.875%, 08/15/26(A) | | | 75 | | | | 77 | |
| | | | | | | | | |
Total Commercial Services | | | 477 | |
| | | | | | | | | |
Computer Software [0.4%] |
Rackspace Hosting | | | | | | | | |
8.625%, 11/15/24(A) | | | 250 | | | | 223 | |
| | | | | | | | | |
Computer System Design & Services [1.3%] |
Banff Merger Sub | | | | | | | | |
9.750%, 09/01/26(A) | | | 275 | | | | 267 | |
Dell International | | | | | | | | |
7.125%, 06/15/24(A) | | | 275 | | | | 292 | |
NCR | | | | | | | | |
5.000%, 07/15/22 | | | 200 | | | | 199 | |
| | | | | | | | | |
Total Computer System Design & Services | | | 758 | |
| | | | | | | | | |
Computers-Memory Devices [0.3%] |
Western Digital | | | | | | | | |
4.750%, 02/15/26 | | | 175 | | | | 167 | |
| | | | | | | | | |
Consumer Products & Services [1.3%] |
EMI Music Publishing Group North America Holdings | | | | | | | | |
7.625%, 06/15/24(A) | | | 175 | | | | 185 | |
Prestige Brands | | | | | | | | |
6.375%, 03/01/24(A) | | | 275 | | | | 280 | |
5.375%, 12/15/21(A) | | | 250 | | | | 252 | |
| | | | | | | | | |
Total Consumer Products & Services | | | 717 | |
| | | | | | | | | |
See accompanying notes to financial statements.
CITY NATIONAL ROCHDALE FUNDS | PAGE 41
schedule of investments |
March 31, 2019 (Unaudited) |
City National Rochdale High Yield Bond Fund(continued) |
Description | | Face Amount (000) | | | Value (000) | |
Containers & Packaging [6.5%] |
ARD Finance | | | | | | | | |
7.125% cash/0% PIK, 09/15/23 | | $ | 325 | | | $ | 324 | |
Ardagh Packaging Finance | | | | | | | | |
6.000%, 02/15/25(A) | | | 325 | | | | 325 | |
Berry Global | | | | | | | | |
5.500%, 05/15/22 | | | 250 | | | | 253 | |
5.125%, 07/15/23 | | | 50 | | | | 51 | |
BWAY Holding | | | | | | | | |
7.250%, 04/15/25(A) | | | 425 | | | | 410 | |
5.500%, 04/15/24(A) | | | 150 | | | | 149 | |
Crown Americas | | | | | | | | |
4.250%, 09/30/26 | | | 125 | | | | 121 | |
Flex Acquisition | | | | | | | | |
7.875%, 07/15/26(A) | | | 275 | | | | 265 | |
6.875%, 01/15/25(A) | | | 300 | | | | 287 | |
Greif | | | | | | | | |
6.500%, 03/01/27(A) | | | 75 | | | | 77 | |
Multi-Color | | | | | | | | |
6.125%, 12/01/22(A) | | | 50 | | | | 51 | |
4.875%, 11/01/25(A) | | | 275 | | | | 284 | |
Owens-Brockway Glass Container | | | | | | | | |
6.375%, 08/15/25(A) | | | 275 | | | | 289 | |
Reynolds Group Issuer | | | | | | | | |
7.000%, 07/15/24(A) | | | 225 | | | | 232 | |
6.875%, 02/15/21 | | | 69 | | | | 69 | |
5.750%, 10/15/20 | | | 200 | | | | 200 | |
Sealed Air | | | | | | | | |
5.500%, 09/15/25(A) | | | 150 | | | | 158 | |
Trident Merger Sub | | | | | | | | |
6.625%, 11/01/25(A) | | | 175 | | | | 164 | |
| | | | | | | | | |
Total Containers & Packaging | | | 3,709 | |
| | | | | | | | | |
Data Processing/Mgmt [1.0%] |
First Data | | | | | | | | |
5.750%, 01/15/24(A) | | | 550 | | | | 566 | |
| | | | | | | | | |
Diagnostic Equipment [1.4%] |
Avantor | | | | | | | | |
9.000%, 10/01/25(A) | | | 250 | | | | 271 | |
6.000%, 10/01/24(A) | | | 75 | | | | 78 | |
Ortho-Clinical Diagnostics | | | | | | | | |
6.625%, 05/15/22(A) | | | 500 | | | | 474 | |
| | | | | | | | | |
Total Diagnostic Equipment | | | 823 | |
| | | | | | | | | |
Disposable Medical Prod [0.6%] |
Sotera Health Holdings | | | | | | | | |
6.500%, 05/15/23(A) | | | 325 | | | | 327 | |
| | | | | | | | | |
Distribution/Wholesale [0.9%] |
American Builders & Contractors Supply | | | | | | | | |
5.875%, 05/15/26(A) | | | 50 | | | | 51 | |
5.750%, 12/15/23(A) | | | 250 | | | | 256 | |
Core & Main | | | | | | | | |
6.125%, 08/15/25(A) | | | 200 | | | | 196 | |
| | | | | | | | | |
Total Distribution/Wholesale | | | 503 | |
| | | | | | | | | |
Diversified Minerals [0.0%] |
Teck Resources | | | | | | | | |
6.000%, 08/15/40 | | | 25 | | | | 26 | |
| | | | | | | | | |
Diversified Operations [0.3%] |
Koppers | | | | | | | | |
6.000%, 02/15/25(A) | | | 200 | | | | 195 | |
| | | | | | | | | |
Drugs [2.4%] |
Bausch Health | | | | | | | | |
6.500%, 03/15/22(A) | | | 50 | | | | 52 | |
6.125%, 04/15/25(A) | | | 425 | | | | 421 | |
5.750%, 08/15/27(A) | | | 50 | | | | 51 | |
5.500%, 11/01/25(A) | | | 100 | | | | 102 | |
Bausch Health Americas | | | | | | | | |
8.500%, 01/31/27(A) | | | 475 | | | | 504 | |
Endo Dac | | | | | | | | |
6.000%, 02/01/25(A) | | | 375 | | | | 271 | |
| | | | | | | | | |
Total Drugs | | | 1,401 | |
| | | | | | | | | |
E-Commerce/Services [0.3%] |
Match Group | | | | | | | | |
5.000%, 12/15/27(A) | | | 150 | | | | 151 | |
| | | | | | | | | |
Electric Utilities [1.1%] |
NRG Energy | | | | | | | | |
7.250%, 05/15/26 | | | 350 | | | | 385 | |
Vistra Operations | | | | | | | | |
5.625%, 02/15/27(A) | | | 100 | | | | 104 | |
5.500%, 09/01/26(A) | | | 125 | | | | 130 | |
| | | | | | | | | |
Total Electric Utilities | | | 619 | |
| | | | | | | | | |
Electrical Products [0.7%] |
WESCO Distribution | | | | | | | | |
5.375%, 06/15/24 | | | 400 | | | | 405 | |
| | | | | | | | | |
See accompanying notes to financial statements.
CITY NATIONAL ROCHDALE FUNDS | PAGE 42
schedule of investments |
March 31, 2019 (Unaudited) |
City National Rochdale High Yield Bond Fund(continued) |
Description | | Face Amount (000) | | | Value (000) | |
Energy & Power [1.0%] |
Enviva Partners | | | | | | | | |
8.500%, 11/01/21 | | $ | 225 | | | $ | 235 | |
TerraForm Power Operating | | | | | | | | |
6.625%, 06/15/25(A) | | | 150 | | | | 157 | |
5.000%, 01/31/28(A) | | | 175 | | | | 169 | |
| | | | | | | | | |
Total Energy & Power | | | 561 | |
| | | | | | | | | |
Enterprise Software/Serv [1.6%] |
Infor US | | | | | | | | |
6.500%, 05/15/22 | | | 575 | | | | 583 | |
Informatica | | | | | | | | |
7.125%, 07/15/23(A) | | | 250 | | | | 255 | |
Riverbed Technology | | | | | | | | |
8.875%, 03/01/23(A) | | | 100 | | | | 75 | |
| | | | | | | | | |
Total Enterprise Software/Serv | | | 913 | |
| | | | | | | | | |
Entertainment & Gaming [3.3%] |
Boyd Gaming | | | | | | | | |
6.000%, 08/15/26 | | | 150 | | | | 154 | |
Caesars Resort Collection | | | | | | | | |
5.250%, 10/15/25(A) | | | 225 | | | | 217 | |
Eldorado Resorts | | | | | | | | |
6.000%, 09/15/26 | | | 200 | | | | 203 | |
MGM Resorts International | | | | | | | | |
5.750%, 06/15/25 | | | 200 | | | | 207 | |
5.500%, 04/15/27 | | | 75 | | | | 76 | |
Mohegan Gaming & Entertainment | | | | | | | | |
7.875%, 10/15/24(A) | | | 150 | | | | 148 | |
Penn National Gaming | | | | | | | | |
5.625%, 01/15/27(A) | | | 100 | | | | 97 | |
Rivers Pittsburgh Borrower | | | | | | | | |
6.125%, 08/15/21(A) | | | 225 | | | | 225 | |
Stars Group Holdings BV | | | | | | | | |
7.000%, 07/15/26(A) | | | 225 | | | | 235 | |
Station Casinos | | | | | | | | |
5.000%, 10/01/25(A) | | | 200 | | | | 196 | |
Sugarhouse HSP Gaming Prop Mezz | | | | | | | | |
5.875%, 05/15/25(A) | | | 125 | | | | 123 | |
| | | | | | | | | |
Total Entertainment & Gaming | | | 1,881 | |
| | | | | | | | | |
Financial Services [2.9%] |
Navient | | | | | | | | |
6.750%, 06/15/26 | | | 175 | | | | 168 | |
5.875%, 10/25/24 | | | 175 | | | | 169 | |
Navient, MTN | | | | | | | | |
5.500%, 01/25/23 | | | 175 | | | | 175 | |
Quicken Loans | | | | | | | | |
5.750%, 05/01/25(A) | | | 50 | | | | 50 | |
5.250%, 01/15/28(A) | | | 575 | | | | 538 | |
Resideo Funding | | | | | | | | |
6.125%, 11/01/26(A) | | | 125 | | | | 129 | |
Tempo Acquisition | | | | | | | | |
6.750%, 06/01/25(A) | | | 400 | | | | 403 | |
| | | | | | | | | |
Total Financial Services | | | 1,632 | |
| | | | | | | | | |
Food, Beverage & Tobacco [1.6%] |
B&G Foods | | | | | | | | |
5.250%, 04/01/25 | | | 275 | | | | 264 | |
Post Holdings | | | | | | | | |
5.625%, 01/15/28(A) | | | 250 | | | | 248 | |
5.500%, 03/01/25(A) | | | 400 | | | | 404 | |
| | | | | | | | | |
Total Food, Beverage & Tobacco | | | 916 | |
| | | | | | | | | |
Food-Catering [0.4%] |
Aramark Services | | | | | | | | |
5.125%, 01/15/24 | | | 250 | | | | 257 | |
| | | | | | | | | |
Food-Wholesale/Distrib [0.4%] |
US Foods | | | | | | | | |
5.875%, 06/15/24(A) | | | 250 | | | | 255 | |
| | | | | | | | | |
Gas-Distribution [0.6%] |
AmeriGas Partners | | | | | | | | |
5.750%, 05/20/27 | | | 225 | | | | 222 | |
5.500%, 05/20/25 | | | 100 | | | | 100 | |
| | | | | | | | | |
Total Gas-Distribution | | | 322 | |
| | | | | | | | | |
Hazardous Waste Disposal [0.3%] |
Tervita Escrow | | | | | | | | |
7.625%, 12/01/21(A) | | | 200 | | | | 199 | |
| | | | | | | | | |
Hotels and Motels [0.2%] |
Wyndham Hotels & Resorts | | | | | | | | |
5.375%, 04/15/26(A) | | | 125 | | | | 127 | |
| | | | | | | | | |
Human Resources [0.6%] |
Team Health Holdings | | | | | | | | |
6.375%, 02/01/25(A) | | | 425 | | | | 346 | |
| | | | | | | | | |
Insurance [1.7%] |
Ardonagh Midco 3 | | | | | | | | |
8.625%, 07/15/23(A) | | | 200 | | | | 171 | |
See accompanying notes to financial statements.
CITY NATIONAL ROCHDALE FUNDS | PAGE 43
schedule of investments |
March 31, 2019 (Unaudited) |
City National Rochdale High Yield Bond Fund(continued) |
Description | | Face Amount (000) | | | Value (000) | |
HUB International | | | | | | | | |
7.000%, 05/01/26(A) | | $ | 525 | | | $ | 520 | |
USI | | | | | | | | |
6.875%, 05/01/25(A) | | | 300 | | | | 291 | |
| | | | | | | | | |
Total Insurance | | | 982 | |
| | | | | | | | | |
Investment Bank/Broker-Dealer [0.5%] |
NFP | | | | | | | | |
6.875%, 07/15/25(A) | | | 275 | | | | 263 | |
| | | | | | | | | |
Mach Tools and Rel Products [0.1%] |
Colfax | | | | | | | | |
6.375%, 02/15/26(A) | | | 25 | | | | 27 | |
6.000%, 02/15/24(A) | | | 25 | | | | 26 | |
| | | | | | | | | |
Total Mach Tools and Rel Products | | | 53 | |
| | | | | | | | | |
Machinery-Pumps [0.2%] |
Titan Acquisition | | | | | | | | |
7.750%, 04/15/26(A) | | | 150 | | | | 129 | |
| | | | | | | | | |
Medical Information Sys [0.4%] |
IQVIA | | | | | | | | |
5.000%, 10/15/26(A) | | | 200 | | | | 205 | |
| | | | | | | | | |
Medical Labs and Testing Srv [1.3%] |
Charles River Laboratories International | | | | | | | | |
5.500%, 04/01/26(A) | | | 25 | | | | 26 | |
Envision Healthcare | | | | | | | | |
8.750%, 10/15/26(A) | | | 225 | | | | 200 | |
MEDNAX | | | | | | | | |
6.250%, 01/15/27(A) | | | 200 | | | | 202 | |
West Street Merger Sub | | | | | | | | |
6.375%, 09/01/25(A) | | | 300 | | | | 292 | |
| | | | | | | | | |
Total Medical Labs and Testing Srv | | | 720 | |
| | | | | | | | | |
Medical Products & Services [5.5%] |
Acadia Healthcare | | | | | | | | |
6.500%, 03/01/24 | | | 300 | | | | 308 | |
CHS | | | | | | | | |
8.000%, 03/15/26(A) | | | 75 | | | | 72 | |
6.250%, 03/31/23 | | | 175 | | | | 165 | |
HCA | | | | | | | | |
5.875%, 02/01/29 | | | 75 | | | | 81 | |
5.625%, 09/01/28 | | | 275 | | | | 291 | |
5.375%, 02/01/25 | | | 425 | | | | 450 | |
5.250%, 06/15/26 | | | 100 | | | | 107 | |
Mallinckrodt International Finance | | | | | | | | |
5.500%, 04/15/25(A) | | | 550 | | | | 429 | |
RegionalCare Hospital Partners Holdings | | | | | | | | |
9.750%, 12/01/26(A) | | | 200 | | | | 208 | |
Sterigenics-Nordion Topco | | | | | | | | |
8.125% cash/0% PIK, 11/01/21(A) | | | 225 | | | | 222 | |
Surgery Center Holdings | | | | | | | | |
6.750%, 07/01/25(A) | | | 175 | | | | 158 | |
Tenet Healthcare | | | | | | | | |
7.000%, 08/01/25 | | | 300 | | | | 303 | |
5.125%, 05/01/25 | | | 150 | | | | 151 | |
4.625%, 07/15/24 | | | 200 | | | | 200 | |
| | | | | | | | | |
Total Medical Products & Services | | | 3,145 | |
| | | | | | | | | |
Medical-HMO [1.2%] |
Centene | | | | | | | | |
4.750%, 01/15/25 | | | 125 | | | | 128 | |
MPH Acquisition Holdings | | | | | | | | |
7.125%, 06/01/24(A) | | | 350 | | | | 349 | |
Polaris Intermediate | | | | | | | | |
8.500% cash/0% PIK, 12/01/22(A) | | | 200 | | | | 197 | |
| | | | | | | | | |
Total Medical-HMO | | | 674 | |
| | | | | | | | | |
Medical-Outptnt/Home Med [0.4%] |
Air Medical Group Holdings | | | | | | | | |
6.375%, 05/15/23(A) | | | 250 | | | | 210 | |
| | | | | | | | | |
Medical-Whsle Drug Dist [0.4%] |
Vizient | | | | | | | | |
10.375%, 03/01/24(A) | | | 225 | | | | 245 | |
| | | | | | | | | |
Metal-Copper [0.8%] |
Freeport-McMoRan | | | | | | | | |
5.400%, 11/14/34 | | | 125 | | | | 114 | |
3.875%, 03/15/23 | | | 325 | | | | 320 | |
| | | | | | | | | |
Total Metal-Copper | | | 434 | |
| | | | | | | | | |
Metals & Mining [0.4%] |
Hudbay Minerals | | | | | | | | |
7.625%, 01/15/25(A) | | | 200 | | | | 205 | |
| | | | | | | | | |
Miscellaneous Business Services [0.3%] |
Garda World Security | | | | | | | | |
8.750%, 05/15/25(A) | | | 200 | | | | 190 | |
| | | | | | | | | |
See accompanying notes to financial statements.
CITY NATIONAL ROCHDALE FUNDS | PAGE 44
schedule of investments |
March 31, 2019 (Unaudited) |
City National Rochdale High Yield Bond Fund(continued) |
Description | | Face Amount (000) | | | Value (000) | |
Multi-line Insurance [0.4%] |
Acrisure | | | | | | | | |
8.125%, 02/15/24(A) | | $ | 50 | | | $ | 52 | |
7.000%, 11/15/25(A) | | | 200 | | | | 180 | |
| | | | | | | | | |
Total Multi-line Insurance | | | 232 | |
| | | | | | | | | |
Office Automation and Equip [0.2%] |
CDW | | | | | | | | |
5.500%, 12/01/24 | | | 100 | | | | 105 | |
| | | | | | | | | |
Oil-Field Services [1.3%] |
Archrock Partners | | | | | | | | |
6.875%, 04/01/27(A) | | | 125 | | | | 128 | |
SESI | | | | | | | | |
7.750%, 09/15/24 | | | 150 | | | | 124 | |
7.125%, 12/15/21 | | | 175 | | | | 157 | |
USA Compression Partners | | | | | | | | |
6.875%, 04/01/26 | | | 225 | | | | 231 | |
6.875%, 09/01/27(A) | | | 75 | | | | 76 | |
| | | | | | | | | |
Total Oil-Field Services | | | 716 | |
| | | | | | | | | |
Paper & Related Products [0.5%] |
Clearwater Paper | | | | | | | | |
5.375%, 02/01/25(A) | | | 137 | | | | 127 | |
4.500%, 02/01/23 | | | 140 | | | | 133 | |
| | | | | | | | | |
Total Paper & Related Products | | | 260 | |
| | | | | | | | | |
Petroleum & Fuel Products [11.1%] |
Antero Midstream Partners | | | | | | | | |
5.750%, 03/01/27(A) | | | 50 | | | | 50 | |
5.375%, 09/15/24 | | | 225 | | | | 227 | |
Antero Resources | | | | | | | | |
5.125%, 12/01/22 | | | 200 | | | | 201 | |
Ascent Resources Utica Holdings | | | | | | | | |
7.000%, 11/01/26(A) | | | 100 | | | | 96 | |
Berry Petroleum | | | | | | | | |
7.000%, 02/15/26(A) | | | 100 | | | | 99 | |
Callon Petroleum | | | | | | | | |
6.125%, 10/01/24 | | | 175 | | | | 176 | |
Carrizo Oil & Gas | | | | | | | | |
6.250%, 04/15/23 | | | 175 | | | | 172 | |
Centennial Resource Production | | | | | | | | |
6.875%, 04/01/27(A) | | | 100 | | | | 101 | |
Cheniere Corpus Christi Holdings | | | | | | | | |
5.875%, 03/31/25 | | | 225 | | | | 245 | |
Cheniere Energy Partners | | | | | | | | |
5.625%, 10/01/26(A) | | | 250 | | | | 256 | |
Chesapeake Energy | | | | | | | | |
8.000%, 06/15/27 | | | 175 | | | | 172 | |
7.000%, 10/01/24 | | | 150 | | | | 150 | |
CNX Midstream Partners | | | | | | | | |
6.500%, 03/15/26(A) | | | 200 | | | | 193 | |
CrownRock | | | | | | | | |
5.625%, 10/15/25(A) | | | 225 | | | | 216 | |
CVR Refining | | | | | | | | |
6.500%, 11/01/22 | | | 250 | | | | 252 | |
EP Energy | | | | | | | | |
8.000%, 11/29/24(A) | | | 150 | | | | 83 | |
Gulfport Energy | | | | | | | | |
6.000%, 10/15/24 | | | 200 | | | | 182 | |
Holly Energy Partners | | | | | | | | |
6.000%, 08/01/24(A) | | | 275 | | | | 284 | |
Jagged Peak Energy | | | | | | | | |
5.875%, 05/01/26 | | | 150 | | | | 149 | |
Laredo Petroleum | | | | | | | | |
5.625%, 01/15/22 | | | 125 | | | | 114 | |
NuStar Logistics | | | | | | | | |
5.625%, 04/28/27 | | | 200 | | | | 200 | |
Oasis Petroleum | | | | | | | | |
6.875%, 01/15/23 | | | 150 | | | | 150 | |
6.250%, 05/01/26(A) | | | 50 | | | | 48 | |
Parsley Energy | | | | | | | | |
5.250%, 08/15/25(A) | | | 125 | | | | 123 | |
PDC Energy | | | | | | | | |
5.750%, 05/15/26 | | | 375 | | | | 367 | |
Precision Drilling | | | | | | | | |
7.125%, 01/15/26(A) | | | 175 | | | | 174 | |
QEP Resources | | | | | | | | |
5.375%, 10/01/22 | | | 125 | | | | 122 | |
Range Resources | | | | | | | | |
5.000%, 03/15/23 | | | 200 | | | | 196 | |
Shelf Drilling Holdings | | | | | | | | |
8.250%, 02/15/25(A) | | | 125 | | | | 119 | |
SM Energy | | | | | | | | |
6.750%, 09/15/26 | | | 175 | | | | 168 | |
SRC Energy | | | | | | | | |
6.250%, 12/01/25 | | | 150 | | | | 134 | |
Summit Midstream Holdings | | | | | | | | |
5.750%, 04/15/25 | | | 375 | | | | 353 | |
Sunoco | | | | | | | | |
5.500%, 02/15/26 | | | 150 | | | | 148 | |
Targa Resources Partners | | | | | | | | |
6.500%, 07/15/27(A) | | | 25 | | | | 27 | |
5.875%, 04/15/26(A) | | | 350 | | | | 370 | |
5.125%, 02/01/25 | | | 50 | | | | 51 | |
See accompanying notes to financial statements.
CITY NATIONAL ROCHDALE FUNDS | PAGE 45
schedule of investments |
March 31, 2019 (Unaudited) |
City National Rochdale High Yield Bond Fund(continued) |
Description | | Face Amount (000) | | | Value (000) | |
Whiting Petroleum | | | | | | | | |
6.625%, 01/15/26 | | $ | 200 | | | $ | 196 | |
| | | | | | | | | |
Total Petroleum & Fuel Products | | | 6,364 | |
| | | | | | | | | |
Precious Metals [0.2%] |
Coeur Mining | | | | | | | | |
5.875%, 06/01/24 | | | 125 | | | | 120 | |
| | | | | | | | | |
Property/Casualty Ins [0.8%] |
AmWINS Group | | | | | | | | |
7.750%, 07/01/26(A) | | | 275 | | | | 274 | |
AssuredPartners | | | | | | | | |
7.000%, 08/15/25(A) | | | 200 | | | | 185 | |
| | | | | | | | | |
Total Property/Casualty Ins | | | 459 | |
| | | | | | | | | |
Quarrying [0.2%] |
Compass Minerals International | | | | | | | | |
4.875%, 07/15/24(A) | | | 150 | | | | 140 | |
| | | | | | | | | |
Radio [1.4%] |
CBS Radio | | | | | | | | |
7.250%, 11/01/24(A) | | | 150 | | | | 149 | |
Sirius XM Radio | | | | | | | | |
5.375%, 07/15/26(A) | | | 350 | | | | 358 | |
3.875%, 08/01/22(A) | | | 200 | | | | 198 | |
Urban One | | | | | | | | |
7.375%, 04/15/22(A) | | | 125 | | | | 121 | |
| | | | | | | | | |
Total Radio | | | 826 | |
| | | | | | | | | |
Real Estate Investment Trusts [0.2%] |
MGM Growth Properties Operating Partnership | | | | | | | | |
5.625%, 05/01/24 | | | 125 | | | | 130 | |
| | | | | | | | | |
Research and Development [1.1%] |
Jaguar Holding II | | | | | | | | |
6.375%, 08/01/23(A) | | | 600 | | | | 611 | |
| | | | | | | | | |
Resorts/Theme Parks [0.5%] |
Six Flags Entertainment | | | | | | | | |
4.875%, 07/31/24(A) | | | 275 | | | | 272 | |
| | | | | | | | | |
Retail [3.6%] |
1011778 BC ULC | | | | | | | | |
4.250%, 05/15/24(A) | | | 425 | | | | 421 | |
Albertsons | | | | | | | | |
7.500%, 03/15/26(A) | | | 100 | | | | 103 | |
5.750%, 03/15/25 | | | 425 | | | | 403 | |
Beacon Roofing Supply | | | | | | | | |
4.875%, 11/01/25(A) | | | 90 | | | | 85 | |
Ferrellgas | | | | | | | | |
6.750%, 01/15/22 | | | 175 | | | | 152 | |
6.750%, 06/15/23 | | | 175 | | | | 153 | |
KFC Holding | | | | | | | | |
5.250%, 06/01/26(A) | | | 200 | | | | 202 | |
Michaels Stores | | | | | | | | |
5.875%, 12/15/20(A) | | | 250 | | | | 250 | |
Party City Holdings | | | | | | | | |
6.625%, 08/01/26(A) | | | 300 | | | | 299 | |
| | | | | | | | | |
Total Retail | | | 2,068 | |
| | | | | | | | | |
Rubber & Plastic [0.3%] |
Goodyear Tire & Rubber | | | | | | | | |
5.000%, 05/31/26 | | | 175 | | | | 167 | |
| | | | | | | | | |
Rubber/Plastic Products [0.4%] |
Gates Global | | | | | | | | |
6.000%, 07/15/22(A) | | | 250 | | | | 251 | |
| | | | | | | | | |
Software Tools [0.4%] |
RP Crown Parent | | | | | | | | |
7.375%, 10/15/24(A) | | | 250 | | | | 256 | |
| | | | | | | | | |
Telecommunication Equip [0.2%] |
Anixter | | | | | | | | |
6.000%, 12/01/25(A) | | | 125 | | | | 131 | |
| | | | | | | | | |
Telephones & Telecommunications [4.8%] |
Altice France | | | | | | | | |
8.125%, 02/01/27(A) | | | 100 | | | | 101 | |
7.375%, 05/01/26(A) | | | 850 | | | | 833 | |
Intelsat Jackson Holdings | | | | | | | | |
8.500%, 10/15/24(A) | | | 200 | | | | 195 | |
5.500%, 08/01/23 | | | 150 | | | | 133 | |
Sprint | | | | | | | | |
7.625%, 02/15/25 | | | 375 | | | | 383 | |
7.125%, 06/15/24 | | | 275 | | | | 279 | |
Sprint Capital | | | | | | | | |
6.875%, 11/15/28 | | | 300 | | | | 288 | |
T-Mobile USA | | | | | | | | |
6.500%, 01/15/24 | | | 425 | | | | 441 | |
6.375%, 03/01/25 | | | 100 | | | | 104 | |
| | | | | | | | | |
Total Telephones & Telecommunications | | | 2,757 | |
| | | | | | | | | |
Transportation Services [0.3%] |
VOC Escrow | | | | | | | | |
5.000%, 02/15/28(A) | | | 175 | | | | 170 | |
| | | | | | | | | |
See accompanying notes to financial statements.
CITY NATIONAL ROCHDALE FUNDS | PAGE 46
schedule of investments |
March 31, 2019 (Unaudited) |
City National Rochdale High Yield Bond Fund(concluded) |
Description | | Face Amount (000)/Shares | | | Value (000) | |
Transport-Equip and Leasing [1.2%] |
Park Aerospace Holdings | | | | | | | | |
5.500%, 02/15/24(A) | | $ | 600 | | | $ | 623 | |
5.250%, 08/15/22(A) | | | 75 | | | | 77 | |
| | | | | | | | | |
Total Transport-Equip and Leasing | | | 700 | |
| | | | | | | | | |
Utility [0.8%] |
Suburban Propane Partners | | | | | | | | |
5.875%, 03/01/27 | | | 250 | | | | 237 | |
5.750%, 03/01/25 | | | 250 | | | | 242 | |
| | | | | | | | | |
Total Utility | | | 479 | |
| | | | | | | | | |
Total Corporate Bonds |
(Cost $55,011) | | | 55,221 | |
| | | | | | | | | |
Special Stock [0.0%] |
Broadcasting & Cable [0.0%] |
Adelphia Recovery Trust* (B) | | | 8,500 | | | | — | |
| | | | | | | | | |
Total Special Stock |
(Cost $9) | | | — | |
| | | | | | | | | |
Short-Term Investment** [2.9%] |
SEI Daily Income Trust Government Fund, Cl F, 2.220% | | | 1,650,601 | | | | 1,651 | |
| | | | | | | | | |
Total Short-Term Investment |
(Cost $1,651) | | | 1,651 | |
| | | | | | | | | |
Total Investments [99.3%] |
(Cost $56,671) | | $ | 56,872 | |
| | | | | | | | | |
Percentages are based on net assets of $57,267 (000).
* | Non-income producing security. |
** | The rate reported is the 7-day effective yield as of March 31, 2019. |
(A) | Security exempt from registration under Rule 144A of the Securities Act of 1933. These securities may be resold in transactions exempt from registration normally to qualified institutions. On March 31, 2019, the value of these securities amounted to $36,131 (000), representing 63.1% of the net assets of the Fund. |
(B) | Level 3 security in accordance with fair value hierarchy. |
Cl — Class
MTN — Medium Term Note
Amounts designated as “—” are either $0 or have been rounded to $0.
The following is a list of the inputs used as of March 31, 2019, in valuing the Fund’s investments carried at value (000):
Investments in Securities | | Level 1 | | | Level 2 | | | Level 3 | | | Total | |
Corporate Bonds | | $ | — | | | $ | 55,221 | | | $ | — | | | $ | 55,221 | |
Special Stock | | | — | | | | — | | | | — | | | | — | |
Short-Term Investment | | | 1,651 | | | | — | | | | — | | | | 1,651 | |
Total Investments in Securities | | $ | 1,651 | | | $ | 55,221 | | | $ | — | | | $ | 56,872 | |
For the period ended March 31, 2019, there were no transfers between Level 1 and Level 2 assets and liabilities.
For the period ended March 31, 2019, there have been transfers between Level 2 and Level 3 assets and liabilities.
The transfers between fair values hierarchy levels were due to changes in the availability of observable inputs to determine fair value. Transfers between levels are recognized at period end.
Amounts designated as “—” are either $0 or have been rounded to $0.
For more information on valuation inputs, see Note 2 — Significant Accounting Policies in the Notes to Financial Statements.
See accompanying notes to financial statements.
CITY NATIONAL ROCHDALE FUNDS | PAGE 47
schedule of investments |
March 31, 2019 (Unaudited) |
City National Rochdale Intermediate Fixed Income Fund |
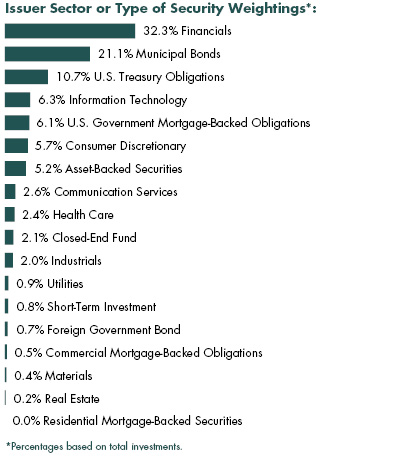
Description | | Face Amount (000) | | | Value (000) | |
Corporate Bonds [52.5%] |
Communication Services [2.6%] |
America Movil | | | | | | | | |
3.125%, 07/16/22 | | $ | 4,000 | | | $ | 4,027 | |
| | | | | | | | | |
Consumer Discretionary [5.6%] |
Daimler Finance North America | | | | | | | | |
3.128%, VAR ICE LIBOR USD 3 Month+0.430%, 02/12/21(A) | | | 4,000 | | | | 3,982 | |
ERAC USA Finance | | | | | | | | |
3.300%, 10/15/22(A) | | | 250 | | | | 251 | |
Gap | | | | | | | | |
5.950%, 04/12/21 | | | 495 | | | | 515 | |
General Motors Financial | | | | | | | | |
4.350%, 01/17/27 | | | 2,500 | | | | 2,430 | |
Hyundai Capital America | | | | | | | | |
2.600%, 03/19/20(A) | | | 1,000 | | | | 994 | |
Tupperware Brands | | | | | | | | |
4.750%, 06/01/21 | | | 500 | | | | 513 | |
| | | | | | | | | |
Total Consumer Discretionary | | | 8,685 | |
| | | | | | | | | |
Financials [32.1%] |
American Express | | | | | | | | |
3.289%, VAR ICE LIBOR USD 3 Month+0.650%, 02/27/23 | | | 3,805 | | | | 3,798 | |
Axis Specialty Finance | | | | | | | | |
5.875%, 06/01/20 | | | 250 | | | | 258 | |
Bank of Montreal, MTN | | | | | | | | |
3.231%, VAR ICE LIBOR USD 3 Month+0.630%, 09/11/22 | | | 4,070 | | | | 4,077 | |
Bank of Nova Scotia | | | | | | | | |
2.450%, 03/22/21 | | | 5,330 | | | | 5,304 | |
Barclays | | | | | | | | |
4.375%, 01/12/26 | | | 1,500 | | | | 1,506 | |
Capital One Financial | | | | | | | | |
4.200%, 10/29/25 | | | 1,000 | | | | 1,017 | |
Citigroup | | | | | | | | |
4.500%, 01/14/22 | | | 2,000 | | | | 2,086 | |
Credit Suisse Group Funding Guernsey | | | | | | | | |
4.550%, 04/17/26 | | | 2,500 | | | | 2,611 | |
Deutsche Bank, MTN | | | | | | | | |
2.850%, 05/10/19 | | | 2,485 | | | | 2,484 | |
Goldman Sachs Group, MTN | | | | | | | | |
3.951%, VAR ICE LIBOR USD 3 Month+1.300%, 11/23/24 | | | 4,500 | | | | 4,505 | |
Jefferies Group | | | | | | | | |
5.125%, 01/20/23 | | | 1,200 | | | | 1,271 | |
JPMorgan Chase | | | | | | | | |
3.125%, 01/23/25 | | | 4,700 | | | | 4,704 | |
Lehman Brothers Holdings, MTN | | | | | | | | |
7.000%, 09/28/37(B) | | | 400 | | | | 8 | |
Metropolitan Life Global Funding I | | | | | | | | |
3.875%, 04/11/22(A) | | | 125 | | | | 129 | |
Morgan Stanley, MTN | | | | | | | | |
3.750%, 02/25/23 | | | 5,000 | | | | 5,128 | |
NASDAQ OMX Group | | | | | | | | |
5.550%, 01/15/20 | | | 749 | | | | 765 | |
Principal Financial Group | | | | | | | | |
3.300%, 09/15/22 | | | 200 | | | | 201 | |
Sumitomo Mitsui Financial Group | | | | | | | | |
2.846%, 01/11/22 | | | 3,910 | | | | 3,913 | |
Toronto-Dominion Bank, MTN | | | | | | | | |
3.293%, VAR ICE LIBOR USD 3 Month+0.560%, 11/05/19 | | | 2,100 | | | | 2,106 | |
See accompanying notes to financial statements.
CITY NATIONAL ROCHDALE FUNDS | PAGE 48
schedule of investments |
March 31, 2019 (Unaudited) |
City National Rochdale Intermediate Fixed Income Fund(continued) |
Description | | Face Amount (000) | | | Value (000) | |
Wells Fargo Bank, MTN | | | | | | | | |
2.910%, VAR United States Secured Overnight Financing Rate+0.480%, 03/25/20 | | $ | 3,500 | | | $ | 3,504 | |
| | | | | | | | | |
Total Financials | | | 49,375 | |
| | | | | | | | | |
Health Care [2.4%] |
AbbVie | | | | | | | | |
2.850%, 05/14/23 | | | 2,500 | | | | 2,473 | |
Gilead Sciences | | | | | | | | |
2.950%, 03/01/27 | | | 1,240 | | | | 1,204 | |
| | | | | | | | | |
Total Health Care | | | 3,677 | |
| | | | | | | | | |
Industrials [2.0%] |
IDEX | | | | | | | | |
4.200%, 12/15/21 | | | 250 | | | | 254 | |
John Deere Capital, MTN | | | | | | | | |
2.800%, 09/08/27 | | | 2,500 | | | | 2,446 | |
Penske Truck Leasing | | | | | | | | |
4.250%, 01/17/23(A) | | | 300 | | | | 310 | |
| | | | | | | | | |
Total Industrials | | | 3,010 | |
| | | | | | | | | |
Information Technology [6.3%] |
KLA-Tencor | | | | | | | | |
4.650%, 11/01/24 | | | 2,500 | | | | 2,671 | |
Oracle | | | | | | | | |
2.500%, 05/15/22 | | | 5,000 | | | | 4,982 | |
Western Union | | | | | | | | |
5.253%, 04/01/20 | | | 2,000 | | | | 2,043 | |
| | | | | | | | | |
Total Information Technology | | | 9,696 | |
| | | | | | | | | |
Materials [0.4%] |
Airgas | | | | | | | | |
2.900%, 11/15/22 | | | 250 | | | | 251 | |
Avery Dennison | | | | | | | | |
5.375%, 04/15/20 | | | 405 | | | | 413 | |
| | | | | | | | | |
Total Materials | | | 664 | |
| | | | | | | | | |
Real Estate [0.2%] |
Highwoods Realty | | | | | | | | |
3.625%, 01/15/23 | | | 200 | | | | 201 | |
SITE Centers | | | | | | | | |
4.625%, 07/15/22 | | | 79 | | | | 81 | |
| | | | | | | | | |
Total Real Estate | | | 282 | |
| | | | | | | | | |
Utilities [0.9%] |
Korea Electric Power | | | | | | | | |
6.750%, 08/01/27 | | | 75 | | | | 94 | |
National Fuel Gas | | | | | | | | |
4.900%, 12/01/21 | | | 500 | | | | 514 | |
Puget Energy | | | | | | | | |
6.000%, 09/01/21 | | | 500 | | | | 531 | |
5.625%, 07/15/22 | | | 250 | | | | 267 | |
| | | | | | | | | |
Total Utilities | | | 1,406 | |
| | | | | | | | | |
Total Corporate Bonds |
(Cost $80,772) | | | 80,822 | |
| | | | | | | | | |
Municipal Bonds [20.9%] |
California [8.0%] |
California State, Various Purpose, GO | | | | | | | | |
3.500%, 04/01/28 | | | 6,000 | | | | 6,302 | |
San Jose, Redevelopment Agency Successor Agency, Ser A-T, TA | | | | | | | | |
2.958%, 08/01/24 | | | 6,000 | | | | 6,047 | |
| | | | | | | | | |
Total California | | | 12,349 | |
| | | | | | | | | |
New York [12.9%] |
New York City Transitional Finance Authority Future Tax Secured Revenue, Sub-Ser C-5, GO | | | | | | | | |
Callable 05/01/28 @ 100 | | | | | | | | |
3.800%, 05/01/29 | | | 2,500 | | | | 2,626 | |
New York City, Build America Bonds, GO | | | | | | | | |
5.424%, 03/01/25 | | | 3,500 | | | | 3,969 | |
New York State, Sub-Ser D-2, GO | | | | | | | | |
3.760%, 12/01/27 | | | 3,020 | | | | 3,151 | |
New York State, Urban Development, RB | | | | | | | | |
3.100%, 03/15/24 | | | 5,000 | | | | 5,080 | |
New York State, Urban Development, Ser D-2, RB | | | | | | | | |
Callable 09/15/27 @ 100 | | | | | | | | |
3.270%, 03/15/28 | | | 5,000 | | | | 5,059 | |
| | | | | | | | | |
Total New York | | | 19,885 | |
| | | | | | | | | |
Total Municipal Bonds |
(Cost $31,276) | | | 32,234 | |
| | | | | | | | | |
See accompanying notes to financial statements.
CITY NATIONAL ROCHDALE FUNDS | PAGE 49
schedule of investments |
March 31, 2019 (Unaudited) |
City National Rochdale Intermediate Fixed Income Fund(continued) |
Description | | Face Amount (000) | | | Value (000) | |
U.S. Treasury Obligations [10.6%] |
U.S. Treasury Note | | | | | | | | |
3.125%, 11/15/28 | | $ | 950 | | | $ | 1,008 | |
2.625%, 01/31/26 | | | 2,200 | | | | 2,242 | |
2.125%, 12/31/22 | | | 1,000 | | | | 996 | |
2.125%, 02/29/24 | | | 2,800 | | | | 2,783 | |
2.439%, 07/25/19(C) | | | 2,000 | | | | 1,985 | |
2.000%, 08/31/21 | | | 5,300 | | | | 5,267 | |
1.625%, 03/15/20 | | | 2,100 | | | | 2,084 | |
| | | | | | | | | |
Total U.S. Treasury Obligation |
(Cost $16,224) | | | 16,365 | |
| | | | | | | | | |
U.S. Government Mortgage-Backed Obligations [6.0%] |
FHLMC, Pool 1B2677 | | | | | | | | |
4.885%, VAR ICE LIBOR USD 12 Month+1.900%, 01/01/35 | | | 3 | | | | 3 | |
FHLMC, Pool 1B2683 | | | | | | | | |
4.833%, VAR ICE LIBOR USD 12 Month+1.900%, 01/01/35 | | | 1 | | | | 1 | |
FHLMC, Pool 1B2692 | | | | | | | | |
4.647%, VAR ICE LIBOR USD 12 Month+1.767%, 12/01/34 | | | 5 | | | | 5 | |
FHLMC, Pool A93505 | | | | | | | | |
4.500%, 08/01/40 | | | 18 | | | | 19 | |
FHLMC, Pool A93996 | | | | | | | | |
4.500%, 09/01/40 | | | 26 | | | | 28 | |
FHLMC, Pool C03490 | | | | | | | | |
4.500%, 08/01/40 | | | 142 | | | | 150 | |
FHLMC, Pool C09015 | | | | | | | | |
3.000%, 10/01/42 | | | 145 | | | | 145 | |
FHLMC, Pool G02940 | | | | | | | | |
5.500%, 05/01/37 | | | 3 | | | | 4 | |
FHLMC, Pool G04222 | | | | | | | | |
5.500%, 04/01/38 | | | 7 | | | | 7 | |
FHLMC, Pool G04913 | | | | | | | | |
5.000%, 03/01/38 | | | 28 | | | | 30 | |
FHLMC, Pool G08003 | | | | | | | | |
6.000%, 07/01/34 | | | 8 | | | | 9 | |
FHLMC, Pool G11880 | | | | | | | | |
5.000%, 12/01/20 | | | 2 | | | | 2 | |
FHLMC, Pool G18124 | | | | | | | | |
6.000%, 06/01/21 | | | 2 | | | | 2 | |
FHLMC, Pool J19197 | | | | | | | | |
3.000%, 05/01/27 | | | 70 | | | | 71 | |
FHLMC, Pool Q08998 | | | | | | | | |
3.500%, 06/01/42 | | | 104 | | | | 106 | |
FHLMC, Pool Q10378 | | | | | | | | |
3.000%, 08/01/42 | | | 135 | | | | 135 | |
FNMA | | | | | | | | |
2.625%, 09/06/24 | | | 3,000 | | | | 3,044 | |
FNMA, Pool 252570 | | | | | | | | |
6.500%, 07/01/29 | | | 2 | | | | 3 | |
FNMA, Pool 253183 | | | | | | | | |
7.500%, 04/01/30 | | | — | | | | — | |
FNMA, Pool 253398 | | | | | | | | |
8.000%, 08/01/30 | | | 1 | | | | 1 | |
FNMA, Pool 254949 | | | | | | | | |
5.000%, 11/01/33 | | | 6 | | | | 7 | |
FNMA, Pool 255814 | | | | | | | | |
5.500%, 08/01/35 | | | 10 | | | | 11 | |
FNMA, Pool 303168 | | | | | | | | |
9.500%, 02/01/25 | | | 1 | | | | 1 | |
FNMA, Pool 725424 | | | | | | | | |
5.500%, 04/01/34 | | | 9 | | | | 10 | |
FNMA, Pool 735060 | | | | | | | | |
6.000%, 11/01/34 | | | 6 | | | | 7 | |
FNMA, Pool 735228 | | | | | | | | |
5.500%, 02/01/35 | | | 5 | | | | 5 | |
FNMA, Pool 735230 | | | | | | | | |
5.500%, 02/01/35 | | | 12 | | | | 13 | |
FNMA, Pool 745275 | | | | | | | | |
5.000%, 02/01/36 | | | 46 | | | | 50 | |
FNMA, Pool 745418 | | | | | | | | |
5.500%, 04/01/36 | | | 51 | | | | 56 | |
FNMA, Pool 827223 | | | | | | | | |
3.840%, VAR ICE LIBOR USD 12 Month+1.465%, 04/01/35 | | | 16 | | | | 17 | |
FNMA, Pool 844809 | | | | | | | | |
5.000%, 11/01/35 | | | 18 | | | | 20 | |
FNMA, Pool AD0454 | | | | | | | | |
5.000%, 11/01/21 | | | 1 | | | | 1 | |
FNMA, Pool AD8522 | | | | | | | | |
4.000%, 08/01/40 | | | 20 | | | | 21 | |
FNMA, Pool AE0828 | | | | | | | | |
3.500%, 02/01/41 | | | 190 | | | | 194 | |
FNMA, Pool AH0621 | | | | | | | | |
3.500%, 01/01/41 | | | 46 | | | | 47 | |
FNMA, Pool AJ1407 | | | | | | | | |
4.000%, 09/01/41 | | | 32 | | | | 33 | |
FNMA, Pool AJ7689 | | | | | | | | |
4.000%, 12/01/41 | | | 115 | | | | 120 | |
FNMA, Pool AK0971 | | | | | | | | |
3.000%, 02/01/27 | | | 63 | | | | 64 | |
FNMA, Pool AL5866 | | | | | | | | |
2.669%, 08/01/22 | | | 4,167 | | | | 4,189 | |
FNMA, Pool AO2970 | | | | | | | | |
3.000%, 05/01/42 | | | 128 | | | | 128 | |
See accompanying notes to financial statements.
CITY NATIONAL ROCHDALE FUNDS | PAGE 50
schedule of investments |
March 31, 2019 (Unaudited) |
City National Rochdale Intermediate Fixed Income Fund(continued) |
| Description | | Face Amount (000)/Shares | | | Value (000) | |
| FNMA, Pool AO4137 | | | | | | | | |
| 3.500%, 06/01/42 | | $ | 105 | | | $ | 108 | |
| FNMA, Pool MA1277 | | | | | | | | |
| 2.500%, 12/01/27 | | | 65 | | | | 65 | |
| GNMA, Pool G2 4696 | | | | | | | | |
| 4.500%, 05/20/40 | | | 58 | | | | 61 | |
| GNMA, Pool G2 4747 | | | | | | | | |
| 5.000%, 07/20/40 | | | 22 | | | | 24 | |
| GNMA, Pool G2 4923 | | | | | | | | |
| 4.500%, 01/20/41 | | | 36 | | | | 38 | |
| GNMA, Pool G2 MA0155 | | | | | | | | |
| 4.000%, 06/20/42 | | | 87 | | | | 90 | |
| GNMA, Pool G2 MA0392 | | | | | | | | |
| 3.500%, 09/20/42 | | | 111 | | | | 113 | |
| | | | | | | | | |
| Total U.S. Government Mortgage-Backed Obligations | | | | | | | | |
| (Cost $9,248) | | | | | | | 9,258 | |
| | | | | | | | | |
| Asset-Backed Securities [5.2%] | | | | | | | | |
| Bayview Financial Acquisition Trust, Ser 2007-A, Cl 1A2 | | | | | | | | |
| 6.205%, 05/28/37 | | | 19 | | | | 19 | |
| Cityscape Home Equity Loan Trust, Ser 1997-C, Cl A4 | | | | | | | | |
| 7.500%, 07/25/28(B) (D) | | | 5 | | | | 4 | |
| Ford Credit Floorplan Master Owner Trust, Ser 2016-3, Cl A1 | | | | | | | | |
| 1.550%, 07/15/19 | | | 4,000 | | | | 3,987 | |
| GMACM Mortgage Loan Trust, Ser 2004-GH1, Cl A6 | | | | | | | | |
| 4.810%, 07/25/35 | | | — | | | | — | |
| Nissan Auto Lease Trust, Ser 2017-B, Cl A3 | | | | | | | | |
| 2.050%, 09/15/20 | | | 4,000 | | | | 3,987 | |
| | | | | | | | | |
| Total Asset-Backed Securities | | | | | | | | |
| (Cost $8,022) | | | | | | | 7,997 | |
| | | | | | | | | |
| Closed-End Fund [2.1%] | | | | | | | | |
| Stone Ridge Reinsurance Risk Premium Interval Fund(D) | | | 387,609 | | | | 3,175 | |
| | | | | | | | | |
| Total Closed-End Fund | | | | | | | | |
| (Cost $3,911) | | | | | | | 3,175 | |
| Description | | Face Amount (000) | | | Value (000) | |
| Foreign Government Bond [0.7%] | | | | | | | | |
| Hashemite Kingdom of Jordan Government AID Bond | | | | | | | | |
| 2.578%, 06/30/22 | | $ | 1,000 | | | $ | 1,008 | |
| | | | | | | | | |
| Total Foreign Government Bond | | | | | | | | |
| (Cost $1,000) | | | | | | | 1,008 | |
| | | | | | | | | |
| Commercial Mortgage-Backed Obligations [0.5%] | | | | | | | | |
| Commercial Mortgage Trust, Ser 2012-CR2, Cl A4 | | | | | | | | |
| 3.147%, 08/15/45 | | | 125 | | | | 126 | |
| GS Mortgage Securities II, Ser 2012-GCJ9, Cl A3 | | | | | | | | |
| 2.773%, 11/10/45 | | | 274 | | | | 275 | |
| JPMorgan Chase Commercial Mortgage Securities Trust, Ser 2013-LC11, Cl A5 | | | | | | | | |
| 2.960%, 04/15/46 | | | 150 | | | | 151 | |
| Morgan Stanley Bank of America Merrill Lynch Trust, Ser 2012-C6, Cl A4 | | | | | | | | |
| 2.858%, 11/15/45 | | | 239 | | | | 239 | |
| | | | | | | | | |
| Total Commercial Mortgage-Backed Obligations | | | | | | | | |
| (Cost $798) | | | | | | | 791 | |
| | | | | | | | | |
| Residential Mortgage-Backed Securities [0.0%] | | | | | | | | |
| RAAC, Ser 2004-SP1, Cl AI4 | | | | | | | | |
| 5.285%, 08/25/27(E) | | | — | | | | — | |
| Residential Accredit Loans, Ser 2004-QS6, Cl A1 | | | | | | | | |
| 5.000%, 05/25/19 | | | 1 | | | | 1 | |
| Residential Asset Mortgage Products, Ser 2002-RS3, Cl AI5 | | | | | | | | |
| 5.572%, 06/25/32(E) | | | 15 | | | | 16 | |
| WaMu Mortgage Pass-Through Certificates Trust, Ser 2004-CB2, Cl 5A | | | | | | | | |
| 5.000%, 07/25/19 | | | — | | | | — | |
| | | | | | | | | |
| Total Residential Mortgage-Backed Securities | | | | | | | | |
| (Cost $17) | | | | | | | 17 | |
See accompanying notes to financial statements.
CITY NATIONAL ROCHDALE FUNDS | PAGE 51
schedule of investments |
March 31, 2019 (Unaudited) |
City National Rochdale Intermediate Fixed Income Fund(concluded) |
Description | | Shares | | | Value (000) | |
Short-Term Investment** [0.8%] |
SEI Daily Income Trust Government Fund, Cl F, 2.220% | | | 1,160,018 | | | $ | 1,160 | |
| | | | | | | | | |
Total Short-Term Investment |
(Cost $1,160) | | | 1,160 | |
| | | | | | | | | |
Total Investments [99.3%] |
(Cost $152,428) | | $ | 152,827 | |
| | | | | | | | | |
Percentages are based on net assets of $153,941 (000).
** | The rate reported is the 7-day effective yield as of March 31, 2019. |
(A) | Security exempt from registration under Rule 144A of the Securities Act of 1933. These securities may be resold in transactions exempt from registration normally to qualified institutions. On March 31, 2019, the value of these securities amounted to $5,666 (000), representing 3.7% of the net assets of the Fund. |
(B) | In default on interest payments. Rate shown represents the last coupon rate prior to default. |
(C) | Zero coupon security. The rate reported is the effective yield at time of purchase. |
(D) | Security is considered illiquid. The total market value of such security as of March 31, 2019, was $3,179 (000) and represented 2.1% of the net assets of the Fund. |
(E) | Variable or floating rate security, the interest rate of which adjusts periodically based on changes in current interest rates and prepayments on the underlying pool of assets. |
AID — Agency for International Development
Cl — Class
FHLMC — Federal Home Loan Mortgage Corporation
FNMA — Federal National Mortgage Association
GNMA — Government National Mortgage Association
GO — General Obligation
ICE — Intercontinental Exchange
LIBOR — London Interbank Offered Rates
MTN — Medium Term Note
RB — Revenue Bond
Ser — Series
TA — Tax Allocation
VAR — Variable
USD — U.S. Dollar
The following is a list of the inputs used as of March 31, 2019, in valuing the Fund’s investments carried at value (000):
Investments in Securities | | Level 1 | | | Level 2 | | | Level 3 | | | Total | |
Corporate Bonds | | $ | — | | | $ | 80,822 | | | $ | — | | | $ | 80,822 | |
Municipal Bonds | | | — | | | | 32,234 | | | | — | | | | 32,234 | |
U.S. Treasury Obligations | | | — | | | | 16,365 | | | | — | | | | 16,365 | |
U.S. Government Mortgage-Backed Obligations | | | — | | | | 9,258 | | | | — | | | | 9,258 | |
Asset-Backed Securities | | | — | | | | 7,997 | | | | — | | | | 7,997 | |
Closed-End Fund | | | 3,175 | | | | — | | | | — | | | | 3,175 | |
Foreign Government Bond | | | — | | | | 1,008 | | | | — | | | | 1,008 | |
Commercial Mortgage-Backed Obligations | | | — | | | | 791 | | | | — | | | | 791 | |
Residential Mortgage-Backed Securities | | | — | | | | 17 | | | | — | | | | 17 | |
Short-Term Investment | | | 1,160 | | | | — | | | | — | | | | 1,160 | |
Total Investments in Securities | | $ | 4,335 | | | $ | 148,492 | | | $ | — | | | $ | 152,827 | |
For the period ended March 31, 2019, there have been no transfers between any of the fair value hierarchy levels. Transfers between levels are recognized at period end.
Amounts designated as “—“ are $0 or have been rounded to $0.
For more information on valuation inputs, see Note 2 – Significant Accounting Policies in the Notes to Financial Statements.
See accompanying notes to financial statements.
CITY NATIONAL ROCHDALE FUNDS | PAGE 52
consolidated schedule of investments |
March 31, 2019 (Unaudited) |
City National Rochdale Fixed Income Opportunities Fund |
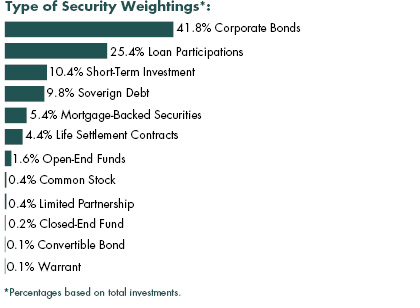
Description | | Face Amount (000)(1) | | | Value (000) | |
Corporate Bonds [41.3%] |
Advertising Sales [0.0%] |
Outfront Media Capital | | | | | | | | |
5.625%, 02/15/24 | | $ | 250 | | | $ | 257 | |
| | | | | | | | | |
Aerospace & Defense [0.4%] |
Quipor | | | | | | | | |
12.000%, 03/15/33 | | | 6,465 | | | | 6,924 | |
TransDigm | | | | | | | | |
6.500%, 07/15/24 | | | 250 | | | | 257 | |
6.500%, 05/15/25 | | | 1,825 | | | | 1,852 | |
6.375%, 06/15/26 | | | 425 | | | | 421 | |
6.250%, 03/15/26(A) | | | 1,125 | | | | 1,172 | |
6.000%, 07/15/22 | | | 950 | | | | 965 | |
| | | | | | | | | |
Total Aerospace & Defense | | | 11,591 | |
| | | | | | | | | |
Agricultural [0.0%] |
Mriya Farming, MTN | | | | | | | | |
2.000%, 09/30/19(A) (B) | | | 177 | | | | 13 | |
Mriya Recovery Certificates | | | | | | | | |
0.000%, 12/31/49 | | | — | | | | 36 | |
| | | | | | | | | |
Total Agricultural | | | | | | | 49 | |
| | | | | | | | | |
Airlines [0.7%] |
EA Partners I | | | | | | | | |
6.875%, 09/28/20 | | | 8,282 | | | | 4,707 | |
EA Partners II | | | | | | | | |
6.750%, 06/01/21(C) | | | 7,545 | | | | 3,833 | |
Gol Finance | | | | | | | | |
8.875%, 01/24/22 | | | 3,869 | | | | 3,932 | |
7.000%, 01/31/25 | | | 1,700 | | | | 1,583 | |
Guanay Finance | | | | | | | | |
6.000%, 12/15/20 | | | 13 | | | | 14 | |
SriLankan Airlines | | | | | | | | |
5.300%, 06/27/19 | | | 8,366 | | | | 8,331 | |
| | | | | | | | | |
Total Airlines | | | 22,400 | |
| | | | | | | | | |
Apparel/Textiles [0.0%] |
Hanesbrands | | | | | | | | |
4.875%, 05/15/26(A) | | | 250 | | | | 247 | |
William Carter | | | | | | | | |
5.625%, 03/15/27(A) | | | 125 | | | | 129 | |
| | | | | | | | | |
Total Apparel/Textiles | | | 376 | |
| | | | | | | | | |
Applications Software [0.1%] |
Nuance Communications | | | | | | | | |
6.000%, 07/01/24 | | | 750 | | | | 769 | |
5.625%, 12/15/26 | | | 700 | | | | 719 | |
SS&C Technologies | | | | | | | | |
5.500%, 09/30/27(A) | | | 1,050 | | | | 1,060 | |
| | | | | | | | | |
Total Applications Software | | | 2,548 | |
| | | | | | | | | |
Auto Rent & Lease [0.1%] |
United Rentals North America | | | | | | | | |
6.500%, 12/15/26 | | | 175 | | | | 184 | |
5.875%, 09/15/26 | | | 575 | | | | 594 | |
5.750%, 11/15/24 | | | 175 | | | | 180 | |
5.500%, 05/15/27 | | | 900 | | | | 909 | |
4.875%, 01/15/28 | | | 600 | | | | 584 | |
| | | | | | | | | |
Total Auto Rent & Lease | | | 2,451 | |
| | | | | | | | | |
Auto-Med and Heavy Duty Trks [0.0%] |
JB Poindexter | | | | | | | | |
7.125%, 04/15/26(A) | | | 550 | | | | 552 | |
| | | | | | | | | |
Automotive [0.0%] |
BCD Acquisition | | | | | | | | |
9.625%, 09/15/23(A) | | | 500 | | | | 530 | |
| | | | | | | | | |
Autoparts [0.2%] |
Adient Global Holdings | | | | | | | | |
4.875%, 08/15/26(A) | | | 1,600 | | | | 1,172 | |
American Axle & Manufacturing | | | | | | | | |
6.500%, 04/01/27 | | | 1,400 | | | | 1,355 | |
6.250%, 03/15/26 | | | 75 | | | | 72 | |
See accompanying notes to financial statements.
CITY NATIONAL ROCHDALE FUNDS | PAGE 53
consolidated schedule of investments |
March 31, 2019 (Unaudited) |
City National Rochdale Fixed Income Opportunities Fund(continued) |
Description | | Face Amount (000)(1) | | | Value (000) | |
Dana Financing Luxembourg Sarl | | | | | | | | |
6.500%, 06/01/26(A) | | $ | 1,250 | | | $ | 1,275 | |
5.750%, 04/15/25(A) | | | 300 | | | | 300 | |
IHO Verwaltungs GmbH | | | | | | | | |
4.750% cash/0% PIK, 09/15/26(A) | | | 1,875 | | | | 1,781 | |
Panther BF Aggregator 2 | | | | | | | | |
8.500%, 05/15/27(A) | | | 1,475 | | | | 1,479 | |
6.250%, 05/15/26(A) | | | 200 | | | | 204 | |
| | | | | | | | | |
Total Autoparts | | | 7,638 | |
| | | | | | | | | |
Banks [3.3%] |
African Bank, MTN | | | | | | | | |
8.125%, 10/19/20 | | | 7,972 | | | | 7,778 | |
Agromercantil Senior Trust | | | | | | | | |
6.250%, 04/10/19 | | | 2,134 | | | | 2,131 | |
Akbank T.A.S. | | | | | | | | |
6.797%, VAR USD Swap Semi 30/360 5 Yr Curr+4.029%, 04/27/28 | | | 5,775 | | | | 4,763 | |
Banco do Brasil | | | | | | | | |
6.250%, VAR US Treas Yield Curve Rate T Note Const Mat 10 Yr+4.398%, 12/12/49 | | | 8,145 | | | | 7,355 | |
Banco Mercantil del Norte | | | | | | | | |
6.875%, VAR US Treas Yield Curve Rate T Note Const Mat 5 Yr+5.035%, 10/06/67 | | | 2,070 | | | | 2,065 | |
Banco Nacional de Costa Rica | | | | | | | | |
5.875%, 04/25/21 | | | 200 | | | | 200 | |
Bank Nadra Via NDR Finance | | | | | | | | |
8.250%, 06/22/17(C) | | | 721 | | | | 4 | |
Bank of Georgia JSC | | | | | | | | |
11.125%, VAR USD Swap Semi 30/360 5 Yr Curr+8.717%, 12/28/67 | | | 8,600 | | | | 8,783 | |
Credit Bank of Moscow Via CBOM Finance | | | | | | | | |
7.500%, VAR USD Swap Semi 30/360 5 Yr Curr+5.416%, 10/05/27 | | | 5,885 | | | | 4,930 | |
5.875%, 11/07/21 | | | 970 | | | | 960 | |
5.150%, 02/20/24(A) | | EUR | 1,910 | | | | 2,162 | |
First Bank of Nigeria Via FBN Finance | | | | | | | | |
8.000%, VAR USD Swap Semi 30/360 2 Yr Curr+6.488%, 07/23/21 | | | 1,923 | | | | 1,930 | |
ForteBank JSC | | | | | | | | |
11.750%, 12/15/24 | | | 2,998 | | | | 3,303 | |
ICBC Standard Bank, MTN | | | | | | | | |
8.125%, 12/02/19 | | | 9,200 | | | | 9,435 | |
QNB Finansbank, MTN | | | | | | | | |
6.250%, 04/30/19 | | | 1,500 | | | | 1,498 | |
Tinkoff Bank JSC Via TCS Finance | | | | | | | | |
9.250%, VAR US Treas Yield Curve Rate T Note Const Mat 5 Yr+7.592%, 12/31/49 | | | 4,155 | | | | 4,284 | |
Turkiye Garanti Bankasi | | | | | | | | |
6.125%, VAR USD Swap Semi 30/360 5 Yr Curr+4.220%, 05/24/27 | | | 5,870 | | | | 4,972 | |
Turkiye Is Bankasi | | | | | | | | |
7.000%, VAR USD Swap Semi 30/360 5 Yr Curr+5.117%, 06/29/28 | | | 6,190 | | | | 4,503 | |
5.500%, 04/21/22 | | | 2,430 | | | | 2,199 | |
Turkiye Vakiflar Bankasi TAO | | | | | | | | |
8.125%, 03/28/24 | | | 1,000 | | | | 945 | |
8.125%, 03/28/24(A) | | | 3,900 | | | | 3,686 | |
Yapi ve Kredi Bankasi | | | | | | | | |
5.500%, 12/06/22 | | | 770 | | | | 650 | |
4.000%, 01/22/20 | | | 1,800 | | | | 1,741 | |
Yapi ve Kredi Bankasi, MTN | | | | | | | | |
8.250%, 10/15/24(A) | | | 4,700 | | | | 4,497 | |
5.850%, 06/21/24 | | | 2,410 | | | | 2,081 | |
Zenith Bank, MTN | | | | | | | | |
6.250%, 04/22/19 | | | 14,365 | | | | 14,350 | |
| | | | | | | | | |
Total Banks | | | 101,205 | |
| | | | | | | | | |
Batteries/Battery Sys [0.0%] |
Energizer Holdings | | | | | | | | |
7.750%, 01/15/27(A) | | | 925 | | | | 985 | |
6.375%, 07/15/26(A) | | | 300 | | | | 308 | |
5.500%, 06/15/25(A) | | | 175 | | | | 173 | |
| | | | | | | | | |
Total Batteries/Battery Sys | | | 1,466 | |
| | | | | | | | | |
Beauty Products [0.0%] |
First Quality Finance | | | | | | | | |
5.000%, 07/01/25(A) | | | 300 | | | | 292 | |
4.625%, 05/15/21(A) | | | 800 | | | | 798 | |
| | | | | | | | | |
Total Beauty Products | | | 1,090 | |
| | | | | | | | | |
See accompanying notes to financial statements.
CITY NATIONAL ROCHDALE FUNDS | PAGE 54
consolidated schedule of investments |
March 31, 2019 (Unaudited) |
City National Rochdale Fixed Income Opportunities Fund(continued) |
Description | | Face Amount (000)(1) | | | Value (000) | |
Broadcasting & Cable [1.9%] |
Altice | | | | | | | | |
7.750%, 05/15/22(A) | | $ | 450 | | | $ | 450 | |
7.625%, 02/15/25(A) | | | 1,350 | | | | 1,185 | |
Altice Financing | | | | | | | | |
7.500%, 05/15/26 | | | 14,980 | | | | 14,823 | |
AMC Networks | | | | | | | | |
5.000%, 04/01/24 | | | 1,400 | | | | 1,407 | |
4.750%, 08/01/25 | | | 100 | | | | 99 | |
Cablevision Systems | | | | | | | | |
5.875%, 09/15/22 | | | 950 | | | | 993 | |
CCO Holdings | | | | | | | | |
5.875%, 04/01/24(A) | | | 325 | | | | 340 | |
5.875%, 05/01/27(A) | | | 600 | | | | 623 | |
5.750%, 09/01/23 | | | 525 | | | | 535 | |
5.750%, 01/15/24 | | | 825 | | | | 847 | |
5.500%, 05/01/26(A) | | | 875 | | | | 903 | |
5.375%, 05/01/25(A) | | | 250 | | | | 258 | |
5.250%, 09/30/22 | | | 700 | | | | 713 | |
5.125%, 02/15/23 | | | 1,275 | | | | 1,297 | |
5.125%, 05/01/27(A) | | | 1,100 | | | | 1,107 | |
5.000%, 02/01/28(A) | | | 900 | | | | 888 | |
Clear Channel Worldwide Holdings | | | | | | | | |
6.500%, 11/15/22 | | | 1,250 | | | | 1,277 | |
CSC Holdings | | | | | | | | |
7.750%, 07/15/25(A) | | | 1,000 | | | | 1,072 | |
7.500%, 04/01/28(A) | | | 675 | | | | 723 | |
6.625%, 10/15/25(A) | | | 625 | | | | 663 | |
5.500%, 05/15/26(A) | | | 775 | | | | 797 | |
5.500%, 04/15/27(A) | | | 1,550 | | | | 1,583 | |
5.375%, 07/15/23(A) | | | 450 | | | | 458 | |
5.250%, 06/01/24 | | | 875 | | | | 888 | |
5.125%, 12/15/21(A) | | | 925 | | | | 926 | |
DISH DBS | | | | | | | | |
7.750%, 07/01/26 | | | 1,025 | | | | 892 | |
5.875%, 11/15/24 | | | 1,525 | | | | 1,281 | |
5.000%, 03/15/23 | | | 675 | | | | 607 | |
Gray Television | | | | | | | | |
5.875%, 07/15/26(A) | | | 1,275 | | | | 1,297 | |
5.125%, 10/15/24(A) | | | 450 | | | | 452 | |
iHeartCommunications | | | | | | | | |
9.000%, 03/01/21(C) | | | 1,150 | | | | 811 | |
Nexstar Broadcasting | | | | | | | | |
6.125%, 02/15/22(A) | | | 650 | | | | 660 | |
5.875%, 11/15/22 | | | 400 | | | | 410 | |
5.625%, 08/01/24(A) | | | 1,600 | | | | 1,624 | |
Sinclair Television Group | | | | | | | | |
5.875%, 03/15/26(A) | | | 1,050 | | | | 1,058 | |
5.625%, 08/01/24(A) | | | 1,075 | | | | 1,084 | |
5.125%, 02/15/27(A) | | | 500 | | | | 479 | |
TEGNA | | | | | | | | |
6.375%, 10/15/23 | | | 1,125 | | | | 1,162 | |
5.500%, 09/15/24(A) | | | 100 | | | | 101 | |
Telegraph Columbus | | | | | | | | |
3.875%, 05/02/25 | | EUR | 1,000 | | | | 1,002 | |
Telenet Finance Luxembourg Notes Sarl | | | | | | | | |
5.500%, 03/01/28(A) | | | 1,800 | | | | 1,764 | |
Tribune Media | | | | | | | | |
5.875%, 07/15/22 | | | 1,575 | | | | 1,607 | |
Unitymedia KabelBW GmbH | | | | | | | | |
6.125%, 01/15/25(A) | | | 1,675 | | | | 1,738 | |
Virgin Media Finance | | | | | | | | |
6.000%, 10/15/24(A) | | | 200 | | | | 207 | |
5.750%, 01/15/25(A) | | | 500 | | | | 508 | |
Virgin Media Secured Finance | | | | | | | | |
5.500%, 08/15/26(A) | | | 400 | | | | 407 | |
5.250%, 01/15/26(A) | | | 2,025 | | | | 2,038 | |
Ziggo Bond BV | | | | | | | | |
6.000%, 01/15/27(A) | | | 925 | | | | 888 | |
5.875%, 01/15/25(A) | | | 275 | | | | 271 | |
Ziggo BV | | | | | | | | |
5.500%, 01/15/27(A) | | | 1,325 | | | | 1,308 | |
| | | | | | | | | |
Total Broadcasting & Cable | | | 58,511 | |
| | | | | | | | | |
Building & Construction [0.4%] |
CIMPOR Financial Operations BV | | | | | | | | |
5.750%, 07/17/24 | | | 2,490 | | | | 2,207 | |
Hillman Group | | | | | | | | |
6.375%, 07/15/22(A) | | | 1,325 | | | | 1,186 | |
Masonite International | | | | | | | | |
5.750%, 09/15/26(A) | | | 175 | | | | 179 | |
5.625%, 03/15/23(A) | | | 325 | | | | 332 | |
NCI Building Systems | | | | | | | | |
8.000%, 04/15/26(A) | | | 1,050 | | | | 943 | |
Servicios Corporativos Javer | | | | | | | | |
9.875%, 04/06/21 | | | 500 | | | | 494 | |
Standard Industries | | | | | | | | |
6.000%, 10/15/25(A) | | | 950 | | | | 995 | |
5.000%, 02/15/27(A) | | | 1,475 | | | | 1,427 | |
USG | | | | | | | | |
4.875%, 06/01/27(A) | | | 175 | | | | 177 | |
Votorantim Cimentos International | | | | | | | | |
7.250%, 04/05/41 | | | 4,450 | | | | 5,123 | |
See accompanying notes to financial statements.
CITY NATIONAL ROCHDALE FUNDS | PAGE 55
consolidated schedule of investments |
March 31, 2019 (Unaudited) |
City National Rochdale Fixed Income Opportunities Fund(continued) |
Description | | Face Amount (000)(1) | | | Value (000) | |
Yuksel Insaat | | | | | | | | |
9.500%, 12/31/49(C) | | $ | 11,509 | | | $ | 632 | |
| | | | | | | | | |
Total Building & Construction | | | 13,695 | |
| | | | | | | | | |
Building & Construction Supplies [0.8%] |
CSN Islands XI | | | | | | | | |
6.875%, 09/21/19 | | | 16,120 | | | | 16,238 | |
CSN Islands XII | | | | | | | | |
7.000%, 12/23/66 | | | 10,333 | | | | 8,882 | |
| | | | | | | | | |
Total Building & Construction Supplies | | | 25,120 | |
| | | | | | | | | |
Building-Heavy Construct [1.0%] |
Andrade Gutierrez International | | | | | | | | |
11.000%, 08/20/21 | | | 25,911 | | | | 24,746 | |
11.000%, 08/20/21(A) | | | 7,148 | | | | 6,879 | |
| | | | | | | | | |
Total Building-Heavy Construct | | | 31,625 | |
| | | | | | | | | |
Cable Satellite [0.1%] |
United Group | | | | | | | | |
4.375%, 07/01/22 | | EUR | 1,700 | | | | 1,957 | |
| | | | | | | | | |
Chemicals [0.2%] |
Alpha 2 BV | | | | | | | | |
8.750% cash/0% PIK, 06/01/23(A) | | | 325 | | | | 316 | |
Alpha 3 | | | | | | | | |
6.250%, 02/01/25(A) | | | 1,475 | | | | 1,423 | |
Element Solutions | | | | | | | | |
5.875%, 12/01/25(A) | | | 450 | | | | 452 | |
Fire BC | | | | | | | | |
4.750%, VAR Euribor 3 Month+4.750%, 09/30/24 | | EUR | 505 | | | | 565 | |
Hexion | | | | | | | | |
6.625%, 04/15/20 | | | 1,600 | | | | 1,348 | |
PQ | | | | | | | | |
5.750%, 12/15/25(A) | | | 500 | | | | 487 | |
Starfruit Finco BV | | | | | | | | |
8.000%, 10/01/26(A) | | | 1,325 | | | | 1,335 | |
| | | | | | | | | |
Total Chemicals | | | 5,926 | |
| | | | | | | | | |
Circuit Boards [0.0%] |
TTM Technologies | | | | | | | | |
5.625%, 10/01/25(A) | | | 900 | | | | 865 | |
| | | | | | | | | |
Coal Mining [1.7%] |
DTEK Finance | | | | | | | | |
10.750% cash/0% PIK, 12/31/24 | | $ | 41,181 | | | | 41,132 | |
Energy Resources | | | | | | | | |
8.000%, VAR N/A+0.000%, 09/30/22 | | | 6,476 | | | | 6,793 | |
Mongolian Mining | | | | | | | | |
2.838%, VAR N/A+0.000%, 12/31/49 | | | 7,787 | | | | 3,917 | |
New World Resources | | | | | | | | |
8.000%, 04/07/20(C) | | EUR | 1,101 | | | | 37 | |
4.000% cash/0% PIK, 10/07/20(C) | | EUR | 380 | | | | 7 | |
Zhongrong International Resources | | | | | | | | |
7.250%, 10/26/20 | | | 2,030 | | | | 1,350 | |
| | | | | | | | | |
Total Coal Mining | | | 53,236 | |
| | | | | | | | | |
Commercial Serv-Finance [0.1%] |
Nexi Capital | | | | | | | | |
4.125%, 11/01/23 | | EUR | 980 | | | | 1,141 | |
3.625%, VAR Euribor 3 Month+3.625%, 05/01/23 | | EUR | 800 | | | | 907 | |
Refinitiv US Holdings | | | | | | | | |
8.250%, 11/15/26(A) | | | 1,575 | | | | 1,546 | |
6.250%, 05/15/26(A) | | | 300 | | | | 304 | |
| | | | | | | | | |
Total Commercial Serv-Finance | | | 3,898 | |
| | | | | | | | | |
Commercial Services [0.3%] |
Atento Luxco 1 | | | | | | | | |
6.125%, 08/10/22 | | | 5,500 | | | | 5,464 | |
Nielsen Finance | | | | | | | | |
5.000%, 04/15/22(A) | | | 850 | | | | 839 | |
Nielsen Luxembourg SARL | | | | | | | | |
5.000%, 02/01/25(A) | | | 450 | | | | 433 | |
Star Merger Sub | | | | | | | | |
10.250%, 02/15/27(A) | | | 1,725 | | | | 1,770 | |
6.875%, 08/15/26(A) | | | 425 | | | | 435 | |
| | | | | | | | | |
Total Commercial Services | | | 8,941 | |
| | | | | | | | | |
Computer Software [0.0%] |
Rackspace Hosting | | | | | | | | |
8.625%, 11/15/24(A) | | | 1,625 | | | | 1,448 | |
| | | | | | | | | |
Computer System Design & Services [0.1%] |
Banff Merger Sub | | | | | | | | |
9.750%, 09/01/26(A) | | | 1,625 | | | | 1,576 | |
See accompanying notes to financial statements.
CITY NATIONAL ROCHDALE FUNDS | PAGE 56
consolidated schedule of investments |
March 31, 2019 (Unaudited) |
City National Rochdale Fixed Income Opportunities Fund(continued) |
Description | | Face Amount (000)(1) | | | Value (000) | |
Dell International | | | | | | | | |
7.125%, 06/15/24(A) | | $ | 1,700 | | | $ | 1,803 | |
NCR | | | | | | | | |
6.375%, 12/15/23 | | | 500 | | | | 514 | |
5.000%, 07/15/22 | | | 650 | | | | 648 | |
| | | | | | | | | |
Total Computer System Design & Services | | | 4,541 | |
| | | | | | | | | |
Computers-Memory Devices [0.0%] |
Western Digital | | | | | | | | |
4.750%, 02/15/26 | | | 600 | | | | 573 | |
| | | | | | | | | |
Consumer Products & Services [0.4%] |
EMI Music Publishing Group North America Holdings | | | | | | | | |
7.625%, 06/15/24(A) | | | 825 | | | | 875 | |
Prestige Brands | | | | | | | | |
6.375%, 03/01/24(A) | | | 1,675 | | | | 1,704 | |
5.375%, 12/15/21(A) | | | 1,675 | | | | 1,688 | |
Turkiye Sise ve Cam Fabrikalari | | | | | | | | |
6.950%, 03/14/26 | | | 2,040 | | | | 1,969 | |
4.250%, 05/09/20 | | | 5,788 | | | | 5,737 | |
| | | | | | | | | |
Total Consumer Products & Services | | | 11,973 | |
| | | | | | | | | |
Containers & Packaging [0.8%] |
ARD Finance | | | | | | | | |
7.125% cash/0% PIK, 09/15/23 | | | 1,600 | | | | 1,594 | |
Ardagh Packaging Finance | | | | | | | | |
7.250%, 05/15/24(A) | | | 1,875 | | | | 1,975 | |
6.000%, 02/15/25(A) | | | 650 | | | | 650 | |
Berry Global | | | | | | | | |
6.000%, 10/15/22 | | | 200 | | | | 206 | |
5.500%, 05/15/22 | | | 1,900 | | | | 1,928 | |
BWAY Holding | | | | | | | | |
7.250%, 04/15/25(A) | | | 2,850 | | | | 2,749 | |
5.500%, 04/15/24(A) | | | 1,050 | | | | 1,042 | |
Crown Americas | | | | | | | | |
4.750%, 02/01/26 | | | 650 | | | | 653 | |
4.250%, 09/30/26 | | | 75 | | | | 73 | |
Flex Acquisition | | | | | | | | |
7.875%, 07/15/26(A) | | | 750 | | | | 724 | |
6.875%, 01/15/25(A) | | | 2,825 | | | | 2,698 | |
Greif | | | | | | | | |
6.500%, 03/01/27(A) | | | 375 | | | | 383 | |
Guala Closures | | | | | | | | |
3.500%, VAR Euribor 3 Month+3.500%, 04/15/24 | | EUR | 250 | | | | 282 | |
Multi-Color | | | | | | | | |
6.125%, 12/01/22(A) | | | 1,550 | | | | 1,597 | |
4.875%, 11/01/25(A) | | | 375 | | | | 387 | |
Owens-Brockway Glass Container | | | | | | | | |
6.375%, 08/15/25(A) | | | 550 | | | | 579 | |
5.375%, 01/15/25(A) | | | 950 | | | | 967 | |
5.000%, 01/15/22(A) | | | 125 | | | | 128 | |
Pactiv | | | | | | | | |
7.950%, 12/15/25 | | | 75 | | | | 75 | |
Reynolds Group Issuer | | | | | | | | |
7.000%, 07/15/24(A) | | | 1,600 | | | | 1,648 | |
5.750%, 10/15/20 | | | 1,599 | | | | 1,601 | |
Sealed Air | | | | | | | | |
5.125%, 12/01/24(A) | | | 425 | | | | 440 | |
4.875%, 12/01/22(A) | | | 125 | | | | 129 | |
Trident Merger Sub | | | | | | | | |
6.625%, 11/01/25(A) | | | 1,075 | | | | 1,005 | |
| | | | | | | | | |
Total Containers & Packaging | | | 23,513 | |
| | | | | | | | | |
Data Processing/Mgmt [0.1%] |
First Data | | | | | | | | |
5.750%, 01/15/24(A) | | | 2,725 | | | | 2,802 | |
5.375%, 08/15/23(A) | | | 375 | | | | 383 | |
| | | | | | | | | |
Total Data Processing/Mgmt | | | 3,185 | |
| | | | | | | | | |
Diagnostic Equipment [0.2%] |
Avantor | | | | | | | | |
9.000%, 10/01/25(A) | | | 1,475 | | | | 1,598 | |
6.000%, 10/01/24(A) | | | 525 | | | | 545 | |
Ortho-Clinical Diagnostics | | | | | | | | |
6.625%, 05/15/22(A) | | | 3,250 | | | | 3,084 | |
| | | | | | | | | |
Total Diagnostic Equipment | | | 5,227 | |
| | | | | | | | | |
Disposable Medical Prod [0.1%] |
Sotera Health Holdings | | | | | | | | |
6.500%, 05/15/23(A) | | | 2,275 | | | | 2,292 | |
| | | | | | | | | |
Distribution/Wholesale [0.1%] |
American Builders & Contractors Supply | | | | | | | | |
5.875%, 05/15/26(A) | | | 1,275 | | | | 1,293 | |
5.750%, 12/15/23(A) | | | 200 | | | | 205 | |
Core & Main | | | | | | | | |
6.125%, 08/15/25(A) | | | 1,225 | | | | 1,198 | |
See accompanying notes to financial statements.
CITY NATIONAL ROCHDALE FUNDS | PAGE 57
consolidated schedule of investments |
March 31, 2019 (Unaudited) |
City National Rochdale Fixed Income Opportunities Fund(continued) |
Description | | Face Amount (000)(1) | | | Value (000) | |
KAR Auction Services | | | | | | | | |
5.125%, 06/01/25(A) | | $ | 700 | | | $ | 692 | |
| | | | | | | | | |
Total Distribution/Wholesale | | | 3,388 | |
| | | | | | | | | |
Diversified Minerals [0.1%] |
China Hongqiao Group | | | | | | | | |
6.850%, 04/22/19 | | | 1,100 | | | | 1,099 | |
Teck Resources | | | | | | | | |
6.125%, 10/01/35 | | | 875 | | | | 931 | |
| | | | | | | | | |
Total Diversified Minerals | | | 2,030 | |
| | | | | | | | | |
Diversified Operations [0.0%] |
Koppers | | | | | | | | |
6.000%, 02/15/25(A) | | | 1,300 | | | | 1,271 | |
| | | | | | | | | |
Drugs [1.1%] |
Bausch Health | | | | | | | | |
9.000%, 12/15/25(A) | | | 875 | | | | 950 | |
7.000%, 03/15/24(A) | | | 425 | | | | 450 | |
6.125%, 04/15/25(A) | | | 2,450 | | | | 2,425 | |
5.875%, 05/15/23(A) | | | 889 | | | | 900 | |
5.750%, 08/15/27(A) | | | 275 | | | | 282 | |
5.500%, 03/01/23(A) | | | 157 | | | | 158 | |
5.500%, 11/01/25(A) | | | 425 | | | | 434 | |
Bausch Health Americas | | | | | | | | |
9.250%, 04/01/26(A) | | | 300 | | | | 328 | |
8.500%, 01/31/27(A) | | | 1,125 | | | | 1,193 | |
Endo Dac | | | | | | | | |
6.000%, 07/15/23(A) | | | 410 | | | | 316 | |
6.000%, 02/01/25(A) | | | 2,200 | | | | 1,591 | |
Teva Pharmaceutical Finance | | | | | | | | |
6.150%, 02/01/36 | | | 4,580 | | | | 4,456 | |
Teva Pharmaceutical Finance Netherlands II BV | | | | | | | | |
4.500%, 03/01/25 | | EUR | 1,600 | | | | 1,862 | |
Teva Pharmaceutical Finance Netherlands III BV | | | | | | | | |
6.750%, 03/01/28 | | | 2,850 | | | | 2,876 | |
6.000%, 04/15/24 | | | 3,160 | | | | 3,172 | |
4.100%, 10/01/46 | | | 12,755 | | | | 9,078 | |
2.800%, 07/21/23 | | | 2,480 | | | | 2,214 | |
| | | | | | | | | |
Total Drugs | | | 32,685 | |
| | | | | | | | | |
E-Commerce/Services [0.0%] |
Match Group | | | | | | | | |
5.000%, 12/15/27(A) | | | 575 | | | | 579 | |
Electric Utilities [0.5%] |
AES Argentina Generacion | | | | | | | | |
7.750%, 02/02/24 | | | 132 | | | | 112 | |
Calpine | | | | | | | | |
5.875%, 01/15/24(A) | | | 375 | | | | 384 | |
5.750%, 01/15/25 | | | 1,275 | | | | 1,269 | |
5.250%, 06/01/26(A) | | | 175 | | | | 174 | |
Cometa Energia | | | | | | | | |
6.375%, 04/24/35 | | | 1,056 | | | | 1,036 | |
NRG Energy | | | | | | | | |
7.250%, 05/15/26 | | | 650 | | | | 715 | |
6.625%, 01/15/27 | | | 625 | | | | 673 | |
6.250%, 05/01/24 | | | 1,325 | | | | 1,368 | |
5.750%, 01/15/28 | | | 200 | | | | 212 | |
Pampa Energia | | | | | | | | |
7.500%, 01/24/27 | | | 2,090 | | | | 1,853 | |
7.375%, 07/21/23 | | | 3,665 | | | | 3,432 | |
Stoneway Capital | | | | | | | | |
10.000%, 03/01/27 | | | 2,494 | | | | 2,413 | |
Termocandelaria Power | | | | | | | | |
7.875%, 01/30/29 | | | 100 | | | | 105 | |
Vistra Operations | | | | | | | | |
5.625%, 02/15/27(A) | | | 800 | | | | 832 | |
5.500%, 09/01/26(A) | | | 400 | | | | 416 | |
| | | | | | | | | |
Total Electric Utilities | | | 14,994 | |
| | | | | | | | | |
Electrical Products [0.1%] |
WESCO Distribution | | | | | | | | |
5.375%, 12/15/21 | | | 1,275 | | | | 1,288 | |
5.375%, 06/15/24 | | | 775 | | | | 784 | |
| | | | | | | | | |
Total Electrical Products | | | 2,072 | |
| | | | | | | | | |
Electric-Distribution [0.0%] |
Comision Federal de Electricidad | | | | | | | | |
8.180%, 12/23/27 | | MXN | 8,240 | | | | 384 | |
Viridian Group FinanceCo | | | | | | | | |
4.000%, 09/15/25 | | EUR | 500 | | | | 556 | |
| | | | | | | | | |
Total Electric-Distribution | | | 940 | |
| | | | | | | | | |
Energy & Power [0.3%] |
Enviva Partners | | | | | | | | |
8.500%, 11/01/21 | | | 1,650 | | | | 1,720 | |
Rio Energy | | | | | | | | |
6.875%, 02/01/25 | | | 4,268 | | | | 3,228 | |
6.875%, 02/01/25(A) | | | 2,080 | | | | 1,583 | |
See accompanying notes to financial statements.
CITY NATIONAL ROCHDALE FUNDS | PAGE 58
consolidated schedule of investments |
March 31, 2019 (Unaudited) |
City National Rochdale Fixed Income Opportunities Fund(continued) |
Description | | Face Amount (000)(1) | | | Value (000) | |
TerraForm Power Operating | | | | | | | | |
6.625%, 06/15/25(A) | | $ | 700 | | | $ | 733 | |
5.000%, 01/31/28(A) | | | 875 | | | | 844 | |
4.250%, 01/31/23(A) | | | 100 | | | | 99 | |
| | | | | | | | | |
Total Energy & Power | | | 8,207 | |
| | | | | | | | | |
Enterprise Software/Serv [0.2%] |
HNA Ecotech Panorama Cayman | | | | | | | | |
8.000%, 04/15/21 | | | 105 | | | | 93 | |
Infor Software Parent | | | | | | | | |
7.125% cash/0% PIK, 05/01/21(A) | | | 1,025 | | | | 1,024 | |
Infor US | | | | | | | | |
6.500%, 05/15/22 | | | 2,350 | | | | 2,382 | |
Informatica | | | | | | | | |
7.125%, 07/15/23(A) | | | 1,600 | | | | 1,630 | |
Riverbed Technology | | | | | | | | |
8.875%, 03/01/23(A) | | | 875 | | | | 661 | |
Sophia | | | | | | | | |
9.000%, 09/30/23(A) | | | 625 | | | | 648 | |
| | | | | | | | | |
Total Enterprise Software/Serv | | | 6,438 | |
| | | | | | | | | |
Entertainment & Gaming [0.4%] |
Boyd Gaming | | | | | | | | |
6.875%, 05/15/23 | | | 1,125 | | | | 1,169 | |
6.375%, 04/01/26 | | | 300 | | | | 310 | |
Caesars Resort Collection | | | | | | | | |
5.250%, 10/15/25(A) | | | 1,950 | | | | 1,878 | |
Eldorado Resorts | | | | | | | | |
6.000%, 04/01/25 | | | 1,175 | | | | 1,190 | |
Gamenet Group | | | | | | | | |
5.125%, VAR Euribor 3 Month+5.125%, 04/27/23 | | EUR | 265 | | | | 300 | |
MGM Resorts International | | | | | | | | |
7.750%, 03/15/22 | | | 75 | | | | 83 | |
6.750%, 10/01/20 | | | 250 | | | | 262 | |
6.000%, 03/15/23 | | | 500 | | | | 528 | |
5.750%, 06/15/25 | | | 975 | | | | 1,009 | |
5.500%, 04/15/27 | | | 400 | | | | 404 | |
4.625%, 09/01/26 | | | 250 | | | | 243 | |
Mohegan Gaming & Entertainment | | | | | | | | |
7.875%, 10/15/24(A) | | | 1,025 | | | | 1,015 | |
Penn National Gaming | | | | | | | | |
5.625%, 01/15/27(A) | | | 675 | | | | 656 | |
Rivers Pittsburgh Borrower | | | | | | | | |
6.125%, 08/15/21(A) | | | 1,425 | | | | 1,425 | |
Stars Group Holdings BV | | | | | | | | |
7.000%, 07/15/26(A) | | | 1,425 | | | | 1,486 | |
Station Casinos | | | | | | | | |
5.000%, 10/01/25(A) | | | 1,025 | | | | 1,004 | |
Sugarhouse HSP Gaming Prop Mezz | | | | | | | | |
5.875%, 05/15/25(A) | | | 850 | | | | 840 | |
| | | | | | | | | |
Total Entertainment & Gaming | | | 13,802 | |
| | | | | | | | | |
Export/Import Bank [0.2%] |
Ukreximbank Via Biz Finance | | | | | | | | |
16.500%, 03/02/21 | | UAH | 170,000 | | | | 5,657 | |
9.750%, 01/22/25 | | | 1,000 | | | | 1,011 | |
| | | | | | | | | |
Total Export/Import Bank | | | 6,668 | |
| | | | | | | | | |
Financial Services [1.0%] |
Ally Financial | | | | | | | | |
5.750%, 11/20/25 | | | 1,625 | | | | 1,731 | |
Amigo Luxembourg | | | | | | | | |
7.625%, 01/15/24 | | GBP | 350 | | | | 452 | |
Arrow Global Finance | | | | | | | | |
3.750%, VAR Euribor 3 Month+3.750%, 03/01/26 | | EUR | 500 | | | | 542 | |
Cabot Financial Luxembourg II | | | | | | | | |
5.875%, VAR Euribor 3 Month+5.875%, 11/15/21 | | EUR | 1,000 | | | | 1,118 | |
Credivalores-Crediservicios SAS | | | | | | | | |
9.750%, 07/27/22 | | | 3,764 | | | | 3,604 | |
Fondo MIVIVIENDA | | | | | | | | |
7.000%, 02/14/24 | | PEN | 1,406 | | | | 456,214 | |
Louvre Bidco SAS | | | | | | | | |
4.250%, 09/30/24 | | EUR | 2,200 | | | | 2,375 | |
Navient | | | | | | | | |
7.250%, 09/25/23 | | | 200 | | | | 211 | |
6.750%, 06/25/25 | | | 225 | | | | 223 | |
6.750%, 06/15/26 | | | 200 | | | | 192 | |
5.875%, 10/25/24 | | | 1,800 | | | | 1,741 | |
Navient, MTN | | | | | | | | |
6.125%, 03/25/24 | | | 975 | | | | 974 | |
Oilflow SPV 1 DAC | | | | | | | | |
12.000%, 01/13/22 | | | 64 | | | | 66 | |
See accompanying notes to financial statements.
CITY NATIONAL ROCHDALE FUNDS | PAGE 59
consolidated schedule of investments |
March 31, 2019 (Unaudited) |
City National Rochdale Fixed Income Opportunities Fund(continued) |
Description | | Face Amount (000)(1) | | | Value (000) | |
Quicken Loans | | | | | | | | |
5.750%, 05/01/25(A) | | $ | 2,300 | | | $ | 2,308 | |
5.250%, 01/15/28(A) | | | 300 | | | | 281 | |
REC, MTN | | | | | | | | |
5.250%, 11/13/23 | | | 4,000 | | | | 4,205 | |
3.875%, 07/07/27 | | | 1,500 | | | | 1,416 | |
Resideo Funding | | | | | | | | |
6.125%, 11/01/26(A) | | | 300 | | | | 309 | |
Tempo Acquisition | | | | | | | | |
6.750%, 06/01/25(A) | | | 2,500 | | | | 2,519 | |
Unifin Financiera SOFOM ENR | | | | | | | | |
7.375%, 02/12/26 | | | 40 | | | | 37 | |
7.000%, 01/15/25 | | | 7,639 | | | | 7,181 | |
Vantiv | | | | | | | | |
4.375%, 11/15/25(A) | | | 200 | | | | 206 | |
| | | | | | | | | |
Total Financial Services | | | 32,148 | |
| | | | | | | | | |
Food, Beverage & Tobacco [1.3%] |
Ajecorp BV | | | | | | | | |
6.500%, 05/14/22 | | | 6,215 | | | | 5,228 | |
B&G Foods | | | | | | | | |
5.250%, 04/01/25 | | | 1,375 | | | | 1,318 | |
CEDC Finance International | | | | | | | | |
10.000%, 12/31/22(A) | | | 7,230 | | | | 4,953 | |
MARB BondCo | | | | | | | | |
7.000%, 03/15/24 | | | 500 | | | | 496 | |
Marfrig Holdings Europe | | | | | | | | |
8.000%, 06/08/23 | | | 3,345 | | | | 3,462 | |
Marfrig Holdings Europe BV | | | | | | | | |
6.875%, 06/24/19 | | | 3,050 | | | | 3,066 | |
MHP | | | | | | | | |
8.250%, 04/02/20 | | | 15,626 | | | | 15,967 | |
7.750%, 05/10/24 | | | 100 | | | | 101 | |
Minerva Luxembourg | | | | | | | | |
6.500%, 09/20/26 | | | 1,025 | | | | 1,021 | |
Post Holdings | | | | | | | | |
5.750%, 03/01/27(A) | | | 900 | | | | 903 | |
5.625%, 01/15/28(A) | | | 575 | | | | 571 | |
5.500%, 03/01/25(A) | | | 275 | | | | 278 | |
5.000%, 08/15/26(A) | | | 2,125 | | | | 2,067 | |
TBLA International Pte | | | | | | | | |
7.000%, 01/24/23 | | | 2,155 | | | | 2,125 | |
| | | | | | | | | |
Total Food, Beverage & Tobacco | | | 41,556 | |
| | | | | | | | | |
Food-Catering [0.1%] |
Aramark Services | | | | | | | | |
5.125%, 01/15/24 | | | 1,075 | | | | 1,103 | |
5.000%, 04/01/25(A) | | | 625 | | | | 640 | |
5.000%, 02/01/28(A) | | | 725 | | | | 722 | |
| | | | | | | | | |
Total Food-Catering | | | 2,465 | |
| | | | | | | | | |
Food-Wholesale/Distrib [0.1%] |
US Foods | | | | | | | | |
5.875%, 06/15/24(A) | | | 1,450 | | | | 1,481 | |
| | | | | | | | | |
Foreign Governments [0.0%] |
Republic of Angola Via Northern Lights III BV | | | | | | | | |
7.000%, 08/17/19 | | | 106 | | | | 107 | |
| | | | | | | | | |
Gas-Distribution [0.1%] |
AmeriGas Partners | | | | | | | | |
5.875%, 08/20/26 | | | 650 | | | | 649 | |
5.750%, 05/20/27 | | | 925 | | | | 913 | |
5.500%, 05/20/25 | | | 375 | | | | 374 | |
| | | | | | | | | |
Total Gas-Distribution | | | 1,936 | |
| | | | | | | | | |
Hazardous Waste Disposal [0.0%] |
Tervita Escrow | | | | | | | | |
7.625%, 12/01/21(A) | | | 1,300 | | | | 1,290 | |
| | | | | | | | | |
Hotels and Motels [0.2%] |
Grupo Posadas | | | | | | | | |
7.875%, 06/30/22 | | | 5,390 | | | | 5,437 | |
Hilton Domestic Operating | | | | | | | | |
5.125%, 05/01/26(A) | | | 900 | | | | 915 | |
Wyndham Hotels & Resorts | | | | | | | | |
5.375%, 04/15/26(A) | | | 475 | | | | 482 | |
| | | | | | | | | |
Total Hotels and Motels | | | 6,834 | |
| | | | | | | | | |
Human Resources [0.1%] |
Team Health Holdings | | | | | | | | |
6.375%, 02/01/25(A) | | | 3,050 | | | | 2,482 | |
| | | | | | | | | |
Industrial [0.0%] |
Reward International Investment | | | | | | | | |
7.250%, 01/25/20(C) | | | 4,152 | | | | 925 | |
| | | | | | | | | |
See accompanying notes to financial statements.
CITY NATIONAL ROCHDALE FUNDS | PAGE 60
consolidated schedule of investments |
March 31, 2019 (Unaudited) |
City National Rochdale Fixed Income Opportunities Fund(continued) |
Description | | Face Amount (000)(1) | | | Value (000) | |
Insurance [0.2%] |
Ardonagh Midco 3 | | | | | | | | |
8.625%, 07/15/23(A) | | $ | 1,375 | | | $ | 1,176 | |
HUB International | | | | | | | | |
7.000%, 05/01/26(A) | | | 3,350 | | | | 3,317 | |
USI | | | | | | | | |
6.875%, 05/01/25(A) | | | 1,725 | | | | 1,675 | |
| | | | | | | | | |
Total Insurance | | | 6,168 | |
| | | | | | | | | |
Internet Connectiv Svcs [0.0%] |
United Group | | | | | | | | |
4.875%, 07/01/24 | | EUR | 1,150 | | | | 1,318 | |
| | | | | | | | | |
Investment Bank/Broker-Dealer [0.1%] |
NFP | | | | | | | | |
6.875%, 07/15/25(A) | | | 1,625 | | | | 1,552 | |
| | | | | | | | | |
Investment Companies [0.2%] |
Aabar Investments PJSC, MTN | | | | | | | | |
1.000%, 03/27/22 | | EUR | 3,500 | | | | 3,540 | |
Unigel Luxembourg | | | | | | | | |
10.500%, 01/22/24 | | | 3,600 | | | | 3,888 | |
| | | | | | | | | |
Total Investment Companies | | | 7,428 | |
| | | | | | | | | |
Mach Tools and Rel Products [0.0%] |
Colfax | | | | | | | | |
6.375%, 02/15/26(A) | | | 200 | | | | 213 | |
6.000%, 02/15/24(A) | | | 250 | | | | 260 | |
| | | | | | | | | |
Total Mach Tools and Rel Products | | | 473 | |
| | | | | | | | | |
Machinery-General Indust [0.0%] |
Stevens Holding | | | | | | | | |
6.125%, 10/01/26(A) | | | 225 | | | | 232 | |
| | | | | | | | | |
Machinery-Pumps [0.0%] |
Titan Acquisition | | | | | | | | |
7.750%, 04/15/26(A) | | | 900 | | | | 776 | |
| | | | | | | | | |
Medical Information Sys [0.0%] |
IQVIA | | | | | | | | |
5.000%, 10/15/26(A) | | | 975 | | | | 998 | |
| | | | | | | | | |
Medical Labs and Testing Srv [0.1%] |
Charles River Laboratories International | | | | | | | | |
5.500%, 04/01/26(A) | | | 325 | | | | 337 | |
Envision Healthcare | | | | | | | | |
8.750%, 10/15/26(A) | | | 1,250 | | | | 1,114 | |
MEDNAX | | | | | | | | |
6.250%, 01/15/27(A) | | | 875 | | | | 884 | |
West Street Merger Sub | | | | | | | | |
6.375%, 09/01/25(A) | | | 1,800 | | | | 1,751 | |
| | | | | | | | | |
Total Medical Labs and Testing Srv | | | 4,086 | |
| | | | | | | | | |
Medical Products & Services [0.7%] |
3AB Optique Developpement SAS | | | | | | | | |
4.125%, VAR Euribor 3 Month+4.125%, 10/01/23 | | EUR | 450 | | | | 499 | |
4.000%, 10/01/23 | | EUR | 450 | | | | 501 | |
Acadia Healthcare | | | | | | | | |
6.500%, 03/01/24 | | | 2,000 | | | | 2,050 | |
Bio City Development | | | | | | | | |
8.000%, 07/06/18 | | | 1,000 | | | | 150 | |
CHS | | | | | | | | |
8.625%, 01/15/24(A) | | | 100 | | | | 100 | |
8.000%, 03/15/26(A) | | | 400 | | | | 384 | |
6.875%, 02/01/22 | | | 975 | | | | 648 | |
6.250%, 03/31/23 | | | 1,025 | | | | 965 | |
HCA | | | | | | | | |
5.875%, 05/01/23 | | | 825 | | | | 880 | |
5.875%, 02/15/26 | | | 675 | | | | 729 | |
5.875%, 02/01/29 | | | 350 | | | | 377 | |
5.625%, 09/01/28 | | | 425 | | | | 449 | |
5.375%, 02/01/25 | | | 1,975 | | | | 2,093 | |
5.375%, 09/01/26 | | | 150 | | | | 158 | |
5.000%, 03/15/24 | | | 1,175 | | | | 1,246 | |
HCA Healthcare | | | | | | | | |
6.250%, 02/15/21 | | | 550 | | | | 578 | |
Mallinckrodt International Finance | | | | | | | | |
5.625%, 10/15/23(A) | | | 750 | | | | 623 | |
5.500%, 04/15/25(A) | | | 2,575 | | | | 2,008 | |
RegionalCare Hospital Partners Holdings | | | | | | | | |
9.750%, 12/01/26(A) | | | 1,250 | | | | 1,297 | |
Sterigenics-Nordion Topco | | | | | | | | |
8.125% cash/0% PIK, 11/01/21(A) | | | 1,275 | | | | 1,259 | |
Surgery Center Holdings | | | | | | | | |
6.750%, 07/01/25(A) | | | 1,200 | | | | 1,086 | |
Teleflex | | | | | | | | |
5.250%, 06/15/24 | | | 275 | | | | 281 | |
4.875%, 06/01/26 | | | 675 | | | | 688 | |
4.625%, 11/15/27 | | | 125 | | | | 124 | |
See accompanying notes to financial statements.
CITY NATIONAL ROCHDALE FUNDS | PAGE 61
consolidated schedule of investments |
March 31, 2019 (Unaudited) |
City National Rochdale Fixed Income Opportunities Fund(continued) |
Description | | Face Amount (000)(1) | | | Value (000) | |
Tenet Healthcare | | | | | | | | |
7.000%, 08/01/25 | | $ | 200 | | | $ | 202 | |
6.750%, 06/15/23 | | | 1,600 | | | | 1,648 | |
5.125%, 05/01/25 | | | 1,025 | | | | 1,030 | |
4.625%, 07/15/24 | | | 375 | | | | 376 | |
4.375%, 10/01/21 | | | 300 | | | | 305 | |
| | | | | | | | | |
Total Medical Products & Services | | | 22,734 | |
| | | | | | | | | |
Medical-HMO [0.1%] |
Centene | | | | | | | | |
5.375%, 06/01/26(A) | | | 650 | | | | 678 | |
MPH Acquisition Holdings | | | | | | | | |
7.125%, 06/01/24(A) | | | 2,900 | | | | 2,893 | |
Polaris Intermediate | | | | | | | | |
8.500% cash/0% PIK, 12/01/22(A) | | | 675 | | | | 666 | |
WellCare Health Plans | | | | | | | | |
5.375%, 08/15/26(A) | | | 325 | | | | 340 | |
| | | | | | | | | |
Total Medical-HMO | | | 4,577 | |
| | | | | | | | | |
Medical-Outptnt/Home Med [0.1%] |
Air Medical Group Holdings | | | | | | | | |
6.375%, 05/15/23(A) | | | 1,800 | | | | 1,512 | |
| | | | | | | | | |
Medical-Whsle Drug Dist [0.1%] |
Vizient | | | | | | | | |
10.375%, 03/01/24(A) | | | 1,525 | | | | 1,657 | |
| | | | | | | | | |
Metal-Copper [0.1%] |
Freeport-McMoRan | | | | | | | | |
5.400%, 11/14/34 | | | 1,325 | | | | 1,206 | |
3.875%, 03/15/23 | | | 1,425 | | | | 1,404 | |
| | | | | | | | | |
Total Metal-Copper | | | 2,610 | |
| | | | | | | | | |
Metal-Iron [1.1%] |
Samarco Mineracao | | | | | | | | |
5.750%, 10/24/23(C) | | | 15,392 | | | | 10,245 | |
5.375%, 09/26/24(C) | | | 9,794 | | | | 6,471 | |
4.125%, 11/01/22(C) | | | 25,448 | | | | 16,340 | |
| | | | | | | | | |
Total Metal-Iron | | | 33,056 | |
| | | | | | | | | |
Metals & Mining [0.5%] |
Hudbay Minerals | | | | | | | | |
7.625%, 01/15/25(A) | | | 875 | | | | 898 | |
7.250%, 01/15/23(A) | | | 325 | | | | 337 | |
TiZir | | | | | | | | |
9.500%, 07/19/22(A) | | | 15,092 | | | | 15,805 | |
| | | | | | | | | |
Total Metals & Mining | | | 17,040 | |
| | | | | | | | | |
Miscellaneous Business Services [0.0%] |
Acosta | | | | | | | | |
7.750%, 10/01/22(A) | | | 1,550 | | | | 240 | |
Garda World Security | | | | | | | | |
8.750%, 05/15/25(A) | | | 1,200 | | | | 1,140 | |
| | | | | | | | | |
Total Miscellaneous Business Services | | | 1,380 | |
| | | | | | | | | |
Multi-line Insurance [0.1%] |
Acrisure | | | | | | | | |
8.125%, 02/15/24(A) | | | 400 | | | | 414 | |
7.000%, 11/15/25(A) | | | 1,275 | | | | 1,148 | |
| | | | | | | | | |
Total Multi-line Insurance | | | 1,562 | |
| | | | | | | | | |
Office Automation and Equip [0.0%] |
CDW | | | | | | | | |
5.500%, 12/01/24 | | | 575 | | | | 605 | |
5.000%, 09/01/25 | | | 125 | | | | 128 | |
| | | | | | | | | |
Total Office Automation and Equip | | | 733 | |
| | | | | | | | | |
Oil-Field Services [0.2%] |
Apergy | | | | | | | | |
6.375%, 05/01/26 | | | 175 | | | | 177 | |
Archrock Partners | | | | | | | | |
6.875%, 04/01/27(A) | | | 775 | | | | 790 | |
SESI | | | | | | | | |
7.750%, 09/15/24 | | | 1,375 | | | | 1,138 | |
7.125%, 12/15/21 | | | 625 | | | | 560 | |
USA Compression Partners | | | | | | | | |
6.875%, 04/01/26 | | | 1,025 | | | | 1,052 | |
6.875%, 09/01/27(A) | | | 600 | | | | 610 | |
Weatherford International | | | | | | | | |
8.250%, 06/15/23 | | | 750 | | | | 531 | |
7.000%, 03/15/38 | | | 500 | | | | 285 | |
| | | | | | | | | |
Total Oil-Field Services | | | 5,143 | |
| | | | | | | | | |
Oil-US Royalty Trusts [0.0%] |
Rio Oil Finance Trust, Ser 2014-1 | | | | | | | | |
9.250%, 07/06/24(A) | | | 63 | | | | 69 | |
| | | | | | | | | |
See accompanying notes to financial statements.
CITY NATIONAL ROCHDALE FUNDS | PAGE 62
consolidated schedule of investments |
March 31, 2019 (Unaudited) |
City National Rochdale Fixed Income Opportunities Fund(continued) |
Description | | Face Amount (000)(1) | | | Value (000) | |
Paper & Related Products [0.1%] |
Clearwater Paper | | | | | | | | |
5.375%, 02/01/25(A) | | $ | 2,075 | | | $ | 1,930 | |
| | | | | | | | | |
Petroleum & Fuel Products [9.1%] |
Andeavor Logistics | | | | | | | | |
6.250%, 10/15/22 | | | 362 | | | | 372 | |
Antero Midstream Partners | | | | | | | | |
5.750%, 03/01/27(A) | | | 150 | | | | 152 | |
5.375%, 09/15/24 | | | 1,300 | | | | 1,310 | |
Antero Resources | | | | | | | | |
5.625%, 06/01/23 | | | 325 | | | | 329 | |
5.000%, 03/01/25 | | | 350 | | | | 344 | |
Ascent Resources Utica Holdings | | | | | | | | |
10.000%, 04/01/22(A) | | | 375 | | | | 411 | |
Berry Petroleum | | | | | | | | |
7.000%, 02/15/26(A) | | | 550 | | | | 544 | |
Callon Petroleum | | | | | | | | |
6.375%, 07/01/26 | | | 175 | | | | 175 | |
6.125%, 10/01/24 | | | 1,155 | | | | 1,161 | |
Carrizo Oil & Gas | | | | | | | | |
8.250%, 07/15/25 | | | 325 | | | | 335 | |
6.250%, 04/15/23 | | | 675 | | | | 664 | |
Centennial Resource Production | | | | | | | | |
6.875%, 04/01/27(A) | | | 600 | | | | 606 | |
Cheniere Corpus Christi Holdings | | | | | | | | |
7.000%, 06/30/24 | | | 275 | | | | 310 | |
5.875%, 03/31/25 | | | 875 | | | | 952 | |
5.125%, 06/30/27 | | | 275 | | | | 288 | |
Cheniere Energy Partners | | | | | | | | |
5.625%, 10/01/26(A) | | | 100 | | | | 102 | |
5.250%, 10/01/25 | | | 1,550 | | | | 1,585 | |
Chesapeake Energy | | | | | | | | |
8.000%, 01/15/25 | | | 325 | | | | 332 | |
8.000%, 06/15/27 | | | 925 | | | | 911 | |
7.000%, 10/01/24 | | | 575 | | | | 574 | |
5.750%, 03/15/23 | | | 250 | | | | 244 | |
CNX Midstream Partners | | | | | | | | |
6.500%, 03/15/26(A) | | | 1,325 | | | | 1,282 | |
Constellation Oil Services Holding | | | | | | | | |
9.500%, 11/09/24 | | | 16,961 | | | | 6,276 | |
CrownRock | | | | | | | | |
5.625%, 10/15/25(A) | | | 1,600 | | | | 1,536 | |
CVR Refining | | | | | | | | |
6.500%, 11/01/22 | | | 1,725 | | | | 1,742 | |
DNO | | | | | | | | |
8.750%, 06/18/20(A) | | | 1,600 | | | | 1,644 | |
8.750%, 05/31/23(A) | | | 11,800 | | | | 12,127 | |
Endeavor Energy Resources | | | | | | | | |
5.750%, 01/30/28(A) | | | 425 | | | | 445 | |
5.500%, 01/30/26(A) | | | 75 | | | | 77 | |
Energy Transfer Operating | | | | | | | | |
5.875%, 01/15/24 | | | 350 | | | | 382 | |
EP Energy | | | | | | | | |
8.000%, 11/29/24(A) | | | 925 | | | | 513 | |
EP PetroEcuador via Noble Sovereign Funding I | | | | | | | | |
8.240%, VAR ICE LIBOR USD 3 Month+5.630%, 09/24/19 | | | 4,692 | | | | 4,733 | |
Faroe Petroleum | | | | | | | | |
8.000%, 04/28/23 | | | 5,200 | | | | 5,317 | |
Frontera Energy | | | | | | | | |
9.700%, 06/25/23 | | | 16,419 | | | | 17,203 | |
Genel Energy Finance 2 | | | | | | | | |
10.000%, 12/22/22(A) | | | 300 | | | | 315 | |
Gulfport Energy | | | | | | | | |
6.375%, 05/15/25 | | | 675 | | | | 611 | |
6.375%, 01/15/26 | | | 225 | | | | 199 | |
6.000%, 10/15/24 | | | 300 | | | | 272 | |
HKN Energy | | | | | | | | |
11.000%, 03/06/24 | | | 11,800 | | | | 11,918 | |
Holly Energy Partners | | | | | | | | |
6.000%, 08/01/24(A) | | | 1,625 | | | | 1,677 | |
Jagged Peak Energy | | | | | | | | |
5.875%, 05/01/26 | | | 500 | | | | 496 | |
Kosmos Energy | | | | | | | | |
7.125%, 04/04/26 | | | 10,000 | | | | 9,910 | |
Kuwait Energy | | | | | | | | |
9.500%, 08/04/19 | | | 25,432 | | | | 24,673 | |
Laredo Petroleum | | | | | | | | |
6.250%, 03/15/23 | | | 200 | | | | 178 | |
5.625%, 01/15/22 | | | 175 | | | | 160 | |
Latina Offshore | | | | | | | | |
8.875%, 10/03/19(A) (D) | | | 8,748 | | | | 7,174 | |
Nostrum Oil & Gas Finance | | | | | | | | |
8.000%, 07/25/22 | | | 2,500 | | | | 1,574 | |
Nostrum Oil & Gas Finance BV | | | | | | | | |
7.000%, 02/16/25 | | | 8,500 | | | | 5,171 | |
NuStar Logistics | | | | | | | | |
5.625%, 04/28/27 | | | 1,200 | | | | 1,198 | |
See accompanying notes to financial statements.
CITY NATIONAL ROCHDALE FUNDS | PAGE 63
consolidated schedule of investments |
March 31, 2019 (Unaudited) |
City National Rochdale Fixed Income Opportunities Fund(continued) |
Description | | Face Amount (000)(1) | | | Value (000) | |
Oasis Petroleum | | | | | | | | |
6.875%, 03/15/22 | | $ | 615 | | | $ | 621 | |
6.875%, 01/15/23 | | | 175 | | | | 175 | |
6.250%, 05/01/26(A) | | | 325 | | | | 310 | |
Odebrecht Drilling Norbe VIII | | | | | | | | |
7.350% cash/0% PIK, 12/01/26 | | | 15,846 | | | | 9,745 | |
Odebrecht Offshore Drilling Finance | | | | | | | | |
7.720% cash/0% PIK, 12/01/26 | | | 188 | | | | 47 | |
Offshore Drilling Holding | | | | | | | | |
8.375%, 09/20/20 | | | 22,045 | | | | 10,995 | |
Oilflow SPV 1 DAC | | | | | | | | |
12.000%, 01/13/22(A) | | | 7,005 | | | | 7,205 | |
Oro Negro Drilling Pte | | | | | | | | |
7.500%, 01/24/19(A) (C) | | | 3,177 | | | | 1,406 | |
Parsley Energy | | | | | | | | |
5.625%, 10/15/27(A) | | | 500 | | | | 498 | |
5.375%, 01/15/25(A) | | | 275 | | | | 274 | |
5.250%, 08/15/25(A) | | | 275 | | | | 271 | |
PDC Energy | | | | | | | | |
6.125%, 09/15/24 | | | 450 | | | | 450 | |
5.750%, 05/15/26 | | | 500 | | | | 489 | |
Petroamazonas EP | | | | | | | | |
4.625%, 02/16/20 | | | 5,051 | | | | 5,051 | |
4.625%, 11/06/20 | | | 3,361 | | | | 3,314 | |
Petrobras Global Finance | | | | | | | | |
6.875%, 01/20/40 | | | 3,825 | | | | 3,914 | |
6.850%, 06/05/15 | | | 14,423 | | | | 14,004 | |
Petrobras Global Finance BV | | | | | | | | |
5.999%, 01/27/28 | | | 1,675 | | | | 1,695 | |
Petroleos de Venezuela | | | | | | | | |
9.750%, 05/17/35(C) | | | 8,689 | | | | 2,493 | |
8.500%, 10/27/20 | | | 10,470 | | | | 9,370 | |
Petroleos Mexicanos | | | | | | | | |
7.190%, 09/12/24 | | MXN | 13,000 | | | | 561 | |
6.500%, 03/13/27 | | | 3,195 | | | | 3,225 | |
Petroleos Mexicanos, MTN | | | | | | | | |
6.750%, 09/21/47 | | | 3,485 | | | | 3,208 | |
Petroleum of Trinidad & Tobago | | | | | | | | |
9.750%, 08/14/19 | | | 28,140 | | | | 27,985 | |
6.000%, 05/08/22 | | | 9,283 | | | | 8,866 | |
Precision Drilling | | | | | | | | |
7.750%, 12/15/23 | | | 775 | | | | 796 | |
7.125%, 01/15/26(A) | | | 200 | | | | 198 | |
6.500%, 12/15/21 | | | 103 | | | | 104 | |
QEP Resources | | | | | | | | |
5.625%, 03/01/26 | | | 350 | | | | 317 | |
5.250%, 05/01/23 | | | 550 | | | | 518 | |
Range Resources | | | | | | | | |
5.000%, 03/15/23 | | | 250 | | | | 245 | |
4.875%, 05/15/25 | | | 847 | | | | 786 | |
ShaMaran Petroleum | | | | | | | | |
12.000%, 07/05/23(A) | | | 8,348 | | | | 8,325 | |
Shelf Drilling Holdings | | | | | | | | |
8.250%, 02/15/25(A) | | | 850 | | | | 808 | |
SM Energy | | | | | | | | |
6.750%, 09/15/26 | | | 350 | | | | 335 | |
6.625%, 01/15/27 | | | 125 | | | | 119 | |
5.625%, 06/01/25 | | | 375 | | | | 347 | |
5.000%, 01/15/24 | | | 175 | | | | 162 | |
Southwestern Energy | | | | | | | | |
7.750%, 10/01/27 | | | 725 | | | | 740 | |
SRC Energy | | | | | | | | |
6.250%, 12/01/25 | | | 925 | | | | 826 | |
Summit Midstream Holdings | | | | | | | | |
5.750%, 04/15/25 | | | 1,275 | | | | 1,202 | |
5.500%, 08/15/22 | | | 1,200 | | | | 1,188 | |
Sunoco | | | | | | | | |
5.875%, 03/15/28 | | | 325 | | | | 323 | |
5.500%, 02/15/26 | | | 325 | | | | 322 | |
4.875%, 01/15/23 | | | 75 | | | | 76 | |
Targa Resources Partners | | | | | | | | |
6.500%, 07/15/27(A) | | | 50 | | | | 54 | |
5.875%, 04/15/26(A) | | | 300 | | | | 317 | |
5.375%, 02/01/27 | | | 1,075 | | | | 1,099 | |
5.250%, 05/01/23 | | | 500 | | | | 509 | |
5.125%, 02/01/25 | | | 225 | | | | 229 | |
5.000%, 01/15/28 | | | 600 | | | | 592 | |
TransMontaigne Partners | | | | | | | | |
6.125%, 02/15/26 | | | 175 | | | | 165 | |
Ultra Resources | | | | | | | | |
7.125%, 04/15/25(A) | | | 750 | | | | 154 | |
6.875%, 04/15/22(A) | | | 225 | | | | 72 | |
Whiting Petroleum | | | | | | | | |
6.625%, 01/15/26 | | | 450 | | | | 441 | |
6.250%, 04/01/23 | | | 800 | | | | 804 | |
WPX Energy | | | | | | | | |
5.250%, 09/15/24 | | | 200 | | | | 202 | |
YPF | | | | | | | | |
8.750%, 04/04/24 | | | 6,770 | | | | 6,821 | |
8.500%, 07/28/25 | | | 3,130 | | | | 3,083 | |
6.950%, 07/21/27 | | | 4,510 | | | | 4,022 | |
See accompanying notes to financial statements.
CITY NATIONAL ROCHDALE FUNDS | PAGE 64
consolidated schedule of investments |
March 31, 2019 (Unaudited) |
City National Rochdale Fixed Income Opportunities Fund(continued) |
Description | | Face Amount (000)(1) | | | Value (000) | |
YPF, MTN | | | | | | | | |
51.729%, VAR 30-35d Argentina BADLAR Private Banks+4.000%, 07/07/20 | | $ | 1,000 | | | $ | 401 | |
| | | | | | | | | |
Total Petroleum & Fuel Products | | | 283,378 | |
| | | | | | | | | |
Precious Metals [0.0%] |
Coeur Mining | | | | | | | | |
5.875%, 06/01/24 | | | 975 | | | | 938 | |
| | | | | | | | | |
Property/Casualty Ins [0.1%] |
AmWINS Group | | | | | | | | |
7.750%, 07/01/26(A) | | | 1,150 | | | | 1,147 | |
AssuredPartners | | | | | | | | |
7.000%, 08/15/25(A) | | | 1,500 | | | | 1,388 | |
| | | | | | | | | |
Total Property/Casualty Ins | | | 2,535 | |
| | | | | | | | | |
Quarrying [0.0%] |
Compass Minerals International | | | | | | | | |
4.875%, 07/15/24(A) | | | 1,200 | | | | 1,122 | |
| | | | | | | | | |
Radio [0.2%] |
CBS Radio | | | | | | | | |
7.250%, 11/01/24(A) | | | 900 | | | | 895 | |
Sirius XM Radio | | | | | | | | |
6.000%, 07/15/24(A) | | | 975 | | | | 1,010 | |
5.375%, 04/15/25(A) | | | 1,100 | | | | 1,129 | |
5.375%, 07/15/26(A) | | | 525 | | | | 536 | |
4.625%, 05/15/23(A) | | | 400 | | | | 405 | |
Urban One | | | | | | | | |
7.375%, 04/15/22(A) | | | 775 | | | | 748 | |
| | | | | | | | | |
Total Radio | | | 4,723 | |
| | | | | | | | | |
Real Estate Investment Trusts [0.1%] |
MGM Growth Properties Operating Partnership | | | | | | | | |
5.625%, 05/01/24 | | | 425 | | | | 442 | |
Trust F/1401 | | | | | | | | |
6.950%, 01/30/44 | | | 2,215 | | | | 2,323 | |
| | | | | | | | | |
Total Real Estate Investment Trusts | | | 2,765 | |
| | | | | | | | | |
Real Estate Oper/Develop [1.4%] |
Central China Real Estate | | | | | | | | |
8.750%, 01/23/21 | | | 970 | | | | 1,009 | |
6.500%, 03/05/21 | | | 2,230 | | | | 2,233 | |
CFLD Cayman Investment | | | | | | | | |
6.500%, 12/21/20 | | | 1,570 | | | | 1,571 | |
China Evergrande Group | | | | | | | | |
8.750%, 06/28/25 | | | 2,385 | | | | 2,266 | |
7.500%, 06/28/23 | | | 4,375 | | | | 4,138 | |
Ezdan Sukuk | | | | | | | | |
4.875%, 04/05/22 | | | 2,170 | | | | 1,891 | |
4.375%, 05/18/21 | | | 3,545 | | | | 3,130 | |
Global Prime Capital Pte | | | | | | | | |
6.750%, 04/27/20 | | | 1,880 | | | | 1,891 | |
Haya Finance 2017 | | | | | | | | |
5.250%, 11/15/22 | | EUR | 3,410 | | | | 3,390 | |
5.125%, VAR Euribor 3 Month+5.125%, 11/15/22 | | EUR | 450 | | | | 447 | |
IRSA Propiedades Comerciales | | | | | | | | |
8.750%, 03/23/23 | | | 2,225 | | | | 2,155 | |
Jababeka International BV | | | | | | | | |
6.500%, 10/05/23 | | | 2,270 | | | | 2,167 | |
Kaisa Group Holdings | | | | | | | | |
8.500%, 06/30/22 | | | 3,165 | | | | 2,944 | |
7.250%, 06/30/20 | | | 3,285 | | | | 3,231 | |
KWG Group Holdings | | | | | | | | |
7.875%, 08/09/21 | | | 2,075 | | | | 2,159 | |
New Metro Global | | | | | | | | |
5.000%, 08/08/22 | | | 1,205 | | | | 1,151 | |
Scenery Journey | | | | | | | | |
11.000%, 11/06/20 | | | 2,200 | | | | 2,319 | |
Sunac China Holdings | | | | | | | | |
7.950%, 08/08/22 | | | 4,400 | | | | 4,500 | |
| | | | | | | | | |
Total Real Estate Oper/Develop | | | 42,592 | |
| | | | | | | | | |
Research and Development [0.1%] |
Jaguar Holding II | | | | | | | | |
6.375%, 08/01/23(A) | | | 3,575 | | | | 3,642 | |
| | | | | | | | | |
Resorts/Theme Parks [0.1%] |
Six Flags Entertainment | | | | | | | | |
5.500%, 04/15/27(A) | | | 1,925 | | | | 1,903 | |
| | | | | | | | | |
Retail [0.7%] |
1011778 BC ULC | | | | | | | | |
5.000%, 10/15/25(A) | | | 2,300 | | | | 2,272 | |
4.250%, 05/15/24(A) | | | 375 | | | | 371 | |
Albertsons | | | | | | | | |
7.500%, 03/15/26(A) | | | 550 | | | | 566 | |
6.625%, 06/15/24 | | | 825 | | | | 833 | |
5.750%, 03/15/25 | | | 1,750 | | | | 1,661 | |
See accompanying notes to financial statements.
CITY NATIONAL ROCHDALE FUNDS | PAGE 65
consolidated schedule of investments |
March 31, 2019 (Unaudited) |
City National Rochdale Fixed Income Opportunities Fund(continued) |
Description | | Face Amount (000)(1) | | | Value (000) | |
Eurotorg Via Bonitron DAC | | | | | | | | |
8.750%, 10/30/22 | | $ | 5,195 | | | $ | 5,348 | |
Ferrellgas | | | | | | | | |
6.750%, 01/15/22 | | | 775 | | | | 676 | |
6.750%, 06/15/23 | | | 725 | | | | 633 | |
6.500%, 05/01/21 | | | 675 | | | | 591 | |
IRSA Inversiones y Representaciones | | | | | | | | |
7.000%, 09/09/19 | | | 100 | | | | 99 | |
KFC Holding | | | | | | | | |
5.250%, 06/01/26(A) | | | 625 | | | | 631 | |
5.000%, 06/01/24(A) | | | 325 | | | | 331 | |
4.750%, 06/01/27(A) | | | 350 | | | | 344 | |
LSF10 Wolverine Investments SCA | | | | | | | | |
5.000%, 03/15/24 | | EUR | 500 | | | | 564 | |
Michaels Stores | | | | | | | | |
5.875%, 12/15/20(A) | | | 1,200 | | | | 1,202 | |
Party City Holdings | | | | | | | | |
6.625%, 08/01/26(A) | | | 300 | | | | 298 | |
6.125%, 08/15/23(A) | | | 1,650 | | | | 1,671 | |
PetSmart | | | | | | | | |
7.125%, 03/15/23(A) | | | 425 | | | | 317 | |
Rite Aid | | | | | | | | |
6.125%, 04/01/23(A) | | | 275 | | | | 227 | |
Suburban Propane Partners | | | | | | | | |
5.875%, 03/01/27 | | | 425 | | | | 403 | |
5.750%, 03/01/25 | | | 850 | | | | 822 | |
5.500%, 06/01/24 | | | 825 | | | | 804 | |
| | | | | | | | | |
Total Retail | | | 20,664 | |
| | | | | | | | | |
Rubber & Plastic [0.0%] |
Goodyear Tire & Rubber | | | | | | | | |
5.000%, 05/31/26 | | | 675 | | | | 644 | |
| | | | | | | | | |
Rubber/Plastic Products [0.0%] |
Gates Global | | | | | | | | |
6.000%, 07/15/22(A) | | | 1,299 | | | | 1,304 | |
| | | | | | | | | |
Semi-Conductors [0.1%] |
Entegris | | | | | | | | |
4.625%, 02/10/26(A) | | | 575 | | | | 569 | |
Sensata Technologies | | | | | | | | |
5.000%, 10/01/25(A) | | | 75 | | | | 77 | |
Sensata Technologies UK Financing | | | | | | | | |
6.250%, 02/15/26(A) | | | 225 | | | | 238 | |
Tunghsu Venus Holdings | | | | | | | | |
7.000%, 06/12/20 | | | 4,275 | | | | 2,994 | |
| | | | | | | | | |
Total Semi-Conductors | | | 3,878 | |
| | | | | | | | | |
Software Tools [0.1%] |
RP Crown Parent | | | | | | | | |
7.375%, 10/15/24(A) | | | 1,850 | | | | 1,896 | |
| | | | | | | | | |
Steel & Steel Works [2.5%] |
CSN Resources | | | | | | | | |
6.500%, 07/21/20 | | | 13,930 | | | | 13,924 | |
Ferrexpo Finance | | | | | | | | |
10.375%, 04/07/19 | | | 12,204 | | | | 12,191 | |
JSW Steel | | | | | | | | |
4.750%, 11/12/19 | | | 10,856 | | | | 10,852 | |
Metinvest BV | | | | | | | | |
8.500%, 04/23/26 | | | 22,018 | | | | 21,623 | |
7.750%, 04/23/23 | | | 19,438 | | | | 19,027 | |
Steel Dynamics | | | | | | | | |
5.500%, 10/01/24 | | | 200 | | | | 206 | |
| | | | | | | | | |
Total Steel & Steel Works | | | 77,823 | |
| | | | | | | | | |
Telecommunication Equip [0.1%] |
Anixter | | | | | | | | |
6.000%, 12/01/25(A) | | | 225 | | | | 236 | |
CommScope Technologies | | | | | | | | |
6.000%, 06/15/25(A) | | | 375 | | | | 365 | |
HTA Group | | | | | | | | |
9.125%, 03/08/22 | | | 2,735 | | | | 2,862 | |
| | | | | | | | | |
Total Telecommunication Equip | | | 3,463 | |
| | | | | | | | | |
Telephones & Telecommunications [3.8%] |
Altice France | | | | | | | | |
8.125%, 02/01/27(A) | | | 375 | | | | 379 | |
7.375%, 05/01/26(A) | | | 2,850 | | | | 2,793 | |
6.250%, 05/15/24(A) | | | 200 | | | | 202 | |
Banglalink Digital Communications | | | | | | | | |
8.625%, 05/06/19 | | | 21,375 | | | | 21,377 | |
Digicel | | | | | | | | |
6.000%, 04/15/21 | | | 19,265 | | | | 16,187 | |
Digicel Group One | | | | | | | | |
8.250%, 12/30/22(A) | | | 5,941 | | | | 3,653 | |
Digicel Group Two | | | | | | | | |
9.125%, 04/01/24(A) | | | 7,480 | | | | 2,057 | |
8.250%, 09/30/22(A) | | | 5,604 | | | | 1,919 | |
See accompanying notes to financial statements.
CITY NATIONAL ROCHDALE FUNDS | PAGE 66
consolidated schedule of investments |
March 31, 2019 (Unaudited) |
City National Rochdale Fixed Income Opportunities Fund(continued) |
Description | | Face Amount (000)(1) | | | Value (000) | |
Intelsat Jackson Holdings | | | | | | | | |
9.750%, 07/15/25(A) | | $ | 525 | | | $ | 533 | |
8.500%, 10/15/24(A) | | | 900 | | | | 875 | |
8.000%, 02/15/24(A) | | | 300 | | | | 313 | |
5.500%, 08/01/23 | | | 900 | | | | 799 | |
Liquid Telecommunications Financing | | | | | | | | |
8.500%, 07/13/22 | | | 2,660 | | | | 2,745 | |
Matterhorn Telecom | | | | | | | | |
4.000%, 11/15/27 | | EUR | 385 | | | | 417 | |
3.250%, VAR Euribor 3 Month+3.250%, 02/01/23 | | EUR | 143 | | | | 159 | |
Maxcom Telecomunicaciones | | | | | | | | |
0.000%, 06/15/20 | | | 9,000 | | | | 5,445 | |
Oi | | | | | | | | |
10.000% cash/0% PIK, 07/27/25 | | | 34,324 | | | | 36,176 | |
Oztel Holdings SPC | | | | | | | | |
6.625%, 04/24/28 | | | 4,280 | | | | 4,185 | |
Silknet JSC | | | | | | | | |
11.000%, 04/02/24 | | | 6,550 | | | | 6,585 | |
Sprint | | | | | | | | |
7.875%, 09/15/23 | | | 2,600 | | | | 2,724 | |
7.625%, 02/15/25 | | | 1,250 | | | | 1,275 | |
7.625%, 03/01/26 | | | 300 | | | | 304 | |
7.125%, 06/15/24 | | | 425 | | | | 431 | |
Sprint Capital | | | | | | | | |
6.875%, 11/15/28 | | | 1,200 | | | | 1,153 | |
Sprint Communications | | | | | | | | |
6.000%, 11/15/22 | | | 125 | | | | 126 | |
Telecom Argentina | | | | | | | | |
6.500%, 06/15/21 | | | 1,229 | | | | 1,229 | |
T-Mobile USA | | | | | | | | |
6.500%, 01/15/24 | | | 700 | | | | 727 | |
6.500%, 01/15/26 | | | 400 | | | | 427 | |
6.375%, 03/01/25 | | | 575 | | | | 599 | |
6.000%, 04/15/24 | | | 550 | | | | 571 | |
4.750%, 02/01/28 | | | 650 | | | | 644 | |
4.500%, 02/01/26 | | | 700 | | | | 700 | |
| | | | | | | | | |
Total Telephones & Telecommunications | | | 117,709 | |
| | | | | | | | | |
Textile-Products [0.1%] |
Grupo Kaltex | | | | | | | | |
8.875%, 04/11/22 | | | 140 | | | | 95 | |
Prime Bloom Holdings | | | | | | | | |
7.500%, 12/19/19 | | | 1,800 | | | | 1,744 | |
| | | | | | | | | |
Total Textile-Products | | | 1,839 | |
| | | | | | | | | |
Transactional Software [0.0%] |
Solera | | | | | | | | |
10.500%, 03/01/24(A) | | | 350 | | | | 379 | |
| | | | | | | | | |
Transportation Services [0.4%] |
Global Liman Isletmeleri | | | | | | | | |
8.125%, 11/14/21 | | | 12,490 | | | | 12,048 | |
Sabre GLBL | | | | | | | | |
5.375%, 04/15/23(A) | | | 375 | | | | 385 | |
VOC Escrow | | | | | | | | |
5.000%, 02/15/28(A) | | | 500 | | | | 486 | |
| | | | | | | | | |
Total Transportation Services | | | 12,919 | |
| | | | | | | | | |
Transport-Equip and Leasng [0.1%] |
Avolon Holdings Funding | | | | | | | | |
5.125%, 10/01/23(A) | | | 150 | | | | 153 | |
Park Aerospace Holdings | | | | | | | | |
5.500%, 02/15/24(A) | | | 2,975 | | | | 3,088 | |
5.250%, 08/15/22(A) | | | 625 | | | | 641 | |
4.500%, 03/15/23(A) | | | 150 | | | | 149 | |
| | | | | | | | | |
Total Transport-Equip and Leasng | | | 4,031 | |
| | | | | | | | | |
Total Corporate Bonds |
(Cost $1,340,127) | | | 1,300,157 | |
| | | | | | | | | |
Loan Participations [25.4%] |
Aerospace [0.6%] |
Air Canada, Term Loan B (2018) | | | | | | | | |
4.499%, VAR LIBOR+2.000%, 10/06/23 | | | 941 | | | | 938 | |
American Airlines Inc, 2017 Class B Term Loan | | | | | | | | |
4.484%, VAR LIBOR+2.000%, 12/14/23 | | | 774 | | | | 759 | |
American Airlines Inc, Term Loan B | | | | | | | | |
4.499%, VAR LIBOR+2.000%, 04/28/23 | | | 1,725 | | | | 1,690 | |
American Airlines Inc, Term Loan B (2017) | | | | | | | | |
4.493%, VAR LIBOR+2.000%, 10/10/21 | | | 1,294 | | | | 1,283 | |
See accompanying notes to financial statements.
CITY NATIONAL ROCHDALE FUNDS | PAGE 67
consolidated schedule of investments |
March 31, 2019 (Unaudited) |
City National Rochdale Fixed Income Opportunities Fund(continued) |
Description | | Face Amount (000)(1) | | | Value (000) | |
American Airlines Inc, Term Loan B (2018) | | | | | | | | |
4.240%, VAR LIBOR+1.750%, 06/27/25 | | $ | 535 | | | $ | 520 | |
Autokiniton US Holdings (L&W), Term Loan B | | | | | | | | |
6.499%, VAR LIBOR+4.000%, 05/17/25 | | | 437 | | | | 430 | |
Dae Aviation, Term Loan B, 1st Lien | | | | | | | | |
0.000%, 01/23/26(E) | | | 1,398 | | | | 1,398 | |
0.000%, 01/23/26(E) | | | 752 | | | | 751 | |
Ducommun Inc, Term Loan B | | | | | | | | |
6.499%, 11/21/25 | | | 810 | | | | 808 | |
MB Aerospace, Term Loan | | | | | | | | |
5.999%, VAR LIBOR+3.500%, 12/13/24 | | | 188 | | | | 181 | |
Science Applications International Corp (SAIC), Term Loan B (2018) | | | | | | | | |
4.249%, VAR LIBOR+1.750%, 11/05/25 | | | 958 | | | | 943 | |
StandardAero (Dae), Term Loan B | | | | | | | | |
6.250%, VAR LIBOR+3.750%, 07/07/22 | | | 3,780 | | | | 3,782 | |
Transdigm Inc., New Tranche E Term Loan (2018) | | | | | | | | |
4.999%, VAR LIBOR+2.500%, 05/30/25 | | | 2,055 | | | | 1,999 | |
Transdigm Inc., New Tranche F Term Loan (2018) | | | | | | | | |
4.999%, VAR LIBOR+2.500%, 06/09/23 | | | 2,160 | | | | 2,107 | |
WP CPP Holdings, Second Lien (2018) | | | | | | | | |
10.510%, VAR LIBOR+7.750%, 04/24/26 | | | 405 | | | | 400 | |
WP CPP Holdings, Term B Loan | | | | | | | | |
6.510%, VAR LIBOR+3.750%, 04/25/25 | | | 2,018 | | | | 2,000 | |
| | | | | | | | | |
Total Aerospace | | | 19,989 | |
| | | | | | | | | |
Aerospace and Defense [0.1%] |
A6 Audio Bidco Limited, Facility B2 | | | | | | | | |
7.101%, VAR LIBOR+4.500%, 03/22/24 | | | 1,223 | | | | 1,217 | |
CAB, Facility B, 1st Lien | | | | | | | | |
4.000%, VAR Euribor+4.000%, 06/14/24 | | EUR | 1,000 | | | | 1,123 | |
| | | | | | | | | |
Total Aerospace and Defense | | | 2,340 | |
| | | | | | | | | |
Aerospace/Defense [0.0%] |
Transdigm Inc., New Tranche G Term Loan | | | | | | | | |
4.999%, 08/22/24(D) | | | 185 | | | | 180 | |
| | | | | | | | | |
Agriculture [0.1%] |
US Salt, Term Loan B, 1st Lien | | | | | | | | |
7.232%, 02/06/26 | | | 1,730 | | | | 1,726 | |
| | | | | | | | | |
Automotive [0.2%] |
Abra Auto Body/Caliber Collision, Term Loan B, 1st Lien | | | | | | | | |
5.982%, 02/05/26 | | | 1,790 | | | | 1,791 | |
Allison Transmission, Term Loan B, 1st Lien | | | | | | | | |
0.000%, 03/27/26(E) | | | 430 | | | | 431 | |
Dana, Term Loan B | | | | | | | | |
4.749%, 11/14/25 | | | 810 | | | | 802 | |
Holley Purchaser, Term Loan B | | | | | | | | |
7.751%, VAR LIBOR+5.000%, 10/24/25 | | | 354 | | | | 347 | |
Panther BF Aggregator 2 Power Solutions, Term Loan, 1st Lien | | | | | | | | |
0.000%, 03/18/26(E) | | | 775 | | | | 766 | |
See accompanying notes to financial statements.
CITY NATIONAL ROCHDALE FUNDS | PAGE 68
consolidated schedule of investments |
March 31, 2019 (Unaudited) |
City National Rochdale Fixed Income Opportunities Fund(continued) |
Description | | Face Amount (000)(1) | | | Value (000) | |
Panther BF Aggregator, Term Loan, 1st Lien | | | | | | | | |
0.000%, 03/18/26(E) | | $ | 3,000 | | | $ | 3,345 | |
| | | | | | | | | |
Total Automotive | | | 7,482 | |
| | | | | | | | | |
Beverage, Food and Tobacco [0.1%] |
Everest Bidco SAS, Facility B | | | | | | | | |
4.000%, VAR Euribor+4.000%, 06/06/25 | | EUR | 1,000 | | | | 1,114 | |
Refresco, Term Loan B, 1st Lien | | | | | | | | |
4.870%, VAR LIBOR+4.000%, 12/13/24 | | EUR | 1,000 | | | | 1,274 | |
| | | | | | | | | |
Total Beverage, Food and Tobacco | | | 2,388 | |
| | | | | | | | | |
Broadcast Radio and Television [0.1%] |
Technicolor S.A., Euro Term Loan, 1st Lien | | | | | | | | |
3.500%, VAR Euribor+3.500%, 12/06/23 | | EUR | 4,500 | | | | 4,527 | |
| | | | | | | | | |
Broadcasting [0.4%] |
CBS Radio Inc., Term Loan B (2017) | | | | | | | | |
5.249%, VAR LIBOR+2.750%, 11/18/24 | | | 1,227 | | | | 1,191 | |
Gray Television, Inc., Term Loan C | | | | | | | | |
4.982%, 11/02/25 | | | 1,277 | | | | 1,262 | |
Nexstar Broadcasting Inc, Term Loan A4 - Nexstar | | | | | | | | |
4.239%, VAR LIBOR+1.750%, 10/20/23 | | | 817 | | | | 809 | |
Nexstar Broadcasting Inc, Term Loan A4 - Shield | | | | | | | | |
4.239%, 10/20/23 | | | 23 | | | | 22 | |
Nexstar Broadcasting Inc, Term Loan B3 (2018) Mission | | | | | | | | |
4.739%, VAR LIBOR+2.250%, 01/17/24 | | | 267 | | | | 263 | |
Nexstar Broadcasting Inc, Term Loan B3 (2018) Nexstar | | | | | | | | |
4.746%, VAR LIBOR+2.250%, 01/17/24 | | | 1,451 | | | | 1,427 | |
Quincy Newspapers, Term Loan B | | | | | | | | |
7.500%, VAR LIBOR+3.000%, 10/19/22 | | | 373 | | | | 369 | |
Tribune Media Company, Term Loan B | | | | | | | | |
5.499%, VAR LIBOR+3.000%, 12/27/20 | | | 875 | | | | 873 | |
Tribune Media Company, Term Loan C | | | | | | | | |
5.499%, VAR LIBOR+3.000%, 01/26/24 | | | 3,294 | | | | 3,287 | |
Univision Comm (fka Umbrella), 2017 Replacement Term Loan | | | | | | | | |
5.249%, VAR LIBOR+2.750%, 03/15/24 | | | 2,314 | | | | 2,177 | |
| | | | | | | | | |
Total Broadcasting | | | 11,680 | |
| | | | | | | | | |
Building and Development [0.1%] |
Flamingo LUX II, Senior Facility B3 | | | | | | | | |
3.000%, VAR Euribor+3.250%, 07/28/23 | | EUR | 1,482 | | | | 1,648 | |
| | | | | | | | | |
Buildings and Real Estate [0.2%] |
Canary Finco Limited, Facility B | | | | | | | | |
7.113%, VAR LIBOR+4.250%, 03/29/24 | | | 2,000 | | | | 1,987 | |
Elsan SAS (fka Vedici Investissements), Facility B2, 1st Lien | | | | | | | | |
3.750%, VAR Euribor+3.750%, 10/31/22 | | EUR | 2,000 | | | | 2,245 | |
See accompanying notes to financial statements.
CITY NATIONAL ROCHDALE FUNDS | PAGE 69
consolidated schedule of investments |
March 31, 2019 (Unaudited) |
City National Rochdale Fixed Income Opportunities Fund(continued) |
Description | | Face Amount (000)(1) | | | Value (000) | |
HomeVi, Senior Facility B, 1st Lien | | | | | | | | |
3.000%, VAR Euribor+3.250%, 10/11/24 | | EUR | 2,000 | | | $ | 2,218 | |
| | | | | | | | | |
Total Buildings and Real Estate | | | 6,450 | |
| | | | | | | | | |
Business Equipment and Services [0.7%] |
Blitz F18-675 GmbH, Facility B1 | | | | | | | | |
3.750%, VAR Euribor+3.750%, 07/16/25 | | EUR | 1,500 | | | | 1,685 | |
Blitz F18-675 GmbH, Facility B2 | | | | | | | | |
3.750%, VAR Euribor+3.750%, 07/31/25 | | EUR | 1,500 | | | | 1,685 | |
Civica, Cov-Lite, 1st Lien | | | | | | | | |
5.598%, 10/10/24(D) | | GBP | 2,000 | | | | 2,579 | |
Indigocyan Holdco 3 Limited, Facility B, 1st Lien | | | | | | | | |
5.602%, VAR LIBOR+4.750%, 07/26/24 | | GBP | 3,000 | | | | 3,878 | |
Phoenix BidCo 2 GmbH, Facility B | | | | | | | | |
3.750%, VAR Euribor+3.750%, 09/13/24 | | EUR | 1,000 | | | | 705 | |
Saphilux S.a.r.l., Euro Facility B | | | | | | | | |
3.750%, VAR Euribor+3.750%, 03/07/25 | | EUR | 2,000 | | | | 2,209 | |
Trescal, Term Loan B, 1st Lien | | | | | | | | |
3.250%, VAR Euribor+3.250%, 03/14/25 | | EUR | 1,000 | | | | 1,099 | |
Unit4, 1st Lien | | | | | | | | |
4.500%, VAR Euribor+4.500%, 09/17/21 | | EUR | 1,000 | | | | 1,121 | |
Webhelp, 1st Lien | | | | | | | | |
3.500%, VAR Euribor+3.500%, 03/16/23 | | EUR | 1,000 | | | | 1,119 | |
Webhelp, Term Loan B3, 1st Lien | | | | | | | | |
5.286%, VAR LIBOR+4.250%, 12/31/49 | | GBP | 1,500 | | | | 1,920 | |
ZPG, Term Loan B, 1st Lien | | | | | | | | |
5.478%, VAR LIBOR+4.750%, 06/06/25 | | EUR | 2,000 | | | | 2,571 | |
3.750%, VAR Euribor+3.750%, 06/06/25 | | EUR | 1,000 | | | | 1,116 | |
| | | | | | | | | |
Total Business Equipment and Services | | | 21,687 | |
| | | | | | | | | |
Cable & Satellite Television [0.2%] |
Orion Cable, Cov-Lite | | | | | | | | |
3.000%, VAR Euribor+3.000%, 10/15/24 | | EUR | 1,248 | | | | 1,266 | |
Ziggo Secured Finance B.V., Term Loan F, 1st Lien | | | | | | | | |
3.000%, VAR Euribor+3.000%, 04/15/25 | | EUR | 3,000 | | | | 3,309 | |
| | | | | | | | | |
Total Cable & Satellite Television | | | 4,575 | |
| | | | | | | | | |
Cable/Wireless Video [1.5%] |
Altice Financing, Term Loan | | | | | | | | |
5.241%, VAR LIBOR+2.750%, 01/31/26 | | | 1,565 | | | | 1,489 | |
Altice Financing, Term Loan B (2017) | | | | | | | | |
5.234%, VAR LIBOR+2.750%, 07/15/25 | | | 1,150 | | | | 1,093 | |
Atlantic Broadband, Term Loan | | | | | | | | |
4.874%, VAR LIBOR+2.375%, 01/03/25 | | | 2,069 | | | | 2,038 | |
Charter Comm Operating, LLC, Term Loan B | | | | | | | | |
4.500%, VAR LIBOR+2.000%, 04/30/25 | | | 6,848 | | | | 6,797 | |
CSC Holdings Inc., Term Loan B (2017) | | | | | | | | |
4.734%, VAR LIBOR+2.250%, 07/17/25 | | | 1,449 | | | | 1,406 | |
See accompanying notes to financial statements.
CITY NATIONAL ROCHDALE FUNDS | PAGE 70
consolidated schedule of investments |
March 31, 2019 (Unaudited) |
City National Rochdale Fixed Income Opportunities Fund(continued) |
Description | | Face Amount (000)(1) | | | Value (000) | |
CSC Holdings Inc., Term Loan B (2018) | | | | | | | | |
4.984%, VAR LIBOR+2.500%, 01/25/26 | | $ | 526 | | | $ | 515 | |
Intelsat Jackson Holdings, Term Loan B3 | | | | | | | | |
6.240%, VAR LIBOR+3.750%, 11/27/23 | | | 1,830 | | | | 1,801 | |
Intelsat Jackson Holdings, Term Loan B4 | | | | | | | | |
6.990%, VAR LIBOR+4.500%, 01/02/24 | | | 325 | | | | 325 | |
Intelsat Jackson Holdings, Term Loan B5 | | | | | | | | |
6.625%, VAR LIBOR+6.625%, 01/02/24 | | | 2,760 | | | | 2,755 | |
Liberty Cablevision of Puerto Rico, First Lien Term Loan | | | | | | | | |
5.984%, VAR LIBOR+3.500%, 01/07/22 | | | 2,610 | | | | 2,582 | |
Liberty Cablevision of Puerto Rico, Second Lien - 2014 | | | | | | | | |
9.234%, VAR LIBOR+6.750%, 06/26/23 | | | 112 | | | | 109 | |
Mediacom LLC, Term Loan N | | | | | | | | |
4.160%, VAR LIBOR+1.750%, 02/15/24 | | | 1,120 | | | | 1,103 | |
Quebecor Media, Term Loan B | | | | | | | | |
4.934%, VAR LIBOR+2.250%, 08/17/20 | | | 3,566 | | | | 3,559 | |
Radiate Holdco, Term Loan B | | | | | | | | |
5.499%, VAR LIBOR+3.000%, 02/01/24 | | | 1,215 | | | | 1,187 | |
Telenet Financing, Term Loan AN | | | | | | | | |
4.734%, VAR LIBOR+2.250%, 08/15/26 | | | 1,665 | | | | 1,627 | |
Unitymedia, Term Loan B (2017) | | | | | | | | |
4.734%, VAR LIBOR+2.250%, 09/30/25 | | | 2,285 | | | | 2,259 | |
Unitymedia, Term Loan D | | | | | | | | |
4.734%, VAR LIBOR+2.250%, 01/15/26 | | | 640 | | | | 632 | |
Unitymedia, Term Loan E | | | | | | | | |
4.484%, VAR LIBOR+2.000%, 05/24/23 | | | 730 | | | | 721 | |
UPC Financing Partnership, Facility AR, 1st Lien | | | | | | | | |
4.984%, VAR LIBOR+2.500%, 01/15/26 | | | 1,770 | | | | 1,766 | |
Virgin Media Invst Hlds Ltd, Term Loan K | | | | | | | | |
4.984%, VAR LIBOR+2.500%, 01/15/26 | | | 3,320 | | | | 3,282 | |
WideOpenWest Finance LLC, Term Loan B (2017) | | | | | | | | |
5.741%, VAR LIBOR+3.250%, 08/18/23 | | | 2,498 | | | | 2,401 | |
Ziggo B.V., Term Loan E | | | | | | | | |
4.984%, VAR LIBOR+2.500%, 04/15/25 | | | 7,800 | | | | 7,589 | |
| | | | | | | | | |
Total Cable/Wireless Video | | | 47,036 | |
| | | | | | | | | |
Cargo Transport [0.0%] |
Baring Private Equity Asia VI Holding (2) Limited, Initial Euro Term Loan | | | | | | | | |
3.250%, VAR Euribor+3.250%, 07/21/22 | | EUR | 968 | | | | 1,072 | |
| | | | | | | | | |
Chemical/Plastics [0.3%] |
AkzoNobel (Starfruit), Term Loan B, 1st Lien | | | | | | | | |
3.750%, VAR Euribor+3.750%, 10/01/25 | | EUR | 1,000 | | | | 1,119 | |
See accompanying notes to financial statements.
CITY NATIONAL ROCHDALE FUNDS | PAGE 71
consolidated schedule of investments |
March 31, 2019 (Unaudited) |
City National Rochdale Fixed Income Opportunities Fund(continued) |
Description | | Face Amount (000)(1) | | | Value (000) | |
Allnex (Luxembourg) & Cy S.C.A. (f/k/a AI Chem & Cy S.C.A.), Tranche B-1 Term Loan, 1st Lien | | | | | | | | |
3.250%, VAR Euribor+3.250%, 06/02/23 | | EUR | 1,453 | | | $ | 1,614 | |
Novacap Group Bidco, Additional Facility B3, 1st Lien | | | | | | | | |
3.500%, VAR Euribor+3.500%, 06/22/23(E) | | EUR | 319 | | | | 352 | |
Novacap Group Bidco, Facility B, 1st Lien | | | | | | | | |
3.500%, VAR Euribor+3.500%, 04/28/23 | | EUR | 2,180 | | | | 2,406 | |
Oxea Holding Vier GMBH, Tranche B-1 Term Loan | | | | | | | | |
3.750%, VAR Euribor+3.750%, 09/27/24 | | EUR | 1,500 | | | | 1,683 | |
Solenis Holdings LLC, Initial Euro Term Loan | | | | | | | | |
4.750%, VAR Euribor+4.250%, 12/18/23 | | EUR | 998 | | | | 1,114 | |
| | | | | | | | | |
Total Chemical/Plastics | | | 8,288 | |
| | | | | | | | | |
Chemicals [1.3%] |
AkzoNobel (Starfruit), Term Loan B | | | | | | | | |
5.740%, VAR LIBOR+3.250%, 10/01/25 | | | 3,970 | | | | 3,908 | |
Alpha 3 (Atotech), Term Loan B-1 | | | | | | | | |
5.601%, VAR LIBOR+3.000%, 01/31/24 | | | 543 | | | | 530 | |
ASP Chromaflo Intermediate Holdings, Second Lien | | | | | | | | |
10.493%, VAR LIBOR+8.000%, 11/18/24 | | | 68 | | | | 68 | |
ASP Chromaflo Intermediate Holdings, Term Loan B-1 | | | | | | | | |
5.999%, VAR LIBOR+3.500%, 11/20/23 | | | 436 | | | | 431 | |
ASP Chromaflo Intermediate Holdings, Term Loan B-2 | | | | | | | | |
5.999%, VAR LIBOR+3.500%, 11/20/23 | | | 566 | | | | 560 | |
Axalta Coating Systems Dutch Holding B B.V. (Axalta Coating Systems U.S. Holdings, Inc.), Term B-2 Dollar Loan, 1st Lien | | | | | | | | |
4.351%, VAR LIBOR+2.000%, 06/01/24 | | | 1,701 | | | | 1,662 | |
Chemours Co LLC, Term Loan B (2018) | | | | | | | | |
4.250%, VAR LIBOR+1.750%, 03/26/25 | | | 741 | | | | 732 | |
Consolidated Energy Limited, Term Loan B | | | | | | | | |
4.989%, VAR LIBOR+2.500%, 05/07/25 | | | 1,227 | | | | 1,185 | |
Cyanco Intermediate 2 Corp., Term Loan | | | | | | | | |
5.999%, VAR LIBOR+3.500%, 03/07/25 | | | 307 | | | | 303 | |
Element Solutions, Term Loan B | | | | | | | | |
4.749%, 01/30/26(E) | | | 643 | | | | 637 | |
Emerald Performance Materials, LLC, Initial Term Loan (First Lien) | | | | | | | | |
5.999%, VAR LIBOR+3.500%, 07/30/21 | | | 117 | | | | 115 | |
Emerald Performance Materials, LLC, Second Lien | | | | | | | | |
10.249%, VAR LIBOR+7.750%, 08/01/22 | | | 1,655 | | | | 1,618 | |
Ferro Corp, Term Loan B-1 | | | | | | | | |
4.851%, VAR LIBOR+2.250%, 02/14/24 | | | 774 | | | | 763 | |
Ferro Corp, Term Loan B-2 | | | | | | | | |
4.851%, VAR LIBOR+2.250%, 02/14/24 | | | 245 | | | | 241 | |
See accompanying notes to financial statements.
CITY NATIONAL ROCHDALE FUNDS | PAGE 72
consolidated schedule of investments |
March 31, 2019 (Unaudited) |
City National Rochdale Fixed Income Opportunities Fund(continued) |
Description | | Face Amount (000)(1) | | | Value (000) | |
Ferro Corp, Term Loan B-3 | | | | | | | | |
4.851%, VAR LIBOR+2.250%, 02/14/24 | | $ | 239 | | | $ | 236 | |
Gemini HDPE LLC, Term Loan B | | | | | | | | |
5.250%, VAR LIBOR+2.500%, 07/24/21 | | | 1,807 | | | | 1,781 | |
HB Fuller, Term Loan B | | | | | | | | |
4.488%, VAR LIBOR+2.000%, 10/20/24 | | | 2,116 | | | | 2,076 | |
Ineos Group Holdings PLC, Term Loan B | | | | | | | | |
4.499%, VAR LIBOR+2.000%, 04/01/24 | | | 5,071 | | | | 4,971 | |
INEOS Styrolution Group GmbH, Term Loan B (2024) | | | | | | | | |
4.601%, VAR LIBOR+2.000%, 03/29/24 | | | 661 | | | | 652 | |
Invictus (LUX Holdco III), Second Lien | | | | | | | | |
9.329%, VAR LIBOR+6.750%, 02/13/26 | | | 75 | | | | 74 | |
Invictus (LUX Holdco III), Term Loan B | | | | | | | | |
5.579%, VAR LIBOR+3.000%, 03/28/25 | | | 223 | | | | 220 | |
Kraton Polymers, Term Loan B (2018) | | | | | | | | |
4.999%, VAR LIBOR+2.500%, 03/08/25 | | | 1,406 | | | | 1,391 | |
Messer Industries, Term Loan B | | | | | | | | |
4.989%, 10/01/25 | | | 1,155 | | | | 1,130 | |
Minerals Technologies Inc., Term Loan B (2017) | | | | | | | | |
4.750%, VAR LIBOR+2.250%, 02/14/24 | | | 2,086 | | | | 2,078 | |
Minerals Technologies Inc., Term Loan B-2 - Fixed TL | | | | | | | | |
4.750%, VAR LIBOR+4.750%, 05/09/21 | | | 3,869 | | | | 3,830 | |
Natgasoline, Term Loan B | | | | | | | | |
6.125%, VAR LIBOR+3.500%, 10/31/25 | | | 249 | | | | 249 | |
New Arclin US Holdings, Term Loan B (2018) | | | | | | | | |
5.999%, VAR LIBOR+3.500%, 02/14/24 | | | 714 | | | | 708 | |
OXEA Corp, Term B Loan | | | | | | | | |
6.000%, VAR LIBOR+3.500%, 09/27/24 | | EUR | 495 | | | | 493 | |
Polyone Corporation, Term Loan B-5 | | | | | | | | |
4.243%, VAR LIBOR+1.750%, 01/11/26 | | | 214 | | | | 211 | |
PQ Corporation, Term Loan B | | | | | | | | |
5.244%, VAR LIBOR+2.500%, 02/08/25 | | | 2,121 | | | | 2,095 | |
Trinseo Materials Operating S.C.A (fka Styron), 2018 Refinancing Term Loans | | | | | | | | |
4.499%, VAR LIBOR+2.000%, 09/06/24 | | | 773 | | | | 761 | |
Tronox, Blocked Dollar Term Loan | | | | | | | | |
5.499%, VAR LIBOR+3.000%, 09/23/24 | | | 675 | | | | 672 | |
Tronox, Initial Dollar Term Loan | | | | | | | | |
5.499%, VAR LIBOR+3.000%, 09/23/24 | | | 1,459 | | | | 1,451 | |
Univar, Term Loan B-3 | | | | | | | | |
4.749%, VAR LIBOR+2.250%, 07/01/24 | | | 1,240 | | | | 1,225 | |
Vantage Specialty Chemicals, Second Lien | | | | | | | | |
10.851%, VAR LIBOR+8.250%, 10/20/25 | | | 790 | | | | 766 | |
Vantage Specialty Chemicals, Term Loan B | | | | | | | | |
5.999%, VAR LIBOR+3.500%, 10/28/24 | | | 627 | | | | 614 | |
��
See accompanying notes to financial statements.
CITY NATIONAL ROCHDALE FUNDS | PAGE 73
consolidated schedule of investments |
March 31, 2019 (Unaudited) |
City National Rochdale Fixed Income Opportunities Fund(continued) |
Description | | Face Amount (000)(1) | | | Value (000) | |
Venator, Term Loan B | | | | | | | | |
5.499%, VAR LIBOR+3.000%, 08/08/24 | | $ | 502 | | | $ | 495 | |
| | | | | | | | | |
Total Chemicals | | | 40,932 | |
| | | | | | | | | |
Chemicals, Plastics and Rubber [0.1%] |
Apcoa Parking Holdings GmbH (fka Perpetuum Beteiligungsgesellschaft mbH), Facility B, 1st Lien | | | | | | | | |
3.750%, VAR Euribor+3.750%, 03/08/24 | | EUR | 2,000 | | | | 2,247 | |
Financiere Dry Mix Solutions S.A.S., Facility B, 1st Lien | | | | | | | | |
3.500%, VAR Euribor+3.500%, 03/07/24 | | EUR | 1,500 | | | | 1,682 | |
| | | | | | | | | |
Total Chemicals, Plastics and Rubber | | | 3,929 | |
| | | | | | | | | |
Computers & Electronics [0.0%] |
ConvergeOne Holdings, Corp., Initial Term Loan | | | | | | | | |
7.499%, 01/04/26 | | | 610 | | | | 583 | |
| | | | | | | | | |
Conglomerates [0.1%] |
Holding Socotec, Facility B1 | | | | | | | | |
3.500%, VAR Euribor+3.500%, 07/20/24 | | EUR | 1,000 | | | | 1,116 | |
Holding Socotec, Facility B2 | | | | | | | | |
5.098%, VAR LIBOR+4.250%, 07/20/24 | | EUR | 1,000 | | | | 1,292 | |
| | | | | | | | | |
Total Conglomerates | | | 2,408 | |
| | | | | | | | | |
Consumer Discretionary [0.0%] |
Biogroup, Term Loan B | | | | | | | | |
4.000%, 06/14/24 | | | 500 | | | | 561 | |
| | | | | | | | | |
Consumer Non-Durables [0.1%] |
ABG Intermediate, Term Loan B | | | | | | | | |
5.999%, VAR LIBOR+3.500%, 09/27/24 | | | 283 | | | | 277 | |
Eastman Kodak Company, Exit Term Loan | | | | | | | | |
8.749%, VAR LIBOR+6.250%, 09/03/19 | | | 807 | | | | 779 | |
Herbalife (HLF), Term Loan B | | | | | | | | |
5.749%, VAR LIBOR+3.250%, 08/08/25 | | | 318 | | | | 319 | |
Varsity Brands (Hercules Achievement), Term Loan B (2017) | | | | | | | | |
5.999%, VAR LIBOR+3.500%, 12/09/24 | | | 462 | | | | 455 | |
| | | | | | | | | |
Total Consumer Non-Durables | | | 1,830 | |
| | | | | | | | | |
Consumer Staples [0.0%] |
CHG PPC Parent, Term Loan, 1st Lien | | | | | | | | |
0.000%, 03/30/25(E) | | | 1,000 | | | | 1,122 | |
| | | | | | | | | |
Containers, Packaging and Glass [0.3%] |
EG Group Limited, Facility B (GBP), 1st Lien | | | | | | | | |
5.598%, VAR LIBOR+4.750%, 02/07/25 | | | 1,995 | | | | 2,522 | |
Roy Bidco ApS, Facility B1 | | | | | | | | |
3.250%, VAR Euribor+3.250%, 07/24/24 | | EUR | 2,500 | | | | 2,730 | |
Verallia, Facility B4, 1st Lien | | | | | | | | |
2.750%, VAR Euribor+2.750%, 10/22/22 | | EUR | 1,855 | | | | 2,053 | |
Weener, Term Loan B, 1st Lien | | | | | | | | |
3.750%, VAR Euribor+3.750%, 06/20/25 | | EUR | 1,500 | | | | 1,675 | |
| | | | | | | | | |
Total Containers, Packaging and Glass | | | 8,980 | |
| | | | | | | | | |
Diversified Insurance [0.1%] |
Financiere Holding CEP, Facility B, 1st Lien | | | | | | | | |
4.250%, VAR Euribor+4.250%, 12/13/24 | | EUR | 2,500 | | | | 2,794 | |
| | | | | | | | | |
See accompanying notes to financial statements.
CITY NATIONAL ROCHDALE FUNDS | PAGE 74
consolidated schedule of investments |
March 31, 2019 (Unaudited) |
City National Rochdale Fixed Income Opportunities Fund(continued) |
Description | | Face Amount (000)(1) | | | Value (000) | |
Diversified Media [1.0%] |
Cineworld (Crown Finance), Term Loan B | | | | | | | | |
4.999%, VAR LIBOR+2.500%, 02/28/25 | | $ | 1,969 | | | $ | 1,921 | |
Creative Artist Agency LLC, Term Loan B (2018) | | | | | | | | |
5.491%, VAR LIBOR+3.000%, 02/15/24 | | | 1,264 | | | | 1,250 | |
Deluxe Entertainment Services Group, Term Loan | | | | | | | | |
8.244%, VAR LIBOR+5.500%, 02/28/20 | | | 1,738 | | | | 1,514 | |
Donnelley Financial Solutions, Term Loan B (2017) | | | | | | | | |
5.481%, VAR LIBOR+3.000%, 09/29/23 | | | 92 | | | | 91 | |
Formula One (Alpha Topco), Term Loan B (2018) | | | | | | | | |
4.999%, VAR LIBOR+2.500%, 02/01/24 | | | 280 | | | | 269 | |
Harland Clarke Holdings, Term Loan B7 | | | | | | | | |
7.351%, VAR LIBOR+4.750%, 11/03/23 | | | 11,813 | | | | 10,573 | |
Internet Brands (Micro Holdings Corp.), Second Lien | | | | | | | | |
9.986%, VAR LIBOR+7.500%, 08/15/25 | | | 145 | | | | 142 | |
Internet Brands (Micro Holdings Corp.), Term Loan (2017) | | | | | | | | |
6.236%, VAR LIBOR+3.750%, 09/13/24 | | | 1,323 | | | | 1,303 | |
Lamar Media Corp, Term Loan B | | | | | | | | |
4.250%, VAR LIBOR+1.750%, 02/14/25 | | | 658 | | | | 656 | |
Lions Gate Entertainment, Term Loan B (2018) | | | | | | | | |
4.749%, VAR LIBOR+2.250%, 03/24/25 | | | 2,521 | | | | 2,483 | |
MediArena Acquisition (Endemol), First Lien Term Loan | | | | | | | | |
8.547%, VAR LIBOR+5.750%, 08/11/21 | | | 1,818 | | | | 1,806 | |
Meredith Corp, Term Loan B - new | | | | | | | | |
5.249%, VAR LIBOR+2.750%, 01/31/25 | | | 836 | | | | 833 | |
Merrill Communications LLC, Term Loan - 2022 | | | | | | | | |
7.994%, VAR LIBOR+5.250%, 05/27/22 | | | 435 | | | | 436 | |
Nielsen Finance LLC, Term Loan B-4 | | | | | | | | |
4.493%, VAR LIBOR+2.000%, 10/04/23 | | | 1,453 | | | | 1,425 | |
Rovi Solutions Corporation, Term Loan B | | | | | | | | |
5.000%, VAR LIBOR+2.500%, 07/02/21 | | | 361 | | | | 352 | |
RR Donnelley & Sons Co, Term Loan B | | | | | | | | |
7.499%, VAR LIBOR+5.000%, 01/04/24 | | | 539 | | | | 537 | |
William Morris Endeavor Entertainment, LLC (IMG Worldwide Holdings, LLC), Term B-1 Loan, 1st Lien | | | | | | | | |
5.360%, VAR LIBOR+2.750%, 05/16/25 | | | 4,594 | | | | 4,345 | |
| | | | | | | | | |
Total Diversified Media | | | 29,936 | |
| | | | | | | | | |
Diversified Natural Resources, Precious Metals and Minerals [0.1%] |
Armonea Finance NV, Facility B | | | | | | | | |
4.250%, VAR Euribor+4.250%, 07/11/25 | | EUR | 1,500 | | | | 1,678 | |
| | | | | | | | | |
See accompanying notes to financial statements.
CITY NATIONAL ROCHDALE FUNDS | PAGE 75
consolidated schedule of investments |
March 31, 2019 (Unaudited) |
City National Rochdale Fixed Income Opportunities Fund(continued) |
Description | | Face Amount (000)(1) | | | Value (000) | |
Diversified/Conglomerate Service [0.2%] |
AI Avocado B.V., Facility B1 (EUR), 1st Lien | | | | | | | | |
4.250%, VAR Euribor+4.250%, 10/08/21 | | EUR | 1,000 | | | $ | 1,121 | |
Colour Bidco Limited, Facility B | | | | | | | | |
6.285%, VAR LIBOR+5.250%, 11/22/24 | | GBP | 1,500 | | | | 1,817 | |
Emerald 2 Limited, Facility B1, 1st Lien | | | | | | | | |
6.660%, VAR LIBOR+4.000%, 05/14/21 | | | 3,460 | | | | 3,444 | |
Emerald 3 Limited, Term Loan, 1st Lien | | | | | | | | |
9.601%, VAR LIBOR+7.000%, 05/09/22 | | | 1,000 | | | | 995 | |
| | | | | | | | | |
Total Diversified/Conglomerate Service | | | 7,377 | |
| | | | | | | | | |
Drugs [0.3%] |
Apollo 5 GmbH, Facility B (Aenova Holding) | | | | | | | | |
5.000%, VAR Euribor+4.000%, 07/10/20 | | EUR | 1,318 | | | | 1,465 | |
Apollo 5 GmbH, Facility B (Dragenopharm) | | | | | | | | |
5.000%, VAR Euribor+4.000%, 09/29/20 | | EUR | 316 | | | | 351 | |
Apollo 5 GmbH, Facility B (SwissCaps Holding) | | | | | | | | |
5.000%, VAR Euribor+4.000%, 09/29/20 | | EUR | 192 | | | | 214 | |
Apollo 5 GmbH, Facility B (Temmler), 1st Lien | | | | | | | | |
5.000%, VAR Euribor+4.000%, 09/29/20 | | EUR | 174 | | | | 193 | |
Cheplapharm Arzneimittel GMBH, Facility B | | | | | | | | |
4.500%, VAR Euribor+4.500%, 07/02/25 | | EUR | 1,500 | | | | 1,693 | |
Cheplapharm, Term Loan B, 1st Lien | | | | | | | | |
4.000%, 07/20/25 | | EUR | 1,000 | | | | 1,127 | |
Financiere Mendel, Facility B2, 1st Lien | | | | | | | | |
3.000%, VAR Euribor+3.000%, 06/30/21 | | EUR | 1,000 | | | | 1,120 | |
Unilabs, Term Loan B2, 1st Lien | | | | | | | | |
2.750%, VAR Euribor+2.750%, 04/19/24 | | EUR | 2,500 | | | | 2,731 | |
| | | | | | | | | |
Total Drugs | | | 8,894 | |
| | | | | | | | | |
Ecological services and equipment [0.1%] |
Dummen Orange, Term Loan B, Cov-Lite, 1st Lien | | | | | | | | |
3.500%, VAR Euribor+3.500%, 05/18/24 | | EUR | 3,000 | | | | 2,796 | |
| | | | | | | | | |
Electronics [0.4%] |
CDS Holdco III B.V., Facility F, 1st Lien | | | | | | | | |
3.750%, VAR Euribor+3.750%, 12/31/24 | | EUR | 885 | | | | 989 | |
Coherent Holding GmbH, Euro Term Loan, 1st Lien | | | | | | | | |
2.750%, VAR Euribor+2.000%, 08/01/23 | | EUR | 1,104 | | | | 1,241 | |
Greeneden U.S. Holdings I, LLC, Tranche B-3 Euro Term Loan, 1st Lien | | | | | | | | |
3.500%, VAR Euribor+3.500%, 12/01/23 | | EUR | 1,960 | | | | 2,182 | |
Infor (US), Inc. (fka Lawson Software Inc.), Euro Tranche B-2 Loan, 1st Lien | | | | | | | | |
3.250%, VAR Euribor+2.250%, 02/01/22 | | EUR | 1,959 | | | | 2,181 | |
LSF1 XL Bidco S.C.A., Facility B, 1st Lien | | | | | | | | |
4.000%, VAR Euribor+4.000%, 02/02/24 | | EUR | 889 | | | | 985 | |
Minerva Bidco Limited, Facility B, 1st Lien | | | | | | | | |
5.912%, VAR LIBOR+5.000%, 07/25/25 | | | 2,700 | | | | 3,486 | |
See accompanying notes to financial statements.
CITY NATIONAL ROCHDALE FUNDS | PAGE 76
consolidated schedule of investments |
March 31, 2019 (Unaudited) |
City National Rochdale Fixed Income Opportunities Fund(continued) |
Description | | Face Amount (000)(1) | | | Value (000) | |
Oberthur Technologies Holding S.A.S. (fka OT Frenchco 1 SAS), Facility B, 1st Lien | | | | | | | | |
3.750%, VAR Euribor+3.750%, 01/10/24 | | EUR | 2,000 | | | $ | 2,204 | |
| | | | | | | | | |
Total Electronics | | | 13,268 | |
| | | | | | | | | |
Energy [1.0%] |
Admiral Permian (APR Operating), Second Lien | | | | | | | | |
9.522%, VAR LIBOR+7.000%, 05/17/24 | | | 735 | | | | 724 | |
Apergy Corp, Term Loan B | | | | | | | | |
5.000%, VAR LIBOR+2.500%, 04/18/25 | | | 835 | | | | 828 | |
BlackBrush Oil & Gas, L.P., Term Loan | | | | | | | | |
10.890%, VAR LIBOR+8.000%, 01/26/24 | | | 1,125 | | | | 1,086 | |
Blackhawk Mining, Term Loan B | | | | | | | | |
12.750%, VAR LIBOR+10.000%, 02/17/22 | | | 1,653 | | | | 1,199 | |
California Resources Corp, Term Loan | | | | | | | | |
12.871%, VAR LIBOR+10.375%, 12/31/21 | | | 1,485 | | | | 1,564 | |
California Resources Corp, Term Loan B (2017) | | | | | | | | |
7.246%, VAR LIBOR+4.750%, 12/31/22 | | | 520 | | | | 511 | |
Calpine, Term Loan B, 1st Lien | | | | | | | | |
0.000%, 03/20/26(E) | | | 5,500 | | | | 5,441 | |
Caprock Midstream (BCP Raptor II), Term Loan B | | | | | | | | |
7.365%, VAR LIBOR+4.750%, 10/22/25 | | | 335 | | | | 316 | |
Crestwood, Term Loan B (2018) | | | | | | | | |
10.020%, VAR LIBOR+7.500%, 02/28/23 | | | 1,780 | | | | 1,745 | |
Eagleclaw (BCP Raptor), Term Loan B | | | | | | | | |
6.879%, VAR LIBOR+4.250%, 06/24/24 | | | 997 | | | | 934 | |
EMG Utica, Term Loan | | | | | | | | |
6.249%, VAR LIBOR+3.750%, 03/27/20 | | | 1,615 | | | | 1,607 | |
Frac Tech International, Term Loan B - 2014 | | | | | | | | |
7.249%, VAR LIBOR+4.750%, 04/16/21 | | | 1,515 | | | | 1,511 | |
Gavilan Resources, Second Lien | | | | | | | | |
8.486%, VAR LIBOR+6.000%, 03/01/24 | | | 565 | | | | 438 | |
Harvey Gulf | | | | | | | | |
0.000%, 03/31/29(E) | | | 8 | | | | 289 | |
Invenergy Thermal Operating I LLC, Term Loan B | | | | | | | | |
6.101%, VAR LIBOR+3.500%, 07/16/25 | | | 422 | | | | 422 | |
KCA Deutag, Term Loan B (2018) | | | | | | | | |
9.351%, VAR LIBOR+6.750%, 02/28/23 | | | 1,439 | | | | 1,224 | |
Keane Group Holdings, LLC, Term Loan | | | | | | | | |
6.250%, VAR LIBOR+3.750%, 05/19/25 | | | 1,806 | | | | 1,734 | |
McDermott International Inc, Term Loan B | | | | | | | | |
7.493%, VAR LIBOR+5.000%, 05/12/25 | | | 2,337 | | | | 2,235 | |
Oregon Clean Energy, Term Loan, 1st Lien | | | | | | | | |
6.249%, 02/13/26 | | | 475 | | | | 475 | |
Osum Production Corp., Term Loan B | | | | | | | | |
8.101%, VAR LIBOR+5.500%, 07/31/20 | | | 577 | | | | 514 | |
Prairie ECI Acquiror LP, Term Loan, 1st Lien | | | | | | | | |
7.366%, 03/11/26 | | | 3,030 | | | | 3,034 | |
See accompanying notes to financial statements.
CITY NATIONAL ROCHDALE FUNDS | PAGE 77
consolidated schedule of investments |
March 31, 2019 (Unaudited) |
City National Rochdale Fixed Income Opportunities Fund(continued) |
Description | | Face Amount (000)(1) | | | Value (000) | |
Riverstone Utopia Member, Term Loan B | | | | | | | | |
6.736%, VAR LIBOR+4.250%, 10/16/24 | | $ | 323 | | | $ | 321 | |
Seadrill Operating LP, Term Loan B | | | | | | | | |
8.601%, VAR LIBOR+6.000%, 02/21/21 | | | 1,290 | | | | 1,070 | |
Sheridan Production Partners, Term Loan II-A | | | | | | | | |
6.130%, VAR LIBOR+3.500%, 12/16/20 | | | 74 | | | | 62 | |
Sheridan Production Partners, Term Loan II-M | | | | | | | | |
6.130%, VAR LIBOR+3.500%, 12/16/20 | | | 28 | | | | 23 | |
Sheridan Production Partners, Term Loan II-SIP | | | | | | | | |
6.130%, VAR LIBOR+3.500%, 12/16/20 | | | 535 | | | | 447 | |
Stetson Midsteam (GIP), Term Loan B | | | | | | | | |
6.732%, VAR LIBOR+4.250%, 07/23/25 | | | 263 | | | | 260 | |
Traverse Midstream, Term Loan B | | | | | | | | |
6.500%, VAR LIBOR+4.000%, 09/27/24 | | | 388 | | | | 387 | |
Westinghouse/Brookfield Wec, Term Loan, 2nd Lien | | | | | | | | |
9.249%, 08/03/26 | | | 460 | | | | 460 | |
Woodford Express, Term Loan B | | | | | | | | |
7.499%, VAR LIBOR+5.000%, 01/27/25 | | | 703 | | | | 679 | |
| | | | | | | | | |
Total Energy | | | 31,540 | |
| | | | | | | | | |
Entertainment [0.1%] |
AMC Entertainment, Term Loan B, 1st Lien | | | | | | | | |
0.000%, 03/20/26(E) | | | 1,920 | | | | 1,905 | |
| | | | | | | | | |
Finance (including structured products) [0.1%] |
ASP MCS Acquisition Corp., Initial Term Loan, 1st Lien | | | | | | | | |
7.249%, VAR LIBOR+4.750%, 05/11/24 | | | 253 | | | | 203 | |
IGT Holding IV AB, Facility B1, 1st Lien | | | | | | | | |
3.500%, VAR Euribor+3.500%, 07/25/24 | | EUR | 2,000 | | | | 2,231 | |
| | | | | | | | | |
Total Finance (including structured products) | | | 2,434 | |
| | | | | | | | | |
Financial [1.8%] |
Advisor Group, Term Loan B | | | | | | | | |
6.249%, VAR LIBOR+3.750%, 08/15/25 | | | 766 | | | | 766 | |
Altisource, Term Loan B (2018) | | | | | | | | |
6.601%, 03/29/24(D) | | | 1,219 | | | | 1,185 | |
Aretec Group, Inc, Second Lien (2018) | | | | | | | | |
10.749%, VAR LIBOR+8.250%, 08/14/26 | | | 505 | | | | 495 | |
Aretec Group, Inc, Term Loan B (2018) | | | | | | | | |
6.749%, VAR LIBOR+4.250%, 08/15/25 | | | 1,430 | | | | 1,410 | |
Asurion, LLC (fka Asurion Corporation), Replacement B-4 Term Loans (2017) | | | | | | | | |
5.499%, VAR LIBOR+3.000%, 11/03/24 | | | 1,082 | | | | 1,073 | |
5.499%, VAR LIBOR+3.000%, 08/04/22 | | | 413 | | | | 411 | |
Asurion, LLC (fka Asurion Corporation), Replacement B-6 Term Loans | | | | | | | | |
5.499%, VAR LIBOR+3.000%, 11/03/23 | | | 3,810 | | | | 3,789 | |
See accompanying notes to financial statements.
CITY NATIONAL ROCHDALE FUNDS | PAGE 78
consolidated schedule of investments |
March 31, 2019 (Unaudited) |
City National Rochdale Fixed Income Opportunities Fund(continued) |
Description | | Face Amount (000)(1) | | | Value (000) | |
Asurion, LLC (fka Asurion Corporation), Second Lien (2017) | | | | | | | | |
8.999%, VAR LIBOR+6.500%, 08/04/25 | | $ | 5,735 | | | $ | 5,804 | |
Ditech (Walter Investment), Term Loan B | | | | | | | | |
12.500%, VAR LIBOR+6.000%, 06/30/22(C) | | | 2,269 | | | | 1,543 | |
Dubai World, 1st Lien | | | | | | | | |
3.750%, 09/30/22 | | | 5,887 | | | | 5,520 | |
4.750%, 09/30/22 | | | 13,271 | | | | 12,391 | |
Edelman Financial Center, Term Loan B | | | | | | | | |
6.037%, VAR LIBOR+3.250%, 06/26/25 | | | 978 | | | | 969 | |
Evergood 4 APS, Facility B1E | | | | | | | | |
3.000%, VAR Euribor+3.000%, 11/29/24 | | EUR | 1,323 | | | | 1,461 | |
Evergood 4 ApS, Term Loan | | | | | | | | |
3.750%, 02/06/25 | | | 1,000 | | | | 1,121 | |
EVO Payments International, Term B Loan | | | | | | | | |
5.750%, VAR LIBOR+3.250%, 12/22/23 | | | 443 | | | | 442 | |
First Eagle Holdings, Term Loan B | | | | | | | | |
5.351%, VAR LIBOR+2.750%, 12/26/24 | | | 549 | | | | 546 | |
Fortress Investment, Term Loan B (2018) | | | | | | | | |
4.499%, VAR LIBOR+2.000%, 12/27/22 | | | 741 | | | | 734 | |
Franklin Square Holdings, L.P., Term Loan | | | | | | | | |
5.000%, VAR LIBOR+2.500%, 07/25/25 | | | 483 | | | | 480 | |
Genworth Financial Inc., Term Loan B | | | | | | | | |
6.982%, VAR LIBOR+4.500%, 02/28/23 | | | 248 | | | | 247 | |
Greenhill & Co, Term Loan B | | | | | | | | |
6.336%, VAR LIBOR+3.750%, 10/06/22 | | | 354 | | | | 354 | |
Inspired Finco, Term Loan B, 1st Lien | | | | | | | | |
0.000%, 11/14/25(E) | | | 1,000 | | | | 1,119 | |
Invitation Homes Operating Partnership LP, Initial Term Loan | | | | | | | | |
4.186%, VAR LIBOR+1.700%, 02/06/22 | | | 2,700 | | | | 2,639 | |
iStar Financial Inc., Term Loan B | | | | | | | | |
5.237%, VAR LIBOR+2.750%, 07/01/20 | | | 3,336 | | | | 3,307 | |
Jane Street Group, LLC, Term Loan B (2018) | | | | | | | | |
5.499%, VAR LIBOR+3.000%, 08/25/22 | | | 502 | | | | 500 | |
Mitchell International, Inc., Second Lien | | | | | | | | |
9.749%, VAR LIBOR+7.250%, 11/20/25 | | | 127 | | | | 123 | |
Mitchell International, Inc., Term Loan | | | | | | | | |
5.749%, VAR LIBOR+3.250%, 11/29/24 | | | 1,181 | | | | 1,133 | |
Navistar, Term Loan B | | | | | | | | |
6.000%, VAR LIBOR+3.500%, 11/06/24 | | | 827 | | | | 823 | |
Navistar, Term Loan B (2018) | | | | | | | | |
6.250%, VAR LIBOR+3.750%, 07/25/25 | | | 642 | | | | 640 | |
Ocwen Financial Corporation, Term Loan | | | | | | | | |
7.486%, VAR LIBOR+5.000%, 12/07/20 | | | 1,050 | | | | 1,045 | |
Paysafe Group PLC, Term Loan | | | | | | | | |
5.999%, VAR LIBOR+3.500%, 01/03/25 | | | 1,069 | | | | 1,048 | |
See accompanying notes to financial statements.
CITY NATIONAL ROCHDALE FUNDS | PAGE 79
consolidated schedule of investments |
March 31, 2019 (Unaudited) |
City National Rochdale Fixed Income Opportunities Fund(continued) |
Description | | Face Amount (000)(1) | | | Value (000) | |
Refinitiv (Thomson Reuters / Financial & Risk), Term Loan B | | | | | | | | |
6.249%, VAR LIBOR+3.750%, 10/01/25 | | $ | 2,973 | | | $ | 2,884 | |
Russell Investments, Term Loan B | | | | | | | | |
5.851%, VAR LIBOR+3.250%, 05/10/23 | | | 624 | | | | 614 | |
Worldpay LLC, Term Loan B-4 | | | | | | | | |
4.159%, VAR LIBOR+1.750%, 08/09/24 | | | 787 | | | | 785 | |
| | | | | | | | | |
Total Financial | | | 57,401 | |
| | | | | | | | | |
Financial Intermediaries [0.2%] |
ION Trading Technologies S.a.r.l., Initial Euro Term Loan (218), 1st Lien | | | | | | | | |
4.250%, VAR Euribor+3.250%, 11/21/24 | | EUR | 2,578 | | | | 2,829 | |
PI UK Holdco II Limited, Facility B2 | | | | | | | | |
3.250%, VAR Euribor+3.250%, 12/02/24 | | EUR | 2,000 | | | | 2,187 | |
PI UK Holdco II Limited, Second Lien Facility 2 | | | | | | | | |
7.000%, VAR Euribor+7.000%, 11/15/22 | | EUR | 1,000 | | | | 1,084 | |
| | | | | | | | | |
Total Financial Intermediaries | | | 6,100 | |
| | | | | | | | | |
Financing [0.3%] |
Citadel Securities, Term Loan B, 1st Lien | | | | | | | | |
5.999%, 02/20/26 | | | 430 | | | | 429 | |
Financiere coli, Term Loan, 1st Lien | | | | | | | | |
0.000%, 03/27/26(E) | | | 1,000 | | | | 1,122 | |
Japan Paris Club, Term Loan, 1st Lien | | | | | | | | |
0.000%, 01/10/28(E) | | JPY | 300,000 | | | | 1,949 | |
Samarinda Investments, Term Loan, 1st Lien | | | | | | | | |
0.000%, 02/25/26(E) | | | 1,000 | | | | 1,116 | |
Travelport Finance, Term Loan, 1st Lien | | | | | | | | |
0.000%, 03/18/26(E) | | | 1,860 | | | | 1,807 | |
Wish Investments, Term Loan, 1st Lien | | | | | | | | |
0.000%, 02/27/26(E) | | | 1,000 | | | | 1,304 | |
0.000%, 03/01/27(E) | | | 1,000 | | | | 1,266 | |
| | | | | | | | | |
Total Financing | | | 8,993 | |
| | | | | | | | | |
Food and Drug [0.1%] |
Albertsons, LLC, 2017-1 Term B-6 | | | | | | | | |
5.479%, VAR LIBOR+3.000%, 06/22/23 | | | 2,631 | | | | 2,606 | |
Albertsons, LLC, 2018-1 Term B-7 | | | | | | | | |
5.499%, VAR LIBOR+3.000%, 11/17/25 | | | 813 | | | | 802 | |
United Natural Foods, Term Loan B | | | | | | | | |
6.749%, VAR LIBOR+4.250%, 10/18/25 | | | 715 | | | | 614 | |
| | | | | | | | | |
Total Food and Drug | | | 4,022 | |
| | | | | | | | | |
Food Products [0.1%] |
Continental Foods, Term Loan B, 1st Lien | | | | | | | | |
3.750%, 12/08/23(D) | | EUR | 1,112 | | | | 1,243 | |
Continental Foods, Tranche 2, 1st Lien | | | | | | | | |
3.750%, VAR LIBOR+0.040%, 12/31/23 | | EUR | 216 | | | | 242 | |
Continental Foods, Tranche 3, 1st Lien | | | | | | | | |
3.750%, VAR LIBOR+0.040%, 12/31/23 | | EUR | 191 | | | | 213 | |
Continental Foods, Tranche 4, 1st Lien | | | | | | | | |
3.750%, VAR LIBOR+0.040%, 12/31/23 | | EUR | 420 | | | | 469 | |
| | | | | | | | | |
Total Food Products | | | 2,167 | |
| | | | | | | | | |
See accompanying notes to financial statements.
CITY NATIONAL ROCHDALE FUNDS | PAGE 80
consolidated schedule of investments |
March 31, 2019 (Unaudited) |
City National Rochdale Fixed Income Opportunities Fund(continued) |
Description | | Face Amount (000)(1) | | | Value (000) | |
Food Service [0.1%] |
Solina Corporate, Facility B2 | | | | | | | | |
3.750%, VAR Euribor+3.750%, 12/16/22 | | EUR | 2,000 | | | $ | 2,232 | |
| | | | | | | | | |
Food/Drug Retailers [0.1%] |
Prosol, Term Loan B, Cov-Lite, 1st Lien | | | | | | | | |
4.000%, VAR Euribor+4.000%, 04/21/24 | | EUR | 2,000 | | | | 2,241 | |
| | | | | | | | | |
Food/Tobacco [0.5%] |
Aramark, Term Loan B-3 | | | | | | | | |
4.249%, VAR LIBOR+1.750%, 03/11/25 | | | 611 | | | | 605 | |
Burger King (1011778 B.C. / New Red), Term Loan B-3 | | | | | | | | |
4.749%, VAR LIBOR+2.250%, 02/16/24 | | | 5,417 | | | | 5,327 | |
CHG PPC Parent (CH Guenther), Term Loan B | | | | | | | | |
5.249%, VAR LIBOR+2.750%, 03/21/25 | | | 526 | | | | 517 | |
JBS USA LLC, Term Loan B (2017) | | | | | | | | |
4.982%, VAR LIBOR+2.500%, 10/30/22 | | | 2,686 | | | | 2,664 | |
K-MAC Holdings, Second Lien | | | | | | | | |
9.236%, VAR LIBOR+6.750%, 03/09/26 | | | 150 | | | | 148 | |
NPC International, Inc., Second Lien | | | | | | | | |
10.134%, VAR LIBOR+7.500%, 03/28/25 | | | 115 | | | | 98 | |
Panera Bread, Term Loan A | | | | | | | | |
4.250%, VAR LIBOR+1.750%, 07/18/22 | | | 3,559 | | | | 3,453 | |
Post Holdings Inc, Term Loan B | | | | | | | | |
4.490%, VAR LIBOR+2.000%, 05/24/24 | | | 920 | | | | 911 | |
US Foods Inc., Term Loan B | | | | | | | | |
4.499%, VAR LIBOR+2.000%, 06/27/23 | | | 1,197 | | | | 1,177 | |
| | | | | | | | | |
Total Food/Tobacco | | | 14,900 | |
| | | | | | | | | |
Forest Prod/Containers [0.1%] |
Berry Global, Inc. (fka Berry Plastics Corporation), Term Q Loan, 1st Lien | | | | | | | | |
4.610%, VAR LIBOR+2.000%, 10/01/22 | | | 335 | | | | 332 | |
Berry Plastics Corp., Term Loan R | | | | | | | | |
4.493%, VAR LIBOR+2.000%, 01/19/24 | | | 139 | | | | 138 | |
Berry Plastics Corp., Term Loan T | | | | | | | | |
4.243%, VAR LIBOR+1.750%, 01/06/21 | | | 150 | | | | 149 | |
BWAY Holding Company, Term Loan B | | | | | | | | |
6.033%, VAR LIBOR+3.250%, 04/03/24 | | | 1,849 | | | | 1,801 | |
Flex Acquisition Company, Inc. (Novolex), Initial Term Loan | | | | | | | | |
5.626%, VAR LIBOR+3.000%, 12/29/23 | | | 645 | | | | 624 | |
ProAmpac, Term Loan B (Refinanced) | | | | | | | | |
6.265%, VAR LIBOR+3.500%, 11/17/23 | | | 464 | | | | 448 | |
Reynolds Group Holdings, Incremental US Term Loans | | | | | | | | |
5.249%, VAR LIBOR+2.750%, 02/05/23 | | | 1,090 | | | | 1,077 | |
| | | | | | | | | |
Total Forest Prod/Containers | | | 4,569 | |
| | | | | | | | | |
See accompanying notes to financial statements.
CITY NATIONAL ROCHDALE FUNDS | PAGE 81
consolidated schedule of investments |
March 31, 2019 (Unaudited) |
City National Rochdale Fixed Income Opportunities Fund(continued) |
Description | | Face Amount (000)(1) | | | Value (000) | |
Gaming [0.1%] |
Amaya, Term Loan, 1st Lien | | | | | | | | |
6.101%, VAR LIBOR+3.500%, 07/10/25 | | $ | 1,505 | | | $ | 1,500 | |
Aristocrat Leisure Limited, Term B-3 Loan, 1st Lien | | | | | | | | |
4.526%, VAR LIBOR+1.750%, 10/19/24 | | | 2,142 | | | | 2,100 | |
| | | | | | | | | |
Total Gaming | | | 3,600 | |
| | | | | | | | | |
Gaming/Leisure [1.4%] |
Belmond Interfin Ltd., Term Loan B | | | | | | | | |
5.249%, VAR LIBOR+2.750%, 07/03/24 | | | 752 | | | | 749 | |
Boyd Gaming Corp, Term Loan B (2017) | | | | | | | | |
4.658%, VAR LIBOR+2.250%, 09/15/23 | | | 514 | | | | 509 | |
Caesars Entertainment Op Co Inc., Term Loan B | | | | | | | | |
4.493%, VAR LIBOR+2.000%, 10/07/24 | | | 990 | | | | 966 | |
Caesars Resort Collection LLC, Term Loan | | | | | | | | |
5.249%, VAR LIBOR+2.750%, 12/23/24 | | | 1,545 | | | | 1,523 | |
CityCenter Holdings, Term Loan B | | | | | | | | |
4.749%, VAR LIBOR+2.250%, 04/18/24 | | | 1,088 | | | | 1,067 | |
Eldorado Resorts, Inc., Term Loan B | | | | | | | | |
4.875%, VAR LIBOR+2.000%, 03/15/24 | | | 967 | | | | 957 | |
ESH Hospitality, Inc., Term Loan B (2018) | | | | | | | | |
4.499%, VAR LIBOR+2.000%, 08/30/23 | | | 960 | | | | 953 | |
Four Seasons Holdings Inc., Term Loan (12/13) | | | | | | | | |
4.499%, VAR LIBOR+2.000%, 11/30/23 | | | 1,235 | | | | 1,224 | |
Gateway Casinos & Entertainment, Term Loan B (2018) | | | | | | | | |
5.601%, VAR LIBOR+3.000%, 12/01/23 | | | 202 | | | | 201 | |
Global Cash Access, Term Loan B (2017) | | | | | | | | |
5.499%, VAR LIBOR+3.000%, 05/09/24 | | | 1,783 | | | | 1,771 | |
GLP Capital LP (Gaming & Leisure), Incremental Tranche A-1 | | | | | | | | |
3.986%, VAR LIBOR+1.500%, 04/29/21 | | | 2,921 | | | | 2,884 | |
Golden Entertainment Inc., Term Loan B | | | | | | | | |
5.500%, VAR LIBOR+3.000%, 08/15/24 | | | 459 | | | | 455 | |
Greektown Holdings, Term Loan B | | | | | | | | |
5.249%, VAR LIBOR+2.750%, 03/21/24 | | | 938 | | | | 936 | |
GVC Holdings PLC, Facility B2 (GBP), 1st Lien | | | | | | | | |
4.535%, VAR LIBOR+3.500%, 03/15/24 | | | 2,000 | | | | 2,586 | |
GVC Holdings, Term Loan B-2 | | | | | | | | |
4.999%, VAR LIBOR+2.500%, 03/15/24 | | | 386 | | | | 382 | |
Hilton Worldwide Finance, LLC., Term Loan B-2 | | | | | | | | |
4.236%, VAR LIBOR+1.750%, 10/25/23 | | | 5,712 | | | | 5,698 | |
Las Vegas Sands, Term Loan B (2018) | | | | | | | | |
4.249%, VAR LIBOR+1.750%, 03/27/25 | | | 2,584 | | | | 2,536 | |
Marriott Ownership Resorts, Term Loan B | | | | | | | | |
4.749%, VAR LIBOR+2.250%, 08/08/25 | | | 284 | | | | 283 | |
See accompanying notes to financial statements.
CITY NATIONAL ROCHDALE FUNDS | PAGE 82
consolidated schedule of investments |
March 31, 2019 (Unaudited) |
City National Rochdale Fixed Income Opportunities Fund(continued) |
Description | | Face Amount (000)(1) | | | Value (000) | |
MGM Growth Properties, Term Loan B | | | | | | | | |
4.499%, VAR LIBOR+2.000%, 03/21/25 | | $ | 1,245 | | | $ | 1,226 | |
MGM Resorts, Term Loan A | | | | | | | | |
4.749%, 12/21/23(D) | | | 3,265 | | | | 3,232 | |
Penn National Gaming, Term Loan B (2018) | | | | | | | | |
4.749%, VAR LIBOR+2.250%, 08/14/25 | | | 1,791 | | | | 1,770 | |
Playa Resorts Holding, Term Loan B (2017) | | | | | | | | |
5.250%, VAR LIBOR+2.750%, 04/05/24 | | | 737 | | | | 707 | |
Scientific Games Inc., Term Loan B-5 | | | | | | | | |
5.329%, VAR LIBOR+2.750%, 08/14/24 | | | 676 | | | | 658 | |
Stars Group Holdings | | | | | | | | |
3.750%, VAR Euribor+3.750%, 07/10/25 | | EUR | 2,000 | | | | 2,250 | |
Station Casinos, Term Loan B | | | | | | | | |
5.000%, VAR LIBOR+2.500%, 06/08/23 | | | 795 | | | | 786 | |
UFC Holdings (Buyer), Term Loan B - 2023 | | | | | | | | |
5.750%, VAR LIBOR+3.250%, 08/18/23 | | | 670 | | | | 664 | |
VICI Properties 1 LLC (Caesars), Term Loan | | | | | | | | |
4.491%, VAR LIBOR+2.000%, 12/20/24 | | | 2,862 | | | | 2,808 | |
Wyndham Hotels & Resorts, Term Loan B | | | | | | | | |
4.249%, VAR LIBOR+1.750%, 05/30/25 | | | 637 | | | | 628 | |
Wynn Resorts, Term Loan B (2018) | | | | | | | | |
4.750%, VAR LIBOR+2.250%, 10/22/24 | | | 2,230 | | | | 2,181 | |
| | | | | | | | | |
Total Gaming/Leisure | | | 42,590 | |
| | | | | | | | | |
Healthcare [2.3%] |
Agiliti Health, Delayed Draw Term Loan B | | | | | | | | |
5.500%, 01/04/26(E) | | | 215 | | | | 214 | |
AI Sirona (Luxembourg) Acquisition S.a.r.l., Facility B (EUR) | | | | | | | | |
4.000%, VAR Euribor+4.000%, 05/29/25 | | EUR | 1,000 | | | | 1,121 | |
Amneal Pharmaceuticals LLC, Term Loan B | | | | | | | | |
6.000%, VAR LIBOR+3.500%, 05/04/25 | | | 1,509 | | | | 1,503 | |
Ardent Health Partners (AHP), Term Loan B | | | | | | | | |
6.999%, VAR LIBOR+4.500%, 06/16/25 | | | 804 | | | | 802 | |
Change Healthcare Holdings Inc, Term Loan B | | | | | | | | |
5.249%, VAR LIBOR+2.750%, 03/01/24 | | | 4,738 | | | | 4,671 | |
CHG Healthcare Services, Term Loan B | | | | | | | | |
5.744%, VAR LIBOR+3.000%, 06/07/23 | | | 855 | | | | 850 | |
Cidron Atrium SE, Facility B | | | | | | | | |
3.500%, VAR Euribor+3.500%, 02/26/25 | | EUR | 1,500 | | | | 1,619 | |
Cidron Gloria Group Services Gmbh, Initial Term Loan, 1st Lien | | | | | | | | |
4.000%, VAR Euribor+3.000%, 07/25/21 | | EUR | 1,000 | | | | 1,109 | |
Cidron Ollopa Holding B.V., Facility B, 2nd Lien | | | | | | | | |
3.250%, VAR Euribor+3.500%, 04/16/25 | | EUR | 2,437 | | | | 2,714 | |
Concentra Operating Corp, Term Loan | | | | | | | | |
5.240%, VAR LIBOR+2.750%, 06/01/22 | | | 1,291 | | | | 1,280 | |
See accompanying notes to financial statements.
CITY NATIONAL ROCHDALE FUNDS | PAGE 83
consolidated schedule of investments |
March 31, 2019 (Unaudited) |
City National Rochdale Fixed Income Opportunities Fund(continued) |
Description | | Face Amount (000)(1) | | | Value (000) | |
Constantin Investissement 4 S.A.S., Facility B | | | | | | | | |
3.000%, VAR Euribor+3.000%, 03/21/24 | | EUR | 1,000 | | | $ | 1,102 | |
Constantin Investissement 4 S.A.S., Facility B2 | | | | | | | | |
3.500%, VAR Euribor+3.500%, 04/22/24 | | EUR | 1,000 | | | | 1,117 | |
ConvaTec Healthcare, Term B Loan | | | | | | | | |
4.851%, VAR LIBOR+2.250%, 10/13/23 | | | 575 | | | | 571 | |
Diplomat Pharmacy, Inc., Term Loan B | | | | | | | | |
7.000%, VAR LIBOR+4.500%, 12/13/24 | | | 120 | | | | 114 | |
Eagle Bidco Limited, Facility B | | | | | | | | |
5.481%, VAR LIBOR+4.750%, 04/29/22 | | GBP | 3,000 | | | | 3,888 | |
Endo Luxembourg Finance Company I S.à.r.l., Initial Term Loan, 1st Lien | | | | | | | | |
6.750%, VAR LIBOR+4.250%, 04/29/24 | | | 1,702 | | | | 1,667 | |
Envision Healthcare Corporation (EMS), Term Loan B (2018) | | | | | | | | |
6.249%, VAR LIBOR+3.750%, 10/10/25 | | | 1,835 | | | | 1,715 | |
Explorer Holdings, Term Loan B | | | | | | | | |
6.351%, VAR LIBOR+3.750%, 05/02/23 | | | 458 | | | | 453 | |
Gentiva (Kindred at Home), Second Lien | | | | | | | | |
9.500%, VAR LIBOR+7.000%, 07/02/26 | | | 185 | | | | 189 | |
Gentiva (Kindred at Home), Term Loan | | | | | | | | |
6.250%, VAR LIBOR+3.750%, 07/02/25 | | | 1,186 | | | | 1,187 | |
Greatbatch, Ltd., Term Loan A | | | | | | | | |
5.000%, VAR LIBOR+2.500%, 10/14/21 | | | 2,222 | | | | 2,214 | |
Greatbatch, Ltd., Term Loan B (Refi) | | | | | | | | |
5.490%, VAR LIBOR+3.000%, 10/27/22 | | | 1,061 | | | | 1,061 | |
Grifols, Inc., Term Loan B (2017) | | | | | | | | |
4.660%, VAR LIBOR+2.250%, 01/31/25 | | | 2,650 | | | | 2,631 | |
HCA Inc., Term Loan B-10 | | | | | | | | |
4.499%, VAR LIBOR+2.000%, 03/13/25 | | | 2,318 | | | | 2,314 | |
HCA Inc., Tranche B-11 Term Loan | | | | | | | | |
4.249%, 03/17/23(D) | | | 658 | | | | 657 | |
Hera SAS (Laboratoire HRA-Pharma), Facility B | | | | | | | | |
3.500%, VAR Euribor+3.500%, 07/31/24 | | EUR | 2,000 | | | | 2,183 | |
Indivior Finance S.a.r.l., Term Loan | | | | | | | | |
7.250%, VAR LIBOR+4.500%, 12/19/22 | | | 1,509 | | | | 1,475 | |
Innoviva Inc., Term Loan B | | | | | | | | |
7.141%, VAR LIBOR+4.500%, 08/11/22 | | | 74 | | | | 72 | |
Kindred Healthcare Inc., Term B Loan | | | | | | | | |
7.500%, VAR LIBOR+5.000%, 06/23/25 | | | 866 | | | | 846 | |
Lannett Company, Inc., Term Loan A | | | | �� | | | | |
7.499%, VAR LIBOR+4.750%, 11/25/20 | | | 2,114 | | | | 2,040 | |
MultiPlan Inc., Term Loan B | | | | | | | | |
5.351%, VAR LIBOR+2.750%, 06/07/23 | | | 22 | | | | 22 | |
See accompanying notes to financial statements.
CITY NATIONAL ROCHDALE FUNDS | PAGE 84
consolidated schedule of investments |
March 31, 2019 (Unaudited) |
City National Rochdale Fixed Income Opportunities Fund(continued) |
Description | | Face Amount (000)(1) | | | Value (000) | |
Nidda Healthcare Holding GmbH (fka Nidda Healthcare Holding AG), Facility B1 (EUR), 1st Lien | | | | | | | | |
3.500%, VAR Euribor+3.500%, 09/20/24 | | EUR | 1,304 | | | $ | 1,445 | |
Nidda Healthcare Holding GmbH (fka Nidda Healthcare Holding AG), Facility B2, 1st Lien | | | | | | | | |
3.500%, VAR Euribor+3.500%, 08/21/24(E) | | EUR | 755 | | | | 837 | |
Nidda Healthcare Holding GmbH (fka Nidda Healthcare Holding AG), Facility C (EUR), 1st Lien | | | | | | | | |
3.500%, VAR Euribor+3.500%, 08/21/24 | | EUR | 2,441 | | | | 2,706 | |
Nidda Healthcare Holding GmbH (fka Nidda Healthcare Holding AG), Facility C (GBP), 1st Lien | | | | | | | | |
5.365%, VAR LIBOR+4.500%, 08/21/24 | | | 1,002 | | | | 1,295 | |
Obol France 3 SAS, Amended Facility B, 1st Lien | | | | | | | | |
3.250%, VAR Euribor+3.250%, 04/11/23 | | EUR | 1,500 | | | | 1,658 | |
Owens & Minor Distribution, Term Loan B | | | | | | | | |
6.989%, 05/02/25(D) | | | 845 | | | | 634 | |
Prophylaxis Holdco B.V., Facility B | | | | | | | | |
4.000%, VAR Euribor+4.000%, 05/23/25 | | EUR | 1,000 | | | | 993 | |
Quintiles IMS Incorporated (IQVIA), Term Loan B-1 | | | | | | | | |
4.601%, VAR LIBOR+2.000%, 03/07/24 | | | 175 | | | | 175 | |
Quintiles IMS Incorporated (IQVIA), Term Loan B-2 | | | | | | | | |
4.601%, VAR LIBOR+2.000%, 01/17/25 | | | 627 | | | | 624 | |
Quintiles IMS Incorporated (IQVIA), Term Loan B-3 | | | | | | | | |
4.249%, VAR LIBOR+1.750%, 06/09/25 | | | 1,459 | | | | 1,442 | |
Regional Care Hospital Partners Holdings, Inc., Term Loan B, 1st Lien | | | | | | | | |
6.982%, 11/16/25(D) | | | 800 | | | | 790 | |
Royalty Pharma (aka RPI), Term A-4 Loan | | | | | | | | |
3.999%, VAR LIBOR+1.500%, 05/04/22 | | | 200 | | | | 197 | |
Royalty Pharma (aka RPI), Term Loan B-6 | | | | | | | | |
4.499%, VAR LIBOR+2.000%, 03/27/23 | | | 4,083 | | | | 4,057 | |
Sante Cie, Facility B | | | | | | | | |
4.000%, VAR Euribor+4.000%, 10/16/25 | | EUR | 1,000 | | | | 1,113 | |
Sebia S.A., 1st Lien | | | | | | | | |
8.500%, VAR LIBOR+0.078%, 09/22/25 | | EUR | 1,000 | | | | 1,122 | |
Sivantos/Widex, Incremental Term Loan | | | | | | | | |
4.000%, 07/24/25 | | | 500 | | | | 563 | |
Sivantos/Widex, Term Loan B, 1st Lien | | | | | | | | |
4.000%, 07/24/25 | | | 2,500 | | | | 2,814 | |
Sound Inpatient Physicians, Second Lien | | | | | | | | |
9.249%, VAR LIBOR+6.750%, 06/19/26 | | | 75 | | | | 75 | |
Sound Inpatient Physicians, Term Loan B | | | | | | | | |
5.249%, VAR LIBOR+2.750%, 06/19/25 | | | 288 | | | | 284 | |
Syneos Health Inc, Term Loan B (2018) | | | | | | | | |
4.499%, VAR LIBOR+2.000%, 08/01/24 | | | 945 | | | | 937 | |
Team Health, Term Loan | | | | | | | | |
5.249%, VAR LIBOR+2.750%, 02/06/24 | | | 1,296 | | | | 1,149 | |
See accompanying notes to financial statements.
CITY NATIONAL ROCHDALE FUNDS | PAGE 85
consolidated schedule of investments |
March 31, 2019 (Unaudited) |
City National Rochdale Fixed Income Opportunities Fund(continued) |
Description | | Face Amount (000)(1) | | | Value (000) | |
Universal Health Services, Inc., Term Loan B | | | | | | | | |
4.249%, VAR LIBOR+1.750%, 10/24/25 | | $ | 354 | | | $ | 354 | |
Valeant Pharmaceuticals International, Term Loan | | | | | | | | |
5.481%, VAR LIBOR+3.000%, 06/02/25 | | | 1,514 | | | | 1,504 | |
Zotec Parters, Term Loan B | | | | | | | | |
7.490%, VAR LIBOR+5.000%, 02/09/25 | | | 758 | | | | 746 | |
| | | | | | | | | |
Total Healthcare | | | 70,915 | |
| | | | | | | | | |
Holding Company [0.1%] |
AI Alpine AT BidCo GmbH, Facility B (EUR) | | | | | | | | |
3.500%, VAR Euribor+3.500%, 10/03/25 | | EUR | 1,500 | | | | 1,662 | |
Financiere Men, Term Loan | | | | | | | | |
1.000%, 03/31/29 | | | 1,000 | | | | 1,105 | |
| | | | | | | | | |
Total Holding Company | | | 2,767 | |
| | | | | | | | | |
Housing [0.6%] |
ABC Supply Company, Term B-2 Loan | | | | | | | | |
4.499%, VAR LIBOR+2.000%, 10/31/23 | | | 1,158 | | | | 1,127 | |
Beacon Roofing Supply, Inc., Term Loan B - new | | | | | | | | |
4.749%, 01/02/25(D) | | | 229 | | | | 223 | |
Canam Construction, Term Loan B | | | | | | | | |
7.499%, VAR LIBOR+5.000%, 06/29/24 | | | 1,098 | | | | 1,071 | |
Capital Automotive LP, Second Lien (2017) | | | | | | | | |
8.500%, VAR LIBOR+6.000%, 03/21/25 | | | 4,961 | | | | 4,952 | |
Capital Automotive LP, Term Loan B (2017) | | | | | | | | |
5.000%, VAR LIBOR+2.500%, 03/21/24 | | | 2,687 | | | | 2,657 | |
DTZ US Borrower LLC, Term Loan B (2018) | | | | | | | | |
5.749%, VAR LIBOR+3.250%, 08/15/25 | | | 1,920 | | | | 1,901 | |
Forest City Enterprises, L.P., Initial Term Loan | | | | | | | | |
6.481%, VAR LIBOR+4.000%, 12/08/25 | | | 464 | | | | 465 | |
GGP (Brookfield Residential Property), Term Loan B | | | | | | | | |
4.996%, VAR LIBOR+2.500%, 08/27/25(E) | | | 4,035 | | | | 3,879 | |
Installed Building Products, Term Loan B (2018) | | | | | | | | |
4.999%, VAR LIBOR+2.500%, 04/15/25 | | | 670 | | | | 651 | |
Realogy Corporation, Term Loan A | | | | | | | | |
4.732%, VAR LIBOR+2.250%, 02/08/23 | | | 731 | | | | 719 | |
Summit Materials LLC, Term Loan B (2017) | | | | | | | | |
4.499%, VAR LIBOR+2.000%, 11/21/24 | | | 2,474 | | | | 2,420 | |
| | | | | | | | | |
Total Housing | | | 20,065 | |
| | | | | | | | | |
Industrial Equipment [0.0%] |
Sodelho S.A., Facility B3 | | | | | | | | |
5.250%, VAR LIBOR+4.250%, 09/25/21 | | GBP | 337 | | | | 438 | |
| | | | | | | | | |
Industrials [0.1%] |
US Silica, Term Loan B, 1st Lien | | | | | | | | |
6.500%, VAR LIBOR+4.000%, 05/01/25 | | | 1,737 | | | | 1,637 | |
| | | | | | | | | |
Information Services [0.0%] |
Cambium Learning, Term Loan, 2nd Lien | | | | | | | | |
10.999%, 12/18/26 | | | 1,000 | | | | 970 | |
| | | | | | | | | |
See accompanying notes to financial statements.
CITY NATIONAL ROCHDALE FUNDS | PAGE 86
consolidated schedule of investments |
March 31, 2019 (Unaudited) |
City National Rochdale Fixed Income Opportunities Fund(continued) |
Description | | Face Amount (000)(1) | | | Value (000) | |
Information Technology [1.3%] |
Applied Systems Inc., Term Loan | | | | | | | | |
5.499%, VAR LIBOR+3.000%, 09/19/24 | | $ | 467 | | | $ | 462 | |
Arris Group, Inc., Term Loan B-3 | | | | | | | | |
4.749%, VAR LIBOR+2.250%, 04/26/24 | | | 556 | | | | 555 | |
Avaya Inc., Tranche B Term Loan | | | | | | | | |
6.734%, VAR LIBOR+4.250%, 12/15/24 | | | 2,698 | | | | 2,684 | |
Barracuda Networks, Inc., Term Loan | | | | | | | | |
5.741%, VAR LIBOR+3.250%, 02/12/25 | | | 392 | | | | 389 | |
Blackboard Inc, Term Loan B-4 | | | | | | | | |
7.780%, VAR LIBOR+5.000%, 06/30/21 | | | 149 | | | | 146 | |
Bomgar (Brave Parent), Term Loan B | | | | | | | | |
6.499%, VAR LIBOR+4.000%, 04/18/25 | | | 328 | | | | 324 | |
Ciena Corporations, Term Loan B (2018) | | | | | | | | |
6.500%, VAR LIBOR+2.000%, 09/19/25 | | | 354 | | | | 354 | |
Dell International L.L.C. (EMC Corporation), Replacement Term A-2 Loan | | | | | | | | |
4.250%, VAR LIBOR+1.750%, 09/07/21 | | | 1,585 | | | | 1,579 | |
Dell, New Term Loan B | | | | | | | | |
4.500%, VAR LIBOR+2.000%, 09/07/23 | | | 4,784 | | | | 4,726 | |
Digicert, Second Lien | | | | | | | | |
10.499%, VAR LIBOR+8.000%, 09/19/25 | | | 292 | | | | 284 | |
Digicert, Term Loan B-2 | | | | | | | | |
6.499%, VAR LIBOR+4.000%, 10/31/24 | | | 621 | | | | 609 | |
Dynatrace Intermediate, Term Loan B | | | | | | | | |
5.749%, VAR LIBOR+3.250%, 08/08/25 | | | 603 | | | | 600 | |
EIG Investors Corp (Endurance), Term Loan B (2018) | | | | | | | | |
6.389%, VAR LIBOR+3.750%, 02/09/23 | | | 1,053 | | | | 1,047 | |
Ensono, Term Loan B | | | | | | | | |
7.749%, VAR LIBOR+5.250%, 04/30/25 | | | 442 | | | | 437 | |
Gigamon, Term Loan B | | | | | | | | |
6.851%, VAR LIBOR+4.250%, 12/19/24 | | | 632 | | | | 621 | |
Help/Systems, Term Loan B (2018) | | | | | | | | |
6.249%, VAR LIBOR+3.750%, 03/22/25 | | | 591 | | | | 583 | |
Internap, Term Loan B | | | | | | | | |
8.240%, VAR LIBOR+5.750%, 04/06/22 | | | 561 | | | | 542 | |
Iron Mountain, Term Loan B | | | | | | | | |
4.249%, VAR LIBOR+1.750%, 01/02/26 | | | 757 | | | | 733 | |
JDA Software Group, Inc (RP Crown), Term Loan B | | | | | | | | |
5.249%, VAR LIBOR+2.750%, 09/21/23 | | | 279 | | | | 275 | |
KeyW Corporation, Term Loan B | | | | | | | | |
6.993%, VAR LIBOR+4.500%, 05/03/24 | | | 209 | | | | 210 | |
Leidos (Abacus Innovations Corp), Term Loan B | | | | | | | | |
4.250%, VAR LIBOR+1.750%, 06/09/23 | | | 506 | | | | 504 | |
Lionbridge Technologies, Term Loan B | | | | | | | | |
7.999%, VAR LIBOR+5.500%, 02/06/24 | | | 442 | | | | 439 | |
See accompanying notes to financial statements.
CITY NATIONAL ROCHDALE FUNDS | PAGE 87
consolidated schedule of investments |
March 31, 2019 (Unaudited) |
City National Rochdale Fixed Income Opportunities Fund(continued) |
Description | | Face Amount (000)(1) | | | Value (000) | |
Mavenir Systems, Term Loan B | | | | | | | | |
8.500%, VAR LIBOR+6.000%, 05/08/25 | | $ | 814 | | | $ | 808 | |
MaxLinear, Term Loan B | | | | | | | | |
4.984%, VAR LIBOR+2.500%, 04/12/24 | | | 238 | | | | 237 | |
McAfee, Term B USD Loans | | | | | | | | |
6.249%, VAR LIBOR+3.750%, 09/30/24 | | | 1,335 | | | | 1,332 | |
Micro Focus, MA FinanceCo | | | | | | | | |
4.999%, VAR LIBOR+2.500%, 06/21/24 | | | 210 | | | | 204 | |
Micro Focus, Seattle SpinCo | | | | | | | | |
4.999%, VAR LIBOR+2.500%, 06/21/24 | | | 1,419 | | | | 1,380 | |
Micro Focus, Term Loan B-2 | | | | | | | | |
4.749%, VAR LIBOR+2.250%, 11/19/21 | | | 214 | | | | 209 | |
Microchip Technology Incorporated, Initial Term Loan, 1st Lien | | | | | | | | |
4.500%, VAR LIBOR+2.000%, 05/23/25 | | | 325 | | | | 321 | |
Peak 10, Inc., Second Lien | | | | | | | | |
9.986%, VAR LIBOR+7.250%, 07/24/25 | | | 180 | | | | 158 | |
Peak 10, Inc., Term Loan | | | | | | | | |
6.101%, VAR LIBOR+3.500%, 08/01/24 | | | 985 | | | | 899 | |
Presidio, Inc., Term Loan B - new | | | | | | | | |
5.249%, VAR LIBOR+2.750%, 02/02/24 | | | 739 | | | | 728 | |
Rackspace Hosting, Inc., Term Loan B | | | | | | | | |
5.738%, VAR LIBOR+3.000%, 11/03/23 | | | 1,156 | | | | 1,080 | |
Salient CRGT Inc, Term Loan B | | | | | | | | |
8.249%, VAR LIBOR+5.750%, 02/25/22 | | | 707 | | | | 693 | |
Sirius Computer Solutions (SCS), Term Loan B | | | | | | | | |
6.749%, VAR LIBOR+4.250%, 10/30/22 | | | 581 | | | | 582 | |
SolarWinds, Term Loan B (2018) | | | | | | | | |
5.249%, VAR LIBOR+2.750%, 03/07/24 | | | 916 | | | | 905 | |
Solera, LLC (Solera Finance, Inc.), Euro Term Loan | | | | | | | | |
3.250%, VAR Euribor+3.250%, 02/28/23 | | EUR | 1,945 | | | | 2,170 | |
Solera, Term Loan B | | | | | | | | |
5.249%, VAR LIBOR+2.750%, 03/03/23 | | | 919 | | | | 911 | |
SS&C Technologies, Term Loan B-3 | | | | | | | | |
4.749%, VAR LIBOR+2.250%, 04/16/25 | | | 611 | | | | 606 | |
SS&C Technologies, Term Loan B-4 | | | | | | | | |
4.749%, VAR LIBOR+2.250%, 04/16/25 | | | 440 | | | | 436 | |
SS&C Technologies, Term Loan B-5 | | | | | | | | |
4.749%, VAR LIBOR+2.250%, 04/16/25 | | | 393 | | | | 389 | |
Superion (SuperMoose), Term Loan B | | | | | | | | |
6.249%, VAR LIBOR+3.750%, 08/15/25 | | | 1,082 | | | | 1,065 | |
Symantec Corporation, Term A-5 Loan | | | | | | | | |
4.240%, VAR LIBOR+1.750%, 08/01/21 | | | 1,600 | | | | 1,590 | |
See accompanying notes to financial statements.
CITY NATIONAL ROCHDALE FUNDS | PAGE 88
consolidated schedule of investments |
March 31, 2019 (Unaudited) |
City National Rochdale Fixed Income Opportunities Fund(continued) |
Description | | Face Amount (000)(1) | | | Value (000) | |
Syncsort Incorporated (Starfish Holdco, LLC), 2018 Refinancing Term Loans | | | | | | | | |
6.999%, VAR LIBOR+4.500%, 08/16/24 | | $ | 286 | | | $ | 284 | |
TierPoint, Term Loan B | | | | | | | | |
6.249%, VAR LIBOR+3.750%, 04/26/24 | | | 528 | | | | 499 | |
TTM Technologies, Term Loan B (2017) | | | | | | | | |
4.989%, VAR LIBOR+2.500%, 09/28/24 | | | 500 | | | | 496 | |
Vertiv (Cortes NP Acquisition), Term Loan B (2017) | | | | | | | | |
6.629%, VAR LIBOR+4.000%, 11/30/23 | | | 1,289 | | | | 1,208 | |
Web.com Group, Term Loan B | | | | | | | | |
6.243%, VAR LIBOR+3.750%, 09/17/25 | | | 227 | | | | 224 | |
Western Digital Corporation, Term Loan A-1 | | | | | | | | |
3.999%, VAR LIBOR+1.500%, 04/29/23 | | | 2,257 | | | | 2,190 | |
Western Digital Corporation, Term Loan B-4 | | | | | | | | |
4.249%, VAR LIBOR+1.750%, 04/29/23 | | | 707 | | | | 687 | |
| | | | | | | | | |
Total Information Technology | | | 40,394 | |
| | | | | | | | | |
Insurance [0.0%] |
NEP Group, Inc., Initial Euro Term Loan, 2nd Lien | | | | | | | | |
3.500%, VAR Euribor+3.500%, 10/03/25 | | EUR | 1,000 | | | | 1,122 | |
| | | | | | | | | |
Land Transportation [0.0%] |
Savage Enterprises, Term Loan B | | | | | | | | |
6.990%, VAR LIBOR+4.500%, 07/02/25 | | | 917 | | | | 917 | |
Transplace Holdings. Inc., Term Loan B | | | | | | | | |
6.241%, VAR LIBOR+3.750%, 09/29/24 | | | 593 | | | | 589 | |
| | | | | | | | | |
Total Land Transportation | | | 1,506 | |
| | | | | | | | | |
Leisure [0.1%] |
Silk Bidco AS, Facility B | | | | | | | | |
3.750%, VAR Euribor+3.750%, 02/24/25 | | EUR | 1,500 | | | | 1,648 | |
| | | | | | | | | |
Leisure, Amusement, Motion Pictures, Entertainment [0.4%] |
Car Trawler, Facility B, 1st Lien | | | | | | | | |
4.500%, 04/30/21(D) | | EUR | 2,434 | | | | 2,294 | |
Dorna Sports, S.L., B2 Term Loan Facility | | | | | | | | |
2.750%, VAR Euribor+2.750%, 04/12/24 | | EUR | 1,801 | | | | 1,981 | |
Financiere Verdi II S.A.S., Facility B1, 1st Lien | | | | | | | | |
5.598%, VAR LIBOR+4.750%, 07/21/23 | | GBP | 1,000 | | | | 1,295 | |
Premier Lotteries Ireland Designated Activity Company, Facility B | | | | | | | | |
3.500%, VAR Euribor+3.500%, 06/26/24 | | EUR | 2,500 | | | | 2,776 | |
Richmond UK Holdco Limited, Facility B | | | | | | | | |
4.981%, VAR LIBOR+4.250%, 03/04/24 | | GBP | 1,000 | | | | 1,233 | |
Tipico, Term B Loan | | | | | | | | |
3.500%, VAR Euribor+3.500%, 08/08/22 | | EUR | 2,000 | | | | 2,221 | |
| | | | | | | | | |
Total Leisure, Amusement, Motion Pictures, Entertainment | | | 11,800 | |
| | | | | | | | | |
Lodgings and Casinos [0.1%] |
HNVR Holdco Limited, Facility B, 1st Lien | | | | | | | | |
3.000%, VAR Euribor+3.250%, 05/31/23 | | EUR | 1,985 | | | | 2,226 | |
| | | | | | | | | |
See accompanying notes to financial statements.
CITY NATIONAL ROCHDALE FUNDS | PAGE 89
consolidated schedule of investments |
March 31, 2019 (Unaudited) |
City National Rochdale Fixed Income Opportunities Fund(continued) |
Description | | Face Amount (000)(1) | | | Value (000) | |
Machinery [0.1%] |
Clark Equipment Company, Repriced Term Loan, 1st Lien | | | | | | | | |
4.601%, VAR LIBOR+2.000%, 05/18/24 | | $ | 1,214 | | | $ | 1,190 | |
Graftech International Ltd., Initial Term Loan, 1st Lien | | | | | | | | |
5.999%, VAR LIBOR+3.500%, 02/12/25 | | | 2,571 | | | | 2,561 | |
| | | | | | | | | |
Total Machinery | | | 3,751 | |
| | | | | | | | | |
Machinery (Non-Agriculture, Non-Construction and Non-Electronic) [0.1%] |
AS Adventure B.V. (fka Lion Adventure B.V.), Additional Facility (GBP) | | | | | | | | |
6.159%, VAR LIBOR+5.250%, 04/12/22 | | GBP | 1,000 | | | | 1,211 | |
AS Adventure B.V. (fka Lion Adventure B.V.), Facility B, 1st Lien | | | | | | | | |
5.000%, VAR Euribor+5.000%, 04/01/22 | | EUR | 2,000 | | | | 2,126 | |
| | | | | | | | | |
Total Machinery (Non-Agriculture, Non-Construction and Non-Electronic) | | | 3,337 | |
| | | | | | | | | |
Manufacturing [0.3%] |
Big River Steel LLC, Term Loan B | | | | | | | | |
7.601%, VAR LIBOR+5.000%, 08/23/23 | | | 808 | | | | 810 | |
Brand Energy & Infrastructure, Term Loan B | | | | | | | | |
6.896%, VAR LIBOR+4.250%, 06/21/24 | | | 434 | | | | 414 | |
CPM Holdings, Inc., Initial Term Loan | | | | | | | | |
6.249%, VAR LIBOR+3.750%, 10/24/25 | | | 494 | | | | 489 | |
DRB-HICOM Berhad, 1st Lien | | | | | | | | |
5.011%, 01/22/21 | | | 2,126 | | | | 2,083 | |
Dynacast International LLC, Term Loan B-1 | | | | | | | | |
5.851%, VAR LIBOR+3.250%, 01/28/22 | | | 684 | | | | 671 | |
Excelitas Technologies, Second Lien | | | | | | | | |
10.308%, VAR LIBOR+7.500%, 11/15/25 | | | 115 | | | | 115 | |
Excelitas Technologies, Term Loan B | | | | | | | | |
6.101%, VAR LIBOR+3.500%, 11/15/24 | | | 223 | | | | 221 | |
Gates Global LLC, Term Loan B (11/17) | | | | | | | | |
5.249%, VAR LIBOR+2.750%, 04/01/24 | | | 2,115 | | | | 2,086 | |
Lumileds (Bright Bidco), Term Loan B (2018) | | | | | | | | |
6.101%, VAR LIBOR+3.500%, 06/30/24(B) | | | 1,247 | | | | 960 | |
Milacron Inc., Term Loan B (2017) | | | | | | | | |
4.999%, VAR LIBOR+2.500%, 09/28/23 | | | 492 | | | | 481 | |
MKS Instruments, Term Loan, 1st Lien | | | | | | | | |
4.739%, 02/02/26 | | | 245 | | | | 245 | |
Ravago Holdings America, Inc., Term Loan B (2016) | | | | | | | | |
5.250%, VAR LIBOR+2.750%, 06/30/23 | | | 343 | | | | 333 | |
Southwire Company, Term Loan B (2018) | | | | | | | | |
4.499%, VAR LIBOR+2.000%, 05/15/25 | | | 293 | | | | 288 | |
TecoStar Holdings, Term Loan B | | | | | | | | |
5.993%, VAR LIBOR+3.500%, 05/01/24 | | | 675 | | | | 670 | |
| | | | | | | | | |
Total Manufacturing | | | 9,866 | |
| | | | | | | | | |
See accompanying notes to financial statements.
CITY NATIONAL ROCHDALE FUNDS | PAGE 90
consolidated schedule of investments |
March 31, 2019 (Unaudited) |
City National Rochdale Fixed Income Opportunities Fund(continued) |
Description | | Face Amount (000)(1) | | | Value (000) | |
Media [0.0%] |
MCC Iowa LLC, Tranche M Term Loan, 1st Lien | | | | | | | | |
4.410%, VAR LIBOR+2.000%, 01/15/25 | | $ | 308 | | | $ | 305 | |
| | | | | | | | | |
Metals/Minerals [0.3%] |
American Rock Salt Company, Term Loan B (2018) | | | | | | | | |
6.249%, VAR LIBOR+3.750%, 03/21/25 | | | 406 | | | | 404 | |
AMG Advanced Metallurgical Group, Term Loan B | | | | | | | | |
5.579%, VAR LIBOR+3.000%, 01/30/25 | | | 703 | | | | 694 | |
Atkore International, Inc., Term Loan (2016) | | | | | | | | |
5.360%, VAR LIBOR+2.750%, 12/22/23 | | | 2,026 | | | | 2,000 | |
Consol Energy Inc., Term Loan B | | | | | | | | |
8.500%, VAR LIBOR+6.000%, 10/31/22 | | | 1,825 | | | | 1,845 | |
Contura Energy Inc, Term Loan B | | | | | | | | |
7.493%, VAR LIBOR+5.000%, 11/10/25 | | | 889 | | | | 878 | |
Covia Holdings (Fairmount), Term Loan B | | | | | | | | |
6.160%, VAR LIBOR+3.750%, 04/09/25 | | | 1,117 | | | | 950 | |
Global Brass and Copper, Inc., Term Loan B (2018) | | | | | | | | |
5.000%, VAR LIBOR+2.500%, 05/23/25 | | | 1,000 | | | | 990 | |
TMS International, Term Loan B (2018) | | | | | | | | |
5.249%, VAR LIBOR+2.750%, 08/14/24 | | | 411 | | | | 403 | |
Zekelman Industries (fka JMC Steel), Term Loan B | | | | | | | | |
4.740%, VAR LIBOR+2.250%, 06/14/21 | | | 639 | | | | 633 | |
| | | | | | | | | |
Total Metals/Minerals | | | 8,797 | |
| | | | | | | | | |
Mining [0.1%] |
Samarco Mineracao, 1st Lien | | | | | | | | |
5.192%, 09/09/19 | | | 5,000 | | | | 2,600 | |
| | | | | | | | | |
Mining, Steel, Iron and Nonprecious Metals [0.1%] |
Diaverum Holding S.a.r.l. (fka Velox Bidco S.a.r.l.), Facility B | | | | | | | | |
3.250%, VAR Euribor+3.250%, 05/24/24 | | EUR | 1,500 | | | | 1,654 | |
Diaverum Holding S.a.r.l. (fka Velox Bidco S.a.r.l.), Second Lien Facility | | | | | | | | |
8.000%, VAR Euribor+8.000%, 05/24/24 | | EUR | 1,500 | | | | 1,650 | |
| | | | | | | | | |
Total Mining, Steel, Iron and Nonprecious Metals | | | 3,304 | |
| | | | | | | | | |
Oil and Gas [0.1%] |
Altice France S.A. (Ypso France SAS), EUR TLB-11 Term Loan | | | | | | | | |
3.000%, VAR Euribor+3.000%, 06/22/25 | | EUR | 2,456 | | | | 2,635 | |
| | | | | | | | | |
Personal Services [0.0%] |
Weight Watchers International Inc, Term Loan B-3 | | | | | | | | |
7.560%, VAR LIBOR+4.750%, 11/29/24 | | | 979 | | | | 930 | |
| | | | | | | | | |
Professional Services [0.4%] |
Belfor, Term Loan B, 1st Lien | | | | | | | | |
0.000%, 02/13/26(E) | | | 1,295 | | | | 1,305 | |
Brooks Automation, Term Loan B, 1st Lien | | | | | | | | |
5.690%, 10/04/24 | | | 753 | | | | 749 | |
See accompanying notes to financial statements.
CITY NATIONAL ROCHDALE FUNDS | PAGE 91
consolidated schedule of investments |
March 31, 2019 (Unaudited) |
City National Rochdale Fixed Income Opportunities Fund(continued) |
Description | | Face Amount (000)(1) | | | Value (000) | |
Dun & Bradstreet, Term Loan, 1st Lien | | | | | | | | |
7.490%, 02/06/26 | | $ | 970 | | | $ | 957 | |
NeuStar, Term Loan B, 1st Lien | | | | | | | | |
6.999%, 08/08/24 | | | 325 | | | | 318 | |
Pre Paid Legal/Legal Shield, Term Loan, 1st Lien | | | | | | | | |
0.000%, 05/01/25(E) | | | 345 | | | | 341 | |
Proxiserve, Term Loan, 1st Lien | | | | | | | | |
0.000%, 02/27/26(E) | | | 1,000 | | | | 1,122 | |
SITGA C.S.A.R.L., Term Loan, 1st Lien | | | | | | | | |
0.000%, 08/30/24(E) | | | 3,084 | | | | 3,437 | |
Stella Group, Term Loan, 1st Lien | | | | | | | | |
4.000%, 02/08/26 | | | 1,000 | | | | 1,124 | |
VFH Parent LLC, Term Loan B, 1st Lien | | | | | | | | |
6.126%, 01/30/26 | | | 1,840 | | | | 1,842 | |
| | | | | | | | | |
Total Professional Services | | | 11,195 | |
| | | | | | | | | |
Publishing [0.1%] |
Infinitas Learning Netherlands B.V. (Infinitas Learning Sweden AB), Facility B3, 1st Lien | | | | | | | | |
3.750%, VAR Euribor+3.750%, 05/03/24 | | EUR | 2,000 | | | | 2,202 | |
Springer Science, Term Loan | | | | | | | | |
3.750%, 08/22/19 | | | 1,924 | | | | 2,145 | |
| | | | | | | | | |
Total Publishing | | | 4,347 | |
| | | | | | | | | |
Recreation Facilities & Services [0.0%] |
Vacalians Group, Term Loan B, 1st Lien | | | | | | | | |
4.000%, VAR Euribor+4.000%, 10/30/25 | | EUR | 1,000 | | | | 1,120 | |
| | | | | | | | | |
Refining [0.1%] |
Karpower, Term Loan | | | | | | | | |
1.000%, 03/31/29 | | | 3,900 | | | | 3,900 | |
| | | | | | | | | |
Research [0.0%] |
Datto, Term Loan B, 1st Lien | | | | | | | | |
0.000%, 03/27/26(E) | | | 280 | | | | 279 | |
| | | | | | | | | |
Retail [0.3%] |
Ascena Retail Group, Tranche B Term Loan | | | | | | | | |
7.000%, VAR LIBOR+4.500%, 08/21/22 | | | 326 | | | | 284 | |
Bass Pro Group, Term Loan B | | | | | | | | |
7.499%, VAR LIBOR+5.000%, 09/25/24 | | | 1,160 | | | | 1,132 | |
Belk Inc, Term Loan | | | | | | | | |
7.447%, VAR LIBOR+4.750%, 12/12/22 | | | 865 | | | | 695 | |
CWGS Group, LLC, Term Loan B - 2023 | | | | | | | | |
5.240%, VAR LIBOR+2.750%, 11/08/23 | | | 1,077 | | | | 967 | |
GGP/Brookfield Retail, Term Loan A-2, 1st Lien | | | | | | | | |
4.746%, 08/28/23 | | | 1,700 | | | | 1,649 | |
Hudson’s Bay Company, Term Loan B - 2022 | | | | | | | | |
5.739%, VAR LIBOR+3.250%, 08/12/22 | | | 1,315 | | | | 1,280 | |
J Crew Group Inc, Term Loan B - Consenting Lenders | | | | | | | | |
5.964%, VAR LIBOR+3.220%, 03/05/21 | | | 257 | | | | 175 | |
JC Penney, Term Loan B | | | | | | | | |
6.879%, VAR LIBOR+4.250%, 06/23/23 | | | 1,398 | | | | 1,239 | |
Neiman Marcus (fka Mariposa), New Term Loan | | | | | | | | |
5.733%, VAR LIBOR+3.250%, 10/25/20 | | | 880 | | | | 817 | |
See accompanying notes to financial statements.
CITY NATIONAL ROCHDALE FUNDS | PAGE 92
consolidated schedule of investments |
March 31, 2019 (Unaudited) |
City National Rochdale Fixed Income Opportunities Fund(continued) |
Description | | Face Amount (000)(1) | | | Value (000) | |
Toys R Us Property Company, Initial Term Loan | | | | | | | | |
7.493%, VAR LIBOR+5.000%, 08/21/19 | | $ | 2,022 | | | $ | 1,840 | |
| | | | | | | | | |
Total Retail | | | 10,078 | |
| | | | | | | | | |
Retailers (other than food/drug) [0.1%] |
Orbiter International S.a.r.l., Facility B1, 1st Lien | | | | | | | | |
3.500%, VAR Euribor+3.500%, 07/11/24 | | EUR | 1,000 | | | | 1,118 | |
Peer Holdings III B.V., Facility B | | | | | | | | |
3.250%, VAR Euribor+3.250%, 03/07/25 | | EUR | 1,000 | | | | 1,100 | |
Vivarte, Term Loan, 1st Lien | | | | | | | | |
11.000%, VAR PIK Interest+7.000%, 10/29/19 | | EUR | 947 | | | | 717 | |
| | | | | | | | | |
Total Retailers (other than food/drug) | | | 2,935 | |
| | | | | | | | | |
Retailing [0.0%] |
Tacala, Term Loan B | | | | | | | | |
5.749%, VAR LIBOR+3.250%, 01/26/25 | | | 1 | | | | 1 | |
| | | | | | | | | |
Service [1.0%] |
Adtalem Global Education, Term Loan B | | | | | | | | |
5.499%, VAR LIBOR+3.000%, 04/09/25 | | | 501 | | | | 497 | |
Aecom Technology Corporation, Term Loan B | | | | | | | | |
4.249%, VAR LIBOR+1.750%, 02/21/25 | | | 762 | | | | 746 | |
Altran Technologies S.A., Term Loan B | | | | | | | | |
4.883%, VAR LIBOR+2.250%, 01/31/25 | | | 223 | | | | 218 | |
American Teleconferencing Services, Term Loan B | | | | | | | | |
9.109%, VAR LIBOR+6.500%, 12/08/21 | | | 250 | | | | 157 | |
Ascend Learning LLC, Term Loan B | | | | | | | | |
5.499%, VAR LIBOR+3.000%, 07/12/24 | | | 577 | | | | 564 | |
Convergint (Gopher Sub Inc), Second Lien | | | | | | | | |
9.249%, VAR LIBOR+6.750%, 02/01/26 | | | 75 | | | | 72 | |
Convergint (Gopher Sub Inc), Term Loan B | | | | | | | | |
5.499%, VAR LIBOR+3.000%, 02/01/25 | | | 441 | | | | 426 | |
CPA Global (Capri - Redtop), Term Loan | | | | | | | | |
5.994%, VAR LIBOR+3.250%, 10/04/24 | | | 166 | | | | 164 | |
Evertec Group, LLC, Term Loan B (2018) | | | | | | | | |
5.999%, VAR LIBOR+3.500%, 11/20/24 | | EUR | 1,102 | | | | 1,099 | |
Exela, Term Loan B (2018) | | | | | | | | |
9.378%, VAR LIBOR+6.500%, 07/12/23 | | | 611 | | | | 609 | |
First Data Corporation, 2023 Term Loan A | | | | | | | | |
3.986%, VAR LIBOR+1.500%, 10/26/23(E) | | | 596 | | | | 593 | |
First Data Corporation, 2024A New Dollar Term Loan | | | | | | | | |
4.486%, VAR LIBOR+2.000%, 04/26/24 | | | 2,655 | | | | 2,647 | |
FleetCor Technologies, Inc, Term Loan B (2017) | | | | | | | | |
4.499%, VAR LIBOR+2.000%, 07/26/24 | | | 709 | | | | 708 | |
Frontdoor Inc, Term Loan B | | | | | | | | |
5.000%, VAR LIBOR+2.500%, 08/14/25 | | | 249 | | | | 247 | |
See accompanying notes to financial statements.
CITY NATIONAL ROCHDALE FUNDS | PAGE 93
consolidated schedule of investments |
March 31, 2019 (Unaudited) |
City National Rochdale Fixed Income Opportunities Fund(continued) |
Description | | Face Amount (000)(1) | | | Value (000) | |
GFL Environmental, Term Loan B (2018) | | | | | | | | |
5.499%, VAR LIBOR+3.000%, 05/30/25 | | $ | 1,441 | | | $ | 1,390 | |
Global Payments Inc., Term B-4 Loan | | | | | | | | |
4.249%, VAR LIBOR+1.750%, 10/10/25 | | | 354 | | | | 349 | |
Inmar, Inc, Term Loan B | | | | | | | | |
6.601%, VAR LIBOR+3.500%, 04/25/24 | | | 1,501 | | | | 1,431 | |
iQor US Inc., Term Loan B | | | | | | | | |
7.797%, VAR LIBOR+5.000%, 04/01/21 | | | 1,399 | | | | 1,311 | |
Lakeland Tours (Worldstrides), Term Loan B | | | | | | | | |
6.615%, VAR LIBOR+4.000%, 12/06/24 | | | 476 | | | | 473 | |
Laureate Education Inc, Term Loan B (2017) | | | | | | | | |
5.999%, VAR LIBOR+3.500%, 04/26/24 | | | 1,331 | | | | 1,329 | |
National Intergovernmental Purchasing Alliance, Second Lien | | | | | | | | |
10.101%, VAR LIBOR+7.500%, 05/18/26 | | | 295 | | | | 285 | |
National Intergovernmental Purchasing Alliance, Term Loan B | | | | | | | | |
6.351%, VAR LIBOR+3.750%, 05/19/25 | | | 496 | | | | 492 | |
Pearl Intermediate (PetVet), Second Lien | | | | | | | | |
8.736%, VAR LIBOR+6.250%, 01/30/26 | | | 40 | | | | 39 | |
PricewaterhouseCoopers (Guidehouse), Term Loan B | | | | | | | | |
5.493%, VAR LIBOR+3.000%, 03/14/25 | | | 710 | | | | 699 | |
Prime Security Services, Term B-1 Loans | | | | | | | | |
5.249%, VAR LIBOR+2.750%, 05/02/22 | | | 858 | | | | 848 | |
R1 RCM Inc., Term Loan B | | | | | | | | |
7.749%, VAR LIBOR+5.250%, 05/02/25 | | | 392 | | | | 388 | |
Red Ventures, LLC, Term B-1 Loan | | | | | | | | |
5.499%, VAR LIBOR+3.000%, 11/08/24 | | | 3,277 | | | | 3,251 | |
Sedgwick, Inc., Term B Loan | | | | | | | | |
5.749%, 12/31/25(E) | | | 1,756 | | | | 1,716 | |
Spin Holdco (Coinmach), Term Loan B-1 | | | | | | | | |
6.029%, VAR LIBOR+3.250%, 11/14/22 | | | 328 | | | | 319 | |
St. George’s University Scholastic Services, Term Loan B (2018) | | | | | | | | |
6.000%, VAR LIBOR+3.500%, 07/17/25(E) | | | 535 | | | | 534 | |
Sutherland Global Services, Initial Cayman Term Loan | | | | | | | | |
7.976%, VAR LIBOR+5.375%, 04/23/21 | | | 340 | | | | 332 | |
Sutherland Global Services, Initial US Term Loan | | | | | | | | |
7.976%, VAR LIBOR+5.375%, 04/23/21 | | | 1,463 | | | | 1,424 | |
Tempo Acquisition LLC, Initial Term Loan | | | | | | | | |
5.499%, VAR LIBOR+3.000%, 05/01/24 | | | 1,438 | | | | 1,423 | |
TKC Holdings, Inc., Second Lien | | | | | | | | |
10.500%, VAR LIBOR+8.000%, 02/01/24 | | | 190 | | | | 184 | |
TKC Holdings, Inc., Term Loan B | | | | | | | | |
6.250%, VAR LIBOR+3.750%, 01/31/23 | | | 461 | | | | 451 | |
See accompanying notes to financial statements.
CITY NATIONAL ROCHDALE FUNDS | PAGE 94
consolidated schedule of investments |
March 31, 2019 (Unaudited) |
City National Rochdale Fixed Income Opportunities Fund(continued) |
Description | | Face Amount (000)(1) | | | Value (000) | |
TransUnion LLC, Term Loan B-3 | | | | | | | | |
4.499%, VAR LIBOR+2.000%, 04/10/23 | | $ | 528 | | | $ | 523 | |
Tunnel Hill Partners, Term Loan B | | | | | | | | |
5.999%, 10/01/25 | | | 445 | | | | 441 | |
Ultra Clean Holdings, Term Loan B | | | | | | | | |
6.999%, 08/27/25 | | | 583 | | | | 559 | |
Ventia (LS Deco LLC Leighton), Term Loan B | | | | | | | | |
6.101%, VAR LIBOR+3.500%, 05/21/22 | | | 348 | | | | 347 | |
Vivint (APX Group), Term Loan B | | | | | | | | |
7.499%, VAR LIBOR+5.000%, 02/02/24 | | | 358 | | | | 349 | |
Xerox Business Services (Conduent), Term Loan B | | | | | | | | |
4.999%, VAR LIBOR+2.500%, 12/07/23 | | | 911 | | | | 906 | |
| | | | | | | | | |
Total Service | | | 30,540 | |
| | | | | | | | | |
Shipping [0.1%] |
Commercial Barge Line Company, Term Loan B 2022 | | | | | | | | |
11.249%, VAR LIBOR+8.750%, 11/12/20 | | | 311 | | | | 216 | |
Harvey Gulf Int’l Marine, Exit Term Loan | | | | | | | | |
1.034%, VAR LIBOR+6.000%, 07/02/23 | | | 624 | | | | 618 | |
Hornblower, Term Loan B | | | | | | | | |
7.101%, VAR LIBOR+4.500%, 03/28/25 | | | 457 | | | | 455 | |
International Seaways, Term Loan B | | | | | | | | |
8.500%, VAR LIBOR+6.000%, 06/22/22 | | | 59 | | | | 60 | |
Navios Maritime Midstream Partners LP, Term Loan | | | | | | | | |
7.140%, VAR LIBOR+4.500%, 06/15/20 | | | 556 | | | | 514 | |
Navios Maritime Partners LP, Term Loan B (2017) | | | | | | | | |
7.600%, VAR LIBOR+5.000%, 09/04/20 | | | 368 | | | | 365 | |
PS Logistics LLC, Term Loan | | | | | | | | |
7.249%, VAR LIBOR+4.750%, 03/06/25 | | | 199 | | | | 198 | |
Worldwide Express, Term Loan | | | | | | | | |
6.863%, VAR LIBOR+4.000%, 02/02/24 | | | 283 | | | | 279 | |
| | | | | | | | | |
Total Shipping | | | 2,705 | |
| | | | | | | | | |
Software Services [0.0%] |
Kofax, Incremental Term Loan, 1st Lien | | | | | | | | |
6.749%, 07/07/23 | | | 1,072 | | | | 1,059 | |
| | | | | | | | | |
Sovereign [0.0%] |
Arab Republic of Egypt, 1st Lien | | | | | | | | |
5.776%, 01/04/21(B) | | CHF | 1,120 | | | | 1,064 | |
| | | | | | | | | |
Technology Services [0.1%] |
Verisure Holdings, Term Loan B | | | | | | | | |
3.500%, VAR Euribor+3.500%, 10/21/22 | | EUR | 1,500 | | | | 1,673 | |
| | | | | | | | | |
Telecommunications [1.0%] |
Cable & Wireless Communications PLC (Sable), Term Loan B-4 | | | | | | | | |
5.749%, VAR LIBOR+3.250%, 01/30/26 | | | 3,415 | | | | 3,400 | |
CenturyLink Inc, Term Loan B | | | | | | | | |
5.249%, VAR LIBOR+2.750%, 01/31/25 | | | 7,187 | | | | 7,038 | |
See accompanying notes to financial statements.
CITY NATIONAL ROCHDALE FUNDS | PAGE 95
consolidated schedule of investments |
March 31, 2019 (Unaudited) |
City National Rochdale Fixed Income Opportunities Fund(continued) |
Description | | Face Amount (000)(1) | | | Value (000) | |
Colorado Buyer (Cyxtera), Second Lien | | | | | | | | |
9.860%, VAR LIBOR+7.250%, 05/01/25 | | $ | 295 | | | $ | 267 | |
Colorado Buyer (Cyxtera), Term Loan B | | | | | | | | |
5.600%, VAR LIBOR+3.000%, 05/01/24 | | | 115 | | | | 111 | |
European Crops Products 2 S.a.r.l., Facility B2, 1st Lien | | | | | | | | |
4.750%, VAR Euribor+4.750%, 01/17/25 | | | 2,500 | | | | 2,781 | |
Hargray Communications Group, Inc., Term Loan B | | | | | | | | |
5.499%, VAR LIBOR+3.000%, 03/22/24 | | | 378 | | | | 372 | |
Level 3 Communications, Term Loan B (2017) | | | | | | | | |
4.736%, VAR LIBOR+2.250%, 02/22/24 | | | 7,031 | | | | 6,941 | |
Neustar, Second Lien | | | | | | | | |
10.499%, VAR LIBOR+8.000%, 02/28/25 | | | 295 | | | | 288 | |
Neustar, Term Loan B-4 | | | | | | | | |
5.999%, VAR LIBOR+3.500%, 08/08/24 | | | 716 | | | | 689 | |
Numericable U.S. LLC (SFR), Term Loan B-11 | | | | | | | | |
5.249%, VAR LIBOR+2.750%, 07/31/25 | | | 2,712 | | | | 2,519 | |
Numericable U.S. LLC (SFR), Term Loan B-12 | | | | | | | | |
6.171%, VAR LIBOR+3.688%, 01/31/26 | | | 2,413 | | | | 2,282 | |
Numericable U.S. LLC (SFR), Term Loan B-13 | | | | | | | | |
6.484%, VAR LIBOR+4.000%, 08/14/26 | | | 1,985 | | | | 1,898 | |
West Corp, Term Loan B | | | | | | | | |
6.629%, VAR LIBOR+4.000%, 10/10/24 | | | 1,190 | | | | 1,114 | |
West Corp, Term Loan B-1 | | | | | | | | |
5.993%, VAR LIBOR+3.500%, 10/10/24 | | | 521 | | | | 483 | |
Zacapa (Ufinet), Term Loan B | | | | | | | | |
7.601%, VAR LIBOR+5.000%, 06/27/25 | | | 378 | | | | 378 | |
Zayo Group LLC, Term Loan B-2 (Refi) | | | | | | | | |
4.749%, VAR LIBOR+2.250%, 01/19/24 | | | 785 | | | | 780 | |
| | | | | | | | | |
Total Telecommunications | | | 31,341 | |
| | | | | | | | | |
Telecommunications Hybrid [0.2%] |
Eircom Finco S.a.r.l., Facility B, 2nd Lien | | | | | | | | |
3.000%, VAR Euribor+3.250%, 03/08/24 | | EUR | 2,500 | | | | 2,778 | |
GTT Communications B.V., Closing Date EMEA Term Loan | | | | | | | | |
3.250%, VAR Euribor+3.250%, 04/25/25 | | EUR | 1,985 | | | | 2,160 | |
Odyssey Investissement SAS, Facility B, 1st Lien | | | | | | | | |
3.750%, VAR Euribor+3.750%, 04/28/25 | | EUR | 1,000 | | | | 1,119 | |
| | | | | | | | | |
Total Telecommunications Hybrid | | | 6,057 | |
| | | | | | | | | |
Textiles and Leather [0.1%] |
Colouroz Investment 1 GMBH, Initial Term C Loan, 1st Lien | | | | | | | | |
5.779%, VAR LIBOR+3.000%, 09/03/21 | | | 407 | | | | 375 | |
Colouroz Investment 2, LLC, Initial Term B-2 Loan, 1st Lien | | | | | | | | |
5.779%, VAR LIBOR+3.000%, 09/03/21 | | | 2,465 | | | | 2,269 | |
| | | | | | | | | |
Total Textiles and Leather | | | 2,644 | |
| | | | | | | | | |
See accompanying notes to financial statements.
CITY NATIONAL ROCHDALE FUNDS | PAGE 96
consolidated schedule of investments |
March 31, 2019 (Unaudited) |
City National Rochdale Fixed Income Opportunities Fund(continued) |
Description | | Face Amount (000)(1) | | | Value (000) | |
Transportation [0.3%] |
American Axle & Manufacturing Inc., Term Loan B | | | | | | | | |
4.740%, VAR LIBOR+2.250%, 04/06/24 | | $ | 1,724 | | | $ | 1,682 | |
Daseke, Term Loan | | | | | | | | |
7.499%, VAR LIBOR+5.000%, 02/27/24 | | | 1,016 | | | | 1,012 | |
DexKo Global, Inc., Replacement U.S. Dollar Term B Loans | | | | | | | | |
5.999%, VAR LIBOR+3.500%, 07/24/24 | | | 446 | | | | 439 | |
Superior Industries, Closing Date Term Loan | | | | | | | | |
6.499%, VAR LIBOR+4.000%, 05/22/24 | | | 800 | | | | 776 | |
Tenneco Inc, Term Loan B | | | | | | | | |
5.249%, VAR LIBOR+2.750%, 10/01/25 | | | 1,815 | | | | 1,729 | |
Tower Auto Holdings, Term Loan B (2024) | | | | | | | | |
5.250%, VAR LIBOR+2.750%, 03/01/24 | | | 759 | | | | 744 | |
Travelport, Term Loan B, 1st Lien | | | | | | | | |
5.184%, 03/17/25(D) | | | 857 | | | | 856 | |
Wabash National Corporation, Term Loan B (2017) | | | | | | | | |
4.740%, VAR LIBOR+2.250%, 03/18/22 | | | 1,320 | | | | 1,308 | |
| | | | | | | | | |
Total Transportation | | | 8,546 | |
| | | | | | | | | |
Utilities [0.1%] |
CD&R Firefly Bidco Limited, Facility B1, 1st Lien | | | | | | | | |
5.412%, VAR LIBOR+4.500%, 05/10/25 | | | 2,000 | | | | 2,560 | |
LGC Science Holdings Limited (fka Figaro Bidco Limited), Facility B4, 1st Lien | | | | | | | | |
3.250%, VAR Euribor+3.250%, 03/08/23 | | EUR | 1,285 | | | | 1,421 | |
| | | | | | | | | |
Total Utilities | | | 3,981 | |
| | | | | | | | | |
Utility [0.7%] |
AES Corp, Term Loan B (2018) | | | | | | | | |
4.379%, VAR LIBOR+1.750%, 05/24/22 | | | 1,101 | | | | 1,097 | |
Atlantic Power, Term Loan | | | | | | | | |
5.249%, VAR LIBOR+2.750%, 03/21/23 | | | 264 | | | | 263 | |
Calpine, Construction Term Loan B (2017) | | | | | | | | |
4.999%, VAR LIBOR+2.500%, 01/31/25 | | | 691 | | | | 682 | |
Calpine, Term Loan B-5 | | | | | | | | |
5.110%, VAR LIBOR+2.500%, 01/15/24 | | | 990 | | | | 980 | |
Calpine, Term Loan B-6 | | | | | | | | |
5.110%, VAR LIBOR+2.500%, 01/15/23 | | | 368 | | | | 368 | |
Calpine, Term Loan B-7 | | | | | | | | |
5.110%, VAR LIBOR+2.500%, 05/31/23 | | | 467 | | | | 462 | |
Eastern Power, LLC (TPF II), Term Loan | | | | | | | | |
6.249%, VAR LIBOR+3.750%, 10/02/23 | | | 984 | | | | 980 | |
Longview Power, Term Loan B | | | | | | | | |
8.530%, VAR LIBOR+6.000%, 04/13/21 | | | 2,038 | | | | 1,774 | |
MRP Generation Holdings, LLC (TPF), Term Loan B (2016) | | | | | | | | |
9.601%, VAR LIBOR+7.000%, 10/18/22 | | | 1,357 | | | | 1,299 | |
See accompanying notes to financial statements.
CITY NATIONAL ROCHDALE FUNDS | PAGE 97
consolidated schedule of investments |
March 31, 2019 (Unaudited) |
City National Rochdale Fixed Income Opportunities Fund(continued) |
Description | | Face Amount (000)(1) | | | Value (000) | |
NRG Energy Inc, Term Loan B | | | | | | | | |
4.249%, VAR LIBOR+1.750%, 06/30/23 | | $ | 2,044 | | | $ | 2,018 | |
Summit Midstream Partners, Term Loan B | | | | | | | | |
8.499%, VAR LIBOR+6.000%, 05/13/22 | | | 1,466 | | | | 1,450 | |
Talen Energy Supply, Term Loan B-1 | | | | | | | | |
6.500%, VAR LIBOR+4.000%, 07/06/23 | | | 534 | | | | 529 | |
Talen Energy Supply, Term Loan B-2 | | | | | | | | |
6.493%, VAR LIBOR+4.000%, 04/07/24 | | | 2,510 | | | | 2,483 | |
Vistra Operations Company LLC, 2016 Term Loan B-2 | | | | | | | | |
4.749%, VAR LIBOR+2.250%, 12/14/23 | | | 601 | | | | 596 | |
Vistra Operations Company LLC, Term Loan | | | | | | | | |
4.499%, VAR LIBOR+2.000%, 08/04/23 | | | 2,168 | | | | 2,141 | |
Vistra Operations Company LLC, Term Loan B-3 | | | | | | | | |
4.482%, VAR LIBOR+2.000%, 12/31/25 | | | 2,506 | | | | 2,466 | |
Westinghouse (Brookfield), Term Loan B | | | | | | | | |
6.249%, VAR LIBOR+3.750%, 08/01/25 | | | 1,955 | | | | 1,949 | |
| | | | | | | | | |
Total Utility | | | 21,537 | |
| | | | | | | | | |
Wireless Communications [0.1%] |
Sprint Communications, Incremental Term Loan B (new) | | | | | | | | |
5.500%, VAR LIBOR+3.000%, 02/02/24(B) | | | 219 | | | | 216 | |
Sprint Communications, Term Loan B - old | | | | | | | | |
5.000%, VAR LIBOR+2.500%, 02/02/24 | | | 1,936 | | | | 1,883 | |
| | | | | | | | | |
Total Wireless Communications | | | 2,099 | |
| | | | | | | | | |
Total Loan Participations |
(Cost $811,859) | | | 790,964 | |
| | | | | | | | | |
Sovereign Debt [9.8%] |
Argentina Bonar Bonds | | | | | | | | |
45.563%, VAR 30-35d Argentina BADLAR Private Banks+2.000%, 04/03/22 | | ARS | 20,727 | | | | 469 | |
45.325%, VAR 30-35d Argentina BADLAR Private Banks+3.250%, 03/01/20 | | ARS | 2,000 | | | | 45 | |
Argentina Paris Club | | | | | | | | |
2.910%, 05/30/21 | | CHF | 4,140 | | | | 3,991 | |
Argentina POM Politica Monetaria | | | | | | | | |
67.546%, VAR Argentina Central Bank 7 Day Repo Rate+0.000%, 06/21/20 | | ARS | 40,882 | | | | 1,039 | |
Argentina Treasury Bill | | | | | | | | |
0.000%, 07/31/20(F) | | ARS | 2,139 | | | | 47 | |
Argentine Republic Government International Bond | | | | | | | | |
10.250%, 12/31/49(C) | | EUR | 12 | | | | 15 | |
10.000%, 12/31/49(C) | | EUR | 1,401 | | | | 1,693 | |
9.500%, 12/31/49(C) | | EUR | 27 | | | | 33 | |
8.750%, 12/31/49(C) | | EUR | 30 | | | | 30 | |
8.500%, 12/31/49(C) | | EUR | 664 | | | | 731 | |
8.125%, 12/31/49(C) | | EUR | 204 | | | | 224 | |
8.000%, 12/31/49(C) | | EUR | 2,399 | | | | 1,935 | |
7.500%, 12/31/49(C) | | EUR | 52 | | | | 38 | |
7.125%, 12/31/49(C) | | EUR | 97 | | | | 97 | |
7.000%, 12/31/49(C) | | EUR | 141 | | | | 158 | |
5.870%, 03/31/23(C) | | EUR | 28 | | | | 41 | |
0.000%, 12/15/35(C) | | | 49,500 | | | | 1,896 | |
0.000%, 12/31/49(C) | | EUR | 237 | | | | 249 | |
Bonos de la Tesoreria de la Republica en pesos | | | | | | | | |
5.000%, 03/01/35 | | CLP | 3,845,000 | | | | 6,091 | |
See accompanying notes to financial statements.
CITY NATIONAL ROCHDALE FUNDS | PAGE 98
consolidated schedule of investments |
March 31, 2019 (Unaudited) |
City National Rochdale Fixed Income Opportunities Fund(continued) |
Description | | Face Amount (000)(1) | | | Value (000) | |
4.500%, 03/01/21 | | CLP | 1,940,000 | | | $ | 2,920 | |
4.500%, 03/01/26 | | CLP | 445,000 | | | | 679 | |
Brazil Letras do Tesouro Nacional | | | | | | | | |
42.291%, 01/01/22(F) | | BRL | 5,690 | | | | 1,184 | |
36.390%, 07/01/21(F) | | BRL | 41,492 | | | | 9,019 | |
Brazil Notas do Tesouro Nacional Serie F | | | | | | | | |
10.000%, 01/01/23 | | BRL | 50,006 | | | | 13,481 | |
10.000%, 01/01/25 | | BRL | 26,554 | | | | 7,187 | |
10.000%, 01/01/27 | | BRL | 31,808 | | | | 8,603 | |
10.000%, 01/01/29 | | BRL | 5,717 | | | | 1,593 | |
Colombian TES | | | | | | | | |
10.000%, 07/24/24 | | COP | 3,563,900 | | | | 1,331 | |
7.750%, 09/18/30 | | COP | 10,004,900 | | | | 3,411 | |
7.250%, 10/18/34 | | COP | 2,651,700 | | | | 857 | |
7.000%, 05/04/22 | | COP | 19,811,000 | | | | 6,513 | |
7.000%, 06/30/32 | | COP | 9,008,400 | | | | 2,875 | |
6.250%, 11/26/25 | | COP | 4,363,600 | | | | 1,383 | |
6.000%, 04/28/28 | | COP | 4,382,100 | | | | 1,336 | |
Costa Rica Government International Bond | | | | | | | | |
9.995%, 08/01/20 | | | 2,100 | | | | 2,202 | |
Egypt Treasury Bills | | | | | | | | |
0.000%, 07/16/19(F) | | EGP | 12,250 | | | | 674 | |
0.000%, 07/30/19(F) | | EGP | 6,050 | | | | 328 | |
0.000%, 08/13/19(F) | | EGP | 8,600 | | | | 467 | |
0.000%, 10/22/19(F) | | EGP | 28,050 | | | | 1,479 | |
Egyptian Paris Club | | | | | | | | |
5.449%, 01/01/21(B) | | | 6 | | | | 4 | |
Export Credit Bank of Turkey | | | | | | | | |
5.875%, 04/24/19 | | | 800 | | | | 798 | |
Hungary Government Bond | | | | | | | | |
5.500%, 06/24/25 | | HUF | 650,500 | | | | 2,727 | |
3.000%, 06/26/24 | | HUF | 595,170 | | | | 2,210 | |
1.750%, 10/26/22 | | HUF | 58,350 | | | | 206 | |
Indonesia Treasury Bond | | | | | | | | |
11.500%, 09/15/19 | | IDR | 5,902,000 | | | | 426 | |
11.000%, 11/15/20 | | IDR | 2,854,000 | | | | 214 | |
10.500%, 08/15/30 | | IDR | 6,724,000 | | | | 563 | |
9.000%, 03/15/29 | | IDR | 33,241,000 | | | | 2,534 | |
8.750%, 05/15/31 | | IDR | 20,214,000 | | | | 1,515 | |
8.375%, 03/15/24 | | IDR | 42,281,000 | | | | 3,109 | |
8.375%, 09/15/26 | | IDR | 29,742,000 | | | | 2,186 | |
8.375%, 03/15/34 | | IDR | 46,836,000 | | | | 3,375 | |
8.250%, 07/15/21 | | IDR | 39,969,000 | | | | 2,893 | |
8.250%, 05/15/29 | | IDR | 31,065,000 | | | | 2,279 | |
8.250%, 05/15/36 | | IDR | 22,489,000 | | | | 1,606 | |
7.500%, 08/15/32 | | IDR | 33,222,000 | | | | 2,228 | |
7.500%, 05/15/38 | | IDR | 23,662,000 | | | | 1,561 | |
7.000%, 05/15/22 | | IDR | 3,674,000 | | | | 258 | |
7.000%, 05/15/27 | | IDR | 21,300,000 | | | | 1,440 | |
6.625%, 05/15/33 | | IDR | 23,694,000 | | | | 1,456 | |
6.125%, 05/15/28 | | IDR | 59,363,000 | | | | 3,773 | |
5.625%, 05/15/23 | | IDR | 24,689,000 | | | | 1,647 | |
Kenya Government International Bond | | | | | | | | |
5.875%, 06/24/19 | | | 1,138 | | | | 1,139 | |
Malaysia Government Bond | | | | | | | | |
4.642%, 11/07/33 | | MYR | 3,058 | | | | 791 | |
4.498%, 04/15/30 | | MYR | 3,019 | | | | 776 | |
4.378%, 11/29/19 | | MYR | 1,861 | | | | 459 | |
4.232%, 06/30/31 | | MYR | 1,517 | | | | 379 | |
4.181%, 07/15/24 | | MYR | 7,293 | | | | 1,829 | |
3.955%, 09/15/25 | | MYR | 5,198 | | | | 1,293 | |
3.899%, 11/16/27 | | MYR | 2,988 | | | | 735 | |
3.882%, 03/10/22 | | MYR | 7,590 | | | | 1,884 | |
3.844%, 04/15/33 | | MYR | 1,042 | | | | 248 | |
3.795%, 09/30/22 | | MYR | 2,720 | | | | 673 | |
3.757%, 04/20/23 | | MYR | 1,645 | | | | 406 | |
3.620%, 11/30/21 | | MYR | 1,200 | | | | 295 | |
3.418%, 08/15/22 | | MYR | 5,808 | | | | 1,419 | |
Mexican Bonos | | | | | | | | |
10.000%, 12/05/24 | | MXN | 235,880 | | | | 13,341 | |
8.500%, 05/31/29 | | MXN | 35,280 | | | | 1,868 | |
8.000%, 12/07/23 | | MXN | 34,480 | | | | 1,788 | |
7.500%, 06/03/27 | | MXN | 34,190 | | | | 1,706 | |
6.500%, 06/10/21 | | MXN | 156,050 | | | | 7,828 | |
6.500%, 06/09/22 | | MXN | 257,640 | | | | 12,783 | |
Pakistan Government International Bond | | | | | | | | |
7.250%, 04/15/19 | | | 10,095 | | | | 10,072 | |
6.750%, 12/03/19 | | | 3,167 | | | | 3,195 | |
Peruvian Government International Bond | | | | | | | | |
6.950%, 08/12/31 | | PEN | 5,311 | | | | 1,808 | |
6.900%, 08/12/37 | | PEN | 11,128 | | | | 3,758 | |
6.150%, 08/12/32(A) | | PEN | 3,261 | | | | 1,033 | |
5.940%, 02/12/29(A) | | PEN | 4,288 | | | | 1,360 | |
Philippine Government International Bond | | | | | | | | |
6.250%, 01/14/36 | | PHP | 10,000 | | | | 205 | |
4.950%, 01/15/21 | | PHP | 5,000 | | | | 95 | |
3.900%, 11/26/22 | | PHP | 20,000 | | | | 368 | |
Province of Salta Argentina | | | | | | | | |
9.500%, 03/16/22 | | | 62 | | | | 61 | |
Provincia de Buenos Aires | | | | | | | | |
50.693%, VAR 30-35d Argentina BADLAR Private Banks+3.750%, 04/12/25(A) | | ARS | 23,785 | | | | 547 | |
See accompanying notes to financial statements.
CITY NATIONAL ROCHDALE FUNDS | PAGE 99
consolidated schedule of investments |
March 31, 2019 (Unaudited) |
City National Rochdale Fixed Income Opportunities Fund(continued) |
Description | | Face Amount (000)(1) | | | Value (000) | |
5.750%, 06/15/19 | | $ | 2,172 | | | $ | 2,173 | |
0.000%, 0.00%, 0, 05/01/20(G) | | EUR | 250 | | | | 268 | |
Republic of Cameroon International Bond | | | | | | | | |
9.500%, 11/19/25 | | | 11,103 | | | | 11,829 | |
Republic of Poland Government Bond | | | | | | | | |
3.250%, 07/25/25 | | PLN | 8,625 | | | | 2,360 | |
2.750%, 08/25/23 | | PLN | 358 | | | | 124 | |
2.500%, 07/25/26 | | PLN | 10,279 | | | | 2,671 | |
Republic of South Africa Government Bond | | | | | | | | |
10.500%, 12/21/26 | | ZAR | 114,259 | | | | 8,734 | |
9.000%, 01/31/40 | | ZAR | 28,484 | | | | 1,836 | |
8.750%, 01/31/44 | | ZAR | 47,409 | | | | 2,973 | |
8.750%, 02/28/48 | | ZAR | 49,403 | | | | 3,092 | |
8.500%, 01/31/37 | | ZAR | 29,393 | | | | 1,827 | |
8.250%, 03/31/32 | | ZAR | 19,908 | | | | 1,264 | |
8.000%, 01/31/30 | | ZAR | 64,798 | | | | 4,138 | |
7.750%, 02/28/23 | | ZAR | 54,367 | | | | 3,767 | |
7.000%, 02/28/31 | | ZAR | 81,497 | | | | 4,736 | |
6.500%, 02/28/41 | | ZAR | 17,548 | | | | 861 | |
6.250%, 03/31/36 | | ZAR | 3,450 | | | | 173 | |
Romania Government Bond | | | | | | | | |
5.800%, 07/26/27 | | RON | 2,520 | | | | 638 | |
Russian Federal Bond - OFZ | | | | | | | | |
8.500%, 09/17/31 | | RUB | 143,633 | | | | 2,227 | |
7.750%, 09/16/26 | | RUB | 241,056 | | | | 3,600 | |
7.700%, 03/23/33 | | RUB | 97,561 | | | | 1,415 | |
7.600%, 04/14/21 | | RUB | 17,722 | | | | 270 | |
7.500%, 08/18/21 | | RUB | 258,246 | | | | 3,924 | |
7.400%, 12/07/22 | | RUB | 114,507 | | | | 1,725 | |
7.100%, 10/16/24 | | RUB | 83,265 | | | | 1,221 | |
7.050%, 01/19/28 | | RUB | 32,036 | | | | 455 | |
7.000%, 08/16/23 | | RUB | 85,467 | | | | 1,261 | |
6.500%, 02/28/24 | | RUB | 66,975 | | | | 961 | |
Seychelles International Bond | | | | | | | | |
8.000%, 01/01/26 | | | 2,100 | | | | 2,125 | |
Thailand Government Bond | | | | | | | | |
4.875%, 06/22/29 | | THB | 3,673 | | | | 139 | |
3.875%, 06/13/19 | | THB | 1,012 | | | | 32 | |
3.850%, 12/12/25 | | THB | 18,492 | | | | 639 | |
3.775%, 06/25/32 | | THB | 92,181 | | | | 3,234 | |
3.650%, 06/20/31 | | THB | 19,654 | | | | 684 | |
3.625%, 06/16/23 | | THB | 43,670 | | | | 1,463 | |
3.400%, 06/17/36 | | THB | 49,931 | | | | 1,689 | |
3.300%, 06/17/38 | | THB | 29,954 | | | | 988 | |
2.875%, 12/17/28 | | THB | 96,255 | | | | 3,142 | |
2.875%, 06/17/46 | | THB | 16,155 | | | | 476 | |
2.400%, 12/17/23 | | THB | 35,320 | | | | 1,128 | |
2.125%, 12/17/26 | | THB | 39,037 | | | | 1,211 | |
2.000%, 12/17/22 | | THB | 110,174 | | | | 3,477 | |
1.250%, 03/12/28 | | THB | 19,487 | | | | 560 | |
1.200%, 07/14/21 | | THB | 6,700 | | | | 226 | |
Turkey Government Bond | | | | | | | | |
11.000%, 03/02/22 | | TRY | 5,460 | | | | 759 | |
11.000%, 02/24/27 | | TRY | 5,614 | | | | 685 | |
10.700%, 08/17/22 | | TRY | 6,750 | | | | 896 | |
10.500%, 08/11/27 | | TRY | 1,666 | | | | 194 | |
10.400%, 03/20/24 | | TRY | 1,295 | | | | 163 | |
9.500%, 01/12/22 | | TRY | 3,372 | | | | 447 | |
8.800%, 09/27/23 | | TRY | 2,731 | | | | 316 | |
8.000%, 03/12/25 | | TRY | 3,790 | | | | 410 | |
7.100%, 03/08/23 | | TRY | 12,498 | | | | 1,429 | |
3.000%, 02/23/22 | | TRY | 1,286 | | | | 429 | |
Ukraine Government International Bond | | | | | | | | |
7.750%, 09/01/19 | | | 7,147 | | | | 7,169 | |
0.000%, 05/31/40(D) | | | 193 | | | | 123 | |
Uruguay Government International Bond | | | | | | | | |
9.875%, 06/20/22 | | UYU | 15,468 | | | | 458 | |
8.500%, 03/15/28 | | UYU | 8,264 | | | | 215 | |
| | | | | | | | | |
Total Sovereign Debt |
(Cost $327,657) | | | 304,923 | |
| | | | | | | | | |
Mortgage-Backed Securities [5.4%] |
Adagio IV CLO, Ser 2015-X, Cl F | | | | | | | | |
6.650%, VAR Euribor 3 Month+6.650%, 10/15/29 | | EUR | 1,250 | | | | 1,341 | |
AIG CLO, Ser 2019-1A, Cl D | | | | | | | | |
6.783%, VAR ICE LIBOR USD 3 Month+3.960%, 01/20/32(A) | | | 750 | | | | 735 | |
Arch Street CLO, Ser 2018-2A, Cl ER | | | | | | | | |
9.061%, VAR ICE LIBOR USD 3 Month+6.300%, 10/20/28(A) | | | 1,000 | | | | 965 | |
Armada Euro CLO II DAC, Ser 2018-2X, Cl E | | | | | | | | |
4.820%, VAR Euribor 3 Month+4.820%, 11/15/31 | | EUR | 1,500 | | | | 1,554 | |
See accompanying notes to financial statements.
CITY NATIONAL ROCHDALE FUNDS | PAGE 100
consolidated schedule of investments |
March 31, 2019 (Unaudited) |
City National Rochdale Fixed Income Opportunities Fund(continued) |
Description | | Face Amount (000)(1) | | | Value (000) | |
Armada Euro CLO II DAC, Ser 2018-2X, Cl F | | | | | | | | |
6.450%, VAR Euribor 3 Month+6.450%, 11/15/31 | | EUR | 1,000 | | | $ | 977 | |
Avoca CLO XVIII DAC, Ser 2018-18X, Cl C | | | | | | | | |
1.750%, VAR Euribor 3 Month+1.750%, 04/15/31 | | EUR | 5,000 | | | | 5,459 | |
BABSN, Ser 2015-IA, Cl A | | | | | | | | |
8.261%, 01/20/31 | | | 4,000 | | | | 3,698 | |
Black Diamond CLO, Ser 2017-1A, Cl C | | | | | | | | |
6.729%, VAR ICE LIBOR USD 3 Month+3.950%, 04/24/29(A) | | | 5,000 | | | | 4,938 | |
Black Diamond CLO DAC, Ser 2015-1X, Cl F | | | | | | | | |
6.500%, VAR Euribor 3 Month+6.500%, 10/03/29 | | EUR | 1,220 | | | | 1,279 | |
Black Diamond CLO DAC, Ser 2018-1A, Cl BR | | | | | | | | |
4.488%, VAR ICE LIBOR USD 3 Month+1.980%, 04/26/31(A) | | | 4,000 | | | | 3,756 | |
Black Diamond CLO DAC, Ser 2018-1X, Cl DR | | | | | | | | |
2.650%, VAR Euribor 3 Month+2.650%, 10/03/29 | | EUR | 5,000 | | | | 5,505 | |
Carlyle Global Market Strategies Euro CLO DAC, Ser 2018-1X, Cl B1 | | | | | | | | |
1.750%, VAR Euribor 3 Month+1.750%, 05/17/31 | | EUR | 4,500 | | | | 4,835 | |
CarVal CLO, Ser 2018-1A, Cl D | | | | | | | | |
5.669%, VAR ICE LIBOR USD 3 Month+2.890%, 07/16/31(A) | | | 5,000 | | | | 4,741 | |
Cifc Funding, Ser 2018-4RA, Cl D | | | | | | | | |
8.473%, VAR ICE LIBOR USD 3 Month+5.700%, 10/17/30(A) | | | 2,200 | | | | 2,052 | |
Colombia Cent CLO 27, Ser 2018-27A, Cl B | | | | | | | | |
4.790%, VAR ICE LIBOR USD 3 Month+2.300%, 10/25/28(A) | | | 3,000 | | | | 2,949 | |
Colombia Cent CLO 27, Ser 2018-27A, Cl C | | | | | | | | |
5.790%, VAR ICE LIBOR USD 3 Month+3.300%, 10/25/28(A) | | | 3,000 | | | | 2,962 | |
Colombia Cent CLO 27, Ser 2018-27A, Cl D | | | | | | | | |
8.590%, VAR ICE LIBOR USD 3 Month+6.100%, 10/25/28(A) | | | 1,950 | | | | 1,895 | |
Crestline Denali CLO XVI, Ser 2018-1A, Cl C | | | | | | | | |
4.611%, VAR ICE LIBOR USD 3 Month+1.850%, 01/20/30(A) | | | 4,500 | | | | 4,282 | |
CRNPT, Ser 2018-4A, Cl C | | | | | | | | |
4.661%, 04/20/31 | | | 2,750 | | | | 2,622 | |
CRNPT, Ser 2018-4A, Cl D | | | | | | | | |
5.511%, 04/20/31 | | | 3,000 | | | | 2,804 | |
Euro-Galaxy VI CLO DAC, Ser 2018-6X, Cl C | | | | | | | | |
1.550%, VAR Euribor 3 Month+1.550%, 04/11/31 | | EUR | 3,750 | | | | 3,987 | |
Greywolf CLO III, Ser 2018-3RA, Cl B | | | | | | | | |
5.011%, VAR ICE LIBOR USD 3 Month+2.250%, 10/22/28(A) | | | 3,000 | | | | 2,982 | |
Greywolf CLO III, Ser 2018-3RA, Cl C | | | | | | | | |
5.911%, VAR ICE LIBOR USD 3 Month+3.150%, 10/22/28(A) | | | 3,000 | | | | 2,962 | |
Greywolf CLO V, Ser 2018-1A, Cl BR | | | | | | | | |
4.771%, VAR ICE LIBOR USD 3 Month+2.000%, 01/27/31(A) | | | 4,000 | | | | 3,842 | |
See accompanying notes to financial statements.
CITY NATIONAL ROCHDALE FUNDS | PAGE 101
consolidated schedule of investments |
March 31, 2019 (Unaudited) |
City National Rochdale Fixed Income Opportunities Fund(continued) |
Description | | Face Amount (000)(1) | | | Value (000) | |
Grosvenor Place CLO 2015-1 BV, Ser 2018-1X, Cl DRR | | | | | | | | |
5.400%, VAR Euribor 3 Month+5.400%, 10/30/29 | | EUR | 3,800 | | | $ | 4,176 | |
Harvest CLO VIII DAC, Ser 2018-8X, Cl CRR | | | | | | | | |
1.650%, VAR Euribor 3 Month+1.650%, 01/15/31 | | EUR | 2,450 | | | | 2,621 | |
Harvest CLO XIV DAC, Ser 2015-14X, Cl F | | | | | | | | |
6.300%, VAR Euribor 3 Month+6.300%, 11/18/29 | | EUR | 3,250 | | | | 3,350 | |
Harvest CLO XIX DAC, Ser 2018-19X, Cl C | | | | | | | | |
1.700%, VAR Euribor 3 Month+1.700%, 04/14/31 | | EUR | 5,500 | | | | 5,918 | |
Man GLG Euro CLO II DAC, Ser 2016-2X, Cl F | | | | | | | | |
8.750%, VAR Euribor 3 Month+8.750%, 01/15/30 | | EUR | 2,000 | | | | 2,227 | |
Man GLG Euro CLO IV DAC, Ser 2018-4X, Cl C | | | | | | | | |
1.600%, VAR Euribor 3 Month+1.600%, 05/15/31 | | EUR | 3,900 | | | | 4,197 | |
Man GLG Euro CLO V DAC, Ser 2018-5X, Cl D1 | | | | | | | | |
3.550%, VAR Euribor 3 Month+3.550%, 12/15/31 | | EUR | 2,500 | | | | 2,768 | |
Marble Point CLO XII, Ser 2018-1A, Cl D | | | | | | | | |
5.436%, VAR ICE LIBOR USD 3 Month+3.000%, 07/16/31(A) | | | 5,000 | | | | 4,772 | |
Mountain View CLO, Ser 2018-9A, Cl CR | | | | | | | | |
5.556%, VAR ICE LIBOR USD 3 Month+3.120%, 07/15/31(A) | | | 2,500 | | | | 2,398 | |
Mountain View CLO, Ser 2018-9A, Cl DR | | | | | | | | |
8.516%, VAR ICE LIBOR USD 3 Month+6.080%, 07/15/31(A) | | | 2,300 | | | | 2,137 | |
Oak Hill European Credit Partners IV Designated Activity, Ser 2018-4X, Cl DR | | | | | | | | |
2.500%, VAR Euribor 3 Month+2.500%, 01/20/32 | | EUR | 3,000 | | | | 3,243 | |
OAK Hill European Credit Partners V Designated Activity, Ser 2017-5X, Cl F | | | | | | | | |
7.300%, VAR Euribor 3 Month+7.300%, 02/21/30 | | EUR | 1,100 | | | | 1,161 | |
Octagon Investment Partners XXIII, Ser 2018-1A, Cl CR | | | | | | | | |
4.637%, VAR ICE LIBOR USD 3 Month+1.850%, 07/15/27(A) | | | 3,000 | | | | 2,949 | |
OZLM XXII, Ser 2018-22A, Cl B | | | | | | | | |
4.573%, VAR ICE LIBOR USD 3 Month+1.800%, 01/17/31(A) | | | 3,500 | | | | 3,320 | |
OZLM XXII, Ser 2018-22A, Cl D | | | | | | | | |
8.073%, VAR ICE LIBOR USD 3 Month+5.300%, 01/17/31(A) | | | 1,800 | | | | 1,614 | |
OZLME IV DAC, Ser 2018-4X, Cl C1 | | | | | | | | |
1.850%, VAR Euribor 3 Month+1.850%, 07/27/32 | | EUR | 1,850 | | | | 1,999 | |
Parallel, Ser 2018-1A, Cl C | | | | | | | | |
5.561%, VAR ICE LIBOR USD 3 Month+2.800%, 04/20/31(A) | | | 2,000 | | | | 1,885 | |
Providus CLO II DAC, Ser 2018-2X, Cl D | | | | | | | | |
3.450%, VAR Euribor 3 Month+3.450%, 07/15/31 | | EUR | 1,000 | | | | 1,105 | |
Saranac CLO III, Ser 2018-3A, Cl CR | | | | | | | | |
5.174%, VAR ICE LIBOR USD 3 Month+2.350%, 06/22/30(A) | | | 5,000 | | | | 4,918 | |
See accompanying notes to financial statements.
CITY NATIONAL ROCHDALE FUNDS | PAGE 102
consolidated schedule of investments |
March 31, 2019 (Unaudited) |
City National Rochdale Fixed Income Opportunities Fund(continued) |
Description | | Face Amount (000)(1) | | | Value (000) | |
Sorrento Park CLO DAC, Ser 2014-1X, Cl E | | | | | | | | |
5.942%, VAR Euribor 3 Month+6.250%, 11/16/27 | | EUR | 3,000 | | | $ | 3,189 | |
St. Paul’s CLO III-R DAC, Ser 2018-3RX, Cl CR | | | | | | | | |
1.600%, VAR Euribor 3 Month+1.600%, 01/15/32 | | EUR | 2,750 | | | | 2,952 | |
Toro European CLO 2 DAC, Ser 2018-2X, Cl CR | | | | | | | | |
2.400%, VAR Euribor 3 Month+2.400%, 10/15/30 | | EUR | 2,000 | | | | 2,245 | |
Tralee CLO V, Ser 2018-5A, Cl D | | | | | | | | |
5.959%, VAR ICE LIBOR USD 3 Month+3.200%, 10/20/28(A) | | | 3,000 | | | | 2,936 | |
Trinitas CLO III, Ser 2018-3A, Cl CR | | | | | | | | |
4.687%, VAR ICE LIBOR USD 3 Month+1.900%, 07/15/27(A) | | | 4,000 | | | | 3,929 | |
Venture CDO, Ser 2018-31A, Cl C1 | | | | | | | | |
4.711%, 04/20/31 | | | 4,000 | | | | 3,825 | |
VIBR, Ser 2018-8A | | | | | | | | |
8.511%, 01/20/31 | | | 2,000 | | | | 1,845 | |
Voya Euro CLO I DAC, Ser 2018-1X, Cl C | | | | | | | | |
1.600%, VAR Euribor 3 Month+1.600%, 10/15/30 | | EUR | 2,500 | | | | 2,696 | |
Voya Euro CLO I DAC, Ser 2018-1X, Cl D | | | | | | | | |
2.500%, VAR Euribor 3 Month+2.500%, 10/15/30 | | EUR | 3,075 | | | | 3,270 | |
Z Capital Credit Partners CLO, Ser 2018-1A, Cl DR | | | | | | | | |
5.879%, VAR ICE LIBOR USD 3 Month+3.100%, 07/16/27(A) | | | 4,000 | | | | 3,914 | |
|
Description | | Face Amount (000)(1)
/Acquisition Cost (000) | | | Value (000) | |
Zais CLO 8, Ser 2018-1A, Cl C | | | | | | | | |
4.537%, VAR ICE LIBOR USD 3 Month+1.750%, 04/15/29(A) | | $ | 4,000 | | | $ | 3,810 | |
| | | | | | | | | |
Total Mortgage-Backed Securities |
(Cost $183,177) | | | 169,252 | |
| | | | | | | | | |
Life Settlement Contracts [4.4%](B)(H)(I) |
American General Life #460L, Acquired 05/30/2014 | | | 303 | | | | 649 | |
American General Life #508L, Acquired 05/30/2014 | | | 2,595 | | | | 3,510 | |
American General Life #542L, Acquired 07/30/2015 | | | 83 | | | | 403 | |
American General Life #634L, Acquired 05/30/2014 | | | 530 | | | | 2,947 | |
American General Life #906L, Acquired 07/30/2015 | | | 479 | | | | 3,063 | |
American General Life #964L, Acquired 07/30/2015 | | | 1,459 | | | | 1,826 | |
AXA Equitable Life #0474, Acquired 11/04/2013 | | | 7,290 | | | | 8,022 | |
AXA Equitable Life #1616, Acquired 05/30/2014 | | | 3,254 | | | | 4,437 | |
AXA Equitable Life #1898, Acquired 11/04/2013 | | | 441 | | | | 896 | |
AXA Equitable Life #7233, Acquired 11/04/2013 | | | 395 | | | | 1,634 | |
AXA Equitable Life #7578, Acquired 11/04/2013 | | | 2,104 | | | | 4,409 | |
AXA Equitable Life #7857, Acquired 11/04/2013 | | | 2,297 | | | | 1,865 | |
AXA Equitable Life #8538, Acquired 11/04/2013 | | | 1,333 | | | | 1,612 | |
AXA Equitable Life #9345, Acquired 11/04/2013 | | | 143 | | | | 364 | |
Guardian Insurance #0346, Acquired 11/04/2013 | | | 646 | | | | 3,282 | |
Hartford Life #4700, Acquired 11/24/2015 | | | 81 | | | | 109 | |
Hartford Life #7522, Acquired 11/24/2015 | | | 805 | | | | 2,571 | |
ING Reliastar #1234, Acquired 12/05/2013 | | | 1,067 | | | | 3,786 | |
See accompanying notes to financial statements.
CITY NATIONAL ROCHDALE FUNDS | PAGE 103
consolidated schedule of investments |
March 31, 2019 (Unaudited) |
City National Rochdale Fixed Income Opportunities Fund(continued) |
Description | | Acquisition Cost (000) | | | Value (000) | |
ING Reliastar #3394, Acquired 05/30/2014 | | $ | 3,687 | | | $ | 7,037 | |
ING Reliastar #4842, Acquired 11/20/2013 | | | 921 | | | | 4,180 | |
ING Reliastar #776H, Acquired 05/30/2014 | | | 1,518 | | | | 1,906 | |
John Hancock #0430, Acquired 05/30/2014 | | | 2,418 | | | | 4,312 | |
John Hancock #0801, Acquired 05/30/2014 | | | 1,564 | | | | 2,165 | |
John Hancock #1929, Acquired 05/30/2014 | | | 3,812 | | | | 4,023 | |
John Hancock #5072, Acquired 05/30/2014 | | | 1,409 | | | | 2,961 | |
John Hancock #5080, Acquired 11/19/2013 | | | 313 | | | | 2,933 | |
John Hancock #5885, Acquired 05/30/2014 | | | 894 | | | | 1,518 | |
John Hancock #6686, Acquired 05/30/2014 | | | 3,035 | | | | 2,843 | |
John Hancock #6912, Acquired 05/30/2014 | | | 1,065 | | | | 2,078 | |
Lincoln National #0019, Acquired 09/18/2015 | | | 2,460 | | | | 4,561 | |
Lincoln National #4654, Acquired 05/30/2014 | | | 721 | | | | 632 | |
Lincoln National #4754, Acquired 09/18/2015 | | | 610 | | | | 3,355 | |
Lincoln National #4754, Acquired 09/18/2015 | | | 1,029 | | | | 4,026 | |
Lincoln National #5658, Acquired 09/18/2015 | | | 329 | | | | 1,258 | |
Lincoln National #7099, Acquired 09/18/2015 | | | 1,254 | | | | 2,529 | |
Lincoln National #8558, Acquired 09/18/2015 | | | 1,659 | | | | 3,969 | |
Mass Mutual #1849, Acquired 11/05/2013 | | | 2,926 | | | | 6,061 | |
Mass Mutual #5167, Acquired 05/30/2014 | | | 63 | | | | 2,055 | |
Mass Mutual #5681, Acquired 11/05/2013 | | | 288 | | | | 2,548 | |
Mass Mutual #5864, Acquired 05/30/2014 | | | 4,668 | | | | 25 | |
Met Life #8MLU, Acquired 05/30/2014 | | | 1,413 | | | | 1,684 | |
Penn Life #8183, Acquired 10/18/2016 | | | 46 | | | | 94 | |
Penn Mutual #3106, Acquired 05/30/2014 | | | 1,294 | | | | 1,663 | |
Phoenix Life #5715, Acquired 10/18/2016 | | | 569 | | | | 1,865 | |
Phoenix Life #6157, Acquired 10/18/2016 | | | 569 | | | | 1,894 | |
Description | | Acquisition Cost (000)/Shares | | | Value (000) | |
Phoenix Life #6161, Acquired 05/30/2014 | | $ | 3,472 | | | $ | 7,669 | |
Phoenix Life #8499, Acquired 05/30/2014 | | | 756 | | | | 1,072 | |
Phoenix Life #8509, Acquired 05/30/2014 | | | 761 | | | | 1,072 | |
Principal Financial #6653, Acquired 10/30/2013 | | | 306 | | | | 270 | |
Prudential #5978, Acquired 10/02/2015 | | | 372 | | | | 1,703 | |
Security Mutual Life #5380, Acquired 10/30/2013 | | | 410 | | | | 80 | |
Transamerica #1708, Acquired 10/28/2013 | | | 957 | | | | 2,421 | |
Transamerica #3426, Acquired 11/12/2013 | | | 274 | | | | 529 | |
Transamerica #8205, Acquired 10/28/2013 | | | 714 | | | | 1,875 | |
| | | | | | | | | |
Total Life Settlement Contracts |
(Cost $73,861) | | | 136,251 | |
| | | | | | | | | |
Open-End Funds [1.6%] |
AllianceBernstein Global High Income Fund | | | 521,479 | | | | 6,044 | |
BlackRock Muni Intermediate Duration Fund | | | 306,224 | | | | 4,217 | |
BlackRock MuniHoldings California Quality Fund | | | 416,015 | | | | 5,512 | |
BlackRock MuniHoldings New Jersey Quality Fund | | | 282,510 | | | | 3,865 | |
Eaton Vance Floating-Rate Income Trust | | | 440,766 | | | | 5,814 | |
Invesco Dynamic Credit Opportunities Fund | | | 550,242 | | | | 5,970 | |
Nuveen California AMT-Free Quality Municipal Income Fund | | | 427,965 | | | | 5,957 | |
Nuveen Floating Rate Income Opportunity Fund | | | 439,289 | | | | 4,213 | |
Nuveen Quality Municipal Income Fund | | | 397,127 | | | | 5,389 | |
Tortoise Power and Energy Infrastructure Fund | | | 122,576 | | | | 2,281 | |
| | | | | | | | | |
Total Open-End Funds |
(Cost $49,010) | | | 49,262 | |
| | | | | | | | | |
See accompanying notes to financial statements.
CITY NATIONAL ROCHDALE FUNDS | PAGE 104
consolidated schedule of investments |
March 31, 2019 (Unaudited) |
City National Rochdale Fixed Income Opportunities Fund(continued) |
Description | | Shares/Number of Warrants | | | Value (000) | |
Common Stock [0.4%] |
Consumer Cyclical [0.1%] |
TruKid* | | | 257 | | | $ | 1,325 | |
| | | | | | | | | |
Diversified Minerals [0.0%] |
New World Resources, Cl A* | | | 44,276,198 | | | | 86 | |
| | | | | | | | | |
Energy [0.0%] |
Templar Energy, Cl A* | | | 105,419 | | | | 33 | |
| | | | | | | | | |
Hotels, Restaurants & Leisure [0.0%] |
Caesars Entertainment* | | | 68,920 | | | | 599 | |
| | | | | | | | | |
Oil, Gas & Consumable Fuels [0.3%] |
Gulf Keystone Petroleum* | | | 2,140,000 | | | | 7,080 | |
Savannah Petroleum* | | | 4,307,451 | | | | 1,408 | |
| | | | | | | | | |
Total Oil, Gas & Consumable Fuels | | | 8,488 | |
| | | | | | | | | |
Services [0.0%] |
A’ayan Leasing & Investment KSCP* | | | 1,169,438 | | | | 140 | |
| | | | | | | | | |
Software [0.0%] |
Avaya Holdings* | | | 63,630 | | | | 1,071 | |
| | | | | | | | | |
Total Common Stock |
(Cost $9,176) | | | 11,742 | |
| | | | | | | | | |
Limited Partnership [0.3%] |
Financial Services [0.3%] |
Cartesian LP* | | | 1 | | | | 11,199 | |
| | | | | | | | | |
Total Limited Partnership |
(Cost $10,000) | | | 11,199 | |
| | | | | | | | | |
Closed-End Fund [0.2%] |
Stone Ridge Reinsurance Risk Premium Interval Fund*(H) | | | 864,834 | | | | 7,083 | |
| | | | | | | | | |
Total Closed-End Fund |
(Cost $8,727) | | | 7,083 | |
| | | | | | | | | |
Warrant [0.1%] |
Central Bank of Nigeria, | | | | | | | | |
Expires 11/15/20, Strike Price $0.0001 | | | 49,000 | | | | 2,573 | |
| | | | | | | | | |
Total Warrant |
(Cost $6,407) | | | 2,573 | |
Description | | Face Amount (000)(1)/Shares | | | Value (000) | |
Convertible Bond [0.1%] |
Investment Companies [0.1%] |
Aabar Investments PJSC, MTN | | | | | | | | |
0.500%, 03/27/20 | | EUR | 2,000 | | | $ | 2,165 | |
| | | | | | | | | |
Total Convertible Bond |
(Cost $2,153) | | | 2,165 | |
| | | | | | | | | |
Short-Term Investment** [10.4%] |
SEI Daily Income Trust Government Fund, Cl F, 2.196% | | | 322,521,828 | | | | 322,522 | |
| | | | | | | | | |
Total Short-Term Investment |
(Cost $322,522) | | | 322,522 | |
| | | | | | | | | |
Total Investments [99.2%] |
(Cost $3,144,676) | | $ | 3,108,093 | |
| | | | | | | | | |
Percentages are based on net assets of $3,115,422 (000).
* | Non-income producing security. |
** | The rate reported is the 7-day effective yield as of March 31, 2019. |
(1) | U.S. Dollars unless otherwise indicated. |
(A) | Security exempt from registration under Rule 144A of the Securities Act of 1933. These securities may be resold in transactions exempt from registration normally to qualified institutions. On March 31, 2019, the value of these securities amounted to $389,995 (000), representing 12.5% of the net assets of the Fund. |
(B) | Level 3 security in accordance with fair value hierarchy. |
(C) | In default on interest payments. Rate shown represents the last coupon rate prior to default. |
(D) | Variable or floating rate security, the interest rate of which adjusts periodically based on changes in current interest rates and prepayments on the underlying pool of assets. |
(E) | Unsettled bank loan, Interest rate not available. |
(F) | Zero coupon security. The rate reported is the effective yield at time of purchase. |
(G) | Step Bond — The rate reported is the rate in effect on March 31, 2019. The coupon on a step bond changes on a specific date. |
(H) | Security is considered illiquid. The total market value of such security as of March 31, 2019, was $143,334 (000) and represented 4.6% of the net assets of the Fund. |
(I) | Security is considered restricted. The total market value of such securities as of March 31, 2019, was $136,251 (000) and represented 4.4% of the Net Assets of the Fund. |
See accompanying notes to financial statements.
CITY NATIONAL ROCHDALE FUNDS | PAGE 105
consolidated schedule of investments |
March 31, 2019 (Unaudited) |
City National Rochdale Fixed Income Opportunities Fund(continued) |
AMT — Alternative Minimum Tax (subject to)
ARS — Argentine Peso
BADLAR — Buenos Aires Deposits of Large Amount Rate
BRL — Brazilian Real
��
CDO — Collateralized Debt Obligation
CHF — Swiss Franc
Cl — Class
CLP — Chilean Peso
CLO — Collateralized Loan Obligation
CNH — Chinese Yuan Offshore
CNY — Chinese Yuan Onshore
COP — Colombian Peso
CZK — Czech Koruna
EGP — Egyptian Pound
EUR — Euro
EURIBOR — Euro Interbank Offered Rates
GBP — British Pound Sterling
HUF — Hungarian Forint
ICE— Intercontinental Exchange
IDR — Indonesian Rupiah
INR — Indian Rupee
JPY — Japanese Yen
JSC — Joint-Stock Company
LIBOR — London Interbank Offered Rates
LLC — Limited Liability Company
LP — Limited Partnership
Ltd. — Limited
MTN — Medium Term Note
MXN — Mexican Peso
MYR — Malaysian Ringgit
PEN — Peruvian Nuevo Sol
PHP— Philippine Peso
PIK — Payment-in-Kind
PJSC — Public Joint-Stock Company
PLC — Public Limited Company
PLN — Polish Zloty
RON — Romanian Leu
RUB — Russian Ruble
Ser — Series
SPV — Special Purpose Vehicle
THB — Thai Bhat
TRY — Turkish Lira
UAH — Ukrainian Hryvnia
ULC — Unlimited Liability Company
USD — U.S. Dollar
UYU — Uruguayan Peso
VAR — Variable Rate
ZAR — South African Rand
A list of the open forward foreign currency contracts held by the Fund at March 31, 2019, is as follows:
Counterparty | Settlement
Date | Currency to
Deliver
(000) | Currency to
Receive
(000) | | Unrealized
Appreciation
(Depreciation)
(000) | |
BNP Paribas | 04/08/19 - 04/22/19 | USD | | | 576 | | ARS | | | 23,821 | | | $ | (36 | ) |
BNP Paribas | 04/08/19 | ARS | | | 22,194 | | USD | | | 528 | | | | 21 | |
BNP Paribas | 04/30/19 | USD | | | 2,721 | | HUF | | | 758,940 | | | | (65 | ) |
BNP Paribas | 04/30/19 | USD | | | 3,496 | | CNH | | | 23,664 | | | | 23 | |
BNP Paribas | 04/30/19 - 05/31/19 | USD | | | 5,079 | | RON | | | 21,363 | | | | (69 | ) |
BNP Paribas | 04/30/19 | ZAR | | | 5,646 | | USD | | | 387 | | | | (3 | ) |
BNP Paribas | 04/30/19 | CZK | | | 9,322 | | USD | | | 413 | | | | 7 | |
BNP Paribas | 04/30/19 - 05/31/19 | IDR | | | 24,508,601 | | USD | | | 1,703 | | | | (3 | ) |
BNP Paribas | 05/03/19 - 12/03/19 | BRL | | | 47,388 | | USD | | | 11,957 | | | | 88 | |
BNP Paribas | 05/31/19 | USD | | | 5,515 | | CNY | | | 37,045 | | | | (5 | ) |
BNP Paribas | 06/28/19 | USD | | | 3,412 | | PLN | | | 12,920 | | | | (37 | ) |
BNP Paribas | 06/28/19 | USD | | | 8,156 | | CZK | | | 183,643 | | | | (155 | ) |
BT Brokerage | 04/02/19 | USD | | | 465 | | BRL | | | 1,744 | | | | (20 | ) |
BT Brokerage | 04/11/19 - 04/15/19 | USD | | | 1,270 | | ARS | | | 52,210 | | | | (86 | ) |
BT Brokerage | 04/30/19 | USD | | | 938 | | MXN | | | 18,111 | | | | (9 | ) |
BT Brokerage | 04/30/19 | USD | | | 1,011 | | ZAR | | | 14,320 | | | | (22 | ) |
BT Brokerage | 04/30/19 | USD | | | 2,710 | | THB | | | 84,440 | | | | (47 | ) |
BT Brokerage | 04/30/19 | USD | | | 3,021 | | RUB | | | 202,428 | | | | 49 | |
BT Brokerage | 04/30/19 | MXN | | | 5,808 | | USD | | | 300 | | | | 2 | |
BT Brokerage | 04/30/19 | USD | | | 11,506 | | PLN | | | 43,389 | | | | (194 | ) |
BT Brokerage | 04/30/19 | RUB | | | 157,890 | | USD | | | 2,437 | | | | 43 | |
BT Brokerage | 05/31/19 | INR | | | 97,407 | | USD | | | 1,351 | | | | (40 | ) |
BT Brokerage | 05/31/19 | IDR | | | 29,819,641 | | USD | | | 2,081 | | | | 10 | |
Citigroup | 04/30/19 | USD | | | 445 | | ZAR | | | 6,300 | | | | (10 | ) |
Citigroup | 04/30/19 | USD | | | 1,189 | | THB | | | 37,042 | | | | (21 | ) |
Citigroup | 04/30/19 | TRY | | | 2,765 | | USD | | | 500 | | | | 21 | |
Credit Suisse First Boston | 04/11/19 - 04/30/19 | ARS | | | 108,676 | | USD | | | 2,507 | | | | 71 | |
Credit Suisse First Boston | 04/30/19 | USD | | | 252 | | RUB | | | 16,735 | | | | 2 | |
Credit Suisse First Boston | 04/30/19 | USD | | | 791 | | PEN | | | 2,646 | | | | 5 | |
Credit Suisse First Boston | 04/30/19 | USD | | | 3,200 | | CLP | | | 2,155,974 | | | | (31 | ) |
Credit Suisse First Boston | 04/30/19 | USD | | | 4,315 | | COP | | | 13,506,834 | | | | (86 | ) |
Credit Suisse First Boston | 04/30/19 | CLP | | | 2,864,082 | | USD | | | 4,327 | | | | 118 | |
Deutsche Bank | 04/02/19 | BRL | | | 11,353 | | USD | | | 2,922 | | | | 22 | |
Deutsche Bank | 05/03/19 | BRL | | | 4,012 | | USD | | | 1,019 | | | | (3 | ) |
Deutsche Bank | 04/30/19 | USD | | | 150 | | PHP | | | 7,905 | | | | — | |
Deutsche Bank | 04/30/19 | MYR | | | 490 | | USD | | | 121 | | | | 1 | |
Deutsche Bank | 04/30/19 | USD | | | 2,070 | | CZK | | | 47,057 | | | | (24 | ) |
Deutsche Bank | 04/30/19 | MXN | | | 13,209 | | USD | | | 680 | | | | 3 | |
Deutsche Bank | 04/30/19 | MXN | | | 54,623 | | USD | | | 2,780 | | | | (20 | ) |
Deutsche Bank | 04/30/19 | COP | | | 8,898,161 | | USD | | | 2,805 | | | | 19 | |
Deutsche Bank | 05/31/19 | USD | | | 3,507 | | HUF | | | 974,439 | | | | (88 | ) |
Deutsche Bank | 05/31/19 | USD | | | 5,510 | | PLN | | | 20,977 | | | | (36 | ) |
Deutsche Bank | 05/31/19 | ZAR | | | 49,386 | | USD | | | 3,397 | | | | — | |
Deutsche Bank | 05/31/19 | INR | | | 97,639 | | USD | | | 1,351 | | | | (44 | ) |
See accompanying notes to financial statements.
CITY NATIONAL ROCHDALE FUNDS | PAGE 106
consolidated schedule of investments |
March 31, 2019 (Unaudited) |
City National Rochdale Fixed Income Opportunities Fund(continued) |
Counterparty | Settlement
Date | Currency to
Deliver
(000) | Currency to
Receive
(000) | | Unrealized
Appreciation
(Depreciation)
(000) | |
JPMorgan Chase Bank | 04/30/19 | USD | | | 537 | | ZAR | | | 7,691 | | | $ | (6 | ) |
JPMorgan Chase Bank | 04/30/19 | USD | | | 601 | | CZK | | | 13,813 | | | | — | |
JPMorgan Chase Bank | 04/30/19 | RON | | | 2,331 | | USD | | | 547 | | | | — | |
JPMorgan Chase Bank | 04/30/19 - 05/31/19 | USD | | | 4,883 | | TRY | | | 27,622 | | | | (107 | ) |
JPMorgan Chase Bank | 04/30/19 - 05/31/19 | IDR | | | 62,635,110 | | USD | | | 4,415 | | | | 43 | |
JPMorgan Chase Bank | 06/28/19 | USD | | | 2,528 | | RON | | | 10,648 | | | | (34 | ) |
JPMorgan Chase Bank | 06/28/19 | USD | | | 3,413 | | PLN | | | 12,920 | | | | (39 | ) |
Merrill Lynch | 04/02/19 | USD | | | 9,612 | | BRL | | | 35,934 | | | | (434 | ) |
Merrill Lynch | 04/02/19 | BRL | | | 26,326 | | USD | | | 6,768 | | | | 44 | |
Merrill Lynch | 04/30/19 | USD | | | 803 | | PLN | | | 2,974 | | | | (27 | ) |
Merrill Lynch | 04/30/19 | USD | | | 1,124 | | ZAR | | | 16,302 | | | | 2 | |
Merrill Lynch | 04/30/19 | USD | | | 2,081 | | ZAR | | | 29,685 | | | | (31 | ) |
Merrill Lynch | 04/30/19 | MXN | | | 20,529 | | USD | | | 1,055 | | | | 2 | |
Merrill Lynch | 04/30/19 | ZAR | | | 27,355 | | USD | | | 2,003 | | | | 114 | |
Merrill Lynch | 04/30/19 | ZAR | | | 9,173 | | USD | | | 633 | | | | (1 | ) |
Merrill Lynch | 05/03/19 | BRL | | | 3,744 | | USD | | | 956 | | | | 1 | |
Merrill Lynch | 05/03/19 | USD | | | 6,756 | | BRL | | | 26,326 | | | | (46 | ) |
Merrill Lynch | 05/31/19 | USD | | | 1,068 | | CZK | | | 24,035 | | | | (22 | ) |
Merrill Lynch | 06/28/19 | USD | | | 3,556 | | HUF | | | 974,439 | | | | (131 | ) |
Morgan Stanley | 04/30/19 | USD | | | 943 | | CNH | | | 6,388 | | | | 8 | |
Morgan Stanley | 04/30/19 | RON | | | 2,865 | | USD | | | 695 | | | | 23 | |
Morgan Stanley | 04/30/19 | USD | | | 2,207 | | RUB | | | 147,187 | | | | 25 | |
Morgan Stanley | 05/31/19 | USD | | | 2,886 | | RUB | | | 190,466 | | | | (9 | ) |
Morgan Stanley | 04/30/19 | CNH | | | 14,930 | | USD | | | 2,215 | | | | (6 | ) |
Morgan Stanley | 04/30/19 | ZAR | | | 83,590 | | USD | | | 5,992 | | | | 219 | |
Morgan Stanley | 04/30/19 | RUB | | | 195,983 | | USD | | | 2,947 | | | | (25 | ) |
Standard Bank | 04/30/19 | USD | | | 699 | | CZK | | | 15,611 | | | | (20 | ) |
Standard Bank | 04/30/19 | CNH | | | 14,934 | | USD | | | 2,214 | | | | (7 | ) |
Standard Bank | 04/30/19 | MXN | | | 327,849 | | USD | | | 16,863 | | | | 54 | |
Standard Bank | 05/31/19 | USD | | | 2,728 | | INR | | | 193,252 | | | | 33 | |
Standard Bank | 05/31/19 | IDR | | | 18,327,000 | | USD | | | 1,273 | | | | (1 | ) |
U.S. Bank | 04/05/19 - 06/28/19 | GBP | | | 38,720 | | USD | | | 50,814 | | | | 333 | |
U.S. Bank | 04/05/19 - 06/28/19 | EUR | | | 257,390 | | USD | | | 291,031 | | | | 2,076 | |
U.S. Bank | 04/17/19 | USD | | | 1,236 | | EUR | | | 1,093 | | | | (8 | ) |
U.S. Bank | 05/29/19 | CHF | | | 6,000 | | USD | | | 6,274 | | | | 215 | |
U.S. Bank | 05/31/19 | JPY | | | 210,500 | | USD | | | 1,907 | | | | (2 | ) |
| | | | | | | | | | | | | | $ | 1,587 | |
A list of the open centrally cleared swap agreements held by the Fund at March 31, 2019, is as follows:
Interest Rate Swaps |
Fund Pays | Fund
Receives | Payment
Frequency | Termination
Date | Currency |
8.255% | MXIBTIIE | Monthly | 12/06/28 | MXN |
8.41% | MXIBTIIE | Monthly | 12/06/28 | MXN |
MXIBTIIE | 8.1564% | Monthly | 12/13/23 | MXN |
WIBR6M | 2.4% | Annually | 03/26/23 | PLN |
Interest Rate Swaps |
Fund Pays | | Notional
Amount
(000) | | | Premiums
Paid
(000) | | | Unrealized
Appreciation
(Depreciation)
(000) | | | Swap
Contracts,
at Value
(000) | |
8.255% | | | 73,000 | | | $ | — | | | $ | (104 | ) | | $ | (104 | ) |
8.41% | | | 110,000 | | | | — | | | | (221 | ) | | | (221 | ) |
MXIBTIIE | | | 137,000 | | | | — | | | | 320 | | | | 320 | |
WIBR6M | | | 20,820 | | | | — | | | | 190 | | | | 190 | |
| | | | | | | $ | — | | | $ | 185 | | | $ | 185 | |
The following is a list of the inputs used as of March 31, 2019, in valuing the Fund’s investments and other financial instruments carried at value (000):
Investments in Securities | | Level 1 | | | Level 2 | | | Level 3(1) | | | Total | |
Corporate Bonds | | $ | — | | | $ | 1,300,144 | | | $ | 13 | | | $ | 1,300,157 | |
Loan Participations | | | — | | | | 788,724 | | | | 2,240 | | | | 790,964 | |
Sovereign Debt | | | — | | | | 304,919 | | | | 4 | | | | 304,923 | |
Mortgage-Backed Securities | | | — | | | | 169,252 | | | | — | | | | 169,252 | |
Life Settlement Contracts | | | — | | | | — | | | | 136,251 | | | | 136,251 | |
Open-End Funds | | | 49,262 | | | | — | | | | — | | | | 49,262 | |
Common Stock | | | 10,298 | | | | 1,444 | | | | — | | | | 11,742 | |
Limited Partnership | | | — | | | | 11,199 | | | | — | | | | 11,199 | |
Closed-End Fund | | | 7,083 | | | | — | | | | — | | | | 7,083 | |
Warrant | | | 2,573 | | | | — | | | | — | | | | 2,573 | |
Convertible Bond | | | — | | | | 2,165 | | | | — | | | | 2,165 | |
Short-Term Investment | | | 322,522 | | | | — | | | | — | | | | 322,522 | |
Total Investments in Securities | | $ | 391,738 | | | $ | 2,577,847 | | | $ | 138,508 | | | $ | 3,108,093 | |
See accompanying notes to financial statements.
CITY NATIONAL ROCHDALE FUNDS | PAGE 107
consolidated schedule of investments |
March 31, 2019 (Unaudited) |
City National Rochdale Fixed Income Opportunities Fund(continued) |
Other Financial Instruments | | Level 1 | | | Level 2 | | | Level 3 | | | Total | |
Forward Contracts* | | | | | | | | | | | | | | | | |
Unrealized Appreciation | | $ | — | | | $ | 3,697 | | | $ | — | | | $ | 3,697 | |
Unrealized Depreciation | | | — | | | | (2,110 | ) | | | — | | | | (2,110 | ) |
Centrally Cleared Swaps | | | | | | | | | | | | | | | | |
Interest Rate Swaps* | | | | | | | | | | | | | | | | |
Unrealized Appreciation | | | — | | | | 510 | | | | — | | | | 510 | |
Unrealized Depreciation | | | — | | | | (325 | ) | | | — | | | | (325 | ) |
Total Other Financial Instruments | | $ | — | | | $ | 1,772 | | | $ | — | | | $ | 1,772 | |
* | Forward contracts and swap contracts are valued at the unrealized appreciation/(depreciation) on the instrument. |
(1) | Of the $138,508 (000) in Level 3 securities as of March 31, 2019, $136,251 (000) or 98.4% are not valued via third party pricing vendors and broker quotes. If significant, the disclosure of the unobservable inputs and the interrelationships and sensitivity between them is required for those Level 3 securities that are not valued by third party vendors or broker quotes. |
The following is a reconciliation of investments in which significant unobservable inputs (Level 3) were used in determining value as of March 31, 2019:
| | | Investments
in Loan
Participations
(000) | | | Investments in
Life Settlement
Contracts
(000) | | | Investments in
Sovereign Debt
(000) | |
Beginning balance as of October 1, 2018 | | $ | 1,311 | | | $ | 142,927 | | | $ | 4 | |
Accrued discounts/ premiums | | | (19 | ) | | | — | | | | — | |
Realized gain/(loss) | | | (257 | ) | | | 9,510 | | | | — | |
Change in unrealized appreciation/ (depreciation) | | | (27 | ) | | | (16,186 | ) | | | — | |
Purchases | | | — | | | | — | | | | — | |
Sales/paydowns | | | 56 | | | | — | | | | — | |
Transfers into Level 3 | | | 1,176 | | | | — | | | | — | |
Transfers out of Level 3 | | | — | | | | — | | | | — | |
Ending balance as of March 31, 2019 | | $ | 2,240 | | | $ | 136,251 | | | $ | 4 | |
Changes in unrealized gains/(losses) included in earnings related to securities still held at reporting date | | $ | (27 | ) | | $ | (16,186 | ) | | $ | — | |
| | | Total
(000) | |
Beginning balance as of October 1, 2018 | | $ | 144,242 | |
Accrued discounts/ premiums | | | (19 | ) |
Realized gain/(loss) | | | 9,436 | |
Change in unrealized appreciation/ (depreciation) | | | (16,213 | ) |
Purchases | | | 27 | |
Sales/paydowns | | | (141 | ) |
Transfers into Level 3 | | | 1,176 | |
Transfers out of Level 3 | | | — | |
Ending balance as of March 31, 2019 | | $ | 138,508 | |
Changes in unrealized gains/(losses) included in earnings related to securities still held at reporting date | | $ | (16,213 | ) |
Amounts designated as “—“ are either $0 or have been rounded to $0.
See accompanying notes to financial statements.
CITY NATIONAL ROCHDALE FUNDS | PAGE 108
consolidated schedule of investments |
March 31, 2019 (Unaudited) |
City National Rochdale Fixed Income Opportunities Fund(concluded) |
The following table summarizes the quantitative inputs and assumptions used for items categorized as material level 3 investments as of March 31, 2019. The disclosures below also include qualitative information on the sensitivity of the fair value measurements to changes in the significant unobservable inputs.
| | | Fair Value at
March 31, 2019
(000) | | Valuation Techniques | | | |
Life Settlement Contracts | | | $136,251 | | Discounted Cash Flow Model | | | |
| | | | | | | | | |
| | | | | | Observable Inputs | | | |
| | | | | | Maturity Value | | | |
| | | | | | | | | |
| | | | | | Unobservable Inputs | | Range | |
| | | | | | Discount Rate | | 13.5% | |
| | | | | | Expected Maturity (months) | | 6-130 months | |
The unobservable inputs used to determine fair value of recurring level 3 assets may have similar or diverging impacts on valuation. Significant increases and decreases in these inputs in isolation and the interrelationships between them could result in significantly higher or lower fair value measurements. Increases in projected collection rates in isolation would result in a higher fair value measurement, while increases in expected discount rates, projected default rates, and maturities of life settlement contracts, in isolation, would result in a lower fair value measurement.
For the period ended March 31, 2019, there have been no transfers between any of the fair value hierarchy levels. Transfers between levels are recognized at period end.
For more information on the Fund’s policy regarding valuation of investments and other significant accounting policies, please refer to the Fund’s most recent semi-annual or annual financial statements.
See accompanying notes to financial statements.
CITY NATIONAL ROCHDALE FUNDS | PAGE 109
schedule of investments |
March 31, 2019 (Unaudited) |
City National Rochdale Dividend & Income Fund |
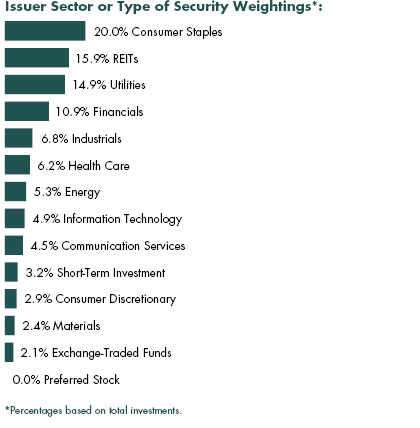
Description | | Shares | | | Value (000) | |
Common Stock [91.7%] |
Communication Services [4.3%] |
AT&T | | | 98,500 | | | $ | 3,089 | |
Verizon Communications | | | 119,167 | | | | 7,046 | |
| | | | | | | | | |
Total Communication Services | | | 10,135 | |
| | | | | | | | | |
Consumer Discretionary [2.9%] |
Cedar Fair (A) | | | 28,000 | | | | 1,473 | |
McDonald’s | | | 19,000 | | | | 3,608 | |
Six Flags Entertainment | | | 34,500 | | | | 1,703 | |
| | | | | | | | | |
Total Consumer Discretionary | | | 6,784 | |
| | | | | | | | | |
Consumer Staples [20.0%] |
Altria Group | | | 114,750 | | | | 6,590 | |
B&G Foods | | | 148,800 | | | | 3,634 | |
Clorox | | | 37,700 | | | | 6,049 | |
Coca-Cola | | | 75,372 | | | | 3,532 | |
General Mills | | | 72,780 | | | | 3,766 | |
Hershey | | | 25,400 | | | | 2,917 | |
Kellogg | | | 47,000 | | | | 2,697 | |
Kimberly-Clark | | | 19,000 | | | | 2,354 | |
Philip Morris International | | | 61,700 | | | | 5,454 | |
Procter & Gamble | | | 45,949 | | | | 4,781 | |
Sysco | | | 38,800 | | | | 2,590 | |
Unilever ADR | | | 39,300 | | | | 2,269 | |
| | | | | | | | | |
Total Consumer Staples | | | 46,633 | |
| | | | | | | | | |
Energy [5.3%] |
Chevron | | | 36,183 | | | | 4,457 | |
Enterprise Products Partners (A) | | | 87,984 | | | | 2,560 | |
Occidental Petroleum | | | 25,500 | | | | 1,688 | |
ONEOK | | | 53,000 | | | | 3,702 | |
| | | | | | | | | |
Total Energy | | | 12,407 | |
| | | | | | | | | |
Financials [9.7%] |
Ares Capital | | | 95,100 | | | | 1,630 | |
Arthur J Gallagher | | | 29,400 | | | | 2,296 | |
BB&T | | | 80,000 | | | | 3,722 | |
Cincinnati Financial | | | 60,650 | | | | 5,210 | |
Compass Diversified Holdings (A) | | | 153,000 | | | | 2,400 | |
Huntington Bancshares | | | 123,000 | | | | 1,560 | |
JPMorgan Chase | | | 22,700 | | | | 2,298 | |
Prudential Financial | | | 21,700 | | | | 1,994 | |
Umpqua Holdings | | | 98,000 | | | | 1,617 | |
| | | | | | | | | |
Total Financials | | | 22,727 | |
| | | | | | | | | |
Health Care [6.2%] |
Bristol-Myers Squibb | | | 54,200 | | | | 2,586 | |
Johnson & Johnson | | | 19,500 | | | | 2,726 | |
Merck | | | 73,150 | | | | 6,084 | |
Pfizer | | | 72,644 | | | | 3,085 | |
| | | | | | | | | |
Total Health Care | | | 14,481 | |
| | | | | | | | | |
Industrials [6.8%] |
Eaton | | | 51,900 | | | | 4,181 | |
General Dynamics | | | 15,300 | | | | 2,590 | |
Lockheed Martin | | | 30,117 | | | | 9,040 | |
| | | | | | | | | |
Total Industrials | | | 15,811 | |
| | | | | | | | | |
Information Technology [4.9%] |
Intel | | | 134,500 | | | | 7,223 | |
Paychex | | | 52,000 | | | | 4,170 | |
| | | | | | | | | |
Total Information Technology | | | 11,393 | |
| | | | | | | | | |
Materials [2.4%] |
Sonoco Products | | | 70,000 | | | | 4,307 | |
See accompanying notes to financial statements.
CITY NATIONAL ROCHDALE FUNDS | PAGE 110
schedule of investments |
March 31, 2019 (Unaudited) |
City National Rochdale Dividend & Income Fund(continued) |
Description | | Shares | | | Value (000) | |
Westrock | | | 35,000 | | | $ | 1,342 | |
| | | | | | | | | |
Total Materials | | | 5,649 | |
| | | | | | | | | |
REITs [14.8%] |
Crown Castle International | | | 25,600 | | | | 3,277 | |
EPR Properties | | | 34,500 | | | | 2,653 | |
Healthcare Trust of America, Cl A | | | 79,500 | | | | 2,273 | |
Lamar Advertising, Cl A | | | 84,800 | | | | 6,721 | |
Liberty Property Trust | | | 83,985 | | | | 4,067 | |
Mid-America Apartment Communities | | | 26,500 | | | | 2,897 | |
National Retail Properties | | | 59,500 | | | | 3,296 | |
National Storage Affiliates Trust | | | 19,000 | | | | 542 | |
Simon Property Group | | | 10,000 | | | | 1,822 | |
Ventas | | | 40,232 | | | | 2,567 | |
Welltower | | | 41,262 | | | | 3,202 | |
WP Carey | | | 15,500 | | | | 1,214 | |
| | | | | | | | | |
Total REITs | | | 34,531 | |
| | | | | | | | | |
Utilities [14.4%] |
American Electric Power | | | 34,900 | | | | 2,923 | |
AmeriGas Partners (A) | | | 18,200 | | | | 562 | |
Avangrid | | | 59,000 | | | | 2,971 | |
Brookfield Infrastructure Partners (A) | | | 67,600 | | | | 2,830 | |
CenterPoint Energy | | | 27,500 | | | | 844 | |
Dominion Energy | | | 33,100 | | | | 2,537 | |
Duke Energy | | | 68,006 | | | | 6,121 | |
Entergy | | | 13,700 | | | | 1,310 | |
Eversource Energy | | | 39,242 | | | | 2,784 | |
OGE Energy | | | 33,600 | | | | 1,449 | |
Pinnacle West Capital | | | 30,135 | | | | 2,880 | |
WEC Energy Group | | | 38,050 | | | | 3,009 | |
Xcel Energy | | | 62,100 | | | | 3,491 | |
| | | | | | | | | |
Total Utilities | | | 33,711 | |
| | | | | | | | | |
Total Common Stock |
(Cost $160,347) | | | 214,262 | |
| | | | | | | | | |
Preferred Stock [2.7%] |
Communication Services [0.1%] |
Qwest, 7.000% | | | 10,000 | | | | 260 | |
| | | | | | | | | |
Financials [1.2%] |
AmTrust Financial Services, 7.500% | | | 10,000 | | | | 184 | |
Bank of America, 6.000% | | | 20,000 | | | | 522 | |
Capital One Financial, 6.700% | | | 10,000 | | | | 256 | |
First Republic Bank, 5.500% | | | 10,000 | | | | 248 | |
JPMorgan Chase, 6.125% | | | 20,000 | | | | 525 | |
MetLife, 5.625% | | | 10,000 | | | | 255 | |
Wells Fargo, 6.000% | | | 20,000 | | | | 509 | |
Wells Fargo Real Estate Investment, 6.375% | | | 10,000 | | | | 257 | |
| | | | | | | | | |
Total Financials | | | 2,756 | |
| | | | | | | | | |
REITs [1.0%] |
Digital Realty Trust, 5.250% | | | 10,000 | | | | 237 | |
National Retail Properties, 5.200% | | | 10,000 | | | | 242 | |
National Storage Affiliates Trust, 6.000% | | | 20,000 | | | | 498 | |
PS Business Parks, 5.200% | | | 10,000 | | | | 240 | |
Public Storage, 5.050% | | | 30,000 | | | | 752 | |
Vornado Realty Trust, 5.250% | | | 20,000 | | | | 469 | |
| | | | | | | | | |
Total REITs | | | 2,438 | |
| | | | | | | | | |
Utilities [0.4%] |
Dominion Energy, 5.250% | | | 5,000 | | | | 126 | |
DTE Energy, 5.250% | | | 20,000 | | | | 501 | |
Southern, 6.250% | | | 10,000 | | | | 263 | |
| | | | | | | | | |
Total Utilities | | | 890 | |
| | | | | | | | | |
Total Preferred Stock |
(Cost $6,375) | | | 6,344 | |
| | | | | | | | | |
Exchange-Traded Funds [2.1%] |
Invesco Preferred ETF | | | 269,500 | | | | 3,908 | |
iShares Preferred & Income Securities ETF | | | 27,300 | | | | 998 | |
| | | | | | | | | |
Total Exchange-Traded Funds |
(Cost $5,027) | | | 4,906 | |
| | | | | | | | | |
See accompanying notes to financial statements.
CITY NATIONAL ROCHDALE FUNDS | PAGE 111
schedule of investments |
March 31, 2019 (Unaudited) |
City National Rochdale Dividend & Income Fund(concluded) |
Description | | Shares | | | Value (000) | |
Short-Term Investment** [3.3%] |
SEI Daily Income Trust Government Fund, Cl F, 2.220% | | | 7,624,178 | | | $ | 7,624 | |
| | | | | | | | | |
Total Short-Term Investment |
(Cost $7,624) | | | 7,624 | |
| | | | | | | | | |
Total Investments [99.8%] |
(Cost $179,373) | | $ | 233,136 | |
| | | | | | | | | |
Percentages are based on net assets of $233,566 (000).
** | The rate reported is the 7-day effective yield as of March 31, 2019. |
(A) | Security is a Master Limited Partnership. At March 31, 2019, such securities amounted to $9,825 (000), or 4.2% of the net assets of the Fund. |
ADR — American Depositary Receipt
Cl — Class
ETF — Exchange-Traded Fund
The following is a list of the inputs used as of March 31, 2019, in valuing the Fund’s investments carried at value (000):
Investments in Securities | | Level 1 | | | Level 2 | | | Level 3 | | | Total | |
Common Stock | | $ | 214,262 | | | $ | — | | | $ | — | | | $ | 214,262 | |
Preferred Stock | | | 6,079 | | | | 265 | | | | — | | | | 6,344 | |
Exchange-Traded Funds | | | 4,906 | | | | — | | | | — | | | | 4,906 | |
Short-Term Investment | | | 7,624 | | | | — | | | | — | | | | 7,624 | |
Total Investments in Securities | | $ | 232,871 | | | $ | 265 | | | $ | — | | | $ | 233,136 | |
For the period ended March 31, 2019, there have been no transfers between any of the fair value hierarchy levels. Transfers between levels are recognized at period end.
Amounts designated as “—” are $0 or have been rounded to $0.
For more information on valuation inputs, see Note 2 — Significant Accounting Policies in the Notes to Financial Statements.
See accompanying notes to financial statements.
CITY NATIONAL ROCHDALE FUNDS | PAGE 112
schedule of investments |
March 31, 2019 (Unaudited) |
City National Rochdale U.S. Core Equity Fund |
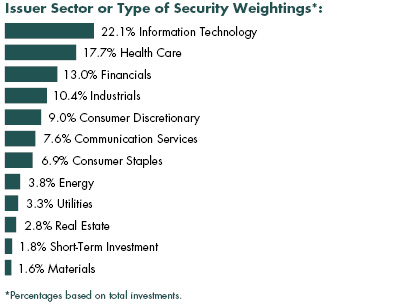
Description | | Shares | | | Value (000) | |
Common Stock [98.3%] |
Aerospace & Defense [2.8%] |
Northrop Grumman | | | 12,000 | | | $ | 3,235 | |
Raytheon | | | 28,000 | | | | 5,098 | |
| | | | | | | | | |
Total Aerospace & Defense | | | 8,333 | |
| | | | | | | | | |
Auto Components [1.3%] |
Magna International | | | 80,000 | | | | 3,895 | |
| | | | | | | | | |
Banks [4.8%] |
Bank of America | | | 187,000 | | | | 5,159 | |
PNC Financial Services Group | | | 37,000 | | | | 4,539 | |
SunTrust Banks | | | 77,000 | | | | 4,562 | |
| | | | | | | | | |
Total Banks | | | 14,260 | |
| | | | | | | | | |
Beverages [2.0%] |
PepsiCo | | | 49,000 | | | | 6,005 | |
| | | | | | | | | |
Capital Markets [2.9%] |
BlackRock, Cl A | | | 6,100 | | | | 2,607 | |
CME Group, Cl A | | | 36,000 | | | | 5,925 | |
| | | | | | | | | |
Total Capital Markets | | | 8,532 | |
| | | | | | | | | |
Chemicals [1.6%] |
Linde | | | 26,000 | | | | 4,574 | |
| | | | | | | | | |
Commercial Banks [2.6%] |
JPMorgan Chase | | | 76,000 | | | | 7,693 | |
| | | | | | | | | |
Commercial Services & Supplies [2.2%] |
Cintas | | | 32,000 | | | | 6,468 | |
| | | | | | | | | |
Communications Equipment [1.3%] |
Cisco Systems | | | 70,000 | | | | 3,779 | |
| | | | | | | | | |
Diversified Financial Services [1.8%] |
Berkshire Hathaway, Cl B* | | | 27,000 | | | | 5,424 | |
| | | | | | | | | |
Electric Utilities [1.3%] |
NextEra Energy | | | 20,000 | | | | 3,866 | |
| | | | | | | | | |
Electronic Equipment [1.7%] |
Amphenol, Cl A | | | 52,000 | | | | 4,911 | |
| | | | | | | | | |
Entertainment [1.3%] |
Walt Disney | | | 35,000 | | | | 3,886 | |
| | | | | | | | | |
Food & Staples Retailing [3.5%] |
Costco Wholesale | | | 21,000 | | | | 5,085 | |
Walmart | | | 55,000 | | | | 5,364 | |
| | | | | | | | | |
Total Food & Staples Retailing | | | 10,449 | |
| | | | | | | | | |
Health Care Equipment & Supplies [7.4%] |
Becton Dickinson | | | 14,000 | | | | 3,496 | |
Danaher | | | 35,000 | | | | 4,621 | |
Edwards Lifesciences* | | | 37,000 | | | | 7,079 | |
Stryker | | | 34,000 | | | | 6,716 | |
| | | | | | | | | |
Total Health Care Equipment & Supplies | | | 21,912 | |
| | | | | | | | | |
Health Care Providers & Services [3.2%] |
UnitedHealth Group | | | 38,000 | | | | 9,396 | |
| | | | | | | | | |
Hotels, Restaurants & Leisure [2.1%] |
McDonald’s | | | 33,000 | | | | 6,267 | |
| | | | | | | | | |
Household Durables [1.7%] |
PulteGroup | | | 180,000 | | | | 5,033 | |
| | | | | | | | | |
Household Products [1.3%] |
Colgate-Palmolive | | | 57,000 | | | | 3,907 | |
| | | | | | | | | |
Industrial Conglomerates [2.2%] |
Honeywell International | | | 25,000 | | | | 3,973 | |
Roper Technologies | | | 7,000 | | | | 2,394 | |
| | | | | | | | | |
Total Industrial Conglomerates | | | 6,367 | |
| | | | | | | | | |
Insurance [0.9%] |
Chubb | | | 18,000 | | | | 2,521 | |
| | | | | | | | | |
See accompanying notes to financial statements.
CITY NATIONAL ROCHDALE FUNDS | PAGE 113
schedule of investments |
March 31, 2019 (Unaudited) |
City National Rochdale U.S. Core Equity Fund(concluded) |
Description | | Shares | | | Value (000) | |
Interactive Media & Services [4.3%] |
Alphabet, Cl A* | | | 6,800 | | | $ | 8,003 | |
Facebook, Cl A* | | | 28,000 | | | | 4,667 | |
| | | | | | | | | |
Total Interactive Media & Services | | | 12,670 | |
| | | | | | | | | |
Internet & Direct Marketing Retail [1.2%] |
Alibaba Group Holding ADR* | | | 20,000 | | | | 3,649 | |
| | | | | | | | | |
IT Services [9.8%] |
Accenture, Cl A | | | 36,000 | | | | 6,337 | |
Mastercard, Cl A | | | 46,000 | | | | 10,831 | |
Visa, Cl A | | | 76,000 | | | | 11,870 | |
| | | | | | | | | |
Total IT Services | | | 29,038 | |
| | | | | | | | | |
Life Sciences Tools & Services [2.8%] |
Thermo Fisher Scientific | | | 30,000 | | | | 8,212 | |
| | | | | | | | | |
Machinery [1.6%] |
Ingersoll-Rand | | | 44,000 | | | | 4,750 | |
| | | | | | | | | |
Media [2.0%] |
Comcast, Cl A | | | 150,000 | | | | 5,997 | |
| | | | | | | | | |
Multi-Utilities [0.9%] |
CMS Energy | | | 48,000 | | | | 2,666 | |
| | | | | | | | | |
Oil, Gas & Consumable Fuels [3.8%] |
Cabot Oil & Gas | | | 97,000 | | | | 2,532 | |
Chevron | | | 50,000 | | | | 6,159 | |
EOG Resources | | | 27,000 | | | | 2,570 | |
| | | | | | | | | |
Total Oil, Gas & Consumable Fuels | | | 11,261 | |
| | | | | | | | | |
Pharmaceuticals [4.4%] |
Johnson & Johnson | | | 42,000 | | | | 5,871 | |
Zoetis, Cl A | | | 70,000 | | | | 7,047 | |
| | | | | | | | | |
Total Pharmaceuticals | | | 12,918 | |
| | | | | | | | | |
Real Estate Investment Trusts [2.8%] |
Equinix | | | 7,000 | | | | 3,172 | |
Essex Property Trust | | | 18,000 | | | | 5,206 | |
| | | | | | | | | |
Total Real Estate Investment Trusts | | | 8,378 | |
| | | | | | | | | |
Road & Rail [1.7%] |
Union Pacific | | | 29,000 | | | | 4,849 | |
| | | | | | | | | |
Software [6.9%] |
Adobe* | | | 33,000 | | | | 8,794 | |
Microsoft | | | 98,000 | | | | 11,558 | |
| | | | | | | | | |
Total Software | | | 20,352 | |
| | | | | | | | | |
Specialty Retail [2.6%] |
Home Depot | | | 40,000 | | | | 7,676 | |
| | | | | | | | | |
Technology Hardware, Storage & Peripherals [2.5%] |
Apple | | | 38,000 | | | | 7,218 | |
| | | | | | | | | |
Water Utilities [1.1%] |
American Water Works | | | 32,000 | | | | 3,336 | |
| | | | | | | | | |
Total Common Stock |
(Cost $186,211) | | | 290,448 | |
| | | | | | | | | |
Short-Term Investment** [1.8%] |
SEI Daily Income Trust Government Fund, Cl F, 2.220% | | | 5,256,743 | | | | 5,257 | |
| | | | | | | | | |
Total Short-Term Investment |
(Cost $5,257) | | | 5,257 | |
| | | | | | | | | |
Total Investments [100.1%] |
(Cost $191,468) | | $ | 295,705 | |
|
Percentages are based on net assets of $295,284 (000).
* | Non-income producing security. |
** | The rate reported is the 7-day effective yield as of March 31, 2019. |
ADR — American Depositary Receipt
Cl — Class
As of March 31, 2019, all of the Fund’s investments are Level 1, in accordance with the authoritative guidance on fair value measurements and disclosure under U.S. GAAP.
For the period ended March 31, 2019, there have been no transfers between any of the fair value hierarchy levels. Transfers between levels are recognized at period end.
For more information on valuation inputs, see Note 2 — Significant Accounting Policies in the Notes to Financial Statements.
See accompanying notes to financial statements.
CITY NATIONAL ROCHDALE FUNDS | PAGE 114
statements of assets and liabilities (000) |
March 31, 2019 (Unaudited) |
| | | City National
Rochdale
Government Money
Market Fund | | | City National
Rochdale
Government
Bond Fund | | | City National
Rochdale Corporate
Bond Fund | | | City National
Rochdale California
Tax Exempt
Bond Fund | |
ASSETS: | | | | | | | | | | | | | | | | |
Cost of securities (including affiliated investments and repurchase agreements) | | $ | 4,345,845 | | | $ | 44,644 | | | $ | 132,888 | | | $ | 80,786 | |
Investments in securities, at value | | $ | 2,978,845 | | | $ | 44,331 | | | $ | 133,129 | | | $ | 79,534 | |
Affiliated investments, at value | | | — | | | | — | | | | — | | | | — | |
Repurchase agreements, at value | | | 1,367,000 | | | | — | | | | — | | | | 3,000 | |
Cash | | | — | | | | — | | | | 65 | | | | — | |
Dividend and interest receivable | | | 2,364 | | | | 126 | | | | 858 | | | | 970 | |
Receivable for capital shares sold | | | — | | | | 7 | | | | 132 | | | | 90 | |
Prepaid expenses | | | 144 | | | | 5 | | | | 8 | | | | 7 | |
Total Assets | | $ | 4,348,353 | | | $ | 44,469 | | | $ | 134,192 | | | $ | 83,601 | |
| | | | | | | | | | | | | | | | | |
LIABILITIES: | | | | | | | | | | | | | | | | |
Payable for income distributions | | $ | 2,262 | | | $ | 49 | | | $ | 212 | | | $ | 87 | |
Payable for capital shares redeemed | | | — | | | | 97 | | | | 226 | | | | 13 | |
Investment advisory fees payable | | | 519 | | | | 3 | | | | 38 | | | | 3 | |
Shareholder servicing and distribution fees payable | | | 1,321 | | | | 12 | | | | 31 | | | | 30 | |
Administrative fees payable | | | 72 | | | | 14 | | | | 15 | | | | 15 | |
Accrued expenses | | | 204 | | | | 19 | | | | 46 | | | | 22 | |
Total Liabilities | | $ | 4,378 | | | $ | 194 | | | $ | 568 | | | $ | 170 | |
Net Assets | | $ | 4,343,975 | | | $ | 44,275 | | | $ | 133,624 | | | $ | 83,431 | |
| | | | | | | | | | | | | | | | | |
NET ASSETS: | | | | | | | | | | | | | | | | |
Paid-in Capital (unlimited authorization — $0.01 par value) | | $ | 4,343,969 | | | $ | 45,404 | | | $ | 134,782 | | | $ | 82,066 | |
Total Distributable Earnings/(Loss) | | | 6 | | | | (1,129 | ) | | | (1,158 | ) | | | 1,365 | |
Net Assets | | $ | 4,343,975 | | | $ | 44,275 | | | $ | 133,624 | | | $ | 83,431 | |
| | | | | | | | | | | | | | | | | |
Institutional Class Shares: | | | | | | | | | | | | | | | | |
Net Assets ($Dollars) | | $ | — | | | $ | 141 | | | $ | — | | | $ | — | |
Total shares outstanding at end of period | | | — | | | | 14 | | | | — | | | | — | |
Net asset value, offering and redemption price per share (net assets ÷ shares outstanding) | | $ | — | | | $ | 10.42 | | | $ | — | | | $ | — | |
| | | | | | | | | | | | | | | | | |
Class N Shares: | | | | | | | | | | | | | | | | |
Net Assets ($Dollars) | | $ | 626,893,231 | | | $ | 2,794,981 | | | $ | 9,009,093 | | | $ | 7,979,691 | |
Total shares outstanding at end of period | | | 626,887,853 | | | | 267,466 | | | | 868,714 | | | | 747,364 | |
Net asset value, offering and redemption price per share (net assets ÷ shares outstanding) | | $ | 1.00 | | | $ | 10.45 | | | $ | 10.37 | | | $ | 10.68 | |
| | | | | | | | | | | | | | | | | |
Class S Shares: | | | | | | | | | | | | | | | | |
Net Assets ($Dollars) | | $ | 928,648,319 | | | $ | — | | | $ | — | | | $ | — | |
Total shares outstanding at end of period | | | 928,642,132 | | | | — | | | | — | | | | — | |
| Net asset value, offering and redemption price per share (net assets ÷ shares outstanding) | | $ | 1.00 | | | $ | — | | | $ | — | | | $ | — | |
| | | | | | | | | | | | | | | | | |
Servicing Class Shares: | | | | | | | | | | | | | | | | |
Net Assets ($Dollars) | | $ | 2,788,433,592 | | | $ | 41,479,561 | | | $ | 124,615,264 | | | $ | 75,451,729 | |
Total shares outstanding at end of period | | | 2,788,443,490 | | | | 3,976,135 | | | | 12,034,296 | | | | 7,089,503 | |
| Net asset value, offering and redemption price per share (net assets ÷ shares outstanding) | | $ | 1.00 | | | $ | 10.43 | | | $ | 10.36 | | | $ | 10.64 | |
Amounts designated as “—” are either $0 or have been rounded to $0.
See accompanying notes to financial statements.
CITY NATIONAL ROCHDALE FUNDS | PAGE 115
statements of assets and liabilities (000)/
consolidated statement of assets and liabilities (000) |
March 31, 2019 (Unaudited) |
| | | City National
Rochdale Municipal
High Income Fund | | | City National
Rochdale High
Yield Bond Fund | | | City National
Rochdale
Intermediate Fixed
Income Fund | | | City National
Rochdale
Fixed Income
Opportunities Fund | |
ASSETS: | | | | | | | | | | | | | | | | |
Cost of securities | | $ | 1,276,749 | | | $ | 56,671 | | | $ | 152,428 | | | $ | 3,144,676 | |
Investments in securities, at value | | $ | 1,300,981 | | | $ | 56,872 | | | $ | 152,827 | | | $ | 3,108,093 | |
Cash | | | 50 | | | | — | | | | — | | | | 8,224 | |
Foreign currency | | | — | | | | — | | | | — | | | | 8,725 | (1) |
Cash collateral | | | — | | | | — | | | | — | | | | 2,092 | |
Dividend and interest receivable | | | 18,230 | | | | 977 | | | | 933 | | | | 35,666 | |
Foreign tax reclaim receivable | | | — | | | | 2 | | | | — | | | | 173 | |
Receivable for capital shares sold | | | 3,610 | | | | | | | | 347 | | | | 11,936 | |
Receivable for investment securities sold | | | 256 | | | | 182 | | | | — | | | | 20,379 | |
Variation margin receivable | | | — | | | | — | | | | — | | | | 144 | |
Unrealized gain on forward foreign currency contracts | | | — | | | | — | | | | — | | | | 3,697 | |
Unrealized gain on foreign currency spot contracts | | | — | | | | — | | | | — | | | | 46 | |
Prepaid expenses | | | 37 | | | | 6 | | | | 9 | | | | 84 | |
Total Assets | | $ | 1,323,164 | | | $ | 58,039 | | | $ | 154,116 | | | $ | 3,199,259 | |
| | | | | | | | | | | | | | | | | |
LIABILITIES: | | | | | | | | | | | | | | | | |
Payable for investment securities purchased | | $ | 6,051 | | | $ | 513 | | | $ | — | | | $ | 75,867 | |
Payable for income distributions | | | 2,342 | | | | 66 | | | | — | | | | — | |
Payable for capital shares redeemed | | | 1,618 | | | | 114 | | | | 29 | | | | 2,677 | |
Unrealized loss on forward foreign currency contracts | | | — | | | | — | | | | — | | | | 2,110 | |
Unrealized loss on foreign currency spot contracts | | | — | | | | — | | | | — | | | | 48 | |
Investment advisory fees payable | | | 548 | | | | 12 | | | | 41 | | | | 1,315 | |
Shareholder servicing and distribution fees payable | | | 279 | | | | 5 | | | | 32 | | | | 658 | |
Administrative fees payable | | | 32 | | | | 14 | | | | 16 | | | | 58 | |
Accrued expenses | | | 268 | | | | 48 | | | | 57 | | | | 1,104 | |
Total Liabilities | | $ | 11,138 | | | $ | 772 | | | $ | 175 | | | $ | 83,837 | |
Net Assets | | $ | 1,312,026 | | | $ | 57,267 | | | $ | 153,941 | | | $ | 3,115,422 | |
| | | | | | | | | | | | | | | | | |
NET ASSETS: | | | | | | | | | | | | | | | | |
Paid-in Capital (unlimited authorization — $0.01 par value) | | $ | 1,313,419 | | | $ | 65,171 | | | $ | 156,009 | | | $ | 3,319,324 | |
Total Distributable Earnings/(Loss) | | | (1,393 | ) | | | (7,904 | ) | | | (2,068 | ) | | | (203,902 | ) |
Net Assets | | $ | 1,312,026 | | | $ | 57,267 | | | $ | 153,941 | | | $ | 3,115,422 | |
| | | | | | | | | | | | | | | | | |
Institutional Class Shares: | | | | | | | | | | | | | | | | |
Net Assets ($Dollars) | | $ | — | | | $ | 31,717,359 | | | $ | 4,313,142 | | | $ | — | |
Total shares outstanding at end of period | | | — | | | | 4,088,787 | | | | 166,894 | | | | — | |
Net asset value, offering and redemption price per share (net assets ÷ shares outstanding) | | $ | — | | | $ | 7.76 | | | $ | 25.84 | | | $ | — | |
| | | | | | | | | | | | | | | | | |
| | | | | | | | | | | | | | | | | |
Class N Shares: | | | | | | | | | | | | | | | | |
Net Assets ($Dollars) | | $ | 793,061,762 | | | $ | 12,836,565 | | | $ | 149,627,486 | | | $ | 3,115,421,641 | |
Total shares outstanding at end of period | | | 74,314,773 | | | | 1,654,733 | | | | 5,790,440 | | | | 127,405,154 | |
Net asset value, offering and redemption price per share (net assets ÷ shares outstanding) | | $ | 10.67 | | | $ | 7.76 | | | $ | 25.84 | | | $ | 24.45 | |
| | | | | | | | | | | | | | | | | |
Servicing Class Shares: | | | | | | | | | | | | | | | | |
Net Assets ($Dollars) | | $ | 518,963,851 | | | $ | 12,713,255 | | | $ | — | | | $ | — | |
Total shares outstanding at end of period | | | 48,605,436 | | | | 1,639,702 | | | | — | | | | — | |
Net asset value, offering and redemption price per share (net assets ÷ shares outstanding) | | $ | 10.68 | | | $ | 7.75 | | | $ | — | | | $ | — | |
(1) | Cost of foreign currency $8,827 (000). |
Amounts designated as “—” are either $0 or have been rounded to $0.
See accompanying notes to financial statements.
CITY NATIONAL ROCHDALE FUNDS | PAGE 116
statements of assets and liabilities (000)/
consolidated statement of assets and liabilities (000) |
March 31, 2019 (Unaudited) |
| | | City National
Rochdale Dividend
& Income Fund | | | City National
Rochdale U.S.
Core Equity Fund | |
ASSETS: | | | | | | | | |
Cost of securities | | $ | 179,373 | | | $ | 191,468 | |
Investments in securities, at value | | $ | 233,136 | | | $ | 295,705 | |
Cash | | | 35 | | | | — | |
Dividend and interest receivable | | | 594 | | | | 144 | |
Foreign tax reclaim receivable | | | 21 | | | | 9 | |
Receivable for capital shares sold | | | 307 | | | | 188 | |
Prepaid expenses | | | 11 | | | | 12 | |
Total Assets | | $ | 234,104 | | | $ | 296,058 | |
| | | | | | | | | |
LIABILITIES: | | | | | | | | |
Payable for capital shares redeemed | | $ | 296 | | | $ | 533 | |
Payable to custodian | | | — | | | | 5 | |
Investment advisory fees payable | | | 99 | | | | 99 | |
Shareholder servicing and distribution fees payable | | | 50 | | | | 62 | |
Administrative fees payable | | | 17 | | | | 18 | |
Accrued expenses | | | 75 | | | | 57 | |
Total Liabilities | | $ | 537 | | | $ | 774 | |
Net Assets | | $ | 233,566 | | | $ | 295,284 | |
| | | | | | | | | |
NET ASSETS: | | | | | | | | |
Paid-in Capital (unlimited authorization — $0.01 par value) | | $ | 176,447 | | | $ | 191,009 | |
Total Distributable Earnings/(Loss) | | | 57,119 | | | | 104,275 | |
Net Assets | | $ | 233,566 | | | $ | 295,284 | |
| | | | | | | | | |
Institutional Class Shares: | | | | | | | | |
Net Assets ($Dollars) | | $ | — | | | $ | 133,500 | |
Total shares outstanding at end of period | | | — | | | | 7,615 | |
Net asset value, offering and redemption price per share
(net assets ÷ shares outstanding) | | $ | — | | | $ | 17.53 | * |
| | | | | | | | | |
Class N Shares: | | | | | | | | |
Net Assets ($Dollars) | | $ | 233,565,644 | | | $ | 143,760,354 | |
Total shares outstanding at end of period | | | 6,035,690 | | | | 8,296,082 | |
Net asset value, offering and redemption price per share
(net assets ÷ shares outstanding) | | $ | 38.70 | | | $ | 17.33 | |
| | | | | | | | | |
Servicing Class Shares: | | | | | | | | |
Net Assets ($Dollars) | | $ | — | | | $ | 151,389,822 | |
Total shares outstanding at end of period | | | — | | | | 8,721,868 | |
Net asset value, offering and redemption price per share
(net assets ÷ shares outstanding) | | $ | — | | | $ | 17.36 | |
* | NAV per share as of March 31, 2019 does not calculate to the stated NAV per share due to rounding of net assets and shares. |
Amounts designated as “—” are either $0 or have been rounded to $0.
See accompanying notes to financial statements.
CITY NATIONAL ROCHDALE FUNDS | PAGE 117
statements of operations (000) |
For the six months ended March 31, 2019 (Unaudited) |
| | | City National
Rochdale
Government Money
Market Fund | | | City National
Rochdale
Government
Bond Fund | | | City National
Rochdale Corporate
Bond Fund | | | City National
Rochdale California
Tax Exempt
Bond Fund | |
INVESTMENT INCOME: | | | | | | | | | | | | | | | | |
Dividend Income | | $ | — | | | $ | 12 | | | $ | 28 | | | $ | 10 | |
Dividend Income from Affiliated Investments | | | — | | | | — | | | | 78 | | | | 1 | |
Interest Income | | | 52,121 | | | | 479 | | | | 2,000 | | | | 894 | |
Total Investment Income | | | 52,121 | | | | 491 | | | | 2,106 | | | | 905 | |
| | | | | | | | | | | | | | | | | |
EXPENSES: | | | | | | | | | | | | | | | | |
Investment Advisory Fees | | | 5,798 | | | | 118 | | | | 271 | | | | 112 | |
Shareholder Servicing Fees — Class N(1) | | | 2,156 | | | | 6 | | | | 19 | | | | 19 | |
Shareholder Servicing Fees — Class S(1) | | | 2,837 | | | | — | | | | — | | | | — | |
Shareholder Servicing Fees — Servicing Class | | | 3,581 | | | | 66 | | | | 160 | | | | 94 | |
Administration Fees | | | 453 | | | | 85 | | | | 92 | | | | 88 | |
Transfer Agent Fees | | | 155 | | | | 2 | | | | 5 | | | | 3 | |
Trustee Fees | | | 93 | | | | 17 | | | | 18 | | | | 18 | |
Professional Fees | | | 160 | | | | 7 | | | | 10 | | | | 8 | |
Custody Fees | | | 100 | | | | 1 | | | | 3 | | | | 2 | |
Registration Fees | | | 110 | | | | 2 | | | | 3 | | | | 2 | |
Printing Fees | | | 71 | | | | 1 | | | | 2 | | | | 1 | |
Insurance and Other Expenses | | | 124 | | | | 7 | | | | (9 | ) | | | 14 | |
Total Expenses | | | 15,638 | | | | 312 | | | | 574 | | | | 361 | |
Less, Waivers of: | | | | | | | | | | | | | | | | |
Investment Advisory Fees | | | (2,451 | ) | | | (95 | ) | | | (49 | ) | | | (89 | ) |
Net Expenses | | | 13,187 | | | | 217 | | | | 525 | | | | 272 | |
| | | | | | | | | | | | | | | | | |
Net Investment Income | | | 38,934 | | | | 274 | | | | 1,581 | | | | 633 | |
Net Realized Gain (Loss) from: | | | | | | | | | | | | | | | | |
Investments | | | — | | | | (148 | ) | | | (330 | ) | | | 17 | |
Affiliated Investments | | | — | | | | — | | | | — | | | | (13 | ) |
Net Change in Unrealized Appreciation on: | | | | | | | | | | | | | | | | |
Investments | | | — | | | | 1,132 | | | | 2,373 | | | | 1,912 | |
Affiliated Investments | | | — | | | | — | | | | — | | | | 8 | |
Net Increase in Net Assets Resulting from Operations | | $ | 38,934 | | | $ | 1,258 | | | $ | 3,624 | | | $ | 2,557 | |
(1) | Includes class specific distribution expenses. |
Amounts designated as “—” are either $0 or have been rounded to $0.
See accompanying notes to financial statements.
CITY NATIONAL ROCHDALE FUNDS | PAGE 118
statements of operations (000)/
consolidated statement of operations (000) |
For the six months ended March 31, 2019 (Unaudited) |
| | | City National
Rochdale Municipal
High Income Fund | | | City National
Rochdale High
Yield Bond Fund | | | City National
Rochdale
Intermediate Fixed
Income Fund | | | City National
Rochdale
Fixed Income
Opportunities Fund | |
INVESTMENT INCOME: | | | | | | | | | | | | | | | | |
Dividend Income | | $ | 294 | | | $ | 24 | | | $ | 85 | | | $ | 1,153 | |
Interest Income | | | 27,285 | | | | 1,761 | | | | 2,634 | | | | 98,423 | |
Less: Foreign Taxes Withheld | | | — | | | | (1 | ) | | | — | | | | (596 | ) |
Total Investment Income | | | 27,579 | | | | 1,784 | | | | 2,719 | | | | 98,980 | |
| | | | | | | | | | | | | | | | | |
EXPENSES: | | | | | | | | | | | | | | | | |
Investment Advisory Fees | | | 3,114 | | | | 169 | | | | 334 | | | | 7,438 | |
Shareholder Servicing Fees — Class N(1) | | | 1,864 | | | | 33 | | | | 406 | | | | 7,438 | |
Shareholder Servicing Fees — Servicing Class | | | 625 | | | | 16 | | | | — | | | | — | |
Administration Fees | | | 217 | | | | 86 | | | | 95 | | | | 367 | |
Transfer Agent Fees | | | 44 | | | | 2 | | | | 6 | | | | 104 | |
Trustee Fees | | | 37 | | | | 17 | | | | 19 | | | | 77 | |
Professional Fees | | | 47 | | | | 7 | | | | 11 | | | | 142 | |
Custody Fees | | | 25 | | | | 4 | | | | 3 | | | | 326 | |
Registration Fees | | | 29 | | | | 1 | | | | 4 | | | | 70 | |
Printing Fees | | | 21 | | | | 1 | | | | 3 | | | | 49 | |
Insurance and Other Expenses | | | 100 | | | | 20 | | | | 15 | | | | 196 | |
Total Expenses | | | 6,123 | | | | 356 | | | | 896 | | | | 16,207 | |
Recovery of Investment Advisory Fees Previously Waived(2) | | | — | | | | — | | | | — | | | | 8 | |
Less, Waivers of: | | | | | | | | | | | | | | | | |
Investment Advisory Fees | | | — | | | | — | | | | (65 | ) | | | (18 | ) |
Net Expenses | | | 6,123 | | | | 356 | | | | 831 | | | | 16,197 | |
| | | | | | | | | | | | | | | | | |
Net Investment Income | | | 21,456 | | | | 1,428 | | | | 1,888 | | | | 82,783 | |
Net Realized Gain (Loss) from: | | | | | | | | | | | | | | | | |
Investments | | | (6,327 | ) | | | (2,702 | ) | | | (652 | ) | | | (4,089 | ) |
Swap Contracts | | | — | | | | — | | | | — | | | | 10 | |
Forward Foreign Currency Contracts | | | — | | | | — | | | | — | | | | 12,752 | |
Foreign Currency Transactions | | | — | | | | — | | | | — | | | | (5,875 | ) |
Net Change in Unrealized Appreciation (Depreciation) on: | | | | | | | | | | | | | | | | |
Investments | | | 22,829 | | | | 2,617 | | | | 3,767 | | | | (24,237 | ) |
Forward Foreign Currency Contracts | | | — | | | | — | | | | — | | | | 614 | |
Foreign Currency Translations | | | — | | | | — | | | | — | | | | (11,875 | ) |
Swap Contracts | | | — | | | | — | | | | — | | | | (139 | ) |
Net Increase in Net Assets Resulting from Operations | | $ | 37,958 | | | $ | 1,343 | | | $ | 5,003 | | | $ | 49,944 | |
(1) | Includes class specific distribution expenses. |
(2) | See Note 5 for advisory fees recovered. |
Amounts designated as “—” are either $0 or have been rounded to $0.
See accompanying notes to financial statements.
CITY NATIONAL ROCHDALE FUNDS | PAGE 119
statements of operations (000) |
For the six months ended March 31, 2019 (Unaudited) |
| | | City National
Rochdale Dividend
& Income Fund | | | City National
Rochdale U.S.
Core Equity Fund | |
INVESTMENT INCOME: | | | | | | | | |
Dividend Income | | $ | 4,479 | | | $ | 2,383 | |
Interest Income | | | 16 | | | | — | |
Less: Foreign Taxes Withheld | | | — | | | | (9 | ) |
Total Investment Income | | | 4,495 | | | | 2,374 | |
| | | | | | | | | |
EXPENSES: | | | | | | | | |
Investment Advisory Fees | | | 572 | | | | 562 | |
Shareholder Servicing Fees — Class N(1) | | | 572 | | | | 340 | |
Shareholder Servicing Fees — Servicing Class(1) | | | — | | | | 181 | |
Administration Fees | | | 100 | | | | 104 | |
Transfer Agent Fees | | | 8 | | | | 10 | |
Trustee Fees | | | 20 | | | | 21 | |
Professional Fees | | | 13 | | | | 15 | |
Custody Fees | | | 5 | | | | 6 | |
Registration Fees | | | 5 | | | | 6 | |
Printing Fees | | | 4 | | | | 5 | |
Insurance and Other Expenses | | | 14 | | | | 12 | |
Total Expenses | | | 1,313 | | | | 1,262 | |
Net Expenses | | | 1,313 | | | | 1,262 | |
| | | | | | | | | |
Net Investment Income | | | 3,182 | | | | 1,112 | |
Net Realized Gain from: | | | | | | | | |
Investments | | | 2,217 | | | | 34 | |
Net Change in Unrealized Appreciation on: | | | | | | | | |
Investments | | | 2,229 | | | | 891 | |
Net Increase in Net Assets Resulting from Operations | | $ | 7,628 | | | $ | 2,037 | |
(1) | Includes class specific distribution expenses. |
Amounts designated as “—” are either $0 or have been rounded to $0.
See accompanying notes to financial statements.
CITY NATIONAL ROCHDALE FUNDS | PAGE 120
This page intentionally left blank.
CITY NATIONAL ROCHDALE FUNDS | PAGE 121
statements of changes in net assets (000) |
For the six months ended March 31, 2019 (Unaudited) and year ended September 30, 2018 |
| | | City National
Rochdale
Government
Money
Market Fund | | | City National
Rochdale
Government
Bond Fund | |
| | 2019 | | | 2018 | | | 2019 | | | 2018 | |
OPERATIONS: | | | | | | | | | | | | | | | | |
Net Investment Income | | $ | 38,934 | | | $ | 41,445 | | | $ | 274 | | | $ | 903 | |
Net Realized Gain (Loss) from Investments and Affiliated Investments | | | — | | | | — | | | | (148 | ) | | | (570 | ) |
Net Change in Unrealized Appreciation (Depreciation) on Investments and Affiliated Investments | | | — | | | | — | | | | 1,132 | | | | (1,246 | ) |
Net Increase (Decrease) in Net Assets Resulting from Operations | | | 38,934 | | | | 41,445 | | | | 1,258 | | | | (913 | ) |
| | | | | | | | | | | | | | | | | |
DISTRIBUTIONS:(1) | | | | | | | | | | | | | | | | |
Institutional Class | | | — | | | | — | | | | — | | | | (411 | ) |
Class N | | | (27,007 | ) | | | (7,842 | ) | | | (10 | ) | | | (17 | ) |
Class S | | | (6,123 | ) | | | (6,152 | ) | | | — | | | | — | |
Servicing Class | | | (5,805 | ) | | | (27,451 | ) | | | (299 | ) | | | (627 | ) |
Total Distributions | | | (38,935 | ) | | | (41,445 | ) | | | (309 | ) | | | (1,055 | ) |
| | | | | | | | | | | | | | | | | |
CAPITAL SHARE TRANSACTIONS:(2) | | | | | | | | | | | | | | | | |
Institutional Class: | | | | | | | | | | | | | | | | |
Shares Issued | | | — | | | | — | | | | — | | | | 3,292 | |
Shares Issued in Lieu of Dividends and Distributions | | | — | | | | — | | | | — | | | | 382 | |
Shares Redeemed | | | — | | | | — | | | | — | | | | (42,896 | ) |
Decrease in Net Assets from Institutional Class Share Transactions | | | — | | | | — | | | | — | | | | (39,222 | ) |
| | | | | | | | | | | | | | | | | |
Class N: | | | | | | | | | | | | | | | | |
Shares Issued | | | 1,185,903 | | | | 3,371,578 | | | | 874 | | | | 413 | |
Shares Issued in Lieu of Dividends and Distributions | | | 4,903 | | | | 4,584 | | | | 8 | | | | 12 | |
Shares Redeemed | | | (1,558,504 | ) | | | (3,480,575 | ) | | | (111 | ) | | | (146 | ) |
Increase (Decrease) in Net Assets from Class N Share Transactions | | | (367,698 | ) | | | (104,413 | ) | | | 771 | | | | 279 | |
| | | | | | | | | | | | | | | | | |
Class S: | | | | | | | | | | | | | | | | |
Shares Issued | | | 2,575,601 | | | | 2,843,388 | | | | — | | | | — | |
Shares Issued in Lieu of Dividends and Distributions | | | — | | | | — | | | | — | | | | — | |
Shares Redeemed | | | (2,717,427 | ) | | | (2,614,166 | ) | | | — | | | | — | |
Increase (Decrease) in Net Assets from Class S Share Transactions | | | (141,826 | ) | | | 229,222 | | | | — | | | | — | |
| | | | | | | | | | | | | | | | | |
Servicing Class: | | | | | | | | | | | | | | | | |
Shares Issued | | | 4,243,097 | | | | 7,234,103 | | | | 4,245 | | | | 13,288 | |
Shares Issued in Lieu of Dividends and Distributions | | | 19,405 | | | | 19,753 | | | | 33 | | | | 86 | |
Shares Redeemed | | | (4,417,047 | ) | | | (6,612,833 | ) | | | (17,453 | ) | | | (15,375 | ) |
Increase (Decrease) in Net Assets from Servicing Class Share Transactions | | | (154,545 | ) | | | 641,023 | | | | (13,175 | ) | | | (2,001 | ) |
| | | | | | | | | | | | | | | | | |
Net Increase (Decrease) in Net Assets from Share Transactions | | | (664,069 | ) | | | 765,832 | | | | (12,404 | ) | | | (40,944 | ) |
Total Increase (Decrease) in Net Assets | | | (664,070 | ) | | | 765,832 | | | | (11,455 | ) | | | (42,912 | ) |
| | | | | | | | | | | | | | | | | |
NET ASSETS: | | | | | | | | | | | | | | | | |
Beginning of Year/Period | | | 5,008,045 | | | | 4,242,213 | | | | 55,730 | | | | 98,642 | |
End of Year/Period(3) | | $ | 4,343,975 | | | $ | 5,008,045 | | | $ | 44,275 | | | $ | 55,730 | |
(1) | Current year presentation of distributions conform with S-X Disclosure Simplification. Prior year distributions have been consolidated to conform with S-X Disclosure
Simplification (see Note 11). |
(2) | See Note 9 for shares issued and redeemed. |
(3) | Includes undistributed (distributed in excess of) net investment income of $0, $(4), $50, $1 and $2,120, respectively, in 2018. The SEC eliminated the requirement to disclose undistributed net investment income on November 5, 2018. |
Amounts designated as “—” are either $0 or have been rounded to $0.
See accompanying notes to financial statements.
CITY NATIONAL ROCHDALE FUNDS | PAGE 122
| | City National
Rochdale
Corporate
Bond Fund | | | City National
Rochdale
California
Tax Exempt
Bond Fund | | | City National
Rochdale
Municipal
High Income
Fund | |
| | 2019 | | | 2018 | | | 2019 | | | 2018 | | | 2019 | | | 2018 | |
| | | | | | | | | | | | | | | | | | | | | | | | |
| | $ | 1,581 | | | $ | 2,684 | | | $ | 633 | | | $ | 1,293 | | | $ | 21,456 | | | $ | 48,177 | |
| | | (330 | ) | | | (30 | ) | | | 4 | | | | (92 | ) | | | (6,327 | ) | | | 869 | |
| | | 2,373 | | | | (3,008 | ) | | | 1,920 | | | | (1,760 | ) | | | 22,829 | | | | (26,926 | ) |
| | | 3,624 | | | | (354 | ) | | | 2,557 | | | | (559 | ) | | | 37,958 | | | | 22,120 | |
| | | | | | | | | | | | | | | | | | | | | | | | |
| | | | | | | | | | | | | | | | | | | | | | | | |
| | | — | | | | — | | | | — | | | | — | | | | — | | | | — | |
| | | (74 | ) | | | (115 | ) | | | (50 | ) | | | (103 | ) | | | (14,678 | ) | | | (25,667 | ) |
| | | — | | | | — | | | | — | | | | — | | | | — | | | | — | |
| | | (1,386 | ) | | | (2,523 | ) | | | (594 | ) | | | (1,193 | ) | | | (10,472 | ) | | | (19,274 | ) |
| | | (1,460 | ) | | | (2,638 | ) | | | (644 | ) | | | (1,296 | ) | | | (25,150 | ) | | | (44,941 | ) |
| | | | | | | | | | | | | | | | | | | | | | | | |
| | | | | | | | | | | | | | | | | | | | | | | | |
| | | | | | | | | | | | | | | | | | | | | | | | |
| | | — | | | | — | | | | — | | | | — | | | | — | | | | — | |
| | | — | | | | — | | | | — | | | | — | | | | — | | | | — | |
| | | — | | | | — | | | | — | | | | — | | | | — | | | | — | |
| | | — | | | | — | | | | — | | | | — | | | | — | | | | — | |
| | | | | | | | | | | | | | | | | | | | | | | | |
| | | | | | | | | | | | | | | | | | | | | | | | |
| | | 2,534 | | | | 2,968 | | | | 1,311 | | | | 3,997 | | | | 129,200 | | | | 208,070 | |
| | | 59 | | | | 81 | | | | 25 | | | | 51 | | | | 8,984 | | | | 14,971 | |
| | | (789 | ) | | | (1,468 | ) | | | (1,295 | ) | | | (5,451 | ) | | | (107,759 | ) | | | (141,682 | ) |
| | | 1,804 | | | | 1,581 | | | | 41 | | | | (1,403 | ) | | | 30,425 | | | | 81,359 | |
| | | | | | | | | | | | | | | | | | | | | | | | |
| | | | | | | | | | | | | | | | | | | | | | | | |
| | | — | | | | — | | | | — | | | | — | | | | — | | | | — | |
| | | — | | | | — | | | | — | | | | — | | | | — | | | | — | |
| | | — | | | | — | | | | — | | | | — | | | | — | | | | — | |
| | | — | | | | — | | | | — | | | | — | | | | — | | | | — | |
| | | | | | | | | | | | | | | | | | | | | | | | |
| | | | | | | | | | | | | | | | | | | | | | | | |
| | | 9,579 | | | | 27,406 | | | | 10,322 | | | | 20,209 | | | | 60,350 | | | | 110,964 | |
| | | 140 | | | | 282 | | | | 92 | | | | 191 | | | | 1,391 | | | | 2,810 | |
| | | (19,660 | ) | | | (23,783 | ) | | | (15,527 | ) | | | (20,331 | ) | | | (59,221 | ) | | | (82,056 | ) |
| | | (9,941 | ) | | | 3,905 | | | | (5,113 | ) | | | 69 | | | | 2,520 | | | | 31,718 | |
| | | | | | | | | | | | | | | | | | | | | | | | |
| | | (8,137 | ) | | | 5,486 | | | | (5,072 | ) | | | (1,334 | ) | | | 32,945 | | | | 113,077 | |
| | | (5,973 | ) | | | 2,494 | | | | (3,159 | ) | | | (3,189 | ) | | | 45,753 | | | | 90,256 | |
| | | | | | | | | | | | | | | | | | | | | | | | |
| | | | | | | | | | | | | | | | | | | | | | | | |
| | | 139,597 | | | | 137,103 | | | | 86,590 | | | | 89,779 | | | | 1,266,273 | | | | 1,176,017 | |
| | $ | 133,624 | | | $ | 139,597 | | | $ | 83,431 | | | $ | 86,590 | | | $ | 1,312,026 | | | $ | 1,266,273 | |
See accompanying notes to financial statements.
CITY NATIONAL ROCHDALE FUNDS | PAGE 123
statements of changes in net assets (000)/
consolidated statement of changes in net assets (000) |
For the six months ended March 31, 2019 (Unaudited) and year ended September 30, 2018 |
| | | City National
Rochdale
High Yield
Bond Fund | | | City National
Rochdale
Intermediate
Fixed Income
Fund | |
| | 2019 | | | 2018 | | | 2019 | | | 2018 | |
OPERATIONS: | | | | | | | | | | | | | | | | |
Net Investment Income | | $ | 1,428 | | | $ | 3,535 | | | $ | 1,888 | | | $ | 4,294 | |
Net Realized Gain (Loss) from: | | | | | | | | | | | | | | | | |
Investments, Purchased Options and Swap Contracts | | | (2,702 | ) | | | (465 | ) | | | (652 | ) | | | (1,400 | ) |
Forward Foreign Currency Contracts and Foreign Currency Transactions | | | — | | | | 78 | | | | — | | | | — | |
Net Change in Unrealized Appreciation (Depreciation) on: | | | | | | | | | | | | | | | | |
Investments, Purchased Options and Swap Contracts | | | 2,617 | | | | (2,162 | ) | | | 3,767 | | | | (5,755 | ) |
Forward Foreign Currency Contracts and Foreign Currency Translations | | | — | | | | 2 | | | | — | | | | — | |
Net Increase (Decrease) in Net Assets Resulting from Operations | | | 1,343 | | | | 988 | | | | 5,003 | | | | (2,861 | ) |
| | | | | | | | | | | | | | | | | |
DISTRIBUTIONS:(1) | | | | | | | | | | | | | | | | |
Institutional Class | | | (825 | ) | | | (2,096 | ) | | | (61 | ) | | | (116 | ) |
Class N | | | (320 | ) | | | (781 | ) | | | (1,860 | ) | | | (4,268 | ) |
Servicing Class | | | (318 | ) | | | (737 | ) | | | — | | | | — | |
Total Distributions | | | (1,463 | ) | | | (3,614 | ) | | | (1,921 | ) | | | (4,384 | ) |
| | | | | | | | | | | | | | | | | |
CAPITAL SHARE TRANSACTIONS:(2) | | | | | | | | | | | | | | | | |
Institutional Class: | | | | | | | | | | | | | | | | |
Shares Issued | | | 2,692 | | | | 5,469 | | | | 204 | | | | 1,314 | |
Shares Issued in Lieu of Dividends and Distributions | | | 824 | | | | 2,070 | | | | 29 | | | | 58 | |
Shares Redeemed | | | (3,630 | ) | | | (14,890 | ) | | | (532 | ) | | | (1,276 | ) |
Increase (Decrease) in Net Assets from Institutional Class Share Transactions | | | (114 | ) | | | (7,351 | ) | | | (299 | ) | | | 96 | |
| | | | | | | | | | | | | | | | | |
Class N: | | | | | | | | | | | | | | | | |
Shares Issued | | | 1,591 | | | | 2,286 | | | | 11,791 | | | | 31,177 | |
Shares Issued in Lieu of Dividends and Distributions | | | 178 | | | | 441 | | | | 1,810 | | | | 4,083 | |
Shares Redeemed | | | (3,043 | ) | | | (4,632 | ) | | | (46,363 | ) | | | (90,671 | ) |
Decrease in Net Assets from Class N Share Transactions | | | (1,274 | ) | | | (1,905 | ) | | | (32,762 | ) | | | (55,411 | ) |
| | | | | | | | | | | | | | | | | |
Servicing Class: | | | | | | | | | | | | | | | | |
Shares Issued | | | 1,052 | | | | 485 | | | | — | | | | — | |
Shares Issued in Lieu of Dividends and Distributions | | | 74 | | | | 151 | | | | — | | | | — | |
Shares Redeemed | | | (931 | ) | | | (4,121 | ) | | | — | | | | — | |
Increase (Decrease) in Net Assets from Servicing Class Share Transactions | | | 195 | | | | (3,485 | ) | | | — | | | | — | |
Net Decrease in Net Assets from Share Transactions | | | (1,193 | ) | | | (12,741 | ) | | | (33,061 | ) | | | (55,315 | ) |
Total Decrease in Net Assets | | | (1,313 | ) | | | (15,367 | ) | | | (29,979 | ) | | | (62,560 | ) |
| | | | | | | | | | | | | | | | | |
NET ASSETS: | | | | | | | | | | | | | | | | |
Beginning of Year/Period | | | 58,580 | | | | 73,947 | | | | 183,920 | | | | 246,480 | |
End of Year/Period(3) | | $ | 57,267 | | | $ | 58,580 | | | $ | 153,941 | | | $ | 183,920 | |
(1) | Current year presentation of distributions conform with S-X Disclosure Simplification. Prior year distributions have been consolidated to conform with S-X Disclosure
Simplification (see Note 11). |
(2) | See Note 9 for shares issued and redeemed. |
(3) | Includes undistributed (distributed in excess of) net investment income of $29, $78, $(87,474), $212 and $7, respectively, in 2018. The SEC eliminated the requirement to disclose undistributed net investment income on November 5, 2018. |
Amounts designated as “—” are either $0 or have been rounded to $0.
See accompanying notes to financial statements.
CITY NATIONAL ROCHDALE FUNDS | PAGE 124
| | City National
Rochdale
Fixed Income
Opportunities
Fund | | | City National
Rochdale
Dividend &
Income Fund | | | City National
Rochdale
U.S. Core
Equity Fund | |
| | 2019 | | | 2018 | | | 2019 | | | 2018 | | | 2019 | | | 2018 | |
| | | | | | | | | | | | | | | | | | | | | | | | |
| | $ | 82,783 | | | $ | 136,050 | | | $ | 3,182 | | | $ | 6,899 | | | $ | 1,112 | | | $ | 1,805 | |
| | | | | | | | | | | | | | | | | | | | | | | | |
| | | (4,079 | ) | | | 7,396 | | | | 2,217 | | | | 7,016 | | | | 34 | | | | 14,421 | |
| | | 6,877 | | | | 12,614 | | | | — | | | | — | | | | — | | | | — | |
| | | | | | | | | | | | | | | | | | | | | | | | |
| | | (23,623 | ) | | | (126,103 | ) | | | 2,229 | | | | (6,601 | ) | | | 891 | | | | 28,351 | |
| | | (12,014 | ) | | | (471 | ) | | | — | | | | — | | | | — | | | | — | |
| | | 49,944 | | | | 29,486 | | | | 7,628 | | | | 7,314 | | | | 2,037 | | | | 44,577 | |
| | | | | | | | | | | | | | | | | | | | | | | | |
| | | | | | | | | | | | | | | | | | | | | | | | |
| | | — | | | | — | | | | — | | | | — | | | | (1 | ) | | | — | |
| | | (81,606 | ) | | | (157,669 | ) | | | (11,121 | ) | | | (14,393 | ) | | | (6,044 | ) | | | (2,497 | ) |
| | | — | | | | — | | | | — | | | | — | | | | (6,680 | ) | | | (2,925 | ) |
| | | (81,606 | ) | | | (157,669 | ) | | | (11,121 | ) | | | (14,393 | ) | | | (12,725 | ) | | | (5,422 | ) |
| | | | | | | | | | | | | | | | | | | | | | | | |
| | | | | | | | | | | | | | | | | | | | | | | | |
| | | | | | | | | | | | | | | | | | | | | | | | |
| | | — | | | | — | | | | — | | | | — | | | | 96 | | | | 20 | |
| | | — | | | | — | | | | — | | | | — | | | | 2 | | | | 1 | |
| | | — | | | | — | | | | — | | | | — | | | | — | | | | (7 | ) |
| | | — | | | | — | | | | — | | | | — | | | | 98 | | | | 14 | |
| | | | | | | | | | | | | | | | | | | | | | | | |
| | | | | | | | | | | | | | | | | | | | | | | | |
| | | 521,792 | | | | 822,435 | | | | 19,592 | | | | 45,008 | | | | 10,045 | | | | 22,630 | |
| | | 61,156 | | | | 117,125 | | | | 7,183 | | | | 9,289 | | | | 5,330 | | | | 2,145 | |
| | | (438,471 | ) | | | (549,018 | ) | | | (29,155 | ) | | | (60,988 | ) | | | (13,095 | ) | | | (24,482 | ) |
| | | 144,477 | | | | 390,542 | | | | (2,380 | ) | | | (6,691 | ) | | | 2,280 | | | | 293 | |
| | | | | | | | | | | | | | | | | | | | | | | | |
| | | | | | | | | | | | | | | | | | | | | | | | |
| | | — | | | | — | | | | — | | | | — | | | | 15,473 | | | | 26,723 | |
| | | — | | | | — | | | | — | | | | — | | | | 451 | | | | 175 | |
| | | — | | | | — | | | | — | | | | — | | | | (13,486 | ) | | | (22,679 | ) |
| | | — | | | | — | | | | — | | | | — | | | | 2,438 | | | | 4,219 | |
| | | 144,477 | | | | 390,542 | | | | (2,380 | ) | | | (6,691 | ) | | | 4,816 | | | | 4,526 | |
| | | 112,815 | | | | 262,359 | | | | (5,873 | ) | | | (13,770 | ) | | | (5,872 | ) | | | 43,681 | |
| | | | | | | | | | | | | | | | | | | | | | | | |
| | | | | | | | | | | | | | | | | | | | | | | | |
| | | 3,002,607 | | | | 2,740,248 | | | | 239,439 | | | | 253,209 | | | | 301,156 | | | | 257,475 | |
| | $ | 3,115,422 | | | $ | 3,002,607 | | | $ | 233,566 | | | $ | 239,439 | | | $ | 295,284 | | | $ | 301,156 | |
See accompanying notes to financial statements.
CITY NATIONAL ROCHDALE FUNDS | PAGE 125
consolidated statement of cash flows (000) |
For the six months ended March 31, 2019 (Unaudited) |
| | | City National
Rochdale
Fixed Income
Opportunities Fund | |
CASH FLOWS FROM OPERATING ACTIVITIES: | | | | |
Net increase in net assets from operations | | $ | 49,944 | |
Adjustments to reconcile net increase in net assets resulting from operations to net cash used in operating activities: | | | | |
Purchase of investment securities | | | (2,976,248 | ) |
Proceeds from disposition of investment securities | | | 2,850,943 | |
Amortization (accretion of market discount) | | | (7,214 | ) |
Premium payments | | | (18,427 | ) |
Net realized loss on investments | | | 4,089 | |
Net change in unrealized depreciation on investments | | | 24,237 | |
| | | | | |
Changes in assets: | | | | |
Variation margin receivable | | | 113 | |
Dividend and interest receivable | | | (2,176 | ) |
Foreign tax reclaim receivable | | | 190 | |
Receivable for investment securities sold | | | 22,309 | |
Unrealized gain on forward foreign currency contracts | | | 638 | |
Unrealized gain on spot contracts | | | 15 | |
Prepaid expenses | | | (30 | ) |
| | | | | |
Changes in liabilities: | | | | |
Payable for investment securities purchased | | | 1,652 | |
Unrealized loss on forward foreign currency contracts | | | (1,252 | ) |
Unrealized loss on spot contracts | | | (27 | ) |
Investment advisory fees payable | | | 178 | |
Shareholder servicing and distribution fees payable | | | (568 | ) |
Administrative fees payable | | | 4 | |
Accrued expenses | | | 679 | |
Net Cash Used in Operating Activities | | | (50,951 | ) |
| | | | | |
CASH FLOWS FROM FINANCING ACTIVITIES: | | | | |
Proceeds from shares issued | | | 577,227 | |
Cost of shares redeemed | | | (437,953 | ) |
Distributions | | | (81,606 | ) |
Net cash provided by financing activities | | | 57,668 | |
Net change in cash | | | 6,717 | |
Cash at beginning of period | | | 12,324 | |
Cash at end of period | | $ | 19,041 | |
See accompanying notes to financial statements.
CITY NATIONAL ROCHDALE FUNDS | PAGE 126
This page intentionally left blank.
CITY NATIONAL ROCHDALE FUNDS | PAGE 127
financial highlights |
For a Share Outstanding Throughout Each Period
For the six months ended March 31, 2019 (Unaudited) and the year or period ended September 30, |
| | | Net Asset
Value
Beginning
of Period | | | Net
Investment
Income† | | | Net
Realized and
Unrealized
Gains
(Losses) on
Securities† | | | Dividends
from Net
Investment
Income | | | Distributions
from Realized
Capital Gains | | | Net Asset
Value End
of Period | | | Total
Return‡ | | | Net Assets End
of Period (000) | | | Ratio of
Expenses to
Average Net
Assets(1)(2) | | | Ratio of Net
Investment
Income to
Average Net
Assets(1)(2) | | | Ratio of Expenses
to Average Net
Assets (Excluding
Waivers &
Recovered Fees)(1) | | | Portfolio
Turnover
Rate | |
| City National Rochdale Government Money Market Fund |
| Class N (commenced operations on June 21, 1999) |
| | 2019 | | $ | 1.00 | | | $ | 0.008 | | | $ | 0.000 | * | | $ | (0.008 | ) | | $ | — | | | $ | 1.00 | | | 0.79 | % | | $ | 626,893 | | | 0.75 | % | | 1.54 | % | | 0.85 | % | | — | % |
| | 2018 | | | 1.00 | | | | 0.007 | | | | 0.000 | * | | | (0.007 | ) | | | — | | | | 1.00 | | | 0.71 | | | | 994,591 | | | 0.88 | | | 0.69 | | | 0.86 | | | — | |
| | 2017 | | | 1.00 | | | | 0.001 | | | | 0.000 | * | | | (0.001 | ) | | | — | | | | 1.00 | | | 0.06 | | | | 1,099,005 | | | 0.60 | | | 0.05 | | | 0.86 | | | — | |
| | 2016 | | | 1.00 | | | | 0.000 | * | | | 0.000 | * | | | (0.000 | )* | | | — | | | | 1.00 | | | 0.02 | | | | 3,870,786 | | | 0.30 | | | 0.02 | | | 0.86 | | | — | |
| | 2015 | | | 1.00 | | | | 0.000 | * | | | 0.000 | * | | | (0.000 | )* | | | — | | | | 1.00 | | | 0.01 | | | | 2,958,782 | | | 0.10 | | | 0.01 | | | 0.87 | | | — | |
| | 2014 | | | 1.00 | | | | 0.000 | * | | | 0.000 | * | | | (0.000 | )* | | | — | | | | 1.00 | | | 0.01 | | | | 3,174,351 | | | 0.08 | | | 0.01 | | | 0.88 | | | — | |
| Class S (commenced operations on October 6, 1999) |
| | 2019 | | $ | 1.00 | | | $ | 0.007 | | | $ | 0.000 | * | | $ | (0.007 | ) | | $ | — | | | $ | 1.00 | | | 0.72 | % | | $ | 928,648 | | | 0.91 | % | | 1.43 | % | | 1.02 | % | | — | % |
| | 2018 | | | 1.00 | | | | 0.006 | | | | 0.000 | * | | | (0.006 | ) | | | — | | | | 1.00 | | | 0.62 | | | | 1,070,474 | | | 0.95 | | | 0.64 | | | 1.03 | | | — | |
| | 2017 | | | 1.00 | | | | 0.001 | | | | 0.000 | * | | | (0.001 | ) | | | — | | | | 1.00 | | | 0.06 | | | | 841,246 | | | 0.67 | | | 0.06 | | | 1.06 | | | — | |
| | 2016 | | | 1.00 | | | | 0.000 | * | | | 0.000 | * | | | (0.000 | )* | | | — | | | | 1.00 | | | 0.02 | | | | 882,925 | | | 0.31 | | | 0.02 | | | 1.06 | | | — | |
| | 2015 | | | 1.00 | | | | 0.000 | * | | | 0.000 | * | | | (0.000 | )* | | | — | | | | 1.00 | | | 0.01 | | | | 668,183 | | | 0.10 | | | 0.01 | | | 1.07 | | | — | |
| | 2014 | | | 1.00 | | | | 0.000 | * | | | 0.000 | * | | | (0.000 | )* | | | — | | | | 1.00 | | | 0.01 | | | | 705,932 | | | 0.08 | | | 0.01 | | | 1.08 | | | — | |
| Servicing Class (commenced operations on April 3, 2000) |
| | 2019 | | $ | 1.00 | | | $ | 0.009 | | | $ | 0.000 | * | | $ | (0.009 | ) | | $ | — | | | $ | 1.00 | | | 0.95 | % | | $ | 2,788,434 | | | 0.46 | % | | 1.88 | % | | 0.57 | % | | — | % |
| | 2018 | | | 1.00 | | | | 0.011 | | | | 0.000 | * | | | (0.011 | ) | | | — | | | | 1.00 | | | 1.11 | | | | 2,942,980 | | | 0.46 | | | 1.12 | | | 0.56 | | | — | |
| | 2017 | | | 1.00 | | | | 0.002 | | | | 0.000 | * | | | (0.002 | ) | | | — | | | | 1.00 | | | 0.17 | | | | 2,301,962 | | | 0.53 | | | 0.24 | | | 0.56 | | | — | |
| | 2016 | | | 1.00 | | | | 0.000 | * | | | 0.000 | * | | | (0.000 | )* | | | — | | | | 1.00 | | | 0.02 | | | | 981,967 | | | 0.31 | | | 0.02 | | | 0.56 | | | — | |
| | 2015 | | | 1.00 | | | | 0.000 | * | | | 0.000 | * | | | (0.000 | )* | | | — | | | | 1.00 | | | 0.01 | | | | 308,591 | | | 0.10 | | | 0.01 | | | 0.57 | | | — | |
| | 2014 | | | 1.00 | | | | 0.000 | * | | | 0.000 | * | | | (0.000 | )* | | | — | | | | 1.00 | | | 0.01 | | | | 211,958 | | | 0.08 | | | 0.01 | | | 0.58 | | | — | |
| City National Rochdale Government Bond Fund |
| Institutional Class (commenced operations on February 1, 2012) |
| | 2019 | | $ | 10.25 | | | $ | 0.12 | | | $ | 0.18 | | | $ | (0.13 | ) | | $ | — | | | $ | 10.42 | | | 2.93 | % | | $ | — | | | 0.04 | %(2) | | 2.25 | % | | 0.19 | % | | 13 | % |
| | 2018 | | | 10.48 | | | | 0.12 | | | | (0.19 | ) | | | (0.15 | ) | | | (0.01 | ) | | | 10.25 | | | (0.67 | ) | | | — | | | 0.53 | | | 1.20 | | | 0.70 | | | 14 | |
| | 2017 | | | 10.61 | | | | 0.10 | | | | (0.12 | ) | | | (0.10 | ) | | | (0.01 | ) | | | 10.48 | | | (0.18 | ) | | | 39,988 | | | 0.53 | | | 0.90 | | | 0.63 | | | 55 | |
| | 2016 | | | 10.59 | | | | 0.09 | | | | 0.02 | | | | (0.09 | ) | | | — | | | | 10.61 | | | 1.09 | | | | 66,021 | | | 0.53 | | | 0.84 | | | 0.58 | | | 37 | |
| | 2015 | | | 10.49 | | | | 0.06 | | | | 0.10 | | | | (0.06 | ) | | | — | | | | 10.59 | | | 1.55 | | | | 58,301 | | | 0.53 | | | 0.59 | | | 0.57 | | | 37 | |
| | 2014 | | | 10.47 | | | | 0.06 | | | | 0.02 | | | | (0.06 | ) | | | — | | | | 10.49 | | | 0.80 | | | | 56,722 | | | 0.53 | | | 0.59 | | | 0.57 | | | 59 | |
| Class N (commenced operations on April 13, 2000) |
| | 2019 | | $ | 10.27 | | | $ | 0.04 | | | $ | 0.19 | | | $ | (0.05 | ) | | $ | — | | | $ | 10.45 | | | 2.21 | % | | $ | 2,795 | | | 1.03 | % | | 0.77 | % | | 1.38 | % | | 13 | % |
| | 2018 | | | 10.49 | | | | 0.07 | | | | (0.19 | ) | | | (0.09 | ) | | | (0.01 | ) | | | 10.27 | | | (1.21 | ) | | | 1,984 | | | 1.03 | | | 0.72 | | | 1.25 | | | 14 | |
| | 2017 | | | 10.62 | | | | 0.05 | | | | (0.12 | ) | | | (0.05 | ) | | | (0.01 | ) | | | 10.49 | | | (0.68 | ) | | | 1,743 | | | 1.03 | | | 0.43 | | | 1.13 | | | 55 | |
| | 2016 | | | 10.60 | | | | 0.03 | | | | 0.03 | | | | (0.04 | ) | | | — | | | | 10.62 | | | 0.58 | | | | 1,453 | | | 1.03 | | | 0.33 | | | 1.08 | | | 37 | |
| | 2015 | | | 10.51 | | | | 0.01 | | | | 0.09 | | | | (0.01 | ) | | | — | | | | 10.60 | | | 0.95 | | | | 1,895 | | | 1.03 | | | 0.08 | | | 1.07 | | | 37 | |
| | 2014 | | | 10.49 | | | | 0.01 | | | | 0.02 | | | | (0.01 | ) | | | — | | | | 10.51 | | | 0.29 | | | | 2,027 | | | 1.03 | | | 0.10 | | | 1.07 | | | 59 | |
| Servicing Class (commenced operations on January 14, 2000) |
| | 2019 | | $ | 10.26 | | | $ | 0.05 | | | $ | 0.18 | | | $ | (0.06 | ) | | $ | — | | | $ | 10.43 | | | 2.24 | % | | $ | 41,480 | | | 0.78 | % | | 1.01 | % | | 0.85 | % | | 13 | % |
| | 2018 | | | 10.48 | | | | 0.10 | | | | (0.20 | ) | | | (0.11 | ) | | | (0.01 | ) | | | 10.26 | | | (0.98 | ) | | | 53,746 | | | 0.78 | | | 0.97 | | | 1.00 | | | 14 | |
| | 2017 | | | 10.60 | | | | 0.07 | | | | (0.10 | ) | | | (0.08 | ) | | | (0.01 | ) | | | 10.48 | | | (0.34 | ) | | | 56,911 | | | 0.78 | | | 0.68 | | | 0.88 | | | 55 | |
| | 2016 | | | 10.58 | | | | 0.06 | | | | 0.03 | | | | (0.07 | ) | | | — | | | | 10.60 | | | 0.84 | | | | 83,184 | | | 0.78 | | | 0.59 | | | 0.83 | | | 37 | |
| | 2015 | | | 10.49 | | | | 0.04 | | | | 0.09 | | | | (0.04 | ) | | | — | | | | 10.58 | | | 1.21 | | | | 90,624 | | | 0.78 | | | 0.33 | | | 0.82 | | | 37 | |
| | 2014 | | | 10.47 | | | | 0.04 | | | | 0.02 | | | | (0.04 | ) | | | — | | | | 10.49 | | | 0.54 | | | | 113,485 | | | 0.78 | | | 0.34 | | | 0.82 | | | 59 | |
| City National Rochdale Corporate Bond Fund |
| Class N (commenced operations on April 13, 2000) |
| | 2019 | | $ | 10.20 | | | $ | 0.11 | | | $ | 0.16 | | | $ | (0.10 | ) | | $ | — | | | $ | 10.37 | | | 2.64 | % | | $ | 9,009 | | | 1.01 | % | | 2.09 | % | | 1.08 | % | | 8 | % |
| | 2018 | | | 10.43 | | | | 0.18 | | | | (0.24 | ) | | | (0.17 | ) | | | — | | | | 10.20 | | | (0.55 | ) | | | 7,065 | | | 1.01 | | | 1.72 | | | 1.12 | | | 29 | |
| | 2017 | | | 10.52 | | | | 0.16 | | | | (0.09 | ) | | | (0.16 | ) | | | — | | | | 10.43 | | | 0.68 | | | | 5,626 | | | 1.01 | | | 1.53 | | | 1.13 | | | 26 | |
| | 2016 | | | 10.45 | | | | 0.16 | | | | 0.08 | | | | (0.15 | ) | | | (0.02 | ) | | | 10.52 | | | 2.39 | | | | 3,783 | | | 1.01 | | | 1.52 | | | 1.09 | | | 30 | |
| | 2015 | | | 10.67 | | | | 0.15 | | | | (0.14 | ) | | | (0.15 | ) | | | (0.08 | ) | | | 10.45 | | | 0.14 | | | | 4,411 | | | 1.01 | | | 1.42 | | | 1.07 | | | 32 | |
| | 2014 | | | 10.71 | | | | 0.14 | | | | 0.03 | | | | (0.14 | ) | | | (0.07 | ) | | | 10.67 | | | 1.64 | | | | 4,008 | | | 1.01 | | | 1.32 | | | 1.07 | | | 37 | |
| Servicing Class (commenced operations on January 14, 2000) |
| | 2019 | | $ | 10.19 | | | $ | 0.12 | | | $ | 0.16 | | | $ | (0.11 | ) | | $ | — | | | $ | 10.36 | | | 2.67 | % | | $ | 124,615 | | | 0.76 | % | | 2.34 | % | | 0.83 | % | | 8 | % |
| | 2018 | | | 10.41 | | | | 0.20 | | | | (0.22 | ) | | | (0.20 | ) | | | — | | | | 10.19 | | | (0.22 | ) | | | 132,532 | | | 0.76 | | | 1.95 | | | 0.87 | | | 29 | |
| | 2017 | | | 10.51 | | | | 0.19 | | | | (0.10 | ) | | | (0.19 | ) | | | — | | | | 10.41 | | | 0.84 | | | | 131,477 | | | 0.76 | | | 1.79 | | | 0.88 | | | 26 | |
| | 2016 | | | 10.44 | | | | 0.18 | | | | 0.09 | | | | (0.18 | ) | | | (0.02 | ) | | | 10.51 | | | 2.69 | | | | 124,717 | | | 0.76 | | | 1.75 | | | 0.84 | | | 30 | |
| | 2015 | | | 10.66 | | | | 0.18 | | | | (0.14 | ) | | | (0.18 | ) | | | (0.08 | ) | | | 10.44 | | | 0.39 | | | | 131,394 | | | 0.76 | | | 1.67 | | | 0.82 | | | 32 | |
| | 2014 | | | 10.70 | | | | 0.17 | | | | 0.03 | | | | (0.17 | ) | | | (0.07 | ) | | | 10.66 | | | 1.89 | | | | 142,766 | | | 0.76 | | | 1.57 | | | 0.82 | | | 37 | |
* | Amount represents less than $0.001. |
† | Per share calculations are based on Average Shares outstanding throughout the period. |
‡ | Returns are for the period indicated and have not been annualized. Fee waivers are in effect; if they had not been in effect, performance would have been lower. Returns shown do not reflect the deduction of taxes that a shareholder would pay on fund distributions or the redemption of fund shares. |
(1) | Ratio includes waivers and previously waived investment advisory fees recovered. The impact of the recovered fees may cause a higher net expense ratio. |
(2) | Ratio reflects the impact of the low level of average net assets. Under normal asset levels, the ratio of expenses to average net assets would have been 0.53%. |
Amounts designated as “—” are either $0 or have been rounded to $0.
See accompanying notes to financial statements.
CITY NATIONAL ROCHDALE FUNDS | PAGE 128
| | | Net Asset
Value
Beginning
of Period | | Net
Investment
Income† | | | Net
Realized and
Unrealized
Gains
(Losses) on
Securities† | | | Dividends
from Net
Investment
Income | | | Distributions
from Realized
Capital Gains | | | Net Asset
Value End
of Period | | | Total
Return‡ | | | Net Assets
End of
Period (000) | | | Ratio of
Expenses to
Average Net
Assets(1)(2) | | | Ratio of Net
Investment
Income to
Average Net
Assets(1)(2) | | | Ratio of Expenses
to Average Net
Assets (Excluding
Waivers &
Recovered Fees)(1) | | | Portfolio
Turnover
Rate | |
| City National Rochdale California Tax Exempt Bond Fund |
| Class N (commenced operations on April 13, 2000) |
| | 2019 | | $ | 10.43 | | $ | 0.07 | | | $ | 0.25 | | | $ | (0.07 | ) | | $ | — | | | $ | 10.68 | | | | 3.07 | % | | $ | 7,979 | | | 0.88 | % | | 1.30 | % | | 1.09 | % | | 9 | % |
| | 2018 | | | 10.64 | | | 0.13 | | | | (0.21 | ) | | | (0.13 | ) | | | — | | | | 10.43 | | | | (0.78 | ) | | | 7,760 | | | 0.88 | | | 1.21 | | | 1.08 | | | 26 | |
| | 2017 | | | 10.82 | | | 0.12 | | | | (0.12 | ) | | | (0.12 | ) | | | (0.06 | ) | | | 10.64 | | | | 0.05 | | | | 9,344 | | | 0.88 | | | 1.11 | | | 1.05 | | | 45 | |
| | 2016 | | | 10.71 | | | 0.12 | | | | 0.11 | | | | (0.12 | ) | | | — | ^^ | | | 10.82 | | | | 2.20 | | | | 7,444 | | | 0.88 | | | 1.14 | | | 0.99 | | | 25 | |
| | 2015 | | | 10.74 | | | 0.12 | | | | 0.02 | | | | (0.12 | ) | | | (0.05 | ) | | | 10.71 | | | | 1.30 | | | | 11,386 | | | 0.88 | | | 1.10 | | | 1.00 | | | 10 | |
| | 2014 | | | 10.54 | | | 0.13 | | | | 0.22 | | | | (0.13 | ) | | | (0.02 | ) | | | 10.74 | | | | 3.31 | | | | 10,955 | | | 0.88 | | | 1.17 | | | 1.02 | | | 36 | |
| Servicing Class (commenced operations on January 14, 2000) |
| | 2019 | | $ | 10.40 | | $ | 0.08 | | | $ | 0.24 | | | $ | (0.08 | ) | | $ | — | | | $ | 10.64 | | | | 3.12 | % | | $ | 75,452 | | | 0.63 | % | | 1.56 | % | | 0.85 | % | | 9 | % |
| | 2018 | | | 10.61 | | | 0.15 | | | | (0.21 | ) | | | (0.15 | ) | | | — | | | | 10.40 | | | | (0.53 | ) | | | 78,830 | | | 0.63 | | | 1.46 | | | 0.83 | | | 26 | |
| | 2017 | | | 10.79 | | | 0.14 | | | | (0.12 | ) | | | (0.14 | ) | | | (0.06 | ) | | | 10.61 | | | | 0.31 | | | | 80,435 | | | 0.63 | | | 1.36 | | | 0.80 | | | 45 | |
| | 2016 | | | 10.68 | | | 0.15 | | | | 0.11 | | | | (0.15 | ) | | | — | ^^ | | | 10.79 | | | | 2.48 | | | | 90,694 | | | 0.63 | | | 1.39 | | | 0.74 | | | 25 | |
| | 2015 | | | 10.71 | | | 0.14 | | | | 0.03 | | | | (0.15 | ) | | | (0.05 | ) | | | 10.68 | | | | 1.56 | | | | 86,507 | | | 0.63 | | | 1.36 | | | 0.75 | | | 10 | |
| | 2014 | | | 10.51 | | | 0.15 | | | | 0.22 | | | | (0.15 | ) | | | (0.02 | ) | | | 10.71 | | | | 3.58 | | | | 70,698 | | | 0.63 | | | 1.43 | | | 0.77 | | | 36 | |
| City National Rochdale Municipal High Income Fund |
| Class N (commenced operations on December 30, 2013) |
| | 2019 | | $ | 10.57 | | $ | 0.17 | | | $ | 0.14 | | | $ | (0.21 | ) | | $ | — | | | $ | 10.67 | | | | 2.95 | % | | $ | 793,062 | | | 1.08 | % | | 3.34 | % | | 1.08 | % | | 20 | % |
| | 2018 | | | 10.76 | | | 0.40 | | | | (0.22 | ) | | | (0.37 | ) | | | — | | | | 10.57 | | | | 1.73 | | | | 754,819 | | | 1.07 | | | 3.76 | | | 1.07 | | | 24 | |
| | 2017 | | | 11.14 | | | 0.38 | | | | (0.38 | ) | | | (0.38 | ) | | | — | | | | 10.76 | | | | 0.16 | | | | 686,922 | | | 1.07 | | | 3.62 | | | 1.07 | | | 50 | |
| | 2016 | | | 10.67 | | | 0.41 | | | | 0.46 | | | | (0.40 | ) | | | — | ^^ | | | 11.14 | | | | 8.34 | | | | 595,221 | | | 1.04 | | | 3.76 | | | 1.04 | | | 28 | |
| | 2015 | | | 10.71 | | | 0.41 | | | | (0.04 | ) | | | (0.41 | ) | | | — | | | | 10.67 | | | | 3.55 | | | | 382,461 | | | 1.04 | | | 3.85 | | | 1.03 | | | 2 | |
| | 2014 | | | 10.00 | | | 0.32 | | | | 0.71 | | | | (0.32 | ) | | | — | | | | 10.71 | | | | 10.38 | | | | 201,200 | | | 1.08 | (2) | | 4.02 | (2) | | 1.08 | (2) | | 1 | |
| Servicing Class (commenced operations on December 30, 2013) |
| | 2019 | | $ | 10.57 | | $ | 0.19 | | | $ | 0.14 | | | $ | (0.22 | ) | | $ | — | | | $ | 10.68 | | | | 3.17 | % | | $ | 518,964 | | | 0.83 | % | | 3.61 | % | | 0.83 | % | | 24 | % |
| | 2018 | | | 10.77 | | | 0.43 | | | | (0.23 | ) | | | (0.40 | ) | | | — | | | | 10.57 | | | | 1.89 | | | | 511,454 | | | 0.82 | | | 4.01 | | | 0.82 | | | 24 | |
| | 2017 | | | 11.14 | | | 0.41 | | | | (0.37 | ) | | | (0.41 | ) | | | — | | | | 10.77 | | | | 0.50 | | | | 489,095 | | | 0.83 | | | 3.87 | | | 0.83 | | | 50 | |
| | 2016 | | | 10.68 | | | 0.44 | | | | 0.45 | | | | (0.43 | ) | | | — | ^^ | | | 11.14 | | | | 8.50 | | | | 443,830 | | | 0.79 | | | 4.01 | | | 0.79 | | | 28 | |
| | 2015 | | | 10.72 | | | 0.44 | | | | (0.04 | ) | | | (0.44 | ) | | | — | | | | 10.68 | | | | 3.81 | | | | 317,201 | | | 0.79 | | | 4.10 | | | 0.79 | | | 2 | |
| | 2014 | | | 10.00 | | | 0.34 | | | | 0.72 | | | | (0.34 | ) | | | — | | | | 10.72 | | | | 10.68 | | | | 220,851 | | | 0.83 | (2) | | 4.27 | (2) | | 0.84 | (2) | | 1 | |
| City National Rochdale High Yield Bond Fund |
| Institutional Class (commenced operations on February 2, 2012) |
| | 2019 | | $ | 7.77 | | $ | 0.20 | | | $ | (0.01 | ) | | $ | (0.20 | ) | | $ | — | | | $ | 7.76 | | | | 2.58 | % | | $ | 31,717 | | | 1.10 | % | | 5.32 | % | | 1.10 | % | | 72 | % |
| | 2018 | | | 8.06 | | | 0.42 | | | | (0.28 | ) | | | (0.43 | ) | | | — | | | | 7.77 | | | | 1.79 | | | | 31,880 | | | 1.04 | | | 5.32 | | | 1.04 | | | 44 | |
| | 2017 | | | 7.80 | | | 0.43 | | | | 0.24 | | | | (0.41 | ) | | | — | | | | 8.06 | | | | 8.82 | | | | 40,698 | | | 0.96 | | | 5.46 | | | 0.96 | | | 59 | |
| | 2016 | | | 7.58 | | | 0.47 | | | | 0.24 | | | | (0.49 | ) | | | — | | | | 7.80 | | | | 9.88 | | | | 40,701 | | | 0.83 | | | 6.39 | | | 0.89 | | | 69 | |
| | 2015 | | | 8.76 | | | 0.49 | | | | (0.77 | ) | | | (0.49 | ) | | | (0.41 | ) | | | 7.58 | | | | (3.47 | ) | | | 38,274 | | | 0.70 | | | 5.94 | | | 0.83 | | | 77 | |
| | 2014 | | | 8.59 | | | 0.53 | | | | 0.19 | | | | (0.53 | ) | | | (0.02 | ) | | | 8.76 | | | | 8.49 | | | | 40,639 | | | 0.70 | | | 5.98 | | | 0.78 | | | 59 | |
| Class N (commenced operations on January 14, 2000) |
| | 2019 | | $ | 7.77 | | $ | 0.18 | | | $ | — | | | $ | (0.19 | ) | | $ | — | | | $ | 7.76 | | | | 2.33 | % | | $ | 12,837 | | | 1.60 | % | | 4.81 | % | | 1.60 | % | | 72 | % |
| | 2018 | | | 8.06 | | | 0.38 | | | | (0.28 | ) | | | (0.39 | ) | | | — | | | | 7.77 | | | | 1.28 | | | | 14,174 | | | 1.54 | | | 4.81 | | | 1.54 | | | 44 | |
| | 2017 | | | 7.80 | | | 0.39 | | | | 0.24 | | | | (0.37 | ) | | | — | | | | 8.06 | | | | 8.28 | | | | 16,705 | | | 1.46 | | | 4.95 | | | 1.46 | | | 59 | |
| | 2016 | | | 7.58 | | | 0.45 | | | | 0.23 | | | | (0.46 | ) | | | — | | | | 7.80 | | | | 9.44 | | | | 18,513 | | | 1.23 | | | 6.02 | | | 1.30 | | | 69 | |
| | 2015 | | | 8.76 | | | 0.44 | | | | (0.76 | ) | | | (0.45 | ) | | | (0.41 | ) | | | 7.58 | | | | (3.94 | ) | | | 21,063 | | | 1.20 | | | 5.43 | | | 1.33 | | | 77 | |
| | 2014 | | | 8.59 | | | 0.49 | | | | 0.18 | | | | (0.48 | ) | | | (0.02 | ) | | | 8.76 | | | | 7.95 | | | | 26,166 | | | 1.20 | | | 5.49 | | | 1.28 | | | 59 | |
| Servicing Class (commenced operations on January 14, 2000) |
| | 2019 | | $ | 7.77 | | $ | 0.19 | | | $ | (0.02 | ) | | $ | (0.19 | ) | | $ | — | | | $ | 7.75 | | | | 2.33 | % | | $ | 12,713 | | | 1.35 | % | | 5.07 | % | | 1.35 | % | | 72 | % |
| | 2018 | | | 8.05 | | | 0.40 | | | | (0.27 | ) | | | (0.41 | ) | | | — | | | | 7.77 | | | | 1.65 | | | | 12,526 | | | 1.29 | | | 5.06 | | | 1.29 | | | 44 | |
| | 2017 | | | 7.80 | | | 0.41 | | | | 0.23 | | | | (0.39 | ) | | | — | | | | 8.05 | | | | 8.42 | | | | 16,544 | | | 1.21 | | | 5.21 | | | 1.21 | | | 59 | |
| | 2016 | | | 7.58 | | | 0.46 | | | | 0.23 | | | | (0.47 | ) | | | — | | | | 7.80 | | | | 9.61 | | | | 18,621 | | | 1.07 | | | 6.16 | | | 1.14 | | | 69 | |
| | 2015 | | | 8.76 | | | 0.47 | | | | (0.77 | ) | | | (0.47 | ) | | | (0.41 | ) | | | 7.58 | | | | (3.71 | ) | | | 27,174 | | | 0.95 | | | 5.67 | | | 1.08 | | | 77 | |
| | 2014 | | | 8.59 | | | 0.51 | | | | 0.19 | | | | (0.51 | ) | | | (0.02 | ) | | | 8.76 | | | | 8.22 | | | | 43,974 | | | 0.95 | | | 5.83 | | | 1.02 | | | 59 | |
| City National Rochdale Intermediate Fixed Income Fund |
| Institutional Class (commenced operations on December 20, 2013) |
| | 2019 | | $ | 25.33 | | $ | 0.35 | | | $ | 0.53 | | | $ | (0.37 | ) | | $ | — | | | $ | 25.84 | | | | 3.48 | % | | $ | 4,313 | | | 0.51 | % | | 2.75 | % | | 0.59 | % | | 18 | % |
| | 2018 | | | 26.18 | | | 0.63 | | | | (0.81 | ) | | | (0.67 | ) | | | — | | | | 25.33 | | | | (0.70 | ) | | | 4,528 | | | 0.51 | | | 2.45 | | | 0.55 | | | 30 | |
| | 2017 | | | 26.56 | | | 0.64 | | | | (0.38 | ) | | | (0.64 | ) | | | — | | | | 26.18 | | | | 1.02 | | | | 4,589 | | | 0.51 | | | 2.43 | | | 0.53 | | | 20 | |
| | 2016 | | | 26.12 | | | 0.63 | | | | 0.45 | | | | (0.64 | ) | | | — | | | | 26.56 | | | | 4.20 | | | | 7,249 | | | 0.51 | | | 2.38 | | | 0.51 | | | 25 | |
| | 2015 | | | 26.23 | | | 0.60 | | | | (0.11 | ) | | | (0.60 | ) | | | — | | | | 26.12 | | | | 1.87 | | | | 15,574 | | | 0.51 | | | 2.29 | | | 0.53 | | | 21 | |
| | 2014 | | | 25.89 | | | 0.53 | | | | 0.33 | | | | (0.52 | ) | | | — | | | | 26.23 | | | | 3.35 | | | | 8,784 | | | 0.51 | | | 2.57 | | | 0.52 | | | 28 | |
| Class N (commenced operations on December 31, 1999) |
| | 2019 | | $ | 25.33 | | $ | 0.29 | | | $ | 0.52 | | | $ | (0.30 | ) | | $ | — | | | $ | 25.84 | | | | 3.23 | % | | $ | 149,628 | | | 1.01 | % | | 2.25 | % | | 1.09 | % | | 18 | % |
| | 2018 | | | 26.17 | | | 0.50 | | | | (0.81 | ) | | | (0.53 | ) | | | — | | | | 25.33 | | | | (1.18 | ) | | | 179,392 | | | 1.01 | | | 1.95 | | | 1.05 | | | 30 | |
| | 2017 | | | 26.56 | | | 0.51 | | | | (0.39 | ) | | | (0.51 | ) | | | — | | | | 26.17 | | | | 0.48 | | | | 241,891 | | | 1.01 | | | 1.95 | | | 1.03 | | | 20 | |
| | 2016 | | | 26.11 | | | 0.50 | | | | 0.46 | | | | (0.51 | ) | | | — | | | | 26.56 | | | | 3.72 | | | | 253,083 | | | 1.01 | | | 1.90 | | | 1.01 | | | 25 | |
| | 2015 | | | 26.23 | | | 0.47 | | | | (0.12 | ) | | | (0.47 | ) | | | — | | | | 26.11 | | | | 1.34 | | | | 255,013 | | | 1.01 | | | 1.79 | | | 1.03 | | | 21 | |
| | 2014 | | | 25.89 | | | 0.57 | | | | 0.34 | | | | (0.57 | ) | | | — | | | | 26.23 | | | | 3.54 | | | | 204,264 | | | 1.01 | | | 2.17 | | | 1.04 | | | 28 | |
† | Per share calculations are based on Average Shares outstanding throughout the period. |
‡ | Returns and Portfolio Turnover Rates are for the period indicated and have not been annualized. Fee waivers are in effect; if they had not been in effect, performance would have been lower. Returns shown do not reflect the deduction of taxes that a shareholder would pay on fund distributions or the redemption of fund shares. |
^^ | Amount represents less than $0.01. |
(1) | Ratio includes waivers and previously waived investment advisory fees recovered. The impact of the recovered fees may cause a higher net expense ratio. |
(2) | Annualized for periods less than one year. |
Amounts designated as “—” are either $0 or have been rounded to $0.
See accompanying notes to financial statements.
CITY NATIONAL ROCHDALE FUNDS | PAGE 129
financial highlights/consolidated financial highlights |
For a Share Outstanding Throughout Each Period
For the six months ended March 31, 2019 (Unaudited) and the year or period ended September 30, |
| | | Net Asset
Value
Beginning
of Period | | Net
Investment
Income† | | Net
Realized
and
Unrealized
Gains
(Losses) on
Securities† | | | Redemption
Fees | | Dividends
from Net
Investment
Income | | | Distributions
from Realized
Capital Gains | | | Distributions
from Return
of Capital | | | Net Asset
Value End
of Period | | Total
Return‡ | | | Net Assets
End of
Period (000) | | Ratio of
Expenses
to Average
Net
Assets(1)(2) | | | Ratio
of Net
Investment
Income to
Average
Net
Assets(1)(2) | | | Ratio of
Expenses
to Average
Net Assets
(Excluding
Waivers &
Recovered
Fees)(1) | | | Portfolio
Turnover
Rate | |
| City National Rochdale Fixed Income Opportunities Fund |
| Class N (commenced operations on July 1, 2009) |
| | 2019 | | $ | 24.72 | | $ | 0.68 | | $ | (0.28 | ) | | $ | — | | $ | (0.67 | ) | | $ | — | | | $ | — | | | $ | 24.45 | | 1.69 | % | | $ | 3,115,422 | | 1.09 | %(7) | | 5.56 | % | | 1.09 | %(7) | | 86 | % |
| | 2018 | | | 25.81 | | | 1.19 | | | (0.92 | ) | | | — | | | (1.36 | ) | | | — | | | | — | | | | 24.72 | | 0.01 | | | | 3,002,607 | | 1.09 | (6) | | 0.05 | | | 1.09 | (6) | | 162 | |
| | 2017 | | | 25.36 | | | 1.30 | | | 0.67 | | | | — | | | (1.52 | ) | | | — | | | | — | | | | 25.81 | | 7.99 | | | | 2,740,248 | | 1.10 | (5) | | 5.04 | | | 1.09 | (5) | | 140 | |
| | 2016 | | | 25.22 | | | 1.28 | | | 0.65 | | | | — | | | (1.79 | ) | | | — | | | | — | | | | 25.36 | | 8.04 | | | | 2,162,580 | | 1.10 | (4) | | 5.15 | | | 1.10 | (4) | | 124 | |
| | 2015 | | | 27.19 | | | 1.34 | | | (1.59 | ) | | | — | | | (1.60 | ) | | | (0.12 | ) | | | — | | | | 25.22 | | (0.88 | ) | | | 1,641,954 | | 1.10 | (3) | | 5.08 | | | 1.12 | (3) | | 73 | |
| | 2014 | | | 26.83 | | | 1.28 | | | 0.38 | | | | — | | | (1.17 | ) | | | (0.13 | ) | | | — | | | | 27.19 | | 6.20 | | | | 1,391,497 | | 1.11 | (2) | | 4.65 | | | 1.12 | (2) | | 82 | |
| City National Rochdale Dividend & Income Fund |
| Class N (commenced operations on June 1, 1999) |
| | 2019 | | $ | 39.32 | | $ | 0.53 | | $ | 0.71 | | | $ | — | | $ | (0.56 | ) | | $ | (1.30 | ) | | $ | — | | | $ | 38.70 | | 3.53 | % | | $ | 233,566 | | 1.15 | % | | 2.78 | % | | 1.15 | % | | 1 | % |
| | 2018 | | | 40.40 | | | 1.10 | | | 0.12 | | | | — | | | (1.12 | ) | | | (1.18 | ) | | | — | | | | 39.32 | | 3.10 | | | | 239,439 | | 1.14 | | | 2.79 | | | 1.14 | | | 10 | |
| | 2017 | | | 39.68 | | | 0.94 | | | 0.90 | | | | — | | | (1.12 | ) | | | — | | | | — | | | | 40.40 | | 4.66 | | | | 253,209 | | 1.13 | | | 2.33 | | | 1.13 | | | 15 | |
| | 2016 | | | 34.22 | | | 0.94 | | | 5.67 | | | | — | | | (0.97 | ) | | | (0.03 | ) | | | (0.15 | ) | | | 39.68 | | 19.50 | | | | 236,957 | | 1.11 | | | 2.49 | | | 1.12 | | | 5 | |
| | 2015 | | | 35.08 | | | 0.94 | | | (0.72 | ) | | | — | | | (1.08 | ) | | | — | | | | — | | | | 34.22 | | 0.53 | | | | 187,685 | | 1.11 | | | 2.60 | | | 1.13 | | | 13 | |
| | 2014 | | | 32.25 | | | 0.95 | | | 2.96 | | | | — | | | (1.08 | ) | | | — | | | | — | | | | 35.08 | | 12.20 | | | | 172,917 | | 1.09 | | | 2.74 | | | 1.14 | | | 16 | |
| City National Rochdale U.S. Core Equity Fund |
| Institutional Class (commenced operations on December 3, 2012) |
| | 2019 | | $ | 18.21 | | $ | 0.11 | | $ | (0.01 | ) | | $ | — | | $ | (0.09 | ) | | $ | (0.69 | ) | | $ | — | | | $ | 17.53 | | 1.14 | % | | $ | 134 | | 0.54 | % | | 1.33 | % | | 0.54 | % | | 18 | % |
| | 2018 | | | 15.83 | | | 0.17 | | | 2.60 | | | | — | | | (0.18 | ) | | | (0.21 | ) | | | — | | | | 18.21 | | 19.40 | | | | 34 | | 0.53 | | | 1.19 | | | 0.53 | | | 18 | |
| | 2017 | | | 14.00 | | | 0.17 | | | 2.43 | | | | — | | | (0.17 | ) | | | (0.60 | ) | | | — | | | | 15.83 | | 19.40 | | | | 17 | | 0.53 | | | 1.19 | | | 0.53 | | | 25 | |
| | 2016 | | | 13.04 | | | 0.13 | | | 1.07 | | | | — | | | (0.15 | ) | | | (0.09 | ) | | | — | | | | 14.00 | | 9.25 | | | | 14 | | 0.52 | | | 0.93 | | | 0.52 | | | 31 | |
| | 2015 | | | 14.21 | | | 0.11 | | | 0.13 | | | | — | | | (0.10 | ) | | | (1.31 | ) | | | — | | | | 13.04 | | 1.79 | | | | 6,870 | | 0.52 | | | 0.79 | | | 0.52 | | | 32 | |
| | 2014 | | | 12.13 | | | 0.08 | | | 2.30 | | | | — | | | (0.08 | ) | | | (0.22 | ) | | | — | | | | 14.21 | | 19.86 | | | | 6,759 | | 0.53 | | | 0.59 | | | 0.53 | | | 60 | |
| Class N (commenced operations on December 3, 2012) |
| | 2019 | | $ | 18.01 | | $ | 0.05 | | $ | 0.02 | | | $ | — | | $ | (0.06 | ) | | $ | (0.69 | ) | | $ | — | | | $ | 17.33 | | 0.91 | % | | $ | 143,760 | | 1.03 | % | | 0.66 | % | | 1.03 | % | | 18 | % |
| | 2018 | | | 15.66 | | | 0.09 | | | 2.56 | | | | — | | | (0.09 | ) | | | (0.21 | ) | | | — | | | | 18.01 | | 18.81 | | | | 146,533 | | 1.03 | | | 0.70 | | | 1.03 | | | 18 | |
| | 2017 | | | 13.86 | | | 0.10 | | | 2.40 | | | | — | | | (0.10 | ) | | | (0.60 | ) | | | — | | | | 15.66 | | 18.81 | | | | 127,086 | | 1.03 | | | 0.70 | | | 1.03 | | | 25 | |
| | 2016 | | | 12.92 | | | 0.08 | | | 1.03 | | | | — | | | (0.08 | ) | | | (0.09 | ) | | | — | | | | 13.86 | | 8.63 | | | | 108,807 | | 1.02 | | | 0.58 | | | 1.02 | | | 31 | |
| | 2015 | | | 14.09 | | | 0.04 | | | 0.14 | | | | — | | | (0.04 | ) | | | (1.31 | ) | | | — | | | | 12.92 | | 1.31 | | | | 102,753 | | 1.02 | | | 0.29 | | | 1.02 | | | 32 | |
| | 2014 | | | 12.08 | | | 0.01 | | | 2.23 | | | | — | | | (0.01 | ) | | | (0.22 | ) | | | — | | | | 14.09 | | 18.80 | | | | 97,205 | | 1.03 | | | 0.09 | | | 1.04 | | | 60 | |
| Servicing Class (commenced operations on December 3, 2012) |
| | 2019 | | $ | 18.04 | | $ | 0.08 | | $ | — | | | $ | — | | $ | (0.07 | ) | | $ | (0.69 | ) | | $ | — | | | $ | 17.36 | | 1.03 | % | | $ | 151,390 | | 0.78 | % | | 0.91 | % | | 0.78 | % | | 18 | % |
| | 2018 | | | 15.69 | | | 0.13 | | | 2.56 | | | | — | | | (0.13 | ) | | | (0.21 | ) | | | — | | | | 18.04 | | 19.14 | | | | 154,589 | | 0.77 | | | 0.76 | | | 0.77 | | | 18 | |
| | 2017 | | | 13.88 | | | 0.14 | | | 2.40 | | | | — | | | (0.13 | ) | | | (0.60 | ) | | | — | | | | 15.69 | | 19.14 | | | | 130,372 | | 0.78 | | | 0.95 | | | 0.78 | | | 25 | |
| | 2016 | | | 12.93 | | | 0.11 | | | 1.04 | | | | — | | | (0.11 | ) | | | (0.09 | ) | | | — | | | | 13.88 | | 8.97 | | | | 111,013 | | 0.77 | | | 0.83 | | | 0.77 | | | 31 | |
| | 2015 | | | 14.11 | | | 0.07 | | | 0.13 | | | | — | | | (0.07 | ) | | | (1.31 | ) | | | — | | | | 12.93 | | 1.48 | | | | 104,220 | | 0.77 | | | 0.54 | | | 0.77 | | | 32 | |
| | 2014 | | | 12.09 | | | 0.05 | | | 2.24 | | | | — | | | (0.05 | ) | | | (0.22 | ) | | | — | | | | 14.11 | | 19.15 | | | | 103,246 | | 0.78 | | | 0.34 | | | 0.79 | | | 60 | |
† | Per share calculations are based on Average Shares outstanding throughout the period. |
‡ | Returns are for the period indicated and have not been annualized. Fee waivers are in effect; if they had not been in effect, performance would have been lower. Returns shown do not reflect the deduction of taxes that a shareholder would pay on fund distributions or the redemption of fund shares. |
(1) | Ratio includes waivers and previously waived investment advisory fees recovered. The impact of the recovered fees may cause a higher net expense ratio. |
(2) | The expense ratio includes acquired fund fee expenses from the investment in the Subsidiary. Had this expense been excluded, the ratios would have been 1.09% and 1.10%, respectively. |
(3) | The expense ratio includes acquired fund fee expenses from the investment in the Subsidiary. Had this expense been excluded, the ratios would have been 1.09% and 1.11%, respectively. |
(4) | The expense ratio includes acquired fund fee expenses from the investment in the Subsidiary. Had this expense been excluded, the ratios would have been 1.09% and 1.09%, respectively. |
(5) | The expense ratio includes acquired fund fee expenses from the investment in the Subsidiary. Had this expense been excluded, the ratios would have been 1.09% and 1.08%, respectively. |
(6) | The expense ratio includes acquired fund fee expenses from the investment in the Subsidiary. Had this expense been excluded, the ratios would have been 1.09% and 1.09%, respectively. |
(7) | The expense ratio includes acquired fund fee expenses from the investment in the Subsidiary. Had this expense been excluded, the ratios would have been 1.09% and 1.08%, respectively. |
Amounts designated as “—” are either $0 or have been rounded to $0.
See accompanying notes to financial statements.
CITY NATIONAL ROCHDALE FUNDS | PAGE 130
notes to financial statements/
consolidated notes to financial statements |
March 31, 2019 (Unaudited) |
City National Rochdale Funds, a Delaware statutory trust (the “Trust”), is registered under the Investment Company Act of 1940, as amended (the “1940 Act”), as an open-end management investment company currently offering the following 10 series (each a “Fund” and collectively, the “Funds”): City National Rochdale Government Money Market Fund (“Government Money Market Fund”); City National Rochdale Government Bond Fund (“Government Bond Fund”), City National Rochdale Corporate Bond Fund (“Corporate Bond Fund”), City National Rochdale California Tax Exempt Bond Fund (“California Tax Exempt Bond Fund”), City National Rochdale Municipal High Income Fund (“Municipal High Income Fund”), City National Rochdale High Yield Bond Fund (“High Yield Bond Fund”), City National Rochdale Intermediate Fixed Income Fund (“Intermediate Fixed Income Fund”), and City National Rochdale Fixed Income Opportunities Fund (“Fixed Income Opportunities Fund”) (collectively, the “Fixed Income Funds”); and City National Rochdale Dividend & Income Fund (“Dividend & Income Fund”) and City National Rochdale U.S. Core Equity Fund (“U.S. Core Equity Fund”) (collectively, the “Equity Funds”).
The assets of each Fund are segregated, and a shareholder’s interest is limited to the Fund in which shares are held. Each Fund is diversified with the exception of the California Tax Exempt Bond Fund, which is non-diversified.
2. | SIGNIFICANT ACCOUNTING POLICIES: |
The following is a summary of significant accounting policies followed by the Funds.
Use of Estimates – The Funds are investment companies that conform with accounting principles generally accepted in the United States of America (“GAAP”). Therefore the Funds follow the accounting and reporting guidance for investment companies. The preparation of financial statements in conformity with GAAP requires management to make estimates and assumptions that affect the reported amounts of assets and liabilities and disclosure of contingent assets and liabilities at the date of the financial statements and the reported amounts of increases and decreases in net assets from operations during the reporting period. Actual results could differ from those estimates.
Security Valuation – Securities listed on a securities exchange, market or automated quotation system for which quotations are readily available (except for securities traded on NASDAQ) are valued at the last quoted sale price on the primary exchange or market (foreign or domestic) on which they are traded, or, if there is no such reported sale, at the most recent quoted bid price. For securities traded on NASDAQ, the NASDAQ Official Closing Price is used. If available, debt securities are priced based upon valuations provided by independent, third-party pricing agents. Such values generally reflect the last reported sales price if the security is actively traded. The third-party pricing agents may also value debt securities at an evaluated bid price by employing methodologies that utilize actual market transactions, broker-supplied valuations, or other methodologies designed to identify the market value for such securities. Debt obligations with remaining maturities of sixty days or less may be valued at their amortized cost, if the Funds’ Fair Value Committee concludes it approximates market value after taking into account factors such as credit, liquidity and interest rate conditions as well as issuer specific factors. Investments in underlying registered investment companies are valued at their respective daily net assets in accordance with pricing procedures approved by their respective boards. The prices for foreign securities are reported in local currency and converted to U.S. Dollars using currency exchange rates. Prices for most securities held by the Funds are provided daily by recognized independent pricing agents. If a security price cannot be obtained from an independent, third-party pricing agent, the Funds seek to obtain a bid price from one or more independent brokers.
Securities for which market prices are not “readily available” are valued in accordance with the Fair Value Procedures established by the Trust’s Board of Trustees. The Funds’ Fair Value Procedures are implemented through a Fair Value Committee (the “Committee”) designated by the Trust’s Board of Trustees. Some of the more common reasons that may necessitate that a security be valued using the Fair Value Procedures include: the security’s trading has been halted or suspended; the security has been de-listed from a national exchange; the security’s primary trading market is temporarily closed at a time when, under normal conditions, it would be open; for international securities, market events that occur after the close of the foreign markets that make closing prices not representative of fair value; or the security’s primary pricing source is not able or willing to provide a price. When a security is valued in accordance with the Fair Value Procedures, the Committee will determine the value after taking into consideration relevant information reasonably available to the Committee.
Investments in life settlement policies (“Policies”) are valued using a probabilistic method, for an actuarially derived valuation approach, in order to determine the fair value of each Policy. The Fair Value Procedures recognize that the Policies are illiquid and that no market currently exists for the Policies. Under the
CITY NATIONAL ROCHDALE FUNDS | PAGE 131
notes to financial statements/
consolidated notes to financial statements |
March 31, 2019 (Unaudited) |
probabilistic method, two life expectancies are obtained from established life expectancy providers on the insured(s) of the Policy and an actuarial table is used to determine the probability of survival in each year going forward for the insured(s) for each of the two life expectancies. The probabilities associated with each life expectancy are then utilized, along with the premiums due and the death benefit of the Policy for each year of the Policy, to determine expected cash flows. These cash flows are then discounted at a rate that accounts for the risks associated with the Policy and various other factors. The valuations from each life expectancy are then typically averaged to obtain the desired market valuation for the investor. Life settlement policies are included in Level 3 of the fair value hierarchy.
In accordance with GAAP, the objective of a fair value measurement is to determine the price that would be received to sell an asset or paid to transfer a liability, in an orderly transaction between market participants at the measurement date (an exit price). The fair value hierarchy gives the highest priority to quoted prices (unadjusted) in active markets for identical assets or liabilities (Level 1) and the lowest priority to unobservable inputs (Level 3). The three levels of the fair value hierarchy are described below:
| | ● | Level 1 — Unadjusted quoted prices in active markets for identical, unrestricted assets or liabilities that the Funds have the ability to access at the measurement date; |
| | ● | Level 2 — Quoted prices in inactive markets, or inputs that are observable (either directly or indirectly) for substantially the full term of the asset or liability; and |
| | ● | Level 3 — Prices, inputs or exotic modeling techniques which are both significant to the fair value measurement and unobservable (supported by little or no market activity). |
Investments are classified within the level of the lowest significant input considered in determining fair value. Investments classified within Level 3, the fair value measurement of which considers several inputs, may include Level 1 or Level 2 inputs as components of the overall fair value measurement.
For the period ended March 31, 2019, there have been no changes to the Funds’ fair value methodologies. For more details on the investment classifications, refer to the Schedules of Investments/Consolidated Schedule of Investments.
Security Transactions and Related Income – Security transactions are accounted for on the trade date of the security purchase or sale. Costs used in determining the net realized capital gains or losses on the sale of securities are those of the specific securities sold. Interest income is recognized on an accrual basis and dividend income is recognized on the ex-dividend date. Purchase discounts and premiums on securities held by the Funds are accreted and amortized to maturity using the scientific method, which approximates the effective interest method over the holding period of a security, except for the Government Money Market Fund, which uses a straight line basis which is not materially different from the scientific method.
Repurchase Agreements – Securities pledged as collateral for repurchase agreements are held by BNY Mellon until maturity of the repurchase agreements. Provisions of the agreements and procedures adopted by the investment adviser require that the market value of the collateral, including accrued interest thereon, is sufficient in the event of default by the counterparty. The Funds also invest in tri-party repurchase agreements. Securities held as collateral for tri-party repurchase agreements are maintained by the broker’s custodian bank in a segregated account until maturity of the repurchase agreements. Provisions of the agreements require that the market value of the collateral, including accrued interest thereon, is sufficient in the event of default. If the counterparty defaults and the value of the collateral declines or if the counterparty enters into an insolvency proceeding, realization of the collateral by a Fund may be delayed or limited.
TBA Transactions – The Funds may engage in “to be announced” (“TBA”) security transactions. Such transactions involve a commitment by a Fund to purchase or sell securities for a predetermined price or yield, with payment and delivery taking place beyond the customary settlement period. The Funds record TBA securities on the trade date and maintain security positions such that sufficient liquid assets will be available to make payments for the securities purchased.
Expense Allocation – Common expenses incurred by the Funds are allocated among the Funds (i) based upon relative average daily net assets, (ii) as incurred on a specific identification basis, (iii) equally, or (iv) based upon a combination of the above, depending on the nature of the expenditure.
Classes – Class-specific expenses are borne by that class. Income, non class-specific expenses, and realized and unrealized gains/losses are allocated to the respective class on the basis of relative net asset value each day.
Dividends and Distributions to Shareholders – Dividends from net investment income are declared daily and paid to shareholders monthly for the Government Money Market Fund and Fixed Income Funds, except for the Intermediate Fixed Income Fund and Fixed Income Opportunities Fund.
CITY NATIONAL ROCHDALE FUNDS | PAGE 132
Dividends from net investment income are declared and paid quarterly for the Intermediate Fixed Income Fund, Fixed Income Opportunities Fund and Equity Funds. Distributions from net realized capital gains are distributed to shareholders at least annually.
Foreign Currency – Values of investments denominated in foreign currencies are converted into U.S. Dollars using the spot market rate of exchange at the time of valuation. Purchases and sales of investments and dividend and interest income are translated into U.S. Dollars using the spot market rate of exchange prevailing on the respective dates of such transactions. The Funds do not isolate the portion of gains and losses on investments that is due to changes in the foreign exchange rates from that which is due to changes in market prices of investments. Foreign securities and currency transactions may involve certain considerations and risks not typically associated with those of domestic origin.
Forward Foreign Currency Contracts – A forward foreign currency contract is an agreement between two parties to buy or sell a currency at a set price on a future date. Forward contracts are marked to market daily and the change in market value is recorded as an unrealized gain/(loss) on forward foreign currency contracts in the Statements of Assets and Liabilities/Consolidated Statement of Assets and Liabilities. When a contract is closed, a Fund records a realized gain or loss equal to the difference between the value of the contract at the time it was opened and the value at the time it was closed, which is included within the realized gain/(loss) on foreign currency transactions in the Statements of Operations/Consolidated Statement of Operations. A Fund could be at risk if the counterparties are unable to meet the terms of the contracts or if the value of the currency changes unfavorably.
To reduce counterparty risk with respect to over-the-counter (“OTC”) transactions, the High Yield Bond Fund and the Fixed Income Opportunities Fund have entered into master netting arrangements, established within the High Yield Bond Fund’s and the Fixed Income Opportunities Fund’s International Swaps and Derivatives Association, Inc. (“ISDA”) master agreements, which allow the High Yield Bond Fund and the Fixed Income Opportunities Fund to make (or to have an entitlement to receive) a single net payment in the event of default (close-out netting) for outstanding payables and receivables with respect to certain OTC positions in forward foreign currency contracts for each individual counterparty. In addition, the High Yield Bond Fund and the Fixed Income Opportunities Fund may require that certain counterparties post cash and/or securities in collateral accounts to cover their net payment obligations for those derivative contracts subject to ISDA master agreements. If the counterparty fails to perform under these agreements, the cash and/or securities will be made available to the High Yield Bond Fund and/or the Fixed Income Opportunities Fund.
For financial reporting purposes, the High Yield Bond Fund and the Fixed Income Opportunities Fund do not offset derivative assets and derivative liabilities that are subject to netting arrangements in the Statements of Assets and Liabilities/Consolidated Statement of Assets and Liabilities. Bankruptcy or insolvency laws of a particular jurisdiction may impose restrictions on or prohibitions against the right of offset in bankruptcy, insolvency or other events.
Collateral terms are contract specific for OTC derivatives. For derivatives traded under an ISDA master agreement, the collateral requirements are typically calculated by netting the marked to market amount of each transaction under such agreement and comparing that amount to the value of any collateral currently pledged by the High Yield Bond Fund and the Fixed Income Opportunities Fund, or the counterparty.
For financial reporting purposes, cash collateral that has been pledged to cover obligations of the High Yield Bond Fund and the Fixed Income Opportunities Fund, if any, is reported separately on the Statements of Assets and Liabilities/Consolidated Statement of Assets and Liabilities as cash pledged as collateral. Non-cash collateral pledged by the High Yield Bond Fund and the Fixed Income Opportunities Fund, if any, is noted in the Schedule of Investments/Consolidated Schedule of Investments. Generally, the amount of collateral due from or to a party must exceed a minimum transfer amount threshold before a transfer has to be made. To the extent the amounts due to the High Yield Bond Fund and the Fixed Income Opportunities Fund from the Funds’ counterparties are not fully collateralized, contractually or otherwise, the High Yield Bond Fund and the Fixed Income Opportunities Fund bear the risk of loss from counterparty nonperformance.
Futures Contracts – To the extent consistent with their investment objective and strategies, certain Funds may use futures contracts for tactical hedging purposes as well as to enhance the Funds’ returns. Initial margin deposits of cash or securities are made upon entering into futures contracts. The contracts are marked to market daily and the resulting changes in value are accounted for as unrealized gains or losses. Variation margin payments are paid or received, depending upon whether unrealized gains or losses are incurred. When a contract is closed,
CITY NATIONAL ROCHDALE FUNDS | PAGE 133
notes to financial statements/
consolidated notes to financial statements |
March 31, 2019 (Unaudited) |
a Fund records a realized gain or loss equal to the difference between the proceeds from (or cost of) the closing transaction and the amount invested in the contract.
Risks of entering into futures contracts include the possibility that there will be an imperfect price correlation between the futures contract and the underlying securities. Second, it is possible that a lack of liquidity for futures contracts could exist in the secondary market, resulting in an inability to close a position prior to its maturity date. Third, futures contracts involve the risk that a Fund could lose more than the original margin deposit required to initiate a futures transaction.
Finally, the risk exists that losses could exceed amounts disclosed on the Statements of Assets and Liabilities/Consolidated Statement of Assets and Liabilities. As of March 31, 2019, there were no open futures contracts.
Swap Agreements – A Fund may invest in swap agreements as a non-principal investment strategy. A swap is a financial instrument that typically involves the exchange of cash flows between two parties on specified dates (settlement dates), where the cash flows are based on agreed-upon measures such as prices, interest rates or indices. The nominal amount on which these cash flows are calculated is called the notional amount. Swaps are individually negotiated and structured to include exposure to a variety of different types of investments or market factors, such as interest rates, foreign currency rates, mortgage securities, corporate borrowing rates, security prices, indices or inflation rates.
Swap agreements may increase or decrease the overall volatility of the investments of a Fund and its share price. The performance of swap agreements may be affected by a change in the specific interest rate, currency, or other factors that determine the payments due to and from a Fund. If a swap agreement calls for payments by a Fund, the Fund must be prepared to make such payments when due. In addition, if the counterparty’s creditworthiness declines, the value of a swap agreement would be likely to decline, potentially resulting in losses.
Generally, a swap agreement has a fixed maturity date that is agreed upon by the parties. The agreement can be terminated before the maturity date only under limited circumstances, such as default by one of the parties or insolvency, among others, and can be transferred by a party only with the prior written consent of the other party. A Fund may be able to eliminate its exposure under a swap agreement either by assignment or by other disposition, or by entering into an offsetting swap agreement with the same party or a similarly creditworthy party. If the counterparty is unable to meet its obligations under the contract, declares bankruptcy, defaults or becomes insolvent, a Fund may not be able to recover the money it expected to receive under the contract.
A swap agreement can be a form of leverage, which can magnify a Fund’s gains or losses. In order to reduce the risk associated with leveraging, a Fund will cover its current obligations under swap agreements according to guidelines established by the SEC. If a Fund enters into a swap agreement on a net basis, it will segregate assets with a daily value at least equal to the excess, if any, of the Fund’s accrued obligations under the swap agreement over the accrued amount the Fund is entitled to receive under the agreement. If a Fund enters into a swap agreement on other than a net basis, it will segregate assets with a value equal to the full amount of the Fund’s accrued obligations under the agreement.
Options Contracts – A Fund may also purchase put and call options. Purchasing call options tends to increase a Fund’s exposure to the underlying instrument. Purchasing put options tends to decrease a Fund’s exposure to the underlying instrument. When purchasing an option, a Fund will pay a premium which is included on the Fund’s Statement of Assets and Liabilities/Consolidated Statement of Assets and Liabilities and subsequently marked to market to reflect the current value of the option. Premiums paid for purchasing options which expire are treated as realized losses. Certain options may be purchased with premiums to be determined on a future date. The premiums for these options are based upon implied volatility parameters at specified terms. The risk associated with purchasing put and call options is limited to the premium paid. Premiums paid for purchasing options which are exercised or closed are added to the amounts paid or offset against the proceeds on the underlying investment transaction to determine the unrealized gain or loss.
The net realized gain or loss on options contracts is reflected in the Statements of Operations/Consolidated Statement of Operations and the net unrealized gains/(losses) are included as a component of the net change in unrealized appreciation/(depreciation) on options contracts in the Statement of Operations/Consolidated Statement of Operations. Realized and changes in unrealized gains or losses on options contracts during the period as disclosed in the Statements of Operations/Consolidated Statement of Operations, serve as indicators of the volume of derivative activity for a Fund. As of March 31, 2019, there were no open options contracts.
Restricted Securities – Restricted securities include securities that have not been registered under the Securities Act of 1933, as amended, and securities that are subject to restrictions on resale.
CITY NATIONAL ROCHDALE FUNDS | PAGE 134
A Fund may invest in restricted securities that are consistent with the Fund’s investment objective and investment strategies. A Fund will not invest in a restricted security if, immediately after and as a result of the investment in such security, more than 15% (5% in the case of the Government Money Market Fund) of the Fund’s net assets would be invested in illiquid securities. In some cases, the issuer of restricted securities has agreed to register such securities for resale, at the issuer’s expense either upon demand by a Fund or in connection with another registered offering of the securities. Investments in restricted securities are valued at fair value as determined in good faith in accordance with procedures adopted by the Board of Trustees. It is possible that the estimated value may differ significantly from the amount that might ultimately be realized in the near term, and the difference could be material.
Master Limited Partnerships – Entities commonly referred to as “MLPs” are generally organized under state law as limited partnerships or limited liability companies. The Dividend & Income Fund may, as a non-principal investment strategy, invest in MLPs receiving partnership taxation treatment under the Internal Revenue Code of 1986, interests or “units” of which are traded on securities exchanges like shares of corporate stock. To qualify as an MLP for U.S. Federal income tax purposes, an entity must receive at least 90% of its income from qualifying sources such as interest, dividends, real estate rents, gains from the sale or disposition of real property, income and gains from certain mineral or natural resources activities, income and gains from the transportation or storage of certain fuels, and, in certain circumstances, income and gains from commodities or futures, forwards and options with respect to commodities, and gains from the sale or other disposition of a capital asset held for the production of such income. Mineral or natural resources activities include exploration, development, production, mining, processing, refining, marketing and transportation (including pipelines) of oil and gas, minerals, geothermal energy, fertilizer, timber or industrial source carbon dioxide. An MLP consists of a general partner and limited partners (or in the case of MLPs organized as limited liability companies, a managing member and members). The general partner or managing member typically controls the operations and management of the MLP and has an ownership stake in the partnership. The limited partners or members, through their ownership of limited partner or member interests, provide capital to the entity, are intended to have no role in the operation and management of the entity, and receive cash distributions. The MLPs themselves generally do not pay U.S. Federal income taxes. Thus, unlike investors in corporate securities, direct MLP investors are generally not subject to double taxation (i.e., corporate level tax and tax on corporate dividends). Currently, most MLPs operate in the energy, natural resources or real estate sectors.
Investments in Irish Subsidiary – The Fixed Income Opportunities Fund may invest up to 15% of its net assets in life insurance policies and interests related thereto purchased through life settlement transactions. The Fund may invest in life insurance policies and related interests directly or through a wholly-owned subsidiary of the Fund under the laws of Ireland (the “Subsidiary”).
The principal purpose of investment in the Subsidiary is to allow the Fixed Income Opportunities Fund to gain exposure to life insurance policies within the limitations of the federal tax law requirements applicable to regulated investment companies. The Subsidiary is a company organized under the laws of Ireland and is overseen by its own board of directors. Although the Subsidiary has its own board of directors, the Subsidiary is wholly-owned and controlled by the Fund. The Subsidiary is not an investment company registered under the 1940 Act and is not subject to all of the investor protections of the 1940 Act.
Information regarding the Fixed Income Opportunities Fund and the Subsidiary has been consolidated in the Consolidated Schedule of Investments, Consolidated Statement of Assets and Liabilities, Consolidated Statement of Operations, Consolidated Statement of Changes in Net Assets and Consolidated Statement of Cash Flows.
The Subsidiary commenced operations on October 3, 2013. The net assets of the Subsidiary at March 31, 2019, were $170,290,561, which represented 5.5% of the net assets of the Fixed Income Opportunities Fund.
Investments in Affiliated Securities – The Fixed Income Funds and Equity Funds may invest excess cash in the Government Money Market Fund and / or the Municipal High Income Fund.
3. | DERIVATIVE TRANSACTIONS |
The following tables include only Funds that had exposure to more than one type of risk from derivatives held throughout the period. For Funds that held derivatives throughout the period with exposure to only one type of risk, additional information can be found on the Schedule of Investments/Consolidated Schedule of Investments and the Statements of Operations/Consolidated Statement of Operations.
CITY NATIONAL ROCHDALE FUNDS | PAGE 135
notes to financial statements/
consolidated notes to financial statements |
March 31, 2019 (Unaudited) |
The fair value of derivative instruments as of March 31, 2019, was as follows:
| Asset
Derivatives | | | | Liability
Derivatives | | | |
| Consolidated
Statement of
Assets and
Liabilities
Location | | Fair Value
(000) | | Consolidated
Statement of
Assets and
Liabilities
Location | | Fair Value
(000) | |
Derivatives not accounted for as hedging instruments: |
Fixed Income Opportunities Fund |
Interest rate contracts | Net Assets — Unrealized appreciation on swap contracts | | $ | 510 | | Net Assets — Unrealized depreciation on swap contracts | | $ | 325 | |
Foreign exchange contracts | Unrealized gain on forward foreign currency contracts | | | 3,697 | | Unrealized loss on forward foreign currency contracts | | | 2,110 | |
Total derivatives not accounted for as hedging instruments | | $ | 4,207 | | | | $ | 2,435 | |
Amount of realized gain or (loss) on derivatives recognized in income (000):
Derivatives not accounted for
as hedging instruments | | Forward
Currency
Contracts | | | Swaps | | | Total | |
Fixed Income Opportunities Fund |
Interest rate contracts | | $ | — | | | $ | 10 | | | $ | 10 | |
Foreign exchange contracts | | | 12,752 | | | | — | | | | 12,752 | |
Total | | $ | 12,752 | | | $ | 10 | | | $ | 12,762 | |
Change in unrealized appreciation or (depreciation) on derivatives recognized in income (000):
Derivatives not accounted for
as hedging instruments | | Forward
Currency
Contracts | | | Swaps | | | Total | |
Fixed Income Opportunities Fund |
Interest rate contracts | | $ | — | | | $ | (139 | ) | | $ | (139 | ) |
Foreign exchange contracts | | | 614 | | | | — | | | | 614 | |
Total | | $ | 614 | | | $ | (139 | ) | | $ | 475 | |
The following table discloses the volume of the Fund’s forward foreign currency contracts and swap contracts activity during the period ended March 31, 2019 (000):
Fixed Income Opportunities Fund | | | |
Forwards: | | | | |
Average Notional Balance Long | | $ | 48,395,834 | |
Average Notional Balance Short | | | 362,457,250 | |
Ending Notional Balance Long | | | 42,333,766 | |
Ending Notional Balance Short | | | 399,190,296 | |
Swaps: | | | | |
Average Notional Balance Long | | $ | 640,153,333 | |
Average Notional Balance Short | | | 640,153,333 | |
Ending Notional Balance Long | | | 340,820,000 | |
Ending Notional Balance Short | | | 340,820,000 | |
The following tables present, by derivative type, the Fixed Income Opportunities Fund’s OTC derivative assets and liabilities net of the related collateral posted for the benefit of the Fixed Income Opportunities Fund at March 31, 2019 (000):
Derivative Type | | Derivative
Assets
Subject to
a Netting
Agreement
or Similar
Arrangement | | | Derivative
Available
for Offset | | | Collateral
Received | | | Net Amount | |
Fixed Income Opportunities Fund |
Forward Foreign Currency Contracts | | | | | | | | | | | | | | | | |
BNP Paribas | | $ | 139 | | | $ | (139 | ) | | $ | — | | | $ | — | |
BT Brokerage | | | 104 | | | | (104 | ) | | | — | | | | — | |
Citigroup | | | 21 | | | | (21 | ) | | | — | | | | — | |
Credit Suisse First Boston | | | 196 | | | | (117 | ) | | | — | | | | 79 | |
Deutsche Bank | | | 45 | | | | (45 | ) | | | — | | | | — | |
JPMorgan Chase Bank | | | 43 | | | | (43 | ) | | | — | | | | — | |
Merrill Lynch | | | 163 | | | | (163 | ) | | | — | | | | — | |
Morgan Stanley | | | 275 | | | | (40 | ) | | | — | | | | 235 | |
Standard Bank | | | 87 | | | | (28 | ) | | | — | | | | 59 | |
U.S. Bank | | | 2,624 | | | | (10 | ) | | | — | | | | 2,614 | |
Derivative Type | | Derivative
Liabilities
Subject to
a Netting
Agreement
or Similar
Arrangement | | | Derivative
Available
for Offset | | | Collateral
Pledged | | | Net Amount | |
Fixed Income Opportunities Fund |
Forward Foreign Currency Contracts | | | | | | | | | | | | | | | | |
BNP Paribas | | $ | | (373) | | $ | 139 | | | $ | 234 | | | $ | — | |
BT Brokerage | | | (418 | ) | | | 104 | | | | 314 | | | | — | |
Citigroup | | | (31 | ) | | | 21 | | | | 10 | | | | — | |
Credit Suisse First Boston | | | (117 | ) | | | 117 | | | | — | | | | — | |
Deutsche Bank | | | (215 | ) | | | 45 | | | | 170 | | | | — | |
JPMorgan Chase Bank | | | (186 | ) | | | 43 | | | | 143 | | | | — | |
Merrill Lynch | | | (692 | ) | | | 163 | | | | 529 | | | | — | |
Morgan Stanley | | | (40 | ) | | | 40 | | | | — | | | | — | |
Standard Bank | | | (28 | ) | | | 28 | | | | — | | | | — | |
U.S. Bank | | | (10 | ) | | | 10 | | | | — | | | | — | |
CITY NATIONAL ROCHDALE FUNDS | PAGE 136
4. | ADMINISTRATION, TRANSFER AGENT, DISTRIBUTION AND SHAREHOLDER SERVICES AGREEMENTS: |
Pursuant to an Amended and Restated Administration Agreement dated January 1, 2013, as amended (the “Agreement”), SEI Investments Global Funds Services (the “Administrator”), a wholly owned subsidiary of SEI Investments Company, acts as the Trust’s administrator. Under the terms of the Agreement, the Administrator is entitled to receive an annual fee based on the average daily net assets of the Trust, subject to a minimum annual fee.
The Trust has adopted a Rule 12b-1 Distribution Plan (“the Plan”) with respect to Class N and Class S Shares that allows each Fund to pay distribution and servicing fees. Pursuant to the Plan, SEI Investments Distribution Co. (the “Distributor”) may receive a distribution fee, computed daily and paid monthly, at the annual rate of 0.50% of the average daily net assets of the Class S Shares and 0.30% of the average daily net assets of the Class N Shares of the Government Money Market Fund and 0.25% of the Class N Shares of the Fixed Income Funds and Equity Funds, which may be used by the Distributor to provide compensation for sales support and distribution-related activities. Pursuant to a Distribution Coordination Agreement, the entirety of the fees received by the Distributor pursuant to the Plan is transmitted to RIM Securities LLC (“RIM Securities”) as Sub-Distribution Coordinator. RIM Securities then reallows those fees to broker-dealers and service providers, including City National Rochdale, LLC ("City National Rochdale" or the "Adviser") and other affiliates, for payments for distribution services of the type identified in the Plan, and retains any undistributed balance of fees received from the Distributor.
The Government Money Market Fund has contractually agreed to limit the Distribution (12b-1) Fee payable by Class S shares of the Fund to 0.45% through January 31, 2020. Prior to that date, the arrangement may be terminated without penalty by the Fund’s Board of Trustees.
U.S. Bank Global Fund Services (the “Transfer Agent”) serves as transfer agent for the Trust and provides services at an annual rate of $20,000 per share class for all Funds plus other transaction based fees and out-of-pocket expenses.
The Trust has entered into Shareholder Servicing Agreements that permit payment of compensation to City National Bank (“CNB”) and its affiliates (including City National Rochdale), which provide certain shareholder support for their customers who own Class N, Class S, or Servicing Class Shares, as applicable. In consideration for such services, a shareholder servicing fee is charged at the annual rate of up to 0.25% of the average daily net assets of the relevant class of each Fund.
CNB and City National Rochdale have agreed to voluntarily waive portions of their shareholder servicing fees with respect to certain Funds. For the period ended March 31, 2019, CNB and City National Rochdale received $12,145,834 in shareholder servicing fees from the Trust.
Certain officers of the Trust are also officers or employees of City National Rochdale, CNB or the Administrator. Such officers are paid no fees by the Trust for serving as officers of the Trust.
5. | INVESTMENT ADVISORY FEES AND OTHER AGREEMENTS: |
Under the terms of the current investment management agreements, City National Rochdale receives an annual fee equal to a percentage of the average daily net assets of each Fund, as follows:
Fund | | Fee | |
Government Money Market Fund | | | 0.26 | % |
Government Bond Fund | | | 0.43 | |
Corporate Bond Fund | | | 0.40 | |
California Tax Exempt Bond Fund | | | 0.27 | |
Municipal High Income Fund | | | 0.50 | |
High Yield Bond Fund | | | 0.60 | |
Intermediate Fixed Income Fund | | | 0.40 | |
Fixed Income Opportunities Fund | | | 0.50 | |
Dividend & Income Fund | | | 0.50 | |
U.S. Core Equity Fund | | | 0.40 | |
City National Rochdale has contractually agreed to waive the management fee for the Government Money Market Fund such that the fee charged is 0.15% through January 31, 2020. Prior to that date, the arrangement may be terminated without penalty (a) by the Fund’s Board of Trustees, or (b) by the Adviser effective no earlier than January 31, 2020, upon at least 60 days’ prior written notice. Management fees waived by the Adviser pursuant to this arrangement will not be eligible for reimbursement by the Fund to the Adviser.
Federated Investment Management Company, LLC acts as the investment sub-adviser with respect to the High Yield Bond Fund.
Alcentra LTD, Alcentra NY, LLC, All Financial Partners II LLC, Ashmore Investment Management Limited, Federated Investment Management Company, GML Capital LLP and Seix Investment Advisors LLC act as the investment sub-advisers with respect to the Fixed Income Opportunities Fund.
CITY NATIONAL ROCHDALE FUNDS | PAGE 137
notes to financial statements/
consolidated notes to financial statements |
March 31, 2019 (Unaudited) |
Sub-adviser fees are paid by City National Rochdale.
City National Rochdale has voluntarily agreed to limit its fees or reimburse expenses to the extent necessary to keep operating expenses at or below certain percentages of certain of the Funds’ respective average daily net assets. The voluntary expense limitations (expressed as percentages of the average daily net assets) are as follows:
| Government
Bond Fund | Corporate
Bond Fund |
Institutional Class | 0.53% | n/a |
Class N | 1.03% | 1.01% |
Class S | n/a | n/a |
Servicing Class | 0.78% | 0.76% |
| California
Tax Exempt
Bond Fund | Intermediate
Fixed Income
Fund | Fixed Income
Opportunities
Fund |
Institutional Class | n/a | 0.51% | n/a |
Class N | 0.88% | 1.01% | 1.09% |
Servicing Class | 0.63% | n/a | n/a |
Any fee reductions or expense reimbursements may be repaid by a Fund to City National Rochdale, within three years after occurrence if such repayments can be achieved within the Fund’s expense limit in effect at the time such expenses were incurred and if certain other conditions are satisfied.
As of March 31, 2019, fees which were previously waived by City National Rochdale which may be subject to possible future reimbursement were as follows:
Fund | | Potential Amount of
Recovery
(000) | | | Expiration | |
Government Money Market Fund | | $ | 1,132 | | | | 2022 | |
Government Bond Fund | | | 178 | | | | 2020 | |
| | | | 181 | | | | 2021 | |
| | | | 47 | | | | 2022 | |
Corporate Bond Fund | | | 196 | | | | 2020 | |
| | | | 146 | | | | 2021 | |
| | | | 22 | | | | 2022 | |
California Tax Exempt Bond Fund | | | 201 | | | | 2020 | |
| | | | 178 | | | | 2021 | |
| | | | 45 | | | | 2022 | |
Intermediate Fixed Income Fund | | | 80 | | | | 2020 | |
| | | | 102 | | | | 2021 | |
| | | | 35 | | | | 2022 | |
Fixed Income Opportunities Fund | | | 266 | | | | 2021 | |
Dividend & Income Fund | | | 43 | | | | 2020 | |
During the period ended March 31, 2019, City National Rochdale recovered $8 (000) in previously waived fees for the Fixed Income Opportunities Fund.
6. | INVESTMENT TRANSACTIONS: |
The cost of security purchases and proceeds from the sale and maturities of securities, other than temporary investments in short-term securities for the period ended March 31, 2019, were as follows for the Fixed Income Funds and Equity Funds:
| | | Purchases | | | Sales and Maturities | |
Fund | | U.S. Gov’t
(000) | | | Other
(000) | | | U.S. Gov’t
(000) | | | Other
(000) | |
Government Bond Fund | | $ | 5,940 | | | $ | — | | | $ | 16,465 | | | $ | 222 | |
Corporate Bond Fund | | | — | | | | 8,548 | | | | — | | | | 18,247 | |
California Tax Exempt Bond Fund | | | — | | | | 7,264 | | | | — | | | | 13,292 | |
Municipal High Income Fund | | | — | | | | 266,676 | | | | — | | | | 232,095 | |
High Yield Bond Fund | | | — | | | | 44,839 | | | | — | | | | 37,885 | |
Intermediate Fixed Income Fund | | | 14,826 | | | | 10,802 | | | | 15,506 | | | | 43,609 | |
Fixed Income Opportunities Fund | | | 11,645 | | | | 1,641,341 | | | | 18,546 | | | | 1,512,354 | |
Dividend & Income Fund | | | — | | | | 2,456 | | | | — | | | | 17,775 | |
U.S. Core Equity | | | — | | | | 51,455 | | | | — | | | | 57,745 | |
The Funds may purchase or sell investment securities in transactions with affiliated entities under procedures adopted by the Board of Trustees, pursuant to the 1940 Act. These transactions are effected at market rates without incurring broker commissions.
7. | FEDERAL TAX INFORMATION: |
Each Fund intends to qualify or continue to qualify as a regulated investment company for U.S. Federal income tax purposes and distribute all of its taxable income and net capital gains. Accordingly, no provisions for U.S. Federal income taxes are required.
Management has analyzed the Funds’ tax positions taken on U.S. Federal income tax returns for all open tax years and has concluded that as of March 31, 2019, no provision for income tax would be required in the Funds’ financial statements. The Funds’ U.S. Federal and state income and U.S. Federal excise tax returns for tax years for which the applicable statutes of limitations have not expired are subject to examination by the Internal Revenue Service and state departments of revenue.
The Funds may be subject to taxes imposed by countries in which they invest, with respect to their investments in issuers existing or operating in such countries. Such taxes are generally based on income earned. The Funds accrue such taxes when the related income is earned.
The timing and characterization of certain income and capital gains distributions are determined annually in accordance with U.S. Federal tax regulations, which may differ from accounting principles generally accepted in the United States of America. As a result, net investment income/(loss) and net realized gain/
CITY NATIONAL ROCHDALE FUNDS | PAGE 138
(loss) on investment transactions for a reporting period may differ significantly from distributions during such period. These book/tax differences may be temporary or permanent. To the extent these differences are permanent in nature, they are charged or credited to undistributed net investment income/(loss), accumulated net realized gain/(loss), or paid-in capital, as appropriate, in the period that the differences arise.
Accordingly, the following permanent differences, primarily attributable to foreign currency transactions, REIT adjustments, investments in partnerships, realized gains/(losses) on paydowns, default bonds, non-deductible excise tax paid, passive foreign investment company adjustments, investments in swaps, reclassification of distributions, return of capital distributions received and market discount adjustments, were reclassified to/from the following accounts as of September 30, 2018:
| | Increase
(Decrease)
Undistributed
Net Investments
Income (Loss)
(000) | | | Increase
(Decrease)
Accumulated
Net Realized
Gain (Loss)
(000) | | | Increase
(Decrease)
Paid-in Capital
(000) | |
Government Bond Fund | | $ | 59 | | | $ | (59 | ) | | $ | — | |
Municipal High Income Fund | | | (2,813 | ) | | | 2,813 | | | | — | |
High Yield Bond Fund | | | 39 | | | | (39 | ) | | | — | |
Intermediate Fixed Income Fund | | | 74 | | | | (68 | ) | | | (6 | ) |
Fixed Income Opportunities Fund | | | 10,202 | | | | (10,202 | ) | | | — | |
Dividend & Income Fund | | | 330 | | | | (326 | ) | | | (4 | ) |
U.S. Core Equity Fund | | | 9 | | | | (9 | ) | | | — | |
Amounts designated as “—” are either $0 or have been rounded to $0.
The tax character of dividends and distributions declared during the years ended September 30, 2018, and September 30, 2017, unless otherwise indicated were as follows:
Fund | | Tax Exempt
Income
(000) | | | Ordinary
Income
(000) | | | Long-Term
Capital
Gain (000) | | | Return of
Capital
(000) | | | Total
(000) | |
Government Money Market Fund |
2018 | | $ | — | | | $ | 41,445 | | | $ | — | | | $ | — | | | $ | 41,445 | |
2017 | | | — | | | | 4,927 | | | | — | | | | — | | | | 4,927 | |
Government Bond Fund |
2018 | | $ | — | | | $ | 995 | | | $ | 60 | | | $ | — | | | $ | 1,055 | |
2017 | | | — | | | | 1,098 | | | | 95 | | | | — | | | | 1,193 | |
Corporate Bond Fund |
2018 | | $ | — | | | $ | 2,638 | | | $ | — | | | $ | — | | | $ | 2,638 | |
2017 | | | — | | | | 2,347 | | | | — | | | | — | | | | 2,347 | |
California Tax Exempt Bond Fund |
2018 | | $ | 1,218 | | | $ | 78 | | | $ | — | | | $ | — | | | $ | 1,296 | |
2017 | | | 1,261 | | | | 151 | | | | 436 | | | | — | | | | 1,848 | |
Municipal High Income Fund |
2018 | | $ | 44,230 | | | $ | 711 | | | $ | — | | | $ | — | | | $ | 44,941 | |
2017 | | | 39,585 | | | | 671 | | | | — | | | | — | | | | 40,256 | |
High Yield Bond Fund |
2018 | | $ | — | | | $ | 3,614 | | | $ | — | | | $ | — | | | $ | 3,614 | |
2017 | | | — | | | | 3,792 | | | | — | | | | — | | | | 3,792 | |
Intermediate Fixed Income Fund |
2018 | | $ | — | | | $ | 4,384 | | | $ | — | | | $ | — | | | $ | 4,384 | |
2017 | | | — | | | | 4,960 | | | | — | | | | — | | | | 4,960 | |
Fixed Income Opportunities Fund |
2018 | | $ | — | | | $ | 157,669 | | | $ | — | | | $ | — | | | $ | 157,669 | |
2017 | | | — | | | | 145,340 | | | | — | | | | — | | | | 145,340 | |
Dividend & Income Fund |
2018 | | $ | — | | | $ | 7,003 | | | $ | 7,390 | | | $ | — | | | $ | 14,393 | |
2017 | | | — | | | | 5,052 | | | | 1,794 | | | | — | | | | 6,846 | |
U.S. Core Equity Fund |
2018 | | $ | — | | | $ | 1,875 | | | $ | 3,547 | | | $ | — | | | $ | 5,422 | |
2017 | | | — | | | | 1,909 | | | | 9,543 | | | | — | | | | 11,452 | |
CITY NATIONAL ROCHDALE FUNDS | PAGE 139
notes to financial statements/
consolidated notes to financial statements |
March 31, 2019 (Unaudited) |
As of September 30, 2018, the components of Distributable Earnings/(Accumulated Losses) on a tax basis were as follows:
Fund | | Undistributed
Tax-Exempt
Income
(000) | | | Undistributed
Ordinary
Income
(000) | | | Undistributed
Long-Term
Capital Gain
(000) | | | Capital Loss
Carryforwards
(000) | | | Post-October
Losses
(000) | | | Unrealized
Appreciation
(Depreciation)
(000) | | | Other
Temporary
Differences
(000) | | | Total
Distributable
Earnings
(Accumulated
Losses)
(000) | |
Government Money Market Fund | | $ | — | | | $ | 6,064 | | | $ | — | | | $ | — | | | $ | — | | | $ | — | | | $ | (6,057 | ) | | $ | 7 | |
Government Bond Fund | | | ��� | | | | 47 | | | | — | | | �� | — | | | | (629 | ) | | | (1,445 | ) | | | (51 | ) | | | (2,078 | ) |
Corporate Bond Fund | | | — | | | | 277 | | | | — | | | | (1,210 | ) | | | (30 | ) | | | (2,132 | ) | | | (227 | ) | | | (3,322 | ) |
California Tax Exempt Bond Fund | | | 111 | | | | — | | | | — | | | | (363 | ) | | | (13 | ) | | | (173 | ) | | | (110 | ) | | | (548 | ) |
Municipal High Income Fund | | | 3,854 | | | | — | | | | — | | | | (17,499 | ) | | | — | | | | 3,279 | | | | (3,835 | ) | | | (14,201 | ) |
High Yield Bond Fund | | | — | | | | 273 | | | | — | | | | (4,886 | ) | | | (511 | ) | | | (2,416 | ) | | | (244 | ) | | | (7,784 | ) |
Intermediate Fixed Income Fund | | | — | | | | 87 | | | | — | | | | (359 | ) | | | (1,500 | ) | | | (3,377 | ) | | | (1 | ) | | | (5,150 | ) |
Fixed Income Opportunities Fund | | | — | | | | 2,740 | | | | — | | | | (36,938 | ) | | | (2,076 | ) | | | (135,233 | ) | | | (733 | ) | | | (172,240 | ) |
Dividend & Income Fund | | | — | | | | 233 | | | | 6,050 | | | | — | | | | — | | | | 54,345 | | | | (16 | ) | | | 60,612 | |
U.S. Core Equity Fund | | | — | | | | 7 | | | | 11,615 | | | | — | | | | — | | | | 103,343 | | | | (2 | ) | | | 114,963 | |
Post-October losses represent losses realized on investments and foreign currency transactions from November 1, 2017, through September 30, 2018, that, in accordance with U.S. Federal income tax regulations, the Funds have elected to defer and treat as having arisen in the following fiscal year.
Under the Regulated Investment Company Modernization Act of 2010, the Funds will be permitted to carry forward capital losses incurred in taxable years beginning after December 22, 2010, for an unlimited period. However, any losses incurred during those future taxable years will be required to be utilized prior to the losses incurred in pre-enactment taxable years. As a result of this ordering rule, pre-enactment capital loss carryforwards may be more likely to expire unused. Additionally, post-enactment capital losses that are carried forward will retain their character as either short-term or long-term capital losses rather than being considered all short-term as under previous law. Losses carried forward under these new provisions are as follows:
Fund | | Short-Term Loss
(000) | | | Long-Term Loss
(000) | | | Total
(000) | |
Corporate Bond Fund | | $ | — | | | $ | (1,210 | ) | | $ | (1,210 | ) |
California Tax Exempt Bond Fund | | | (328 | ) | | | (35 | ) | | | (363 | ) |
Municipal High Income Fund | | | (17,499 | ) | | | — | | | | (17,499 | ) |
High Yield Bond Fund | | | — | | | | (4,886 | ) | | | (4,886 | ) |
Intermediate Fixed Income Fund | | | (21 | ) | | | (338 | ) | | | (359 | ) |
Fixed Income Opportunities Fund | | | — | | | | (36,938 | ) | | | (36,938 | ) |
During the year ended September 30, 2018, the following Funds utilized capital loss carryforwards to offset capital gains amounting to:
Fund | | Amount
(000) | |
High Yield Bond Fund | | $ | 50 | |
Intermediate Fixed Income Fund | | | 54 | |
Fixed Income Opportunities Fund | | | 7,972 | |
The aggregate gross unrealized appreciation on investments, the aggregate gross unrealized depreciation on investments and the net unrealized appreciation/(depreciation) for tax purposes as of March 31, 2019, for each of the Fixed Income Funds’ and Equity Funds’ investments were as follows:
Fund | | Federal Tax
Cost
(000) | | | Aggregate
Gross
Unrealized
Appreciation
(000) | | | Aggregate
Gross
Unrealized
Depreciation
(000) | | | Net
Unrealized
Appreciation
(Depreciation)
(000) | |
Government Bond Fund | | $ | 44,644 | | | $ | 107 | | | $ | (420 | ) | | $ | (313 | ) |
Corporate Bond Fund | | | 132,888 | | | | 1,065 | | | | (824 | ) | | | 241 | |
California Tax Exempt Bond Fund | | | 80,786 | | | | 1,791 | | | | (43 | ) | | | 1,748 | |
Municipal High Income Fund | | | 1,276,749 | | | | 53,063 | | | | (28,831 | ) | | | 24,232 | |
High Yield Bond Fund | | | 56,671 | | | | 1,026 | | | | (825 | ) | | | 201 | |
Intermediate Fixed Income Fund | | | 152,428 | | | | 1,853 | | | | (1,454 | ) | | | 399 | |
Fixed Income Opportunities Fund | | | 3,144,676 | | | | 93,794 | | | | (130,377 | ) | | | (36,583 | ) |
Dividend & Income Fund | | | 179,373 | | | | 56,538 | | | | (2,775 | ) | | | 53,763 | |
U.S. Core Equity Fund | | | 191,468 | | | | 104,254 | | | | (17 | ) | | | 104,237 | |
At March 31, 2019, the Government Money Market Fund’s cost of securities for U.S. Federal income tax purposes approximates the cost disclosed in the Schedule of Investments.
In the normal course of business, the Funds enter into contracts that provide general indemnifications. The Funds’ maximum exposure under these arrangements is dependent on future claims
CITY NATIONAL ROCHDALE FUNDS | PAGE 140
that may be made against the Funds and, therefore, cannot be established; however, based on experience, the risk of loss from such claims is considered remote.
The Intermediate Fixed Income Fund, the Fixed Income Opportunities Fund and the Dividend & Income Fund may invest in exchange-traded notes (“ETNs”), each as a non-principal investment strategy. ETNs are unsecured debt obligations of investment banks which are traded on exchanges and the returns of which are linked to the performance of market indexes. In addition to trading ETNs on exchanges, investors may redeem ETNs directly with the issuer on a weekly basis, typically in a minimum amount of 50,000 units, or hold the ETNs until maturity. ETNs are riskier than ordinary unsecured debt securities and have no principal protection. The Funds will generally invest in ETNs which are linked to commodities indexes. A Fund’s investment in an ETN may be influenced by many unpredictable factors, including highly volatile commodities prices, changes in supply and demand relationships, weather, agriculture, trade, changes in interest rates, and monetary and other governmental policies, action and inaction. Investing in ETNs is not equivalent to investing directly in index components or the relevant index itself. Because ETNs are debt securities, they possess credit risk; if the issuer has financial difficulties or goes bankrupt, the investor may not receive the return expected and may suffer a loss.
The Municipal High Income Fund, High Yield Bond Fund, Intermediate Fixed Income Fund and Fixed Income Opportunities Fund may invest in lower-rated corporate bonds, known as high yield bonds. High yield bonds involve greater risks of default, downgrade, or price declines and are more volatile than investment grade securities. Issuers of high yield bonds may be more susceptible than other issuers to economic downturns and investors are subject to a greater risk that the issuer may not be able to pay interest or dividends, or repay the principal upon maturity. Discontinuation of these payments could have a substantial adverse effect on the market value of the security.
The Intermediate Fixed Income Fund and Fixed Income Opportunities Fund may invest in asset-backed and mortgage-backed securities. As a general rule, prepayments of the principal of the loans underlying mortgage-backed or other pass-through securities increase during a period of falling interest rates and decrease during a period of rising interest rates. In periods of declining interest rates, as a result of prepayments a Fund may be required to reinvest its assets in securities with lower interest rates. In periods of increasing interest rates, the securities subject to prepayment risk held by a Fund may exhibit price characteristics of longer-term debt securities.
The Intermediate Fixed Income Fund, High Yield Bond Fund and Fixed Income Opportunities Fund may invest in bank loans. Bank loans are not traded on an exchange and purchasers and sellers of bank loans generally rely on market makers, typically the administrative agent under a bank loan, to effect private sales transactions. As a result, bank loans may have relatively less liquidity than other types of fixed income assets, and a Fund may be more likely to incur losses on the sale of bank loans than on other, more liquid, investments.
The Fixed Income Opportunities Fund may invest in beneficial interests in individual life insurance Policies. A Policy owner transfers his or her Policy at a discount to its face value (the amount that is payable upon the death of the insured) in return for an immediate cash settlement. The ultimate purchaser of the Policy (in this case, the Fund) is responsible for premiums payable on the Policy and is entitled to receive the full face value from the insurance company upon the death of the insured. If the Fund is unable to make premium payments on a Policy, the Policy will lapse and the Fund will lose its ownership interest in the Policy. There is currently no established secondary market for Policies, and the Policies are not considered liquid investments by the Fund. If the Fund must sell Policies to meet redemption requests or for other cash needs, the Fund may be forced to sell at a loss. The longer the insured lives, the lower the Fund’s rate of return on the Policy. The underwriter’s estimate of the insured’s life expectancy may be incorrect. An insurance company may be unable or may refuse to pay benefits on a Policy. In addition, market quotations will not be readily available for the Policies and the Policies will be priced using a fair value methodology adopted by the Trust’s Board of Trustees. The sales price the Fund could receive for a Policy may differ from the Trust’s valuation of the Policy. A Policy is a liability of the issuing life insurance company, and if the life insurance company goes out of business, sufficient funds may not be available to pay that liability.
California Tax Exempt Bond Fund – Specific Risks
The ability of issuers to pay interest on, and repay the principal of, California municipal securities may be affected by economic and political developments in the State of California.
Certain securities are backed by letters of credit from various financial institutions and financial guaranty assurance agencies. These letters of credit enhance the credit quality of the individual securities; however, if any of the financial institutions’ or financial guaranty assurance agencies’ credit quality should
CITY NATIONAL ROCHDALE FUNDS | PAGE 141
notes to financial statements/
consolidated notes to financial statements |
March 31, 2019 (Unaudited) |
deteriorate, it could cause the individual security’s credit quality to change. Additionally, if the Fund concentrates its letters of credit in any one financial institution, the risk of credit quality deterioration increases.
The Fund invests in Certificates of Participation in a municipal obligation, which are subject to annual appropriation risk.
A more complete description of risks is included in the Funds’ prospectus and statement of additional information.
9. | CAPITAL SHARES ISSUED AND REDEEMED: |
Capital share activity for the six months ended March 31, 2019, and the year ended September 30, 2018, were as follows (000):
| | | Government Money Market Fund | | | | Government Bond Fund | | | | Corporate Bond Fund | |
| | | 2019 | | | 2018 | | | | 2019 | | | 2018 | | | | 2019 | | | 2018 | |
CAPITAL SHARES ISSUED AND REDEEMED: | | | | | | | | | | | | | | | | | | | | | | |
Institutional Class: | | | | | | | | | | | | | | | | | | | | | | | | | | |
Shares issued | | | — | | | | — | | | | | — | | | | 318 | | | | | — | | | | — | |
Shares issued in lieu of dividends and distributions | | | — | | | | — | | | | | — | | | | 37 | | | | | — | | | | — | |
Shares redeemed | | | — | | | | — | | | | | — | | | | (4,170 | ) | | | | — | | | | — | |
Net Institutional Class transactions | | | — | | | | — | | | | | — | | | | (3,815 | ) | | | | — | | | | — | |
Class N: | | | | | | | | | | | | | | | | | | | | | | | | | | |
Shares issued | | | 1,185,903 | | | | 3,371,578 | | | | | 84 | | | | 40 | | | | | 248 | | | | 288 | |
Shares issued in lieu of dividends and distributions | | | 4,904 | | | | 4,585 | | | | | 1 | | | | 1 | | | | | 6 | | | | 8 | |
Shares redeemed | | | (1,558,504 | ) | | | (3,480,575 | ) | | | | (11 | ) | | | (14 | ) | | | | (77 | ) | | | (143 | ) |
Net Class N transactions | | | (367,697 | ) | | | (104,412 | ) | | | | 74 | | | | 27 | | | | | 177 | | | | 153 | |
Class S: | | | | | | | | | | | | | | | | | | | | | | | | | | |
Shares issued | | | 2,575,601 | | | | 2,843,388 | | | | | — | | | | — | | | | | — | | | | — | |
Shares issued in lieu of dividends and distributions | | | — | | | | — | | | | | — | | | | — | | | | | — | | | | — | |
Shares redeemed | | | (2,717,427 | ) | | | (2,614,165 | ) | | | | — | | | | — | | | | | — | | | | — | |
Net Class S transactions | | | (141,826 | ) | | | 229,223 | | | | | — | | | | — | | | | | — | | | | — | |
Servicing Class: | | | | | | | | | | | | | | | | | | | | | | | | | | |
Shares issued | | | 4,243,097 | | | | 7,234,103 | | | | | 411 | | | | 1,287 | | | | | 939 | | | | 2,666 | |
Shares issued in lieu of dividends and distributions | | | 19,407 | | | | 19,753 | | | | | 3 | | | | 8 | | | | | 14 | | | | 28 | |
Shares redeemed | | | (4,417,047 | ) | | | (6,612,833 | ) | | | | (1,678 | ) | | | (1,487 | ) | | | | (1,927 | ) | | | (2,314 | ) |
Net Servicing Class transactions | | | (154,543 | ) | | | 641,023 | | | | | (1,264 | ) | | | (192 | ) | | | | (974 | ) | | | 380 | |
| | | California Tax Exempt Bond Fund | | | | Municipal High Income Fund | |
| | | 2019 | | | 2018 | | | | 2019 | | | 2018 | |
CAPITAL SHARES ISSUED AND REDEEMED: | | | | | | | | | | | | | | | | | |
Class N: | | | | | | | | | | | | | | | | | |
Shares issued | | | 248 | | | | 380 | | | | | 12,349 | | | | 19,450 | |
Shares issued in lieu of dividends and distributions | | | 6 | | | | 5 | | | | | 858 | | | | 1,402 | |
Shares redeemed | | | (77 | ) | | | (519 | ) | | | | (10,318 | ) | | | (13,263 | ) |
Net Class N transactions | | | 177 | | | | (134 | ) | | | | 2,889 | | | | 7,589 | |
Servicing Class: | | | | | | | | | | | | | | | | | |
Shares issued | | | 939 | | | | 1,926 | | | | | 5,768 | | | | 10,360 | |
Shares issued in lieu of dividends and distributions | | | 14 | | | | 18 | | | | | 133 | | | | 263 | |
Shares redeemed | | | (1,927 | ) | | | (1,942 | ) | | | | (5,670 | ) | | | (7,681 | ) |
Net Servicing Class transactions | | | (974 | ) | | | 2 | | | | | 231 | | | | 2,942 | |
CITY NATIONAL ROCHDALE FUNDS | PAGE 142
| | | High Yield Bond Fund | | | | Intermediate Fixed Income Fund | | | | Fixed Income Opportunities Fund | |
| | | 2019 | | | 2018 | | | | 2019 | | | 2018 | | | | 2019 | | | 2018 | |
CAPITAL SHARES ISSUED AND REDEEMED: | | | | | | | | | | | | | |
Institutional Class: | | | | | | | | | | | | | | | | | | | | | | | | | | |
Shares issued | | | 354 | | | | 691 | | | | | 8 | | | | 52 | | | | | — | | | | — | |
Shares issued in lieu of dividends and distributions | | | 109 | | | | 263 | | | | | 1 | | | | 2 | | | | | — | | | | — | |
Shares redeemed | | | (476 | ) | | | (1,903 | ) | | | | (21 | ) | | | (50 | ) | | | | — | | | | — | |
Net Institutional Class transactions | | | (13 | ) | | | (949 | ) | | | | (12 | ) | | | 4 | | | | | — | | | | — | |
Class N: | | | | | | | | | | | | | | | | | | | | | | | | | | |
Shares issued | | | 211 | | | | 286 | | | | | 464 | | | | 1,211 | | | | | 21,388 | | | | 32,209 | |
Shares issued in lieu of dividends and distributions | | | 23 | | | | 56 | | | | | 71 | | | | 160 | | | | | 2,550 | | | | 4,676 | |
Shares redeemed | | | (403 | ) | | | (591 | ) | | | | (1,826 | ) | | | (3,533 | ) | | | | (18,001 | ) | | | (21,582 | ) |
Net Class N transactions | | | (169 | ) | | | (249 | ) | | | | (1,291 | ) | | | (2,162 | ) | | | | 5,937 | | | | 15,303 | |
Servicing Class: | | | | | | | | | | | | | | | | | | | | | | | | | | |
Shares issued | | | 141 | | | | 61 | | | | | — | | | | — | | | | | — | | | | — | |
Shares issued in lieu of dividends and distributions | | | 10 | | | | 19 | | | | | — | | | | — | | | | | — | | | | — | |
Shares redeemed | | | (123 | ) | | | (522 | ) | | | | — | | | | — | | | | | — | | | | — | |
Net Servicing Class transactions | | | 28 | | | | (442 | ) | | | | — | | | | — | | | | | — | | | | — | |
| | | Dividend & Income Fund | | | | U.S. Core Equity Fund | |
| | | 2019 | | | 2018 | | | | 2019 | | | 2018 | |
CAPITAL SHARES ISSUED AND REDEEMED: | | | | |
Institutional Class: | | | | | | | | | | | | | | | | | |
Shares issued | | | — | | | | — | | | | | 6 | | | | 1 | |
Shares issued in lieu of dividends and distributions | | | — | | | | — | | | | | — | (a) | | | — | (a) |
Shares redeemed | | | — | | | | — | | | | | — | | | | — | (a) |
Net Institutional Class transactions | | | — | | | | — | | | | | 6 | | | | 1 | |
Class N: | | | | | | | | | | | | | | | | | |
Shares issued | | | 522 | | | | 1,145 | | | | | 609 | | | | 1,330 | |
Shares issued in lieu of dividends and distributions | | | 199 | | | | 234 | | | | | 345 | | | | 129 | |
Shares redeemed | | | (774 | ) | | | (1,558 | ) | | | | (794 | ) | | | (1,436 | ) |
Net Class N transactions | | | (53 | ) | | | (179 | ) | | | | 160 | | | | 23 | |
Servicing Class: | | | | | | | | | | | | | | | | | |
Shares issued | | | — | | | | — | | | | | 939 | | | | 1,580 | |
Shares issued in lieu of dividends and distributions | | | — | | | | — | | | | | 29 | | | | 10 | |
Shares redeemed | | | — | | | | — | | | | | (816 | ) | | | (1,331 | ) |
Net Servicing Class transactions | | | — | | | | — | | | | | 152 | | | | 259 | |
CITY NATIONAL ROCHDALE FUNDS | PAGE 143
notes to financial statements/
consolidated notes to financial statements |
March 31, 2019 (Unaudited) |
The Funds, except for the Government Money Market Fund, have an unsecured Loan Agreement (“LOC”) with U.S. Bank N.A. Under the terms of the LOC, borrowings for an individual Fund were limited to either the lesser of 10% of the Fund’s net assets or an explicit amount on the LOC. Interest is charged to a Fund based on its borrowings at prime rate minus 0.50%. For the period ended March 31, 2019, there was no borrowing activity.
On August 17, 2018, the SEC adopted amendments to Regulation S-X. These changes are effective for periods after November 5, 2018. The updates to Registered Investment Companies were mainly focused on simplifying the presentation of distributable earnings by eliminating the need to present the components of distributable earnings on a book basis in the Statements of Assets and Liabilities. The update also impacted the presentation of undistributed net investment income and distribution to shareholders on the Statements of Changes in Net Assets. The amounts presented in the current Statements of Changes in Net Assets represent the aggregated total distributions of net investment income and realized capital gains, except for distributions classified as return of capital which are still presented separately. The disaggregated amounts from the prior fiscal year are broken out below if there were both distributions from net investment income and realized capital gains. Otherwise, the amount on the current Statement of Changes for the prior fiscal year end represents distributions of net investment income:
Fund | | Net Investment
Income
(000) | | | Net Realized
Gains
(000) | | | Total
(000) | |
Government Bond Fund | | $ | 995 | | | $ | 60 | | | $ | 1,055 | |
Dividend & Income Fund | | | 7,003 | | | | 7,390 | | | | 14,393 | |
U.S. Core Equity Fund | | | 1,875 | | | | 3,547 | | | | 5,422 | |
12. | NEW ACCOUNTING PRONOUNCEMENTS |
In August 2018, the FASB issued Accounting Standards Update 2018-13, Fair Value Measurement (Topic 820). The new guidance includes additions and modifications to disclosures requirements for fair value measurements. For public entities, the amendments are effective for financial statements issued for fiscal years beginning after December 15, 2019, and interim periods within those fiscal years. At this time, management is currently evaluating the impact of this new guidance on the financial statements and disclosures.
The Trust has evaluated the need for additional disclosures and/or adjustments resulting from subsequent events. Based on this evaluation, no adjustments were required to the financial statements as of March 31, 2019, and no issues were noted to disclose.
CITY NATIONAL ROCHDALE FUNDS | PAGE 144
disclosure of fund expenses(Unaudited) |
|
All mutual funds have operating expenses. As a shareholder of a Fund, your investment is affected by these ongoing costs, which include (among others) costs for portfolio management, administrative services, class-specific distribution fees, acquired fund fees and shareholder reports like this one. It is important for you to understand the impact of these costs on your investment returns.
Operating expenses such as these are deducted from a Fund’s gross income and directly reduce your final investment return. These expenses are expressed as a percentage of the Fund’s average net assets; this percentage is known as the Fund’s expense ratio.
The following examples use the expense ratio and are intended to help you understand the ongoing costs (in dollars) of investing in a Fund and to compare these costs with those of other mutual funds. The examples are based on an investment of $1,000 made at the beginning of the period shown and held for the entire period (October 1, 2018 to March 31, 2019).
The table below illustrates each Fund’s costs in two ways:
Actual Fund Return. This section helps you to estimate the actual expenses that each Fund incurred over the period. The “Expenses Paid During Period” column shows the actual dollar expense cost incurred by a $1,000 investment in each Fund, and the “Ending Account Value” number is derived from deducting that expense cost from each Fund’s gross investment return.
You can use this information, together with the actual amount you invested in a Fund, to estimate the expenses you paid over that period. Simply divide your actual account value by $1,000 to arrive at a ratio (for example, an $8,600 account value divided by $1,000 = 8.6), then multiply that ratio by the number shown for the Fund under “Expenses Paid During Period.”
Hypothetical 5% Return. This section helps you compare each Fund’s costs with those of other mutual funds. It assumes that each Fund had an annual 5% return before expenses during the year, but that the expense ratio (Column 3) for the period is unchanged. This example is useful in making comparisons because the Securities and Exchange Commission requires all mutual funds to make this 5% calculation. You can assess each Fund’s comparative cost by comparing the hypothetical result for each Fund in the “Expenses Paid During Period” column with those that appear in the same charts in the shareholder reports for other funds.
NOTE: Because the return is set at 5% for comparison purposes – NOT each Fund’s actual return – the account values shown do not apply to your specific investment.
CITY NATIONAL ROCHDALE FUNDS | PAGE 145
disclosure of fund expenses(Unaudited) (Continued) |
|
| | | Beginning
Account
Value
10/01/2018 | | | Ending
Account
Value
3/31/2019 | | | Annualized
Expense
Ratios | | | Expense
Paid During
Period* | |
City National Rochdale Government Money Market Fund |
Actual Fund Return | | | | | | | | | | | | | | | | |
Class N | | $ | 1,000.00 | | | $ | 1,007.90 | | | | 0.75 | % | | $ | 3.75 | |
Class S | | | 1,000.00 | | | | 1,007.20 | | | | 0.91 | % | | | 4.53 | |
Servicing Class | | | 1,000.00 | | | | 1,009.50 | | | | 0.46 | % | | | 2.30 | |
| | | | | | | | | | | | | | | | | |
Hypothetical 5% Return | | | | | | | | | | | | | | | | |
Class N | | $ | 1,000.00 | | | $ | 1,021.19 | | | | 0.75 | % | | $ | 3.78 | |
Class S | | | 1,000.00 | | | | 1,021.19 | | | | 0.91 | % | | | 4.57 | |
Servicing Class | | | 1,000.00 | | | | 1,022.64 | | | | 0.46 | % | | | 2.32 | |
| | | | | | | | | | | | | | | | | |
City National Rochdale Government Bond Fund |
Actual Fund Return | | | | | | | | | | | | | | | | |
Institutional Class | | $ | 1,000.00 | | | $ | 1,029.30 | | | | 0.04 | %(1) | | $ | 0.20 | |
Class N | | | 1,000.00 | | | | 1,022.10 | | | | 1.03 | % | | | 5.19 | |
Servicing Class | | | 1,000.00 | | | | 1,022.40 | | | | 0.78 | % | | | 3.93 | |
| | | | | | | | | | | | | | | | | |
Hypothetical 5% Return | | | | | | | | | | | | | | | | |
Institutional Class | | $ | 1,000.00 | | | $ | 1,024.73 | | | | 0.04 | %(1) | | $ | 0.20 | |
Class N | | | 1,000.00 | | | | 1,019.80 | | | | 1.03 | % | | | 5.19 | |
Servicing Class | | | 1,000.00 | | | | 1,021.04 | | | | 0.78 | % | | | 3.93 | |
| | | | | | | | | | | | | | | | | |
City National Rochdale Corporate Bond Fund |
Actual Fund Return | | | | | | | | | | | | | | | | |
Class N | | $ | 1,000.00 | | | $ | 1,026.40 | | | | 1.01 | % | | $ | 5.10 | |
Servicing Class | | | 1,000.00 | | | | 1,026.70 | | | | 0.76 | % | | | 3.84 | |
| | | | | | | | | | | | | | | | | |
Hypothetical 5% Return | | | | | | | | | | | | | | | | |
Class N | | $ | 1,000.00 | | | $ | 1,019.90 | | | | 1.01 | % | | $ | 5.09 | |
Servicing Class | | | 1,000.00 | | | | 1,021.14 | | | | 0.76 | % | | | 3.83 | |
| |
City National Rochdale California Tax Exempt Bond Fund |
Actual Fund Return | | | | | | | | | | | | | | | | |
Class N | | $ | 1,000.00 | | | $ | 1,003.70 | | | | 0.88 | % | | $ | 4.46 | |
Servicing Class | | | 1,000.00 | | | | 1,031.20 | | | | 0.63 | % | | | 3.19 | |
| | | | | | | | | | | | | | | | | |
Hypothetical 5% Return | | | | | | | | | | | | | | | | |
Class N | | $ | 1,000.00 | | | $ | 1,020.54 | | | | 0.88 | % | | $ | 4.43 | |
Servicing Class | | | 1,000.00 | | | | 1,021.79 | | | | 0.63 | % | | | 3.18 | |
| | | | | | | | | | | | | | | | | |
City National Rochdale Municipal High Income Fund |
Actual Fund Return | | | | | | | | | | | | | | | | |
Class N | | $ | 1,000.00 | | | $ | 1,029.50 | | | | 1.08 | % | | $ | 5.46 | |
Servicing Class | | | 1,000.00 | | | | 1,031.70 | | | | 0.83 | % | | | 4.20 | |
| | | | | | | | | | | | | | | | | |
Hypothetical 5% Return | | | | | | | | | | | | | | | | |
Class N | | $ | 1,000.00 | | | $ | 1,019.50 | | | | 1.08 | % | | $ | 5.44 | |
Servicing Class | | | 1,000.00 | | | | 1,020.80 | | | | 0.83 | % | | | 4.18 | |
| |
City National Rochdale High Yield Bond Fund |
Actual Fund Return | | | | | | | | | | | | | | | | |
Institutional Class | | $ | 1,000.00 | | | $ | 1,025.80 | | | | 1.10 | % | | $ | 5.56 | |
Class N | | | 1,000.00 | | | | 1,023.30 | | | | 1.60 | % | | | 8.07 | |
Servicing Class | | | 1,000.00 | | | | 1,023.30 | | | | 1.35 | % | | | 6.81 | |
| | | | | | | | | | | | | | | | | |
Hypothetical 5% Return | | | | | | | | | | | | | | | | |
Institutional Class | | $ | 1,000.00 | | | $ | 1,019.40 | | | | 1.10 | % | | $ | 5.54 | |
Class N | | | 1,000.00 | | | | 1,017.00 | | | | 1.60 | % | | | 8.05 | |
Servicing Class | | | 1,000.00 | | | | 1,018.20 | | | | 1.35 | % | | | 6.79 | |
| | | | | | | | | | | | | | | | | |
City National Rochdale Intermediate Fixed Income Fund |
Actual Fund Return | | | | | | | | | | | | | | | | |
Institutional Class | | $ | 1,000.00 | | | $ | 1,034.80 | | | | 0.51 | % | | $ | 5.12 | |
Class N | | | 1,000.00 | | | | 1,032.30 | | | | 1.01 | % | | | 2.58 | |
| | | | | | | | | | | | | | | | | |
Hypothetical 5% Return | | | | | | | | | | | | | | | | |
Institutional Class | | $ | 1,000.00 | | | $ | 1,019.90 | | | | 0.51 | % | | $ | 5.09 | |
Class N | | | 1,000.00 | | | | 1,022.39 | | | | 1.01 | % | | | 2.57 | |
| | | | | | | | | | | | | | | | | |
City National Rochdale Fixed Income Opportunities Fund |
Actual Fund Return | | | | | | | | | | | | | | | | |
Class N | | $ | 1,000.00 | | | $ | 1,016.90 | | | | 1.09 | % | | $ | 5.48 | |
| | | | | | | | | | | | | | | | | |
Hypothetical 5% Return | | | | | | | | | | | | | | | | |
Class N | | $ | 1,000.00 | | | $ | 1,019.50 | | | | 1.09 | % | | $ | 5.49 | |
* | Expenses are equal to the Fund’s annualized expense ratio multiplied by the average account value over the period, multiplied by 182/365 (to reflect the one-half year period). |
(1) | Ratio reflects the impact of the low level of average net assets. Under normal asset levels, the ratio would have been 0.53%. |
CITY NATIONAL ROCHDALE FUNDS | PAGE 146
| | | Beginning
Account
Value
10/01/2018 | | | Ending
Account
Value
3/31/2019 | | | Annualized
Expense
Ratios | | | Expense
Paid During
Period* | |
City National Rochdale Dividend & Income Fund |
Actual Fund Return | | | | | | | | | | | | | | | | |
Class N | | $ | 1,000.00 | | | $ | 1,035.30 | | | | 1.15 | % | | $ | 5.84 | |
| | | | | | | | | | | | | | | | | |
Hypothetical 5% Return | | | | | | | | | | | | | | | | |
Class N | | $ | 1,000.00 | | | $ | 1,019.20 | | | | 1.15 | % | | $ | 5.79 | |
| | | | | | | | | | | | | | | | | |
City National Rochdale U.S. Core Equity Fund |
Actual Fund Return | | | | | | | | | | | | | | | | |
Institutional Class | | $ | 1,000.00 | | | $ | 1,011.40 | | | | 0.54 | % | | $ | 2.71 | |
Class N | | | 1,000.00 | | | | 1,009.10 | | | | 1.03 | % | | | 5.16 | |
Servicing Class | | | 1,000.00 | | | | 1,010.30 | | | | 0.78 | % | | | 3.91 | |
| | | | | | | | | | | | | | | | | |
Hypothetical 5% Return | | | | | | | | | | | | | | | | |
Institutional Class | | $ | 1,000.00 | | | $ | 1,022.20 | | | | 0.54 | % | | $ | 2.72 | |
Class N | | | 1,000.00 | | | | 1,019.80 | | | | 1.03 | % | | | 5.19 | |
Servicing Class | | | 1,000.00 | | | | 1,021.00 | | | | 0.78 | % | | | 3.93 | |
* | Expenses are equal to the Fund’s annualized expense ratio multiplied by the average account value over the period, multiplied by 182/365 (to reflect the one-half year period). |
CITY NATIONAL ROCHDALE FUNDS | PAGE 147
board approval of advisory and sub-advisory agreements(Unaudited) |
|
The Board of Trustees of City National Rochdale Funds (the “Trust”) is comprised of six Trustees, five of whom are Independent Trustees (i.e., not “interested persons” of the Trust as defined in the Investment Company Act of 1940, as amended (the “1940 Act”)). During the six months ended March 31, 2019, the Board and the Independent Trustees approved the new advisory agreement (the “New Advisory Agreement”) between City National Rochdale, LLC (the “Adviser”) and the Trust, and the new sub-advisory agreement (the “New Sub-Advisory Agreement”) between the Adviser and GML Capital LLP (the “Sub-Adviser”) with respect to the City National Rochdale Short Term Emerging Markets Debt Fund series of the Trust (the “Fund”), each for an initial two-year term. The New Advisory Agreement and the New Sub-Advisory Agreement are collectively referred to below as the “New Agreements.”
General Information
The following information summarizes the Board’s considerations associated with its review of the New Agreements. In connection with their deliberations, the Board considered such information and factors as they believed, in light of the legal advice furnished to them and their own business judgment, to be relevant. As described below, the Board considered the nature, quality and extent of the various investment advisory and administrative services to be performed by the Adviser and the Sub-Adviser. In considering these matters, the Independent Trustees discussed the approval of the New Agreements with management and in private sessions with their independent counsel at which no representatives of the Adviser or the Sub-Adviser were present.
The Board reviewed extensive materials regarding the investment performance of a portfolio of the City National Rochdale Fixed Income Opportunities Fund (the “Fixed Income Opportunities Fund”) managed by the Sub-Adviser using investment strategies similar to those it would use to manage the Fund; the proposed fees and expenses of the Fund; financial information with respect to the Adviser and the Sub-Adviser; descriptions of various functions such as compliance monitoring and portfolio trading practices; and information about the personnel who would be providing investment management and administrative services to the Fund. The Board noted that it had previously reviewed each of the Adviser’s and the Sub-Adviser’s investment philosophy and processes as well as its brokerage and trading practices, its disaster recovery and contingency planning, and its commitment and systems in place with regard to compliance with applicable laws and regulations in connection with the Board’s August 2018 renewal of the investment advisory agreement with respect to the other series of the Trust, and the Sub-Adviser’s sub-advisory agreement with respect to the Fixed Income Opportunities Fund, as applicable. The Board also received a memorandum from legal counsel to the Independent Trustees discussing the legal standards under the 1940 Act and other applicable law for their consideration of the proposed approval of the New Agreements. In addition, the Board took into account information they received at past meetings of the Board and its committees with respect to these matters.
In deciding to approve the New Agreements, the Board and the Independent Trustees did not identify a single factor as controlling and this summary does not describe all of the matters considered. In addition, each Board member did not necessarily attribute the same weight to each matter. However, the Board and the Independent Trustees concluded that each of the various factors referred to below favored such approval.
CITY NATIONAL ROCHDALE, LLC
Nature, Extent and Quality of Services
In reviewing the services proposed to be provided by the Adviser to the Fund, the Board considered a variety of matters, including the background, education and experience of the Adviser’s key portfolio management and operational personnel; its overall financial strength and stability; its resources and related efforts to retain, attract and motivate capable personnel to serve the Fund; and the overall general quality and depth of its organization. The Board also reviewed the Adviser’s investment philosophy and processes as well as its brokerage and trading practices, its disaster recovery and contingency planning, and its commitment and systems in place with regard to compliance with applicable laws and regulations. The Trustees also considered their familiarity with the Adviser as the adviser to the other series of the Trust, as well as the information that the Adviser had provided to the Board in connection with the Board’s August 2018 renewal of the Adviser’s advisory agreement with respect to the other series of the Trust.
The Board also considered the services to be provided by the Adviser and the Sub-Adviser to the Fund. In doing so, the Board considered the respective roles of the Adviser and the Sub-Adviser, noting that the Adviser would provide overall supervision of the general investment management and investment operations of the Fund and oversee the Sub-Adviser with respect to the Fund’s operations, including monitoring the investment and trading activities of the Sub-Adviser, monitoring the Fund’s compliance with its investment policies, and providing general administrative services related to the Adviser’s overall supervision of the Fund; and that the Sub-Adviser’s responsibilities would include day-to-day portfolio management of the Fund.
CITY NATIONAL ROCHDALE FUNDS | PAGE 148
The Board concluded that based on the various factors they had reviewed, the Adviser would have the capabilities, resources, and personnel necessary to manage the Fund, and that the Adviser would provide the Fund with a reasonable potential for good investment results.
Advisory Fees and Fund Expenses
The Board reviewed information included in the meeting materials regarding the Fund’s proposed advisory fee and estimated total expenses. The Board observed that, assuming total net assets of $100 million or $200 million, the Fund’s proposed advisory fee (gross of fee waivers) and the estimated total expenses (net of fee waivers) were lower than the averages of a peer group of funds selected by SEI Investments Global Funds Services from the Lipper Emerging Markets Hard Currency Debt Funds universe (the “Lipper Universe”), as well as the averages of funds in the Lipper Universe. The Board also noted that the proposed advisory fee for the Fund was the same as the advisory fee for the Fixed Income Opportunities Fund.
The Trustees considered the processes the Adviser utilizes to select sub-advisers such as the Sub-Adviser and proactively oversee sub-advisers with respect to various investment, valuation and other compliance matters, and noted that the Adviser will be responsible for approving the pool of debt instruments that will make up the Fund’s portfolio. The Trustees also considered that any net advisory fee retained by the Adviser with respect to the Fund, after the payment of the Sub-Adviser’s sub-advisory fee, that is attributable to shareholders investing in the Fund through qualified retirement accounts managed by the Adviser would be rebated to those shareholders.
The Board and the Independent Trustees concluded that the proposed compensation to the Adviser under the New Advisory Agreement would be fair and reasonable in light of the nature and quality of the services proposed to be provided by the Adviser to the Fund.
Profitability, Benefits to the Adviser and Economies of Scale
The Trustees next considered information regarding the estimated profitability of the Adviser’s overall relationship with the Fund. The Trustees recognized the competitiveness of the mutual fund industry and the importance of an investment adviser’s long-term profitability, including for maintaining management stability and accountability. Recognizing the difficulty in evaluating an investment adviser’s profitability with respect to the funds it manages in the context of an adviser with multiple lines of business, and noting that other profitability methodologies might also be reasonable, the Trustees concluded that the expected profits of the Adviser from its relationship with the Fund were reasonable.
The Board also considered the potential benefits to be received by the Adviser and its affiliates as a result of their relationships with the Fund generally, including as applicable, investment advisory fees paid to the Adviser, fees paid to the Adviser and City National Bank for providing certain non-distribution shareholder services to the Fund, benefits to City National Bank’s brokerage and wealth management business as a result of the availability of the Fund to its customers, and the intangible benefits of the Adviser’s association with the Fund generally and any favorable publicity arising in connection with the Fund’s performance. The Trustees also noted that significant economies of scale were not likely to be realized by the Adviser at the asset levels anticipated during the first several years of the Fund’s operations.
Conclusion
Based on their review, including their consideration of each of the factors referred to above, the Board and the Independent Trustees concluded that approval of the New Advisory Agreement was in the best interests of the Fund and its shareholders and, accordingly, approved the New Advisory Agreement with respect to the Fund.
GML CAPITAL LLP
Nature, Extent and Quality of Services
In reviewing the services proposed to be provided by the Sub-Adviser to the Fund, the Board considered a variety of matters, including the background, education and experience of the Sub-Adviser’s key portfolio management and operational personnel; its overall financial strength and stability; its resources and related efforts to retain, attract and motivate capable personnel to serve the Fund; and the overall general quality and depth of its organization. The Board also reviewed the Sub-Adviser’s investment philosophy and processes as well as its brokerage and trading practices, its disaster recovery and contingency planning, and its commitment and systems in place with regard to compliance with applicable laws and regulations. The Trustees also considered their familiarity with the Sub-Adviser as sub-adviser to two portfolios of the Fixed Income Opportunities Fund, as well as the information that the Sub-Adviser had provided to the Board in connection with the Board’s August 2018 renewal of the Sub-Adviser’s sub-advisory agreement with respect to the Fixed Income Opportunities Fund.
CITY NATIONAL ROCHDALE FUNDS | PAGE 149
board approval of advisory and sub-advisory agreements(Unaudited) (Continued) |
|
The Trustees reviewed information regarding the performance of a portfolio of the Fixed Income Opportunities Fund managed by the Sub-Adviser using similar strategies to those it would use to manage the Fund. The Trustees observed that the performance of the Fixed Income Opportunities Fund portfolio for the period since the commencement of the portfolio (which was less than one year) was below that of its benchmark, the ICE Bank of America 0-1 Year Emerging Markets Corporate Plus Index, but noted that neither the portfolio nor the proposed Fund is designed to replicate the performance of that index, and that the portfolio had been operating for a relatively short period, and that performance over a longer period would be more meaningful.
The Board concluded that based on the various factors they had reviewed, the Sub-Adviser would have the capabilities, resources, and personnel necessary to manage the Fund, and that the Sub-Adviser would provide the Fund with a reasonable potential for good investment results.
Sub-Advisory Fee and Benefits to Sub-Adviser
The Board reviewed information included in the meeting materials regarding the proposed sub-advisory fee charged by the Sub-Adviser with respect to the Fund. The Board observed that the proposed sub-advisory fee rate was between the sub-advisory fee rates paid to the Sub-Adviser with respect to the two portfolios of the Fixed Income Opportunities Fund that the Sub-Adviser currently manages. The Board also noted that the proposed sub-advisory fee was lower than the fee that the Sub-Adviser receives to manage an open-end Jersey fund using an emerging market high yield and special situations credit strategy.
The Board also considered the potential benefits to be received by the Sub-Adviser as a result of its relationship with the Fund, other than the receipt of its sub-advisory fee, including any research provided to it by broker-dealers providing execution services to the Fund, and the intangible benefits of its association with the Fund generally and any favorable publicity arising in connection with the Fund’s performance.
Conclusion
Based on their review, including their consideration of each of the factors referred to above, the Board and the Independent Trustees concluded that approval of the New Sub-Advisory Agreement was in the best interests of the Fund and its shareholders and, accordingly, approved the New Sub-Advisory Agreement with respect to the Fund.
CITY NATIONAL ROCHDALE FUNDS | PAGE 150
This page intentionally left blank.
CITY NATIONAL ROCHDALE FUNDS | PAGE 151
This page intentionally left blank.
CITY NATIONAL ROCHDALE FUNDS | PAGE 152

Item 2. Code of Ethics.
Not applicable for semi-annual report.
Item 3. Audit Committee Financial Expert.
Not applicable for semi-annual report.
Item 4. Principal Accountant Fees and Services.
Not applicable for semi-annual report.
Item 5. Audit Committee of Listed Registrants.
Not applicable to open-end management investment companies.
Item 6. Schedule of Investments
Not applicable.
Item 7. Disclosure of Proxy Voting Policies and Procedures for Closed-End Management Investment Companies.
Not applicable to open-end management investment companies.
Item 8. Portfolio Managers of Closed-End Management Investment Companies
Not applicable to open-end management investment companies.
Item 9. Purchases of Equity Securities by Closed-End Management Company and Affiliated Purchasers.
Not applicable to open-end management investment companies.
Item 10. Submission of Matters to a Vote of Security Holders.
None.
Item 11. Controls and Procedures.
(a) The certifying officers, whose certifications are included herewith, have evaluated the registrant’s disclosure controls and procedures within 90 days of the filing date of this report. In their opinion, based on their evaluation, the registrant’s disclosure controls and procedures are adequately designed, and are operating effectively to ensure, that information required to be disclosed by the registrant in the reports it files or submits under the Securities Exchange Act of 1934 is recorded, processed, summarized and reported within the time periods specified in the Securities and Exchange Commission’s rules and forms.
(b) There were no significant changes in the registrant’s internal control over financial reporting that occurred during the second fiscal quarter of the period covered by this report that has materially affected, or is reasonably likely to materially affect, the registrant’s internal control over financial reporting.
Items 12. Disclosure of Securities Lending Activities for Closed-End Management Investment Companies.
Not applicable.
Items 13. Exhibits.
(a)(1) Not applicable for semi-annual report.
(a)(2) A separate certification for the principal executive officer and the principal financial officer of the registrant as required by Rule 30a-2(a) under the Investment Company Act of 1940, as amended (17 CFR 270.30a-2(a)), are filed herewith.
(b) Officer certifications as required by Rule 30a-2(b) under the Investment Company Act of 1940, as amended (17 CFR 270.30a-2(b)) also accompany this filing as an Exhibit.
SIGNATURES
Pursuant to the requirements of the securities Exchange Act of 1934 and the Investment Company Act of 1940, the registrant has duly caused this report to be signed on its behalf by the undersigned, thereunto duly authorized.
| (Registrant) | City National Rochdale Funds | |
| | | |
| By (Signature and Title) | /s/ Garrett R. D’Alessandro | |
| | Garrett R. D’Alessandro, | |
| | President and Chief Executive Officer | |
| | | |
| Date: | June 6, 2019 | |
Pursuant to the requirements of the Securities Exchange Act of 1934 and the Investment Company Act of 1940, this report has been signed below by the following persons on behalf of the registrant and in the capacities and on the dates indicated.
| By (Signature and Title) | /s/ Garrett R. D’Alessandro | |
| | Garrett R. D’Alessandro, | |
| | President and Chief Executive Officer | |
| | | |
| Date: | June 6, 2019 | |
| | | |
| By (Signature and Title) | /s/ Eric Kleinschmidt | |
| | Eric Kleinschmidt, Treasurer | |
| | | |
| Date: | June 6, 2019 | |