EXHIBIT 99.2

Managed technology for the global legal profession
April 28, 2011
First Quarter 2011
Earnings Conference Call
Earnings Conference Call
NASDAQ: EPIQ
www.epiqsystems.com

Q1 2011 Earnings Conference Call
2
Forward Looking and Cautionary Statements
This presentation contains forward-looking statements within the meaning of Section 27A of the Securities Act of 1933, as
amended, and Section 21E of the Securities Exchange Act of 1934, as amended, and include, but are not limited to, any
projection or expectation of earnings, revenue or other financial items; the plans, strategies and objectives of management
for future operations; factors that may affect our operating results; new products or services; the demand for our products
or services; our ability to consummate acquisitions and successfully integrate them into our operations; future capital
expenditures; effects of current or future economic conditions or performance; industry trends and other matters that do not
relate strictly to historical facts or statements of assumptions underlying any of the foregoing. These forward-looking
statements are based on our current expectations which may not prove to be accurate. Forward-looking statements may
be identified by terms such as “believe,” “expect,” “anticipate,” “should,” “planned,” “may,” “estimated,” "goal," "objective,"
”seeks,” and “potential” and variations of these words and similar expressions or negatives of these words. Because
forward-looking statements involve future risks and uncertainties, listed below are a variety of factors that could cause
actual results and experience to differ materially from the anticipated results or other expectations expressed in our
forward-looking statements. These factors include (1) any material changes in our total number of client engagements and
the volume associated with each engagement, (2) any material changes in our client’s deposit portfolio or the services
required or selected by our clients in engagements, (3) material changes in the number of bankruptcy filings, class action
filings or mass tort actions each year, or changes in government legislation or court rules affecting these filings, (4) overall
strength and stability of general economic conditions, both in the United States and in the global markets, (5) significant
changes in the competitive environment, (6) risks associated with handling of confidential data and compliance with
information privacy laws, (7) changes in or the effects of pricing structures and arrangements, (8) risks associated with the
integration of acquisitions into our existing business operations, (9) risks associated with indebtedness, (10) risks
associated with foreign currency fluctuations, (11) risks associated with developing and providing software and internet-
based technology solutions to our clients, (12) risks associated with interruptions or delays in services at data centers, (13)
risks of errors or failures of software or services, (14) risks associated with our international operations, (15) risks of
litigation against us, and (16) other risks detailed from time to time in our SEC filings, including our most recent annual
report on Form 10-K, quarterly reports on Form 10-Q and current reports on Form 8-K. In addition, there may be other
factors not included in our SEC filings that may cause actual results to differ materially from any forward-looking
statements. We undertake no obligation to update publicly or revise any forward-looking statements contained herein to
reflect future events or developments, except as required by law.

Q1 2011 Earnings Conference Call
3
This presentation includes the following non-GAAP financial measures: (i) non-GAAP net income (net
income adjusted for amortization of acquisition intangibles, share-based compensation, acquisition
expense, capitalized loan fee amortization, litigation expense/settlement, non-cash embedded option
charges, and the effect of tax adjustments that are outside of the company’s anticipated effective tax
rate, all net of tax), (ii) non-GAAP earnings per share, calculated as non-GAAP net income on a fully
diluted per share basis, and (iii) non-GAAP adjusted EBITDA (net income adjusted for depreciation,
amortization, share-based compensation, acquisition expense, net expenses related to financing,
litigation expense/settlement, and provision for income taxes). Income taxes represent a complex
element of a company’s income statement and effective tax rates can vary widely between different
periods. Epiq Systems uses a statutory tax rate of 40% to reflect income tax adjustments in
presentation of its non-GAAP net income and non-GAAP earnings per share. Utilization of a statutory
tax rate for presentation of the non-GAAP measures is done to allow a consistent basis for investors
to understand financial performance across historical periods and to allow a comparison with other
companies, many of whom use similar non-GAAP financial measures to supplement their GAAP
results.
Although Epiq Systems reports its results using GAAP, Epiq Systems also uses non-GAAP financial
measures when management believes those measures provide useful information for its
stockholders. These non-GAAP financial measures are intended to supplement the GAAP financial
information by providing additional insight regarding results of operations. These non-GAAP financial
measures are reconciled in the accompanying tables to the most directly comparable measures as
reported in accordance with GAAP, and should be viewed in addition to, and not in lieu of, such
comparable financial measures.
Use of non-GAAP Measures

Q1 2011 Earnings Conference Call
4
 Epiq acquired Encore Discovery Solutions on April 4, 2011, for $100.0 million cash.
Based in Phoenix, Arizona, Encore Discovery Solutions provides market-proven products
and services for electronic evidence processing, document review platforms, and
professional services for project management, data collection and forensic consulting.
On January 17, 2011, the Board of Directors declared a cash dividend of 3.5 cents pershare of outstanding common stock which was paid on February 17, 2011. On February 23,
2011, the Board of Directors declared a cash dividend of 3.5 cents per share of outstanding
common stock which will be paid on May 19, 2011 to stockholders of record at the close of
business on April 28, 2011.
On April 25, 2011, Epiq’s senior credit facility was amended and extended throughDecember 31, 2015, increasing the amount of funds available under the credit facility from
$140.0 million to $325.0 million with an accordion feature to increase to $375.0 million to
facilitate future business expansion.
As reported by the Administrative Office of the U.S. Courts, bankruptcy filings totaled1,593,081 for the 12 month period ended December 31, 2010, up 8% versus the same period in
2009. Chapter 11 bankruptcy filings fell 10% for the 12 month period ended December 31,
2010 versus the same period in 2009, while Chapter 7 and 13 filings each increased 8%.
Key Events

Q1 2011 Earnings Conference Call
5
(In thousands, except per share data) | Q1 2011 | Q1 2010 | ||
Operating Revenue Before Reimbursed Direct Costs | $54,213 | $49,111 | ||
Net Income | $3,082 | $2,335 | ||
Net Cash Provided by Operating Activities | $10,753 | $5,177 | ||
Non-GAAP Net Income (1) | $6,905 | $6,191 | ||
Non-GAAP Adjusted EBITDA (2) | $17,435 | $15,951 | ||
Non-GAAP Net Income Per Share - Diluted (3) | $0.19 | $0.16 |
(1) Refer to page 10 for reconciliation.
(2) Refer to page 11 for reconciliation.
(3) Refer to page 12 for calculation.
Financial Highlights

Q1 2011 Earnings Conference Call
6
(In thousands) | March 31, 2011 | December 31, 2010 |
Cash and Cash Equivalents | $4,350 | $5,439 |
Trade Receivables, Net | $57,979 | $59,940 |
Property and Equipment, Net | $41,795 | $41,258 |
Goodwill | $294,946 | $294,789 |
Other Intangibles, Net | $39,820 | $43,580 |
Indebtedness | $95,769 | $89,805 |
Stockholders’ Equity | $320,755 | $328,523 |
Selected Balance Sheet Data

Q1 2011 Earnings Conference Call
7
(In thousands) | Q1 2011 | Q1 2010 | |||
Net Income | $3,082 | $2,335 | |||
Non-cash Adjustments to Net Income | |||||
Depreciation and Amortization | $8,973 | $7,021 | |||
Other, Net | $4,254 | $1,377 | |||
Changes in Operating Assets and Liabilities, Net | ($5,556) | ($5,556) | |||
Net Cash Provided By Operating Activities | $10,753 | $5,177 |
Cash from Operating Activities
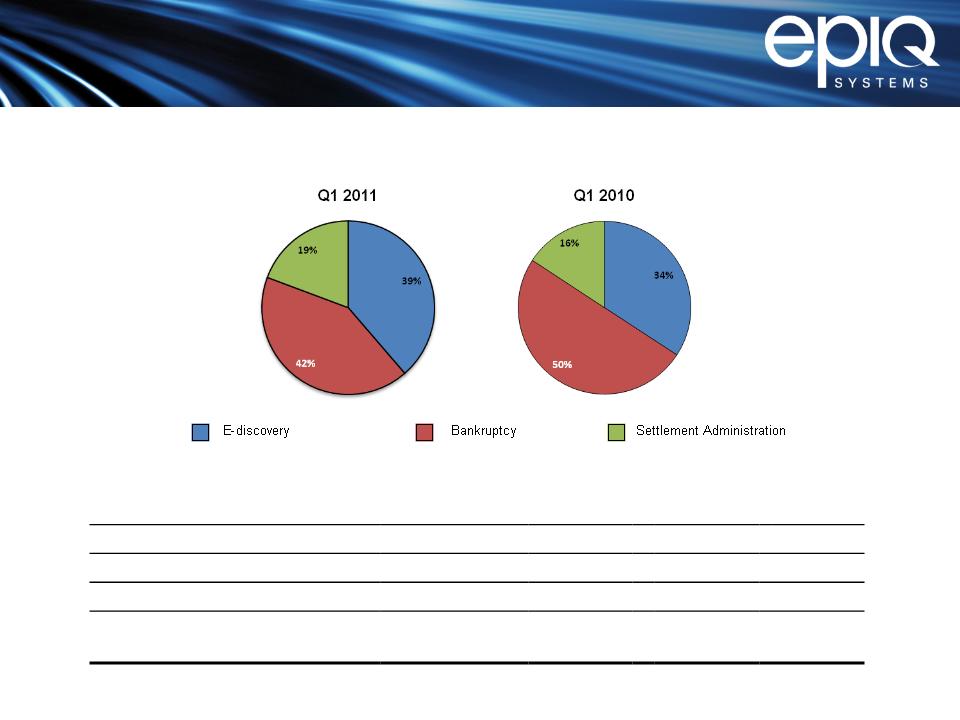
(In thousands)
Q1 2011
Q1 2010
E-discovery
$20,971
$16,796
Bankruptcy
$22,774
$24,577
Settlement Administration
$10,468
$7,738
Total Operating Revenue
Before Reimbursed Direct Costs
$54,213
$49,111
Operating Revenue Before Reimbursed Direct Costs
Q1 2011 Earnings Conference Call
8
Operating Revenue by Segment
Q1 2011 Earnings Conference Call
9
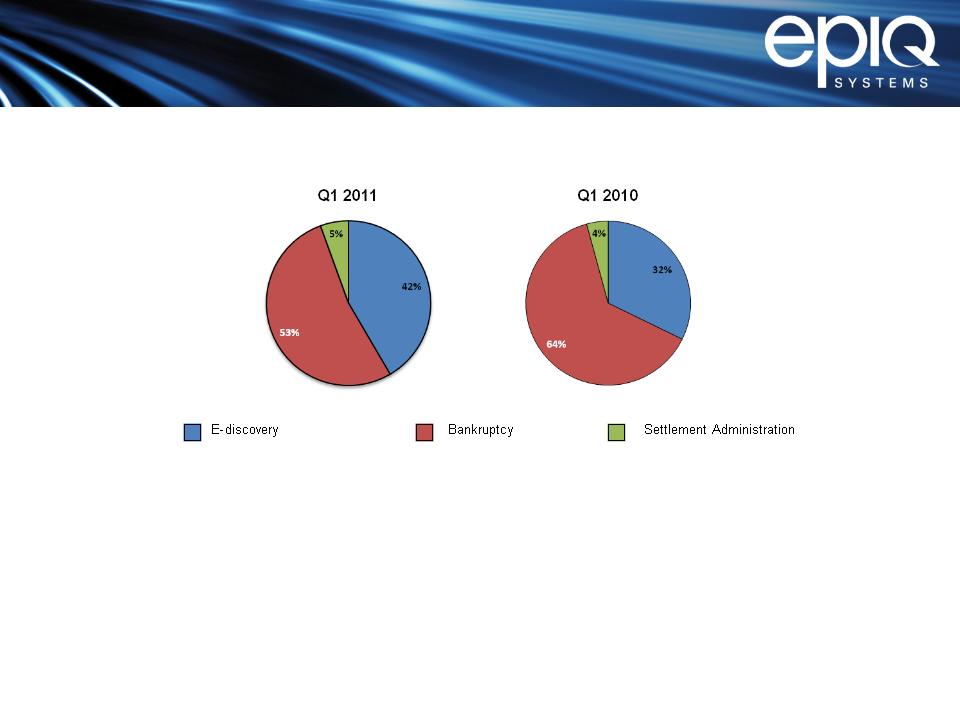
Non-GAAP Adjusted EBITDA
(In millions) | E-discovery | Bankruptcy | Settlement Administration | |||
Operating Revenue | Non-GAAP Adj EBITDA | Operating Revenue | Non-GAAP Adj EBITDA | Operating Revenue | Non-GAAP Adj EBITDA | |
Q1 2011 | $21.0 | $9.8 | $22.8 | $12.5 | $10.4 | $1.3 |
Q1 2010 | $16.8 | $6.9 | $24.6 | $13.7 | $7.7 | $0.9 |
Financial Results by Segment

Q1 2011 Earnings Conference Call
10
(In thousands, except per share data) | Q1 2011 | Q1 2010 | ||
Net Income | $3,082 | $2,335 | ||
Plus (net of tax (1)): | ||||
Amortization of Acquisition Intangibles | $2,260 | $1,101 | ||
Share-based Compensation | $1,080 | $1,129 | ||
Acquisition Expense | $290 | $27 | ||
Loan Fee Amortization | $73 | $52 | ||
Litigation Expense/Settlement | - | $953 | ||
Non-cash Embedded Option Charges | - | ($244) | ||
Effective Tax Rate Adjustment (2) | $120 | $838 | ||
Non-GAAP Net Income | $6,905 | $6,191 | ||
Non-GAAP Net Income Per Share - Diluted | $0.19 | $0.16 | ||
(1) Individual adjustments are calculated using a tax rate of 40% except for the non-qualified portion of share-based compensation. (2) The effective tax rate adjustment reflects a non-GAAP provision for income taxes at a statutory tax rate of 40%. | ||||
Non-GAAP Net Income

Q1 2011 Earnings Conference Call
11
(In thousands) | Q1 2011 | Q1 2010 | ||
Net Income | $3,082 | $2,335 | ||
Plus: | ||||
Depreciation and Amortization | $8,973 | $7,021 | ||
Share-based Compensation | $1,837 | $1,636 | ||
Acquisition Expense | $483 | $44 | ||
Expenses Related to Financing, Net | $805 | $387 | ||
Litigation Expense/Settlement | - | $1,575 | ||
Provision for Income Taxes | $2,255 | $2,953 | ||
Non-GAAP Adjusted EBITDA | $17,435 | $15,951 |
Non-GAAP Adjusted EBITDA

Q1 2011 Earnings Conference Call
12
(In thousands, except per share data) | Q1 2011 | Q1 2010 | ||
Net Income | $3,082 | $2,335 | ||
Interest expense adjustment for convertible debt | - | $298 | ||
Amounts re-allocated to nonvested shares | - | ($6) | ||
Net Income Adjusted For Diluted Calculation | $3,082 | $2,627 | ||
Non-GAAP Net Income | $6,905 | $6,191 | ||
Interest expense adjustment for convertible debt | - | $298 | ||
Amounts re-allocated to nonvested shares | - | ($6) | ||
Non-GAAP Net Income Adjusted for Diluted Calculation | $6,905 | $6,483 | ||
Basic Weighted Average Shares | 35,092 | 36,185 | ||
Adjustment to reflect share-based awards | 1,395 | 1,102 | ||
Adjustment to reflect convertible debt shares | - | 4,283 | ||
Diluted Weighted Average Shares | 36,487 | 41,570 | ||
Net Income Per Share - Diluted | $0.08 | $0.06 | ||
Non-GAAP Net Income Per Share - Diluted | $0.19 | $0.16 |
EPS Calculation

Managed technology for the global legal profession
NASDAQ: EPIQ
www.epiqsystems.com