Fourth Quarter and Fiscal Year 2015 Earnings Conference Call March 1, 2016 NASDAQ: EPIQ Exhibit 99.2
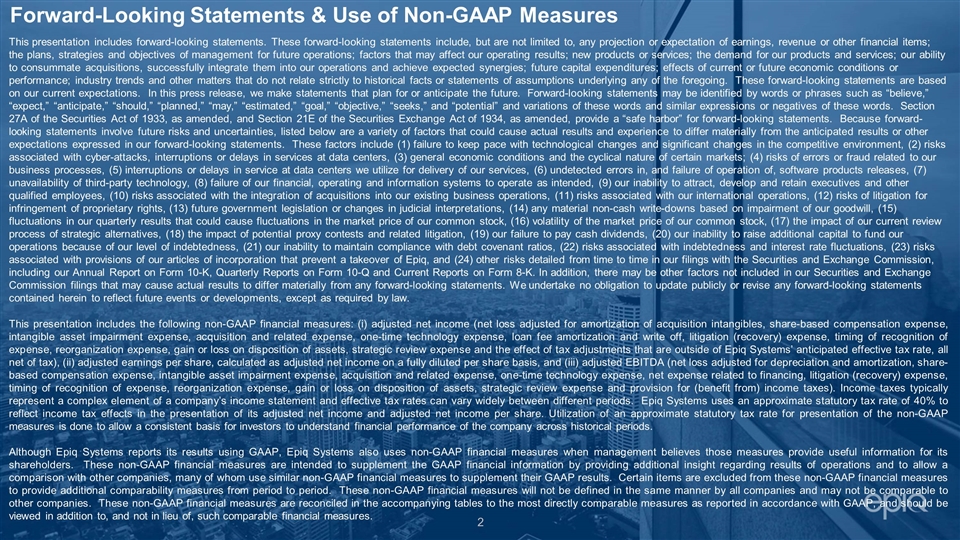
Forward-Looking Statements & Use of Non-GAAP Measures This presentation includes forward-looking statements. These forward-looking statements include, but are not limited to, any projection or expectation of earnings, revenue or other financial items; the plans, strategies and objectives of management for future operations; factors that may affect our operating results; new products or services; the demand for our products and services; our ability to consummate acquisitions, successfully integrate them into our operations and achieve expected synergies; future capital expenditures; effects of current or future economic conditions or performance; industry trends and other matters that do not relate strictly to historical facts or statements of assumptions underlying any of the foregoing. These forward-looking statements are based on our current expectations. In this press release, we make statements that plan for or anticipate the future. Forward-looking statements may be identified by words or phrases such as “believe,” “expect,” “anticipate,” “should,” “planned,” “may,” “estimated,” “goal,” “objective,” “seeks,” and “potential” and variations of these words and similar expressions or negatives of these words. Section 27A of the Securities Act of 1933, as amended, and Section 21E of the Securities Exchange Act of 1934, as amended, provide a “safe harbor” for forward-looking statements. Because forward-looking statements involve future risks and uncertainties, listed below are a variety of factors that could cause actual results and experience to differ materially from the anticipated results or other expectations expressed in our forward-looking statements. These factors include (1) failure to keep pace with technological changes and significant changes in the competitive environment, (2) risks associated with cyber-attacks, interruptions or delays in services at data centers, (3) general economic conditions and the cyclical nature of certain markets; (4) risks of errors or fraud related to our business processes, (5) interruptions or delays in service at data centers we utilize for delivery of our services, (6) undetected errors in, and failure of operation of, software products releases, (7) unavailability of third-party technology, (8) failure of our financial, operating and information systems to operate as intended, (9) our inability to attract, develop and retain executives and other qualified employees, (10) risks associated with the integration of acquisitions into our existing business operations, (11) risks associated with our international operations, (12) risks of litigation for infringement of proprietary rights, (13) future government legislation or changes in judicial interpretations, (14) any material non-cash write-downs based on impairment of our goodwill, (15) fluctuations in our quarterly results that could cause fluctuations in the market price of our common stock, (16) volatility of the market price of our common stock, (17) the impact of our current review process of strategic alternatives, (18) the impact of potential proxy contests and related litigation, (19) our failure to pay cash dividends, (20) our inability to raise additional capital to fund our operations because of our level of indebtedness, (21) our inability to maintain compliance with debt covenant ratios, (22) risks associated with indebtedness and interest rate fluctuations, (23) risks associated with provisions of our articles of incorporation that prevent a takeover of Epiq, and (24) other risks detailed from time to time in our filings with the Securities and Exchange Commission, including our Annual Report on Form 10-K, Quarterly Reports on Form 10-Q and Current Reports on Form 8-K. In addition, there may be other factors not included in our Securities and Exchange Commission filings that may cause actual results to differ materially from any forward-looking statements. We undertake no obligation to update publicly or revise any forward-looking statements contained herein to reflect future events or developments, except as required by law. This presentation includes the following non-GAAP financial measures: (i) adjusted net income (net loss adjusted for amortization of acquisition intangibles, share-based compensation expense, intangible asset impairment expense, acquisition and related expense, one-time technology expense, loan fee amortization and write off, litigation (recovery) expense, timing of recognition of expense, reorganization expense, gain or loss on disposition of assets, strategic review expense and the effect of tax adjustments that are outside of Epiq Systems’ anticipated effective tax rate, all net of tax), (ii) adjusted earnings per share, calculated as adjusted net income on a fully diluted per share basis, and (iii) adjusted EBITDA (net loss adjusted for depreciation and amortization, share-based compensation expense, intangible asset impairment expense, acquisition and related expense, one-time technology expense, net expense related to financing, litigation (recovery) expense, timing of recognition of expense, reorganization expense, gain or loss on disposition of assets, strategic review expense and provision for (benefit from) income taxes). Income taxes typically represent a complex element of a company’s income statement and effective tax rates can vary widely between different periods. Epiq Systems uses an approximate statutory tax rate of 40% to reflect income tax effects in the presentation of its adjusted net income and adjusted net income per share. Utilization of an approximate statutory tax rate for presentation of the non-GAAP measures is done to allow a consistent basis for investors to understand financial performance of the company across historical periods. Although Epiq Systems reports its results using GAAP, Epiq Systems also uses non-GAAP financial measures when management believes those measures provide useful information for its shareholders. These non-GAAP financial measures are intended to supplement the GAAP financial information by providing additional insight regarding results of operations and to allow a comparison with other companies, many of whom use similar non-GAAP financial measures to supplement their GAAP results. Certain items are excluded from these non-GAAP financial measures to provide additional comparability measures from period to period. These non-GAAP financial measures will not be defined in the same manner by all companies and may not be comparable to other companies. These non-GAAP financial measures are reconciled in the accompanying tables to the most directly comparable measures as reported in accordance with GAAP, and should be viewed in addition to, and not in lieu of, such comparable financial measures.
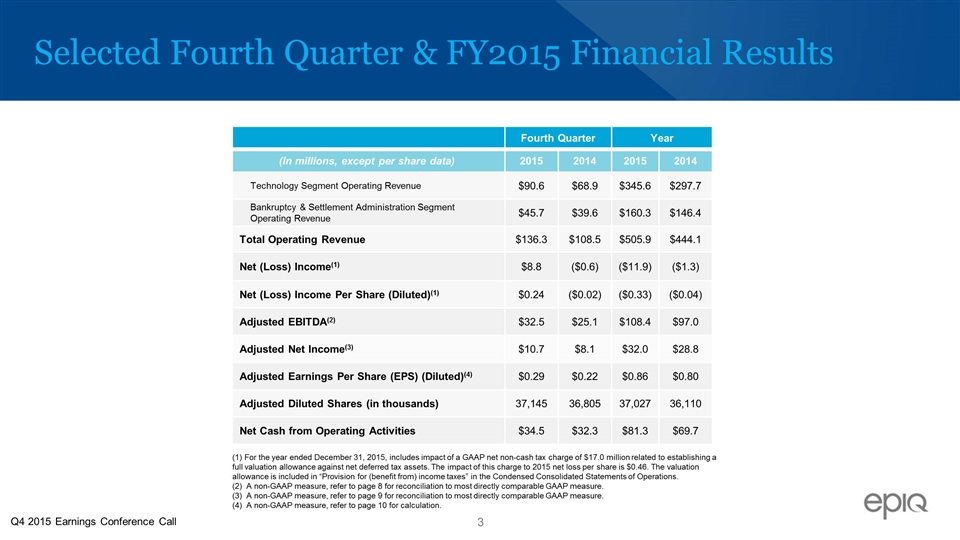
Selected Fourth Quarter & FY2015 Financial Results Fourth Quarter Year (In millions, except per share data) 2015 2014 2015 2014 Technology Segment Operating Revenue $90.6 $68.9 $345.6 $297.7 Bankruptcy & Settlement Administration Segment Operating Revenue $45.7 $39.6 $160.3 $146.4 Total Operating Revenue $136.3 $108.5 $505.9 $444.1 Net (Loss) Income(1) $8.8 ($0.6) ($11.9) ($1.3) Net (Loss) Income Per Share (Diluted)(1) $0.24 ($0.02) ($0.33) ($0.04) Adjusted EBITDA(2) $32.5 $25.1 $108.4 $97.0 Adjusted Net Income(3) $10.7 $8.1 $32.0 $28.8 Adjusted Earnings Per Share (EPS) (Diluted)(4) $0.29 $0.22 $0.86 $0.80 Adjusted Diluted Shares (in thousands) 37,145 36,805 37,027 36,110 Net Cash from Operating Activities $34.5 $32.3 $81.3 $69.7 (1) For the year ended December 31, 2015, includes impact of a GAAP net non-cash tax charge of $17.0 million related to establishing a full valuation allowance against net deferred tax assets. The impact of this charge to 2015 net loss per share is $0.46. The valuation allowance is included in “Provision for (benefit from) income taxes” in the Condensed Consolidated Statements of Operations. (2) A non-GAAP measure, refer to page 8 for reconciliation to most directly comparable GAAP measure. (3) A non-GAAP measure, refer to page 9 for reconciliation to most directly comparable GAAP measure. (4) A non-GAAP measure, refer to page 10 for calculation. Q4 2015 Earnings Conference Call
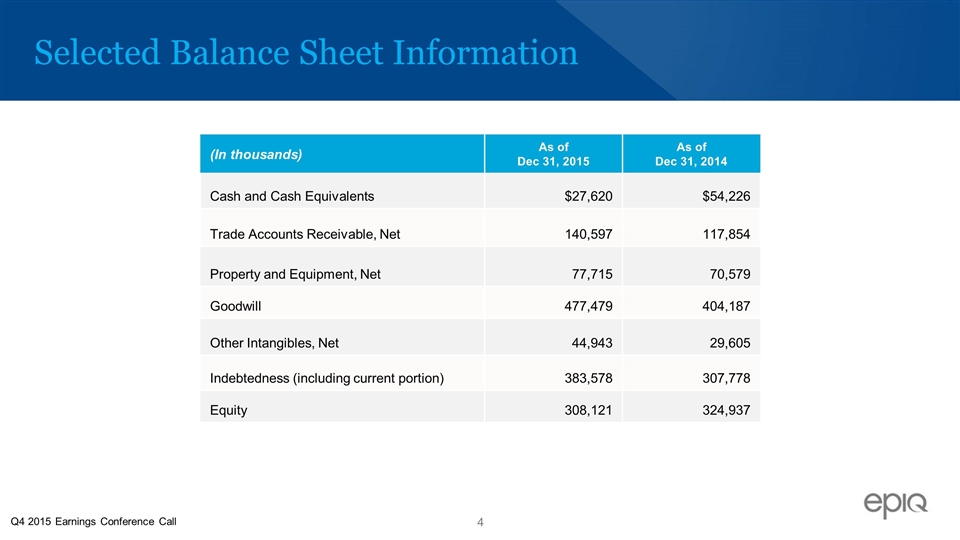
Selected Balance Sheet Information (In thousands) As of Dec 31, 2015 As of Dec 31, 2014 Cash and Cash Equivalents $27,620 $54,226 Trade Accounts Receivable, Net 140,597 117,854 Property and Equipment, Net 77,715 70,579 Goodwill 477,479 404,187 Other Intangibles, Net 44,943 29,605 Indebtedness (including current portion) 383,578 307,778 Equity 308,121 324,937 Q4 2015 Earnings Conference Call
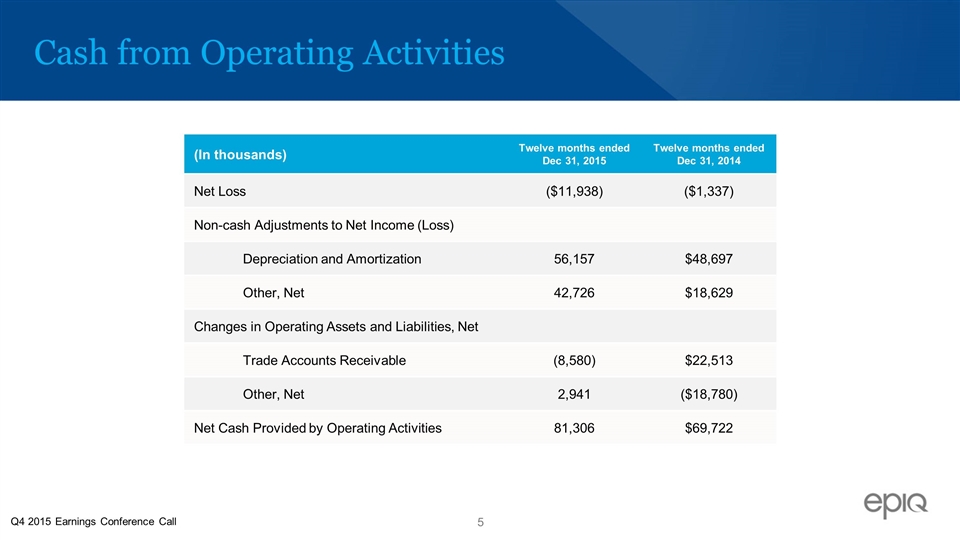
Cash from Operating Activities (In thousands) Twelve months ended Dec 31, 2015 Twelve months ended Dec 31, 2014 Net Loss ($11,938) ($1,337) Non-cash Adjustments to Net Income (Loss) Depreciation and Amortization 56,157 $48,697 Other, Net 42,726 $18,629 Changes in Operating Assets and Liabilities, Net Trade Accounts Receivable (8,580) $22,513 Other, Net 2,941 ($18,780) Net Cash Provided by Operating Activities 81,306 $69,722 Q4 2015 Earnings Conference Call
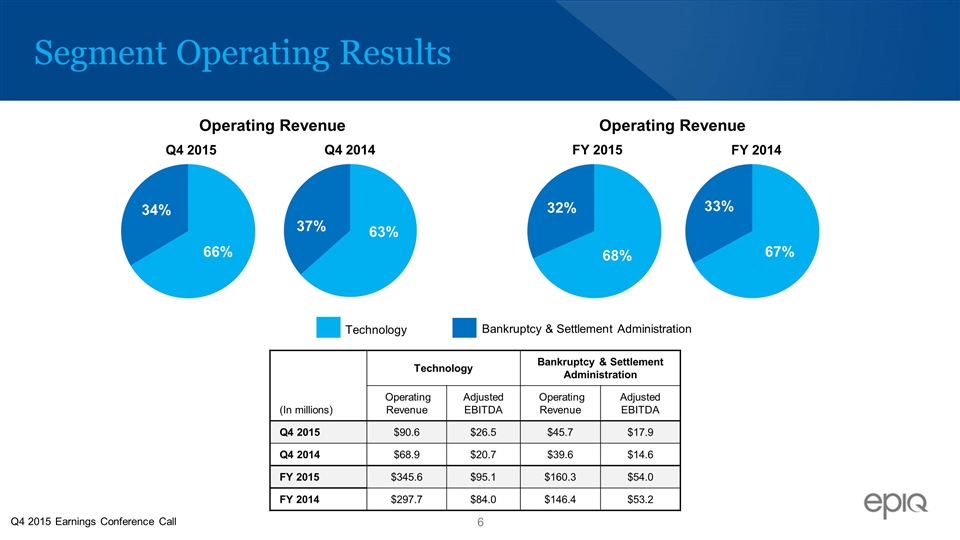
Segment Operating Results Technology Bankruptcy & Settlement Administration (In millions) Technology Bankruptcy & Settlement Administration Operating Revenue Adjusted EBITDA Operating Revenue Adjusted EBITDA Q4 2015 $90.6 $26.5 $45.7 $17.9 Q4 2014 $68.9 $20.7 $39.6 $14.6 FY 2015 $345.6 $95.1 $160.3 $54.0 FY 2014 $297.7 $84.0 $146.4 $53.2 Operating Revenue Operating Revenue Q4 2015 Earnings Conference Call
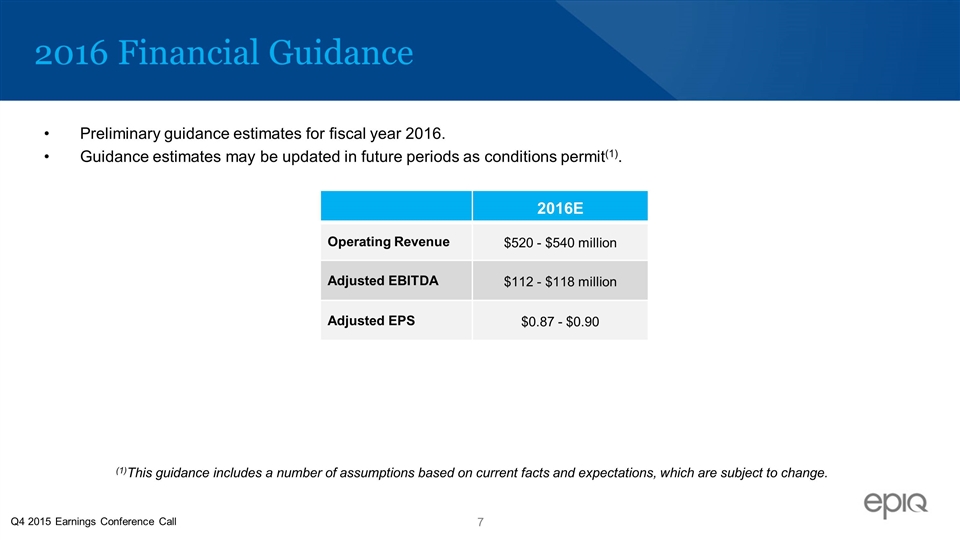
2016 Financial Guidance Preliminary guidance estimates for fiscal year 2016. Guidance estimates may be updated in future periods as conditions permit(1). 2016E Operating Revenue $520 - $540 million Adjusted EBITDA $112 - $118 million Adjusted EPS $0.87 - $0.90 Q4 2015 Earnings Conference Call (1)This guidance includes a number of assumptions based on current facts and expectations, which are subject to change.
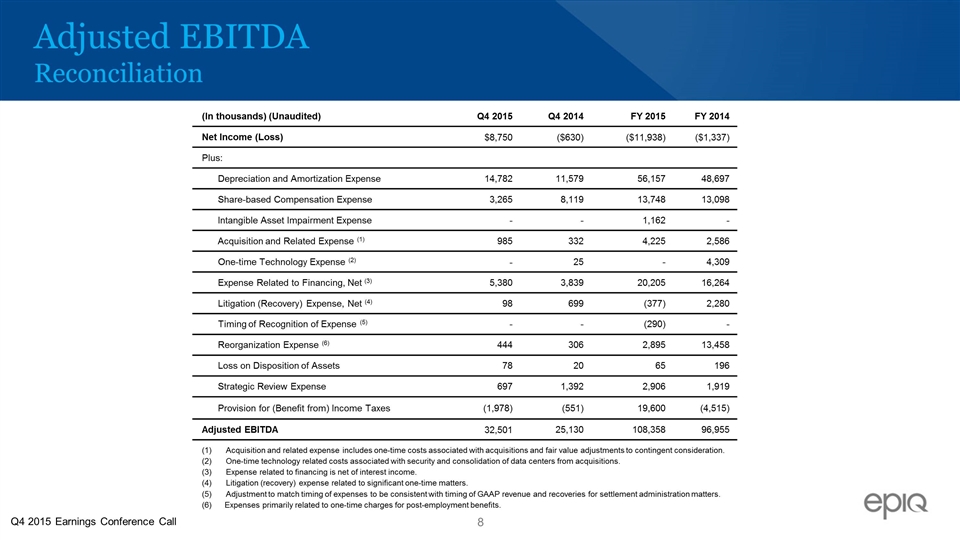
Adjusted EBITDA Reconciliation (In thousands) (Unaudited) Q4 2015 Q4 2014 FY 2015 FY 2014 Net Income (Loss) $8,750 ($630) ($11,938) ($1,337) Plus: Depreciation and Amortization Expense 14,782 11,579 56,157 48,697 Share-based Compensation Expense 3,265 8,119 13,748 13,098 Intangible Asset Impairment Expense - - 1,162 - Acquisition and Related Expense (1) 985 332 4,225 2,586 One-time Technology Expense (2) - 25 - 4,309 Expense Related to Financing, Net (3) 5,380 3,839 20,205 16,264 Litigation (Recovery) Expense, Net (4) 98 699 (377) 2,280 Timing of Recognition of Expense (5) - - (290) - Reorganization Expense (6) 444 306 2,895 13,458 Loss on Disposition of Assets 78 20 65 196 Strategic Review Expense 697 1,392 2,906 1,919 Provision for (Benefit from) Income Taxes (1,978) (551) 19,600 (4,515) Adjusted EBITDA 32,501 25,130 108,358 96,955 Acquisition and related expense includes one-time costs associated with acquisitions and fair value adjustments to contingent consideration. One-time technology related costs associated with security and consolidation of data centers from acquisitions. Expense related to financing is net of interest income. Litigation (recovery) expense related to significant one-time matters. Adjustment to match timing of expenses to be consistent with timing of GAAP revenue and recoveries for settlement administration matters. (6) Expenses primarily related to one-time charges for post-employment benefits. Q4 2015 Earnings Conference Call
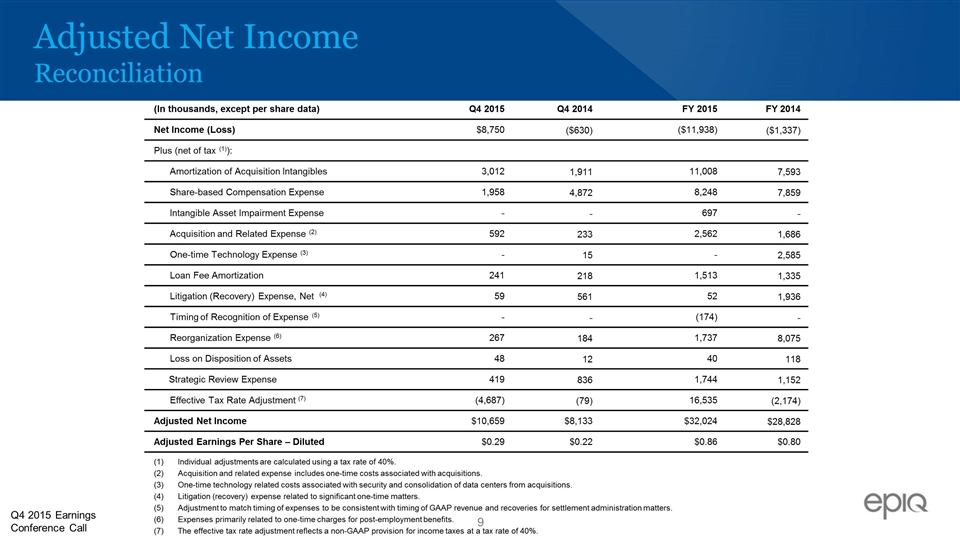
Adjusted Net Income Reconciliation (In thousands, except per share data) Q4 2015 Q4 2014 FY 2015 FY 2014 Net Income (Loss) $8,750 ($630) ($11,938) ($1,337) Plus (net of tax (1)): Amortization of Acquisition Intangibles 3,012 1,911 11,008 7,593 Share-based Compensation Expense 1,958 4,872 8,248 7,859 Intangible Asset Impairment Expense - - 697 - Acquisition and Related Expense (2) 592 233 2,562 1,686 One-time Technology Expense (3) - 15 - 2,585 Loan Fee Amortization 241 218 1,513 1,335 Litigation (Recovery) Expense, Net (4) 59 561 52 1,936 Timing of Recognition of Expense (5) - - (174) - Reorganization Expense (6) 267 184 1,737 8,075 Loss on Disposition of Assets 48 12 40 118 Strategic Review Expense 419 836 1,744 1,152 Effective Tax Rate Adjustment (7) (4,687) (79) 16,535 (2,174) Adjusted Net Income $10,659 $8,133 $32,024 $28,828 Adjusted Earnings Per Share – Diluted $0.29 $0.22 $0.86 $0.80 Individual adjustments are calculated using a tax rate of 40%. Acquisition and related expense includes one-time costs associated with acquisitions. One-time technology related costs associated with security and consolidation of data centers from acquisitions. Litigation (recovery) expense related to significant one-time matters. Adjustment to match timing of expenses to be consistent with timing of GAAP revenue and recoveries for settlement administration matters. Expenses primarily related to one-time charges for post-employment benefits. The effective tax rate adjustment reflects a non-GAAP provision for income taxes at a tax rate of 40%. Q4 2015 Earnings Conference Call
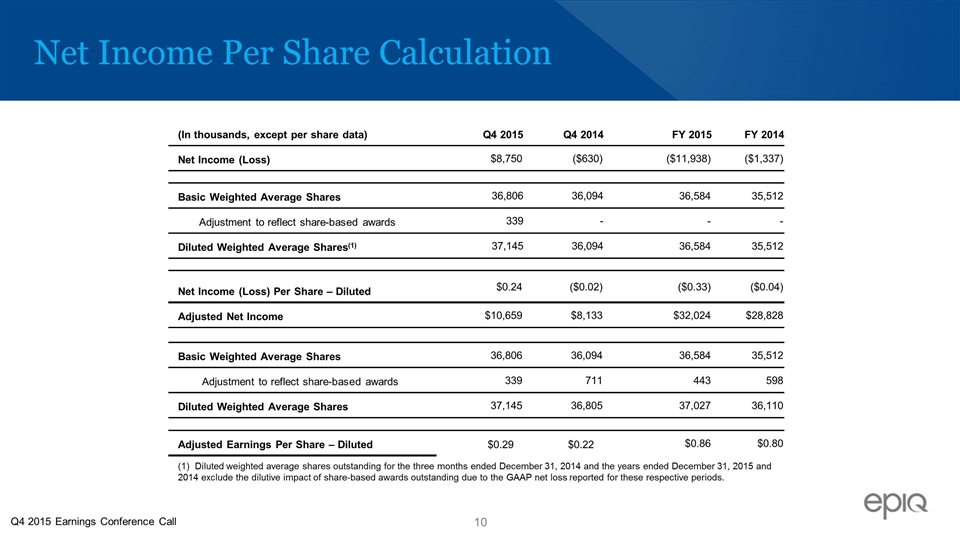
Net Income Per Share Calculation (In thousands, except per share data) Q4 2015 Q4 2014 FY 2015 FY 2014 Net Income (Loss) $8,750 ($630) ($11,938) ($1,337) Basic Weighted Average Shares 36,806 36,094 36,584 35,512 Adjustment to reflect share-based awards 339 - - - Diluted Weighted Average Shares(1) 37,145 36,094 36,584 35,512 Net Income (Loss) Per Share – Diluted $0.24 ($0.02) ($0.33) ($0.04) Adjusted Net Income $10,659 $8,133 $32,024 $28,828 Basic Weighted Average Shares 36,806 36,094 36,584 35,512 Adjustment to reflect share-based awards 339 711 443 598 Diluted Weighted Average Shares 37,145 36,805 37,027 36,110 Adjusted Earnings Per Share – Diluted $0.29 $0.22 $0.86 $0.80 (1) Diluted weighted average shares outstanding for the three months ended December 31, 2014 and the years ended December 31, 2015 and 2014 exclude the dilutive impact of share-based awards outstanding due to the GAAP net loss reported for these respective periods. Q4 2015 Earnings Conference Call
Epiq (NASDAQ: EPIQ) is a leading global provider of integrated technology and services for the legal profession, including electronic discovery, bankruptcy, and class action and mass tort administration. Our innovative solutions are designed to streamline the administration of litigation, investigations, financial transactions, regulatory compliance and other legal matters. Epiq’s subject-matter experts bring clarity to complexity, create efficiency through expertise and deliver confidence to our clients around the world.
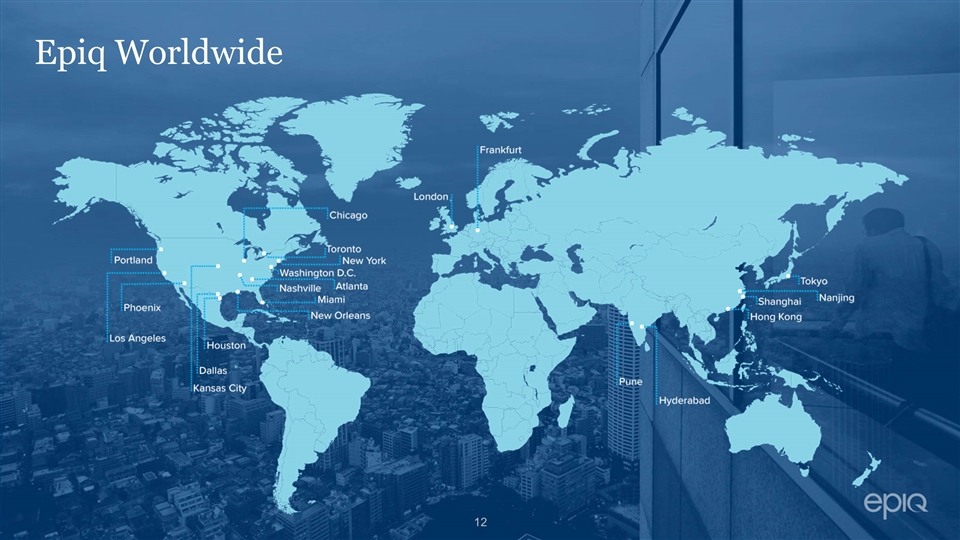
Epiq Worldwide

Investor Contacts Kelly Bailey Epiq Systems (913) 621-9500 IR@epiqsystems.com Chris Eddy Catalyst Global (212) 924-9800 epiq@catalyst-ir.com NASDAQ: EPIQ