Filed by Southwest Bancorporation of Texas, Inc.
Pursuant to Rule 425 under the Securities Act of 1933
Subject Company: Southwest Bancorporation of Texas, Inc.
Commission File No.: 000-22007
FORWARD-LOOKING STATEMENTS
Certain statements made in the attached (and oral statements regarding the subjects of the attached press release and the presentation, including the conference call announced therein) contain forward-looking statements within the meaning of Section 27A of the Securities Act of 1933, as amended, and Section 21E of the Securities Exchange Act of 1934, as amended. Such statements may involve known and unknown risks, uncertainties and other factors which may cause the actual results, performance or achievements of Southwest Bancorporation of Texas, Inc. (the “Company”) to be materially different from future results, performance or achievements expressed or implied by such forward-looking statements. The words “expect,” “anticipated,” “intend,” “plan,” “believe,” “seek,” “estimate,” and similar expressions are intended to identify such forward-looking statements.
The Company’s actual results may differ materially from the results anticipated in these forward-looking statements due to a variety of factors, including, without limitation (a) the effects of future economic conditions on the Company and its customers; (b) the costs and effects of litigation and of unexpected or adverse outcomes in such litigation; (c) governmental monetary and fiscal policies, as well as legislative and regulatory changes; (d) the effect of changes in accounting policies and practices, as may be adopted by the regulatory agencies, as well as the Financial Accounting Standards Board and other accounting standard setters; (e) the risks of changes in interest rates on the level and composition of deposits, loan demand, and the values of loan collateral, securities and interest rate protection agreements, as well as interest rate risks; (f) the effects of competition from other commercial banks, thrifts, mortgage banking firms, consumer finance companies, credit unions, securities brokerage firms, insurance companies, money market and other mutual funds and other financial institutions operating in the Company’s market area and elsewhere, including institutions operating locally, regionally, nationally and internationally, together with such competitors offering banking products and services by mail, telephone, computer and the internet; (g) technological changes; (h) acquisition and integration of acquired businesses, including Klein Bancshares, Inc.; (i) the failure of assumptions underlying the establishment of reserves for loan loses and estimations of values of collateral in various financial assets and liabilities; (j) acts of war or terrorism. All written or oral forward-looking statements attributable to the Company are expressly qualified in their entirety by these cautionary statements.
ADDITIONAL INFORMATION
Southwest will file a proxy statement/prospectus and other relevant documents concerning the proposed transaction with the SEC. Investors are urged to read the proxy
statement/prospectus when it becomes available and any other relevant documents filed with the SEC because they will contain important information. You will be able to obtain the documents free of charge at the website maintained by the SEC at www.sec.gov. In addition, you may obtain documents filed with the SEC by Southwest free of charge by requesting them in writing from Southwest or by telephone at (713) 232-1115.
The following documents are filed herewith pursuant to Rule 425 under the Securities Act of 1933:
| • | Press release of Southwest Bancorporation of Texas, Inc. dated July 19, 2004 |
 | PRESS RELEASE Additional information www.swbanktx.com |
July 19, 2004
SOUTHWEST BANCORPORATION OF TEXAS, INC.
REPORTS STRONG INTERNAL GROWTH
Loans, Deposits, Revenue Reflect Linked Quarter Gains
2nd Quarter Highlights
Southwest Bancorporation of Texas declared a two-for-one stock split in the
form of a 100% stock dividend effective July 15, 2004.
| • | Diluted earnings per common share were $0.23 ($0.46 pre-split) for the second quarter of 2004 and $0.45 ($0.90 pre-split) for the six month period ended June 30, 2004. | |||
| • | Net income was affected by a decline in the net interest margin. Net interest margin was 3.99% compared to 4.03% linked quarter and 4.09% for the second quarter of 2003. | |||
| • | Excluding core deposit intangible amortization and gain on sales of securities in the second quarter of the prior year, cash earnings per share grew 9.2% from $0.22 ($0.44 pre-split) to $0.24 ($0.48 pre-split). | |||
| • | Strong growth trends continue: | |||
| – Average loans held for investment increased 4.6% linked quarter; 17% versus prior year | ||||
| – Average deposits increased 5.0% linked quarter; 18% versus prior year | ||||
| – Noninterest income increased 4.4% linked quarter; 17% versus prior year | ||||
| – Total revenue grew 3.5% linked quarter; 17% versus prior year. | ||||
| • | Non interest expense grew by 1.1% linked quarter, 26% versus prior year, primarily due to expenses from merged institutions. | |||
| • | Southwest Bank of Texas continues its market expansion with the announced merger with Klein Bancshares, Inc. and the opening of the Dallas operations center. | |||
| • | For the third consecutive year, Southwest Bank of Texas was named to the Keefe, Bruyette & Woods Honor Roll which recognizes industry leaders with strong 10-year EPS performance. | |||
Houston, Texas – Southwest Bancorporation of Texas, Inc. (NASDAQ: SWBT) today reported second quarter results that reflect continued success in core business growth and successful expansion in Texas.
1
For the quarter ended June 30, 2004, net income was $16.2 million, or $0.23 per diluted common share ($0.46 pre-split), compared to $16.0 million for the quarter ended June 30, 2003, or $0.23 per diluted common share ($0.46 pre-split). For the six months ended June 30, 2004, net income was $31.5 million, or $0.45 per diluted common share ($0.90 pre-split), as compared to $31.0 million, or $0.45 per diluted common share ($0.90 pre-split), for the six months ended June 30, 2003.
Return on average assets and return on average common shareholders’ equity for the three months ended June 30, 2004 were 1.06% and 12.66% compared to 1.25% and 13.60% for the same period in 2003. For the six months ended June 30, 2004, return on average assets and return on average common shareholders’ equity were 1.04% and 12.35% as compared to 1.24% and 13.54% for the six months ended June 30, 2003.
Total revenue for the second quarter of 2004 was $78.5 million, an increase of 17% over the same period in 2003. For the six months ended June 30, 2004, total revenue was $154.3 million, a 17% increase over the same period in 2003. Average loans held for investment were $3.77 billion, a 17% increase over the second quarter of 2003. Average deposits were $4.69 billion, an increase of 18% over the comparable period in 2003. Average assets were $6.18 billion, an increase of $1.07 billion, or 21%, from the second quarter of 2003.
“This is a quarter where once again our group of motivated bankers has fully demonstrated their individual and collective ability to grow our core business,” said Paul Murphy, Chief Executive Officer of Southwest Bank of Texas. “On a linked quarter comparison, average loans are up $167.0 million or 4.6%, average deposits increased $222.8 million, or 5%, and noninterest income is up $1.0 million, or 4.4%.”
Murphy also noted the Company’s expansion into the high-growth northwest sector of the greater Houston area with the May 19th Klein Bank merger announcement. “This transaction will add 27 branches and $530 million in core deposits and will nicely compliment our Montgomery County strategy which has been very successful,” he added. “The Klein branch coverage meshes almost perfectly with our existing branch system and fills out our footprint extremely well in the Houston region. Also, we are pleased with the talented team of bankers there and the growth potential in the area. We are looking forward to completing the transaction in October and see a smooth
2
operational merger in the first quarter of 2005. We expect the merger to be 3%-5% accretive to 2005 earnings.”
Net Interest Income
Net interest income increased to $55.0 million, 3.1% linked quarter, and increased 17% compared to the same period of 2003.
The net interest margin, however, decreased by 4 basis points when compared to the first quarter of 2004, and by 10 basis points when compared to the second quarter of 2003. During the quarter, the net yield on the securities portfolio declined 12 basis points and the net yield on the loan portfolio declined by 5 basis points on a linked quarter basis. The cost of funds, including demand deposits, declined by 2 basis points linked quarter to 79 basis points.
“The pressure on the net interest margin has been attributable to lower yields on the loan and securities portfolios,” explained Scott McLean, President. “Over the past several years, we have successfully offset the effects of net interest margin compression through our strong business development efforts that have resulted in above average loan and deposit growth.”
Southwest Bancorporation of Texas
Net Interest Spreads
(yield minus cost of funds)
3
Noninterest Income
For the three months ended June 30, 2004, noninterest income was $23.4 million, a 4.4% increase linked quarter and a 17% increase from the same period in 2003. For the six months ended June 30, 2004, noninterest income was $45.9 million, an increase of 17% over the comparable period of the prior year.
Service charges on deposit accounts increased to $11.2 million, a 20% increase from the second quarter of 2003. Investment services fee income increased 19% over the second quarter of 2003 and other fee income increased 36% as a result of higher letter of credit fees, increases in retail fees, and fee income on loan commitments. Other operating income increased 23% over the second quarter of 2003 primarily as a result of higher levels of BOLI income.
There was a $25,000 loss on the sales of securities recognized during the second quarter of 2004 as compared to a gain of $1.1 million in the second quarter of 2003.
Noninterest Expenses
Noninterest expenses were $51.9 million for the second quarter of 2004, up $542,000, or 1.1%, linked quarter and up 26% from the same period prior year. The primary influence on the prior year comparisons are the mergers with Maxim Bank and Lone Star Bank. Core deposit intangible amortization expense was $1.0 million for the second quarter 2004. There was no core deposit intangible amortization expense in the second quarter of 2003.
“We continue to make investments in the future of this franchise to maintain our growth and levels of customer service,” noted McLean.
Asset Quality
Nonperforming assets were 0.61% of loans and other real estate at June 30, 2004 compared to 0.68% at both June 30, 2003 and March 31, 2004. Net charge-offs for the quarter were $3.6 million, the provision for loan losses was $3.0 million. The allowance for loan losses to total loans is 1.21% at June 30, 2004 compared to 1.18% at June 30, 2003 and 1.29% at March 31, 2004.
4
“We continue to be pleased with the overall level of asset quality,” said Murphy.
Period End Loans, Deposits, Investments, Assets, and Equity
Loans held for investment were $3.91 billion at June 30, 2004, an increase of 5.1% linked quarter, and a 19% increase from June 30, 2003. Total deposits at June 30, 2004 were $4.78 billion, an increase of 1.6% linked quarter, and an increase of 15% from June 30, 2003. Investment securities were $1.62 billion at June 30, 2004, an increase of 3.0% linked quarter, and an increase of 25% from June 30, 2003. Total assets were $6.36 billion at June 30, 2004, an increase of 4.0% linked quarter, and an increase of 17% from June 30, 2003. Total shareholders’ equity was $510.2 million at June 30, 2004, compared to $479.9 million at June 30, 2003.
Southwest Bancorporation of Texas, Inc., the parent company of Southwest Bank of Texas NA, is the largest independent bank holding company headquartered in Houston, Texas. The Company focuses on commercial lending, treasury management and investment services for businesses in the southwest, private financial management and trust services for families and individuals, and retail and mortgage banking services. The Company, with $6.4 billion in assets, has 49 full-service branches located throughout the Houston and Dallas metropolitan areas.
Consolidated financial information and supplemental unaudited data schedules follow in this release. Exhibits I and II provide additional information on the net interest margin, including average balances and average rates for both assets and liabilities for the periods presented. Exhibit III presents quarterly comparative data. Exhibit IV presents reconcilements of non-GAAP disclosures.
The Company’s earnings release and the related financial supplement will be available on www.swbanktx.com, the Company’s website, prior to the beginning of the conference call to discuss earnings.
The conference call will be Tuesday, July 20 at 10:30am CST. The call is available at http://phx.corporate-ir.net/phoenix.zhtml?c=99147&p=irol-EventDetails&Event I or by dialing 866-814-1914 and referencing “Southwest Bank of Texas Second Quarter Earnings Call.” The webcast will be archived for 90 days in the Investor Relations portion of the Bank’s web site at www.swbanktx.com. A phone archive also can be accessed by calling 888-266-2081 and entering 86529 as the PIN.
The conference call may include a discussion of non-GAAP financial measures, which is qualified by a reconciliation to GAAP included in this news release or otherwise available on the Southwest Bank of Texas website under “Investor Relations.” The conference call may include forward-looking information which, along with the supplementary information and this news release, is subject to the cautionary statement that follows.
Certain of the matters discussed in this press release may constitute forward-looking statements for the purposes of the Securities Act of 1933, as amended, and the Securities Exchange Act of 1934, as amended, and as such may involve known and unknown risks, uncertainties and other factors which may cause the actual results, performance or achievements of Southwest Bancorporation of
5
Texas, Inc. (the “Company”) to be materially different from future results, performance or achievements expressed or implied by such forward-looking statements. The words “expect,” “anticipated,” “intend,” “plan,” “believe,” “seek,” “estimate,” and similar expressions are intended to identify such forward-looking statements. The Company’s actual results may differ materially from the results anticipated in these forward-looking statements due to a variety of factors, including, without limitation (a) the effects of future economic conditions on the Company and its customers; (b) the costs and effects of litigation and of unexpected or adverse outcomes in such litigation; (c) governmental monetary and fiscal policies, as well as legislative and regulatory changes; (d) the effect of changes in accounting policies and practices, as may be adopted by the regulatory agencies, as well as the Financial Accounting Standards Board and other accounting standard setters; (e) the risks of changes in interest rates on the level and composition of deposits, loan demand, and the values of loan collateral, securities and interest rate protection agreements, as well as interest rate risks; (f) the effects of competition from other commercial banks, thrifts, mortgage banking firms, consumer finance companies, credit unions, securities brokerage firms, insurance companies, money market and other mutual funds and other financial institutions operating in the Company’s market area and elsewhere, including institutions operating locally, regionally, nationally and internationally, together with such competitors offering banking products and services by mail, telephone, computer and the internet; (g) technological changes; (h) acquisition and integration of acquired businesses; (i) the failure of assumptions underlying the establishment of reserves for loan loses and estimations of values of collateral in various financial assets and liabilities; (j) acts of war or terrorism. All written or oral forward-looking statements attributable to the Company are expressly qualified in their entirety by these cautionary statements.
Contacts:
Randy Meyer, EVP & CFO
713-235-8832
rmeyer@swbanktx.com
Sarah Peterson, SVP Investor & Corporate Communications
713-232-1115
speterson@swbanktx.com
6
Southwest Bancorporation of Texas, Inc.
Consolidated Financial Information (unaudited)
| 2Q-04 | 2Q-03 | % change | YTD 04 | YTD 03 | % change | |||||||||||||||||||
| Balance sheet averages | (in 000's except per share data) | |||||||||||||||||||||||
| Loans held for investment | $ | 3,768,629 | $ | 3,218,818 | 17.1 | % | $ | 3,685,133 | $ | 3,173,978 | 16.1 | % | ||||||||||||
| Loans held for sale | 104,545 | 86,001 | 21.6 | % | 100,081 | 89,842 | 11.4 | % | ||||||||||||||||
| Investment securities | 1,628,789 | 1,222,798 | 33.2 | % | 1,592,290 | 1,190,491 | 33.8 | % | ||||||||||||||||
| Securities purchased under resale agreements | — | 30,000 | -100.0 | % | 11,538 | 24,033 | -52.0 | % | ||||||||||||||||
| Fed funds sold and other interest-earning assets | 42,375 | 66,204 | -36.0 | % | 46,943 | 59,796 | -21.5 | % | ||||||||||||||||
Total interest-earning assets | 5,544,338 | 4,623,821 | 19.9 | % | 5,435,985 | 4,538,140 | 19.8 | % | ||||||||||||||||
| Allowance for loan losses | (49,658 | ) | (39,930 | ) | 24.4 | % | (47,714 | ) | (39,078 | ) | 22.1 | % | ||||||||||||
| Cash and due from banks | 266,082 | 233,126 | 14.1 | % | 294,799 | 265,939 | 10.9 | % | ||||||||||||||||
| Goodwill | 55,077 | 2,590 | 2026.5 | % | 50,383 | 2,590 | 1845.3 | % | ||||||||||||||||
| Core deposit intangibles | 11,149 | — | 100.0 | % | 9,541 | — | 100.0 | % | ||||||||||||||||
| Other assets | 354,592 | 290,585 | 22.0 | % | 361,561 | 289,961 | 24.7 | % | ||||||||||||||||
Total assets | $ | 6,181,580 | $ | 5,110,192 | 21.0 | % | $ | 6,104,555 | $ | 5,057,552 | 20.7 | % | ||||||||||||
| Noninterest-bearing deposits | $ | 1,574,075 | $ | 1,208,477 | 30.3 | % | $ | 1,532,569 | $ | 1,190,533 | 28.7 | % | ||||||||||||
| Interest-bearing demand deposits | 71,089 | 35,451 | 100.5 | % | 65,724 | 35,250 | 86.5 | % | ||||||||||||||||
| Savings deposits | 1,981,168 | 1,775,535 | 11.6 | % | 1,947,004 | 1,737,238 | 12.1 | % | ||||||||||||||||
| Time deposits | 1,065,937 | 964,980 | 10.5 | % | 1,035,563 | 965,123 | 7.3 | % | ||||||||||||||||
| Total deposits | 4,692,269 | 3,984,443 | 17.8 | % | 4,580,860 | 3,928,144 | 16.6 | % | ||||||||||||||||
| Repurchase agreements and other borrowed funds | 940,165 | 627,729 | 49.8 | % | 974,197 | 633,512 | 53.8 | % | ||||||||||||||||
| Other liabilities | 33,824 | 27,349 | 23.7 | % | 36,491 | 33,799 | 8.0 | % | ||||||||||||||||
| Minority interest in consolidated subsidiary | — | — | 0.0 | % | — | — | 0.0 | % | ||||||||||||||||
| Shareholders’ equity | 515,322 | 470,671 | 9.5 | % | 513,007 | 462,097 | 11.0 | % | ||||||||||||||||
Total liabilities and shareholders’ equity | $ | 6,181,580 | $ | 5,110,192 | 21.0 | % | $ | 6,104,555 | $ | 5,057,552 | 20.7 | % | ||||||||||||
Income statement data | ||||||||||||||||||||||||
| Interest and fees on loans | $ | 51,289 | $ | 46,988 | 9.2 | % | $ | 100,921 | $ | 92,143 | 9.5 | % | ||||||||||||
| Interest on securities | 14,678 | 11,489 | 27.8 | % | 29,227 | 23,440 | 24.7 | % | ||||||||||||||||
| Interest on fed funds sold and other interest-earning assets | 119 | 284 | -58.1 | % | 308 | 491 | -37.3 | % | ||||||||||||||||
Total interest income | 66,086 | 58,761 | 12.5 | % | 130,456 | 116,074 | 12.4 | % | ||||||||||||||||
| Interest on deposits | 8,408 | 9,535 | -11.8 | % | 16,478 | 19,641 | -16.1 | % | ||||||||||||||||
| Interest on borrowings | 2,660 | 2,050 | 29.8 | % | 5,592 | 4,176 | 33.9 | % | ||||||||||||||||
Total interest expense | 11,068 | 11,585 | -4.5 | % | 22,070 | 23,817 | -7.3 | % | ||||||||||||||||
Net interest income | 55,018 | 47,176 | 16.6 | % | 108,386 | 92,257 | 17.5 | % | ||||||||||||||||
| Provision for loan losses | 3,000 | 3,000 | 0.0 | % | 5,000 | 6,000 | -16.7 | % | ||||||||||||||||
Net interest income after provision | 52,018 | 44,176 | 17.8 | % | 103,386 | 86,257 | 19.9 | % | ||||||||||||||||
| Service charges on deposit accounts | 11,190 | 9,316 | 20.1 | % | 22,230 | 18,932 | 17.4 | % | ||||||||||||||||
| Investment services | 2,885 | 2,430 | 18.7 | % | 5,855 | 4,725 | 23.9 | % | ||||||||||||||||
| Other fee income | 5,399 | 3,959 | 36.4 | % | 10,352 | 7,607 | 36.1 | % | ||||||||||||||||
| Other operating income | 4,000 | 3,259 | 22.7 | % | 7,465 | 6,917 | 7.9 | % | ||||||||||||||||
| Gain (loss) on sales of securities, net | (25 | ) | 1,115 | -102.2 | % | 1 | 1,150 | -99.9 | % | |||||||||||||||
Total noninterest income | 23,449 | 20,079 | 16.8 | % | 45,903 | 39,331 | 16.7 | % | ||||||||||||||||
| Salaries and benefits | 30,084 | 24,076 | 25.0 | % | 59,327 | 47,902 | 23.9 | % | ||||||||||||||||
| Occupancy expenses | 8,887 | 6,885 | 29.1 | % | 17,145 | 13,384 | 28.1 | % | ||||||||||||||||
| Other expenses | 12,917 | 10,202 | 26.6 | % | 26,762 | 19,388 | 38.0 | % | ||||||||||||||||
Total noninterest expenses | 51,888 | 41,163 | 26.1 | % | 103,234 | 80,674 | 28.0 | % | ||||||||||||||||
Income before income taxes | 23,579 | 23,092 | 2.1 | % | 46,055 | 44,914 | 2.5 | % | ||||||||||||||||
| Provision for income taxes | 7,358 | 7,129 | 3.2 | % | 14,547 | 13,877 | 4.8 | % | ||||||||||||||||
Net income | $ | 16,221 | $ | 15,963 | 1.6 | % | $ | 31,508 | $ | 31,037 | 1.5 | % | ||||||||||||
Basic earnings per common share | $ | 0.24 | $ | 0.24 | 0.4 | % | $ | 0.46 | $ | 0.46 | 0.3 | % | ||||||||||||
Diluted earnings per common share | $ | 0.23 | $ | 0.23 | 0.1 | % | $ | 0.45 | $ | 0.45 | -0.1 | % | ||||||||||||
Dividends per common share | $ | 0.03 | $ | — | 100.0 | % | $ | 0.06 | $ | — | 100.0 | % | ||||||||||||
Period end # of shares outstanding | 69,068 | 68,120 | 1.4 | % | 69,068 | 68,120 | 1.4 | % | ||||||||||||||||
Weighted avg # of shares outstanding (incl CSE’s) | 70,528 | 69,458 | 1.5 | % | 70,406 | 69,280 | 1.6 | % | ||||||||||||||||
| 2Q-04 | 2Q-03 | % change | YTD 04 | YTD 03 | % change | |||||||||||||||||||
| | (in 000's except per share data) | |||||||||||||||||||||||
| Nonperforming assets | ||||||||||||||||||||||||
| Nonaccrual loans | $ | 10,668 | $ | 14,609 | -27.0 | % | ||||||||||||||||||
| Accruing loans 90 or more days past due | 1,805 | 4,308 | -58.1 | % | ||||||||||||||||||||
| Restructured loans | — | — | 0.0 | % | ||||||||||||||||||||
| ORE and OLRA | 11,461 | 3,398 | 237.3 | % | ||||||||||||||||||||
| Total nonperforming assets | $ | 23,934 | $ | 22,315 | 7.3 | % | ||||||||||||||||||
Changes in allowance for loan losses | ||||||||||||||||||||||||
| Allowance for loan losses — beginning of period | $ | 48,071 | $ | 38,508 | 24.8 | % | $ | 43,008 | $ | 36,696 | 17.2 | % | ||||||||||||
| Provision for loan losses | 3,000 | 3,000 | 0.0 | % | 5,000 | 6,000 | -16.7 | % | ||||||||||||||||
| Charge-offs | (3,748 | ) | (3,054 | ) | 22.7 | % | (5,130 | ) | (4,373 | ) | 17.3 | % | ||||||||||||
| Recoveries | 169 | 269 | -37.2 | % | 2,498 | 400 | 524.4 | % | ||||||||||||||||
| Allowance acquired through mergers and acquisitions | — | — | 0.0 | % | 2,116 | — | 100.0 | % | ||||||||||||||||
| Allowance for loan losses — end of period | $ | 47,492 | $ | 38,723 | 22.6 | % | $ | 47,492 | $ | 38,723 | 22.6 | % | ||||||||||||
Ratios | ||||||||||||||||||||||||
| Return on average assets | 1.06 | % | 1.25 | % | 1.04 | % | 1.24 | % | ||||||||||||||||
| Return on average common shareholders’ equity | 12.66 | % | 13.60 | % | 12.35 | % | 13.54 | % | ||||||||||||||||
| Tier 1 leverage ratio | 8.45 | % | 9.06 | % | ||||||||||||||||||||
| Yield on interest-earning assets | 4.79 | % | 5.10 | % | 4.83 | % | 5.16 | % | ||||||||||||||||
| Cost of funds with demand accounts | 0.79 | % | 1.01 | % | 0.80 | % | 1.05 | % | ||||||||||||||||
| Net interest margin | 3.99 | % | 4.09 | % | 4.01 | % | 4.10 | % | ||||||||||||||||
| Efficiency ratio | 64.82 | % | 62.24 | % | 65.67 | % | 61.85 | % | ||||||||||||||||
| Demand deposits to total deposits | 33.55 | % | 30.33 | % | 33.46 | % | 30.31 | % | ||||||||||||||||
| Noninterest income to total income | 29.88 | % | 29.86 | % | 29.75 | % | 29.89 | % | ||||||||||||||||
| Noninterest expense to average interest-earning assets | 3.76 | % | 3.57 | % | 3.82 | % | 3.58 | % | ||||||||||||||||
| Nonperforming assets to loans and other real estate | 0.61 | % | 0.68 | % | ||||||||||||||||||||
| Net charge-offs (recoveries) to average loans | 0.38 | % | 0.35 | % | 0.14 | % | 0.25 | % | ||||||||||||||||
| Allowance for loan losses to total loans | 1.21 | % | 1.18 | % | ||||||||||||||||||||
| Allowance for loan losses to nonperforming loans | 380.76 | % | 204.70 | % | ||||||||||||||||||||
Common stock performance | ||||||||||||||||||||||||
| Market value of common stock — Close | $ | 22.060 | $ | 16.255 | $ | 22.060 | $ | 16.255 | ||||||||||||||||
| Market value of common stock — High | $ | 22.085 | $ | 17.975 | $ | 22.085 | $ | 17.975 | ||||||||||||||||
| Market value of common stock — Low | $ | 18.605 | $ | 14.825 | $ | 18.425 | $ | 14.825 | ||||||||||||||||
| Book value of common stock | $ | 7.39 | $ | 7.05 | ||||||||||||||||||||
| Market/book value of common stock | 299 | % | 231 | % | ||||||||||||||||||||
| Price/12 month trailing earnings ratio | 25 | 18 | ||||||||||||||||||||||
Other data | ||||||||||||||||||||||||
| EOP Employees — full time equivalent | 1,830 | 1,556 | 17.6 | % | ||||||||||||||||||||
Period end balances | $( in 000's ) | |||||||||||||||||||||||
| Loans held for investment | $ | 3,912,212 | $ | 3,277,684 | 19.4 | % | ||||||||||||||||||
| Loans held for sale | 97,929 | 91,757 | 6.7 | % | ||||||||||||||||||||
| Investment securities | 1,624,540 | 1,303,613 | 24.6 | % | ||||||||||||||||||||
| Securities purchased under resale agreements | — | 30,000 | -100.0 | % | ||||||||||||||||||||
| Fed funds sold and other interest-earning assets | 45,612 | 244,117 | -81.3 | % | ||||||||||||||||||||
Total interest-earning assets | 5,680,293 | 4,947,171 | 14.8 | % | ||||||||||||||||||||
| Allowance for loan losses | (47,492 | ) | (38,723 | ) | 22.6 | % | ||||||||||||||||||
| Cash and due from banks | 270,551 | 270,711 | -0.1 | % | ||||||||||||||||||||
| Goodwill | 54,998 | 2,590 | 2023.5 | % | ||||||||||||||||||||
| Core deposit intangibles | 10,653 | — | 100.0 | % | ||||||||||||||||||||
| Other assets | 390,958 | 260,383 | 50.1 | % | ||||||||||||||||||||
Total assets | $ | 6,359,961 | $ | 5,442,132 | 16.9 | % | ||||||||||||||||||
| Noninterest-bearing demand deposits | $ | 1,622,348 | $ | 1,343,749 | 20.7 | % | ||||||||||||||||||
| Interest-bearing demand deposits | 62,316 | 31,479 | 98.0 | % | ||||||||||||||||||||
| Savings deposits | 1,998,375 | 1,766,818 | 13.1 | % | ||||||||||||||||||||
| Time deposits | 1,097,130 | 997,407 | 10.0 | % | ||||||||||||||||||||
| Total deposits | 4,780,169 | 4,139,453 | 15.5 | % | ||||||||||||||||||||
| Repurchase agreements and other borrowed funds | 1,031,866 | 789,993 | 30.6 | % | ||||||||||||||||||||
| Other liabilities | 37,746 | 32,770 | 15.2 | % | ||||||||||||||||||||
| Minority interest in consolidated subsidiary | — | — | 0.0 | % | ||||||||||||||||||||
| Shareholders’ equity | 510,180 | 479,916 | 6.3 | % | ||||||||||||||||||||
Total liabilities and shareholders’ equity | $ | 6,359,961 | $ | 5,442,132 | 16.9 | % | ||||||||||||||||||
EXHIBIT I
Rate Volume
3 Months Ended Analysis
(unaudited)
| Three Months Ended | Three Months Ended | |||||||||||||||||||||||
| June 30, 2004 | June 30, 2003 | |||||||||||||||||||||||
| Average | Interest | Average | Average | Interest | Average | |||||||||||||||||||
| Outstanding | Earned/ | Yield/ | Outstanding | Earned/ | Yield/ | |||||||||||||||||||
| Balance | Paid | Rate | Balance | Paid | Rate | |||||||||||||||||||
| (Dollars in thousands) | ||||||||||||||||||||||||
| Interest-earning assets: | ||||||||||||||||||||||||
| Loans | $ | 3,873,174 | $ | 51,289 | 5.33 | % | $ | 3,304,819 | $ | 46,988 | 5.70 | % | ||||||||||||
| Securities | 1,628,789 | 14,678 | 3.62 | 1,222,798 | 11,489 | 3.77 | ||||||||||||||||||
| Federal funds sold and other | 42,375 | 119 | 1.13 | 96,204 | 284 | 1.18 | ||||||||||||||||||
| Total interest-earning assets | 5,544,338 | 66,086 | 4.79 | % | 4,623,821 | 58,761 | 5.10 | % | ||||||||||||||||
| Less allowance for loan losses | (49,658 | ) | (39,930 | ) | ||||||||||||||||||||
| 5,494,680 | 4,583,891 | |||||||||||||||||||||||
| Noninterest-earning assets | 686,900 | 526,301 | ||||||||||||||||||||||
| Total assets | $ | 6,181,580 | $ | 5,110,192 | ||||||||||||||||||||
| Interest-bearing liabilities: | ||||||||||||||||||||||||
| Money market and savings deposits | $ | 2,052,257 | 3,353 | 0.66 | % | $ | 1,810,986 | 4,035 | 0.89 | % | ||||||||||||||
| Time deposits | 1,065,937 | 5,055 | 1.91 | 964,980 | 5,500 | 2.29 | ||||||||||||||||||
| Repurchase agreements and other borrowed funds | 940,165 | 2,660 | 1.14 | 627,729 | 2,050 | 1.31 | ||||||||||||||||||
| Total interest-bearing liabilities | 4,058,359 | 11,068 | 1.10 | % | 3,403,695 | 11,585 | 1.37 | % | ||||||||||||||||
| Noninterest-bearing liabilities: | ||||||||||||||||||||||||
| Noninterest-bearing demand deposits | 1,574,075 | 1,208,477 | ||||||||||||||||||||||
| Other liabilities | 33,824 | 27,349 | ||||||||||||||||||||||
| Total liabilities | 5,666,258 | 4,639,521 | ||||||||||||||||||||||
| Shareholders’ equity | 515,322 | 470,671 | ||||||||||||||||||||||
| Total liabilities and shareholders’ equity | $ | 6,181,580 | $ | 5,110,192 | ||||||||||||||||||||
| Net interest income | $ | 55,018 | $ | 47,176 | ||||||||||||||||||||
| Net interest spread | 3.69 | % | 3.73 | % | ||||||||||||||||||||
| Net interest margin | 3.99 | % | 4.09 | % | ||||||||||||||||||||
| Three Months Ended | ||||||||||||
| Q2 2004 vs Q2 2003 | ||||||||||||
| Increase (Decrease) | ||||||||||||
| Due to | ||||||||||||
| Volume | Rate | Total | ||||||||||
| (Dollars in thousands) | ||||||||||||
| Interest-earning assets: | ||||||||||||
| Loans | 7,971 | (3,669 | ) | $ | 4,302 | |||||||
| Securities | 3,777 | (588 | ) | 3,189 | ||||||||
| Federal funds sold and other | (159 | ) | (6 | ) | (165 | ) | ||||||
| Total increase (decrease) in interest income | 11,589 | (4,263 | ) | 7,326 | ||||||||
| Interest-bearing liabilities: | ||||||||||||
| Money market and savings deposits | 533 | (1,215 | ) | (682 | ) | |||||||
| Time deposits | 569 | (1,014 | ) | (445 | ) | |||||||
| Repurchase agreements and borrowed funds | 1,014 | (404 | ) | 610 | ||||||||
| Total increase (decrease) in interest expense | 2,116 | (2,633 | ) | (517 | ) | |||||||
| Increase (decrease) in net interest income | $ | 9,473 | $ | (1,630 | ) | $ | 7,843 | |||||
EXHIBIT II
Rate Volume
Linked Quarter Analysis
(unaudited)
| Three Months Ended | Three Months Ended | |||||||||||||||||||||||
| June 30, 2004 | March 31, 2004 | |||||||||||||||||||||||
| Average | Interest | Average | Average | Interest | Average | |||||||||||||||||||
| Outstanding | Earned/ | Yield/ | Outstanding | Earned/ | Yield/ | |||||||||||||||||||
| Balance | Paid | Rate | Balance | Paid | Rate | |||||||||||||||||||
| (Dollars in thousands) | ||||||||||||||||||||||||
| Interest-earning assets: | ||||||||||||||||||||||||
| Loans | $ | 3,873,174 | $ | 51,289 | 5.33 | % | $ | 3,697,254 | $ | 49,632 | 5.40 | % | ||||||||||||
| Securities | 1,628,789 | 14,678 | 3.62 | 1,555,791 | 14,549 | 3.76 | ||||||||||||||||||
| Federal funds sold and other | 42,375 | 119 | 1.13 | 74,589 | 189 | 1.02 | ||||||||||||||||||
| Total interest-earning assets | 5,544,338 | 66,086 | 4.79 | % | 5,327,634 | 64,370 | 4.86 | % | ||||||||||||||||
| Less allowance for loan losses | (49,658 | ) | (45,770 | ) | ||||||||||||||||||||
| 5,494,680 | 5,281,864 | |||||||||||||||||||||||
| Noninterest-earning assets | 686,900 | 731,933 | ||||||||||||||||||||||
| Total assets | $ | 6,181,580 | $ | 6,013,797 | ||||||||||||||||||||
| Interest-bearing liabilities: | ||||||||||||||||||||||||
| Money market and savings deposits | $ | 2,052,257 | 3,353 | 0.66 | % | $ | 1,973,198 | 3,208 | 0.65 | % | ||||||||||||||
| Time deposits | 1,065,937 | 5,055 | 1.91 | 1,005,189 | 4,862 | 1.95 | ||||||||||||||||||
| Repurchase agreements and other borrowed funds | 940,165 | 2,660 | 1.14 | 1,008,229 | 2,932 | 1.17 | ||||||||||||||||||
| Total interest-bearing liabilities | 4,058,359 | 11,068 | 1.10 | % | 3,986,616 | 11,002 | 1.11 | % | ||||||||||||||||
| Noninterest-bearing liabilities: | ||||||||||||||||||||||||
| Noninterest-bearing demand deposits | 1,574,075 | 1,491,064 | ||||||||||||||||||||||
| Other liabilities | 33,824 | 25,425 | ||||||||||||||||||||||
| Total liabilities | 5,666,258 | 5,503,105 | ||||||||||||||||||||||
| Shareholders’ equity | 515,322 | 510,692 | ||||||||||||||||||||||
| Total liabilities and shareholders’ equity | $ | 6,181,580 | $ | 6,013,797 | ||||||||||||||||||||
| Net interest income | $ | 55,018 | $ | 53,368 | ||||||||||||||||||||
| Net interest spread | 3.70 | % | �� | 3.75 | % | |||||||||||||||||||
| Net interest margin | 3.99 | % | 4.03 | % | ||||||||||||||||||||
| Three Months Ended | ||||||||||||
| Q2 2004 vs Q1 2004 | ||||||||||||
| Increase (Decrease) | ||||||||||||
| Due to | ||||||||||||
| Volume | Rate | Total | ||||||||||
| (Dollars in thousands) | ||||||||||||
| Interest-earning assets: | ||||||||||||
| Loans | 2,362 | (705 | ) | $ | 1,657 | |||||||
| Securities | 683 | (554 | ) | 129 | ||||||||
| Federal funds sold and other | (82 | ) | 12 | (70 | ) | |||||||
| Total increase (decrease) in interest income | 2,963 | (1,247 | ) | 1,716 | ||||||||
| Interest-bearing liabilities: | ||||||||||||
| Money market and savings deposits | 129 | 16 | 145 | |||||||||
| Time deposits | 294 | (101 | ) | 193 | ||||||||
| Repurchase agreements and borrowed funds | (198 | ) | (74 | ) | (272 | ) | ||||||
| Total increase (decrease) in interest expense | 225 | (159 | ) | 66 | ||||||||
| Increase (decrease) in net interest income | $ | 2,738 | $ | (1,088 | ) | $ | 1,650 | |||||
EXHIBIT III
Southwest Bancorporation of Texas, Inc.
Consolidated Financial Information (unaudited)
Quarterly Trend Analysis
| 2Q-02 | 3Q-02 | 4Q-02 | 1Q-03 | 2Q-03 | 3Q-03 | 4Q-03 | 1Q-04 | 2Q-04 | ||||||||||||||||||||||||||||||||||||||||
Balance sheet averages | ||||||||||||||||||||||||||||||||||||||||||||||||
| Loans held for investment | $ | 2,765,257 | $ | 2,855,389 | $ | 3,034,633 | $ | 3,128,640 | $ | 3,218,818 | $ | 3,351,647 | $ | 3,362,374 | $ | 3,601,637 | $ | 3,768,629 | ||||||||||||||||||||||||||||||
| Loans held for sale | 76,361 | 72,922 | 85,766 | 93,726 | 86,001 | 105,064 | 98,777 | 95,617 | 104,545 | |||||||||||||||||||||||||||||||||||||||
| Investment securities | 1,089,573 | 1,192,252 | 1,198,055 | 1,157,825 | 1,222,798 | 1,497,754 | 1,539,469 | 1,555,791 | 1,628,789 | |||||||||||||||||||||||||||||||||||||||
| Securities purchased under resale agreements | 10,330 | 19,999 | 20,000 | 18,000 | 30,000 | 30,000 | 30,000 | 23,077 | — | |||||||||||||||||||||||||||||||||||||||
| Fed funds sold and other interest-earning assets | 37,341 | 26,250 | 41,967 | 53,316 | 66,204 | 90,474 | 39,997 | 51,512 | 42,375 | |||||||||||||||||||||||||||||||||||||||
Total interest-earning assets | 3,978,862 | 4,166,812 | 4,380,421 | 4,451,507 | 4,623,821 | 5,074,939 | 5,070,617 | 5,327,634 | 5,544,338 | |||||||||||||||||||||||||||||||||||||||
| Allowance for loan losses | (33,142 | ) | (34,474 | ) | (36,105 | ) | (38,216 | ) | (39,930 | ) | (41,469 | ) | (42,513 | ) | (45,770 | ) | (49,658 | ) | ||||||||||||||||||||||||||||||
| Cash and due from banks | 171,550 | 191,469 | 226,675 | 299,117 | 233,126 | 257,010 | 268,099 | 323,517 | 266,082 | |||||||||||||||||||||||||||||||||||||||
| Goodwill | 2,590 | 2,590 | 2,590 | 2,590 | 2,590 | 25,471 | 25,647 | 45,689 | 55,077 | |||||||||||||||||||||||||||||||||||||||
| Core deposit intangibles | — | — | — | — | — | 6,327 | 6,509 | 7,934 | 11,149 | |||||||||||||||||||||||||||||||||||||||
| Other assets | 250,279 | 280,699 | 283,477 | 289,330 | 290,585 | 287,289 | 338,571 | 354,793 | 354,592 | |||||||||||||||||||||||||||||||||||||||
Total assets | $ | 4,370,139 | $ | 4,607,096 | $ | 4,857,058 | $ | 5,004,328 | $ | 5,110,192 | $ | 5,609,567 | $ | 5,666,930 | $ | 6,013,797 | $ | 6,181,580 | ||||||||||||||||||||||||||||||
| Noninterest-bearing deposits | $ | 954,006 | $ | 1,016,011 | $ | 1,099,772 | $ | 1,172,389 | $ | 1,208,477 | $ | 1,342,560 | $ | 1,399,592 | $ | 1,491,064 | $ | 1,574,075 | ||||||||||||||||||||||||||||||
| Interest-bearing demand deposits | 32,735 | 32,006 | 38,572 | 35,047 | 35,451 | 73,142 | 37,997 | 60,359 | 71,089 | |||||||||||||||||||||||||||||||||||||||
| Savings deposits | 1,460,482 | 1,529,241 | 1,630,166 | 1,698,516 | 1,775,535 | 1,854,140 | 1,829,947 | 1,912,839 | 1,981,168 | |||||||||||||||||||||||||||||||||||||||
| Time deposits | 929,548 | 964,091 | 892,342 | 965,267 | 964,980 | 1,064,502 | 1,023,668 | 1,005,189 | 1,065,937 | |||||||||||||||||||||||||||||||||||||||
| Total deposits | 3,376,771 | 3,541,349 | 3,660,852 | 3,871,219 | 3,984,443 | 4,334,344 | 4,291,204 | 4,469,451 | 4,692,269 | |||||||||||||||||||||||||||||||||||||||
| Repurchase agreements and other borrowed funds | 575,363 | 613,791 | 730,363 | 639,359 | 627,729 | 771,132 | 847,109 | 1,008,229 | 940,165 | |||||||||||||||||||||||||||||||||||||||
| Other liabilities | 26,167 | 25,266 | 25,695 | 40,323 | 27,349 | 27,493 | 40,991 | 25,425 | 33,824 | |||||||||||||||||||||||||||||||||||||||
| Minority interest | 1,393 | 1,472 | 506 | — | — | — | — | — | — | |||||||||||||||||||||||||||||||||||||||
| Shareholders’ equity | 390,445 | 425,218 | 439,642 | 453,427 | 470,671 | 476,598 | 487,626 | 510,692 | 515,322 | |||||||||||||||||||||||||||||||||||||||
Total liabilities and equity | $ | 4,370,139 | $ | 4,607,096 | $ | 4,857,058 | $ | 5,004,328 | $ | 5,110,192 | $ | 5,609,567 | $ | 5,666,930 | $ | 6,013,797 | $ | 6,181,580 | ||||||||||||||||||||||||||||||
Income statement data | ||||||||||||||||||||||||||||||||||||||||||||||||
| Interest and fees on loans | $ | 44,767 | $ | 45,774 | $ | 46,735 | $ | 45,156 | $ | 46,988 | $ | 48,359 | $ | 48,022 | $ | 49,632 | $ | 51,289 | ||||||||||||||||||||||||||||||
| Interest on securities | 14,629 | 15,266 | 12,685 | 11,951 | 11,489 | 12,314 | 13,856 | 14,549 | 14,678 | |||||||||||||||||||||||||||||||||||||||
| Interest on fed funds sold and other interest-earning assets | 186 | 191 | 230 | 206 | 284 | 303 | 175 | 189 | 119 | |||||||||||||||||||||||||||||||||||||||
Total interest income | 59,582 | 61,231 | 59,650 | 57,313 | 58,761 | 60,976 | 62,053 | 64,370 | 66,086 | |||||||||||||||||||||||||||||||||||||||
| Interest on deposits | 12,174 | 12,819 | 11,276 | 10,106 | 9,535 | 9,106 | 8,224 | 8,070 | 8,408 | |||||||||||||||||||||||||||||||||||||||
| Interest on borrowings | 2,503 | 2,671 | 2,846 | 2,126 | 2,050 | 2,105 | 2,473 | 2,932 | 2,660 | |||||||||||||||||||||||||||||||||||||||
Total interest expense | 14,677 | 15,490 | 14,122 | 12,232 | 11,585 | 11,211 | 10,697 | 11,002 | 11,068 | |||||||||||||||||||||||||||||||||||||||
Net interest income | 44,905 | 45,741 | 45,528 | 45,081 | 47,176 | 49,765 | 51,356 | 53,368 | 55,018 | |||||||||||||||||||||||||||||||||||||||
| Provision for loan losses | 3,250 | 3,000 | 3,000 | 3,000 | 3,000 | 3,000 | 3,000 | 2,000 | 3,000 | |||||||||||||||||||||||||||||||||||||||
Net interest income after provision | 41,655 | 42,741 | 42,528 | 42,081 | 44,176 | 46,765 | 48,356 | 51,368 | 52,018 | |||||||||||||||||||||||||||||||||||||||
| Service charges on deposit accounts | 8,652 | 8,367 | 8,896 | 9,617 | 9,316 | 10,551 | 10,581 | 11,040 | 11,190 | |||||||||||||||||||||||||||||||||||||||
| Investment services | 2,395 | 2,371 | 2,119 | 2,295 | 2,430 | 2,489 | 2,498 | 2,970 | 2,885 | |||||||||||||||||||||||||||||||||||||||
| Other fee income | 3,903 | 957 | 4,173 | 3,648 | 3,959 | 6,816 | 4,986 | 4,953 | 5,399 | |||||||||||||||||||||||||||||||||||||||
| Other operating income | 2,724 | 3,145 | 4,758 | 3,658 | 3,259 | 4,545 | 5,048 | 3,465 | 4,000 | |||||||||||||||||||||||||||||||||||||||
| Gain (loss) on sales of securities | 1 | 1,680 | 55 | 35 | 1,115 | 31 | 43 | 26 | (25 | ) | ||||||||||||||||||||||||||||||||||||||
Total noninterest income | 17,675 | 16,520 | 20,001 | 19,253 | 20,079 | 24,432 | 23,156 | 22,454 | 23,449 | |||||||||||||||||||||||||||||||||||||||
| Salaries and benefits | 21,487 | 22,325 | 22,777 | 23,826 | 24,076 | 27,878 | 27,966 | 29,243 | 30,084 | |||||||||||||||||||||||||||||||||||||||
| Occupancy expenses | 5,631 | 5,840 | 7,110 | 6,500 | 6,885 | 8,006 | 8,299 | 8,258 | 8,887 | |||||||||||||||||||||||||||||||||||||||
| Other expenses | 10,109 | 9,949 | 9,611 | 9,185 | 10,202 | 15,474 | 11,865 | 13,845 | 12,917 | |||||||||||||||||||||||||||||||||||||||
| Minority interest | 24 | 30 | (39 | ) | — | — | — | — | — | — | ||||||||||||||||||||||||||||||||||||||
Total noninterest expenses | 37,251 | 38,144 | 39,459 | 39,511 | 41,163 | 51,358 | 48,130 | 51,346 | 51,888 | |||||||||||||||||||||||||||||||||||||||
Income before income taxes | 22,079 | 21,117 | 23,070 | 21,823 | 23,092 | 19,839 | 23,382 | 22,476 | 23,579 | |||||||||||||||||||||||||||||||||||||||
| Provision for income taxes | 6,897 | 6,555 | 7,153 | 6,748 | 7,129 | 6,459 | 7,071 | 7,189 | 7,358 | |||||||||||||||||||||||||||||||||||||||
Net income | $ | 15,182 | $ | 14,562 | $ | 15,917 | $ | 15,075 | $ | 15,963 | $ | 13,380 | $ | 16,311 | $ | 15,287 | $ | 16,221 | ||||||||||||||||||||||||||||||
Basic earnings per common share | $ | 0.23 | $ | 0.22 | $ | 0.24 | $ | 0.22 | $ | 0.24 | $ | 0.20 | $ | 0.24 | $ | 0.22 | $ | 0.24 | ||||||||||||||||||||||||||||||
Diluted earnings per common share | $ | 0.22 | $ | 0.21 | $ | 0.23 | $ | 0.22 | $ | 0.23 | $ | 0.19 | $ | 0.23 | $ | 0.22 | $ | 0.23 | ||||||||||||||||||||||||||||||
Dividends per common share | $ | — | $ | — | $ | — | $ | — | $ | — | $ | 0.03 | $ | 0.03 | $ | 0.03 | $ | 0.03 | ||||||||||||||||||||||||||||||
Period end # of shares outstanding | 67,264 | 67,668 | 67,712 | 67,786 | 68,120 | 68,368 | 68,428 | 68,612 | 69,068 | |||||||||||||||||||||||||||||||||||||||
Weighted avg # of shares outstanding (incl CSE’s) | 68,824 | 69,452 | 69,133 | 69,280 | 69,458 | 70,002 | 70,190 | 70,282 | 70,528 | |||||||||||||||||||||||||||||||||||||||
EXHIBIT III
Southwest Bancorporation of Texas, Inc.
Consolidated Financial Information (unaudited)
Quarterly Trend Analysis
Quarterly Trend Analysis
| 2Q-02 | 3Q-02 | 4Q-02 | 1Q-03 | 2Q-03 | 3Q-03 | 4Q-03 | 1Q-04 | 2Q-04 | ||||||||||||||||||||||||||||||||||||||||
Nonperforming assets | ||||||||||||||||||||||||||||||||||||||||||||||||
| Nonaccrual loans | $ | 11,725 | $ | 14,596 | $ | 13,113 | $ | 20,503 | $ | 14,609 | $ | 14,173 | $ | 11,443 | $ | 17,671 | $ | 10,668 | ||||||||||||||||||||||||||||||
| Accruing loans 90 or more days past due | 1,536 | 2,687 | 1,876 | 1,893 | 4,308 | 983 | 1,299 | 3,044 | 1,805 | |||||||||||||||||||||||||||||||||||||||
| ORE and OLRA | 818 | 829 | 760 | 684 | 3,398 | 3,688 | 4,248 | 4,722 | 11,461 | |||||||||||||||||||||||||||||||||||||||
| Total nonperforming assets | $ | 14,079 | $ | 18,112 | $ | 15,749 | $ | 23,080 | $ | 22,315 | $ | 18,844 | $ | 16,990 | $ | 25,437 | $ | 23,934 | ||||||||||||||||||||||||||||||
Changes in allowance for loan losses | ||||||||||||||||||||||||||||||||||||||||||||||||
| Allowance for loan losses — beginning of period | $ | 32,508 | $ | 33,025 | $ | 34,597 | $ | 36,696 | $ | 38,508 | $ | 38,723 | $ | 41,135 | $ | 43,008 | $ | 48,071 | ||||||||||||||||||||||||||||||
| Provision for loan losses | 3,250 | 3,000 | 3,000 | 3,000 | 3,000 | 3,000 | 3,000 | 2,000 | 3,000 | |||||||||||||||||||||||||||||||||||||||
| Charge-offs | (3,002 | ) | (1,580 | ) | (1,045 | ) | (1,319 | ) | (3,054 | ) | (2,157 | ) | (1,725 | ) | (1,382 | ) | (3,748 | ) | ||||||||||||||||||||||||||||||
| Recoveries | 269 | 152 | 232 | 131 | 269 | 143 | 598 | 2,329 | 169 | |||||||||||||||||||||||||||||||||||||||
| Allowance acquired through mergers and acquisitions | — | — | — | — | — | 1,426 | — | 2,116 | — | |||||||||||||||||||||||||||||||||||||||
| Adjustment for sale of subsidiary | — | — | (88 | ) | — | — | — | — | — | — | ||||||||||||||||||||||||||||||||||||||
| Allowance for loan losses — end of period | $ | 33,025 | $ | 34,597 | $ | 36,696 | $ | 38,508 | $ | 38,723 | $ | 41,135 | $ | 43,008 | $ | 48,071 | $ | 47,492 | ||||||||||||||||||||||||||||||
Ratios | ||||||||||||||||||||||||||||||||||||||||||||||||
| Return on average assets | 1.39 | % | 1.25 | % | 1.30 | % | 1.22 | % | 1.25 | % | 0.95 | % | 1.14 | % | 1.02 | % | 1.06 | % | ||||||||||||||||||||||||||||||
| Return on average common shareholders’ equity | 15.60 | % | 13.59 | % | 14.36 | % | 13.48 | % | 13.60 | % | 11.14 | % | 13.27 | % | 12.04 | % | 12.66 | % | ||||||||||||||||||||||||||||||
| Tier 1 leverage ratio | 9.03 | % | 8.97 | % | 8.85 | % | 8.91 | % | 9.06 | % | 8.06 | % | 9.15 | % | 8.35 | % | 8.45 | % | ||||||||||||||||||||||||||||||
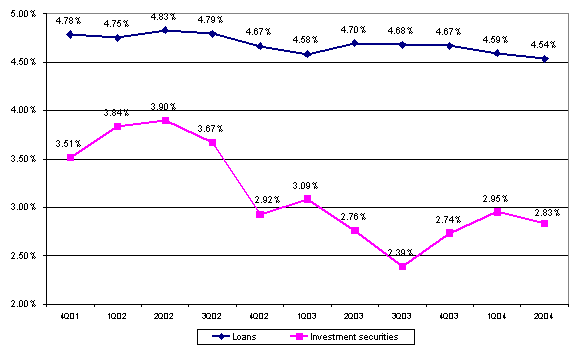
| Yield on interest-earning assets | 6.01 | % | 5.83 | % | 5.40 | % | 5.22 | % | 5.10 | % | 4.77 | % | 4.86 | % | 4.86 | % | 4.79 | % | ||||||||||||||||||||||||||||||
| Cost of funds with demand accounts | 1.49 | % | 1.48 | % | 1.28 | % | 1.10 | % | 1.01 | % | 0.87 | % | 0.83 | % | 0.81 | % | 0.79 | % | ||||||||||||||||||||||||||||||
| Net interest margin | 4.53 | % | 4.36 | % | 4.12 | % | 4.11 | % | 4.09 | % | 3.89 | % | 4.02 | % | 4.03 | % | 3.99 | % | ||||||||||||||||||||||||||||||
| Efficiency ratio | 59.53 | % | 62.96 | % | 60.27 | % | 61.45 | % | 62.24 | % | 68.31 | % | 63.73 | % | 66.55 | % | 64.82 | % | ||||||||||||||||||||||||||||||
| Demand deposits to total deposits | 28.25 | % | 28.69 | % | 30.04 | % | 30.28 | % | 30.33 | % | 30.97 | % | 32.62 | % | 33.36 | % | 33.55 | % | ||||||||||||||||||||||||||||||
| Noninterest income to total income | 28.24 | % | 26.53 | % | 30.52 | % | 29.93 | % | 29.86 | % | 32.93 | % | 31.08 | % | 29.61 | % | 29.88 | % | ||||||||||||||||||||||||||||||
| Noninterest expense to average interest-earning assets | 3.76 | % | 3.63 | % | 3.57 | % | 3.60 | % | 3.57 | % | 4.01 | % | 3.77 | % | 3.88 | % | 3.76 | % | ||||||||||||||||||||||||||||||
| Nonperforming assets to loans and other real estate | 0.50 | % | 0.62 | % | 0.50 | % | 0.73 | % | 0.68 | % | 0.57 | % | 0.49 | % | 0.68 | % | 0.61 | % | ||||||||||||||||||||||||||||||
| Net charge-offs (recoveries) to average loans | 0.40 | % | 0.20 | % | 0.11 | % | 0.15 | % | 0.35 | % | 0.24 | % | 0.13 | % | (0.11 | )% | 0.38 | % | ||||||||||||||||||||||||||||||
| Allowance for loan losses to total loans | 1.17 | % | 1.18 | % | 1.18 | % | 1.21 | % | 1.18 | % | 1.24 | % | 1.23 | % | 1.29 | % | 1.21 | % | ||||||||||||||||||||||||||||||
| Allowance for loan losses to nonperforming loans | 249.04 | % | 200.18 | % | 244.82 | % | 171.94 | % | 204.70 | % | 271.41 | % | 337.53 | % | 232.06 | % | 380.76 | % | ||||||||||||||||||||||||||||||
Common stock performance | ||||||||||||||||||||||||||||||||||||||||||||||||
| Market value of stock — Close | $ | 18.110 | $ | 18.205 | $ | 14.405 | $ | 15.015 | $ | 16.255 | $ | 18.245 | $ | 19.425 | $ | 18.865 | $ | 22.060 | ||||||||||||||||||||||||||||||
| Market value of stock — High | $ | 18.365 | $ | 19.600 | $ | 18.670 | $ | 16.525 | $ | 17.975 | $ | 19.225 | $ | 19.645 | $ | 19.955 | $ | 22.085 | ||||||||||||||||||||||||||||||
| Market value of stock — Low | $ | 15.340 | $ | 15.225 | $ | 12.245 | $ | 13.795 | $ | 14.825 | $ | 16.025 | $ | 17.600 | $ | 18.425 | $ | 18.605 | ||||||||||||||||||||||||||||||
| Book value of stock | $ | 6.10 | $ | 6.42 | $ | 6.58 | $ | 6.80 | $ | 7.05 | $ | 7.03 | $ | 7.29 | $ | 7.63 | $ | 7.39 | ||||||||||||||||||||||||||||||
| Market/book value of stock | 297 | % | 283 | % | 219 | % | 221 | % | 231 | % | 259 | % | 266 | % | 247 | % | 299 | % | ||||||||||||||||||||||||||||||
| Price/earnings ratio | 22 | 22 | 17 | 17 | 18 | 21 | 22 | 22 | 25 | |||||||||||||||||||||||||||||||||||||||
Other data | ||||||||||||||||||||||||||||||||||||||||||||||||
| EOP Employees — full time equivalent | 1,391 | 1,434 | 1,481 | 1,528 | 1,556 | 1,728 | 1,760 | 1,839 | 1,830 | |||||||||||||||||||||||||||||||||||||||
Period end balances | ||||||||||||||||||||||||||||||||||||||||||||||||
| Loans held for investment | $ | 2,813,133 | $ | 2,928,547 | $ | 3,117,951 | $ | 3,181,059 | $ | 3,277,684 | $ | 3,328,827 | $ | 3,491,673 | $ | 3,720,950 | $ | 3,912,212 | ||||||||||||||||||||||||||||||
| Loans held for sale | 70,577 | 81,874 | 101,389 | 87,398 | 91,757 | 100,366 | 96,899 | 101,944 | 97,929 | |||||||||||||||||||||||||||||||||||||||
| Investment securities | 1,162,966 | 1,254,849 | 1,201,200 | 1,193,917 | 1,303,613 | 1,507,504 | 1,549,398 | 1,576,977 | 1,624,540 | |||||||||||||||||||||||||||||||||||||||
| Securities purchased under resale agreements | 20,000 | 20,000 | 20,000 | 30,000 | 30,000 | 30,000 | 30,000 | — | — | |||||||||||||||||||||||||||||||||||||||
| Fed funds sold and other interest-earning assets | 75,404 | 130,124 | 43,107 | 92,364 | 244,117 | 88,592 | 64,908 | 52,678 | 45,612 | |||||||||||||||||||||||||||||||||||||||
Total interest-earning assets | 4,142,080 | 4,415,394 | 4,483,647 | 4,584,738 | 4,947,171 | 5,055,289 | 5,232,878 | 5,452,549 | 5,680,293 | |||||||||||||||||||||||||||||||||||||||
| Allowance for loan losses | (33,025 | ) | (34,597 | ) | (36,696 | ) | (38,508 | ) | (38,723 | ) | (41,135 | ) | (43,008 | ) | (48,071 | ) | (47,492 | ) | ||||||||||||||||||||||||||||||
| Cash and due from banks | 182,352 | 197,489 | 472,257 | 289,363 | 270,711 | 286,417 | 390,890 | 290,796 | 270,551 | |||||||||||||||||||||||||||||||||||||||
| Goodwill | 2,590 | 2,590 | 2,590 | 2,590 | 2,590 | 25,647 | 25,647 | 55,094 | 54,998 | |||||||||||||||||||||||||||||||||||||||
| Core deposit intangibles | — | — | — | — | — | 6,858 | 6,185 | 11,661 | 10,653 | |||||||||||||||||||||||||||||||||||||||
| Other assets | 254,530 | 257,581 | 250,159 | 271,686 | 260,383 | 330,434 | 333,144 | 352,189 | 390,958 | |||||||||||||||||||||||||||||||||||||||
Total assets | $ | 4,548,527 | $ | 4,838,457 | $ | 5,171,957 | $ | 5,109,869 | $ | 5,442,132 | $ | 5,663,510 | $ | 5,945,736 | $ | 6,114,218 | $ | 6,359,961 | ||||||||||||||||||||||||||||||
| Noninterest-bearing demand deposits | $ | 1,042,127 | $ | 1,115,405 | $ | 1,290,323 | $ | 1,270,991 | $ | 1,343,749 | $ | 1,341,277 | $ | 1,513,038 | $ | 1,625,647 | $ | 1,622,348 | ||||||||||||||||||||||||||||||
| Interest-bearing demand deposits | 29,806 | 35,000 | 36,222 | 39,551 | 31,479 | 40,496 | 43,452 | 72,009 | 62,316 | |||||||||||||||||||||||||||||||||||||||
| Savings deposits | 1,526,331 | 1,521,060 | 1,715,536 | 1,723,369 | 1,766,818 | 1,875,665 | 1,840,814 | 1,985,622 | 1,998,375 | |||||||||||||||||||||||||||||||||||||||
| Time deposits | 985,218 | 903,874 | 869,968 | 978,350 | 997,407 | 1,051,815 | 1,005,935 | 1,019,666 | 1,097,130 | |||||||||||||||||||||||||||||||||||||||
| Total deposits | 3,583,482 | 3,575,339 | 3,912,049 | 4,012,261 | 4,139,453 | 4,309,253 | 4,403,239 | 4,702,944 | 4,780,169 | |||||||||||||||||||||||||||||||||||||||
| Repurchase agreements and other borrowed funds | 531,468 | 804,294 | 790,873 | 602,465 | 789,993 | 842,644 | 1,016,930 | 854,005 | 1,031,866 | |||||||||||||||||||||||||||||||||||||||
| Other liabilities | 21,609 | 22,755 | 23,512 | 34,152 | 32,770 | 30,709 | 26,246 | 34,038 | 37,746 | |||||||||||||||||||||||||||||||||||||||
| Minority interest | 1,461 | 1,503 | — | — | — | — | — | — | — | |||||||||||||||||||||||||||||||||||||||
| Shareholders’ equity | 410,507 | 434,566 | 445,523 | 460,991 | 479,916 | 480,904 | 499,321 | 523,231 | 510,180 | |||||||||||||||||||||||||||||||||||||||
Total liabilities and equity | $ | 4,548,527 | $ | 4,838,457 | $ | 5,171,957 | $ | 5,109,869 | $ | 5,442,132 | $ | 5,663,510 | $ | 5,945,736 | $ | 6,114,218 | $ | 6,359,961 | ||||||||||||||||||||||||||||||
EXHIBIT IV
Southwest Bancorporation of Texas, Inc.
Reconcilements of Non-GAAP Disclosures for Impact
of Core Deposit Intangible Amortization Expense and
Gain on Sales of Securities, Net
| 2Q-04 | 2Q-03 | % change | YTD 04 | YTD 03 | % change | |||||||||||||||||||
| (in 000's except per share data) | ||||||||||||||||||||||||
| Net income — as reported | $ | 16,221 | $ | 15,963 | 1.6 | % | $ | 31,508 | $ | 31,037 | 1.5 | % | ||||||||||||
| Impact of core deposit amortization expense, after tax | 655 | — | 1,242 | — | ||||||||||||||||||||
| Impact of gain on sales of securities, net, after tax | 16 | (725 | ) | (1 | ) | (748 | ) | |||||||||||||||||
| Net income — adjusted for core deposit amortization expense and gain on sales of securities, net, after tax | $ | 16,892 | $ | 15,238 | 10.9 | % | $ | 32,750 | $ | 30,290 | 8.1 | % | ||||||||||||
| Diluted earnings per common share — as reported | $ | 0.23 | $ | 0.23 | 0.1 | % | $ | 0.45 | $ | 0.45 | -0.1 | % | ||||||||||||
| Impact of core deposit amortization expense, after tax | 0.01 | — | 0.02 | — | ||||||||||||||||||||
| Impact of gain on sales of securities, net, after tax | 0.00 | (0.01 | ) | (0.00 | ) | (0.01 | ) | |||||||||||||||||
| Diluted cash earnings per common share | $ | 0.24 | $ | 0.22 | 9.2 | % | $ | 0.47 | $ | 0.44 | 6.4 | % | ||||||||||||
| The company announced a stock split as of July 1, 2004. For informational purposes, the table below is presented on a pre-split basis. | ||||||||||||||||||||||||
| Diluted earnings per common share — as reported | $ | 0.46 | $ | 0.46 | 0.1 | % | $ | 0.90 | $ | 0.90 | -0.1 | % | ||||||||||||
| Impact of core deposit amortization expense, after tax | 0.02 | — | 0.04 | — | ||||||||||||||||||||
| Impact of gain on sales of securities, net, after tax | 0.00 | (0.02 | ) | (0.00 | ) | (0.02 | ) | |||||||||||||||||
| Diluted cash earnings per common share (pre-split) | $ | 0.48 | $ | 0.44 | 9.2 | % | $ | 0.93 | $ | 0.87 | 6.4 | % | ||||||||||||
| (1) | Management believes that cash earnings per share provides additional analytical information concerning the results of operations. |