| © 2022 Valmont ® Industries, Inc. Valmont Industries, Inc. Third Quarter 2022 Earnings Presentation October 27, 2022 |
| Disclosure Regarding Forward - Looking Statements These slides contain (and the accompanying oral discussion will contain) “forward - looking statements” within the meaning of the Private Securities Litigation Reform Act of 1995. Such statements involve known and unknown risks, uncertainties and other fa cto rs that could cause the actual results of the Company to differ materially from the results expressed or implied by such stateme nts , including general economic and business conditions, conditions affecting the industries served by the Company and its subsidi ari es including the continuing and developing effects of the pandemic including the effects of the outbreak on the general economy and the specific economic responses to the Company’s products and services, the overall market acceptance of such products and services, the integration of acquisitions and other factors disclosed in the Company’s periodic reports filed with the Securi tie s and Exchange Commission, as well as future economic and market circumstances, industry conditions, company performance and financial results, operating efficiencies, availability and price of raw materials, availability and market acceptance of new pr oducts, product pricing, domestic and international competitive environments, geopolitical risks and actions and policy changes of do mes tic and foreign governments. Consequently, such forward - looking statements should be regarded as the Company’s current plans, estimates and beliefs. The Company does not undertake and specifically declines any obligation to publicly release the result s o f any revisions to these forward - looking statements that may be made to reflect any future events or circumstances after the date of such statements or to reflect the occurrence of anticipated or unanticipated events. October 27, 2022 | Valmont Industries, Inc. 2 |
| STEVE KANIEWSKI PRESIDENT & CHIEF EXECUTIVE OFFICER October 27, 2022 | Valmont Industries, Inc. 3 |
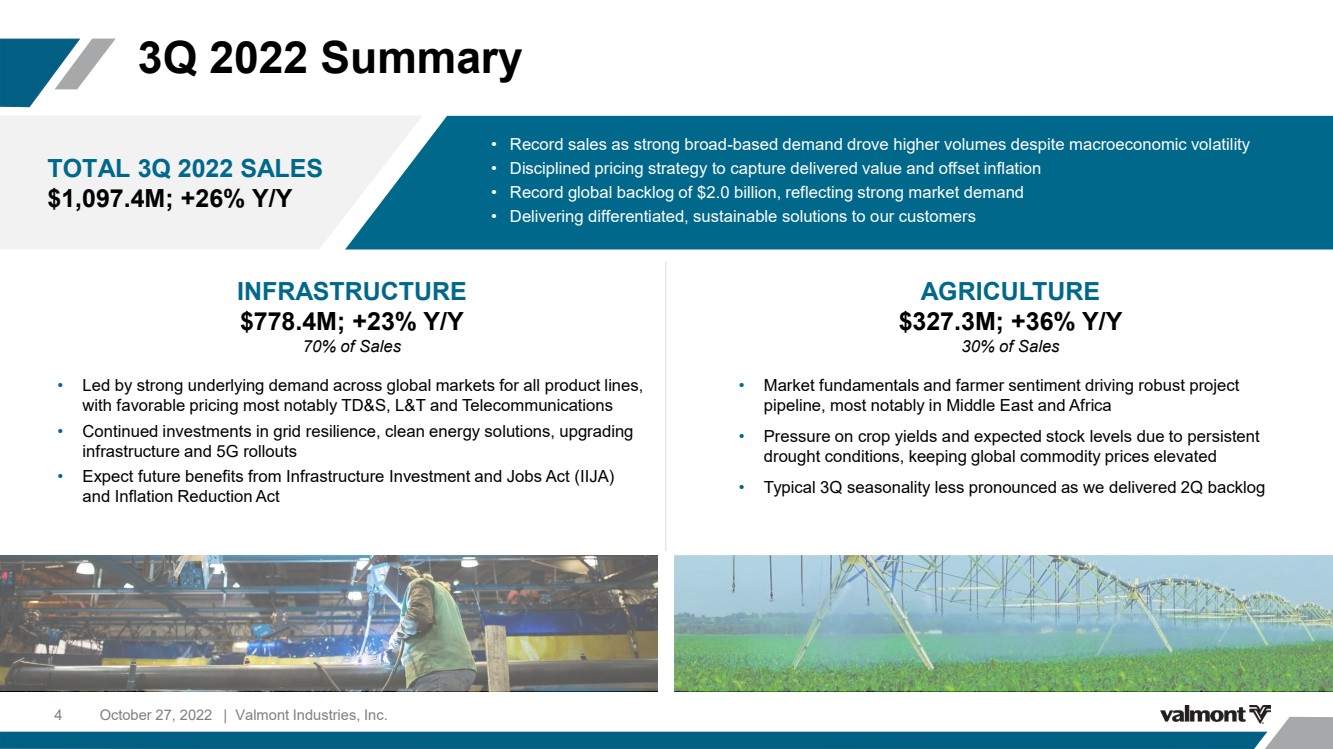
| 3Q 2022 Summary October 27, 2022 | Valmont Industries, Inc. 4 • Record sales as strong broad - based demand drove higher volumes despite macroeconomic volatility • Disciplined pricing strategy to capture delivered value and offset inflation • Record global backlog of $2.0 billion, reflecting strong market demand • Delivering differentiated, sustainable solutions to our customers TOTAL 3Q 2022 SALES $1,097.4M; +26% Y/Y AGRICULTURE $327.3M; +36% Y/Y 30% of Sales • Market fundamentals and farmer sentiment driving robust project pipeline, most notably in Middle East and Africa • Pressure on crop yields and expected stock levels due to persistent drought conditions, keeping global commodity prices elevated • Typical 3Q seasonality less pronounced as we delivered 2Q backlog INFRASTRUCTURE $778.4M; +23% Y/Y 70% of Sales • Led by strong underlying demand across global markets for all product lines, with favorable pricing most notably TD&S, L&T and Telecommunications • Continued investments in grid resilience, clean energy solutions, upgrading infrastructure and 5G rollouts • Expect future benefits from Infrastructure Investment and Jobs Act (IIJA) and Inflation Reduction Act |
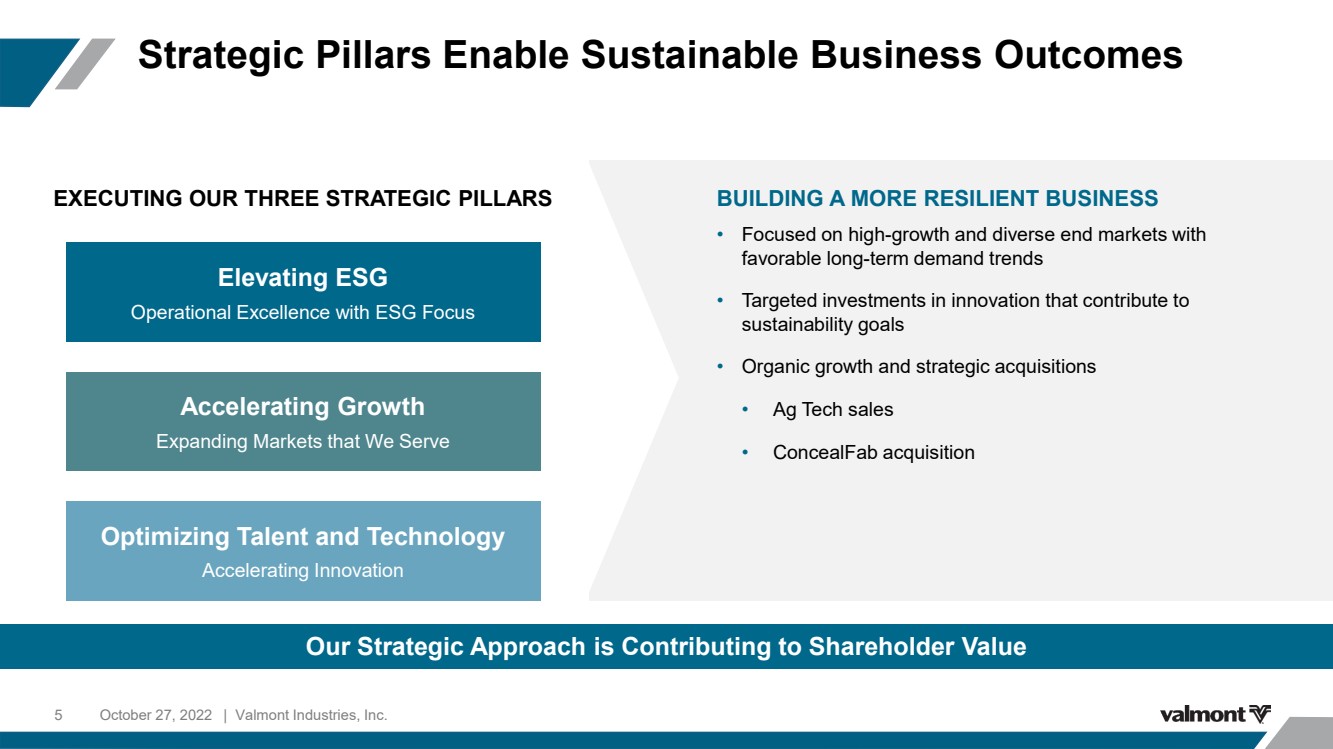
| Strategic Pillars Enable Sustainable Business Outcomes October 27, 2022 | Valmont Industries, Inc. 5 Our Strategic Approach is Contributing to Shareholder Value BUILDING A MORE RESILIENT BUSINESS • Focused on high - growth and diverse end markets with favorable long - term demand trends • Targeted investments in innovation that contribute to sustainability goals • Organic growth and strategic acquisitions • Ag Tech sales • ConcealFab acquisition Optimizing Talent and Technology Accelerating Innovation Elevating ESG Operational Excellence with ESG Focus Accelerating Growth Expanding Markets that We Serve EXECUTING OUR THREE STRATEGIC PILLARS |
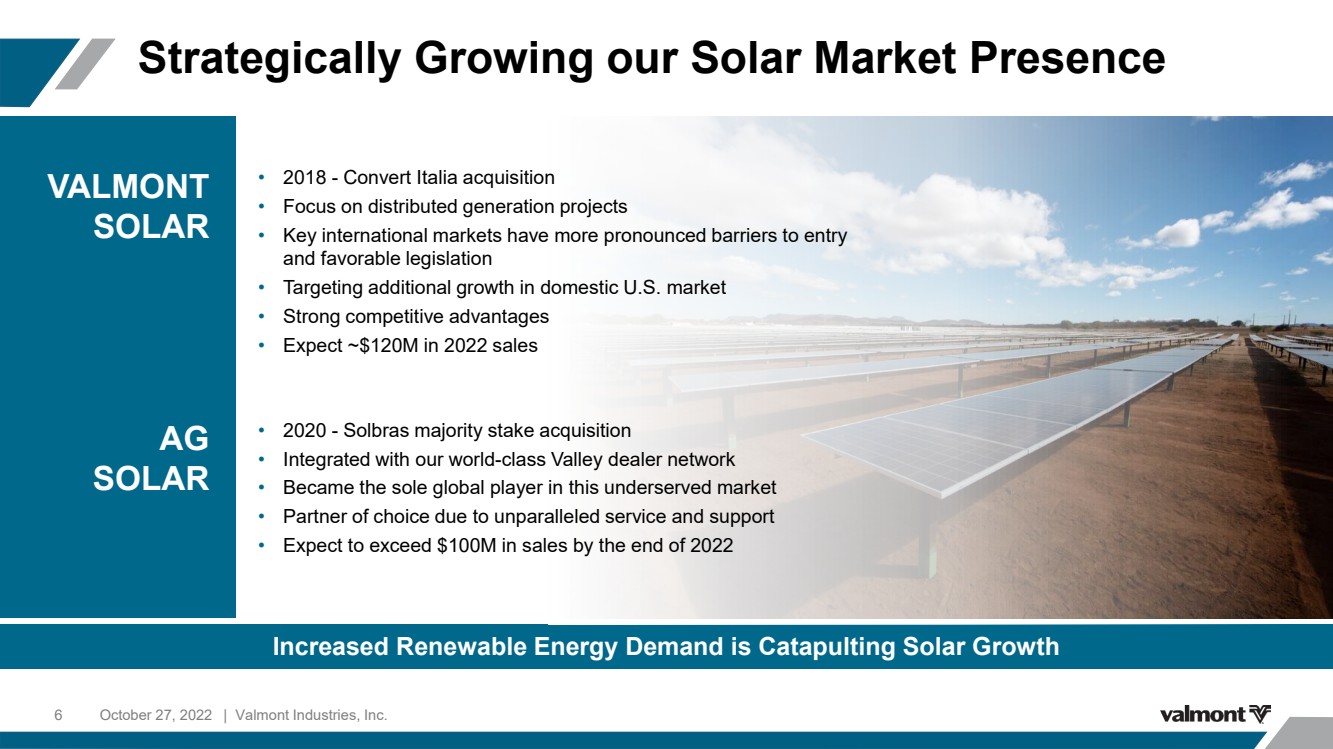
| Strategically Growing our Solar Market Presence October 27, 2022 | Valmont Industries, Inc. 6 Increased Renewable Energy Demand is Catapulting Solar Growth VALMONT SOLAR AG SOLAR • 2018 - Convert Italia acquisition • Focus on distributed generation projects • Key international markets have more pronounced barriers to entry and favorable legislation • Targeting additional growth in domestic U.S. market • Strong competitive advantages • Expect ~$120M in 2022 sales • 2020 - Solbras majority stake acquisition • Integrated with our world - class Valley dealer network • Became the sole global player in this underserved market • Partner of choice due to unparalleled service and support • Expect to exceed $100M in sales by the end of 2022 |
| October 27, 2022 | Valmont Industries, Inc. 7 AVNER APPLBAUM EVP & CHIEF FINANCIAL OFFICER |
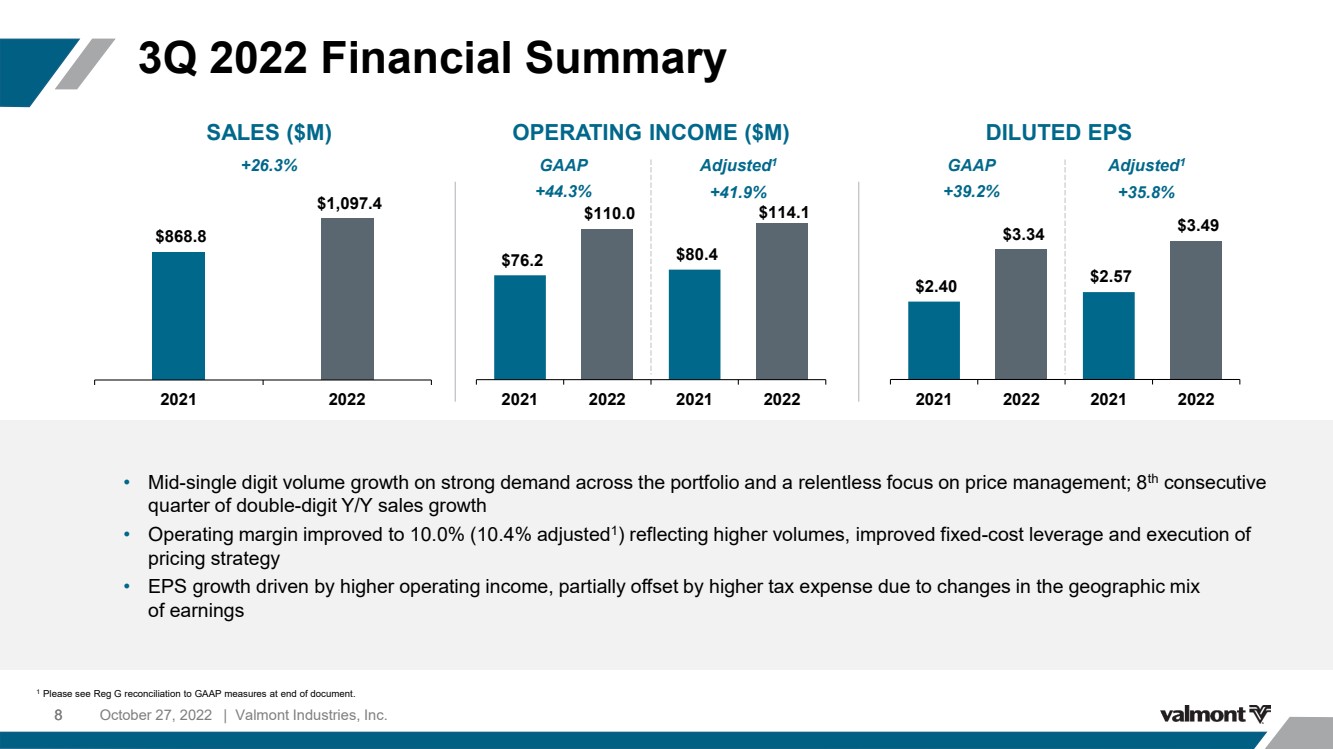
| 3Q 2022 Financial Summary October 27, 2022 | Valmont Industries, Inc. 8 8 1 Please see Reg G reconciliation to GAAP measures at end of document. • Mid - single digit volume growth on strong demand across the portfolio and a relentless focus on price management; 8 th consecutive quarter of double - digit Y/Y sales growth • Operating margin improved to 10.0% (10.4% adjusted 1 ) reflecting higher volumes, improved fixed - cost leverage and execution of pricing strategy • EPS growth driven by higher operating income, partially offset by higher tax expense due to changes in the geographic mix of earnings SALES ($M) +26.3% $868.8 $1,097.4 2021 2022 OPERATING INCOME ($M) GAAP Adjusted 1 +44.3% +41.9% $76.2 $110.0 $80.4 $114.1 2021 2022 2021 2022 $2.40 $3.34 $2.57 $3.49 2021 2022 2021 2022 DILUTED EPS GAAP Adjusted 1 +39.2% +35.8% |
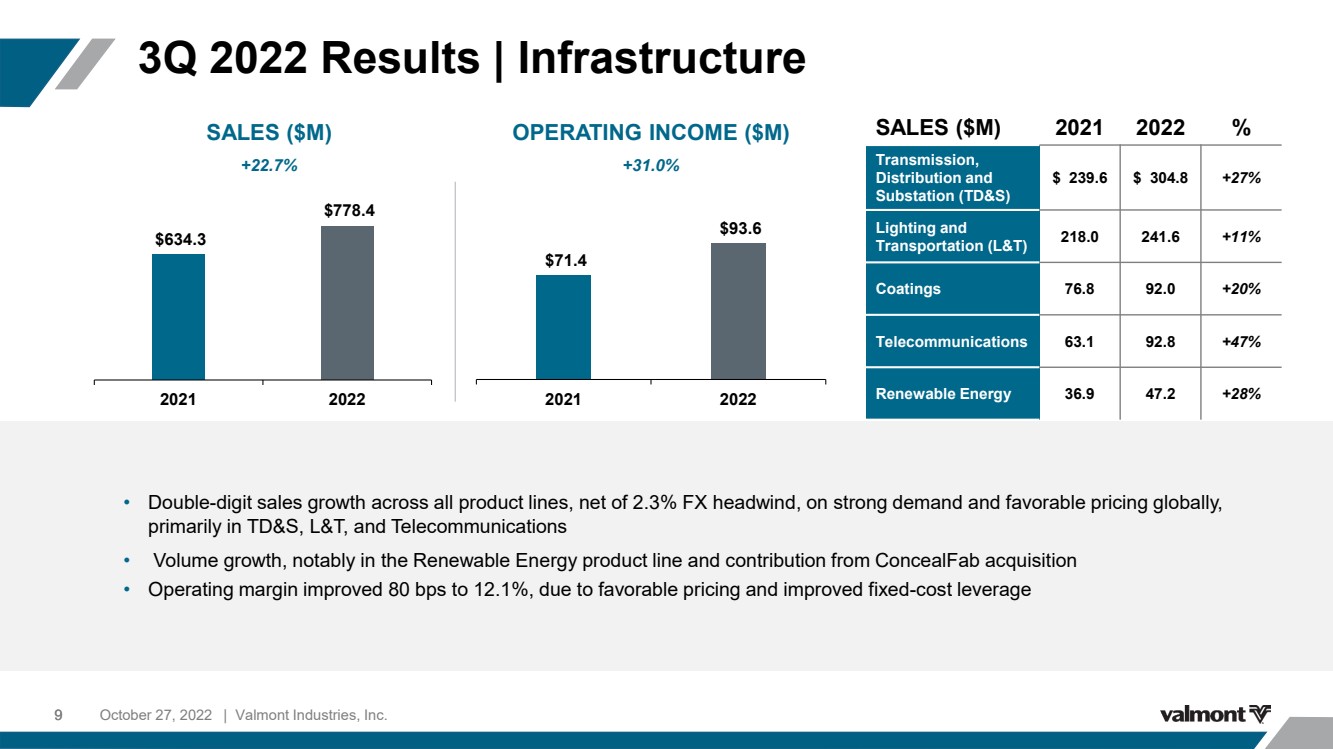
| 3Q 2022 Results | Infrastructure October 27, 2022 | Valmont Industries, Inc. 9 9 • Double - digit s ales growth across all product lines, net of 2.3% FX headwind, on strong demand and favorable pricing globally, primarily in TD&S, L&T, and Telecommunications • Volume growth, notably in the Renewable Energy product line and contribution from ConcealFab acquisition • Operating margin improved 80 bps to 12.1%, due to favorable pricing and improved fixed - cost leverage SALES ($M) 2021 2022 % Transmission, Distribution and Substation (TD&S) $ 239.6 $ 304.8 +27% Lighting and Transportation (L&T) 218.0 241.6 +11% Coatings 76.8 92.0 +20% Telecommunications 63.1 92.8 +47% Renewable Energy 36.9 47.2 +28% $634.3 $778.4 2021 2022 $71.4 $93.6 2021 2022 SALES ($M) +22.7% OPERATING INCOME ($M) +31.0% |
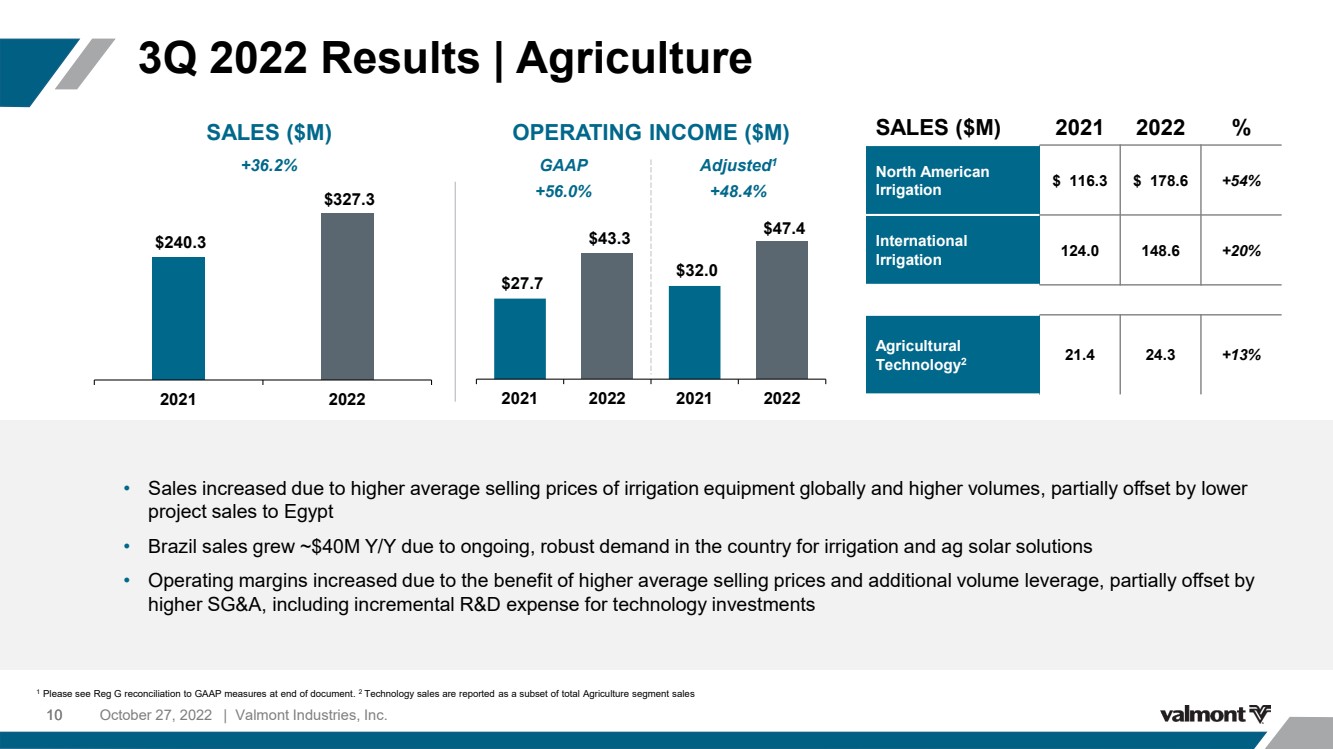
| 3Q 2022 Results | Agriculture October 27, 2022 | Valmont Industries, Inc. 10 10 1 Please see Reg G reconciliation to GAAP measures at end of document. 2 Technology sales are reported as a subset of total Agriculture segment sales $240.3 $327.3 2021 2022 SALES ($M) 2021 2022 % North American Irrigation $ 116.3 $ 178.6 +54% International Irrigation 124.0 148.6 +20% Agricultural Technology 2 21.4 24.3 +13% $27.7 $43.3 $32.0 $47.4 2021 2022 2021 2022 SALES ($M) +36.2% OPERATING INCOME ($M) GAAP Adjusted 1 +56.0% +48.4% • Sales increased due to higher average selling prices of irrigation equipment globally and higher volumes, partially offset by lower project sales to Egypt • Brazil sales grew ~$ 40 M Y/ Y due to ongoing, robust demand in the country for irrigation and ag solar solutions • Operating margins increased due to the benefit of higher average selling prices and additional volume leverage, partially offset by higher SG&A, including incremental R&D expense for technology investments |
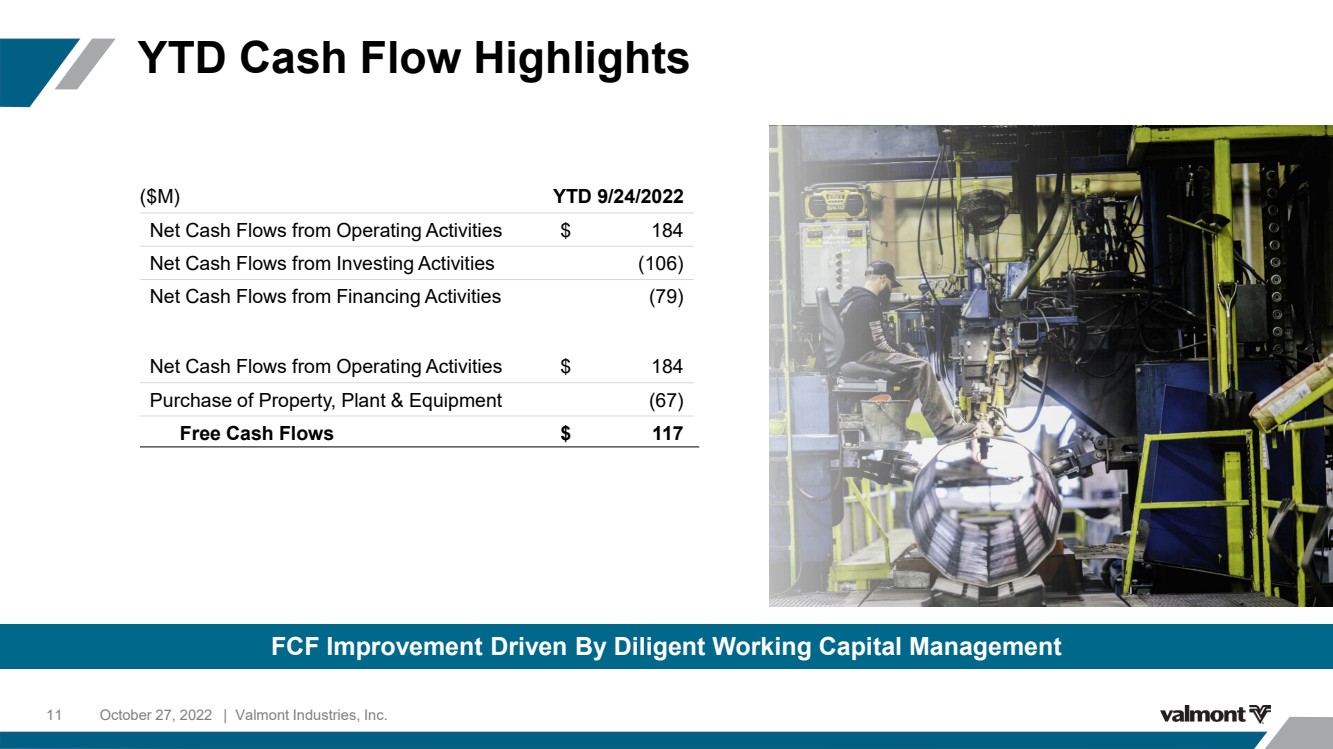
| YTD Cash Flow Highlights October 27, 2022 | Valmont Industries, Inc. 11 ($M) YTD 9/24/2022 Net Cash Flows from Operating Activities $ 184 Net Cash Flows from Investing Activities (106) Net Cash Flows from Financing Activities (79) Net Cash Flows from Operating Activities $ 184 Purchase of Property, Plant & Equipment (67) Free Cash Flows $ 117 FCF Improvement Driven By Diligent Working Capital Management |
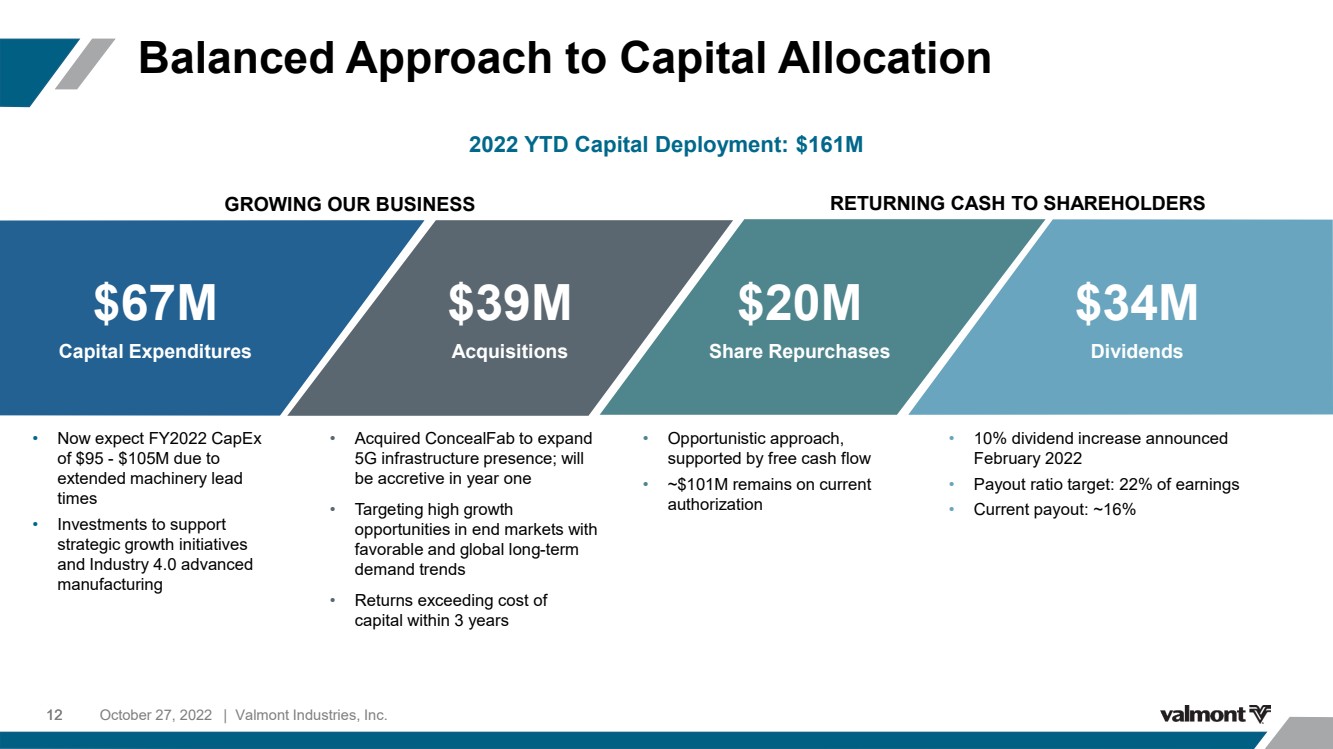
| Balanced Approach to Capital Allocation October 27, 2022 | Valmont Industries, Inc. 12 12 GROWING OUR BUSINESS RETURNING CASH TO SHAREHOLDERS • Now expect FY2022 CapEx of $95 - $105M due to extended machinery lead times • Investments to support strategic growth initiatives and Industry 4.0 advanced manufacturing • Acquired ConcealFab to expand 5G infrastructure presence; will be accretive in year one • Targeting high growth opportunities in end markets with favorable and global long - term demand trends • Returns exceeding cost of capital within 3 years • Opportunistic approach, supported by free cash flow • ~$101M remains on current authorization • 10% dividend increase announced February 2022 • Payout ratio target: 22% of earnings • Current payout: ~16% 2022 YTD Capital Deployment: $161M $67M Capital Expenditures $39M Acquisitions $20M Share Repurchases $34M Dividends |
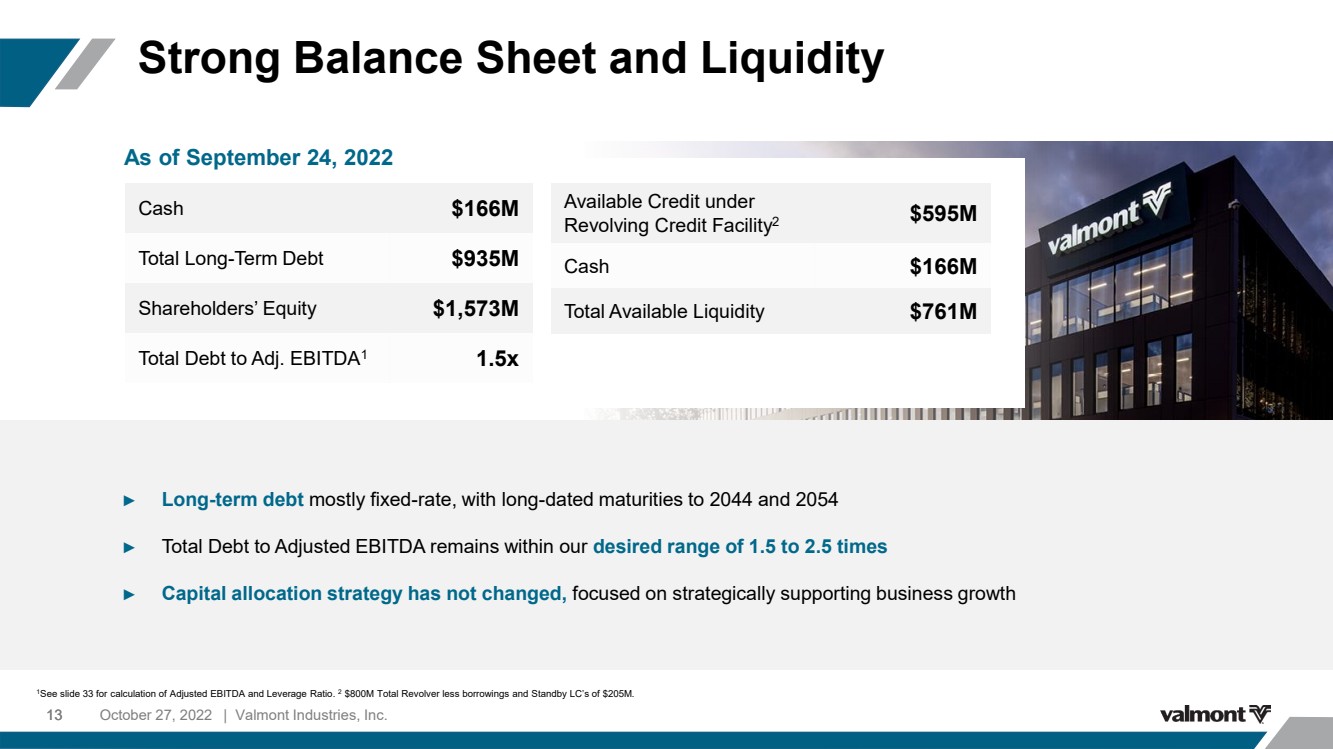
| Strong Balance Sheet and Liquidity October 27, 2022 | Valmont Industries, Inc. 13 13 Cash $166M Total Long - Term Debt $935M Shareholders’ Equity $1,573M Total Debt to Adj. EBITDA 1 1.5x Available Credit under Revolving Credit Facility 2 $595M Cash $166M Total Available Liquidity $761M As of September 24, 2022 ► Long - term debt mostly fixed - rate, with long - dated maturities to 2044 and 2054 ► Total Debt to Adjusted EBITDA remains within our desired range of 1.5 to 2.5 times ► Capital allocation strategy has not changed, focused on strategically supporting business growth 1 See slide 33 for calculation of Adjusted EBITDA and Leverage Ratio. 2 $800M Total Revolver less borrowings and Standby LC’s of $205M. |
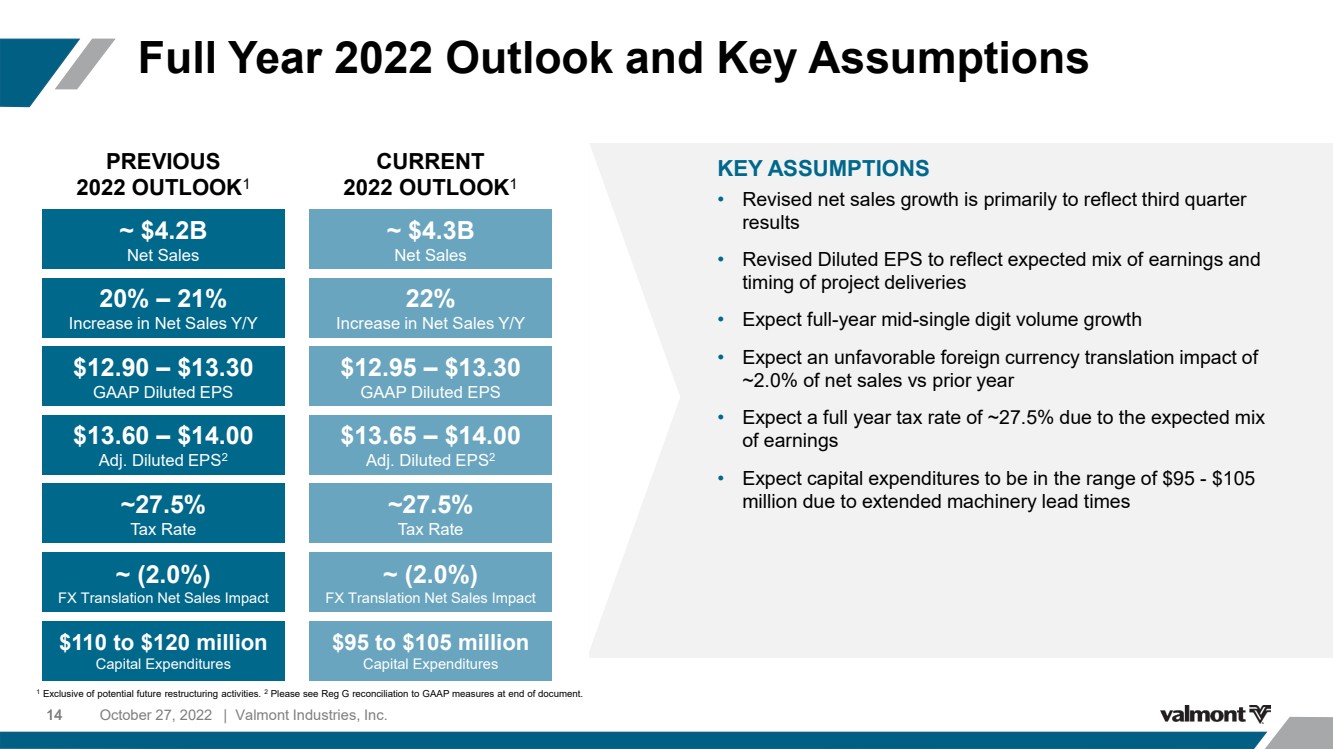
| Full Year 2022 Outlook and Key Assumptions October 27, 2022 | Valmont Industries, Inc. 14 14 KEY ASSUMPTIONS • Revised net sales growth is primarily to reflect third quarter results • Revised Diluted EPS to reflect expected mix of earnings and timing of project deliveries • Expect full - year mid - single digit volume growth • Expect an unfavorable foreign currency translation impact of ~2.0% of net sales vs prior year • Expect a full year tax rate of ~27.5% due to the expected mix of earnings • Expect capital expenditures to be in the range of $95 - $105 million due to extended machinery lead times 1 Exclusive of potential future restructuring activities. 2 Please see Reg G reconciliation to GAAP measures at end of document. PREVIOUS 2022 OUTLOOK 1 20% – 21% Increase in Net Sales Y/Y ~ (2.0%) FX Translation Net Sales Impact $13.60 – $14.00 Adj. Diluted EPS 2 $12.90 – $13.30 GAAP Diluted EPS ~27.5% Tax Rate ~ $4.2B Net Sales CURRENT 2022 OUTLOOK 1 22% Increase in Net Sales Y/Y ~ (2.0%) FX Translation Net Sales Impact $13.65 – $14.00 Adj. Diluted EPS 2 $12.95 – $13.30 GAAP Diluted EPS ~27.5% Tax Rate ~ $4.3B Net Sales $110 to $120 million Capital Expenditures $95 to $105 million Capital Expenditures |
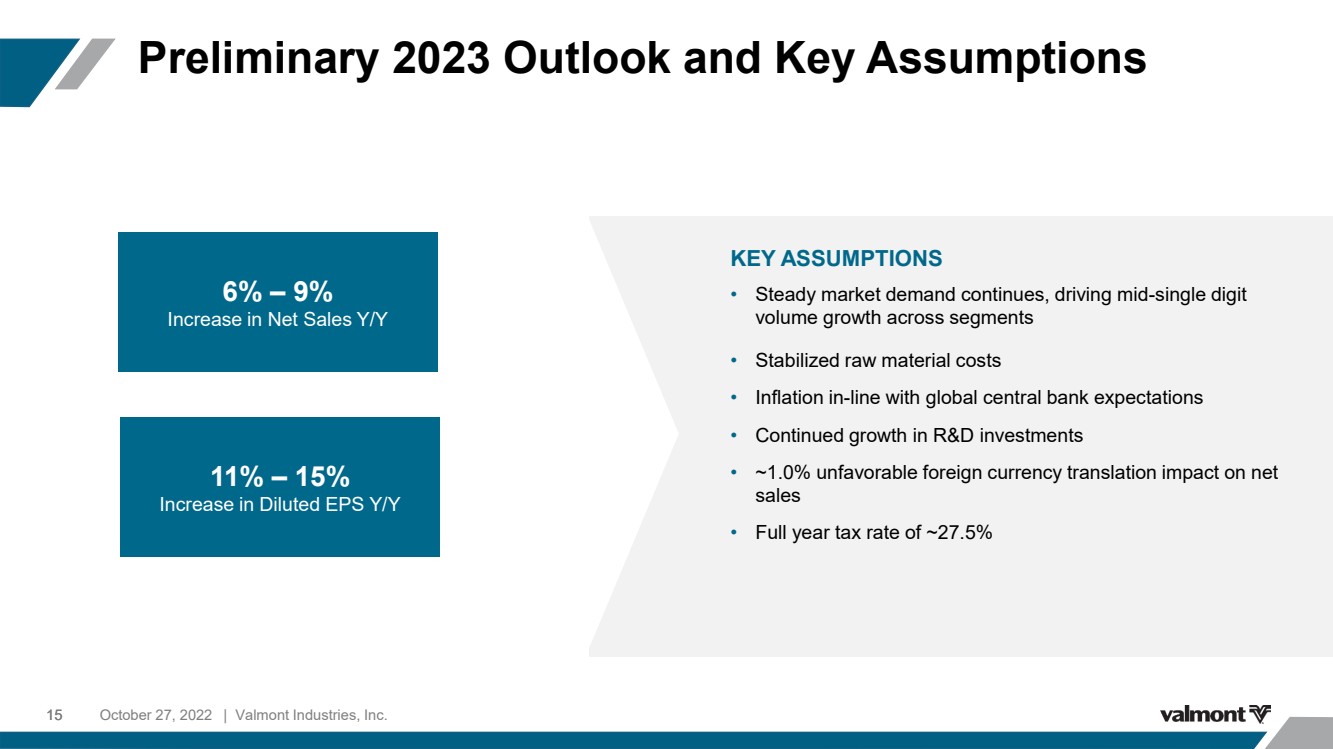
| Preliminary 2023 Outlook and Key Assumptions October 27, 2022 | Valmont Industries, Inc. 15 15 KEY ASSUMPTIONS • Steady market demand continues, driving mid - single digit volume growth across segments • Stabilized raw material costs • Inflation in - line with global central bank expectations • Continued growth in R&D investments • ~1.0% unfavorable foreign currency translation impact on net sales • Full year tax rate of ~27.5% 11% – 15% Increase in Diluted EPS Y/Y 6% – 9% Increase in Net Sales Y/Y |
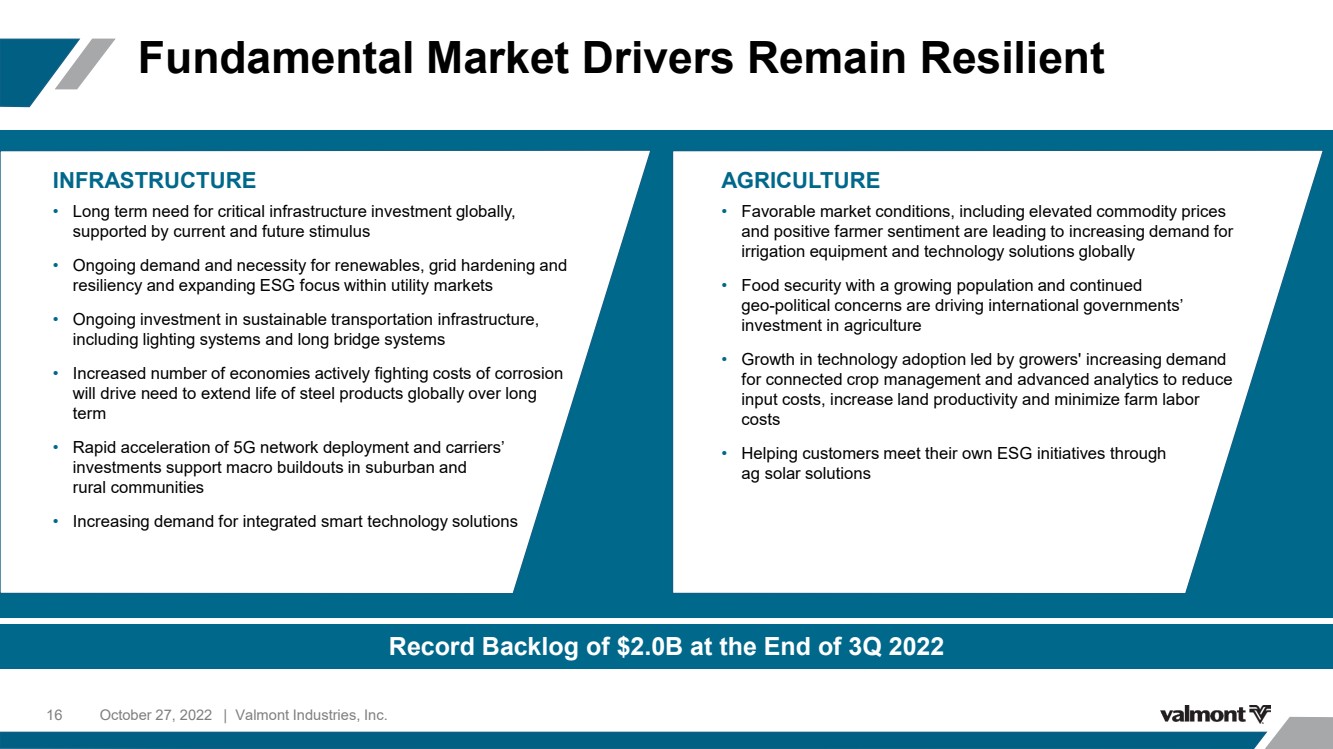
| Fundamental Market Drivers Remain Resilient October 27, 2022 | Valmont Industries, Inc. 16 INFRASTRUCTURE • Long term need for critical infrastructure investment globally, supported by current and future stimulus • Ongoing demand and necessity for renewables, grid hardening and resiliency and expanding ESG focus within utility markets • Ongoing investment in sustainable transportation infrastructure, including lighting systems and long bridge systems • Increased number of economies actively fighting costs of corrosion will drive need to extend life of steel products globally over long term • Rapid acceleration of 5G network deployment and carriers’ investments support macro buildouts in suburban and rural communities • Increasing demand for integrated smart technology solutions AGRICULTURE • Favorable market conditions, including elevated commodity prices and positive farmer sentiment are leading to increasing demand for irrigation equipment and technology solutions globally • Food security with a growing population and continued geo - political concerns are driving international governments’ investment in agriculture • Growth in technology adoption led by growers' increasing demand for connected crop management and advanced analytics to reduce input costs, increase land productivity and minimize farm labor costs • Helping customers meet their own ESG initiatives through ag solar solutions Record Backlog of $2.0B at the End of 3Q 2022 |
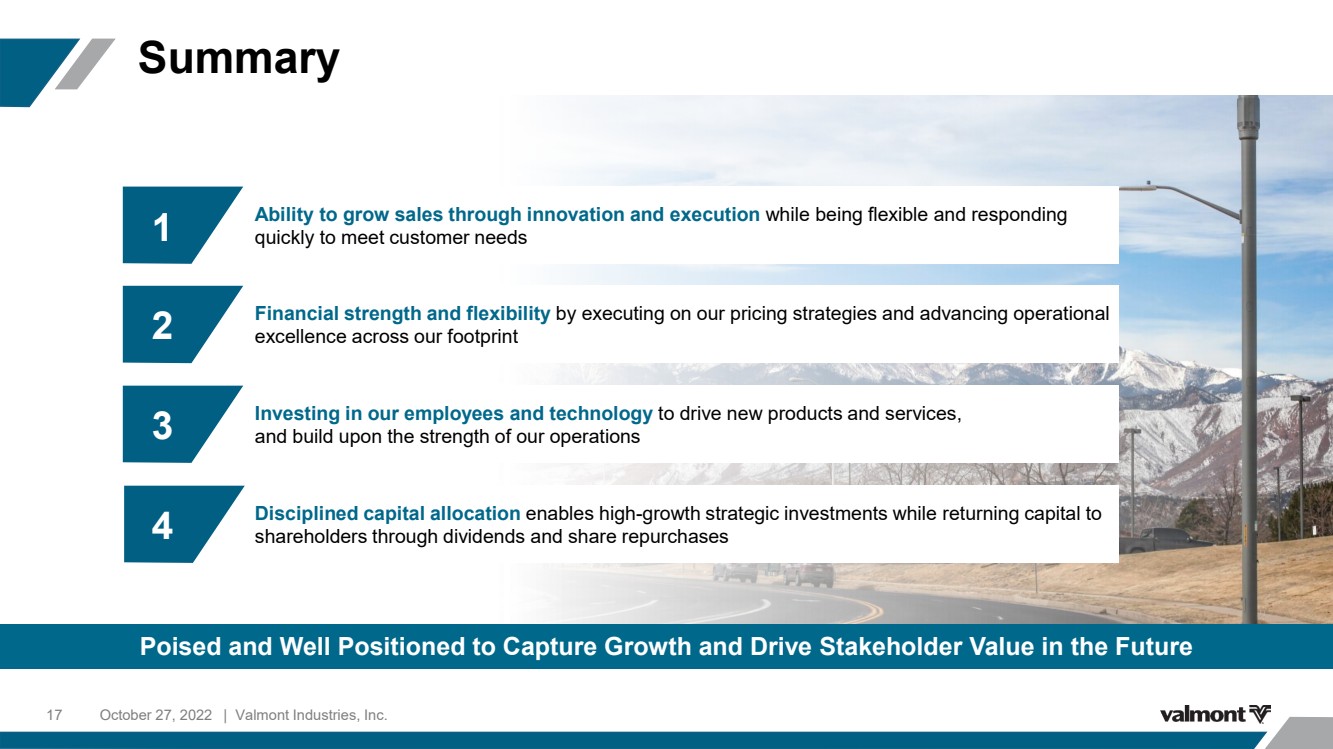
| Summary October 27, 2022 | Valmont Industries, Inc. 17 Ability to grow sales through innovation and execution while being flexible and responding quickly to meet customer needs Financial strength and flexibility by executing on our pricing strategies and advancing operational excellence across our footprint Disciplined capital allocation enables high - growth strategic investments while returning capital to shareholders through dividends and share repurchases Investing in our employees and technology to drive new products and services, and build upon the strength of our operations 1 2 3 4 Poised and Well Positioned to Capture Growth and Drive Stakeholder Value in the Future |
| October 27, 2022 | Valmont Industries, Inc. 18 Q&A |

| October 27, 2022 | Valmont Industries, Inc. 19 APPENDIX |

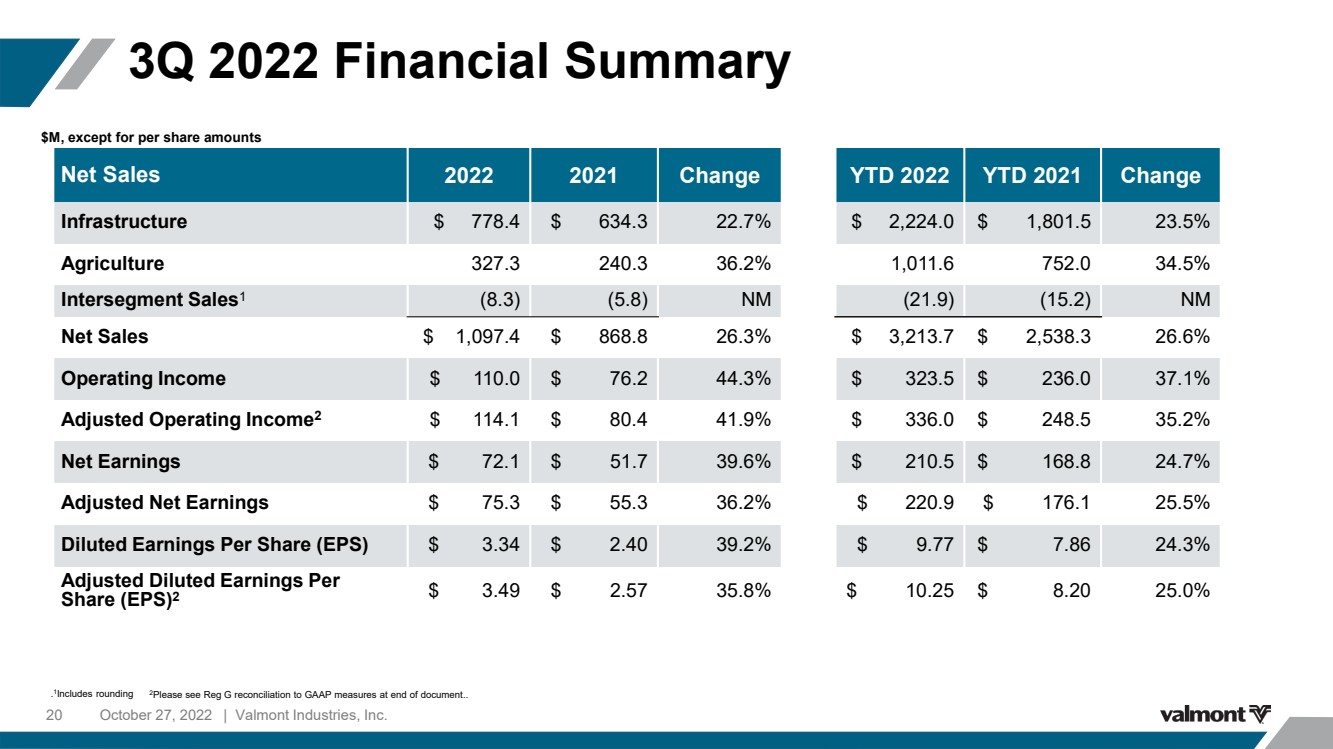
| October 27, 2022 | Valmont Industries, Inc. 20 3Q 2022 Financial Summary $M, except for per share amounts .. 1 Includes rounding 2 Please see Reg G reconciliation to GAAP measures at end of document. .. Net Sales 2022 2021 Change YTD 2022 YTD 2021 Change Infrastructure $ 778.4 $ 634.3 22.7% $ 2,224.0 $ 1,801.5 23.5% Agriculture 327.3 240.3 36.2% 1,011.6 752.0 34.5% Intersegment Sales 1 (8.3) (5.8) NM (21.9) (15.2) NM Net Sales $ 1,097.4 $ 868.8 26.3% $ 3,213.7 $ 2,538.3 26.6% Operating Income $ 110.0 $ 76.2 44.3% $ 323.5 $ 236.0 37.1% Adjusted Operating Income 2 $ 114.1 $ 80.4 41.9% $ 336.0 $ 248.5 35.2% Net Earnings $ 72.1 $ 51.7 39.6% $ 210.5 $ 168.8 24.7% Adjusted Net Earnings $ 75.3 $ 55.3 36.2% $ 220.9 $ 176.1 25.5% Diluted Earnings Per Share (EPS) $ 3.34 $ 2.40 39.2% $ 9.77 $ 7.86 24.3% Adjusted Diluted Earnings Per Share (EPS) 2 $ 3.49 $ 2.57 35.8% $ 10.25 $ 8.20 25.0% |
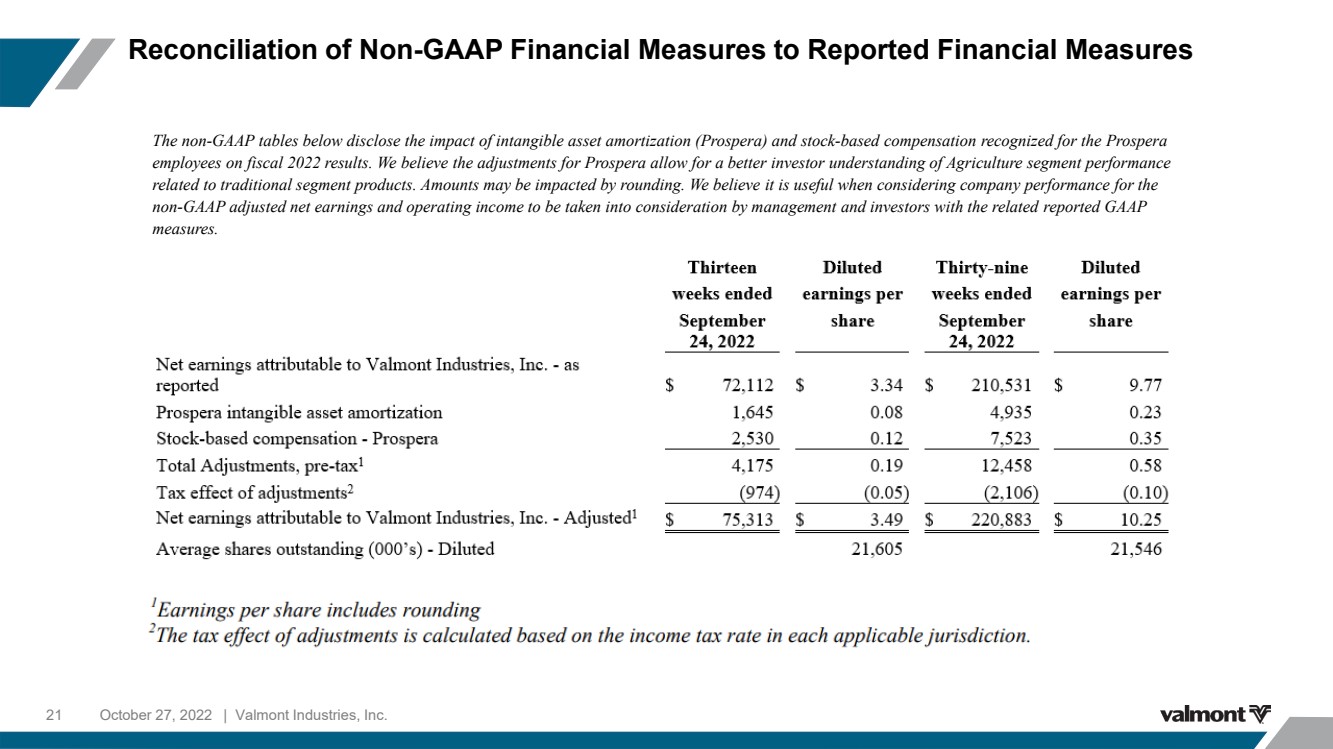
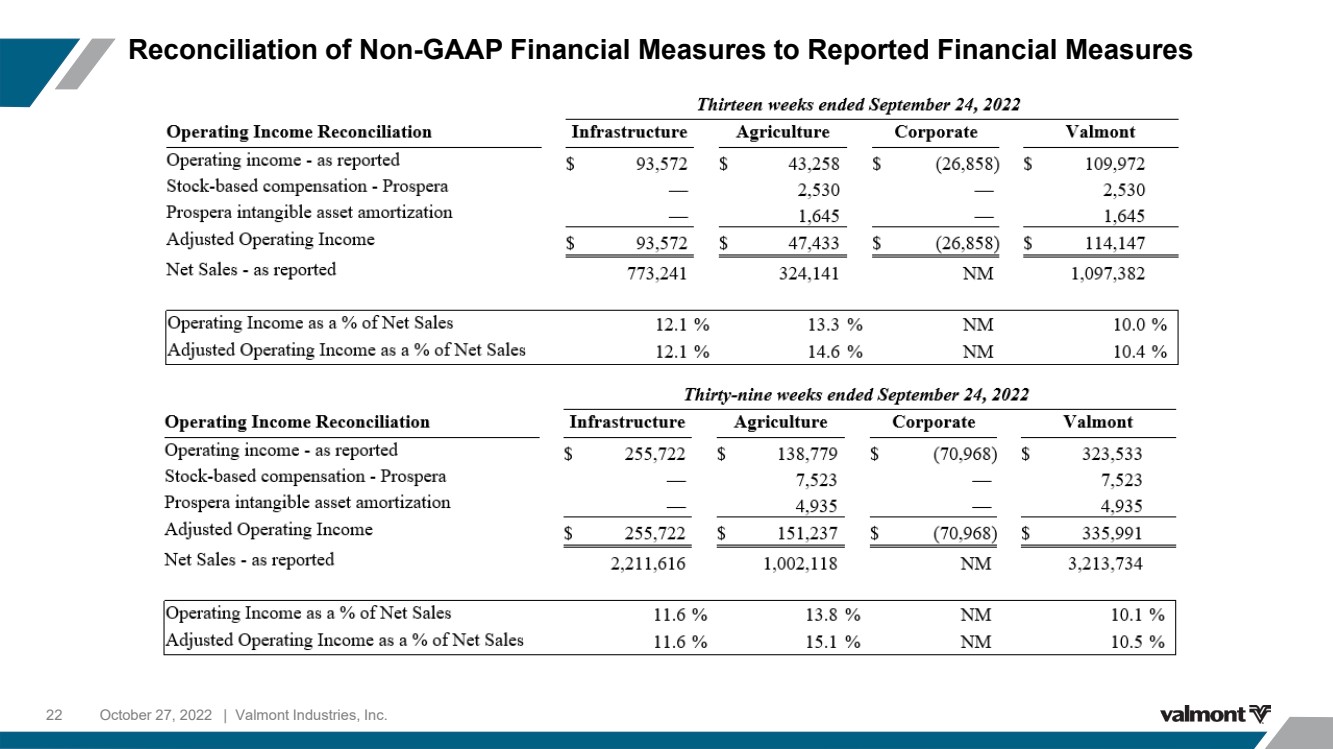
| October 27, 2022 | Valmont Industries, Inc. 21 Reconciliation of Non - GAAP Financial Measures to Reported Financial Measures The non - GAAP tables below disclose the impact of intangible asset amortization ( Prospera ) and stock - based compensation recognized for the Prospera employees on fiscal 2022 results. We believe the adjustments for Prospera allow for a better investor understanding of Agriculture segment performance related to traditional segment products. Amounts may be impacted by rounding. We believe it is useful when considering compan y p erformance for the non - GAAP adjusted net earnings and operating income to be taken into consideration by management and investors with the related reported GAAP measures. |
| October 27, 2022 | Valmont Industries, Inc. 22 Reconciliation of Non - GAAP Financial Measures to Reported Financial Measures |
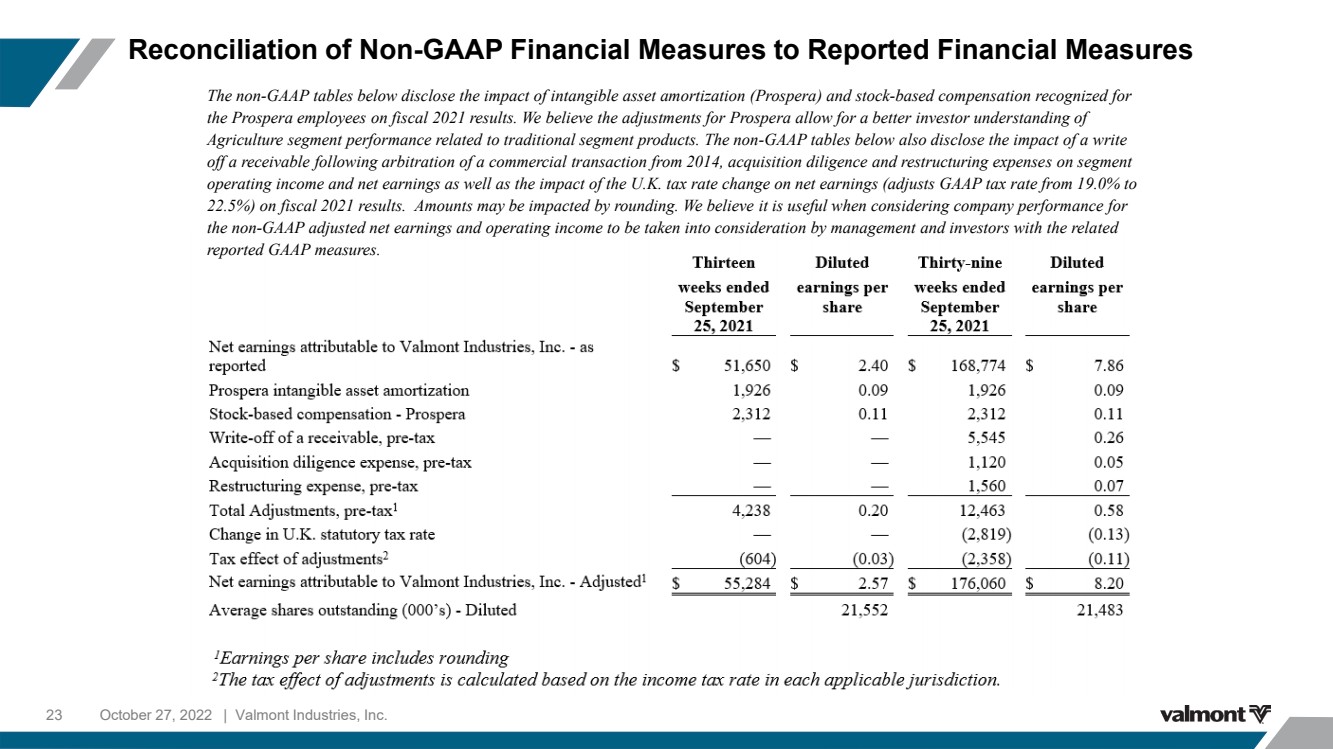
| October 27, 2022 | Valmont Industries, Inc. 23 Reconciliation of Non - GAAP Financial Measures to Reported Financial Measures The non - GAAP tables below disclose the impact of intangible asset amortization ( Prospera ) and stock - based compensation recognized for the Prospera employees on fiscal 2021 results. We believe the adjustments for Prospera allow for a better investor understanding of Agriculture segment performance related to traditional segment products. The non - GAAP tables below also disclose the impact of a write off a receivable following arbitration of a commercial transaction from 2014, acquisition diligence and restructuring expense s o n segment operating income and net earnings as well as the impact of the U.K. tax rate change on net earnings (adjusts GAAP tax rate fr om 19.0% to 22.5%) on fiscal 2021 results. Amounts may be impacted by rounding. We believe it is useful when considering company perform anc e for the non - GAAP adjusted net earnings and operating income to be taken into consideration by management and investors with the rela ted reported GAAP measures. |
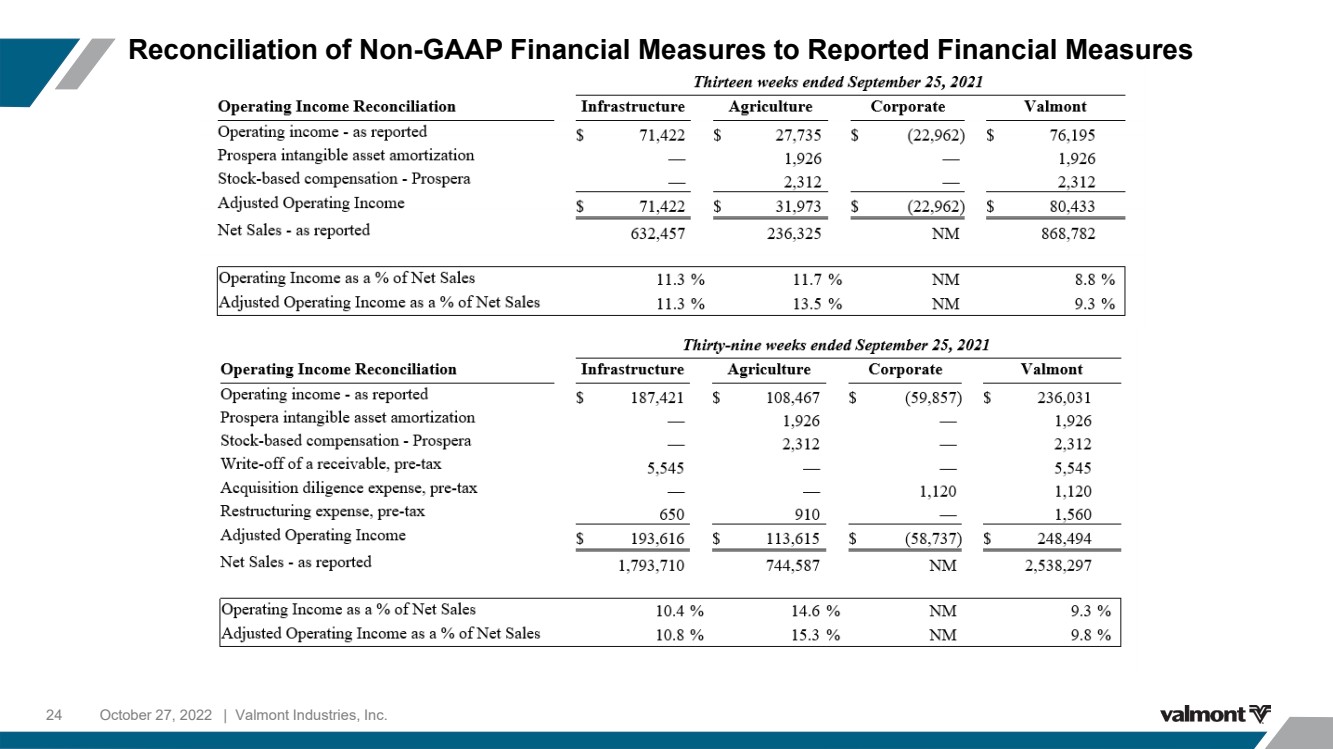
| October 27, 2022 | Valmont Industries, Inc. 24 Reconciliation of Non - GAAP Financial Measures to Reported Financial Measures |
| October 27, 2022 | Valmont Industries, Inc. 25 Regulation G Reconciliation of Forecasted GAAP and Adjusted Earnings (Dollars in thousands, except per share amounts) |

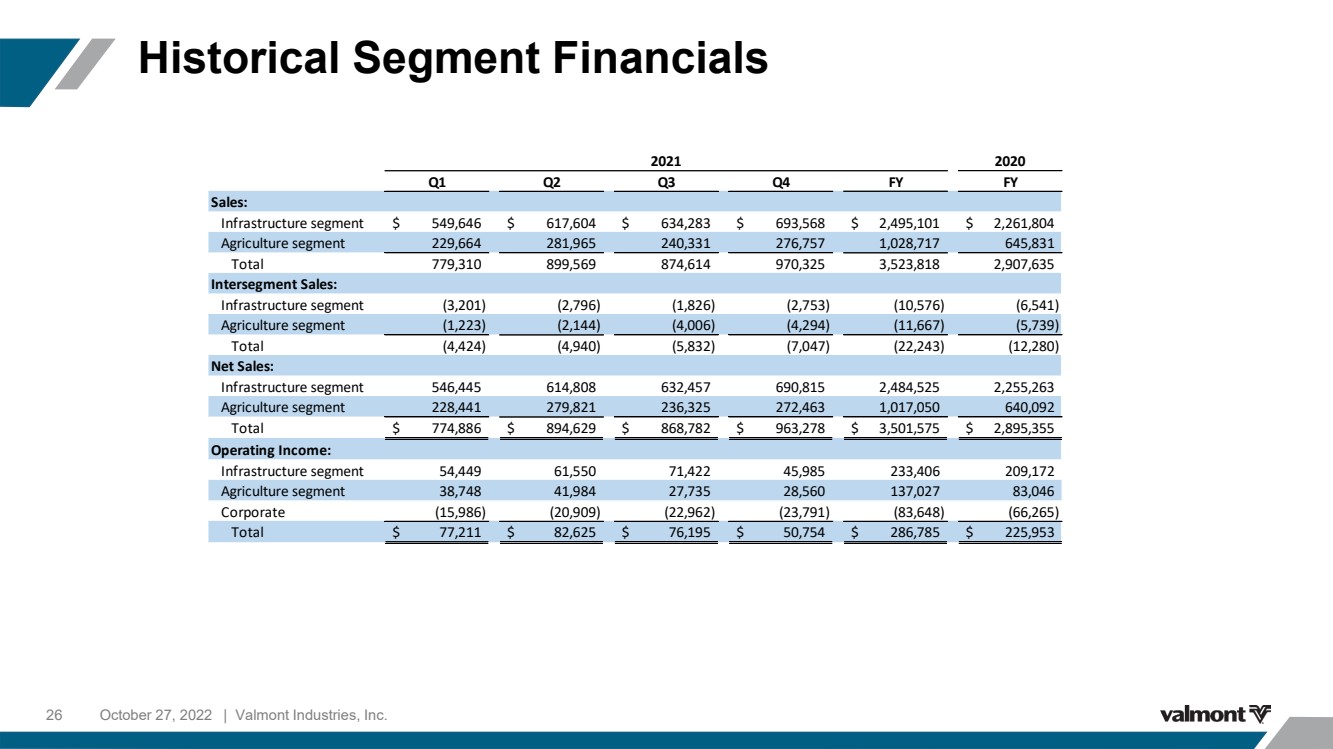
| Historical Segment Financials October 27, 2022 | Valmont Industries, Inc. 26 2020 Q1 Q2 Q3 Q4 FY FY Sales: Infrastructure segment 549,646 $ 617,604 $ 634,283 $ 693,568 $ 2,495,101 $ 2,261,804 $ Agriculture segment 229,664 281,965 240,331 276,757 1,028,717 645,831 Total 779,310 899,569 874,614 970,325 3,523,818 2,907,635 Intersegment Sales: Infrastructure segment (3,201) (2,796) (1,826) (2,753) (10,576) (6,541) Agriculture segment (1,223) (2,144) (4,006) (4,294) (11,667) (5,739) Total (4,424) (4,940) (5,832) (7,047) (22,243) (12,280) Net Sales: Infrastructure segment 546,445 614,808 632,457 690,815 2,484,525 2,255,263 Agriculture segment 228,441 279,821 236,325 272,463 1,017,050 640,092 Total 774,886 $ 894,629 $ 868,782 $ 963,278 $ 3,501,575 $ 2,895,355 $ Operating Income: Infrastructure segment 54,449 61,550 71,422 45,985 233,406 209,172 Agriculture segment 38,748 41,984 27,735 28,560 137,027 83,046 Corporate (15,986) (20,909) (22,962) (23,791) (83,648) (66,265) Total 77,211 $ 82,625 $ 76,195 $ 50,754 $ 286,785 $ 225,953 $ 2021 |
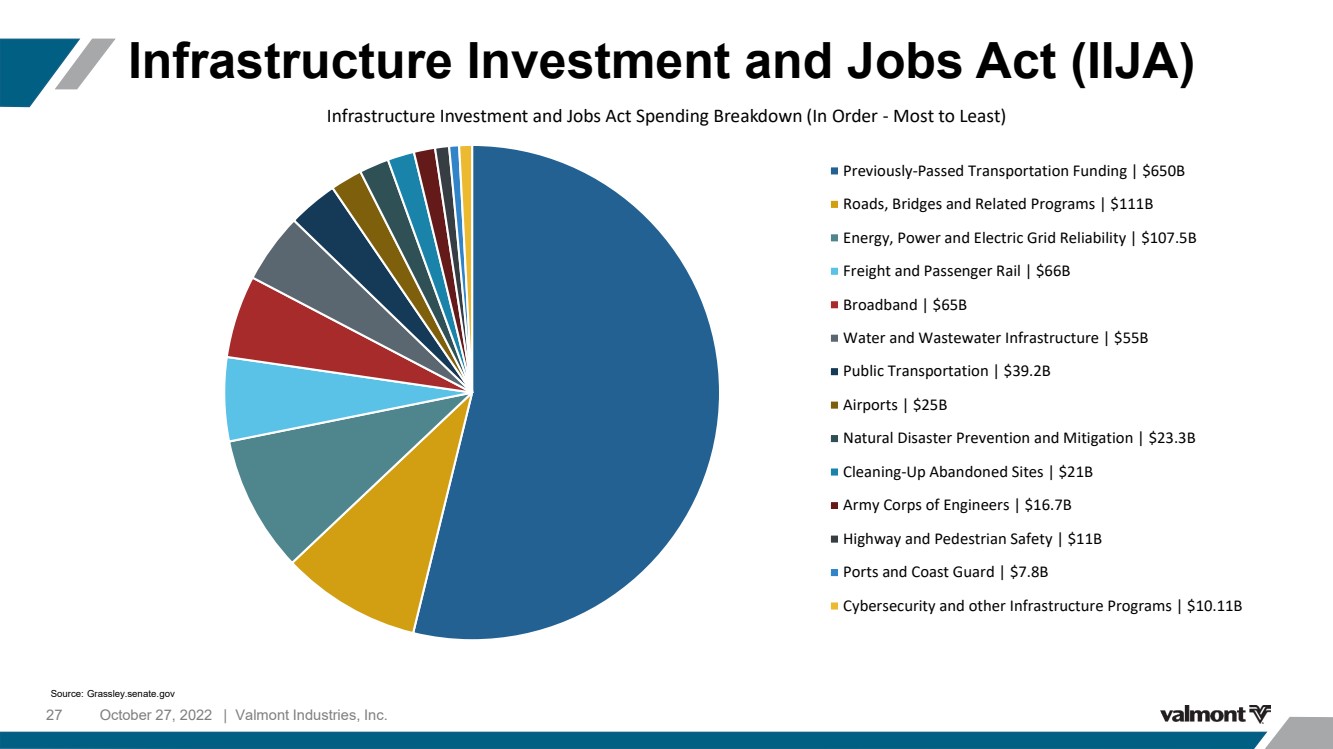
| October 27, 2022 | Valmont Industries, Inc. 27 Infrastructure Investment and Jobs Act (IIJA) Infrastructure Investment and Jobs Act Spending Breakdown (In Order - Most to Least) Previously-Passed Transportation Funding | $650B Roads, Bridges and Related Programs | $111B Energy, Power and Electric Grid Reliability | $107.5B Freight and Passenger Rail | $66B Broadband | $65B Water and Wastewater Infrastructure | $55B Public Transportation | $39.2B Airports | $25B Natural Disaster Prevention and Mitigation | $23.3B Cleaning-Up Abandoned Sites | $21B Army Corps of Engineers | $16.7B Highway and Pedestrian Safety | $11B Ports and Coast Guard | $7.8B Cybersecurity and other Infrastructure Programs | $10.11B Source: Grassley.senate.gov |
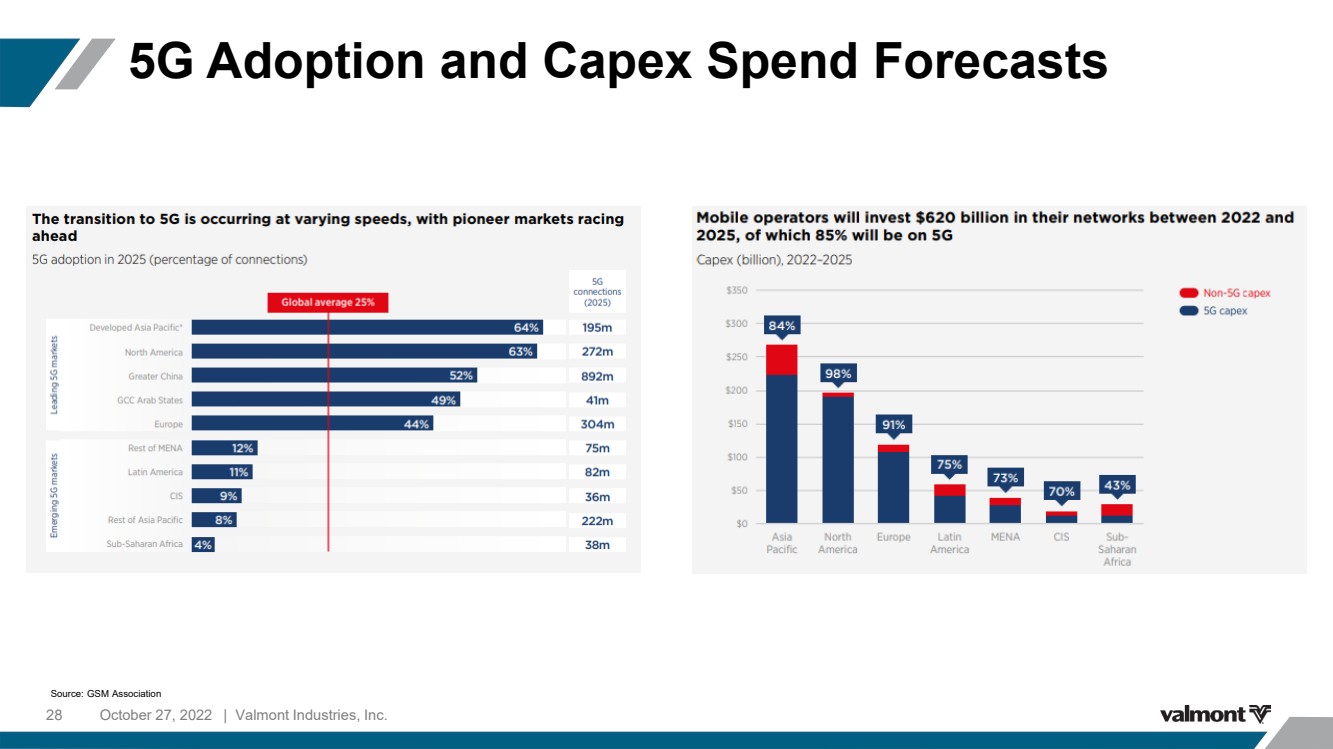
| October 27, 2022 | Valmont Industries, Inc. 28 5G Adoption and Capex Spend Forecasts Source: GSM Association |
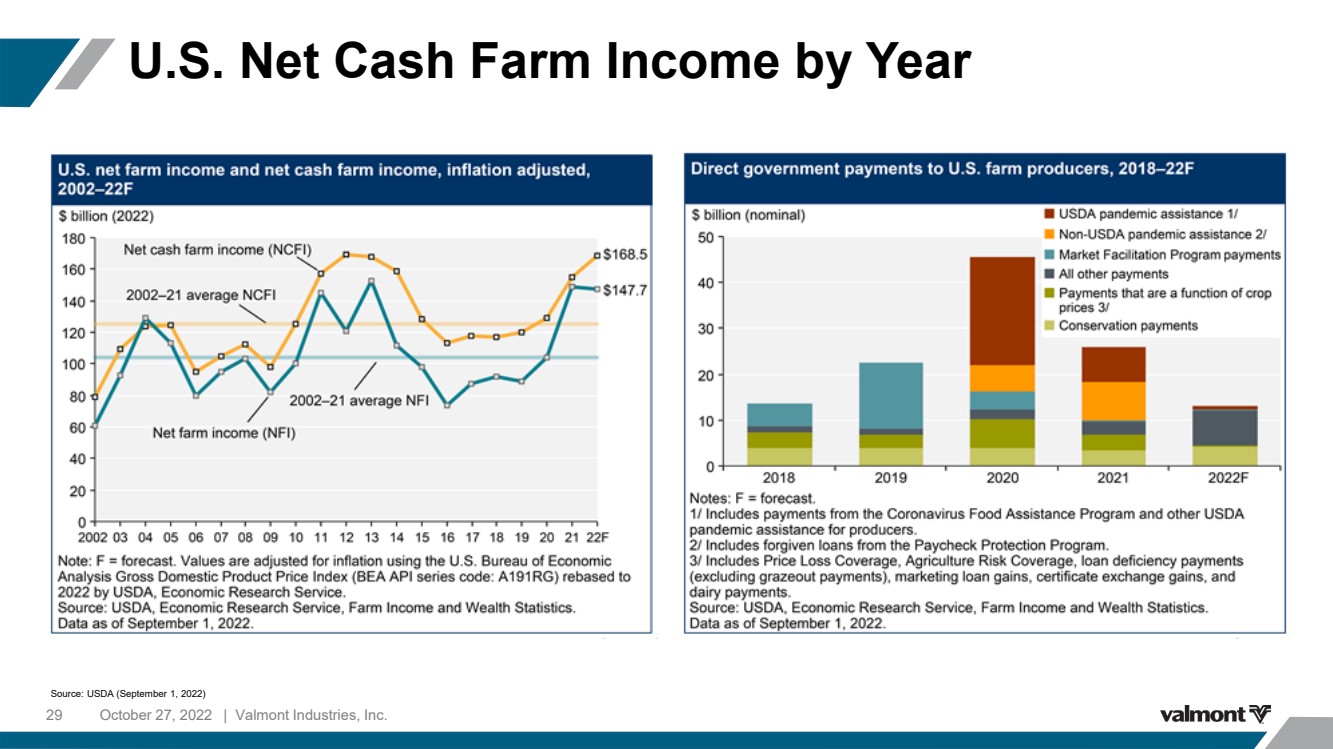
| October 27, 2022 | Valmont Industries, Inc. 29 U.S. Net Cash Farm Income by Year Source: USDA (September 1, 2022) |
| U.S. Drought Condition October 27, 2022 | Valmont Industries, Inc. 30 Source: Drought Monitor (October 20, 2022) |

| October 27, 2022 | Valmont Industries, Inc. 31 2012 - 2021 Historical Free Cash Flow 1 1 Adjusted earnings for purposes of calculating FCF conversion may not agree to the adjusted net earnings. The difference is du e to cash restructuring, debt refinancing, or other non - recurring expenses which were settled in cash in the year of occurrence. ($M) 2012 2013 2014 2015 2016 2017 2018 2019 2020 2021 Net cash flows from operating activities $ 197.1 $ 396.4 $ 174.1 $ 272.3 $ 232.8 $ 133.1 $ 153.0 $ 307.6 $ 316.3 $ 65.9 Net cash flows from investing activities (136.7) (131.7) (256.9) (48.2) (53.0) (49.6) (155.4) (168.1) (104.0) (417.3) Net cash flows from financing activities (16.4) (37.4) (136.8) (32.0) (95.2) (32.0) (162.1) (98.9) (173.8) 133.5 Net cash flows from operating activities $ 197.1 $ 396.4 $ 174.1 $ 272.3 $ 232.8 $ 133.1 $ 153.0 $ 307.6 $ 316.3 $ 65.9 Purchase of plant, property, and equipment (97.1) (106.8) (73.0) (45.5) (57.9) (55.3) (72.0) (97.4) (106.7) (107.8) Free Cash flows 100.0 289.7 101.1 226.8 174.9 77.8 81.0 210.2 209.6 (41.9) Net earnings attributed to Valmont Industries, Inc. $ 234.1 $ 278.5 $ 183.9 $ 40.1 $ 175.5 $ 120.5 $ 101.8 $ 146.4 $ 140.7 $ 195.6 Adjusted net earnings attributed to Valmont Industries, Inc. N/A $ 295.1 $ 187.7 $ 131.7 $ 139.9 $ 162.7 $ 130.4 N/A $ 159.8 $ 222.3 Free Cash Flow Conversion - GAAP 0.43 1.04 0.55 5.66 1.00 0.65 0.80 1.44 1.49 (0.21) Free Cash Flow Conversion - Adjusted N/A 0.98 0.53 1.71 1.25 0.48 0.62 N/A 1.31 (0.19) 1) Reconciliation of Net Earnings to Adjusted Figures Net earnings attributed to Valmont Industries, Inc. $ 234.1 $ 278.5 $ 183.9 $ 40.1 $ 175.5 $ 120.5 $ 101.8 $ 146.4 $ 140.7 $ 195.6 Change in valuation allowance against deferred tax assets - - - 7.1 (20.7) 41.9 - - - 5.0 Impairment of long - lived assets - 12.2 - 61.8 1.1 - 28.6 - 19.1 21.7 Reversal of contingent liability - - - (16.6) - - - - - Other non - recurring expenses (non - cash) - - - 18.1 - - - - Deconsolidation of Delta EMD, after - tax and NCI - 4.4 - - - - - - - - Noncash loss from Delta EMD shares - - 3.8 4.6 0.6 0.2 - - - - Adjusted net earnings attributed to Valmont Industries, Inc. $ 234.1 $ 295.1 $ 187.7 $ 131.7 $ 139.9 $ 162.7 $ 130.4 $ 146.4 $ 159.8 $ 222.3 10 Year Average FCF is $143M; Last 5 Years Has Averaged $107M |

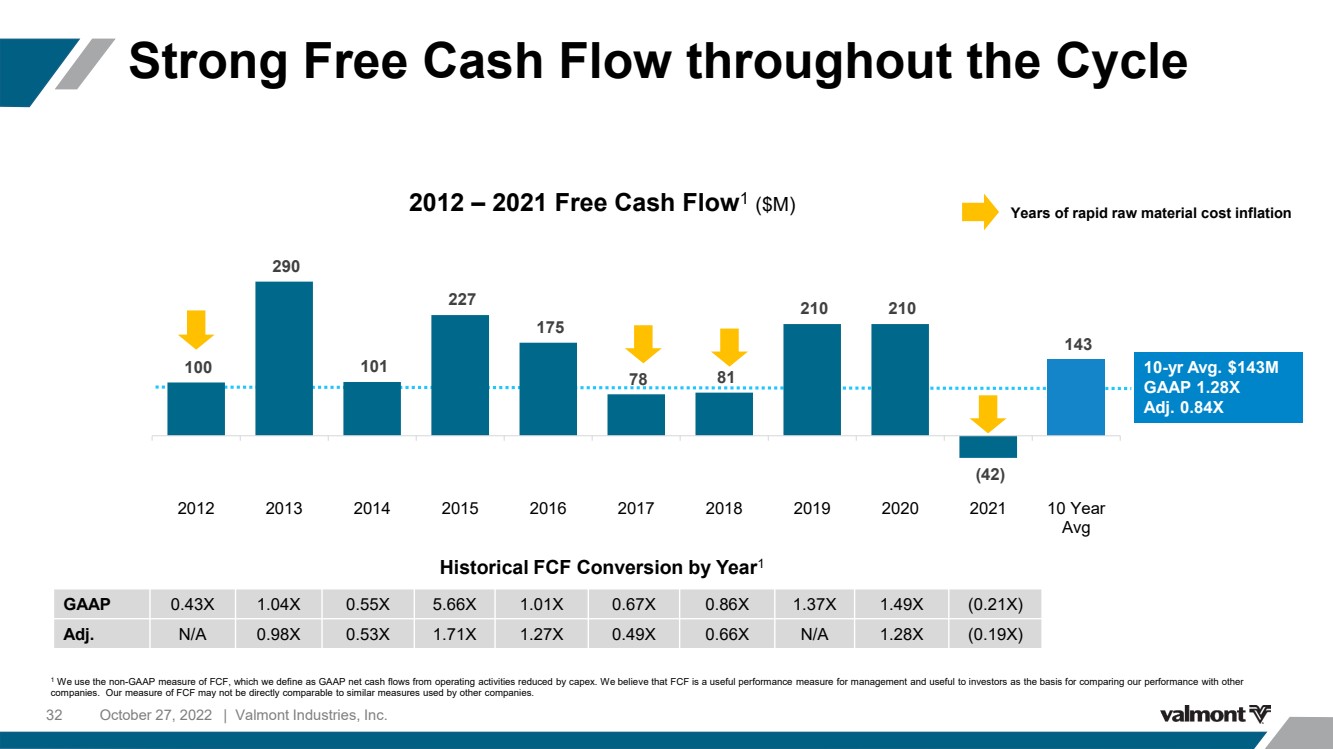
| October 27, 2022 | Valmont Industries, Inc. 32 Years of rapid raw material cost inflation GAAP 0.43X 1.04X 0.55X 5.66X 1.01X 0.67X 0.86X 1.37X 1.49X (0.21X) Adj. N/A 0.98X 0.53X 1.71X 1.27X 0.49X 0.66X N/A 1.28X (0.19X) 2012 – 2021 Free Cash Flow 1 ($M) 100 290 101 227 175 78 81 210 210 (42) 143 (100) (50) - 50 100 150 200 250 300 350 2012 2013 2014 2015 2016 2017 2018 2019 2020 2021 10 Year Avg 10 - yr Avg. $143M GAAP 1.28X Adj. 0.84X Historical FCF Conversion by Year 1 Strong Free Cash Flow throughout the Cycle 1 We use the non - GAAP measure of FCF, which we define as GAAP net cash flows from operating activities reduced by capex. We belie ve that FCF is a useful performance measure for management and useful to investors as the basis for comparing our performance wi th other companies. Our measure of FCF may not be directly comparable to similar measures used by other companies. |
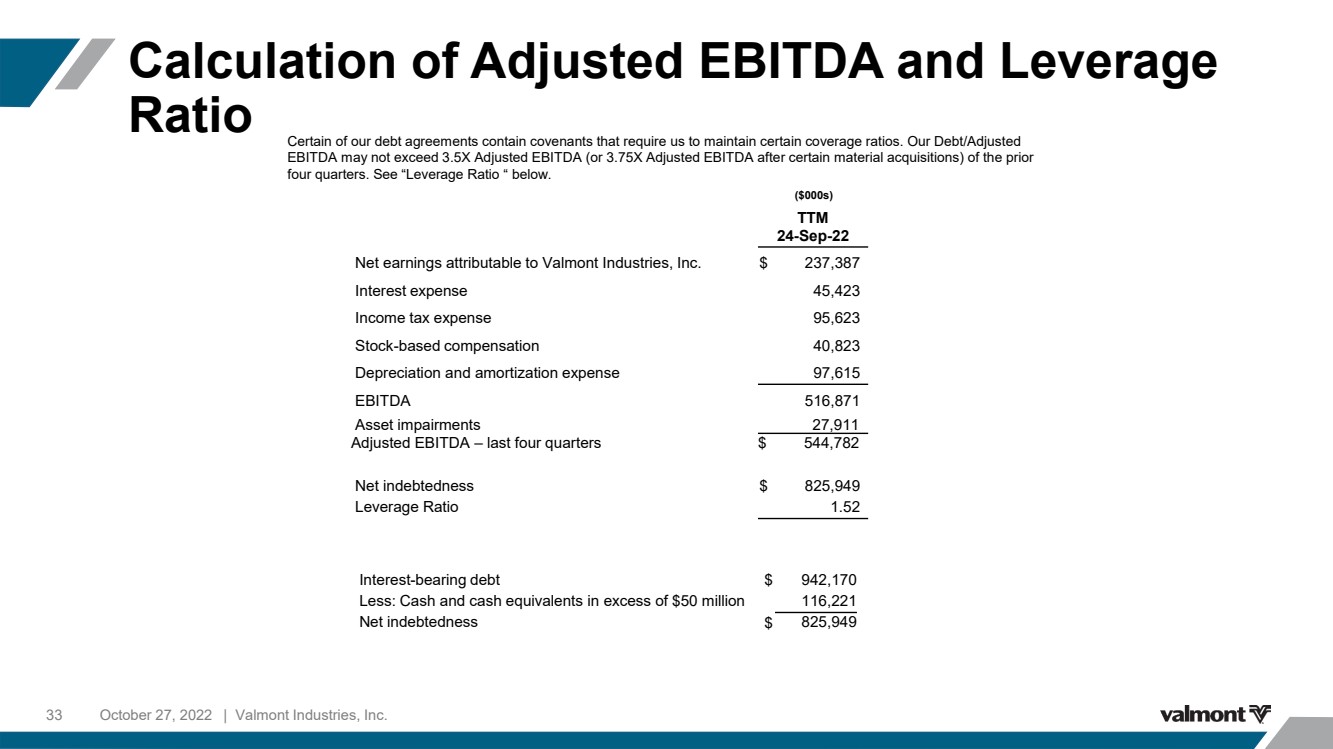
| October 27, 2022 | Valmont Industries, Inc. 33 Calculation of Adjusted EBITDA and Leverage Ratio Certain of our debt agreements contain covenants that require us to maintain certain coverage ratios. Our Debt/Adjusted EBITDA may not exceed 3.5X Adjusted EBITDA (or 3.75X Adjusted EBITDA after certain material acquisitions) of the prior four quarters. See “Leverage Ratio “ below. TTM 2 4 - Sep - 22 Net earnings attributable to Valmont Industries, Inc. $ 237,387 Interest expense 45,423 Income tax expense 95,623 Stock - based compensation 40,823 Depreciation and amortization expense 97,615 EBITDA 516,871 Asset impairments 27,911 Adjusted EBITDA – last four quarters $ 544,782 Net indebtedness $ 825,949 Leverage Ratio 1.52 Interest - bearing debt $ 942,170 Less: Cash and cash equivalents in excess of $50 million 116,221 Net indebtedness $ 825,949 ($000s) |