| News Release | For Immediate Release |
| | |
Contact: Jeff Laudin | July 20, 2016 |
Phone: 402-963-1158 | |
Fax: 402-963-1198 | |
| | |
| | |
Valmont Reports Second Quarter 2016 Earnings
Omaha, NE - Valmont Industries, Inc. (NYSE: VMI), a leading global provider of engineered products and services for infrastructure development and mechanized irrigation equipment and services for agriculture, today reported second quarter results.
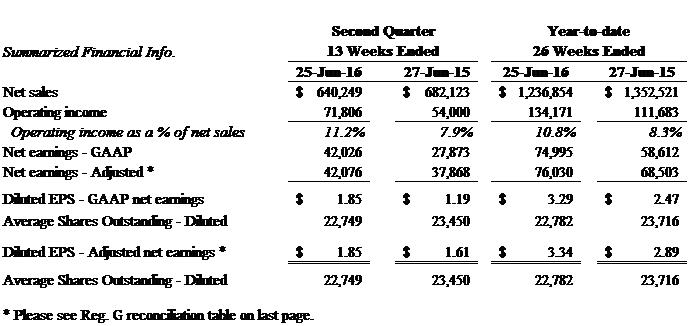
| · | Revenues of $640.2 million were down 6% year-over-year, primarily reflecting lower irrigation equipment and international utility sales, and $10 million of foreign exchange translation effects. |
| · | Operating income rose to $71.8 million, or 33%, (5% excluding 2015 restructuring) benefitting from the restructuring and further cost reductions this year and was 11.2% of net sales compared to 7.9% in 2015, (10.0% excluding restructuring). |
| · | Diluted EPS were $1.85 compared to $1.19 in 2015 ($1.61 when restructuring expenses are excluded). |
| · | During the third quarter, the Company will further restructure its Australia operations, consolidating certain Energy and Mining, and Coatings facilities, plus reduce other SG&A costs. Restructuring charges are estimated to be $4.7 million, mostly cash. The benefit of the restructuring are expected to approximate $5.0 million and should be recovered through lower operating costs in 2017. |
| · | The Company repurchased 92,000 shares for $11.7 million during the quarter; $153 million remains on the current authorization. |
| · | The Company is reaffirming 2016 annual guidance of diluted EPS between $6.31 and $6.49. |
“Net earnings improved meaningfully on lower revenues reflecting the positive impact of last year’s restructuring and further cost reduction initiatives implemented this year more than offsetting the weakness in the irrigation business,” said Mogens C. Bay, Valmont’s Chairman and Chief Executive Officer.
“Ongoing reviews of our cost structure identified opportunities to reduce costs in Australia. This will result in a mostly cash restructuring charge, estimated to be $4.7 million over the remainder of the year. Restructuring activities will affect the Energy and Mining and Coatings Segments. The primary activities will be the consolidation and closure of a few facilities, and headcount reductions.”
Second Quarter Segment Review
Infrastructure-related
Engineered Support Structures (32% of Sales)
Poles, towers and components for the global lighting, traffic and wireless communication markets, and highway safety products.
Sales of $203.9 million were slightly higher than last year mainly due to increased telecommunication structure sales in the Asia-Pacific region.
In North America, sales of lighting and traffic products were comparable to last year while wireless communication products sales were lower.
In Europe, lighting and traffic structure sales declined modestly reflecting continued spending restraint for infrastructure projects.
Operating income was $21.0 million or 10.3% of sales compared to $16.2 million, ($19.3 million adjusted for restructuring), in the prior-year period, driven by the positive impacts of last year’s restructuring, and lower raw material costs that more than offset a less favorable sales mix.
Utility Support Structures (24% of Sales)
Steel and concrete structures for the global electric utility industry.
Sales of $151.2 million decreased 7% year-over-year, largely a result of contractual price reductions tied to lower steel costs (de-escalation clauses), but volume increased. The overall market environment remains attractive, with demand continuing to be driven by reliability standards and increased renewable energy projects. Market pricing remains competitive.
Operating income was $17.5 million or 11.6% of sales compared to $10.4 million ($12.9 million adjusted for restructuring) in the prior-year period, reflecting the positive impact of ongoing operational improvements and restructuring.
Coatings Segment (12% of Sales)
Global galvanizing, painting and anodizing services.
Sales of $75.3 million were essentially flat with last year. The positive impact of the acquisition of American Galvanizing last year mostly offset lower sales in the Asia-Pacific region.
Operating income was $14.0 million, or 18.6% of sales, compared to $7.9 million ($12.6 million adjusted for restructuring), in the prior-year period.
Energy and Mining Segment (13% of Sales)
Offshore structures, engineered access systems and grinding media.
Sales of $80.7 million were 6.5% lower than last year due to reduced sales of access systems and grinding media products partially offset by increased sales of wind tower products. Continued weakness in the oil and gas markets led to lower offshore structure and access systems sales into those markets.
Operating income was $3.3 million or 4.1% of sales compared to $2.7 million ($4.2 million adjusted for restructuring), in the prior-year period. Last year’s restructuring helped mitigate the impact of weaker access systems markets on operating performance.
Agriculture-related
Irrigation Segment (24% of Sales)
Agricultural irrigation equipment, parts, services and tubular products.
Sales of $152.3 million were down 12% due to lower North America irrigation equipment and tubing sales. Irrigation equipment sales in North America were muted by restrained capital investment by growers facing forecasts of further pressure on net farm income. Given a declining sales environment, industry pricing was competitive although relatively disciplined, its impact mitigated by lower average input costs. International irrigation equipment sales were comparable to last year despite unfavorable currency translation effects. The international irrigation business benefited from Valmont’s geographic diversification, supporting the business.
Tubing sales fell despite recent firmness in steel prices. In the past, steel inflation has led to higher tubing sales. This year, declines reflected customer wariness over short-term steel price volatility.
Operating income fell 13% to $27.8 million impacted by the lower volumes. Operating income as a percent of sales of 18.2% was similar to last year despite lower revenue, due to cost management and lower input costs.
Outlook:
“We do not expect a significant short-term improvement in our end markets, and we see continued downward pressure in the irrigation market,” Mr. Bay said. “With steel being a major input cost, our guidance of earnings per-share between $6.31 and $6.49 in 2016 takes into account some margin pressure in the second half, particularly in the Engineered Support Structures Segment, and assumes stable steel prices for the remainder of the year.”
“Our goal of improving earnings in a challenging environment is showing results. Looking forward, we are investing in new products, opening new markets and pursuing acquisitions to drive future profitable growth in our infrastructure and agricultural markets.”
“Long-term, our outlook is quite positive due to the strong inherent drivers in infrastructure and agriculture markets.”
An audio discussion of Valmont’s second quarter results will be available live by
Telephone by dialing 1-877-493-2981 and entering Conference ID#:15297367 or via Webcast at 8:00 a.m. CDT July 21, 2016 at https://engage.vevent.com/rt/valmontindustries_ao~15297367. A replay is available through the above link or by telephone (877-493-2981 or 404-537-3406, Conference ID#:15297367) beginning July 21, 2016 at 10:00 a.m. CDT through 12:00 p.m. CDT on July 28, 2016. The Company’s slide presentation for the call will be simultaneously available on the investor relations tab at www.valmont.com under Investor Relations.
Valmont is a global leader, designing and manufacturing highly engineered products that support global infrastructure development and agricultural productivity. Its products for infrastructure serve highway, transportation, wireless communication, electric transmission, and industrial construction and energy markets. Its mechanized irrigation equipment for large scale agriculture improves farm productivity while conserving fresh water resources. In addition, Valmont provides coatings services that protect against corrosion and improve the service lives of steel and other metal products.
This release contains forward-looking statements, within the meaning of the Private Securities Litigation Reform Act of 1995. These forward-looking statements are based on assumptions that management has made in light of experience in the industries in which Valmont operates, as well as management’s perceptions of historical trends, current conditions, expected future developments and other factors believed to be appropriate under the circumstances. As you read and consider this release, you should understand that these statements are not guarantees of performance or results. They involve risks, uncertainties (some of which are beyond Valmont’s control) and assumptions. Although management believes that these forward-looking statements are based on reasonable assumptions, you should be aware that many factors could affect Valmont’s actual financial results and cause them to differ materially from those anticipated in the forward-looking statements. These factors include among other things, risk factors described from time to time in Valmont’s reports to the Securities and Exchange Commission, as well as future economic and market circumstances, industry conditions, company performance and financial results, operating efficiencies, availability and price of raw material, availability and market acceptance of new products, product pricing, domestic and international competitive environments, and actions and policy changes of domestic and foreign governments. The Company cautions that any forward-looking statement included in this press release is made as of the date of this press release and the Company does not undertake to update any forward-looking statement.
| VALMONT INDUSTRIES, INC. AND SUBSIDIARIES |
| CONDENSED CONSOLIDATED STATEMENTS OF EARNINGS |
| (Dollars in thousands, except per share amounts) |
| (unaudited) |
| | | | | |
| | | Second Quarter
13 Weeks Ended | | Year-to-Date
26 Weeks Ended |
| | | 25-Jun-16 | | 27-Jun-15 | | 25-Jun-16 | | 27-Jun-15 |
| Net sales | | $ 640,249 | | $ 682,123 | | $ 1,236,854 | | $ 1,352,521 |
| Cost of sales | | 465,132 | | 512,575 | | 900,768 | | 1,017,519 |
| Gross profit | | 175,117 | | 169,548 | | 336,086 | | 335,002 |
| Selling, general and administrative expenses | | 103,311 | | 115,548 | | 201,915 | | 223,319 |
| Operating income | | 71,806 | | 54,000 | | 134,171 | | 111,683 |
| Other income (expense) | | | | | | | | |
| Interest expense | | (11,122) | | (11,232) | | (22,176) | | (22,360) |
| Interest income | | 707 | | 616 | | 1,518 | | 1,490 |
| Other | | 1,252 | | (28) | | (426) | | 988 |
| | | (9,163) | | (10,644) | | (21,084) | | (19,882) |
| Earnings before income taxes and equity in earnings of nonconsolidated subsidiaries | | 62,643 | | 43,356 | | 113,087 | | 91,801 |
| | | | | | | | |
| Income tax expense | | 19,201 | | 13,917 | | 35,474 | | 30,855 |
| Net earnings | | 43,442 | | 29,439 | | 77,613 | | 60,946 |
| Less: Earnings attributable to non-controlling interests | | (1,416) | | (1,566) | | (2,618) | | (2,334) |
| Net earnings attributable to Valmont Industries, Inc. | | $ 42,026 | | $ 27,873 | | $ 74,995 | | $ 58,612 |
| | | | | | | | | |
| | | | | | | | | |
| Average shares outstanding (000's) - Basic | | 22,602 | | 23,336 | | 22,651 | | 23,602 |
| Earnings per share - Basic | | $ 1.86 | | $ 1.19 | | $ 3.31 | | $ 2.48 |
| | | | | | | | | |
| Average shares outstanding (000's) - Diluted | | 22,749 | | 23,450 | | 22,782 | | 23,716 |
| Earnings per share - Diluted | | $ 1.85 | | $ 1.19 | | $ 3.29 | | $ 2.47 |
| | | | | | | | | |
| Cash dividends per share | | $ 0.375 | | $ 0.375 | | $ 0.750 | | $ 0.750 |
| | | | | | | | | |
| VALMONT INDUSTRIES, INC. AND SUBSIDIARIES |
| SUMMARY OPERATING RESULTS |
| (Dollars in thousands) |
| (unaudited) |
| | | | | |
| | | Second Quarter
13 Weeks Ended | | Year-to-Date
26 Weeks Ended |
| | | 25-Jun-16 | | 27-Jun-15 | | 25-Jun-16 | | 27-Jun-15 |
| | | | | | | | | |
| Net sales | | | | | | | | |
| Engineered Support Structures | | $ 203,916 | | $ 200,756 | | $ 380,887 | | $ 378,660 |
| Utility Support Structures | | 151,245 | | 162,929 | | 295,765 | | 339,270 |
| Energy and Mining | | 80,692 | | 86,302 | | 153,141 | | 174,363 |
| Coatings | | 75,298 | | 76,093 | | 143,879 | | 150,453 |
| Infrastructure products | | 511,151 | | 526,080 | | 973,672 | | 1,042,746 |
| | | | | | | | | |
| Irrigation | | 152,252 | | 173,303 | | 310,766 | | 347,880 |
| Other | | - | | 2,342 | | - | | 4,511 |
| Less: Intersegment sales | | (23,154) | | (19,602) | | (47,584) | | (42,616) |
| Total | | $ 640,249 | | $ 682,123 | | $ 1,236,854 | | $ 1,352,521 |
| | | | | | | | | |
| Operating Income | | | | | | | | |
| Engineered Support Structures | | $ 20,968 | | $ 16,219 | | $ 35,176 | | $ 25,669 |
| Utility Support Structures | | 17,528 | | 10,399 | | 32,296 | | 25,756 |
| Energy and Mining | | 3,341 | | 2,698 | | 5,243 | | 7,064 |
| Coatings | | 14,023 | | 7,862 | | 25,436 | | 18,861 |
| Infrastructure products | | 55,860 | | 37,178 | | 98,151 | | 77,350 |
| | | | | | | | | |
| Irrigation | | 27,763 | | 31,865 | | 56,608 | | 62,039 |
| Other | | - | | (1,271) | | - | | (2,379) |
| Corporate | | (11,817) | | (13,772) | | (20,588) | | (25,327) |
| Total | | $ 71,806 | | $ 54,000 | | $ 134,171 | | $ 111,683 |
| | | | | | | | | |
| | | | | | | | | |
| | | | | | | | | |
Valmont has aggregated its business segments into five global reportable segments as follows.
Engineered Support Structures: This segment consists of the manufacture of engineered metal structures and components for lighting and traffic, wireless communication, and roadway safety.
Utility Support Structures: This segment consists of the manufacture of engineered steel and concrete structures for the utility industry.
Energy and Mining: This segment includes the manufacture of access systems applications, forged steel grinding media, and offshore oil and gas and wind energy structures.
Coatings: This segment consists of galvanizing, painting and anodizing services.
Irrigation: This segment consists of the manufacture of agricultural irrigation equipment and related parts and services for the agricultural industry and tubular products for industrial customers.
| VALMONT INDUSTRIES, INC. AND SUBSIDIARIES |
| CONDENSED CONSOLIDATED BALANCE SHEETS |
| (Dollars in thousands) |
| (unaudited) |
| | | | | |
| | | 25-Jun-16 | | 27-Jun-15 |
ASSETS | | | | |
| Current assets: | | | | |
| Cash and cash equivalents | | $ 344,346 | | $ 317,523 |
| Accounts receivable, net | | 469,674 | | 491,706 |
| Inventories | | 372,106 | | 379,897 |
| Prepaid expenses | | 60,725 | | 56,653 |
| Refundable and deferred income taxes | | 20,441 | | 44,072 |
| Total current assets | | 1,267,292 | | 1,289,851 |
| Property, plant and equipment, net | | 526,347 | | 570,977 |
| Goodwill and other assets | | 602,234 | | 706,564 |
| | | $ 2,395,873 | | $ 2,567,392 |
| | | | | |
LIABILITIES AND SHAREHOLDERS' EQUITY | | | | |
| Current liabilities: | | | | |
| Current installments of long-term debt | | $ 889 | | $ 1,096 |
| Notes payable to banks | | 3,735 | | 7,914 |
| Accounts payable | | 183,126 | | 186,421 |
| Accrued expenses | | 161,784 | | 165,138 |
| Dividend payable | | 8,505 | | 8,733 |
| Total current liabilities | | 358,039 | | 369,302 |
| Long-term debt, excluding current installments | | 756,543 | | 765,272 |
| Other long-term liabilities | | 287,120 | | 292,225 |
| Shareholders' equity | | 994,171 | | 1,140,593 |
| | | $ 2,395,873 | | $ 2,567,392 |
| | | | | |
| CONDENSED CONSOLIDATED STATEMENTS OF CASH FLOWS |
| (Dollars in thousands) and unaudited |
| | | YTD | | YTD |
Cash flows from operating activities | | 25-Jun-16 | | 27-Jun-15 |
| Net Earnings | | $ 77,613 | | $ 60,946 |
| Depreciation and amortization | | 40,804 | | 47,761 |
| Contribution to defined benefit pension plan | | (712) | | (15,735) |
| Change in working capital | | (33,615) | | 7,804 |
| Other | | 9,484 | | 17,569 |
| Net cash flows from operating activities | | 93,574 | | 118,345 |
| | | | | |
Cash flows from investing activities | | | | |
| Purchase of property, plant, and equipment | | (26,019) | | (24,758) |
| Increase in restricted cash - pension plan | | (13,652) | | - |
| Other | | 219 | | 6,997 |
| Net cash flows from investing activities | | (39,452) | | (17,761) |
| | | | | |
Cash flows from financing activities | | | | |
| Net borrowings on short and long-term agreements | | 1,934 | | (6,547) |
| Purchase of treasury shares | | (28,621) | | (121,020) |
| Purchase of noncontrolling interest | | (11,009) | | - |
| Dividends paid | | (17,098) | | (17,956) |
| Other | | 2,599 | | (1,311) |
| Net cash flows from financing activities | | (52,195) | | (146,834) |
| Effect of exchange rates on cash and cash equivalents | | (6,655) | | (7,806) |
| Net change in cash and cash equivalents | | (4,728) | | (54,056) |
| Cash and cash equivalents - beginning of year | | 349,074 | | 371,579 |
| Cash and cash equivalents - end of period | | $ 344,346 | | $ 317,523 |
| | | | | |
VALMONT INDUSTRIES, INC. AND SUBSIDIARIES
SUMMARY OF EFFECT OF SIGNIFICANT NON-RECURRING ITEMS ON REPORTED RESULTS
REGULATION G RECONCILIATION |
| (Dollars in thousands, except per share amounts) |
| (unaudited) |
| The non-GAAP tables below disclose the impact on (a) diluted earnings per share of (1) restructuring costs, and (2) the non-cash after-tax loss or gain associated with adjusting the fair value of Delta EMD Pty. Ltd (Delta EMD) shares owned to its quoted market price at June 25, 2016 and June 27, 2015, (b) operating income of restructuring costs, and (c) segment operating income of restructuring costs. Amounts may be impacted by rounding. We believe it is useful when considering company performance for the non-GAAP adjusted net earnings and operating income to be taken into consideration by management and investors with the related reported GAAP measures. |
| | | | | | | | | |
| | | Second Quarter Ended June 25, 2016 | | Diluted earnings per share | | Year-to-Date June 25, 2016 | | Diluted earnings per share |
| Net earnings attributable to Valmont Industries, Inc. - as reported | | $ 42,026 | | $ 1.85 | | $ 74,995 | | $ 3.29 |
| | | | | | | | | |
| Fair market value adjustment, Delta EMD - after-tax | | 50 | | - | | 1,035 | | 0.05 |
| | | | | | | | | |
| Net earnings attributable to Valmont Industries, Inc. - Adjusted | | $ 42,076 | | $ 1.85 | | $ 76,030 | | $ 3.34 |
| Average shares outstanding (000's) - Diluted | | | | 22,749 | | | | 22,782 |
| | | | | | | | | |
| | | Second Quarter Ended June 27, 2015 | | Diluted earnings per share | | Year-to-Date June 27, 2015 | | Diluted earnings per share |
| Net earnings attributable to Valmont Industries, Inc. - as reported | | $ 27,873 | | $ 1.19 | | $ 58,612 | | $ 2.47 |
| | | | | | | | | |
| Restructuring expenses - after tax | | 9,828 | | 0.42 | | 10,324 | | 0.44 |
| | | | | | | | | |
| Fair market value adjustment, Delta EMD - after-tax | | 167 | | 0.01 | | (433) | | (0.02) |
| | | | | | | | | |
| Net earnings attributable to Valmont Industries, Inc. - Adjusted | | $ 37,868 | | $ 1.61 | | $ 68,503 | | 2.89 |
| Average shares outstanding (000's) - Diluted | | | | 23,450 | | | | 23,716 |
| | | | | | | | | |
Operating Income Reconciliation | | Second Quarter Ended June 25, 2016 | | Operating Income as a % of Sales | | Second Quarter Ended
June 27, 2015 | | Operating Income as a % of Sales |
| Operating income - as reported | | $ 71,806 | | 11.2% | | $ 54,000 | | 7.9% |
| | | | | | | | | |
| Restructuring expenses - before tax | | - | | | | 14,273 | | |
| | | | | | | | | |
| Adjusted Operating Income | | $ 71,806 | | 11.2% | | $ 68,273 | | 10.0% |
| Net Sales | | $ 640,249 | | | | $ 682,123 | | |
| | | | | | | | | |
| | | For the Second Quarter Ended June 25, 2016 |
Segment Operating Income Reconciliation | Engineered Support Structures | Energy and Mining | | Utility Support Structures | | Coatings | | Irrigation | | Other/ Corporate |
| | | | | | | | | | | |
| Operating income - as reported | $ 20,968 | $ 3,341 | | $ 17,528 | | $ 14,023 | | $ 27,763 | | $ (11,817) |
| | | | | | | | | | | |
| Net Sales | $ 203,916 | $ 80,692 | | $ 151,245 | | $ 75,298 | | $ 152,252 | | |
| | | | | | | | | | | |
| Operating Income as a % of Sales | 10.3% | 4.1% | | 11.6% | | 18.6% | | 18.2% | | |
| | | | | | | | | | | |
| | | For the Second Quarter Ended June 27, 2015 |
Segment Operating Income Reconciliation | Engineered Support Structures | Energy and Mining | | Utility Support Structures | | Coatings | | Irrigation | | Other/ Corporate |
| | | | | | | | | | | |
| Operating income - as reported | $ 16,219 | $ 2,698 | | $ 10,399 | | $ 7,862 | | $ 31,865 | | $ (15,043) |
| | | | | | | | | | | |
| Restructuring expenses - before tax | 3,029 | 1,541 | | 2,455 | | 4,769 | | 349 | | �� 2,130 |
| | | | | | | | | | | |
| Adjusted Operating Income | $ 19,248 | $ 4,239 | | $ 12,854 | | $ 12,631 | | $ 32,214 | | $ (12,913) |
| | | | | | | | | | | |
| Net Sales | $ 200,756 | 86,302 | | 162,929 | | 76,093 | | 173,303 | | |
| | | | | | | | | | | |
| Operating Income as a % of Sales | 8.1% | 3.1% | | 6.4% | | 10.3% | | 18.4% | | |
| | | | | | | | | | | |
| Adjusted Operating Income as a % of Sales | 9.6% | 4.9% | | 7.9% | | 16.6% | | 18.6% | | |
| | | | | | | | | | | |