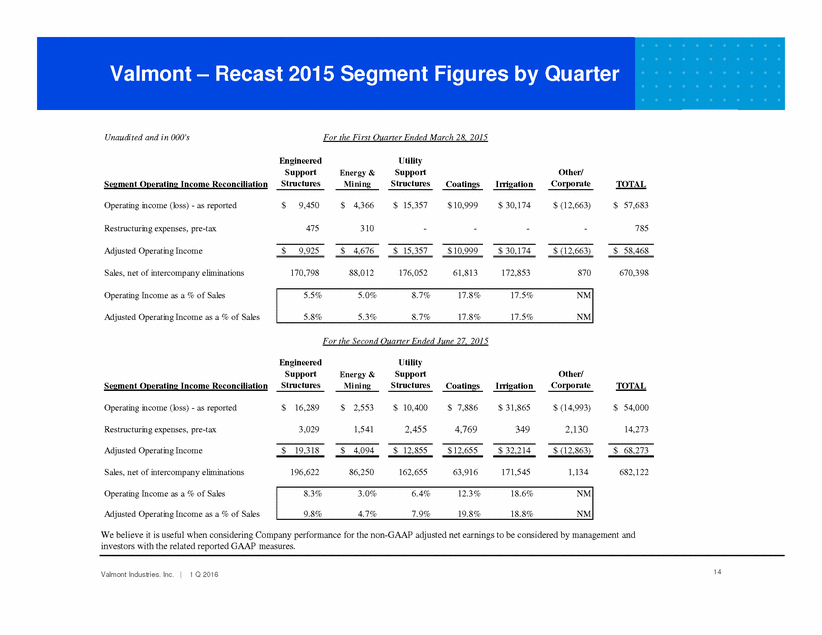
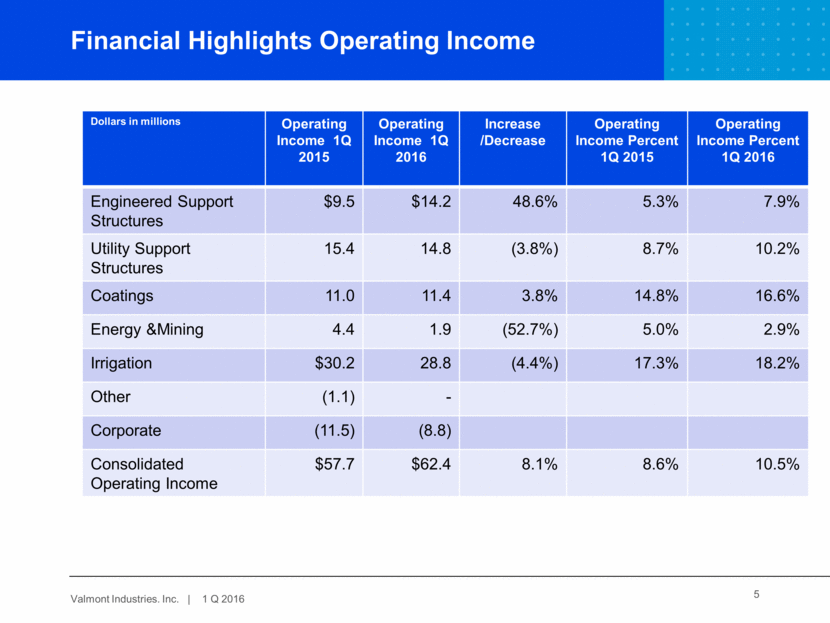
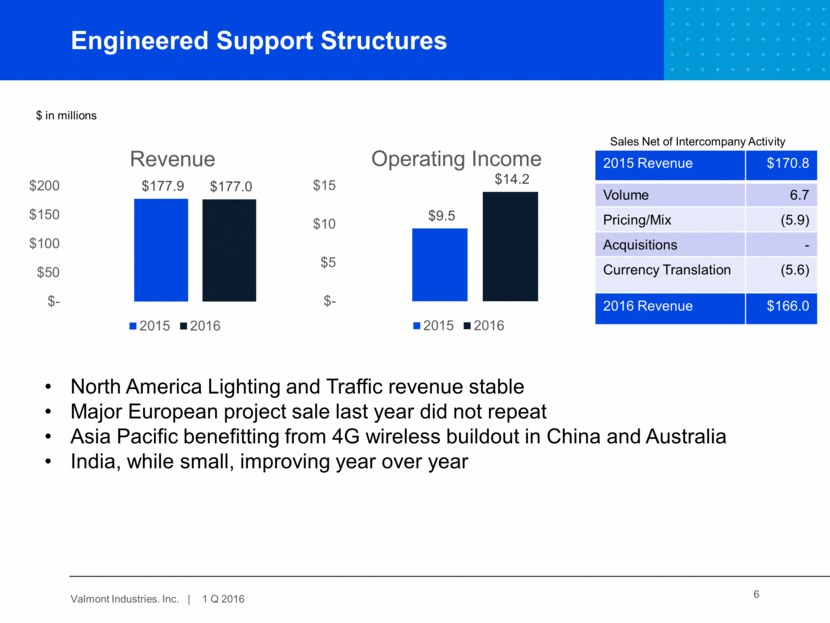
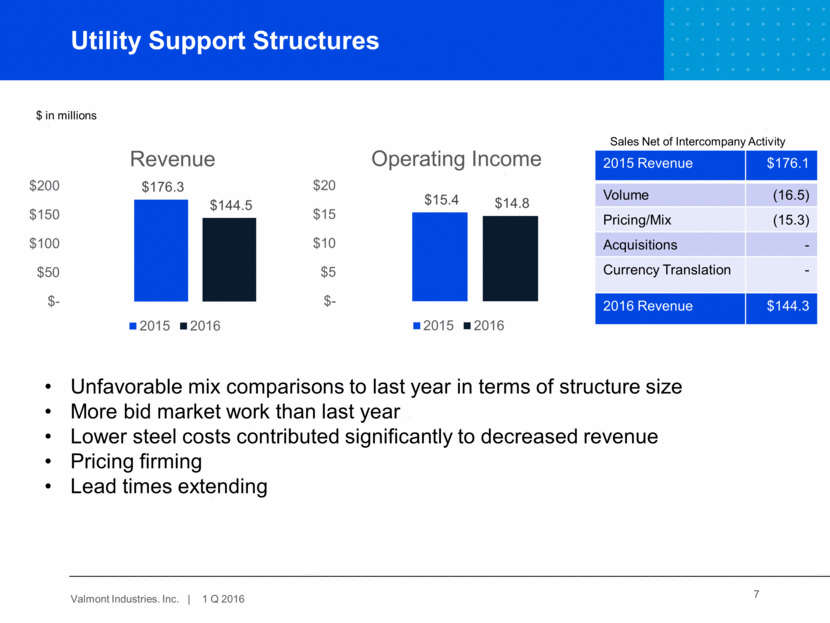
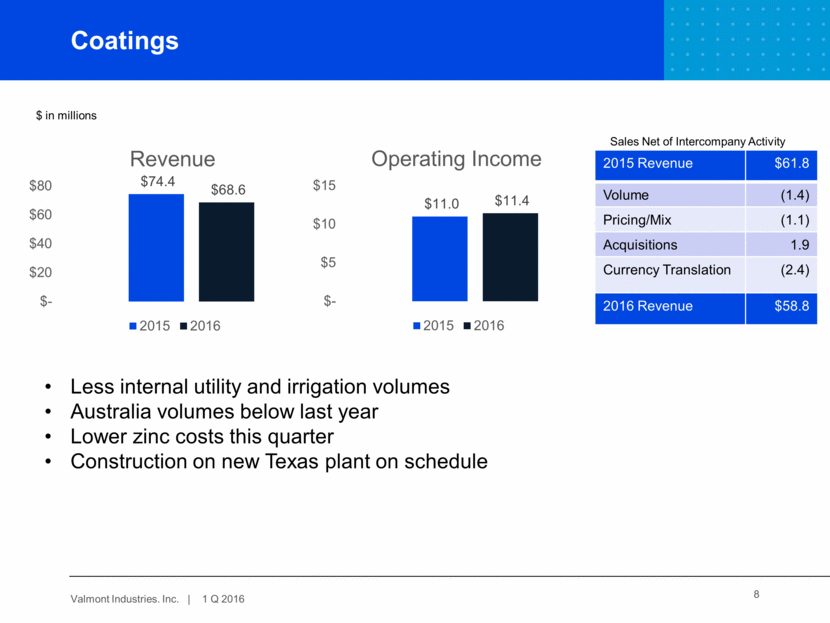
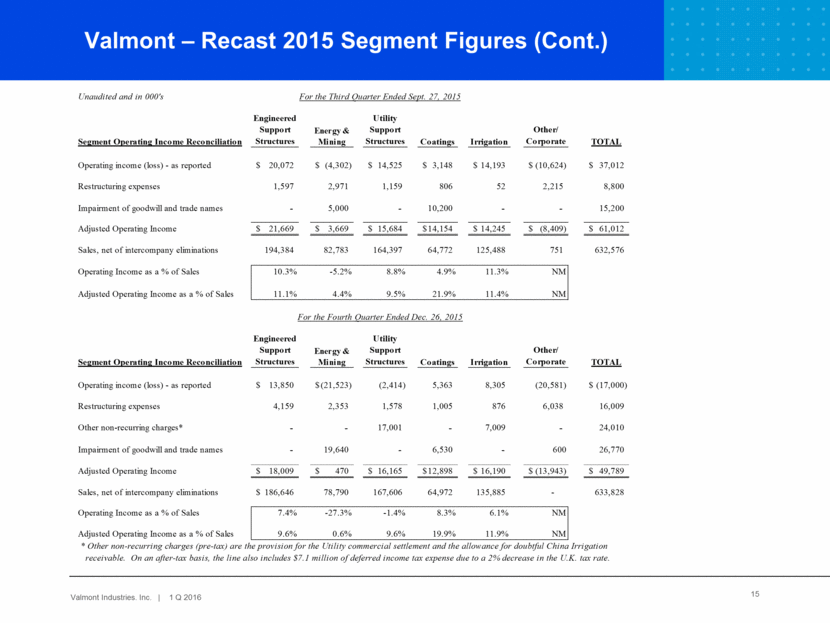
Unaudited and in 000's For the Fi rst Quarter Ended March 28, 2015 Engineered Support Structures Utility Support Structures Other/ Corporate Energy & Mi ni ng Segment Operating Inco me Reco nciliatio n Co atings Irrigatio n TOTAL Operating income (loss) - as reported $ 9,450 $ 4,366 $ 15,357 $ 10,999 $ 30,174 $ (12,663) $ 57,683 Restructuring expenses, pre-tax 475 310 - - - - 785 Adjusted Operating Income $ 9,925 $ 4,676 $ 15,357 $ 10,999 $ 30,174 $ (12,663) $ 58,468 Sales, net of intercompany eliminations 170,798 88,012 176,052 61,813 172,853 870 670,398 Operating Income as a % of Sales Adjusted Operating Income as a % of Sales For the Second Quarter Ended June 27, 2015 Engineered Support Structures Utility Support Structures Other/ Corporate Energy & Mi ni ng Segment Operating Inco me Reco nciliatio n Co atings Irrigatio n TOTAL Operating income (loss) - as reported $ 16,289 $ 2,553 $ 10,400 $ 7,886 $ 31,865 $ (14,993) $ 54,000 Restructuring expenses, pre-tax 3,029 1,541 2,455 4,769 349 2,130 14,273 Adjusted Operating Income $ 19,318 $ 4,094 $ 12,855 $ 12,655 $ 32,214 $ (12,863) $ 68,273 Sales, net of intercompany eliminations 196,622 86,250 162,655 63,916 171,545 1,134 682,122 Operating Income as a % of Sales Adjusted Operating Income as a % of Sales We believe it is useful when considering Company performance for the non-GAAP adjusted net earnings to be considered by management and investors with the related reported GAAP measures. 14 Valmont Industries. Inc. | 1 Q 2016 8.3% 3.0% 6.4% 12.3% 18.6% NM 9.8% 4.7% 7.9% 19.8% 18.8% NM 5.5% 5.0% 8.7% 17.8% 17.5% NM 5.8% 5.3% 8.7% 17.8% 17.5% NM Valmont – Recast 2015 Segment Figures by Quarter
