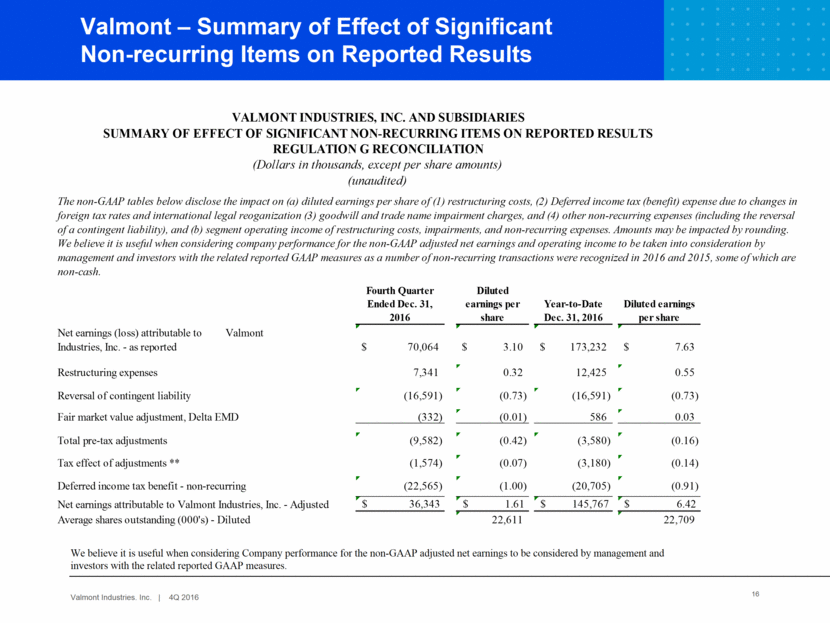
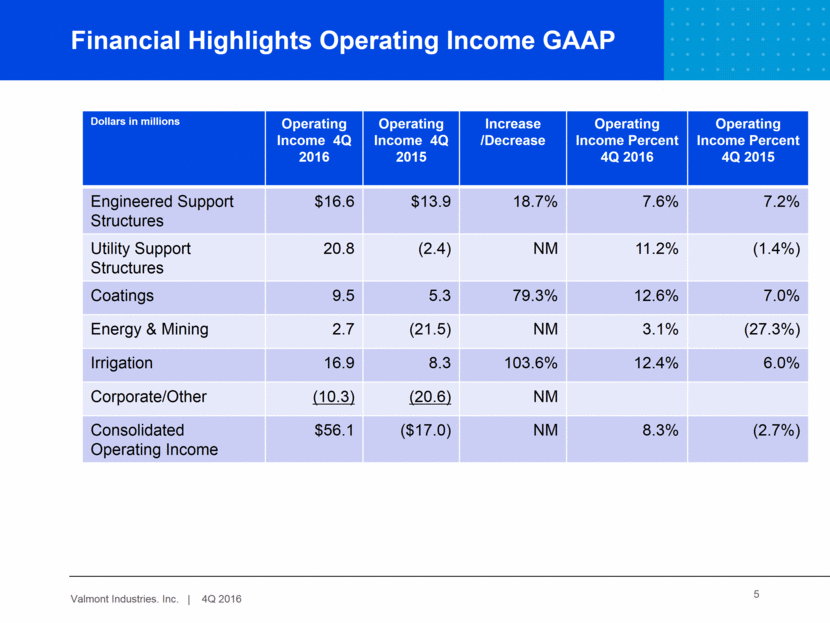
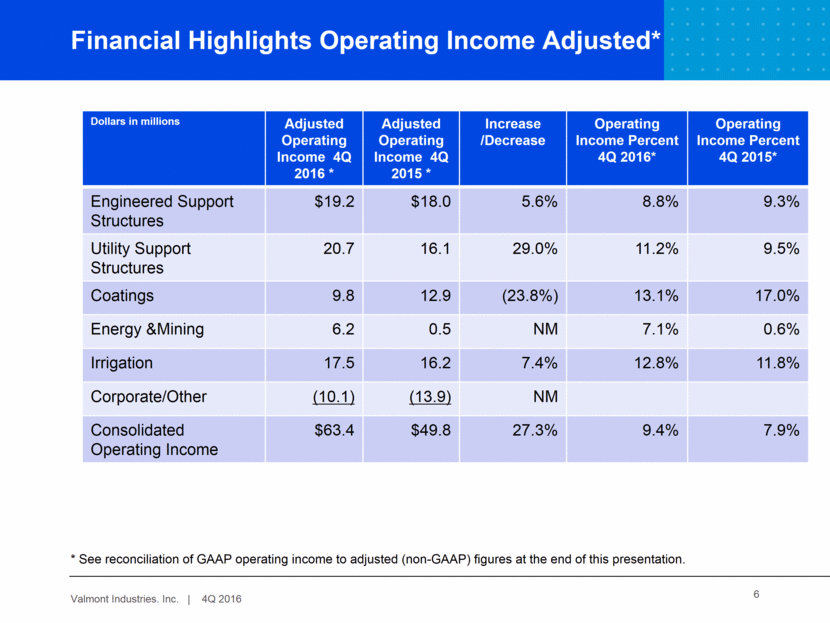
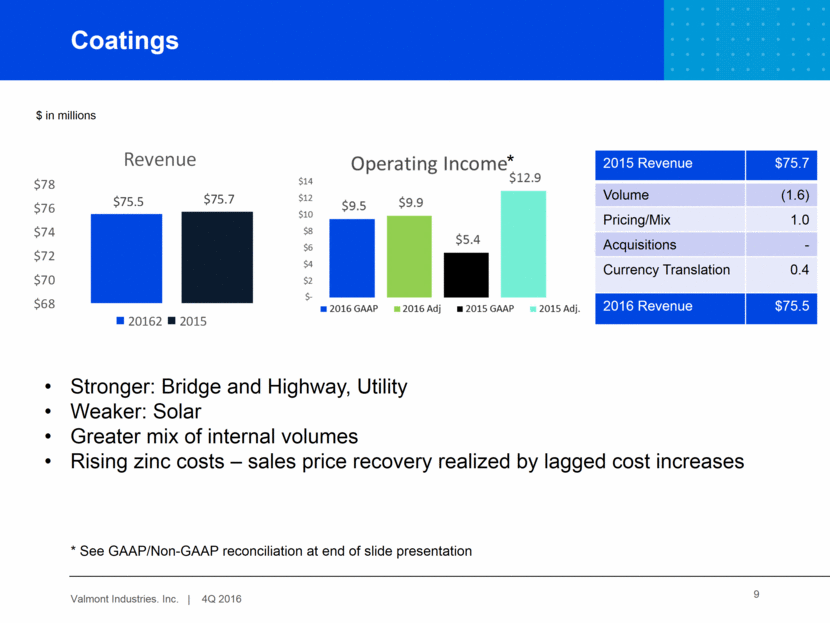
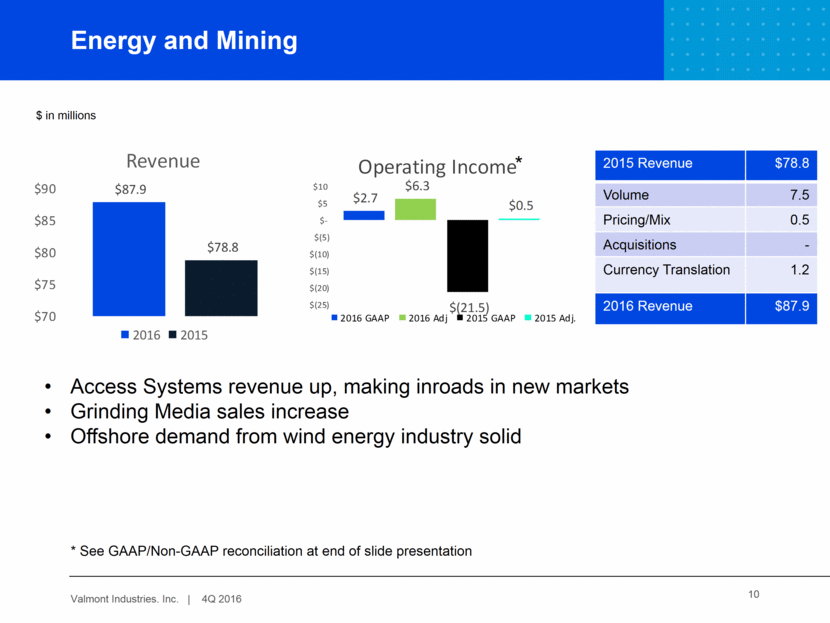
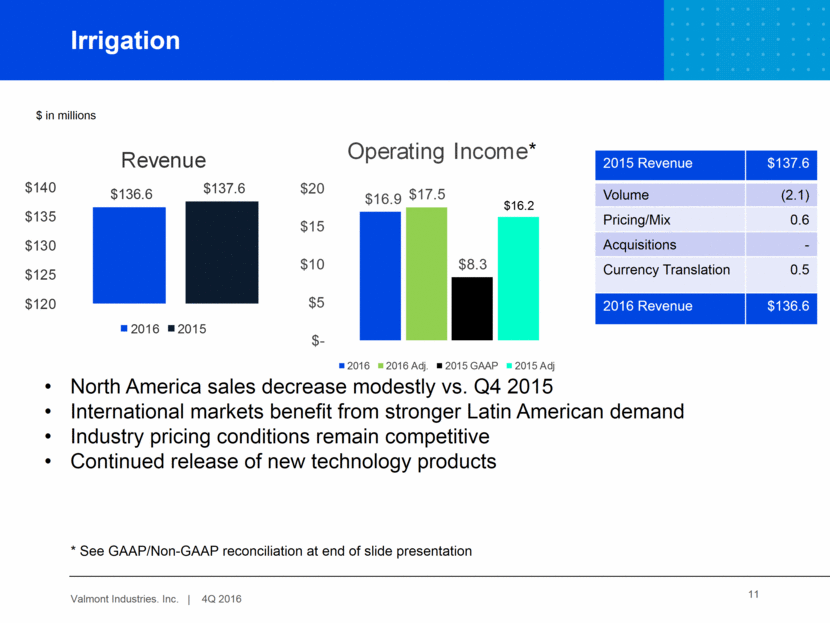
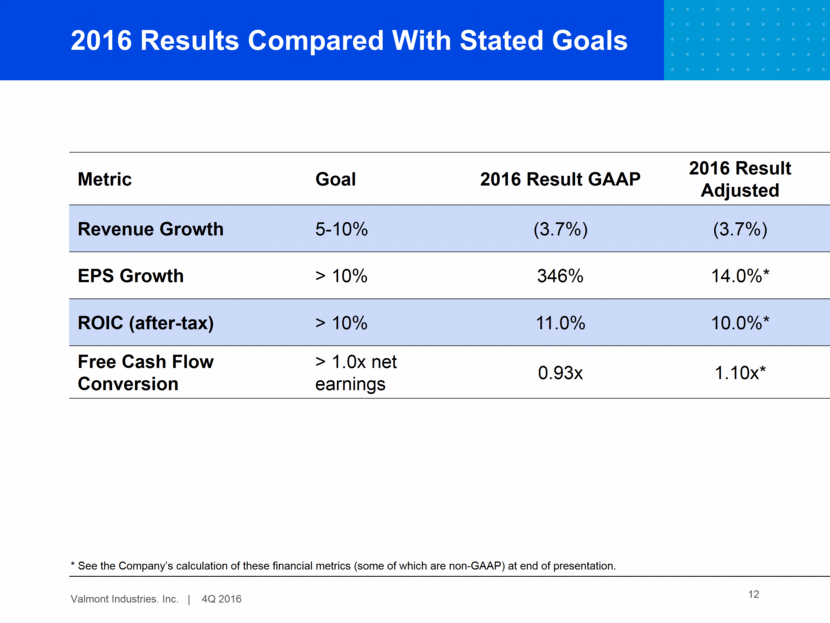
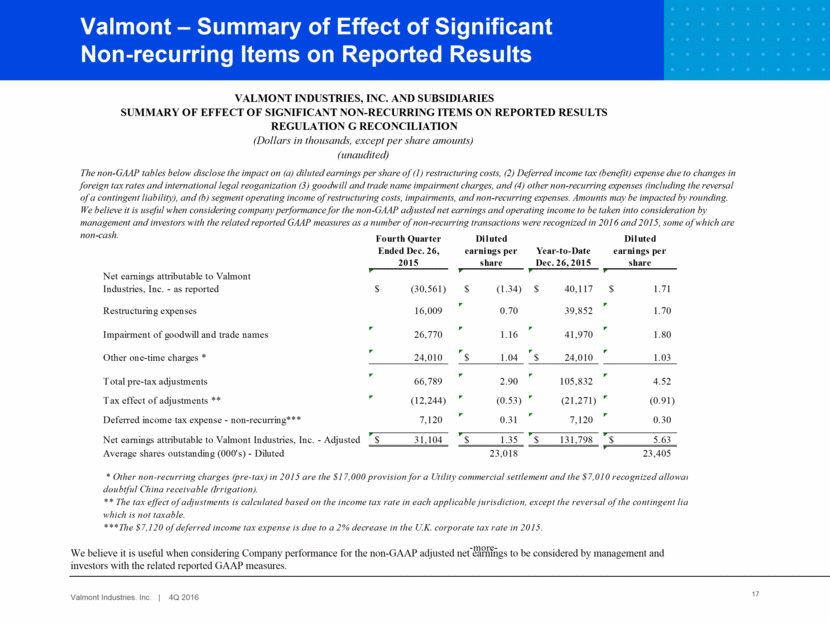
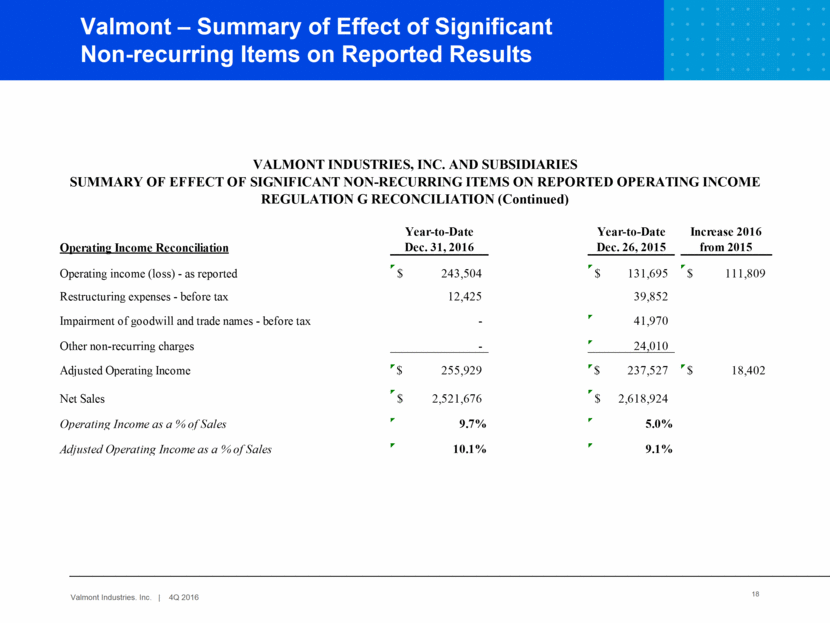
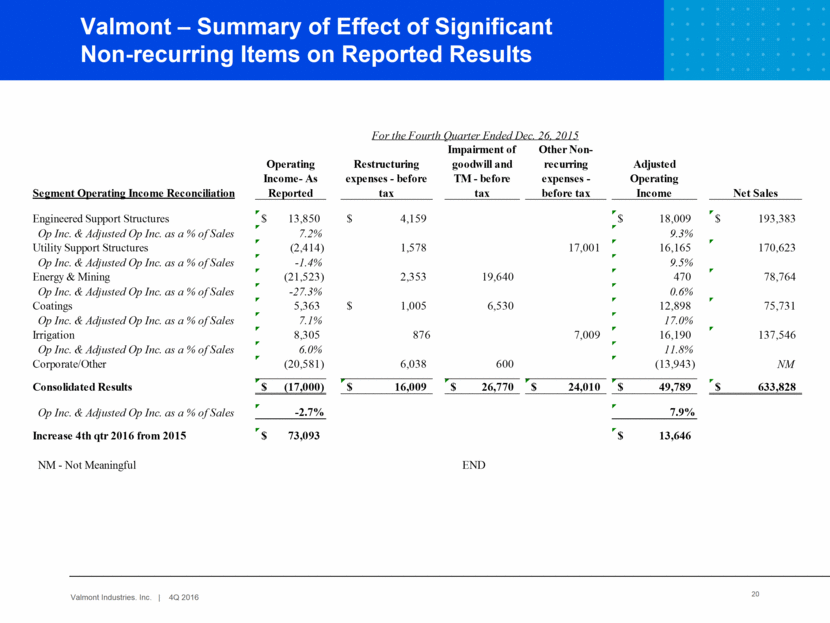
16 Valmont – Recast 2015 Segment Figures Valmont – Summary of Effect of Significant Non-recurring Items on Reported Results We believe it is useful when considering Company performance for the non-GAAP adjusted net earnings to be considered by management and investors with the related reported GAAP measures. SUMMARY OF EFFECT OF SIGNIFICANT NON-RECURRING ITEMS ON REPORTED RESULTS REGULATION G RECONCILIATION (Dollars in thousands, except per share amounts) (unaudited) The non-GAAP tables below disclose the impact on (a) diluted earnings per share of (1) restructuring costs, (2) Deferred income tax (benefit) expense due to changes in foreign tax rates and international legal reorganization (3) goodwill and trade name impairment charges, and (4) other non-recurring expenses (including the reversal of a contingent liability), and (b) segment operating income of restructuring costs, impairments, and non-recurring expenses. Amounts may be impacted by rounding. We believe it is useful when considering company performance for the non-GAAP adjusted net earnings and operating income to be taken into consideration by management and investors with the related reported GAAP measures as a number of non-recurring transactions were recognized in 2016 and 2015, some of which are non-cash. Fourth Quarter Ended Dec. 31, 2016 Diluted earnings per share Year-to-Date Dec. 31, 2016 Diluted earnings per share Net earnings (loss) attributable to Valmont Industries, Inc. - as reported $ 70,064 $ 3.10 $ 173,232 $ 7.63 Restructuring expenses 7,341 0.32 12,425 0.55 Reversal of contingent liability (16,591) (0.73) (16,591) (0.73) Fair market value adjustment, Delta EMD (332) (0.01) 586 0.03 Total pre-tax adjustments (9,582) (0.42) (3,580) (0.16) Tax effect of adjustments ** (1,574) (0.07) (3,180) (0.14) Deferred income tax benefit - non-recurring (22,565) (1.00) (20,705) (0.91) Net earnings attributable to Valmont Industries, Inc. - Adjusted $ 36,343 $ 1.61 $ 145,767 $ 6.42 Average shares outstanding (000's) - Diluted 22,611 22,709 VALMONT INDUSTRIES, INC. AND SUBSIDIARIES SUMMARY OF EFFECT OF SIGNIFICANT NON-RECURRING ITEMS ON REPORTED RESULTS REGULATION G RECONCILIATION (Dollars in thousands, except per share amounts) (unaudited) The non-GAAP tables below disclose the impact on (a) diluted earnings per share of (1) restructuring costs, (2) Deferred income tax (benefit) expense due to changes in foreign tax rates and international legal reoganization (3) goodwill and trade name impairment charges, and (4) other non-recurring expenses (including the reversal of a contingent liability), and (b) segment operating income of restructuring costs, impairments, and non-recurring expenses. Amounts may be impacted by rounding. We believe it is useful when considering company performance for the non-GAAP adjusted net earnings and operating income to be taken into consideration by management and investors with the related reported GAAP measures as a number of non-recurring transactions were recognized in 2016 and 2015, some of which are non-cash. Fourth Quarter Ended Dec. 31, 2016 Diluted earnings per share Year-to-Date Dec. 31, 2016 Diluted earnings per share Net earnings (loss) attributable to Valmont Industries, Inc. - as reported $ 70,064 $ 3.10 $ 173,232 $ 7.63 Restructuring expenses 7,341 0.32 12,425 0.55 Reversal of contingent liability (16,591) (0.73) (16,591) (0.73) Fair market value adjustment, Delta EMD (332) (0.01) 586 0.03 Total pre-tax adjustments (9,582) (0.42) (3,580) (0.16) Tax effect of adjustments ** (1,574) (0.07) (3,180) (0.14) Deferred income tax benefit - non-recurring (22,565) (1.00) (20,705) (0.91) Net earnings attributable to Valmont Industries, Inc. - Adjusted $ 36,343 $ 1.61 $ 145,767 $ 6.42 Average shares outstanding (000's) - Diluted 22,611 22,709
