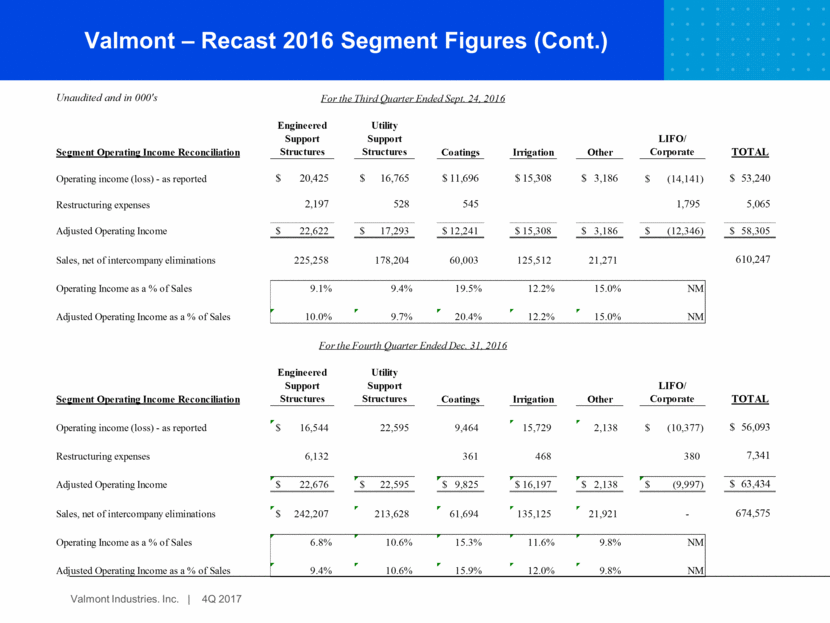
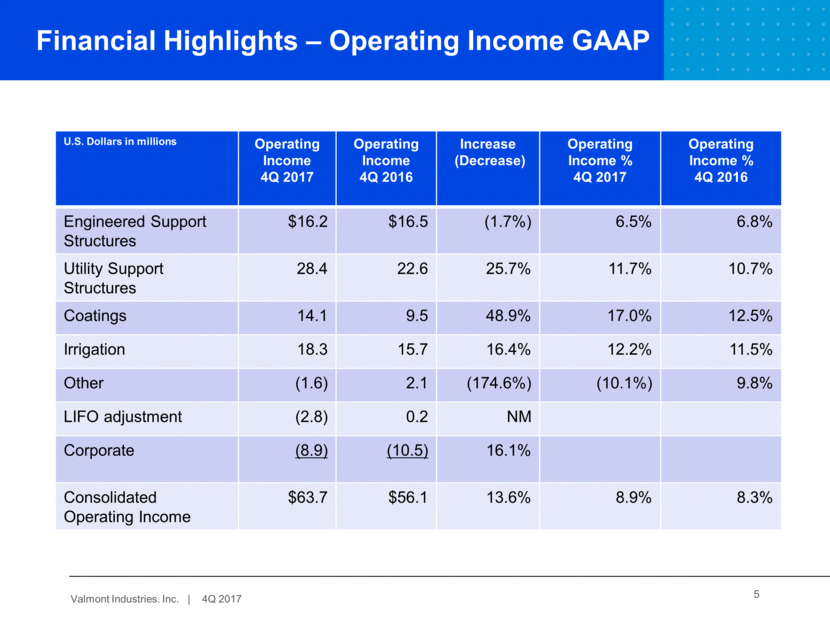
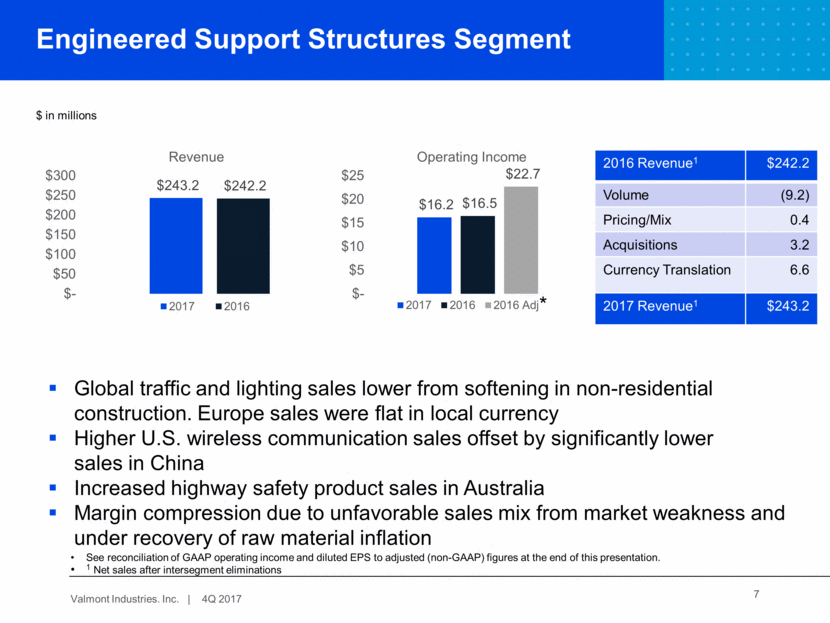
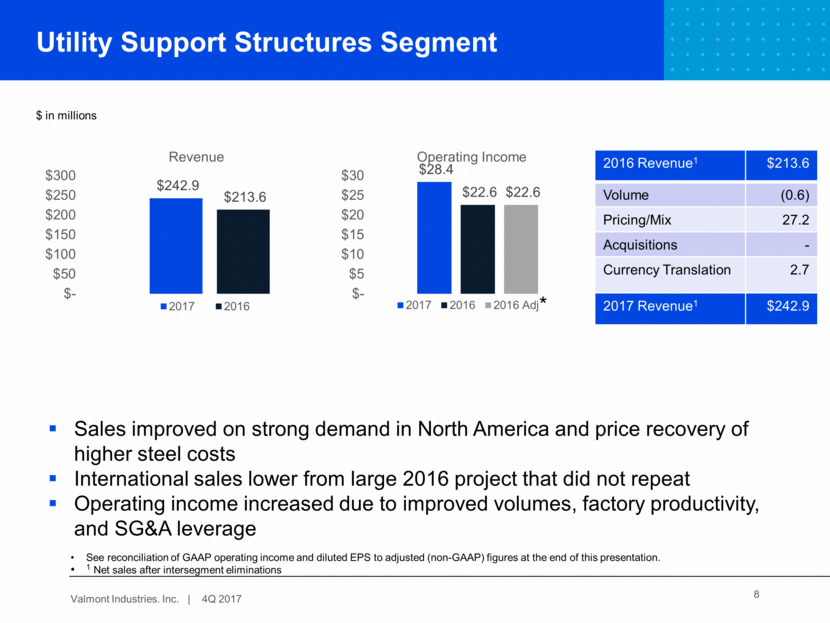
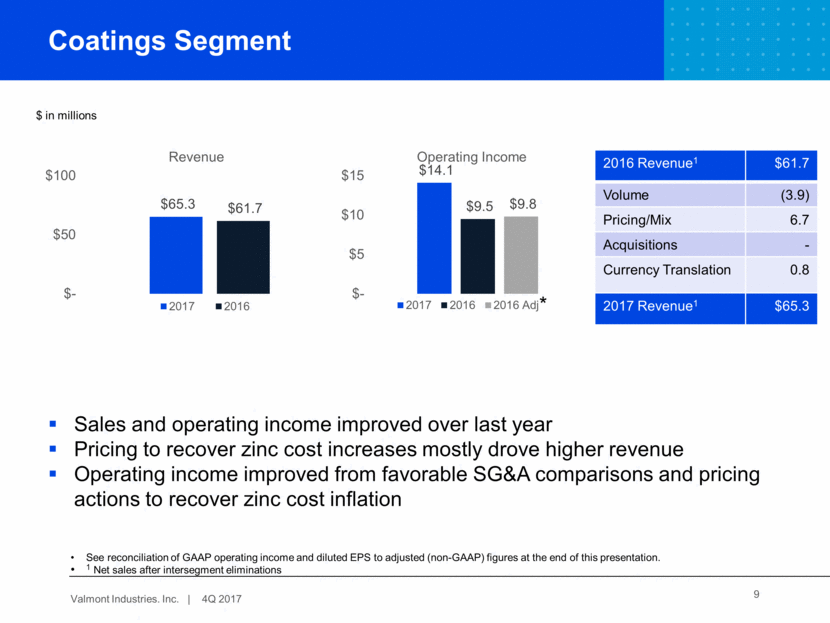
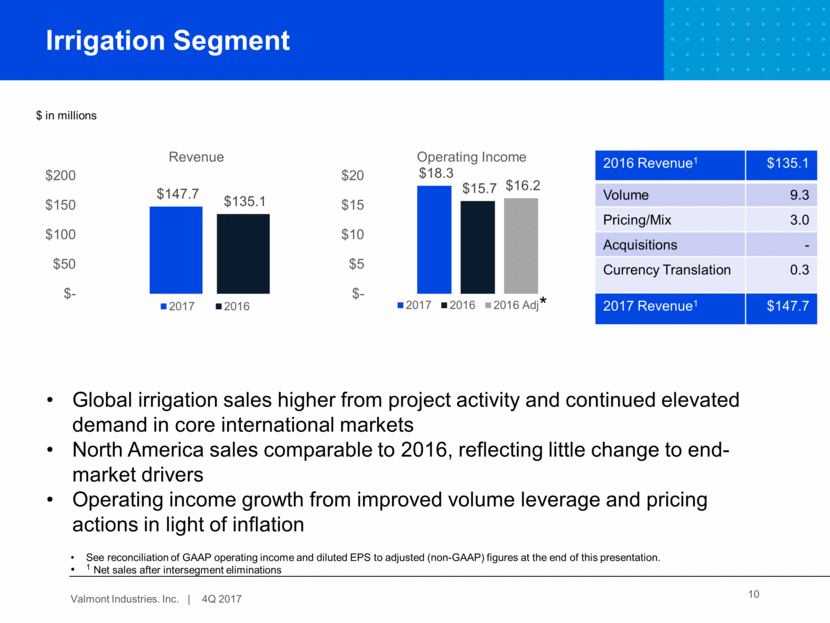
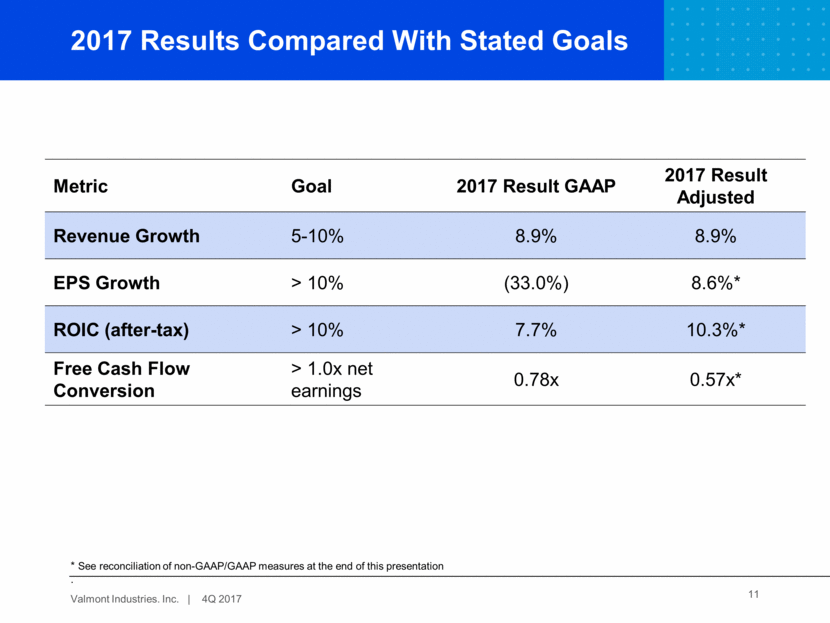
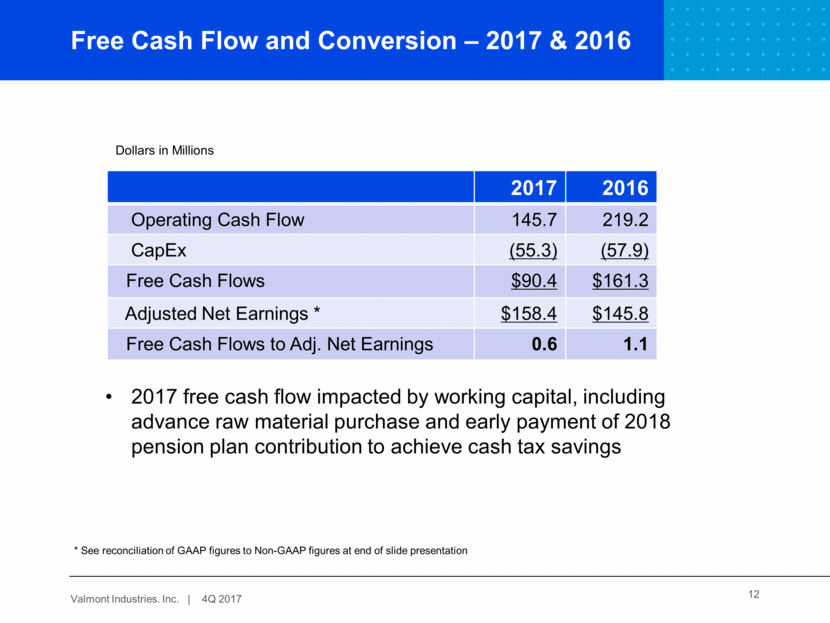
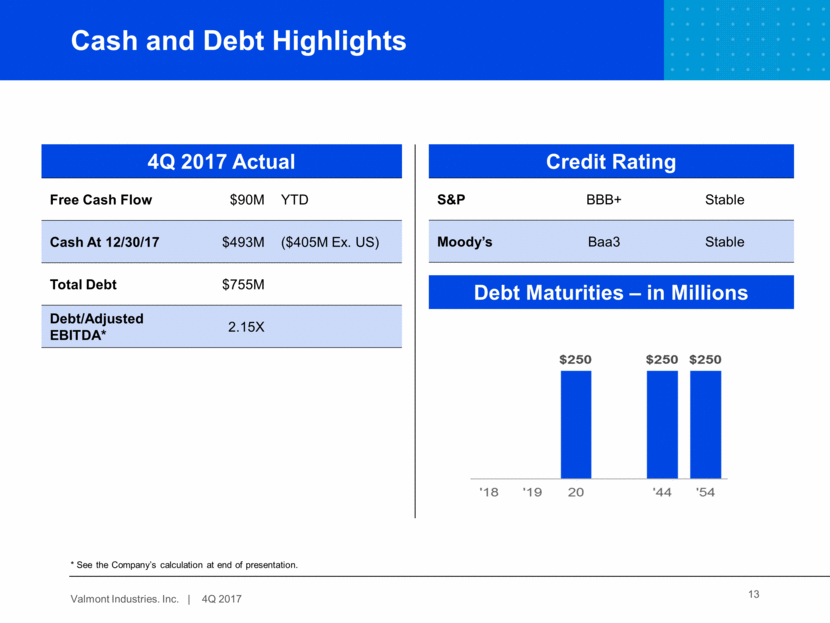
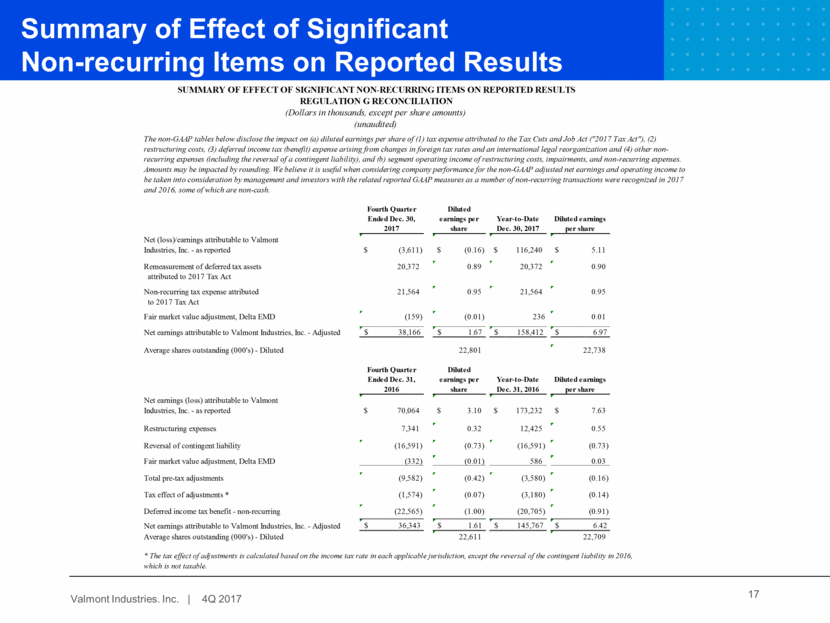
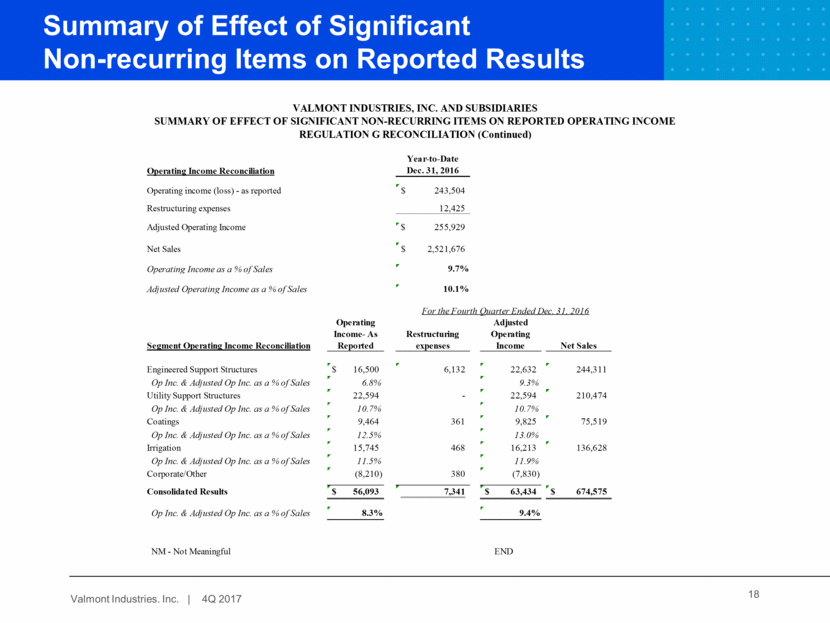
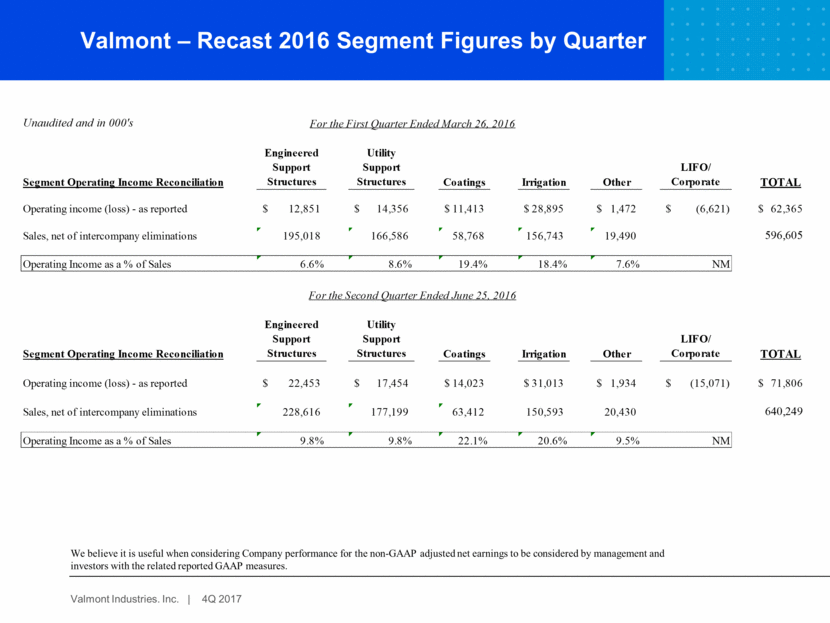
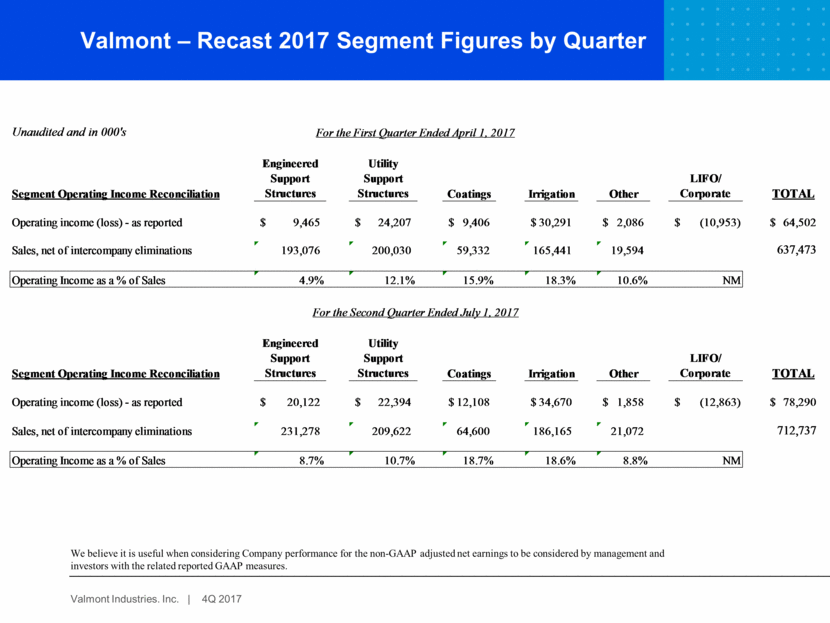
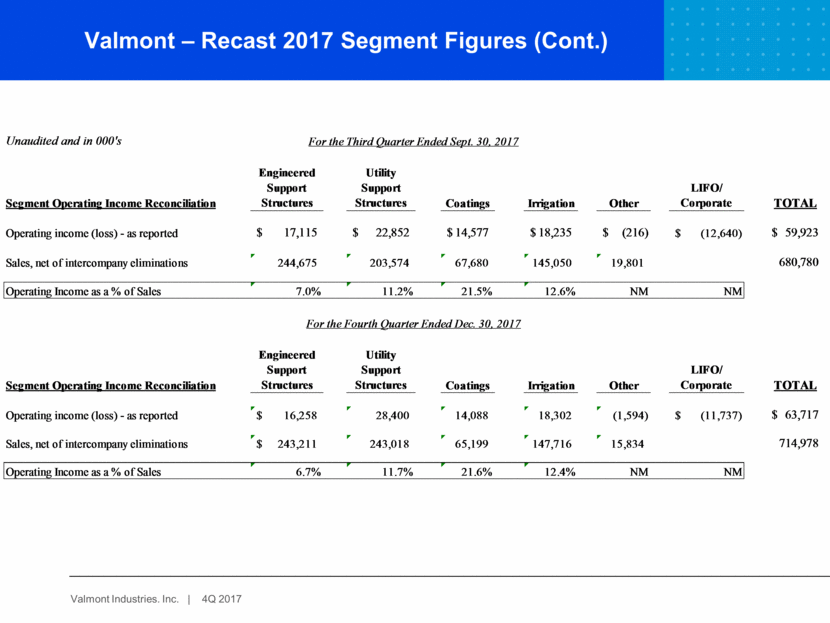
Valmont – Recast 2015 Segment Figures (Cont.) Valmont – Recast 2016 Segment Figures (Cont.) Unaudited and in 000's Segment Operating Income Reconciliation Engineered Support Structures Utility Support Structures Coatings Irrigation Other LIFO/ Corporate TOTAL Operating income (loss) - as reported 20,425 $ 16,765 $ 11,696 $ 15,308 $ 3,186 $ (14,141) $ 53,240 $ Restructuring expenses 2,197 528 545 1,795 5,065 Adjusted Operating Income 22,622 $ 17,293 $ 12,241 $ 15,308 $ 3,186 $ (12,346) $ 58,305 $ Sales, net of intercompany eliminations 225,258 178,204 60,003 125,512 21,271 610,247 Operating Income as a % of Sales 9.1% 9.4% 19.5% 12.2% 15.0% NM Adjusted Operating Income as a % of Sales 10.0% 9.7% 20.4% 12.2% 15.0% NM Segment Operating Income Reconciliation Engineered Support Structures Utility Support Structures Coatings Irrigation Other LIFO/ Corporate TOTAL Operating income (loss) - as reported 16,544 $ 22,595 9,464 15,729 2,138 (10,377) $ 56,093 $ Restructuring expenses 6,132 361 468 380 7,341 Adjusted Operating Income 22,676 $ 22,595 $ 9,825 $ 16,197 $ 2,138 $ (9,997) $ 63,434 $ Sales, net of intercompany eliminations 242,207 $ 213,628 61,694 135,125 21,921 - 674,575 Operating Income as a % of Sales 6.8% 10.6% 15.3% 11.6% 9.8% NM Adjusted Operating Income as a % of Sales 9.4% 10.6% 15.9% 12.0% 9.8% NM For the Third Quarter Ended Sept. 24, 2016 For the Fourth Quarter Ended Dec. 31, 2016
