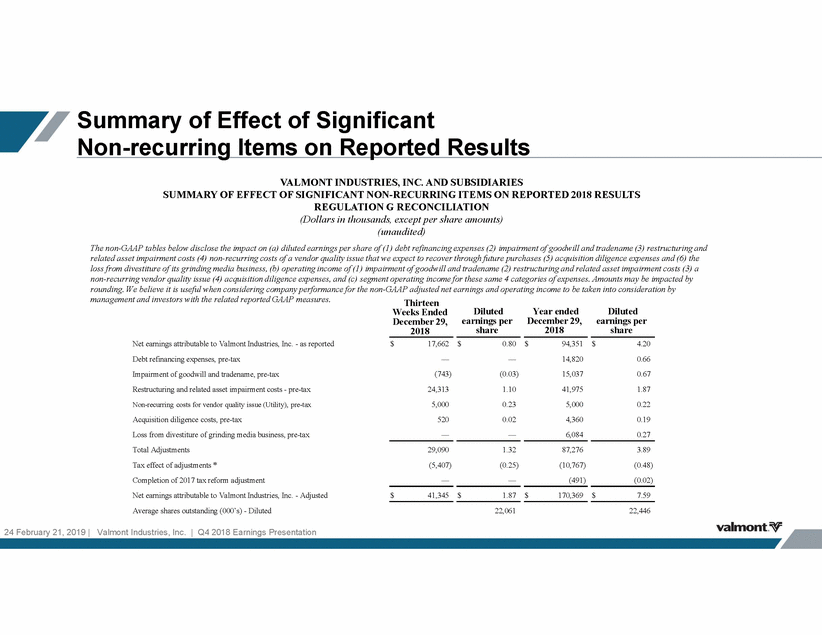
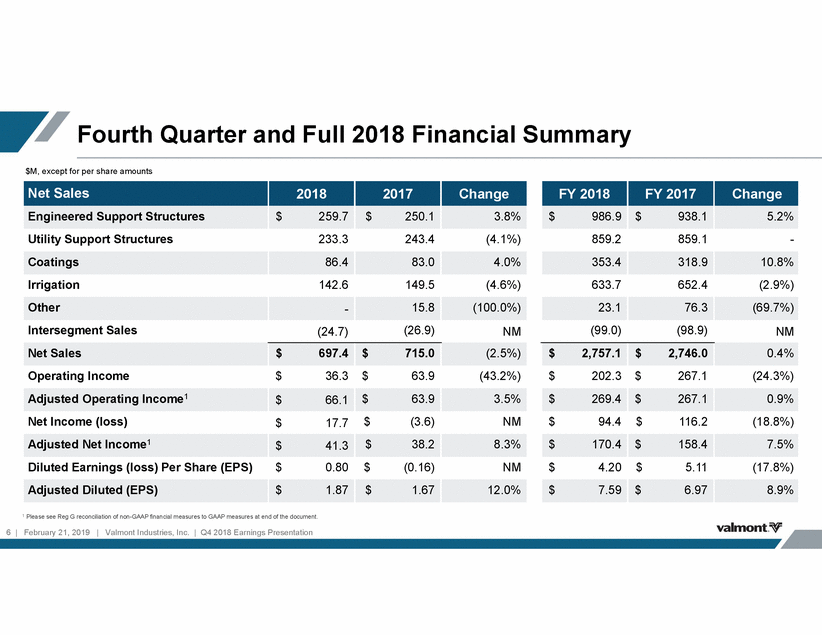
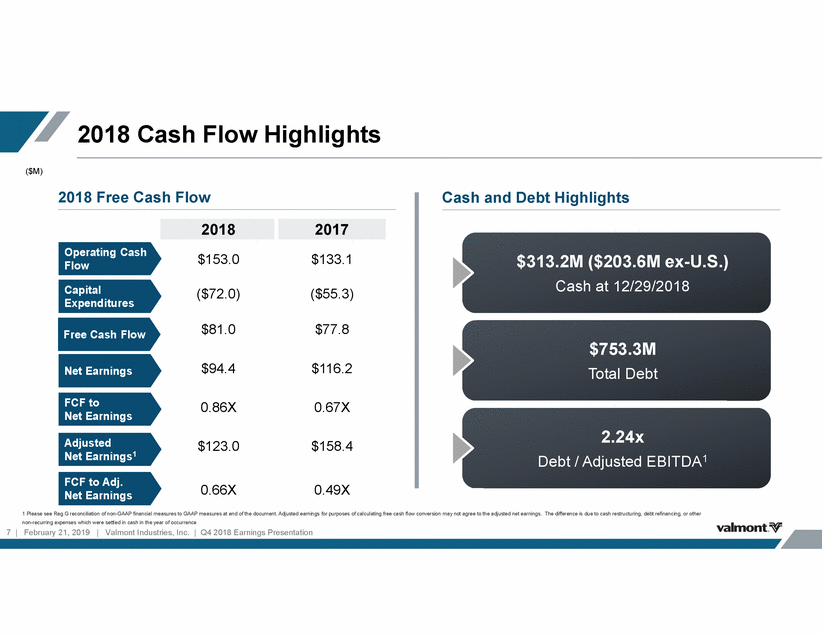
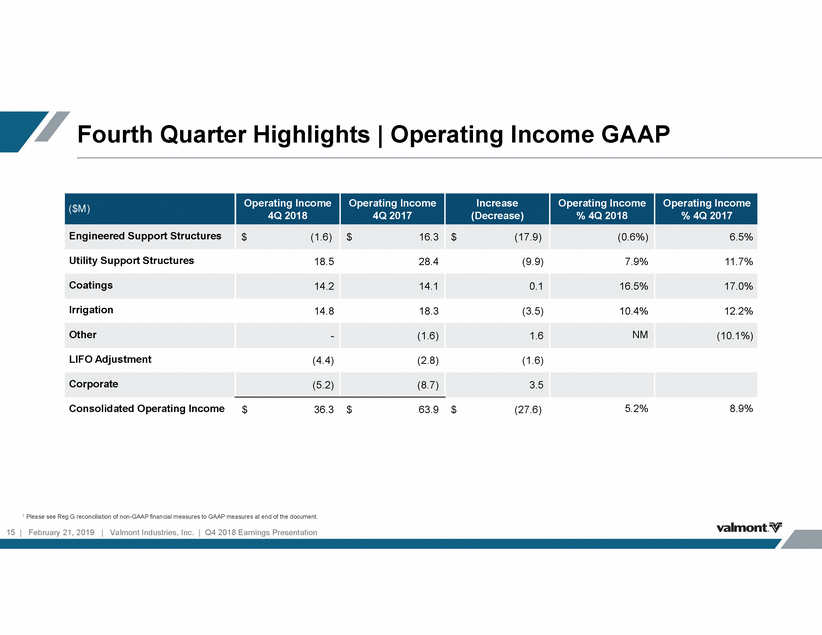
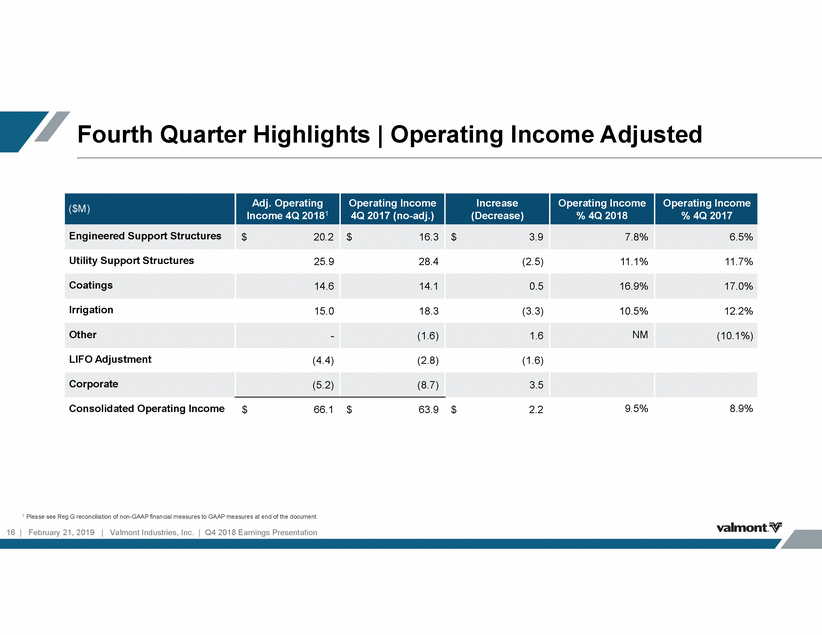
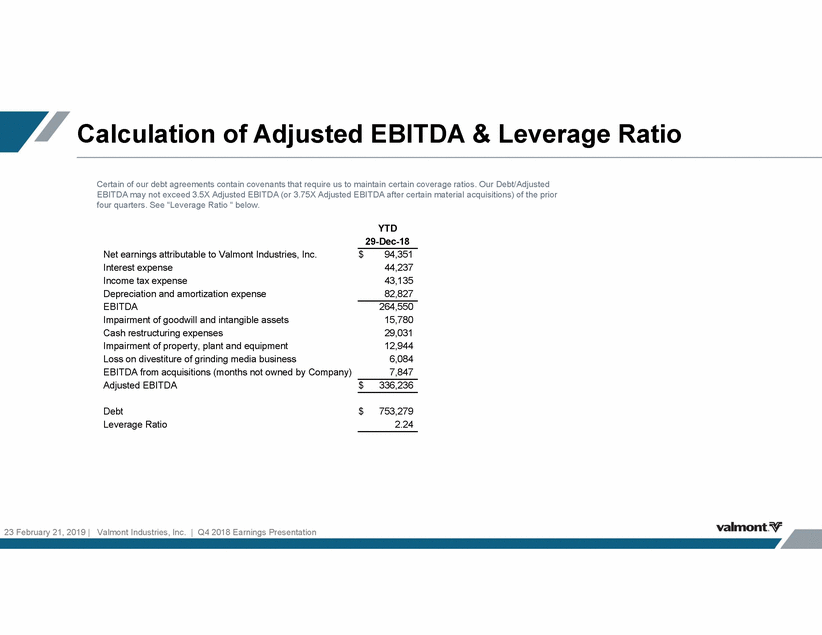
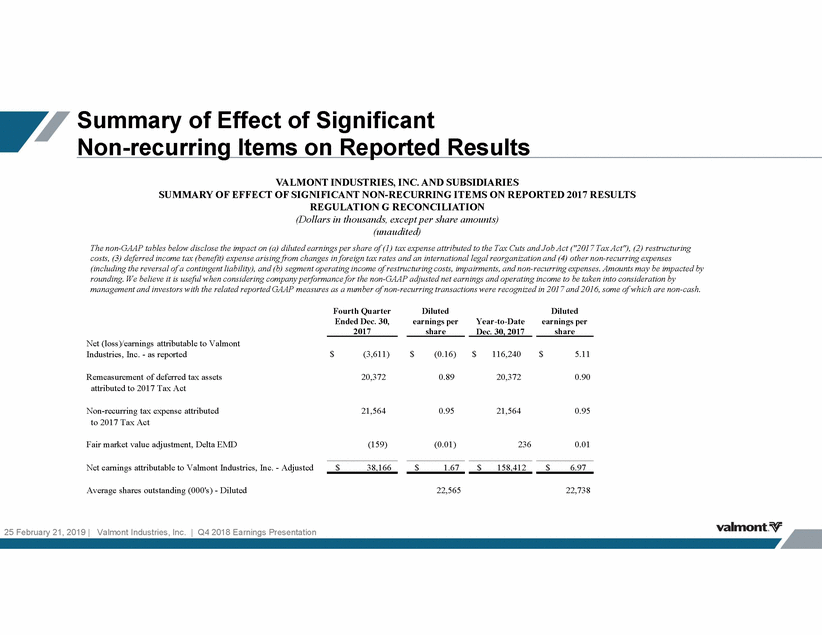
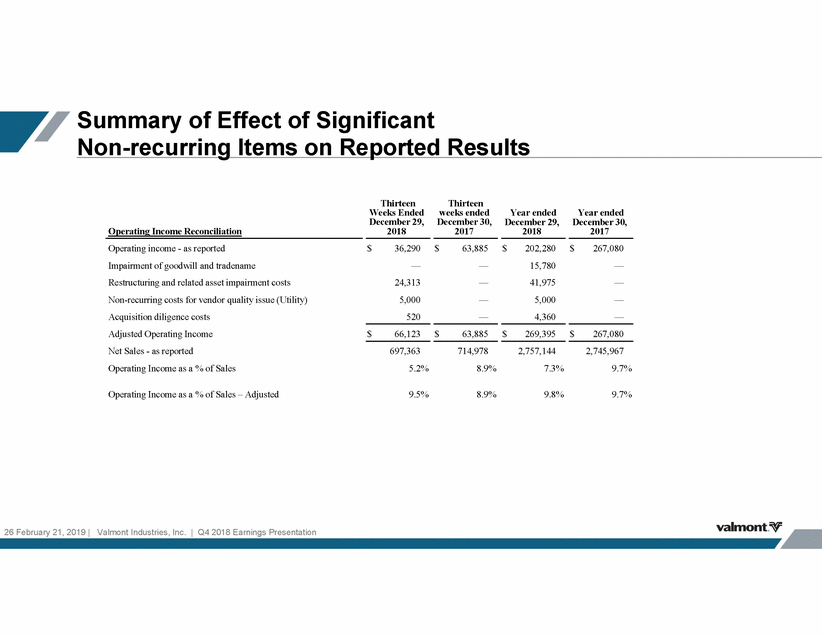
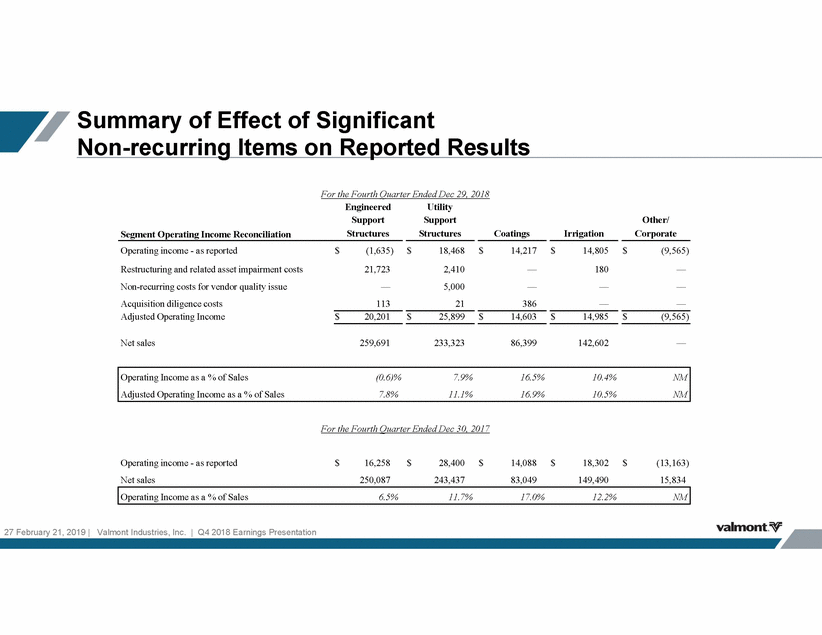
Summary of Effect of Significant Non-recurring Items on Reported Results VALMONT INDUSTRIES, INC. AND SUBSIDIARIES SUMMARY OF EFFECT OF SIGNIFICANT NON-RECURRING ITEMS ON REPORTED 2018 RESULTS REGULATION G RECONCILIATION (Dollars in thousands, except per share amounts) (unaudited) The non-GAAP tables below disclose the impact on (a) diluted earnings per share of (1) debt refinancing expenses (2) impairment of goodwill and tradename (3) restructuring and related asset impairment costs (4) non-recurring costs of a vendor quality issue that we expect to recover through future purchases (5) acquisition diligence expenses and (6) the loss from divestiture of its grinding media business, (b) operating income of (1) impairment of goodwill and tradename (2) restructuring and related asset impairment costs (3) a non-recurring vendor quality issue (4) acquisition diligence expenses, and (c) segment operating income for these same 4 categories of expenses. Amounts may be impacted by rounding. We believe it is useful when considering company performance for the non-GAAP adjusted net earnings and operating income to be taken into consideration by management and investors with the related reported GAAP measures. Thirteen Weeks Ended December 29, 2018 Diluted earnings per share Year ended December 29, 2018 Diluted earnings per share Net earnings attributable to Valmont Industries, Inc. - as reported Debt refinancing expenses, pre-tax Impairment of goodwill and tradename, pre-tax Restructuring and related asset impairment costs - pre-tax Non-recurring costs for vendor quality issue (Utility), pre-tax Acquisition diligence costs, pre-tax Loss from divestiture of grinding media business, pre-tax Total Adjustments Tax effect of adjustments * Completion of 2017 tax reform adjustment Net earnings attributable to Valmont Industries, Inc. - Adjusted Average shares outstanding (000’s) - Diluted $ 17,662 — (743) 24,313 5,000 520 — $ 0.80 — (0.03) 1.10 0.23 0.02 — $ 94,351 14,820 15,037 41,975 5,000 4,360 6,084 $ 4.20 0.66 0.67 1.87 0.22 0.19 0.27 29,090 (5,407) — 1.32 (0.25) — 87,276 (10,767) (491) 3.89 (0.48) (0.02) $ 41,345 $ 1.87 $ 170,369 $ 7.59 22,061 22,446 24 February 21, 2019 | Valmont Industries, Inc. | Q4 2018 Earnings Presentation
