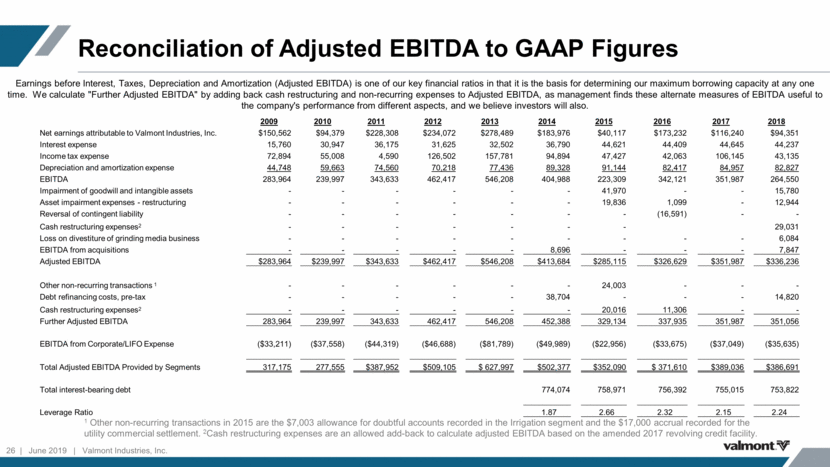
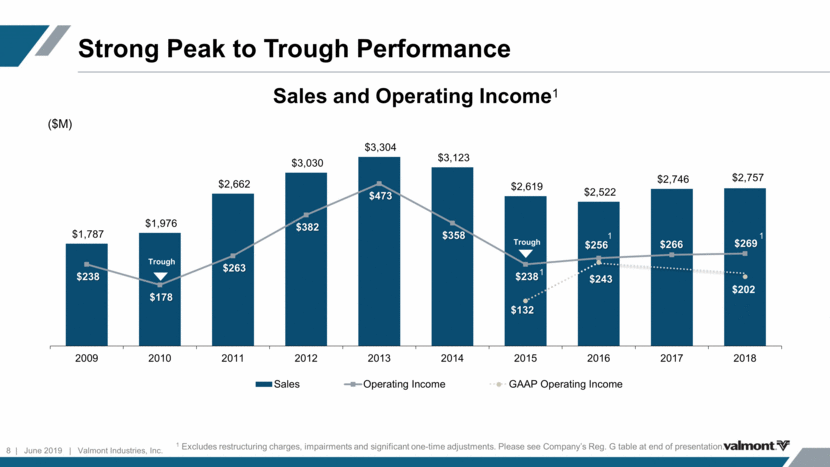
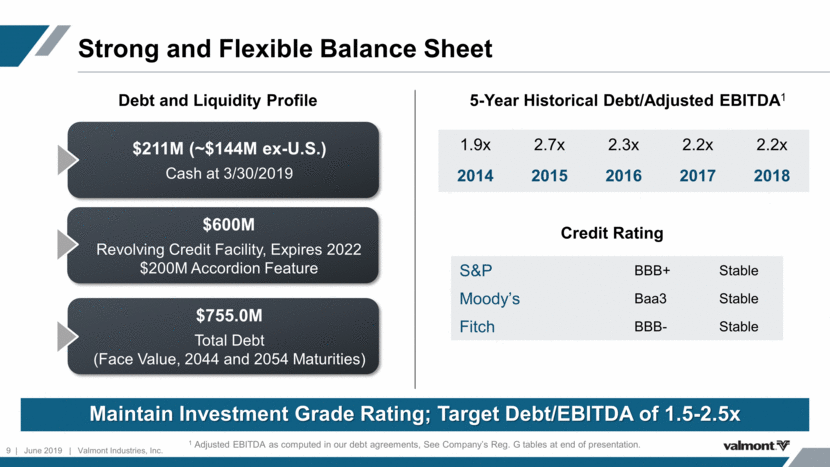
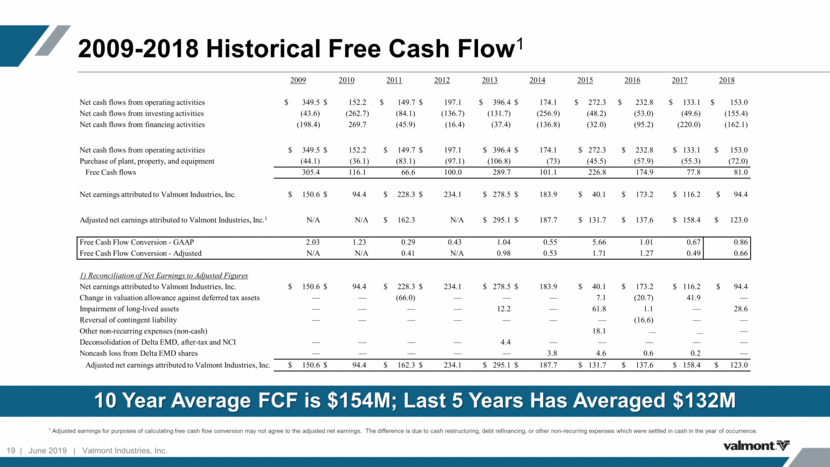
Reconciliation of Adjusted EBITDA to GAAP Figures 1 Other non-recurring transactions in 2015 are the $7,003 allowance for doubtful accounts recorded in the Irrigation segment and the $17,000 accrual recorded for the utility commercial settlement. 2Cash restructuring expenses are an allowed add-back to calculate adjusted EBITDA based on the amended 2017 revolving credit facility. Earnings before Interest, Taxes, Depreciation and Amortization (Adjusted EBITDA) is one of our key financial ratios in that it is the basis for determining our maximum borrowing capacity at any one time. We calculate "Further Adjusted EBITDA" by adding back cash restructuring and non-recurring expenses to Adjusted EBITDA, as management finds these alternate measures of EBITDA useful to the company's performance from different aspects, and we believe investors will also. 26 June 2019 Valmont Industries, Inc. 2009 2010 2011 2012 2013 2014 2015 2016 2017 2018 Net earnings attributable to Valmont Industries, Inc. $150,562 $94,379 $228,308 $234,072 $278,489 $183,976 $40,117 $173,232 $116,240 $94,351 Interest expense 15,760 30,947 36,175 31,625 32,502 36,790 44,621 44,409 44,645 44,237 Income tax expense 72,894 55,008 4,590 126,502 157,781 94,894 47,427 42,063 106,145 43,135 Depreciation and amortization expense 44,748 59,663 74,560 70,218 77,436 89,328 91,144 82,417 84,957 82,827 EBITDA 283,964 239,997 343,633 462,417 546,208 404,988 223,309 342,121 351,987 264,550 Impairment of goodwill and intangible assets - - - - - - 41,970 - - 15,780 Asset impairment expenses - restructuring - - - - - - 19,836 1,099 - 12,944 Reversal of contingent liability - - - - - - - (16,591) - - Cash restructuring expenses2 - - - - - - - 29,031 Loss on divestiture of grinding media business - - - - - - - - - 6,084 EBITDA from acquisitions - - - - - 8,696 - - - 7,847 Adjusted EBITDA $283,964 $239,997 $343,633 $462,417 $546,208 $413,684 $285,115 $326,629 $351,987 $336,236 Other non-recurring transactions 1 - - - - - - 24,003 - - - Debt refinancing costs, pre-tax - - - - - 38,704 - - - 14,820 Cash restructuring expenses2 - - - - - - 20,016 11,306 - - Further Adjusted EBITDA 283,964 239,997 343,633 462,417 546,208 452,388 329,134 337,935 351,987 351,056 EBITDA from Corporate/LIFO Expense ($33,211) ($37,558) ($44,319) ($46,688) ($81,789) ($49,989) ($22,956) ($33,675) ($37,049) ($35,635) Total Adjusted EBITDA Provided by Segments 317,175 277,555 $387,952 $509,105 $ 627,997 $502,377 $352,090 $ 371,610 $389,036 $386,691 Total interest-bearing debt 774,074 758,971 756,392 755,015 753,822 Leverage Ratio 1.87 2.66 2.32 2.15 2.24