| PROJECT ODIN Presentation to the Special Committee of the Board of Directors October 7, 2007 |
| Preface Important Information The following pages contain material provided to the Special Committee (the “Committee”) of the Board of Directors of Norseman (the “Company”) by Savvian Advisors LLC (“Savvian Advisors”) in connection with a proposed transaction between the Company and Helsing. The accompanying material was compiled or prepared on a confidential basis solely for use by the Committee and not with a view toward public disclosure under any securities laws or otherwise. The information utilized in preparing this material was obtained from the management of the Company, as well as public sources. Unless otherwise indicated, all estimates and projections contained herein have been prepared or provided by the Management or Wall Street Research estimates. No representation or warranty, express or implied, is made as to the accuracy or completeness of such information and nothing contained herein is, or shall be relied upon as, a representation, whether as to the past or the future. Because this material was prepared for use in the context of a presentation to the Committee, which is familiar with the business and the affairs of the Company, neither the Company nor Savvian Advisors nor any of their respective legal or other advisors takes any responsibility for the accuracy or completeness of any of the material if used by persons other than the Committee. Neither the Company nor Savvian Advisors undertakes any obligation to update or otherwise revise the accompanying materials. |
| Table Of Contents I. Proposed Transaction Overview II. Overview of Norseman III. Valuation Analysis Appendix |
| I. Proposed Transaction Overview |
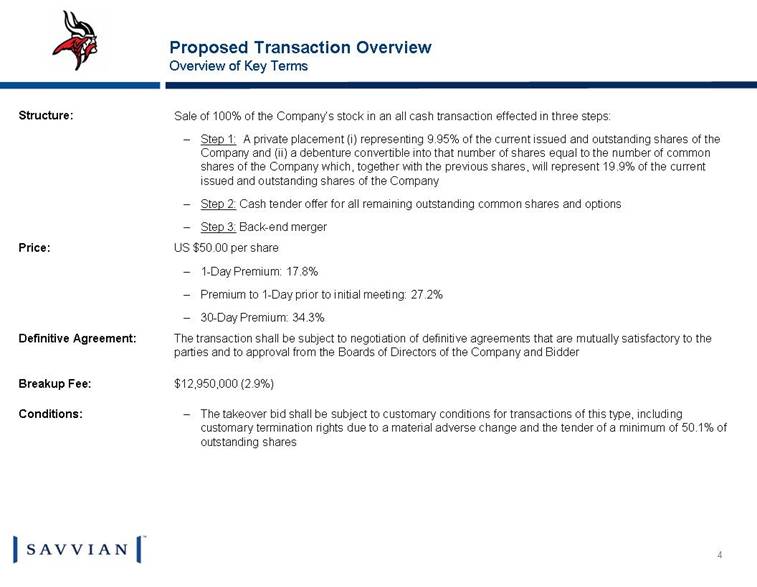
| Proposed Transaction Overview Overview of Key Terms The takeover bid shall be subject to customary conditions for transactions of this type, including customary termination rights due to a material adverse change and the tender of a minimum of 50.1% of outstanding shares Conditions: $12,950,000 (2.9%) Breakup Fee: The transaction shall be subject to negotiation of definitive agreements that are mutually satisfactory to the parties and to approval from the Boards of Directors of the Company and Bidder Definitive Agreement: US $50.00 per share 1-Day Premium: 17.8% Premium to 1-Day prior to initial meeting: 27.2% 30-Day Premium: 34.3% Price: Sale of 100% of the Company’s stock in an all cash transaction effected in three steps: Step 1: A private placement (i) representing 9.95% of the current issued and outstanding shares of the Company and (ii) a debenture convertible into that number of shares equal to the number of common shares of the Company which, together with the previous shares, will represent 19.9% of the current issued and outstanding shares of the Company Step 2: Cash tender offer for all remaining outstanding common shares and options Step 3: Back-end merger Structure: |
| Proposed Transaction Overview Key Considerations Helsing informed Management of intention to acquire a competitor of Norseman as a catalyst to the current discussions Norseman decided not to approach any suitors in connection with its evaluation of this transaction However, Norseman has had conversations with other likely suitors in the past Suitors indicated at that time that a transaction would be problematic / undoable given likely customer loss If Norseman remains independent, customer concentration will continue to create significant stock price risk and the customer relationship with Helsing could be jeopardized Helsing as a customer: 19.5% of revenues in 2007, 38.1% of EBITDA in 2007 |
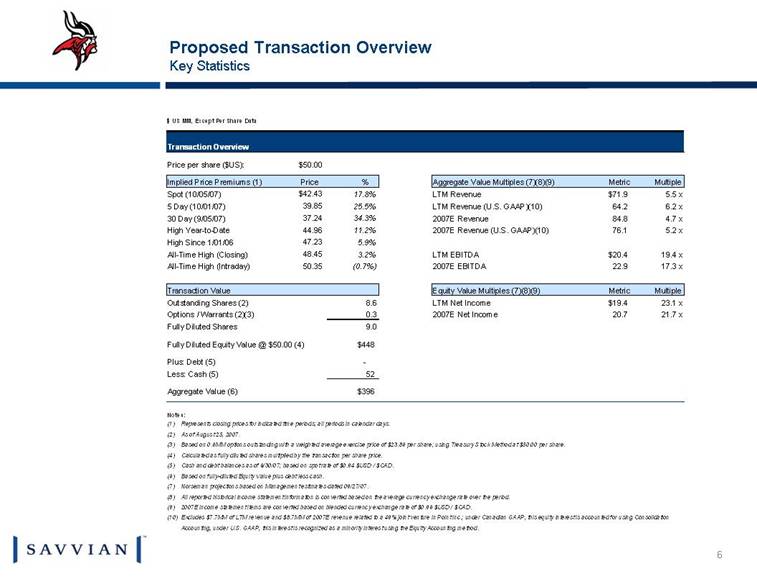
| Proposed Transaction Overview Key Statistics $ US MM, Except Per Share Data Transaction Overview Price per share ($US): $50.00 Implied Price Premiums (1) Aggregate Value Multiples (7)(8)(9) Spot (10/05/07) $42.43 17.8% LTM Revenue $71.9 5.5 x 5 Day (10/01/07) 39.85 25.5% LTM Revenue (U.S. GAAP)(10) 64.2 6.2 x 30 Day (9/05/07) 37.24 34.3% 2007E Revenue 84.8 4.7 x High Year-to-Date 44.96 11.2% 2007E Revenue (U.S. GAAP)(10) 76.1 5.2 x High Since 1/01/06 47.23 5.9% All-Time High (Closing) 48.45 3.2% LTM EBITDA $20.4 19.4 x All-Time High (Intraday) 50.35 (0.7%) 2007E EBITDA 22.9 17.3 x Transaction Value Equity Value Multiples (7)(8)(9) Outstanding Shares (2) 8.6 LTM Net Income $19.4 23.1 x Options / Warrants (2)(3) 0.3 2007E Net Income 20.7 21.7 x Fully Diluted Shares 9.0 Fully Diluted Equity Value @ $50.00 (4) $448 Plus: Debt (5) - Less: Cash (5) 52 Aggregate Value (6) $396 Notes: (1) Represents closing prices for indicated time periods; all periods in calendar days. (2) As of August 25, 2007. (3) Based on 0.6MM options outstanding with a weighted average exercise price of $23.86 per share; using Treasury Stock Method at $50.00 per share. (4) Calculated as fully diluted shares multiplied by the transaction per share price. (5) Cash and debt balances as of 6/30/07; based on spot rate of $0.94 $USD / $CAD. (6) Based on fully-diluted Equity Value plus debt less cash. (7) Norseman projections based on Management estimates dated 09/27/07. (8) All reported historical income statement information is converted based on the average currency exchange rate over the period. (9) 2007E income statement items are converted based on blended currency exchange rate of $0.96 $USD / $CAD. (10) Excludes $7.7MM of LTM revenue and $8.7MM of 2007E revenue related to a 49% joint venture in Point Inc.; under Canadian GAAP, this equity interest is accounted for using Consolidation Accounting, under U.S. GAAP, this interest is recognized as a minority interest using the Equity Accounting method. Multiple Metric Multiple Metric % Price |
| II. Overview of Norseman |
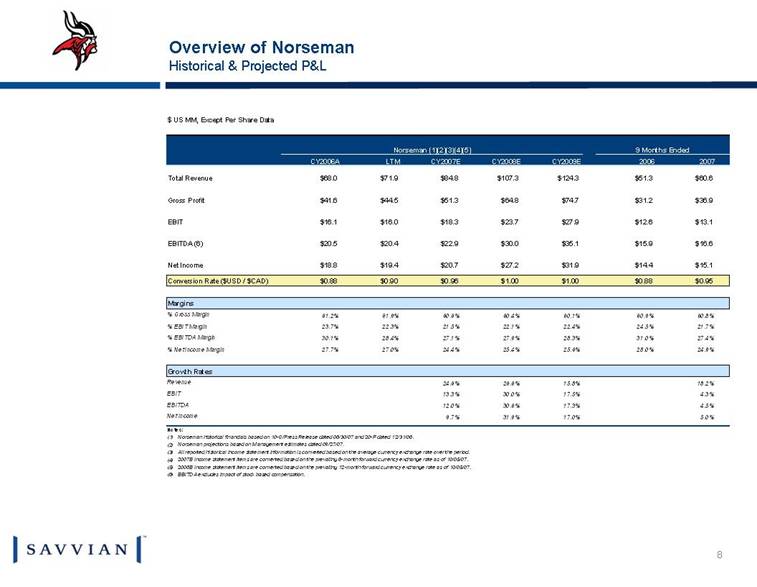
| Overview of Norseman Historical & Projected P&L $ US MM, Except Per Share Data Norseman (1)(2)(3)(4)(5) 9 Months Ended CY2006A LTM CY2007E CY2008E CY2009E 2006 2007 Total Revenue $68.0 $71.9 $84.8 $107.3 $124.3 $51.3 $60.6 Gross Profit $41.6 $44.5 $51.3 $64.8 $74.7 $31.2 $36.9 EBIT $16.1 $16.0 $18.3 $23.7 $27.9 $12.6 $13.1 EBITDA (6) $20.5 $20.4 $22.9 $30.0 $35.1 $15.9 $16.6 Net Income $18.8 $19.4 $20.7 $27.2 $31.9 $14.4 $15.1 Conversion Rate ($USD / $CAD) $0.88 $0.90 $0.96 $1.00 $1.00 $0.88 $0.95 Margins % Gross Margin 61.2% 61.9% 60.6% 60.4% 60.1% 60.9% 60.8% % EBIT Margin 23.7% 22.3% 21.5% 22.1% 22.4% 24.5% 21.7% % EBITDA Margin 30.1% 28.4% 27.1% 27.9% 28.3% 31.0% 27.4% % Net Income Margin 27.7% 27.0% 24.4% 25.4% 25.6% 28.0% 24.9% Growth Rates Revenue 24.6% 26.6% 15.8% 18.2% EBIT 13.3% 30.0% 17.5% 4.3% EBITDA 12.0% 30.6% 17.3% 4.5% Net Income 9.7% 31.9% 17.0% 5.0% Notes: (1) Norseman historical financials based on 10-Q/Press Release dated 06/30/07 and 20-F dated 12/31/06. (2) Norseman projections based on Management estimates dated 09/27/07. (3) All reported historical income statement information is converted based on the average currency exchange rate over the period. (4) 2007E income statement items are converted based on the prevailing 6-month forward currency exchange rate as of 10/05/07. (5) 2008E income statement items are converted based on the prevailing 12-month forward currency exchange rate as of 10/05/07. (6) EBITDA excludes impact of stock based compensation. |
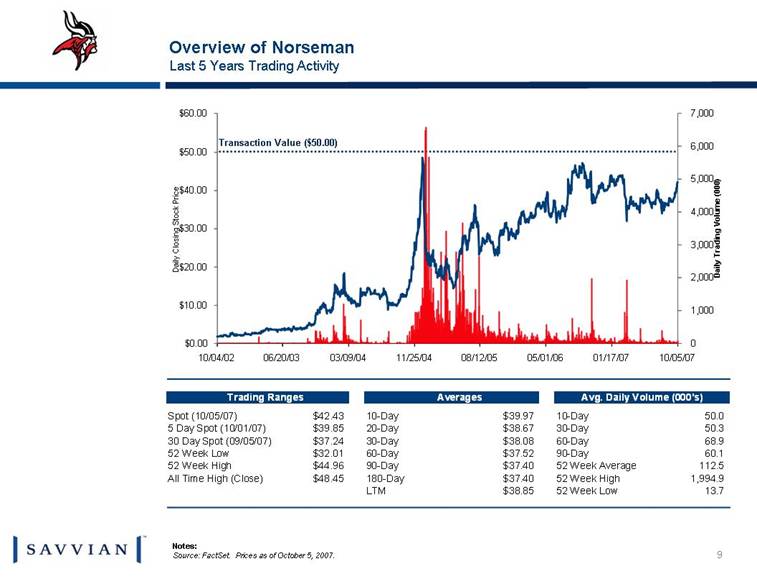
| Overview of Norseman Last 5 Years Trading Activity Notes: Source: FactSet. Prices as of October 5, 2007. Transaction Value ($50.00) 10/04/02 06/20/03 03/09/04 11/25/04 08/12/05 05/01/06 01/17/07 10/05/07 $0.00 $10.00 $20.00 $30.00 $40.00 $50.00 $60.00 Daily Closing Stock Price 0 1,000 2,000 3,000 4,000 5,000 6,000 7,000 Daily Trading Volume (000) 10/04/02 06/20/03 03/09/04 11/25/04 08/12/05 05/01/06 01/17/07 10/05/07 $0.00 $10.00 $20.00 $30.00 $40.00 $50.00 $60.00 Daily Closing Stock Price 0 1,000 2,000 3,000 4,000 5,000 6,000 7,000 Daily Trading Volume (000) Trading Ranges Averages Avg. Daily Volume (000's) Spot (10/05/07) $42.43 10-Day $39.97 10-Day 50.0 5 Day Spot (10/01/07) $39.85 20-Day $38.67 30-Day 50.3 30 Day Spot (09/05/07) $37.24 30-Day $38.08 60-Day 68.9 52 Week Low $32.01 60-Day $37.52 90-Day 60.1 52 Week High $44.96 90-Day $37.40 52 Week Average 112.5 All Time High (Close) $48.45 180-Day $37.40 52 Week High 1,994.9 LTM $38.85 52 Week Low 13.7 |
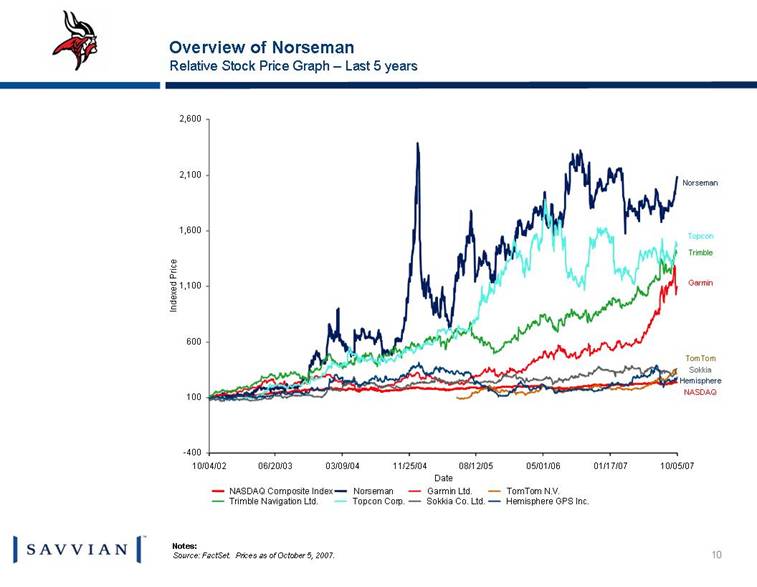
| Overview of Norseman Relative Stock Price Graph – Last 5 years Norseman Topcon Trimble Garmin TomTom Sokkia Hemisphere NASDAQ Notes: Source: FactSet. Prices as of October 5, 2007. 10/04/02 06/20/03 03/09/04 11/25/04 08/12/05 05/01/06 01/17/07 10/05/07 Date -400 100 600 1,100 1,600 2,100 2,600 Indexed Price 10/04/02 06/20/03 03/09/04 11/25/04 08/12/05 05/01/06 01/17/07 10/05/07 Date -400 100 600 1,100 1,600 2,100 2,600 Indexed Price NASDAQ Composite Index Norseman Garmin Ltd. TomTom N.V. Trimble Navigation Ltd. Topcon Corp. Sokkia Co. Ltd. Hemisphere GPS Inc. |
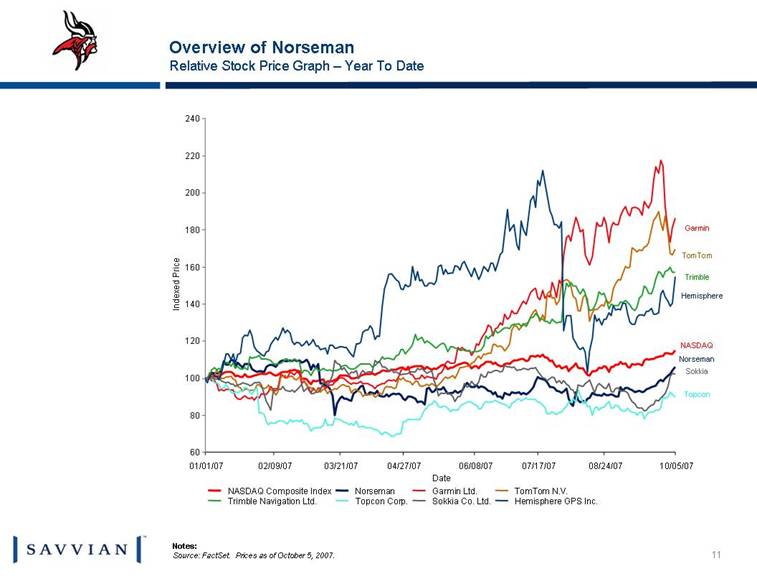
| Overview of Norseman Relative Stock Price Graph – Year To Date Norseman Topcon Trimble Garmin TomTom Sokkia Hemisphere NASDAQ Notes: Source: FactSet. Prices as of October 5, 2007. 01/01/07 02/09/07 03/21/07 04/27/07 06/08/07 07/17/07 08/24/07 10/05/07 Date 60 80 100 120 140 160 180 200 220 240 Indexed Price NASDAQ Composite Index Norseman Garmin Ltd. TomTom N.V. Trimble Navigation Ltd. Topcon Corp. Sokkia Co. Ltd. Hemisphere GPS Inc. |
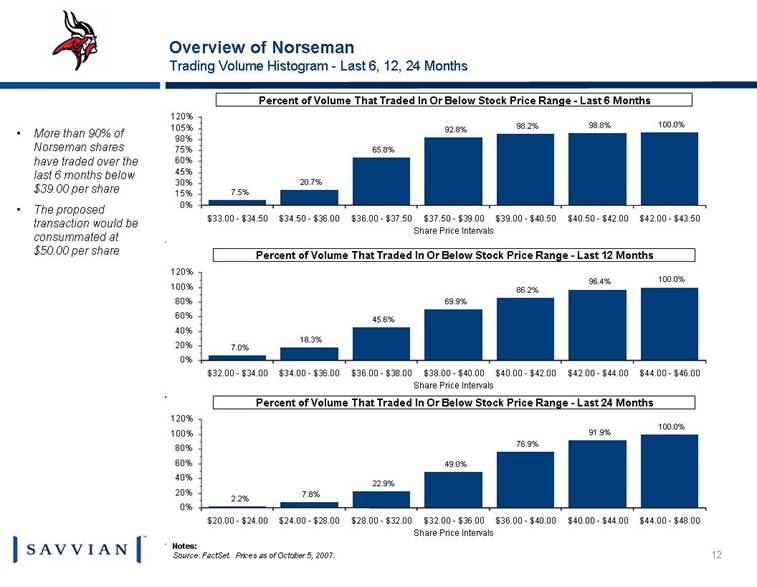
| Overview of Norseman Trading Volume Histogram - Last 6, 12, 24 Months More than 90% of Norseman shares have traded over the last 6 months below $39.00 per share The proposed transaction would be consummated at $50.00 per share Notes: Source: FactSet. Prices as of October 5, 2007. $20.00 - $24.00 $24.00 - $28.00 $28.00 - $32.00 $32.00 - $36.00 $36.00 - $40.00 $40.00 - $44.00 $44.00 - $48.00 Share Price Intervals 0% 20% 40% 60% 80% 100% 120% $20.00 - $24.00 $24.00 - $28.00 $28.00 - $32.00 $32.00 - $36.00 $36.00 - $40.00 $40.00 - $44.00 $44.00 - $48.00 Share Price Intervals 0% 20% 40% 60% 80% 100% 120% 2.2% 7.8% 22.9% 49.0% 76.9% 91.9% 100.0% Percent of Volume That Traded In Or Below Stock Price Range - Last 24 Months $32.00 - $34.00 $34.00 - $36.00 $36.00 - $38.00 $38.00 - $40.00 $40.00 - $42.00 $42.00 - $44.00 $44.00 - $46.00 Share Price Intervals 0% 20% 40% 60% 80% 100% 120% $32.00 - $34.00 $34.00 - $36.00 $36.00 - $38.00 $38.00 - $40.00 $40.00 - $42.00 $42.00 - $44.00 $44.00 - $46.00 Share Price Intervals 0% 20% 40% 60% 80% 100% 120% 7.0% 18.3% 45.6% 69.9% 86.2% 96.4% 100.0% Percent of Volume That Traded In Or Below Stock Price Range - Last 12 Months $33.00 - $34.50 $34.50 - $36.00 $36.00 - $37.50 $37.50 - $39.00 $39.00 - $40.50 $40.50 - $42.00 $42.00 - $43.50 Share Price Intervals 0% 15% 30% 45% 60% 75% 90% 105% 120% $33.00 - $34.50 $34.50 - $36.00 $36.00 - $37.50 $37.50 - $39.00 $39.00 - $40.50 $40.50 - $42.00 $42.00 - $43.50 Share Price Intervals 0% 15% 30% 45% 60% 75% 90% 105% 120% 7.5% 20.7% 65.8% 92.8% 98.2% 98.8% 100.0% Percent of Volume That Traded In Or Below Stock Price Range - Last 6 Months |
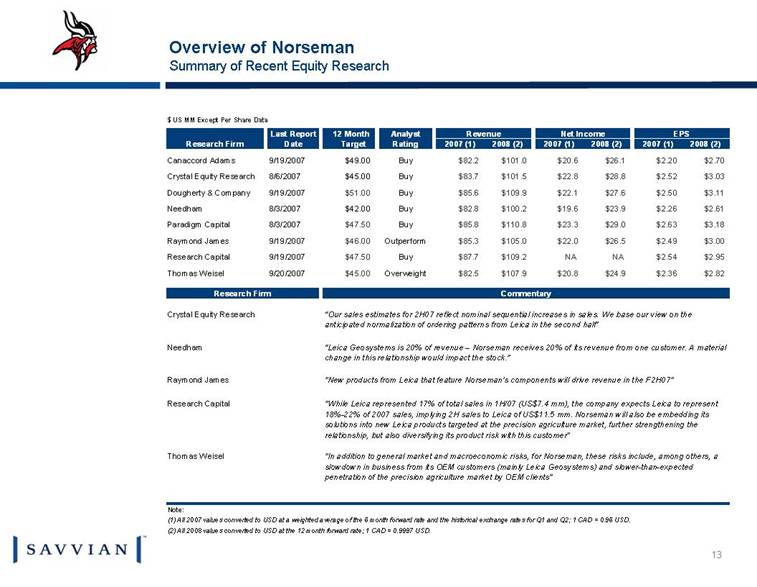
| Overview of Norseman Summary of Recent Equity Research $ US MM Except Per Share Data Last Report Analyst Revenue Net Income EPS Research Firm Date Rating 2007 (1) 2008 (2) 2007 (1) 2008 (2) 2007 (1) 2008 (2) Canaccord Adams 9/19/2007 $49.00 Buy $82.2 $101.0 $20.6 $26.1 $2.20 $2.70 Crystal Equity Research 8/6/2007 $45.00 Buy $83.7 $101.5 $22.8 $28.8 $2.52 $3.03 Dougherty & Company 9/19/2007 $51.00 Buy $85.6 $109.9 $22.1 $27.6 $2.50 $3.11 Needham 8/3/2007 $42.00 Buy $82.8 $100.2 $19.6 $23.9 $2.26 $2.61 Paradigm Capital 8/3/2007 $47.50 Buy $85.8 $110.8 $23.3 $29.0 $2.63 $3.18 Raymond James 9/19/2007 $46.00 Outperform $85.3 $105.0 $22.0 $26.5 $2.49 $3.00 Research Capital 9/19/2007 $47.50 Buy $87.7 $109.2 NA NA $2.54 $2.95 Thomas Weisel 9/20/2007 $45.00 Overweight $82.5 $107.9 $20.8 $24.9 $2.36 $2.82 Research Firm Commentary Crystal Equity Research Needham Raymond James Research Capital Thomas Weisel Note: "In addition to general market and macroeconomic risks, for Norseman, these risks include, among others, a slowdown in business from its OEM customers (mainly Leica Geosystems) and slower-than-expected penetration of the precision agriculture market by OEM clients" "New products from Leica that feature Norseman’s components will drive revenue in the F2H07" “Leica Geosystems is 20% of revenue – Norseman receives 20% of its revenue from one customer. A material change in this relationship would impact the stock." (2) All 2008 values converted to USD at the 12 month forward rate; 1 CAD = 0.9997 USD. “Our sales estimates for 2H07 reflect nominal sequential increases in sales. We base our view on the anticipated normalization of ordering patterns from Leica in the second half” "While Leica represented 17% of total sales in 1H/07 (US$7.4 mm), the company expects Leica to represent 18%-22% of 2007 sales, implying 2H sales to Leica of US$11.5 mm. Norseman will also be embedding its solutions into new Leica products targeted at the precision agriculture market, further strengthening the relationship, but also diversifying its product risk with this customer" (1) All 2007 values converted to USD at a weighted average of the 6 month forward rate and the historical exchange rates for Q1 and Q2; 1 CAD = 0.96 USD. Target 12 Month |
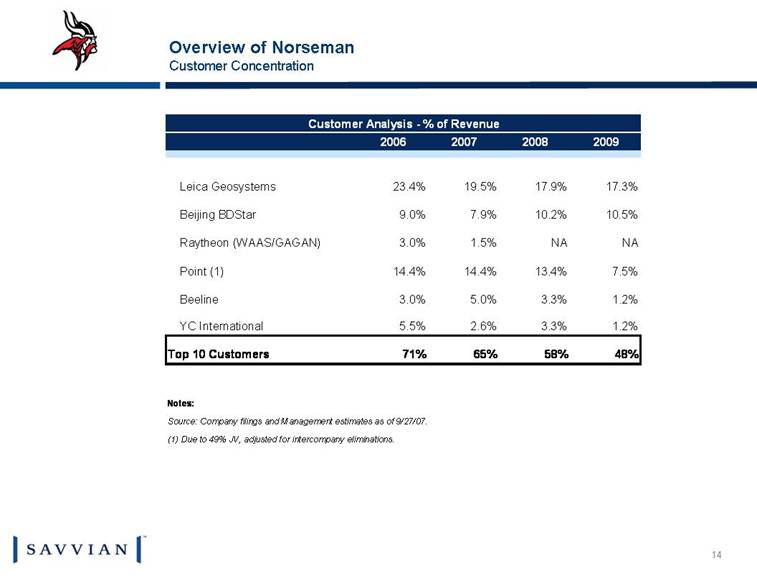
| Overview of Norseman Customer Concentration Customer Analysis - % of Revenue 2006 2007 2008 2009 Leica Geosystems 23.4% 19.5% 17.9% 17.3% Beijing BDStar 9.0% 7.9% 10.2% 10.5% Raytheon (WAAS/GAGAN) 3.0% 1.5% NA NA Point (1) 14.4% 14.4% 13.4% 7.5% Beeline 3.0% 5.0% 3.3% 1.2% YC International 5.5% 2.6% 3.3% 1.2% Top 10 Customers 71% 65% 58% 48% Notes: Source: Company filings and Management estimates as of 9/27/07. (1) Due to 49% JV, adjusted for intercompany eliminations. |
| III. Valuation Analysis |
| 2007E Total Revenue Valuation Analysis Selected Comparable Companies Analysis GPS Hardware High Precision GPS IC & Software GPS Diversified GPS Notes: Sources: Public filings, Wall Street consensus estimates, Factset market data as of 10/05/07 GRMN =Garmin, TRMB=Trimble, NMAN =Norseman, TOM=TomTom, RAVN=Raven, HEM=Hemisphere, VSAT=ViaSat, ESL=Esterline, TNL=Technitrol, SOK=Sokkia Norseman: $378 Norseman: $85 $2,885 $2,526 $1,197 $953 $228 $54 $321 $1,271 $1,035 $578 $229 $0 $1,000 $2,000 $3,000 GRMN TOM ESL TRMB TNL TOP VSAT SiRF RAVN SOK HEM $22,693 $8,595 $5,635 $1,650 $156 $118 $1,360 $1,490 $1,124 $1,071 $774 $0 $5,000 $10,000 $15,000 $20,000 $25,000 GRMN TOM TRMB TOP ESL SiRF TNL VSAT RAVN SOK HEM Current Equity Value Current Equity Value |

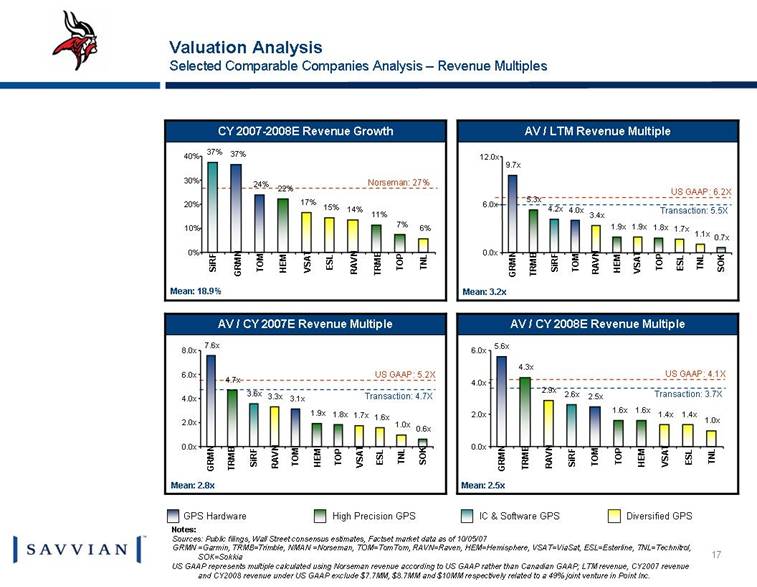
| CY 2007-2008E Revenue Growth AV / LTM Revenue Multiple AV / CY 2007E Revenue Multiple AV / CY 2008E Revenue Multiple Mean: 3.2x Norseman: 27% Mean: 18.9% Mean: 2.8x Mean: 2.5x GPS Hardware High Precision GPS IC & Software GPS Diversified GPS Valuation Analysis Selected Comparable Companies Analysis – Revenue Multiples Notes: Sources: Public filings, Wall Street consensus estimates, Factset market data as of 10/05/07 GRMN =Garmin, TRMB=Trimble, NMAN =Norseman, TOM=TomTom, RAVN=Raven, HEM=Hemisphere, VSAT=ViaSat, ESL=Esterline, TNL=Technitrol, SOK=Sokkia US GAAP represents multiple calculated using Norseman revenue according to US GAAP rather than Canadian GAAP; LTM revenue, CY2007 revenue and CY2008 revenue under US GAAP exclude $7.7MM, $8.7MM and $10MM respectively related to a 49% joint venture in Point Inc. US GAAP: 6.2X Transaction: 5.5X US GAAP: 5.2X Transaction: 4.7X US GAAP: 4.1X Transaction: 3.7X 5.6x 2.5x 4.3x 1.6x 1.6x 2.6x 2.9x 1.4x 1.4x 1.0x 0.0x 2.0x 4.0x 6.0x GRMN TRMB RAVN SiRF TOM TOP HEM VSAT ESL TNL 7.6x 3.1x 4.7x 1.9x 1.8x 0.6x 3.6x 3.3x 1.7x 1.6x 1.0x 0.0x 2.0x 4.0x 6.0x 8.0x GRMN TRMB SiRF RAVN TOM HEM TOP VSAT ESL TNL SOK 37% 24% 22% 11% 7% 37% 17% 15% 14% 6% 0% 10% 20% 30% 40% SiRF GRMN TOM HEM VSAT ESL RAVN TRMB TOP TNL 9.7x 4.0x 5.3x 1.9x 1.8x 0.7x 4.2x 3.4x 1.9x 1.7x 1.1x 0.0x 6.0x 12.0x GRMN TRMB SiRF TOM RAVN HEM VSAT TOP ESL TNL SOK |
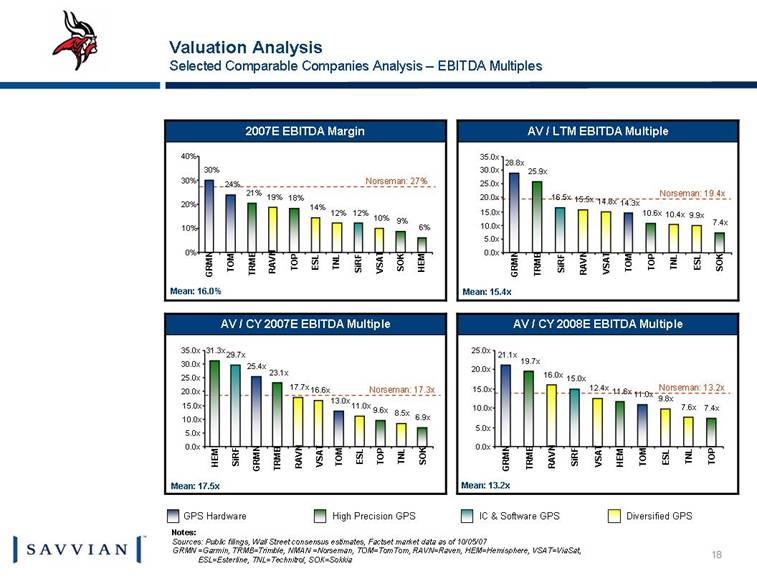
| AV / LTM EBITDA Multiple 2007E EBITDA Margin AV / CY 2007E EBITDA Multiple AV / CY 2008E EBITDA Multiple Norseman: 19.4x Mean: 15.4x Mean: 16.0% Mean: 17.5x Mean: 13.2x GPS Hardware High Precision GPS IC & Software GPS Diversified GPS Valuation Analysis Selected Comparable Companies Analysis – EBITDA Multiples Norseman: 27% Norseman: 17.3x Norseman: 13.2x Notes: Sources: Public filings, Wall Street consensus estimates, Factset market data as of 10/05/07 GRMN =Garmin, TRMB=Trimble, NMAN =Norseman, TOM=TomTom, RAVN=Raven, HEM=Hemisphere, VSAT=ViaSat, ESL=Esterline, TNL=Technitrol, SOK=Sokkia 21.1x 11.0x 19.7x 11.6x 7.4x 15.0x 16.0x 12.4x 9.8x 7.6x 0.0x 5.0x 10.0x 15.0x 20.0x 25.0x GRMN TRMB RAVN SiRF VSAT HEM TOM ESL TNL TOP 25.4x 13.0x 31.3x 23.1x 9.6x 6.9x 29.7x 17.7x 16.6x 11.0x 8.5x 0.0x 5.0x 10.0x 15.0x 20.0x 25.0x 30.0x 35.0x HEM SiRF GRMN TRMB RAVN VSAT TOM ESL TOP TNL SOK 30% 24% 21% 18% 9% 6% 12% 19% 14% 12% 10% 0% 10% 20% 30% 40% GRMN TOM TRMB RAVN TOP ESL TNL SiRF VSAT SOK HEM 28.8x 14.3x 25.9x 10.6x 7.4x 16.5x 15.5x 14.8x 10.4x 9.9x 0.0x 5.0x 10.0x 15.0x 20.0x 25.0x 30.0x 35.0x GRMN TRMB SiRF RAVN VSAT TOM TOP TNL ESL SOK |
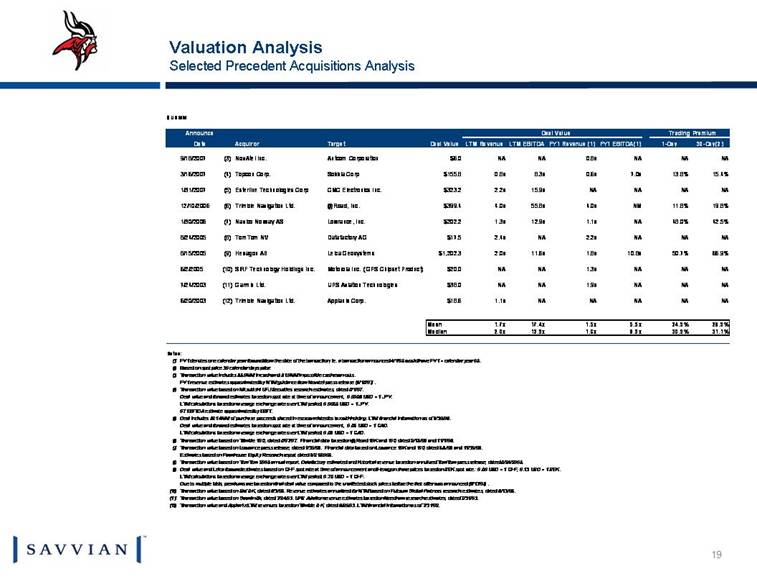
| Valuation Analysis Selected Precedent Acquisitions Analysis $ US MM Announce Deal Value Trading Premium Inputs Date Acquiror Target Deal Value LTM Revenue LTM EBITDA FY1 Revenue (1) FY1 EBITDA(1) 1-Day 30-Day(2) 9/18/2007 (3) NovAtel Inc. Antcom Corporation $6.0 NA NA 0.8x NA NA NA 3/16/2007 (4) Topcon Corp. Sokkia Corp $155.8 0.8x 8.3x 0.6x 7.0x 13.8% 15.4% 1/31/2007 (5) Esterline Technologies Corp CMC Electronics Inc. $323.2 2.2x 15.9x NA NA NA NA 12/10/2006 (6) Trimble Navigation Ltd. @Road, Inc. $399.4 4.0x 55.8x 4.0x NM 11.8% 19.8% 1/30/2006 (7) Navico Norway AS Lowrance, Inc. $202.2 1.3x 12.9x 1.1x NA 48.0% 42.5% 8/24/2005 (8) TomTom NV Datafactory AG $17.5 2.4x NA 2.2x NA NA NA 8/15/2005 (9) Hexagon AB Leica Geosystems $1,202.3 2.0x 11.6x 1.8x 10.8x 50.7% 66.9% 6/2/2005 (10) SiRF Technology Holdings Inc. Motorola Inc. ( GPS Chipset Product) $20.0 NA NA 1.3x NA NA NA 7/24/2003 (11) Garmin Ltd. UPS Aviation Technologies $38.0 NA NA 1.9x NA NA NA 6/20/2003 (12) Trimble Navigation Ltd. Applanix Corp. $18.6 1.1x NA NA NA NA NA Mean 1.7x 17.4x 1.5x 5.9x 24.9% 28.9% Median 2.0x 12.9x 1.6x 8.9x 30.9% 31.1% Notes: (1) FY1 denotes one calendar year forward from the date of the transaction, ie. a transaction announced 4/1/05 would have FY1 = calendar year 05. (2) Based on spot price 30 calendar days prior. (3) Transaction value includes $5.0MM in cash and $1.0MM in possible cash earn-outs. FY1 revenue estimates approximated by NTM guidance from Novatel press release (9/18/07). (4) Transaction value based on Mitsubishi UFJ Securities research estimates, dated 8/1/07. Deal value and forward estimates based on spot rate at time of announcement, 0.0086 USD = 1 JPY. LTM calculations based on average exchange rate over LTM period, 0.0085 USD = 1 JPY. 07 EBITDA estimate approximated by EBIT. (5) Deal includes $21.4MM of purchase proceeds placed in escrow related to tax withholding. LTM financial information as of 9/30/06. Deal value and forward estimates based on spot rate at time of announcement, 0.85 USD = 1 CAD. LTM calculations based on average exchange rate over LTM period, 0.89 USD = 1 CAD. (6) Transaction value based on Trimble 10Q, dated 8/07/07. Financial data based on @Road 10K and 10Q dated 2/15/06 and 11/1/06. (7) Transaction value based on Lowrance press release, dated 1/30/06. Financial data based on Lowrance 10K and 10Q dated 9/9/06 and 11/30/06. Estimates based on Farmhouse Equity Research report dated 9/21/2005. (8) Transaction value based on TomTom 2005 annual report. Datafactory estimated and historical revenue based on annulized TomTom press release, dated 8/24/2005. (9) Deal value and Leica forward estimates based on CHF spot rate at time of announcement and Hexagon share prices based on SEK spot rate: 0.80 USD = 1 CHF, 0.13 USD = 1 SEK. LTM calculations based on average exchange rate over LTM period, 0.78 USD = 1 CHF. Due to multiple bids, premiums are based on final deal value compared to the unaffected stock prices before the first offer was announced (6/13/05). (10) Transaction value based on Sirf 8-K, dated 6/3/05. Revenue estimates annualized for NTM based on Fulcrum Global Partners research estimates, dated 6/13/05. (11) Transaction value based on Garmin 8k, dated 7/24/03. UPS Aviation revenue estimates based on Needham research estimates, dated 7/31/03. (12) Transaction value and Applanix LTM revenues based on Trimble 8-K, dated 6/20/03. LTM financial information as of 7/31/02. |
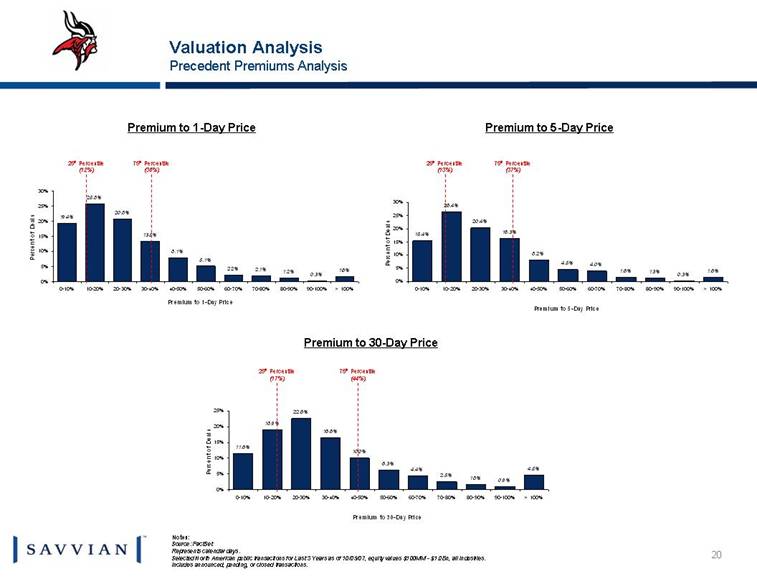
| Valuation Analysis Precedent Premiums Analysis Notes: Source: FactSet Represents calendar days. Selected North American public transactions for Last 3 Years as of 10/05/07, equity values $100MM - $1.0Bn, all industries. Includes announced, pending, or closed transactions. Premium to 1-Day Price Premium to 30-Day Price Premium to 5-Day Price 25th Percentile (12%) 75th Percentile (36%) 25th Percentile (13%) 75th Percentile (37%) 25th Percentile (17%) 75th Percentile (44%) 19.4% 25.8% 20.8% 13.5% 8.1% 5.1% 2.2% 2.1% 1.2% 0.3% 1.6% 0% 5% 10% 15% 20% 25% 30% 0-10% 10-20% 20-30% 30-40% 40-50% 50-60% 60-70% 70-80% 80-90% 90-100% > 100% Premium to 1-Day Price Percent of Deals 11.6% 18.9% 22.6% 16.6% 10.0% 6.3% 4.4% 2.5% 1.8% 0.9% 4.5% 0% 5% 10% 15% 20% 25% 0-10% 10-20% 20-30% 30-40% 40-50% 50-60% 60-70% 70-80% 80-90% 90-100% > 100% Premium to 30-Day Price Percent of Deals 15.4% 26.4% 20.4% 16.3% 8.2% 4.5% 4.0% 1.6% 1.3% 0.3% 1.6% 0% 5% 10% 15% 20% 25% 30% 0-10% 10-20% 20-30% 30-40% 40-50% 50-60% 60-70% 70-80% 80-90% 90-100% > 100% Premium to 5-Day Price Percent of Deals |
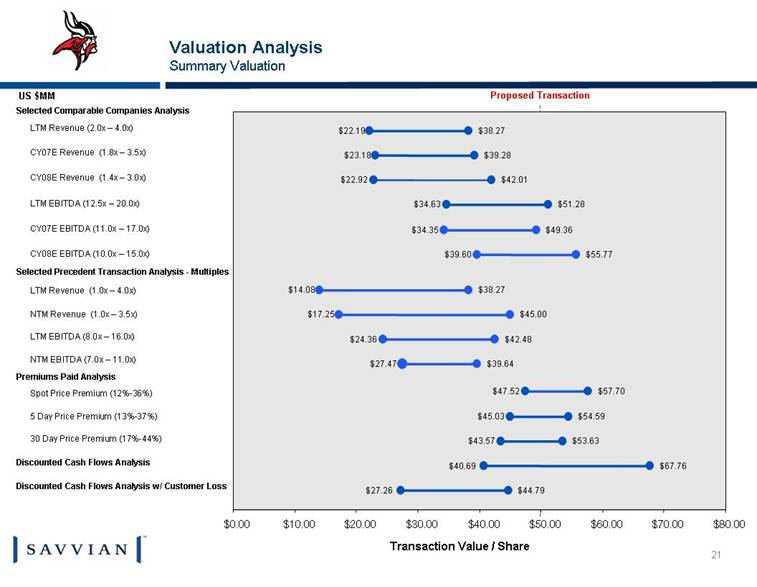
| Valuation Analysis Summary Valuation Selected Comparable Companies Analysis LTM Revenue (2.0x – 4.0x) CY07E Revenue (1.8x – 3.5x) CY08E Revenue (1.4x – 3.0x) LTM EBITDA (12.5x – 20.0x) CY07E EBITDA (11.0x – 17.0x) CY08E EBITDA (10.0x – 15.0x) Selected Precedent Transaction Analysis - Multiples LTM Revenue (1.0x – 4.0x) NTM Revenue (1.0x – 3.5x) LTM EBITDA (8.0x – 16.0x) NTM EBITDA (7.0x – 11.0x) Premiums Paid Analysis Spot Price Premium (12%-36%) 5 Day Price Premium (13%-37%) 30 Day Price Premium (17%-44%) Discounted Cash Flows Analysis Discounted Cash Flows Analysis w/ Customer Loss Proposed Transaction US $MM Transaction Value / Share $39.60 $39.64 $57.70 $54.59 $53.63 $67.76 $44.79 $38.27 $22.19 $23.18 $39.28 $22.92 $42.01 $34.63 $51.28 $34.35 $49.36 $55.77 $14.08 $38.27 $17.25 $45.00 $24.36 $42.48 $27.47 $47.52 $45.03 $43.57 $40.69 $27.26 $0.00 $10.00 $20.00 $30.00 $40.00 $50.00 $60.00 $70.00 $80.00 |
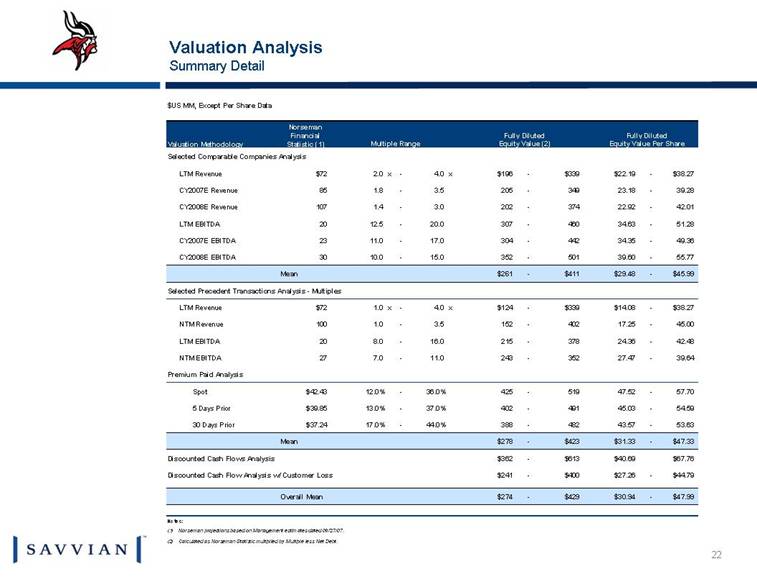
| Valuation Analysis Summary Detail $US MM, Except Per Share Data Norseman Financial Fully Diluted Fully Diluted Valuation Methodology Statistic (1) Multiple Range Equity Value (2) Equity Value Per Share Selected Comparable Companies Analysis LTM Revenue $72 2.0 x - 4.0 x $196 - $339 $22.19 - $38.27 CY2007E Revenue 85 1.8 - 3.5 205 - 349 23.18 - 39.28 CY2008E Revenue 107 1.4 - 3.0 202 - 374 22.92 - 42.01 LTM EBITDA 20 12.5 - 20.0 307 - 460 34.63 - 51.28 CY2007E EBITDA 23 11.0 - 17.0 304 - 442 34.35 - 49.36 CY2008E EBITDA 30 10.0 - 15.0 352 - 501 39.60 - 55.77 Mean $261 - $411 $29.48 - $45.99 Selected Precedent Transactions Analysis - Multiples LTM Revenue $72 1.0 x - 4.0 x $124 - $339 $14.08 - $38.27 NTM Revenue 100 1.0 - 3.5 152 - 402 17.25 - 45.00 LTM EBITDA 20 8.0 - 16.0 215 - 378 24.36 - 42.48 NTM EBITDA 27 7.0 - 11.0 243 - 352 27.47 - 39.64 Premium Paid Analysis Spot $42.43 12.0% - 36.0% 425 - 519 47.52 - 57.70 5 Days Prior $39.85 13.0% - 37.0% 402 - 491 45.03 - 54.59 30 Days Prior $37.24 17.0% - 44.0% 388 - 482 43.57 - 53.63 Mean $278 - $423 $31.33 - $47.33 Discounted Cash Flows Analysis $362 - $613 $40.69 $67.76 Discounted Cash Flow Analysis w/ Customer Loss $241 - $400 $27.26 - $44.79 Overall Mean $274 - $429 $30.94 - $47.99 Notes: (1) Norseman projections based on Management estimates dated 09/27/07. (2) Calculated as Norseman Statistic multiplied by Multiple less Net Debt. |
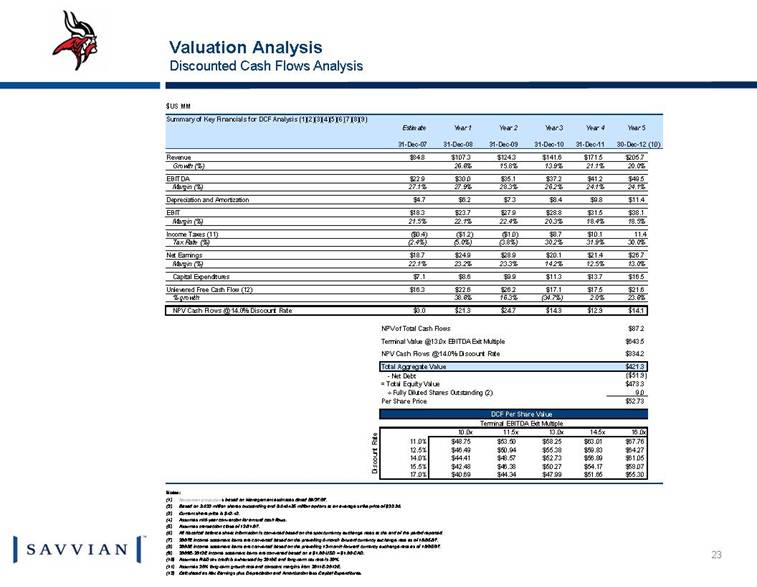
| Valuation Analysis Discounted Cash Flows Analysis $US MM Summary of Key Financials for DCF Analysis (1)(2)(3)(4)(5)(6)(7)(8)(9) Estimate Year 1 Year 2 Year 3 Year 4 Year 5 31-Dec-07 31-Dec-08 31-Dec-09 31-Dec-10 31-Dec-11 30-Dec-12 (10) Revenue $84.8 $107.3 $124.3 $141.6 $171.5 $205.7 Growth (%) 26.6% 15.8% 13.9% 21.1% 20.0% EBITDA $22.9 $30.0 $35.1 $37.2 $41.2 $49.5 Margin (%) 27.1% 27.9% 28.3% 26.2% 24.1% 24.1% Depreciation and Amortization $4.7 $6.2 $7.3 $8.4 $9.8 $11.4 EBIT $18.3 $23.7 $27.9 $28.8 $31.5 $38.1 Margin (%) 21.5% 22.1% 22.4% 20.3% 18.4% 18.5% Income Taxes (11) ($0.4) ($1.2) ($1.0) $8.7 $10.1 11.4 Tax Rate (%) (2.4%) (5.0%) (3.8%) 30.2% 31.9% 30.0% Net Earnings $18.7 $24.9 $28.9 $20.1 $21.4 $26.7 Margin (%) 22.1% 23.2% 23.3% 14.2% 12.5% 13.0% Capital Expenditures $7.1 $8.6 $9.9 $11.3 $13.7 $16.5 Unlevered Free Cash Flow (12) $16.3 $22.6 $26.2 $17.1 $17.5 $21.6 % growth 38.6% 16.3% (34.7%) 2.0% 23.6% NPV Cash Flows @ 14.0% Discount Rate $0.0 $21.3 $24.7 $14.3 $12.9 $14.1 NPV of Total Cash Flows $87.2 Terminal Value @13.0x EBITDA Exit Multiple $643.5 NPV Cash Flows @ 14.0% Discount Rate $334.2 Total Aggregate Value $421.3 - Net Debt ($51.9) = Total Equity Value $473.3 ÷ Fully Diluted Shares Outstanding (2) 9.0 Per Share Price $52.73 DCF Per Share Value Terminal EBITDA Exit Multiple $52.7 10.0x 11.5x 13.0x 14.5x 16.0x 11.0% $48.75 $53.50 $58.25 $63.01 $67.76 12.5% $46.49 $50.94 $55.38 $59.83 $64.27 14.0% $44.41 $48.57 $52.73 $56.89 $61.05 15.5% $42.48 $46.38 $50.27 $54.17 $58.07 17.0% $40.69 $44.34 $47.99 $51.65 $55.30 Notes: (1) Norseman projections based on Management estimates dated 09/27/07. (2) Based on 8.622 million shares outstanding and 0.646485 million options at an average strike price of $23.86. (3) Current share price is $42.43. (4) Assumes mid-year convention for annual cash flows. (5) Assumes transaction close of 12/31/07. (6) All historical balance sheet information is converted based on the spot currency exchange rates at the end of the period reported. (7) 2007E income statement items are converted based on the prevailing 6-month forward currency exchange rate as of 10/05/07. (8) 2008E income statement items are converted based on the prevailing 12-month forward currency exchange rate as of 10/05/07. (9) 2009E-2012E income statement items are converted based on a $1.00 USD = $1.00 CAD. (10) Assumes R&D tax credit is exhausted by 2010E and long-term tax rate is 30%. (11) Assumes 20% long-term growth rate and constant margins from 2011E-2012E. (12) Calculated as Net Earnings plus Depreciation and Amortization less Capital Expenditures. Discount Rate |
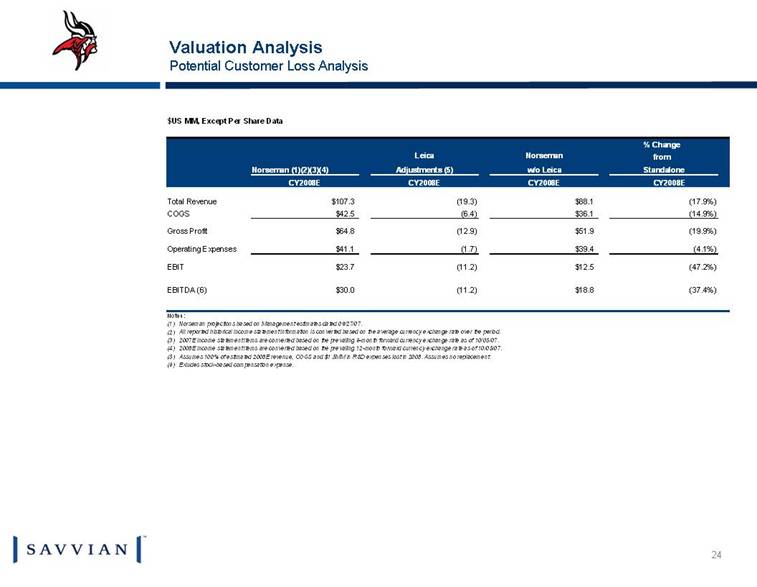
| Valuation Analysis Potential Customer Loss Analysis $US MM, Except Per Share Data % Change Leica Norseman from Norseman (1)(2)(3)(4) Adjustments (5) w/o Leica Standalone CY2008E CY2008E CY2008E CY2008E Total Revenue $107.3 (19.3) $88.1 (17.9%) COGS $42.5 (6.4) $36.1 (14.9%) Gross Profit $64.8 (12.9) $51.9 (19.9%) Operating Expenses $41.1 (1.7) $39.4 (4.1%) EBIT $23.7 (11.2) $12.5 (47.2%) EBITDA (6) $30.0 (11.2) $18.8 (37.4%) Notes: (1) Norseman projections based on Management estimates dated 09/27/07. (2) All reported historical income statement information is converted based on the average currency exchange rate over the period. (3) 2007E income statement items are converted based on the prevailing 6-month forward currency exchange rate as of 10/05/07. (4) 2008E income statement items are converted based on the prevailing 12-month forward currency exchange rate as of 10/05/07. (5) Assumes 100% of estimated 2008E revenue, COGS and $1.5MM in R&D expenses lost in 2008. Assumes no replacement. (6) Exludes stock-based compensation expense. |
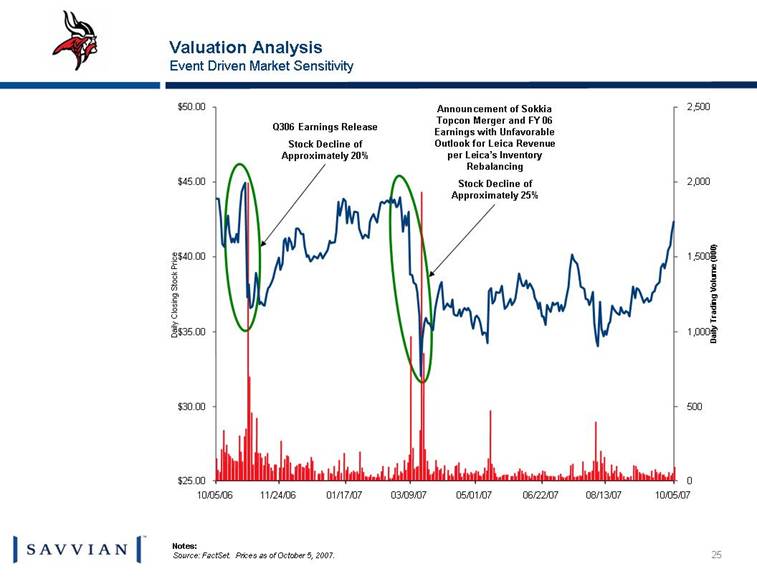
| Valuation Analysis Event Driven Market Sensitivity Notes: Source: FactSet. Prices as of October 5, 2007. Announcement of Sokkia Topcon Merger and FY 06 Earnings with Unfavorable Outlook for Leica Revenue per Leica’s Inventory Rebalancing Stock Decline of Approximately 25% Q306 Earnings Release Stock Decline of Approximately 20% 10/05/06 11/24/06 01/17/07 03/09/07 05/01/07 06/22/07 08/13/07 10/05/07 $25.00 $30.00 $35.00 $40.00 $45.00 $50.00 Daily Closing Stock Price 0 500 1,000 1,500 2,000 2,500 Daily Trading Volume (000) 10/05/06 11/24/06 01/17/07 03/09/07 05/01/07 06/22/07 08/13/07 10/05/07 $25.00 $30.00 $35.00 $40.00 $45.00 $50.00 Daily Closing Stock Price 0 500 1,000 1,500 2,000 2,500 Daily Trading Volume (000) |
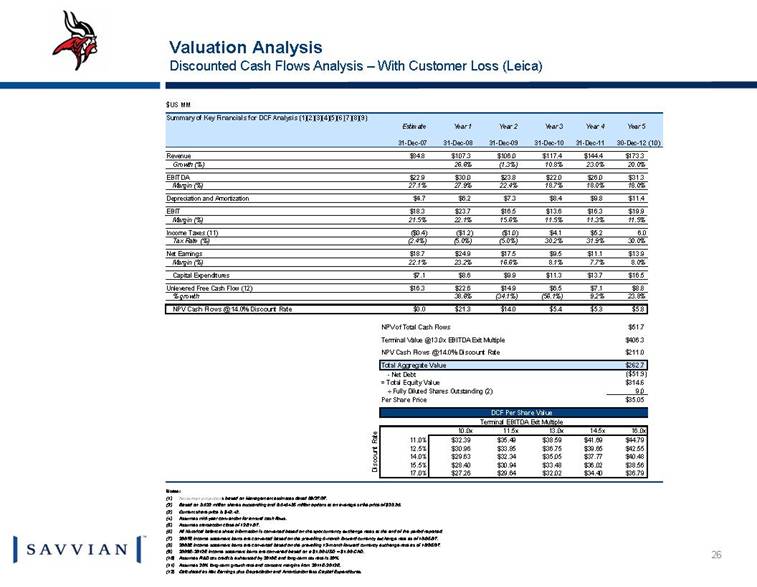
| Valuation Analysis Discounted Cash Flows Analysis – With Customer Loss (Leica) $US MM Summary of Key Financials for DCF Analysis (1)(2)(3)(4)(5)(6)(7)(8)(9) Estimate Year 1 Year 2 Year 3 Year 4 Year 5 31-Dec-07 31-Dec-08 31-Dec-09 31-Dec-10 31-Dec-11 30-Dec-12 (10) Revenue $84.8 $107.3 $106.0 $117.4 $144.4 $173.3 Growth (%) 26.6% (1.3%) 10.8% 23.0% 20.0% EBITDA $22.9 $30.0 $23.8 $22.0 $26.0 $31.3 Margin (%) 27.1% 27.9% 22.4% 18.7% 18.0% 18.0% Depreciation and Amortization $4.7 $6.2 $7.3 $8.4 $9.8 $11.4 EBIT $18.3 $23.7 $16.5 $13.6 $16.3 $19.9 Margin (%) 21.5% 22.1% 15.6% 11.5% 11.3% 11.5% Income Taxes (11) ($0.4) ($1.2) ($1.0) $4.1 $5.2 6.0 Tax Rate (%) (2.4%) (5.0%) (5.0%) 30.2% 31.9% 30.0% Net Earnings $18.7 $24.9 $17.5 $9.5 $11.1 $13.9 Margin (%) 22.1% 23.2% 16.6% 8.1% 7.7% 8.0% Capital Expenditures $7.1 $8.6 $9.9 $11.3 $13.7 $16.5 Unlevered Free Cash Flow (12) $16.3 $22.6 $14.9 $6.5 $7.1 $8.8 % growth 38.6% (34.1%) (56.1%) 9.2% 23.8% NPV Cash Flows @ 14.0% Discount Rate $0.0 $21.3 $14.0 $5.4 $5.3 $5.8 NPV of Total Cash Flows $51.7 Terminal Value @13.0x EBITDA Exit Multiple $406.3 NPV Cash Flows @ 14.0% Discount Rate $211.0 Total Aggregate Value $262.7 - Net Debt ($51.9) = Total Equity Value $314.6 ÷ Fully Diluted Shares Outstanding (2) 9.0 Per Share Price $35.05 DCF Per Share Value Terminal EBITDA Exit Multiple $35.1 10.0x 11.5x 13.0x 14.5x 16.0x 11.0% $32.39 $35.49 $38.59 $41.69 $44.79 12.5% $30.96 $33.85 $36.75 $39.65 $42.55 14.0% $29.63 $32.34 $35.05 $37.77 $40.48 15.5% $28.40 $30.94 $33.48 $36.02 $38.56 17.0% $27.26 $29.64 $32.02 $34.40 $36.79 Notes: (1) Norseman projections based on Management estimates dated 09/27/07. (2) Based on 8.622 million shares outstanding and 0.646485 million options at an average strike price of $23.86. (3) Current share price is $42.43. (4) Assumes mid-year convention for annual cash flows. (5) Assumes transaction close of 12/31/07. (6) All historical balance sheet information is converted based on the spot currency exchange rates at the end of the period reported. (7) 2007E income statement items are converted based on the prevailing 6-month forward currency exchange rate as of 10/05/07. (8) 2008E income statement items are converted based on the prevailing 12-month forward currency exchange rate as of 10/05/07. (9) 2009E-2012E income statement items are converted based on a $1.00 USD = $1.00 CAD. (10) Assumes R&D tax credit is exhausted by 2010E and long-term tax rate is 30%. (11) Assumes 20% long-term growth rate and constant margins from 2011E-2012E. (12) Calculated as Net Earnings plus Depreciation and Amortization less Capital Expenditures. Discount Rate |
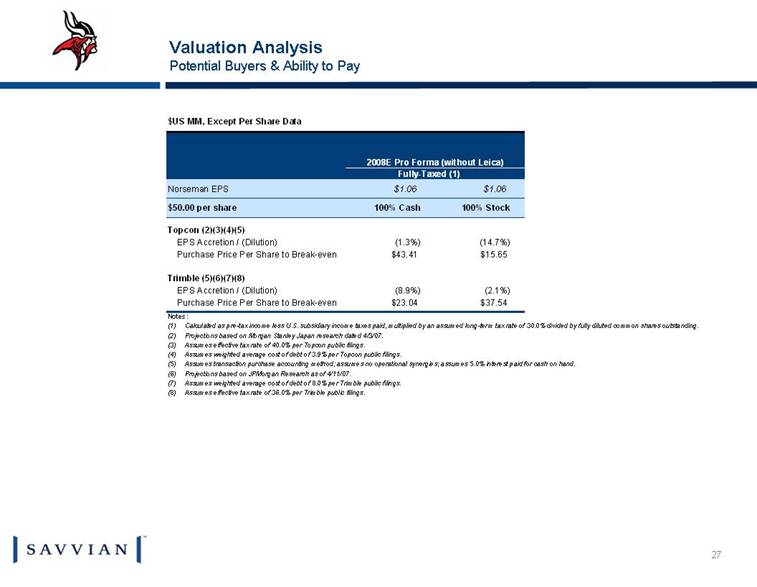
| Valuation Analysis Potential Buyers & Ability to Pay $US MM, Except Per Share Data 2008E Pro Forma (without Leica) Fully-Taxed (1) Norseman EPS $1.06 $1.06 $50.00 per share 100% Cash 100% Stock Topcon (2)(3)(4)(5) EPS Accretion / (Dilution) (1.3%) (14.7%) Purchase Price Per Share to Break-even $43.41 $15.65 Trimble (5)(6)(7)(8) EPS Accretion / (Dilution) (8.9%) (2.1%) Purchase Price Per Share to Break-even $23.04 $37.54 Notes: (1) Calculated as pre-tax income less U.S. subsidiary income taxes paid, multiplied by an assumed long-term tax rate of 30.0% divided by fully diluted common shares outstanding. (2) Projections based on Morgan Stanley Japan research dated 4/3/07. (3) Assumes effective tax rate of 40.0% per Topcon public filings. (4) Assumes weighted average cost of debt of 3.9% per Topcon public filings. (5) Assumes transaction purchase accounting method; assumes no operational synergies; assumes 5.0% interest paid for cash on hand. (6) Projections based on JPMorgan Research as of 4/11/07. (7) Assumes weighted average cost of debt of 8.0% per Trimble public filings. (8) Assumes effective tax rate of 36.0% per Trimble public filings. |
| Appendix |
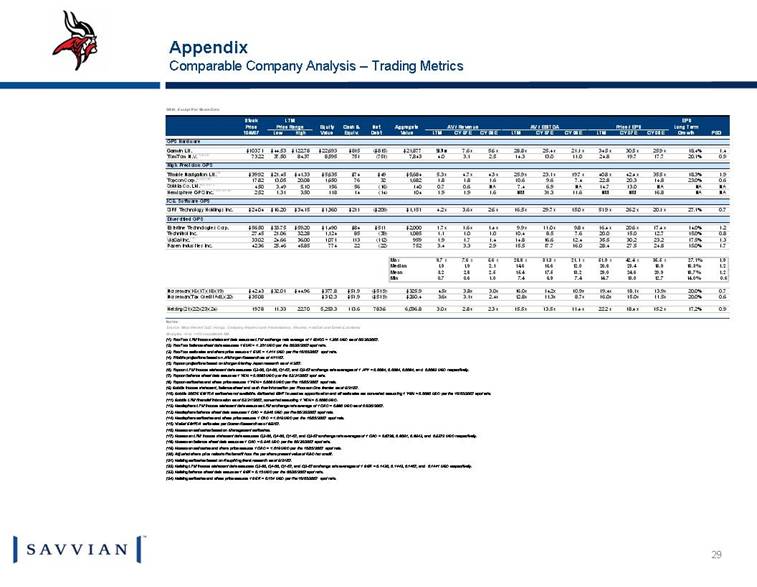
| Appendix Comparable Company Analysis – Trading Metrics $MM, Except Per Share Data fdsup:app=SCRIPT&creator=factset&CMD=INSTRUCTION&WINDOW=NEW&TARGET_APP=EDGAR\Search by Symbol&INSTRUCTION_NAME=VIEW_DOCUMENT&display_string=View Table&IDENTIFIER=IT&START_DATE=20070301&END_DATE=20070301&FILING=10-K&TITLE=Options Table (Activity) Stock LTM EPS Price Price Range Equity Cash & Net Aggregate AV / Revenue AV / EBITDA Price / EPS Long Term 10/5/07 Low High Value Equiv. Debt Value LTM CY 07E CY 08E LTM CY 07E CY 08E LTM CY 07E CY 08E Growth PEG GPS Hardware Garmin Ltd. $103.71 $44.53 $122.78 $22,693 $815 ($815) $21,877 18.4% 1.4 TomTom N.V. (1)(2)(3) 73.22 37.50 84.37 8,595 751 (751) 7,843 20.1% 0.9 High Precision GPS Trimble Navigation Ltd. (4) $39.92 $21.45 $41.33 $5,635 $74 $49 $5,684 18.3% 1.9 Topcon Corp. (5)(6)(7)(8) 17.82 13.05 20.08 1,650 76 32 1,682 23.0% 0.6 Sokkia Co. Ltd. (9)(10)(11) 4.50 3.49 5.10 156 56 (16) 140 NA NA NA NA NA Hemisphere GPS Inc. (12)(13)(14) 2.52 1.31 3.50 118 14 (14) 104 NM NM NM NA NA IC & Software GPS SiRF Technology Holdings Inc. $24.04 $16.20 $34.15 $1,360 $211 ($209) $1,151 27.1% 0.7 Diversified GPS Esterline Technologies Corp. $56.50 $33.75 $59.20 $1,490 $84 $511 $2,000 14.0% 1.2 Technitrol Inc. 27.45 21.06 32.28 1,124 85 (39) 1,085 15.0% 0.8 ViaSat Inc. (15) 33.02 24.66 36.00 1,071 113 (112) 959 17.5% 1.3 Raven Industries Inc. 42.36 25.46 45.85 774 22 (22) 752 15.0% 1.7 Max 9.7 x 7.6 x 5.6 x 28.8 x 31.3 x 21.1 x 51.9 x 42.4 x 35.5 x 27.1% 1.9 Median 1.9 1.9 2.1 14.6 16.6 12.0 26.6 23.4 18.9 18.3% 1.2 Mean 3.2 2.8 2.5 15.4 17.5 13.2 29.0 24.6 20.9 18.7% 1.2 Min 0.7 0.6 1.0 7.4 6.9 7.4 14.7 13.0 12.7 14.0% 0.6 Norseman(16)(17)(18)(19) $42.43 $32.01 $44.96 $377.8 $51.9 ($51.9) $325.9 4.5x 3.8x 3.0x 16.0x 14.2x 10.9x 19.4x 18.1x 13.9x 20.0% 0.7 Norseman(Tax Credit Adj.)(20) $35.08 $312.3 $51.9 ($51.9) $260.4 3.6x 3.1x 2.4x 12.8x 11.3x 8.7x 16.0x 15.0x 11.5x 20.0% 0.6 Helsing(21)(22)(23)(24) 19.78 11.33 22.70 5,253.3 113.6 783.6 6,036.8 17.2% 0.9 Notes: Source: Most Recent SEC Filings, Company Reports and Presentations, Reuters, FactSet and Street Estimates Multiples <0 or >100 considered NM. (1) TomTom LTM income statement data assumes LTM exchange rate average of 1 EURO = 1.300 USD as of 06/30/2007. (2) TomTom balance sheet data assumes 1 EUR = 1.351 USD per the 06/30/2007 spot rate. (3) TomTom estimates and share price assume 1 EUR = 1.414 USD per the 10/05/2007 spot rate. (4) Trimble projections based on JPMorgan Research as of 4/11/07. (5) Topcon projections based on Morgan Stanley Japan research as of 4/3/07. (6) Topcon LTM income statement data assumes Q3-06, Q4-06, Q1-07, and Q2-07 exchange rate averages of 1 JPY = 0.0084, 0.0084, 0.0084, and 0.0082 USD respectively. (7) Topcon balance sheet data assumes 1 YEN = 0.0085 USD per the 03/31/2007 spot rate. (8) Topcon estimates and share price assume 1 YEN = 0.0086 USD per the 10/05/2007 spot rate. (9) Sokkia income statement, balance sheet and cash flow information per Thomson One Banker as of 9/21/07. (10) Sokkia 2007E EBITDA estimates not available. Estimated EBIT is used as approximation and all estimates are converted assuming 1 YEN = 0.0086 USD per the 10/05/2007 spot rate. (11) Sokkia LTM financial information as of 03/31/2007, converted assuming 1 YEN = 0.0086 USD. (12) Hemisphere LTM income statement data assumes LTM exchange rate average of 1 CAD = 0.886 USD as of 06/30/2007. (13) Hemisphere balance sheet data assumes 1 CAD = 0.940 USD per the 06/30/2007 spot rate. (14) Hemisphere estimates and share price assume 1 CAD = 1.019 USD per the 10/05/2007 spot rate. (15) ViaSat EBITDA estimates per Cowen Research as of 8/9/07. (16) Norseman estimates based on Management estimates. (17) Norseman LTM income statement data assumes Q3-06, Q4-06, Q1-07, and Q2-07 exchange rate averages of 1 CAD = 0.8728, 0.8691, 0.8943, and 0.9372 USD respectively. (18) Norseman balance sheet data assumes 1 CAD = 0.940 USD per the 06/30/2007 spot rate. (19) Norseman estimates and share price assume 1 CAD = 1.019 USD per the 10/05/2007 spot rate. (20) Adjusted share price reflects the benefit from the per share present value of R&D tax credit. (21) Helsing estimates based on Kaupthing Bank research as of 9/21/07. (22) Helsing LTM income statement data assumes Q3-06, Q4-06, Q1-07, and Q2-07 exchange rate averages of 1 SEK = 0.1430, 0.1442, 0.1467, and 0.1441 USD respectively. (23) Helsing balance sheet data assumes 1 SEK = 0.15 USD per the 06/30/2007 spot rate. (24) Helsing estimates and share price assume 1 SEK = 0.154 USD per the 10/05/2007 spot rate. 15.2 x 18.4 x 22.2 x 11.4 x 13.5 x 15.5 x 2.3 x 2.8 x 3.0 x 24.8 27.5 28.4 16.0 17.7 15.5 2.9 3.3 3.4 23.2 30.2 35.5 12.4 16.6 14.8 1.4 1.7 1.9 12.7 15.0 20.0 7.6 8.5 10.4 1.0 1.0 1.1 17.4 x 20.6 x 16.4 x 9.8 x 11.0 x 9.9 x 1.4 x 1.6 x 1.7 x 20.1 x 26.2 x 51.9 x 15.0 x 29.7 x 16.5 x 2.6 x 3.6 x 4.2 x 16.8 11.6 31.3 1.6 1.9 1.9 13.0 14.7 6.9 7.4 0.6 0.7 14.8 20.3 22.8 7.4 9.6 10.6 1.6 1.8 1.8 35.5 x 42.4 x 40.8 x 19.7 x 23.1 x 25.9 x 4.3 x 4.7 x 5.3 x 17.7 19.7 24.8 11.0 13.0 14.3 2.5 3.1 4.0 25.9 x 30.5 x 34.5 x 21.1 x 25.4 x 28.8 x 5.6 x 7.6 x 9.7 x |
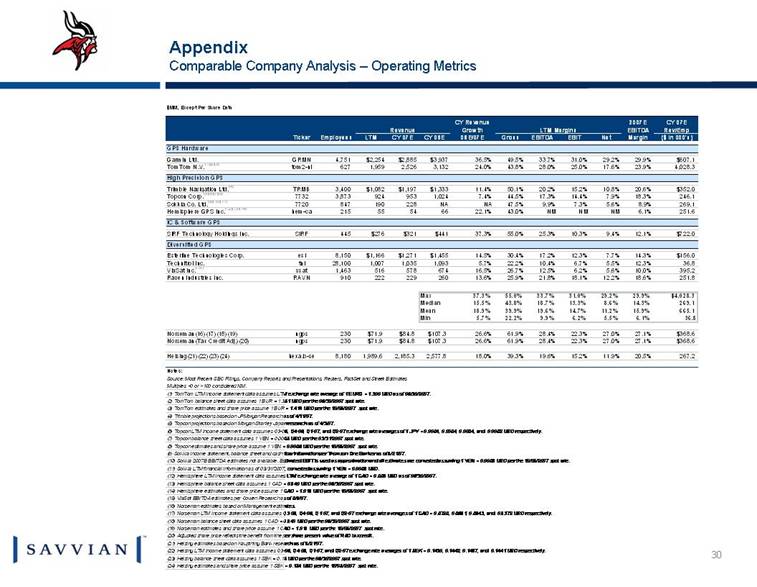
| Appendix Comparable Company Analysis – Operating Metrics $MM, Except Per Share Data fdsup:app=SCRIPT&creator=factset&CMD=INSTRUCTION&WINDOW=NEW&TARGET_APP=EDGAR\Search by Symbol&INSTRUCTION_NAME=VIEW_DOCUMENT&display_string=View Table&IDENTIFIER=IT&START_DATE=20070301&END_DATE=20070301&FILING=10-K&TITLE=Options Table (Activity) CY Revenue 2007E CY 07E Revenue Growth LTM Margins EBITDA Rev/Emp Ticker Employees LTM CY 07E CY 08E 08E/07E Gross EBITDA EBIT Net Margin ($ in 000's) GPS Hardware Garmin Ltd. GRMN 4,751 $2,254 $2,885 $3,937 36.5% 49.5% 33.7% 31.0% 29.2% 29.9% $607.1 TomTom N.V. (1)(2)(3) tom2-nl 627 1,959 2,526 3,132 24.0% 43.8% 28.0% 25.0% 17.6% 23.9% 4,028.3 High Precision GPS Trimble Navigation Ltd. (4) TRMB 3,400 $1,082 $1,197 $1,333 11.4% 50.1% 20.2% 15.2% 10.8% 20.6% $352.0 Topcon Corp. (5)(6)(7)(8) 7732 3,873 924 953 1,024 7.4% 44.5% 17.3% 14.4% 7.9% 18.3% 246.1 Sokkia Co. Ltd. (9)(10)(11) 7720 847 190 228 NA NA 47.5% 9.9% 7.3% 5.6% 8.9% 269.1 Hemisphere GPS Inc. (12)(13)(14) hem-ca 215 55 54 66 22.1% 43.0% NM NM NM 6.1% 251.6 IC & Software GPS SiRF Technology Holdings Inc. SIRF 445 $276 $321 $441 37.3% 55.0% 25.3% 10.3% 9.4% 12.1% $722.0 Diversified GPS Esterline Technologies Corp. esl 8,150 $1,166 $1,271 $1,455 14.5% 30.4% 17.2% 12.3% 7.7% 14.3% $156.0 Technitrol Inc. tnl 28,100 1,007 1,035 1,093 5.7% 22.2% 10.4% 6.7% 5.5% 12.3% 36.8 ViaSat Inc. (15) vsat 1,463 516 578 674 16.5% 26.7% 12.5% 6.2% 5.6% 10.0% 395.2 Raven Industries Inc. RAVN 910 222 229 260 13.6% 25.9% 21.8% 18.1% 12.2% 18.6% 251.8 Max 37.3% 55.0% 33.7% 31.0% 29.2% 29.9% $4,028.3 Median 15.5% 43.8% 18.7% 13.3% 8.6% 14.3% 269.1 Mean 18.9% 39.9% 19.6% 14.7% 11.2% 15.9% 665.1 Min 5.7% 22.2% 9.9% 6.2% 5.5% 6.1% 36.8 Norseman(16)(17)(18)(19) ngps 230 $71.9 $84.8 $107.3 26.6% 61.9% 28.4% 22.3% 27.0% 27.1% $368.6 Norseman(Tax Credit Adj.)(20) ngps 230 $71.9 $84.8 $107.3 26.6% 61.9% 28.4% 22.3% 27.0% 27.1% $368.6 Helsing(21)(22)(23)(24) hexa.b-se 8,180 1,989.6 2,185.3 2,577.8 18.0% 39.3% 19.6% 15.2% 11.9% 20.5% 267.2 Notes: Source: Most Recent SEC Filings, Company Reports and Presentations, Reuters, FactSet and Street Estimates Multiples <0 or >100 considered NM. (1) TomTom LTM income statement data assumes LTM exchange rate average of 1 EURO = 1.300 USD as of 06/30/2007. (2) TomTom balance sheet data assumes 1 EUR = 1.351 USD per the 06/30/2007 spot rate. (3) TomTom estimates and share price assume 1 EUR = 1.414 USD per the 10/05/2007 spot rate. (4) Trimble projections based on JPMorgan Research as of 4/11/07. (5) Topcon projections based on Morgan Stanley Japan research as of 4/3/07. (6) Topcon LTM income statement data assumes Q3-06, Q4-06, Q1-07, and Q2-07 exchange rate averages of 1 JPY = 0.0084, 0.0084, 0.0084, and 0.0082 USD respectively. (7) Topcon balance sheet data assumes 1 YEN = 0.0085 USD per the 03/31/2007 spot rate. (8) Topcon estimates and share price assume 1 YEN = 0.0086 USD per the 10/05/2007 spot rate. (9) Sokkia income statement, balance sheet and cash flow information per Thomson One Banker as of 9/21/07. (10) Sokkia 2007E EBITDA estimates not available. Estimated EBIT is used as approximation and all estimates are converted assuming 1 YEN = 0.0086 USD per the 10/05/2007 spot rate. (11) Sokkia LTM financial information as of 03/31/2007, converted assuming 1 YEN = 0.0086 USD. (12) Hemisphere LTM income statement data assumes LTM exchange rate average of 1 CAD = 0.886 USD as of 06/30/2007. (13) Hemisphere balance sheet data assumes 1 CAD = 0.940 USD per the 06/30/2007 spot rate. (14) Hemisphere estimates and share price assume 1 CAD = 1.019 USD per the 10/05/2007 spot rate. (15) ViaSat EBITDA estimates per Cowen Research as of 8/9/07. (16) Norseman estimates based on Management estimates. (17) Norseman LTM income statement data assumes Q3-06, Q4-06, Q1-07, and Q2-07 exchange rate averages of 1 CAD = 0.8728, 0.8691, 0.8943, and 0.9372 USD respectively. (18) Norseman balance sheet data assumes 1 CAD = 0.940 USD per the 06/30/2007 spot rate. (19) Norseman estimates and share price assume 1 CAD = 1.019 USD per the 10/05/2007 spot rate. (20) Adjusted share price reflects the benefit from the per share present value of R&D tax credit. (21) Helsing estimates based on Kaupthing Bank research as of 9/21/07. (22) Helsing LTM income statement data assumes Q3-06, Q4-06, Q1-07, and Q2-07 exchange rate averages of 1 SEK = 0.1430, 0.1442, 0.1467, and 0.1441 USD respectively. (23) Helsing balance sheet data assumes 1 SEK = 0.15 USD per the 06/30/2007 spot rate. (24) Helsing estimates and share price assume 1 SEK = 0.154 USD per the 10/05/2007 spot rate. |
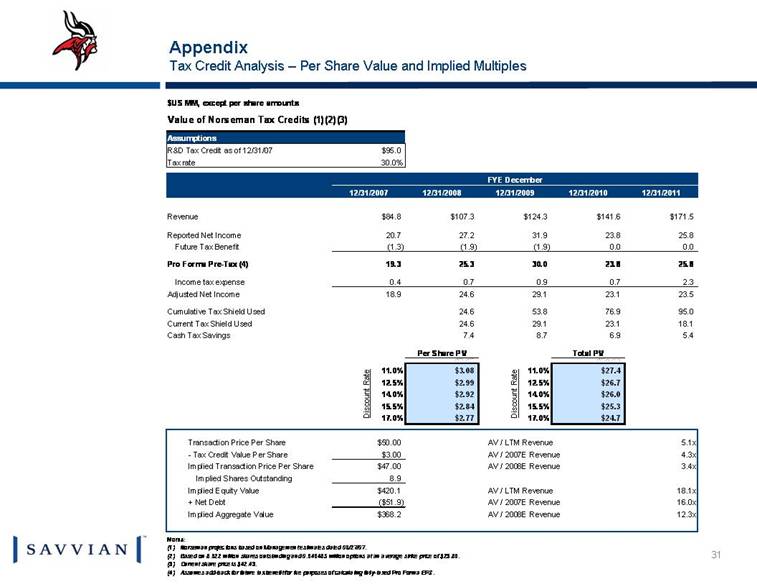
| Appendix Tax Credit Analysis – Per Share Value and Implied Multiples $US MM, except per share amounts Value of Norseman Tax Credits (1)(2)(3) Assumptions R&D Tax Credit as of 12/31/07 $95.0 Tax rate 30.0% FYE December 10/5/2007 12/31/2007 12/31/2008 12/31/2009 12/31/2010 12/31/2011 Revenue $84.8 $107.3 $124.3 $141.6 $171.5 Reported Net Income 20.7 27.2 31.9 23.8 25.8 Future Tax Benefit (1.3) (1.9) (1.9) 0.0 0.0 Pro Forma Pre-Tax (4) 19.3 25.3 30.0 23.8 25.8 Income tax expense 0.4 0.7 0.9 0.7 2.3 Adjusted Net Income 18.9 24.6 29.1 23.1 23.5 Cumulative Tax Shield Used 18.9 24.6 53.8 76.9 95.0 Current Tax Shield Used 18.9 24.6 29.1 23.1 18.1 Cash Tax Savings 0 5.7 7.4 8.7 6.9 5.4 Per Share PV Total PV $2.92 $25.96 11.0% $3.08 11.0% $27.4 12.5% $2.99 12.5% $26.7 14.0% $2.92 14.0% $26.0 15.5% $2.84 15.5% $25.3 17.0% $2.77 17.0% $24.7 Transaction Price Per Share $50.00 AV / LTM Revenue 5.1x - Tax Credit Value Per Share $3.00 AV / 2007E Revenue 4.3x Implied Transaction Price Per Share $47.00 AV / 2008E Revenue 3.4x Implied Shares Outstanding 8.9 Implied Equity Value $420.1 AV / LTM Revenue 18.1x + Net Debt ($51.9) AV / 2007E Revenue 16.0x Implied Aggregate Value $368.2 AV / 2008E Revenue 12.3x Notes: (1) Norseman projections based on Management estimates dated 09/27/07. (2) Based on 8.622 million shares outstanding and 0.646485 million options at an average strike price of $23.86. (3) Current share price is $42.43. (4) Assumes add-back for future tax benefit for the purposes of calculating fully-taxed Pro Forma EPS. Discount Rate Discount Rate |
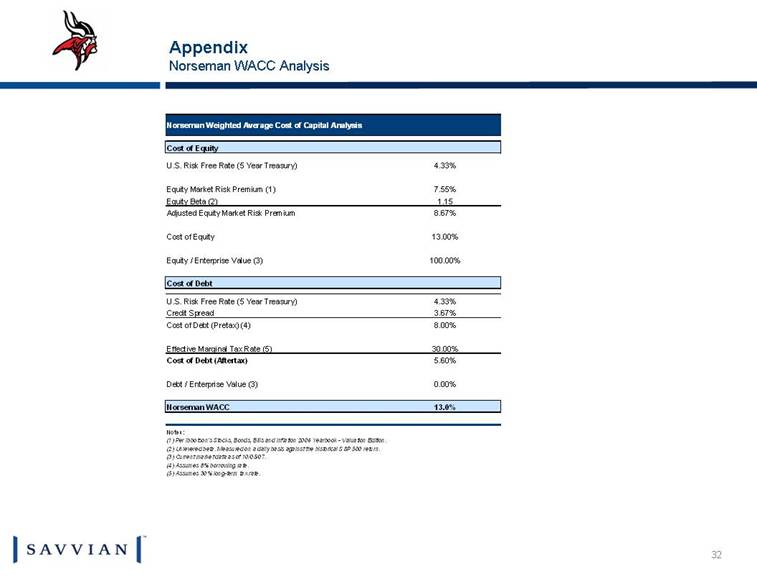
| Appendix Norseman WACC Analysis Norseman Weighted Average Cost of Capital Analysis Cost of Equity U.S. Risk Free Rate (5 Year Treasury) 4.33% Equity Market Risk Premium (1) 7.55% Equity Beta (2) 1.15 Adjusted Equity Market Risk Premium 8.67% Cost of Equity 13.00% Equity / Enterprise Value (3) 100.00% Cost of Debt U.S. Risk Free Rate (5 Year Treasury) 4.33% Credit Spread 3.67% Cost of Debt (Pretax) (4) 8.00% Effective Marginal Tax Rate (5) 30.00% Cost of Debt (Aftertax) 5.60% Debt / Enterprise Value (3) 0.00% Norseman WACC 13.0% Notes: (1) Per Ibbotson's Stocks, Bonds, Bills and Inflation 2006 Yearbook - Valuation Edition. (2) Unlevered beta. Measured on a daily basis against the historical S&P 500 return. (3) Current market data as of 10/05/07. (4) Assumes 8% borrowing rate. (5) Assumes 30% long-term tax rate. |
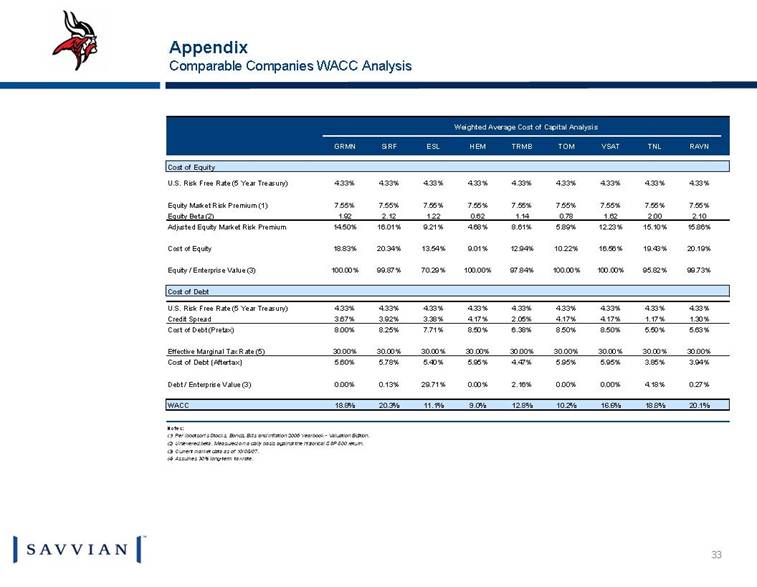
| Appendix Comparable Companies WACC Analysis Weighted Average Cost of Capital Analysis GRMN SiRF ESL HEM TRMB TOM VSAT TNL RAVN Cost of Equity U.S. Risk Free Rate (5 Year Treasury) 4.33% 4.33% 4.33% 4.33% 4.33% 4.33% 4.33% 4.33% 4.33% Equity Market Risk Premium (1) 7.55% 7.55% 7.55% 7.55% 7.55% 7.55% 7.55% 7.55% 7.55% Equity Beta (2) 1.92 2.12 1.22 0.62 1.14 0.78 1.62 2.00 2.10 Adjusted Equity Market Risk Premium 14.50% 16.01% 9.21% 4.68% 8.61% 5.89% 12.23% 15.10% 15.86% Cost of Equity 18.83% 20.34% 13.54% 9.01% 12.94% 10.22% 16.56% 19.43% 20.19% Equity / Enterprise Value (3) 100.00% 99.87% 70.29% 100.00% 97.84% 100.00% 100.00% 95.82% 99.73% Cost of Debt U.S. Risk Free Rate (5 Year Treasury) 4.33% 4.33% 4.33% 4.33% 4.33% 4.33% 4.33% 4.33% 4.33% Credit Spread 3.67% 3.92% 3.38% 4.17% 2.05% 4.17% 4.17% 1.17% 1.30% Cost of Debt (Pretax) 8.00% 8.25% 7.71% 8.50% 6.38% 8.50% 8.50% 5.50% 5.63% Effective Marginal Tax Rate (5) 30.00% 30.00% 30.00% 30.00% 30.00% 30.00% 30.00% 30.00% 30.00% Cost of Debt (Aftertax) 5.60% 5.78% 5.40% 5.95% 4.47% 5.95% 5.95% 3.85% 3.94% Debt / Enterprise Value (3) 0.00% 0.13% 29.71% 0.00% 2.16% 0.00% 0.00% 4.18% 0.27% WACC 18.8% 20.3% 11.1% 9.0% 12.8% 10.2% 16.6% 18.8% 20.1% Notes: (1) Per Ibbotson's Stocks, Bonds, Bills and Inflation 2006 Yearbook - Valuation Edition. (2) Unlevered beta. Measured on a daily basis against the historical S&P 500 return. (3) Current market data as of 10/05/07. (4) Assumes 30% long-term tax rate. |