UNITED STATES
SECURITIES AND EXCHANGE COMMISSION
Washington, D.C. 20549
FORM 20-F
¨ REGISTRATION STATEMENT PURSUANT TO SECTION 12(b) OR (g) OF THE SECURITIES EXCHANGE ACT OF 1934
OR
x ANNUAL REPORT PURSUANT TO SECTION 13 OR 15(d) OF THE SECURITIES EXCHANGE ACT OF 1934
For the fiscal year ended December 31, 2006
OR
¨ TRANSITION REPORT PURSUANT TO SECTION 13 OR 15(d) OF THE SECURITIES EXCHANGE ACT OF 1934
OR
¨ SHELL COMPANY REPORT PURSUANT TO SECTION 13 OR 15 (d) OF THE SECURITIES EXCHANGE ACT OF 1934
Commission file number 0-29004
NOVATEL INC.
(Exact name of Registrant as specified in its charter)
N/A
(Translation of Registrant’s name into English)
Canada
(Jurisdiction of incorporation or organization)
1120-68th Avenue N.E., Calgary, Alberta, Canada T2E 8S5
(Address of principal executive offices)
SECURITIES REGISTERED OR TO BE REGISTERED PURSUANT TO SECTION 12(b) OF THE ACT:
Title of Each Class | Name of Each Exchange on Which Registered | |
Common Shares | The NASDAQ Stock Market, LLC |
SECURITIES REGISTERED OR TO BE REGISTERED PURSUANT TO SECTION 12(g) OF THE ACT: NONE
SECURITIES FOR WHICH THERE IS A REPORTING OBLIGATION PURSUANT TO
SECTION 15(d) OF THE ACT: NONE
At December 31, 2006, Registrant had outstanding 8,528,636 Common Shares, no par value.
Indicate by check mark if the Registrant is a well-known seasoned issuer, as defined in Rule 405 of the Securities Act.
Yes ¨ No x
If this report is an annual or transition report, indicate by check mark if the Registrant is not required to file reports pursuant to Section 13 or 15(d) of the Securities Exchange Act 1934.
Yes ¨ No x
Indicate by check mark whether the Registrant (1) has filed all reports required to be filed by Section 13 or 15(d) of the Securities Exchange Act of 1934 during the preceding 12 months (or for such shorter period that the Registrant was required to file such reports) and (2) has been subject to such filing requirement for the past 90 days.
Yes x No ¨
Indicate by check mark whether the Registrant is a large accelerated filer, an accelerated filer, or a non-accelerated filer. See definition of “accelerated filer and large accelerated filer” in Rule 12b-2 of the Exchange Act. (Check one):
Large accelerated filer ¨ Accelerated filer x Non-accelerated filer ¨
Indicate by check mark which financial statement item the Registrant has elected to follow.
Item 17 ¨ Item 18 x
If this is an annual report, indicate by check mark whether the Registrant is a shell company (as defined in Rule 12b-2 of the Exchange Act).
Yes ¨ No x
Table of Contents
i
The dollar amounts presented in this Annual Report on Form 20-F are in Canadian currency unless otherwise noted (CDN$1.00 = U.S. $0.9264 on May 25, 2007), and are presented in accordance with accounting principles generally accepted in Canada. Historic rates of exchange appear in Part I, “Item 3 — Key Information, Selected Financial Data.” The material differences between Canadian and U.S. generally accepted accounting principles (“GAAP”) which would bear upon NovAtel Inc.’s, (hereinafter referred to as “NovAtel” or “the Company”), financial statements and, more particularly, income applicable to shareholders’ equity are disclosed in Note 20 of Notes to Consolidated Financial Statements.
Certain statements in this Annual Report, including those about the Company’s future plans and intentions, financial guidance, risk factors, long-term growth prospects, levels of activity or other future events, are forward-looking statements within the meaning of the Private Securities Litigation Reform Act of 1995. These forward-looking statements are not based on historical facts but rather on management’s current expectations regarding NovAtel’s future growth, results of operations, performance, future capital and other expenditures, competitive advantages, business prospects and opportunities. Wherever possible, words such as “anticipate”, “believe”, “expect”, “may”, “could”, “potential”, “intend”, “estimate”, “should”, “plan”, “predict”, “forecast” or the negative or other variations of these words, or similar words or phrases, have been used to identify these forward-looking statements. Forward-looking statements involve significant known and unknown risks, uncertainties and assumptions. Many factors could cause actual results, performance or achievements to differ materially from the results discussed or implied in the forward-looking statements, including operating results of the Company’s joint venture Point, Inc. (“Point”), U.S. dollar to Canadian dollar exchange rate fluctuations, establishing and maintaining effective distribution channels, certification and market acceptance of NovAtel’s new products, the impact and timing of large orders, dependence on key customers, credit risks of customers and the Company’s joint venture Point, pricing pressures in the market and other competitive factors, maintaining technological leadership, timing of revenue recognition in connection with certain contracts, the ability to maintain supply of products from subcontract manufacturers, the procurement of components to build products, product defects, the impact of industry consolidations, vulnerability to general economic, market and business conditions, competition, environmental and other actions by governmental authorities, reliance on key personnel and other factors described in this Annual Report and other SEC filings, many of which are beyond the control of NovAtel. These factors should be considered carefully and undue reliance should not be placed on the forward-looking statements. These forward-looking statements are made as of the date of this Annual Report, and NovAtel assumes no obligation to update or revise them to reflect new events or circumstances.
ii
Item 1. Identity of Directors, Senior Management and Advisers
Not applicable.
Item 2. Offer Statistics and Expected Timetable
Not applicable.
Item 3. Key Information
A. Selected Financial Data
(a) Summary Financial Information
The following table sets forth selected financial data of the Company for the periods indicated. The selected financial data as at December 31, 2005 and 2006 and for the years ended December 31, 2004, 2005 and 2006 have been derived from the Company’s audited consolidated financial statements, which appear elsewhere in this Annual Report. The selected financial data as at and for the years ended December 31, 2002 and 2003 and as at December 31, 2004 have been derived from our audited consolidated financial statements, not included in this Annual Report. The table sets forth, in Canadian dollars and U.S. dollars, the selected financial data as prepared in accordance with Canadian generally accepted accounting principles (“Canadian GAAP”). The financial data should be read in conjunction with “Item 5 — Operating and Financial Review and Prospects” and the Consolidated Financial Statements of the Company and Notes thereto included elsewhere in this Annual Report.
1
Year Ended December 31, | ||||||||||||||||
2006 | 2005 | 2004 | 2003 | 2002 | ||||||||||||
(in thousands, except per share data) | ||||||||||||||||
Statement of Operations Data (1) | ||||||||||||||||
| Revenues: | ||||||||||||||||
| Product sales | $ | 72,972 | $ | 59,306 | $ | 48,802 | $ | 32,138 | $ | 26,967 | ||||||
| NRE fees | 4,662 | 3,989 | 5,130 | 6,546 | 6,179 | |||||||||||
| Total revenues | 77,634 | 63,295 | 53,932 | 38,684 | 33,146 | |||||||||||
| Cost of sales: | ||||||||||||||||
| Cost of product sales | 27,228 | 22,323 | 19,586 | 14,805 | 11,885 | |||||||||||
| Cost of NRE fees | 2,879 | 2,313 | 2,917 | 3,565 | 4,055 | |||||||||||
| Total cost of sales | 30,107 | 24,636 | 22,503 | 18,370 | 15,940 | |||||||||||
| Gross profit | 47,527 | 38,659 | 31,429 | 20,314 | 17,206 | |||||||||||
| Operating expenses: | ||||||||||||||||
| Research and development | 13,450 | 10,882 | 9,588 | 7,123 | 5,334 | |||||||||||
| Selling and marketing | 7,692 | 6,387 | 5,751 | 5,269 | 5,361 | |||||||||||
| General and administration | 8,009 | 7,082 | 5,312 | 4,280 | 4,045 | |||||||||||
| Foreign exchange (gain) loss | 198 | 255 | 595 | 527 | (49 | ) | ||||||||||
| Share offering costs | — | — | 754 | — | — | |||||||||||
| Total operating expenses | 29,349 | 24,606 | 22,000 | 17,199 | 14,691 | |||||||||||
| Operating income | 18,178 | 14,053 | 9,429 | 3,115 | 2,515 | |||||||||||
| Interest income, net | 1,680 | 787 | 313 | 174 | 84 | |||||||||||
| Other expense | (86 | ) | (72 | ) | (67 | ) | (137 | ) | (377 | ) | ||||||
| Benefit of investment tax credits | — | 1,592 | 4,356 | — | — | |||||||||||
| Income from continuing operations before income taxes | 19,772 | 16,360 | 14,031 | 3,152 | 2,222 | |||||||||||
| Income taxes | ||||||||||||||||
| Current provision | 341 | 2,046 | 2,328 | 52 | 77 | |||||||||||
| Future income tax expense (benefit) | (2,061 | ) | (2,402 | ) | (1,091 | ) | — | — | ||||||||
| Total income tax expense (benefit) | (1,720 | ) | (356 | ) | 1,237 | 52 | 77 | |||||||||
| Net income from continuing operations (3) | 21,492 | 16,716 | 12,794 | 3,100 | 2,145 | |||||||||||
| Income (loss) from discontinued operations (3) | — | — | 21 | 360 | (648 | ) | ||||||||||
| Net income | $ | 21,492 | $ | 16,716 | $ | 12,815 | $ | 3,460 | $ | 1,497 | ||||||
| Net income (loss) per share (basic): | ||||||||||||||||
| Continuing operations | $ | 2.54 | $ | 2.01 | $ | 1.59 | $ | 0.40 | $ | 0.28 | ||||||
| Discontinued operations | — | — | — | 0.05 | (0.09 | ) | ||||||||||
| Net income per share | $ | 2.54 | $ | 2.01 | $ | 1.59 | $ | 0.45 | $ | 0.19 | ||||||
| Weighted average shares outstanding (basic) | 8,450 | 8,298 | 8,063 | 7,723 | 7,681 | |||||||||||
| Net income (loss) per share (diluted): | ||||||||||||||||
| Continuing operations | $ | 2.44 | $ | 1.91 | $ | 1.51 | $ | 0.39 | $ | 0.27 | ||||||
| Discontinued operations | — | — | — | 0.04 | (0.08 | ) | ||||||||||
| Net income per share | $ | 2.44 | $ | 1.91 | $ | 1.51 | $ | 0.43 | $ | 0.19 | ||||||
| Weighted average shares outstanding (diluted) | 8,825 | 8,763 | 8,500 | 7,983 | 7,824 | |||||||||||
Footnotes appear on pages 4-8
2
Year Ended December 31, 2006 | ||||
(in thousands, except per share data) | ||||
(U.S. $ equivalent) (2) | ||||
| Revenues: | ||||
| Product sales | $ | 67,601 | ||
| NRE fees | 4,319 | |||
| Total revenues | 71,920 | |||
| Cost of sales: | ||||
| Cost of product sales | 25,224 | |||
| Cost of NRE fees | 2,667 | |||
| Total cost of sales | 27,891 | |||
| Gross profit | 44,029 | |||
| Operating expenses: | ||||
| Research and development | 12,460 | |||
| Selling and marketing | 7,126 | |||
| General and administration | 7,420 | |||
| Foreign exchange loss | 183 | |||
| Total operating expenses | 27,189 | |||
| Operating income | 16,840 | |||
| Interest income, net | 1,556 | |||
| Other expense | (79 | ) | ||
| Benefit of investment tax credits | ― | |||
| Income from continuing operations before income taxes | 18,317 | |||
| Income taxes | ||||
| Current provision | 316 | |||
| Future income tax expense (benefit) | (1,909 | ) | ||
| Total income tax expense (benefit) | (1,593 | ) | ||
| Net income | $ | 19,910 | ||
| Net income per share (basic): | ||||
| Continuing operations | $ | 2.35 | ||
| Discontinued operations | ― | |||
| Net income per share | $ | 2.35 | ||
| Weighted average shares outstanding (basic) | 8,450 | |||
| Net income per share (diluted): | ||||
| Continuing operations | $ | 2.26 | ||
| Discontinued operations | ― | |||
| Net income per share | $ | 2.26 | ||
| Weighted average shares outstanding (diluted) | 8,825 | |||
Footnotes appear on pages 4-8
3
December 31, | U.S. $ Equivalent December 31, 2006(2) | ||||||||||||||||||
(Canadian $) | |||||||||||||||||||
2006 | 2005 | 2004 | 2003 | 2002 | |||||||||||||||
($ thousands) | |||||||||||||||||||
Balance Sheet Data(1): | |||||||||||||||||||
| Working capital | $ | 61,854 | $ | 44,270 | $ | 30,322 | $ | 17,978 | $ | 14,372 | $ | 57,302 | |||||||
| Total assets | 96,968 | 71,255 | 52,946 | 35,572 | 30,890 | 89,831 | |||||||||||||
| Long-term liabilities | 691 | — | — | 212 | 98 | 640 | |||||||||||||
| Total shareholders’ equity | 81,589 | 58,117 | 40,093 | 25,447 | 20,547 | $ | 75,584 | ||||||||||||
(1) The consolidated financial statements have been prepared in accordance with generally accepted accounting principles in Canada (Canadian GAAP or Canadian principles). The material differences from U.S. generally accepted accounting principles (U.S. GAAP or U.S. principles) are described below.
(2) Canadian dollar amounts for 2006 have been translated into U.S. dollars solely for the convenience of the reader, at the rate of U.S. $0.9264 per CDN $1.00, which was the exchange rate as of May 25, 2007. These translations are not necessarily representative of the amounts that would have been reported if the Company historically had reported its financial statements in U.S. dollars. In addition, the rates utilized are not necessarily indicative of the rates in effect at any other time.
(3) As of December 31, 2006, the Company owned a 70% equity interest in Mezure, Inc., a company that had been developing a GPS, wireless communication and Internet based product for deformation monitoring of manmade and natural structures. On April 8, 2003, the shareholders of Mezure voted unanimously to proceed with a Chapter 7 bankruptcy filing for Mezure, which was concluded on September 24, 2003. Consequently, the Company is treating Mezure as a discontinued operation.
Canadian GAAP to U.S. GAAP Reconciliation ($ thousands)
i) Deferred Development Costs
As of December 31, 2006, the Company had deferred $1,253 of development costs, net of accumulated amortization related to the development of a certified aviation GPS receiver. In 2006, the Company deferred $nil of development costs ($nil in 2005, $218 in 2004, $157 in 2003, and $125 in 2002) in accordance with Canadian GAAP. Under U.S. GAAP, these costs would be expensed as incurred as research and development costs.
In 2006, the Company amortized $404 of deferred development costs ($538 in 2005, $416 in 2004, $196 in 2003, and $57 in 2002) in accordance with Canadian GAAP. Under U.S. GAAP, these costs would have been expensed in the periods when the originating expenditures were incurred.
In addition, for Canadian GAAP purposes, in connection with the recognition of prior year’s investment tax credits, the Company reduced the deferred development costs by $164 in 2005. Under U.S. GAAP, this amount would have been accounted for as an expense when the originating expenditures were incurred.
ii) Stock-Based Compensation
At December 31, 2006, the Company had issued 567 unexercised options to employees and directors to purchase common shares under its stock-based compensation plans (see Note 11).
On January 1, 2004, the Company established a new Long Term Incentive Plan (“LTI Plan”), which authorized the grant of approximately 44 phantom shares to employees of the Company. All grants of phantom shares under the LTI Plan have a three-year cliff vesting and vested on December 31, 2006. Payments under the LTI Plan are made in cash.
Effective January 1, 2004, under Canadian GAAP the Company adopted the fair value method of accounting for stock options awarded to employees on or after January 1, 2002 as required by amended CICA Handbook Section 3870 Stock-Based Compensation and Other Stock-Based Payments. As permitted by the transitional provisions of Section 3870, the change was adopted retroactively without restatement. Under Section 3870, the fair value of stock options is recognized over the applicable vesting period as stock-based compensation expense and a credit to contributed surplus. When options are exercised, the proceeds are credited to share capital, and the applicable fair value is reclassified from contributed surplus to share capital. Retroactive application of Section 3870 resulted in the opening balances as at January 1, 2004 of deficit, contributed surplus and share capital being increased by $456, $390 and $66, respectively, as though the fair value method had been applied since January 1, 2002.
In December 2004, the Financial Accounting Standards Board (“FASB”) issued Statement of Financial Accounting Standard (“SFAS”) No. 123 (Revised 2004), “Share-Based Payment” (“SFAS 123R”), which requires all share-based payments to employees, including grants of employee stock options, to be recognized as compensation expense in the consolidated financial statements based on their fair values. SFAS 123R also modifies certain measurement and expense recognition provisions of SFAS 123 that impact the Company, including the requirement to estimate employee forfeitures each period when recognizing compensation expense and requiring that the initial and subsequent measurement of the cost of liability-based awards each period be based on the fair value (instead of the intrinsic value) of the award, resulting in differences from Canadian GAAP. Prior to the adoption of SFAS 123R, the Company accounted for stock-based compensation to employees and directors using the intrinsic value method in accordance with APB Opinion No. 25 as allowed under Statement of Financial Accounting Standards No. 123, “Accounting for Stock-Based Compensation” (“SFAS 123”). Under the intrinsic value method, no stock-based compensation expense related to the Company’s stock options had been recognized in the Company’s consolidated statement of operations for U.S. GAAP purposes, as the exercise price of the Company’s stock options granted to employees and directors equaled the fair market value of the underlying stock at the date of grant.
4
Effective January 1, 2006, under U.S. GAAP, the Company adopted SFAS 123R using the modified prospective transition method and accordingly, the results of prior periods have not been restated. As a result, the Company’s financial statements for fiscal periods after December 31, 2005 include stock-based compensation expenses that are not comparable to financial statements of fiscal periods prior to January 1, 2006. SFAS 123R requires stock-based compensation to be estimated using the fair value on the date of grant using an option pricing model. Under the modified prospective method, the Company expenses the value of the portion of the stock based awards that is expected to vest over the related employees’ requisite service periods for U.S. GAAP purposes. The adoption of SFAS 123R under U.S. GAAP created differences in the accounting treatment of stock based compensation from Canadian GAAP, relating primarily to the application of forfeiture rates.
The Company estimates the fair value of stock options using the Black-Scholes option pricing model, consistent with the provisions of SFAS 123R, and the Company’s prior period pro forma disclosures of net income, including share-based compensation. The key input assumptions used to estimate the fair value of stock options include the grant price of the award, the expected term of the options, the expected volatility of the Company’s stock, the risk-free rate, annual forfeiture rate and the Company’s dividend yield. The expected term of the options is estimated based on historical grants with similar vesting periods. The expected volatility of the Company’s stock is estimated using the daily historical stock prices over a prior period in relation to the expected term of the award. The Company believes that the Black-Scholes option pricing model utilized to develop the underlying assumptions is appropriate in calculating the fair values of the Company’s stock options.
The phantom shares are accounted for as a liability award under U.S. GAAP and are remeasured to fair value at the end of each reporting period. The Company estimates the fair value of the phantom shares granted under the LTI Plan based on an option pricing model (Black-Scholes). The fair value estimated using the Black-Scholes model is consistent with the market value of the Company’s common shares at each reporting date.
SFAS 123R requires forfeitures to be estimated at the time of grant in order to estimate the amount of share-based awards that will ultimately vest. As share-based compensation expense recognized in the consolidated statement of operations for the year ended December 31, 2006 is based on awards ultimately expected to vest, it has been reduced for estimated forfeitures. Prior to the adoption of SFAS 123R, the Company recognized forfeitures as they occurred. The Company recorded a gain of $23 as a cumulative effect of an accounting change, as a result of the change in accounting for forfeitures under SFAS 123R. In the Company’s pro forma information required under SFAS 123 for the period prior to fiscal 2006, the Company accounted for forfeitures as they occurred.
As of December 31, 2006, the annual forfeiture rates applied to the Company’s stock option plans and the phantom share awards were 2% and 2.4%, respectively.
Stock-based compensation under U.S. GAAP recorded for the years ended December 31 was as follows:
Year ended December 31, | ||||||||||||||||
2006 | 2005 | 2004 | 2003 | 2002 | ||||||||||||
Stock-based compensation: | ||||||||||||||||
| Stock option expense | $ | 969 | $ | ― | $ | ― | $ | ― | $ | ― | ||||||
| Phantom share expense | 1,051 | 347 | 615 | ― | ― | |||||||||||
| Total stock-based compensation expense reported | $ | 2,020 | $ | 347 | $ | 615 | $ | ― | $ | ― | ||||||
The compensation cost that has been charged against income for the Company’s share-based award plans was $2,020 for the year ended December 31, 2006 ($347 and $615, respectively for the years ended December 31, 2005 and 2004). The total income tax benefit recognized in the statements of operations for stock-based award compensation was nil for the years ended December 31, 2006, 2005 and 2004.
As of December 31, 2006, there was $2,687 of unrecognized compensation cost related to the Company’s stock option plans that is expected to be recognized over a weighted average period of 3.0 years. As of December 31, 2006, there was $nil of total unrecognized compensation cost related to the Company’s phantom share awards granted.
Cash received from exercise under all share-based payment arrangements was $1,041 for the year ended December 31, 2006 ($721 and $1,505 respectively for the years ended December 31, 2005 and 2004). Tax benefits realized by the Company related to these exercises were $nil.
iii) Derivatives and Hedging Activities
The Company has historically entered into forward foreign exchange contracts to manage its exposure to foreign currency fluctuations. Under U.S. GAAP, the accounting for derivative instruments and hedging activities is contained in the Statement of Financial Accounting Standard (“SFAS”) No. 133, as amended by SFAS 137, SFAS 138 and SFAS 149 (“SFAS 133”). SFAS 133 establishes accounting and reporting standards requiring that all derivative instruments be recorded in the balance sheet as either an asset or a liability measured at fair value and requires that changes in the fair value be recognized currently in earnings unless specific hedge accounting criteria are met. For cash flow hedges, changes in the fair value of the derivative instrument are recognized in net earnings in the same period as the hedged item and any changes in the fair value prior to that period are recognized in other comprehensive income. For fair value hedges, both the derivative instrument and the underlying commitment are recognized on the balance sheet at their fair value and any changes in the fair value are recognized currently in net earnings. Prior to July 18, 2006, the Company’s foreign exchange contracts have been accounted for as cash flow hedges. Foreign exchange contracts entered into after July 18, 2006 have been recorded at fair value and any changes in fair value have been recognized in net earnings.
5
iv) Investment in Joint Venture
The accounts of the Company’s 49% joint venture interest in Point are proportionately consolidated as required under Canadian GAAP. Under U.S. GAAP, proportionate consolidation is not permitted, and the Company’s investment in this joint venture would be accounted for using the equity method. As permitted by SEC guidance, the effects of this difference in accounting principles have not been reflected in the accompanying tables.
In 2002, the Company recognized a gain of $121 related to the reduction of its equity interest in Mezure from approximately 74% to 70%. Under U.S. GAAP, the Company would have reflected the effects of this transaction as a direct increase in shareholders’ equity of $160 after consideration of the impact of previous U.S. GAAP adjustments.
In addition, in 2003, the Company recognized a gain of $379 related to the liquidation of the remaining assets and liabilities of Mezure. Under U.S. GAAP, this gain would have been $571, since $192 characterized as goodwill under Canadian GAAP would have been expensed on acquisition in 2001.
v) Intangibles Related to Acquisition of CMC Electronics’ OEM GPS Business
On May 14, 2003, the Company acquired the CMC Electronics non-aviation GPS product line. The fair value of the net assets acquired included $497 in intangibles, comprised primarily of technology, product design, customer relationships and an established market presence. Under U.S. GAAP, when accounting for transfer of assets between entities under common control, the entity that receives the net assets or the equity interest would initially recognize the assets and liabilities transferred at their carrying amounts at the date of transfer. Any excess of consideration given over the controlling shareholders’ carrying value would be accounted for as a reduction of equity.
vi) Classification of Employee Relocation and Termination Costs
In 2002, the Company included $128 of employee relocation and $84 of employee termination costs within other expense in the consolidated statement of operations. Under U.S. GAAP, these costs would be included within operating expenses.
vii) Provision for Future Warranty Costs
The changes in the provision for future warranty costs during each of the five years ended December 31, are as follows:
2006 | 2005 | 2004 | 2003 | 2002 | ||||||||||||
| Opening balance, beginning of period | $ | 693 | $ | 538 | $ | 410 | $ | 344 | $ | 285 | ||||||
| Additions to provision | 560 | 382 | 312 | 220 | 203 | |||||||||||
| Costs incurred | (437 | ) | (227 | ) | (184 | ) | (154 | ) | (144 | ) | ||||||
| Ending balance, end of period | $ | 816 | $ | 693 | $ | 538 | $ | 410 | $ | 344 | ||||||
viii) Investment Tax Credits
Under Canadian GAAP, the Company uses the cost reduction method to account for its investment tax credits. The investment tax credits relate to certain research and development expenses and are recognized when there is reasonable assurance that the Company will be able to realize the benefit of these credits. In 2005, the Company recognized $1,756 ($4,356 in 2004, $nil in 2003) of investment tax credits, of which $1,592 was recorded on the statement of operations as a benefit of prior years’ investment tax credits and $164 was recorded as a reduction of deferred development costs on the balance sheet.
Under U.S. GAAP, the Company would use the flow through method to account for its investment tax credits and would record the recognition of the $1,756 of investment tax credits in 2005 as a reduction of the current income tax provision. Under U.S. GAAP, for the year ended December 31, 2004, the Company would record the recognition of the $4,356 of investment tax credits as a $2,258 reduction of the current income tax provision and as a $2,098 increase in future income tax benefit.
The net effect of these reconciling items would be an increase in net income from continuing operations of $164 in 2005 under U.S. GAAP.
ix) Comprehensive Income
U.S. GAAP utilizes the concept of comprehensive income, which includes net income and other comprehensive income. Currently, there is no similar concept under Canadian GAAP. Other comprehensive income represents the change in equity during the period from transactions and other events from non-owner sources and includes such items as changes in the fair value of cash flow hedges.
x) Summary of the Differences between Canadian and U.S. GAAP
The effects of the above-noted differences between U.S. and Canadian GAAP produces the following differences on the presented statement of operations data:
6
Year Ended December 31, | ||||||||||||||||
2006 | 2005 | 2004 | 2003 | 2002 | ||||||||||||
Net income from continuing operations — Canadian GAAP | $ | 21,492 | $ | 16,716 | $ | 12,794 | $ | 3,100 | $ | 2,145 | ||||||
| Adjustments to U.S. GAAP: | ||||||||||||||||
| Deferred development costs (i) | — | — | (218 | ) | (157 | ) | (125 | ) | ||||||||
| Amortization of deferred development costs (i) | 404 | 538 | 416 | 196 | 57 | |||||||||||
| Stock-based compensation expense (ii) | 44 | 587 | 326 | — | — | |||||||||||
| Reduction of deferred development costs related to recognition of investment tax credits | — | 164 | — | — | — | |||||||||||
| Amortization of intangibles acquired from CMC Electronics (v) | 125 | 124 | 124 | 62 | — | |||||||||||
Net income from continuing operations — U.S. GAAP | 22,065 | 18,129 | 13,442 | 3,201 | 2,077 | |||||||||||
| Net income (loss) from discontinued operations — Canadian GAAP | — | — | 21 | 360 | (648 | ) | ||||||||||
| Adjustments to U.S. GAAP: | ||||||||||||||||
| Gain on liquidation of Mezure, Inc. (iv) | — | — | — | 192 | — | |||||||||||
| Gain on dilution of equity in Mezure, Inc. (iv) | — | — | — | — | (121 | ) | ||||||||||
| Income (loss) from discontinued operations — U.S. GAAP | — | 21 | 552 | (769 | ) | |||||||||||
Net income before cumulative effect of accounting change | 22,065 | 18,129 | 13,463 | 3,753 | 1,308 | |||||||||||
| Cumulative effect of accounting change (ii) | 23 | — | — | — | — | |||||||||||
Net income - U.S. GAAP | 22,088 | 18,129 | 13,463 | 3,753 | 1,308 | |||||||||||
| Net unrealized gain (loss) on foreign exchange contracts (iii) | (132 | ) | 192 | 179 | — | (48 | ) | |||||||||
| Reclassification to income of gains and losses on cash flow hedges | (192 | ) | (179 | ) | — | 48 | (1 | ) | ||||||||
Comprehensive income (loss) | $ | 21,764 | $ | 18,142 | $ | 13,642 | $ | 3,801 | $ | 1,259 | ||||||
Net income per share as computed under Canadian and U.S. GAAP is as set forth below for the following periods:
Year Ended December 31, | ||||||||||||||||
2006 | 2005 | 2004 | 2003 | 2002 | ||||||||||||
Net income per share from continuing operations | ||||||||||||||||
| Canadian GAAP — basic | $ | 2.54 | $ | 2.01 | $ | 1.59 | $ | 0.40 | $ | 0.28 | ||||||
| U.S. GAAP — basic | $ | 2.61 | $ | 2.18 | $ | 1.67 | $ | 0.41 | $ | 0.27 | ||||||
| Canadian GAAP — diluted | $ | 2.44 | $ | 1.91 | $ | 1.51 | $ | 0.39 | $ | 0.27 | ||||||
| U.S. GAAP — diluted | $ | 2.50 | $ | 2.07 | $ | 1.58 | $ | 0.40 | $ | 0.27 | ||||||
Year Ended December 31, | ||||||||||||||||
Net income per share | 2006 | 2005 | 2004 | 2003 | 2002 | |||||||||||
| Canadian GAAP — basic | $ | 2.54 | $ | 2.01 | $ | 1.59 | $ | 0.45 | $ | 0.19 | ||||||
| U.S. GAAP — basic | $ | 2.61 | $ | 2.18 | $ | 1.67 | $ | 0.49 | $ | 0.17 | ||||||
| Canadian GAAP — diluted | $ | 2.44 | $ | 1.91 | $ | 1.51 | $ | 0.43 | $ | 0.19 | ||||||
| U.S. GAAP — diluted | $ | 2.50 | $ | 2.07 | $ | 1.58 | $ | 0.47 | $ | 0.17 | ||||||
The reconciliation of the selected consolidated financial data between U.S. and Canadian GAAP produces the following differences on the presented balance sheet data:
7
Year Ended December 31, | ||||||||||||||||
2006 | 2005 | 2004 | 2003 | 2002 | ||||||||||||
Total Assets | ||||||||||||||||
| Canadian GAAP | $ | 96,968 | $ | 71,255 | $ | 52,946 | $ | 35,572 | $ | 30,890 | ||||||
| Adjustments to U.S. GAAP: | ||||||||||||||||
| Deferred development costs (i) | (1,253 | ) | (1,657 | ) | (2,359 | ) | (2,557 | ) | (2,596 | ) | ||||||
| Fair value of financial instruments (iii) | (132 | ) | 192 | 179 | — | (48 | ) | |||||||||
| Write off of development related costs on Mezure acquisition (iv) | — | — | — | — | (192 | ) | ||||||||||
Reduction of intangibles acquired from CMC Electronics to carrying value (v) | (57 | ) | (182 | ) | (306 | ) | (430 | ) | — | |||||||
| U.S. GAAP | $ | 95,526 | $ | 69,608 | $ | 50,460 | $ | 32,585 | $ | 28,054 | ||||||
Total Shareholders’ Equity | ||||||||||||||||
| Canadian GAAP | $ | 81,589 | $ | 58,117 | $ | 40,093 | $ | 25,447 | $ | 20,547 | ||||||
| Adjustments to U.S. GAAP: | ||||||||||||||||
| Deferred development costs (i) | (1,253 | ) | (1,657 | ) | (2,359 | ) | (2,557 | ) | (2,596 | ) | ||||||
| Write off of development related costs on Mezure acquisition (iv) | — | — | — | — | (192 | ) | ||||||||||
| Stock based compensation (ii) | 16 | — | — | — | — | |||||||||||
Reduction of intangibles acquired from CMC Electronics to carrying value (v) | (492 | ) | (492 | ) | (492 | ) | (492 | ) | — | |||||||
| Amortization of intangibles acquired from CMC Electronics (v) | 435 | 310 | 186 | 62 | — | |||||||||||
| U.S. GAAP before other comprehensive income | $ | 80,295 | $ | 56,278 | $ | 37,428 | $ | 22,460 | $ | 17,759 | ||||||
| Accumulated other comprehensive income (loss) | (132 | ) | 192 | 179 | — | (48 | ) | |||||||||
| U.S. GAAP including accumulated comprehensive income | $ | 80,163 | $ | 56,470 | $ | 37,607 | $ | 22,460 | $ | 17,711 | ||||||
(b) Canadian and U.S. Dollar Exchange Rate
The following table sets forth, for each period presented, the high, low and average exchange rates during the indicated period and the exchange rates at the end of the indicated period for one Canadian dollar, expressed in U.S. dollars, based on the noon buying rate in New York City for cable transfers payable in Canadian dollars as certified for customs purposes by the Federal Reserve Bank of New York:
U.S. Dollars Per Canadian Dollar Year Ended December 31, | ||||||||||||||||
2006 | 2005 | 2004 | 2003 | 2002 | ||||||||||||
| Average | $ | 0.8821 | $ | 0.8254 | $ | 0.7682 | $ | 0.7139 | $ | 0.6368 | ||||||
| High | 0.9100 | 0.8690 | 0.8493 | 0.7738 | 0.6619 | |||||||||||
| Low | 0.8528 | 0.7872 | 0.7158 | 0.6349 | 0.6200 | |||||||||||
| Period end | 0.8581 | 0.8579 | 0.8310 | 0.7738 | 0.6329 | |||||||||||
Month Ended | |||||||||||||||||||
April 2007 | March 2007 | February 2007 | January 2007 | December 2006 | November 2006 | ||||||||||||||
| High | $ | 0.9035 | $ | 0.8673 | $ | 0.8631 | $ | 0.8586 | $ | 0.8760 | $ | 0.8869 | |||||||
| Low | $ | 0.8633 | $ | 0.8467 | $ | 0.8437 | $ | 0.8457 | $ | 0.8582 | $ | 0.8715 | |||||||
On May 25, 2007, the exchange rate was U.S. $0.9264 per CDN $1.00.
(c) Dividends
The Company has not paid any cash dividends since its inception. The Board of Directors may pay cash dividends in the foreseeable future, but intends to retain the majority of earnings, if any, for use in its business operations.
8
B. Capitalization and Indebtedness
Not applicable.
C. Reasons for the Offer and Use of Proceeds
Not applicable.
D. Risk Factors
In addition to the other information set forth in this Annual Report, the following risk factors should be considered carefully in evaluating the Company. This Annual Report contains certain forward-looking statements and intentions. The cautionary statements made in this Annual Report should be read as being applicable to all related forward-looking statements wherever they appear in this Annual Report. The Company’s actual results could differ materially from those discussed here. Factors that could cause or contribute to such differences include those discussed below, as well as those discussed elsewhere in this Annual Report.
The Company’s operating results are susceptible to fluctuations.
NovAtel’s results of operations have fluctuated and can be expected to continue to fluctuate on a periodic basis as a result of a number of factors which affect revenue, gross margin and operating expenses. Annual and quarterly revenues have fluctuated because of a number of factors, including fluctuations in demand for existing products, the rate of development of new products, the degree of market acceptance of new products, increased competition, acquisition of new product lines, timing of major contracts, U.S. dollar to Canadian dollar exchange rates, operating results of subsidiaries and joint ventures, certification and market acceptance of new products, impact and timing of large orders, pricing pressures in the market, establishing and maintaining effective distribution channels, fluctuations in non-recurring engineering (“NRE”) fees, seasonality and other factors affecting customer purchase patterns and the timing of industry trade shows.
Gross margin as a percentage of revenue varies primarily as a result of product sales mix, the proportion of total revenue comprised of NRE revenue, changes in materials and contract manufacturing costs, liquidation of discontinued inventory, and absorption of fixed manufacturing costs.
A shortfall from anticipated revenue, lower gross margins or higher than expected expenses could adversely affect results of operations. In addition, if NovAtel were to receive a major contract, the Company’s expenditures required to support such a contract would likely increase. If revenue from the contract were delayed for any reason, including cancellation or deferral of the contract, the Company’s results of operations could be adversely affected. See “Item 5 — Operating and Financial Review and Prospects, Operating Results.”
If the Company’s product innovations and enhancements are not successful, the Company’s revenue growth and results of operations may be adversely impacted.
Although NovAtel expects to make significant investments in research and development to continue to enhance existing products, develop new products which incorporate new and existing technologies and achieve market acceptance for such products, there can be no assurance that such new products or product enhancements will be successfully developed or, if developed, that any such new products or product enhancements will be developed in time to capture market opportunities or achieve a significant or sustainable level of market acceptance in new and existing markets. The development of new, technologically advanced products and product enhancements is a complex and uncertain process requiring accurate anticipation of technological and market trends. Any inability on NovAtel’s part to successfully define, develop and introduce new products and product enhancements may materially adversely affect its growth potential and results of operations.
In addition, development and manufacturing schedules for technology products are difficult to predict, and there can be no assurance that NovAtel will achieve timely initial customer shipments of new products. The timely availability of these products in the market place and their acceptance by customers are important to the future success of NovAtel. NovAtel has previously experienced delays in shipping certain of its products and any future delays, whether due to manufacturing delays, product design and development delays, lack of market acceptance, delays in any required regulatory approval, or otherwise, could adversely affect customer acceptance of its products and have a material adverse effect on NovAtel’s business, financial condition and results of operations. From time to time, NovAtel or its competitors may announce new products, capabilities or technologies that have the potential to replace or shorten the life cycles of its existing products. No assurance can be given that announcements of currently planned or other new products will not cause customers to defer or stop purchasing NovAtel products until NovAtel or its competitors’ new products become available. In addition, certain of NovAtel’s products must pass governmental and similar certifications before they can be sold. Any inability or delay in obtaining such certifications could have a material adverse effect on NovAtel’s business, financial condition and results of operations. See “Item 4 — Information on the Company, Business Overview — Research and Development.”
The Company is subject to exchange rate fluctuations which could have a material effect on the Company’s revenues and results of operations.
Over 95% of NovAtel’s revenues have been, and are likely to continue to be, realized in currencies other than the Canadian dollar, principally the U.S. dollar. A significant portion of NovAtel’s expenses, however, will be incurred in Canadian dollars. Accordingly, fluctuations in the exchange rates between the U.S. dollar and other foreign currencies and the Canadian dollar could have a material adverse effect on NovAtel’s revenues and its results from operations. If the Canadian dollar increases in value relative to the U.S. dollar, NovAtel’s reported Canadian dollar revenues and net income may be materially and adversely affected. NovAtel uses forward foreign currency contracts to hedge a portion of its exposure to fluctuations in the U.S. dollar and Euro. There can be no assurance that NovAtel will be successful in such hedging activities.
The Company relies on a limited number of customers for a substantial portion of its revenue and any loss of any key customer could have a material effect on the Company’s business, financial condition or results of operations.
In 2006, the Company derived 52% of its revenues from its top four customers, namely Leica Geosystems A.G. (“Leica Geosystems”) , Sokkia Co. Ltd. (“Sokkia”)/Point, Beijing BDStar, and YC International. The loss of any key customer could have a material adverse effect on the Company’s business, financial condition and results of operations. In addition, should any of the Company’s customers experience financial difficulties resulting in an inability to pay amounts owing to the Company, the Company may experience a material adverse effect on its financial condition and results of operations.
9
The Company’s strategic co-operation agreement with Leica Geosystems provides that in the event of the acquisition of control of NovAtel or a significant portion of its assets by certain specified competitors of Leica Geosystems, then Leica Geosystems may, among other things, terminate the agreement and any related development or supply agreements. The strategic co-operation agreement between the Company and CMC Electronics contains a similar right in favour of CMC Electronics which is triggered in circumstances in which control of NovAtel or a significant portion of its assets are acquired by certain specified competitors of CMC Electronics. The termination of either of such agreements could have a material adverse effect on NovAtel’s business, financial condition and results of operations and could cause the Company’s quarterly operating results to fluctuate and cause its stock price to decline.
On March 16, 2007, Topcon Corp. (“Topcon”) and Sokkia announced that they had entered into an agreement to form a “combined” entity. Topcon has GNSS technology and products that compete with those supplied by NovAtel to Point. The agreement under which NovAtel and Sokkia established Point expires in July 2009. The loss of Point or Sokkia, or both, as a customer or a substantial decrease in sales to Point could have a material adverse effect on NovAtel’s business, financial condition and results from operations and could cause its stock price to decline.
The Company places binding manufacturing orders based on its forecast, and, if the Company fails to adequately forecast demand for its products, it may incur product shortages or excess product inventory.
The Company’s third-party manufacturers require the Company to place binding manufacturing orders in advance of the Company receiving purchase orders from its customers. This may result in product shortages or excess product inventory because the Company cannot easily increase or decrease these purchase orders. Obtaining additional supply in the face of product shortages may be costly or impossible, particularly in the short term, which could prevent the Company from fulfilling orders. If the Company fails to adequately forecast demand for its products, it could cause the Company’s operating results to fluctuate and cause its stock price to decline.
The Company relies on suppliers for the components used in its products and interruptions in the supply of such components or a significant increase in the price of one or more components could adversely affect the Company’s business, financial condition and results of operations.
Most of the components used in the Company’s products are standard parts readily available from more than one supplier. However, a few components are sourced from sole suppliers or are custom parts unique to NovAtel, including application specific integrated circuits manufactured to proprietary design, radio frequency filters, microprocessors and duplexers/filters. While custom parts make the Company’s products hard to imitate, they also represent a manufacturing risk due to the lack of alternative suppliers. If these parts became unavailable, redesign or modification of the Company’s products could be required. In addition, suppliers may cease manufacturing common components, replacing them with newer parts, which require requalification. These risks could cause an interruption in the Company’s ability to provide a steady stream of products to its customers, which would adversely impact the Company’s revenues and results of operations.
NovAtel has experienced significant production delays in the past caused by an insufficient supply of certain components. If NovAtel is unable to obtain a sufficient supply of single source components from its current vendors, NovAtel may be required to obtain such components from alternative sources at higher prices and may experience a delay or interruption in product shipments, which could adversely affect its business, financial condition and results of operations and damage customer relationships until an alternative source can be obtained. NovAtel has taken steps to ensure adequate supply of these components and commenced product redesigns, as may be required.
Also, a significant increase in the price of one or more components could adversely affect NovAtel’s business, financial condition and results of operations. Although NovAtel has instituted vendor audit programs, there can be no assurance that NovAtel will not face problems with the quality of components in the future that could result in delays in supplies, interrupt shipments and require modification of products already sold by NovAtel, any of which could have a material adverse effect on NovAtel’s business, financial condition and results of operations. NovAtel currently relies on three primary subcontractors to manufacture the majority of its circuit card assemblies. There can be no assurance that the circuit card assembly subcontractors will be able to manufacture NovAtel’s products in a timely and reliable manner. The failure by a subcontractor to manufacture products in a timely and reliable manner could have a material adverse effect on NovAtel’s business, financial condition and results of operations.
The Company’s success is dependent upon key personnel.
NovAtel’s future success depends, in part, on its ability to attract and retain qualified technical staff, such as geomatics engineers, electrical engineers (including radio frequency engineers, A.S.I.C. engineers and digital signal processing engineers), printed circuit board technologists, and marketing, sales and executive management. Competition for such personnel is intense and the number of persons with relevant experience, particularly in engineering, is limited. The Company’s main centre of operation is experiencing a major labour shortage due to recent strong economic growth in Calgary. Any inability on the part of NovAtel to attract and retain additional key employees or the loss of one or more of its current key employees could materially adversely affect NovAtel’s business, financial condition and results of operations.
The Company may not be able to maintain existing OEM customers and strategic relationships or develop distribution channels for the sale of its products which would affect the Company’s revenues and results of operations.
NovAtel sells its OEM products directly to OEM customers and to strategic relationships. The Company expects to continue to utilize these relationships to sell to companies that will incorporate NovAtel’s products into their products and services. Accordingly, the Company’s success will be dependent in large part on its ability to continue existing relationships and develop new OEM and other third party relationships.
NovAtel cannot predict nor control the extent to which its distribution network will be successful in marketing products incorporating the Company’s technology. A material loss of any of the Company’s key OEM customers or strategic partners, either as a result of competitive products offered by other companies or products developed internally by these OEM customers and strategic partners, or their inability to penetrate their respective market segments, could have a material adverse effect on the Company’s business, financial condition and results of operations. There can be no assurance that NovAtel can continue to attract OEM customers, dealers and strategic partners and any inability to do so could materially adversely affect the Company’s business, financial condition and results of operations.
NovAtel plans to continue expanding its distribution channels. There can be no assurance that such expansion will be successfully completed, that the cost of such expansion will not exceed the revenues generated, or that the Company’s sales and marketing organization will be able to successfully compete against the more extensive and well-funded sales and marketing operations of many of NovAtel’s current or potential competitors. NovAtel’s inability to manage effectively its distribution expansion could have a material adverse effect on the Company’s business, financial condition and results of operations. See “Item 4 — Information on the Company, Business Overview — Sales, Marketing and Distribution.”
10
The Company’s business may be adversely affected by risks associated with international operations.
NovAtel derives a significant portion of its revenues from international sales. NovAtel plans to continue to expand its international sales and marketing efforts. There are a number of risks inherent in NovAtel’s international business activities, including unexpected changes in Canadian, United States or other government policies concerning the import and export of goods, services and technology and other regulatory requirements, tariffs and other trade barriers, costs and risks of localizing products for foreign countries, higher credit risks, potentially adverse tax consequences, limits on repatriation of earnings and the burdens of complying with a wide variety of foreign laws. Fluctuations in currency exchange rates could materially adversely affect sales denominated in currencies other than the Canadian dollar and cause a reduction in revenues derived from sales in a particular currency. The financial stability of foreign markets could also affect the Company’s international sales. There can be no assurance that such factors will not materially adversely affect the revenues from NovAtel’s future international sales and, consequently, its results of operations. In addition, revenues that NovAtel earns abroad may be subject to taxation by more than one jurisdiction, which could materially adversely affect its earnings. Furthermore, in certain foreign markets, there may be a reluctance to purchase products based on GPS technology, given the control of GPS by the U.S. Government. Each of these factors could have an adverse effect on NovAtel’s business, financial condition and results of operations. See “Item 4 — Information on the Company, Business Overview — Sales, Marketing and Distribution.”
Competition and increased industry consolidation could adversely affect the Company’s business, financial condition and results of operation.
NovAtel faces competition primarily from other developers and suppliers of high-precision positioning component technology which is sold to OEMs and system integrators for commercial applications, as well as from OEMs who choose to develop and produce the component technology in-house. In addition, the GNSS industry has been going through a consolidation phase over the past several years. A number of GNSS companies have been selecting strategic partners to merge, acquire or form joint businesses in an effort to remain cost competitive and meet customer requirements, including the proposed combination of Topcon and Sokkia announced on March 16, 2007. The Company expects that this consolidation phase will continue for the foreseeable future resulting in fewer, but larger companies. Industry consolidation, by creating stronger and larger potential competitors, and industry competition, could have a material adverse effect on the Company’s business, financial condition and results of operations.
The Company may be adversely affected by trends in the markets for Global Navigation Satellite System (“GNSS”) technology and products.
NovAtel currently addresses the following markets for the application of GNSS technology: surveying and mapping, aerospace, precision agriculture, precise timing, marine, unmanned vehicles, mining and machine control. Although NovAtel believes that these markets have growth potential for sales of GNSS products, there can be no assurance that such markets will continue to develop, particularly given that GNSS-based systems are still in an early stage of adoption in some of these markets, or that even if they develop, such markets will develop in a direction beneficial to NovAtel’s products or product positioning or in the time frame in which NovAtel expects to launch products for these markets. Any development of these markets away from GNSS technologies or the GNSS products offered by NovAtel could have a material adverse effect on NovAtel’s growth potential and its business, financial condition and results of operations.
NovAtel also believes that in certain emerging markets its success will depend on its ability to form and maintain strategic relationships with established system providers and industry leaders. NovAtel’s failure to form and maintain such relationships, or the pre-emption of such relationships by the actions of other GNSS competitors, could adversely affect its ability to penetrate emerging GNSS markets. In addition, NovAtel’s future growth will depend upon the timely development of the markets in which it currently competes, its ability to continue to identify and exploit new markets for its products and its ability to open new channels of distribution for existing and future products. NovAtel’s inability to effectively and efficiently exploit opportunities in new or emerging markets through successful product marketing, new and timely product introductions and product enhancements and establishing new distribution channels for its products could have a material adverse effect on NovAtel’s growth, financial condition and results of operations. Further, to the extent NovAtel builds inventory in anticipation of potential sales in a new market, the failure of that market to develop could have a material adverse effect on NovAtel’s business, financial condition and results of operations.
The price of NovAtel’s common shares has fluctuated substantially over the last few years.
Since January 1, 2006, the closing daily price of NovAtel’s common shares has ranged from a low of U.S. $27.42 to a high of U.S. $47.23. A number of factors will continue to influence the market price for the common shares, including:
• volume and timing of orders for NovAtel’s products;
• quarterly variations in NovAtel’s or its competitors’ results of operations;
• the announcement and introduction of new products or product enhancements by NovAtel or its competitors;
• the announcement of acquisition of companies or technologies by NovAtel or its competitors;
• product liability claims or other litigation;
• changes in earnings estimates or recommendations by securities analysts; and
• general market conditions and other factors that may be unrelated to NovAtel’s operating performance or the operating performance of its competitors.
If the trading market for NovAtel’s stock does not continue to develop, securities analysts may not initiate or maintain research coverage of NovAtel and its shares, and this could adversely affect the market for NovAtel’s shares.
New Chinese legislation that restricts the use of certain hazardous substances and creates requirements for waste electrical and electronic equipment may affect sales into China.
The Company has updated its internal processes to be compliant with the new Chinese legislation, which required that the Company’s few remaining products containing any hazardous substances be properly marked and documented for shipment to China. There is no assurance that the Company will be able to comply with future regulations governing the use of hazardous materials, which may affect sales into China.
11
The failure of Point to repay existing loans to the Company or continue as a going concern could adversely affect the Company’s results of operations.
NovAtel sells GNSS receivers and antennas to Point which incorporates these receivers into surveying systems that are in turn sold through Sokkia’s distribution channels and through independent dealers and distributors. NovAtel’s consolidated financial statements include its proportionate 49% joint venture interest in the accounts of Point. Point is subject to similar types of risks as the Company.
Point is dependent on the Company and Sokkia for product supply, distribution and financing. As of December 31, 2006, the Company and Sokkia had collectively loaned Point U.S. $1.6 million, U.S. $637,000 of which was advanced by the Company. The loans are secured by the assets of Point.
Should Sokkia and the Company discontinue their support, Point’s ability to continue as a going concern would be impaired. The consolidated financial statements of the Company contained elsewhere in this Annual Report do not reflect any adjustments that would be required if Point’s operations were discontinued. See “— Dependence on Key Customers.”
The Company’s business is dependent on its intellectual property. If the Company’s patents or trademarks are declared invalid, the Company’s ability to compete may be adversely affected.
NovAtel currently holds 31 U.S. patents and various related foreign patents which expire at various dates no earlier than March 31, 2009. NovAtel also has numerous pending U.S. and foreign patent applications. NovAtel currently licences certain peripheral aspects of its technology from third parties. Although NovAtel believes that its patents and trademarks have value, there can be no assurance that its patents and trademarks, or any additional patents and trademarks that may be obtained in the future, will provide meaningful protection from competition. The value of NovAtel’s products relies substantially on its technical innovation in fields in which there are many current patent filings. NovAtel recognizes that as new patents are issued or are brought to its attention by the holders of such patents, it may be necessary for NovAtel to withdraw products from the market, negotiate a license from such patent holders, redesign its products or pay damages assessed as a result of litigation. Such events could have a material adverse effect on NovAtel’s business, financial condition and results of operations. In addition, the legal costs and engineering time required to safeguard intellectual property or to defend against litigation could become a significant expense of operations.
NovAtel has received written notices from certain parties alleging patent infringement of their respective patents. Other than one claim by Trimble Navigation Limited (“Trimble”) for which a settlement agreement was reached, and one other claim by ARAM Systems Ltd. (“ARAM”) alleging co-inventorship of a patent, which is outstanding, no formal claim has been brought by any of the parties. The Company believes it has valid defences to these claims should formal proceedings be commenced. In protecting its intellectual property rights NovAtel has from time to time sent out letters to third parties regarding potential infringement. While no intellectual property right of the Company has been invalidated or declared unenforceable, there can be no assurance that such rights will not be invalidated due to the existence of prior art or otherwise held unenforceable. See “Item 4 — Information on the Company, Business Overview — Legal Proceedings.”
The Company’s acquisition strategy involves a number of risks, including overpayment, failure to adequately integrate an acquired business and distraction of management from core operations.
In order to assist in the achievement of growth, NovAtel continues to seek acquisition opportunities to complement its existing businesses. NovAtel cannot be certain that it will be able to identify suitable acquisition candidates available for sale at reasonable prices, to consummate any acquisition, or to integrate any acquired business into its operations successfully. Acquisitions may involve a number of special risks, circumstances or legal liabilities, some or all of which may have a material adverse effect on NovAtel’s business, results of operations and financial condition. Acquisitions may also result in potentially dilutive issuances of equity securities. When evaluating an acquisition opportunity, NovAtel cannot be certain that it has correctly identified and managed the risks and costs inherent in the business that it is acquiring.
From time to time, NovAtel engages in discussions and activities with respect to possible acquisitions. At any given time, discussions and activities can be in process on a number of initiatives, each at different stages of development. While at the present time NovAtel has no binding agreement or commitment to enter into any such transaction, in normal course, from time to time, it pursues potential acquisitions. NovAtel can provide no assurance that any potential transaction will be successfully completed, and, if completed, that the business acquired will be successfully integrated into NovAtel’s operations. The failure of NovAtel to manage its acquisition strategy successfully could have a material adverse effect on NovAtel’s business, results of operations and financial condition.
The products and services provided by the Company could expose the Company to product liability and other claims.
There is a risk that NovAtel’s products and services may not perform up to expectations. While NovAtel usually contractually limits its liability for damages arising from its provision of services, there can be no assurance that the contractual limitations will be enforceable in all circumstances or in all jurisdictions. Furthermore, litigation, regardless of contractual limitations, could result in substantial cost to NovAtel, divert management’s attention and resources from NovAtel’s operations and result in negative publicity that may impair its ongoing marketing efforts. Although NovAtel has general liability insurance, there is no assurance that this insurance will cover the claims or that the claims will not exceed the insurance limit under its current policies.
The adoption of new technologies to replace GNSS could adversely affect the Company’s business.
The Company operates in a highly technical market. Technology is constantly advancing and changing to meet new demands. NovAtel is unable to determine if GNSS will be essential in the future due to unpredictable advances in technology. There is a risk that GNSS may be replaced with entirely new technologies and products which are not foreseeable at this time.
The creation of a new satellite system such as Galileo, and NovAtel’s ability to utilize them is also key to the Company’s future. The combination in some cases and substitution in others will be a key area that NovAtel must monitor and be positioned to address.
12
A disruption of the GPS satellite network or governmental regulation of this network or GPS products could impair the viability of the Company’s business.
The Company’s products rely on signals from GPS satellites and to a lesser extent GLONASS and Galileo satellites. GPS satellites and their ground support systems are complex electronic systems subject to electronic and mechanical failures and possible sabotage. As of December 2006, there are 29 usable satellites, five more than the design requirement. The satellites have a limited design life of between seven and 11 years and the satellites are also subject to damage by the hostile space environment in which they operate. Of the current constellation of satellites, 19 are past their design target and five are past their design life target by six years or more. The repair of damaged or malfunctioning satellites is nearly impossible. If a significant number of satellites were to become inoperable, there could be a substantial delay before they are replaced with new satellites. A reduction in the number of operating satellites would impair the current usefulness of the GPS system or the growth of current and additional market opportunities, which, in either case, would adversely affect the Company’s business, financial condition and the results of operations. Spare satellites have been launched to address these concerns. There can be no assurance that the U.S. Government will remain committed to the operation and maintenance of GPS satellites over a long period of time, or that the policies of the U.S. Government for the use of GPS without charge will remain unchanged.
Prior to May 2000, the accuracy of GPS was reduced by the distortion of GPS signals as a result of selective availability (“SA”), which was controlled by the U.S. Department of Defense. SA was the activated, intentional system-wide degradation of stand alone GPS accuracy from approximately 25 metres to approximately 100 metres. The Department of Defense implemented SA in order to deny hostile forces accurate position, time and velocity information supplied by GPS. In certain military applications, classified devices are utilized to decode the SA degradation and return accuracies to their original levels. NovAtel has to date been able to design products that will reduce the degradation that can be caused by SA. Although the U.S. Government discontinued the use of SA effective May 2000, there can be no assurance that the U.S. Government will not take further actions which would adversely affect the use of GPS. These actions could include various methods of degrading the system, rendering it inoperable or the re-implementation of SA by the U.S. Department of Defense in times of military action. There can be no assurances that NovAtel would be able to design products to compensate for these further actions. In addition, to protect national security interests, various U.S. Government agencies have indicated their intention to limit or prohibit the use of techniques which compensate for SA and such limitations or prohibitions could have a material adverse effect on the Company’s business, financial condition and results of operations. Certain non U.S. government organizations have expressed concern regarding the susceptibility of GPS equipment to intentional or inadvertent signal interference. Such concern could translate into reduced demand for GPS products in certain geographic regions.
The European Community and European Space Agency have completed plans and are in the process of launching full-scale development of Galileo, a system similar in capability to GPS. NovAtel is actively involved in Galileo receiver development activities under contracts funded by the Canadian Space Agency and the European Space Agency. There can be no assurance that NovAtel will be able to design products compatible with Galileo or that external funding will continue to be available for such work.
The Company derives a substantial portion of its revenue from the aviation industry and factors that adversely affect the aviation industry generally could adversely affect the Company’s financial condition and results of operations.
NovAtel derives revenue from the Aerospace and Defence market sector, a substantial portion of which has been derived from sales to the ground infrastructure and airborne aviation industry. The aviation industry has only in recent years began to recover from activities arising from the events of September 11, 2001 in the United States. In addition, as of December 31, 2006, NovAtel deferred $1.3 million of costs related to the development of a certified aviation GPS receiver. A protracted downturn in the aviation industry could result in a material adverse effect on the Company’s revenue from this market and on NovAtel’s ability to recover the deferred development costs which could adversely affect its financial condition and results of operations.
The Company may be unable to utilize certain tax deductions and investment tax credits, which could adversely affect the Company’s results of operations.
The Company’s operations are substantially located in Canada and accordingly, Canada is the Company’s main tax jurisdiction. The Company has not recorded a provision for current income taxes in Canada, other than for Canadian federal large corporations tax, income tax related to Waypoint Consulting Inc.’s (“Waypoint”) operations prior to amalgamation with NovAtel and a provision related to the benefit of income tax credits, due to previously incurred losses, credits and costs. As of December 31, 2006, the Company had approximately $120 million of losses, investment tax credits, depreciation and research and development costs that are available to reduce future taxable income and taxes payable primarily in Canada. The Company has determined that the acquisition of a majority of its Common Shares by CMC Electronics in 1998, BAE SYSTEMS p.l.c.’s acquisition of the majority of the common shares of CMC Electronics in November 1999 and ONCAP’s acquisition of the majority of the common shares of CMC Electronics in April 2001 each constitute an acquisition of control of the Company for Canadian income tax purposes. Accordingly, the availability of certain of the Company’s Canadian income tax losses, research and development costs, depreciation deductible for tax purposes and investment tax credits may be subject to limitation. The ultimate availability and amount of these losses, credits and costs may be dependent upon future Canada Revenue Agency audits.
NovAtel may incur significant costs to satisfy regulatory requirements relating to internal controls over financial reporting.
Section 404 of the Sarbanes-Oxley Act of 2002 requires NovAtel to perform an evaluation, including management’s certification of its internal controls over financial reporting. Management’s Report is included in this Form 20-F. During 2007, NovAtel will be updating its evaluation of internal controls (and any necessary remediation) required in an effort to comply with the management certification and auditor attestation requirements which will be required in the Company’s Form 20-F for the fiscal year ending December 31, 2007. As a result, the Company expects to incur additional expenses and diversion of management’s time. While NovAtel currently anticipates being able to fully implement the requirements relating to internal controls and all other aspects of Section 404 in a timely fashion, the Company cannot be certain as to the timing of completion of its evaluation, testing and remediation actions or the impact of the same on its operations.
The Company may be subject to litigation and infringement claims that may harm its business or reputation, be costly and divert management’s attention.
The technology used by NovAtel in its business may subject the Company to claims that the Company infringes on the patents or proprietary rights of others. The risk of this occurring will tend to increase as the GPS, GLONASS and Galileo industry expands and more patents are issued. Furthermore, many of the Company’s competitors and other companies have already applied for patents covering technology similar to that used by the Company, and many patents have already been issued which cover these technologies. The Company may be involved in future lawsuits alleging patent infringement, other intellectual property rights violations, product liability claims or general commercial claims. In addition, litigation may be necessary to:
13
• assert claims of infringement;
• enforce the Company’s patents, if any;
• protect the Company’s trade secrets or know-how; and
• determine the enforceability, scope and validity of the proprietary rights of others.
The Company may be unsuccessful in defending or pursuing these lawsuits. Regardless of the outcome, litigation can be very costly, can divert management’s efforts and could materially affect the Company’s business and operating results. An adverse determination may subject the Company to significant liabilities or restrict or prohibit the Company from selling its products.
See “Item 4 — Information on the Company, Business Overview — Legal Proceedings.”
The reallocation of radio frequency bands used by GNSS technology or other interference with the reception of GNSS signals could harm the utility and reliability of the Company’s products.
GPS technology is dependent on the use of the radio frequency spectrum. The assignment of spectrum is controlled by the International Telecommunications Union (“ITU”). The Federal Communications Commission (“FCC”) and Industry Canada are responsible for the assignment of spectrum for non-government use in the United States and Canada, respectively, in accordance with ITU regulations. Any ITU, FCC or Industry Canada reallocation of radio frequency spectrum, including frequency band segmentation or sharing of the spectrum, could cause interference with the reception of GNSS signals and may materially and adversely affect the utility and reliability of NovAtel’s products, which would, in turn, have a material adverse effect on its business, financial condition and results of operations. In addition, emissions from mobile satellite service and other equipment operating in adjacent frequency bands or in band may materially and adversely affect the utility and reliability of NovAtel’s products, which could result in a material adverse effect on the Company’s business, financial condition and results of operations.
On May 11, 2000, the FCC issued a Notice of Proposed Rulemaking that proposed rules for the operation of Ultra Wideband (“UWB”) radio devices on an unlicensed basis in the frequency bands allocated to GPS. A coalition of companies and trade associates, including various airline companies, the Air Transport Association of America and the U.S. GPS Industry Council, submitted a proposal for the regulation of UWB devices to the FCC in November 2001. On February 14, 2002, the FCC approved the commercial use of UWB technology at conservative power limits. The current standards of operation set limits on what radio frequencies UWB devices can be operating in, including avoiding those frequencies used by the military and companies that sell global positioning services. In February 2003, the FCC upheld its ruling to allow the production of UWB devices with “conservative” power limits. This may lead the way for a proliferation of personal wireless devices that would be manufactured and sold on the open market without licence requirements. No restrictions on the density of these devices will be defined. Therefore, it is possible that the GNSS noise floor could be contaminated and rise by as much as 10 times the current level when operating in an area with a high density of operating UWB devices. This degradation of the GNSS signal-to-noise ratio would adversely affect the performance of the receivers. NovAtel is adding additional digital signal processing algorithms to its next generation GNSS receivers to enable tracking of weak GNSS signals or continue to operate in high noise floor environments. If the FCC expands or changes the current UWB standards, UWB devices might cause interference with the reception of GNSS signals. Such interference could reduce demand for GNSS products in the future. Any resulting change in market demand for GNSS products could have a material adverse effect on the Company’s business, financial condition and results of operations.
The Company may be unable to properly manage the discontinuation of its older products.
As NovAtel develops newer products, many of its older products will reach their end of life. As NovAtel discontinues the manufacturing and sale of these older products, it must manage the liquidation of inventory, supplier commitments and customer expectations. If NovAtel is unable to properly manage the discontinuation of these older products, it could have a material adverse effect on its business, financial condition and results of operations.
Item 4. Information on the Company
A. History and Development of the Company
The Company was incorporated under the Canada Business Corporations Act (“CBCA”) on October 17, 1978 as 89006 Canada Ltd. The Company was extra provincially registered in Alberta on November 20, 1979 and remains active in this jurisdiction as of the date of this Annual Report. In July 1979, the Company’s name was changed to Westech Systems Ltd. and in April of 1983 was changed to NovAtel Communications Ltd. In October 1996, the Company changed its name to NovAtel Inc. and in November 1996, the Company amended its articles to split its then outstanding common shares from 4 million to 5.2 million and amended its articles to authorize the stated capital of the Company to include an unlimited number of Common Shares and First Preference Shares.
From the time of the Company’s formation until the mid-1990s, NovAtel’s business was focused on the development of various communication businesses based on wireless technology. In 1989, NovAtel acquired Norstar Instruments Ltd., a developer of GPS technology.
Between 1992 and 1996, NovAtel divested its non-GPS businesses in a series of transactions. Since that time, NovAtel’s business has been focused primarily on high-precision GPS technology and products.
In 1997, NovAtel completed an initial public offering of its Common Shares in the United States and was concurrently listed on NASDAQ with the offering under the symbol “NGPS.”
On April 17, 1998, pursuant to requests by its customers to integrate GPS technology into its aviation systems, CMC Electronics acquired 58.3% of the then outstanding Common Shares.
14
In 1999, Point was established to develop advanced measurement solutions that incorporate NovAtel’s GPS technology, primarily for Sokkia’s surveying and mapping markets.
On April 11, 2001, an investor group led by ONCAP L.P. (“ONCAP”) acquired control of the Company through the acquisition of CMC Electronics.
In 2001, NovAtel acquired a controlling equity interest in Mezure, Inc. (“Mezure”), a company that had been developing a GPS, wireless communication and Internet-based product for deformation monitoring of man-made and natural structures. The business operations of Mezure were discontinued in 2003. See “Item 5 — Operating and Financial Review and Prospects, Operating Results — Overview.”
In 2002, NovAtel and Leica Geosystems AG (“Leica Geosystems”) formed a strategic partnership, under which NovAtel would develop and supply GPS-based products and technology to Leica Geosystems. See “Item 4 — Information on the Company, Business Overview — Strategic Partnerships — Leica Geosystems.”
In May 2003, NovAtel acquired CMC Electronics’ non-aviation L1 GPS OEM product line to broaden the Company’s product line. See “Item 5 — Operating and Financial Review and Prospects, Operating Results — Overview.”
In 2004, NovAtel and CMC Electronics formed a strategic partnership, under which NovAtel develops and supplies GPS-based products and technology to CMC Electronics. See “Item 4 — Information on the Company, Business Overview — Strategic Partnerships — CMC Electronics.”
From January 2005 to August 2005, CMC Electronics sold all of its common shares of NovAtel.
On October 1, 2005, the Company acquired all of the shares of Waypoint for approximately $3.5 million in cash, subject to post-closing adjustments to working capital. Waypoint’s products include specialized real-time and post-processing GNSS and GNSS/inertial positioning and trajectory software. See “Item 5 — Operating and Financial Review and Prospects, Operating Results — Executive Overview.”
The Company’s capital expenditures over the last three years were $6.4 million in 2006, $2.4 million in 2005, and $2.3 million in 2004 and were primarily for equipment for research and development, computer equipment and software and patents/trademarks. The Company expects capital expenditures of approximately $5.5 million in 2007 to be internally financed, substantially all of which will be made in Canada.
There has been no indication of any public takeover offers by third parties in respect of the Company’s shares or by the Company in respect of other companies’ shares during the last and current fiscal year.
NovAtel’s Common Shares are listed on The NASDAQ Global Select Market under the symbol “NGPS.” The Company’s head and registered offices are located at 1120-68th Avenue N.E., Calgary, Alberta, T2E 8S5, phone number (403) 295-4500. The Company’s website is located at www.novatel.com. The information on the website is not incorporated by reference into this Annual Report. The Company’s agent for service in the United States is CT Corporation System, 111 - 8th Avenue, 13th Floor, New York, New York 10011.
B. Business Overview
General
NovAtel designs, markets and sells high-precision GNSS and other positioning components and sub-systems used in a wide variety of commercial applications principally in the aviation, geomatics (surveying and mapping), mining, precision agriculture, marine and defence industries. NovAtel’s solutions combine hardware, such as receivers and antennas, with software to enable its customers to fully integrate the Company’s high-precision positioning technology into their respective products and systems. The Company is focused on supplying core high-precision positioning technology to OEMs and system integrators who build systems for various end market applications.
Management of the Company believes the primary customer benefits of NovAtel’s core technology solutions include:
• high-precision positioning with accuracy to the sub centimetre level;
• high-reliability and robust performance, even in challenging environments;
• cost-effective components and sub-systems to enable broad market application;
• small, low-power designs for easy system integration; and
• flexibility to integrate customer software solutions enabling the Company’s customers to reduce system costs and accelerate time to market.
The availability of reliable and cost-effective high-precision positioning technology has resulted in an expanding number of commercial applications for the technology. Examples of applications for this technology include enabling commercial aircraft to use direct point-to-point flight lines resulting in reduced operating cost, farmers to equip their tractors with machine controlled precision guidance systems, which typically results in lower operating costs and higher crop yields, and surveyors to use GNSS-based instruments to survey sites more rapidly and accurately.
One of the most critical elements of the NovAtel solution is the Company’s product line of GNSS receivers. The receiver is the core technology which receives, processes and resolves the GNSS signals. The majority of NovAtel’s proprietary technology is incorporated into NovAtel’s receivers and most of the research and development efforts of the Company are directed towards improving their accuracy, reliability and cost effectiveness. These receivers are highly flexible and configurable with software for differing accuracy and performance, allowing the Company and its customers to leverage a limited number of hardware platforms into a wide variety of end-market applications.
15
Industry Overview
Satellite Navigation Systems
Location determination has become a fundamental requirement for many consumer and commercial activities. GPS is currently the world’s most widely used and accepted technology for precise location determination.
Development of the GPS system began with the launch of the first GPS satellite in 1978. The GPS system was founded and continues to be funded and controlled by the U.S. Department of Defense. The purpose of the GPS system is to provide precise location and time determination for military and civilian applications. The GPS system can currently be accessed free of charge and provides positioning data 24 hours a day worldwide.
The survey industry was the first commercial market to make widespread use of the GPS system. Adoption began in the late 1980’s and grew significantly in the early 1990’s as new technologies emerged to make the applications more cost-effective. Since that time, use of the system has spread to a variety of commercial and consumer applications including navigation, tracking, mapping and monitoring.
The GPS system is based on signals presently provided by a constellation of 29 orbiting satellites. The system of satellites currently broadcasts on two frequencies, L1, which is available for civilian use, and L2 which is encrypted and primarily used for military applications. GPS modernization will see a new frequency, L5, and a new Signal, L2C, on satellites launched in the future. GPS positioning is based on a triangulation technique that precisely measures the distance from a GPS receiver to satellites which continuously transmit precisely timed radio signals. GPS receivers calculate the distance by measuring the travel time of the satellite signal. Signals from four satellites are typically required to compute the three dimensional position of the GPS receiver. Under normal operating conditions, a receiver is able to receive signals from six to eight satellites at any point in time.
GLONASS is a similar positioning system established by the former Soviet Union and controlled and operated by the Russian government. The GLONASS system was introduced in 1982 with the launch of its first satellite and currently consists of 12 active satellites. Industry participants generally view GPS as being superior to GLONASS primarily as a result of the greater number of active satellites.
A third system, called Galileo, is currently being developed by the European Space Agency and is scheduled to become operational between 2010 and 2012. According to the report entitled “Global Navigation Satellite Positioning Systems and Devices” prepared by Allied Business Intelligence Inc., a leading industry research firm, and published in 2006 (the “Allied Report”), the European Union is planning to spend €3.2 billion over the next several years to deploy the Galileo system. The development of alternative satellite positioning systems is a benefit to providers of global positioning technology, such as the Company, since products can be designed to use the signals from multiple systems resulting in greater accuracy and reliability.
GPS Market Overview
The market for positioning technology has experienced significant growth since the original launch of the first GPS satellites. According to the Allied Report Worldwide, revenue from global GPS systems was estimated to be approximately U.S. $38.0 billion in 2006. According to the report entitled “North American GPS Equipment Markets (A601-22)” prepared by Frost & Sullivan, a leading industry research firm, and published in 2004 (the “Frost & Sullivan Report”), total unit sales in the North American market are expected to grow from 2.9 million in 2003 to 11.4 million in 2010 for a compounded annual growth rate of approximately 22%.
GNSS Market
The overall GNSS market can be divided into three primary segments, lower precision consumer markets, mid level commercial and higher precision commercial markets. Management of the Company estimates NovAtel’s current total addressable annual market for mid level commercial and high-precision positioning component technologies and sub-systems is approximately U.S. $400 million to U.S. $500 million.
The following chart illustrates the view of management of the Company in respect of the relative accuracy and reliability needs of the various end-markets. Accuracy refers to how precise the positioning information is required to be in an application. Reliability refers to how important the continuity of positioning is to an application.
16
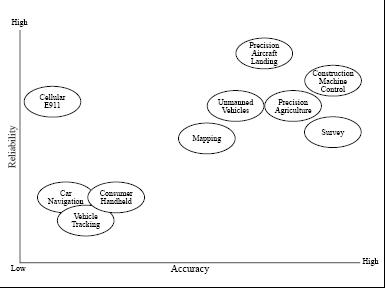
Management of the Company believes that a limited number of highly specialized GNSS companies, including NovAtel, have the capability to develop and produce technology that can be used in higher precision applications, largely as a result of proprietary and patented technology.
As a result of the high degree of specialization required, commercial high-precision GNSS component technology is typically sold at significantly higher prices, as illustrated by the following chart, which typically results in higher gross margins than lower precision, consumer focused systems.

Source: Frost & Sullivan Report (2004).
Growth in High-Precision GPS
Management of the Company believes that growth in the high precision segment of the GPS market is the result of an expanding number of applications which are being driven by technological advancements with respect to accuracy and reliability and a general reduction in the cost of peripheral component technology. Many new applications are also being driven by improving safety of life or reducing labour requirements.
Technological Advancements
Since the introduction of GPS technology, there have been a number of technological innovations that have significantly increased the accuracy and reliability of GPS products. Differential GPS, one of the first techniques developed to improve performance, can be used to achieve position accuracies down to a few millimetres for certain applications. With this technique one receiver, typically called a base station, is precisely positioned on a known location and calculates a variety of measurement errors. This differential correction data is then broadcast via communication links to other receivers, that can be static or in motion, which receive the differential corrections and apply them to provide precise locations. Using this technique, virtually all significant positioning errors can be eliminated and the resulting differential positions can achieve superior accuracy. Limitations of early differential GPS technology included the cost, reliability and form factor of the systems.
Differential GPS was originally developed based on single-frequency receivers which used only the civilian signal. The first commercial dual frequency GPS system, which makes use of both the L1 frequency and the L2 frequency, was introduced in the mid 1980s. Using both signals allows for significant reductions in the time required to calculate a precise position and an increase in the working range of GPS devices.
Other technologies have been developed to address specific issues or applications. For example, in 1993 NovAtel introduced Narrow Correlator® tracking technology which significantly reduced the effects of multipath interference which is caused by the reflection of multiple GPS signals. This innovation has allowed for a significant increase in accuracy. Comparable versions of this technology have been broadly adopted by the industry.
17
Another innovation was on-the-fly initialization which enabled differential GPS to be applied to receivers in motion while maintaining accuracy to within a few centimetres. This technology broadened the application of GPS to unmanned and automated vehicles.
NovAtel has introduced numerous additional technological innovations over the past ten years. See “Item 4 — Information on the Company, Business Overview — Technology.” These and other technological innovations have enabled the significant expansion of applications for high precision GPS positioning solutions.
Continued Reduction in the Cost of Peripheral Component Technology
High-precision GNSS component suppliers, including the Company, as well as system integrators have benefited from significant reductions in the cost of peripheral components such as microprocessors, memory and wireless communications technology. These savings have enabled a significant reduction in the overall cost of GNSS solutions and have driven an expansion in the number of applications using the technology. Management of the Company believes that this trend will continue to promote growth for the high precision segment of the GNSS industry.
Other Industry Trends
In addition to the growth trends set forth above, management of the Company believes that growth of the high precision segment will be driven by the outsourcing of core GNSS technology by OEMs and system integrators and the development of complementary technologies that will enhance the performance and functionality of existing GNSS technology.
Outsourcing of Core GNSS Technology by OEMs and System Integrators
A number of NovAtel’s key competitors and OEM customers have historically developed core GNSS technology in-house or have acquired stand alone GNSS component vendors. Management of the Company believes there is currently a trend among OEMs and system integrators to outsource core GNSS technology to vendors such as NovAtel. By doing so, these companies are attempting to re-focus on their core competencies, developing custom systems for end market applications, which may enable them to make better use of their capital and other resources. Management of the Company also believes it is becoming increasingly difficult for these companies to provide cost effective and technically advanced precision GNSS receivers relative to GNSS focused companies, such as NovAtel, that have strong patent positions, substantial continuous GNSS development and the ability to leverage their receiver technology across multiple applications and customers.
Development of Complementary Technology
Management of the Company believes that the development of complementary technology that enhances or augments the accuracy and reliability of the core GNSS technology will enable a multitude of new applications for the technology and drive further growth. For example, the integration of inertial technology with GNSS enables the combined system to provide full position, velocity and attitude information while the receiver passes through areas of signal blockage. There are a number of other complementary technologies that are expected to cause acceleration in the number of applications using the technology.
Barriers to Entry
Management of the Company believes there are significant barriers to entry in the industry, including:
• proprietary and patented technology;
• scarcity of industry expertise; and
• extensive, established relationships with market leading customers and partners.
Mission and Strategy
NovAtel’s goal is to become the leading provider of high-precision global positioning component technologies and sub-systems. In order to achieve this goal, NovAtel is focused on the following growth strategies:
• continue to invest in high-precision global positioning technology;
• partner with and/or acquire enabling and complementary technologies;
• continue to build market share with large OEMs and emerging system integrators;
• attract and retain key employees;
• continue to generate strong revenue growth while improving profitability and capital efficiency; and
• expand international sales.
Continue to Invest in High-Precision Global Positioning Technology
The Company is committed to continual improvement of the accuracy, reliability, cost and quality of its technology. To achieve these objectives, the Company intends to invest in research and development primarily in the following areas: (i) core GNSS hardware and software; (ii) technology supporting the modernization of the GPS system; (iii) technology supporting other satellite based positioning systems; and (iv) technology that augments the Company’s global positioning technology.
Partner with and/or Acquire Enabling and Complementary Technologies
NovAtel continually seeks to develop strategic partnerships with industry leaders of enabling and complementary technologies, such as inertial systems, guidance technology and wireless communications. The Company also expects to continue to pursue selective strategic acquisitions that complement current product offerings, expand its market opportunity or broaden its customer base.
18
Continue to Build Market Share with Large OEMs and Emerging System Integrators
The Company plans to continue to build market share and enhance its growth through leveraging its OEM business model. Furthermore, the Company expects to continue to develop relationships with emerging system integrators through its growing international dealer network. An important element of this strategy is to continue to work with OEMs and system integrators in a highly collaborative fashion and to provide them with an exceptional level of customer support.
Attract and Retain Key Employees
NovAtel has assembled a talented and experienced team with proven expertise in the GNSS industry. As the Company experiences growth, it intends to hire employees with demonstrated experience and ability, with the objective of increasing the number of highly productive teams. Potential employees are offered the opportunity to work for an industry leader on challenging assignments in their area of core competency with access to state-of-the-art development resources. The Company also maintains a competitive performance based compensation program which is designed to attract and retain employees.
Continue to Generate Strong Revenue Growth while Improving Profitability and Capital Efficiency
The Company intends to continue to pursue profitable growth opportunities through its focus on return on investment. Key elements of this strategy include: (i) maintaining selling prices and gross margins by pursuing value added high-precision global positioning applications; (ii) improving capital efficiency through outsourcing select business activities, manufacturing services and certain design functions; and (iii) investing in initiatives to improve efficiency and reduce costs while continuing to deliver superior customer service.
Expand International Sales
The Company plans to expand international sales by establishing sales offices outside of North America. The Company opened a sales office in the United Kingdom to service Europe, the Middle East and Africa in 2005, and opened a sales office in Australia in 2006 to service Australia and Asia.
Products
NovAtel offers a broad range of high-precision GNSS and other positioning components and sub-systems. The Company’s products combine specialized hardware with proprietary software to enable its customers to fully integrate the Company’s technology into their respective products and systems. NovAtel’s products include GNSS receivers, antennas, proprietary software and augmented GNSS products.
A critical component of NovAtel’s products is its GNSS receivers which process the satellite signals received through the antenna to determine precise positions. A key advantage of NovAtel’s GNSS receivers is that they are highly flexible and configurable allowing the same receiver to be used across a broad range of applications. For example, NovAtel can install different software on the same hardware receiver to meet the specific requirements of customers. This benefits NovAtel through reduced unit costs, higher production rates, focused research and development efforts and a streamlined product line. NovAtel’s customers also benefit in that they are able to upgrade their systems on a cost-effective basis by installing new software as opposed to having to replace the entire receiver. NovAtel’s GNSS receivers are also capable of storing and running customer applications, enabling NovAtel’s customers to realize cost-efficiencies and accelerated time to market.
NovAtel offers a range of antennas that are capable of supporting both single frequency, dual-frequency and dual constellation receivers and may be incorporated into a broad range of applications, including those which operate in dynamic or challenging environments.
NovAtel has also developed a range of proprietary high-precision GNSS positioning software that, working in conjunction with its hardware, enables its customers to achieve accuracies to within a few centimetres, in real-time, while providing a high degree of reliability.
NovAtel leverages the components described above in its aviation and geomatics product lines as well as in its augmented GNSS products, such as the SPANTM product family. The SPAN product family integrates third-party inertial measurement technology with the Company’s GNSS technology (receiver, antenna and software) to provide the user with continuous positioning data even when a GNSS signal has been temporarily lost.
NovAtel acquired Waypoint Consulting in 2005. This acquisition provided NovAtel with a new post-processing software product line which the Company believes is a leader in the photogrammetry market. One of the software products post-processes GNSS and inertial measurements and fits directly into the SPAN product family mentioned above.
In March 2006, NovAtel released its new generation of GNSS receivers (“OEMVTM”) which include modernized GPS technology and optional GLONASS capability. The OEMV product family complies with the upcoming EU regulations governing the use of hazardous substances.
In 2006, the Company continued development of a GPS/Galileo receiver, and is part of an industrial team focused on the development and supply of the reference receivers for the Galileo monitoring and ground control system.
In 2006, the Company also launched the Europak-15a, a 16 channel dual mode GPS and Galileo receiver. Customers for this receiver include agencies and organizations involved in the test and evaluation of the Galileo system and signals.
The following are the Company’s most popular products with a brief explanation of their features and applications.
19
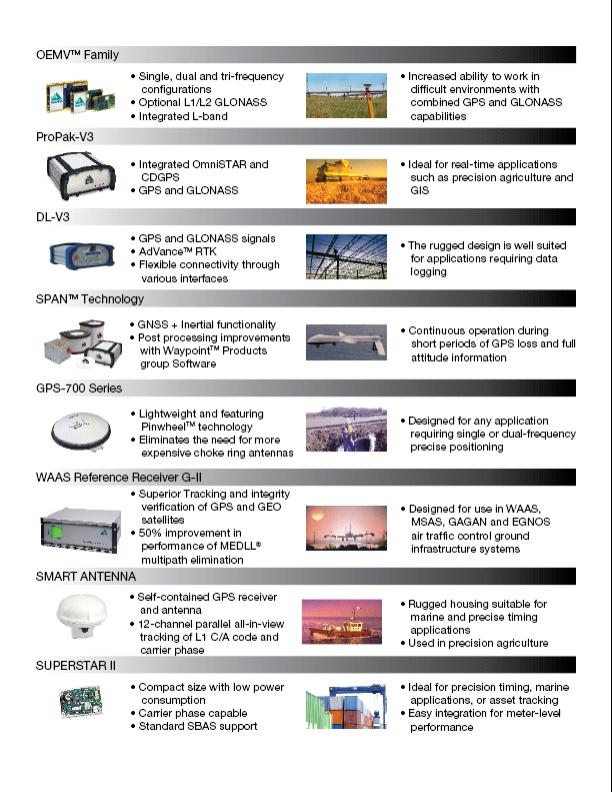
20
Markets
Management of the Company believes there are three primary drivers of future growth in the high-precision global positioning industry:
• increased sales into existing applications in traditional markets;
• development of new applications in non-traditional markets; and
• development of new applications in emerging markets.
Increased Sales into Existing Applications in Traditional Markets
Management of the Company believes sales of existing applications will continue to increase in markets that have been traditional users of GNSS technology. Generally, these are markets where GNSS has either replaced older technology, such as the marine industry, or markets where GNSS technology was adopted at an early stage largely because the benefits of GNSS outweighed price sensitivity, such as the survey and mapping market.
The Company expects these markets to continue to expand for a number of reasons including:
• continued reductions in the price of GNSS technology are expected to make existing applications more cost-effective for a broader range of users;
• development of new technology is expected to enhance the functionality and productivity of existing applications which will increase the number of users; and
• outsourcing of core GNSS technology by OEMs and system integrators is expected to increase.
Selected examples of growth applications in traditional markets include surveying and mapping, aviation and air traffic navigation ground infrastructure and commercial marine.
Development of New Applications in Non-Traditional Markets
New applications continue to emerge within established markets that to date have not been traditional users of GNSS technology. The growth in new applications is largely being driven by OEMs and system integrators who are developing new products that have become commercially viable as a result of technological improvements, cost reductions and the development of complementary technology.
Selected examples of growth applications in non-traditional markets include precision agriculture and mining and construction machine control.
Development of New Applications in Emerging Markets
New applications are also being developed within markets that have been created or transformed as a result of the evolution of low-cost, high-precision positioning technology. These markets represent a diverse range of significant growth opportunities for the Company.
Selected examples of applications in emerging markets include unmanned air vehicles, airborne weapons training and precision asset tracking and guidance.
Customers
NovAtel competes in the high-precision global positioning market by selling components and sub-systems to leading OEMs and system integrators in multiple industries. During the past two years, NovAtel has sold its products to over 500 customers worldwide, including some of the leading companies in their respective sectors.
For the fiscal year ended December 31, 2006, NovAtel’s 10 largest customers represented 69% of its revenues.
Sales to key customers, Leica Geosystems, Beijing BDStar, and YC International, accounted for 23%, 9%, and 5%, respectively, of the Company’s total revenues in 2006. In comparison, sales to Leica Geosystems, Beijing BDStar, and YC International accounted for 18%, 11%, and 3%, respectively, of the Company’s total revenues in 2005. See “Item 4 — Information on the Company, Business Overview — Strategic Partnerships — Leica Geosystems” and “Item 3 — Key Information, Risk Factors — Dependence on Key Customers.”
The Company’s total revenue attributable to Point, including NovAtel’s sales to Point and its 49% proportionate share of sales made by Point, accounted for 14% of total revenues in 2006 and 2005. On March 16, 2007, Topcon Corp. (“Topcon”) and Sokkia announced that they had entered into an agreement to form a “combined” entity. Topcon has GNSS technology and products that compete with those supplied by NovAtel to Point. The agreement under which NovAtel and Sokkia established Point expires in July 2009. The loss of Point or Sokkia, or both, as a customer or a substantial decrease in sales to Point could have a material adverse effect on NovAtel’s business, financial condition and results from operations and could cause its stock price to decline.
In 2006, the Company derived 38% of its revenues in the United States, 17% in Asia/Australia, 37% in Europe, 6% in Canada and 2% in other parts of the world.
The Company divides its customers into three primary market categories: Special Applications, Geomatics and Aerospace and Defence. The following chart sets out the consolidated revenues of the Company by the categories indicated for the fiscal years ended December 31, 2004, 2005 and 2006.
21
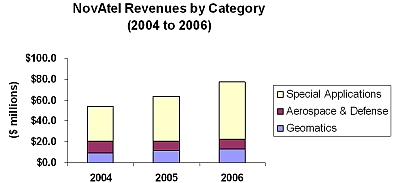
The following chart sets out consolidated revenues by geographic area for the financial years ended December 31, 2004, 2005 and 2006.
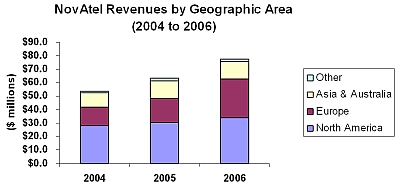
Special Applications
Special Applications is the largest and fastest growing category, contributing $55.3 million or 71% of NovAtel’s revenues for the fiscal year ended December 31, 2006. This category has experienced a 35% compounded annual growth rate from 2002 to 2006. This group’s customers are in diverse markets, including precision agriculture, marine, mining and machine control, unmanned vehicles and sports media.
Special Applications has three main types of customers:
• large, industry leading companies utilizing NovAtel’s proprietary solutions to develop replacement and transformative products for their end-markets, such as Leica Geosystems in the survey market or AGCO in precision agriculture;
• innovative system integrators that have developed new markets through creative integration of NovAtel’s products with other technology, such as BEELINE; and
• dealers and distributors that service hundreds of smaller companies that are developing innovative solutions for existing and new markets.
NovAtel’s dealers and distributors are critical in extending the market reach of the Company. In many cases, these organizations make the first sales to small system integrators that grow to become significant customers through the development of innovative product offerings. This was the case for Beijing BDStar, which is now one of NovAtel’s largest customers.
Geomatics
Geomatics (surveying and mapping) was one of the first commercial applications of high-precision GNSS technology and is currently a well-established market. The Geomatics category contributed $13.2 million, or 17%, of NovAtel’s revenues for the fiscal year ended December 31, 2006. Revenue in NovAtel’s Geomatics category consists primarily of sales attributable to Point, the Company’s joint venture with Sokkia, which comprised 84% of the Geomatics revenue in 2006. Point provides Sokkia’s global marketing organization with advanced measurement solutions for the fields of surveying, mapping, geographic information systems, construction and construction machine control. Sokkia’s distribution system includes subsidiaries and representatives around the world, each having its own dealer network. The geomatics category also includes revenues from third party customers which comprised approximately 16% of the geomatics category in 2006. NovAtel’s sales to Leica Geosystems, although primarily for geomatics applications, are not included in this category for reporting purposes due to historical classification.
Given the relative maturity of this market, growth in the sale of traditional GPS products is expected to be moderate. However, management of the Company believes that GPS modernization and the introduction of the Galileo system represent significant opportunities for future growth as end-users upgrade their equipment in order to realize the enhanced performance and efficiencies that may be achieved through the utilization of the new signals.
Aerospace and Defence
Aerospace and defence continue to be strong markets for GPS technology and include some of the most technically demanding applications of NovAtel’s products. The Aerospace and Defence category contributed $9.0 million or 12% of NovAtel’s revenues for the fiscal year ended December 31, 2006. Customers of the Company in this group utilize NovAtel’s high-precision positioning technology for critical components in such applications as the ground networks of civil air traffic navigation systems, and in-flight guidance systems on board aircraft that together enable aircraft to determine their precise position, and certain military applications.
22
The Company’s family of Wide Area Augmentation System (“WAAS”) receivers and other elements are key components of revenue in this category. The WAAS receivers are an important part of the existing ground infrastructure that supports the next generation of air traffic navigation systems for commercial aviation in North America, Europe, Japan, China and India. Raytheon Company, the Federal Aviation Administration (“FAA”) and other leading companies and national aviation organizations around the world have selected NovAtel as a key receiver and signal generator supplier for this application primarily because of NovAtel’s leading technology in this area.
Management of the Company believes that opportunities for future growth within the aviation and defence markets will be driven by such developments as the introduction of the Galileo system and the use of commercial grade receivers in defence applications such as unmanned vehicles. The Company has successfully developed early commercial GPS/Galileo receivers, and has been selected as part of an industrial team to develop and supply the reference receivers for the Galileo monitoring and ground control system.
The Company is currently working with OEMs and system integrators that have determined precision GPS technology can be utilized in many military applications such as training, logistics and missile tracking which do not require the use of encrypted military GPS technology.
Sales, Marketing and Distribution
NovAtel sells, markets and distributes its products through both direct and indirect channels in order to maximize market coverage on a cost-effective basis. The primary focus for NovAtel’s sales and marketing efforts is on OEM customers, strategic relationships and supporting a network of dealers and resellers. The Company has developed its sales and marketing capabilities in anticipation of and in response to customer needs as they arise in its multiple markets. The in-house sales and marketing efforts are focused on market research, product management, customer service, distribution management, communications and promotions. Each market receives specific attention to the needs of its sales and distribution channels, which are rapidly changing.
The Company believes that providing a high level of customer technical support is critical to creating and maintaining strong relationships with their OEM and system integrator customers. The Company is able to achieve this level of support by employing a sufficient number of qualified engineers and technicians to advise and provide customers with integration and after-sale support. Due to frequent interaction with customers, these integration engineers and support technicians also act as an important source of customer information, which can drive product enhancements, new product ideas and new business opportunities.
Technology
NovAtel has invested significant funds and resources to become a leading provider of high-precision positioning technology. Since 1992, NovAtel has provided several major technological innovations to meet the increasingly demanding needs of the high-precision positioning industry. NovAtel currently holds 31 U.S. patents and various related foreign patents in jurisdictions such as Canada, Europe and Japan which expire at various dates no earlier than March 31, 2009 and has numerous pending U.S. and foreign patent applications. Some of the more significant technology developments by the Company are discussed below.
1992 Narrow Correlator® Tracking Technology
NovAtel established itself in the GPS industry through the introduction of its patented Narrow Correlator® tracking technology in 1992. Narrow Correlator tracking allowed NovAtel products to provide positioning accuracy to within one meter with a single-frequency receiver while significantly reducing the effects of multipath interference caused by the reflection of multiple GPS signals. Relative to other GPS technology available at the time, this innovation resulted in a five-fold improvement in accuracy for GPS devices.
1994 Multipath Elimination Technology (“MET”)
NovAtel continued its technology advancements with the introduction of MET in 1994. MET expanded upon the Narrow Correlator tracking technology by refining software algorithms to more effectively filter the effects of multipath signal interference. This new technology removed 25% to 50% of the residual multipath errors.
1995 Multipath Estimating Delay Lock Loop (“MEDLL®”)
In 1995, NovAtel introduced MEDLL® technology. MEDLL offered a more rigorous approach to the reduction of multipath effects using improved circuitry, software control and processing. The MEDLL technology further reduced the effects of multipath interference by up to 90%.
1995 Real Time Kinematic (“RTK”) Signal Processing Technology
Also in 1995, NovAtel introduced a unique method of applying RTK processing to the carrier frequency signals in order to rapidly increase the accuracy of the computed position from meters to less than 20 centimeters. This signal processing method is particularly useful for single frequency GPS receivers. Previous attempts at using RTK resulted in significant delays before reaching precision accuracies.
2000 Pinwheel™ Aperture Coupled Slot Array Technology
In 2000, NovAtel introduced a new antenna utilizing its patented Pinwheel™ Aperture Coupled Slot Array technology. Using this technology, the Company was able to produce a much smaller and lighter antenna than other available antennas on the market without sacrificing either accuracy or reliability.
2000 Pulse Aperture Correlation (“PAC™”) Technology
Also in 2000, NovAtel introduced its new PAC™ technology. PAC technology implements the latest digital signal processing techniques to provide superior tracking capability in the presence of multipath interference. PAC effectively doubles the accuracy of the Narrow Correlator tracking technology and reduces interference by up to eight times.
23
2002 Model Position Aiding and Position Velocity Filter
In 2002, NovAtel developed a method of increasing the reliability of GPS position output in very challenging environments through the use of model position aiding and position velocity filter techniques. While this technology was initially developed to meet the needs of a specific application, Management of the Company believes that it can be applied to a broader range of markets, such as precision agriculture.
2003 GPS and Micro-Electro-Mechanical System (“MEMS”) Integration
In 2003, the Company developed software that enables the integration of its GPS receivers with a MEMS system. This system can maintain an accurate estimate of position and velocity without the use of GPS satellite signals for short periods of time. In the absence of GPS satellite signals, a GPS receiver cannot provide information about the user’s position or velocity if the direct line-of-sight between the receiver and the satellites is blocked. The integration of GPS and MEMS allows the combined system to provide full position and velocity information while the receiver passes through areas of signal blockage.
2004 GPS Modernization and Integration of Inertial Navigation Systems (“INS”)
In 2004, the Company developed equipment designed to generate and receive the new GPS L5 civil signal. In support of the Company’s air traffic navigation ground infrastructure business, the new L5 equipment will generate the signal used by WAAS Ground Uplink Stations and will also control and monitor the quality of the signal produced by the WAAS geostationary satellites.
The Company continued its technology advancement in the area of integrating GPS and INS technologies, resulting in two patents.
2005 GLONASS and Galileo
The Company’s OEMV family of products also includes optional GLONASS capability. In addition, in 2005, the Company successfully developed GPS/Galileo receivers, and has been selected as part of an industrial team to develop and supply the reference receivers for the Galileo monitoring and ground control system.
2006 RTK Technology and Galileo
In 2006, NovAtel launched a new RTK solution which delivers performance improvements, including more reliable ambiguity solutions and faster narrow lane convergence on short, medium and long baselines, allowing users to work more reliably and efficiently in a wider range of conditions.
In 2006, the Company launched the Europak-15a, a 16 channel dual mode GPS and Galileo receiver. Customers for this receiver include agencies and organizations involved in the test and evaluation of the Galileo system and signals.
Research and Development
The Company’s technology position is supported by a strong commitment to research and development. NovAtel has invested heavily in developing GNSS technology, including the design of proprietary software and integrated circuits for GNSS receivers. The Company’s research and development expense, net of customer funded programs, was $13.5 million, $10.9 million and $9.6 million in 2006, 2005 and 2004, respectively.
In addition, the Company also receives significant amounts of funding from its customers through NRE contracts to conduct research and development on their behalf. Typically, NovAtel retains ownership of the intellectual property developed under these arrangements and is able to exploit such intellectual property for its own purposes. The Company’s total engineering expenditures comprised of internal research and development programs and customer funded programs, were $18.6 million or 24% of revenue in 2006, $15.4 million or 24% of revenue in 2005, and $13.1 million or 24% of revenue in 2004.
Often a new product is initially developed for a customer or strategic partner who is willing to purchase development stage products. The Company uses feedback from such initial customers as a source of information in designing and refining its products, and in defining, with greater precision, customer needs in emerging market areas.
Competition
NovAtel faces competition primarily from other developers and suppliers of high-precision positioning component technology which is sold to OEMs and system integrators for commercial applications, as well as from OEMs who choose to develop and produce the component technology in-house.
The primary competitors supplying component technology to OEMs and system integrators vary by each industry or market served, but generally include Trimble Navigation Limited (U.S.), Thales Group (France), Topcon Positioning Systems (Japan), Javad Navigation Systems (U.S.), NavComm Technologies (U.S.) and at the single-frequency level, companies such as CSI Wireless Inc. (Canada), u-blox (Switzerland) and Furuno Marine Electronics (Japan). While these competitors to NovAtel offer high-precision positioning solutions to OEMs, many also develop, produce and market products that are sold directly to end-users and are, therefore, in competition with the OEMs’ end-products and solutions.
NovAtel works with OEMs in a highly collaborative and cooperative process to provide them with the core technology that becomes integrated into their end products and solutions. Management of the Company believes that the non-competitive nature of its relationships with OEMs is a key differentiator and a competitive advantage for the Company relative to other suppliers.
Strategic Partnerships
Leica Geosystems
The Company entered into a strategic co-operation agreement with Leica Geosystems on May 1, 2003, to jointly develop new technology for GPS in the high-precision geomatics market. The initial term of the agreement is seven years. Under the terms of the agreement, NovAtel has agreed to develop custom versions of existing GNSS receivers and other components for Leica Geosystems. In September 2003, pursuant to the strategic co-operation agreement, the Company entered into a supply agreement with Leica Geosystems which sets forth the arrangements under which NovAtel would develop and supply Leica Geosystems with custom GNSS receivers. Leica Geosystems announced the launch of new products that incorporate NovAtel’s GNSS receiver and antenna technology in each of 2004, 2005 and 2006. In October 2005, Leica Geosystems was acquired by Hexagon AB of Sweden. The Company does not expect this transaction to affect its business with Leica Geosystems. In addition, the Company, Leica Geosystems and CMC Electronics entered into a change of control agreement dated April 5, 2004, which provides Leica Geosystems with certain rights in the event of the acquisition of control of NovAtel by certain competitors of Leica Geosystems. See “— Certain Contractual Rights” and “Item 3 — Key Information, Risk Factors — Dependence on Key Customers.”
24
Point, a NovAtel/Sokkia Joint Venture
The Company owns 49% of the common shares in Point, a geomatics joint venture with Sokkia, one of the world’s largest suppliers of surveying and mapping equipment. The Company sells GNSS receivers and antennas to Point which incorporates these products into surveying systems that are in turn sold through the Sokkia distribution channels and through independent dealers and distributors. In addition, the Company provides facilities, computer support and development and logistical support for Point’s Calgary operations. On March 16, 2007, Topcon Corp. (“Topcon”) and Sokkia announced that they had entered into an agreement to form a “combined” entity. Topcon has GNSS technology and products that compete with those supplied by NovAtel to Point. The agreement under which NovAtel and Sokkia established Point expires in July 2009. The loss of Point or Sokkia, or both, as a customer or a substantial decrease in sales to Point could have a material adverse effect on NovAtel’s business, financial condition and results from operations and could cause its stock price to decline. See “Item 3 — Key Information, Risk Factors — Dependence on Key Customers.”
Certain Contractual Rights
Pursuant to the terms of a strategic co-operation agreement dated April 5, 2004, Leica Geosystems has the unilateral right in the case where a defined competitor of Leica Geosystems obtains (1) 50% of the voting shares of the Company, (2) the power to elect a majority of the Board of Directors, or (3) obtain a significant portion of the Company’s technology, to cancel the strategic co-operation agreement and any related development and supply agreements signed between the Company and Leica Geosystems, the right to purchase the intellectual property developed by the Company on behalf of Leica Geosystems (while providing the Company a license to use such intellectual property in its ongoing business) and in the event of a material disruption in supply to deal directly with the Company’s suppliers (subject to appropriate compensation to the Company).
Employees
A key priority of the Company is to attract, train and retain talented employees. NovAtel views its highly skilled and performance-motivated employees as a competitive advantage and a key part of the strategy for future growth. The Company staff turnover rate was approximately 7% for its fiscal year ending December 31, 2006 (excluding Point employees and involuntary separations).
As at December 31, 2004, 2005 and 2006, the Company (excluding Point) had the following full-time employees:
Full-Time Employees | |||
Department | 2004 | 2005 | 2006 |
| Research and development | 75 | 84 | 108 |
| Operations | 37 | 52 | 69 |
| Administration and finance | 22 | 23 | 28 |
| Sales and marketing | 16 | 21 | 25 |
| TOTAL | 150 | 180 | 230 |
The Company also retained four part-time, three temporary employees and three student personnel as at December 31, 2006. Separately, Point employed 44 permanent employees and one temporary employee as at December 31, 2006. None of NovAtel’s employees are represented by a labour union, and the Company has not experienced any work stoppages.
Operations and Facilities
NovAtel’s registered and head office is located in Calgary, Alberta. The Company’s office space totals approximately 69,000 square feet, including a 22,000 square foot expansion substantially completed in September 2006, and is subject to a ten-year lease that expires in 2016, with an option for NovAtel to extend the term for a further five-year period. At this location, the Company assembles, tests, packages and ships most of its products including GNSS receivers and antennas. The Company expects to be at 100% utilization of the Calgary facility by March 2008.
The circuit card assemblies, which are a primary component of NovAtel’s GNSS receiver, are manufactured by contract suppliers in accordance with NovAtel design, manufacturing and testing requirements. NovAtel has two primary subcontract suppliers of circuit card assemblies.
Patents, Trademarks and Licenses
NovAtel currently holds 31 U.S. patents and various related foreign patents in jurisdictions such as Canada, Europe and Japan which expire at various dates no earlier than November 28, 2010, and has numerous pending U.S. and foreign patent applications. The Company also currently has numerous trademarks worldwide, including the NovAtel trademark, which is registered or pending in over 25 countries. See “Item 3 — Key Information, Risk Factors — Patents and Proprietary Rights; Patent Litigation.”
NovAtel has copyrights and intellectual property rights to its proprietary software and custom integrated circuit designs. In 1997, the Company purchased a license with respect to its SoftSurv® software, which is a full-featured GPS dual frequency data post-processing package software for surveying applications. In 1999, NovAtel licensed SoftSurv and certain intellectual property related to end user products to Point. See “Item 4 — Information on the Company, Business Overview — Strategic Partnerships — Sokkia/Point Joint Venture.”
25
The Company acquired the exclusive rights to the multipath mitigation technique (“MMT”) from the Communication Sciences Corporation for applications in commercial non-military markets. The Company invested in the commercialization of this technology, resulting in design changes within its GNSS Digital Signal Processing and software processing sections.
Legal Proceedings
In July and September 2005, NovAtel, formally contacted ARAM and requested that ARAM abandon its Patent Application related to seismic data acquisition points using GPS, which both violated a Non-Disclosure Agreement and which incorporated portions of NovAtel’s United States Patent Publication No. US 2005/0033519. In September 2005, ARAM responded stating that NovAtel was in violation of a Non-Disclosure Agreement and required that ARAM be listed as a co-inventor on the NovAtel patent. In July 2006, ARAM commenced action against the Company and its Chief Technology Officer for alleged infringement of a Confidentiality Agreement and the alleged improper filing of a United States Utility Patent Application. The action requested declaration that ARAM was the inventor / co-inventor or damages of $100,000,000, return of all patent based revenue to ARAM and punitive damages of $1,000,000, special damages and all costs. In August 2006, the Company issued Notice to Dismiss the action for breach and issued a counterclaim. An initial court proceeding supported NovAtel’s position but was overturned on appeal. The Company has sought legal advice on this matter and believes the claim is without merit. As of the date hereof, the Company has not provided for any court award or for impairment of these intangible assets in its financial statements. The Company does not expect this issue to materially affect its financial position, results of operation or liquidity of the Company.
Other than the foregoing, there are no outstanding legal proceedings material to the Company that the Company is aware of to which the Company, its subsidiaries or any of its properties are subject, nor are there any such proceedings known to be contemplated.
C. Organizational Structure
The Company’s wholly owned operational subsidiaries are NovAtel Europe Limited in the United Kingdom and NovAtel Australia Pty Ltd in Australia.
D. Property, Plant and Equipment
See “Item 4 — Information on the Company, Business Overview — Operations and Facilities.”
Item 4A. Unresolved Staff Comments
None.
A. Operating Results
Management’s discussion and analysis is a review of the results of operations and the liquidity and capital resources of the Company. It should be read in conjunction with the selected financial data and the consolidated financial statements of the Company and the notes thereto included elsewhere in this Annual Report. Certain information included herein is forward looking and based upon assumptions and anticipated results that are subject to uncertainties. Should one or more of these uncertainties materialize or should the underlying assumptions prove incorrect, actual results may vary significantly from those expected. See “Item 3 — Key Information, Risk Factors.”
The Company prepares its financial statements in Canadian dollars and in conformity with Canadian generally accepted accounting principles (“Canadian GAAP”). Unless otherwise noted, the dollar amounts presented in this Annual Report are in Canadian currency. The Company is required to reconcile the material differences between Canadian GAAP and U.S. generally accepted accounting principles (“U.S. GAAP”). Such reconciliation is set forth in Note 20 of the consolidated financial statements of the Company included elsewhere in this Annual Report.
Executive Overview
NovAtel designs, markets and sells high-precision GNSS and other positioning component technology and sub-systems for a wide variety of commercial applications principally in the aviation, geomatics (surveying and mapping), mining, precision agriculture, unmanned vehicles, port automation, marine and defence industries. NovAtel’s solutions combine hardware, such as receivers and antennas, with software to enable its customers to fully integrate the Company’s high-precision GNSS technology into their respective products and systems. Unless the context requires otherwise, references herein to “NovAtel” or the “Company” refer to NovAtel Inc., including its interest in its joint venture, Point.
The Company’s goal is to become the leading provider of high precision GNSS component technology and subsystems. In order to achieve this objective, NovAtel’s management focuses on achieving average long-run organic revenue growth of 15% to 20% per year (prior to currency fluctuations). Since the Company’s top ten customers generated 69% of revenue in 2006, NovAtel’s ability to achieve its revenue projections and revenue growth will be largely dependent on maintaining successful relationships with its key customers and strategic partners, as well as forming relationships with new key OEM customers.
A substantial portion of the Company’s operating costs are relatively fixed in the short-term, and consequently, NovAtel’s short-term profitability is largely dependent on achieving projected revenues and forecasted gross margins as a percentage of revenue.
In order for the Company to maintain its technology position within its market, the Company’s management believes that continued significant investment in research and product development programs is required and expects research and development costs, net of customer funding, will be 18% to 20% of revenue in the near term.
As part of the Company’s growth strategy, the Company also focuses on managing working capital, particularly inventory and trade accounts receivable.
The Company uses performance based incentive programs for both senior management and employees. Incentive pay under these programs is dependent on the Company achieving certain corporate objectives, such as operating income targets.
26
Most of the Company’s revenues (over 95% in 2006) are earned in currencies other than the Canadian dollar, principally the U.S. dollar. A substantial portion of the Company’s expenses, however, have been and will continue to be incurred in Canadian dollars. Accordingly, fluctuations in exchange rates between the U.S. dollar and the Canadian dollar could materially affect results of operations.
The Company’s results of operations have fluctuated and can be expected to continue to fluctuate on a periodic basis as a result of a number of factors which affect revenue, gross margin and operating expenses. Annual and quarterly revenues have fluctuated because of a number of factors, including introduction of new product lines, timing of major contracts, U.S. dollar to Canadian dollar exchange rates, operating results of subsidiaries and a joint venture entity, certification and market acceptance of the Company’s new products, impact and timing of large orders, pricing pressures in the market, establishing and maintaining effective distribution channels, fluctuations in non-recurring engineering (“NRE”) fees, seasonality, and other issues affecting customer purchase patterns, and the timing of industry trade shows.
NovAtel’s consolidated financial statements include a 49% proportionate share of the accounts of Point, a geomatics joint venture with Sokkia, as required under Canadian GAAP. The Company sells products to Point which incorporates them into surveying systems that are in turn largely sold through Sokkia’s distribution channels. In addition, the Company provides facilities, computer support and development and logistical support for Point’s Calgary operations. The Company’s consolidated Statements of Operations include the proportionate share of each of the equivalent line items reflected on Point’s Statement of Operations. Similarly, the Company consolidates its proportionate share of each line item of Point’s balance sheet.
On May 14, 2003, the Company acquired CMC Electronics’ non-aviation L1 GPS OEM product line. The new product line extended the Company’s current high-performance, upgradeable L1 and L1/L2 product line into the mid-level L1 market. This increased the Company’s total addressable market in core sectors and also created entry points into new vertical markets, such as timing and marine. The purchase price was comprised of $150,000 at closing and $600,000 payable over time as a royalty on the revenue generated by this product line. The $600,000 royalty payment was paid out in full by the end of 2006. CMC Electronics’ non-aviation L1 GPS OEM product line contributed approximately $3.1 million in revenue in 2006 compared to $3.4 million in 2005.
On October 1, 2005, the Company acquired Waypoint Consulting Inc. (“Waypoint”) for approximately $3.5 million in cash, subject to post closing adjustments to working capital. Of the total purchase price, $2.2 million was paid by December 31, 2005 and $1.2 million held in escrow will be paid in installments over three years, subject to certain conditions. In 2006, $400,000 of the escrow amount was paid. Waypoint’s products include specialized real-time and post-processing GNSS and /inertial positioning and trajectory software. The Company plans to leverage Waypoint’s products, intellectual property and expertise across a number of products and market applications. The Waypoint product line contributed $2.1 million in revenue in 2006, compared to $0.5 million in 2005.
Revenue and Expenses
Revenues include product sales and NRE fees. NRE fees are received by the Company from its customers under engineering service contracts. Revenues from product sales consist primarily of sales of OEM receivers, GNSS antennas, WAAS type receivers and end user products primarily for the survey and mapping market. The Company classifies its revenues into the following three primary categories, Geomatics, Aerospace and Defence, and Special Applications.
The Geomatics category is made up of surveying and mapping markets. Geomatics revenues are largely comprised of NovAtel’s sales to Point, net of intercompany eliminations, and NovAtel’s 49% proportionate share of sales by Point.
The Aerospace and Defence category is made up of aviation and defence markets. These markets utilize the Company’s precision positioning technology for critical components in civil air traffic navigation, flight management systems, and certain military applications.
The Special Applications category is made up of precision agriculture, marine, unmanned vehicles, mining and machine control, and also includes dealers (other than those that can be identified with a particular market sector) and miscellaneous markets. This category also includes sales to Leica Geosystems.
The Company typically maintains control of the technology developed under NRE contracts allowing it to use these technologies to improve its current products and develop new products and solutions.
Total revenue has increased year over year since 2002 at a compounded annual growth rate of 24% through sales to new customers as well as through sales of additional products and services to existing customers.
Cost of product sales consists primarily of the cost of the raw materials and components, labour, manufacturing overhead and provisions for obsolete inventory and provisions for warranty obligations. Cost of NRE fees consists primarily of personnel and related costs incurred in providing the engineering services.
Gross margin as a percentage of revenue varies primarily as a result of product sales mix, changes in materials and contract manufacturing costs, liquidation of discontinued inventory and absorption of fixed manufacturing costs.
Research and development expenses consist primarily of compensation and benefit costs of engineering personnel, contracted research and development expenses, amortization of purchased technology, amortization of equipment costs, and facility and computer support costs. Research and development expenses are reduced to the extent they are funded under customer contracts and other engineering development contracts.
Selling and marketing expenses consist primarily of compensation and benefit costs of sales and marketing personnel as well as expenses for advertising, promotion and trade shows, dealer and agent’s commissions, facilities and other expenses related to the sale of products.
General and administration expenses consist primarily of compensation and benefit costs of administrative personnel, professional fees such as legal, audit and insurance costs, corporate overhead, computer support costs and facilities expenses.
Critical Accounting Estimates
The Company applies a number of critical accounting estimates in preparing the consolidated financial statements. A discussion of the Company’s critical accounting estimates follows.
27
Revenue Recognition
The Company recognizes product revenue when persuasive evidence of an arrangement exists, delivery has occurred, the fee is fixed or determinable and collectibility is reasonably assured. Revenues from non-recurring engineering fees are recognized at the time services are rendered. On long-term contracts, in which the customer pays established rates for time and materials, revenue is recognized as services are rendered and costs are incurred. On certain long-term contracts, revenue is recognized using the proportional performance method relative to customer milestones achieved. Revisions in cost and profit estimates during the course of work are reflected in the period in which the need for revision becomes known. Losses, if any, are recognized fully when first anticipated. Some contracts contain penalty provisions based on performance relative to established targets. Such penalties are included in revenue or cost estimates when amounts can be reasonably determined.
In 2006, approximately $4.7 million, or 6.0%, of the Company’s revenue was derived from NRE fees. Approximately 26% of these revenues were recognized from contracts on which the customer paid established rates for time and materials and 74% were recognized from contracts that contained customer milestones.
The Company applies American Institute of Certified Public Accountants Statement of Position 97-2, Software Revenue Recognition, to product sales where software is considered more than incidental. For software arrangements involving multiple elements, the Company allocates revenue to each element based on the relative fair value or the residual method, as applicable, and using vendor specific objective evidence of fair values, which is based on prices charged when the element is sold separately. Software revenue is recognized when persuasive evidence of an arrangement exists, the software is delivered in accordance with all terms and conditions of the customer contracts, the fee is fixed or determinable and collection is reasonably assured. Revenue related to post-contract support (“PCS”), including technical support and unspecified when-and-if available software upgrades, is recognized ratably over the PCS term.
As of December 31, 2006, the Company had deferred revenue of $205,000 in accordance with its software revenue recognition policies.
For contracts involving multiple deliverables, where the deliverables are governed by more than one authoritative accounting standard, the Company applies the Emerging Issues Committee 142, ‘‘Revenue Arrangements with Multiple Deliverables’’ (‘‘EIC-142’’), and evaluates each deliverable to determine whether it represents a separate unit of accounting based on the following criteria: (a) whether the delivered item has value to the customer on a standalone basis, (b) whether there is objective and reliable evidence of the fair value of the undelivered item(s), and (c) if the contract includes a general right of return relative to the delivered item, delivery or performance of the undelivered item(s) is considered probable and substantially in the control of the Company. If objective and reliable evidence of fair value exists for all units of accounting in the arrangement, revenue is allocated to each unit of accounting or element based on relative fair values. In situations where there is objective and reliable evidence of fair value for all undelivered elements, but not for delivered elements, the residual method is used to allocate the contract consideration. Under the residual method, the amount of revenue allocated to delivered elements equals the total arrangement consideration less the aggregate fair value of any undelivered elements. Each unit of accounting is then accounted for under the applicable revenue recognition guidance. So long as elements otherwise governed by separate authoritative accounting standards cannot be treated as separate units of accounting under the guidance in EIC-142 the elements are combined into a single unit of accounting for revenue recognition purposes. In this case, revenue allocated to the unit of accounting is deferred until all combined elements have been delivered or, once there is only one remaining element to be delivered, based on the revenue recognition guidance applicable to the last delivered element within the unit of accounting.
At the time the Company recognizes revenue, the Company reduces the measurement of revenue by an estimate of the expected product returns and price adjustments. The provision for product returns and price adjustments is assessed for adequacy at each quarter-end and is based on recent historical experience and known customer claims. The provision for product returns and price adjustments was $298,000 as of December 31, 2006 compared to $281,000 at December 31, 2005, with the increase attributable to an increase in revenue.
Effective with the fourth quarter of 2002, the Company changed its policy of recognizing revenue on shipments of product from the Company to Point from revenue recognition at the time of shipment to revenue recognition at the time of receiving payment from Point, due to the uncertainty of collecting payment on the associated receivables. As of December 31, 2006, the Company had deferred revenue related to product shipments to Point of $485,000, net of inter-company eliminations. The Company would revert to its prior policy of recognizing revenue at the time of shipment if the Company is able to determine that reasonable assurance of collecting payment from Point exists. This determination would be based on Point’s ability to demonstrate sustained improved operating performance and/or Point receiving additional financial support from the Company and Sokkia sufficient to enable Point to meet its financial obligations on an ongoing basis.
Inventories
Raw materials and components, work-in-progress, and finished goods inventories are recorded at the lower of cost and net realizable value. Cost is determined on a first-in, first-out basis and includes materials, labour and manufacturing overhead.
The Company establishes provisions for obsolete or excess inventory. The Company’s products have product life cycles that range on average from two to four years. At both the product introduction and product discontinuation stage, there is a higher degree of risk of inventory obsolescence. In 2006, the provision for obsolete and excess inventory included in the statement of operations was $201,000 or 0.3% of revenue, compared to $147,000 or 0.2% of revenue in 2005.
The estimate of the provision for obsolete and excess inventory is partially based on expected future product sales, which are difficult to forecast for certain products. As of December 31, 2006, the Company had approximately $392,000 (gross value before inventory provisions) of first generation WAAS and older generation GPS receiver inventory for which no firm customer commitments were on hand. Based on the Company’s assessment of future market opportunities, the Company expects that the value of this inventory will not be realized through future sales, and, accordingly, has established provisions to reduce the net value of this inventory to $nil. As at December 31, 2006, the provision for obsolete and excess inventory was $1.3 million or 14% of the gross value of inventory, compared to $1.5 million or 22% at December 31, 2005, with the decrease primarily caused by disposal of certain obsolete inventory items in 2006.
28
Allowance for Doubtful Accounts
The Company establishes provisions for doubtful accounts receivable. These provisions are established at the time revenue is recognized and are re-evaluated at each quarter end for adequacy. In determining the adequacy of the provision, the Company considers known uncollectible or at-risk receivables as well as the aging profile of other receivables. In 2006, the provision for doubtful accounts included in the statement of operations was a recovery of $74,000 or 0.1% of revenue, compared to $20,000 or 0.03% of revenue in 2005, with the change in provision in 2006 attributable to a decrease in the amount of uncollectible receivables from customers.
As at December 31, 2006, the provision for doubtful accounts was $726,000 or 4.9% of the gross value of the third party receivables compared to $799,000 or 6.8% at December 31, 2005. The lower dollar amount of the provision reflects recent favourable experience relating to collection of customer receivables in 2006.
Provision for Future Warranty Costs
Warranty costs are accrued, to the extent that they are not recoverable from third party manufacturers, for the estimated cost to repair products for the balance of the warranty periods.
The Company’s products are covered by standard warranty plans that normally extend 12 months to 18 months from the date of product shipment. Certain customers negotiate warranty terms that range up to three years.
The Company provides for the costs of expected future warranty claims at the time of product shipment. The adequacy of the provision is assessed at each quarter end and is based on historical experience of warranty claims and costs. As of December 31, 2006, the Company’s provision for future warranty claims was $816,000 compared to $693,000 as of December 31, 2005, with the increase attributable primarily to increased revenue from product shipments.
Research and Development Costs and Deferred Development Costs
Research costs are charged to operations as incurred. Development costs, including software development costs, are charged to operations as incurred unless they meet specific criteria related to technical, market and financial feasibility. In these circumstances, the costs are deferred and amortized on a systematic basis, subject to an estimate of recoverability.
In 2006 and 2005, the Company deferred development costs of $nil related to the development of a certified aviation GPS receiver.
At December 31, 2006, the Company had deferred $1.3 million of development costs ($1.7 million at December 31, 2005). The continued deferral of these costs is subject to recoverability based on estimates of future sales of the certified aviation GPS receiver. With the GPS receiver having reached the commercialization stage, the Company amortizes these deferred costs, using a method similar to the unit-of-production method of amortization. The Company amortized $404,000 of these deferred costs in 2006 compared to $538,000 in 2005. On April 5, 2004, the Company and CMC Electronics entered into a Strategic Cooperation Agreement which inter alia provides for certain guaranteed future payments over the following four years. Under the current business programs between the Company and CMC Electronics, the Company would expect these guaranteed future payments to recover approximately 44% of the $1.3 million of deferred development costs as of December 31, 2006. Should future actual sales of this receiver be materially lower than the current estimated sales, all or a portion of the deferred development costs would be charged to results of operations. The Company assesses the recoverability of the deferred development costs at each quarter end.
Income Taxes
The Company follows the liability method of accounting for income taxes. Under this method, current income taxes are recognized for the estimated income taxes payable for the current year. Future income tax assets and liabilities are recognized for temporary differences between the tax and accounting bases of assets and liabilities as well as for the benefit of losses available to be carried forward to future years for tax purposes that are more likely than not to be realized.
As of December 31, 2006, the Company had income tax benefits related to previously incurred income tax losses, research and development costs, depreciation deductible for tax purposes and investment tax credits totaling approximately $120 million, which are available to reduce future taxable income and taxes payable, primarily for Canadian purposes.
Prior to 2004, the Company had established a full valuation allowance against the future tax benefits, since it was uncertain that these tax benefits were more likely than not to be realized. In determining the valuation allowances to establish against these deferred tax benefits, the Company considers many factors, including the specific taxing jurisdiction, the carry forward period, income tax strategies, limitations due to acquisitions-of-control and forecasted earnings. A valuation allowance is recognized if, based on the weight of available evidence, the Company concludes that it is more likely than not that some portion or all of the future tax benefits will not be realized. Effective 2004, and continuing in 2005 and 2006, the Company determined, on the basis of consecutive years of increasing profitability from 2001 to 2006 and the Company’s forecasts of operating results for the foreseeable future, that it was more likely than not that a portion of the future income tax assets would be realized. As part of this analysis, the Company used a seven year moving average of forecasted profitability for its operations subject to Canadian income tax.
Accordingly, the Company recognized future income tax assets of $7.7 million on its balance sheet as of December 31, 2006, and a corresponding $2.1 million future income tax benefit in its statement of operations for the year ended December 31, 2006. In 2005, the Company recognized $5.6 million of future income tax assets on its balance sheet as of December 31, 2005, and a corresponding $2.4 million future income tax benefit in its statement of operations for the year ended December 31, 2005.
As of December 31, 2006, the valuation allowance against the calculated future income tax assets was approximately $31.0 million, or 80% of the gross value of the future income tax assets.
If the Company’s forecasted profitability in the foreseeable future were 20% above or 20% below current estimates, the future income tax benefit included in the statement of operations for the year ended December 31, 2006, would have been approximately $3.6 million and $0.5 million, respectively.
29
Results of Operations
The following table sets out, as a percentage of revenue, consolidated operations data for the periods indicated.
Year Ended December 31, | |||
2006 | 2005 | 2004 | |
(Percentage of Revenue) | |||
| Revenues | 100.0% | 100.0% | 100.0% |
| Gross profit — product sales | 63.7 | 62.4 | 59.9 |
| Gross profit — NRE fees | 38.2 | 42.0 | 43.1 |
| Total gross profit | 61.2 | 61.1 | 58.3 |
| Operating expenses: | |||
| Research and development | 17.3 | 17.2 | 17.8 |
| Selling and marketing | 9.9 | 10.1 | 10.7 |
| General and administration | 10.3 | 11.2 | 9.8 |
| Foreign exchange loss | 0.3 | 0.4 | 1.1 |
| Share offering costs | — | — | 1.4 |
| Total operating expenses | 37.8 | 38.9 | 40.8 |
| Operating income | 23.4 | 22.2 | 17.5 |
| Interest income, net | 2.2 | 1.2 | 0.5 |
| Other expense | (0.1) | (0.1) | (0.1) |
| Benefit of investment tax credits | — | 2.5 | 8.1 |
| Income from continuing operations before income taxes | 25.5 | 25.8 | 26.0 |
| Income taxes | |||
| Current provision | 0.4 | 3.2 | 4.3 |
| Future income tax expense (benefit) | (2.7) | (3.8) | (2.0) |
| Total income tax expense (benefit) | (2.3) | (0.6) | 2.3 |
| Net income from continuing operations | 27.7 | 26.4 | 23.7 |
| Income (loss) from discontinued operations | — | — | 0.1 |
| Net income | 27.7% | 26.4% | 23.8% |
2006 Compared to 2005
Revenues
Total revenues in 2006 were $77.6 million, representing a 23% increase over 2005 revenues of $63.3 million, despite the adverse impact of the weaker U.S. dollar relative to the Canadian dollar. Since the majority of the Company’s revenues are denominated in U.S. dollars, a weaker U.S. dollar adversely affects NovAtel’s revenues. NovAtel’s U.S. dollar denominated revenue declined to an average of $1.14 Canadian in 2006 from an average of $1.22 Canadian in 2005. If the Company’s U.S. dollar denominated revenues were converted into Canadian dollars at equivalent exchange rates, revenue in 2006 would have been approximately 31% higher than in 2005.
The following table sets out revenues of the Company by the market categories indicated for the fiscal years ended December 31, 2006 and 2005.
2006 | 2005 | Change | |||||||||||||||||
| $ | % | $ | % | $ | % | ||||||||||||||
($000’s) | |||||||||||||||||||
| Geomatics | $ | 13,226 | 17 | % | $ | 11,534 | 18 | % | $ | 1,692 | 15 | % | |||||||
| Aerospace and Defence | 8,978 | 12 | % | 9,487 | 15 | % | (509 | ) | (5 | %) | |||||||||
| Special Applications | 55,301 | 71 | % | 41,992 | 67 | % | 13,309 | 32 | % | ||||||||||
| Other | 129 | — | 282 | — | (153 | ) | (54 | %) | |||||||||||
| TOTAL | $ | 77,634 | 100 | % | $ | 63,295 | 100 | % | $ | 14,339 | 23 | % | |||||||
30
Geomatics
In 2006, approximately 84% of Geomatics revenues were comprised of NovAtel’s sales to Point, net of intercompany eliminations and the Company’s proportionate share of sales by Point. The balance of Geomatics revenue was derived from sales to third party customers. Geomatics sales were $13.2 million in 2006, an increase of 15% from $11.5 million in 2005, due primarily to higher sales by Point to Sokkia, as well as higher product shipments by NovAtel to Point. NovAtel only recognizes revenue on product shipments to Point at the time of receiving payment.
Aerospace and Defence
Aerospace and Defence revenues were $9.0 million in 2006 compared to $9.5 million for 2005, a decrease of 5%. The Company’s Aerospace and Defence revenues are highly dependent on the timing of large, government-funded programs. The lower revenue was anticipated and was attributable to lower WAAS and Geostationary Earth Orbit Augmented Navigation (GAGAN) program revenue.
In 2005, the Company received a contract for a portion of the Galileo Reception Chain (GRC) reference receiver development as part of the European Galileo program. The initial contracts valued at €3.7 million, run from June 2005 to December 31, 2006. The Company recognized $1.5 million revenue under this program in 2006 compared to $1.1 million revenue in 2005. Should the contract proceed to a full award, the program may have a value up to €6.3 million and will be substantially completed by the end of 2008.
The Company and CMC Electronics jointly developed the certified GPS receiver, intended for use in airborne applications and the local area augmentation system (“LAAS”) program. The Company earned royalties of $683,000 in 2006, compared to $800,000 in 2005 related to this receiver, with the decline partially attributable to lifetime volume price points.
In October 2004, the Canadian Space Agency (CSA) awarded a contract to the Company for demonstration and prototype receiver development for the European Galileo system. The value of CSA’s contribution to NovAtel under the contract is $997,000, of which $402,000 was recognized as revenue in 2006 compared to $595,000 in 2005. This contract was completed in 2006.
In November 2005, the Company commenced work on the Galileo Safety of Life project under a CSA contract with CMC Electronics. The Company expects to receive $500,000 funding on this program over approximately 18 months, with equipment deliveries scheduled for May 2007.
Special Applications
Special Applications revenues were $55.3 million in 2006 compared to $42.0 million in 2005, an increase of 32%. The increase was primarily attributable to higher product shipments to Leica Geosystems of $6.9 million.
The Company entered into a strategic co-operation agreement with Leica Geosystems in May 2003 to jointly develop new technology for GPS in the high-precision geomatics market. In September 2003, pursuant to the strategic co-operation agreement, NovAtel also entered into a supply agreement with Leica Geosystems which sets forth the arrangements under which NovAtel would develop and supply a custom GPS receiver for Leica Geosystems. In 2005 and 2006, Leica Geosystems announced the launch of new survey products that incorporate NovAtel’s GNSS receiver and antenna technology. The Company’s revenue with Leica Geosystems accounted for 23% of total revenue in 2006, and the Company expects revenue from product shipments supplied to Leica Geosystems to comprise between 18% and 22% of NovAtel’s total revenue in 2007.
Revenues by Geographic Market
In 2006, the Company derived approximately 56% of its total revenues from the sale of products to countries outside the United States and Canada compared to 52% in 2005. Revenues from such international sales increased to $43.6 million in 2006 from $33.2 million in 2005, primarily as a result of higher shipments to Leica Geosystems and into China.
Gross Profit
Gross profit increased to $47.5 million in 2006 from $38.7 million in 2005, mainly as a result of increased revenue. Gross profit as a percentage of total revenues increased to 61.2% in 2006 from 61.1% in 2005, relatively unchanged.
Research and Development
Research and development expenses increased 24% from $10.9 million in 2005 to $13.5 million in 2006 and increased as a percentage of total revenues from 17.2% in 2005 to 17.3% in 2006. The increase in research and development expenses is primarily attributable to higher employee compensation and benefit costs of $2.9 million, higher material/services costs of $673,000, higher amortization costs of $269,000, higher recruiting and relocation costs of $113,000, and higher equipment costs of $98,000, partially offset by higher recovery of expenses from customer funded programs of $1.6 million. The Company believes that significant investments in research and development are required to maintain its technology and compete in its business. The Company expects to spend approximately 18% to 20% of revenue in research and development activities in 2007.
Selling and Marketing
Selling and marketing expenses increased 20% from $6.4 million in 2005 to $7.7 million in 2006 but decreased as a percentage of revenue from 10.1% in 2005 to 9.9% in 2006. The increased selling and marketing costs were due primarily to higher employee compensation and benefit costs of $793,000, higher costs for facilities and IT support services of $197,000, higher travel costs of $118,000 and higher external commission costs of $136,000, partially offset by lower provision for doubtful customer accounts receivable of $94,000. The Company expects to spend approximately 9.5% to 10.5% of revenue in selling and marketing activities in 2007.
General and Administration
General and administration expenses increased 13% from $7.1 million in 2005 to $8.0 million in 2006 but decreased as a percentage of revenue from 11.2% in 2005 to 10.3% in 2006. The increase in general and administration expenses was a result of higher employee compensation and benefit costs of $367,000, higher facilities costs of $365,000, higher amortization costs of $250,000, and higher insurance costs of $105,000, partially offset by lower professional fees for legal and audit services of $72,000 and higher internal allocation to other departments for facilities and IT support services of $117,000. The Company expects to spend approximately 9.5% to 10.5% of revenue in general and administration activities in 2007.
31
Foreign exchange loss
Foreign exchange loss decreased from $255,000 in 2005 to $198,000 in 2006 due to a slowdown in the weakening of the U.S. dollar relative to the Canadian dollar.
Interest Income, net
NovAtel earned net interest income of $1.7 million in 2006 compared to $787,000 in 2005 as a result of higher cash balances available for investment and higher interest rates. The Company’s cash deposits which are not required for operations are invested in short-term interest bearing instruments.
Benefit of Investment Tax Credits
In 2005, the Company recognized a $1.6 million benefit of investment tax credits related to the use of investment tax credits to shelter tax otherwise payable in 2005. There was no comparable recognition in 2006 as the Company utilized other tax shields to shelter tax otherwise payable.
Provision for Current Income Taxes and Future Income Tax Benefit
The provision for current income taxes consists primarily of an expense related to the benefit of investment tax credits recognized elsewhere on the statement of operations, a provision for income tax payable in the United States, United Kingdom and Australia, a provision for income tax payable in Canada related to Waypoint’s operations prior to being amalgamated with the Company, and Canadian federal large corporations tax. The provision for current income taxes was $341,000 in 2006 compared to $2.0 million in 2006. The decrease was mainly attributable to expense incurred with the recognition of the benefit of investment tax credits in 2005.
In 2006, the Company recognized $2.1 million future income tax benefit (see “Critical Accounting Estimates”) compared to $2.4 million in 2005. The Company recognized the future income tax benefit in 2006 on the basis of its improving profitability from 2001 to 2006 and the Company’s forecasted profitability in the foreseeable future.
2005 Compared to 2004
Revenues
Total revenues in 2005 were $63.3 million, representing a 17% increase over 2004 revenues of $53.9 million, despite the adverse impact of the weaker U.S. dollar relative to the Canadian dollar. Since the majority of the Company’s revenues are denominated in U.S. dollars, a weaker U.S. dollar adversely affects NovAtel’s revenues. NovAtel’s U.S. dollar denominated revenue declined to an average of $1.22 Canadian in 2005 from an average of $1.30 Canadian in 2004. If the Company’s U.S. dollar denominated revenues were converted into Canadian dollars at equivalent exchange rates, revenue in 2005 would have been approximately 25% higher than in 2004.
The following table sets out revenues of the Company by the market categories indicated for the fiscal years ended December 31, 2005 and 2004.
2005 | 2004 | Change | |||||||||||||||||
| $ | % | $ | % | $ | % | ||||||||||||||
($000’s) | |||||||||||||||||||
| Geomatics | $ | 11,534 | 18 | % | $ | 9,339 | 17 | % | $ | 2,195 | 24 | % | |||||||
| Aerospace and Defence | 9,487 | 15 | % | 11,503 | 21 | % | (2,016 | ) | (18 | %) | |||||||||
| Special Applications | 41,992 | 67 | % | 32,697 | 61 | % | 9,295 | 28 | % | ||||||||||
| Other | 282 | — | 393 | 1 | % | (111 | ) | (28 | %) | ||||||||||
| TOTAL | $ | 63,295 | 100 | % | $ | 53,932 | 100 | % | $ | 9,363 | 17 | % | |||||||
Geomatics
In 2005, approximately 77% of Geomatics revenues were comprised of NovAtel’s sales to Point, net of intercompany eliminations and the Company’s proportionate share of sales by Point. The balance of Geomatics revenue was derived from sales to third party customers. Geomatics sales were $11.5 million in 2005, an increase of 24% from $9.3 million in 2004, due primarily to higher sales to third party customers in Canada and Asia, as well as higher NRE revenue associated with new product development for Point.
Aerospace and Defence
Aerospace and Defence revenues were $9.5 million in 2005 compared to $11.5 million for 2004, a decrease of 18%. The Company’s Aerospace and Defence revenues are highly dependent on the timing of large, government-funded programs. The majority of the revenue in 2005 related to the U.S. WAAS and Indian GAGAN aviation programs that contributed $4.1 million in revenue in 2005 compared to $8.2 million in 2004. The lower revenue was anticipated and was attributable to the substantial completion of major phases of three WAAS related contracts in 2004. In the latter half of 2005, the Company also recognized initial revenue of $1.1 million under a contract funded by the European Space Agency (“ESA”) to develop the Ground Reference Receiver for the European Galileo program.
The certified GPS receiver jointly developed by the Company and CMC Electronics is intended for use in airborne applications and the local area augmentation system (“LAAS”) program. With the GPS receiver achieving certification, the Company earned royalties of $800,000 in 2005, compared to $545,000 in 2004.
32
In October 2004, the Canadian Space Agency (CSA) awarded a contract to the Company for demonstration and prototype receiver development for the European Galileo system. The value of CSA’s contribution to NovAtel under the contract is $997,000, of which $595,000 was recognized as revenue in 2005.
Special Applications
Special Applications revenues were $42.0 million in 2005 compared to $32.7 million in 2004, an increase of 28%. The increase was primarily attributable to higher product shipments to Leica Geosystems of $2.6 million, higher shipments of product into China of $2.6 million and higher shipments to the Company’s U.S. dealer network of $2.8 million. The Company’s revenue with Leica Geosystems accounted for 18% of total revenue in 2005.
Revenues by Geographic Market
In 2005, the Company derived approximately 52% of its total revenues from the sale of products to countries outside the United States and Canada compared to 48% in 2004. Revenues from such international sales increased to $33.2 million in 2005 from $25.8 million in 2004, primarily as a result of higher shipments to Leica Geosystems and into China.
Gross Profit
Gross profit increased to $38.7 million in 2005 from $31.4 million in 2004, mainly as a result of increased revenue. Gross profit as a percentage of total revenues increased to 61.1% in 2005 from 58.3% in 2004. The increase in gross margin as a percentage of revenue was primarily attributable to favourable product mix, including the benefit of Waypoint related products which are primarily software, a lower proportion of NRE fee revenues relative to product sales, and lower provisions for inventory obsolescence.
Research and Development
Research and development expenses increased 14% from $9.6 million in 2004 to $10.9 million in 2005 but decreased as a percentage of total revenues from 17.8% in 2004 to 17.2% in 2005. The increase in research and development expenses is primarily attributable to higher material costs of $523,000, higher employee compensation and benefit costs of $343,000, higher costs for facilities and IT support services of $378,000 and higher consulting and other outside service of $298,000, partially offset by higher recovery of expenses from customer funded programs of $418,000.
Selling and Marketing
Selling and marketing expenses increased 11% from $5.8 million in 2004 to $6.4 million in 2005 but decreased as a percentage of revenue from 10.7% in 2004 to 10.1% in 2005. The increased selling and marketing costs were due primarily to higher employee compensation and benefit costs of $477,000, higher advertising and product promotion costs of $307,000, partially offset by lower provision for doubtful customer accounts receivable of $160,000.
General and Administration
General and administration expenses increased 33% from $5.3 million in 2004 to $7.1 million in 2005 and increased as a percentage of revenue from 9.8% in 2004 to 11.2% in 2005. The increase in general and administration expenses was a result of higher professional fees for legal and audit services of $667,000, higher employee compensation and benefit costs of $460,000, higher insurance costs of $441,000, higher amortization costs of $170,000, higher board of director fees of $100,000, and higher consulting costs related to the Company’s Sarbanes-Oxley 404 compliance project of $260,000, partially offset by higher allocations for facility and IT support to manufacturing, research and development and sales and marketing departments of $550,000.
Foreign exchange loss
Foreign exchange loss decreased from $595,000 in 2004 to $255,000 in 2005 due to a slowdown in the weakening of the U.S. dollar relative to the Canadian dollar.
Interest Income, net
NovAtel earned net interest income of $787,000 in 2005 compared to $313,000 in 2004 as a result of higher cash balances available for investment and higher interest rates.
Benefit of Investment Tax Credits
In 2005, the Company recognized a $1.6 million benefit of investment tax credits related to the use of investment tax credits to shelter tax otherwise payable in 2005. In 2004, the Company recognized a $4.4 million benefit of investment tax credits of which $2.3 million was related to the use of investment tax credits to shelter tax otherwise payable in 2004 and $2.1 million was related to the recognition of future income tax assets.
Provision for Current Income Taxes and Future Income Tax Benefit
The provision for current income taxes consists primarily of an expense related to the benefit of investment tax credits recognized elsewhere on the statement of operations, a provision for income tax payable in the U.S., a provision for income tax payable in Canada related to Waypoint’s operations prior to being amalgamated with the Company, and Canadian federal large corporations tax. The provision for current income taxes was $2.0 million in 2005, compared to $2.3 million in 2004. The decrease was mainly attributable to a lower expense incurred with the recognition of the benefit of investment tax credits.
In 2005, the Company recognized $2.4 million future income tax benefit (see “Critical Accounting Estimates”) compared to $1.1 million in 2004. The Company recognized the future income tax benefit in 2005 on the basis of its improving profitability from 2001 to 2005 and the Company’s forecasted profitability in the foreseeable future.
33
Quarterly Results of Operations
The following tables set out certain financial information for each of the eight quarters ended December 31, 2006. In the opinion of management of the Company, this information has been prepared on the same basis as the audited financial statements appearing elsewhere in this Annual Report, and all necessary adjustments have been included in the amounts stated below to fairly present the unaudited quarterly results when read in conjunction with the Company’s audited financial statements and the notes to those statements. The operating results for any quarter should not be relied upon as any indication of results for any future period.
Quarter Ended | |||||||||||||||||||||||||
2006 | 2005 | ||||||||||||||||||||||||
Dec. 31 | Sept. 30 | Jun. 30 | Mar. 31 | Dec. 31 | Sept. 30 | Jun. 30 | Mar. 31 | ||||||||||||||||||
($000's) | |||||||||||||||||||||||||
| Revenue | $ | 19,196 | $ | 19,023 | $ | 20,965 | $ | 18,450 | $ | 16,157 | $ | 14,295 | $ | 17,486 | $ | 15,357 | |||||||||
| Cost of sales | 7,253 | 6,905 | 8,593 | 7,356 | 5,905 | 5,614 | 6,817 | 6,300 | |||||||||||||||||
| Gross profit | 11,943 | 12,118 | 12,372 | 11,094 | 10,252 | 8,681 | 10,669 | 9,057 | |||||||||||||||||
| Operating expenses: | |||||||||||||||||||||||||
| Research and development | 3,447 | 3,480 | 3,334 | 3,189 | 3,056 | 2,606 | 2,882 | 2,338 | |||||||||||||||||
| Selling and marketing | 2,060 | 1,984 | 1,948 | 1,700 | 1,480 | 1,689 | 1,651 | 1,567 | |||||||||||||||||
| General and administration | 2,392 | 2,031 | 1,900 | 1,686 | 1,928 | 1,520 | 1,817 | 1,817 | |||||||||||||||||
| Foreign exchange loss (gain) | 119 | (69 | ) | 250 | (102 | ) | 19 | 196 | 32 | 8 | |||||||||||||||
| Share offering costs | — | — | — | — | — | — | — | — | |||||||||||||||||
| Total operating expenses | 8,018 | 7,426 | 7,432 | 6,473 | 6,483 | 6,011 | 6,382 | 5,730 | |||||||||||||||||
| Operating income | 3,925 | 4,692 | 4,940 | 4,621 | 3,769 | 2,670 | 4,287 | 3,327 | |||||||||||||||||
| Interest income, net | 545 | 468 | 380 | 287 | 246 | 218 | 170 | 153 | |||||||||||||||||
| Other income (expense) | 53 | (56 | ) | (63 | ) | (20 | ) | (12 | ) | (16 | ) | (30 | ) | (14 | ) | ||||||||||
| Benefit of investment tax credits | — | —— | — | — | 556 | — | — | 1,036 | |||||||||||||||||
| Income from continuing operations before income taxes | 4,523 | 5,104 | 5,257 | 4,888 | 4,559 | 2,872 | 4,427 | 4,502 | |||||||||||||||||
| Income taxes | |||||||||||||||||||||||||
| Current provision | 65 | 96 | 99 | 81 | 549 | 75 | 109 | 1,313 | |||||||||||||||||
| Future income tax expense (benefit) | (688 | ) | (600 | ) | (345 | ) | (428 | ) | (1,121 | ) | (371 | ) | (355 | ) | (555 | ) | |||||||||
| Total income tax expense (benefit) | (623 | ) | (504 | ) | (246 | ) | (347 | ) | (572 | ) | (296 | ) | (246 | ) | 758 | ||||||||||
| Net income from continuing operations | $ | 5,146 | $ | 5,608 | $ | 5,503 | $ | 5,235 | $ | 5,131 | $ | 3,168 | $ | 4,673 | $ | 3,744 | |||||||||
34
Quarter Ended | ||||||||
2006 | 2005 | |||||||
(Percentage of Revenues) | ||||||||
Dec. 31 | Sept. 30 | Jun. 30 | Mar. 31 | Dec. 31 | Sept. 30 | Jun. 30 | Mar. 31 | |
| Revenues | 100% | 100% | 100% | 100% | 100% | 100% | 100% | 100% |
| Gross profit | 62.2 | 63.7 | 59.0 | 60.1 | 63.4 | 60.7 | 61.0 | 59.0% |
| Operating expenses: | ||||||||
| Research and development | 18.0 | 18.3 | 15.9 | 17.3 | 18.9 | 18.2 | 16.5 | 15.2 |
| Selling and marketing | 10.7 | 10.4 | 9.3 | 9.2 | 9.2 | 11.8 | 9.4 | 10.2 |
| General and administration | 12.5 | 10.7 | 9.1 | 9.1 | 11.9 | 10.6 | 10.4 | 11.8 |
| Foreign exchange loss (gain) | 0.6 | (0.4) | 1.2 | (0.6) | 0.1 | 1.4 | 0.2 | 0.1 |
| Share offering costs | — | — | — | — | — | — | — | — |
| Total operating expenses | 41.8 | 39.0 | 35.4 | 35.1 | 40.1 | 42.0 | 36.5 | 37.3 |
| Operating income | 20.4 | 24.7 | 23.6 | 25.0 | 23.3 | 18.7 | 24.5 | 21.7 |
| Interest income, net | 2.8 | 2.5 | 1.8 | 1.6 | 1.6 | 1.5 | 1.0 | 1.0 |
| Other income (expense) | 0.4 | (0.4) | (0.3) | (0.1) | (0.1) | (0.1) | (0.2) | (0.1) |
| Benefit of investment tax credits | — | — | — | — | 3.4 | — | — | 6.7 |
| Income from continuing operations before income taxes | 23.6 | 26.8 | 25.1 | 26.5 | 28.2 | 20.1 | 25.3 | 29.3 |
| Income taxes | ||||||||
| Current provision | 0.4 | 0.5 | 0.5 | 0.4 | 3.4 | 0.5 | 0.6 | 8.5 |
| Future income tax expense (benefit) | (3.6) | (3.2) | (1.6) | (2.3) | (7.0) | (2.6) | (2.0) | (3.6) |
| Total income tax expense (benefit) | (3.2) | (2.7) | (1.1) | (1.9) | (3.6) | (2.1) | (1.4) | 4.9 |
| Net income from continuing operations | 26.8% | 29.5% | 26.2% | 28.4% | 31.8% | 22.2% | 26.7% | 24.4% |
The following table sets out revenues of the Company by the market categories indicated for the last eight fiscal quarters.
Quarter Ended | |||||||||||||||||||||||||
2006 | 2005 | ||||||||||||||||||||||||
Dec. 31 | Sept. 30 | Jun. 30 | Mar. 31 | Dec. 31 | Sept. 30 | Jun. 30 | Mar. 31 | ||||||||||||||||||
($000’s) | |||||||||||||||||||||||||
| Geomatics | $ | 3,525 | $ | 3,315 | $ | 4,015 | $ | 2,371 | $ | 2,339 | $ | 3,010 | $ | 3,719 | $ | 2,466 | |||||||||
| Aerospace and Defence | 1,551 | 3,066 | 2,089 | 2,272 | 3,115 | 1,368 | 3,116 | 1,888 | |||||||||||||||||
| Special Applications | 14,065 | 12,635 | 14,838 | 13,763 | 10,656 | 9,832 | 10,626 | 10,878 | |||||||||||||||||
| Other | 55 | 7 | 23 | 44 | 47 | 85 | 25 | 125 | |||||||||||||||||
| TOTAL | $ | 19,196 | $ | 19,023 | $ | 20,965 | $ | 18,450 | $ | 16,157 | $ | 14,295 | $ | 17,486 | $ | 15,357 | |||||||||
The Company’s quarterly results of operations have fluctuated and are expected to continue to fluctuate because of a number of factors which affect revenue, gross margins and operating expenses, including revenue generated from major contracts, acquisition of new product lines, U.S. dollar to Canadian dollar exchange rates, operating results of joint venture and subsidiary entities, acquisitions, new product introductions, fluctuations in NRE fees, seasonality and other factors affecting customer purchase patterns, and the timing of industry trade shows.
In addition, revenues can be expected to vary significantly as a result of a lack of a significant order backlog, fluctuations in demand for existing products, the rate of development of new markets, the degree of market acceptance of new products, increased competition and the general strength of domestic and international economic conditions. Furthermore, if the Company were unable to deliver sufficient quantities of products in a timely manner, due to factors such as parts supply shortages or customs delays, its revenues could be adversely affected.
In 2006, quarterly operating expenses fluctuated due to the impact of changes in staffing levels, recovery of research and development expenses from NRE fees, legal fees, and provisions related to the Company’s employee incentive programs and senior management bonus program.
Liquidity and Capital Resources
In 2006, cash provided by operations was $19.4 million, compared to $17.1 million in 2005. Cash provided by operations in 2006 consisted primarily of $21.5 million of net income and $3.5 million of amortization expenses, partially offset by the effect of $2.0 million in non-cash tax-related items and a $4.7 million increase in non-cash working capital. The increase in non-cash working capital was caused primarily by an increase in accounts receivable and inventories, due largely to the launch of a new generation of GNSS receivers in 2006, partially offset by an increase in accounts payable and accrued liabilities.
35
Cash provided by financing activities in 2006 was $2.6 million, consisting of $1.0 million related to the exercise of employee stock options and the reimbursement of loans by Point, Inc. of $1.5 million, after the effect of intercompany eliminations. In 2005, $778,000 in cash was provided by financing activities, of which $721,000 was also related to employee stock option exercises.
Cash used in investing activities in 2006 was $20.9 million, consisting of purchases of $51.8 million of short-term investments, an additional investment in Point, Inc of $1.5 million, after the effect of intercompany eliminations, and $6.4 million of capital equipment, partially offset by proceeds of short-term investments of $38.7 million. In 2005, cash used in investing activities was $24.1 million, consisting of purchases of $56.4 million of short-term investments, $3.5 million related to the acquisition of Waypoint, $2.4 million of capital equipment and $221,000 in royalty payments made to CMC Electronics in connection with the purchase of its former OEM GPS business, partially offset by proceeds from maturities of short-term investments of $38.4 million.
At December 31, 2006, NovAtel had cash and short-term investments of $49.3 million of which approximately 95% are in Canadian dollars. The Company has credit agreements with HSBC Bank Canada and The Toronto Dominion Bank under which it can borrow up to $1.7 million for day-to-day operating requirements and $3.9 million to support the margin requirement related to the purchase of up to approximately U.S. $17.0 to $18.0 million of foreign exchange contracts (depending on the maturity date of the contracts). The lines of credit are payable on demand, are secured by certain of the Company's assets and bear interest at the financial institutions’ prime rate (December 31, 2006 — 6.0%) on Canadian dollar advances. At December 31, 2006, portions of the lines of credit were utilized to support approximately U.S. $14.0 million of foreign exchange contracts (U.S. $8.5 million at December 31, 2005), leaving $1.7 million available for day-to-day operating requirements and the margin capacity necessary to enter into an additional U.S. $3.0 to $4.0 million in forward exchange contracts (depending on the maturity date of the contracts).
The Company believes that its existing cash, cash equivalents, short-term investments, available lines of credit and anticipated cash generated from operations will be sufficient to satisfy its currently anticipated cash needs for at least the next twelve months.
Taxes
The Company’s operations are substantially located in Canada and accordingly, Canada is the Company’s main tax jurisdiction. The Company has not recorded a provision for current income taxes payable in Canada, other than for Canadian federal large corporations tax, income tax related to Waypoint’s operations prior to amalgamation with NovAtel, due to previously incurred losses, credits and costs. As of December 31, 2006, the Company had approximately $120 million of losses, investment tax credits, depreciation and research and development costs that are available to reduce future taxable income and taxes payable primarily in Canada. The Company has determined that the acquisition of a majority of its Common Shares by CMC Electronics in 1998, BAE SYSTEMS p.l.c.’s acquisition of the majority of the common shares of CMC Electronics in November 1999, and ONCAP’s acquisition of the majority of the common shares of CMC Electronics in April 2001 each constitute an acquisition of control of the Company for Canadian income tax purposes. Accordingly, the availability of certain of the Company’s Canadian income tax losses, research and development costs, depreciation deductible for tax purposes and investment tax credit may be subject to limitation. The ultimate availability and amount of these losses, credits and costs may be dependent upon future Canada Revenue Agency audits.
Prior to 2004, the Company had established a full valuation allowance against the future tax benefits associated with tax shields, since it was uncertain that these tax benefits were more likely than not to be realized. In determining the valuation allowances to establish against these deferred tax benefits, the Company considers many factors, including the specific taxing jurisdiction, the carry forward period, income tax strategies, limitations due to acquisitions-of-control and forecasted earnings. A valuation allowance is recognized if, based on the weight of available evidence, the Company concludes that it is more likely than not that some portion or all of the future tax benefits will not be realized. In 2004, 2005 and 2006, the Company determined, on the basis of consecutive years of increasing profitability from 2001 to 2006 and the Company’s forecasts of operating results for the foreseeable future, that it was more likely than not that a portion of the future income tax assets would be realized. As part of this analysis, the Company used a seven year moving average to forecast profitability of its operations subject to Canadian income tax.
Accordingly, the Company recognized future income tax assets of $7.7 million ($3.4 million current and $4.3 million long term) on its balance sheet as of December 31, 2006, and a corresponding $2.1 million future income tax benefit in its statement of operations for the year ended December 31, 2006.
Outlook
Management of the Company expects revenues to increase as a result of the addition of new customers, the sale of additional products and services to existing customers, as well as through the implementation of the Company’s overall growth strategy. NovAtel’s management expects to achieve average organic revenue growth of 15% to 20% per year over the long-term, prior to currency fluctuations.
The Company’s U.S. dollar denominated revenue generated an average of $1.14 Canadian dollar per U.S. dollar in 2006. As of May 25, 2007, the U.S. dollar was valued at approximately $1.08 per Canadian dollar. The Company currently expects that product shipments to Leica Geosystems will represent 18% to 22% of 2007 revenues. The Company expects gross profit generated on product sales and NRE fees to increase in conjunction with the expected increase in revenue. Research and development expenses are expected to increase to support evolving technological needs and new product development. Sales and marketing expenses and general and administrative expenses are also anticipated to increase to support the anticipated growth in the Company’s business.
Off Balance Sheet Arrangements
As of December 31, 2006, the Company had no off balance sheet arrangements other than operating leases.
36
Contractual Obligations
The following table sets forth the Company’s contractual obligations and commitments to make future payments under contracts, excluding trade and related party trade payables.
Payments Due by Period | ||||||||||||||||
Total | Less than 1 Year | 1-3 Years | 3-5 Years | More than 5 years | ||||||||||||
($000’s) | ||||||||||||||||
| Capital lease obligations | $ | — | $ | — | $ | — | $ | — | $ | — | ||||||
| Operating leases | 14,021 | 1,391 | 2,806 | 2,716 | 7,108 | |||||||||||
| Purchase obligations for inventory, capital assets and services | 10,921 | 10,706 | 215 | — | — | |||||||||||
| Notes payable | 541 | 541 | — | — | — | |||||||||||
| Licence fee payable | 1,842 | 965 | 877 | — | — | |||||||||||
| TOTAL | $ | 27,325 | $ | 13,603 | $ | 3,898 | $ | 2,716 | $ | 7,108 | ||||||
Related Party Transactions
In 2006, the Company sold $5.8 million of products to Point, its joint venture with Sokkia. In addition, the Company provided $322,000 in facilities, computer systems support and research and development support and charged engineering services of $512,000 to Point. The above transactions between the Company and Point are before intercompany eliminations.
On November 24, 2006, the Company and Sokkia invested U.S. $5.3 million (the Company’s share being U.S. $2.6 million) in the common shares of Point, Inc. The Company’s ownership percentage of Point, Inc. remained unchanged as a result of this transaction.
On November 27, 2006, Point, Inc. repaid U.S. $5.3 million (the Company’s share being $2.6 million) of loans outstanding with the Company and Sokkia.
As at December 31, 2006, the Company and Sokkia had collectively loaned Point U.S. $1.6 million, the Company’s share being U.S. $637,000. The loans are secured by the assets of Point. On February 3, 2006, the Company and Sokkia advanced U.S. $1.6 million in new loans to Point, Inc. with the Company’s share being U.S. $637,000.
Point is dependent on the Company and Sokkia for product supply, distribution and financing. Should Sokkia and the Company discontinue their support, Point’s ability to continue as a going concern would be impaired. The consolidated financial statements of the Company included elsewhere in this Annual Report do not reflect any adjustments that would be required if Point’s operations were discontinued.
On March 16, 2007, Topcon and Sokkia announced that they had entered into an agreement to form a “combined” entity. Topcon has GNSS technology and products that compete with those supplied by NovAtel to Point. The agreement under which NovAtel and Sokkia established Point expires in July 2009. The loss of Point or Sokkia, or both, as a customer or a substantial decrease in sales to Point could have a material adverse effect on NovAtel’s business, financial condition and results from operations and could cause its stock price to decline.
New Canadian and U.S. GAAP Accounting Pronouncements
Canadian Pronouncements
In January 2005, the Canadian Institute of Chartered Accountants (“CICA”) issued Section 1530, “Comprehensive Income”, Section 3251, “Equity”, Section 3855, “Financial Instruments - Recognition and Measurement” and Section 3865, “Hedges”. The new standards increase harmonization with U.S. GAAP and will require the following:
| · | Financial assets will be classified as either held-to-maturity, held-for-trading or available-for-sale. Held-to-maturity classification will be restricted to fixed maturity instruments that the company intends and is able to hold to maturity and will be accounted for at amortized cost. Held-for-trading instruments will be recorded at fair value with realized and unrealized gains and losses reported in net income. The remaining financial assets will be classified as available-for-sale. These will be recorded at fair value with unrealized gains and losses reported in a new category of the consolidated balance sheet under shareholders’ equity called other comprehensive income (“OCI”); and |
| · | Derivatives will be classified as held-for-trading unless designated as hedging instruments. All derivatives, including embedded derivatives that must be separately accounted for, will be recorded at fair value on the consolidated balance sheet. For derivatives that hedge the changes in fair value of an asset or liability, changes in the derivatives’ fair value will be reported in net income and be substantially offset by changes in the fair value of the hedged asset or liability attributable to the risk being hedged. For derivatives that hedge variability in cash flows, the effective portion of the changes in the derivatives’ fair value will be initially recognized in OCI and the ineffective portion will be recorded in net income. The amounts temporarily recorded in OCI will subsequently be reclassified to net income in the periods when net income is affected by the variability in the cash flows of the hedged item. |
The above guidance will apply for interim and annual financial statements relating to fiscal years beginning on or after October 1, 2006. Earlier adoption will be permitted only as of the beginning of a fiscal year. The impact of implementing these new standards did not have a material impact on the Company’s consolidated financial statements.
In December 2006, CICA issued Section 3862 - “Financial Instruments - Disclosures”. This standard requires entities to provide disclosures in their financial statements that enable users to evaluate the significance of financial instruments to the entity's financial position and performance. It also requires that entities disclose the nature and extent of risks arising from financial instruments and how the entity manages those risks.
In December 2006, CICA issued Section 3863 - “Financial Instruments - Presentation”. This standard establishes standards for presentation of financial instruments and non-financial derivatives and deals with the classification of financial instruments, from the perspective of the issuer, between liabilities and equity, the classification of related interest, dividends, losses and gains, and the circumstances in which financial assets and financial liabilities are offset. CICA sections 3862 and 3863 are effective for annual and interim periods beginning on or after October 1, 2007.
37
Canada’s Accounting Standards Board issued CICA Section 1506, “Accounting Changes”. The standard prescribes the criteria for changing accounting policies, together with the accounting treatment and disclosure of changes in accounting policies and estimates, and correction of errors. The standard requires the retrospective application to prior periods’ financial statements of changes in accounting principle, unless it is impractical to determine either the period-specific effects or the cumulative effect of the change. Application is on a prospective basis and is effective for changes in accounting policies and estimates and correction of errors made in fiscal years beginning on or after January 1, 2007.
In July 2006, the Emerging Issues Committee ("EIC") issued Abstract No. 162, “Stock-Based Compensation for Employees Eligible to Retire Before the Vesting Date”. This EIC discusses how compensation cost attributable to a stock-based award for a compensation plan that contains provisions that allow an employee to continue vesting after the employee has retired from the entity should be accounted for in the case of an employee who is eligible to retire at the grant date or who will become eligible to retire during the vesting period. In the case of an employee who is eligible to retire at the grant date, this EIC concludes that compensation should be recognized on the grant date. In the case of an employee who will become eligible to retire during the vesting period, the compensation cost should be recognized over the period from the grant date to the date the employee becomes eligible to retire. The implementation of this EIC is effective January 1, 2007 and is not expected to have a material impact on the Company’s consolidated financial statements.
The Emerging Issues Committee issued EIC Abstract 163 - “Determining the Variability to be Considered in Applying AcG 15”. This Abstract, which is harmonized with the equivalent United States FASB Staff Position (FSP) FIN 46(R) - 6 - “Determining the Variability to be Considered in Applying FASB Interpretation No. 46 (R)”, provides guidance on how an enterprise should determine the variability to be considered in applying “AcG 15 - Consolidation of Variable Interest Entities”. The Abstract is to be applied prospectively to all entities with which an enterprise first becomes involved and to all entities previously required to be analyzed under AcG 15 when a reconsideration event has occurred beginning the first day of the first reporting period beginning on or after January 1, 2007.
In early 2006, Canada’s Accounting Standards Board ratified a strategic plan that will result in Canadian GAAP, as used by public companies, being converged with International Financial Reporting Standards over a transitional period. The Accounting Standards Board is expected to develop and publish a detailed implementation plan with a transition period expected to be approximately five years. As this convergence initiative is very much in its infancy as of the date of the annual consolidated financial statements, it would be premature to currently assess the impact of the initiative, if any, on the Company.
U.S. Pronouncements
In February 2007, the Financial Accounting Standards Board (“FASB”) issued Statement of Financial Accounting Standards No. 159, “The Fair Value Option for Financial Assets and Financial Liabilities (including an amendment of FASB Statement No. 115)”. The statement would create a fair value option under which an entity may irrevocably elect fair value as the initial and subsequent measurement attribute for certain financial assets and financial liabilities on a contract-by-contract basis, with changes in fair value recognized in earnings as those changes occur. This Statement is effective as of the beginning of an entity’s first fiscal year that begins after November 15, 2007. Management is in the process of reviewing the requirements of this recent statement.
In September 2006, the FASB issued SFAS No. 157 “Fair Value Measurements” (“SFAS 157”). SFAS 157 provides accounting guidance on the definition of fair value and establishes a framework for measuring fair value in U.S. GAAP and expands disclosures about fair value measurements. SFAS 157 is effective for financial statements issued for fiscal years beginning after November 15, 2007. The Company plans to adopt the provisions of SFAS 157 on January 1, 2008. The Company is currently assessing the impact of the adoption of SFAS 157 on its results of operations and financial condition.
In September 2006, the SEC Staff issued Staff Accounting Bulletin 108, “Quantifying Misstatements in the Financial Statements” (“SAB 108”). SAB 108 requires that misstatements identified in the current year financial statements that result from misstatements of prior year financial statements be quantified and evaluated using a dual approach that includes both an income statement and balance sheet assessment of any misstatement. The guidance is effective for fiscal years ending after November 15, 2006. The implementation of SAB 108 did not have a material impact on the Company’s consolidated financial statements.
In June 2006, the EITF reached a consensus on EITF Issue No. 06-3 “How Taxes Collected from Customers and Remitted to Governmental Authorities Should Be Presented in the Income Statement (That Is, Gross Versus Net Presentation)” (“EITF 06-3”). EITF 06-3 provides guidance on how taxes directly imposed on revenue producing transactions between a seller and customer that are remitted to governmental authorities should be presented in the income statement (i.e. gross versus net presentation). EITF 06-3 is effective for interim and annual reporting periods beginning after December 15, 2006. The Company will adopt the provisions of EITF 06-3 on January 1, 2007. The Company is currently in the process of assessing the impact of EITF 06-3 on the presentation of its results of operations and financial condition.
In June 2006, the FASB issued FASB Interpretation No. 48 (“FIN 48”) entitled “Accounting for Uncertain Tax Positions” - an interpretation of SFAS No. 109. The interpretation clarifies the accounting for uncertainty in income taxes recognized in an enterprise’s financial statements in accordance with SFAS No. 109, Accounting for Income Taxes. The evaluation of a tax position in accordance with this interpretation is a two-step process. Under the recognition step an enterprise determines whether it is more likely than not that a tax position will be sustained upon examination based on the technical merits of the position. Under the measurement step a tax position that meets the more-likely-than-not recognition threshold is measured to determine the amount of benefit to recognize in the financial statements. The tax position is measured at the largest amount of benefit that is greater than 50 percent likely of being realized upon ultimate settlement. FIN 48 is effective for fiscal years beginning after December 15, 2006. Earlier application of the provisions of this interpretation is encouraged if the enterprise has not yet issued financial statements, including interim financial statements, in the period this interpretation is adopted. The implementation of FIN 48 did not have a material impact on the Company’s results of operations and financial condition.
38
In February 2006, the FASB issued Statement of Financial Accounting Standard (“SFAS”) No. 155, “Accounting for Certain Hybrid Financial Instruments - an amendment to FASB Statements No. 133 and 140” (“SFAS 155”). SFAS 155 simplifies the accounting for certain hybrid financial instruments containing embedded derivatives. SFAS 155 allows fair value measurement for any hybrid financial instrument that contains an embedded derivative that otherwise would require bifurcation under SFAS No. 133, “Accounting for Derivative Instruments and Hedging Activities” (“SFAS 133”). In addition, it amends SFAS No. 140 “Accounting for Transfers and Servicing of Financial Assets and Extinguishments of Liabilities” (“SFAS 140”), to eliminate the prohibition on a qualifying special-purpose entity from holding a derivative financial instrument that pertains to a beneficial interest other than another derivative financial instrument. SFAS 155 is effective for all financial instruments acquired, issued, or subject to a re-measurement event occurring after the beginning of an entity’s first fiscal year that begins after September 15, 2006. The Company will adopt the provisions of SFAS 155 on January 1, 2007. The implementation of SFAS 155 is not expected to have a material impact on the Company’s results of operations and financial condition.
In September 2006, the EITF reached a consensus on EITF Issue No. 06-1 “Accounting for Consideration Given by a Service Provider to Manufacturers or Resellers of Equipment Necessary for an End-Customer to Receive Service from the Service Provider” (“EITF 06-1”). EITF 06-1 provides accounting guidance on the consideration given by a service provider to a manufacturer or reseller of specialized equipment for the reduction of the price of such equipment to an end-customer which is necessary for an end-customer to receive service from the service provider. EITF 06-1 is effective for fiscal years beginning after June 15, 2007. The Company will adopt the provisions of EITF 06-1 on January 1, 2008. The Company is in the process of reviewing the requirements and potential impact of EITF 06-1.
In June 2005, the FASB published an exposure draft containing proposals to change the accounting for business combinations. The proposed standards would replace the existing requirements of the FASB’s Statement No. 141, Business Combinations. The proposals would result in fewer exceptions to the principle of measuring assets acquired and liabilities assumed in a business combination at fair value. Additionally, the proposals would result in payments to third parties for consulting, legal, audit, and similar services associated with an acquisition being recognized generally as expenses when incurred rather than capitalized as part of the business combination. The FASB also published an exposure draft that proposes, among other changes, that non-controlling interests be classified as equity within the consolidated financial statements. The FASB’s proposed standard would replace Accounting Research Bulletin No. 51, Consolidated Financial Statements.
Financial Instruments
Most of the Company’s revenues (over 95% in 2006) are earned in currencies other than the Canadian dollar, principally the U.S. dollar. A substantial portion of the Company’s expenses, however, have been and will continue to be incurred in Canadian dollars. Accordingly, fluctuations in exchange rates between the U.S. dollar and the Canadian dollar could materially affect results of operations. In the normal course of business, the Company uses foreign currency options and forward foreign currency contracts to reduce exposure to fluctuations in the U.S. dollar to Canadian dollar exchange rates. At December 31, 2006, the Company had forward currency contracts to sell U.S. $13.5 million between January 30, 2007 and September 28, 2007 at rates between U.S. $0.8715 and $0.9132 per Canadian dollar. In addition, the Company had forward foreign currency contracts to sell €555,000 between June 29, 2007 and September 28, 2007 at rates between €0.6498 and €0.6965 per Canadian dollar. Derivative financial instruments are not used for speculative purposes. There can be no assurance that the Company will be successful in such hedging activities.
The Company’s operating budget for 2007 is based on an exchange rate of U.S. $0.87 per Canadian dollar. The Company estimates that each $0.01 change in the U.S. dollar to Canadian dollar exchange rate would impact the Company’s 2006 budgeted net income by approximately $550,000, prior to taking into consideration the Company’s 2007 hedging program. The following table sets forth the potential impact of various hypothetical U.S. dollar to Canadian dollar exchange rates on the Company’s 2007 budgeted net income, prior to taking into consideration the Company’s 2007 hedging program.
U.S. $ per Canadian $ | Impact on 2007 Budgeted Net Income |
Favourable/(Unfavourable) (CDN$) | |
| $0.82 | $2.7 million |
| $0.83 | $2.2 million |
| $0.84 | $1.6 million |
| $0.85 | $1.1 million |
| $0.86 | $0.5 million |
| $0.87 | $― million |
| $0.88 | $(0.5) million |
| $0.89 | $(1.1) million |
| $0.90 | $(1.6) million |
| $0.91 | $(2.2) million |
| $0.92 | $(2.7) million |
| $0.93 | $(3.2) million |
| $0.94 | $(3.8) million |
The Company is not subject to significant interest rate risk due to the short-term maturities of the Company’s outstanding loans and short-term investments.
A. Inflation
While the Company believes that inflation has not had a material effect on its results of operations, there can be no assurance that inflation will not have such an effect in the future.
B. Liquidity and Capital Resources
See “Item 5 — Operating and Financial Review and Prospects, Liquidity and Capital Resources.”
39
C. Research and Development, Patents and Licences, etc.
See “Item 4 — Information on the Company, Business Overview — Research and Development” and “— Patents, Trademarks and Licenses.”
D. Trend Information
See “Item 5 — Operating and Financial Review and Prospects, Operating Results” and “Outlook”.
E. Off Balance Sheet Arrangements
See “Item 5 — Operating and Financial Review and Prospects, Operating Results — Off Balance Sheet Arrangements.”
F. Tabular Disclosure of Contractual Obligations
See “Item 5 — Operating and Financial Review and Prospects, Operating Results — Contractual Obligations.”
A. Directors and Senior Management
The following table sets forth certain information, as of May 25, 2007, regarding the executive officers, directors and certain key employees of the Company:
Name | Age | Position | Director Since | Executive Officer Since |
Directors and Senior Management | ||||
| Jonathan W. Ladd | 51 | President and Chief Executive Officer | 2002 | 2002 |
| Werner Gartner | 50 | Executive Vice President and Chief Financial Officer | 2001 | 1995 |
| Patrick C. Fenton | 49 | Vice President and Chief Technology Officer | 2005 | 2003 |
| Colin A. Maclellan | 48 | Vice President and General Manager | — | 2007 |
| Farlin A. Halsey, Jr. | 41 | Vice President, Corporate Strategy and Alliances | — | 2003 |
| Graham C. Purves | 45 | Vice President, Sales and Marketing | — | 2003 |
| Anthony J. Murfin | 59 | Vice President, Business Development | — | — |
| Michael McAloney | 49 | Vice President, Operations and Quality | — | — |
| Curtis Anderson | 46 | Vice President, OEM Product Development | — | — |
| Robert J. Iverach | 59 | Director | 2005 | — |
| Richard D. Orman | 59 | Vice Chairman of the Board | 1994 | — |
| Joel A. Schleicher | 55 | Director | 1997 | — |
| Charles R. Trimble | 65 | Director | 2002 | — |
| David E. Vaughn | 62 | Chairman of the Board | 2001 | — |
The following is a brief biography of each of the directors and members of senior management of the Company, which includes a description of their present occupation and their principal occupations during at least the past five years.
Senior Management
Jonathan W. Ladd. Mr. Ladd was appointed President and Chief Executive Officer of the Company in February 2002 and has served as a director of the Company from July 2002. From July 2001 to November 2001, Mr. Ladd served as Senior Vice President, Engineering at Thales Navigation Inc., a satellite positioning product company, and President of Thales’ Russian subsidiary, Ashtech A/O. From January 1998 to July 2001, Mr. Ladd served in several other management positions at Magellan Corporation, a satellite positioning product company, including Senior Vice President, Advanced Technology Group and Vice President and General Manager of Ashtech Precision Products Business Unit.
Werner Gartner. Mr. Gartner was appointed Executive Vice President and Chief Financial Officer of the Company in October 1996 and has served as a director of the Company from July 2001. Mr. Gartner also served as a director of the Company from November 1995 until May 1998. From November 2000 to February 2001, Mr. Gartner, in addition to his regular duties, served as Acting Interim President and Chief Executive Officer of the Company. From August 1990 to October 1996, Mr. Gartner served in a variety of financial positions at the Company including Vice President, Finance and Corporate Controller.
Patrick C. Fenton. Mr. Fenton was appointed Chief Technology Officer in January 2002 and became an executive officer of the Company in April 2003. Mr. Fenton previously served as Vice President, Technology of the Company from October 1998 and as Vice President, Research and Development of the Company from March 1997 until October 1998. Mr. Fenton previously served as Director, Research and Development for NovAtel’s GPS business unit from February 1995 until March 1997 and was Chief Engineer for the GPS business unit from November 1993 to February 1995. Mr. Fenton was appointed to the Board of Directors in March 2005.
Colin A Maclellan. Mr. Maclellan joined the company in May 2007 as Vice President and General Manager. From March 2002 to June 2006, Mr. Maclellan worked for CSI Wireless, a wireless and GPS product company, serving as General Manager Wireless Business Unit and as Chief Operating Officer. Prior to this, Mr. Maclellan spent 16 years with Nortel, a telecommunications equipment company, serving in various capacities, including three years as Vice President, Wireless Operations.
Farlin A. Halsey, Jr. Mr. Halsey was appointed Vice President of Corporate Strategy and Alliances in May 2007. Mr. Halsey served as Vice President, Marketing of the Company from July 2002 to May 2007. From August 2000 to January 2002, Mr. Halsey served as Vice President of Marketing for JP Mobile, a mobile server company. From August 1999 to August 2000, Mr. Halsey served as Director of Marketing-Personal Navigation with Navigation Technologies Company, a provider of digital mapping databases. From March 1993 to August 1999, Mr. Halsey served in various sales and marketing positions for Topcon America Company.
40
Graham C. Purves. Mr. Purves was appointed Vice President of Sales and Marketing in May 2007. Mr. Purves served as Vice President, Sales of the Company from January 2002 to May 2007. Mr. Purves previously served as Vice President, Sales and Marketing of the Company from October 1998 to January 2002. Mr. Purves assumed additional responsibility for product development in July 1999. Mr. Purves previously served as Director, Custom Products Group for the Company from January 1998 until October 1998, and as Director, Business Operations for the Company’s GPS business unit from September 1994 until October 1998. From August 1988 to September 1990, Mr. Purves served in various capacities at the Company including Manager, VLSI Design Group.
Anthony J. Murfin. Mr. Murfin was appointed Vice President, Business Development of the Company in April 2002. Mr. Murfin has also served as Director, Aviation Group of the Company from April 1998 until April 2002. Mr. Murfin previously served as Director, Corporate Accounts of the Company from April 1995 to April 1998 and as Director of Product and Marketing of the Company from April 1994 to April 1995. From January 1980 to April 1994, Mr. Murfin served in various capacities including Business Development Manager and Product Manager (Flight Systems) in the Avionics Division of CMC Electronics. From September 1977 until January 1980, Mr. Murfin was employed by CAE Electronics, a provider of advanced simulation technologies.
Curtis Anderson. Mr. Anderson was appointed Vice President, OEM Product Development in January 2005. Mr. Anderson previously served as Director, OEM Engineering from February 2000 until January 2005. Since joining NovAtel in 1994, Mr. Anderson served in a variety of product development roles, including Firmware Engineer and Project Manager.
Michael McAloney. Mr. McAloney was appointed Vice President, Business Operations and Corporate Quality in March, 2005. Mr. McAloney previously served as Director, Technical Services and Business Operations from 2002 to 2005 and Director Technical Services from 1998 to 2002. From 1995 to 1998, Mr. McAloney was Programs Manager for NovAtel’s GPS business unit. Mr. McAloney is currently a Director of Canadian Manufacturers and Exporters Alberta. Prior to joining NovAtel, Mr. McAloney was employed as Systems Engineer Manager at Micronav Ltd., a provider of Microwave Landing Systems.
Non-Management Directors
Robert J. Iverach. Mr. Iverach has served as a director of the Company since March 2005. From January 1994 to December 2004, Mr. Iverach was a Partner with Felesky Flynn LLP, a tax law firm in Calgary, Alberta. From January 2005 to December 2005, Mr. Iverach was Counsel with that firm. He retired completely from Felesky Flynn LLP on December 31, 2005. Mr. Iverach is presently the Chairman of Win Energy Corporation, Chairman of RAMTelecom Inc, a director of Vacci-Test Corporation, and a Trustee of Big Eagle Services Trust.
Richard D. Orman. Mr. Orman has served as a director of the Company since January 1994. Mr. Orman currently serves as Chief Executive of Nor Energy AS. From March 2003 to September 2005, he served as Executive Vice-Chairman of Exceed Energy Inc. From June 1999 to April 2003, Mr. Orman served as Chairman and Chief Executive Officer of Hemisphere International Inc. From March 1996 to October 1998, Mr. Orman was Chairman and Chief Executive Officer of Kappa Energy Company Inc. and served as a director until January 2000. From May 1986 to December 1992, Mr. Orman served as a member of the Alberta legislature and as Minister of Employment from May 1986 to September 1988, Minister of Labour from September 1988 to April 1989 and Minister of Energy from April 1989 to December 1992. Mr. Orman is lead director for Daylight Energy, a company listed on the Toronto Stock Exchange. Mr. Orman has also served as a director of a number of other public companies.
Joel A. Schleicher. Mr. Schleicher has served as a director of the Company since March 1997. Mr. Schleicher currently serves as Chairman and Chief Executive Officer for Integrated Solutions, Inc. From June 2000 to July 2002, Mr. Schleicher served as Chairman and Chief Executive Officer of Interpath Communications Inc. (prior to their acquisition of USinternetworking, Inc.) and continued to serve on its board until the company was sold to ATT in 2006. From 1995 until 2000, Mr. Schleicher held senior positions with private equity backed firms and served as a business consultant, advisor and investor with and to private equity firms. From 1989 to 1995, Mr. Schleicher served as Chief Operating Officer of and a board member for Nextel Communications, Inc. Mr. Schleicher also currently serves as a Director of TechTronic Industries Co. Ltd.
Charles R. Trimble. Mr. Trimble has served as a director of the Company since January 2002. Mr. Trimble currently serves as Chairman of the United States GPS Industry Council. Mr. Trimble also serves as a Director of KVH Industries, Inc. Mr. Trimble was one of the founders of Trimble Navigation Limited, a provider of GPS and other positioning technologies and products, in 1978 and served as President, Chief Executive Officer and a director of such company from 1981 to 1998.
David E. Vaughn. Mr. Vaughn has served as a director of the Company since July 2001 and was elected Chairman of the Board of Directors in March 2004. Mr. Vaughn also served as President and Chief Executive Officer of the Company from February 2001 to February 2002. Mr. Vaughn currently serves as President of Foursome Technologies, a consulting firm. From January 1999 to December 2000, Mr. Vaughn served as Senior Vice President and Chief Operations Officer with Magellan Corporation and as Senior Vice President, Strategic Business Alliances from August 1998 to January 1999. From June 1991 to July 1998, Mr. Vaughn served with Trimble Navigation Limited, a provider of GPS and other positioning technologies and products, in a variety of positions including Executive Vice President, Tracking and Communications Products Division and, most recently, as Executive Vice President, Corporate Business Development.
There is no family relationship between any of the directors and the executive officers. There are no arrangements or understandings between any director or executive officer and any other person pursuant to which any director and executive officer was selected.
B. Compensation
Summary of Executive Compensation
The following table provides a summary of the compensation paid during each of the three most recently completed fiscal years to each of the Chief Executive Officer, Chief Financial Officer and the three next most highly compensated executive officers of the Company who are currently serving as executive officers of NovAtel and based on salary and bonus value earned during 2006 (the “Named Executive Officers”).
41
Long Term Compensation | |||||||||||||||||||||||||
Annual Compensation | Awards | Payouts | |||||||||||||||||||||||
Name and Principal Position | Year | Salary ($) | Bonus ($) | Other Annual Compensation ($) | Restricted Stock Awards ($) | Securities Under Options/ SARs Granted (#) | LTIP Payouts ($) | All Other Compen- sation ($) | |||||||||||||||||
| Jonathan W. Ladd, President and CEO | 2006 2005 2004 | $ $ $ | 315,068 299,369 294,595 | $ $ $ | 208,000 242,500 329,754 | $ $ $ | 15,750(1 14,917(1 14,198(1 | ) ) ) | $ | — — 71,500(2 | ) | 16,600 14,500 — | $ | 274,259(2 — — | ) | — — — | |||||||||
| Werner Gartner, Executive Vice President and CFO | 2006 2005 2004 | $ $ $ | 202,542 193,114 185,567 | $ $ $ | 88,500 132,015 161,992 | $ $ $ | 10,125(1 9,656(1 9,266(1 | ) ) ) | $ | — — 36,036(2 | ) | 8,000 7,000 — | $ | 138,226(2 — — | ) | — — — | |||||||||
| Patrick C. Fenton , Vice President and CTO | 2006 2005 2004 | $ $ $ | 175,731 168,089 160,696 | $ $ $ | 76,500 110,090 140,290 | $ $ $ | 8,785(1 8,405(1 8,025(1 | ) ) ) | $ | — — 31,200(2 | ) | 7,100 6,200 — | $ | 119,678(2 — — | ) | — — — | |||||||||
Farlin A. Halsey, Vice President, Marketing (3) | 2006 2005 2004 | $ $ $ | 169,569 162,989 158,744 | $ $ $ | 67,500 101,024 134,068 | $ $ $ | 8,477(1 8,149(1 7,930(1 | ) ) ) | $ | — — 23,288(2 | ) | 5,700 5,000 — | $ | 89,328(2 — — | ) | — — — | |||||||||
Graham C. Purves, Vice President, Sales (4) | 2006 2005 2004 | $ $ $ | 169,569 160,721 149,432 | $ $ $ | 67,500 101,024 134,068 | $ $ $ | 8,477(1 7,911(1 7,371(1 | ) ) ) | $ | — — 21,840(2 | ) | 5,700 5,000 — | $ | 83,776(2 — — | ) | — — — | |||||||||
| All directors and executive officers as a group (ten persons in 2006, ten persons in 2005, and twelve persons in 2004) | 2006 2005 2004 | $ $ $ | 1,245,279 1,265,600 1,283,333 | $ $ $ | 508,000 686,653 1,034,240 | $ $ $ | 51,614 49,038 53,821 | $ | — — 205,219 | 49,000 43,855 — | $ | 705,267 — — | — — — | ||||||||||||
(1) Represents matching contributions made by the Company on behalf of each Named Executive Officer into their respective Registered Retirement Savings Plans.
(2) Represents values for awards of phantom share units issued pursuant to the 2004 Employee Long-term Incentive Plan. The value of the units are payable in cash subject to performance vesting conditions. Vesting occurred on December 31, 2006 as cumulative revenue and operating income for the three years ending December 31, 2006 exceeded certain pre-determined performance objectives. The dollar value payable upon vesting of the phantom shares is reported under LTIP payouts in the table above.
(3) Mr. Halsey was appointed Vice President of Corporate Strategy and Alliances in May 2007.
(4) Mr. Purves was appointed Vice President of Sales and Marketing in May 2007.
Options Granted During the Year Ended December 31, 2006
The following table sets forth the details of all options to purchase Common Shares that were granted to the Named Executive Officers during the fiscal year ended December 31, 2006.
Name | Securities Under Options/SARs Granted (#) | % of Total Options/ SARs Granted to Employees in Financial Year (%) | Exercise or Base Price (U.S.$/Security) | Grant Date Fair Value (U.S.$) (1) | Expiration Date | |||||||||||
| Jonathan W. Ladd, President and CEO | 16,600 | 11.3% | $ | 39.58 | $ | 243,024 | April 27, 2011 | |||||||||
| Werner Gartner, Executive Vice President and CFO | 8,000 | 5.4% | $ | 39.58 | $ | 117,120 | April 27, 2011 | |||||||||
| Patrick C. Fenton, Vice President and CTO | 7,100 | 4.8% | $ | 39.58 | $ | 103,944 | April 27, 2011 | |||||||||
| Farlin Halsey, Vice President, Marketing | 5,700 | 3.9% | $ | 39.58 | $ | 83,448 | April 27, 2011 | |||||||||
| Graham Purves, Vice President, Sales | 5,700 | 3.9% | $ | 39.58 | $ | 83,448 | April 27, 2011 | |||||||||
(1) Based on a Black- Scholes option pricing model. The same model is used to compute the compensation expense related to stock options reported in the Company’s financial statements.
42
Options Exercised During the Year Ended December 31, 2006
The following table sets forth details of: (i) options exercised, and the value thereof, by the Named Executive Officers during the fiscal year end December 31, 2006, (ii) the number of unexercised options as at December 31, 2006 (exercisable and unexercisable) held by the Named Executive Officers and (iii) the value of unexercised “in-the-money” options as at the fiscal year ended December 31, 2006, (exercisable and unexercisable) held by the Named Executive Officers. The closing price of the Company’s Common Shares on the last trading day of the fiscal year was U.S. $39.90 per share.
Name | Securities Acquired on Exercise | Aggregate Value Realized (U.S. $) | Unexercised Options December 31, 2006 (Exercisable/Unexercisable) | Value of Unexercised In-the-Money Options at December 31, 2006 (Exercisable/Unexercisable)(U.S. $) | |||||||||
| Jonathan W. Ladd, President and CEO | — | $ | — | 43,625 / 39,975 | $ | 1,575,801 / 696,591 | |||||||
| Werner Gartner, Executive Vice President and CFO | 50,000 | $ | 1,580,410 | 20,500 / 17,000 | $ | 741,529 / 250,271 | |||||||
| Patrick C. Fenton, Vice President and CTO | 20,100 | $ | 727,844 | 57,100 / 14,875 | $ | 1,886,853 / 214,277 | |||||||
| Farlin A. Halsey, Vice President, Marketing | 7,500 | $ | 245,756 | 12,000 / 11,700 | $ | 443,938 / 162,625 | |||||||
| Graham C. Purves, Vice President, Sales | 6,250 | $ | 233,714 | 21,423 / 12,075 | $ | 685,070 / 176,743 | |||||||
NovAtel’s Employee Stock Option Plan and Directors Stock Option Plan (collectively, the “Plans”) authorize the grant of options to purchase Common Shares to employees or directors of NovAtel or employees of a related company and non-employee directors of NovAtel, respectively.
The Employee Stock Option Plan provides for the granting of stock options (“Options”) to employees and to such other persons that have or will provide some service to the Company or a related company. The purpose of the Employee Stock Option Plan is to attract and retain the best available personnel for positions of substantial responsibility. The Employee Stock Option Plan is administered by the Compensation Committee of the Board of Directors.
The price of the Company’s Common Shares subject to each Option (the “Option Price”) is set by the Compensation Committee and shall not be less than 100% of the fair market value per Common Share on the date of grant. The Compensation Committee set an option price of 115% of fair market for option grants made in April 2006. Options granted under the Employee Stock Option Plan are exercisable at the times and on the terms established by the Compensation Committee. The Compensation Committee may accelerate the exercisability of any option. Options may also be accelerated in the event the Company is liquidated or dissolved or if certain conditions are met with respect to a change of control.
Vested options terminate 90 days after an optionee’s termination for any reason other than death or disability. Unvested options terminate immediately upon the termination of an optionee’s employment or service to the Company. Unless provided otherwise by the Compensation Committee, all options granted shall expire ten years from the date of grant. The Compensation Committee set an option expiration date of five years from the date of grant for options granted in April 2006.
The Employee Stock Option Plan was amended in 2005 to provide that the minimum exercise price of stock options be no less than 100% of the fair market value on the date of grant, that neither the Board of Directors nor the Compensation Committee be authorized to materially amend the Employee Stock Option Plan without shareholder approval; and re-pricing of stock options (including the cancellation and exchange of options) not be permitted without shareholder approval. In addition, the number of Common Shares available for future grant, together with the number of Common Shares issuable upon exercise of outstanding options under the Employee Stock Option Plan and the Directors Stock Option Plan, collectively, may not exceed 13% of the Common Shares outstanding at any time.
The Directors Option Plan provides for the granting of stock options to eligible non-employee directors of the Company. The purpose of the Directors Option Plan is to attract and retain the best available persons for positions on the Company’s Board of Directors. The Directors Option Plan is administered by the Compensation Committee of the Board of Directors.
Each non-employee director automatically will receive upon joining the Board of Directors and on the date of each subsequent annual meeting at which he or she is a non-employee director, an option to purchase such number of Common Shares as determined by dividing U.S. $40,000 by the closing selling price for a Common Share on The NASDAQ Global Select Market on that date.
The exercise price of the shares subject to each directors option will be 100% of the fair market value of the shares on the date of grant. Each directors option will become exercisable one year from the date of grant of the directors option; provided however that if prior to such date the participant terminates his or her service on the Board of Directors on account of death or disability, then the directors option will become exercisable in full on the date of such termination of service. Each directors option will terminate five years from the date of grant of the directors option. In addition, each directors option provides that, until the non-employee director resigns or does not stand for re-election, a non-employee director may only sell up to 50% of the shares received upon exercise of a directors option.
The Directors Option Plan was amended in 2005 to provide that discretionary grants to non-employee directors be replaced with annual non-discretionary grants pursuant to the terms of the plan; that neither the Board of Directors nor the Compensation Committee be authorized to materially amend the Directors Option Plan without shareholder approval; and that re-pricing of stock options (including the cancellation and exchange of options) not be permitted without shareholder approval. In addition, the number of Common Shares available for future grant, together with the number of Common Shares issuable upon exercise of outstanding options under the Employee Stock Option Plan and the Directors Stock Option Plan, collectively, may not exceed 13% of the Common Shares outstanding at any time.
The vesting schedule for each option granted pursuant to the Plans is specified by the Board of Directors or the committee, as the case may be, at the time of the grant. The vesting of outstanding options may be accelerated by the Board of Directors or the committee, as the case may be, at such times and in such amounts as the Board of Directors or the committee, as the case may be, determines in its sole discretion. Options that have been outstanding for at least six months immediately vest upon a change of control and are fully exercisable for a specified number of days depending on the nature of the event resulting in a change of control.
43
Options granted under the Plans are non-transferable. Vested options granted under each of the Plans terminate on the earlier of: (i) the expiry of the option (as discussed above); (ii) the expiry of 90 days from the date that an optionee ceases to be employed by or a member of the Board of Directors of the Company, as the case may be, for reasons other than death or disability; and (iii) the expiry of one year from the date of death of an optionee or the date that an optionee ceases to be employed by or a member of the Board of Directors of the Company, as the case may be, by reason of disability.
Management Employment Contracts
Jonathan W. Ladd, Werner Gartner and Patrick C. Fenton have employment-related contracts which provide for, among other things, industry standard covenants in the Company’s favour, including non-competition covenants for one year following termination. The contracts also provide that the Company can terminate an officer without cause upon which event the officer is entitled to one times his annual salary plus accelerated vesting of certain options, depending on the agreement. In addition, the contracts contain provisions relating to payments and accelerated vesting of stock options upon a termination within a certain amount of time of a change of control of the Company, with payments ranging from one and one-half to two times salary, depending on the contract.
Summary of Directors’ Compensation
Directors do not have service contracts with the Company. NovAtel compensates its directors who are not employees of the Company a base amount of $20,000 per year. The Chairman of the Board receives an additional $20,000 per year. Additional payments of $10,000 annually are paid to both the chairman and all members of the Audit Committee. The chairman of the Audit Committee receives an additional $10,000. In addition, directors are paid $1,000 for attendance at meetings of the Board of Directors, the Compensation Committee and the Audit Committee, with an additional $200 per hour payable for attendance at all supplemental meetings.
The directors of the Company received an aggregate of 5,900 stock options of NovAtel as compensation for their services in 2006 (6,155 in 2005 and nil in 2004).
Name | Fees Earned or Paid in Cash ($) | Stock Awards ($) | Option Awards ($) (1) | Non-Equity Incentive Plan Compensation ($) | Change in Pension Value and Nonqualified Deferred Compensation Earnings | All Other Compensation ($) | Total ($) | |||||||||||||||
| Robert J. Iverach | $ | 30,000 | ― | $ | 26,018 | ― | ― | ― | $ | 56,018 | ||||||||||||
| Richard D. Orman | $ | 44,000 | ― | $ | 26,306 | ― | ― | ― | $ | 70,306 | ||||||||||||
| Joel Schleicher | $ | 49,400 | ― | $ | 26,306 | ― | ― | ― | $ | 75,706 | ||||||||||||
| Charles Trimble | $ | 38,000 | ― | $ | 26,306 | ― | ― | ― | $ | 64,306 | ||||||||||||
| David Vaughn | $ | 51,000 | ― | $ | 26,018 | ― | ― | ― | $ | 77,018 | ||||||||||||
(1) Based on a Black- Scholes option pricing model. The same model is used to compute the compensation expense related to stock options reported in the Company’s financial statements.
Directors’ and Officers’ Liability Insurance
The Company maintains a comprehensive directors’ and officers’ liability policy for events arising prior to CMC Electronics acquiring majority control of the Company on April 17, 1998. This policy was originally purchased for $42,000 for the policy period from December 1, 2000 to December 1, 2005 and extended to June 30, 2007. The policy covers limits of liability for each loss and for each policy period of $10 million with a $250,000 deductible for any claims.
Esterline Technologies Corporation, which controls directly or indirectly, all of the common shares of CMC Electronics Inc., maintains a comprehensive directors’ and officers’ liability policy which applies to the Company’s directors and officers for events arising subsequent to April 12, 2001 and prior to February 3, 2005. This policy is in place until March 14, 2013.
The Company maintains comprehensive directors’ and officers’ liability policies for events arising subsequent to January 27, 2005. These policies, in place until June 30, 2007, cover limits of liability for each loss and for each policy period of U.S. $10 million primary coverage with a U.S. $250,000 deductible for any claims and U.S. $10 million excess coverage. The annual premium for these policies is U.S. $217,850.
Indebtedness of Directors and Executive Officers
No executive officers or directors of NovAtel, or any of their associates or affiliates, are or have been indebted to NovAtel since the commencement of the last completed financial year of the Company, nor have any of the foregoing been the subject of a guarantee, support agreement, letter of credit or other similar arrangement or understanding provided by NovAtel or any of its subsidiaries since the commencement of the last completed financial year.
C. Board Practices
All directors hold office until the next annual meeting of the Company’s shareholders, which has been in July for the past several years, or until their respective successors are duly appointed by the Board of Directors or their positions are earlier vacated by resignation or otherwise.
Executive officers are appointed by the Board of Directors on an annual basis and serve until the next annual meeting of the Board of Directors or until their respective successors are duly appointed or their positions are earlier vacated by resignation or otherwise.
44
Committees of the Board of Directors
The Company has an Audit Committee and a Compensation Committee.
Audit Committee
The Audit Committee assists the Board of Directors of the Company in fulfilling its responsibilities for oversight and supervision of financial and accounting matters. The Audit Committee responsibilities include the engagement or discharge of independent auditors, reviewing with the independent auditors the plan and results of the auditing engagement, reviewing NovAtel’s internal auditing procedures, system of internal accounting controls and financial management and making inquiries into matters within the scope of this Committee’s functions. The members of the Audit Committee are Richard D. Orman, Joel A. Schleicher and Charles R. Trimble. The Board of Directors has determined that all members of the Audit Committee are “independent directors” as determined in accordance with applicable securities laws and rules of The NASDAQ Global Select Market. The Board of Directors and the Audit Committee have adopted a written charter of the Audit Committee. The Audit Committee reviews and assesses the adequacy of the charter on an annual basis.
Compensation Committee
The function of the Compensation Committee is to ensure that the Company has a high caliber executive management in place and a total compensation plan that is competitive, motivating and rewarding for participants. The Compensation Committee reviews and makes recommendations to the Board of Directors of the Company concerning the compensation of the key management employees of the Company and the administration of the Plans. The members of the Compensation Committee are Richard D. Orman, Robert Iverach and David E. Vaughn. The Board of Directors has determined that each member of the Compensation Committee is an “independent director” as determined in accordance with applicable securities laws and The NASDAQ Global Select Market rules.
D. Employees
See “Item 4 — Information on the Company, Business Overview — Employees.”
E. Share Ownership
The following table sets forth as of April 26, 2007, the ownership of the Company’s Common Shares by each director and Named Executive Officer and all directors and executive officers as a group:
Shares Beneficially Owned | ||
Name | Shares | Percent |
| Patrick C. Fenton (1) | 60,225 | * |
| Werner Gartner (2) | 42,250 | * |
| Farlin A. Halsey (3) | 14,250 | * |
| Robert J. Iverach (4) | 1,231 | * |
| Jonathan W. Ladd (5) | 76,125 | * |
| Richard D. Orman (6) | 1,231 | * |
| Graham C. Purves (7) | 24,048 | * |
| Joel A. Schleicher (8) | 1,231 | * |
| Charles R. Trimble (9) | 1,231 | * |
| David E. Vaughn (10) | 1,231 | * |
| All directors and executive officers as a group (ten persons) (11) | 223,053 | 2.6% |
* Less than 1%.
(1) Represents vested stock options to purchase 60,225 Common Shares of the Company as of April 26, 2007.
(2) Includes vested stock options to purchase 24,250 Common Shares of the Company as of April 26, 2007.
(3) Represents vested stock options to purchase 14,250 Common Shares of the Company as of April 26, 2007.
(4) Represents vested stock options to purchase 1,231 Common Shares of the Company as of April 26, 2007.
(5) Includes vested stock options to purchase 56,125 Common Shares of the Company as of April 26, 2007.
(6) Represents vested stock options to purchase 1,231 Common Shares of the Company as of April 26, 2007.
(7) Represents vested stock options to purchase 24,048 Common Shares of the Company as of April 26, 2007.
(8) Represents vested stock options to purchase 1,231 Common Shares of the Company as of April 26, 2007.
(9) Represents vested stock options to purchase 1,231 Common Shares of the Company as of April 26, 2007.
(10) Represents vested stock options to purchase 1,231 Common Shares of the Company as of April 26, 2007.
(11) Includes vested stock options to purchase 185,053 Common Shares of the Company as of April 26, 2007.
45
The following table sets forth certain information regarding outstanding options to purchase securities held by the Company’s Named Executive Officers and directors as of April 26, 2007.
Stock options | Total Amount | Purchase Price U.S $ (1) | Expiration Date | |||||||
| Jonathan W. Ladd | 15,000 | $ | 2.50 | 2/18/2012 | ||||||
| 37,500 | $ | 2.25 | 2/12/1013 | |||||||
| 14,500 | $ | 19.61 | 5/12/2010 | |||||||
| 16,600 | $ | 39.58 | 4/27/2011 | |||||||
| 83,600 | ||||||||||
| Werner Gartner | 7,500 | $ | 2.25 | 1/14/2012 | ||||||
| 15,000 | $ | 2.25 | 2/12/2013 | |||||||
| 7,000 | $ | 19.61 | 5/12/2010 | |||||||
| 8,000 | $ | 39.58 | 4/27/2011 | |||||||
| 37,500 | ||||||||||
| Patrick C. Fenton | 15,000 | $ | 7.50 | 6/30/2007 | ||||||
| 2,500 | $ | 1.69 | 1/11/2011 | |||||||
| 5,000 | $ | 2.25 | 1/14/2012 | |||||||
| 9,375 | $ | 2.25 | 2/12/2013 | |||||||
| 6,200 | $ | 19.61 | 5/12/2010 | |||||||
| 7,100 | $ | 39.58 | 4/27/2011 | |||||||
| 45,175 | ||||||||||
| Farlin A. Halsey | 9,250 | $ | 3.10 | 6/16/2012 | ||||||
| 5,000 | $ | 2.25 | 2/12/2013 | |||||||
| 3,750 | $ | 19.61 | 5/12/2010 | |||||||
| 5,700 | $ | 39.58 | 4/27/2011 | |||||||
| 23,700 | ||||||||||
| Graham C. Purves | 6,000 | $ | 10.75 | 10/01/2007 | ||||||
| 3,923 | $ | 8.00 | 1/18/2008 | |||||||
| 5,000 | $ | 7.50 | 12/17/2008 | |||||||
| 7,875 | $ | 2.25 | 2/12/2013 | |||||||
| 5,000 | $ | 19.61 | 5/12/2010 | |||||||
| 5,700 | $ | 39.58 | 4/27/2011 | |||||||
| 33,498 | ||||||||||
| David E. Vaughn | 1,231 | $ | 32.50 | 7/28/2010 | ||||||
| 1,180 | $ | 33.89 | 7/17/2011 | |||||||
| 2,411 | ||||||||||
| Joel A. Schleicher | 1,231 | $ | 32.50 | 7/28/2010 | ||||||
| 1,180 | $ | 33.89 | 7/17/2011 | |||||||
| 2,411 | ||||||||||
| Charles R. Trimble | 1,231 | $ | 32.50 | 7/28/2010 | ||||||
| 1,180 | $ | 33.89 | 7/17/2011 | |||||||
| 2,411 | ||||||||||
| Richard D. Orman | 1,231 | $ | 32.50 | 7/28/2010 | ||||||
| 1,180 | $ | 33.89 | 7/17/2011 | |||||||
| 2,411 | ||||||||||
| Robert J. Iverach | 1,231 | $ | 32.50 | 7/28/2010 | ||||||
| 1,180 | $ | 33.89 | 7/17/2011 | |||||||
| 2,411 | ||||||||||
| All directors and executive officers as a group (ten persons) | 235,528 | |||||||||
(1) All options were granted at not less than fair market value at date of grant.
46
A. Major Shareholders
The following table sets forth as of May 11, 2007 those persons known to the Company to be owners of more than 5% of the Common Shares:
Shares Beneficially Owned | ||
Shares | Percent | |
| Neuberger Berman LLC (1) | 1,126,050 | 13.1% |
| Wellington Management Company, LLP (2) | 1,011,412 | 11.8 |
| Tygh Capital Management, Inc. (3) | 589,466 | 6.9 |
(1) The address of Neuberger Berman LLC is 605 Third Avenue, New York, New York, USA, 10158
Based on a Schedule 13F-HR filed on May 10, 2007.
(2) The address of Wellington Management Company, LLP is 75 State Street, Boston Massachusetts, USA, 02109
Based on a Schedule 13G/A filed on April 10, 2007.
(3) The address of Tygh Capital Management, Inc. is 1211 SW, Fifth Avenue, Suite 2100, Portland, Oregon, USA, 97204.
Based on a Schedule 13F-HR filed on May 7, 2007.
The Company’s major shareholders do not have different rights from our other common shareholders. CMC Electronics, FMR Corp., Provident Investment Counsel and Essex Investment Management Co. each owned at one or more times during the last three years more than 5% of the outstanding common shares, but, to the Company’s knowledge, do not own more than 5% currently. To the best of the Company’s knowledge, as of May 11, 2007, U.S shareholders held approximately 4.7 million of the Company’s outstanding Common Shares, or 55% of total Common Shares outstanding. This figure may not be entirely accurate because the Company can obtain only limited information regarding the current holding of the Company’s shares in the United States. As of May 11, 2007, there were 14 registered shareholders of NovAtel, of which 12 have addresses within the United States.
B. Related Party Transactions
See “Item 5 — Operating and Financial Review and Prospects, Operating Results — Related Party Transactions” and “Item 4 — Information on the Company, Business Overview — Strategic Partnerships — CMC Electronics” and “— Certain Contractual Rights.”
C. Interests of Experts and Counsel
Not applicable.
A. Consolidated Statements and Other Financial Information
Consolidated Financial Statements
See Item 18 “Financial Statements” for a full list of financial statements included as part of this Annual Report.
Legal Proceedings
See “Item 4 — Information on the Company, Business Overview — Legal Proceedings.”
Dividend Policy
The Company has not declared or paid any dividends on the Common Shares to date. The payment of dividends in the future will be dependent on the earnings and financial condition of the Company and on such other factors as the Board of Directors of NovAtel considers appropriate.
B. Significant Changes
Not applicable.
47
A. Offer and Listing Details
The Company’s Common Shares have been listed on The NASDAQ Global Select Market (formerly The Nasdaq National Market) since February 7, 1997. The following are the price ranges as reported by The NASDAQ Global Select Market for the periods indicated.
U.S. $ | |||||||
Annual | High | Low | |||||
| 2006 | $ | 48.250 | $ | 26.910 | |||
| 2005 | $ | 48.450 | $ | 14.318 | |||
| 2004 | $ | 50.350 | $ | 8.070 | |||
| 2003 | $ | 11.080 | $ | 1.900 | |||
| 2002 | $ | 5.200 | $ | 1.760 | |||
Quarterly | |||||||
| Q4 - 2006 | $ | 46.680 | $ | 36.020 | |||
| Q3 - 2006 | $ | 48.250 | $ | 33.170 | |||
| Q2 - 2006 | $ | 40.100 | $ | 29.500 | |||
| Q1 - 2006 | $ | 37.610 | $ | 26.910 | |||
| Q4 - 2005 | $ | 31.760 | $ | 21.690 | |||
| Q3 - 2005 | $ | 37.150 | $ | 22.910 | |||
| Q2 - 2005 | $ | 29.190 | $ | 14.318 | |||
| Q1 - 2005 | $ | 48.450 | $ | 16.260 | |||
Monthly | |||||||
| April 2007 | $ | 38.440 | $ | 34.690 | |||
| March 2007 | $ | 44.500 | $ | 30.720 | |||
| February 2007 | $ | 45.050 | $ | 41.050 | |||
| January 2007 | $ | 44.910 | $ | 39.650 | |||
| December 2006 | $ | 42.390 | $ | 39.500 | |||
| November 2006 | $ | 42.230 | $ | 36.020 | |||
B. Plan of Distribution
Not applicable.
C. Markets
In February 1997, the Company’s Common Shares commenced trading in the United States on the Nasdaq National Market tier of The NASDAQ Stock Market under the symbol “NGPSF.” The Common Shares are not listed on any other non-United States trading market. In March 1999, the Company’s symbol was changed to “NGPS.” The Common Shares began trading on The NASDAQ Global Select Market in August 2006.
Prior to February 4, 1997, the Company’s Common Shares were not listed on any trading market.
D. Selling Shareholders
Not applicable.
E. Dilution
Not applicable.
F. Expenses of the Issue
Not applicable.
A. Share Capital
Not applicable.
B. Articles of Incorporation
The Company is registered under the Canada Business Corporations Act (“CBCA” or the “Act”) as corporation number 076226-1 and has the capacity and, subject to the provisions of the Act, the rights, powers and privileges of a natural person. Pursuant to Item 6 of the Company’s Restated Articles of Incorporation, there are no restrictions on the Company’s objects and purposes.
Powers of Directors
Subject to any unanimous shareholder agreement, the directors shall manage or supervise the management of the business and affairs of the Company and may exercise all such powers and do all such acts and things as may be exercised or done by the Company and are not by the Act, the articles, the by-laws, any special resolution of the Company, a unanimous shareholder agreement or by statute expressly directed or required to be done in some other manner. Notwithstanding any vacancy among the directors, the remaining directors may exercise all the powers of the board so long as a quorum of the board remains in office.
48
The Act requires every director or officer who is a party to a material contract or a material transaction, whether made or proposed with the Company, or who is a director or officer of or has a material interest in any person who is a party to a material contract or a material transaction, whether made or proposed contract with the Company to disclose in writing to the Company or request to have entered in the minutes of meetings of directors or meetings of committees of directors the nature and extent of his or her interest, and shall, except in certain limited circumstances, refrain from voting in respect of the material contract or material transaction. The articles and by-laws do not require an independent quorum to enable the directors to vote compensation to themselves or any member of their body. The Act also provides that the shareholders of the Company may examine the portion of any minutes of meetings of directors or such other documents that contain such disclosures of interest.
Unless the articles or by-laws of or a unanimous shareholder agreement relating to the Company otherwise provide, the directors of the Company may, without authorization of the shareholders, (a) borrow money on the credit of the Company, (b) issue, reissue, sell, pledge or hypothecate debt obligations of the Company, (c) to the extent permitted by the CBCA, give a guarantee on behalf of the Company to secure performance of an obligation by any person, and (d) mortgage, hypothecate, pledge or otherwise create a security interest in all or any property of the Company, owned or subsequently acquired, to secure any obligation of the Company. The Company does not have a unanimous shareholder agreement and the Company’s articles and by-laws do not limit the above powers.
Directors of the Company are not required to own shares of the Company in order to qualify as a director and the directors are not required to retire upon reaching a specified age.
Description of Securities
The Company is authorized to issue an unlimited number of Common Shares and an unlimited number of First Preference Shares.
Holders of Common Shares are entitled to receive notice of and to attend all meetings of the shareholders of the Company, except meetings at which holders of another specified class of shares are exclusively entitled to vote, and are entitled to one vote for each Common Share held on all votes taken at such meetings. The holders of Common Shares are entitled to receive such dividends as the directors may in their discretion declare, regardless of whether dividends are declared on any other class of shares. Upon liquidation, dissolution or wind-up of the Company, the holders of Common Shares are entitled to receive any remaining property after payment of any amount required to redeem or retract the issued and outstanding First Preference Shares.
The First Preference Shares may be issued in one or more series with each series to consist of such number of shares as may, before the issue of the series, be fixed by the directors of the Company. The directors are authorized, before the issue of the series, to determine the designation, rights, privileges, restrictions and conditions attaching to the First Preference Shares of each series.
The First Preference Shares of each series rank equally with respect to the payment of dividends and the distribution of assets or return of capital in the event of liquidation, dissolution or winding-up and in priority to the Common Shares and any other shares of the Company ranking junior to the First Preference Shares. In addition, if any amount of cumulative dividend or declared non-cumulative dividend or an amount payable on return of capital in respect of shares of a series of First Preference Shares is not paid in full, the shares of the series are entitled to participate ratably with the shares of any other series of the same class in respect of such amounts.
In accordance with the provisions of the CBCA, the amendment of certain rights attaching to a class of shares, including Common Shares, requires the approval of not less than two-thirds of the votes cast by the holders of such shares voting at a special meeting of such holders. Pursuant to the Company’s By-laws, a quorum for a meeting of the holders of Common Shares occurs when persons not being less than two in number and holding or representing by proxy not less than 33⅓% of the issued and outstanding Common Shares entitled to vote at such meetings are present, unless a higher number is designated by the Board. In circumstances where the rights of Commons Shares may be amended, to add, change or remove any provisions restricting or constraining the issue, transfer or ownership of Common Shares, holders of Common Shares have the right under the CBCA to dissent from such amendment and require the Company to pay them the then fair value of the Common Shares.
Shareholder Meetings
There are two types of shareholder meetings: regular annual meetings and special meetings. Pursuant to the CBCA, the annual shareholder meeting shall be held not later than fifteen months after the holding of the last preceding annual meeting but no later than six months after the end of preceding financial year, unless an order extending the time for calling the annual meeting is obtained. The Directors may at any time call a special meeting of shareholders.
A notice stating the day, hour and place of meeting and, if special business is to be transacted, details of the nature of the business, must be served by sending such notice to each person who is entitled to notice of such meeting and who on the record date for notice appears on the records of the Company or the Company’s transfer agent as a shareholder entitled to vote at the meeting and to each director of the Company and to the auditor of the Company by prepaid mail not less than 21 days and not more than 60 days before the meeting unless such requirement is otherwise waived. The Company must fix a record date in advance of the meeting for the purpose of determining shareholders entitled to notice of the meeting. Only shareholders of record on such date will be entitled to notice of the meeting.
Votes at meetings of shareholders may be given either personally or by proxy. Every shareholder, including a shareholder that is a body corporate, entitled to vote at a meeting of shareholders may by means of a proxy appoint a proxyholder or one or more alternate proxyholders, who need not be shareholders, as his nominee to attend and act at the meeting in the manner, to the extent and with the authority conferred by the proxy.
C. Material Contracts
Except for contracts entered into in the ordinary course of business, the only material contract entered into by NovAtel in the three years immediately preceding the date of this Annual Report which can reasonably be regarded as presently material is the following:
49
(1) Change of Control Agreement dated April 5, 2004 among NovAtel, Leica Geosystems and CMC Electronics, as more particularly described under “Item 4 — Information on the Company, Business Overview — Certain Contractual Rights.”
D. Exchange Controls
Investment Canada Act
Canada has no system of exchange controls. There is no law, government decree or regulation in Canada restricting the export or import of capital or affecting the remittance of dividends, interest or other payments to a non-resident holder of Common Shares, other than withholding tax requirements. See “Item 10 — Additional Information, Taxation.”
There is no limitation imposed by Canadian law or by the articles or other charter documents of the Company on the right of a non-resident to hold or vote Common Shares or Preferred Shares of the Company with voting rights (collectively, “Voting Shares”), other than as provided in the Investment Canada Act (the “Investment Act”), as amended by the World Trade Organization Agreement Implementation Act (the “WTOA Act”). The Investment Act generally prohibits implementation of a reviewable investment by an individual, government or agency thereof, corporation, partnership, trust or joint venture that is not a “Canadian,” as defined in the Investment Act (a “non-Canadian”), unless, after review, the minister responsible for the Investment Act is satisfied that the investment is likely to be of net benefit to Canada. An investment in Voting Shares of the Company by a non-Canadian (other than a “WTO Investor,” as defined below) would be reviewable under the Investment Act if it was an investment to acquire control of the Company and the Company was not, immediately prior to the implementation of the investment, controlled by a WTO Investor, and the value of the assets of the Company were $5.0 million or more. An investment in Voting Shares of the Company by a WTO Investor would be reviewable under the Investment Act if it was an investment to acquire direct control of the Company, and the value of the assets of the Company equaled or exceeded $265 million for the year 2006 and $287 million for the year 2007. A non-Canadian, whether a WTO Investor or otherwise, would acquire control of the Company for purposes of the Investment Act if he or she acquired a majority of the Voting Shares of the Company. The acquisition of less than a majority, but at least one-third of the Voting Shares of the Company, would be presumed to be an acquisition of control of the Company, unless it could be established that the Company was not controlled in fact by the acquirer through the ownership of Voting Shares. In general, an individual is a WTO Investor if he or she is a “national” of a country (other than Canada) that is a member of the World Trade Organization (“WTO Member”) or has a right of permanent residence in a WTO Member other than Canada. A corporation or other entity will be a WTO investor if it is a “WTO investor-controlled entity” pursuant to detailed rules set out in the Investment Act. The United States is a WTO Member.
Certain transactions involving Voting Shares of the Company would be exempt from the Investment Act, including: (a) an acquisition of Voting Shares of the Company if the acquisition was made in connection with the person’s business as a trader or dealer in securities; (b) an acquisition of control of the Company in connection with the realization of a security interest granted for a loan or other financial assistance and not for any purpose related to the provisions of the Investment Act; and (c) an acquisition of control of the Company by reason of an amalgamation, merger, consolidation or corporate reorganization, following which the ultimate direct or indirect control in fact of the Company, through the ownership of voting interests, remains unchanged.
E. Taxation
The following is a summary of the principal Canadian federal income tax considerations generally applicable to a holder of Common Shares who is neither resident nor deemed to be resident in Canada, who does not use or hold and is not deemed to use or hold their Common Shares in carrying on a business in Canada and whose Common Shares do not otherwise constitute “taxable Canadian property” for purposes of the Tax Act (a “U.S. Holder”). Common Shares of a holder will generally not constitute “taxable Canadian property unless (a) at any time within the sixty (60) month period that ends at the time of the disposition of Common Shares by such holder, such holder, persons not dealing at arm’s length with such holder, or any combination thereof, owned (or had an interest in or option to acquire) 25% or more of the issued shares of any class or series of the capital stock of the Company or a predecessor, or (b) the Common Shares are deemed by the Tax Act to be taxable Canadian property. The Tax Act contains provisions relevant to a non-resident insurer for whom any Securities are “designated insurance property” which this summary does not take into account. This summary is not exhaustive of all potential Canadian income tax consequences to a U.S. Holder of acquiring, holding or disposing of Common Shares.
This summary takes into account the current provisions of Tax Act, the regulations thereunder, all specific proposals to amend the Tax Act publicly announced prior to the date of this Annual Report by the Minister of Finance, Canada, and the current published administrative practices and policies of the Canada Revenue Agency. It assumes that all proposals to amend the Tax Act will be enacted in their present form and otherwise does not take into account or anticipate changes in the law, whether by way of judicial decision or legislative action, nor does it take into account provincial, territorial or foreign tax legislation or considerations.
The discussion below is of a general nature only and is not intended to be, nor should it be construed to be, legal, business or tax advice to any particular holder or prospective holder of Common Shares. The tax considerations relative to ownership and disposition of the Common Shares may vary from taxpayer to taxpayer depending on the taxpayers’ particular status. Accordingly, holders and prospective holders of Common Shares should consult their own tax advisors regarding any and all tax consequences of purchasing, owning and disposing of Common Shares.
A U.S. Holder will not be subject to tax under the Tax Act on any gain realized in respect of the disposition or deemed disposition of Common Shares to a person other than the Company, provided the Common Shares are not taxable Canadian property to the U.S. holder. A disposition of the Common Shares to the Company may give rise to a deemed dividend that would be subject to Canadian withholding tax. Generally, dividends paid or credited, or deemed to be paid or credited by the Company, to U.S. Holders who beneficially own the dividends or deemed dividends are subject to Canadian withholding tax at the rate of 15% (reduced from 25% by the Convention). The Company assumes responsibility for the withholding of tax on dividends to a U.S. Holder at the source.
F. Dividends and Paying Agents
Not applicable.
50
G. Statement by Experts
Not applicable.
H. Documents on Display
Documents concerning the Company referred to in this Annual Report may be inspected at its headquarters at 1120-68th Avenue N.E., Calgary, Alberta, T2E 8S5, CANADA. The Company provides access to its Quarterly Reports filed on Form 6-K and Annual Report on Form 20-F on its website free of charge, as soon as reasonably practicable after those reports are electronically filed. The Company’s Code of Ethics and Business Conduct is posted on its website at www.novatel.ca.
The Company’s SEC filings and the exhibits thereto, are available for inspection and copying at the public reference facilities maintained by the SEC, 100 F Street N.E., Washington, D.C., 20549. Copies of these filings may be obtained from these offices after the payment of prescribed fees. Please call the SEC at 1-800-SEC-0330 for further information on the public reference rooms.
As a foreign private issuer, the Company is exempt from the proxy rules under the Securities Exchange Act of 1934, as amended, prescribing the furnishing and content of proxy statements to shareholders. As the Company is a foreign private issuer, the Company’s directors and officers are also exempt from the short swing profit recovery and disclosure regime of Section 16 of the Exchange Act.
I. Subsidiary Information
Not applicable.
See “Item 5 — Operating and Financial Review and Prospects, Operating Results — Financial Instruments.” The Company is not subject to significant interest rate risk due to the short-term maturities of the Company’s outstanding loans and short-term investments.
Not applicable.
Not applicable.
Not applicable.
(a) Evaluation of Disclosure Controls and Procedures. The Company’s Chief Executive Officer and Chief Financial Officer, after evaluating the effectiveness of the Company’s “disclosure controls and procedures” (as defined in the Securities Exchange Act of 1934, Rules 13a-15(e) and 15d-15(e)) as of the end of the period covered by this Annual Report, have concluded that the Company’s disclosure controls and procedures were effective.
(b) Management’s Report on Internal Control over Financial Reporting. Management’s Report on Internal Control over Financial Reporting appears on page F-3.
(c) Changes in Internal Controls. There were no changes in the Company’s internal controls over financial reporting identified in connection with the evaluation above during the period covered by this Annual Report that has materially affected, or is reasonably likely to materially affect, the Company’s internal controls over financial reporting.
The Company’s Board of Directors has determined that Joel A. Schleicher is the Company’s audit committee financial expert as defined by the rules of the SEC. Mr. Schleicher is “independent” as defined by the Nasdaq rules.
The Company has adopted a Code of Ethics and Business Conduct that applies to its principal executive officer, principal financial officer and all other officers, employees and directors of the Company. A copy of the Company’s Code of Ethics and Business Conduct can be found on the Company’s website at www. novatel.ca. There were no amendments to, or waivers granted under, the Code of Ethics and Business Conduct during the year ended December 31, 2006.
51
The following table sets forth the aggregate fees billed to the Company for the years ended December 31, 2006 and December 31, 2005:
Fees | 2006 | 2005 | |||||
| Audit Fees (1) | $ | 563,444 | $ | 342,628 | |||
| Audit-Related Fees (2) | ― | ― | |||||
| Tax Fees (3) | 135,918 | 91,242 | |||||
| All Other Fees (4) | — | — | |||||
Total Fees | $ | 699,362 | $ | 433,870 | |||
(1) "Audit Fees" consist of fees for professional services rendered in connection with the audit of the Company’s consolidated annual financial statements, review of the Company’s quarterly financial statements and the quarterly and annual regulatory filings thereon.
(2) “Audit-Related Fees” consist of fees for professional services rendered in connection with financial accounting and reporting consultations.
(3) “Tax Fees” consist of fees billed for professional services rendered for tax compliance and tax advice. These services include preparation of the Company’s income tax returns, employee-related tax issues and excise tax matters.
(4) “All Other Fees” consist of fees for products and services other than the services reported above.
The Audit Committee requires pre-approval of all audit and permissible non-audit services (including the fees and terms thereof) to be performed for the Company by its independent registered chartered accountants, subject to the de-minimus exception for non-audit services described in Section 10A(i)(1)(B) of the Securities Exchange act of 1934.
The Audit Committee reviews all audit related services, tax services and other services provided by the independent registered chartered accountants to the Company, at each quarterly meeting. In 2006, the Audit Committee approved 100% of the audit related services provided by the independent registered chartered accountants in 2006.
Not applicable.
The Company did not purchase any of its equity securities in 2006, nor were any such purchases made by or on behalf of any affiliated purchaser as defined in Rule 10b-18(a)(3) of the Securities Exchange Act of 1934.
Not applicable.
See Item 19 below for Financial Statements filed as a part of this Annual Report.
(a) Financial Statements
| 1. | Management’s Report |
| 2. | Management’s Report on Internal Control over Financial Reporting |
| 3. | Report of Independent Registered Chartered Accountants |
| 4. | Consolidated Balance Sheets |
| 5. | Consolidated Statements of Operations |
| 6. | Consolidated Statements of Shareholders’ Equity |
| 7. | Consolidated Statements of Cash Flows |
| 8. | Notes to Consolidated Financial Statements |
| 9. | Financial Statement Schedule |
52
(b) Exhibits
Exhibit Number | Exhibit |
| 3.1 | Restated Articles of Incorporation of Registrant. (1) |
| 3.2 | Amended Bylaws of Registrant. |
| 4.1 | Form of Common Stock Certificate. (1) |
| 10.1 | Directors Stock Option Plan. (2) |
| 10.2 | Employee Stock Option Plan with form of stock option agreement. (2) |
| 10.3 | Form of Indemnification Agreement to be entered into between Registrant and certain directors and officers. (1) |
| 10.4 | Employment Agreement dated July 1, 1997 between NovAtel Inc. and Werner Gartner. (3) |
| 10.5 | Lease Agreement (Building) dated January 29, 1999 between Christian Schumacher and NovAtel Inc. (4) |
| 10.6 | Agreement made effective July 20, 1999 between NovAtel Inc. and Sokkia Co., Ltd. (5) |
| 10.7 | License Agreement made effective August 1, 1999 between NovAtel Inc., Sokkia Co., Ltd. and Point, Inc. (5) |
| 10.8 | Amendment No. 1 to Point Agreement dated September 17, 2004. |
| 10.9 | Operating Loan Credit Facility Letter from HSBC Bank Canada made effective November 6, 2000. (6) |
| 10.10 | Amendment made effective August 1, 2006 to Operating Loan Credit Facility Letter from HSBC Bank Canada. |
| 10.11 | Employment Agreement dated April 5, 2004 between NovAtel Inc. and Jonathan W. Ladd. (8) |
| 10.12 | Operating Line of Credit Facility Letter from The Toronto Dominion Bank dated June 5, 2002. (7) |
| 10.13 | Employment Agreement dated November 20, 1996 between NovAtel Inc. and Patrick C. Fenton. (8) |
| *10.14 | Change of Control Agreement dated April 5, 2004 between NovAtel Inc. and Leica Geosystems A.G., CMC Electronics Inc., and Oncap L.P. (8) |
| 10.15 | 2004 Employee Long-term Incentive Plan. (9) |
| 21.1 | List of Subsidiaries. |
| 23.1 | Consent of Deloitte & Touche LLP, Independent Registered Chartered Accountants. |
| 31.1 | Section 302 Certification of Chief Executive Officer. |
| 31.2 | Section 302 Certification of Chief Financial Officer. |
| 32.1 | Section 906 Certification of Chief Executive Officer. |
| 32.2 | Section 906 Certification of Chief Financial Officer. |
(1) Incorporated by reference to Registrant’s registration statement on Form F-1 (Registration Statement No. 333-6088).
(2) Incorporated by reference to Registrant’s annual report on Form 20-F/A for the year ended December 31, 2005.
(3) Incorporated by reference to Registrant’s annual report on Form 20-F for the year ended December 31, 1997.
(4) Incorporated by reference to Registrant’s annual report on Form 20-F for the year ended December 31, 1998.
(5) Incorporated by reference to Registrant’s annual report on Form 20-F for the year ended December 31, 1999.
(6) Incorporated by reference to Registrant’s annual report on Form 20-F for the year ended December 31, 2000.
(7) Incorporated by reference to Registrant’s annual report on Form 20-F for the year ended December 31, 2002.
(8) Incorporated by reference to Registrant’s annual report on Form 20-F for the year ended December 31, 2003.
(9) Incorporated by reference to Registrant’s annual report on Form 20-F for the year ended December 31, 2004.
* Certain portions of this agreement have been omitted and filed separately with the Securities and Exchange Commission. Confidential treatment has been granted with respect to the omitted portions.
Copies of the Company’s SEC filings and the above exhibits are available for inspection and copying at the public reference facilities maintained by the SEC, 100 F Street N.E., Washington, D.C., 20549 or through the SEC’s website at www.sec.gov. You may also request copies of the above exhibits by contacting our investor relations department by telephone (403-295-4532) or by e-mail (ir@novatel.com).
53
SIGNATURES
The Registrant hereby certifies that it meets all of the requirements for filing on Form 20-F and that it has duly caused and authorized the undersigned to sign this annual report on its behalf.
NOVATEL INC.
By: /s/ Jonathan W. Ladd
Jonathan W. Ladd
President and Chief Executive Officer
Date: May 31, 2007
54
NOVATEL INC.
INDEX TO CONSOLIDATED FINANCIAL STATEMENTS
| Management’s Report | F-2 |
| Management’s Report on Internal Control over Financial Reporting | F-3 |
| Reports of Independent Registered Chartered Accountants | F-4 |
| Consolidated Balance Sheets | F-5 |
| Consolidated Statements of Operations | F-6 |
| Consolidated Statements of Shareholders’ Equity | F-7 |
| Consolidated Statements of Cash Flows | F-8 |
| Notes to Consolidated Financial Statements | F-9 |
F-1
MANAGEMENT’S REPORT
Management is responsible to the Board of Directors for the preparation of the Company’s consolidated financial statements. These financial statements have been prepared in accordance with generally accepted accounting principles in Canada and include certain amounts based on estimates and judgments. Management has determined such amounts on a reasonable basis to ensure that the consolidated financial statements are presented fairly, in all material respects. Financial information presented elsewhere in this Annual Report is consistent with that in the consolidated financial statements.
The Company maintains a system of internal controls which provides management with reasonable assurance that assets are safeguarded and that reliable financial records are maintained.
The independent registered chartered accountants, Deloitte & Touche LLP, have been appointed by the shareholders to express an opinion as to whether these consolidated financial statements present fairly the Company’s consolidated financial position and operating results in accordance with generally accepted accounting principles in Canada. Their report follows.
The Board of Directors has reviewed and approved these consolidated financial statements. To assist the Board in meeting its responsibility, it has appointed an Audit Committee, all of whose members are outside directors. The committee meets periodically with management and the independent registered chartered accountants to review internal controls, audit results and accounting principles and practices. The independent registered chartered accountants have full and free access to the Audit Committee.
/s/ Jonathan W. Ladd Jonathan W. Ladd President and Chief Executive Officer | /s/ Werner Gartner Werner Gartner Executive Vice President and Chief Financial Officer |
February 12, 2007
F-2
MANAGEMENT’S REPORT ON INTERNAL CONTROL OVER FINANCIAL REPORTING
Management is responsible for establishing and maintaining adequate internal control over financial reporting, as defined in Securities Exchange Act Rule 13a-15(f). The Company’s system of internal control is evaluated on a cost benefit basis and is designed to provide reasonable, not absolute, assurance that reported financial information is materially accurate.
Under the supervision and with the participation of Management, including the Company’s Chief Executive Officer and Chief Financial Officer, Management has conducted an evaluation of the design and effectiveness of the Company’s internal control over financial reporting based on the Internal Control - Integrated Framework issued by the Committee of Sponsoring Organizations (COSO). Based on this evaluation, Management concluded that the Company’s internal control over financial reporting was effective as of December 31, 2006.
F-3
REPORT OF INDEPENDENT REGISTERED CHARTERED ACCOUNTANTS
To the Board of Directors and Shareholders of NovAtel Inc.
We have audited the consolidated balance sheets of NovAtel Inc. as at December 31, 2006 and 2005, and the consolidated statements of operations, shareholders’ equity and cash flows for each of the years in the three-year period ended December 31, 2006. These financial statements are the responsibility of the Company’s management. Our responsibility is to express an opinion on these financial statements based on our audits.
We conducted our audits in accordance with Canadian generally accepted auditing standards and the standards of the Public Company Accounting Oversight Board (United States). Those standards require that we plan and perform an audit to obtain reasonable assurance whether the financial statements are free of material misstatement. An audit includes examining, on a test basis, evidence supporting the amounts and disclosures in the financial statements. An audit also includes assessing the accounting principles used and significant estimates made by management, as well as evaluating the overall financial statement presentation. We believe that our audits provide a reasonable basis for our opinion.
In our opinion, these consolidated financial statements present fairly, in all material respects, the financial position of NovAtel Inc. as at December 31, 2006 and 2005 and the results of its operations and its cash flows for each of the years in the three-year period ended December 31, 2006 in accordance with Canadian generally accepted accounting principles.
The Company is not required to have, nor were we engaged to perform, an audit of its internal control over financial reporting. Our audit included consideration of internal control over financial reporting as a basis for designing audit procedures that are appropriate in the circumstances, but not for the purpose of expressing an opinion on the effectiveness of the Company’s internal control over financial reporting. Accordingly we express no such opinion.
(signed) “Deloitte & Touche LLP”
Deloitte & Touche LLP
Independent Registered Chartered Accountants
Calgary, Alberta, Canada
February 9, 2007, except as to Note 9(c) which is as of March 21, 2007
COMMENTS BY INDEPENDENT REGISTERED CHARTERED ACCOUNTANTS
ON CANADA-UNITED STATES OF AMERICA REPORTING DIFFERENCES
The standards of the Public Company Accounting Oversight Board (United States) require the addition of an explanatory paragraph (following the opinion paragraph) when there are changes in accounting principles that have a material effect on the comparability of the Company’s financial statements or changes that have been implemented in the financial statements such as those described in Note 2 and Note 20 to the consolidated financial statements. Our report to the Board of Directors and Shareholders on the consolidated financial statements of NovAtel Inc., dated February 9, 2007, except as to Note 9(c) which is as of March 21, 2007, is expressed in accordance with Canadian reporting standards which do not require a reference to such changes in accounting principles in the auditors’ report when the change is properly accounted for and adequately disclosed in the financial statements.
(signed) “Deloitte & Touche LLP”
Deloitte & Touche LLP
Independent Registered Chartered Accountants
Calgary, Alberta, Canada
February 9, 2007, except as to Note 9(c) which is as of March 21, 2007
F-4
NOVATEL INC.
CONSOLIDATED BALANCE SHEETS
(in thousands, Canadian dollars)
December 31, | |||||||
ASSETS | 2006 | 2005 | |||||
| Current assets: | |||||||
| Cash and cash equivalents | $ | 3,853 | $ | 2,721 | |||
| Short-term investments (Note 8) (includes compensating balances of $4,158 at December 31, 2006 and December 31, 2005) | 45,454 | 32,363 | |||||
| Accounts receivable (Notes 3 and 12) | 13,697 | 10,694 | |||||
| Related party receivables (Note 15) | 920 | 1,331 | |||||
| Related party notes receivable (Note 15) | 378 | 1,552 | |||||
| Inventories (Note 4) | 8,075 | 5,436 | |||||
| Prepaid expenses and deposits | 578 | 599 | |||||
| Future income tax asset — current portion (Note 14) | 3,356 | 2,370 | |||||
| Total current assets | 76,311 | 57,066 | |||||
| Capital assets (Note 5) | 6,079 | 3,095 | |||||
| Intangible assets (Note 6) | 6,719 | 4,722 | |||||
| Goodwill (Note 18) | 1,494 | 1,494 | |||||
| Other assets | 816 | ― | |||||
| Deferred development costs (Note 7) | 1,253 | 1,657 | |||||
| Future income tax asset — long term portion (Note 14) | 4,296 | 3,221 | |||||
| Total assets | $ | 96,968 | $ | 71,255 | |||
LIABILITIES AND SHAREHOLDERS’ EQUITY | |||||||
| Current liabilities: | |||||||
| Accounts payable and accrued liabilities | $ | 12,336 | $ | 9,784 | |||
| Related party payables (Note 15) | 72 | 15 | |||||
| Notes payable (Note 16) | 541 | 1,552 | |||||
| Deferred revenue and customer deposits | 692 | 752 | |||||
| Provision for future warranty costs | 816 | 693 | |||||
| Total current liabilities | 14,457 | 12,796 | |||||
| Licence fee payable | 691 | ― | |||||
| Deferred gain on sale/leaseback of capital assets (Note 5) | 231 | 342 | |||||
| Total liabilities | 15,379 | 13,138 | |||||
| Commitments, contingencies and guarantees (Note 9) | |||||||
| Shareholders’ equity (Note 11): | |||||||
| Capital stock | |||||||
| (Common shares issued and outstanding: 8,529 at December 31, 2006 and 8,365 at December 31, 2005) | 40,953 | 39,667 | |||||
| Contributed surplus | 1,647 | 953 | |||||
| Retained earnings | 38,989 | 17,497 | |||||
| Total shareholders’ equity | 81,589 | 58,117 | |||||
| Total liabilities and shareholders’ equity | $ | 96,968 | $ | 71,255 | |||
The accompanying notes are an integral part of these consolidated financial statements.
F-5
NOVATEL INC.
CONSOLIDATED STATEMENTS OF OPERATIONS
(in thousands, except per share data, Canadian dollars)
Year Ended December 31, | ||||||||||
2006 | 2005 | 2004 | ||||||||
| Revenues (Notes 12 and 15) | ||||||||||
| Product sales | $ | 72,972 | $ | 59,306 | $ | 48,802 | ||||
| NRE fees | 4,662 | 3,989 | 5,130 | |||||||
| Total revenues | 77,634 | 63,295 | 53,932 | |||||||
| Cost of sales (Note 15) | ||||||||||
| Cost of product sales | 27,228 | 22,323 | 19,586 | |||||||
| Cost of NRE fees | 2,879 | 2,313 | 2,917 | |||||||
| Total cost of sales | 30,107 | 24,636 | 22,503 | |||||||
| Gross profit | 47,527 | 38,659 | 31,429 | |||||||
| Operating expenses: | ||||||||||
| Research and development | 13,450 | 10,882 | 9,588 | |||||||
| Selling and marketing | 7,692 | 6,387 | 5,751 | |||||||
| General and administration | 8,009 | 7,082 | 5,312 | |||||||
| Foreign exchange loss | 198 | 255 | 595 | |||||||
| Share offering costs (Note 13) | — | — | 754 | |||||||
| Total operating expenses | 29,349 | 24,606 | 22,000 | |||||||
| Operating income | 18,178 | 14,053 | 9,429 | |||||||
| Interest income, net | 1,680 | 787 | 313 | |||||||
| Other expense | (86 | ) | (72 | ) | (67 | ) | ||||
| Benefit of investment tax credits | — | 1,592 | 4,356 | |||||||
| Income from continuing operations before income taxes | 19,772 | 16,360 | 14,031 | |||||||
| Income taxes (Note 14) | ||||||||||
| Current provision | 341 | 2,046 | 2,328 | |||||||
| Future income tax expense (benefit) | (2,061 | ) | (2,402 | ) | (1,091 | ) | ||||
Total income tax expense (benefit) | (1,720 | ) | (356 | ) | 1,237 | |||||
| Net income from continuing operations | 21,492 | 16,716 | 12,794 | |||||||
Income from discontinued operations (Note 17) | — | — | 21 | |||||||
| Net income | $ | 21,492 | $ | 16,716 | $ | 12,815 | ||||
| Net income per share (basic) (Note 11) | ||||||||||
| Continuing operations | $ | 2.54 | $ | 2.01 | $ | 1.59 | ||||
| Discontinued operations | — | — | — | |||||||
| Net income per share (basic) | $ | 2.54 | $ | 2.01 | $ | 1.59 | ||||
| Weighted average shares outstanding (basic) | 8,450 | 8,298 | 8,063 | |||||||
| Net income per share (diluted) (Note 11) | ||||||||||
| Continuing operations | $ | 2.44 | $ | 1.91 | $ | 1.51 | ||||
| Discontinued operations | — | — | — | |||||||
| Net income per share (diluted) | $ | 2.44 | $ | 1.91 | $ | 1.51 | ||||
| Weighted average shares outstanding (diluted) | 8,825 | 8,763 | 8,500 | |||||||
The accompanying notes are an integral part of these consolidated financial statements.
F-6
NOVATEL INC.
CONSOLIDATED STATEMENTS OF SHAREHOLDERS’ EQUITY
(in thousands, Canadian dollars)
Common Shares (Note 11) | ||||||||||||||||
Number | Amount | Contributed Surplus | Retained Earnings (Deficit) | Total Shareholders’ Equity | ||||||||||||
| January 1, 2004 | 7,984 | $ | 37,012 | $ | 13 | $ | (11,578 | ) | $ | 25,447 | ||||||
| Change in accounting policy relating to stock-based compensation (Note 2(i)) | — | 66 | 390 | (456 | ) | — | ||||||||||
| Common shares issued pursuant to exercise of stock options (Note 11) | 276 | 1,792 | (287 | ) | — | 1,505 | ||||||||||
| Stock based compensation | — | — | 326 | — | 326 | |||||||||||
| Net income | — | — | — | 12,815 | 12,815 | |||||||||||
| December 31, 2004 | 8,260 | $ | 38,870 | $ | 442 | $ | 781 | $ | 40,093 | |||||||
| Common shares issued pursuant to exercise of stock options (Note 11) | 105 | $ | 797 | $ | (76 | ) | $ | — | $ | 721 | ||||||
| Stock based compensation | — | — | 587 | — | 587 | |||||||||||
| Net income | — | — | — | 16,716 | 16,716 | |||||||||||
| December 31, 2005 | 8,365 | $ | 39,667 | $ | 953 | $ | 17,497 | $ | 58,117 | |||||||
| Common shares issued pursuant to exercise of stock options (Note 11) | 166 | $ | 1,294 | $ | (253 | ) | $ | ― | $ | 1,041 | ||||||
| Repurchase of shares | (2 | ) | (8 | ) | (73 | ) | ― | (81 | ) | |||||||
| Stock-based compensation | ― | ― | 1,020 | ― | 1,020 | |||||||||||
| Net income | ― | ― | ― | 21,492 | 21,492 | |||||||||||
| December 31, 2006 | 8,529 | $ | 40,953 | $ | 1,647 | $ | 38,989 | $ | 81,589 | |||||||
The accompanying notes are an integral part of these consolidated financial statements.
F-7
NOVATEL INC.
CONSOLIDATED STATEMENTS OF CASH FLOWS
(in thousands of Canadian dollars) | ||||||||||
Year Ended December 31, | ||||||||||
2006 | 2005 | 2004 | ||||||||
| Operating activities: | ||||||||||
| Net income | $ | 21,492 | $ | 16,716 | $ | 12,815 | ||||
| Share offering costs (Note 13) | ― | — | 754 | |||||||
| Charges and credits to operations not involving an outlay of cash: | ||||||||||
| Amortization | 3,454 | 2,921 | 2,390 | |||||||
| Loss on disposal of capital assets | 31 | 19 | 19 | |||||||
| Current income tax provision and future income tax benefit | (2,003 | ) | (440 | ) | 1,167 | |||||
| Benefit of investment tax credits | ― | (1,592 | ) | (4,356 | ) | |||||
| Gain on liquidation of Mezure assets and liabilities (Note 17) | ― | — | (21 | ) | ||||||
| Stock based compensation expense | 2,064 | 934 | 941 | |||||||
| Amortization of deferred gain on sale/leaseback of capital assets | (111 | ) | (111 | ) | (114 | ) | ||||
| Accretion on royalty payable to CMC related to GPS OEM product line acquisition | ― | 17 | 54 | |||||||
| Net change in non-cash working capital related to operations: | ||||||||||
Increase in accounts receivable and related party receivables | (2,592 | ) | (694 | ) | (3,480 | ) | ||||
Increase in inventories | (2,639 | ) | (223 | ) | (409 | ) | ||||
Decrease (increase) in prepaid expenses and deposits | 21 | (309 | ) | 89 | ||||||
Increase (decrease) in accounts payable, accrued liabilities and related party payables | 475 | (125 | ) | 2,084 | ||||||
(Decrease) increase in deferred revenue | (60 | ) | (176 | ) | 443 | |||||
Increase in provision for future warranty costs | 123 | 155 | 128 | |||||||
| Increase in other assets | (816 | ) | — | — | ||||||
| Cash provided by operating activities | 19,439 | 17,092 | 12,504 | |||||||
| Financing activities: | ||||||||||
| Issuance of shares (Note 11) | 1,041 | 721 | 1,505 | |||||||
| Repurchase of shares (Note 11) | (81 | ) | — | — | ||||||
| Related party notes receivable | 1,169 | 55 | (11 | ) | ||||||
| Notes payable | (1,013 | ) | (55 | ) | 11 | |||||
| Equity financing of joint venture (Note 16) | 1,490 | ― | ― | |||||||
| Receipts (payments) related to share offering costs (Note 13) | ― | 57 | (807 | ) | ||||||
| Payment of capital lease obligations | ― | — | (100 | ) | ||||||
| Effect of exchange rate changes on financing activities | 7 | — | — | |||||||
| Cash provided by financing activities | 2,613 | 778 | 598 | |||||||
| Investing activities: | ||||||||||
| Purchase of capital and intangible assets | (6,374 | ) | (2,446 | ) | (2,293 | ) | ||||
| Proceeds from disposal of capital assets | 35 | 53 | 29 | |||||||
| Purchase of short-term investments | (51,772 | ) | (56,350 | ) | (17,720 | ) | ||||
| Proceeds from short-term investments | 38,681 | 38,397 | 13,865 | |||||||
| Acquisition of Waypoint Consulting Inc. (Note 18) | ― | (3,531 | ) | — | ||||||
| Investment in Point, Inc. (Note 16) | (1,490 | ) | — | — | ||||||
| Royalty payment relating to CMC Electronics’ OEM GPS business | ― | (221 | ) | (261 | ) | |||||
| Deferred development costs | ― | — | (218 | ) | ||||||
| Cash used in investing activities | (20,920 | ) | (24,098 | ) | (6,598 | ) | ||||
| Increase (decrease) in cash and cash equivalents | 1,132 | (6,228 | ) | 6,504 | ||||||
| Cash and cash equivalents beginning of year | 2,721 | 8,949 | 2,445 | |||||||
| Cash and cash equivalents, end of year | $ | 3,853 | $ | 2,721 | $ | 8,949 | ||||
| Interest paid related to bank advances and capital lease obligations | $ | ― | $ | ― | $ | 3 | ||||
| Income taxes paid | $ | 283 | $ | 91 | $ | 71 | ||||
| Cash and cash equivalents consist of: | ||||||||||
| Cash | $ | 614 | $ | 2,721 | $ | 1,221 | ||||
| Cash equivalents | 3,239 | — | 7,728 | |||||||
| Total | $ | 3,853 | $ | 2,721 | $ | 8,949 | ||||
The accompanying notes are an integral part of these consolidated financial statements.
F-8
NOTE 1 NATURE OF BUSINESS
NovAtel Inc. (“NovAtel” or the “Company”) is incorporated under the laws of Canada. The Company designs, markets and supports a broad range of products that determine precise geographic locations using the Global Positioning System (“GPS”) and other positioning technologies.
On July 20, 1999, the Company and Sokkia Co., Ltd. formed a joint venture, Point, Inc. to develop and distribute GPS based products for surveying, mapping, geographical information systems, construction and construction machine control applications, on a world-wide basis (see Note 16).
On April 17, 1998, CMC Electronics Inc. (“CMC Electronics”) acquired 58.3% of the Company’s outstanding common shares from the Company’s two former principal shareholders (see Note 14). On April 11, 2001, an investor group led by ONCAP L.P. (“ONCAP”) acquired control of the Company through the acquisition of CMC Electronics (see Note 14). From January 2005 through August 2005, CMC Electronics sold approximately 4.5 million common shares through open market transactions, reducing its ownership of the Company from approximately 55% to 0%.
On October 1, 2005 the Company acquired Waypoint Consulting Inc. (“Waypoint”) for approximately $3.5 million in cash, subject to post-closing adjustments to working capital. Waypoint’s products include specialized real-time and post-processing GPS and GPS/inertial positioning and trajectory software (see Note 18).
NOTE 2 SIGNIFICANT ACCOUNTING POLICIES
The consolidated financial statements have been prepared by management in accordance with generally accepted accounting principles in Canada and are stated in Canadian dollars. The material differences between Canadian and United States (U.S.) generally accepted accounting principles are described in Note 20. The preparation of financial statements in accordance with generally accepted accounting principles requires management to make estimates and assumptions that affect the reported amounts of assets and liabilities and the disclosure of contingent assets and liabilities at the date of the financial statements, and revenues and expenses during the reporting period. Actual results could differ from those estimated. Estimates are used when accounting for items and matters such as revenue recognition, allowance for uncollectible accounts, inventory obsolescence, product warranty, amortization, impairment assessments, taxes and related valuation allowance, stock-based compensation and contingencies.
a) Principles of Consolidation
The consolidated financial statements include the accounts of the Company, its continuing subsidiaries and its proportionate 49% joint venture interest in Point, Inc.
b) Foreign Currency Translation
Foreign subsidiaries and Point, Inc. are considered financially and operationally dependent on the Company and are translated into Canadian dollars using current rates of exchange for monetary assets and liabilities, historical rates of exchange for non-monetary assets and liabilities, and average rates for the period for revenues and expenses, except amortization and cost of sales, which are translated at the rate of exchange applicable to the related assets. Gains and losses resulting from these translation adjustments are included in operating income.
Transactions and monetary balances denominated in a currency other than the Canadian dollar are translated into Canadian dollars using yearly average and year-end exchange rates, respectively. Gains and losses arising from this translation process are included in operating income.
c) Cash and Cash Equivalents, Short Term Investments
Cash and cash equivalents include highly liquid investments which have original maturities of 90 days or less. Short-term investments include highly liquid investments which have original maturities of 91 days to 12 months at the time of purchase.
d) Inventories
Raw materials and components, work-in-progress, and finished goods inventories are recorded at the lower of cost or net realizable value. Cost is determined on a first-in, first-out basis and includes materials, labour and manufacturing overhead.
e) Capital Assets, Intangible Assets and Amortization
Capital assets are recorded at cost. Maintenance and repair costs of a routine nature are charged to operations as incurred, and renewals and betterments that extend the economic useful life of an asset are capitalized.
F-9
Capital assets and intangible assets are amortized on a straight-line basis using the expected useful lives of the assets:
| Computer and ancillary equipment | 4 years |
| Research and development equipment | 4 years |
| Production equipment | 5 years |
| Automobiles | 5 years |
| Leasehold improvements | Shorter of useful life or the term of leases |
| Furniture and fixtures | 10 years |
| Product tooling | 2 - 4 years |
| Patents and trademarks | 10 years |
| Technology | 4 - 10 years |
| Software licenses | 4 years |
| Market presence of CMC Electronics OEM GPS and Waypoint product lines | 4 - 8.5 years |
Capital assets and intangible assets are assessed for future recoverability or impairment by estimating future net undiscounted cash flows and residual values. When impairment has occurred, a loss is recognized in the period. When the carrying value of a long-lived asset is greater than its net recoverable amount as determined on an estimated undiscounted cash flow basis, an impairment loss is recognized to the extent that its fair value, measured as the discounted cash flows over the life of the asset when quoted market prices are not readily available, is below the asset’s carrying value.
f) Revenue Recognition
The Company recognizes product revenue when persuasive evidence of an arrangement exists, delivery has occurred, the fee is fixed or determinable and collectibility is reasonably assured. Revenues from non-recurring engineering (“NRE”) fees are recognized at the time services are rendered. On long-term contracts, in which the customer pays established rates for time and materials, revenue is recognized as services are rendered and costs are incurred. On certain long-term contracts, revenue is recognized using the proportional performance method relative to customer milestones achieved. Revisions in cost and profit estimates during the course of work are reflected in the period in which the need for revision becomes known. Losses, if any, are recognized fully when first anticipated. Some contracts contain penalty provisions based on performance relative to established targets. Such penalties are included in revenue or cost estimates when amounts can be reasonably determined.
The Company applies American Institute of Certified Public Accountants Statement of Position 97-2, “Software Revenue Recognition”, to product sales where software is considered more than incidental. For software arrangements involving multiple elements, the Company allocates revenue to each element based on the relative fair value or the residual method, as applicable, and using vendor specific objective evidence of fair values, which is based on prices charged when the element is sold separately. Software revenue is recognized when persuasive evidence of an arrangement exists, the software is delivered in accordance with all terms and conditions of the customer contracts, the fee is fixed or determinable and collection is reasonably assured. Revenue related to post-contract support (“PCS”), including technical support and unspecified when-and-if available software upgrades, is recognized ratably over the PCS term.
For contracts involving multiple deliverables, where the deliverables are governed by more than one authoritative accounting standard, the Company applies the Emerging Issues Committee 142, ‘‘Revenue Arrangements with Multiple Deliverables’’ (‘‘EIC-142’’), and evaluates each deliverable to determine whether it represents a separate unit of accounting based on the following criteria: (a) whether the delivered item has value to the customer on a standalone basis, (b) whether there is objective and reliable evidence of the fair value of the undelivered item(s), and (c) if the contract includes a general right of return relative to the delivered item, delivery or performance of the undelivered item(s) is considered probable and substantially in the control of the Company. If objective and reliable evidence of fair value exists for all units of accounting in the arrangement, revenue is allocated to each unit of accounting or element based on relative fair values. In situations where there is objective and reliable evidence of fair value for all undelivered elements, but not for delivered elements, the residual method is used to allocate the contract consideration. Under the residual method, the amount of revenue allocated to delivered elements equals the total arrangement consideration less the aggregate fair value of any undelivered elements. Each unit of accounting is then accounted for under the applicable revenue recognition guidance. So long as elements otherwise governed by separate authoritative accounting standards cannot be treated as separate units of accounting under the guidance in EIC-142 the elements are combined into a single unit of accounting for revenue recognition purposes. In this case, revenue allocated to the unit of accounting is deferred until all combined elements have been delivered or, once there is only one remaining element to be delivered, based on the revenue recognition guidance applicable to the last delivered element within the unit of accounting.
F-10
g) Research and Development Costs
Research costs are charged to operations as incurred. Development costs, including software development costs, are charged to operations as incurred unless they meet specific criteria related to technical, market and financial feasibility. In these circumstances, the costs are deferred and amortized on a systematic basis, using a method similar to the unit-of-production method of amortization, subject to an estimate of recoverability.
h) Provision for Future Warranty Costs
Warranty costs are accrued, to the extent that they are not recoverable from third party manufacturers, for the estimated cost to repair products for the balance of the warranty periods.
i) Stock-based Compensation Plans
The Company has stock-based compensation plans (see Note 11 and Note 19). Effective January 1, 2004, the Company adopted the fair value method of accounting for stock options awarded to employees on or after January 1, 2002 as required by amended CICA Handbook Section 3870 “Stock-Based Compensation and Other Stock-Based Payments”. As permitted by the transitional provisions of Section 3870, the change was adopted retroactively without restatement. Under Section 3870, the fair value of stock options is recognized over the applicable vesting period as stock-based compensation expense and a credit to contributed surplus. When options are exercised, the proceeds are credited to share capital, and the applicable fair value is reclassified from contributed surplus to share capital. Retroactive application of Section 3870 resulted in the January 1, 2004 opening balances of deficit, contributed surplus and share capital being increased by $456, $390 and $66, respectively, as though the fair value method had been applied since January 1, 2002.
j) Hedging Relationships
Effective January 1, 2004, the Company adopted Accounting Guideline 13, “Hedging Relationships.” The guideline establishes conditions where hedge accounting may be applied. Where hedge accounting does not apply, any changes in the fair values of the financial contracts are taken into income in the period of change. The Company enters into forward foreign currency contracts to reduce its exposure to fluctuations in the exchange rates between the Canadian dollar and the U.S. dollar and Euro. Certain of the contracts entered into qualify as hedges under the accounting guideline and the Company applies hedge accounting to those financial instruments. Effective July 18, 2006, the Company has discontinued the designation of new foreign currency contracts as hedges against forecasted transactions. Any gains or losses relating to these contracts have been recorded in the consolidated statement of operations for the twelve months ended December 31, 2006.
k) Impairment of Long-Lived Assets
The Company reviews both long-lived assets to be held and used and identifiable intangible assets with finite lives whenever events or changes in circumstances indicate that the carrying amount of such assets may not be fully recoverable. Determination of recoverability is based on an estimate of undiscounted future cash flows resulting from the use of the asset and its eventual disposition. Measurement of an impairment loss for long-lived assets and certain identifiable intangible assets that management expects to hold and use is based on the fair value of the assets, whereas such assets to be disposed of are reported at the lower of carrying amount or fair value less costs to sell. As at December 31, 2006, the Company determined that there were no triggering events requiring impairment analysis.
Goodwill impairment is assessed at the reporting unit level at least annually, or more frequently if events or circumstances indicate there may be impairment. Potential impairment is identified when the carrying value of a reporting unit, including the allocated goodwill, exceeds its fair value. Goodwill impairment is measured as the excess of the carrying amount of the reporting unit’s allocated goodwill over the implied fair value of the goodwill, based on the fair value of the assets and liabilities of the reporting unit. The fair values are estimated using accepted valuation methodologies such as discounted future net cash flows, earnings multiples or prices for similar assets, whichever is most appropriate under the circumstances.
l) Asset retirement obligations
In April 2006, the Company adopted Emerging Issues Committee Abstract No. 159, “Conditional Asset Retirement Obligations” (“EIC”-159”). EIC-159 clarifies the accounting treatment for a legal obligation to perform an asset retirement activity in which the timing and/or method of settlement are conditional on a future event that may or may not be within the control of the entity. Under this EIC, an entity is required to recognize a liability for the fair value of a conditional asset retirement obligation if the fair value of the liability can be reasonably estimated. The implementation of EIC-159 did not have a material impact on the Company’s consolidated financial statements.
F-11
m) Variable Interest Entities
Effective January 1, 2006, the Company adopted Emerging Issues Committee Abstract No. 157 “Implicit Variable Interests Under AcG 15” (“EIC-157”). EIC-157 addresses whether a company has an implicit variable interest in a variable interest entity (“VIE”) or potential VIE when specific conditions exist. An implicit variable interest acts the same as an explicit variable interest except it involves the absorbing and/or receiving of variability indirectly from the entity (rather than directly). The identification of an implicit variable interest is a matter of judgment that depends on the relevant facts and circumstances. The implementation of EIC-157 did not have a material impact on the Company’s consolidated financial statements.
n) Income Taxes
The Company follows the liability method of accounting for income taxes. Under this method, current income taxes are recognized for the estimated income taxes payable for the current year. Future income tax assets and liabilities are recognized for temporary differences between the tax and accounting bases of assets and liabilities as well as for the benefit of losses available to be carried forward to future years for tax purposes that are more likely than not to be realized. In establishing the appropriate income tax valuation allowances, the Company assesses the realizability of its net future income tax assets and based on all available evidence, both positive and negative, determines whether it is more likely than not that the remaining net future income tax assets or a portion thereof will be realized (see Note 14).
o) Investment Tax Credits
Investment tax credits relating to scientific research and development and capital expenditures are accounted for using the cost reduction method and are recognized once there is reasonable assurance that the Company will be able to realize the benefit from these credits.
p) Non-Monetary Transactions
Effective January 1, 2006, the Company adopted the accounting standards of Section 3831 of the CICA Handbook, “Non-Monetary Transactions” (“Section 3831”). Section 3831 replaced Section 3830 of the same title. The new accounting standard requires all non-monetary transactions be measured at fair value unless certain conditions are satisfied. The new requirements are effective for non-monetary transactions initiated in periods beginning on or after January 1, 2006. The adoption of Section 3831 did not have a material impact on the Company’s consolidated financial statements.
q) Earnings per Share
Basic earnings per share is calculated by dividing the net earnings available to common shareholders by the weighted average number of common shares outstanding. Diluted earnings per share reflects the potential dilution that would occur if stock options were exercised. The treasury stock method is used in calculating diluted earnings per share, which assumes that any proceeds received from the exercise of in-the-money stock options, including those not currently exercisable, would be used to purchase common shares at the average market price for the period.
NOTE 3 ACCOUNTS RECEIVABLE
December 31, 2006 | December 31, 2005 | ||||||
| Trade receivables, net | $ | 12,192 | $ | 9,840 | |||
| Interest receivable | 901 | 231 | |||||
| Goods and Services Tax receivable | 318 | 218 | |||||
| Other | 286 | 405 | |||||
| $ | 13,697 | $ | 10,694 | ||||
The receivable balances are net of an allowance for doubtful accounts and sales returns of $1,024 at December 31, 2006 and $1,080 at December 31, 2005.
NOTE 4 INVENTORIES
December 31, 2006 | December 31, 2005 | ||||||
| Raw materials and components, net | $ | 3,626 | $ | 2,378 | |||
| Work-in-progress | 1,052 | 552 | |||||
| Finished goods, net | 3,397 | 2,506 | |||||
| $ | 8,075 | $ | 5,436 | ||||
The inventory balances are net of a provision for excess and obsolete inventory of $1,320 at December 31, 2006 and $1,546 at December 31, 2005.
F-12
NOTE 5 CAPITAL ASSETS
December 31, 2006 | December 31, 2005 | ||||||||||||||||||
Cost | Accumulated Amortization | Net | Cost | Accumulated Amortization | Net | ||||||||||||||
| Computer and ancillary equipment | $ | 3,364 | $ | 2,065 | $ | 1,299 | $ | 2,797 | $ | 1,689 | $ | 1,108 | |||||||
| Production, research and development equipment | 5,153 | 3,596 | 1,557 | 4,105 | 3,021 | 1,084 | |||||||||||||
| Automobiles | 26 | 14 | 12 | 26 | 9 | 17 | |||||||||||||
| Leasehold improvements | 2,239 | 199 | 2,040 | 201 | 121 | 80 | |||||||||||||
| Furniture and fixtures | 2,363 | 1,670 | 693 | 1,770 | 1,491 | 279 | |||||||||||||
| Product tooling | 1,630 | 1,152 | 478 | 1,445 | 919 | 526 | |||||||||||||
| Equipment under capital lease | 3 | 3 | ― | 3 | 2 | 1 | |||||||||||||
| $ | 14,778 | $ | 8,699 | $ | 6,079 | $ | 10,347 | $ | 7,252 | $ | 3,095 | ||||||||
On January 29, 1999, the Company concluded a sale/leaseback arrangement by which the Calgary facility, including certain adjacent land, with a carrying value of $5,812 at time of sale, was sold for net proceeds of $6,922, resulting in a gain of $1,110. The gain on the sale of the facility has been deferred and is being amortized on a straight-line basis over the ten year term of the lease.
NOTE 6 INTANGIBLE ASSETS
Intangible assets subject to amortization are as set out below:
December 31, 2006 | December 31, 2005 | ||||||||||||||||||
Cost | Accumulated Amortization | Net | Cost | Accumulated Amortization | Net | ||||||||||||||
| Patents and trademarks | $ | 4,690 | $ | 3,238 | $ | 1,452 | $ | 4,262 | $ | 2,860 | $ | 1,402 | |||||||
| Technology | 5,845 | 2,517 | 3,328 | 3,670 | 2,254 | 1,416 | |||||||||||||
| Software licences | 4,195 | 2,775 | 1,420 | 3,691 | 2,458 | 1,233 | |||||||||||||
Market presence of CMC Electronics’ OEM GPS and Waypoint’s product lines | 906 | 387 | 519 | 906 | 235 | 671 | |||||||||||||
| Total intangibles | $ | 15,636 | $ | 8,917 | $ | 6,719 | $ | 12,529 | $ | 7,807 | $ | 4,722 | |||||||
For the years ended December 31, 2006, 2005 and 2004, amortization expense of intangibles was $1,320, $941, and $757 respectively. The weighted-average amortization period is 7 years.
The estimated aggregate amortization expense for intangible assets for the years ending on December 31 is as follows:
| 2007 | $ | 1,347 | ||
| 2008 | $ | 1,262 | ||
| 2009 | $ | 1,087 | ||
| 2010 | $ | 881 | ||
| 2011 | $ | 696 |
NOTE 7 DEFERRED DEVELOPMENT COSTS
December 31, 2006 | December 31, 2005 | ||||||
| Deferred development costs | $ | 2,900 | $ | 2,900 | |||
| Accumulated amortization | (1,647 | ) | (1,243 | ) | |||
| $ | 1,253 | $ | 1,657 | ||||
The Company has deferred certain costs related to the development of a certified aviation GPS receiver. The Company amortizes these deferred costs using a method similar to the unit-of-production method of amortization. The following table discloses the development costs which have been deferred and the amortization of deferred development costs:
F-13
Year Ended December 31, | ||||||||||
2006 | 2005 | 2004 | ||||||||
| Deferred development costs | $ | — | $ | — | $ | 218 | ||||
| Amortization of deferred development costs | $ | 404 | $ | 538 | $ | 416 | ||||
At December 31, 2006, the Company had deferred $1,253 of development costs, net of accumulated amortization. The continued deferral of these costs is subject to recoverability based on estimates of future sales of the certified aviation GPS receiver. On April 5, 2004, the Company and CMC Electronics entered into a Strategic Cooperation Agreement which inter alia provides for certain guaranteed future payments over the following four years. Under the current business programs between the Company and CMC Electronics, the Company would expect these future guaranteed payments to recover approximately 44% of the $1,253 of deferred development costs as of December 31, 2006. Should future actual or estimated sales of this receiver be materially lower than that currently estimated, a portion of the deferred development costs would be charged to results of operations.
NOTE 8 BANK ADVANCES
At December 31, 2006, lines of credit were available with certain Canadian financial institutions. The lines of credit are payable on demand and are secured by $4,158 of short-term investments held as compensating balances. The credit line advances bear interest at the financial institutions’ prime rate (December 31, 2006 — 6.0%) on Canadian dollar advances.
In aggregate, the Company can borrow up to $1,650 for day-to-day operating requirements and $3,850 to support the margin requirements related to the purchase of up to between U.S. $ $17,000 and $18,000 of forward foreign exchange contracts (depending on the maturity date of the contracts). At December 31, 2006, portions of the lines of credit were utilized to support approximately U.S. $ 14,000 of foreign exchange contracts ($8,500 at December 31, 2005) leaving $1,650 available for day-to-day operating requirements and the margin capacity available to enter into approximately U.S. $3,000 to $4,000 in forward foreign exchange contracts (depending on the maturity date of the contracts).
NOTE 9 COMMITMENTS, CONTINGENCIES AND GUARANTEES
a) At December 31, 2006, purchase commitments were outstanding for approximately $11.0 million pertaining primarily to the acquisition of inventory, supplies and services in the normal course of business.
b) The Company’s facilities and certain equipment are leased for various periods up to 2016. Payments under the leasing arrangements are estimated to be as follows:
Operating Leases | ||||
| 2007 | $ | 1,391 | ||
| 2008 | 1,364 | |||
| 2009 | 1,442 | |||
| 2010 | 1,325 | |||
| 2011 | 1,391 | |||
| 2012 and beyond | 7,108 | |||
| Total future minimum lease payments | $ | 14,021 | ||
The Company’s rent expense associated with its facilities was $1,032 in 2006, $883 in 2005, and $910 in 2004.
c) The Company is subject to legal proceedings and other claims which arise in the ordinary course of its business. The Company has sought legal advice on these matters. In the opinion of management, the ultimate liability with respect to the resolution of these actions is not expected to materially affect the financial position, results of operations, or liquidity of the Company.
On July 6, 2006, the Company received notice that a Statement of Claim had been filed in the Province of Alberta alleging a breach of confidential information and a non-disclosure agreement by the Company and its Chief Technology Officer relating to the development of certain technology and an associated U.S. patent application for the seismic industry. The Company has sought legal advice on this matter and believes that the claim is without merit. The Company has defended the action and on December 29, 2006, the Statement of Claim was dismissed by the provincial court. On January 2, 2007, the plaintiff in this matter filed a Notice of Appeal of the dismissal judgment. The dismissal judgment was overturned by the appellate court on March 21, 2007. In the opinion of management, the ultimate liability with respect to this matter is not expected to materially affect the financial position or results of operations.
d) In the normal course of operations, the Company provides indemnifications that are often standard contractual terms to counterparties in transactions such as purchase and sale contracts and service agreements. These indemnification agreements may require the Company to compensate the counterparties for costs incurred as a result of various events, changes in (or in the interpretation of) laws and regulations, or as a result of litigation claims or statutory sanctions that may be suffered by the counterparty as a consequence of the transaction. The terms of these indemnification agreements will vary based upon the contract, the nature of which prevents the Company from making a reasonable estimate of the maximum potential amount it could be required to pay counterparties. Historically, the Company has not made any payments under such indemnifications and no amounts have been accrued in the accompanying consolidated financial statements.
F-14
NOTE 10 FINANCIAL INSTRUMENTS
In the normal course of business, the Company uses forward foreign currency contracts to reduce its exposure to fluctuations in the exchange rates between the Canadian dollar and the U.S. dollar and the Euro. Where hedge accounting applies, the Company documents the relationship between hedging instruments and hedged items, as well as its risk management objective for undertaking hedging transactions. The process includes linking hedging instruments to assets and liabilities on the balance sheet or to forecasted transactions. The Company also assesses, both at the hedge’s inception and on an ongoing basis, whether the foreign currency contracts that are used in hedging transactions are effective in offsetting changes in fair values or cash flows of hedged items. The contracts are normally for terms of up to twelve months and are used as hedges of a portion of the Company’s U.S. dollar and Euro denominated revenues.
Effective July 18, 2006, the Company has discontinued the designation of new forward foreign currency contracts as hedges against forecasted transactions. Any gains or losses relating to these contracts have been recorded in the consolidated statement of operations for the year ended December 31, 2006.
At December 31, 2006, the Company had forward currency contracts to sell U.S. $13,500 between January 30, 2007 and September 28, 2007 at rates between $0.8715 and $0.9132 U.S. dollar per Canadian dollar. In addition, the Company had forward foreign currency contracts to sell €555 between June 29, 2007 and September 28, 2007 at rates between €0.6498 and €0.6965 per Canadian dollar.
The carrying values of other financial instruments, which include cash and cash equivalents, short-term investments, accounts receivable, related party receivables and advances, related party notes receivable, accounts payable and accrued liabilities, related party payables and notes payable approximate their fair value because of the near-term maturity of these instruments.
NOTE 11 SHAREHOLDERS’ EQUITY
The Company has authorized an unlimited number of common shares and first preference shares, of which 8,529 common shares are outstanding as of December 31, 2006 (8,365 in 2005 and 8,260 in 2004).
Net income per share figures presented in the Company’s financial statements are based upon the weighted average number of shares outstanding. Diluted net income per share figures are computed as if the dilutive instruments were exercised at the beginning of the period (or the time of issuance, if later) and the funds obtained were used to purchase common shares at the average market price during the period.
The Company maintains stock option plans for employees and members of the Board of Directors. Under the plans, participants are granted options to purchase common shares at no less than the market value on the date of the grant. The options have vesting periods ranging from one to four years and expire between five and ten years from the date of the grant.
A summary of the status of the Company’s stock option plans as of December 31, 2006, 2005 and 2004, and changes during the years ending on those dates is presented below:
2006 | 2005 | 2004 | |||||||||||||||||
Number of Options | Weighted- Average Exercise Price | Number of Options | Weighted- Average Exercise Price | Number of Options | Weighted- Average Exercise Price | ||||||||||||||
Options | |||||||||||||||||||
| Outstanding at beginning of year | 584 | U.S. $ 7.46 | 574 | U.S. $4.51 | 855 | U.S. $4.42 | |||||||||||||
| Granted | 153 | 39.47 | 118 | 20.28 | 5 | 11.81 | |||||||||||||
| Exercised | (165 | ) | 5.58 | (105 | ) | 5.73 | (276 | ) | 4.41 | ||||||||||
| Forfeited | (5 | ) | 28.99 | (3 | ) | 8.67 | (10 | ) | 2.28 | ||||||||||
| Outstanding at end of year | 567 | U.S. $16.47 | 584 | U.S. $7.46 | 574 | U.S. $4.51 | |||||||||||||
| Options exercisable at end of year | 289 | U.S $ 5.81 | 330 | U.S. $4.94 | 313 | U.S. $6.24 | |||||||||||||
F-15
The following table summarizes information about the stock option plans as of December 31, 2006:
Options Outstanding | Options Exercisable | |||||||||||||||
Range of Exercise Prices | Number Outstanding | Weighted- Average Remaining Contractual Life | Weighted- Average Exercise Price | Number Exercisable | Weighted- Average Exercise Price | |||||||||||
| U.S. $32.50 to $44.36 | 157 | 4.3 | U.S $39.19 | 6 | U.S $32.50 | |||||||||||
| $13.16 to $19.61 | 105 | 3.4 | 19.53 | 22 | 19.61 | |||||||||||
| $7.50 to $11.25 | 76 | 0.8 | 8.15 | 75 | 8.13 | |||||||||||
| $4.00 to $4.94 | 2 | 6.3 | 4.67 | 2 | 4.57 | |||||||||||
| $2.25 to $3.44 | 202 | 5.6 | 2.35 | 159 | 2.38 | |||||||||||
| $1.38 to $2.00 | 25 | 3.8 | 1.64 | 25 | 1.64 | |||||||||||
| U.S. $1.38 to $44.36 | 567 | 4.1 | U.S. $16.47 | 289 | U.S $5.81 | |||||||||||
The aggregate intrinsic value of options outstanding and options exercisable at December 31, 2006 was U.S. $13,279 and U.S. $9,848, respectively. The total intrinsic value of options exercised during the year ended December 31, 2006 was U.S. $5,387.
A summary of the Company’s unvested options as at December 31, 2006, and changes during the twelve month period then ended, is presented below.
Options | Number of Options | Weighted Average Fair Value | |||||
| Outstanding at January 1, 2006 | 254 | U.S. $5.71 | |||||
| Granted | 153 | 14.91 | |||||
| Vested | (124 | ) | 4.62 | ||||
| Forfeited | (5 | ) | 11.50 | ||||
| Outstanding at December 31, 2006 | 278 | U.S. $11.16 | |||||
In 2006, the Company granted 153 stock options to purchase common shares of the Company, of which 147 were granted to employees and 6 were granted to directors. The options have a weighted average exercise price of U.S. $ 39.47, and expire five years from the date of grant. The employee options vest over four years, while the directors’ options vest one year from the date of grant.
The following table represents the potential dilutive effect of options which have been issued, and could be exercised by the option holder.
Year Ended December 31, | ||||||||||
Number of Common Shares | 2006 | 2005 | 2004 | |||||||
| Weighted average common shares outstanding (basic) | 8,450 | 8,298 | 8,063 | |||||||
| Dilutive effect of options | 375 | 465 | 437 | |||||||
| Weighted average common shares outstanding (diluted) | 8,825 | 8,763 | 8,500 | |||||||
In the years ended December 31, 2006, 2005 and 2004, there were 88, 6, and nil options, respectively, excluded from the calculation, due to an anti-dilutive effect as a result of the exercise price being higher than the market price of the stock in the period.
NOTE 12 MAJOR CUSTOMERS, EXPORT SALES AND SUPPLIERS
Certain major customers accounted for significant portions of the sales from continuing operations. The table below reflects customers whose purchases represented more than 10% of the Company’s total revenues in any of the periods indicated.
Year Ended December 31, | ||||||||||
Sales by Major Customer | 2006 | 2005 | 2004 | |||||||
| Customer A | $ | 18,174 | $ | 11,211 | $ | 8,631 | ||||
| Customer B | 9,946 | 6,554 | 5,684 | |||||||
| Customer C | 6,964 | 6,736 | 4,157 | |||||||
| $ | 35,084 | $ | 24,501 | $ | 18,472 | |||||
| Percentage of total revenue | 45 | % | 39 | % | 34 | % | ||||
F-16
Accounts receivable and related party receivables related to these major customers were $5,702 at December 31, 2006 and $3,540 at December 31, 2005.
Year Ended December 31, | |||||||||||||||||||
Sales by Geographic Market | 2006 | 2005 | 2004 | ||||||||||||||||
| U.S.A. | $ | 29,302 | 38% | $ | 25,671 | 41% | $ | 25,105 | 46% | ||||||||||
| Europe | 28,461 | 37% | 17,924 | 28% | 13,852 | 26% | |||||||||||||
| Asia/Australia | 13,047 | 17% | 13,530 | 21% | �� | 10,331 | 19% | ||||||||||||
| Canada | 4,748 | 6% | 4,462 | 7% | 3,044 | 6% | |||||||||||||
| Other | 2,076 | 2% | 1,708 | 3% | 1,600 | 3% | |||||||||||||
| $ | 77,634 | 100% | $ | 63,295 | 100% | $ | 53,932 | 100% | |||||||||||
Certain of the Company’s products incorporate components that are either procured from sole source suppliers or which are in short supply. In the opinion of management, the Company has taken measures to mitigate the risk associated with the availability of these components.
NOTE 13 SHARE OFFERING COSTS
In the year ended December 31, 2004, the Company incurred $754 of expenses in relation to a proposed public offering in Canada and a private placement in the U.S. of its common shares. On May 26, 2004, the Company withdrew the offering and expensed the costs.
NOTE 14 INCOME TAXES
The Company follows the liability method of accounting for income taxes. Temporary differences that give rise to future income tax assets and liabilities as of December 31 are as follows:
2006 | 2005 | ||||||
| Future income tax assets | |||||||
| Loss carryforwards | $ | 1,420 | $ | 1,730 | |||
| Scientific research deductions and credits | 36,370 | 46,110 | |||||
| Reserves not currently deductible for tax | 1,130 | 1,710 | |||||
| Capital assets | 560 | 970 | |||||
| Capital losses | 130 | 150 | |||||
| Deferred gain on sale of building | 70 | 120 | |||||
| Deferred loss on hedging contracts | 60 | ― | |||||
| 39,740 | 50,790 | ||||||
| Future income tax liabilities | |||||||
| Intangible assets | (670 | ) | (400 | ) | |||
| Deferred development costs | (380 | ) | (560 | ) | |||
| Deferred gain on hedging contracts | ― | (50 | ) | ||||
| (1,050 | ) | (1,010 | ) | ||||
| Valuation allowance | (31,038 | ) | (44,189 | ) | |||
| $ | 7,652 | $ | 5,591 | ||||
| Future income tax asset — current portion | 3,356 | 2,370 | |||||
| Future income tax asset — long term portion | 4,296 | 3,221 | |||||
| $ | 7,652 | $ | 5,591 | ||||
As at December 31, 2006, the Company’s net future income tax assets were $7,652, reflecting temporary differences between the financial reporting and tax treatment of certain current assets and liabilities and non-current assets and liabilities, in addition to the tax benefit of net operating and capital loss carryforwards and tax credit carryforwards.
In accordance with the CICA Handbook Section 3465, “Accounting for Income Taxes”, the Company reviews all available positive and negative evidence to evaluate the recoverability of the future income tax assets. This includes a review of such evidence as the carryforward periods of the significant tax assets, the Company’s history of generating taxable income in its material tax jurisdictions and the Company’s forecasted profitability in the foreseeable future. Based on this review the Company concluded that the valuation allowance as at December 31, 2006 was appropriate and determined that it was more likely than not that the recorded future income tax assets would be realized.
F-17
The following table reconciles the differences between the income tax that would result solely by applying statutory rates and the income tax provided for in the statements of operations.
Year Ended December 31, | |||||||||||||||||||
2006 | 2005 | 2004 | |||||||||||||||||
| Income from continuing operations before income taxes | $ | 19,772 | $ | 16,360 | $ | 14,031 | |||||||||||||
| Statutory income tax expense | $ | 6,426 | 32.5% | $ | 5,500 | 33.6% | $ | 4,752 | 33.9% | ||||||||||
| Adjusted for the effects of: | |||||||||||||||||||
| Change in valuation allowance on tax benefit | (13,151 | ) | (6,172 | ) | (5,339 | ) | |||||||||||||
| Change in tax rates on future tax benefit | 4,675 | — | 1,604 | ||||||||||||||||
| Non deductible expenses and costs | 447 | 258 | 166 | ||||||||||||||||
| Other | (96 | ) | 46 | (17 | ) | ||||||||||||||
| Large corporation tax (recovery) | (21 | ) | 12 | 71 | |||||||||||||||
| Total income tax expense (benefit) | $ | (1,720 | ) | (8.7%) | $ | (356 | ) | (2.2%) | $ | 1,237 | 8.8% | ||||||||
a) Canadian Income Taxes
At December 31, 2006, the Company has approximately $119 million of research and development costs deducted in the accounts, in excess of amounts claimed for Canadian federal income tax purposes and approximately $101 million of research and development costs deducted in the accounts, in excess of amounts claimed for provincial income tax purposes. These expenditures have an indefinite life for tax purposes.
At December 31, 2006, the Company also has unutilized investment tax credits of approximately $3.5 million available to reduce future Canadian federal income taxes. These credits expire as follows:
| 2013 | $ | 600 | ||
| 2014 | 700 | |||
| 2015 | 700 | |||
| 2016 | 800 | |||
| 2017 | 700 | |||
| $ | 3,500 |
The Company has determined that CMC Electronics’ acquisition of a majority of the common shares of the Company on April 17, 1998, BAE SYSTEMS p.l.c.’s acquisition of the majority of the common shares of CMC Electronics on November 29, 1999 and ONCAP’s acquisition of the common shares of CMC Electronics on April 11, 2001, constitute acquisitions-of-control of the Company for Canadian income tax purposes. Accordingly, the availability of certain of the Company’s Canadian losses, deductions, and investment tax credits may be subject to limitation.
The ultimate availability and amount of the losses and other tax benefits described above may be dependent upon future Canada Revenue Agency audits. An adverse determination could result in a significant decrease in the availability and amount of the tax benefits described above.
F-18
NOTE 15 RELATED PARTY TRANSACTIONS
In the normal course of business, the Company had the following transactions, measured at the exchange amount, with its related parties:
Year Ended December 31, | ||||||||||
2006 | 2005 | 2004 | ||||||||
| Product sales to Point, Inc. | $ | 2,923 | $ | 2,247 | $ | 2,178 | ||||
| Services provided to Point, Inc. | 164 | 153 | 137 | |||||||
| Engineering and other services charged by Point, Inc. | 309 | 611 | 265 | |||||||
| Engineering services charged to Point, Inc. | 261 | 913 | 309 | |||||||
| Inventory purchases from CMC Electronics, Inc. and Point, Inc. | 54 | 12 | 1,272 | |||||||
| Inventory sold to CMC Electronics, Inc. | — | 124 | 85 | |||||||
| Contracted development costs charged by CMC Electronics, Inc. | — | — | 218 | |||||||
| Other charges from CMC Electronics, Inc. | — | 10 | 318 | |||||||
| Royalties charged to CMC Electronics, Inc. | — | 241 | 545 | |||||||
| Royalties paid to CMC Electronics, Inc. | — | — | 261 | |||||||
| Share offering costs charged to CMC Electronics, Inc. | — | — | 748 | |||||||
| Share offering costs charged by CMC Electronics, Inc. | — | — | 55 | |||||||
From January 2005 through August 2005, CMC Electronics sold its interest in NovAtel and does not maintain any representation on the Company’s Board of Directors and therefore is not considered to be a related party, effective May 11, 2005.
Significant related party receivables at December 31, 2006 consist of $920 from Point, Inc. ($1,331 at December 31, 2005). Related party payables at December 31, 2006 consist of amounts due to Point, Inc. of $72 ($15 at December 31, 2005).
The related party notes receivable of $378 at December 31, 2006 ($1,552 at December 31, 2005) reflects the Company’s proportionate joint venture interest in the aggregate borrowings by Point, Inc. from NovAtel and Sokkia Co., Ltd. (Sokkia) of U.S. $1,585 (U.S. $5,330 at December 31, 2005). The loans are secured by the assets of Point, Inc., bore interest at rates of between 3% and 5.5% during 2006 (3% in 2005 and 2004) and are due on August 31, 2007.
On February 3, 2006, the Company and Sokkia advanced U.S. $1,585 in new loans to Point, Inc. with the Company’s share being U.S. $637.
On November 24, 2006, the Company and Sokkia invested U.S. $5,330 (the Company’s share being U.S. $2,612) in the common shares of Point, Inc. The Company’s ownership percentage of Point, Inc. remained unchanged as a result of this transaction.
On November 27, 2006, Point, Inc. repaid U.S. $5,330 (the Company’s share being $2,612) of loans outstanding with the Company and Sokkia.
NOTE 16 INVESTMENT IN POINT, INC.
On July 20, 1999, the Company and Sokkia Co., Ltd. formed a joint venture, Point, Inc., to distribute GPS based products for surveying, mapping, geographical information systems, construction and construction machine control applications, on a worldwide basis. The consolidated financial statements presented herein include the Company’s proportionate share of the accounts of Point, Inc.
The following is a summary of the Company’s 49% proportionate share of the financial position, operating results, and cash flows of Point, Inc.:
Year ended December 31, | ||||||||||
2006 | 2005 | 2004 | ||||||||
Financial Position | ||||||||||
| Current assets | $ | 1,537 | $ | 1,332 | $ | 1,603 | ||||
| Non-current assets | 174 | 118 | 104 | |||||||
| Total assets | $ | 1,711 | $ | 1,450 | $ | 1,707 | ||||
| Current liabilities | $ | 1,314 | $ | 2,729 | $ | 2,635 | ||||
| Total liabilities | $ | 1,314 | $ | 2,729 | $ | 2,635 | ||||
Results of Operations | ||||||||||
| Revenues | $ | 8,055 | $ | 5,819 | $ | 5,932 | ||||
| Gross profit | 2,359 | 1,726 | 1,760 | |||||||
| Expenses | 2,097 | 2,094 | 1,781 | |||||||
| Income (loss) | 262 | (368 | ) | (21 | ) | |||||
Cash Flows | ||||||||||
| Cash provided by (used in) | ||||||||||
| Operating activities | $ | (156 | ) | $ | 100 | $ | 62 | |||
| Investing activities | (136 | ) | (68 | ) | (23 | ) | ||||
| Financing activities | 535 | (11 | ) | 9 | ||||||
| Effect of exchange rate changes on financing activities | (56 | ) | (51 | ) | (118 | ) | ||||
Included in current liabilities is the Company’s share of notes payable by Point, Inc. to Sokkia, in the amount of $541 ($1,552 at December 31, 2005). The loans are secured by the assets of Point, Inc., bore interest at rates of between 3% and 5.5% during 2006 (3% in 2005 and 2004) and are due on August 31, 2007.
On February 3, 2006, the Company and Sokkia advanced U.S. $1,585 in new loans to Point, Inc. with the Company’s share being U.S. $637.
On November 24, 2006, the Company and Sokkia invested U.S. $5,330 (the Company’s share being U.S. $2,612) in the common shares of Point, Inc. The Company’s ownership percentage of Point, Inc. remained unchanged as a result of this transaction.
On November 27, 2006, Point, Inc. repaid U.S. $5,330 (the Company’s share being $2,612) of loans outstanding with the Company and Sokkia.
Point, Inc. is dependent on the Company and Sokkia for product supply, distribution and financing. Should Sokkia and the Company discontinue their support, Point, Inc.’s ability to continue as a going concern would be impaired.
NOTE 17 DISCONTINUED OPERATIONS (MEZURE, INC.)
As of December 31, 2006, the Company owned a 70% equity interest in Mezure, Inc. (“Mezure”), a company that had been developing a GPS, wireless communication and Internet-based product for deformation monitoring of manmade and natural structures.
During the latter part of 2002, the Company discontinued its financial support of Mezure. On April 8, 2003, the shareholders of Mezure voted unanimously to proceed with a Chapter 7 bankruptcy, which was filed on June 25, 2003. On September 24, 2003 an Order Approving Trustee’s Account, Discharging Trustee and Closing Estate was entered into the docket of the United States Bankruptcy Court, District Oregon (Portland). Consequently, the Company treated Mezure as a discontinued operation.
The consolidated balance sheets as of December 31, 2006 and December 31, 2005 include residual accounts payable and accrued liabilities related to discontinued operations of $15.
F-19
NOTE 18 ACQUISITION OF WAYPOINT CONSULTING INC.
On October 1, 2005 the Company acquired all of the shares of Waypoint Consulting Inc. (“Waypoint”) for approximately $3.5 million in cash, subject to post-closing adjustments to working capital. Of the total purchase price, $2.2 million was paid by December 31, 2005 and $1.2 million was held in escrow by Waypoint’s attorneys to be paid in installments over three years, subject to certain conditions. In 2006, $400 was released from escrow. Waypoint’s products include specialized real-time and post-processing GPS and GPS/inertial positioning and trajectory software. The results of the Waypoint acquisition have been included in the consolidated results of operations since October 1, 2005.
The fair value of net assets and liabilities acquired has been allocated as follows:
| Accounts receivable | $ | 384 | ||
| Inventories | 22 | |||
| Prepaid expenses | 22 | |||
| Capital and intangible assets | 46 | |||
| Intangibles related to technology, brand names and customer relationships | 1,818 | |||
| Goodwill | 1,494 | |||
| Accounts payable | (82 | ) | ||
| Deferred revenue | (173 | ) | ||
| Net investment | $ | 3,531 |
The intangibles are comprised primarily of technology, customer relationships and brand names to which the Company has assigned values of $1,260, $358 and $200 respectively. The Company estimates that these intangibles have an average expected useful life of 8.5 years and are amortized using the straight-line method. The Company has determined that the $1,494 of goodwill is deductible for tax purposes.
NOTE 19 STOCK-BASED COMPENSATION
Stock Option Plans
At December 31, 2006, the Company had 567 unexercised options to employees and directors to purchase common shares under its stock-based compensation plans (see Note 11).
Effective January 1, 2004, the Company adopted the fair value method of accounting for stock options awarded to employees on or after January 1, 2002, as required by amended CICA Handbook Section 3870 Stock-Based Compensation and Other Stock-Based Payments. As permitted by the transitional provisions of Section 3870, the change was adopted retroactively without restatement. Under Section 3870, the fair value of stock options is recognized over the applicable vesting period as a charge to stock-based compensation expense and a credit to contributed surplus. For the year ended December 31, 2006 stock-based compensation expense of $1,020 ($587 and $326 in the years ended December 31, 2005 and 2004) was recognized. When options are exercised, the proceeds are credited to share capital, and the applicable fair value is reclassified from contributed surplus to share capital. As of December 31, 2006, $616 was reclassified from contributed surplus to share capital, as a result of stock option exercises.
The fair value of each option granted was estimated using the Black-Scholes option pricing model with the following weighted-average assumptions used for options granted in 2006, 2005 and 2004: dividend yield of 0%; expected lives of 3 to 10 years; a risk free interest rate of between 3.34% and 4.31% and expected volatility of between 66% and 84%.
In 2006, the Company granted 153 stock options to purchase common shares of the Company, of which 147 were granted to employees and 6 were granted to directors. The options have a weighted average exercise price of U.S. $ 39.47, and expire five years from the date of grant. The employee options vest over four years, while the directors’ options vest one year from the date of grant.
The weighted average fair value of options granted in 2006 was U.S. $14.94, (U.S. $9.61 in 2005 and U.S. $10.67 in 2004.)
Phantom Share Plan
Effective January 1, 2004, the Company established a new Long Term Incentive Plan (LTI Plan), which authorized the grant of approximately 44 phantom shares to employees of the Company. All grants of phantom shares under the LTI Plan have a three-year cliff vesting and vested on December 31, 2006. Payments under the LTI plan will be made in cash.
As of December 31, 2006, the Company estimated that the fair value of the granted and outstanding phantom shares was $2,005, based on a 20-day average price of the Company’s common shares.
For the year ended December 31, 2006, the Company recognized $1,044 in compensation expense related to phantom shares ($347 in the year ended December 31, 2005 and $615 in the year ended December 31, 2004).
F-20
NOTE 20 DIFFERENCES BETWEEN CANADIAN AND UNITED STATES GENERALLY ACCEPTED ACCOUNTING PRINCIPLES
The consolidated financial statements have been prepared in accordance with generally accepted accounting principles in Canada (Canadian GAAP or Canadian principles). The significant differences from U.S. generally accepted accounting principles (U.S. GAAP or U.S. principles) are as follows:
a) Deferred Development Costs (see Note 7)
In the year ended December 31, 2006, the Company deferred $nil of development costs ($nil in 2005 and $218 in 2004) in accordance with Canadian GAAP. Under U.S. GAAP, these costs would be expensed as incurred as research and development costs.
In the year ended December 31, 2006, the Company amortized $404 of deferred development costs ($538 in 2005 and $416 in 2004) in accordance with Canadian GAAP. Under U.S. GAAP, these costs would have been expensed in the periods when the originating expenditures were incurred.
In addition, for Canadian GAAP purposes, in connection with the recognition of prior year’s investment tax credits, the Company reduced the deferred development costs by $164 in the year ended December 31, 2005. Under U.S. GAAP, this amount would have been accounted for as an expense when the originating expenditures were incurred.
b) Stock-Based Compensation
At December 31, 2006, the Company had issued 567 unexercised options to employees and directors to purchase common shares under its stock-based compensation plans (see Note 11).
On January 1, 2004, the Company established a new Long Term Incentive Plan (“LTI Plan”), which authorized the grant of approximately 44 phantom shares to employees of the Company. All grants of phantom shares under the LTI Plan have a three-year cliff vesting and vested on December 31, 2006. Payments under the LTI Plan will be made in cash.
Effective January 1, 2004, under Canadian GAAP the Company adopted the fair value method of accounting for stock options awarded to employees on or after January 1, 2002 as required by amended CICA Handbook Section 3870 Stock-Based Compensation and Other Stock-Based Payments. As permitted by the transitional provisions of Section 3870, the change was adopted retroactively without restatement. Under Section 3870, the fair value of stock options is recognized over the applicable vesting period as stock-based compensation expense and a credit to contributed surplus. When options are exercised, the proceeds are credited to share capital, and the applicable fair value is reclassified from contributed surplus to share capital. Retroactive application of Section 3870 resulted in the opening balances as at January 1, 2004 of deficit, contributed surplus and share capital being increased by $456, $390 and $66, respectively, as though the fair value method had been applied since January 1, 2002.
In December 2004, the Financial Accounting Standards Board ("FASB") issued Statement of Financial Accounting Standards ("SFAS") No. 123 (Revised 2004), “Share-Based Payment” (“SFAS 123R”), which requires all share-based payments to employees, including grants of employee stock options, to be recognized as compensation expense in the consolidated financial statements based on their fair values. SFAS 123R also modifies certain measurement and expense recognition provisions of SFAS No. 123 "Accounting for Stock-Based Compensation" (“SFAS 123”) that impact the Company, including the requirement to estimate employee forfeitures each period when recognizing compensation expense and requiring that the initial and subsequent measurement of the cost of liability-based awards each period be based on the fair value (instead of the intrinsic value) of the award, resulting in differences from Canadian GAAP. Prior to the adoption of SFAS 123R, the Company accounted for stock-based compensation to employees and directors using the intrinsic value method in accordance with APB Opinion No. 25 as allowed under SFAS No. 123. Under the intrinsic value method, no stock-based compensation expense related to the Company’s stock options had been recognized in the Company’s consolidated statement of operations for U.S. GAAP purposes, as the exercise price of the Company’s stock options granted to employees and directors equaled the fair market value of the underlying stock at the date of grant.
Effective January 1, 2006, under U.S. GAAP, the Company adopted SFAS 123R using the modified prospective transition method and accordingly, the results of prior periods have not been restated. As a result, the Company’s financial statements for fiscal periods after December 31, 2005 include stock-based compensation expenses that are not comparable to financial statements of fiscal periods prior to January 1, 2006. SFAS 123R requires stock-based compensation to be estimated using the fair value on the date of grant using an option pricing model. Under the modified prospective method, the Company expenses the value of the portion of the stock based awards that is expected to vest over the related employees’ requisite service periods for U.S. GAAP purposes. The adoption of SFAS 123R under U.S. GAAP created differences in the accounting treatment of stock based compensation from Canadian GAAP, relating primarily to the application of forfeiture rates.
The Company estimates the fair value of stock options using the Black-Scholes option pricing model, consistent with the provisions of SFAS 123R, and the Company’s prior period pro forma disclosures of net income, including share-based compensation. The key input assumptions used to estimate the fair value of stock options include the grant price of the award, the expected term of the options, the expected volatility of the Company’s stock, the risk-free rate, annual forfeiture rate and the Company’s dividend yield. The expected term of the options is estimated based on historical grants with similar vesting periods. The expected volatility of the Company’s stock is estimated using the daily historical stock prices over a prior period in relation to the expected term of the award. The Company believes that the Black-Scholes option pricing model utilized to develop the underlying assumptions is appropriate in calculating the fair values of the Company’s stock options.
F-21
The phantom shares are accounted for as a liability award under U.S. GAAP and are remeasured to fair value at the end of each reporting period. The Company estimates the fair value of the phantom shares granted under the LTI Plan based on an option pricing model (Black-Scholes). The fair value estimated using the Black-Scholes model is consistent with the market value of the Company’s common shares at each reporting date.
SFAS 123R requires forfeitures to be estimated at the time of grant in order to estimate the amount of share-based awards that will ultimately vest. As share-based compensation expense recognized in the consolidated statement of operations for the year ended December 31, 2006 is based on awards ultimately expected to vest, it has been reduced for estimated forfeitures. Prior to the adoption of SFAS 123R, the Company recognized forfeitures as they occurred. The Company recorded a gain of $23 as a cumulative effect of an accounting change, as a result of the change in accounting for forfeitures under SFAS 123R. In the Company’s pro forma information required under SFAS 123 for the period prior to fiscal 2006, the Company accounted for forfeitures as they occurred.
As of December 31, 2006, the annual forfeiture rates applied to the Company’s stock option plans and the phantom share awards were 2% and 2.4%, respectively.
Stock-based compensation under U.S. GAAP recorded for the years ended December 31 was as follows:
Year ended December 31, | ||||||||||
2006 | 2005 | 2004 | ||||||||
Stock-based compensation: | ||||||||||
| Stock option expense | $ | 969 | $ | ― | $ | ― | ||||
| Phantom share expense | 1,051 | 347 | 615 | |||||||
| Total stock-based compensation expense reported | $ | 2,020 | $ | 347 | $ | 615 | ||||
The compensation cost that has been charged against income for the Company’s share-based award plans was $2,020 for the year ended December 31, 2006 ($347 and $615, respectively for the years ended December 31, 2005 and 2004). The total income tax benefit recognized in the statements of operations for stock-based award compensation was nil for the years ended December 31, 2006, 2005 and 2004.
As of December 31, 2006, there was $2,687 of unrecognized compensation cost related to the Company’s stock option plans that is expected to be recognized over a weighted average period of 3.0 years. As of December 31, 2006, there was $nil of total unrecognized compensation cost related to the Company’s phantom share awards granted.
Cash received from exercise under all share-based payment arrangements was $1,041 for the year ended December 31, 2006 ($721 and $1,505 respectively for the years ended December 31, 2005 and 2004). Tax benefits realized by the Company related to these exercises were $nil.
On May 13, 2005, the Company granted 112 options to employees to purchase common shares of the Company. The options had an exercise price of U.S. $19.61, vest over four years and expire five years from the date of grant. The fair value of the options granted (U.S. $9.15) was estimated using the Black-Scholes option pricing model with the following weighted-average assumptions used; dividend yield of 0%; expected lives of 3 years; a risk-free interest rate of 3.34%, and expected volatility of 84%.
On July 29, 2005, the Company granted 6 options to purchase common shares of the Company to directors. The options have an exercise price of U.S. $32.50, and vested on July 29, 2006, one year from the date of grant. The fair value of the options granted (U.S. $18.03) was estimated using the Black-Scholes option pricing model with the following weighted average assumptions used: dividend yield of 0%, expected lives of 3 years; a risk-free interest rate of 3.34%, and expected volatility of 84%.
In 2006, the Company granted 153 options to purchase common shares of the Company, of which 147 were granted to employees and 6 were granted to directors. The options have a weighted average exercise price of U.S. $39.47 and expire five years from the date of grant. The employees’ options vest over four years, while the directors’ options vest one year from the date of grant. The weighted average fair value of the options granted (U.S. $14.91) was estimated using the Black Scholes option pricing model with the following weighted average assumptions used: dividend yield of 0%, expected lives of 3 years; a risk free interest rate of between 4.03% and 4.31%; and expected volatility of between 66% and 72%.
Had compensation cost for the Company’s stock-based compensation plans been determined based on the fair value of the options at the grant dates, the Company’s pro forma net income and net income per share for years ended December 31, 2005 and 2004 would have been as follows:
F-22
Year ended | ||||||||||
2005 | 2004 | |||||||||
| Net income - U.S. GAAP | As reported | $ | 18,129 | $ | 13,463 | |||||
| Less: Fair value of stock options | Pro forma | 502 | 408 | |||||||
| Net income - U.S. GAAP | $ | 17,627 | $ | 13,055 | ||||||
| Net income -per share (basic) | As reported | $ | 2.18 | $ | 1.67 | |||||
| Pro forma | $ | 2.12 | $ | 1.62 | ||||||
| Net income -per share (diluted) | As reported | $ | 2.07 | $ | 1.58 | |||||
| Pro forma | $ | 2.01 | $ | 1.54 | ||||||
c) Derivatives and Hedging Activities
The Company has historically entered into forward foreign exchange contracts to manage its exposure to foreign currency fluctuations. Under U.S. GAAP the accounting for derivative instruments and hedging activities is contained in the Statement of Financial Accounting Standard No. 133, as amended by SFAS 137, SFAS 138 and SFAS 149 (“SFAS 133”). SFAS 133 establishes accounting and reporting standards requiring that all derivative instruments be recorded in the balance sheet as either an asset or a liability measured at fair value and requires that changes in the fair value be recognized currently in earnings unless specific hedge accounting criteria are met. For cash flow hedges, changes in the fair value of the derivative instrument are recognized in net earnings in the same period as the hedged item and any changes in the fair value prior to that period are recognized in other comprehensive income. For fair value hedges, both the derivative instrument and the underlying commitment are recognized on the balance sheet at their fair value and any changes in the fair value are recognized currently in net earnings. Prior to July 18, 2006, the Company’s foreign exchange contracts have been accounted for as cash flow hedges. Foreign exchange contracts entered into after July 18, 2006, have been recorded at fair value and any changes in fair value have been recognized in net earnings.
Under U.S. GAAP, SFAS 133 would result in a decrease in total assets of $132 as of December 31, 2006 (an increase of $192 as of December 31, 2005) related to the fair value of the Company’s foreign exchange contracts.
d) Investment in Joint Ventures
The accounts of the Company’s 49.0% joint venture interest in Point, Inc. are proportionately consolidated as required under Canadian GAAP. Under U.S. GAAP, proportionate consolidation is not permitted, and the Company’s investment in these joint ventures would be accounted for using the equity method. As permitted by SEC guidance, the effects of this difference in accounting principles have not been reflected in the accompanying tables (see Note 16).
e) Intangibles Related to Acquisition of CMC Electronics OEM GPS Business
On May 14, 2003, the Company acquired the CMC Electronics non-aviation GPS product line. The fair value of the net assets acquired included $497 in intangibles, comprised primarily of technology, product design, customer relationships and an established market presence. Under U.S. GAAP, when accounting for a transfer of assets between entities under common control, the entity that receives the net assets or the equity interest would initially recognize the assets and liabilities transferred at their carrying amounts at the date of transfer. Any excess of consideration given over the controlling shareholders’ carrying value would be accounted for as a reduction of equity.
f) Provision for Future Warranty Costs
The changes in the provision for future warranty costs during each of the years ended December 31, 2006, 2005 and 2004 are as follows:
F-23
2006 | 2005 | 2004 | ||||||||
| Opening balance, beginning of period | $ | 693 | $ | 538 | $ | 410 | ||||
| Additions to provision | 560 | 382 | 312 | |||||||
| Costs incurred | (437 | ) | (227 | ) | (184 | ) | ||||
| Ending balance, end of period | $ | 816 | $ | 693 | $ | 538 | ||||
g) Investment Tax Credits
Under Canadian GAAP, the Company uses the cost reduction method to account for its investment tax credits. The investment tax credits relate to certain research and development expenses and are recognized when there is reasonable assurance that the Company will be able to realize the benefit of these credits. In the year ended December 31, 2006, the Company recognized $nil ($1,756 in 2005, $4,356 in 2004) of investment tax credits. Of the $1,756 recorded in 2005, $1,592 was recorded on the statement of operations as a benefit of investment tax credits and $164 was recorded as a reduction of deferred development costs on the balance sheet.
Under U.S. GAAP, the Company would use the flow through method to account for its investment tax credits and would record the recognition of the $1,756 of investment tax credits in 2005 as a reduction of the current income tax provision. Under U.S. GAAP, for the year ended December 31, 2004, the Company would record the recognition of the $4,356 of investment tax credits as a $2,258 reduction of the current income tax provision and as a $2,098 increase in future income tax benefit.
The net effect of these reconciling items would be an increase in net income from continuing operations of $164 in the year ended December 31, 2005 under U.S. GAAP.
h) Comprehensive Income
U.S. GAAP utilizes the concept of comprehensive income, which includes net income and other comprehensive income. The concept of comprehensive income will be in effect under Canadian GAAP as of January 1, 2007. Other comprehensive income represents the change in equity during the period from transactions and other events from non-owner sources and includes such items as changes in the fair value of cash flow hedges.
i) Summary of the Differences between Canadian and U.S. GAAP
The effects of the above-noted differences between Canadian and U.S. GAAP on the statements of operations and on the balance sheets are as follows:
Year Ended December 31, | ||||||||||
2006 | 2005 | 2004 | ||||||||
Net income from continuing operations— Canadian GAAP | $ | 21,492 | $ | 16,716 | $ | 12,794 | ||||
| Adjustments to U.S. GAAP | ||||||||||
| Deferred development costs (a) | — | — | (218 | ) | ||||||
| Amortization of deferred development costs (a) | 404 | 538 | 416 | |||||||
| Reduction of deferred development costs related to recognition of investment tax credits (a)(g) | — | 164 | — | |||||||
| Stock-based compensation expense (b) | 44 | 587 | 326 | |||||||
| Amortization of intangibles acquired from CMC Electronics (e) | 125 | 124 | 124 | |||||||
Net income from continuing operations — U.S. GAAP | 22,065 | 18,129 | 13,442 | |||||||
| Net income from discontinued operations | — | — | 21 | |||||||
Net income before cumulative effect of accounting change — U.S. GAAP | 22,065 | 18,129 | 13,463 | |||||||
| Cumulative effect of accounting change (b) | 23 | ― | ― | |||||||
Net income - U.S. GAAP | 22,088 | 18,129 | 13,463 | |||||||
| Net unrealised gain (loss) on foreign exchange contracts (c) | (132 | ) | 192 | 179 | ||||||
| Reclassification to income of gains and losses on cash flow hedges (c) | (192 | ) | (179 | ) | — | |||||
Comprehensive income | $ | 21,764 | $ | 18,142 | $ | 13,642 | ||||
F-24
December 31, | |||||||
2006 | 2005 | ||||||
Total Assets | |||||||
| Canadian GAAP | $ | 96,968 | $ | 71,255 | |||
| Adjustments to U.S. GAAP | |||||||
| Deferred development costs (a) | (1,253 | ) | (1,657 | ) | |||
| Fair value of financial instruments (c) | (132 | ) | 192 | ||||
| Reduction of intangibles acquired from CMC Electronics to carrying value (e) | (57 | ) | (182 | ) | |||
| U.S. GAAP | $ | 95,526 | $ | 69,608 | |||
Total Shareholders’ Equity | |||||||
| Canadian GAAP | $ | 81,589 | $ | 58,117 | |||
| Adjustments to U.S. GAAP | |||||||
| Deferred development costs (a) | (1,253 | ) | (1,657 | ) | |||
| Stock based compensation (b) | 16 | ― | |||||
| Reduction of intangibles acquired from CMC Electronics to carrying value (e) | (492 | ) | (492 | ) | |||
| Amortization of intangibles acquired from CMC Electronics (e) | 435 | 310 | |||||
| U.S. GAAP — before other comprehensive income (loss) | 80,295 | 56,278 | |||||
| Accumulated other comprehensive income (loss) | (132 | ) | 192 | ||||
| U.S. GAAP — including accumulated other comprehensive income (loss) | $ | 80,163 | $ | 56,470 | |||
j) Net Income per Share
Net income per share as computed under Canadian and U.S. principles is as set forth below for the following periods:
Year Ended December 31, | |||||||||||||||||||
Canadian GAAP | U.S. GAAP | ||||||||||||||||||
Net Income per Share — Basic | Net Income per Share — Basic | ||||||||||||||||||
2006 | 2005 | 2004 | 2006 | 2005 | 2004 | ||||||||||||||
| Continuing operations | $ | 2.54 | $ | 2.01 | $ | 1.59 | $ | 2.61 | $ | 2.18 | $ | 1.67 | |||||||
| Discontinued operations | — | — | — | — | — | — | |||||||||||||
| Net income per share | $ | 2.54 | $ | 2.01 | $ | 1.59 | $ | 2.61 | $ | 2.18 | $ | 1.67 | |||||||
Net Income per Share — Diluted | Net Income per Share — Diluted | ||||||||||||||||||
2006 | 2005 | 2004 | 2006 | 2005 | 2004 | ||||||||||||||
| Continuing operations | $ | 2.44 | $ | 1.91 | $ | 1.51 | $ | 2.50 | $ | 2.07 | $ | 1.58 | |||||||
| Discontinued operations | — | — | — | — | — | — | |||||||||||||
| Net income per share | $ | 2.44 | $ | 1.91 | $ | 1.51 | $ | 2.50 | $ | 2.07 | $ | 1.58 | |||||||
F-25
k) Consolidated Statement of Cash Flows
The effects of the differences between Canadian and U.S. GAAP on the consolidated statement of cash flows are as follows:
Year Ended December 31, | ||||||||||
2006 | 2005 | 2004 | ||||||||
| Cash flow provided by operations — Canadian GAAP | $ | 19,439 | $ | 17,092 | $ | 12,504 | ||||
| Adjustments to U.S. GAAP | ||||||||||
| Deferred development costs (a) | — | — | (218 | ) | ||||||
| Royalty payment relating to CMC Electronics’ OEM GPS business (e) | — | (221 | ) | (261 | ) | |||||
| Cash flow provided by operations — U.S. GAAP | $ | 19,439 | $ | 16,871 | $ | 12,025 | ||||
| Cash flow provided by financing activities — Canadian GAAP | $ | 2,613 | $ | 778 | $ | 598 | ||||
| Adjustments to U.S. GAAP | — | — | — | |||||||
| Cash flow provided by financing activities — U.S. GAAP | $ | 2,613 | $ | 778 | $ | 598 | ||||
| Cash used in investing activities — Canadian GAAP | $ | (20,920 | ) | $ | (24,098 | ) | $ | (6,598 | ) | |
| Adjustments to U.S. GAAP | ||||||||||
| Deferred development costs (a) | — | — | 218 | |||||||
| Royalty payment relating to CMC Electronics’ OEM GPS business (e) | — | 221 | 261 | |||||||
| Cash used in investing activities — U.S. GAAP | $ | (20,920 | ) | $ | (23,877 | ) | $ | (6,119 | ) | |
l) Accounts Payable and Accrued Liabilities
The following balances comprise accounts payable and accrued liabilities:
Year Ended December 31, | |||||||
2006 | 2005 | ||||||
| Accounts payable and accrued trade liabilities | $ | 6,714 | $ | 5,229 | |||
| Accrued salaries, incentive plans and other employee-related obligations | 4,950 | 3,686 | |||||
| Accrued dealer and agent commissions | 322 | 458 | |||||
| Other | 350 | 411 | |||||
| Total | $ | 12,336 | $ | 9,784 | |||
m) New Canadian and U.S. GAAP Accounting Pronouncements
Canadian Pronouncements
In January 2005, the Canadian Institute of Chartered Accountants (“CICA”) issued Section 1530, “Comprehensive Income”, Section 3251, “Equity”, Section 3855, “Financial Instruments - Recognition and Measurement” and Section 3865, “Hedges”. The new standards increase harmonization with U.S. GAAP and will require the following:
| · | Financial assets will be classified as either held-to-maturity, held-for-trading or available-for-sale. Held-to-maturity classification will be restricted to fixed maturity instruments that the company intends and is able to hold to maturity and will be accounted for at amortized cost. Held-for-trading instruments will be recorded at fair value with realized and unrealized gains and losses reported in net income. The remaining financial assets will be classified as available-for-sale. These will be recorded at fair value with unrealized gains and losses reported in a new category of the consolidated balance sheet under shareholders’ equity called other comprehensive income (“OCI”); and |
| · | Derivatives will be classified as held-for-trading unless designated as hedging instruments. All derivatives, including embedded derivatives that must be separately accounted for, will be recorded at fair value on the consolidated balance sheet. For derivatives that hedge the changes in fair value of an asset or liability, changes in the derivatives’ fair value will be reported in net income and be substantially offset by changes in the fair value of the hedged asset or liability attributable to the risk being hedged. For derivatives that hedge variability in cash flows, the effective portion of the changes in the derivatives’ fair value will be initially recognized in OCI and the ineffective portion will be recorded in net income. The amounts temporarily recorded in OCI will subsequently be reclassified to net income in the periods when net income is affected by the variability in the cash flows of the hedged item. |
The above guidance will apply for interim and annual financial statements relating to fiscal years beginning on or after October 1, 2006. Earlier adoption will be permitted only as of the beginning of a fiscal year. The impact of implementing these new standards did not have a material impact on the Company’s consolidated financial statements.
F-26
In December 2006, CICA issued Section 3862 - “Financial Instruments - Disclosures”. This standard requires entities to provide disclosures in their financial statements that enable users to evaluate the significance of financial instruments to the entity's financial position and performance. It also requires that entities disclose the nature and extent of risks arising from financial instruments and how the entity manages those risks.
In December 2006, CICA issued Section 3863 - “Financial Instruments - Presentation”. This standard establishes standards for presentation of financial instruments and non-financial derivatives and deals with the classification of financial instruments, from the perspective of the issuer, between liabilities and equity, the classification of related interest, dividends, losses and gains, and the circumstances in which financial assets and financial liabilities are offset. CICA sections 3862 and 3863 are effective for annual and interim periods beginning on or after October 1, 2007.
Canada’s Accounting Standards Board issued CICA Section 1506, “Accounting Changes”. The standard prescribes the criteria for changing accounting policies, together with the accounting treatment and disclosure of changes in accounting policies and estimates, and correction of errors. The standard requires the retrospective application to prior periods’ financial statements of changes in accounting principle, unless it is impractical to determine either the period-specific effects or the cumulative effect of the change. Application is on a prospective basis and is effective for changes in accounting policies and estimates and correction of errors made in fiscal years beginning on or after January 1, 2007.
In July 2006, the Emerging Issues Committee ("EIC") issued Abstract No. 162, “Stock-Based Compensation for Employees Eligible to Retire Before the Vesting Date”. This EIC discusses how compensation cost attributable to a stock-based award for a compensation plan that contains provisions that allow an employee to continue vesting after the employee has retired from the entity should be accounted for in the case of an employee who is eligible to retire at the grant date or who will become eligible to retire during the vesting period. In the case of an employee who is eligible to retire at the grant date, this EIC concludes that compensation should be recognized on the grant date. In the case of an employee who will become eligible to retire during the vesting period, the compensation cost should be recognized over the period from the grant date to the date the employee becomes eligible to retire. The implementation of this EIC is effective January 1, 2007 and is not expected to have a material impact on the Company’s consolidated financial statements.
The Emerging Issues Committee issued EIC Abstract 163 - “Determining the Variability to be Considered in Applying AcG 15”. This Abstract, which is harmonized with the equivalent United States FASB Staff Position (FSP) FIN 46(R) - 6 - “Determining the Variability to be Considered in Applying FASB Interpretation No. 46 (R)”, provides guidance on how an enterprise should determine the variability to be considered in applying “AcG 15 - Consolidation of Variable Interest Entities”. The Abstract is to be applied prospectively to all entities with which an enterprise first becomes involved and to all entities previously required to be analyzed under AcG 15 when a reconsideration event has occurred beginning the first day of the first reporting period beginning on or after January 1, 2007.
In early 2006, Canada’s Accounting Standards Board ratified a strategic plan that will result in Canadian GAAP, as used by public companies, being converged with International Financial Reporting Standards over a transitional period. The Accounting Standards Board is expected to develop and publish a detailed implementation plan with a transition period expected to be approximately five years. As this convergence initiative is very much in its infancy as of the date of the annual consolidated financial statements, it would be premature to currently assess the impact of the initiative, if any, on the Company.
U.S. Pronouncements
In February 2007, the Financial Accounting Standards Board issued Statement of Financial Accounting Standards No. 159, “The Fair Value Option for Financial Assets and Financial Liabilities (including an amendment of FASB Statement No. 115)”. The statement would create a fair value option under which an entity may irrevocably elect fair value as the initial and subsequent measurement attribute for certain financial assets and financial liabilities on a contract-by-contract basis, with changes in fair value recognized in earnings as those changes occur. This Statement is effective as of the beginning of an entity’s first fiscal year that begins after November 15, 2007. Management is in the process of reviewing the requirements of this recent statement.
In September 2006, the FASB issued SFAS No. 157 “Fair Value Measurements” (“SFAS 157”). SFAS 157 provides accounting guidance on the definition of fair value and establishes a framework for measuring fair value in U.S. GAAP and expands disclosures about fair value measurements. SFAS 157 is effective for financial statements issued for fiscal years beginning after November 15, 2007. The Company plans to adopt the provisions of SFAS 157 on January 1, 2008. The Company is currently assessing the impact of the adoption of SFAS 157 on its results of operations and financial condition.
In September 2006, the SEC Staff issued Staff Accounting Bulletin 108, “Quantifying Misstatements in the Financial Statements” (“SAB 108”). SAB 108 requires that misstatements identified in the current year financial statements that result from misstatements of prior year financial statements be quantified and evaluated using a dual approach that includes both an income statement and balance sheet assessment of any misstatement. The guidance is effective for fiscal years ending after November 15, 2006. The implementation of SAB 108 did not have a material impact on the Company’s consolidated financial statements.
In June 2006, the EITF reached a consensus on EITF Issue No. 06-3 “How Taxes Collected from Customers and Remitted to Governmental Authorities Should Be Presented in the Income Statement (That Is, Gross Versus Net Presentation)” (“EITF 06-3”). EITF 06-3 provides guidance on how taxes directly imposed on revenue producing transactions between a seller and customer that are remitted to governmental authorities should be presented in the income statement (i.e. gross versus net presentation). EITF 06-3 is effective for interim and annual reporting periods beginning after December 15, 2006. The Company will adopt the provisions of EITF 06-3 on January 1, 2007. The Company is currently in the process of assessing the impact of EITF 06-3 on the presentation of its results of operations and financial condition.
F-27
In June 2006, the FASB issued FASB Interpretation No. 48 (“FIN 48”) entitled “Accounting for Uncertain Tax Positions” - an interpretation of SFAS No. 109. The interpretation clarifies the accounting for uncertainty in income taxes recognized in an enterprise’s financial statements in accordance with SFAS No. 109, Accounting for Income Taxes. The evaluation of a tax position in accordance with this interpretation is a two-step process. Under the recognition step an enterprise determines whether it is more likely than not that a tax position will be sustained upon examination based on the technical merits of the position. Under the measurement step a tax position that meets the more-likely-than-not recognition threshold is measured to determine the amount of benefit to recognize in the financial statements. The tax position is measured at the largest amount of benefit that is greater than 50 percent likely of being realized upon ultimate settlement. FIN 48 is effective for fiscal years beginning after December 15, 2006. Earlier application of the provisions of this interpretation is encouraged if the enterprise has not yet issued financial statements, including interim financial statements, in the period this interpretation is adopted. The implementation of FIN 48 did not have a material impact on the Company’s results of operations and financial condition.
In February 2006, the FASB issued Statement of Financial Accounting Standard (“SFAS”) No. 155, “Accounting for Certain Hybrid Financial Instruments - an amendment to FASB Statements No. 133 and 140” (“SFAS 155”). SFAS 155 simplifies the accounting for certain hybrid financial instruments containing embedded derivatives. SFAS 155 allows fair value measurement for any hybrid financial instrument that contains an embedded derivative that otherwise would require bifurcation under SFAS No. 133, “Accounting for Derivative Instruments and Hedging Activities” (“SFAS 133”). In addition, it amends SFAS No. 140 “Accounting for Transfers and Servicing of Financial Assets and Extinguishments of Liabilities” (“SFAS 140”), to eliminate the prohibition on a qualifying special-purpose entity from holding a derivative financial instrument that pertains to a beneficial interest other than another derivative financial instrument. SFAS 155 is effective for all financial instruments acquired, issued, or subject to a re-measurement event occurring after the beginning of an entity’s first fiscal year that begins after September 15, 2006. The Company will adopt the provisions of SFAS 155 on January 1, 2007. The implementation of SFAS 155 is not expected to have a material impact on the Company’s results of operations and financial condition.
In September 2006, the EITF reached a consensus on EITF Issue No. 06-1 “Accounting for Consideration Given by a Service Provider to Manufacturers or Resellers of Equipment Necessary for an End-Customer to Receive Service from the Service Provider” (“EITF 06-1”). EITF 06-1 provides accounting guidance on the consideration given by a service provider to a manufacturer or reseller of specialized equipment for the reduction of the price of such equipment to an end-customer which is necessary for an end-customer to receive service from the service provider. EITF 06-1 is effective for fiscal years beginning after June 15, 2007. The Company will adopt the provisions of EITF 06-1 on January 1, 2008. The Company is in the process of reviewing the requirements and potential impact of EITF 06-1.
In June 2005, the FASB published an exposure draft containing proposals to change the accounting for business combinations. The proposed standards would replace the existing requirements of the FASB’s Statement No. 141, Business Combinations. The proposals would result in fewer exceptions to the principle of measuring assets acquired and liabilities assumed in a business combination at fair value. Additionally, the proposals would result in payments to third parties for consulting, legal, audit, and similar services associated with an acquisition being recognized generally as expenses when incurred rather than capitalized as part of the business combination. The FASB also published an exposure draft that proposes, among other changes, that non-controlling interests be classified as equity within the consolidated financial statements. The FASB’s proposed standard would replace Accounting Research Bulletin No. 51, Consolidated Financial Statements.
F-28
REPORT OF INDEPENDENT REGISTERED CHARTERED ACCOUNTANTS
To the Board of Directors and Shareholders of NovAtel Inc.
We have audited the consolidated financial statements of NovAtel Inc. as at December 31, 2006 and 2005, and for each of the years in the three-year period ended December 31, 2006, and have issued our reports thereon dated February 9, 2007, except as to Note 9(c) which is as of March 21, 2007 (which audit report expresses an unqualified opinion and includes an explanatory paragraph referring to our consideration of internal control over financial reporting and also includes a separate report titled Comments by Independent Registered Chartered Accountants on Canada — United States of America Reporting Differences referring to changes in accounting principles that have a material effect on the comparability of the Company’s financial statements and changes in accounting principles that have been implemented in the Company’s financial statements); such financial statements and reports are included in the 2006 Annual Report on Form 20-F. Our audits also included the financial statement schedule of NovAtel Inc. This financial statement schedule is the responsibility of the Company’s management. Our responsibility is to express an opinion based on our audits. In our opinion, the financial statement schedule, when considered in relation to the basic financial statements taken as a whole, present fairly, in all material respects, the information set forth therein.
(signed) “Deloitte & Touche LLP”
Deloitte & Touche LLP
Independent Registered Chartered Accountants
Calgary, Alberta, Canada
February 9, 2007
F-29
SCHEDULE II
Valuation and Qualifying Accounts
(in thousands, Canadian dollars)
2004 | Balance at beginning of period | Additions | Deductions | Balance at end of period | |||||||||
| Allowance for doubtful accounts and provision for sales returns | $ | 1,078 | $ | 215 | $ | (86 | ) | $ | 1,207 | ||||
| Provision for future warranty costs | $ | 410 | $ | 312 | $ | (184 | ) | $ | 538 | ||||
2005 | Balance at beginning of period | Additions | Deductions | Balance at end of period | |||||||||
| Allowance for doubtful accounts and provision for sales returns | $ | 1,207 | $ | 29 | $ | (156 | ) | $ | 1,080 | ||||
| Provision for future warranty costs | $ | 538 | $ | 382 | $ | (227 | ) | $ | 693 | ||||
2006 | Balance at beginning of period | Additions | Deductions | Balance at end of period | |||||||||
| Allowance for doubtful accounts and provision for sales returns | $ | 1,080 | $ | 34 | $ | (90 | ) | $ | 1,024 | ||||
| Provision for future warranty costs | $ | 693 | $ | 560 | $ | (437 | ) | $ | 816 | ||||
F-30