UNITED STATES
SECURITIES AND EXCHANGE COMMISSION
Washington, D.C. 20549
FORM N-CSR
CERTIFIED SHAREHOLDER REPORT OF REGISTERED
MANAGEMENT INVESTMENT COMPANIES
Investment Company Act file Number 811-02265
Value Line Mid Cap Focused Fund, Inc.
(Exact name of registrant as specified in charter)
7 Times Square, Suite 1606, New York, N.Y. 10036
(Address of principal executive offices) (Zip Code)
Registrant’s telephone number, including area code: 212-907-1900
Date of fiscal year end: December 31, 2022
Date of reporting period: December 31, 2022
Item I Reports to Stockholders
a) A copy of the Annual Report to Stockholders for the period ended 12/31/22 is included with this Form.
b) Not Applicable
Equity Funds
Value Line Small Cap Opportunities Fund, Inc. |
|
Institutional Class (VLEIX) |
Value Line Mid Cap Focused Fund, Inc. |
|
Institutional Class (VLMIX) |
Value Line Select Growth Fund, Inc. |
|
Institutional Class (VILSX) |
Value Line Larger Companies Focused Fund, Inc. |
|
Institutional Class (VLLIX) |
Allocation Funds
Value Line Asset Allocation Fund, Inc. |
|
Institutional Class (VLAIX) |
Value Line Capital Appreciation Fund, Inc. |
|
Institutional Class (VLIIX) |
Fixed Income Fund
Value Line Core Bond Fund |
|
Go Paperless
VLFunds.com/edelivery
This audited report is issued for information to shareholders. It is not authorized for distribution to prospective investors unless preceded or accompanied by a currently effective prospectus of the Fund (obtainable from the Distributor).
President’s Letter (unaudited)
Dear Fellow Shareholders:
On behalf of all of us here at Value Line Funds, I hope this annual report finds you and your families safe and well.
As we continue through these challenging times, know that our long-term commitment to you, our Fund shareholders, remains unchanged. As such, we are pleased to present you with this annual report for Value Line Select Growth Fund, Inc., Value Line Mid Cap Focused Fund, Inc., Value Line Capital Appreciation Fund, Inc., Value Line Larger Companies Focused Fund, Inc. and Value Line Core Bond Fund (individually, a “Fund” and collectively, the “Funds”) for the 12 months ended December 31, 2022. Additionally, to streamline your Funds’ operations and help reduce shareholder expenses, the fiscal year-end for Value Line Small Cap Opportunities Fund, Inc. and Value Line Asset Allocation Fund, Inc. (individually, a “Fund” and collectively, the “Funds”) was changed from March 31st to December 31st, and so this newly-combined report also includes a review of these two Funds for the nine months ended December 31, 2022.
During the annual period, most broad U.S. equity and fixed income indices generated double-digit negative absolute returns, impacted by a variety of economic and market factors discussed below. It was only the third year since 1926 that both U.S. stocks and bonds lost ground in the same calendar year. Notably, while all seven equity, hybrid and fixed income Funds also posted negative absolute returns during their respective reporting periods, four of the seven outperformed their respective benchmark index on a relative basis. The reporting period was highlighted by several of the Value Line Funds being recognized for their long-term performance and/or attractive risk profiles.
•
Value Line Small Cap Opportunities Fund, Inc.* outpaced the category average return of its peers for the one-, three-, five- and ten-year periods ended December 31, 2022 (small growth category), as measured by Morningtar.1 Additionally, the Fund earned an overall five-star rating from Morningstar2 in the small growth category among 576 funds as of December 31, 2022 based on risk-adjusted returns. Morningstar gave the Fund an overall Risk rating of Low.i
•
Value Line Mid Cap Focused Fund, Inc.* outpaced the category average return of its peers for the one-, three-, five- and ten-year periods ended December 31, 2022 (mid-cap growth category), as measured by Morningstar,1 ranking in the top 8% of its peer category in each of those time periods. Additionally, the Fund earned an overall five-star rating from Morningstar2 in the mid-cap growth category among 534 funds as of December 31, 2022 based on risk-adjusted returns. Morningstar gave the Fund an overall Risk Rating of Low and an overall Return Rating of High.ii
•
Value Line Select Growth Fund, Inc.* outpaced the category average return of its peers for the one-year, three-year and five-year periods ended December 31, 2022 (large growth category), as measured by Morningstar1. Additionally, the Fund earned an overall four-star rating from Morningstar2 in the large growth category among 1,131 funds as of December 31, 2022 based on risk-adjusted returns. Morningstar gave the Fund an overall Risk Rating of Below Average.iii
•
Value Line Asset Allocation Fund, Inc.* outpaced the category average return of its peers for the five- and ten-year periods ended December 31, 2022 (allocation 50% to 70% equity category), as measured by Morningstar.1 Additionally, the Fund earned an overall five-star rating from Morningstar2 in the allocation 50% to 70% equity category among 697 funds as of December 31, 2022 based on risk-adjusted returns. Morningstar gave the Fund an overall Return Rating of Above Average.iv
•
Value Line Core Bond Fund* outpaced the category average return of its peers for the one-year period ended December 31, 2022 (intermediate core bond category), as measured by Morningstar.1 Morningstar gave the Fund an overall Risk rating of Below Average.v
On the following pages, the Funds’ portfolio managers discuss the management of their respective Funds during the reporting period. The discussions highlight key factors influencing recent performance of the Funds. You will also find a Schedule of Investments and financial statements for each of the Funds.
Before reviewing the performance of your individual mutual fund investment(s), we encourage you to take a brief look at the major factors affecting the financial markets during the 12 months ended December 31, 2022, especially given the newsworthy events of the annual period. With meaningful trends and developments during 2022 in several drivers of the capital markets, we also invite you to take this time to consider a broader diversification strategy by including additional Value Line Funds in your investment portfolio. You can find out more about the entire family of Value Line Funds at our website, www.vlfunds.com.
Economic Review
During the 12 months ended December 31, 2022, U.S. economic data painted a mixed picture. Annualized U.S. Gross Domestic Product (GDP) posted a growth rate of -1.6% for the first quarter of 2022 and -0.6% for the second quarter of 2022 before generating a strong positive annualized growth rate for the third quarter of 2022 of 3.2%. The increase in real GDP for the third quarter reflected increases in exports, consumer spending, nonresidential fixed investment, state and local government spending and federal government spending, which were partly offset by decreases in imports, residential fixed investment and private inventory investment. Many policymakers see the fourth quarter of 2022 also running at a positive rate for U.S. GDP growth.
President’s Letter (unaudited) (continued)
Economic activity in the manufacturing and services sectors continued to grow through most of the annual period but then contracted toward the end of 2022. The Institute for Supply Management (ISM) Manufacturing Survey read 48.4 in December, its second consecutive month of contraction following a 29-month period of growth. Similarly, the ISM Services Index registered 49.6 in December 2022, after 30 consecutive months of growth. New home sales fell for 2022 overall, but actually rose in the last months of the year, despite rising mortgage rates and still-elevated house prices. Throughout the annual period, the U.S. labor market remained strong. The U.S. economy recovered approximately 4.8 million jobs in 2022, and the U.S. unemployment rate fell from 4.0% at the start of the calendar year to 3.5% in December 2022. Retail sales also remained surprisingly robust, with holiday season spending by consumers increasing at an annualized rate of 7.6%, exceeding consensus expectations.
Inflation was clearly the dominant theme of the economic narrative during the annual period. The Consumer Price Index (CPI), a measure of inflation, rose to a high of 9.1% year over year in June 2022, the largest 12-month increase since the period ending November 1981. The CPI fell to 6.5% year over year in December 2022, the smallest 12-month increase since the period ended October 2021 but still well above the U.S. Federal Reserve’s (Fed) target of 2%. The core Consumer Price Index, which excludes food and energy, rose 5.7% over the last 12 months. Since the high in June 2022, the gasoline index saw the largest decrease. According to AAA, the Daily National Average of Gasoline Prices reached a high of $5.02/gallon on June 14, 2022 before coming down to $3.18/gallon at the end of December 2022. Food, shelter and other major energy components indices continued to increase. All told, the food index increased 10.4% for the 12 months ending December 2022, and the energy index rose 7.3% over the last year, each increase smaller than for the 12-month period ending November 2022. The shelter index, which was the dominant factor in the core CPI’s month-over-month increase, rose 7.5% for the 12 months ending December 2022.
The surprisingly high and persistent inflation data prompted the Fed to take an accelerated approach to raising short-term interest rates. Indeed, following a sustained period of near-zero interest rates, Fed officials hiked the targeted federal funds rate 25 basis points in March 2022 in the first U.S. rate increase since the end of 2018. (A basis point is 1/100th of a percentage point.) The Fed then lifted the targeted federal funds rate another six times—for a total of seven—in 2022, bringing it to a range of 4.25% to 4.50% at the end of December, its highest level in 15 years. At its December meeting, the Fed indicated it expected to keep interest rates higher for longer, with no reductions until 2024. The expected terminal rate, or point where officials expected to end the rate hikes, was put at 5.1%, according to the Fed’s dot plot projections. (The dot plot shows interest rate projections of the members of the Federal Open Market Committee (“FOMC”).)
Also during the annual period, the Fed scaled back its large-scale asset purchase program in an effort to counteract increasing inflation, ending it entirely in March 2022. The Fed’s balance sheet had doubled during the COVID-19 pandemic from approximately $3.9 trillion to about $8.5 trillion to ensure financial market liquidity. In May 2022, the Fed announced it would start reducing the size of its balance sheet beginning June 1, 2022 but expected to maintain ample reserves to ensure it could continue to effectively control short-term interest rates. While the Fed had not engaged in active selling as of the end of the annual period, since June 1, 2022, the Fed has progressively been phasing in a run-off cap of $95 billion. To ensure a gradual decline in the balance sheet, the monthly amounts of securities that were allowed to mature and not be replaced were capped and amounts above the cap would be reinvested and left on the balance sheet.
At its last meeting during the annual period, the Fed stated, “Russia's war against Ukraine is causing tremendous human and economic hardship. The war and related events are contributing to upward pressure on inflation and are weighing on global economic activity. The Committee is highly attentive to inflation risks. The Committee seeks to achieve maximum employment and inflation at the rate of 2 percent over the longer run.”
Equity Market Review
U.S. equities, as measured by the S&P 500® Index3, returned -18.11% during the 12 months ended December 31, 2022, its worst calendar year performance since 2008. Aggressive U.S. Fed interest rate hikes to combat decades-high inflation, volatile commodity prices, persistent recession worries, supply-chain disruptions, ongoing war between Russia and Ukraine, and elevated concerns around China’s zero-COVID policy pressured the U.S. equity markets most during the 12 months ended December 31, 2022.
During the first quarter of 2022, the S&P 500® Index experienced its first quarterly decline since the first quarter of 2020. The dramatic repricing of the Fed’s interest rate hike path and accelerated expectations for a more aggressive balance sheet runoff phase due to concerns about elevated and persistent inflation pressures weighed on investor sentiment. Also, a resurgence in COVID-19 Omicron cases brought back supply-chain issues and worker shortages. Dampened corporate earnings momentum played into the bearish narrative for the U.S. equities markets. (Bearish refers to an expected downward movement in the prices of securities.) During the second quarter of 2022, the S&P 500® Index retreated significantly. Inflation, the Fed’s policy response and recession worries were at the core of investors’ worries, resulting in a broad risk-off, or heightened risk aversion, atmosphere. Geopolitical overhang also remained a concern, as it affected energy prices, leading to low consumer sentiment and potentially changing consumer spending trends.
The S&P 500® Index declined again in the third quarter of 2022, bringing its year-to-date performance to the third worst since the 1950s. The noticeable tightening of financial conditions, guided by expectations for a more aggressive global interest rate cycle, was the dominant story during these months. The Fed increased its “raise and hold” messaging, based on higher than expected August core inflation data and a still-tight labor market that showed only moderate signs of cooling. Geopolitical tensions remained
President’s Letter (unaudited) (continued)
heightened due to the possible weaponization of energy flows, keeping energy prices relatively high. Further weighing on the U.S. equities market during the quarter were concerns that corporate earnings could suffer given a combination of profit margin pressures, slowing demand, higher labor costs, slower economic activity and a stronger U.S. dollar eroding international sales.
In the fourth quarter of 2022, the S&P 500® Index broke the streak of losses with a gain, attributable primarily to October and November. Macroeconomic data remained mixed, but there was a broad expectation the Fed might reduce the pace of its monetary policy tightening, which was realized when it announced a 50 basis point interest rate hike in December, following four successive 75 basis point increases. Positive inflation developments further supported hopes of a peak in Fed tightening, with inflation rates decreasing in each month during the quarter. Still, the Fed maintained its hawkish tone, which remained a headwind for the U.S. equities market. (Hawkish tends to suggest higher interest rates; opposite of dovish.) Further, as the year came to a close, corporate earnings reports disappointed, and many, especially in the technology sector, focused on cost-cutting measures, including layoffs.
Value stocks meaningfully outperformed growth stocks across the capitalization spectrum of the U.S. equity market for the annual period ended December 31, 2022. Within the U.S. equity market, all segments declined, but small-cap stocks were weakest, followed by large-cap stocks and then mid-cap stocks. (All as measured by the FTSE Russell indices.3)
In the S&P 500® Index, nine of the 11 sectors generated negative absolute total returns during the annual period. Information technology, consumer discretionary and communication services were the weakest performing sectors in the S&P 500® Index during the annual period. Conversely, energy was by far the best relative performer, followed at some distance by utilities—the only two sectors to produce a positive total return during the annual period.
The U.S. equity markets generally performed in line with the international equity markets during the annual period. Developed and emerging market equities, as measured by the MSCI EAFE Index3 and MSCI Emerging Markets Index3, respectively, posted annual returns of -14.45% and -20.09%, respectively. As was the case for the U.S. equity markets, international equity markets, both developed and emerging, faced pressures from global concerns around rising inflation, interest rate hikes by the U.S. Fed and other major central banks around the world, rising bond yields, valuation concerns and the war in Ukraine. The geopolitical crisis also drove concerns around its impact on commodity prices—particularly in Europe, as Russia halted already curtailed natural gas exports to the region at the end of August 2022. Other uncertainties included those around slowing economic growth in China, exacerbated by its zero-COVID policy, leading, in turn, to further supply-chain issues. Emerging markets equities fell on similar drivers but were particularly affected by a strong U.S. dollar, volatile commodities markets, contentious political elections, government defaults and supply-chain effects from China’s zero-COVID-19 policy lockdowns. Notably, effective March 9, 2022, MSCI Inc. removed Russian securities from the MSCI Emerging Markets Index after deeming the Russian equity market “uninvestable” amidst Russia’s invasion of Ukraine. MSCI Inc. announced the MSCI Russia Indexes would be reclassified to “standalone markets” instead of “emerging markets” across all of MSCI’s indexes “at a price that is effectively zero.”
Fixed Income Market Review
The broad U.S. investment grade fixed income market, as measured by the Bloomberg US Aggregate Bond Index4, posted a return of -13.01% during the annual period, challenged by rising interest rates, as persistently high inflation led to aggressive monetary policy tightening by the Fed. Still, for the annual period overall, the U.S. fixed income market outperformed the broad U.S. equity market. Bond prices fell and yields rose across the yield curve, or spectrum of maturities, during the annual period. (There is usually an inverse relationship between bond prices and yield movements, so that bond prices rise when yields decrease and vice versa.)
For the annual period overall, the yield on the three-month U.S. Treasury bill rose approximately 436 basis points, while the yield on the two-year U.S. Treasury note increased approximately 368 basis points, and the yield on the five-year U.S. Treasury note rose approximately 273 basis points. (A basis point is 1/100th of a percentage point.) The yield on the bellwether 10-year U.S. Treasury note increased approximately 236 basis points, and the yield on the 30-year U.S. Treasury bond rose approximately 207 basis points during the annual period. Yields rose primarily in response to rising inflation and the Fed’s series of seven interest rate hikes, which sought to contain that inflation. As investors feared an economic slowdown in reaction to the interest rate hikes, the yield curve flattened5, meaning the spread, or yield differential, between two-year and 30-year maturities narrowed during the annual period. Indeed, as short- to intermediate-term maturity yields rose more than longer-term maturity yields, the U.S. Treasury yield curve actually inverted in the last months of 2022, with yields on shorter-term maturities higher than those on longer-term maturities.
Virtually all fixed income sectors recorded negative absolute returns during the annual period. However, on a relative basis, investment grade corporate bonds and sovereign emerging markets debt underperformed U.S. Treasury securities the most given their longer durations.
President’s Letter (unaudited) (continued)
***
Just as we remain focused on long-term, strategic investing through all market conditions, we encourage you to do so as well.
We thank you for trusting us to be a part of your long-term, comprehensive investment strategy. We appreciate your confidence in the Value Line Funds and look forward to serving your investment needs in the years ahead just as we have been helping to secure generations’ financial futures since 1950—based on solid fundamentals, sound investment principles and the power of disciplined and rigorous analytics.
To stay current with timely commentary and investment insights and/or if you would like additional information on the Funds, we invite you to contact your investment representative or visit us at www.vlfunds.com.
Sincerely,
Mitchell Appel
President of the Value Line Funds
The opinions expressed herein are those of EULAV Asset Management and its investment team. The opinions referenced are as of the date of publication and are subject to change due to changes in the market or economic conditions and may not necessarily come to pass. There is no guarantee of the future performance of any Value Line Funds investment portfolio. Nothing herein should be construed as a solicitation, recommendation or an offer to buy, sell or hold any securities, other investments or to adopt any investment strategy or strategies. For educational use only. This information is not intended to serve as investment advice. This material is not intended to be relied upon as a forecast or research.
Past performance does not guarantee future results. Investment return and principal value of an investment can fluctuate so that an investor’s shares, when redeemed, may be worth more or less than their original cost; and that current performance may be lower or higher than the performance data quoted. Investors should carefully consider the investment objective, risks, charges and expense of a fund. This and other important information about a fund is contained in the fund’s prospectus. A copy of our Funds’ prospectuses can be obtained free of charge by going to our website at www.vlfunds.com or calling toll-free 800.243.2729.
The Value Line Funds are distributed by EULAV Securities LLC.
*
Data, rankings and ratings are based on the Investor Class of the Fund.
1
Morningstar, Inc. is an investment research and investment management firm headquartered in Chicago, Illinois, United States.
2
The Morningstar RatingTM for funds, or "star rating", is calculated for managed products (including mutual funds, variable annuity and variable life subaccounts, exchange-traded funds, closed-end funds, and separate accounts) with at least a three-year history. Exchange-traded funds and open-ended mutual funds are considered a single population for comparative purposes. It is calculated based on a Morningstar Risk-Adjusted Return measure that accounts for variation in a managed product's monthly excess performance, placing more emphasis on downward variations and rewarding consistent performance. The top 10% of products in each product category receive 5 stars, the next 22.5% receive 4 stars, the next 35% receive 3 stars, the next 22.5% receive 2 stars, and the bottom 10% receive 1 star. The Overall Morningstar Rating for a managed product is derived from a weighted average of the performance figures associated with its three-, five-, and 10-year (if applicable) Morningstar Rating metrics. The weights are: 100% three-year rating for 36-59 months of total returns, 60% five-year rating/40% three-year rating for 60-119 months of total returns, and 50% 10-year rating/30% five-year rating/20% three-year rating for 120 or more months of total returns. While the 10-year overall star rating formula seems to give the most weight to the 10-year period, the most recent three-year period actually has the greatest impact because it is included in all three rating periods.
i
For Value Line Small Cap Opportunities Fund, Inc.: Ranked by Morningstar in the 12th percentile for one-year (604 funds), 29th percentile for three-year (576 funds), 43rd percentile for five-year (530 funds) and 35th percentile for 10-year (399 funds) periods ended December 31, 2022. All in the Morningstar small growth category. Five-star rating for 10-year (399 funds) and overall (576 funds) periods ended December 31, 2022 and four-star rating for 3-year (576 funds) and 5-year (530 funds) periods ended December 31, 2022. All in the Morningstar small growth category. Morningstar Risk: Low for the 3-year, 5-year, 10-year and overall periods ended December 31, 2022.
ii
For Value Line Mid Cap Focused Fund, Inc.: Ranked by Morningstar in the 4th percentile for one-year (586 funds), 8th percentile for three-year (534 funds), 5th percentile for five-year (499 funds) and 6th percentile for ten-year (389 funds) periods ended December 31, 2022. All in the Morningstar mid-cap growth category. Five-star rating for 3-year (534 funds); 5-year (499 funds); 10-year (389 funds) and overall (534 funds) periods ended December 31, 2022. All in the Morningstar mid-cap growth category. Morningstar Risk: Low for the 3-year, 5-year, 10-year and overall periods ended December 31, 2022. Morningstar Return: High for the 3-year, 5-year, 10-year and overall periods ended December 31, 2022.
President’s Letter (unaudited) (continued)
iii
For Value Line Select Growth Fund, Inc.: Ranked by Morningstar in the 15th percentile for one-year (1235 funds), 35th percentile for three-year (1131 funds), 13th percentile for five-year (1054 funds) and 60th percentile for ten-year (804 funds) periods ended December 31, 2022. All in the Morningstar large growth category. Four-star rating for 3-year (1131 funds), 5-year (1054 funds) and overall (1131 funds) periods ended December 31, 2022; three-star rating for 10-year (804 funds) period ended December 31, 2022. All in the Morningstar large growth category. Morningstar Risk: Average for the 3-year period ended December 31, 2022; Below Average for the 5-year, 10-year and overall periods ended December 31, 2022.
iv
For Value Line Asset Allocation Fund, Inc.: Ranked by Morningstar in the 60th percentile for one-year (757 funds), 53rd percentile for three-year (697 funds), 6th percentile for five-year (657 funds) and 9th percentile for 10-year (490 funds) periods ended December 31, 2022. All in the Morningstar allocation 50% to 70% equity category. Three-star rating for 3-year (697 funds) period ended December 31, 2022; five-star rating for 5-year (657 funds), 10-year (490 funds) and overall (697 funds) periods ended December 31, 2022. All in the allocation 50% to 70% equity category. Morningstar Return: Average for the 3-year period ended December 31, 2022; High for the 5-year and 10-year periods ended December 31, 2022; and Above Average for the overall period ended December 31, 2022.
v
For Value Line Core Bond Fund: Ranked by Morningstar in the 21st percentile for one-year (453 funds), 88th percentile for three-year (405 funds), 88th percentile for five-year (372 funds) and 88th percentile for 10-year (275 funds) periods ended December 31, 2022. All in the Morningstar intermediate core bond category. Morningstar Risk: Below Average for the 3-year, 5-year, 10-year and overall periods ended December 31, 2022.
3
The S&P 500® Index consists of 500 stocks that are traded on the New York Stock Exchange, American Stock Exchange and the NASDAQ national Market System and is representative of the broad stock market. The MSCI EAFE Index is an equity index that captures large-cap and mid-cap representation across 21 developed markets countries around the world, excluding the U.S. and Canada. The index covers approximately 85% of the free float-adjusted market capitalization in each country. The MSCI Emerging Markets Index captures large-cap and mid-cap representation across 27 emerging markets countries. The index covers approximately 85% of the free float-adjusted market capitalization in each country. The FTSE Russell indices are a broad range of U.S. indices that allow investors to track current and historical market performance by specific size, investment style and other market characteristics. These are unmanaged indices and do not reflect charges, expenses or taxes, and it is not possible to directly invest in these indices.
4
The Bloomberg US Aggregate Bond Index is a broad-based benchmark that measures the investment grade, U.S. dollar-denominated, fixed-rate taxable bond market, including U.S. Treasuries, government-related and corporate securities, MBS (agency fixed-rate and hybrid ARM pass-throughs), ABS and CMBS. This is an unmanaged index and does not reflect charges, expenses or taxes, which are deducted from the Fund’s return. It is not possible to directly invest in this index.
5
A flattening yield curve is one in which the differential between yields on shorter-term and longer-term maturities narrows. A steepening yield curve is one in which longer-term yields are increasingly higher than shorter-term yields.
Value Line Small Cap Opportunities Fund, Inc.
PORTFOLIO MANAGEMENT COMMENTARY (unaudited)
INVESTMENT OBJECTIVE
The Fund’s investment objective is long-term growth of capital.
Manager Discussion of Fund Performance
Shareholders of Value Line Small Cap Opportunities Fund, Inc. (the “Fund”) received an annual report covering the 12 months ended March 31, 2022. The fiscal year-end of the Fund was subsequently changed from March 31st to December 31st. As such, below, Fund portfolio manager Stephen E. Grant discusses the Fund’s performance and positioning for the nine months ended December 31, 2022 (the “reporting period”).
How did the Fund perform during the reporting period?
The Fund’s Investor Class generated a total return of -8.73% during the nine months ended December 31, 2022. This compares to the -13.96% return of the Fund’s benchmark, the Russell 2000® Index1, during the same reporting period.
What key factors were responsible for the Fund’s performance during the reporting period?
While absolute returns disappointed, the Fund significantly outperformed the Russell 2000® Index on a relative basis during the nine-month reporting period due primarily to stock selection. Sector allocation detracted modestly from relative results during the reporting period.
Further, during the reporting period, higher-quality stocks outpaced lower-quality, more speculative stocks within the broad U.S. equity market, as economic uncertainty and market volatility persisted. The Fund held more higher-quality stocks on average than did the Russell 2000® Index, supporting its outperformance during a down market.
Which equity market sectors most significantly affected Fund performance?
Relative to the Russell 2000® Index, effective stock selection in and having an overweighted exposure to the comparatively strongly performing industrials sector contributed most positively to the Fund’s results. The Fund also benefited from strong individual stock selection in the consumer discretionary, information technology and materials sectors. Having no exposure to the real estate sector, which was the second-weakest sector in the Russell 2000® Index during the reporting period, helped as well.
Only partially offsetting these positive contributors was the dampening effect of having no holdings in the energy sector, which was, by far, the best performing sector in the Russell 2000® Index during the reporting period. Having an underweighted allocation to the utilities sector, which posted a negative absolute return but notably outpaced the Russell 2000® Index during the reporting period, and weak stock selection in the health care sector also detracted.
What were some of the Fund’s best-performing individual stocks?
Among the individual stocks that contributed most positively to the Fund’s relative results were RLI, an insurance company; ExlServices Holdings, a data analytics and digital operations company; and Aaon, a provider of semi-custom heating, ventilation, and air conditioning equipment for commercial use. Each of these companies enjoyed a robust double-digit share price gain during the reporting period, in each case because of stronger than expected operating results.
Which stocks detracted significantly from the Fund’s performance during the reporting period?
During the reporting period, among the stocks that detracted most from the Fund’s relative performance were positions in Omnicell, a medication and medical supply management solutions provider for the healthcare industry; Rapid7, a security data and analytics solutions provider; and Five9, a cloud-based call center software provider. Each of these stocks posted a substantial double-digit negative return, in each case because of weaker than expected operating results.
How did the Fund use derivatives and similar instruments during the reporting period?
The Fund did not use derivatives as part of its strategy during the reporting period.
Did the Fund make any significant purchases or sales during the reporting period?
Among the new Fund positions established during the reporting period were industrial equipment company Franklin Electric, medical device company Penumbra and building and service provider for mechanical, electrical, and plumbing building systems Comfort Systems USA. The qualities we seek in new investments include a favorable history of both earnings and stock price growth and strong recent operating performance.
Value Line Small Cap Opportunities Fund, Inc. (continued)
Conversely, among those positions eliminated from the Fund’s portfolio during the reporting period were ACI Worldwide, which provides real-time electronic payment and banking solutions; Itron, a technology and services company offering solutions to measure, manage and analyze energy, gas and water usage; and LivePerson, a global technology company that develops conversational commerce and artificial intelligence software. In each case, these positions were sold because we believed they were no longer delivering the consistent long-term earnings growth we seek.
Were there any notable changes in the Fund’s sector weightings during the reporting period?
There were no notable changes in the Fund’s sector weightings relative to the Russell 2000® Index during the reporting period.
How was the Fund positioned relative to its benchmark index at the end of December 2022?
As of December 31, 2022, the Fund was overweighted relative to the Russell 2000® Index in the industrials, information technology, materials and consumer discretionary sectors. The Fund was underweighted relative to the Russell 2000® Index in the health care, financials, communication services and utilities sectors and had a rather neutral exposure relative to the Russell 2000® Index in consumer staples on the same date. The Fund had no exposure to the energy or real estate sectors on December 31, 2022.
What is your tactical view and strategy for the months ahead?
As always, we intend to stay true to our time-tested investment discipline going forward, seeking to invest in companies that have demonstrated a solid history of consistent growth in both their earnings and stock price. We believe these companies possess enviable portfolios of proprietary products and services that give them strong market positions and make them less vulnerable to swings in national and international economic conditions. In our experience, the stocks of these companies tend to be less volatile than the average small-cap stock, and therefore the Fund has historically provided a smoother ride to investors than its peer group average. At the same time, however, past performance is no guarantee of future results, and small-cap stocks in general are often more volatile than larger-cap stocks. Accepting the short-term ebbs and flows inevitable in the stock market, we believe investments in these companies may well provide superior returns to our shareholders maintaining a long-term perspective.
1
The Russell 2000® Index is representative of the smaller capitalization stocks traded in the United States.
Value Line Small Cap Opportunities Fund, Inc.
Portfolio Highlights at December 31, 2022 (unaudited)
| | | |
| | | |
| | | |
| | | |
| | | |
ExlService Holdings, Inc. | | | |
| | | |
| | | |
| | | |
| | | |
| | | |
| | | |
Asset Allocation — Percentage of Net Assets |
|
Sector Weightings — Percentage of Total Investments In Securities* |
|
| Excludes short-term investments, if any. |
Value Line Small Cap Opportunities Fund, Inc.
Portfolio Highlights at December 31, 2022 (unaudited) (continued)
The following graph compares the performance of the Value Line Small Cap Opportunities Fund, Inc. to that of the Russell 2000 Index*** (the “Index”). The Value Line Small Cap Opportunities Fund, Inc. is a professionally managed mutual fund, while the Index is not available for investment and is unmanaged. The returns for the Index do not reflect charges, expenses or taxes but do include the reinvestment of dividends, if any. The comparison is shown for illustrative purposes only.
Comparison of a Change in Value of a $10,000 Investment in the Value Line Small Cap Opportunities Fund, Inc. and the Russell 2000® Index**Value Line Small Cap Opportunities Fund, Inc.
As of 12/31/2022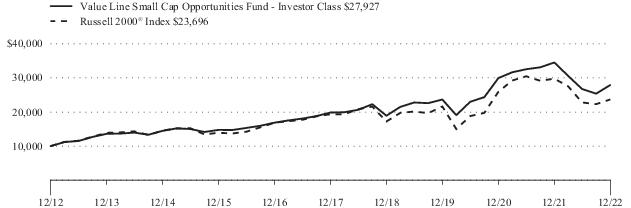
Performance Data: **
Average Annual Total Returns (For periods ended 12/31/2022)
| | | | | |
| | | | | |
Value Line Small Cap Opportunities Fund, Inc. | | | | | |
| | | | | |
| | | | | |
| | | | | |
Value Line Small Cap Opportunities Fund, Inc. | | | | | |
| | | | | |
**
The performance data quoted represent past performance and are no guarantee of future performance. The investment return and principal value of an investment will fluctuate so that an investment, when redeemed, may be worth more or less than its original cost. The performance data includes reinvestment of all dividends and distributions but does not reflect the deduction of taxes that a shareholder would pay on fund distributions or the redemption of fund shares.
***
The Russell 2000® Index is representative of the smaller capitalization stocks traded in the United States.
Value Line Small Cap Opportunities Fund, Inc.
| | |
|
COMMUNICATION SERVICES 0.8% |
| |
| | |
CONSUMER DISCRETIONARY 13.2% |
| |
| | |
| AUTO PARTS & EQUIPMENT 0.6% |
| | |
| |
| | |
| ENGINEERING & CONSTRUCTION 1.0% |
| | |
| |
| | |
| |
| Cavco Industries, Inc.(1) | |
| | |
| | |
| |
| | |
| |
| Planet Fitness, Inc. Class A(1) | |
| |
| | |
| | |
| | |
| | |
|
| |
| | |
| |
| | |
| | |
| | |
| | |
| | |
|
| |
| First Financial Bankshares, Inc. | |
| | |
| | |
| DIVERSIFIED FINANCIALS 1.6% |
| | |
| |
| | |
| | |
| Selective Insurance Group, Inc. | |
| | |
| | |
| | |
COMMON STOCKS 98.6% (continued) |
|
| |
| AMN Healthcare Services, Inc.(1) | |
| |
| | |
| iRhythm Technologies, Inc.(1) | |
| | |
| | |
| | |
| | |
| | |
| |
| | |
| | |
| Medpace Holdings, Inc.(1) | |
| US Physical Therapy, Inc. | |
| | |
| | |
|
| |
| | |
| |
| | |
| Lennox International, Inc. | |
| | |
| | |
| |
| | |
| | |
| Healthcare Services Group, Inc. | |
| | |
| | |
| | |
| |
| CACI International, Inc. Class A(1) | |
| DISTRIBUTION/WHOLESALE 0.7% |
| SiteOne Landscape Supply, Inc.(1) | |
| ELECTRICAL EQUIPMENT 1.1% |
| | |
| |
| | |
| ENGINEERING & CONSTRUCTION 5.0% |
| Comfort Systems USA, Inc. | |
| Dycom Industries, Inc.(1) | |
| | |
| | |
| |
| Franklin Electric Co., Inc. | |
| MACHINERY - DIVERSIFIED 4.7% |
| Applied Industrial Technologies, Inc. | |
| | |
See Notes to Financial Statements.
| | |
COMMON STOCKS 98.6% (continued) |
INDUSTRIALS 33.5% (continued) |
| MACHINERY - DIVERSIFIED 4.7% (continued) |
| | |
| Watts Water Technologies, Inc. Class A | |
| | |
| METAL FABRICATE/HARDWARE 3.0% |
| | |
| MISCELLANEOUS MANUFACTURERS 2.3% |
| | |
| | |
| John Bean Technologies Corp. | |
| | |
| |
| Rush Enterprises, Inc. Class A | |
| |
| | |
| |
| | |
| |
| | |
| | |
INFORMATION TECHNOLOGY 18.9% |
| |
| Alarm.com Holdings, Inc.(1) | |
| |
| ExlService Holdings, Inc.(1) | |
| Insight Enterprises, Inc.(1) | |
| | |
| | |
| | |
| | |
| ELECTRICAL EQUIPMENT 0.6% |
| | |
| |
| | |
| | |
| | |
| |
| | |
| MISCELLANEOUS MANUFACTURERS 1.1% |
| | |
| |
| | |
| | |
| | |
| | |
COMMON STOCKS 98.6% (continued) |
INFORMATION TECHNOLOGY 18.9% (continued) |
| SOFTWARE 7.9% (continued) |
| | |
| | |
| | |
| | |
|
| |
| | |
| | |
| | |
| PACKAGING & CONTAINERS 3.3% |
| | |
| | |
| | |
| | |
|
| |
| American States Water Co. | |
TOTAL COMMON STOCKS
(Cost $211,281,376) | |
SHORT-TERM INVESTMENTS 2.1% |
| |
| State Street Institutional U.S. Government Money Market Fund, Premier Class, 4.12%(3) | |
| State Street Navigator Securities Lending Government Money Market Portfolio(4) | |
| | |
TOTAL SHORT-TERM INVESTMENTS
(Cost $7,883,710) | |
TOTAL INVESTMENTS IN SECURITIES 100.7%
(Cost $219,165,086) | |
EXCESS OF LIABILITIES OVER CASH AND OTHER ASSETS (0.7)% | |
| |
| |
| A portion or all of the security was held on loan. As of December 31, 2022, the market value of the securities on loan was $4,465,529. |
| Rate reflects 7 day yield as of December 31, 2022. |
| Securities with an aggregate market value of $4,465,529 were out on loan in exchange for collateral including $2,761,361 of cash collateral as of December 31, 2022. The collateral was invested in a cash collateral reinvestment vehicle. |
See Notes to Financial Statements.
Schedule of Investments (continued)
The following table summarizes the inputs used to value the Fund's investments in securities as of December 31, 2022 (See Note 1(B)):
Investments in Securities: | | | | |
| | | | |
| | | | |
| | | | |
Total Investments in Securities | | | | |
| See Schedule of Investments for further breakdown by category. |
See Notes to Financial Statements.
Value Line Mid Cap Focused Fund, Inc.
PORTFOLIO MANAGEMENT COMMENTARY (unaudited)
INVESTMENT OBJECTIVE
The Fund’s sole investment objective is long-term growth of capital.
Manager Discussion of Fund Performance
Below, Value Line Mid Cap Focused Fund, Inc. portfolio manager Stephen E. Grant discusses the Fund’s performance and positioning for the 12 months ended December 31, 2022.
How did the Fund perform during the annual period?
The Fund’s Investor Class generated a total return of -9.56% during the 12 months ended December 31, 2022. This compares to the -18.11% return of the Fund’s benchmark, the S&P 500® Index, during the same annual period.
What key factors were responsible for the Fund’s performance during the 12-month reporting period?
While absolute returns disappointed, the Fund significantly outperformed the S&P 500® Index on a relative basis during the 12-month reporting period, driven primarily by effective stock selection overall. Sector allocation decisions as a whole also boosted the Fund’s relative results. Such positive contributors more than offset the relative disadvantage the Fund faced, as the annual period was one wherein value stocks beat growth stocks across the capitalization spectrum of the U.S. equity market, and the Fund emphasizes growth over value.
Which equity market sectors most significantly affected Fund performance?
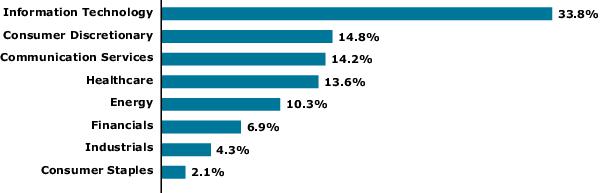
The Fund was helped most by effective stock selection in the information technology and financials sectors. The Fund also benefited from having no holdings in communication services, which was the weakest sector in the S&P 500® Index during the annual period, and from having an overweighted allocation to the industrials sector, which significantly outpaced the S&P 500® Index during the annual period.
These positive contributors were only partially offset by weak stock selection in the health care sector, which detracted. Further dampening the Fund’s relative results was its lack of exposure to energy and utilities—the two strongest sectors in the S&P 500® Index during the annual period.
What were some of the Fund’s best-performing individual stocks?
Among the individual stocks that contributed most to the Fund’s relative results were two insurance company holdings—W.R. Berkley and Arch Capital Group. Another strong contributor to the Fund’s results was Fair Isaac, also known as FICO, which provides credit scores, analytics software solutions and services, and risk management tools for businesses worldwide. Each of these three companies enjoyed a double-digit share price gain during the annual period because of stronger than expected operating performance.
Which stocks detracted significantly from the Fund’s performance during the annual period?
During the annual period, the Fund was hurt most by positions in swimming pool supplies and equipment distributor Pool, integrated information management solutions and services provider for the public sector Tyler Technologies and engineering simulation software and services company ANSYS. Each of these companies experienced a substantial double-digit share price decline during the annual period because of weaker than expected operating performance.
How did the Fund use derivatives and similar instruments during the reporting period?
The Fund did not use derivatives during the reporting period.
Did the Fund make any significant purchases or sales during the annual period?
New positions added to the Fund’s portfolio during the annual period were corporate identity uniforms and related business services provider Cintas; advanced analytics, technology solution and clinical research services provides to the health care industry Iqvia Holdings; and data communications and telecommunications equipment provider Motorola Solutions. In our view, each has established a consistent history of strong earnings growth and stock price growth.
Value Line Mid Cap Focused Fund, Inc. (continued)
Conversely, we eliminated from the Fund’s portfolio positions in household products manufacturer Church & Dwight, packaging products manufacturer Ball Corp. and insurance company Arch Capital Group, the last of which was mentioned earlier. We sold the positions because we believed these companies would no longer deliver the consistent long-term growth we seek. This focused Fund ended the annual period with 34 holdings in its common stock portfolio as compared to 29 at the start of the calendar year.
Were there any notable changes in the Fund’s weightings during the 12-month period?
We shifted during the annual period from having an overweight to an underweight position in materials, from an underweight to a relatively neutral position in health care, and from rather neutral positions to underweights in financials and consumer staples relative to the S&P 500® Index.
How was the Fund positioned relative to its benchmark index at the end of December 2022?
As of December 31, 2022, the Fund was overweighted relative to the S&P 500® Index in the information technology and industrials sectors. The Fund was underweighted relative to the S&P 500® Index in the consumer discretionary, materials, financials and consumer staples sectors and was rather neutrally weighted relative to the S&P 500® Index in the health care and real estate sectors on the same date. On December 31, 2022, the Fund held no positions at all in the energy, communication services or utilities sectors.
What is your tactical view and strategy for the months ahead?
Regardless of market conditions, we intend to stay true to our time-tested investment discipline going forward, seeking to invest in companies that have demonstrated a solid history of consistent growth in both their earnings and stock price. In our view, these companies possess attractive portfolios of proprietary products and services that give them strong market positions and make them less vulnerable to swings in national and international economic conditions. At the same time, we believe the underlying stocks of these companies tend to be less volatile than the average stock in the S&P 500® Index. By maintaining our investment discipline, the Fund has historically provided a smoother ride to investors than its peer group averages. Putting aside short-term ebbs and flows in the equity market, we believe the Fund’s investments are likely to provide superior returns to our shareholders over the long term.
Value Line Mid Cap Focused Fund, Inc.
Portfolio Highlights at December 31, 2022 (unaudited)
| | | |
| | | |
| | | |
| | | |
Teledyne Technologies, Inc. | | | |
Cadence Design Systems, Inc. | | | |
| | | |
| | | |
| | | |
| | | |
American Financial Group, Inc. | | | |
| | | |
Asset Allocation — Percentage of Net Assets |
|
Sector Weightings — Percentage of Total Investments In Securities* |
|
| Excludes short-term investments, if any. |
Value Line Mid Cap Focused Fund, Inc.
Portfolio Highlights at December 31, 2022 (unaudited) (continued)
The following graph compares the performance of the Value Line Mid Cap Focused Fund, Inc. to that of the S&P 500® Index*** (the “Index”). The Value Line Mid Cap Focused Fund, Inc. is a professionally managed mutual fund, while the Index is not available for investment and is unmanaged. The returns for the Index do not reflect charges, expenses or taxes, but do include the reinvestment of dividends, if any. The comparison is shown for illustrative purposes only.
Comparison of a Change in Value of a $10,000 Investment in the Value Line Mid Cap Focused Fund, Inc. and the S&P 500® Index**Value Line Mid Cap Focused Fund, Inc.
As of 12/31/2022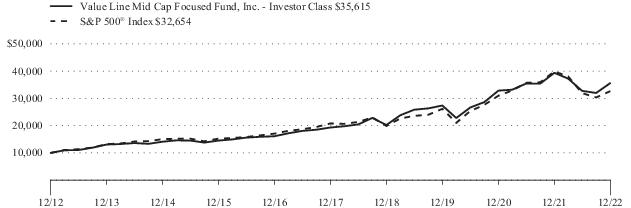
Performance Data: **
Average Annual Total Returns (For year ended 12/31/2022)
| | | | |
| | | | |
Value Line Mid Cap Focused Fund, Inc. | | | | |
| | | | |
| | | | |
| | | | |
Value Line Mid Cap Focused Fund, Inc. | | | | |
| | | | |
**
The performance data quoted represent past performance and are no guarantee of future performance. The investment return and principal value of an investment will fluctuate so that an investment, when redeemed, may be worth more or less than its original cost. The performance data includes reinvestments of all dividends and distributions but does not reflect the deduction of taxes that a shareholder would pay on fund distributions or the redemption of fund shares.
***
The S&P 500® Index is an unmanaged index that is representative of the larger-capitalization stocks traded in the United States.
Value Line Mid Cap Focused Fund, Inc.
| | |
|
CONSUMER DISCRETIONARY 7.3% |
| DISTRIBUTION/WHOLESALE 4.4% |
| | |
| |
| | |
| | |
|
| |
| | |
|
| |
| American Financial Group, Inc. | |
| | |
| | |
| |
| | |
| | |
|
| |
| Mettler-Toledo International, Inc.(1) | |
| |
| | |
| IDEXX Laboratories, Inc.(1) | |
| | |
| | |
| |
| | |
| | |
| | |
| | |
|
| |
| | |
| | |
| | |
| |
| Lennox International, Inc. | |
| |
| | |
| | |
| | |
| ENGINEERING & CONSTRUCTION 2.5% |
| | |
| ENVIRONMENTAL CONTROL 2.0% |
| | |
| | |
INFORMATION TECHNOLOGY 38.5% |
| |
| | |
| |
| | |
| | |
COMMON STOCKS 96.1% (continued) |
INFORMATION TECHNOLOGY 38.5% (continued) |
| COMPUTERS 5.3% (continued) |
| | |
| | |
| MISCELLANEOUS MANUFACTURERS 4.6% |
| Teledyne Technologies, Inc.(1) | |
| |
| | |
| Cadence Design Systems, Inc.(1) | |
| | |
| | |
| Jack Henry & Associates, Inc. | |
| | |
| Tyler Technologies, Inc.(1) | |
| | |
| |
| | |
| | |
| | |
| | |
|
| PACKAGING & CONTAINERS 2.1% |
| | |
|
| |
| Equity Lifestyle Properties, Inc. REIT | |
TOTAL COMMON STOCKS
(Cost $362,821,556) | |
SHORT-TERM INVESTMENTS 3.9% |
| |
| State Street Institutional U.S. Government Money Market Fund, Premier Class, 4.12%(3) | |
| State Street Navigator Securities Lending Government Money Market Portfolio(4) | |
| | |
TOTAL SHORT-TERM INVESTMENTS
(Cost $20,425,386) | |
TOTAL INVESTMENTS IN SECURITIES 100.0%
(Cost $383,246,942) | |
CASH AND OTHER ASSETS IN EXCESS OF LIABILITIES 0.0% | |
| |
| |
| A portion or all of the security was held on loan. As of December 31, 2022, the market value of the securities on loan was $4,047,723. |
| Rate reflects 7 day yield as of December 31, 2022. |
| Securities with an aggregate market value of $4,047,723 were out on loan in exchange for collateral including $1,677,909 of cash collateral as of December 31, 2022. The collateral was invested in a cash collateral reinvestment vehicle. |
See Notes to Financial Statements.
Schedule of Investments (continued)
| American Depositary Receipt. |
| Real Estate Investment Trusts. |
The following table summarizes the inputs used to value the Fund's investments in securities as of December 31, 2022 (See Note 1(B)):
Investments in Securities: | | | | |
| | | | |
| | | | |
| | | | |
Total Investments in Securities | | | | |
| See Schedule of Investments for further breakdown by category. |
See Notes to Financial Statements.
Value Line Select Growth Fund, Inc.
PORTFOLIO MANAGEMENT COMMENTARY (unaudited)
INVESTMENT OBJECTIVE
The Fund’s sole investment objective is long-term growth of capital.
Manager Discussion of Fund Performance
Below, Value Line Select Growth Fund, Inc. portfolio manager Stephen E. Grant discusses the Fund’s performance and positioning for the 12 months ended December 31, 2022.
How did the Fund perform during the annual period?
The Fund’s Investor Class generated a total return of -20.67% during the 12 months ended December 31, 2022. This compares to the -18.11% return of the Fund’s benchmark, the S&P 500® Index, during the same annual period.
What key factors were responsible for the Fund’s performance during the 12-month reporting period?
The Fund underperformed the S&P 500® Index during the 12-month reporting period, driven by a combination of stock selection and sector allocation decisions overall. Further, the annual period was one wherein value stocks beat growth stocks across the capitalization spectrum of the U.S. equity market. This put the Fund at a relative disadvantage, as the Fund emphasizes growth over value.
Which equity market sectors most significantly affected Fund performance?
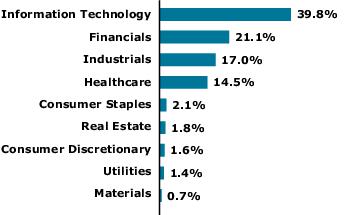
The Fund was hurt most by weak stock selection in the health care and consumer staples sectors. Further detracting from the Fund’s relative results was its lack of exposure to energy, the strongest sector by far in the S&P 500® Index during the annual period.
Partially offsetting these detractors was the positive contribution made by having only a small exposure to consumer discretionary and having no exposure at all to communication services, the two weakest sectors in the S&P 500® Index during the annual period. Further boosting the Fund’s relative results was effective stock selection in and having an overweighting to the industrials sector, which posted negative absolute returns but significantly outpaced the S&P 500® Index on a relative basis during the annual period.
Which stocks detracted significantly from the Fund’s performance during the annual period?
The most significant detractors from the Fund’s performance were positions in cloud-based customer relationship management software company Salesforce, information technology services and consulting firm Accenture and software and technology services firm Intuit. Each significantly lagged the S&P 500® Index during the annual period, reflecting weaker than expected operating performance at each of these three information technology sector companies.
What were some of the Fund’s best-performing individual stocks?
Among the individual stocks that contributed most to the Fund’s relative results were those in which it held no position—namely, e-commerce behemoth Amazon.com and electric vehicle maker Tesla. Not holding these stocks helped because they were among the top detractors from the S&P 500® Index during the annual period. Having an overweight position in Cintas, which posted positive absolute returns during the annual period, also boosted the Fund’s relative results. Cintas, which provides corporate identity uniforms and related business services, performed well on stronger than expected operating performance.
How did the Fund use derivatives and similar instruments during the reporting period?
The Fund did not use derivatives during the reporting period.
Did the Fund make any significant purchases or sales during the annual period?
During the annual period, we established one new Fund position—in insurance and professional services firm Marsh & McLennan, which, in our view, continues to deliver consistent, attractive long-term growth in both earnings and stock price.
Conversely, we eliminated the Fund’s positions in TJX, a leading off-price apparel and home fashions retailer; Fidelity National Information Services, a provider of technology solutions for merchants, banks and capital markets firms globally; and HEICO, an aerospace and electronics company. We believed each was no longer generating the consistent long-term growth we seek. The Fund had 28 holdings in its common stock portfolio as of December 31, 2022, as compared to 32 at the start of the annual period.
Value Line Select Growth Fund, Inc. (continued)
Were there any notable changes in the Fund’s weightings during the 12-month period?
The only notable change in the Fund’s sector weightings relative to the S&P 500® Index during the 12-month period ended December 31, 2022 was a shift from an underweight to an overweight position in financials. We also shifted during the annual period from underweighted exposure to no exposure to the consumer discretionary and real estate sectors.
How was the Fund positioned relative to its benchmark index at the end of December 2022?
As of December 31, 2022, the Fund was overweighted relative to the S&P 500® Index in the industrials, information technology, health care and financials sectors. The Fund was underweighted relative to the S&P 500® Index in the consumer staples and materials sectors. The Fund had no allocations to the consumer discretionary, real estate, energy, communication services or utilities sectors on the same date.
What is your tactical view and strategy for the months ahead?
Regardless of market conditions, we intend to stay true to our time-tested investment discipline going forward, seeking to invest in companies that have demonstrated a solid history of consistent growth in both their earnings and stock price. In our view, these companies possess attractive portfolios of proprietary products and services that give them strong market positions and make them less vulnerable to swings in national and international economic conditions. At the same time, we believe the underlying stocks of these companies tend to be less volatile than the average stock in the S&P 500® Index. By maintaining our investment discipline, the Fund has historically provided a smoother ride to investors than its peer group averages. Putting aside short-term ebbs and flows in the equity market, we believe the Fund’s investments are likely to provide superior returns to our shareholders over the long term.
Value Line Select Growth Fund, Inc.
Portfolio Highlights at December 31, 2022 (unaudited)
| | | |
| | | |
| | | |
| | | |
Thermo Fisher Scientific, Inc. | | | |
| | | |
| | | |
| | | |
| | | |
| | | |
| | | |
Teledyne Technologies, Inc. | | | |
Asset Allocation — Percentage of Net Assets |
|
Sector Weightings — Percentage of Total Investments In Securities* |
|
| Excludes short-term investments, if any. |
Value Line Select Growth Fund, Inc.
Portfolio Highlights at December 31, 2022 (unaudited) (continued)
The following graph compares the performance of the Value Line Select Growth Fund, Inc. to that of the S&P 500® Index*** (the “Index”). The Value Line Select Growth Fund, Inc. is a professionally managed mutual fund, while the Index is not available for investment and is unmanaged. The returns for the Index do not reflect charges, expenses or taxes, but do include the reinvestment of dividends, if any. The comparison is shown for illustrative purposes only.
Comparison of a Change in Value of a $10,000 Investment in the Value Line Select Growth Fund, Inc. and the S&P 500® Index**Value Line Select Growth Fund, Inc.
As of 12/31/2022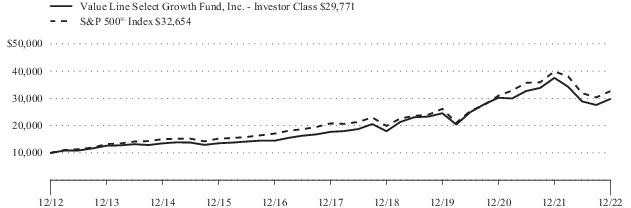
Performance Data: **
Average Annual Total Returns (For year ended 12/31/2022)
| | | | |
| | | | |
Value Line Select Growth Fund, Inc. | | | | |
| | | | |
| | | | |
| | | | |
Value Line Select Growth Fund, Inc. | | | | |
| | | | |
**
The performance data quoted represent past performance and are no guarantee of future performance. The investment return and principal value of an investment will fluctuate so that an investment, when redeemed, may be worth more or less than its original cost. The performance data includes reinvestments of all dividends and distributions but does not reflect the deduction of taxes that a shareholder would pay on fund distributions or the redemption of fund shares.
***
The S&P 500® Index is an unmanaged index that is representative of the larger-capitalization stocks traded in the United States.
Value Line Select Growth Fund, Inc.
| | |
|
|
| |
| | |
|
| |
| | |
| DIVERSIFIED FINANCIALS 3.5% |
| Intercontinental Exchange, Inc. | |
| |
| | |
| Marsh & McLennan Cos., Inc. | |
| | |
| | |
|
| |
| Mettler-Toledo International, Inc.(1) | |
| HEALTHCARE PRODUCTS 15.8% |
| | |
| IDEXX Laboratories, Inc.(1) | |
| | |
| Thermo Fisher Scientific, Inc. | |
| | |
| | |
|
| |
| | |
| |
| | |
| ENVIRONMENTAL CONTROL 5.1% |
| | |
| | |
| | |
| |
| | |
| | |
INFORMATION TECHNOLOGY 41.4% |
| |
| | |
| | |
COMMON STOCKS 99.0% (continued) |
INFORMATION TECHNOLOGY 41.4% (continued) |
| DIVERSIFIED FINANCIALS 5.0% |
| | |
| MISCELLANEOUS MANUFACTURERS 4.1% |
| Teledyne Technologies, Inc.(1) | |
| |
| | |
| | |
| Cadence Design Systems, Inc.(1) | |
| | |
| | |
| | |
| | |
| | |
| | |
| | |
| | |
|
| |
| | |
TOTAL COMMON STOCKS
(Cost $178,444,044) | |
SHORT-TERM INVESTMENTS 1.2% |
| |
| State Street Institutional U.S. Government Money Market Fund, Premier Class, 4.12%(2) | |
TOTAL SHORT-TERM INVESTMENTS
(Cost $4,042,049) | |
TOTAL INVESTMENTS IN SECURITIES 100.2%
(Cost $182,486,093) | |
EXCESS OF LIABILITIES OVER CASH AND OTHER ASSETS (0.2)% | |
| |
| |
| Rate reflects 7 day yield as of December 31, 2022. |
The following table summarizes the inputs used to value the Fund's investments in securities as of December 31, 2022 (See Note 1(B)):
Investments in Securities: | | | | |
| | | | |
| | | | |
| | | | |
Total Investments in Securities | | | | |
| See Schedule of Investments for further breakdown by category. |
See Notes to Financial Statements.
Value Line Larger Companies Focused Fund, Inc.
PORTFOLIO MANAGEMENT COMMENTARY (unaudited)
INVESTMENT OBJECTIVE
The Fund’s sole investment objective is long-term growth of capital.
Manager Discussion of Fund Performance
Below, Value Line Larger Companies Focused Fund, Inc. portfolio manager Cindy Starke discusses the Fund’s performance and positioning for the 12 months ended December 31, 2022.
How did the Fund perform during the semi-annual period?
The Fund’s Investor Class generated a total return of -38.99% during the 12 months ended December 31, 2022. This compares to the -18.11% return of the Fund’s benchmark, the S&P 500® Index, during the same annual period.
What key factors were responsible for the Fund’s performance during the 12-month reporting period?
The Fund underperformed the S&P 500® Index on a relative basis during the 12-month reporting period, attributable primarily to stock selection. Sector allocation overall also detracted. Further, the Fund was hurt by its focus on growth companies and especially large-cap growth companies. Value-oriented stocks significantly outperformed growth-oriented stocks during the annual period, and large-cap growth-oriented stocks were the weakest segment of the U.S. equity market. That said, having a position in cash, albeit a modest one, during an annual period when the S&P 500® Index declined significantly, proved beneficial.
Which equity market sectors most significantly affected Fund performance?
Stock selection in information technology, communication services and industrials detracted most from the Fund’s relative results. Having overweighted allocations to information technology and communication services, two of the weaker sectors in the S&P 500® Index during the annual period, and an underweighted allocation to industrials, which outpaced the S&P 500® Index during the annual period, also hurt.
Only partially offsetting these detractors was effective stock selection in health care, which contributed positively. The Fund’s modest overweight to health care, which outpaced the S&P 500® Index during the annual period, also helped. Having no exposure to real estate, which notably underperformed the S&P 500® Index during the annual period, buoyed the Fund’s relative results as well.
Which stocks detracted significantly from the Fund’s performance during the annual period?
During the annual period, the stocks that detracted most from the Fund’s performance were camera and social media company Snap, cloud communication and Internet infrastructure solutions company Twilio and ride share transportation company Lyft.
Shares of Snap, the parent company of Snapchat, declined significantly during the annual period, pressured by several headwinds simultaneously, including economic softness, heightened competition, platform changes, internal reorganizations and technology investments. Twilio experienced a sharp double-digit share price decline during the annual period, as it faced macroeconomic pressures, most notably softening demand. Lyft also saw a significant double-digit share price decline during the annual period. Its weak performance reflected lower than consensus expected customer growth as well as driver market challenges, while the company was investing in its marketplace, drivers and brand marketing. By the end of the annual period, we had sold the Fund’s position in Lyft.
What were some of the Fund’s best-performing individual stocks?
The individual stocks that contributed most to the Fund’s relative results were blood-based disorders-focused clinical-stage biopharmaceutical company Global Blood Therapeutics, independent oil and natural gas company Diamondback Energy and cystic fibrosis-focused biotechnology company Vertex Pharmaceuticals.
Shares of Global Blood Therapeutics enjoyed a triple-digit price gain during the annual period. Its stock benefited from the announcement by Pfizer in August 2022 that it would be acquiring the company. Following the announcement, the Fund sold its position in Global Blood Therapeutics, taking profits. Diamondback Energy’s shares experienced a double-digit share price gain during the annual period, supported by energy market tailwinds as well as the company reducing its debt and increasing its dividends during the year. Vertex Pharmaceuticals saw a double-digit share price gain during the annual period, with its strong performance supported by execution and growth within both its core cystic fibrosis drug portfolio and its non-cystic fibrosis pipeline, including drugs for acute pain, type 1 diabetes and sickle cell disease.
Value Line Larger Companies Focused Fund, Inc. (continued)
How did the Fund use derivatives and similar instruments during the reporting period?
The Fund did not use derivatives during the reporting period.
Did the Fund make any significant purchases or sales during the annual period?
We established a Fund position during the annual period in athletic apparel and accessories company Lululemon Athletica. In our view, the company is well positioned to benefit from both renewed consumer demand for its products and increased consumer mobility post the COVID-19 pandemic. We also initiated a Fund position in cosmetics company Estee Lauder. In our view, the company has been benefiting from favorable demographic trends and was well positioned to grow in the post-pandemic environment, including better conditions for the travel retail industry.
Conversely, in addition to those sales already mentioned, we exited the Fund’s position in Adobe, one of the largest software companies in the digital market and media markets. While the company was benefiting from digital transformation trends broadly, tighter macroeconomic conditions were pressuring the company’s fundamentals. Additionally, we sold the Fund’s position in interactive gaming and entertainment software developer Activision Blizzard following Microsoft’s announcement of its intent to acquire the company in an all-cash transaction.
Were there any notable changes in the Fund’s weightings during the 12-month period?
During the annual period, the Fund’s weightings in the consumer discretionary, consumer staples, energy, financials and information technology sectors increased, and its weightings in the communication services, health care and industrials sectors decreased, in each case relative to the S&P 500® Index.
How was the Fund positioned relative to its benchmark index at the end of December 2022?
As of December 31, 2022, the Fund was overweighted relative to the S&P 500® Index in the information technology, communication services, consumer discretionary and energy sectors. The Fund was underweighted relative to the S&P 500® Index in the consumer staples, financials, health care and industrials sectors on the same date. The Fund had no exposure to the materials, real estate and utilities sectors at the end of December 2022.
What is your tactical view and strategy for the months ahead?
Following the worst year for S&P 500® Index performance since 2008, we were cautiously optimistic at the end of the annual period that 2023 would be a better year for U.S. equities. We believed it was likely that U.S. equity markets would continue to experience higher than historically usual volatility. That said, there were, in our view, some potential tailwinds for the U.S. equity markets for the year ahead. These tailwinds include the potentially slowing pace of interest rate hikes and maybe even the end of the Fed’s current tightening cycle. Signs of cooling inflation, lower equity price/earnings ratios and slower economic growth may serve as supports for such Fed action going forward. Still, headwinds remained, including the pace of U.S. economic growth and the potential depth and length of a recession, if it occurs. On the positive side, should such conditions evolve, it is well worth noting that banks and consumers remained rather healthy at the end of the annual period, in our view, supported by low rates of unemployment and solid balance sheets.
Given this backdrop, we continue to believe innovative and quality large-cap growth companies with scale, pricing power, healthy balance sheets, strong management teams and above-average sales and earnings growth prospects are likely to outperform the S&P 500® Index over longer periods of time and especially during spans of slower economic growth. Typically, when economic growth slows or stalls, growth companies become more valuable and scarce, as they are historically able to continue to post sales and earnings growth given the secular rather than cyclical nature of their products and services. Regardless of market condition, we remain committed to our focus on longer-term growth investing as a compelling way to create long-term growth of capital for investors.
Value Line Larger Companies Focused Fund, Inc.
Portfolio Highlights at December 31, 2022 (unaudited)
| | | |
| | | |
| | | |
| | | |
| | | |
| | | |
| | | |
| | | |
Pioneer Natural Resources Co. | | | |
| | | |
| | | |
Vertex Pharmaceuticals, Inc. | | | |
Asset Allocation — Percentage of Net Assets |
|
Sector Weightings — Percentage of Total Investments In Securities* |
|
| Excludes short-term investments, if any. |
Value Line Larger Companies Focused Fund, Inc.
Portfolio Highlights at December 31, 2022 (unaudited) (continued)
The following graph compares the performance of the Value Line Larger Companies Focused Fund, Inc. to that of the S&P 500® Index*** (the “Index”). The Value Line Larger Companies Focused Fund, Inc. is a professionally managed mutual fund, while the Index is not available for investment and is unmanaged. The returns for the Index do not reflect charges, expenses or taxes, but do include the reinvestment of dividends, if any. The comparison is shown for illustrative purposes only.
Comparison of a Change in Value of a $10,000 Investment in the Value Line Larger Companies Focused Fund, Inc. and the S&P 500® Index**Value Line Larger Companies Focused Fund, Inc.
As of 12/31/2022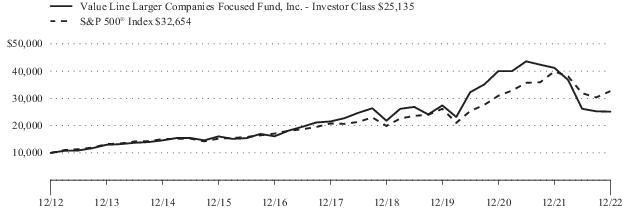
Performance Data: **
Average Annual Total Returns (For year ended 12/31/2022)
| | | | |
| | | | |
Value Line Larger Companies Focused Fund, Inc. | | | | |
| | | | |
| | | | |
| | | | |
Value Line Larger Companies Focused Fund, Inc. | | | | |
| | | | |
**
The performance data quoted represent past performance and are no guarantee of future performance. The investment return and principal value of an investment will fluctuate so that an investment, when redeemed, may be worth more or less than its original cost. The performance data includes reinvestments of all dividends and distributions but does not reflect the deduction of taxes that a shareholder would pay on fund distributions or the redemption of fund shares.
***
The S&P 500® Index is an unmanaged index that is representative of the larger-capitalization stocks traded in the United States.
Value Line Larger Companies Focused Fund, Inc.
| | |
|
COMMUNICATION SERVICES 14.0% |
| |
| Alphabet, Inc. Class A(1) | |
| | |
| Meta Platforms, Inc. Class A(1) | |
| | |
| | |
| | |
| | |
| |
| | |
| | |
CONSUMER DISCRETIONARY 14.6% |
| |
| Rivian Automotive, Inc. Class A(1) | |
| | |
| | |
| |
| DraftKings, Inc. Class A(1)(2) | |
| |
| Alibaba Group Holding Ltd. ADR(1) | |
| | |
| Booking Holdings, Inc.(1) | |
| | |
| |
| Lululemon Athletica, Inc.(1) | |
| | |
| | |
| | |
|
| COSMETICS/PERSONAL CARE 2.1% |
| Estee Lauder Cos., Inc. Class A | |
|
| |
| | |
| | |
| Pioneer Natural Resources Co. | |
| | |
|
| |
| | |
| Goldman Sachs Group, Inc. | |
| | |
| DIVERSIFIED FINANCIALS 2.1% |
| | |
| Coinbase Global, Inc. Class A(1)(2) | |
| | |
| |
| Robinhood Markets, Inc. Class A(1) | |
| | |
| | |
COMMON STOCKS 98.7% (continued) |
|
| |
| BioMarin Pharmaceutical, Inc.(1) | |
| | |
| Vertex Pharmaceuticals, Inc.(1) | |
| | |
| |
| | |
| |
| | |
| | |
|
| |
| Uber Technologies, Inc.(1) | |
INFORMATION TECHNOLOGY 33.3% |
| |
| | |
| |
| | |
| Crowdstrike Holdings, Inc. Class A(1) | |
| | |
| DIVERSIFIED FINANCIALS 4.4% |
| | |
| |
| | |
| | |
| | |
| |
| Advanced Micro Devices, Inc.(1) | |
| | |
| | |
| | |
| |
| | |
| | |
| | |
| | |
| | |
| | |
| | |
| | |
| | |
TOTAL COMMON STOCKS
(Cost $207,540,668) | |
SHORT-TERM INVESTMENTS 2.0% |
| |
| State Street Institutional U.S. Government Money Market Fund, Premier Class, 4.12%(3) | |
See Notes to Financial Statements.
| | |
SHORT-TERM INVESTMENTS 2.0% (continued) |
| MONEY MARKET FUNDS 2.0% (continued) |
| State Street Navigator Securities Lending Government Money Market Portfolio(4) | |
| | |
TOTAL SHORT-TERM INVESTMENTS
(Cost $4,137,059) | |
TOTAL INVESTMENTS IN SECURITIES 100.7%
(Cost $211,677,727) | |
EXCESS OF LIABILITIES OVER CASH AND OTHER ASSETS (0.7)% | |
| |
| |
| A portion or all of the security was held on loan. As of December 31, 2022, the market value of the securities on loan was $2,265,380. |
| Rate reflects 7 day yield as of December 31, 2022. |
| Securities with an aggregate market value of $2,265,380 were out on loan in exchange for collateral including $958,500 of cash collateral as of December 31, 2022. The collateral was invested in a cash collateral reinvestment vehicle. |
| American Depositary Receipt. |
The following table summarizes the inputs used to value the Fund's investments in securities as of December 31, 2022 (See Note 1(B)):
Investments in Securities: | | | | |
| | | | |
| | | | |
| | | | |
Total Investments in Securities | | | | |
| See Schedule of Investments for further breakdown by category. |
See Notes to Financial Statements.
Value Line Asset Allocation Fund, Inc.
PORTFOLIO MANAGEMENT COMMENTARY (unaudited)
INVESTMENT OBJECTIVE
The Fund’s investment objective is to achieve a high total investment return (current income and capital appreciation) consistent with reasonable risk. For this purpose, risk takes into account volatility and other factors as determined by EULAV Asset Management (the “Adviser”).
Manager Discussion of Fund Performance
Shareholders of the Value Line Asset Allocation Fund, Inc. (the “Fund”) received an annual report covering the 12 months ended March 31, 2022. The fiscal year-end of the Fund was subsequently changed from March 31st to December 31st. As such, below, Fund portfolio managers Stephen E. Grant and Liane Rosenberg discuss the Fund’s performance and positioning for the nine months ended December 31, 2022 (the “reporting period”).
How did the Fund perform during the reporting period?
The Fund’s Investor Class generated a total return of -8.81% during the nine months ended December 31, 2022. This compares to the -11.29% return of the Fund’s blended benchmark, comprised 60% of the S&P 500® Index and 40% of the Bloomberg US Aggregate Bond Index (the “Bloomberg Index”), during the same reporting period.
What key factors were responsible for the Fund’s performance during the reporting period?
While absolute returns disappointed, the Fund’s relative outperformance of its blended benchmark is attributable to both the equity portfolio outperforming the S&P 500® Index and the fixed income portfolio outperforming the Bloomberg Index during the reporting period. The reporting period was one wherein value stocks beat growth stocks across the capitalization spectrum of the U.S. equity market. This put the equity portion of the Fund at a relative disadvantage, as the equity portion of the Fund emphasizes growth over value. However, the equity portion of the Fund was able to overcome this headwind by favoring higher quality growth issues with consistent track records and avoiding the troubled giant companies that dampened the returns of the S&P 500® Index.
Asset allocation had mixed results during the reporting period. An overweighting in equities detracted, as the -14.16% return of the S&P 500® Index significantly lagged the -7.52% return of the Bloomberg Index during the reporting period. However, the Fund’s 3% to 5% allocation of assets to cash proved beneficial, as both the equity and fixed income markets declined during the reporting period.
Which equity market sectors most significantly affected Fund performance?
The equity portion of the Fund outperformed its benchmark, the S&P 500® Index, on a relative basis due to a combination of stock selection and sector allocation decisions overall. The equity portion of the Fund was helped most by effective stock selection in information technology. Having an underweighted allocation to the consumer discretionary sector and having no exposure at all to the communication services sector, the two weakest sectors in the S&P 500® Index during the reporting period, also proved beneficial. Having overweighted allocations to the industrials and financials sectors, which each posted negative absolute returns but notably outpaced the S&P 500® Index during the reporting period, added value as well. Only partially offsetting these positive contributors was the equity portion of the Fund’s weak stock selection in the health care sector, which detracted. Having no holdings at all in energy, which was, by far, the strongest sector in the S&P 500® Index during the reporting period, also hurt.
What were some of the Fund’s best-performing individual stocks?
Among the individual stocks that contributed most positively to the equity portion of the Fund’s relative results were those it did not own—namely, electric vehicle maker Tesla, e-commerce behemoth Amazon.com and Google parent company Alphabet. Each of these companies was among the largest detractors from the S&P 500® Index’s performance, each experiencing a significant double-digit share price decline during the reporting period. Additionally, the Fund’s overweight position in Cintas, which posted a positive absolute return during the reporting period, boosted the equity portion of the Fund’s relative results. Cintas, which provides corporate identity uniforms and related business services, performed well, supported by better than expected operating performance.
Which stocks detracted significantly from the Fund’s performance during the reporting period?
Among the stocks that detracted most from the equity portion of the Fund’s relative results were ServiceNow, a provider of enterprise cloud software, and Salesforce, a cloud-based customer relationship management software company. Each of these companies saw a substantial double-digit share price decline during the reporting period, in each case hurt by weaker than expected operating
Value Line Asset Allocation Fund, Inc. (continued)
performance. The equity portion of the Fund’s relative results were also hurt by not owning a position in integrated energy company Exxon Mobil, whose shares achieved a robust double-digit gain and which was the top contributor to the S&P 500® Index’s results during the reporting period.
Did the equity portion of the Fund make any significant purchases or sales?
During the reporting period, we established a new position in the equity portion of the Fund in global professional services firm Marsh & McLennan, which, in our view, has a solid long-term history of consistent gains in earnings and stock price. Conversely, among those names sold from the equity portion of the Fund during the reporting period were leading off-price apparel and home fashions retailer TJX, pest control services provider Rollins and insurance company Arch Capital. We believed each had become less consistent in delivering long-term gains in earnings and stock price.
Were there any notable changes in the equity portion of the Fund’s sector weightings during the reporting period?
During the reporting period, we shifted from an overweight to an underweight position in the health care sector relative to the S&P 500® Index within the equity portion of the Fund.
How was the equity portion of the Fund positioned relative to its benchmark index at the end of December 2022?
As of December 31, 2022, the equity portion of the Fund was overweighted relative to the S&P 500® Index in information technology, industrials and financials and was underweighted relative to the S&P 500® Index in the consumer staples, consumer discretionary, materials and health care sectors. The equity portion of the Fund was rather neutrally weighted relative to the S&P 500® Index in real estate and utilities and had no exposure to the energy or communication services sectors on December 31, 2022.
What was the duration and yield curve strategy of the fixed income portion of the Fund?
We generally kept the fixed income portion of the Fund’s duration shorter than that of the Bloomberg Index during the reporting period based on our expectations for higher interest rates. As rates did rise across the yield curve in response to greater inflationary pressures and the U.S. Federal Reserve’s (the “Fed”) efforts to rein in inflation by hiking interest rates, the fixed income portion of the Fund’s short duration positioning added value. Duration is a measure of the Fund’s sensitivity to changes in interest rates.
Overall, yield curve positioning also contributed positively to relative performance. The fixed income portion of the Fund was positioned with an overweight to intermediate-maturity bonds and an underweight to long-dated bonds, i.e. those with maturities of 30 years. Long-dated bonds significantly underperformed bonds with short-term and intermediate-term maturities during the reporting period.
Which fixed income market segments most significantly affected Fund performance?
During the reporting period, security selection within the investment grade corporate bond market boosted relative results. More specifically, positions in high quality investment grade corporate bonds, i.e. those rated AAA to A, materially outperformed positions in lower quality investment grade corporate bonds, i.e. those rated BBB, as investors looked to reduce risk. Further, the fixed income portion of the Fund maintained a modest out-of-benchmark position in cash, which proved beneficial as virtually all fixed income sectors posted negative absolute returns during the reporting period.
Conversely, having an overweighted allocation to investment grade corporate bonds relative to the Bloomberg Index detracted, as the sector was among the weakest within the fixed income asset class amid the strong investor bias to more “risk off”* securities during the reporting period.
Were there any notable changes in the fixed income portion of the Fund’s sector weightings during the reporting period?
During the reporting period, in an effort to enhance the fixed income portion of the Fund’s risk-off posture, we added some higher quality corporate bonds to the portfolio and sold some weaker BBB-rated positions. For the same reason, we increased the fixed income portion of the Fund’s exposure to mortgage-backed securities from an underweighted allocation to a rather neutral weighting relative to the Bloomberg Index. Within the allocation to mortgage-backed securities, we shifted to higher-coupon securities, which had become more readily available with the rise in rates and which performed well later in 2022 as inflation declined, albeit from high levels. Further, we modestly lengthened the fixed income portion of the Fund’s duration compared to that of the Bloomberg Index, while still maintaining a shorter duration overall.
Value Line Asset Allocation Fund, Inc. (continued)
How was the fixed income portion of the Fund positioned relative to its benchmark index at the end of December 2022?
As of December 31, 2022, the fixed income portion of the Fund remained overweight relative to the Bloomberg Index in investment grade corporate bonds and remained underweight relative to the Bloomberg Index in U.S. Treasuries. Within the securitized sector, the fixed income portion of the Fund had a rather neutral allocation to mortgage-backed securities and an overweighted allocation to commercial mortgage-backed securities compared to the Bloomberg Index at the end of the reporting period. As mentioned, the fixed income portion of the Fund’s duration was modestly lengthened during the reporting period but remained shorter than that of the Bloomberg Index.
How did the Fund’s overall asset allocation shift from beginning to end of the reporting period?
At the end of December 2022, the Fund had a weighting of approximately 67% in stocks, 30% in fixed income securities and 3% in cash equivalents. This compares to Fund weightings of approximately 67% in stocks, 28% in fixed income securities and 5% in cash equivalents at the end of March 2022. While the overall asset allocation remained relatively unchanged during the reporting period, we sought, as always, to take advantage of short-term market swings to buy and sell stocks and bonds.
How did the Fund use derivatives and similar instruments during the reporting period?
Neither the equity portion nor the fixed income portion of the Fund used derivatives as part of its strategy during the reporting period.
What is your tactical view and strategy for the months ahead?
Regardless of market conditions, within the equity portion of the Fund, we intend to stay true to our time-tested investment discipline going forward, seeking to invest in companies that have demonstrated a solid history of consistent growth in both their earnings and stock price. We believe these companies possess enviable portfolios of proprietary products and services that give them strong market positions and make them less vulnerable to swings in national and international economic conditions. Unlike the typical fund in its peer group, the equity portion of the Fund held none of the 25 largest U.S. companies by market capitalization as of December 31, 2022. The equity portion of the Fund favors mid-cap companies and the lower range of the large-cap company spectrum. In our view, this is the “sweet spot,” where we seek to find firms that have already established long-term winning records and yet still have plenty of room to grow. Of course, past performance is no guarantee of future results. Accepting the short-term ebbs and flows inevitable in the stock market, we believe investments in these companies may well provide superior returns to our shareholders maintaining a long-term perspective.
As we manage both the equity and fixed income portions of the Fund and determine asset allocation, we will continue to carefully monitor any significant changes in the pace of U.S. and global economic growth, any shifts in the Fed’s size or frequency of interest rate hikes or in its outlook, the path of the Russia/Ukraine war, and any notable movements in either inflation or labor market conditions, as these factors are likely, in our view, to affect the Fund’s equity and fixed income holdings.
*
"Risk off,” or its opposite “risk on,” is an investment setting in which price behavior responds to and is driven by changes in investor risk tolerance. Risk on and risk off refer to changes in investment activity in response to global economic patterns. During periods when risk is perceived as low, the risk on/risk off theory states that investors tend to engage in higher risk investments. When risk is perceived to be high, investors have the tendency to gravitate toward lower risk investments.
Value Line Asset Allocation Fund, Inc.
Portfolio Highlights at December 31, 2022 (unaudited)
| | | |
| | | |
| | | |
| | | |
Thermo Fisher Scientific, Inc. | | | |
Intercontinental Exchange, Inc. | | | |
| | | |
| | | |
| | | |
| | | |
| | | |
Cadence Design Systems, Inc. | | | |
Asset Allocation — Percentage of Net Assets |
|
Common Stock Sectors —
Percentage of Common Stocks* |
|
Bonds & Notes Sectors —
Percentage of All Bonds & Notes* |
|
| Excludes short-term investments, if any. |
Value Line Asset Allocation Fund, Inc.
Portfolio Highlights at December 31, 2022 (unaudited) (continued)
The following graph compares the performance of the Value Line Asset Allocation Fund, Inc. to that of the S&P 500® Index**** and the 60/40 S&P 500® Index/Bloomberg Barclays US Aggregate Bond Index***, (the “Indexes”). The Value Line Asset Allocation Fund, Inc. is a professionally managed mutual fund, while the Indexes are not available for investment and are unmanaged. The returns for the Indexes do not reflect charges, expenses or taxes, but do include the reinvestment of dividends, if any. The comparison is shown for illustrative purposes only.
Comparison of a Change in Value of a $10,000 Investment in the Value Line Asset Allocation Fund, Inc., the S&P 500® Index and the 60/40 S&P 500® Index/Bloomberg Barclays US Aggregate Bond Index**Value Line Asset Allocation Fund, Inc.
As of 12/31/2022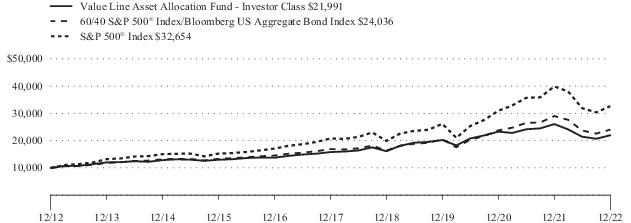
Value Line Asset Allocation Fund, Inc.
Portfolio Highlights at December 31, 2022 (unaudited) (continued)
Performance Data: **
Average Annual Total Returns (For periods ended 12/31/2022)
| | | | | |
| | | | | |
Value Line Asset Allocation Fund, Inc. | | | | | |
60/40 S&P 500® Index/Bloomberg US Aggregate Bond*** | | | | | |
| | | | | |
| | | | | |
| | | | | |
Value Line Asset Allocation Fund, Inc. | | | | | |
60/40 S&P 500® Index/Bloomberg US Aggregate Bond*** | | | | | |
| | | | | |
**
The performance data quoted represent past performance and are no guarantee of future performance. The investment return and principal value of an investment will fluctuate so that an investment, when redeemed, may be worth more or less than its original cost. The performance data includes reinvestment of all dividends and distributions but does not reflect the deduction of taxes that a shareholder would pay on fund distributions or the redemption of fund shares.
***
The 60/40 S&P 500® Index/Bloomberg US Aggregate Bond Index is an unmanaged blended index which consists of a 60% weighting of the S&P 500® Index representative of the larger capitalization stocks traded in the United States and a 40% weighting of the Bloomberg US Aggregate Bond Index which is a broad-based benchmark that measures the investment grade, U.S. dollar denominated, fixed-rate taxable bond market, including Treasuries, government-related and corporate securities, Mortgage Backed Securities (MBS) (agency fixed-rate and hybrid ARM pass-through’s), Asset Backed Securities (ABS), and Commercial Mortgage Backed Securities (CMBS).
****The S&P 500®Index is an unmanaged index that is representative of the larger capitalization stocks traded in the United States.
Value Line Asset Allocation Fund, Inc.
| | |
|
CONSUMER DISCRETIONARY 1.1% |
| DISTRIBUTION/WHOLESALE 1.1% |
| | |
|
| |
| | |
|
| |
| | |
| DIVERSIFIED FINANCIALS 3.1% |
| Intercontinental Exchange, Inc. | |
| |
| American Financial Group, Inc. | |
| | |
| Marsh & McLennan Cos., Inc. | |
| | |
| | |
| | |
| | |
|
| |
| Bio-Rad Laboratories, Inc. Class A(1) | |
| |
| | |
| IDEXX Laboratories, Inc.(1) | |
| | |
| Thermo Fisher Scientific, Inc. | |
| | |
| |
| Charles River Laboratories International, Inc.(1) | |
| | |
| | |
| | |
| | |
|
| |
| | |
| |
| Lennox International, Inc. | |
| |
| | |
| ENGINEERING & CONSTRUCTION 0.4% |
| | |
| ENVIRONMENTAL CONTROL 2.6% |
| | |
| |
| | |
| | |
| | |
COMMON STOCKS 67.5% (continued) |
INFORMATION TECHNOLOGY 26.8% |
| |
| | |
| |
| | |
| | |
| | |
| | |
| MISCELLANEOUS MANUFACTURERS 1.3% |
| Teledyne Technologies, Inc.(1) | |
| |
| | |
| | |
| Cadence Design Systems, Inc.(1) | |
| | |
| | |
| | |
| | |
| | |
| | |
| | |
| Tyler Technologies, Inc.(1) | |
| | |
| |
| | |
| | |
|
| |
| | |
|
| |
| Equity Lifestyle Properties, Inc. REIT | |
|
| |
| | |
TOTAL COMMON STOCKS
(Cost $421,762,530) | |
| | |
COMMERCIAL MORTGAGE-BACKED SECURITIES 1.8% |
| FHLMC Multifamily Structured Pass-Through Certificates, Series K037, Class A2, 3.49%, 1/25/24 | |
| FHLMC Multifamily Structured Pass-Through Certificates, Series K040, Class A2, 3.24%, 9/25/24 | |
| FHLMC Multifamily Structured Pass-Through Certificates, Series K055, Class A2, 2.67%, 3/25/26 | |
| FHLMC Multifamily Structured Pass-Through Certificates, Series K056, Class A2, 2.53%, 5/25/26 | |
See Notes to Financial Statements.
| | |
COMMERCIAL MORTGAGE-BACKED SECURITIES 1.8% (continued) |
| FHLMC Multifamily Structured Pass-Through Certificates, Series K058, Class A2, 2.65%, 8/25/26 | |
| FHLMC Multifamily Structured Pass-Through Certificates, Series K061, Class A2, 3.35%, 11/25/26(3) | |
| FHLMC Multifamily Structured Pass-Through Certificates, Series K064, Class A2, 3.22%, 3/25/27 | |
| FHLMC Multifamily Structured Pass-Through Certificates, Series K065, Class A2, 3.24%, 4/25/27 | |
| FHLMC Multifamily Structured Pass-Through Certificates, Series K067, Class A2, 3.19%, 7/25/27 | |
| FHLMC Multifamily Structured Pass-Through Certificates, Series K072, Class A1, 3.25%, 11/25/27 | |
| FHLMC Multifamily Structured Pass-Through Certificates, Series K084, Class A2, 3.78%, 10/25/28(3) | |
| FHLMC Multifamily Structured Pass-Through Certificates, Series K089, Class A1, 3.34%, 10/25/28 | |
| FREMF Mortgage Trust, Series 2015-K43, Class B, 3.73%, 2/25/48(3)(4) | |
| GNMA, Series 2013-12, Class B, 2.06%, 11/16/52(3) | |
| Morgan Stanley Capital I Trust, Series 2021-L7, Class A4, 2.32%, 10/15/54 | |
| Wells Fargo Commercial Mortgage Trust, Series 2015-NXS1, Class A2, 2.63%, 5/15/48 | |
TOTAL COMMERCIAL MORTGAGE-BACKED SECURITIES
(Cost $18,826,648) | |
CORPORATE BONDS & NOTES 11.2% |
|
| |
| Nutrien Ltd., Senior Unsecured Notes, 4.20%, 4/1/29 | |
| |
| Steel Dynamics, Inc., Senior Unsecured Notes, 3.25%, 1/15/31 | |
| |
| Freeport-McMoRan, Inc., Guaranteed Notes, 4.63%, 8/1/30 | |
| | |
|
| |
| Expedia Group, Inc., Guaranteed Notes, 3.25%, 2/15/30 | |
| Netflix, Inc., Senior Unsecured Notes, 4.88%, 4/15/28 | |
| | |
| | |
CORPORATE BONDS & NOTES 11.2% (continued) |
COMMUNICATIONS 1.0% (continued) |
| |
| Charter Communications Operating LLC/Charter Communications Operating Capital, Senior Secured Notes, 4.91%, 7/23/25 | |
| Comcast Corp., Guaranteed Notes, 4.15%, 10/15/28 | |
| Discovery Communications LLC, Guaranteed Notes, 4.90%, 3/11/26 | |
| | |
| |
| AT&T, Inc., Senior Unsecured Notes, 2.55%, 12/1/33 | |
| Motorola Solutions, Inc., Senior Unsecured Notes, 4.60%, 5/23/29 | |
| T-Mobile USA, Inc., Guaranteed Notes, 3.50%, 4/15/31 | |
| Vodafone Group PLC, Senior Unsecured Notes, 4.25%, 9/17/50 | |
| | |
| | |
|
| |
| Cummins, Inc., Senior Unsecured Notes, 1.50%, 9/1/30 | |
| Ford Motor Credit Co. LLC, Senior Unsecured Notes, 3.38%, 11/13/25 | |
| | |
| |
| PulteGroup, Inc., Guaranteed Notes, 5.00%, 1/15/27(2) | |
| |
| Hyatt Hotels Corp., Senior Unsecured Notes, 1.80%, 10/1/24 | |
| Marriott International, Inc., Senior Unsecured Notes, 5.00%, 10/15/27 | |
| | |
| |
| AutoZone, Inc., Senior Unsecured Notes, 3.75%, 6/1/27 | |
| Costco Wholesale Corp., Senior Unsecured Notes, 1.75%, 4/20/32 | |
| Dollar General Corp., Senior Unsecured Notes, 3.50%, 4/3/30 | |
| McDonald's Corp., Senior Unsecured Notes, 4.60%, 9/9/32(2) | |
| O'Reilly Automotive, Inc., Senior Unsecured Notes, 3.60%, 9/1/27 | |
| | |
| | |
CONSUMER, NON-CYCLICAL 2.3% |
| |
| Bunge Ltd. Finance Corp., Guaranteed Notes, 3.25%, 8/15/26 | |
See Notes to Financial Statements.
Schedule of Investments (continued)
| | |
CORPORATE BONDS & NOTES 11.2% (continued) |
CONSUMER, NON-CYCLICAL 2.3% (continued) |
| |
| Anheuser-Busch InBev Worldwide, Inc., Guaranteed Notes, 4.90%, 1/23/31 | |
| Constellation Brands, Inc., Guaranteed Notes, 5.25%, 11/15/48 | |
| Diageo Capital PLC, Guaranteed Notes, 2.00%, 4/29/30 | |
| | |
| |
| Amgen, Inc., Senior Unsecured Notes, 2.20%, 2/21/27 | |
| Regeneron Pharmaceuticals, Inc., Senior Unsecured Notes, 1.75%, 9/15/30 | |
| | |
| |
| PayPal Holdings, Inc., Senior Unsecured Notes, 2.65%, 10/1/26 | |
| |
| Baxter International, Inc., Senior Unsecured Notes, 1.73%, 4/1/31 | |
| |
| Centene Corp., Senior Unsecured Notes, 4.63%, 12/15/29 | |
| HCA, Inc., Guaranteed Notes, 5.38%, 2/1/25 | |
| Laboratory Corp. of America Holdings, Senior Unsecured Notes, 2.95%, 12/1/29 | |
| UnitedHealth Group, Inc., Senior Unsecured Notes, 4.63%, 11/15/41 | |
| | |
| |
| AbbVie, Inc., Senior Unsecured Notes, 2.95%, 11/21/26 | |
| AstraZeneca PLC, Senior Unsecured Notes, 1.38%, 8/6/30 | |
| Becton Dickinson and Co., Senior Unsecured Notes, 3.70%, 6/6/27(2) | |
| CVS Health Corp., Senior Unsecured Notes, 1.75%, 8/21/30 | |
| Merck & Co., Inc., Senior Unsecured Notes, 3.90%, 3/7/39 | |
| Novartis Capital Corp., Guaranteed Notes, 2.75%, 8/14/50 | |
| Takeda Pharmaceutical Co. Ltd., Senior Unsecured Notes, 3.03%, 7/9/40 | |
| Teva Pharmaceutical Finance Netherlands III BV, Guaranteed Notes, 3.15%, 10/1/26 | |
| Utah Acquisition Sub, Inc., Guaranteed Notes, 3.95%, 6/15/26 | |
| | |
| | |
|
| |
| Canadian Natural Resources Ltd., Senior Unsecured Notes, 2.05%, 7/15/25 | |
| | |
CORPORATE BONDS & NOTES 11.2% (continued) |
|
| OIL & GAS 0.5% (continued) |
| EOG Resources, Inc., Senior Unsecured Notes, 4.38%, 4/15/30(2) | |
| Hess Corp., Senior Unsecured Notes, 4.30%, 4/1/27 | |
| Occidental Petroleum Corp., Senior Unsecured Notes, 5.50%, 12/1/25 | |
| | |
| |
| Schlumberger Finance Canada Ltd., Guaranteed Notes, 1.40%, 9/17/25 | |
| |
| Boardwalk Pipelines LP, Guaranteed Notes, 4.95%, 12/15/24 | |
| Enbridge, Inc., Guaranteed Notes, 2.50%, 8/1/33 | |
| Enterprise Products Operating LLC, Guaranteed Notes, 4.85%, 8/15/42 | |
| Kinder Morgan, Inc., Guaranteed Notes, 4.30%, 3/1/28 | |
| Targa Resources Corp., Guaranteed Notes, 5.20%, 7/1/27 | |
| TransCanada PipeLines Ltd., Senior Unsecured Notes, 4.25%, 5/15/28 | |
| | |
| | |
|
| |
| Bank of America Corp. MTN, Senior Unsecured Notes, (SOFR + 1.33%), 5.65%, 4/2/26(3) | |
| Citigroup, Inc., Senior Unsecured Notes, (3-month LIBOR + 0.90%), 3.35%, 4/24/25(3) | |
| Citigroup, Inc., Subordinated Notes, 5.30%, 5/6/44 | |
| Goldman Sachs Group, Inc., Senior Unsecured Notes, 3.75%, 2/25/26 | |
| JPMorgan Chase & Co., Subordinated Notes, 4.13%, 12/15/26(2) | |
| JPMorgan Chase & Co., Senior Unsecured Notes, (3-month LIBOR + 1.38%), 3.96%, 11/15/48(3) | |
| KeyCorp, Senior Unsecured Notes, 2.55%, 10/1/29 | |
| Lloyds Banking Group PLC, Senior Unsecured Notes, 3.90%, 3/12/24 | |
| Morgan Stanley, Series F, Senior Unsecured Notes, 3.88%, 4/29/24 | |
| Northern Trust Corp., Senior Unsecured Notes, 1.95%, 5/1/30(2) | |
| PNC Financial Services Group, Inc. (The), Senior Unsecured Notes, (SOFR + 0.98%), 2.31%, 4/23/32(2)(3) | |
| Wells Fargo & Co., Senior Unsecured Notes, (SOFR + 1.32%), 5.24%, 4/25/26(3) | |
See Notes to Financial Statements.
| | |
CORPORATE BONDS & NOTES 11.2% (continued) |
FINANCIAL 3.5% (continued) |
| |
| Zions Bancorp NA, Subordinated Notes, 3.25%, 10/29/29 | |
| | |
| DIVERSIFIED FINANCIALS 0.8% |
| AerCap Ireland Capital DAC/AerCap Global Aviation Trust, Guaranteed Notes, 1.75%, 1/30/26 | |
| Air Lease Corp., Senior Unsecured Notes, 3.63%, 4/1/27 | |
| Ally Financial, Inc., Senior Unsecured Notes, 4.75%, 6/9/27 | |
| American Express Co., Senior Unsecured Notes, (SOFR + 0.72%), 4.79%, 5/3/24(3) | |
| Charles Schwab Corp., Senior Unsecured Notes, (SOFR + 1.05%), 5.30%, 3/3/27(2)(3) | |
| Discover Financial Services, Senior Unsecured Notes, 3.95%, 11/6/24 | |
| Visa, Inc., Senior Unsecured Notes, 2.05%, 4/15/30 | |
| | |
| |
| Aflac, Inc., Senior Unsecured Notes, 3.60%, 4/1/30 | |
| Allstate Corp., Senior Unsecured Notes, 1.45%, 12/15/30 | |
| Prudential Financial, Inc., Junior Subordinated Notes, (3-month LIBOR + 2.67%), 5.70%, 9/15/48(3) | |
| | |
| |
| AvalonBay Communities, Inc., Senior Unsecured Notes, 2.45%, 1/15/31 | |
| Crown Castle, Inc., Senior Unsecured Notes, 3.80%, 2/15/28 | |
| Digital Realty Trust LP, Guaranteed Notes, 3.60%, 7/1/29(2) | |
| Equinix, Inc., Senior Unsecured Notes, 2.50%, 5/15/31 | |
| Kimco Realty Corp., Senior Unsecured Notes, 2.25%, 12/1/31 | |
| Life Storage LP, Guaranteed Notes, 2.20%, 10/15/30 | |
| Prologis LP, Senior Unsecured Notes, 2.25%, 4/15/30 | |
| Welltower, Inc., Senior Unsecured Notes, 4.25%, 4/15/28 | |
| | |
| | |
|
| |
| Raytheon Technologies Corp., Senior Unsecured Notes, 4.13%, 11/16/28 | |
| |
| Masco Corp., Senior Unsecured Notes, 2.00%, 10/1/30 | |
| | |
CORPORATE BONDS & NOTES 11.2% (continued) |
INDUSTRIAL 0.8% (continued) |
| BUILDING MATERIALS 0.2% (continued) |
| Vulcan Materials Co., Senior Unsecured Notes, 3.50%, 6/1/30 | |
| | |
| |
| Amphenol Corp., Senior Unsecured Notes, 2.20%, 9/15/31 | |
| Flex Ltd., Senior Unsecured Notes, 4.75%, 6/15/25 | |
| | |
| MACHINERY - DIVERSIFIED 0.1% |
| John Deere Capital Corp., Senior Unsecured Notes, 2.45%, 1/9/30 | |
| |
| CSX Corp., Senior Unsecured Notes, 3.35%, 9/15/49 | |
| Union Pacific Corp., Senior Unsecured Notes, 3.25%, 2/5/50 | |
| | |
| | |
|
| |
| Dell International LLC / EMC Corp., Senior Unsecured Notes, 4.90%, 10/1/26 | |
| |
| Analog Devices, Inc., Senior Unsecured Notes, 2.80%, 10/1/41 | |
| |
| Adobe, Inc., Senior Unsecured Notes, 2.30%, 2/1/30 | |
| Electronic Arts, Inc., Senior Unsecured Notes, 4.80%, 3/1/26 | |
| Oracle Corp., 6.25%, 11/9/32 | |
| | |
| | |
|
| |
| Duke Energy Corp., Senior Unsecured Notes, 4.50%, 8/15/32 | |
TOTAL CORPORATE BONDS & NOTES
(Cost $121,325,003) | |
LONG-TERM MUNICIPAL SECURITIES 0.6% |
| |
| City & County of San Francisco CA, General Obligation Limited, Series C, 2.60%, 6/15/37 | |
| San Diego Unified School District/CA, Series ZR1, GO, 2.61%, 7/1/36 | |
| San Marcos California Unified School District, Refunding Revenue Bonds, 3.17%, 8/1/38 | |
| | |
See Notes to Financial Statements.
Schedule of Investments (continued)
| | |
LONG-TERM MUNICIPAL SECURITIES 0.6% (continued) |
| |
| Hartford County Metropolitan District Clean Water Project Revenue, Series B, 2.17%, 4/1/34 | |
| |
| New York City Transitional Finance Authority Building Aid Revenue, (ST AID WITHHLDG), 4.80%, 7/15/26 | |
| |
| State of Oregon, Series C, GO, 2.38%, 5/1/36 | |
| Tri-County Metropolitan Transportation District of Oregon, Series B, 2.50%, 9/1/30 | |
| | |
TOTAL LONG-TERM MUNICIPAL SECURITIES
(Cost $7,332,140) | |
RESIDENTIAL MORTGAGE-BACKED SECURITIES 8.2% |
| FHLMC, Series 4151, Class PA, 2.00%, 1/15/33 | |
| FHLMC Gold PC Pool #G08488, 3.50%, 4/1/42 | |
| FHLMC Pool #QB2462, 3.00%, 8/1/50 | |
| FHLMC Pool #QB2958, 3.00%, 9/1/50 | |
| FHLMC Pool #RA6817, 2.50%, 2/1/52 | |
| FHLMC Pool #RB5022, 3.00%, 11/1/39 | |
| FHLMC Pool #SD7514, 3.50%, 4/1/50 | |
| FHLMC Pool #SD8108, 3.00%, 11/1/50 | |
| FHLMC Pool #SD8196, 3.50%, 2/1/52 | |
| FHLMC Pool #ZS4647, 3.50%, 1/1/46 | |
| FNMA Pool #AS0516, 3.00%, 9/1/43 | |
| FNMA Pool #AX9528, 3.50%, 2/1/45 | |
| FNMA Pool #AZ6194, 3.50%, 10/1/45 | |
| FNMA Pool #BM3634, 3.50%, 5/1/47 | |
| FNMA Pool #BP5709, 2.50%, 5/1/50 | |
| FNMA Pool #CA5540, 3.00%, 4/1/50 | |
| FNMA Pool #FM2202, 4.00%, 12/1/48 | |
| FNMA Pool #FM3254, 3.50%, 5/1/49 | |
| FNMA Pool #FM4140, 2.50%, 9/1/50 | |
| FNMA Pool #FM9509, 3.00%, 11/1/36 | |
| FNMA Pool #FM9760, 3.50%, 11/1/51 | |
| FNMA Pool #FM9834, 3.50%, 6/1/49 | |
| FNMA Pool #FM9939, 4.00%, 1/1/52 | |
| FNMA Pool #MA4055, 2.50%, 6/1/50 | |
| FNMA Pool #MA4078, 2.50%, 7/1/50 | |
| FNMA Pool #MA4222, 3.50%, 12/1/50 | |
| FNMA Pool #MA4494, 3.00%, 12/1/51 | |
| FNMA Pool #MA4495, 3.50%, 12/1/51 | |
| FNMA REMIC Trust Series 2013-18, Series 2013-18, Class AE, 2.00%, 3/25/28 | |
| FNMA REMIC Trust Series 2013-41, Series 2013-41, Class WD, 2.00%, 11/25/42 | |
| FNMA UMBS TBA, 4.00%, 1/15/53 | |
| FNMA UMBS TBA, 4.50%, 1/15/53 | |
| FNMA UMBS TBA, 5.50%, 1/15/53 | |
| GNMA, Series 2021-98, Class 2021-IG, IO, 3.00%, 6/20/51 | |
| | |
RESIDENTIAL MORTGAGE-BACKED SECURITIES 8.2% (continued) |
| GNMA II Pool #MA3937, 3.50%, 9/20/46 | |
| GNMA II Pool #MA7054, 3.50%, 12/20/50 | |
| GNMA II Pool #MA7651, 3.50%, 10/20/51 | |
TOTAL RESIDENTIAL MORTGAGE-BACKED SECURITIES
(Cost $84,605,022) | |
U.S. TREASURY OBLIGATIONS 8.1% |
| U.S. Treasury Bonds, 5.38%, 2/15/31 | |
| U.S. Treasury Bonds, 4.38%, 2/15/38 | |
| U.S. Treasury Bonds, 3.50%, 2/15/39 | |
| U.S. Treasury Bonds, 2.75%, 11/15/42 | |
| U.S. Treasury Bonds, 2.88%, 5/15/43 | |
| U.S. Treasury Bonds, 3.00%, 2/15/48 | |
| U.S. Treasury Bonds, 2.25%, 8/15/49 | |
| U.S. Treasury Bonds, 2.88%, 5/15/52 | |
| U.S. Treasury Notes, 0.25%, 4/15/23 | |
| U.S. Treasury Notes, 2.38%, 8/15/24 | |
| U.S. Treasury Notes, 3.00%, 9/30/25 | |
| U.S. Treasury Notes, 1.63%, 5/15/26 | |
| U.S. Treasury Notes, 0.63%, 11/30/27 | |
| U.S. Treasury Notes, 1.50%, 2/15/30 | |
| U.S. Treasury Notes, 1.13%, 2/15/31 | |
| U.S. Treasury Notes, 2.75%, 8/15/32 | |
TOTAL U.S. TREASURY OBLIGATIONS
(Cost $83,450,851) | |
| | |
SHORT-TERM INVESTMENTS 6.7% |
| |
| State Street Institutional U.S. Government Money Market Fund, Premier Class, 4.12%(5) | |
| State Street Navigator Securities Lending Government Money Market Portfolio(6) | |
| | |
TOTAL SHORT-TERM INVESTMENTS
(Cost $63,176,942) | |
TOTAL INVESTMENTS IN SECURITIES 104.1%
(Cost $800,479,136) | |
EXCESS OF LIABILITIES OVER CASH AND OTHER ASSETS (4.1)% | |
| |
See Notes to Financial Statements.
| |
| A portion or all of the security was held on loan. As of December 31, 2022, the market value of the securities on loan was $7,716,870. |
| Floating or variable rate security. The rate disclosed is the rate in effect as of December 31, 2022. The information in parentheses represents the benchmark and reference rate for each relevant security and the rate adjusts based upon the reference rate and spread. The security may be further subject to interest rate floor and caps. For securities which do not indicate a reference rate and spread in their descriptions, the interest rate adjusts periodically based on current interest rates and, for mortgage-backed securities, prepayments in the underlying pool of assets. |
| Pursuant to Rule 144A under the Securities Act of 1933, this security can only be sold to qualified institutional investors. |
| Rate reflects 7 day yield as of December 31, 2022. |
| Securities with an aggregate market value of $7,716,870 were out on loan in exchange for collateral including $2,368,128 of cash collateral as of December 31, 2022. The collateral was invested in a cash collateral reinvestment vehicle. |
| Federal Home Loan Mortgage Corp. |
| Federal National Mortgage Association. |
| |
| Government National Mortgage Association. |
| London Interbank Offered Rate. |
| |
| Real Estate Investment Trusts. |
| Real Estate Mortgage Investment Conduit. |
| Secured Overnight Financing Rate. |
| |
| |
| Uniform Mortgage-Backed Securities |
The following table summarizes the inputs used to value the Fund's investments in securities as of December 31, 2022 (See Note 1(B)):
Investments in Securities: | | | | |
| | | | |
| | | | |
Commercial Mortgage-Backed Securities | | | | |
| | | | |
Long-Term Municipal Securities* | | | | |
Residential Mortgage-Backed Securities | | | | |
U.S. Treasury Obligations | | | | |
| | | | |
Total Investments in Securities | | | | |
| See Schedule of Investments for further breakdown by category. |
See Notes to Financial Statements.
Value Line Capital Appreciation Fund, Inc.
PORTFOLIO MANAGEMENT COMMENTARY (unaudited)
INVESTMENT OBJECTIVE
The Fund’s investment objective is to seek capital appreciation and income consistent with its asset allocation.
Manager Discussion of Fund Performance
Below, Value Line Capital Appreciation Fund, Inc. portfolio managers Cindy Starke and Liane Rosenberg discuss the Fund’s performance and positioning for the 12 months ended December 31, 2022.
How did the Fund perform during the annual period?
The Fund’s Investor Class generated a total return of -29.83% during the 12 months ended December 31, 2022. This compares to the -15.79% return of the Fund’s blended benchmark, comprised 60% of the S&P 500® Index and 40% of the Bloomberg US Aggregate Bond Index (the Bloomberg Index), during the same annual period.
What key factors were responsible for the Fund’s performance during the 12-month reporting period?
The Fund underperformed its blended benchmark during the 12-month reporting period. Asset allocation decisions detracted. The Fund was overweight equities and underweight fixed income, which hurt, as equities significantly underperformed fixed income during the annual period. However, having a position in cash, albeit a modest one, during an annual period when both the S&P 500® Index and Bloomberg Index declined boosted the Fund’s relative results.
The fixed income portion of the Fund outperformed the Bloomberg Index during the annual period. The equity portion of the Fund underperformed the S&P 500® Index during the annual period, driving the Fund’s underperformance most, attributable primarily to stock selection. Sector allocation overall also dampened results, though modestly. Further, the equity portion of the Fund was hurt by its allocation to growth companies and especially large-cap growth companies. Value-oriented stocks significantly outperformed growth-oriented stocks during the annual period, and large-cap growth-oriented stocks were the weakest segment of the U.S. equity market.
Which equity market sectors most significantly affected Fund performance?
The equity portion of the Fund was hurt most by stock selection in the information technology, communication services and industrials sectors. Within the information technology sector, selection within the information technology services, software, and semiconductor & semiconductor equipment industries hurt. Within communication services, an emphasis on the interactive media & services and entertainment industries detracted, as these were the weakest performing industries in the sector during the annual period. Within industrials, stock selection within the road & rail and electrical equipment industries dampened results most. Having overweighted allocations to information technology and communication services and an underweighted allocation to industrials also hurt.
Only partially offsetting these detractors was stock selection in health care, which contributed positively. The Fund also benefited from having an overweighted allocation to energy, which was by far the best performing sector in the S&P 500® Index during the annual period, and by having no exposure to the real estate sector for most of the annual period, a sector that lagged the S&P 500® Index during the annual period.
Which stocks detracted significantly from the Fund’s performance during the annual period?
During the annual period, the stocks that detracted most from the equity portion of the Fund’s performance were ride share transportation company Lyft, social media and Facebook parent company Meta Platforms and TV streaming platform operator Roku.
Lyft saw a significant double-digit share price decline during the annual period. Its weak performance reflected lower than consensus expected customer growth as well as driver market challenges, while the company was investing in its marketplace, drivers and brand marketing. Shares of Meta Platforms fell significantly during the annual period. The company was pressured by a slowdown in advertising, while investments and capital expenditures were higher than anticipated. Roku experienced a steep double-digit share price decline, as the company faced ongoing supply-chain headwinds and advertising and competition pressures, which together hurt the company’s margins.
What were some of the Fund’s best-performing individual stocks?
Contributing most to the equity portion of the Fund’s relative results were positions in blood-based disorders-focused clinical-stage biopharmaceutical company Global Blood Therapeutics, independent oil and natural gas company Diamondback Energy and oil and gas exploration and production company Pioneer Natural Resources.
Value Line Capital Appreciation Fund, Inc. (continued)
Shares of Global Blood Therapeutics enjoyed a triple-digit price gain during the annual period. Its stock benefited from the announcement by Pfizer in August 2022 that it would be acquiring the company. Following the announcement, the Fund sold its position in Global Blood Therapeutics, taking profits. Diamondback Energy’s shares experienced a double-digit share price gain during the annual period, supported by energy market tailwinds as well as the company reducing its debt and increasing its dividends during the year. Shares of Pioneer Natural Resources experienced a double-digit increase during the annual period, largely supported by energy market tailwinds and the company reporting increased production, investments in renewable energy and an increase in its dividend.
Did the equity portion of the Fund make any significant purchases or sales?
During the annual period, we established a position in Insulet, which develops diabetes management tools and is the market leader in a large, underpenetrated and growing type-2 diabetes market. The company’s Omnipod diabetes management system has been performing better than expected, leading to a growing number of customers. We also initiated a Fund position in exploration and production company Devon Energy, which, in our view, has an attractive asset base and financials and which grew its total production in 2022. Further, we initiated a Fund position in cosmetics company Estee Lauder during the annual period. In our view, the company has been benefiting from favorable demographic trends and was well positioned to grow in the post-pandemic environment, including better conditions for the travel retail industry.
Conversely, in addition to those sales already mentioned, we exited the Fund’s position in home construction company Lennar. The sale of Lennar was largely driven by our outlook for higher interest rates, which we believe represent a headwind for the homebuilding industry broadly. We eliminated the Fund’s position in Adobe, one of the largest software companies in the digital market and media markets. While the company was benefiting from digital transformation trends broadly, tighter macroeconomic conditions were pressuring the company’s fundamentals. We also sold the Fund’s position in interactive gaming and entertainment software developer Activision Blizzard following Microsoft’s announcement of its intent to acquire the company in an all-cash transaction.
Were there any notable changes in the equity portion of the Fund’s weightings during the 12-month period?
During the annual period, the equity portion of the Fund’s allocations to the consumer discretionary and energy sectors increased and its exposures to the health care and information technology sectors decreased relative to the S&P 500® Index. We eliminated the equity portion of the Fund’s exposure to the real estate sector by selling its sole real estate holding, American Tower, early in the annual period.
How was the equity portion of the Fund positioned relative to its benchmark index at the end of December 2022?
As of December 31, 2022, the equity portion of the Fund was overweight relative to the S&P 500® Index in the consumer discretionary, communication services, energy and information technology sectors. The equity portion of the Fund was underweight relative to the S&P 500® Index in the consumer staples and industrials sectors on the same date. The equity portion of the Fund was rather neutrally weighted to the S&P 500® Index in the financials and health care sectors and had no exposure to the materials, real estate and utilities sectors at the end of December 2022.
What was the duration and yield curve strategy of the fixed income portion of the Fund?
We generally kept the fixed income portion of the Fund’s duration shorter than that of the Bloomberg Index during the annual period based on our expectations for higher interest rates. As rates did rise across the yield curve in response to greater inflationary pressures and the U.S. Federal Reserve’s (the “Fed”) efforts to rein in inflation by hiking interest rates, the fixed income portion of the Fund’s short duration positioning added value. Duration is a measure of the Fund’s sensitivity to changes in interest rates.
Overall, yield curve positioning also contributed positively to results. The fixed income portion of the Fund had an overweight to intermediate-maturity bonds and an underweight to long-dated bonds, i.e. those with maturities of 30 years. Long-dated bonds significantly underperformed bonds with short-term and intermediate-term maturities during the annual period.
Which fixed income market segments most significantly affected Fund performance?
During the annual period, security selection within the investment grade corporate bond market boosted relative results. More specifically, positions in high quality investment grade corporate bonds, i.e. those rated AAA to A, materially outperformed positions in lower quality investment grade corporate bonds, i.e. those rated BBB, as investors looked to reduce risk. Further, the fixed income portion of the Fund maintained a modest position in cash, which proved beneficial as virtually all fixed income sectors posted negative absolute returns during the annual period.
Value Line Capital Appreciation Fund, Inc. (continued)
Conversely, having an overweighted allocation to investment grade corporate bonds relative to the Bloomberg Index detracted, as the sector was among the weakest within the fixed income asset class amid the strong investor bias to more “risk off”* securities during the annual period.
Were there any notable changes in the fixed income portion of the Fund’s weightings during the 12-month period?
During the annual period, in an effort to enhance the fixed income portion of the Fund’s risk-off posture, we added some higher quality corporate bonds to the portfolio and sold some weaker BBB-rated positions. For the same reason, we increased the fixed income portion of the Fund’s exposure to mortgage-backed securities from an underweight to a rather neutral weighting relative to the Bloomberg Index. Within the allocation to mortgage-backed securities, we shifted to higher-coupon securities, which had become more readily available with the rise in rates and which performed well later in 2022 as inflation declined, albeit from high levels. Further, we modestly lengthened the fixed income portion of the Fund’s duration compared to that of the Bloomberg Index, while still maintaining a shorter duration overall.
How was the fixed income portion of the Fund positioned relative to its benchmark index at the end of December 2022?
At the end of December 2022, the fixed income portion of the Fund remained overweight relative to the Bloomberg Index in investment grade corporate bonds and remained underweight relative to the Bloomberg Index in U.S. Treasuries. The fixed income portion of the Fund had a modest overweight to the securitized sector overall, but a rather neutral allocation to mortgage-backed securities compared to the Bloomberg Index at the end of the annual period.
How did the Fund’s overall asset allocation shift from beginning to end of the annual period?
At December 31, 2022, the Fund had a weighting of approximately 83% in stocks, 11% in fixed income securities and 6% in cash equivalents. This compared to approximately 84% in stocks, 11% in fixed income securities and 5% in cash equivalents at the start of the annual period.
How did the Fund use derivatives and similar instruments during the reporting period?
Neither the equity portion nor the fixed income portion of the Fund used derivatives during the reporting period.
What is your tactical view and strategy for the months ahead?
Following the worst year for S&P 500® Index performance since 2008 and only the third year since 1926 that both U.S. equities and bonds declined, we were cautiously optimistic at the end of the annual period that 2023 would be a better year for U.S. equity and fixed income markets. In our view, potential tailwinds for the U.S. equity markets for the year ahead include the potentially slowing pace of interest rate hikes and maybe even the end of the Fed’s current tightening cycle. Signs of cooling inflation and slower economic growth may serve as supports for such Fed action going forward. In addition, companies appear to be taking the necessary steps to eliminate jobs and unnecessary spending, increasing their focus on profitability. Still, headwinds remained, including the pace of U.S. economic growth and the potential depth and length of a recession, if it occurs.
Given this backdrop, we continue to believe innovative market leaders with scale, pricing power and strong management are likely to outperform the S&P 500® Index over longer periods of time and especially during spans of slower economic growth. At the end of the annual period, for the equity portion of the Fund, we continued to favor and look for quality companies with strong balance sheets that are poised to grow both sales and earnings above the market and their peers over the long term. We intend to closely monitor any significant changes in the pace of U.S. and global economic growth, any shifts in the Fed’s monetary policy, the path of the Russia/Ukraine war, and any notable movements in either inflation or labor market conditions, as these factors are likely, in our view, to affect the Fund’s equity and fixed income holdings.
*
"Risk off,” or its opposite “risk on,” is an investment setting in which price behavior responds to and is driven by changes in investor risk tolerance. Risk on and risk off refer to changes in investment activity in response to global economic patterns. During periods when risk is perceived as low, the risk on/risk off theory states that investors tend to engage in higher risk investments. When risk is perceived to be high, investors have the tendency to gravitate toward lower risk investments.
Value Line Capital Appreciation Fund, Inc.
Portfolio Highlights at December 31, 2022 (unaudited)
| | | |
| | | |
Pioneer Natural Resources Co. | | | |
| | | |
| | | |
| | | |
| | | |
| | | |
| | | |
| | | |
| | | |
| | | |
Asset Allocation — Percentage of Net Assets |
|
Common Stock Sectors —
Percentage of Common Stocks* |
|
Bonds & Notes Sectors —
Percentage of All Bonds & Notes* |
|
| Excludes short-term investments, if any. |
Value Line Capital Appreciation Fund, Inc.
Portfolio Highlights at December 31, 2022 (unaudited) (continued)
The following graph compares the performance of the Value Line Capital Appreciation Fund, Inc. to that of the S&P 500® Index**** and the 60/40 S&P 500® Index/Bloomberg US Aggregate Bond Index***, (the “Indexes”). The Value Line Capital Appreciation Fund, Inc. is a professionally managed mutual fund, while the Indexes are not available for investment and are unmanaged. The returns for the Indexes do not reflect charges, expenses or taxes, but do include the reinvestment of dividends, if any. The comparison is shown for illustrative purposes only.
Comparison of a Change in Value of a $10,000 Investment in the Value Line Capital Appreciation Fund, Inc., the S&P 500® Index and the 60/40 S&P 500® Index/Bloomberg US Aggregate Bond Index**Value Line Capital Appreciation Fund, Inc.
As of 12/31/2022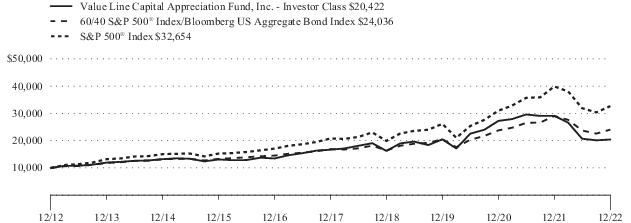
Value Line Capital Appreciation Fund, Inc.
Portfolio Highlights at December 31, 2022 (unaudited) (continued)
Performance Data: **
Average Annual Total Returns (For year ended 12/31/2022)
| | | | |
| | | | |
Value Line Capital Appreciation Fund, Inc. | | | | |
60/40 S&P 500® Index/Bloomberg US Aggregate Bond Index*** | | | | |
| | | | |
| | | | |
| | | | |
Value Line Capital Appreciation Fund, Inc. | | | | |
60/40 S&P 500® Index/Bloomberg US Aggregate Bond Index*** | | | | |
| | | | |
**
The performance data quoted represent past performance and are no guarantee of future performance. The investment return and principal value of an investment will fluctuate so that an investment, when redeemed, may be worth more or less than its original cost. The performance data includes reinvestments of all dividends and distributions but does not reflect the deduction of taxes that a shareholder would pay on fund distributions or the redemption of fund shares.
***
The 60/40 S&P 500®Index/Bloomberg US Aggregate Bond Index is an unmanaged blended index which consists of a 60% weighting of the S&P 500® Index representative of the larger capitalization stocks traded in the United States and a 40% weighting of the Bloomberg US Aggregate Bond Index which is a broad-based benchmark that measures the investment grade, U.S. dollar denominated, fixed-rate taxable bond market, including Treasuries, government-related and corporate securities, Mortgage Backed Securities (MBS) (agency fixed-rate and hybrid ARM pass-through’s), Asset Backed Securities (ABS), and Commercial Mortgage Backed Securities (CMBS).
****The S&P 500® Index is an unmanaged index that is representative of the larger-capitalization stocks traded in the United States.
Value Line Capital Appreciation Fund, Inc.
| | |
|
COMMUNICATION SERVICES 9.6% |
| |
| Alphabet, Inc. Class A(1) | |
| | |
| Meta Platforms, Inc. Class A(1) | |
| | |
| | |
| | |
| | |
| |
| | |
| | |
CONSUMER DISCRETIONARY 13.0% |
| |
| | |
| |
| | |
| |
| DraftKings, Inc. Class A(1)(2) | |
| | |
| | |
| |
| Alibaba Group Holding Ltd. ADR(1) | |
| | |
| Booking Holdings, Inc.(1) | |
| | |
| |
| Peloton Interactive, Inc. Class A(1)(2) | |
| |
| Hilton Worldwide Holdings, Inc. | |
| |
| | |
| Lululemon Athletica, Inc.(1) | |
| | |
| | |
| | |
| | |
|
| |
| Constellation Brands, Inc. Class A | |
| COSMETICS/PERSONAL CARE 1.6% |
| Estee Lauder Cos., Inc. Class A | |
| | |
|
| |
| | |
| | |
| Pioneer Natural Resources Co. | |
| | |
| | |
COMMON STOCKS 83.0% (continued) |
|
| |
| | |
| | |
| Goldman Sachs Group, Inc. | |
| | |
| | |
| DIVERSIFIED FINANCIALS 2.3% |
| | |
| Coinbase Global, Inc. Class A(1)(2) | |
| Interactive Brokers Group, Inc. Class A | |
| | |
| |
| Robinhood Markets, Inc. Class A(1) | |
| | |
|
| |
| BioMarin Pharmaceutical, Inc.(1) | |
| | |
| | |
| Intercept Pharmaceuticals, Inc.(1) | |
| Vertex Pharmaceuticals, Inc.(1) | |
| | |
| |
| | |
| | |
| | |
| |
| | |
| Revance Therapeutics, Inc.(1) | |
| | |
| | |
| | |
|
| |
| | |
| ELECTRICAL EQUIPMENT 0.6% |
| Generac Holdings, Inc.(1) | |
| |
| | |
| Uber Technologies, Inc.(1) | |
| | |
| | |
INFORMATION TECHNOLOGY 23.5% |
| |
| | |
| |
| | |
| Crowdstrike Holdings, Inc. Class A(1) | |
| | |
See Notes to Financial Statements.
| | |
COMMON STOCKS 83.0% (continued) |
INFORMATION TECHNOLOGY 23.5% (continued) |
| DIVERSIFIED FINANCIALS 3.2% |
| | |
| | |
| | |
| |
| | |
| | |
| | |
| |
| Advanced Micro Devices, Inc.(1) | |
| | |
| | |
| | |
| | |
| | |
| | |
| |
| | |
| | |
| | |
| | |
| | |
| | |
| | |
| | |
| | |
TOTAL COMMON STOCKS
(Cost $317,559,051) | |
| | |
COMMERCIAL MORTGAGE-BACKED SECURITIES 0.6% |
| COMM Mortgage Trust, Series 2014-UBS2, Class AM, 4.20%, 3/10/47 | |
| FHLMC Multifamily Structured Pass-Through Certificates, Series K052, Class A2, 3.15%, 11/25/25 | |
| FHLMC Multifamily Structured Pass-Through Certificates, Series K055, Class A2, 2.67%, 3/25/26 | |
| FHLMC Multifamily Structured Pass-Through Certificates, Series K064, Class A2, 3.22%, 3/25/27 | |
| FHLMC Multifamily Structured Pass-Through Certificates, Series K074, Class A2, 3.60%, 1/25/28 | |
| FHLMC Multifamily Structured Pass-Through Certificates, Series K084, Class A2, 3.78%, 10/25/28(3) | |
| FHLMC Multifamily Structured Pass-Through Certificates, Series K728, Class A2, 3.06%, 8/25/24(3) | |
| GNMA, Series 2013-12, Class AB, 1.83%, 11/16/52 | |
| | |
COMMERCIAL MORTGAGE-BACKED SECURITIES 0.6% (continued) |
| GNMA, Series 2013-12, Class B, 2.06%, 11/16/52(3) | |
| Wells Fargo Commercial Mortgage Trust, Series 2015-NXS1, Class A2, 2.63%, 5/15/48 | |
TOTAL COMMERCIAL MORTGAGE-BACKED SECURITIES
(Cost $2,309,109) | |
CORPORATE BONDS & NOTES 4.1% |
|
| |
| Steel Dynamics, Inc., Senior Unsecured Notes, 3.25%, 1/15/31 | |
| |
| Freeport-McMoRan, Inc., Guaranteed Notes, 4.63%, 8/1/30 | |
| | |
|
| |
| Expedia Group, Inc., Guaranteed Notes, 3.25%, 2/15/30 | |
| Netflix, Inc., Senior Unsecured Notes, 4.88%, 4/15/28 | |
| | |
| |
| Charter Communications Operating LLC/Charter Communications Operating Capital, Senior Secured Notes, 4.91%, 7/23/25 | |
| Comcast Corp., Guaranteed Notes, 3.95%, 10/15/25 | |
| Discovery Communications LLC, Guaranteed Notes, 4.90%, 3/11/26 | |
| | |
| |
| AT&T, Inc., Senior Unsecured Notes, 2.55%, 12/1/33 | |
| Motorola Solutions, Inc., Senior Unsecured Notes, 4.60%, 5/23/29 | |
| T-Mobile USA, Inc., Guaranteed Notes, 3.50%, 4/15/31 | |
| Vodafone Group PLC, Senior Unsecured Notes, 4.25%, 9/17/50 | |
| | |
| | |
|
| |
| Cummins, Inc., Senior Unsecured Notes, 1.50%, 9/1/30 | |
| Ford Motor Credit Co. LLC, Senior Unsecured Notes, 3.38%, 11/13/25 | |
| General Motors Financial Co., Inc., Senior Unsecured Notes, 5.00%, 4/9/27 | |
| | |
| |
| PulteGroup, Inc., Guaranteed Notes, 5.00%, 1/15/27(2) | |
See Notes to Financial Statements.
Schedule of Investments (continued)
| | |
CORPORATE BONDS & NOTES 4.1% (continued) |
CONSUMER, CYCLICAL 0.5% (continued) |
| |
| Marriott International, Inc., Senior Unsecured Notes, 5.00%, 10/15/27 | |
| |
| AutoZone, Inc., Senior Unsecured Notes, 3.75%, 6/1/27 | |
| Costco Wholesale Corp., Senior Unsecured Notes, 1.75%, 4/20/32(2) | |
| Dollar General Corp., Senior Unsecured Notes, 3.50%, 4/3/30 | |
| McDonald's Corp., Senior Unsecured Notes, 4.60%, 9/9/32(2) | |
| O'Reilly Automotive, Inc., Senior Unsecured Notes, 3.60%, 9/1/27(2) | |
| | |
| | |
CONSUMER, NON-CYCLICAL 0.8% |
| |
| Anheuser-Busch InBev Worldwide, Inc., Guaranteed Notes, 4.90%, 1/23/31(2) | |
| Constellation Brands, Inc., Guaranteed Notes, 5.25%, 11/15/48 | |
| Diageo Capital PLC, Guaranteed Notes, 2.00%, 4/29/30 | |
| | |
| |
| Regeneron Pharmaceuticals, Inc., Senior Unsecured Notes, 1.75%, 9/15/30 | |
| |
| PayPal Holdings, Inc., Senior Unsecured Notes, 2.65%, 10/1/26 | |
| |
| Baxter International, Inc., Senior Unsecured Notes, 1.73%, 4/1/31(2) | |
| |
| HCA, Inc., Guaranteed Notes, 5.38%, 2/1/25 | |
| Laboratory Corp. of America Holdings, Senior Unsecured Notes, 2.95%, 12/1/29 | |
| | |
| |
| AbbVie, Inc., Senior Unsecured Notes, 2.95%, 11/21/26 | |
| AstraZeneca PLC, Senior Unsecured Notes, 1.38%, 8/6/30 | |
| Becton Dickinson and Co., Senior Unsecured Notes, 3.70%, 6/6/27(2) | |
| CVS Health Corp., Senior Unsecured Notes, 1.75%, 8/21/30 | |
| Merck & Co., Inc., Senior Unsecured Notes, 3.90%, 3/7/39 | |
| Novartis Capital Corp., Guaranteed Notes, 2.75%, 8/14/50 | |
| Takeda Pharmaceutical Co. Ltd., Senior Unsecured Notes, 3.03%, 7/9/40 | |
| | |
CORPORATE BONDS & NOTES 4.1% (continued) |
CONSUMER, NON-CYCLICAL 0.8% (continued) |
| PHARMACEUTICALS 0.4% (continued) |
| Teva Pharmaceutical Finance Netherlands III BV, Guaranteed Notes, 3.15%, 10/1/26 | |
| Utah Acquisition Sub, Inc., Guaranteed Notes, 3.95%, 6/15/26 | |
| | |
| | |
|
| |
| Canadian Natural Resources Ltd., Senior Unsecured Notes, 2.05%, 7/15/25 | |
| EOG Resources, Inc., Senior Unsecured Notes, 4.38%, 4/15/30 | |
| Hess Corp., Senior Unsecured Notes, 4.30%, 4/1/27 | |
| Occidental Petroleum Corp., Senior Unsecured Notes, 5.50%, 12/1/25 | |
| | |
| |
| Boardwalk Pipelines LP, Guaranteed Notes, 4.95%, 12/15/24 | |
| Enbridge, Inc., Guaranteed Notes, 2.50%, 8/1/33(2) | |
| Enterprise Products Operating LLC, Guaranteed Notes, 4.85%, 8/15/42 | |
| Targa Resources Corp., Guaranteed Notes, 5.20%, 7/1/27 | |
| TransCanada PipeLines Ltd., Senior Unsecured Notes, 4.25%, 5/15/28 | |
| | |
| | |
|
| |
| Citigroup, Inc., Senior Unsecured Notes, (3-month LIBOR + 0.90%), 3.35%, 4/24/25(3) | |
| Citigroup, Inc., Subordinated Notes, 5.30%, 5/6/44 | |
| Goldman Sachs Group, Inc., Senior Unsecured Notes, 3.75%, 2/25/26 | |
| JPMorgan Chase & Co., Senior Unsecured Notes, (3-month LIBOR + 1.38%), 3.96%, 11/15/48(3) | |
| KeyCorp, Senior Unsecured Notes, 2.55%, 10/1/29 | |
| Lloyds Banking Group PLC, Senior Unsecured Notes, 3.90%, 3/12/24 | |
| Morgan Stanley, Series F, Senior Unsecured Notes, 3.88%, 4/29/24 | |
| Northern Trust Corp., Senior Unsecured Notes, 1.95%, 5/1/30(2) | |
| PNC Financial Services Group, Inc. (The), Senior Unsecured Notes, (SOFR + 0.98%), 2.31%, 4/23/32(3) | |
See Notes to Financial Statements.
| | |
CORPORATE BONDS & NOTES 4.1% (continued) |
FINANCIAL 1.4% (continued) |
| |
| Wells Fargo & Co., Senior Unsecured Notes, (SOFR + 1.32%), 5.24%, 4/25/26(3) | |
| | |
| DIVERSIFIED FINANCIALS 0.4% |
| AerCap Ireland Capital DAC/AerCap Global Aviation Trust, Guaranteed Notes, 1.75%, 1/30/26 | |
| Air Lease Corp., Senior Unsecured Notes, 3.63%, 4/1/27 | |
| Ally Financial, Inc., Senior Unsecured Notes, 4.75%, 6/9/27 | |
| American Express Co., Senior Unsecured Notes, (SOFR + 0.72%), 4.79%, 5/3/24(3) | |
| Charles Schwab Corp., Senior Unsecured Notes, (SOFR + 1.05%), 5.30%, 3/3/27(2)(3) | |
| Discover Financial Services, Senior Unsecured Notes, 3.95%, 11/6/24 | |
| Synchrony Financial, Senior Unsecured Notes, 4.25%, 8/15/24 | |
| Visa, Inc., Senior Unsecured Notes, 2.05%, 4/15/30 | |
| | |
| |
| CNA Financial Corp., Senior Unsecured Notes, 3.95%, 5/15/24 | |
| Prudential Financial, Inc., Junior Subordinated Notes, (3-month LIBOR + 2.67%), 5.70%, 9/15/48(3) | |
| | |
| |
| AvalonBay Communities, Inc., Senior Unsecured Notes, 2.45%, 1/15/31 | |
| Crown Castle, Inc., Senior Unsecured Notes, 3.80%, 2/15/28 | |
| Digital Realty Trust LP, Guaranteed Notes, 3.60%, 7/1/29(2) | |
| Equinix, Inc., Senior Unsecured Notes, 2.50%, 5/15/31 | |
| Kimco Realty Corp., Senior Unsecured Notes, 2.25%, 12/1/31 | |
| Life Storage LP, Guaranteed Notes, 2.20%, 10/15/30 | |
| Prologis LP, Senior Unsecured Notes, 2.25%, 4/15/30 | |
| Sabra Health Care LP, Guaranteed Notes, 3.90%, 10/15/29 | |
| Welltower, Inc., Senior Unsecured Notes, 4.25%, 4/15/28 | |
| | |
| | |
|
| |
| Raytheon Technologies Corp., Senior Unsecured Notes, 4.13%, 11/16/28 | |
| | |
CORPORATE BONDS & NOTES 4.1% (continued) |
INDUSTRIAL 0.3% (continued) |
| |
| Vulcan Materials Co., Senior Unsecured Notes, 3.50%, 6/1/30(2) | |
| |
| Flex Ltd., Senior Unsecured Notes, 4.75%, 6/15/25 | |
| MACHINERY - DIVERSIFIED 0.0% |
| John Deere Capital Corp., Senior Unsecured Notes, 2.45%, 1/9/30 | |
| |
| CSX Corp., Senior Unsecured Notes, 3.35%, 9/15/49 | |
| Union Pacific Corp., Senior Unsecured Notes, 3.25%, 2/5/50 | |
| | |
| | |
|
| |
| Dell International LLC / EMC Corp., Senior Unsecured Notes, 4.90%, 10/1/26 | |
| |
| Analog Devices, Inc., Senior Unsecured Notes, 2.80%, 10/1/41(2) | |
| |
| Adobe, Inc., Senior Unsecured Notes, 2.30%, 2/1/30 | |
| Electronic Arts, Inc., Senior Unsecured Notes, 4.80%, 3/1/26 | |
| | |
| | |
|
| |
| Duke Energy Corp., Senior Unsecured Notes, 4.50%, 8/15/32 | |
TOTAL CORPORATE BONDS & NOTES
(Cost $16,655,039) | |
LONG-TERM MUNICIPAL SECURITIES 0.2% |
| |
| San Marcos California Unified School District, Refunding Revenue Bonds, 3.17%, 8/1/38 | |
| |
| Massachusetts Water Resources Authority, Green Bonds, Refunding Revenue Bonds, Series F, 3.10%, 8/1/39 | |
| |
| City of Houston TX Combined Utility System Revenue, Refunding Revenue Bonds, Series D, 1.97%, 11/15/34 | |
| Tarrant County Cultural Education Facilities Finance Corp., Revenue Bonds, Baylor Health Care System Project, Series C, 4.45%, 11/15/43 | |
| | |
TOTAL LONG-TERM MUNICIPAL SECURITIES
(Cost $820,277) | |
See Notes to Financial Statements.
Schedule of Investments (continued)
| | |
RESIDENTIAL MORTGAGE-BACKED SECURITIES 3.3% |
| FHLMC, Series 4151, Class PA, 2.00%, 1/15/33 | |
| FHLMC Gold PC Pool #A47613, 5.00%, 11/1/35 | |
| FHLMC Gold Pool #C09027, 3.00%, 2/1/43 | |
| FHLMC Pool #QD2419, 3.00%, 12/1/51 | |
| FHLMC Pool #RA6817, 2.50%, 2/1/52 | |
| FHLMC Pool #SD8093, 3.50%, 9/1/50 | |
| FHLMC Pool #SD8108, 3.00%, 11/1/50 | |
| FNMA Pool #AH3226, 5.00%, 2/1/41 | |
| FNMA Pool #AL0657, 5.00%, 8/1/41 | |
| FNMA Pool #AQ1853, 3.00%, 11/1/42 | |
| FNMA Pool #AU5409, 3.00%, 8/1/43 | |
| FNMA Pool #CA5540, 3.00%, 4/1/50 | |
| FNMA Pool #FM2202, 4.00%, 12/1/48 | |
| FNMA Pool #FM4140, 2.50%, 9/1/50 | |
| FNMA Pool #FM9760, 3.50%, 11/1/51 | |
| FNMA Pool #FM9834, 3.50%, 6/1/49 | |
| FNMA Pool #MA4222, 3.50%, 12/1/50 | |
| FNMA REMIC Trust Series 2013-18, Series 2013-18, Class AE, 2.00%, 3/25/28 | |
| FNMA UMBS TBA, 4.00%, 1/15/53 | |
| FNMA UMBS TBA, 4.50%, 1/15/53 | |
| FNMA UMBS TBA, 5.50%, 1/15/53 | |
| GNMA, Series 2021-98, Class 2021-IG, IO, 3.00%, 6/20/51 | |
| GNMA II Pool #MA1521, 3.50%, 12/20/43 | |
| GNMA II Pool #MA1839, 4.00%, 4/20/44 | |
| GNMA II Pool #MA4836, 3.00%, 11/20/47 | |
| GNMA II Pool #MA7054, 3.50%, 12/20/50 | |
| GNMA II Pool #MA7651, 3.50%, 10/20/51 | |
TOTAL RESIDENTIAL MORTGAGE-BACKED SECURITIES
(Cost $13,180,369) | |
U.S. TREASURY OBLIGATIONS 2.9% |
| U.S. Treasury Bonds, 2.75%, 8/15/42 | |
| U.S. Treasury Bonds, 3.00%, 2/15/48 | |
| U.S. Treasury Bonds, 2.25%, 8/15/49 | |
| U.S. Treasury Bonds, 2.88%, 5/15/52 | |
| U.S. Treasury Notes, 2.25%, 11/15/24 | |
| U.S. Treasury Notes, 0.50%, 3/31/25 | |
| U.S. Treasury Notes, 3.00%, 9/30/25 | |
| U.S. Treasury Notes, 0.63%, 3/31/27 | |
| U.S. Treasury Notes, 2.25%, 8/15/27 | |
| U.S. Treasury Notes, 1.25%, 3/31/28 | |
| U.S. Treasury Notes, 1.63%, 8/15/29 | |
| U.S. Treasury Notes, 1.50%, 2/15/30 | |
| U.S. Treasury Notes, 1.13%, 2/15/31 | |
| U.S. Treasury Notes, 2.75%, 8/15/32 | |
TOTAL U.S. TREASURY OBLIGATIONS
(Cost $11,865,648) | |
| | |
SHORT-TERM INVESTMENTS 7.8% |
| |
| State Street Institutional U.S. Government Money Market Fund, Premier Class, 4.12%(4) | |
| State Street Navigator Securities Lending Government Money Market Portfolio(5) | |
| | |
TOTAL SHORT-TERM INVESTMENTS
(Cost $28,029,741) | |
TOTAL INVESTMENTS IN SECURITIES 101.9%
(Cost $390,419,234) | |
EXCESS OF LIABILITIES OVER CASH AND OTHER ASSETS (1.9)% | |
| |
| |
| A portion or all of the security was held on loan. As of December 31, 2022, the market value of the securities on loan was $5,850,857. |
| Floating or variable rate security. The rate disclosed is the rate in effect as of December 31, 2022. The information in parentheses represents the benchmark and reference rate for each relevant security and the rate adjusts based upon the reference rate and spread. The security may be further subject to interest rate floor and caps. For securities which do not indicate a reference rate and spread in their descriptions, the interest rate adjusts periodically based on current interest rates and, for mortgage-backed securities, prepayments in the underlying pool of assets. |
| Rate reflects 7 day yield as of December 31, 2022. |
| Securities with an aggregate market value of $5,850,857 were out on loan in exchange for collateral including $2,850,557 of cash collateral as of December 31, 2022. The collateral was invested in a cash collateral reinvestment vehicle. |
| American Depositary Receipt. |
| Federal Home Loan Mortgage Corp. |
| Federal National Mortgage Association. |
| Government National Mortgage Association. |
| London Interbank Offered Rate. |
| Real Estate Mortgage Investment Conduit. |
| Secured Overnight Financing Rate. |
| |
| Uniform Mortgage-Backed Securities |
See Notes to Financial Statements.
The following table summarizes the inputs used to value the Fund's investments in securities as of December 31, 2022 (See Note 1(B)):
Investments in Securities: | | | | |
| | | | |
| | | | |
Commercial Mortgage-Backed Securities | | | | |
| | | | |
Long-Term Municipal Securities* | | | | |
Residential Mortgage-Backed Securities | | | | |
U.S. Treasury Obligations | | | | |
| | | | |
Total Investments in Securities | | | | |
| See Schedule of Investments for further breakdown by category. |
See Notes to Financial Statements.
Value Line Core Bond Fund
PORTFOLIO MANAGEMENT COMMENTARY (unaudited)
INVESTMENT OBJECTIVE
The investment objective of the Fund is to maximize current income. Capital appreciation is a secondary objective but only when consistent with the Fund’s primary objective.
Manager Discussion of Fund Performance
Below, Value Line Core Bond Fund’s portfolio manager Liane Rosenberg discusses the Fund’s performance and positioning for the 12 months ended December 31, 2022.
How did the Fund perform during the annual period?
The Fund generated a total return of -12.58% during the 12 months ended December 31, 2022. This compares to the -13.01% return of the Fund’s benchmark, the Bloomberg US Aggregate Bond Index (the “Bloomberg Index”), during the same annual period.
What key factors were responsible for the Fund’s performance relative to its benchmark during the 12-month reporting period?
The Fund posted negative absolute returns but outperformed its benchmark on a relative basis due primarily to duration and yield curve positioning. Issue selection overall also contributed positively. Having an allocation to cash during this challenging period for fixed income assets also added value. Sector allocation decisions as a whole modestly detracted.
Which fixed income market sectors most significantly affected Fund performance?
During the annual period, exposure to high yield corporate bonds, which is not a component of the Bloomberg Index but which outperformed the Bloomberg Index during the annual period, contributed positively to the Fund’s relative performance. Having an underweight to U.S. Treasuries further bolstered Fund results given the rising rate environment that dominated the annual period. Issue selection within the corporate credit sector also added value. Finally, the Fund maintained an approximately 5% out-of-benchmark position in cash, which proved beneficial as virtually all fixed income sectors posted negative absolute returns during the annual period.
Conversely, having an overweighted allocation to investment grade corporate bonds relative to the Bloomberg Index detracted, as the sector was among the weakest within the fixed income asset class amid the strong investor bias to more “risk off”* securities during the annual period.
What was the Fund’s duration strategy?
Duration positioning in the Fund contributed positively to its relative performance, as the Fund generally held a duration stance shorter than that of the Bloomberg Index during the annual period based on our expectations for higher interest rates. As rates did rise across the yield curve during the annual period in response to greater inflationary pressures and the U.S. Federal Reserve’s (the “Fed”) efforts to rein in inflation by hiking interest rates, the Fund’s short duration positioning added value. Duration is a measure of the Fund’s sensitivity to changes in interest rates.
How did yield curve positioning decisions affect the Fund’s performance?
Overall, yield curve positioning contributed positively to the Fund’s relative performance during the annual period. The Fund was positioned with an overweight to intermediate-maturity bonds and an underweight to long-dated bonds, i.e. those with maturities of 30 years. Long-dated bonds significantly underperformed bonds with short-term and intermediate-term maturities during the annual period.
How did the Fund use derivatives and similar instruments during the reporting period?
The Fund did not use derivatives during the reporting period.
Were there any notable changes in the Fund’s weightings during the annual period?
During the annual period, we further shortened the Fund’s duration compared to that of the Bloomberg Index, as the Fed voiced a strong commitment to lowering inflation. Implementation of this strategy helped returns given the significant increase in interest rates. We modestly reduced the Fund’s exposure to corporate bonds, both investment grade and high yield, during the second half
Value Line Core Bond Fund (continued)
of the annual period as our concerns around a possible recession heightened. We increased the Fund’s exposure to mortgage-backed securities, and within the allocation, we shifted to higher-coupon securities, which had become more readily available with the rise in rates and which performed well later in 2022 as inflation declined, albeit from high levels.
How was the Fund positioned relative to its benchmark index at the end of December 2022?
At the end of December 2022, the Fund remained overweight relative to the Bloomberg Index in investment grade corporate bonds and commercial mortgage-backed securities and remained underweight relative to the Bloomberg Index in U.S. Treasuries. The Fund had a modestly underweighted allocation relative to the Bloomberg Index in mortgage-backed securities at the end of the annual period. The Fund maintained exposure to high yield corporate bonds, which are not a component of the Bloomberg Index.
What is your tactical view and strategy for the months ahead?
At the end of December 2022, we believed the Fed would continue to have an outsized influence on the fixed income market in the months ahead. While we felt the Fed had made some progress in taming inflation, there was still work to be done before inflation levels reach the Fed’s stated target of around 2%. If and when it becomes more clear that the Fed begins to take a less hawkish stance or is nearing the end of its tightening cycle, we intend to re-evaluate the Fund’s duration and curve positioning and its focus on quality and shorter-maturity securities. The other major factor we are monitoring is economic growth.
In regularly evaluating the Fund’s sector allocations and duration and yield curve positioning, we will, of course, also closely monitor any notable movements in either inflation or labor market conditions, as these factors, too, will likely impact the fixed income markets strongly in the months ahead.
*
"Risk off,” or its opposite “risk on,” is an investment setting in which price behavior responds to and is driven by changes in investor risk tolerance. Risk on and risk off refer to changes in investment activity in response to global economic patterns. During periods when risk is perceived as low, the risk on/risk off theory states that investors tend to engage in higher risk investments. When risk is perceived to be high, investors have the tendency to gravitate toward lower risk investments.
Value Line Core Bond Fund
Portfolio Highlights at December 31, 2022 (unaudited)
| | | |
| | | |
FNMA UMBS TBA, 5.50%, 1/15/53 | | | |
FNMA UMBS TBA, 4.50%, 1/15/53 | | | |
U.S. Treasury Bonds, 2.25%, 8/15/49 | | | |
FNMA Pool #FM9834, 3.50%, 6/1/49 | | | |
U.S. Treasury Notes, 2.25%, 11/15/24 | | | |
FNMA UMBS TBA, 4.00%, 1/15/53 | | | |
U.S. Treasury Bonds, 3.00%, 2/15/48 | | | |
U.S. Treasury Notes, 2.75%, 2/15/28 | | | |
FNMA Pool #CB0856, 3.00%, 6/1/51 | | | |
U.S. Treasury Bonds, 3.50%, 2/15/39 | | | |
Asset Allocation — Percentage of Net Assets |
|
Sector Weightings — Percentage of Total Investments In Securities* |
|
| Excludes short-term investments, if any. |
Value Line Core Bond Fund
Portfolio Highlights at December 31, 2022 (unaudited) (continued)
Coupon Distribution
| Percentage of
Total Investments
In Securities* |
| |
| |
| |
| |
| |
| Excludes short-term investments, if any. |
The following graph compares the performance of the Value Line Core Bond Fund to that of the Bloomberg US Aggregate Bond Index*** (the “Index”). The Value Line Core Bond Fund is a professionally managed mutual fund, while the Index is not available for investment and is unmanaged. The returns for the Index do not reflect charges, expenses or taxes, but do include the reinvestment of dividends, if any. The comparison is shown for illustrative purposes only.
Comparison of a Change in Value of a $10,000 Investment in the Value Line Core Bond Fund and the Bloomberg US Aggregate Bond Index***Value Line Core Bond Fund
As of 12/31/2022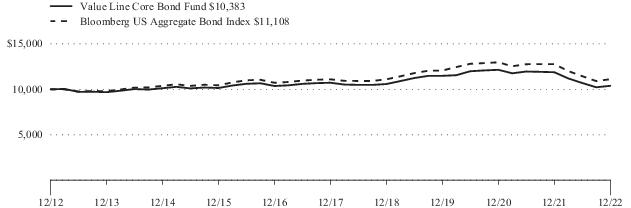
Value Line Core Bond Fund
Portfolio Highlights at December 31, 2022 (unaudited) (continued)
Performance Data: **
Average Annual Total Returns (For year ended 12/31/2022)
| | | |
Value Line Core Bond Fund | | | |
Bloomberg US Aggregate Bond Index*** | | | |
**
The performance data quoted represent past performance and are no guarantee of future performance. The investment return and principal value of an investment will fluctuate so that an investment, when redeemed, may be worth more or less than its original cost. The performance data includes reinvestments of all dividends and distributions but does not reflect the deduction of taxes that a shareholder would pay on fund distributions or the redemption of fund shares.
***
The Bloomberg US Aggregate Bond Index is a broad-based benchmark that measures the investment grade, U.S. dollar denominated, fixed-rate taxable bond market, including Treasuries, government-related and corporate securities, MBS (agency fixed-rate and hybrid ARM passthrough’s), ABS and CMBS. This is an unmanaged index and does not reflect charges, expenses or taxes, which are deducted from the Fund’s return. It is not possible to directly invest in this Index.
Value Line Core Bond Fund
| | |
COMMERCIAL MORTGAGE-BACKED SECURITIES 5.1% |
| COMM Mortgage Trust, Series 2014-UBS2, Class AM, 4.20%, 3/10/47 | |
| FHLMC Multifamily Structured Pass-Through Certificates, Series K058, Class A2, 2.65%, 8/25/26 | |
| FHLMC Multifamily Structured Pass-Through Certificates, Series K061, Class A2, 3.35%, 11/25/26(1) | |
| FHLMC Multifamily Structured Pass-Through Certificates, Series K063, Class A2, 3.43%, 1/25/27(1) | |
| FHLMC Multifamily Structured Pass-Through Certificates, Series K069, Class A2, 3.19%, 9/25/27(1) | |
| FHLMC Multifamily Structured Pass-Through Certificates, Series K092, Class A2, 3.30%, 4/25/29 | |
| FHLMC Multifamily Structured Pass-Through Certificates, Series K103, Class A2, 2.65%, 11/25/29 | |
| FREMF Mortgage Trust, Series 2015-K43, Class B, 3.73%, 2/25/48(1)(2) | |
| GNMA, Series 2012-125, Class AB, 2.11%, 2/16/53(1) | |
| GNMA, Series 2013-12, Class AB, 1.83%, 11/16/52 | |
| Sequoia Mortgage Trust, Series 2004-8, Class A1, (1-month LIBOR + 0.70%), 5.05%, 9/20/34(1) | |
| Wells Fargo Commercial Mortgage Trust, Series 2015-NXS2, Class ASB, 3.46%, 7/15/58 | |
TOTAL COMMERCIAL MORTGAGE-BACKED SECURITIES
(Cost $2,414,086) | |
CORPORATE BONDS & NOTES 35.7% |
|
| |
| Nutrien Ltd., Senior Unsecured Notes, 4.20%, 4/1/29 | |
| |
| Steel Dynamics, Inc., Senior Unsecured Notes, 3.25%, 1/15/31 | |
| |
| Freeport-McMoRan, Inc., Guaranteed Notes, 4.63%, 8/1/30 | |
| | |
|
| |
| Expedia Group, Inc., Guaranteed Notes, 3.25%, 2/15/30 | |
| Netflix, Inc., Senior Unsecured Notes, 4.88%, 4/15/28 | |
| VeriSign, Inc., Senior Unsecured Notes, 2.70%, 6/15/31(3) | |
| | |
| | |
CORPORATE BONDS & NOTES 35.7% (continued) |
COMMUNICATIONS 3.4% (continued) |
| |
| Charter Communications Operating LLC/Charter Communications Operating Capital, Senior Secured Notes, 4.91%, 7/23/25 | |
| Comcast Corp., Guaranteed Notes, 4.15%, 10/15/28 | |
| Discovery Communications LLC, Guaranteed Notes, 4.90%, 3/11/26 | |
| | |
| |
| AT&T, Inc., Senior Unsecured Notes, 2.55%, 12/1/33 | |
| Motorola Solutions, Inc., Senior Unsecured Notes, 4.60%, 5/23/29 | |
| T-Mobile USA, Inc., Guaranteed Notes, 3.50%, 4/15/31 | |
| Vodafone Group PLC, Senior Unsecured Notes, 4.25%, 9/17/50 | |
| | |
| | |
|
| |
| Cummins, Inc., Senior Unsecured Notes, 1.50%, 9/1/30 | |
| Ford Motor Credit Co. LLC, Senior Unsecured Notes, 3.38%, 11/13/25 | |
| General Motors Financial Co., Inc., Senior Unsecured Notes, 5.00%, 4/9/27 | |
| | |
| |
| Lennar Corp., Guaranteed Notes, 4.88%, 12/15/23(3) | |
| PulteGroup, Inc., Guaranteed Notes, 5.00%, 1/15/27(3) | |
| Toll Brothers Finance Corp., Guaranteed Notes, 4.88%, 11/15/25 | |
| | |
| |
| Marriott International, Inc., Senior Unsecured Notes, 5.00%, 10/15/27 | |
| |
| AutoZone, Inc., Senior Unsecured Notes, 3.75%, 6/1/27 | |
| Costco Wholesale Corp., Senior Unsecured Notes, 1.75%, 4/20/32 | |
| Dollar General Corp., Senior Unsecured Notes, 3.50%, 4/3/30 | |
| McDonald's Corp., Senior Unsecured Notes, 4.60%, 9/9/32(3) | |
| O'Reilly Automotive, Inc., Senior Unsecured Notes, 3.60%, 9/1/27 | |
| | |
| | |
See Notes to Financial Statements.
Schedule of Investments (continued)
| | |
CORPORATE BONDS & NOTES 35.7% (continued) |
CONSUMER, NON-CYCLICAL 7.1% |
| |
| Bunge Ltd. Finance Corp., Guaranteed Notes, 3.25%, 8/15/26 | |
| |
| Anheuser-Busch InBev Worldwide, Inc., Guaranteed Notes, 4.90%, 1/23/31 | |
| Constellation Brands, Inc., Guaranteed Notes, 5.25%, 11/15/48 | |
| Diageo Capital PLC, Guaranteed Notes, 2.00%, 4/29/30 | |
| | |
| |
| Amgen, Inc., Senior Unsecured Notes, 2.20%, 2/21/27 | |
| Regeneron Pharmaceuticals, Inc., Senior Unsecured Notes, 1.75%, 9/15/30 | |
| | |
| |
| PayPal Holdings, Inc., Senior Unsecured Notes, 2.65%, 10/1/26 | |
| Service Corp. International, Senior Unsecured Notes, 4.00%, 5/15/31 | |
| | |
| |
| Baxter International, Inc., Senior Unsecured Notes, 1.73%, 4/1/31 | |
| |
| Centene Corp., Senior Unsecured Notes, 4.63%, 12/15/29 | |
| HCA, Inc., Guaranteed Notes, 5.38%, 2/1/25 | |
| Laboratory Corp. of America Holdings, Senior Unsecured Notes, 2.95%, 12/1/29 | |
| UnitedHealth Group, Inc., Senior Unsecured Notes, 4.63%, 11/15/41 | |
| | |
| |
| AbbVie, Inc., Senior Unsecured Notes, 2.95%, 11/21/26 | |
| AstraZeneca PLC, Senior Unsecured Notes, 1.38%, 8/6/30 | |
| Becton Dickinson and Co., Senior Unsecured Notes, 3.70%, 6/6/27(3) | |
| CVS Health Corp., Senior Unsecured Notes, 1.75%, 8/21/30 | |
| Merck & Co., Inc., Senior Unsecured Notes, 3.90%, 3/7/39 | |
| Novartis Capital Corp., Guaranteed Notes, 2.75%, 8/14/50 | |
| Takeda Pharmaceutical Co. Ltd., Senior Unsecured Notes, 3.03%, 7/9/40 | |
| Teva Pharmaceutical Finance Netherlands III BV, Guaranteed Notes, 3.15%, 10/1/26 | |
| | |
CORPORATE BONDS & NOTES 35.7% (continued) |
CONSUMER, NON-CYCLICAL 7.1% (continued) |
| PHARMACEUTICALS 2.8% (continued) |
| Utah Acquisition Sub, Inc., Guaranteed Notes, 3.95%, 6/15/26 | |
| | |
| | |
|
| |
| Canadian Natural Resources Ltd., Senior Unsecured Notes, 2.05%, 7/15/25 | |
| EOG Resources, Inc., Senior Unsecured Notes, 4.38%, 4/15/30 | |
| Hess Corp., Senior Unsecured Notes, 4.30%, 4/1/27 | |
| Occidental Petroleum Corp., Senior Unsecured Notes, 5.50%, 12/1/25 | |
| | |
| |
| Schlumberger Finance Canada Ltd., Guaranteed Notes, 1.40%, 9/17/25 | |
| |
| Boardwalk Pipelines LP, Guaranteed Notes, 4.95%, 12/15/24 | |
| Enbridge, Inc., Guaranteed Notes, 2.50%, 8/1/33 | |
| Enterprise Products Operating LLC, Guaranteed Notes, 4.85%, 8/15/42 | |
| Kinder Morgan, Inc., Guaranteed Notes, 4.30%, 3/1/28 | |
| Magellan Midstream Partners LP, Senior Unsecured Notes, 4.25%, 9/15/46 | |
| Targa Resources Corp., Guaranteed Notes, 5.20%, 7/1/27 | |
| TransCanada PipeLines Ltd., Senior Unsecured Notes, 4.25%, 5/15/28 | |
| | |
| | |
|
| |
| Bank of America Corp. MTN, Senior Unsecured Notes, (SOFR + 1.33%), 5.65%, 4/2/26(1) | |
| Citigroup, Inc., Senior Unsecured Notes, (3-month LIBOR + 0.90%), 3.35%, 4/24/25(1) | |
| Citigroup, Inc., Subordinated Notes, 5.30%, 5/6/44 | |
| First-Citizens Bank & Trust Co., Senior Unsecured Notes, (SOFR + 3.83%), 3.93%, 6/19/24(1) | |
| Goldman Sachs Group, Inc., Senior Unsecured Notes, 3.75%, 2/25/26 | |
| JPMorgan Chase & Co., Subordinated Notes, 4.13%, 12/15/26(3) | |
| JPMorgan Chase & Co., Senior Unsecured Notes, (3-month LIBOR + 1.38%), 3.96%, 11/15/48(1) | |
See Notes to Financial Statements.
| | |
CORPORATE BONDS & NOTES 35.7% (continued) |
FINANCIAL 11.8% (continued) |
| |
| KeyCorp, Senior Unsecured Notes, 2.55%, 10/1/29 | |
| Lloyds Banking Group PLC, Senior Unsecured Notes, 3.90%, 3/12/24 | |
| Morgan Stanley, Series F, Senior Unsecured Notes, 3.88%, 4/29/24 | |
| Northern Trust Corp., Senior Unsecured Notes, 1.95%, 5/1/30(3) | |
| PNC Financial Services Group, Inc. (The), Senior Unsecured Notes, (SOFR + 0.98%), 2.31%, 4/23/32(1)(3) | |
| Wells Fargo & Co., Senior Unsecured Notes, (SOFR + 1.32%), 5.24%, 4/25/26(1) | |
| Zions Bancorp NA, Subordinated Notes, 3.25%, 10/29/29 | |
| | |
| DIVERSIFIED FINANCIALS 2.8% |
| AerCap Ireland Capital DAC/AerCap Global Aviation Trust, Guaranteed Notes, 1.75%, 1/30/26 | |
| Air Lease Corp., Senior Unsecured Notes, 3.63%, 4/1/27 | |
| Ally Financial, Inc., Senior Unsecured Notes, 4.75%, 6/9/27 | |
| American Express Co., Senior Unsecured Notes, (SOFR + 0.72%), 4.79%, 5/3/24(1) | |
| Charles Schwab Corp., Senior Unsecured Notes, (SOFR + 1.05%), 5.30%, 3/3/27(1)(3) | |
| Discover Financial Services, Senior Unsecured Notes, 3.95%, 11/6/24 | |
| Synchrony Financial, Senior Unsecured Notes, 4.25%, 8/15/24 | |
| | |
| |
| Aflac, Inc., Senior Unsecured Notes, 3.60%, 4/1/30 | |
| Allstate Corp., Senior Unsecured Notes, 1.45%, 12/15/30 | |
| CNA Financial Corp., Senior Unsecured Notes, 3.95%, 5/15/24 | |
| Prudential Financial, Inc., Junior Subordinated Notes, (3-month LIBOR + 2.67%), 5.70%, 9/15/48(1) | |
| | |
| |
| AvalonBay Communities, Inc., Senior Unsecured Notes, 2.45%, 1/15/31 | |
| Crown Castle, Inc., Senior Unsecured Notes, 3.80%, 2/15/28 | |
| Digital Realty Trust LP, Guaranteed Notes, 3.60%, 7/1/29 | |
| Equinix, Inc., Senior Unsecured Notes, 2.50%, 5/15/31 | |
| Kimco Realty Corp., Senior Unsecured Notes, 2.25%, 12/1/31 | |
| | |
CORPORATE BONDS & NOTES 35.7% (continued) |
FINANCIAL 11.8% (continued) |
| |
| Life Storage LP, Guaranteed Notes, 2.20%, 10/15/30 | |
| Prologis LP, Senior Unsecured Notes, 2.25%, 4/15/30 | |
| Sabra Health Care LP, Guaranteed Notes, 3.90%, 10/15/29 | |
| Welltower, Inc., Senior Unsecured Notes, 4.25%, 4/15/28 | |
| | |
| | |
|
| |
| Raytheon Technologies Corp., Senior Unsecured Notes, 4.13%, 11/16/28 | |
| |
| Masco Corp., Senior Unsecured Notes, 2.00%, 10/1/30 | |
| Vulcan Materials Co., Senior Unsecured Notes, 3.50%, 6/1/30 | |
| | |
| |
| Amphenol Corp., Senior Unsecured Notes, 2.20%, 9/15/31 | |
| Flex Ltd., Senior Unsecured Notes, 4.75%, 6/15/25 | |
| | |
| MACHINERY - DIVERSIFIED 0.3% |
| John Deere Capital Corp., Senior Unsecured Notes, 2.45%, 1/9/30 | |
| |
| CSX Corp., Senior Unsecured Notes, 3.35%, 9/15/49 | |
| Union Pacific Corp., Senior Unsecured Notes, 3.25%, 2/5/50 | |
| | |
| | |
|
| |
| Dell International LLC / EMC Corp., Senior Unsecured Notes, 4.90%, 10/1/26 | |
| |
| Analog Devices, Inc., Senior Unsecured Notes, 2.80%, 10/1/41 | |
| |
| Adobe, Inc., Senior Unsecured Notes, 2.30%, 2/1/30 | |
| Electronic Arts, Inc., Senior Unsecured Notes, 4.80%, 3/1/26 | |
| Oracle Corp., 6.25%, 11/9/32 | |
| | |
| | |
See Notes to Financial Statements.
Schedule of Investments (continued)
| | |
CORPORATE BONDS & NOTES 35.7% (continued) |
|
| |
| Duke Energy Corp., Senior Unsecured Notes, 4.50%, 8/15/32 | |
TOTAL CORPORATE BONDS & NOTES
(Cost $16,377,647) | |
FOREIGN GOVERNMENT OBLIGATIONS 0.4% |
| European Bank for Reconstruction & Development, Senior Unsecured Notes, 2.75%, 3/7/23 | |
TOTAL FOREIGN GOVERNMENT OBLIGATIONS
(Cost $149,985) | |
LONG-TERM MUNICIPAL SECURITIES 2.4% |
| |
| San Marcos California Unified School District, Refunding Revenue Bonds, 3.17%, 8/1/38 | |
| |
| Hartford County Metropolitan District Clean Water Project Revenue, Series B, 2.17%, 4/1/34 | |
| DISTRICT OF COLUMBIA 0.5% |
| District of Columbia Income Tax Secured Revenue Bonds, Build America Bonds, Series F, 4.91%, 12/1/23 | |
| |
| State of Oregon, Series C, GO, 2.38%, 5/1/36 | |
| |
| Tarrant County Cultural Education Facilities Finance Corp., Revenue Bonds, Baylor Health Care System Project, Series C, 4.45%, 11/15/43 | |
TOTAL LONG-TERM MUNICIPAL SECURITIES
(Cost $1,179,774) | |
U.S. GOVERNMENT AGENCY OBLIGATIONS 1.1% |
| | |
| | |
TOTAL U.S. GOVERNMENT AGENCY OBLIGATIONS
(Cost $483,870) | |
RESIDENTIAL MORTGAGE-BACKED SECURITIES 25.6% |
| FHLMC Gold PC Pool #A29526, 5.00%, 1/1/35 | |
| FHLMC Gold PC Pool #C91749, 4.00%, 1/1/34 | |
| FHLMC Gold PC Pool #G06224, 3.50%, 1/1/41 | |
| FHLMC Gold PC Pool #J11587, 4.00%, 1/1/25 | |
| FHLMC Gold PC Pool #Q06307, 3.50%, 2/1/42 | |
| FHLMC Gold PC Pool #Q08656, 4.00%, 6/1/42 | |
| FHLMC Gold PC Pool #Q08903, 3.50%, 6/1/42 | |
| FHLMC Gold PC Pool #Q14593, 3.00%, 1/1/43 | |
| | |
RESIDENTIAL MORTGAGE-BACKED SECURITIES 25.6% (continued) |
| FHLMC Gold Pool #Q34167, 4.00%, 6/1/45 | |
| FHLMC Gold Pool #Q57991, 4.00%, 8/1/48 | |
| FHLMC Pool #QB2958, 3.00%, 9/1/50 | |
| FHLMC Pool #QB5314, 2.50%, 11/1/50 | |
| FHLMC Pool #QB8153, 2.50%, 1/1/51 | |
| FHLMC Pool #SD8023, 2.50%, 11/1/49 | |
| FHLMC Pool #SD8163, 3.50%, 8/1/51 | |
| FHLMC Pool #SD8173, 2.50%, 10/1/51 | |
| FNMA Pool #AB2346, 4.50%, 2/1/41 | |
| FNMA Pool #AB5231, 2.50%, 5/1/27 | |
| FNMA Pool #AB5716, 3.00%, 7/1/27 | |
| FNMA Pool #AI4285, 5.00%, 6/1/41 | |
| FNMA Pool #AR6394, 3.00%, 2/1/43 | |
| FNMA Pool #AS5892, 3.50%, 10/1/45 | |
| FNMA Pool #AS6102, 3.50%, 11/1/45 | |
| FNMA Pool #AS6205, 3.50%, 11/1/45 | |
| FNMA Pool #AS6385, 4.00%, 12/1/45 | |
| FNMA Pool #AS9562, 3.00%, 5/1/47 | |
| FNMA Pool #AU4279, 3.00%, 9/1/43 | |
| FNMA Pool #AV0703, 4.00%, 12/1/43 | |
| FNMA Pool #AW7362, 2.50%, 8/1/29 | |
| FNMA Pool #AX0416, 4.00%, 8/1/44 | |
| FNMA Pool #AY1670, 3.50%, 2/1/45 | |
| FNMA Pool #AY4195, 4.00%, 5/1/45 | |
| FNMA Pool #BA3885, 3.50%, 11/1/45 | |
| FNMA Pool #CA2320, 3.50%, 9/1/48 | |
| FNMA Pool #CA5540, 3.00%, 4/1/50 | |
| FNMA Pool #CB0856, 3.00%, 6/1/51 | |
| FNMA Pool #FM9834, 3.50%, 6/1/49 | |
| FNMA Pool #MA0641, 4.00%, 2/1/31 | |
| FNMA Pool #MA4012, 2.00%, 5/1/35 | |
| FNMA Pool #MA4548, 2.50%, 2/1/52 | |
| FNMA REMIC Trust Series 2013-18, Series 2013-18, Class AE, 2.00%, 3/25/28 | |
| FNMA UMBS TBA, 4.00%, 1/15/53 | |
| FNMA UMBS TBA, 4.50%, 1/15/53 | |
| FNMA UMBS TBA, 5.50%, 1/15/53 | |
| GNMA, Series 2011-136, Class GB, 2.50%, 5/20/40 | |
| GNMA, Series 2021-98, Class 2021-IG, IO, 3.00%, 6/20/51 | |
| GNMA II Pool #5332, 4.00%, 3/20/42 | |
| GNMA II Pool #MA3937, 3.50%, 9/20/46 | |
| GNMA II Pool #MA7054, 3.50%, 12/20/50 | |
| GNMA II Pool #MA7651, 3.50%, 10/20/51 | |
TOTAL RESIDENTIAL MORTGAGE-BACKED SECURITIES
(Cost $11,385,292) | |
U.S. TREASURY OBLIGATIONS 25.9% |
| U.S. Treasury Bonds, 5.38%, 2/15/31 | |
| U.S. Treasury Bonds, 4.38%, 2/15/38 | |
| U.S. Treasury Bonds, 3.50%, 2/15/39 | |
| U.S. Treasury Bonds, 1.13%, 5/15/40 | |
| U.S. Treasury Bonds, 2.88%, 5/15/43 | |
See Notes to Financial Statements.
| | |
U.S. TREASURY OBLIGATIONS 25.9% (continued) |
| U.S. Treasury Bonds, 3.00%, 2/15/48 | |
| U.S. Treasury Bonds, 2.25%, 8/15/49 | |
| U.S. Treasury Bonds, 2.88%, 5/15/52 | |
| U.S. Treasury Inflation Indexed Note, 0.13%, 7/15/31 | |
| U.S. Treasury Notes, 0.13%, 7/15/23 | |
| U.S. Treasury Notes, 0.13%, 8/31/23 | |
| U.S. Treasury Notes, 0.25%, 11/15/23 | |
| U.S. Treasury Notes, 2.25%, 11/15/24 | |
| U.S. Treasury Notes, 3.00%, 9/30/25 | |
| U.S. Treasury Notes, 1.50%, 8/15/26 | |
| U.S. Treasury Notes, 1.13%, 2/28/27 | |
| U.S. Treasury Notes, 2.75%, 2/15/28 | |
| U.S. Treasury Notes, 1.25%, 6/30/28 | |
| U.S. Treasury Notes, 1.63%, 8/15/29 | |
| U.S. Treasury Notes, 1.50%, 2/15/30 | |
| U.S. Treasury Notes, 1.13%, 2/15/31 | |
| U.S. Treasury Notes, 2.75%, 8/15/32 | |
TOTAL U.S. TREASURY OBLIGATIONS
(Cost $12,354,883) | |
| | |
SHORT-TERM INVESTMENTS 16.6% |
| |
| State Street Institutional U.S. Government Money Market Fund, Premier Class, 4.12%(4) | |
| State Street Navigator Securities Lending Government Money Market Portfolio(5) | |
| | |
TOTAL SHORT-TERM INVESTMENTS
(Cost $6,754,597) | |
TOTAL INVESTMENTS IN SECURITIES 112.8%
(Cost $51,100,134) | |
EXCESS OF LIABILITIES OVER CASH AND OTHER ASSETS (12.8)% | |
| |
| Floating or variable rate security. The rate disclosed is the rate in effect as of December 31, 2022. The information in parentheses represents the benchmark and reference rate for each relevant security and the rate adjusts based upon the reference rate and spread. The security may be further subject to interest rate floor and caps. For securities which do not indicate a reference rate and spread in their descriptions, the interest rate adjusts periodically based on current interest rates and, for mortgage-backed securities, prepayments in the underlying pool of assets. |
| Pursuant to Rule 144A under the Securities Act of 1933, this security can only be sold to qualified institutional investors. |
| A portion or all of the security was held on loan. As of December 31, 2022, the market value of the securities on loan was $1,447,891. |
| Rate reflects 7 day yield as of December 31, 2022. |
| Securities with an aggregate market value of $1,447,891 were out on loan in exchange for collateral including $658,837 of cash collateral as of December 31, 2022. The collateral was invested in a cash collateral reinvestment vehicle. |
| Federal Home Loan Mortgage Corp. |
| Federal National Mortgage Association. |
| |
| Government National Mortgage Association. |
| London Interbank Offered Rate. |
| |
| Real Estate Mortgage Investment Conduit. |
| Secured Overnight Financing Rate. |
| |
| Uniform Mortgage-Backed Securities |
See Notes to Financial Statements.
Schedule of Investments (continued)
The following table summarizes the inputs used to value the Fund's investments in securities as of December 31, 2022 (See Note 1(B)):
Investments in Securities: | | | | |
| | | | |
Commercial Mortgage-Backed Securities | | | | |
| | | | |
Foreign Government Obligations | | | | |
Long-Term Municipal Securities* | | | | |
U.S. Government Agency Obligations | | | | |
Residential Mortgage-Backed Securities | | | | |
U.S. Treasury Obligations | | | | |
| | | | |
Total Investments in Securities | | | | |
| See Schedule of Investments for further breakdown by category. |
See Notes to Financial Statements.
Statements of Assets and Liabilities
at December 31, 2022
| Value Line Small Cap
Opportunities Fund, Inc. | Value Line Mid Cap
Focused
Fund, Inc. |
| | |
Investments in securities, at value* | | |
Dividends and interest receivable | | |
Receivable for securities sold | | |
Receivable for capital shares sold | | |
| | |
Receivable for securities lending income | | |
| | |
| | |
Payable upon return of securities on loan (See Note 1(K)) | | |
Payable for capital shares redeemed | | |
| | |
| | |
Service and distribution plan fees | | |
| | |
Auditing and legal fees payable | | |
Custody and accounting fees payable | | |
| | |
Directors’ fees and expenses | | |
| | |
| | |
| | |
| | |
Capital stock, at $0.001 and $1.00 par value, respectively (authorized 300,000,000 and 50,000,000 shares, respectively) | | |
Additional paid-in capital | | |
Distributable Earnings/(Loss) | | |
| | |
Net Asset Value Per Share | | |
| | |
| | |
| | |
Net Asset Value, Offering and Redemption Price per Outstanding Share | | |
| | |
| | |
| | |
Net Asset Value, Offering and Redemption Price per Outstanding Share | | |
*Includes securities on loan of | | |
| | |
See Notes to Financial Statements.
Statements of Assets and Liabilities
at December 31, 2022 (continued)
| Value Line Select
Growth
Fund, Inc. | Value Line Larger
Companies Focused
Fund, Inc. |
| | |
Investments in securities, at value* | | |
Receivable for securities sold | | |
Dividends and interest receivable | | |
| | |
Receivable for capital shares sold | | |
Receivable for securities lending income | | |
| | |
| | |
Payable for capital shares redeemed | | |
Payable upon return of securities on loan (See Note 1(K)) | | |
| | |
| | |
Service and distribution plan fees | | |
Auditing and legal fees payable | | |
Custody and accounting fees payable | | |
| | |
Directors’ fees and expenses | | |
| | |
| | |
| | |
| | |
| | |
Capital stock, at $1.00 par value (authorized 100,000,000 and 50,000,000 shares, respectively) | | |
Additional paid-in capital | | |
Distributable Earnings/(Loss) | | |
| | |
Net Asset Value Per Share | | |
| | |
| | |
| | |
Net Asset Value, Offering and Redemption Price per Outstanding Share | | |
| | |
| | |
| | |
Net Asset Value, Offering and Redemption Price per Outstanding Share | | |
*Includes securities on loan of | | |
| | |
See Notes to Financial Statements.
Statements of Assets and Liabilities
at December 31, 2022 (continued)
| Value Line Asset
Allocation Fund, Inc. | Value Line Capital
Appreciation
Fund, Inc. |
| | |
Investments in securities, at value* | | |
Receivable for securities sold | | |
Dividends and interest receivable | | |
Receivable for capital shares sold | | |
| | |
Receivable for securities lending income | | |
| | |
| | |
Payable for securities purchased | | |
Payable for capital shares redeemed | | |
Payable upon return of securities on loan (See Note 1(K)) | | |
| | |
| | |
Service and distribution plan fees | | |
| | |
Custody and accounting fees payable | | |
Auditing and legal fees payable | | |
| | |
Directors’ fees and expenses | | |
| | |
| | |
| | |
| | |
Capital stock, at $0.001 and $1.00 par value, respectively (authorized 300,000,000 and 75,000,000 shares, respectively) | | |
Additional paid-in capital | | |
Distributable Earnings/(Loss) | | |
| | |
Net Asset Value Per Share | | |
| | |
| | |
| | |
Net Asset Value, Offering and Redemption Price per Outstanding Share | | |
| | |
| | |
| | |
Net Asset Value, Offering and Redemption Price per Outstanding Share | | |
*Includes securities on loan of | | |
| | |
See Notes to Financial Statements.
Statements of Assets and Liabilities
at December 31, 2022 (continued)
| |
| |
Investments in securities, at value* | |
Dividends and interest receivable | |
Receivable for capital shares sold | |
| |
Receivable for securities lending income | |
| |
| |
Payable for securities purchased | |
Payable upon return of securities on loan (See Note 1(K)) | |
Payable for capital shares redeemed | |
Dividends payable to shareholders | |
| |
| |
Custody and accounting fees payable | |
Auditing and legal fees payable | |
| |
Directors’ fees and expenses | |
| |
| |
| |
| |
Capital stock, at $0.01 par value (authorized unlimited shares) | |
Additional paid-in capital | |
Distributable Earnings/(Loss) | |
| |
Net Asset Value Per Share | |
| |
| |
| |
Net Asset Value, Offering and Redemption Price per Outstanding Share | |
*Includes securities on loan of | |
| |
See Notes to Financial Statements.
| Value Line Small Cap
Opportunities Fund, Inc. | Value Line Mid Cap
Focused
Fund, Inc. | Value Line Select
Growth
Fund, Inc. |
| Period Ended
December 31,
2022* | | Year Ended
December 31,
2022 | Year Ended
December 31,
2022 |
| | | | |
Dividends (net of foreign withholding tax of $0, $0, $12,324 and $9,386, respectively) | | | | |
| | | | |
Securities lending income (Net) | | | | |
| | | | |
| | | | |
| | | | |
Service and distribution plan fees | | | | |
| | | | |
| | | | |
Custody and accounting fees | | | | |
Registration and filing fees | | | | |
| | | | |
Directors’ fees and expenses | | | | |
Printing and postage fees | | | | |
| | | | |
Compliance and tax service fees | | | | |
| | | | |
| | | | |
| | | | |
Total Expenses Before Fees Waived (See Note 5) | | | | |
Less: Advisory Fees Waived | | | | |
| | | | |
Net Investment Income/(Loss) | | | | |
Net Realized and Unrealized Gain/(Loss) on Investments and Foreign Exchange Transactions: | | | | |
Net Realized Gain/(Loss) From: | | | | |
Investments in securities | | | | |
Foreign currency transactions | | | | |
| | | | |
Change in Net Unrealized Appreciation/(Depreciation) of: | | | | |
Investments in securities | | | | |
Net Realized Gain/(Loss) and Change in Net Unrealized Appreciation/(Depreciation) on Investments and Foreign Exchange Transactions | | | | |
Net Increase/(Decrease) in Net Assets from Operations | | | | |
| For the nine month period ended December 31, 2022. See Note 6 of Notes to Financial Statements. |
See Notes to Financial Statements.
Statements of Operations (continued)
| Value Line Larger
Companies Focused
Fund, Inc. | Value Line Asset
Allocation Fund, Inc. | Value Line Capital
Appreciation
Fund, Inc. |
| Year Ended
December 31,
2022 | Period Ended
December 31,
2022* | | Year Ended
December 31,
2022 |
| | | | |
Dividends (net of foreign withholding tax of $0, $0, $14,874 and $15,844, respectively) | | | | |
| | | | |
Securities lending income (Net) | | | | |
| | | | |
| | | | |
| | | | |
Service and distribution plan fees | | | | |
| | | | |
| | | | |
Custody and accounting fees | | | | |
Directors’ fees and expenses | | | | |
Registration and filing fees | | | | |
| | | | |
| | | | |
Compliance and tax service fees | | | | |
| | | | |
Printing and postage fees | | | | |
| | | | |
| | | | |
Total Expenses Before Fees Waived (See Note 5) | | | | |
Less: Advisory Fees Waived | | | | |
| | | | |
Net Investment Income/(Loss) | | | | |
Net Realized and Unrealized Gain/(Loss) on Investments and Foreign Exchange Transactions: | | | | |
Net Realized Gain/(Loss) From: | | | | |
Investments in securities | | | | |
Foreign currency transactions | | | | |
| | | | |
Change in Net Unrealized Appreciation/(Depreciation) of: | | | | |
Investments in securities | | | | |
Net Realized Gain/(Loss) and Change in Net Unrealized Appreciation/(Depreciation) on Investments and Foreign Exchange Transactions | | | | |
Net Increase/(Decrease) in Net Assets from Operations | | | | |
| For the nine month period ended December 31, 2022. See Note 6 of Notes to Financial Statements. |
See Notes to Financial Statements.
Statements of Operations (continued)
| |
| Year Ended
December 31,
2022 |
| |
| |
| |
Securities lending income (Net) | |
| |
| |
| |
Service and distribution plan fees | |
Custody and accounting fees | |
| |
| |
| |
Registration and filing fees | |
Compliance and tax service fees | |
Directors’ fees and expenses | |
| |
| |
| |
Total Expenses Before Fees Waived (See Note 5) | |
Less: Advisory Fees Waived | |
Less: Service and Distribution Plan Fees Waived | |
| |
Net Investment Income/(Loss) | |
Net Realized and Unrealized Gain/(Loss) on Investments: | |
Net Realized Gain/(Loss) From: | |
Investments in securities | |
Change in Net Unrealized Appreciation/(Depreciation) of: | |
Investments in securities | |
Net Realized Gain/(Loss) and Change in Net Unrealized Appreciation/(Depreciation) on Investments | |
Net Increase/(Decrease) in Net Assets from Operations | |
See Notes to Financial Statements.
Statements of Changes in Net Assets
| Value Line Small Cap Opportunities Fund, Inc. |
| Period Ended
December 31, 2022* | | |
| | | |
Net investment income/(loss) | | | |
Net realized gain/(loss) on investments and foreign currency | | | |
Change in net unrealized appreciation/(depreciation) on investments | | | |
Net increase/(decrease) in net assets from operations | | | |
Distributions to Shareholders from: | | | |
| | | |
| | | |
| | | |
| | | |
Proceeds from sale of shares | | | |
| | | |
| | | |
Proceeds from reinvestment of distributions to shareholders | | | |
| | | |
| | | |
| | | |
| | | |
| | | |
Net increase/(decrease) in net assets from capital share transactions | | | |
Total increase/(decrease) in net assets | | | |
| | | |
| | | |
| | | |
Capital Share Transactions: | | | |
| | | |
| | | |
| | | |
Shares issued to shareholders in reinvestment of distributions | | | |
| | | |
| | | |
| | | |
| | | |
| | | |
| For the nine month period ended December 31, 2022. See Note 6 of Notes to Financial Statements. |
See Notes to Financial Statements.
Statements of Changes in Net Assets (continued)
| Value Line Mid Cap
Focused Fund, Inc. | Value Line Select
Growth Fund, Inc. |
| Year Ended
December 31, 2022 | Year Ended
December 31, 2021 | Year Ended
December 31, 2022 | Year Ended
December 31, 2021 |
| | | | |
Net investment income/(loss) | | | | |
Net realized gain/(loss) on investments and foreign currency | | | | |
Change in net unrealized appreciation/(depreciation) on investments | | | | |
Net increase/(decrease) in net assets from operations | | | | |
Distributions to Shareholders from: | | | | |
| | | | |
| | | | |
| | | | |
| | | | |
Proceeds from sale of shares | | | | |
| | | | |
| | | | |
Proceeds from reinvestment of distributions to shareholders | | | | |
| | | | |
| | | | |
| | | | |
| | | | |
| | | | |
Net increase/(decrease) in net assets from capital share transactions | | | | |
Total increase/(decrease) in net assets | | | | |
| | | | |
| | | | |
| | | | |
Capital Share Transactions: | | | | |
| | | | |
| | | | |
| | | | |
Shares issued to shareholders in reinvestment of distributions | | | | |
| | | | |
| | | | |
| | | | |
| | | | |
| | | | |
See Notes to Financial Statements.
Statements of Changes in Net Assets (continued)
| Value Line Larger Companies
Focused Fund, Inc. |
| Year Ended
December 31, 2022 | Year Ended
December 31, 2021 |
| | |
Net investment income/(loss) | | |
Net realized gain/(loss) on investments | | |
Change in net unrealized appreciation/(depreciation) on investments | | |
Net increase/(decrease) in net assets from operations | | |
Distributions to Shareholders from: | | |
| | |
| | |
| | |
| | |
Proceeds from sale of shares | | |
| | |
| | |
Proceeds from reinvestment of distributions to shareholders | | |
| | |
| | |
| | |
| | |
| | |
Net increase/(decrease) in net assets from capital share transactions | | |
Total decrease in net assets | | |
| | |
| | |
| | |
Capital Share Transactions: | | |
| | |
| | |
| | |
Shares issued to shareholders in reinvestment of distributions | | |
| | |
| | |
| | |
| | |
| | |
See Notes to Financial Statements.
Statements of Changes in Net Assets (continued)
| Value Line Asset Allocation Fund, Inc. |
| Period Ended
December 31, 2022* | | |
| | | |
Net investment income/(loss) | | | |
Net realized gain/(loss) on investments and foreign currency | | | |
Change in net unrealized appreciation/(depreciation) on investments | | | |
Net increase/(decrease) in net assets from operations | | | |
Distributions to Shareholders from: | | | |
| | | |
| | | |
| | | |
| | | |
Proceeds from sale of shares | | | |
| | | |
| | | |
Proceeds from reinvestment of distributions to shareholders | | | |
| | | |
| | | |
| | | |
| | | |
| | | |
Net increase/(decrease) in net assets from capital share transactions | | | |
Total increase/(decrease) in net assets | | | |
| | | |
| | | |
| | | |
Capital Share Transactions: | | | |
| | | |
| | | |
| | | |
Shares issued to shareholders in reinvestment of distributions | | | |
| | | |
| | | |
| | | |
| | | |
| | | |
| For the nine month period ended December 31, 2022. See Note 6 of Notes to Financial Statements. |
See Notes to Financial Statements.
Statements of Changes in Net Assets (continued)
| Value Line Capital
Appreciation Fund, Inc. |
| Year Ended
December 31, 2022 | Year Ended
December 31, 2021 |
| | |
Net investment income/(loss) | | |
Net realized gain/(loss) on investments | | |
Change in net unrealized appreciation/(depreciation) on investments | | |
Net increase/(decrease) in net assets from operations | | |
Distributions to Shareholders from: | | |
| | |
| | |
| | |
| | |
Proceeds from sale of shares | | |
| | |
| | |
Proceeds from reinvestment of distributions to shareholders | | |
| | |
| | |
| | |
| | |
| | |
Net increase/(decrease) in net assets from capital share transactions | | |
Total increase/(decrease) in net assets | | |
| | |
| | |
| | |
Capital Share Transactions: | | |
| | |
| | |
| | |
Shares issued to shareholders in reinvestment of distributions | | |
| | |
| | |
| | |
| | |
| | |
See Notes to Financial Statements.
Statements of Changes in Net Assets (continued)
| |
| Year Ended
December 31, 2022 | Year Ended
December 31, 2021 |
| | |
Net investment income/(loss) | | |
Net realized gain/(loss) on investments | | |
Change in net unrealized appreciation/(depreciation) on investments | | |
Net increase/(decrease) in net assets from operations | | |
Distributions to Shareholders from: | | |
| | |
Share Transactions (Investor Class): | | |
Proceeds from sale of shares | | |
Proceeds from reinvestment of distributions to shareholders | | |
| | |
Net increase/(decrease) in net assets from capital share transactions | | |
Total decrease in net assets | | |
| | |
| | |
| | |
Capital Share Transactions (Investor Class): | | |
| | |
Shares issued to shareholders in reinvestment of dividends | | |
| | |
See Notes to Financial Statements.
Value Line Small Cap Opportunities Fund, Inc.
Financial Highlights
Selected data for a share of capital stock outstanding throughout each year:
| Value Line Small Cap Opportunities Fund, Inc.
Investor Class |
| | |
| | | | | | |
| | | | | | |
Net asset value, beginning of year | | | | | | |
Income/(loss) from investment operations: | | | | | |
Net investment income/(loss) | | | | | | |
Net gains/(losses) on securities (both realized and unrealized) | | | | | | |
Total from investment operations | | | | | | |
| | | | | | |
Distributions from net realized gains | | | | | | |
| | | | | | |
Net asset value, end of year | | | | | | |
| | | | | | |
Ratios/Supplemental Data: | | | | | | |
Net assets, end of year (in thousands) | | | | | | |
Ratio of expenses to average net assets | | | | | | |
Ratio of net investment income/(loss) to average net assets | | | | | | |
| | | | | | |
| Value Line Small Cap Opportunities Fund, Inc.
Institutional Class |
| | |
| | | | | | |
| | | | | | |
Net asset value, beginning of year | | | | | | |
Income/(loss) from investment operations: | | | | | |
Net investment income/(loss) | | | | | | |
Net gains/(losses) on securities (both realized and unrealized) | | | | | | |
Total from investment operations | | | | | | |
| | | | | | |
Distributions from net realized gains | | | | | | |
| | | | | | |
Net asset value, end of year | | | | | | |
| | | | | | |
Ratios/Supplemental Data: | | | | | | |
Net assets, end of year (in thousands) | | | | | | |
Ratio of gross expenses to average net assets | | | | | | |
Ratio of net expenses to average net assets | | | | | | |
Ratio of net investment income/(loss) to average net assets | | | | | | |
| | | | | | |
| For the nine month period ended December 31, 2022. See Note 6 of Notes to Financial Statements. |
| Per share amounts are calculated based on average shares outstanding during the year. |
| |
| |
| Amount is less than $0.01 per share or 0.01%. |
See Notes to Financial Statements.
Value Line Mid Cap Focused Fund, Inc.
Financial Highlights
Selected data for a share of capital stock outstanding throughout each year:
| Value Line Mid Cap Focused Fund, Inc.
Investor Class |
| |
| | | | | |
| | | | | |
Net asset value, beginning of year | | | | | |
Income/(loss) from investment operations: | | | | |
Net investment income/(loss) | | | | | |
Net gains/(losses) on securities (both realized and unrealized) | | | | | |
Total from investment operations | | | | | |
| | | | | |
Dividends from net investment income | | | | | |
Distributions from net realized gains | | | | | |
| | | | | |
Net asset value, end of year | | | | | |
| | | | | |
Ratios/Supplemental Data: | | | | | |
Net assets, end of year (in thousands) | | | | | |
Ratio of expenses to average net assets | | | | | |
Ratio of net investment income/(loss) to average net assets | | | | | |
| | | | | |
| Value Line Mid Cap Focused Fund, Inc.
Institutional Class |
| |
| | | | | |
| | | | | |
Net asset value, beginning of year | | | | | |
Income/(loss) from investment operations: | | | | |
Net investment income/(loss) | | | | | |
Net gains/(losses) on securities (both realized and unrealized) | | | | | |
Total from investment operations | | | | | |
| | | | | |
Dividends from net investment income | | | | | |
Distributions from net realized gains | | | | | |
| | | | | |
Net asset value, end of year | | | | | |
| | | | | |
Ratios/Supplemental Data: | | | | | |
Net assets, end of year (in thousands) | | | | | |
Ratio of gross expenses to average net assets | | | | | |
Ratio of net expenses to average net assets | | | | | |
Ratio of net investment income/(loss) to average net assets | | | | | |
| | | | | |
| Per share amounts are calculated based on average shares outstanding during the year. |
| Includes income resulting from special dividends. For the year ended December 31, 2021, without these dividends, the per share value for the Investor Class and Institutional Class would have been $(0.18) and $(0.09), respectively, and the ratio for the Investor Class and Institutional Class would have been (0.59)% and (0.30)%, respectively. |
| Includes income resulting from special dividends. For the year ended December 31, 2019, without these dividends, the per share value for the Investor Class and Institutional Class would have been $(0.08) and $0.05, respectively, and the ratio for the Investor Class and Institutional Class would have been (0.33)% and 0.22%, respectively. |
| Amount is less than $0.01 per share. |
| Amount is less than 0.50%. |
See Notes to Financial Statements.
Value Line Select Growth Fund, Inc.
Financial Highlights
Selected data for a share of capital stock outstanding throughout each year:
| Value Line Select Growth Fund, Inc.
Investor Class |
| |
| | | | | |
| | | | | |
Net asset value, beginning of year | | | | | |
Income/(loss) from investment operations: | | | | |
Net investment income/(loss) | | | | | |
Net gains/(losses) on securities (both realized and unrealized) | | | | | |
Total from investment operations | | | | | |
| | | | | |
Distributions from net realized gains | | | | | |
| | | | | |
Net asset value, end of year | | | | | |
| | | | | |
Ratios/Supplemental Data: | | | | | |
Net assets, end of year (in thousands) | | | | | |
Ratio of expenses to average net assets | | | | | |
Ratio of net investment income/(loss) to average net assets | | | | | |
| | | | | |
| Value Line Select Growth Fund, Inc.
Institutional Class |
| | |
| | | |
| | | |
Net asset value, beginning of year | | | |
Income/(loss) from investment operations: | | |
Net investment income/(loss)(1) | | | |
Net gains/(losses) on securities (both realized and unrealized) | | | |
Total from investment operations | | | |
| | | |
Distributions from net realized gains | | | |
| | | |
Net asset value, end of year | | | |
| | | |
Ratios/Supplemental Data: | | | |
Net assets, end of year (in thousands) | | | |
Ratio of gross expenses to average net assets | | | |
Ratio of net expenses to average net assets | | | |
Ratio of net investment income/(loss) to average net assets | | | |
| | | |
| Per share amounts are calculated based on average shares outstanding during the year. |
| Commenced operations on May 1, 2020. |
| |
| |
See Notes to Financial Statements.
Value Line Larger Companies Focused Fund, Inc.
Financial Highlights
Selected data for a share of capital stock outstanding throughout each year:
| Value Line Larger Companies Focused Fund, Inc.
Investor Class |
| |
| | | | | |
| | | | | |
Net asset value, beginning of year | | | | | |
Income/(loss) from investment operations: | | | | |
Net investment income/(loss) | | | | | |
Net gains/(losses) on securities (both realized and unrealized) | | | | | |
Total from investment operations | | | | | |
| | | | | |
Distributions from net realized gains | | | | | |
| | | | | |
Net asset value, end of year | | | | | |
| | | | | |
Ratios/Supplemental Data: | | | | | |
Net assets, end of year (in thousands) | | | | | |
Ratio of gross expenses to average net assets | | | | | |
Ratio of net expenses to average net assets | | | | | |
Ratio of net investment income/(loss) to average net assets | | | | | |
| | | | | |
| Value Line Larger Companies Focused Fund, Inc.
Institutional Class |
| |
| | | | | |
| | | | | |
Net asset value, beginning of year | | | | | |
Income/(loss) from investment operations: | | | | |
Net investment income/(loss) | | | | | |
Net gains/(losses) on securities (both realized and unrealized) | | | | | |
Total from investment operations | | | | | |
| | | | | |
Distributions from net realized gains | | | | | |
| | | | | |
Net asset value, end of year | | | | | |
| | | | | |
Ratios/Supplemental Data: | | | | | |
Net assets, end of year (in thousands) | | | | | |
Ratio of gross expenses to average net assets | | | | | |
Ratio of net expenses to average net assets | | | | | |
Ratio of net investment income/(loss) to average net assets | | | | | |
| | | | | |
| Per share amounts are calculated based on average shares outstanding during the year. |
See Notes to Financial Statements.
Value Line Asset Allocation Fund, Inc.
Financial Highlights
Selected data for a share of capital stock outstanding throughout each year:
| Value Line Asset Allocation Fund, Inc.
Investor Class |
| | |
| | | | | | |
| | | | | | |
Net asset value, beginning of year | | | | | | |
Income/(loss) from investment operations: | | | | | |
Net investment income/(loss) | | | | | | |
Net gains/(losses) on securities (both realized and unrealized) | | | | | | |
Total from investment operations | | | | | | |
| | | | | | |
Dividends from net investment income | | | | | | |
Distributions from net realized gains | | | | | | |
| | | | | | |
Net asset value, end of year | | | | | | |
| | | | | | |
Ratios/Supplemental Data: | | | | | | |
Net assets, end of year (in thousands) | | | | | | |
Ratio of gross expenses to average net assets | | | | | | |
Ratio of net investment income/(loss) to average net assets | | | | | | |
| | | | | | |
| Value Line Asset Allocation Fund, Inc.
Institutional Class |
| | |
| | | | | | |
| | | | | | |
Net asset value, beginning of year | | | | | | |
Income/(loss) from investment operations: | | | | | |
Net investment income/(loss) | | | | | | |
Net gains/(losses) on securities (both realized and unrealized) | | | | | | |
Total from investment operations | | | | | | |
| | | | | | |
Dividends from net investment income | | | | | | |
Distributions from net realized gains | | | | | | |
| | | | | | |
Net asset value, end of year | | | | | | |
| | | | | | |
Ratios/Supplemental Data: | | | | | | |
Net assets, end of year (in thousands) | | | | | | |
Ratio of gross expenses to average net assets | | | | | | |
Ratio of net expenses to average net assets | | | | | | |
Ratio of net investment income/(loss) to average net assets | | | | | | |
| | | | | | |
| For the nine month period ended December 31, 2022. See Note 6 of Notes to Financial Statements. |
| Per share amounts are calculated based on average shares outstanding during the year. |
| Amount is less than $0.01 per share or 0.01%. |
| |
| |
See Notes to Financial Statements.
Value Line Capital Appreciation Fund, Inc.
Financial Highlights
Selected data for a share of capital stock outstanding throughout each year:
| Value Line Capital Appreciation Fund, Inc.
Investor Class |
| |
| | | | | |
| | | | | |
Net asset value, beginning of year | | | | | |
Income/(loss) from investment operations: | | | | |
Net investment income/(loss) | | | | | |
Net gains/(losses) on securities (both realized and unrealized) | | | | | |
Total from investment operations | | | | | |
| | | | | |
Dividends from net investment income | | | | | |
Distributions from net realized gains | | | | | |
| | | | | |
Net asset value, end of year | | | | | |
| | | | | |
Ratios/Supplemental Data: | | | | | |
Net assets, end of year (in thousands) | | | | | |
Ratio of expenses to average net assets | | | | | |
Ratio of net investment income/(loss) to average net assets | | | | | |
| | | | | |
| Value Line Capital Appreciation Fund, Inc.
Institutional Class |
| |
| | | | | |
| | | | | |
Net asset value, beginning of year | | | | | |
Income/(loss) from investment operations: | | | | |
Net investment income/(loss) | | | | | |
Net gains/(losses) on securities (both realized and unrealized) | | | | | |
Total from investment operations | | | | | |
| | | | | |
Dividends from net investment income | | | | | |
Distributions from net realized gains | | | | | |
| | | | | |
Net asset value, end of year | | | | | |
| | | | | |
Ratios/Supplemental Data: | | | | | |
Net assets, end of year (in thousands) | | | | | |
Ratio of gross expenses to average net assets | | | | | |
Ratio of net expenses to average net assets | | | | | |
Ratio of net investment income/(loss) to average net assets | | | | | |
| | | | | |
| Per share amounts are calculated based on average shares outstanding during the year. |
| Amount is less than $0.01 per share. |
| Amount includes a non-recurring settlement paid by the Fund related to Legal Proceedings. The settlement payment impacted the realized (loss) per share by less than $0.01 per share for Investor and Institutional class. Total return was not impacted. |
See Notes to Financial Statements.
Value Line Core Bond Fund
Financial Highlights
Selected data for a share of capital stock outstanding throughout each year:
| Value Line Core Bond Fund
Investor Class |
| |
| | | | | |
Net asset value, beginning of year | | | | | |
Income/(loss) from investment operations: | | | | | |
Net investment income/(loss) | | | | | |
Net gains/(losses) on securities (both realized and unrealized) | | | | | |
Total from investment operations | | | | | |
| | | | | |
Dividends from net investment income | | | | | |
Distributions from net realized gains | | | | | |
| | | | | |
Net asset value, end of year | | | | | |
| | | | | |
Ratios/Supplemental Data: | | | | | |
Net assets, end of year (in thousands) | | | | | |
Ratio of gross expenses to average net assets | | | | | |
Ratio of net expenses to average net assets | | | | | |
Ratio of net investment income/(loss) to average net assets | | | | | |
| | | | | |
| Per share amounts are calculated based on average shares outstanding during the year. |
See Notes to Financial Statements.
Notes to Financial Statements
1. Significant Accounting Policies
Value Line Small Cap Opportunities Fund, Inc., Value Line Mid Cap Focused Fund, Inc., Value Line Select Growth Fund, Inc., Value Line Larger Companies Focused Fund, Inc., Value Line Asset Allocation Fund, Inc., Value Line Capital Appreciation Fund, Inc. and Value Line Core Bond Fund (individually a “Fund” and collectively, the “Funds”) are each registered under the Investment Company Act of 1940, as amended (the “1940 Act”), as diversified, open-end management investment companies. The Funds each (except for Value Line Core Bond Fund) offer two classes of shares: Investor Class shares and Institutional Class shares. Value Line Core Bond Fund offers only Investor Class shares. Investor Class shares are available to any investor who meets the Fund’s minimum purchase requirement. Institutional Class shares are designed for investors who meet certain administrative, service and account size criteria. The Value Line Family of Funds (the “Value Line Funds”) is a family of mutual funds that consists of a variety of equity, fixed income, and hybrid funds. The investment objective of each Fund is listed below.
| |
Value Line Small Cap Opportunities Fund, Inc. | The Fund seeks long-term capital growth. |
Value Line Mid Cap Focused Fund, Inc. | The Fund seeks long-term capital growth. |
Value Line Select Growth Fund, Inc. | The Fund seeks long-term capital growth. |
Value Line Larger Companies Focused Fund, Inc. | The Fund seeks long-term capital growth. |
Value Line Asset Allocation Fund, Inc. | The Fund seeks high total investment return. |
Value Line Capital Appreciation Fund, Inc. | The Fund seeks capital appreciation and income. |
Value Line Core Bond Fund | The Fund seeks to maximize current income and secondarily capital appreciation. |
Each Fund follows the investment company accounting and reporting guidance of the Financial Accounting Standards Board (“FASB”) Accounting Standards Codification Topic 946 Financial Services — Investment Companies.
The preparation of financial statements in conformity with generally accepted accounting principles requires management to make estimates and assumptions that affect the reported amounts of assets and liabilities and disclosure of contingent assets and liabilities at the date of the financial statements and the reported amounts of revenues and expenses during the reporting period. Actual results may differ from those estimates. The following is a summary of significant accounting policies consistently followed by the Funds in the preparation of their financial statements.
(A) Security Valuation: In accordance with Rule 2a-5 under the Investment Company Act of 1940, as amended, the Board of Directors (the "Board") has designated EULAV Asset Management (the "Adviser"), as its valuation designee (the "Valuation Designee"). As Valuation Designee, the Adviser, subject to the oversight of the Board, is responsible for making fair valuation determinations in accordance with procedures (the "Pricing Procedures") approved by the Board. The Adviser's day-to-day responsibilities as Valuation Designee are performed by a pricing committee established by the Adviser (the "Committee").
Securities listed on a securities exchange are valued at the closing sales prices on the date as of which the net asset value (“NAV”) is being determined. Securities traded on the National Association of Securities Dealers Automated Quotations (“NASDAQ”) Stock Market are valued at the NASDAQ Official Closing Price. In the absence of closing sales prices for such securities and for securities traded in the over-the-counter market, the security is valued at the midpoint between the latest available and representative asked and bid prices. Short-term instruments with maturities of 60 days or less at the date of purchase are valued at amortized cost, which approximates fair value. Short-term instruments with maturities greater than 60 days at the date of purchase are valued at the midpoint between the latest available and representative asked and bid prices, and commencing 60 days prior to maturity such securities are valued at amortized cost.
Investments in shares of open-end mutual funds, including money market funds, are valued at their daily NAV which is calculated as of the close of regular trading on the New York Stock Exchange (“NYSE”) (usually 4:00 P.M. Eastern Time) on each day on which the NYSE is open for business. NAV per share is determined by dividing the funds' total net assets by the funds' total number of shares outstanding at the time of calculation.
Bonds and other fixed income securities are calculated on the valuation date by reference to valuations obtained from an independent pricing service that determines valuations for normal institutional-size trading units of debt securities, without exclusive reliance upon quoted prices. This service takes into account appropriate factors such as institutional-size trading in similar groups of securities, yield, quality, coupon rate, maturity, type of issue, trading characteristics and other market data in determining valuations. Bonds and fixed income securities are valued at the evaluated bid on the date as of which the NAV is being determined.
The Committee monitors the continued appropriateness of methods applied and determines if adjustments should be made in light of market changes, events affecting the issuer, or other factors. If the Committee determines that a valuation method may no longer be appropriate, another valuation method may be selected. The Board shall review the appropriateness of the valuation methods and these methods may be amended or supplemented from time to time by the Committee. In addition, the Funds may use the fair value of a security when the closing market price on the primary exchange where the security is traded no longer reflects the value of a security due to factors affecting one or more relevant securities markets or the specific issuer.
Notes to Financial Statements (continued)
(B) Fair Value Measurements: The Funds follow fair valuation accounting standards which establish a definition of fair value and set out a hierarchy for measuring fair value. These standards require additional disclosures about the various inputs and valuation techniques used to develop the measurements of fair value and a discussion of changes in valuation techniques and related inputs during the period. These inputs are summarized in the three broad levels listed below:
•
Level 1 — Inputs that reflect unadjusted quoted prices in active markets for identical assets or liabilities that the Fund has the ability to access at the measurement date;
•
Level 2 — Inputs other than quoted prices that are observable for the asset or liability either directly or indirectly, including inputs in markets that are not considered to be active;
•
Level 3 — Inputs that are unobservable.
Transfers between investment levels may occur as the markets fluctuate and/or the availability of data used in an investment’s valuation changes. The inputs or methodologies used for valuing securities are not necessarily an indication of the risk associated with investing in those securities.
An investment asset's or liability's level within the fair value hierarchy is based on the lowest level input, individually or in aggregate, that is significant to fair value measurement. The objective of fair value measurement remains the same even when there is a significant decrease in the volume and level of activity for an asset or liability and regardless of the valuation techniques used.
(C) Federal Income Taxes: It is the policy of each Fund to continue to qualify as a regulated investment company by complying with the provisions available to regulated investment companies, as defined in applicable sections of the Internal Revenue Code, and to distribute all of its investment income and capital gains to its shareholders. Therefore, no provision for federal income tax is required.
As of December 31, 2022, and for all open tax years, management has analyzed the Funds’ tax positions taken on federal and state income tax returns, and has concluded that no provision for federal or state income tax is required in the Funds' financial statements. The Funds' federal and state income tax returns for tax years for which the applicable statutes of limitations have not expired are subject to examination by the Internal Revenue Service and the state departments of revenue. The Funds are not aware of any tax positions for which it is reasonably possible that the total amounts of unrecognized tax benefits will significantly change in the next twelve months.
(D) Security Transactions and Income: Securities transactions are recorded on a trade date basis. Realized gains and losses from securities transactions are calculated using the identified cost method. Interest income on investments, adjusted for amortization of discount and premium, if applicable, is earned from settlement date and recognized on the accrual basis. Dividend income is recorded on the ex-dividend date.
The Value Line Asset Allocation Fund, Inc., Value Line Capital Appreciation Fund, Inc. and Value Line Core Bond Fund may purchase mortgage pass-through securities on a to-be-announced (“TBA”) basis, with payment and delivery scheduled for a future date. These Funds may enter into a TBA agreement, sell the obligation to purchase the pools stipulated in the TBA agreement prior to the stipulated settlement date and enter into a new TBA agreement for future delivery of pools of mortgage pass-through securities (a “TBA roll”). A TBA roll is treated by the Fund as a purchase transaction and a sale transaction in which the Fund realizes a gain or loss. The Fund’s use of TBA rolls may cause the Fund to experience higher portfolio turnover and higher transaction costs. The Fund could be exposed to possible risk if there is an adverse market reaction, expenses or delays in connection with TBA transactions, or if the counterparty fails to complete the transaction.
The Value Line Core Bond Fund may invest in Treasury Inflation-Protected Securities (“TIPS”). The principal value and interest payout of TIPS are periodically adjusted according to the rate of inflation based on the Consumer Price Index. The adjustments for principal and income due to inflation are reflected in interest income in the Fund's Statement of Operations.
(E) Fund Distributions: Income dividends and capital gains distributions are automatically reinvested in additional shares of each Fund unless the shareholder has requested otherwise. Income earned by the Fund on weekends, holidays and other days on which the Fund is closed for business is declared as a dividend on the next day on which the Fund is open for business. The Funds (except for Value Line Core Bond Fund) distribute all of their net investment income annually. Value Line Core Bond Fund declares and pays dividends from its net investment income monthly. Net realized capital gains, if any, are distributed to shareholders annually or more frequently if necessary, to comply with the Internal Revenue Code.
(F) Class Allocations: All income earned and expenses incurred by the Funds are borne on a pro-rata basis by each outstanding class of shares, based on the proportionate interest in the Fund represented by the shares of such class, except for class specific expenses which are allocated to the respective class. Expenses of the Fund are charged proportionately to each Fund or based on other appropriate methods. Realized and unrealized gains and losses are allocated between the share classes based on respective net assets.
Class Specific Expenses:
| | | |
Value Line Small Cap Opportunities Fund, Inc.* | | | |
| | | |
| | | |
Registration and filing fees | | | |
| | | |
| For the period 4/1/22-12/31/22. |
| | | |
Value Line Mid Cap Focused Fund, Inc. | | | |
| | | |
| | | |
Registration and filing fees | | | |
| | | |
| | | |
Value Line Select Growth Fund, Inc. | | | |
| | | |
| | | |
Registration and filing fees | | | |
| | | |
| | | |
Value Line Larger Companies Focused Fund, Inc. | | | |
| | | |
| | | |
Registration and filing fees | | | |
| | | |
| | | |
Value Line Asset Allocation Fund, Inc.* | | | |
| | | |
| | | |
Registration and filing fees | | | |
| | | |
| For the period 4/1/22-12/31/22. |
| | | |
Value Line Capital Appreciation Fund, Inc. | | | |
| | | |
| | | |
Notes to Financial Statements (continued)
| | | |
Registration and filing fees | | | |
| | | |
(G) Foreign Currency Translation: The books and records of the Funds are maintained in U.S. dollars. Assets and liabilities which are denominated in foreign currencies are translated to U.S. dollars at the prevailing rates of exchange at the valuation date. The Funds do not isolate changes in the value of investments caused by foreign exchange rate differences from the changes due to other circumstances.
Income and expenses are translated to U.S. dollars based upon the rates of exchange on the respective dates of such transactions.
Net realized foreign exchange gains or losses arise from currency fluctuations realized between the trade and settlement dates on securities transactions, the differences between the U.S. dollar amounts of dividends, interest, and foreign withholding taxes recorded by the Funds, and the U.S. dollar equivalent of the amounts actually received or paid. Net unrealized foreign exchange gains and losses arise from changes in the value of assets and liabilities, other than investments, at the end of the fiscal period, resulting from changes in the exchange rates. The effect of the change in foreign exchange rates on the value of investments is included in realized gain/(loss) on investments and change in net unrealized appreciation/(depreciation) on investments.
(H) Representations and Indemnifications: In the normal course of business, the Funds enter into contracts that contain a variety of representations and warranties which provide general indemnifications. The Funds’ maximum exposure under these arrangements is unknown, as this would involve future claims that may be made against the Funds that have not yet occurred. However, based on experience, management expects the risk of loss to be remote.
(I) Accounting for Real Estate Investment Trusts: The Funds may own shares of Real Estate Investment Trusts (“REITs”) which report information on the source of their distributions annually. Distributions received from REITs during the year which represent a return of capital are recorded as a reduction of cost and distributions which represent a capital gain dividend are recorded as a realized long-term capital gain on investments.
(J) Foreign Taxes: The Funds may be subject to foreign taxes on income, gains on investments, or currency repatriation, a portion of which may be recoverable. The Funds will accrue such taxes and recoveries as applicable, based upon its current interpretation of tax rules and regulations that exist in the markets in which it invests.
(K) Securities Lending: Under an agreement with State Street Bank & Trust Company (“State Street”), the Funds can lend their securities to brokers, dealers and other financial institutions approved by the Board. The Funds or the borrower may terminate the loan at any time. By lending their investment securities, the Funds attempt to increase their net investment income through receipt of interest on the loan. Any gain or loss in the market price of the securities loaned that might occur and any interest or dividends declared during the term of the loan would accrue to the account of the Funds. Risks of delay in recovery of the securities or even loss of rights in the collateral may occur should the borrower of the securities fail financially. Generally, in the event of a counter-party default, the Funds have the right to use the collateral to offset the losses incurred. The lending fees received and the Funds’ portion of the interest income earned on the cash collateral are included in “Securities lending income (Net)” in the Statements of Operations.
Upon entering into a securities lending transaction, the Funds receive cash or other securities as collateral in an amount equal to or exceeding 102% of the current market value of the loaned securities. Any cash received as collateral is invested by State Street, acting in its capacity as securities lending agent (the “Agent”), in the Value Line Funds collateral account, which is subsequently invested into joint repurchase agreements and/or State Street Navigator Securities Lending Government Money Market Portfolio. When the Funds invest the cash collateral in the State Street Navigator Securities Lending Government Money Market Portfolio, a portion of the dividends received on the collateral is rebated to the borrower of the securities and the remainder is split between the Agent and the Funds. Investments made with the cash collateral are disclosed in the Schedules of Investments.
As of December 31, 2022, certain Funds loaned securities which were collateralized by cash and other securities. The value of the securities on loan and the value of the related collateral were as follows:
| Value of Securities
Loaned | |
Value Line Small Cap Opportunities Fund, Inc. | | |
Value Line Mid Cap Focused Fund, Inc. | | |
Value Line Larger Companies Focused Fund, Inc. | | |
Value Line Asset Allocation Fund, Inc. | | |
| Value of Securities Loaned | |
Value Line Capital Appreciation Fund, Inc. | | |
Value Line Core Bond Fund | | |
| Value Line Small Cap Opportunities Fund, Inc., Value Line Mid Cap Focused Fund, Inc., Value Line Larger Companies Focused Fund, Inc., Value Line Asset Allocation Fund, Inc., Value Line Capital Appreciation Fund, Inc. and Value Line Core Bond Fund. received cash collateral of $2,761,361, 1,677,909, $958,500, $2,368,128, $2,850,557 and $658,837, respectively, which was subsequently invested in the State Street Navigator Securities Lending Government Money Market Portfolio as reported in the Schedule of Investments. In addition, Value Line Small Cap Opportunities Fund, Inc. received non cash-collateral of $1,818,080 in the form of U.S. Government obligations, ranging from 0.13% - 1.88%, maturing 6/30/23 — 11/20/51, Value Line Mid Cap Focused Fund, Inc. received non cash-collateral of $2,484,531 in the form of U.S. Government obligations, ranging from 0.13% - 4.38%, maturing 4/15/23— 11/15/51, Value Line Larger Companies Focused Fund, Inc. received non cash-collateral of $1,322,500 in the form of U.S. Government obligations, ranging from 0.13% - 3.75%, maturing 4/30/24— 5/15/52, Value Line Asset Allocation Fund, Inc. received non cash-collateral of $5,508,400 in the form of U.S. Government obligations, ranging from 0.01%-5.00%, maturing 12/15/27 — 8/7/50, Value Line Capital Appreciation Fund, Inc. received non cash-collateral of $3,069,000 in the form of U.S. Government obligations, ranging from 0.01%-6.63%, maturing 1/12/23 — 5/15/52 and Value Line Core Bond Fund received non cash-collateral of $819,720 in the form of U.S. Government obligations, ranging from 0.01%-5.00%, maturing 1/15/27 — 8/7/50. The Funds cannot sell or repledge the non-cash collateral which accordingly is not reflected in the Schedule of Investments. The value of securities loaned is determined at the close of business of the Funds and any additional required collateral is delivered to the Funds on the next business day. |
(L) Other Risks: An outbreak of infectious respiratory illness caused by a novel coronavirus known as COVID-19 was first detected in China in December 2019 and was declared a pandemic by the World Health Organization in March 2020. This coronavirus has resulted in travel restrictions, restrictions on gatherings of people (including closings of, or limitations on, dining and entertainment establishments, as well as schools and universities), closed businesses (or businesses that are restricted in their operations), closed international borders, enhanced health screenings at ports of entry and elsewhere, disruption of and delays in healthcare service preparation and delivery, prolonged quarantines, cancellations, supply chain disruptions, and lower consumer demand, as well as general concern and uncertainty. The impact of COVID-19, and other infectious disease outbreaks that may arise in the future, could adversely affect the economies of many nations or the entire global economy, individual issuers and capital markets in ways that cannot be foreseen. Public health crises caused by the COVID-19 outbreak may exacerbate other pre-existing political, social and economic risks in certain countries or globally. The duration of the COVID-19 outbreak cannot be determined with certainty. The risk of further spreading of COVID-19 has led to significant uncertainty and volatility in the financial markets and disruption to the global economy, the consequences of which are currently unpredictable. Certain of the Funds’ investments are likely to have exposure to businesses that, as a result of COVID-19, experience a slowdown or temporary suspension in business activities. These factors, as well as any restrictive measures instituted in order to prevent or control a pandemic or other public health crisis, such as the one posed by COVID-19, could have a material and adverse effect on the Funds’ investments.
(M) Subsequent Events: Management has evaluated all subsequent transactions and events through the date on which these financial statements were issued and has determined that no additional items require adjustment to or disclosure in the financial statements.
2. Investment Risks
Securities issued by U.S. Government agencies or government-sponsored enterprises may not be guaranteed by the U.S. Treasury. The Government National Mortgage Association (“GNMA” or “Ginnie Mae”), a wholly-owned U.S. Government corporation, is authorized to guarantee, with the full faith and credit of the U.S. Government, the timely payment of principal and interest on securities issued by institutions approved by GNMA and backed by pools of mortgages insured by the Federal Housing Administration or guaranteed by the Department of Veterans Affairs. Government-related guarantors (i.e., not backed by the full faith and credit of the U.S. Government) include the Federal National Mortgage Association (“FNMA” or “Fannie Mae”) and the Federal Home Loan Mortgage Corporation (“FHLMC” or “Freddie Mac”). Pass-through securities issued by FNMA are guaranteed as to timely payment of principal and interest by FNMA, but are not backed by the full faith and credit of the U.S. Government. FHLMC guarantees the timely payment of interest and ultimate collection of principal, but its participation certificates are not backed by the full faith and credit of the U.S. Government.
Notes to Financial Statements (continued)
3. Purchases and Sales of Securities
Purchases and sales of securities, excluding short-term investments, for the year ended December 31, 2022, were as follows:
| Purchases of
Investment
Securities
Excluding
U.S. Government
Securities | Sales of
Investment
Securities
Excluding
U.S. Government
Securities | Purchases of
U.S. Government
Obligations | Sales of U.S.
Government
Obligations |
Value Line Small Cap Opportunities Fund, Inc.* | | | | |
Value Line Mid Cap Focused Fund, Inc. | | | | |
Value Line Select Growth Fund, Inc. | | | | |
Value Line Larger Companies Focused Fund, Inc. | | | | |
Value Line Asset Allocation Fund, Inc.* | | | | |
Value Line Capital Appreciation Fund, Inc. | | | | |
Value Line Core Bond Fund | | | | |
| For the period 4/1/22-12/31/22. |
4. Income Taxes
At December 31, 2022, the federal tax cost and net unrealized appreciation (depreciation) in value of investments held were:
| Cost of
Investments
for Tax
Purposes | Gross Tax
Unrealized
Appreciation | Gross Tax
Unrealized
Depreciation | Net Tax
Unrealized
Appreciation/
(Depreciation)
on Investments |
Value Line Small Cap Opportunities Fund, Inc. | | | | |
Value Line Mid Cap Focused Fund, Inc. | | | | |
Value Line Select Growth Fund, Inc. | | | | |
Value Line Larger Companies Focused Fund, Inc. | | | | |
Value Line Asset Allocation Fund, Inc. | | | | |
Value Line Capital Appreciation Fund, Inc. | | | | |
Value Line Core Bond Fund | | | | |
Net Unrealized appreciation/depreciation differs for financial statements and tax purposes primarily due to wash sales, return of capital on corporations and market premium amortization.
As of December 31, 2022, the components of distributable earnings on a tax basis were as follows:
| Undistributed
Ordinary
Income | Undistributed
Long-Term
Gain | | | Capital Loss
Carryforwards | | Distributable
Earnings (Loss) |
Value Line Small Cap Opportunities Fund, Inc. | | | | | | | |
Value Line Mid Cap Focused Fund, Inc. | | | | | | | |
Value Line Select Growth Fund, Inc. | | | | | | | |
Value Line Larger Companies Focused Fund, Inc. | | | | | | | |
Value Line Asset Allocation Fund, Inc. | | | | | | | |
Value Line Capital Appreciation Fund, Inc. | | | | | | | |
| | | | | | | |
At December 31, 2022, the Value Line Larger Companies Focused Fund, Inc, has net short-term capital loss carryforwards of $4,303,713 and the Value Line Core Bond Fund has net short-term capital loss carryforwards of $248,882 and net long-term capital loss carryforwards of $863,276. All of these can be carried forward indefinitely.
In accordance with federal tax laws applicable to investment companies, all or a portion of losses resulting from capital loss or net specified losses realized between November 1 and the Funds’ fiscal year-end are not recognized for tax purposes until the subsequent year (late-year loss deferrals); however, such losses are recognized for financial reporting purposes in the year realized.
A reclassification has been made on the Statements of Assets and Liabilities to increase/(decrease) total distributable earnings/(loss) and additional paid-in capital for the Funds as follows:
| Total Distributable
Earnings/(Loss) | |
| Undistributed Net
Investment
Income/(Loss) | Accumulated Net
Realized Gains/(Losses) | Additional
Paid-In Capital |
Value Line Small Cap Opportunities Fund, Inc. | | | |
Value Line Mid Cap Focused Fund, Inc. | | | |
Value Line Select Growth Fund, Inc. | | | |
Value Line Larger Companies Focused Fund, Inc. | | | |
Value Line Asset Allocation Fund, Inc. | | | |
Value Line Capital Appreciation Fund, Inc. | | | |
Value Line Core Bond Fund | | | |
These reclassifications were primarily due to net operating losses and paydown losses. Net assets were not affected by these reclassifications.
The tax composition of distributions paid to shareholders during fiscal years ended December 31, 2022 and 2021 were as follows:
| Year Ended December 31, 2022
Distributions Paid from |
| | | |
Value Line Small Cap Opportunities Fund, Inc.* | | | |
Value Line Mid Cap Focused Fund, Inc. | | | |
Value Line Select Growth Fund, Inc. | | | |
Value Line Larger Companies Focused Fund, Inc. | | | |
Value Line Asset Allocation Fund, Inc.* | | | |
Value Line Capital Appreciation Fund, Inc. | | | |
Value Line Core Bond Fund | | | |
| For the period 4/1/22-12/31/22. |
| Year Ended December 31, 2021
Distributions Paid from |
| | | |
Value Line Small Cap Opportunities Fund, Inc.**, *** | | | |
Value Line Mid Cap Focused Fund, Inc. | | | |
Value Line Select Growth Fund, Inc. | | | |
Value Line Larger Companies Focused Fund, Inc. | | | |
Value Line Asset Allocation Fund, Inc.**, *** | | | |
Notes to Financial Statements (continued)
| Year Ended December 31, 2021 Distributions Paid from |
| | | |
Value Line Capital Appreciation Fund, Inc. | | | |
Value Line Core Bond Fund | | | |
| For the fiscal year ended March 31, 2022. |
| For the fiscal year ended March 31, 2021, Value Line Small Cap Opportunities Fund, Inc. had distributions paid from ordinary income and long-term capital gain of $0, and $35,485,282, respectively, and Value Line Asset Allocation Fund, Inc. had distributions paid from ordinary income and long-term capital gain of $4,707,510, and $9,891,201, respectively. |
5. Investment Advisory Fees, Service and Distribution Fees and Transactions With Affiliates
For providing advisory services to the Value Line Small Cap Opportunities Fund, Inc., Value Line Mid Cap Focused Fund, Inc., Value Line Select Growth Fund, Inc., Value Line Larger Companies Focused Fund, Inc., Value Line Asset Allocation Fund, Inc., Value Line Capital Appreciation Fund, Inc. and Value Line Core Bond Fund, and managing each Fund’s investments for the year ended December 31, 2022, the Adviser was paid a fee at an annual rate of 0.74%, 0.64%, 0.73%, 0.73%, 0.62%, 0.65% and 0.35%, respectively, of each Fund’s average daily net assets. The investment advisory agreement between each Fund and the Adviser provides for a combined fee for both advisory services and Administrative Services (as defined in the investment advisory agreement) at an annual rate, based on each Fund’s average daily net assets, equal to 0.75% for Value Line Select Growth Fund, Inc., Value Line Larger Companies Focused Fund, Inc. and Value Line Small Cap Opportunities Fund and 0.70% on the first $100 million of average daily net assets, and 0.65% on the remaining net assets for Value Line Mid Cap Focused Fund, Inc., Value Line Capital Appreciation Fund, Inc. and Value Line Asset Allocation Fund, Inc. and 0.50% for Value Line Core Bond Fund (the “Combined Rate”). The advisory fee component paid by each Fund to the Adviser for each period is calculated by subtracting the amount paid by each Fund for Administrative Services with respect to the same period from the respective Combined Rate. The Adviser provides (or arranges for the provision of) such Administrative Services pursuant to a separate administration agreement with the Funds.
For the Value Line Larger Companies Focused Fund, the Adviser has contractually agreed to waive through June 30, 2023 certain Fund-wide fees and further assume certain Fund-wide expenses to the extent necessary to limit such expenses (excluding brokerage commissions, interest, taxes, and certain non-routine Fund-wide expenses) to 0.90% of the average daily net assets of each class (the “Fund-Level Expense Limitation 1”).
For the Value Line Core Bond Fund, the Adviser and the Distributor have agreed to waive a portion of their advisory and Rule 12b-1 fee and the Adviser has further agreed to reimburse certain expenses of the Fund to the extent necessary to limit the Fund’s total annual operating expenses (other than those attributable to interest, taxes, brokerage and futures commissions, and extraordinary expenses not incurred in the ordinary course of the Fund’s business) to 0.90% of the Fund’s average daily net assets (the “Fund-Level Expense Limitation 2”). The Adviser and the Distributor may subsequently recover from the Value Line Core Bond Fund reimbursed expenses and/or waived fees (within 3 years from the month in which the waiver/reimbursement occurred) to the extent that the Fund’s expense ratio is less than the Expense Limitation. The Fund-Level Expense Limitation 2 can be terminated or modified before June 30, 2023 only with the agreement of the Fund’s Board.
For Value Line Asset Allocation Fund, Inc., the Adviser contractually agreed to waive and not recoup a portion of its annual advisory fee rate by 0.05% with respect to the portion of the Fund’s average daily net assets that exceed $750 million. This contractual waiver creates a breakpoint in the advisory fee. With the approval of the Fund's Board, this agreement was terminated effective August 1, 2022.
The Funds have a Service and Distribution Plan (the “Plan”), adopted pursuant to Rule 12b-1 under the 1940 Act, which compensates EULAV Securities, LLC (the “Distributor”) for advertising, marketing and distributing the Funds’ shares and for servicing the Funds’ shareholders at an annual rate of 0.25% of the Funds’ average daily net assets attributable to Investor Class shares. Institutional Class shares do not pay Rule 12b-1 distribution and service fees, and are not subject to the Plan.
The Funds (except Value Line Core Bond Fund) have a Sub-Transfer Agent Plan (the “sub TA plan”) which compensates financial intermediaries that provide sub-transfer agency and related services to investors that hold their Fund shares of such class in omnibus accounts maintained by the financial intermediaries with the Funds. The sub-transfer agency fee, which the Fund may pay directly to the financial intermediary or indirectly via the Distributor, will not exceed (unless approved by the Board) the lower of: (i) the aggregate amount of additional transfer agency fees and expenses that the Funds would otherwise pay to the transfer agent if each subaccount in the omnibus account for such class of shares maintained by the financial intermediary with the Funds were a direct account with the Funds and (ii) the amount by which the fees charged by the financial intermediary for including the Funds on its platform and providing shareholder, sub-transfer agency and related services exceed the amount paid under the Funds’ Plan with
respect to each Fund’s assets attributable to shares held by the financial intermediary in the omnibus account. If the sub-transfer agency fee is paid to financial intermediaries indirectly via the Distributor, the Distributor does not retain any amount thereof and such fee otherwise reduces the amount that the Distributor is contractually obligated to pay to the financial intermediary.
The Adviser agreed to pay or reimburse certain class-specific expenses of the Funds attributable to the Institutional Class, so that the Institutional Class bears its class-specific fees and expenses at the same annual percentage of its average daily net assets as the Investor Class’s class-specific fees and expenses (excluding the 12b-1 fees paid by the Investor Class and certain non-routine class-specific expenses, if applicable) (the “Class Expense Limitation”, together with the Fund-level Expense Limitations (attributable to the Value Line Larger Companies Focused Fund and Value Line Core Bond Fund), the “Expense Limitations”). The Adviser may subsequently recover from the Fund contractually reimbursed expenses and/or waived fees (within 3 years from the month in which the waiver/reimbursement occurred) to the extent that such class’ expense ratio is less than the applicable Expense Limitation or, if lower, the expense limitation in effect when the waiver or reimbursement occurred. The Class Expense Limitation can be terminated or modified only with the agreement of the Board of Directors.
As of December 31, 2022, fees contractually waived/ reimbursed by the Adviser amounted to $41,619, $79,382, $28,912, $19,795, $83,665, $53,839 and $21,481 for the Value Line Small Cap Opportunities Fund, Inc., Value Line Mid Cap Focused Fund, Inc., Value Line Select Growth Fund, Inc., Value Line Larger Companies Focused Fund, Inc., Value Line Asset Allocation Fund, Inc., Value Line Capital Appreciation Fund, Inc. and Value Line Core Bond Fund, respectively. As of December 31, 2022, the Adviser may seek reimbursement of the remaining waived fees and reimbursed expenses as follows:
| Expiration for the 12
months ended | Fees Waived and
Reimbursed by
the Adviser |
Value Line Small Cap Opportunities Fund, Inc. | | |
Value Line Small Cap Opportunities Fund, Inc. | | |
Value Line Small Cap Opportunities Fund, Inc. | | |
Value Line Mid Cap Focused Fund, Inc. | | |
Value Line Mid Cap Focused Fund, Inc. | | |
Value Line Mid Cap Focused Fund, Inc. | | |
Value Line Select Growth Fund, Inc. | | |
Value Line Select Growth Fund, Inc. | | |
Value Line Select Growth Fund, Inc. | | |
Value Line Larger Companies Focused Fund, Inc. | | |
Value Line Larger Companies Focused Fund, Inc. | | |
Value Line Larger Companies Focused Fund, Inc. | | |
Value Line Asset Allocation Fund, Inc. | | |
Value Line Asset Allocation Fund, Inc. | | |
Value Line Asset Allocation Fund, Inc. | | |
Value Line Capital Appreciation Fund, Inc. | | |
Value Line Capital Appreciation Fund, Inc. | | |
Value Line Capital Appreciation Fund, Inc. | | |
Value Line Core Bond Fund | | |
Value Line Core Bond Fund | | |
Value Line Core Bond Fund | | |
During the year/period ended December 31, 2022, the Value Line Small Cap Opportunities Fund, Inc., Value Line Mid Cap Focused Fund Inc., Value Line Asset Allocation Fund, Inc., Value Line Capital Appreciation Fund, Inc., and Value Line Core Bond Fund made repayments to the Adviser for previously waived and reimbursed fees in the amounts of $812, $3,446, $68,577, $945 and $16,169, respectively.
On June 16, 2022, the Board agreed to terminate the Expense Limitation Agreement between the Adviser and the Value Line Asset Allocation Fund, Inc. with respect to the Institutional Class. The change is effective on August 1, 2022.
6. Fiscal Year End Change
Effective April 1, 2022, the Board agreed to change the fiscal year-end of the Value Line Small Cap Opportunities Fund, Inc. and the Value Line Asset Allocation Fund, Inc. from March 31 to December 31. Accordingly, these Funds’ financial statements and related notes include information as-of and for the nine month period ended December 31, 2022, and the year ended March 31, 2022.
Report of Independent Registered Public Accounting Firm
To the Board of Directors and Shareholders of Value Line Small Cap Opportunities Fund, Inc., Value Line Mid Cap Focused Fund, Inc., Value Line Select Growth Fund, Inc., Value Line Larger Companies Focused Fund, Inc., Value Line Asset Allocation Fund, Inc., Value Line Capital Appreciation Fund, Inc. and Value Line Core Bond Fund
Opinions on the Financial Statements
We have audited the accompanying statements of assets and liabilities, including the schedules of investments, of each of the funds listed in the table below (hereafter collectively referred to as the "Funds") as of December 31, 2022, the related statements of operations and the statements of changes in net assets for each of the periods indicated in the table below, including the related notes, and the financial highlights for each of the periods indicated in the table below (collectively referred to as the “financial statements”). In our opinion, the financial statements present fairly, in all material respects, the financial position of each of the Funds as of December 31, 2022, the results of each of their operations, the changes in each of their net assets and each of the financial highlights for each of the periods indicated in the table below, in conformity with accounting principles generally accepted in the United States of America.
Value Line Select Growth Fund, Inc.(1)
Value Line Mid Cap Focused Fund, Inc. (2)
Value Line Capital Appreciation Fund, Inc. (2)
Value Line Larger Companies Focused Fund, Inc. (2)
Value Line Core Bond Fund (2)
Value Line Small Cap Opportunities Fund, Inc. (3)
Value Line Asset Allocation Fund, Inc. (3)
(1)
Statement of operations for the year ended December 31, 2022, statement of changes in net assets for each of the two years in the period ended December 31, 2022 and the financial highlights for each of the periods indicated therein
(2)
Statement of operations for the year ended December 31, 2022, statement of changes in net assets for each of the two years in the period ended December 31, 2022 and the financial highlights for each of the five years in the period ended December 31, 2022
(3)
Statements of operations for the period April 1, 2022 through December 31, 2022 and for the year ended March 31, 2022, statements of changes in net assets for the period April 1, 2022 through December 31, 2022 and for each of the two years in the period ended March 31, 2022 and the financial highlights for the period April 1, 2022 through December 31, 2022 and for each of the five years in the period ended March 31, 2022
Basis for Opinions
These financial statements are the responsibility of the Funds’ management. Our responsibility is to express an opinion on the Funds’ financial statements based on our audits. We are a public accounting firm registered with the Public Company Accounting Oversight Board (United States) (PCAOB) and are required to be independent with respect to the Funds in accordance with the U.S. federal securities laws and the applicable rules and regulations of the Securities and Exchange Commission and the PCAOB.
We conducted our audits of these financial statements in accordance with the standards of the PCAOB. Those standards require that we plan and perform the audit to obtain reasonable assurance about whether the financial statements are free of material misstatement, whether due to error or fraud.
Our audits included performing procedures to assess the risks of material misstatement of the financial statements, whether due to error or fraud, and performing procedures that respond to those risks. Such procedures included examining, on a test basis, evidence regarding the amounts and disclosures in the financial statements. Our audits also included evaluating the accounting principles used and significant estimates made by management, as well as evaluating the overall presentation of the financial statements. Our procedures included confirmation of securities owned as of December 31, 2022 by correspondence with the custodian, transfer agent and brokers; when replies were not received from brokers, we performed other auditing procedures. We believe that our audits provide a reasonable basis for our opinions.
/s/PricewaterhouseCoopers LLP
New York, New York
February 17, 2023
We have served as the auditor of one or more investment companies in the Value Line Funds since 1983.
Fund Expenses (unaudited)
Example
As a shareholder of the Funds, you incur ongoing costs, including management fees, distribution and service (12b-1) fees, and other Fund expenses. This Example is intended to help you understand your ongoing costs (in dollars) of investing in each Fund and to compare these costs with the ongoing costs of investing in other mutual funds.
The Example is based on an investment of $1,000 invested on (July 1, 2022 and held for six months ended December 31, 2022).
Actual Expenses
The first line of the table below provides information about actual account values and actual expenses. You may use the information in this line, together with the amount you invested, to estimate the expenses that you paid over the period. Simply divide your account value by $1,000 (for example an $8,600 account value divided by $1,000 = 8.6), then multiply the result by the number in the first line for each Fund under the heading “Expenses Paid During Period” to estimate the expenses you paid on your account during this period.
Hypothetical Example for Comparison Purposes
The second line of the table below provides information about hypothetical account values and hypothetical expenses based on the Funds’ actual expense ratio and an assumed rate of return of 5% per year before expenses, which is not the Funds’ actual return. The hypothetical account values and expenses may not be used to estimate the actual ending account balance or expenses you paid for the period. You may use this information to compare the ongoing costs of investing in the Fund and other funds. To do so, compare this 5% hypothetical example with the 5% hypothetical examples that appear in the shareholder reports of other funds.
Please note that the expenses shown in the table are meant to highlight your ongoing costs only and do not reflect any transactional costs, such as sales charges (loads), redemption fees, or exchange fees. Therefore, the table is useful in comparing ongoing costs only and will not help you determine the relative total costs of owning different funds. In addition, if transactional costs were included, your costs would have been higher.
| Beginning
Account
Value
July 1,
2022 | Ending
Account
Value
December 31,
2022 | | |
| | | | |
Value Line Small Cap Opportunities Fund, Inc. — Investor Class | | | | |
Value Line Small Cap Opportunities Fund, Inc. — Institutional Class | | | | |
Value Line Mid Cap Focused Fund, Inc. — Investor Class | | | | |
Value Line Mid Cap Focused Fund, Inc. — Institutional Class | | | | |
Value Line Select Growth Fund, Inc. — Investor Class | | | | |
Value Line Select Growth Fund, Inc. — Institutional Class | | | | |
Value Line Larger Companies Focused Fund, Inc. — Investor Class | | | | |
Value Line Larger Companies Focused Fund, Inc. — Institutional Class | | | | |
Value Line Asset Allocation Fund, Inc. — Investor Class | | | | |
Value Line Asset Allocation Fund, Inc. — Institutional Class | | | | |
Value Line Capital Appreciation Fund, Inc. — Investor Class | | | | |
Value Line Capital Appreciation Fund, Inc. — Institutional Class | | | | |
Value Line Core Bond Fund — Investor Class | | | | |
Hypothetical (5% return before expenses) | | | | |
Value Line Small Cap Opportunities Fund, Inc. — Investor Class | | | | |
Value Line Small Cap Opportunities Fund, Inc. — Institutional Class | | | | |
Value Line Mid Cap Focused Fund, Inc. — Investor Class | | | | |
Value Line Mid Cap Focused Fund, Inc. — Institutional Class | | | | |
Value Line Select Growth Fund, Inc. — Investor Class | | | | |
Value Line Select Growth Fund, Inc. — Institutional Class | | | | |
Value Line Larger Companies Focused Fund, Inc. — Investor Class | | | | |
Value Line Larger Companies Focused Fund, Inc. — Institutional Class | | | | |
Value Line Asset Allocation Fund, Inc. — Investor Class | | | | |
Value Line Asset Allocation Fund, Inc. — Institutional Class | | | | |
Value Line Capital Appreciation Fund, Inc. — Investor Class | | | | |
Fund Expenses (unaudited) (continued)
| Beginning Account Value July 1, 2022 | Ending Account Value December 31, 2022 | | |
Hypothetical (5% return before expenses) | | | | |
Value Line Capital Appreciation Fund, Inc. — Institutional Class | | | | |
Value Line Core Bond Fund — Investor Class | | | | |
| Expenses are equal to the Funds' annualized expense ratio multiplied by the average account value over the period, multiplied by 184/365 (to reflect the Fund's most recent fiscal one-half year). These expense ratios may differ from the expense ratios shown in the Financial Highlights. |
Federal Tax Notice (unaudited)
Each Fund designates the following amounts distributed during the fiscal year ended December 31, 2022, if any, as capital gain dividends, dividends eligible for the corporate dividends received deduction and/or qualified dividend income:
| % of
Qualifying
Dividend
Income | % of
Dividends
Eligible for the
Corporate
Dividends
Received
Deduction | |
Value Line Small Cap Opportunities Fund, Inc. | | | |
Value Line Mid Cap Focused Fund, Inc. | | | |
Value Line Select Growth Fund, Inc. | | | |
Value Line Larger Companies Focused Fund, Inc. | | | |
Value Line Asset Allocation Fund, Inc. | | | |
Value Line Capital Appreciation Fund, Inc. | | | |
Value Line Core Bond Fund | | | |
Each Fund files its complete schedule of portfolio holdings with the Securities and Exchange Commission ("SEC") for the first and third quarters of each fiscal year as an exhibit to Form N-PORT within 60 days of the end of such fiscal quarter. Regulatory filings of Forms N-PORT are available on the SEC's website at http://www.sec.gov.
A description of the policies and procedures that the Funds use to determine how to vote proxies relating to portfolio securities, and information regarding how the Funds voted these proxies for the 12-month period ended June 30 is available through the Funds' website at http://www.vlfunds.com and on the SEC's website at http://www.sec.gov. The description of the policies and procedures is also available without charge, upon request, by calling 1-800-243-2729.
Board Approval of Liquidity Risk Management Program (unaudited)
To promote effective liquidity risk management throughout the fund industry and to enhance disclosure regarding fund liquidity and redemption practices, the Securities and Exchange Commission (the “Commission”) adopted Rule 22e-4 under the Investment Company Act of 1940, as amended. This Rule requires every registered open-end management company to establish a liquidity risk management program (the “LRMP”) that, among other things, provides for the assessment, management and review of liquidity risk, the classification of a fund’s portfolio investments into one of four liquidity buckets based upon the number of days that such investments may reasonably be expected to be converted into cash or otherwise disposed of without significantly impacting their price, the establishment of a highly liquid investment minimum where required, and the establishment of a 15% limitation on illiquid investments. Additionally, the Commission adopted Rule 30b1-10 and Form N-LIQUID, which generally requires a fund to notify the Commission when certain liquidity-related events occur.
The Funds’ Board approved the appointment of the Adviser’s 40 Act Liquidity Risk Management Committee (“Liquidity Committee”) as the administrator of the LRMP for the Funds on December 13, 2018 and the Fund’s LRMP on March 15, 2019. At the Board’s regular meeting on June 16, 2022, the Funds’ Chief Compliance Officer provided a report to the Funds’ Board on the operation and effectiveness of the LRMP after its first year of operation. The Adviser manages liquidity risks associated with the Funds’ investments by monitoring cash and cash equivalents, the use of derivatives, the concentration of investments and the appropriateness of portfolio strategies for open-end funds, and by classifying every Fund investment as either highly liquid, moderately liquid, less liquid or illiquid on at least a monthly basis. To assist with the classification of Fund investments, the Adviser utilizes a third-party provider of liquidity monitoring services. The third-party provider supplies portfolio-level data and certain assumptions which it uses to determine classifications. The Liquidity Committee reviews and reconciles the information provided for accuracy.
The LRMP effectively managed the Funds’ liquidity risks for the twelve-month period ended December 31, 2022. During this period, each Fund held no less than 50% of its total net assets in highly liquid investments. Because each Fund consisted primarily of highly liquid investments, no highly liquid investment minimum was required to be established for any Fund, and all Funds were well under their illiquid investment limitations. Additionally, no events that would require the filing of Form N-LIQUID occurred.
The business and affairs of each Fund are managed by the Fund’s officers under the direction of its Board of Directors. The following table sets forth information on the Directors and officers of the Funds, each of which serves in that capacity for every Fund. Each Director serves as a director or trustee of each of the registered investment companies advised by the Adviser (the “Value Line Funds”). Each Director serves until his or her successor is elected and qualified. The Statement of Additional Information includes additional information about the Funds’ Directors and is available without charge by calling 1-800-243-2729.
| | | Principal Occupations
During the Past 5 Years | Number of
Portfolios
in Fund
Complex
Overseen
by Director | Other
Directorships
Held by
Director
During the
Past 5 Years |
| | | | | |
| | | President of each of the Value Line Funds; Trustee, CEO and Treasurer of the Adviser; President and Chief Financial Officer of the Distributor. | | Forethought Variable Insurance Trust |
| | | | | |
Joyce E. Heinzerling Age: 66 | | | Retired. Managing Member, Meridian Fund Advisers LLC (consultants) until 2020. | | KOP Therapeutics Corp (biotechnology) |
| Director (Chair of the Board of the Value Line Funds since April 2016) | | Chief Financial Officer, Notre Dame School of Manhattan since 2011; Director and Principal Financial Officer, Merrill Lynch Global Wealth Management, 2006 - 2011. | | Miller/Howard High Income Equity Fund |
Paul Craig Roberts Age: 83 | | | Chairman, Institute for Political Economy. | | |
| | | Independent Trustee and Managing Member, NBS Consulting LLC since 2014; Senior Financial Adviser, Veritable, L.P. (investment advisor) until 2013. | | |
*
Mr. Appel is an “interested person” as defined in the 1940 Act by virtue of his position with the Distributor and the Adviser.
Management of the Funds (continued)
| | | Principal Occupations
During the Past 5 Years |
| | | |
| | | President of each of the Value Line Funds; Trustee, CEO and Treasurer of the Adviser; President and Chief Financial Officer of the Distributor. |
| Treasurer and Chief Financial Officer | | Treasurer and Chief Financial Officer (Principal Financial and Accounting Officer) of each of the Value Line Funds since June 2022. Senior Principal Consultant. Foreside Management Services, LLC, since 2022. Director Fund Services, Bank of New York Mellon, 2002 - 2021. |
| | | Chief Compliance Officer of each of the Value Line Funds since 2009; President of Northern Lights Compliance Services, LLC 2006 – 2019. |
Emily D. Washington Age: 44 | Vice President and Secretary | | Vice President of each of the Value Line Funds since 2020 and Secretary since 2010; Treasurer and Chief Financial Officer of each of the Value Line Funds, 2008 – 2020. |
| | | Vice President of each of the Value Line Funds since 2020; Vice President of the Distributor and the Adviser since 2011. |
The address for each of the above is 7 Times Square, Suite 1606, New York, NY 10036-6524.
In 1950, Value Line started its first mutual fund. For seven decades, knowledgeable investors and financial advisors have been relying on the Value Line Funds to help them build their financial futures. Over the years, Value Line Funds has evolved into what it is today - a diversified family of mutual funds with a wide range of investment objectives.
Strategies That Have Stood the Test of Time
1950Value Line Mid Cap Focused Fund
1952Value Line Capital Appreciation Fund
1956Value Line Select Growth Fund
1972Value Line Larger Companies Focused Fund
1986Value Line Core Bond Fund
1993Value Line Small Cap Opportunities Fund
1993Value Line Asset Allocation Fund
2015Institutional shares launched for the Value Line
Larger Companies Focused Fund, Small Cap
Opportunities Fund, Asset Allocation Fund
and Capital Appreciation Fund
2017Insitutional shares launched for the
Value Line Mid Cap Focused Fund
2020Institutional shares launched for the
Value Line Select Growth Fund
For more complete information about any of the Value Line Funds, including charges and expenses, send for a prospectus from EULAV Securities LLC, 7 Times Square, Suite 1606, New York, New York 10036-6524 or call 1-800-243-2729, 9am-5pm CST, Monday-Friday, or visit us at www.vlfunds.com. Read the prospectus carefully before you invest or send money.
Item 2 Code of Ethics
(a) The Registrant has adopted a Code of Ethics that applies to its principal executive officer, and principal financial officer and principal accounting officer.
(f) Pursuant to item 12(a), the Registrant is attaching as an exhibit a copy of its Code of Ethics that applies to its principal executive officer, and principal financial officer and principal accounting officer.
Item 3. Audit Committee Financial Expert.
((a)(1)The Registrant has an Audit Committee Financial Expert serving on its Audit Committee.
(2) The Registrant’s Board has designated James Hillman, member of the Registrant’s Audit Committee, as the Registrant’s Audit Committee Financial Expert. Mr. Hillman is an independent director. Mr. Hillman currently serves as the Chief Financial Officer at Notre Dame School of Manhattan since 2011.
A person who is designated as an “audit committee financial expert” shall not make such person an “expert” for any purpose, including without limitation under Section 11 of the Securities Act of 1933 or under applicable fiduciary laws, as a result of being designated or identified as an audit committee financial expert. The designation or identification of a person as an audit committee financial expert does not impose on such person any duties, obligations, or liabilities that are greater than the duties, obligations, and liabilities imposed on such person as a member of the audit committee and Board of Trustees in the absence of such designation or identification.
Item 4 Principal Accountant Fees and Services
(a) Audit Fees 2022 - $44,071
Audit Fees 2021 - $36,953
(b) Audit-Related fees – None.
(c) Tax Preparation Fees 2022 - None
Tax Preparation Fees 2021 - None
(d) All Other Fees – None
(e) (1) Disclose the audit committee’s pre-approval policies and procedures described in paragraph (c)(7) of Rule 2-01 of Regulation S-X
The Value Line Mid Cap Focused Fund, Inc. (the “Fund”) Board has adopted policies and procedures with regard to the pre-approval of services provided by the Audit firm. Audit, audit-related and tax compliance services provided to the Fund on an annual basis require specific pre-approval by the Board. As noted above, the Board must also approve other non-audit services provided to the Fund and those non-audit services provided to the Fund’s Affiliate Service Providers that related directly to the operations and financial reporting of the Fund. Certain of these non-audit services that the Board believes are a) consistent with the SEC’s auditor independence rules and b) routine and recurring services that will not impair the independence of the independent auditors may be approved by the Board.
General Audit Committee Approval Policy:
Potential services by the auditors will be classified by officers of the Fund and the auditors into the four non-restricted service categories denoted above and this “Approval of Audit, Audit-Related, Tax and Other Services” Policy above will be applied. Any services outside the specific pre-approved service subcategories set forth in this Policy must be specifically approved by the Audit Committee (or such member or members of the Audit Committee as the Audit Committee may authorize to grant such approval).
At least quarterly, the Audit Committee shall review a report summarizing the services by service category, including fees, provided by the Audit firm as set forth in the above policy.
(e) (2) Not applicable.
(f) Not applicable.
(g) Aggregate Non-Audit Fees 2022 - None
Aggregate Non-Audit Fees 2020 - None
(h) Not applicable.
Item 5. Audit Committee of Listed Registrants
Not Applicable.
Item 6. Investments
Not Applicable
Item 7. Disclosure of Proxy Voting Policies and Procedures for Closed-End Management Investment Companies
Not Applicable
Item 8. Portfolio Managers of Closed-End Management Investment Companies
Not Applicable
Item 9. Purchases of Equity Securities by Closed-End Management Investment Company and Affiliated Purchasers
Not Applicable
Item 10 Submission of Matters to a Vote of Security Holders
Not Applicable
Item 11 Controls and Procedures
| | (a) | The registrant’s principal executive officer and principal financial officer have concluded that the registrant’s disclosure controls and procedures (as defined in rule 30a-2(c) under the Act (17 CFR 270.30a-2(c)) based on their evaluation of these controls and procedures as of a date within 90 days of the filing date of this report, are appropriately designed to ensure that material information relating to the registrant is made known to such officers and are operating effectively. |
| | (b) | The registrant’s principal executive officer and principal financial officer have determined that there have been no significant changes in the registrant’s internal controls or in other factors that could significantly affect these controls during the period covered by this report, including corrective actions with regard to significant deficiencies and material weaknesses. |
Item 12. Disclosure of Securities Lending Activities for Closed-End Management Investment Companies
Not Applicable
Item 13 Exhibits
(2) Certification pursuant to Section 906 of the Sarbanes-Oxley Act of 2002 attached hereto as Exhibit 99.906.CERT.
SIGNATURES
Pursuant to the requirements of the Securities Exchange Act of 1934 and the Investment Company Act of 1940, the registrant has duly caused this report to be signed on its behalf by the undersigned, thereunto duly authorized.
| | |
| |
| By | | /s/ Mitchell E. Appel |
| | Mitchell E. Appel, President |
Date: March 2, 2023
Pursuant to the requirements of the Securities Exchange Act of 1934 and the Investment Company Act of 1940, this report has been signed below by the following persons on behalf of the registrant and in the capacities and on the dates indicated.
| | |
| |
| By: | | /s/ Mitchell E. Appel |
| | Mitchell E. Appel, President, Principal Executive Officer |
| |
| By: | | /s/ James A. Gallo |
| | James A. Gallo, Treasurer, Principal Financial Officer |
Date: March 2, 2023