UNITED STATES
SECURITIES AND EXCHANGE COMMISSION
Washington, D.C. 20549
SECURITIES AND EXCHANGE COMMISSION
Washington, D.C. 20549
FORM N-CSR
CERTIFIED SHAREHOLDER REPORT OF REGISTERED
MANAGEMENT INVESTMENT COMPANIES
Investment Company Act file number 811-07959
Advisors Series Trust
(Exact name of registrant as specified in charter)
(Exact name of registrant as specified in charter)
615 East Michigan Street
Milwaukee, WI 53202
(Address of principal executive offices) (Zip code)
(Address of principal executive offices) (Zip code)
Jeffrey T. Rauman, President/Chief Executive Officer
Advisors Series Trust
c/o U.S. Bancorp Fund Services, LLC
777 East Wisconsin Avenue, 5th Floor
Milwaukee, WI 53202
(Name and address of agent for service)
(Name and address of agent for service)
(626) 914-7363
Registrant's telephone number, including area code
Date of fiscal year end: February 28, 2022
Date of reporting period: August 31, 2021
Item 1. Reports to Stockholders.
| (a) | [Insert full text of semi-annual or annual report here] |
| Pzena Funds | |
| Semi-Annual Report | |
| AUGUST 31, 2021 | |
PZENA MID CAP VALUE FUND
Investor Class PZVMX
Institutional Class PZIMX
PZENA EMERGING MARKETS VALUE FUND
Investor Class PZVEX
Institutional Class PZIEX
PZENA SMALL CAP VALUE FUND
Investor Class PZVSX
Institutional Class PZISX
PZENA INTERNATIONAL SMALL CAP VALUE FUND
Investor Class PZVIX
Institutional Class PZIIX
PZENA INTERNATIONAL VALUE FUND
Investor Class PZVNX
Institutional Class PZINX
1-844-PZN-1996 (1-844-796-1996) • www.pzenafunds.com
Table of Contents
Letter to Shareholders | 1 | ||
Pzena Funds Commentary | |||
| Pzena Mid Cap Value Fund | 2 | ||
| Pzena Emerging Markets Value Fund | 4 | ||
| Pzena Small Cap Value Fund | 7 | ||
| Pzena International Small Cap Value Fund | 9 | ||
| Pzena International Value Fund | 11 | ||
Pzena Mid Cap Value Fund | |||
| Portfolio Allocation | 13 | ||
| Schedule of Investments | 14 | ||
Pzena Emerging Markets Value Fund | |||
| Portfolio Allocation | 15 | ||
| Schedule of Investments | 16 | ||
| Portfolio Diversification | 18 | ||
Pzena Small Cap Value Fund | |||
| Portfolio Allocation | 19 | ||
| Schedule of Investments | 20 | ||
Pzena International Small Cap Value Fund | |||
| Portfolio Allocation | 22 | ||
| Schedule of Investments | 23 | ||
| Portfolio Diversification | 25 | ||
Pzena International Value Fund | |||
| Portfolio Allocation | 26 | ||
| Schedule of Investments | 27 | ||
| Portfolio Diversification | 29 | ||
Statements of Assets and Liabilities | 30 | ||
Statements of Operations | 32 | ||
Statements of Changes in Net Assets | |||
| Pzena Mid Cap Value Fund | 34 | ||
| Pzena Emerging Markets Value Fund | 35 | ||
| Pzena Small Cap Value Fund | 36 | ||
| Pzena International Small Cap Value Fund | 37 | ||
| Pzena International Value Fund | 38 | ||
Financial Highlights | |||
| Pzena Mid Cap Value Fund | 39 | ||
| Pzena Emerging Markets Value Fund | 41 | ||
| Pzena Small Cap Value Fund | 43 | ||
| Pzena International Small Cap Value Fund | 45 | ||
| Pzena International Value Fund | 47 | ||
Notes to Financial Statements | 49 | ||
Expense Example | 59 | ||
Approval of Investment Advisory Agreement | 61 | ||
Notice to Shareholders | 63 | ||
Privacy Notice | 64 |
Dear Shareholder:
Before the start of the reporting period, optimism, driven by COVID-19 vaccine success and stimulus packages, led global markets higher. Since the end of February, as COVID-19 concerns gradually eased, global equity markets mostly continued their positive trajectories, albeit less intensely than in the second half of 2020.
Value, which started to outperform in the fourth quarter of 2020, continued to lead markets higher in early 2021 on expectations of a sustained economic recovery (and, indeed, consumer spending increased as COVID-19 restrictions were relaxed) due in large part to both fiscal and monetary support from governments and central banks around the world, and on rising inflation expectations, which saw bond yields move higher.
Our Funds each started out strongly, as market sentiment favored companies that stood to benefit from economic reopening over many of the lockdown winners. Additionally, the “reflation trade,” driven by massive amounts of central bank stimulus, led to inflationary pressure and rising interest rates, boosting many companies in the financials and energy sectors.
But as we got deeper into the summer, sentiment shifted back to large cap growth names in many areas of the world, as uncertainties over reopenings grew as the Delta variant spread worldwide. From June through August, each of our Funds, except for the Emerging Markets Value Fund, gave back a good percentage of the outperformance they had built up in the first three months of the period.
Putting the six months together, our Funds ended with mixed results as large caps were favored over small caps, and growth outperformed value across much of the developed world. Value, however, was stronger among U.S. small cap and emerging markets stocks.
The spread of the Delta variant, particularly in India and subsequently East Asia, also pressured emerging market equities. Yet, while the MSCI EM Index was down slightly less than 1%, the MSCI Emerging Markets Value series outpaced the growth index by 953 basis points (USD). Importantly, the MSCI EM Index excluding China posted a strong 10.08% gain. The Chinese Communist Party’s abrupt regulatory crackdown that ensued in July took many investors by surprise, not only due to its swiftness, but because for the better part of the past 40 years, China’s ruling party had seemingly been willing to set aside a strict socialist agenda to prioritize growing the economy.
As economies continue to reopen, we expect the cost cutting and restructuring actions taken by management teams during the pandemic to continue to drive operating margin expansion as revenues recover. The current valuation gap between growth and value stocks globally is still extremely wide by historical standards, and the Funds remain heavily weighted toward cyclical stocks – most notably in financials, industrials, and consumer discretionary. We remain confident in current positioning given the robustness of the companies’ underlying franchises and balance sheets.
As always, we are committed to our philosophy of value investing with a long-term outlook, and we encourage our Fund investors to take a similar view.
The following pages review investment decisions and current positioning. Please take a few minutes to read these letters.
If you have questions about your Pzena Fund’s portfolio, please get in touch with your advisor or a member of our team of registered representatives. We thank you for investing with us.
Best regards,
Pzena Investment Management, LLC
Past performance does not guarantee future results. Index performance is not indicative of fund performance. One cannot invest directly in an index.
Mutual fund investing involves risk. Principal loss is possible.
Basis point – One-hundredth of a percentage point (0.01%).
1
Pzena Mid Cap Value Fund
Commentary
August 2021
Average Annual Total Returns for the Semi-Annual Period Ended August 31, 2021.
| Since | ||||||
| Three | Six | One | Three | Five | Inception | |
Months(1) | Months(1) | Year(1) | Years | Years | (3/31/2014) | |
| Pzena Mid Cap Value Fund – Investor Class (PZVMX) | -3.63% | 11.23% | 66.14% | 10.58% | 12.02% | 9.36% |
| Pzena Mid Cap Value Fund – Institutional Class (PZIMX) | -3.55% | 11.50% | 66.80% | 10.97% | 12.39% | 9.70% |
Russell Midcap® Value Index | 1.58% | 14.20% | 44.50% | 11.37% | 11.52% | 10.00% |
| (1) | Not annualized. |
Performance data quoted represents past performance and does not guarantee future results. The investment return and principal value of an investment will fluctuate so that an investor’s shares, when redeemed, may be worth more or less than their original cost. Current performance of the Fund may be lower or higher than the performance quoted. Performance data current to the most recent month-end may be obtained by calling 844.PZN.1996 (844.796.1996).
PZVMX Expense Ratio – Gross: 1.41%
PZVMX Expense Ratio – Net: 1.25%*
PZIMX Expense Ratio – Gross: 1.06%
PZIMX Expense Ratio – Net: 0.90%*
Expense ratios shown are as of the Fund’s registration statement dated June 28, 2021.
| * | Pzena Investment Management, LLC, the Fund’s investment adviser, has contractually agreed to waive a portion or all of its management fees and pay Fund expenses through at least June 28, 2022. |
Building on late-2020 momentum, value stocks continued to surge in the first half of 2021 as the vaccine rollout accelerated. Massive fiscal and monetary stimulus drove consumer spending, setting the stage for a powerful rebound in the economy. Investor preference abruptly shifted from value to growth in June, as the Fed spoke about potential tapering, resulting in a significant flattening of the yield curve, and the Russell Midcap Value Index posted a negative return for the first time in five months. Domestic equities came under pressure again in July as the spread of the COVID-19 Delta variant in both Asia and the U.S. raised concerns about the potential economic implications, impacting shares of cyclical companies the most. Value’s summer hiatus led the Fund to underperform the index, with energy the largest detractor, while industrials, financials, and consumer discretionary drove gains.
Oil service companies Halliburton, NOV, and Baker Hughes were the worst performers in the period – falling victim to the summer crude price selloff that was prompted by concerns over global demand growth, as the Delta variant continued to spread. Halliburton nonetheless reported solid 2Q21 results, with margins and cash flow coming in ahead of consensus expectations, while sales were up year-over-year and on a sequential basis; importantly, management was bullish on its 2H21 outlook for the industry as a whole. NOV similarly reported strong 2Q21 results on the back of better revenue, EBITDA and cash flow, whereas Baker Hughes’ reported earnings per share came in below expectations due to higher taxes; but sales, operating income, and cash flow were all strong.
Olin Corp., a chemical producer of chlorine derivatives and caustic soda, was the portfolio’s top individual performer, as the company continues to realize pricing improvements amid tight market conditions. The new CEO’s strategy around rationalizing supply and maximizing the size of molecules is yielding positive results at a faster pace than anticipated, and future earnings growth looks encouraging assuming the industrial recovery remains intact. Management expects conditions to continue to improve in the third quarter, and as a result, they raised FY21 EBITDA guidance to at least $2.1bn, up from prior guidance of $1.8bn to $2.1bn. Global insurer American International Group was higher after reporting 2Q21 results that revealed tangible progress in the turnaround of its core General Insurance (P&C) unit, while Life & Retirement also exhibited strong performance. Lastly, defense contractor and private jet manufacturer Textron’s shares rose after the company reported two consecutive quarters of strong results due to robust commercial demand for both its Bell helicopters and business jets, resulting in the company’s highest level of backlog since before the global financial crisis.
During the period, we added IT services company Cognizant Technology Solutions to the portfolio. The key reason why Cognizant’s valuation looks discounted relative to its historical return profile is that the company has been underperforming peers in recent history in terms of both growth and margin trajectory – namely because prior management focused on margins at the expense of growth while competitors were moving up the learning curve and investing in digital capabilities. As a result, Cognizant has been undergoing a
2
Pzena Mid Cap Value Fund
Commentary (Continued)
August 2021
digital investment/restructuring period in an effort to catch up to its competitors, but management believes that its spending phase has peaked, restructuring charges are winding down, and importantly, backlog trends support the notion that its investments should start to pay off in the near future. We believe the relatively new management team will be able to stabilize the business and slow employee attrition, and margins will ultimately revert to normal levels while revenue grows in line with the industry. We also exited our position in Avis Budget Group on valuation, and generic drug manufacturer Viatris as the range of outcomes widened.
Management teams have cut costs and restructured operations to an extent that should continue to drive operating margin expansion as revenues recover. The current valuation gap between growth and value stocks is still extremely wide by historical standards, and the portfolio remains heavily weighted towards cyclical stocks – most notably in financials, industrials, and consumer discretionary. We remain confident in the positioning of the portfolio given the robustness of the companies’ underlying franchises and balance sheets.
Mutual fund investing involves risk. Principal loss is possible. Investments in small- and mid-cap companies involve additional risks such as limited liquidity and greater volatility than larger companies. Investments in foreign securities involve political, economic and currency risks, greater volatility and differences in accounting methods. These risks are greater for investments in emerging markets. The Fund may have emphasis on a specific sector which could adversely affect a fund to a greater extent than if its emphasis was less. The Fund may invest in securities which are less liquid and more difficult to sell than more liquid securities. The Fund may invest in participatory notes which are a type of equity linked derivative and involve counterparty risk and risk that the performance of the security may not exactly match the performance of the issuer. Investments in REITs are subject to the risks associated with the direct ownership of real estate.
The Pzena Funds are distributed by Quasar Distributors, LLC.
Fund holdings, exposures and characteristics are as of the date shown and are subject to change at any time. Please refer to the Schedule of Investments for more information.
The opinions expressed in this letter are those of the Fund manager, are subject to change, are not guaranteed, and should not be considered recommendations to buy or sell any security.
The Russell Midcap® Value Index is an unmanaged index that measures the performance of those Russell Mid Cap® companies with lower price-to-book ratios and lower forecasted growth rates.
An index cannot be invested in directly.
Fund holdings, exposures and characteristics are as of the date shown and are subject to change at any time. Please refer to the Schedule of Investments for more information.
Cash flow – net amount of cash being transferred into and out of a business.
EBITDA, or earnings before interest, taxes, depreciation, and amortization, is a measure of profitability.
Operating income – Gross profit minus operating expenses.
Operating margin – operating earnings (revenue minus cost of goods sold, and selling, general and administrative costs, excluding interest and taxes) divided by revenue.
3
Pzena Emerging Markets Value Fund
Commentary
August 2021
Average Annual Total Returns for the Semi-Annual Period Ended August 31, 2021.
| Since | ||||||
| Three | Six | One | Three | Five | Inception | |
Months(1) | Months(1) | Year(1) | Years | Years | (3/31/2014) | |
| Pzena Emerging Markets Value Fund – | ||||||
| Investor Class (PZVEX) | -1.79% | 6.33% | 42.10% | 8.52% | 9.87% | 4.57% |
| Pzena Emerging Markets Value Fund – | ||||||
| Institutional Class (PZIEX) | -1.63% | 6.57% | 42.61% | 8.91% | 10.21% | 4.89% |
| MSCI Emerging Markets Index | -4.12% | -0.98% | 21.12% | 9.87% | 10.40% | 6.27% |
| MSCI Emerging Markets Value Index | -2.68% | 3.98% | 29.34% | 6.40% | 7.69% | 3.77% |
| (1) | Not annualized. |
Performance data quoted represents past performance and does not guarantee future results. The investment return and principal value of an investment will fluctuate so that an investor’s shares, when redeemed, may be worth more or less than their original cost. Current performance of the Fund may be lower or higher than the performance quoted. Performance data current to the most recent month-end may be obtained by calling 844.PZN.1996 (844.796.1996).
PZVEX Expense Ratio – Gross: 1.56%
PZVEX Expense Ratio – Net: 1.43%*
PZIEX Expense Ratio – Gross: 1.21%
PZIEX Expense Ratio – Net: 1.08%*
Expense ratios shown are as of the Fund’s registration statement dated June 28, 2021.
| * | Pzena Investment Management, LLC, the Fund’s investment adviser, has contractually agreed to waive a portion or all of its management fees and pay Fund expenses through at least June 28, 2022. |
As COVID-19 concerns gradually eased, most emerging-market bourses continued their positive trajectories, though the index was down nearly one percent, driven by China weakness – China composes nearly 35% of the index and was down over 17%. The Chinese central government announced some key regulatory changes for internet companies and some industry-specific regulations for the education and housing sectors among others. The European, South American, and Africa/Mideast regions were each up.
The underperformance of richly valued Chinese growth-oriented names helped the MSCI Emerging Markets Value Index outperform the style-neutral MSCI Emerging Markets Index for the period, continuing the trend that began last November. By sector, the MSCI Emerging Markets Index reported weakness in the consumer discretionary, real estate, and communication services sectors; energy, materials, and utilities were the strongest sectors.
With a favorable backdrop for value, the Pzena Emerging Markets Value Fund outpaced the benchmark (MSCI Emerging Markets Index) by over 730 basis points, with relative performance driven by holdings in the industrials, utilities, and financials sectors. All sectors contributed positively except health care, which was the only detractor. By country, positioning in China/Hong Kong and holdings in Korea and Brazil contributed the most. Holdings in India, Taiwan, and Singapore were the leading detractors.
By company, the largest individual contributors for the period were Pacific Basin Shipping Limited, DB Insurance Co., Ltd., and Companhia Energetica de Minas Gerais SA (CEMIG). The top performer was Hong Kong-based dry bulk shipper Pacific Basin, which continued to benefit from normalization of industry over-supply, and higher shipping rates on many of its key routes, largely stemming from supply chain bottlenecks and lack of new ship supply. Korean insurer DB Insurance Co. was strong on the back of reported results ahead of consensus, largely on improved loss ratio in general insurance. While the expense ratio was a bit higher, it stemmed from stronger sales, as premiums grew, notably faster than its peers. CEMIG, the Brazilian electric utility, did well as it reported EBITDA up significantly year over year on strong performance in both the power generation and gas distribution segments. Also, the Brazilian power regulator ANEEL laid out some measures to mitigate distribution companies’ tariff hikes, removing some of the regulatory uncertainty.
The largest detractors in the portfolio were Baidu Inc., Galaxy Entertainment Group Limited, and Brilliance China Automotive. Baidu (Chinese internet search company) shares suffered early in the period in reaction to the U.S. Securities and Exchange Commission’s (SEC) adoption of measures to remove foreign stocks from U.S. exchanges if they fail to comply with U.S. accounting standards and from the Archegos Capital Management unwind. We don’t see the share decline as having anything to do with fundamentals. However, shares
4
Pzena Emerging Markets Value Fund
Commentary (Continued)
August 2021
declined further – later in the period – with other Internet stocks as China told major tech firms to improve compliance management. Uncertainty around the extent of China’s regulatory crackdown as well as criticism over unfair competition in the form of fake reviews has weighed on shares. We believe the fundamentals of the company are strong and see strength in its core search business and its investments in other ventures including autonomous driving. Galaxy Entertainment shares have been weak with other reopening trades as the timeline remains uncertain on when Macau will be fully reopening to visitors. Galaxy did show a net profit in first-half 2021, compared with net losses at Macau peers. New outbreaks continue to slow the pace of Macau’s recovery, but we remain constructive based on pent-up demand, its asset quality, its net-cash balance sheet, and its large land bank. Brilliance China Automotive detracted, due to our decision to write down the value of our holding. On March 31st, trading in shares of Brilliance China was halted after the company delayed publishing its 2020 financials due to unauthorized guarantees and legal proceedings involving a subsidiary. On April 14th, the following details were released: Brilliance China’s wholly-owned subsidiary, Shenyang JinBei Automotive Industry Holdings (SJAI), had guaranteed the debt of Huachen at four banks; and, on April 13th, auditors discovered a cash discrepancy of RMB 2.38bn between SJAI’s bank accounts and what it recorded on its books. While the asset side and its operations remain strong, given the lack of clarity on Brilliance China’s residual market value (due to apparent fraud) once it does resume trading, we marked the position to a price of 0.01 HKD until further notice.
During the period we established positions in United Integrated Services (UIS), China Overseas Land & Investment (COLI), Alibaba Group Holding, Indian used commercial vehicle financier Shriram Transport Finance Co., and electronics player Vtech. Taiwan’s UIS is a cleanroom producer for the foundry industry and counts chip giant Taiwan Semiconductor Manufacturing Company (TSMC) among its most loyal and important customers. UIS should continue to benefit from TSMC’s strength and capital expenditure spending, and trades at a fraction of its intrinsic valuation. COLI is a large, partially state-owned homebuilder, which boasts a large landbank in Chinese tier 1 and 2 cities. Recently, the company suffered from stagnating volumes in its core markets, as well as from margin compression due to government-imposed property price caps. We believe COLI’s state-owned status allows it a lower cost of funding and better access to liquidity in a downturn where tight liquidity conditions are expected. Moreover, its strong balance sheet helps it to gain market share as more stringent leverage requirements push weaker competitors out of the market. We bought Alibaba as it is a top internet player with strong franchises in ecommerce, cloud, and adjacent markets. There is uncertainty because the Chinese government is cracking down on the internet sector (regulations are literally coming out every week) but we feel the company’s recent share price decline provides compelling valuation as it navigates through these challenges. Shriram is the industry leader in used commercial vehicle financing in India and is poised to benefit significantly as the country recovers from COVID-19. We continued to build our position in electronic company Vtech. Vtech, as the world’s largest manufacturer of electronic learning toys, and a niche Electronics Manufacturing Services company, is a solid franchise with strong cash-generating abilities trading at an exceptional valuation.
During this period, we added to Galaxy and Turkish lender Akbank on weakness. We trimmed relative outperformers Rosneft Oil from Russia, and Indian private bank ICICI Bank Limited. We sold positions in independent power producer China Resources Power Holdings, Korean bank Hana Financial Group, and China Dongxiang, also mostly on strength.
The Fund’s largest sector weightings remain in financials (relative overweight) and information technology. We have a small allocation to health care, communication services, and real estate. Communications services is the Fund’s largest underweight relative to the index. Geographically, the largest relative exposure remains to emerging Europe. The large commitments by country are to Korea (overweight versus the index), China (underweight) and Taiwan (roughly index weight).
While we continue to applaud the recovery in emerging markets value equities, valuation spreads remain extremely wide by historical standards, which is to say: we believe the current value cycle has legs. The portfolio remains positioned in businesses across geographies and industries that can capture significant upside as they recover from both company-specific and externally-driven pain.
5
Pzena Emerging Markets Value Fund
Commentary (Continued)
August 2021
Mutual fund investing involves risk. Principal loss is possible. Investments in foreign securities involve political, economic and currency risks, greater volatility and differences in accounting methods. These risks are greater for investments in emerging markets. The Fund may have emphasis on a specific sector which could adversely affect a fund to a greater extent than if its emphasis was less. The Fund may invest in securities which are less liquid and more difficult to sell than more liquid securities. The Fund may invest in participatory notes which are a type of equity linked derivative and involve counterparty risk and risk that the performance of the security may not exactly match the performance of the issuer. Investments in real estate investment trusts are subject to the risks associated with the direct ownership of real estate.
The Pzena Funds are distributed by Quasar Distributors, LLC.
Fund holdings, exposures and characteristics are as of the date shown and are subject to change at any time. Please refer to the Schedule of Investments for more information.
The opinions expressed in this letter are those of the Fund manager, are subject to change, are not guaranteed, and should not be considered recommendations to buy or sell any security.
The MSCI Emerging Markets Index is a free float-adjusted market capitalization index that is designed to measure equity market performance of emerging markets, and provides equity returns including dividends net of withholding tax rates as calculated by MSCI. The index cannot be invested in directly.
The MSCI Emerging Markets Value Index is based on a traditional market cap weighted parent index, the MSCI Emerging Markets Index. The value investment style characteristics for index construction are defined using three variables: book value to price, 12-month forward earnings to price and dividend yield.
Loss ratio – the losses an insurer incurs due to paid claims as a percentage of premiums earned.
EBITDA, or earnings before interest, taxes, depreciation, and amortization, is a measure of profitability.
6
Pzena Small Cap Value Fund
Commentary
August 2021
Average Annual Total Returns for the Semi-Annual Period Ended August 31, 2021.
| Since | ||||||
| Three | Six | One | Three | Five | Inception | |
Months(1) | Months(1) | Year(1) | Years | Years | (4/27/2016) | |
| Pzena Small Cap Value Fund – Investor Class (PZVSX) | -4.06% | 8.42% | 61.96% | 6.62% | 9.94% | 9.37% |
| Pzena Small Cap Value Fund – Institutional Class (PZISX) | -3.97% | 8.52% | 62.38% | 6.90% | 10.26% | 9.69% |
Russell 2000® Value Index | -1.60% | 8.93% | 59.49% | 8.41% | 11.66% | 12.61% |
| (1) | Not annualized. |
Performance data quoted represents past performance and does not guarantee future results. The investment return and principal value of an investment will fluctuate so that an investor’s shares, when redeemed, may be worth more or less than their original cost. Current performance of the Fund may be lower or higher than the performance quoted. Performance data current to the most recent month-end may be obtained by calling 844.PZN.1996 (844.796.1996).
PZVSX Expense Ratio – Gross: 1.77%
PZVSX Expense Ratio – Net: 1.46%*
PZISX Expense Ratio – Gross: 1.42%
PZISX Expense Ratio – Net: 1.11%*
Expense ratios shown are as of the Fund’s registration statement dated June 28, 2021.
| * | Pzena Investment Management, LLC, the Fund’s investment adviser, has contractually agreed to waive a portion or all of its management fees and pay Fund expenses through at least June 28, 2022. |
Since the end of February, the Fund was up over eight percent, slightly lagging the index. Domestic stocks appreciated this period as the U.S. economy continued to reopen and markets benefited from ample liquidity. Small-cap stocks underperformed their large-cap peers, on a shift in investor preference to large growth. Within the small cap cohort, however, value outpaced growth. The strongest sectors in the index were basic materials, real estate, and consumer discretionary, while health care and technology delivered negative returns.
Relative Fund performance was driven by holdings in the health care, industrials, and technology sectors. Names in the financials, consumer discretionary, and real estate sectors lagged the most.
By name, the Fund’s largest contributors were Olin Corporation, Triple-S Management Corporation, and Belden Inc. Olin Corp. (chlor-alkali chemical producer) continues to realize pricing improvements and was a major contributor. The new CEO’s strategy around improving chlor-alkali profitability while demand rebounds, and rationalizing supply is bearing fruit, and future earnings growth is encouraging, assuming an industrial recovery and better industry supply/demand balance. Another contributor was Puerto Rico-based insurer Triple-S Management Corp. The stock traded in a somewhat choppy manner but ultimately ended up solidly. The company posted a strong set of results while issuing a positive outlook for the full year, which didn’t have much impact on the share price. But late in August management announced its agreement to be acquired by GuideWell Mutual Holding Corp. for $36 per share, a significant premium to its recent trading range. Signal transmission company Belden’s stock performed well having reported very strong back to back quarters. The company posted strong organic growth in concert with margin expansion due to cost take-outs and encouraging revenue growth.
The largest detractors for the period were NexTier Oilfield Solutions, Inc., TechnipFMC Plc, and WSFS Financial Corporation. Oil services company NexTier Oilfield Solutions shares were quite volatile. The stock rose in the second calendar quarter as crude prices rose, but came under pressure as crude prices fell toward the middle of July. In August the company reported in-line revenues but weaker-than-expected EBITDA, and also announced and closed on an acquisition of Alamo Pressure Pumping. We believe the acquisition adds top-tier fleets capable of burning dual fuels in diesel and natural gas, at an attractive price. Oilfield services company TechnipFMC’s shares were lower despite posting solid quarterly results in July. Investors became concerned about the company’s prospects for revenue growth, with book-to-bill remaining under 1x, as orders were still 40% below pre-COVID levels. WSFS’s underperformance can largely be attributed to technical and fundamental market selling pressure from the all-stock merger of Bryn Mawr Bank Corporation (BMBC), announced in March 2021. WSFS paid a 16% premium for BMBC and is not repurchasing its own shares while the transaction remains pending through expected close in early 4Q21. Further, the company’s primarily Commercial & Industrial customer base has not recovered as quickly as those in other sectors, and the significant excess liquidity on customer balance sheets led management to cut its full year net interest margin guidance by
7
Pzena Small Cap Value Fund
Commentary (Continued)
August 2021
35 basis points at the midpoint to 3.20-3.30%. Still, we believe the combination with BMBC creates a valuable franchise in the Greater Philadelphia and Delaware regions while the banking group, more broadly, is expected to move past economic uncertainty caused by the COVID-19 pandemic.
During the quarter, Huntington Bancshares came into the portfolio as a result of the TCF Financial Corporation acquisition, which the Fund owned. We will continue to evaluate Huntington over time but feel that the combined company remains attractive as they work through achieving synergies from the combination. We initiated a new position in MRC Global, a leading distributor of pipes, valves, and fittings for the transportation of oil & gas. The company has been negatively impacted by depressed energy demand, but its cash flows are countercyclical given the company’s working capital position. At the same time, MRC has a strong gas utility business that makes up almost one-third of sales, which has a growing revenue and profit stream. The company is actively right-sizing its cost structure, which will position it for profit growth as volumes normalize. We also continued to build our position in animal nutrition company Phibro Animal Health, and, in other activity, we opportunistically added to high-performance server manufacturer Super Micro Computer, NexTier Oilfield Solutions, chemical company Orion Engineered Carbons, index annuity writer American Equity Investment Life, and door & window manufacturer JELD-WEN Holdings, among others.
To help fund these purchases we exited our positions in investment bank Cowen, which performed well on strong earnings and particularly from SPAC activity, rental car company Avis Budget Group, and audio-video equipment manufacturer Poly (formally Plantronics) – both of which appreciated significantly due to increasing travel and video conferencing demand, respectively, and as a result, approached our estimate of fair value. We also sold out of a small position in Technip Energies, which had spun out from TechnipFMC, and trimmed Olin Corp., Murphy Oil Corporation, MasTec (infrastructure construction), and Ryder System (truck rental), on strength.
We believe the portfolio is positioned for a recovery from the COVID-19 recession. The portfolio remains heavily focused in holdings of strong cyclical businesses with solid balance sheets that are deeply discounted to the earnings growth and cash flows they can, and in many cases, are already delivering. We remain committed to discovering new opportunities where we see potential for significant valuation upside over the long term, as we view the current valuation gap between growth and value stocks (which is still extremely wide by historical standards) as irrational and exploitable. We believe the value rotation is in its early stages.
Mutual fund investing involves risk. Principal loss is possible. Investments in small-cap companies involve additional risks such as limited liquidity and greater volatility than larger companies. Investments in foreign securities involve political, economic and currency risks, greater volatility and differences in accounting methods. These risks are greater for investments in emerging markets. The Fund may have emphasis on a specific sector which could adversely affect a fund to a greater extent than if its emphasis was less. The Fund may invest in securities which are less liquid and more difficult to sell than more liquid securities. The value investing style may over time go in and out of favor. At times when the value investing style is out of favor, the Small Cap Value Fund may underperform other funds that use different investing styles. Investments in REITs are subject to the risks associated with the direct ownership of real estate.
The Pzena Funds are distributed by Quasar Distributors, LLC.
Fund holdings, exposures and characteristics are as of the date shown and are subject to change at any time. Please refer to the Schedule of Investments for more information. The opinions expressed in this letter are those of the Fund manager, are subject to change, are not guaranteed, and should not be considered recommendations to buy or sell any security.
The Russell 2000® Value Index measures the performance of those Russell 2000® companies with lower price-to-book ratios and lower forecasted growth values. The index cannot be invested in directly.
EBITDA, or earnings before interest, taxes, depreciation, and amortization, is a measure of profitability.
Net interest margin is a measure of the difference between the interest income generated by banks or other financial institutions and the amount of interest paid out to their lenders, relative to the amount of their assets.
Basis point – One-hundredth of a percentage point (0.01%).
Cash flow – net amount of cash being transferred into and out of a business.
Working capital – the difference between current assets and current liabilities.
8
Pzena International Small Cap Value Fund
Commentary
August 2021
Average Annual Total Returns for the Semi-Annual Period Ended August 31, 2021.
| Since | |||||
| Three | Six | One | Three | Inception | |
Months(1) | Months(1) | Year(1) | Years | (7/2/2018) | |
| Pzena International Small Cap Value Fund – Investor Class (PZVIX) | -0.46% | 14.13% | 52.64% | 4.10% | 4.21% |
| Pzena International Small Cap Value Fund – Institutional Class (PZIIX) | -0.37% | 14.33% | 53.14% | 4.36% | 4.49% |
| MSCI World ex-USA Small Cap Index | 2.60% | 11.63% | 33.13% | 10.49% | 10.41% |
| MSCI World ex-USA Small Cap Value Index | 0.65% | 11.38% | 36.28% | 7.54% | 7.56% |
| (1) | Not annualized. |
Performance data quoted represents past performance and does not guarantee future results. The investment return and principal value of an investment will fluctuate so that an investor’s shares, when redeemed, may be worth more or less than their original cost. Current performance of the Fund may be lower or higher than the performance quoted. Performance data current to the most recent month-end may be obtained by calling 844.PZN.1996 (844.796.1996).
PZVIX Expense Ratio – Gross: 8.29%
PZVIX Expense Ratio – Net: 1.53%*
PZIIX Expense Ratio – Gross: 7.94%
PZIIX Expense Ratio – Net: 1.18%*
Expense ratios shown are as of the Fund’s registration statement dated June 28, 2021.
| * | Pzena Investment Management, LLC, the Fund’s investment adviser, has contractually agreed to waive a portion or all of its management fees and pay Fund expenses through at least June 28, 2022. |
International equity markets continued to ascend in the spring, with European stocks performing well, while Japanese equities declined modestly, partially due to a deteriorating COVID-19 situation in the country. Investor sentiment abruptly shifted toward growth, mostly in the month of June, on concerns about the spread of the COVID-19 Delta variant, as well as flattening yield curves. Nonetheless, developed small cap value stocks ended the period on a high note, spurred on by improving macro conditions and rising interest rates, as well as positive economic data out of Europe. Despite the brief summer setback for value, the Fund outperformed its benchmark over the full period, with industrials the clear standout performer, driving the bulk of the portfolio’s gains.
The top individual performer in the period was Hong Kong-based dry bulk shipper Pacific Basin, which continued to benefit from higher shipping rates on many of its key routes, largely stemming from supply chain bottlenecks and port congestion. The company’s 1H results in July reinforced investors’ positive sentiment on the sector, while the industry’s container ship order book remained muted, despite the massive influx of cash from surging spot freight rates, implying sustainably strong free cash flow going forward. Italian engineering & construction company Maire Tecnimont’s shares benefitted from general European macro strength in early June, particularly after Italy revised its 1Q GDP number higher. The company also reported 1H21 results that highlighted a return to growth, margin improvement stemming from structural cost cuts taken during the downturn, as well as a particularly strong backlog with a book-to-bill ratio of 1.7x. Italian specialty steel equipment company Danieli also benefited from rallying metals prices on increasing global demand and tighter supply.
Energy was the largest detracting sector due to the crude price volatility, followed by consumer discretionary and consumer staples. The company, Foster Electric Co., a Japanese manufacturer of audio and electronic equipment, was the worst performer after reporting full-year group revenue and net income below expectations. The deteriorating macro environment in Japan also pressured the stock during the period. European oil & gas equipment services company Subsea 7 sold off after reporting results that disappointed investors on the margin front. Management attributed the weakness to persistent COVID-19-related issues causing delays and elevated costs, but they expect margins to recover in the back half of the year as low-margin projects that were booked during the downturn start to roll off. The stock also came under pressure in August due to lower crude prices, which fell on demand concerns and dollar strength. UK oil services company John Wood Group underperformed after management provided investors with a disappointing first half trading statement, which hurt the stock. The company’s earnings for the second half, however, are expected to improve materially, benefiting from a combination of better mix and cost savings, despite the ongoing revenue headwind.
During the quarter we purchased United Integrated Services, a Taiwanese engineering & construction (E&C) company specializing in integrated cleanroom construction, and major supplier to TSMC. We also added BIC, which maintains an 80% market share in U.S. pocket lighters, UK-based aerospace component supplier Senior plc, and Sabre Insurance Group, a private motor-only insurer that focuses on the specialty segment. Sabre is attractive due to the competitive edge it
9
Pzena International Small Cap Value Fund
Commentary (Continued)
August 2021
possesses by serving higher premium, non-standard customers, which manifests in a consistently better combined ratio versus peers. Sabre’s management is also keenly focused on profitability over top-line growth; the company has essentially no leverage and a dividend yield north of 4%. We sold out of PostNL and Redde Northgate on valuation, as well as Vienna Insurance Group, after we became concerned about the company’s M&A strategy.
The eurozone and UK’s economic recoveries continue to gain pace, as the region’s vaccination rate recently surpassed that of the United States, while the situation in Japan is also progressing, providing governments with the confidence to further relax restrictions. That said, the portfolio remains deeply undervalued, with price-to-book spreads between the cheapest and most expensive stocks still at extreme levels, implying that the value rally still has plenty of steam.
Mutual fund investing involves risk. Principal loss is possible. Investments in small- and mid-cap companies involve additional risks such as limited liquidity and greater volatility than larger companies. Investments in foreign securities involve political, economic and currency risks, greater volatility and differences in accounting methods. These risks are greater for investments in emerging markets. The Fund may have emphasis on a specific sector which could adversely affect a fund to a greater extent than if its emphasis was less. The Fund may invest in securities which are less liquid and more difficult to sell than more liquid securities. The Fund may invest in participatory notes which are a type of equity linked derivative and involve counterparty risk and risk that the performance of the security may not exactly match the performance of the issuer. Investments in REITs are subject to the risks associated with the direct ownership of real estate.
The Pzena Funds are distributed by Quasar Distributors, LLC.
Fund holdings, exposures and characteristics are as of the date shown and are subject to change at any time. Please refer to the Schedule of Investments for more information.
The opinions expressed in this letter are those of the Fund manager, are subject to change, are not guaranteed, and should not be considered recommendations to buy or sell any security.
The MSCI World ex USA Small Cap Index captures small cap representation across 22 of 23 Developed Markets (DM) countries* (excluding the United States). The index covers approximately 14% of the free float-adjusted market capitalization in each country. *DM countries in this index include: Australia, Austria, Belgium, Canada, Denmark, Finland, France, Germany, Hong Kong, Ireland, Israel, Italy, Japan, Netherlands, New Zealand, Norway, Portugal, Singapore, Spain, Sweden, Switzerland and the UK.
The MSCI World ex USA Small Cap Value Index captures small cap securities exhibiting overall value style characteristics across 22 Developed Markets countries. The value investment style characteristics for index construction are defined using three variables: book value to price, 12-month forward earnings to price and dividend yield.
Free cash flow – cash available after spending on capital goods and changes in working capital.
Dividend yield – A ratio that indicates how much a company pays out in dividends each year relative to its share price.
Price to book (P/B ratio) – A ratio for valuing a company that measures its current share price relative to its book value per share.
10
Pzena International Value Fund
Commentary
August 2021
Average Annual Total Returns for the Semi-Annual Period Ended August 31, 2021.
| Since | |
| Inception | |
(6/28/2021)(1) | |
| Pzena International Value Fund – Investor Class (PZVNX) | -0.80% |
| Pzena International Value Fund – Institutional Class (PZINX) | -0.70% |
| MSCI EAFE Index | 1.47% |
| MSCI EAFE Value Index | -0.35% |
| (1) | Not annualized. |
Performance data quoted represents past performance and does not guarantee future results. The investment return and principal value of an investment will fluctuate so that an investor’s shares, when redeemed, may be worth more or less than their original cost. Current performance of the Fund may be lower or higher than the performance quoted. Performance data current to the most recent month-end may be obtained by calling 844.PZN.1996 (844.796.1996).
PZVNX Expense Ratio – Gross: 5.33%
PZVNX Expense Ratio – Net: 1.10%*
PZIIX Expense Ratio – Gross: 4.98%
PZIIX Expense Ratio – Net: 0.75*
Expense ratios shown are as of the Fund’s registration statement dated June 28, 2021.
| * | Pzena Investment Management, LLC, the Fund’s investment adviser, has contractually agreed to waive a portion or all of its management fees and pay Fund expenses through at least June 28, 2023. |
The Pzena International Value Fund launched on June 28, 2021. The discussion below covers the period from inception through August. Over this time the MSCI EAFE Index was up 1.47% while the MSCI EAFE Value Index was down 0.35%.
Three of the Fund’s largest detractors were oilfield services company TechnipFMC, Honda Motor Co., and Galaxy Entertainment Group Limited. TechnipFMC’s shares came under pressure despite posting solid quarterly results, after investors became concerned about the company’s prospects for revenue growth, with book-to-bill remaining under 1x, as orders were still 40% below pre-COVID levels. Automobile manufacturer Honda Motor was weak, despite reporting solid quarterly results, as supply chain challenges and chip shortages continue to weigh on the stock. Macau casino operator Galaxy Entertainment Group shares continued to decline amid delayed re-openings. Galaxy did show a net profit in first-half 2021, compared with net losses at Macau peers. New outbreaks continue to slow the pace of Macau’s recovery, but we remain constructive based on pent up demand, its asset quality, its net-cash balance sheet, and its large land bank.
Three of the largest contributors were John Wood Group PLC, J Sainsbury plc, and European telecom equipment company Nokia. UK oil services company John Wood Group rebounded strongly, helped by management’s upbeat guidance for the second half of 2021, with expected margins coming in ahead of the street’s estimates. UK grocer Sainsbury’s stock spiked on private equity buyout speculation. Nokia’s stock was higher after the company reported earnings ahead of consensus across the board, with sales rising 9% year-over-year on solid margins, reflecting good cost control and scale benefits. Management subsequently raised its full-year sales and free cash flow guidance.
The value recovery has taken a pause following remarkably strong moves from November through May. We view our portfolio holdings as very well positioned to achieve strong earnings improvement over the medium term, as they benefit from both self-help initiatives and a pronounced external demand recovery post-COVID-19. We believe the valuation gap between our portfolio and the market remains at extreme levels, which bodes well for future returns.
The Fund’s portfolio will generally consist of 60 to 80 stocks identified through a research-driven, bottom-up security selection process based on thorough fundamental research. The Fund seeks to invest in stocks that sell at a substantial discount to their intrinsic value but have solid long-term prospects.
The Fund may invest up to 15% of its net assets in emerging market and frontier market securities.
In evaluating an investment for purchase for the International Value Fund, we conduct a thorough fundamental assessment of the business, with a focus on those challenges that have created the value opportunity. We examine material issues that can influence the company’s long-term performance and risk profile. As a part of this process, we speak with competitors, customers, and suppliers; conduct field research such as site visits to plants, stores, or other facilities; analyze the financials and public filings of the company and its competitors; focus on the company’s underlying financial condition and business prospects considering estimated earnings, economic conditions, degree of competitive or pricing pressures, the experience and
11
Pzena International Value Fund
Commentary (Continued)
August 2021
competence of management; and integrate environmental, social, and governance (“ESG”) considerations, which can vary across companies and industries (ESG considerations may include, but are not limited to, environmental impact, corporate governance and ethical business practices).
Each step of this process contributes to our determination of whether to invest and at what position size. Once an investment has been made, we continue to engage with the company on an ongoing basis to exert a constructive, long-term oriented influence on the trajectory of the company. Our sell discipline is guided by the same process with which we originally screen the investment universe. We typically sell a security when it reaches what we judge to be fair value, there are more attractive opportunities, or there is a change in company fundamentals.
Mutual fund investing involves risk. Principal loss is possible. Investments in small-cap companies involve additional risks such as limited liquidity and greater volatility than larger companies. Investments in foreign securities involve political, economic and currency risks, greater volatility and differences in accounting methods. These risks are greater for investments in emerging markets. The Fund may have emphasis on a specific sector which could adversely affect a fund to a greater extent than if its emphasis was less. The Fund may invest in securities which are less liquid and more difficult to sell than more liquid securities. The value investing style may over time go in and out of favor. At times when the value investing style is out of favor, the International Value Fund may underperform other funds that use different investing styles. Investments in REITs are subject to the risks associated with the direct ownership of real estate.
The Pzena Funds are distributed by Quasar Distributors, LLC.
Fund holdings, exposures and characteristics are as of the date shown and are subject to change at any time. Please refer to the Schedule of Investments for more information. The opinions expressed in this letter are those of the Fund manager, are subject to change, are not guaranteed, and should not be considered recommendations to buy or sell any security.
MSCI EAFE Index (Europe, Australasia, Far East) is a free float-adjusted market capitalization index that is designed to measure the equity market performance of developed markets, excluding the U.S. & Canada, and provides equity returns including dividends net of withholding tax rates as calculated by MSCI.
MSCI EAFE Value Index captures large and mid-cap securities exhibiting overall value style characteristics across Developed Markets countries around the world, excluding the U.S. and Canada, and provides equity returns including dividends net of withholding tax rates as calculated by MSCI. The index targets 50% coverage of the free float-adjusted market capitalization of the MSCI EAFE Index.
12
Pzena Mid Cap Value Fund
Portfolio Allocation
August 31, 2021 (Unaudited)
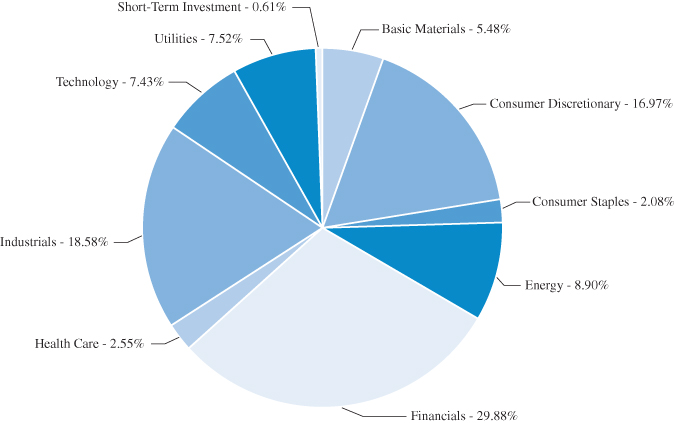
The portfolio’s holdings and allocations are subject to change. The percentages are of total investments as of August 31, 2021.
Note: For presentation purposes, the Fund has grouped some of the industry categories. For purposes of categorizing securities for compliance with Section 8(b)(1) of the Investment Company Act of 1940, as amended, the Fund uses more specific industry classifications.
13
Pzena Mid Cap Value Fund
Schedule of Investments
August 31, 2021 (Unaudited)
| Shares | Fair Value | |||||||
| COMMON STOCKS – 99.39% | ||||||||
| Basic Materials – 5.48% | ||||||||
| Dow, Inc. | 38,374 | $ | 2,413,724 | |||||
| Olin Corp. | 98,426 | 4,905,552 | ||||||
7,319,276 | ||||||||
| Consumer Discretionary – 16.97% | ||||||||
| Ford Motor Co. (a) | 216,287 | 2,818,220 | ||||||
| Gap, Inc. | 68,905 | 1,841,831 | ||||||
| Gildan Activewear, Inc. (b) | 107,191 | 4,121,494 | ||||||
| Lear Corp. | 25,918 | 4,145,325 | ||||||
| Newell Brands, Inc. | 147,029 | 3,736,007 | ||||||
| PVH Corp. (a) | 31,602 | 3,311,573 | ||||||
| Skechers U.S.A., Inc. – Class A (a) | 53,101 | 2,677,883 | ||||||
22,652,333 | ||||||||
| Consumer Staples – 2.08% | ||||||||
| McKesson Corp. | 13,592 | 2,774,671 | ||||||
| Energy – 8.90% | ||||||||
| Baker Hughes, a GE Co. | 165,391 | 3,767,607 | ||||||
| Cenovus Energy, Inc. (b) | 127,614 | 1,056,644 | ||||||
| Halliburton Co. | 201,466 | 4,025,291 | ||||||
| NOV, Inc. (a) | 165,627 | 2,181,307 | ||||||
| TechnipFMC PLC – ADR (a) | 129,300 | 857,259 | ||||||
11,888,108 | ||||||||
| Financials – 29.88% | ||||||||
| American International Group, Inc. | 114,268 | 6,234,462 | ||||||
| Axis Capital Holdings, Ltd. (b) | 87,872 | 4,496,410 | ||||||
| CNO Financial Group, Inc. | 155,643 | 3,807,028 | ||||||
| Equitable Holdings, Inc. | 140,915 | 4,369,774 | ||||||
| Fifth Third Bancorp | 106,123 | 4,123,940 | ||||||
| Invesco, Ltd. (b) | 101,065 | 2,558,966 | ||||||
| KeyCorp | 194,784 | 3,958,011 | ||||||
| Regions Financial Corp. | 195,608 | 3,996,271 | ||||||
| Reinsurance Group of America, Inc. | 26,750 | 3,098,185 | ||||||
| Voya Financial, Inc. | 49,988 | 3,248,220 | ||||||
39,891,267 | ||||||||
| Health Care – 2.55% | ||||||||
| Cardinal Health, Inc. | 28,137 | 1,476,911 | ||||||
| Fresenius Medical | ||||||||
| Care AG & Co. KGaA – ADR | 49,838 | 1,922,750 | ||||||
3,399,661 | ||||||||
| Industrials – 18.58% | ||||||||
| JELD-WEN Holding, Inc. (a) | 161,972 | $ | 4,460,709 | |||||
| MasTec, Inc. (a) | 23,374 | 2,137,319 | ||||||
| Mohawk Industries, Inc. (a) | 13,079 | 2,586,503 | ||||||
| Ryder System, Inc. | 34,961 | 2,779,050 | ||||||
| Terex Corp. | 81,220 | 4,146,281 | ||||||
| Textron, Inc. | 45,051 | 3,273,856 | ||||||
| Wabtec Corp. | 60,314 | 5,415,594 | ||||||
24,799,312 | ||||||||
| Technology – 7.43% | ||||||||
| Avnet, Inc. | 112,980 | 4,571,171 | ||||||
| Cognizant Technology | ||||||||
| Solutions Corp. – Class A | 34,337 | 2,620,257 | ||||||
| Hewlett Packard Enterprise Co. | 176,868 | 2,734,379 | ||||||
9,925,807 | ||||||||
| Utilities – 7.52% | ||||||||
| Edison International | 78,000 | 4,511,520 | ||||||
| NRG Energy, Inc. | 121,174 | 5,534,017 | ||||||
10,045,537 | ||||||||
| Total Common Stocks | ||||||||
| (Cost $88,109,328) | 132,695,972 | |||||||
| SHORT-TERM INVESTMENT – 0.61% | ||||||||
| Money Market Fund – 0.61% | ||||||||
| Fidelity Institutional Government | ||||||||
| Portfolio – Class I, 0.01% (c) | 814,609 | 814,609 | ||||||
| Total Short-Term Investment | ||||||||
| (Cost $814,609) | 814,609 | |||||||
| Total Investments | ||||||||
| (Cost $88,923,937) – 100.00% | 133,510,581 | |||||||
| Liabilities in Excess | ||||||||
| of Other Assets – (0.00)% | (5,345 | ) | ||||||
| TOTAL NET ASSETS – 100.00% | $ | 133,505,236 | ||||||
Percentages are stated as a percent of net assets.
| ADR | American Depositary Receipt |
| PLC | Public Limited Company |
| (a) | Non-income producing security. |
| (b) | Foreign issued security. |
| (c) | The rate listed is the 7-day annualized yield as of August 31, 2021. |
Note: For presentation purposes, the Fund has grouped some of the industry categories. For purposes of categorizing securities for compliance with Section 8(b)(1) of the Investment Company Act of 1940, as amended, the Fund uses more specific industry classifications.
The accompanying notes are an integral part of these financial statements.
14
Pzena Emerging Markets Value Fund
Portfolio Allocation
August 31, 2021 (Unaudited)
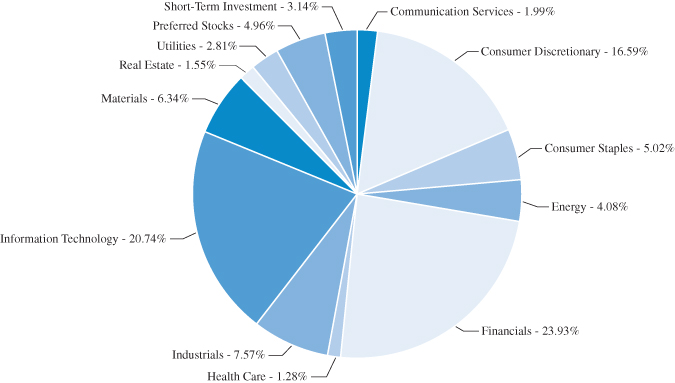
The portfolio’s holdings and allocations are subject to change. The percentages are of total investments as of August 31, 2021.
15
Pzena Emerging Markets Value Fund
Schedule of Investments
August 31, 2021 (Unaudited)
| Shares | Fair Value | |||||||
| COMMON STOCKS – 91.47% | ||||||||
| Brazil – 3.79% | ||||||||
| Ambev S.A. | 4,881,300 | $ | 16,001,012 | |||||
| Light S.A. | 1,275,300 | 3,408,495 | ||||||
19,409,507 | ||||||||
| China – 12.73% | ||||||||
| Alibaba Group Holding, Ltd. (a) | 464,400 | 9,882,185 | ||||||
| Baidu, Inc. – ADR (a) | 43,028 | 6,756,257 | ||||||
| Baidu, Inc. – Class A (a) | 171,850 | 3,376,258 | ||||||
| Brilliance China Automotive | ||||||||
| Holdings, Ltd. (a)(b) | 4,202,000 | 5,403 | ||||||
| China Construction Bank Corp. | 8,220,000 | 5,939,787 | ||||||
| China Overseas | ||||||||
| Land & Investment, Ltd. | 3,418,500 | 7,867,765 | ||||||
| Dongfeng Motor Group Co., Ltd. | 4,960,000 | 5,433,555 | ||||||
| Grand Baoxin Auto Group, Ltd. (a) | 10,102,000 | 1,454,749 | ||||||
| Lenovo Group, Ltd. | 6,446,000 | 7,144,311 | ||||||
| Trip.com Group, Ltd. – ADR (a) | 566,621 | 17,276,274 | ||||||
65,136,544 | ||||||||
| Czech Republic – 2.13% | ||||||||
| CEZ | 345,639 | 10,893,613 | ||||||
| Hong Kong – 10.72% | ||||||||
| Galaxy Entertainment Group, Ltd. (a) | 2,337,000 | 14,979,132 | ||||||
| Pacific Basin Shipping, Ltd. | 46,798,000 | 25,572,842 | ||||||
| VTech Holdings, Ltd. | 502,300 | 4,879,332 | ||||||
| Yue Yuen Industrial (Holdings), Ltd. (a) | 4,640,500 | 9,415,309 | ||||||
54,816,615 | ||||||||
| Hungary – 2.35% | ||||||||
| OTP Bank PLC (a) | 199,463 | 12,044,175 | ||||||
| India – 5.49% | ||||||||
| Aurobindo Pharma, Ltd. | 654,186 | 6,516,995 | ||||||
| ICICI Bank, Ltd. | 270,321 | 2,662,388 | ||||||
| Shriram Transport Finance Co., Ltd. | 547,364 | 10,141,688 | ||||||
| State Bank of India | 831,695 | 4,853,524 | ||||||
| State Bank of India – GDR | 67,053 | 3,922,600 | ||||||
28,097,195 | ||||||||
| Indonesia – 0.83% | ||||||||
| PT Bank Mandiri (Persero) Tbk | 9,985,100 | 4,270,577 | ||||||
| Malaysia – 0.72% | ||||||||
| Genting Malaysia Berhad | 5,181,300 | 3,701,819 | ||||||
| Republic of Korea – 16.18% | ||||||||
| DB Insurance Co., Ltd. | 324,990 | 16,453,416 | ||||||
| Hankook Tire & Technology Co., Ltd. | 333,689 | 13,411,451 | ||||||
| Hyundai Motor Co. | 11,880 | 2,177,326 | ||||||
| KB Financial Group, Inc. | 90,180 | 4,114,470 | ||||||
| Korea Shipbuilding & Offshore | ||||||||
| Engineering Co., Ltd. (a) | 57,613 | 5,888,258 | ||||||
| POSCO | 62,685 | 18,219,712 | ||||||
| Samsung Electronics Co., Ltd. | 231,857 | 15,337,817 | ||||||
| Shinhan Financial Group Co., Ltd. | 213,350 | 7,148,775 | ||||||
82,751,225 | ||||||||
| Romania – 1.01% | ||||||||
| Banca Transilvania S.A. | 7,261,053 | 5,151,408 | ||||||
| Russian Federation – 4.06% | ||||||||
| LUKOIL PJSC – ADR | 216,956 | 18,389,190 | ||||||
| Rosneft Oil Co. – GDR | 328,363 | 2,370,781 | ||||||
20,759,971 | ||||||||
| Singapore – 1.87% | ||||||||
| Wilmar International, Ltd. | 3,105,400 | 9,562,539 | ||||||
| South Africa – 2.69% | ||||||||
| Reunert, Ltd. | 826,836 | 2,970,661 | ||||||
| Sasol, Ltd. (a) | 698,541 | 10,771,754 | ||||||
13,742,415 | ||||||||
| Taiwan – 11.89% | ||||||||
| Catcher Technology Co., Ltd. | 864,000 | 5,206,415 | ||||||
| Compal Electronics, Inc. | 9,096,000 | 7,516,135 | ||||||
| Hon Hai Precision Industry Co., Ltd. | 3,980,132 | 15,941,496 | ||||||
| Lite-On Technology Corp. | 4,702,000 | 10,383,474 | ||||||
| Taiwan Semiconductor | ||||||||
| Manufacturing Co., Ltd. | 796,000 | 17,635,593 | ||||||
| United Integrated Services Co., Ltd. | 576,000 | 4,136,035 | ||||||
60,819,148 | ||||||||
| Thailand – 3.44% | ||||||||
| Bangkok Bank Public Co., Ltd. | 786,900 | 2,783,110 | ||||||
| Bangkok Bank Public Co., Ltd. – NVDR | 656,900 | 2,323,326 | ||||||
| Siam Commercial Bank PLC – NVDR | 3,781,900 | 12,495,846 | ||||||
17,602,282 | ||||||||
| Turkey – 2.42% | ||||||||
| Akbank T.A.S. | 7,919,313 | 5,608,700 | ||||||
| Ford Otomotiv Sanayi A.S. | 246,733 | 5,096,943 | ||||||
| Tofas Turk Otomobil Fabrikasi A.S. | 327,353 | 1,653,986 | ||||||
12,359,629 | ||||||||
The accompanying notes are an integral part of these financial statements.
16
Pzena Emerging Markets Value Fund
Schedule of Investments (Continued)
August 31, 2021 (Unaudited)
| Shares | Fair Value | |||||||
| COMMON STOCKS – 91.47% (Continued) | ||||||||
| United Arab Emirates – 2.02% | ||||||||
| Abu Dhabi Commercial Bank PJSC | 5,047,582 | $ | 10,320,118 | |||||
| United Kingdom – 2.91% | ||||||||
| Antofagasta PLC | 163,366 | 3,270,240 | ||||||
| Standard Chartered PLC | 1,859,820 | 11,629,149 | ||||||
14,899,389 | ||||||||
| United States – 4.22% | ||||||||
| Cognizant Technology | ||||||||
| Solutions Corp. – Class A | 186,351 | 14,220,445 | ||||||
| Flex, Ltd. (a) | 396,162 | 7,360,690 | ||||||
21,581,135 | ||||||||
| Total Common Stocks | ||||||||
| (Cost $404,501,388) | 467,949,304 | |||||||
| PREFERRED STOCKS – 4.94% | ||||||||
| Brazil – 4.52% | ||||||||
| Cia Energetica de Minas Gerais, 6.64% | 6,165,617 | 15,978,042 | ||||||
| Itau Unibanco Holding S.A., 2.29% | 1,201,443 | 7,144,808 | ||||||
23,122,850 | ||||||||
| Republic of Korea – 0.42% | ||||||||
| Hyundai Motor Co., 3.95% | 24,063 | 2,127,265 | ||||||
| Total Preferred Stocks | ||||||||
| (Cost $22,009,888) | 25,250,115 | |||||||
| SHORT-TERM INVESTMENT – 3.12% | ||||||||
| Money Market Fund – 3.12% | ||||||||
| Fidelity Institutional Government | ||||||||
| Portfolio – Class I, 0.01% (c) | 15,979,641 | 15,979,641 | ||||||
| Total Short-Term Investment | ||||||||
| (Cost $15,979,641) | 15,979,641 | |||||||
| Total Investments | ||||||||
| (Cost $442,490,917) – 99.53% | 509,179,060 | |||||||
| Other Assets in Excess | ||||||||
| of Liabilities – 0.47% | 2,408,772 | |||||||
| TOTAL NET ASSETS – 100.00% | $ | 511,587,832 | ||||||
Percentages are stated as a percent of net assets.
| ADR | American Depository Receipt |
| GDR | Global Depository Receipt |
| NVDR | Non-voting Depository Receipt |
| PJSC | Private Joint Stock Company |
| PLC | Public Limited Company |
| S.A. | Société Anonyme |
| (a) | Non-income producing security. |
| (b) | Value determined using significant unobservable inputs. |
| (c) | The rate listed is the 7-day annualized yield as of August 31, 2021. |
The accompanying notes are an integral part of these financial statements.
17
Pzena Emerging Markets Value Fund
Portfolio Diversification
August 31, 2021 (Unaudited)
| Fair | % of | |||||||
| Value | Net Assets | |||||||
| COMMON STOCKS | ||||||||
Communication Services | $ | 10,132,515 | 1.98 | % | ||||
Consumer Discretionary | 84,488,131 | 16.51 | % | |||||
Consumer Staples | 25,563,552 | 5.00 | % | |||||
Energy | 20,759,971 | 4.06 | % | |||||
Financials | 121,863,058 | 23.82 | % | |||||
Health Care | 6,516,995 | 1.27 | % | |||||
Industrials | 38,567,796 | 7.54 | % | |||||
Information Technology | 105,625,708 | 20.65 | % | |||||
Materials | 32,261,705 | 6.31 | % | |||||
Real Estate | 7,867,765 | 1.54 | % | |||||
Utilities | 14,302,108 | 2.79 | % | |||||
| Total Common Stocks | 467,949,304 | 91.47 | % | |||||
| PREFERRED STOCKS | ||||||||
Consumer Discretionary | 2,127,265 | 0.42 | % | |||||
Financials | 7,144,808 | 1.40 | % | |||||
Utilities | 15,978,042 | 3.12 | % | |||||
| Total Preferred Stocks | 25,250,115 | 4.94 | % | |||||
| Short-Term Investment | 15,979,641 | 3.12 | % | |||||
| Total Investments | 509,179,060 | 99.53 | % | |||||
| Other Assets in | ||||||||
| Excess of Liabilities | 2,408,772 | 0.47 | % | |||||
| Total Net Assets | $ | 511,587,832 | 100.00 | % | ||||
The Global Industry Classification Standard (GICS®) was developed by and/or is the exclusive property of MSCI, Inc. and Standard & Poor’s Financial Services LLC (“S&P”). GICS is a service mark of MSCI and S&P and has been licensed for use by Pzena Investment Management, LLC.
The accompanying notes are an integral part of these financial statements.
18
Pzena Small Cap Value Fund
Portfolio Allocation
August 31, 2021 (Unaudited)
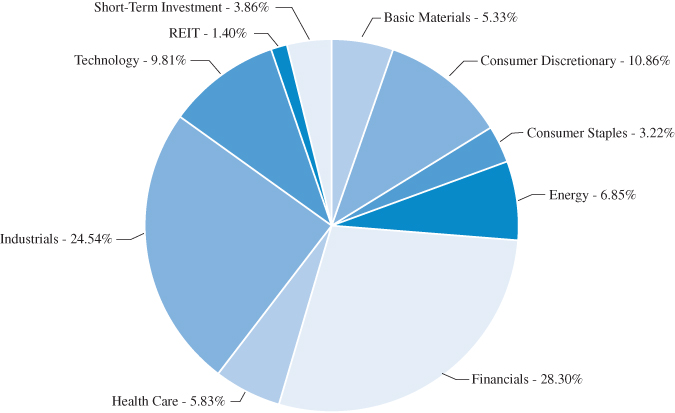
The portfolio’s holdings and allocations are subject to change. The percentages are of total investments as of August 31, 2021.
Note: For presentation purposes, the Fund has grouped some of the industry categories. For purposes of categorizing securities for compliance with Section 8(b)(1) of the Investment Company Act of 1940, as amended, the Fund uses more specific industry classifications.
19
Pzena Small Cap Value Fund
Schedule of Investments
August 31, 2021 (Unaudited)
| Shares | Fair Value | |||||||
| COMMON STOCKS – 94.71% | ||||||||
| Basic Materials – 5.33% | ||||||||
| Olin Corp. | 73,416 | $ | 3,659,054 | |||||
| Orion Engineered Carbons S.A. (a) | 108,205 | 1,911,982 | ||||||
5,571,036 | ||||||||
| Consumer Discretionary – 10.86% | ||||||||
| Dana, Inc. | 128,122 | 2,980,118 | ||||||
| Hooker Furniture Corp. | 44,676 | 1,392,104 | ||||||
| Motorcar Parts of America, Inc. (a) | 72,226 | 1,431,519 | ||||||
| PVH Corp. (a) | 23,140 | 2,424,841 | ||||||
| Steelcase, Inc. | 221,478 | 3,120,625 | ||||||
11,349,207 | ||||||||
| Consumer Staples – 3.21% | ||||||||
| Spectrum Brands Holdings, Inc. | 19,278 | 1,504,841 | ||||||
| Universal Corp. | 36,666 | 1,855,299 | ||||||
3,360,140 | ||||||||
| Energy – 6.85% | ||||||||
| MRC Global, Inc. (a) | 119,344 | 978,621 | ||||||
| Murphy Oil Corp. | 77,006 | 1,637,147 | ||||||
| NexTier Oilfield Solutions, Inc. (a) | 585,532 | 2,107,915 | ||||||
| NOV, Inc. (a) | 111,146 | 1,463,793 | ||||||
| TechnipFMC PLC (a)(b) | 147,403 | 977,282 | ||||||
7,164,758 | ||||||||
| Financials – 28.30% | ||||||||
| American Equity Investment | ||||||||
| Life Holding Co. | 77,690 | 2,461,996 | ||||||
| Argo Group International | ||||||||
| Holdings, Ltd. (b) | 38,474 | 2,035,275 | ||||||
| Associated Banc-Corp. | 147,400 | 3,039,388 | ||||||
| Axis Capital Holdings, Ltd. (b) | 63,304 | 3,239,266 | ||||||
| CNO Financial Group, Inc. | 144,492 | 3,534,274 | ||||||
| First Midwest Bancorp, Inc. | 146,780 | 2,749,189 | ||||||
| Hope Bancorp, Inc. | 147,697 | 2,036,742 | ||||||
| Huntington Bancshares, Inc. | 137,926 | 2,141,991 | ||||||
| Umpqua Holdings Corp. | 101,807 | 1,982,182 | ||||||
| Univest Financial Corp. | 70,662 | 1,913,527 | ||||||
| Webster Financial Corp. | 61,395 | 3,101,675 | ||||||
| WSFS Financial Corp. | 29,654 | 1,346,588 | ||||||
29,582,093 | ||||||||
| Health Care – 5.83% | ||||||||
| Phibro Animal Health Corp. | 54,667 | 1,327,862 | ||||||
| Triple-S Management | ||||||||
| Corp. – Class B (a)(b) | 86,736 | 3,079,128 | ||||||
| Varex Imaging Corp. (a) | 57,673 | 1,682,321 | ||||||
6,089,311 | ||||||||
| Industrials – 24.53% | ||||||||
| Belden, Inc. | 69,824 | 3,997,424 | ||||||
| Enerpac Tool Group Corp. | 98,938 | 2,489,280 | ||||||
| JELD-WEN Holding, Inc. (a) | 129,417 | 3,564,144 | ||||||
| MasTec, Inc. (a) | 14,833 | 1,356,329 | ||||||
| Moog, Inc. – Class A | 22,384 | 1,778,185 | ||||||
| REV Group, Inc. | 131,516 | 2,138,450 | ||||||
| Ryder System, Inc. | 37,769 | 3,002,258 | ||||||
| Terex Corp. | 62,473 | 3,189,247 | ||||||
| TriMas Corp. (a) | 61,879 | 1,986,935 | ||||||
| TrueBlue, Inc. (a) | 78,385 | 2,142,262 | ||||||
25,644,514 | ||||||||
| Technology – 9.80% | ||||||||
| Avnet, Inc. | 58,114 | 2,351,293 | ||||||
| Celestica, Inc. (a)(b) | 355,436 | 3,376,642 | ||||||
| ScanSource, Inc. (a) | 72,966 | 2,596,130 | ||||||
| Super Micro Computer, Inc. (a) | 52,661 | 1,924,233 | ||||||
10,248,298 | ||||||||
| Total Common Stocks | ||||||||
| (Cost $80,990,345) | 99,009,357 | |||||||
| REIT – 1.40% | ||||||||
| Real Estate – 1.40% | ||||||||
| DiamondRock Hospitality Co. (a) | 161,454 | 1,459,544 | ||||||
| Total REIT | ||||||||
| (Cost $1,238,009) | 1,459,544 | |||||||
The accompanying notes are an integral part of these financial statements.
20
Pzena Small Cap Value Fund
Schedule of Investments (Continued)
August 31, 2021 (Unaudited)
| Shares | Fair Value | |||||||
| SHORT-TERM INVESTMENT – 3.86% | ||||||||
| Money Market Fund – 3.86% | ||||||||
| Fidelity Institutional Government | ||||||||
| Portfolio – Class I, 0.01% (c) | 4,032,739 | $ | 4,032,739 | |||||
| Total Short-Term Investment | ||||||||
| (Cost $4,032,739) | 4,032,739 | |||||||
| Total Investments | ||||||||
| (Cost $86,261,093) – 99.97% | 104,501,640 | |||||||
| Other Assets in Excess | ||||||||
| of Liabilities – 0.03% | 34,614 | |||||||
| TOTAL NET ASSETS – 100.00% | $ | 104,536,254 | ||||||
Percentages are stated as a percent of net assets.
| PLC | Public Limited Company |
| REIT | Real Estate Investment Trust |
| S.A. | Société Anonyme |
| (a) | Non-income producing security. |
| (b) | Foreign issued security. |
| (c) | The rate listed is the 7-day annualized yield as of August 31, 2021. |
Note: For presentation purposes, the Fund has grouped some of the industry categories. For purposes of categorizing securities for compliance with Section 8(b)(1) of the Investment Company Act of 1940, as amended, the Fund uses more specific industry classifications.
The accompanying notes are an integral part of these financial statements.
21
Pzena International Small Cap Value Fund
Portfolio Allocation
August 31, 2021 (Unaudited)
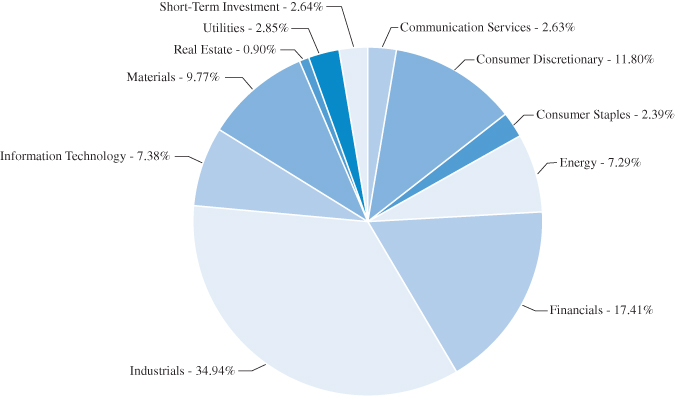
The portfolio’s holdings and allocations are subject to change. The percentages are of total investments as of August 31, 2021.
Note: For presentation purposes, the Fund has grouped some of the industry categories. For purposes of categorizing securities for compliance with Section 8(b)(1) of the Investment Company Act of 1940, as amended, the Fund uses more specific industry classifications.
22
Pzena International Small Cap Value Fund
Schedule of Investments
August 31, 2021 (Unaudited)
| Shares | Fair Value | |||||||
| COMMON STOCKS – 97.10% | ||||||||
| Austria – 1.95% | ||||||||
| ANDRITZ AG | 5,554 | $ | 319,106 | |||||
| Canada – 7.64% | ||||||||
| Celestica, Inc. (a) | 61,348 | 582,044 | ||||||
| Linamar Corp. | 6,241 | 353,590 | ||||||
| Transcontinental, Inc. – Class A | 16,153 | 312,651 | ||||||
1,248,285 | ||||||||
| France – 10.32% | ||||||||
| Ipsos | 8,844 | 428,144 | ||||||
| Rexel S.A. | 29,700 | 621,234 | ||||||
| SCOR SE | 10,521 | 322,865 | ||||||
| Societe BIC S.A. | 4,719 | 313,980 | ||||||
1,686,223 | ||||||||
| Germany – 6.76% | ||||||||
| Bertrandt AG | 2,636 | 150,176 | ||||||
| SAF-Holland S.A. (a) | 23,298 | 332,035 | ||||||
| Salzgitter AG (a) | 16,561 | 622,611 | ||||||
1,104,822 | ||||||||
| Hong Kong – 5.90% | ||||||||
| Pacific Basin Shipping, Ltd. | 614,000 | 335,521 | ||||||
| VTech Holdings, Ltd. | 31,100 | 302,105 | ||||||
| Yue Yuen Industrial (Holdings), Ltd. (a) | 161,000 | 326,660 | ||||||
964,286 | ||||||||
| Ireland – 4.39% | ||||||||
| Bank of Ireland Group PLC (a) | 52,209 | 328,325 | ||||||
| Origin Enterprises PLC | 98,406 | 389,246 | ||||||
717,571 | ||||||||
| Israel – 1.96% | ||||||||
| Ituran Location and Control, Ltd. – ADR | 12,258 | 319,811 | ||||||
| Italy – 9.46% | ||||||||
| Anima Holding S.p.A. | 81,243 | 418,820 | ||||||
| BPER Banca | 81,581 | 177,482 | ||||||
| Danieli & C Officine Meccaniche S.p.A. | 27,473 | 522,263 | ||||||
| Maire Tecnimont S.p.A. | 109,879 | 428,141 | ||||||
1,546,706 | ||||||||
| Japan – 14.64% | ||||||||
| DIC Corp. | 12,000 | 345,226 | ||||||
| Foster Electric Co., Ltd. | 36,734 | 290,159 | ||||||
| Fukuoka Financial Group, Inc. | 18,400 | 340,019 | ||||||
| Open House Co., Ltd. | 3,000 | 146,162 | ||||||
| Sankyu, Inc. | 7,200 | 335,736 | ||||||
| Tsubakimoto Chain Co. | 10,100 | 311,680 | ||||||
| Ube Industries, Ltd. | 15,500 | 312,635 | ||||||
| Zeon Corp. | 23,500 | 311,866 | ||||||
2,393,483 | ||||||||
| Netherlands – 4.09% | ||||||||
| Flow Traders | 3,331 | 135,691 | ||||||
| Koninklijke BAM Groep N.V. (a) | 117,872 | 389,140 | ||||||
| Technip Energies N.V. (a) | 6,243 | 81,565 | ||||||
| Technip Energies N.V. – ADR (a) | 4,760 | 61,499 | ||||||
667,895 | ||||||||
| Norway – 1.56% | ||||||||
| Subsea 7 S.A. | 33,601 | 255,923 | ||||||
| Republic of Korea – 4.74% | ||||||||
| DB Insurance Co., Ltd. | 9,592 | 485,618 | ||||||
| Hankook Tire & Technology Co., Ltd. | 7,179 | 288,535 | ||||||
774,153 | ||||||||
| Spain – 1.79% | ||||||||
| Unicaja Banco S.A. | 316,539 | 292,835 | ||||||
| Taiwan – 1.84% | ||||||||
| United Integrated Services Co., Ltd. | 42,000 | 301,586 | ||||||
| United Kingdom – 20.06% | ||||||||
| Balfour Beatty PLC | 112,522 | 442,446 | ||||||
| Capita PLC (a) | 491,788 | 331,036 | ||||||
| Drax Group PLC | 81,366 | 464,022 | ||||||
| Inchcape PLC | 26,335 | 332,921 | ||||||
| John Wood Group PLC (a) | 154,966 | 532,213 | ||||||
| Sabre Insurance Group PLC | 110,671 | 336,266 | ||||||
| Senior PLC (a) | 144,114 | 351,889 | ||||||
| TechnipFMC PLC (a) | 38,836 | 257,483 | ||||||
| Travis Perkins PLC | 9,301 | 230,364 | ||||||
3,278,640 | ||||||||
| Total Common Stocks | ||||||||
| (Cost $15,064,524) | 15,871,325 | |||||||
The accompanying notes are an integral part of these financial statements.
23
Pzena International Small Cap Value Fund
Schedule of Investments (Continued)
August 31, 2021 (Unaudited)
| Shares | Fair Value | |||||||
| SHORT-TERM INVESTMENT – 2.65% | ||||||||
| Money Market Fund – 2.65% | ||||||||
| Fidelity Institutional Government | ||||||||
| Portfolio – Class I, 0.01% (b) | 432,554 | $ | 432,554 | |||||
| Total Short-Term Investment | ||||||||
| (Cost $432,554) | 432,554 | |||||||
| Total Investments | ||||||||
| (Cost $15,497,078) – 99.75% | 16,303,879 | |||||||
| Other Assets in Excess | ||||||||
| of Liabilities – 0.25% | 41,661 | |||||||
| TOTAL NET ASSETS – 100.00% | $ | 16,345,540 | ||||||
Percentages are stated as a percent of net assets.
| ADR | American Depositary Receipt |
| AG | Aktiengesellschaft |
| N.V. | Naamloze Vennootschap |
| PLC | Public Limited Company |
| S.A. | Société Anonyme |
| S.p.A | Società per azioni |
| (a) | Non-income producing security. |
| (b) | The rate listed is the 7-day annualized yield as of August 31, 2021. |
The accompanying notes are an integral part of these financial statements.
24
Pzena International Small Cap Value Fund
Portfolio Diversification
August 31, 2021 (Unaudited)
| Fair | % of | |||||||
| Value | Net Assets | |||||||
| COMMON STOCKS | ||||||||
Communication Services | $ | 428,144 | 2.62 | % | ||||
Consumer Discretionary | 1,923,899 | 11.77 | % | |||||
Consumer Staples | 389,246 | 2.38 | % | |||||
Energy | 1,188,683 | 7.27 | % | |||||
Financials | 2,837,922 | 17.36 | % | |||||
Industrials | 5,696,949 | 34.85 | % | |||||
Information Technology | 1,203,960 | 7.37 | % | |||||
Materials | 1,592,338 | 9.74 | % | |||||
Real Estate | 146,162 | 0.90 | % | |||||
Utilities | 464,022 | 2.84 | % | |||||
| Total Common Stocks | 15,871,325 | 97.10 | % | |||||
| Short-Term Investment | 432,554 | 2.65 | % | |||||
| Total Investments | 16,303,879 | 99.75 | % | |||||
| Other Assets in Excess | ||||||||
| of Liabilities | 41,661 | 0.25 | % | |||||
| Total Net Assets | $ | 16,345,540 | 100.00 | % | ||||
Note: For presentation purposes, the Fund has grouped some of the industry categories. For purposes of categorizing securities for compliance with Section 8(b)(1) of the Investment Company Act of 1940, as amended, the Fund uses more specific industry classifications.
The Global Industry Classification Standard (GICS®) was developed by and/or is the exclusive property of MSCI, Inc. and Standard & Poor’s Financial Services LLC (“S&P”). GICS is a service mark of MSCI and S&P and has been licensed for use by Pzena Investment Management, LLC.
The accompanying notes are an integral part of these financial statements.
25
Pzena International Value Fund
Portfolio Allocation
August 31, 2021 (Unaudited)
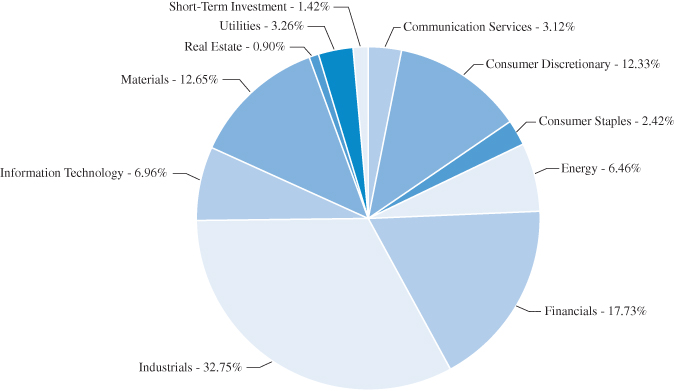
The portfolio’s holdings and allocations are subject to change. The percentages are of total investments as of August 31, 2021.
Note: For presentation purposes, the Fund has grouped some of the industry categories. For purposes of categorizing securities for compliance with Section 8(b)(1) of the Investment Company Act of 1940, as amended, the Fund uses more specific industry classifications.
26
Pzena International Value Fund
Schedule of Investments
August 31, 2021 (Unaudited)
| Shares | Fair Value | |||||||
| COMMON STOCKS – 95.13% | ||||||||
| Belgium – 0.89% | ||||||||
| KBC Group N.V. | 209 | $ | 17,605 | |||||
| Brazil – 1.85% | ||||||||
| Ambev S.A. – ADR | 11,264 | 36,721 | ||||||
| China – 0.86% | ||||||||
| Alibaba Group Holding, Ltd. (a) | 800 | 17,024 | ||||||
| Denmark – 3.28% | ||||||||
| AP Moller – Maersk A/S – Series B | 16 | 45,397 | ||||||
| Danske Bank A/S | 1,170 | 19,664 | ||||||
65,061 | ||||||||
| Finland – 2.75% | ||||||||
| Nokia Oyj – ADR (a) | 9,174 | 54,677 | ||||||
| France – 13.68% | ||||||||
| Amundi S.A. | 461 | 43,627 | ||||||
| Bouygues S.A. | 549 | 22,967 | ||||||
| Cie Generale des | ||||||||
| Etablissements Michelin SCA | 315 | 50,974 | ||||||
| Publicis Groupe | 478 | 31,335 | ||||||
| Rexel S.A. | 2,797 | 58,505 | ||||||
| Sanofi | 249 | 25,761 | ||||||
| Schneider Electric SE | 128 | 22,867 | ||||||
| SCOR SE | 503 | 15,436 | ||||||
271,472 | ||||||||
| Germany – 8.84% | ||||||||
| BASF SE | 728 | 56,320 | ||||||
| Covestro AG | 860 | 55,748 | ||||||
| Fresenius Medical Care AG & Co. KGaA | 477 | 36,631 | ||||||
| Siemens AG | 161 | 26,774 | ||||||
175,473 | ||||||||
| Hong Kong – 0.97% | ||||||||
| Galaxy Entertainment Group, Ltd. (a) | 3,000 | 19,229 | ||||||
| Italy – 1.96% | ||||||||
| Enel S.p.A | 4,279 | 38,990 | ||||||
| Japan – 16.80% | ||||||||
| Bridgestone Corp. | 400 | 18,412 | ||||||
| Fukuoka Financial Group, Inc. | 900 | 16,631 | ||||||
| Honda Motor Co., Ltd. | 1,600 | 48,604 | ||||||
| Iida Group Holdings Co., Ltd. | 800 | 20,332 | ||||||
| Isuzu Motors, Ltd. | 3,100 | 39,224 | ||||||
| Komatsu, Ltd. | 2,300 | 55,663 | ||||||
| Mitsui & Co., Ltd. | 900 | 19,871 | ||||||
| MS&AD Insurance Group Holdings, Inc. | 400 | 12,925 | ||||||
| Panasonic Corp. | 3,600 | 42,932 | ||||||
| Resona Holdings, Inc. | 4,000 | 15,478 | ||||||
| Sumitomo Mitsui Financial Group, Inc. | 600 | 20,730 | ||||||
| Suzuki Motor Corp. | 300 | 12,969 | ||||||
| T&D Holdings, Inc. | 800 | 9,708 | ||||||
333,479 | ||||||||
| Luxembourg – 1.17% | ||||||||
| ArcelorMittal S.A. | 690 | 23,134 | ||||||
| Netherlands – 2.70% | ||||||||
| ING Groep N.V. | 3,072 | 42,439 | ||||||
| Koninklijke KPN N.V. | 3,499 | 11,213 | ||||||
53,652 | ||||||||
| Republic of Korea – 3.10% | ||||||||
| POSCO – ADR (a) | 656 | 46,838 | ||||||
| Shinhan Financial | ||||||||
| Group Co., Ltd. – ADR (a) | 440 | 14,630 | ||||||
61,468 | ||||||||
| Singapore – 2.44% | ||||||||
| DBS Group Holdings, Ltd. | 900 | 20,062 | ||||||
| Wilmar International, Ltd. | 9,200 | 28,330 | ||||||
48,392 | ||||||||
| Spain – 1.30% | ||||||||
| CaixaBank S.A. | 8,273 | 25,710 | ||||||
| Switzerland – 8.25% | ||||||||
| Credit Suisse Group AG | 1,521 | 16,134 | ||||||
| Julius Baer Group, Ltd. | 166 | 11,348 | ||||||
| Novartis AG | 335 | 31,018 | ||||||
| Roche Holding AG | 153 | 61,442 | ||||||
| UBS Group AG | 2,631 | 43,900 | ||||||
163,842 | ||||||||
The accompanying notes are an integral part of these financial statements.
27
Pzena International Value Fund
Schedule of Investments (Continued)
August 31, 2021 (Unaudited)
| Shares | Fair Value | |||||||
| COMMON STOCKS – 95.13% (Continued) | ||||||||
| Taiwan – 2.40% | ||||||||
| Hon Hai Precision | ||||||||
| Industry Co., Ltd. – GDR | 6,000 | $ | 47,556 | |||||
| United Kingdom – 21.89% | ||||||||
| Aviva PLC | 3,644 | 20,245 | ||||||
| Barclays PLC | 8,666 | 22,030 | ||||||
| HSBC Holdings PLC | 6,949 | 36,897 | ||||||
| J Sainsbury PLC | 12,149 | 50,777 | ||||||
| John Wood Group PLC (a) | 14,282 | 49,050 | ||||||
| NatWest Group PLC | 7,231 | 21,186 | ||||||
| Royal Dutch Shell PLC – Class A | 2,803 | 55,681 | ||||||
| Standard Chartered PLC | 4,472 | 27,963 | ||||||
| TechnipFMC PLC (a) | 3,337 | 22,124 | ||||||
| Tesco PLC | 13,211 | 46,343 | ||||||
| Travis Perkins PLC | 2,113 | 52,335 | ||||||
| Vodafone Group PLC | 17,805 | 29,855 | ||||||
434,486 | ||||||||
| Total Common Stocks | ||||||||
| (Cost $1,901,910) | 1,887,971 | |||||||
| PREFERRED STOCK – 2.34% | ||||||||
| Germany – 2.34% | ||||||||
| Volkswagen AG, 2.41% | 195 | 46,349 | ||||||
| Total Preferred Stock | ||||||||
| (Cost $50,477) | 46,349 | |||||||
| SHORT-TERM INVESTMENT – 3.57% | ||||||||
| Money Market Fund – 3.57% | ||||||||
| Fidelity Institutional Government | ||||||||
| Portfolio – Class I, 0.01% (b) | 70,954 | 70,954 | ||||||
| Total Short-Term Investment | ||||||||
| (Cost $70,954) | 70,954 | |||||||
| Total Investments | ||||||||
| (Cost $2,023,341) – 101.04% | 2,005,274 | |||||||
| Liabilities in Excess | ||||||||
| of Other Assets – (1.04)% | (20,571 | ) | ||||||
| TOTAL NET ASSETS – 100.00% | $ | 1,984,703 | ||||||
Percentages are stated as a percent of net assets.
| ADR | American Depository Receipt |
| AG | Aktiengesellschaft |
| GDR | Global Depository Receipt |
| N.V. | Naamloze Vennootschap |
| PLC | Public Limited Company |
| S.A. | Société Anonyme |
| S.p.A | Società per azioni |
| (a) | Non-income producing security. |
| (b) | The rate listed is the 7-day annualized yield as of August 31, 2021. |
The accompanying notes are an integral part of these financial statements.
28
Pzena International Value Fund
Portfolio Diversification
August 31, 2021 (Unaudited)
| Fair | % of | |||||||
| Value | Net Assets | |||||||
| COMMON STOCKS | ||||||||
Communication Services | $ | 72,403 | 3.65 | % | ||||
Consumer Discretionary | 269,699 | 13.59 | % | |||||
Consumer Staples | 162,171 | 8.17 | % | |||||
Energy | 126,856 | 6.39 | % | |||||
Financials | 474,349 | 23.90 | % | |||||
Health Care | 154,853 | 7.80 | % | |||||
Industrials | 304,378 | 15.34 | % | |||||
Information Technology | 102,233 | 5.15 | % | |||||
Materials | 182,040 | 9.17 | % | |||||
Utilities | 38,989 | 1.97 | % | |||||
| Total Common Stocks | 1,887,971 | 95.13 | % | |||||
| PREFERRED STOCK | ||||||||
Consumer Discretionary | 46,349 | 2.34 | % | |||||
| Total Preferred Stock | 46,349 | 2.34 | % | |||||
| Short-Term Investment | 70,954 | 3.57 | % | |||||
| Total Investments | 2,005,274 | 101.04 | % | |||||
| Liabilities in Excess | ||||||||
| of Other Assets | (20,571 | ) | (1.04 | )% | ||||
| Total Net Assets | $ | 1,984,703 | 100.00 | % | ||||
The Global Industry Classification Standard (GICS®) was developed by and/or is the exclusive property of MSCI, Inc. and Standard & Poor’s Financial Services LLC (“S&P”). GICS is a service mark of MSCI and S&P and has been licensed for use by Pzena Investment Management, LLC.
The accompanying notes are an integral part of these financial statements.
29
Pzena Funds
Statements of Assets and Liabilities
August 31, 2021 (Unaudited)
| PZENA | ||||||||||||
| PZENA | EMERGING | PZENA | ||||||||||
| MID CAP | MARKETS | SMALL CAP | ||||||||||
| VALUE FUND | VALUE FUND | VALUE FUND | ||||||||||
| ASSETS: | ||||||||||||
Investments in securities, at value | ||||||||||||
(cost $88,923,937, $442,490,917, and $86,261,093, respectively) | $ | 133,510,581 | $ | 509,179,060 | $ | 104,501,640 | ||||||
Foreign currency, at value (cost $0, $1,190,486, and $0, respectively) | — | 1,180,822 | — | |||||||||
Receivables: | ||||||||||||
| Fund shares sold | 9,470 | 557,393 | 52,668 | |||||||||
| Securities sold | — | 668,010 | — | |||||||||
| Dividends and interest | 200,748 | 1,196,896 | 122,623 | |||||||||
| Dividend tax reclaim | 1,651 | 17,774 | — | |||||||||
Prepaid expenses | 22,762 | 42,804 | 27,100 | |||||||||
| Total assets | 133,745,212 | 512,842,759 | 104,704,031 | |||||||||
| LIABILITIES: | ||||||||||||
Payables: | ||||||||||||
| Securities purchased | 13,536 | 561,539 | — | |||||||||
| Fund shares redeemed | 40,242 | 44,779 | 10,527 | |||||||||
| Due to Adviser (Note 4) | 82,277 | 398,829 | 74,845 | |||||||||
| Administration fees | 42,657 | 108,800 | 34,483 | |||||||||
| Transfer agent fees and expenses | 18,005 | 31,193 | 17,853 | |||||||||
| 12b-1 distribution fees – Investor Class | 14,448 | 21,381 | 3,377 | |||||||||
| Audit fees | 11,342 | 11,342 | 11,342 | |||||||||
| Chief Compliance Officer fee | 5,671 | 5,670 | 5,671 | |||||||||
| Shareholder reporting | 5,282 | 18,994 | 4,440 | |||||||||
| Miscellaneous | 2,698 | — | 2,626 | |||||||||
| Custody fees | 1,426 | 43,395 | 1,100 | |||||||||
| Shareholder servicing fees – Investor Class | 1,181 | 1,748 | 197 | |||||||||
| Fund accounting fees | 702 | 1,478 | 794 | |||||||||
| Trustee fees and expenses | 509 | 2,832 | 522 | |||||||||
| Currency | — | 2,947 | — | |||||||||
| Total liabilities | 239,976 | 1,254,927 | 167,777 | |||||||||
| NET ASSETS | $ | 133,505,236 | $ | 511,587,832 | $ | 104,536,254 | ||||||
| NET ASSETS CONSIST OF: | ||||||||||||
Paid-in capital | $ | 83,126,907 | $ | 438,940,396 | $ | 85,527,995 | ||||||
Total distributable earnings | 50,378,329 | 72,647,436 | 19,008,259 | |||||||||
| Net assets | $ | 133,505,236 | $ | 511,587,832 | $ | 104,536,254 | ||||||
| CALCULATION OF NET ASSET VALUE PER SHARE | ||||||||||||
| Investor Class: | ||||||||||||
Net assets | $ | 14,147,130 | $ | 21,331,584 | $ | 3,397,846 | ||||||
Shares outstanding [unlimited number of shares (par value $0.01) authorized] | 845,062 | 1,693,671 | 239,817 | |||||||||
Net asset value, offering and redemption price per share | $ | 16.74 | $ | 12.59 | $ | 14.17 | ||||||
| Institutional Class: | ||||||||||||
Net assets | $ | 119,358,106 | $ | 490,256,248 | $ | 101,138,408 | ||||||
Shares outstanding [unlimited number of shares (par value $0.01) authorized] | 7,199,526 | 38,751,248 | 7,090,666 | |||||||||
Net asset value, offering and redemption price per share | $ | 16.58 | $ | 12.65 | $ | 14.26 | ||||||
The accompanying notes are an integral part of these financial statements.
30
Pzena Funds
Statements of Assets and Liabilities (Continued)
August 31, 2021 (Unaudited)
| PZENA | ||||||||
| INTERNATIONAL | PZENA | |||||||
| SMALL CAP | INTERNATIONAL | |||||||
| VALUE FUND | VALUE FUND | |||||||
| ASSETS: | ||||||||
Investments in securities, at value (cost $15,497,078 and $2,023,341, respectively) | $ | 16,303,879 | $ | 2,005,274 | ||||
Foreign currency, at value (cost $14,597 and $0, respectively) | 14,561 | — | ||||||
Receivables: | ||||||||
| Currency | 62 | — | ||||||
| Fund shares sold | 932 | 81 | ||||||
| Dividends and interest | 196,932 | 2,471 | ||||||
| Dividend tax reclaim | 5,851 | 384 | ||||||
| Due from Adviser (Note 4) | 3,895 | — | ||||||
Prepaid expenses | 22,406 | 28,085 | ||||||
| Total assets | 16,548,518 | 2,036,295 | ||||||
| LIABILITIES: | ||||||||
Payables: | ||||||||
| Securities purchased | 133,543 | — | ||||||
| Due to Adviser (Note 4) | — | 18,045 | ||||||
| Administration fees | 31,313 | 14,457 | ||||||
| Transfer agent fees and expenses | 12,757 | 4,450 | ||||||
| 12b-1 distribution fees – Investor Class | 1,592 | 426 | ||||||
| Audit fees | 11,342 | 4,337 | ||||||
| Chief Compliance Officer fee | 5,671 | 1,972 | ||||||
| Shareholder reporting | 2,368 | 1,045 | ||||||
| Miscellaneous | 2,489 | 191 | ||||||
| Custody fees | — | 3,008 | ||||||
| Shareholder servicing fees – Investor Class | 53 | 17 | ||||||
| Fund accounting fees | 1,351 | 273 | ||||||
| Trustee fees and expenses | 499 | 2,596 | ||||||
| Legal fees | — | 775 | ||||||
| Total liabilities | 202,978 | 51,592 | ||||||
| NET ASSETS | $ | 16,345,540 | $ | 1,984,703 | ||||
| NET ASSETS CONSIST OF: | ||||||||
Paid-in capital | $ | 15,513,766 | $ | 2,000,081 | ||||
Total distributable earnings/(deficit) | 831,774 | (15,378 | ) | |||||
| Net assets | $ | 16,345,540 | $ | 1,984,703 | ||||
| CALCULATION OF NET ASSET VALUE PER SHARE | ||||||||
| Investor Class: | ||||||||
Net assets | $ | 1,600,641 | $ | 992,080 | ||||
Shares outstanding [unlimited number of shares (par value $0.01) authorized] | 147,865 | 100,000 | ||||||
Net asset value, offering and redemption price per share | $ | 10.83 | $ | 9.92 | ||||
| Institutional Class: | ||||||||
Net assets | $ | 14,744,899 | $ | 992,623 | ||||
Shares outstanding [unlimited number of shares (par value $0.01) authorized] | 1,358,613 | 100,008 | ||||||
Net asset value, offering and redemption price per share | $ | 10.85 | $ | 9.93 | ||||
The accompanying notes are an integral part of these financial statements.
31
Pzena Funds
Statements of Operations
For the Six Months Ended August 31, 2021 (Unaudited)
| PZENA | ||||||||||||
| PZENA | EMERGING | PZENA | ||||||||||
| MID CAP | MARKETS | SMALL CAP | ||||||||||
| VALUE FUND | VALUE FUND | VALUE FUND | ||||||||||
| INVESTMENT INCOME: | ||||||||||||
Dividends (net of foreign taxes withheld and | ||||||||||||
issuance fees of $6,129, $1,059,162, and $0, respectively) | $ | 1,290,950 | $ | 8,299,167 | $ | 687,249 | ||||||
Interest income | 124 | 785 | 165 | |||||||||
| Total investment income | 1,291,074 | 8,299,952 | 687,414 | |||||||||
| EXPENSES: | ||||||||||||
Investment advisory fees (Note 4) | 524,467 | 2,361,332 | 429,824 | |||||||||
Administration fees (Note 4) | 42,831 | 109,717 | 34,779 | |||||||||
12b-1 distribution fees – Investor Class (Note 5) | 16,517 | 25,256 | 3,983 | |||||||||
Transfer agent fees and expenses (Note 4) | 16,488 | 27,458 | 17,391 | |||||||||
Federal and state registration fees | 13,419 | 10,396 | 14,746 | |||||||||
Audit fees | 11,342 | 11,342 | 11,342 | |||||||||
Trustee fees and expenses | 7,458 | 7,665 | 7,282 | |||||||||
Shareholder servicing fees – Investor Class (Note 6) | 6,348 | 10,037 | 793 | |||||||||
Chief Compliance Officer fees (Note 4) | 5,671 | 5,671 | 5,671 | |||||||||
Custody fees (Note 4) | 4,715 | 152,037 | 3,779 | |||||||||
Legal fees | 3,043 | 3,148 | 2,948 | |||||||||
Reports to shareholders | 2,857 | 9,235 | 2,312 | |||||||||
Insurance expense | 1,800 | 3,634 | 1,569 | |||||||||
Fund accounting fees (Note 4) | 677 | 1,438 | 784 | |||||||||
Interest expense (Note 9) | 293 | — | — | |||||||||
Other expenses | 2,388 | 9,314 | 2,144 | |||||||||
| Total expenses before advisory fee waiver | 660,314 | 2,747,680 | 539,347 | |||||||||
Advisory fee waiver (Note 4) | (47,424 | ) | (162,148 | ) | (36,881 | ) | ||||||
Net expenses | 612,890 | 2,585,532 | 502,466 | |||||||||
| NET INVESTMENT INCOME | 678,184 | 5,714,420 | 184,948 | |||||||||
| REALIZED AND UNREALIZED GAIN/(LOSS): | ||||||||||||
Net realized gain/(loss) on transactions from: | ||||||||||||
Investments | 6,648,218 | 4,494,638 | 1,836,752 | |||||||||
Foreign currency | 2 | (109,567 | ) | — | ||||||||
Net change in unrealized appreciation from: | ||||||||||||
Investments | 6,055,800 | 18,446,036 | 4,277,824 | |||||||||
Foreign currency | — | 51,759 | — | |||||||||
Net gain on investments and foreign currency | 12,704,020 | 22,882,866 | 6,114,576 | |||||||||
| NET INCREASE IN NET ASSETS RESULTING FROM OPERATIONS | $ | 13,382,204 | $ | 28,597,286 | $ | 6,299,524 | ||||||
The accompanying notes are an integral part of these financial statements.
32
Pzena Funds
Statements of Operations (Continued)
For the Six Months Ended August 31, 2021 (Unaudited)
| PZENA | ||||||||
| INTERNATIONAL | PZENA | |||||||
| SMALL CAP | INTERNATIONAL | |||||||
| VALUE FUND | VALUE FUND(1) | |||||||
| INVESTMENT INCOME: | ||||||||
Dividends (net of foreign taxes withheld and issuance fees of $16,579 and $990, respectively) | $ | 138,452 | $ | 7,123 | ||||
Interest income | 17 | 1 | ||||||
| Total investment income | 138,469 | 7,124 | ||||||
| EXPENSES: | ||||||||
Investment advisory fees (Note 4) | 43,820 | 2,214 | ||||||
Administration fees (Note 4) | 21,353 | 14,457 | ||||||
12b-1 distribution fees – Investor Class (Note 5) | 1,878 | 426 | ||||||
Transfer agent fees and expenses (Note 4) | 12,758 | 4,450 | ||||||
Federal and state registration fees | 15,706 | 10,196 | ||||||
Audit fees | 11,342 | 4,337 | ||||||
Trustee fees and expenses | 7,042 | 2,596 | ||||||
Shareholder servicing fees – Investor Class (Note 6) | 227 | 34 | ||||||
Chief Compliance Officer fees (Note 4) | 5,671 | 1,972 | ||||||
Custody fees (Note 4) | 8,374 | 3,008 | ||||||
Legal fees | 2,948 | 1,010 | ||||||
Reports to shareholders | 1,787 | 1,045 | ||||||
Insurance expense | 1,207 | — | ||||||
Fund accounting fees (Note 4) | 1,134 | 273 | ||||||
Other expenses | 2,170 | 1,008 | ||||||
| Total expenses before advisory fee waiver and expense reimbursement | 137,417 | 47,026 | ||||||
Advisory fee waiver and expense reimbursement (Note 4) | (84,043 | ) | (44,045 | ) | ||||
Net expenses | 53,374 | 2,981 | ||||||
| NET INVESTMENT INCOME | 85,095 | 4,143 | ||||||
| REALIZED AND UNREALIZED GAIN/(LOSS): | ||||||||
Net realized gain/(loss) on transactions from: | ||||||||
Investments | 261,431 | (275 | ) | |||||
Foreign currency | (1,047 | ) | (1,175 | ) | ||||
Net change in unrealized appreciation/(depreciation) from: | ||||||||
Investments | 388,685 | (18,067 | ) | |||||
Foreign currency | 118 | (4 | ) | |||||
Net gain/(loss) on investments and foreign currency | 649,187 | (19,521 | ) | |||||
| NET INCREASE/(DECREASE) IN NET ASSETS RESULTING FROM OPERATIONS | $ | 734,282 | $ | (15,378 | ) | |||
(1) | For the period June 28, 2021 through August 31, 2021. |
The accompanying notes are an integral part of these financial statements.
33
Pzena Mid Cap Value Fund
Statements of Changes in Net Assets
| Six Months Ended | Year Ended | |||||||
| August 31, 2021 | February 28, | |||||||
| (Unaudited) | 2021 | |||||||
| INCREASE/(DECREASE) IN NET ASSETS FROM: | ||||||||
| OPERATIONS: | ||||||||
Net investment income | $ | 678,184 | $ | 1,463,560 | ||||
Net realized gain/(loss) from: | ||||||||
Investments | 6,648,218 | (2,606,193 | ) | |||||
Foreign currency | 2 | (12 | ) | |||||
Change in unrealized appreciation on investments | 6,055,800 | 48,835,413 | ||||||
Net increase in net assets resulting from operations | 13,382,204 | 47,692,768 | ||||||
| DISTRIBUTIONS: | ||||||||
Net dividends and distributions to shareholders – Investor Class | — | (165,177 | ) | |||||
Net dividends and distributions to shareholders – Institutional Class | — | (2,464,158 | ) | |||||
Net decrease in net assets resulting from distributions paid | — | (2,629,335 | ) | |||||
| CAPITAL SHARE TRANSACTIONS: | ||||||||
Proceeds from shares subscribed – Investor Class | 9,998,362 | 3,431,747 | ||||||
Proceeds from shares subscribed – Institutional Class | 9,751,253 | 40,349,201 | ||||||
Net asset value of shares issued to shareholders | ||||||||
in payment of distributions declared – Investor Class | — | 153,901 | ||||||
Net asset value of shares issued to shareholders | ||||||||
in payment of distributions declared – Institutional Class | — | 1,466,424 | ||||||
Payments for shares redeemed – Investor Class | (6,043,759 | ) | (1,199,419 | ) | ||||
Payments for shares redeemed – Institutional Class | (11,450,255 | ) | (26,652,142 | ) | ||||
Net increase in net assets derived from capital share transactions | 2,255,601 | 17,549,712 | ||||||
| TOTAL INCREASE IN NET ASSETS | 15,637,805 | 62,613,145 | ||||||
| NET ASSETS: | ||||||||
Beginning of period | 117,867,431 | 55,254,286 | ||||||
End of period | $ | 133,505,236 | $ | 117,867,431 | ||||
| CHANGES IN SHARES OUTSTANDING: | ||||||||
Shares sold – Investor Class | 604,021 | 392,778 | ||||||
Shares sold – Institutional Class | 592,408 | 4,777,225 | ||||||
Shares issued in reinvestments of dividends and distributions – Investor Class | — | 11,563 | ||||||
Shares issued in reinvestments of dividends and distributions – Institutional Class | — | 111,600 | ||||||
Shares redeemed – Investor Class | (355,225 | ) | (119,940 | ) | ||||
Shares redeemed – Institutional Class | (713,878 | ) | (2,404,457 | ) | ||||
Net increase in shares outstanding | 127,326 | 2,768,769 | ||||||
The accompanying notes are an integral part of these financial statements.
34
Pzena Emerging Markets Value Fund
Statements of Changes in Net Assets
| Six Months Ended | Year Ended | |||||||
| August 31, 2021 | February 28, | |||||||
| (Unaudited) | 2021 | |||||||
| INCREASE/(DECREASE) IN NET ASSETS FROM: | ||||||||
| OPERATIONS: | ||||||||
Net investment income | $ | 5,714,420 | $ | 5,377,306 | ||||
Net realized gain/(loss) from: | ||||||||
Investments | 4,494,638 | (5,399,424 | ) | |||||
Foreign currency | (109,567 | ) | (305,812 | ) | ||||
Change in unrealized appreciation on: | ||||||||
Investments | 18,446,036 | 96,896,067 | ||||||
Foreign currency | 51,759 | 7,819 | ||||||
Net increase in net assets resulting from operations | 28,597,286 | 96,575,956 | ||||||
| DISTRIBUTIONS: | ||||||||
Net dividends and distributions to shareholders – Investor Class | — | (191,321 | ) | |||||
Net dividends and distributions to shareholders – Institutional Class | — | (4,408,966 | ) | |||||
Net decrease in net assets resulting from distributions paid | — | (4,600,287 | ) | |||||
| CAPITAL SHARE TRANSACTIONS: | ||||||||
Proceeds from shares subscribed – Investor Class | 13,425,851 | 13,477,912 | ||||||
Proceeds from shares subscribed – Institutional Class | 86,886,254 | 151,614,556 | ||||||
Net asset value of shares issued to shareholders | ||||||||
in payment of distributions declared – Investor Class | — | 190,706 | ||||||
Net asset value of shares issued to shareholders | ||||||||
in payment of distributions declared – Institutional Class | — | 3,746,033 | ||||||
Payments for shares redeemed – Investor Class | (11,353,017 | ) | (11,232,577 | )(1) | ||||
Payments for shares redeemed – Institutional Class | (27,377,006 | ) | (138,846,626 | )(2) | ||||
Net increase in net assets derived from capital share transactions | 61,582,082 | 18,950,004 | ||||||
| TOTAL INCREASE IN NET ASSETS | 90,179,368 | 110,925,673 | ||||||
| NET ASSETS: | ||||||||
Beginning of period | 421,408,464 | 310,482,791 | ||||||
End of period | $ | 511,587,832 | $ | 421,408,464 | ||||
| CHANGES IN SHARES OUTSTANDING: | ||||||||
Shares sold – Investor Class | 1,074,308 | 1,435,252 | ||||||
Shares sold – Institutional Class | 6,946,063 | 15,740,156 | ||||||
Shares issued in reinvestments of dividends and distributions – Investor Class | — | 17,957 | ||||||
Shares issued in reinvestments of dividends and distributions – Institutional Class | — | 352,071 | ||||||
Shares redeemed – Investor Class | (901,054 | ) | (1,111,326 | ) | ||||
Shares redeemed – Institutional Class | (2,184,428 | ) | (15,514,751 | ) | ||||
Net increase in shares outstanding | 4,934,889 | 919,359 | ||||||
(1) | Net of redemption fees of $1,113. |
(2) | Net of redemption fees of $6,063. |
The accompanying notes are an integral part of these financial statements.
35
Pzena Small Cap Value Fund
Statements of Changes in Net Assets
| Six Months Ended | Year Ended | |||||||
| August 31, 2021 | February 28, | |||||||
| (Unaudited) | 2021 | |||||||
| INCREASE/(DECREASE) IN NET ASSETS FROM: | ||||||||
| OPERATIONS: | ||||||||
Net investment income | $ | 184,948 | $ | 570,946 | ||||
Net realized gain/(loss) on investments | 1,836,752 | (1,208,818 | ) | |||||
Net change in unrealized appreciation on investments | 4,277,824 | 19,032,246 | ||||||
Net increase in net assets resulting from operations | 6,299,524 | 18,394,374 | ||||||
| DISTRIBUTIONS: | ||||||||
Net dividends and distributions to shareholders – Investor Class | — | (28,912 | ) | |||||
Net dividends and distributions to shareholders – Institutional Class | — | (730,588 | ) | |||||
Net decrease in net assets resulting from distributions paid | — | (759,500 | ) | |||||
| CAPITAL SHARE TRANSACTIONS: | ||||||||
Proceeds from shares subscribed – Investor Class | 918,307 | 553,854 | ||||||
Proceeds from shares subscribed – Institutional Class | 30,273,385 | 31,389,498 | ||||||
Net asset value of shares issued to shareholders | ||||||||
in payment of distributions declared – Investor Class | — | 28,912 | ||||||
Net asset value of shares issued to shareholders | ||||||||
in payment of distributions declared – Institutional Class | — | 665,409 | ||||||
Payments for shares redeemed – Investor Class | (132,584 | ) | (168,938 | ) | ||||
Payments for shares redeemed – Institutional Class | (5,243,238 | ) | (9,585,465 | )(1) | ||||
Net increase in net assets derived from capital share transactions | 25,815,870 | 22,883,270 | ||||||
| TOTAL INCREASE IN NET ASSETS | 32,115,394 | 40,518,144 | ||||||
| NET ASSETS: | ||||||||
Beginning of period | 72,420,860 | 31,902,716 | ||||||
End of period | $ | 104,536,254 | $ | 72,420,860 | ||||
| CHANGES IN SHARES OUTSTANDING: | ||||||||
Shares sold – Investor Class | 64,937 | 67,494 | ||||||
Shares sold – Institutional Class | 2,138,265 | 3,289,919 | ||||||
Shares issued in reinvestments of dividends and distributions – Investor Class | — | 2,516 | ||||||
Shares issued in reinvestments of dividends and distributions – Institutional Class | — | 57,661 | ||||||
Shares redeemed – Investor Class | (9,417 | ) | (22,579 | ) | ||||
Shares redeemed – Institutional Class | (375,491 | ) | (1,205,688 | ) | ||||
Net increase in shares outstanding | 1,818,294 | 2,189,323 | ||||||
(1) | Net of redemption fees of $1,318. |
The accompanying notes are an integral part of these financial statements.
36
Pzena International Small Cap Value Fund
Statements of Changes in Net Assets
| Six Months Ended | Year Ended | |||||||
| August 31, 2021 | February 28, | |||||||
| (Unaudited) | 2021 | |||||||
| INCREASE/(DECREASE) IN NET ASSETS FROM: | ||||||||
| OPERATIONS: | ||||||||
Net investment income | $ | 85,095 | $ | 31,774 | ||||
Net realized gain/(loss) from: | ||||||||
Investments | 261,431 | (321,274 | ) | |||||
Foreign currency | (1,047 | ) | 86 | |||||
Change in unrealized appreciation/(depreciation) on: | ||||||||
Investments | 388,685 | 1,046,386 | ||||||
Foreign currency | 118 | (83 | ) | |||||
Net increase in net assets resulting from operations | 734,282 | 756,889 | ||||||
| DISTRIBUTIONS: | ||||||||
Net dividends and distributions to shareholders – Investor Class | — | (12,023 | ) | |||||
Net dividends and distributions to shareholders – Institutional Class | — | (23,803 | ) | |||||
Net decrease in net assets resulting from distributions paid | — | (35,826 | ) | |||||
| CAPITAL SHARE TRANSACTIONS: | ||||||||
Proceeds from shares subscribed – Investor Class | 517,025 | 160,225 | ||||||
Proceeds from shares subscribed – Institutional Class | 12,103,107 | 303,160 | ||||||
Net asset value of shares issued to shareholders | ||||||||
in payment of distributions declared – Investor Class | — | 12,024 | ||||||
Net asset value of shares issued to shareholders | ||||||||
in payment of distributions declared – Institutional Class | — | 23,803 | ||||||
Payments for shares redeemed – Investor Class | (367,015 | ) | (7,334 | ) | ||||
Payments for shares redeemed – Institutional Class | (2,953 | ) | (94,600 | ) | ||||
Net increase in net assets derived from capital share transactions | 12,250,164 | 397,278 | ||||||
| TOTAL INCREASE IN NET ASSETS | 12,984,446 | 1,118,341 | ||||||
| NET ASSETS: | ||||||||
Beginning of period | 3,361,094 | 2,242,753 | ||||||
End of period | $ | 16,345,540 | $ | 3,361,094 | ||||
| CHANGES IN SHARES OUTSTANDING: | ||||||||
Shares sold – Investor Class | 49,492 | 22,496 | ||||||
Shares sold – Institutional Class | 1,136,966 | 39,038 | ||||||
Shares issued in reinvestments of dividends and distributions – Investor Class | — | 1,421 | ||||||
Shares issued in reinvestments of dividends and distributions – Institutional Class | — | 2,813 | ||||||
Shares redeemed – Investor Class | (33,917 | ) | (1,013 | ) | ||||
Shares redeemed – Institutional Class | (282 | ) | (10,097 | ) | ||||
Net increase in shares outstanding | 1,152,259 | 54,658 | ||||||
The accompanying notes are an integral part of these financial statements.
37
Pzena International Value Fund
Statement of Changes in Net Assets
| For the period | ||||
| June 28, 2021 | ||||
| through | ||||
| August 31, 2021 | ||||
| (Unaudited) | ||||
| INCREASE/(DECREASE) IN NET ASSETS FROM: | ||||
| OPERATIONS: | ||||
Net investment income | $ | 4,143 | ||
Net realized loss from: | ||||
Investments | (275 | ) | ||
Foreign currency | (1,175 | ) | ||
Net change in unrealized depreciation on: | ||||
Investments | (18,067 | ) | ||
Securities sold short | (4 | ) | ||
Net decrease in net assets resulting from operations | (15,378 | ) | ||
| CAPITAL SHARE TRANSACTIONS: | ||||
Proceeds from shares subscribed – Investor Class | 1,000,000 | |||
Proceeds from shares subscribed – Institutional Class | 1,000,081 | |||
Net increase in net assets derived from capital share transactions | 2,000,081 | |||
| TOTAL INCREASE IN NET ASSETS | 1,984,703 | |||
| NET ASSETS: | ||||
Beginning of period | — | |||
End of period | $ | 1,984,703 | ||
| CHANGES IN SHARES OUTSTANDING: | ||||
Shares sold – Investor Class | 100,000 | |||
Shares sold – Institutional Class | 100,008 | |||
Net increase in shares outstanding | 200,008 | |||
The accompanying notes are an integral part of these financial statements.
38
Pzena Mid Cap Value Fund – Investor Class
Financial Highlights
For a share outstanding throughout each period
| Six Months | ||||||||||||||||||||||||
| Ended | ||||||||||||||||||||||||
| August 31, | Year Ended | Year Ended | Year Ended | Year Ended | Year Ended | |||||||||||||||||||
| 2021 | February 28, | February 29, | February 28, | February 28, | February 28, | |||||||||||||||||||
| (Unaudited) | 2021 | 2020 | 2019 | 2018 | 2017 | |||||||||||||||||||
| PER SHARE DATA: | ||||||||||||||||||||||||
| Net asset value, beginning of period | $ | 15.05 | $ | 10.86 | $ | 11.59 | $ | 12.92 | $ | 12.26 | $ | 8.70 | ||||||||||||
| Income from investment operations: | ||||||||||||||||||||||||
| Net investment income | 0.06 | (1) | 0.16 | (1) | 0.12 | (1) | 0.11 | (1) | 0.05 | 0.05 | ||||||||||||||
| Net realized and unrealized | ||||||||||||||||||||||||
| gain/(loss) on investments | 1.63 | 4.32 | (0.74 | ) | (1.18 | ) | 0.94 | 3.58 | ||||||||||||||||
| Total from investment operations | 1.69 | 4.48 | (0.62 | ) | (1.07 | ) | 0.99 | 3.63 | ||||||||||||||||
| Less distributions: | ||||||||||||||||||||||||
| Dividends from net investment income | — | (0.05 | ) | (0.06 | ) | — | (0.05 | ) | (0.07 | ) | ||||||||||||||
| Dividends from net realized | ||||||||||||||||||||||||
| gain on investments | — | (0.24 | ) | (0.05 | ) | (0.26 | ) | (0.28 | ) | — | ||||||||||||||
| Total distributions | — | (0.29 | ) | (0.11 | ) | (0.26 | ) | (0.33 | ) | (0.07 | ) | |||||||||||||
| Redemption fees retained | — | — | 0.00 | (1)(2) | 0.00 | (1)(2) | 0.00 | (1)(2) | — | |||||||||||||||
| Net asset value, end of period | $ | 16.74 | $ | 15.05 | $ | 10.86 | $ | 11.59 | $ | 12.92 | $ | 12.26 | ||||||||||||
| TOTAL RETURN | 11.23 | %(3) | 41.53 | % | -5.49 | % | -8.12 | % | 8.09 | % | 41.73 | % | ||||||||||||
| SUPPLEMENTAL DATA AND RATIOS: | ||||||||||||||||||||||||
| Net assets, end of period (thousands) | $ | 14,147 | $ | 8,972 | $ | 3,387 | $ | 8,920 | $ | 8,593 | $ | 2,741 | ||||||||||||
| Ratio of expenses to average net assets: | ||||||||||||||||||||||||
| Before fee waivers and | ||||||||||||||||||||||||
| expense reimbursement | 1.32 | %(4) | 1.40 | % | 1.56 | % | 1.66 | % | 3.63 | % | 6.90 | % | ||||||||||||
| After fee waivers and | ||||||||||||||||||||||||
| expense reimbursement | 1.25 | %(4) | 1.24 | % | 1.23 | % | 1.24 | % | 1.22 | % | 1.35 | % | ||||||||||||
| Ratio of net investment income/(loss) | ||||||||||||||||||||||||
| to average net assets: | ||||||||||||||||||||||||
| Before fee waivers and | ||||||||||||||||||||||||
| expense reimbursement | 0.65 | %(4) | 1.33 | % | 0.69 | % | 0.48 | % | (2.09 | )% | (5.04 | )% | ||||||||||||
| After fee waivers and | ||||||||||||||||||||||||
| expense reimbursement | 0.72 | %(4) | 1.49 | % | 1.02 | % | 0.90 | % | 0.32 | % | 0.51 | % | ||||||||||||
Portfolio turnover rate(5) | 11 | %(3) | 45 | % | 32 | % | 34 | % | 16 | % | 26 | % | ||||||||||||
(1) | Based on average shares outstanding. |
(2) | Amount is less than $0.01 per share. |
(3) | Not annualized. |
(4) | Annualized. |
(5) | Portfolio turnover is calculated on the basis of the Fund as a whole. |
The accompanying notes are an integral part of these financial statements.
39
Pzena Mid Cap Value Fund – Institutional Class
Financial Highlights
For a share outstanding throughout each period
| Six Months | ||||||||||||||||||||||||
| Ended | ||||||||||||||||||||||||
| August 31, | Year Ended | Year Ended | Year Ended | Year Ended | Year Ended | |||||||||||||||||||
| 2021 | February 28, | February 29, | February 28, | February 28, | February 28, | |||||||||||||||||||
| (Unaudited) | 2021 | 2020 | 2019 | 2018 | 2017 | |||||||||||||||||||
| PER SHARE DATA: | ||||||||||||||||||||||||
| Net asset value, beginning of period | $ | 14.87 | $ | 10.72 | $ | 11.44 | $ | 12.93 | $ | 12.27 | $ | 8.70 | ||||||||||||
| Income from investment operations: | ||||||||||||||||||||||||
| Net investment income | 0.09 | (1) | 0.20 | (1) | 0.16 | (1) | 0.15 | (1) | 0.09 | 0.09 | ||||||||||||||
| Net realized and unrealized | ||||||||||||||||||||||||
| gain/(loss) on investments | 1.62 | 4.27 | (0.73 | ) | (1.20 | ) | 0.94 | 3.58 | ||||||||||||||||
| Total from investment operations | 1.71 | 4.47 | (0.57 | ) | (1.05 | ) | 1.03 | 3.67 | ||||||||||||||||
| Less distributions: | ||||||||||||||||||||||||
| Dividends from net investment income | — | (0.08 | ) | (0.10 | ) | (0.18 | ) | (0.09 | ) | (0.10 | ) | |||||||||||||
| Dividends from net realized | ||||||||||||||||||||||||
| gain on investments | — | (0.24 | ) | (0.05 | ) | (0.26 | ) | (0.28 | ) | — | ||||||||||||||
| Total distributions | — | (0.32 | ) | (0.15 | ) | (0.44 | ) | (0.37 | ) | (0.10 | ) | |||||||||||||
| Redemption fees retained | — | — | 0.00 | (1)(2) | 0.00 | (1)(2) | — | — | ||||||||||||||||
| Net asset value, end of period | $ | 16.58 | $ | 14.87 | $ | 10.72 | $ | 11.44 | $ | 12.93 | $ | 12.27 | ||||||||||||
| TOTAL RETURN | 11.50 | %(3) | 42.06 | % | -5.17 | % | -7.82 | % | 8.36 | % | 42.21 | % | ||||||||||||
| SUPPLEMENTAL DATA AND RATIOS: | ||||||||||||||||||||||||
| Net assets, end of period (thousands) | $ | 119,358 | $ | 108,895 | $ | 51,867 | $ | 33,928 | $ | 33,137 | �� | $ | 2,757 | |||||||||||
| Ratio of expenses to average net assets: | ||||||||||||||||||||||||
| Before fee waivers and | ||||||||||||||||||||||||
| expense reimbursement | 0.97 | %(4) | 1.06 | % | 1.23 | % | 1.32 | % | 2.83 | % | 6.64 | % | ||||||||||||
| After fee waivers and | ||||||||||||||||||||||||
| expense reimbursement | 0.90 | %(4) | 0.90 | % | 0.90 | % | 0.90 | % | 0.93 | % | 1.00 | % | ||||||||||||
| Ratio of net investment income/(loss) | ||||||||||||||||||||||||
| to average net assets: | ||||||||||||||||||||||||
| Before fee waivers and | ||||||||||||||||||||||||
| expense reimbursement | 1.00 | %(4) | 1.67 | % | 1.02 | % | 0.82 | % | (1.27 | )% | (4.77 | )% | ||||||||||||
| After fee waivers and | ||||||||||||||||||||||||
| expense reimbursement | 1.07 | %(4) | 1.83 | % | 1.35 | % | 1.24 | % | 0.63 | % | 0.87 | % | ||||||||||||
Portfolio turnover rate(5) | 11 | %(3) | 45 | % | 32 | % | 34 | % | 16 | % | 26 | % | ||||||||||||
(1) | Based on average shares outstanding. |
(2) | Amount is less than $0.01 per share. |
(3) | Not annualized. |
(4) | Annualized. |
(5) | Portfolio turnover is calculated on the basis of the Fund as a whole. |
The accompanying notes are an integral part of these financial statements.
40
Pzena Emerging Markets Value Fund – Investor Class
Financial Highlights
For a share outstanding throughout each period
| Six Months | ||||||||||||||||||||||||
| Ended | ||||||||||||||||||||||||
| August 31, | Year Ended | Year Ended | Year Ended | Year Ended | Year Ended | |||||||||||||||||||
| 2021 | February 28, | February 29, | February 28, | February 28, | February 28, | |||||||||||||||||||
| (Unaudited) | 2021 | 2020 | 2019 | 2018 | 2017 | |||||||||||||||||||
| PER SHARE DATA: | ||||||||||||||||||||||||
| Net asset value, beginning of period | $ | 11.84 | $ | 8.96 | $ | 10.56 | $ | 11.46 | $ | 9.47 | $ | 6.74 | ||||||||||||
| Income from investment operations: | ||||||||||||||||||||||||
| Net investment income | 0.10 | (1) | 0.14 | (1) | 0.16 | (1) | 0.13 | (1) | 0.07 | 0.03 | ||||||||||||||
| Net realized and unrealized | ||||||||||||||||||||||||
| gain/(loss) on investments | 0.65 | 2.86 | (1.37 | ) | (0.93 | ) | 2.06 | 2.76 | ||||||||||||||||
| Total from investment operations | 0.75 | 3.00 | (1.21 | ) | (0.80 | ) | 2.13 | 2.79 | ||||||||||||||||
| Less distributions: | ||||||||||||||||||||||||
| Dividends from net investment income | — | (0.09 | ) | (0.14 | ) | (0.10 | ) | (0.14 | ) | (0.06 | ) | |||||||||||||
| Dividends from net realized | ||||||||||||||||||||||||
| gain on investments | — | (0.03 | ) | (0.25 | ) | — | — | — | ||||||||||||||||
| Total distributions | — | (0.12 | ) | (0.39 | ) | (0.10 | ) | (0.14 | ) | (0.06 | ) | |||||||||||||
| Redemption fees retained | — | 0.00 | (1)(2) | 0.00 | (1)(2) | 0.00 | (1)(2) | 0.00 | (1)(2) | 0.00 | (1)(2) | |||||||||||||
| Net asset value, end of period | $ | 12.59 | $ | 11.84 | $ | 8.96 | $ | 10.56 | $ | 11.46 | $ | 9.47 | ||||||||||||
| TOTAL RETURN | 6.33 | %(3) | 33.63 | % | -11.85 | % | -6.95 | % | 22.56 | % | 41.63 | % | ||||||||||||
| SUPPLEMENTAL DATA AND RATIOS: | ||||||||||||||||||||||||
| Net assets, end of period (thousands) | $ | 21,332 | $ | 17,996 | $ | 10,563 | $ | 12,814 | $ | 11,023 | $ | 2,713 | ||||||||||||
| Ratio of expenses to average net assets: | ||||||||||||||||||||||||
| Before fee waivers and | ||||||||||||||||||||||||
| expense reimbursement | 1.50 | %(4) | 1.56 | % | 1.58 | % | 1.60 | % | 2.03 | % | 3.19 | % | ||||||||||||
| After fee waivers and | ||||||||||||||||||||||||
| expense reimbursement | 1.43 | %(4) | 1.43 | % | 1.56 | % | 1.59 | % | 1.57 | % | 1.60 | % | ||||||||||||
| Ratio of net investment income/(loss) | ||||||||||||||||||||||||
| to average net assets: | ||||||||||||||||||||||||
| Before fee waivers and | ||||||||||||||||||||||||
| expense reimbursement | 1.59 | %(4) | 1.32 | % | 1.55 | % | 1.25 | % | 0.42 | % | (0.91 | )% | ||||||||||||
| After fee waivers and | ||||||||||||||||||||||||
| expense reimbursement | 1.66 | %(4) | 1.45 | % | 1.57 | % | 1.26 | % | 0.88 | % | 0.68 | % | ||||||||||||
Portfolio turnover rate(5) | 7 | %(3) | 43 | % | 18 | % | 21 | % | 7 | % | 29 | % | ||||||||||||
(1) | Based on average shares outstanding. |
(2) | Amount is less than $0.01 per share. |
(3) | Not annualized. |
(4) | Annualized. |
(5) | Portfolio turnover is calculated on the basis of the Fund as a whole. |
The accompanying notes are an integral part of these financial statements.
41
Pzena Emerging Markets Value Fund – Institutional Class
Financial Highlights
For a share outstanding throughout each period
| Six Months | ||||||||||||||||||||||||
| Ended | ||||||||||||||||||||||||
| August 31, | Year Ended | Year Ended | Year Ended | Year Ended | Year Ended | |||||||||||||||||||
| 2021 | February 28, | February 29, | February 28, | February 28, | February 28, | |||||||||||||||||||
| (Unaudited) | 2021 | 2020 | 2019 | 2018 | 2017 | |||||||||||||||||||
| PER SHARE DATA: | ||||||||||||||||||||||||
| Net asset value, beginning of period | $ | 11.87 | $ | 8.98 | $ | 10.57 | $ | 11.46 | $ | 9.48 | $ | 6.74 | ||||||||||||
| Income from investment operations: | ||||||||||||||||||||||||
| Net investment income | 0.13 | (1) | 0.17 | (1) | 0.20 | (1) | 0.17 | (1) | 0.17 | 0.10 | ||||||||||||||
| Net realized and unrealized | ||||||||||||||||||||||||
| gain/(loss) on investments | 0.65 | 2.86 | (1.37 | ) | (0.93 | ) | 1.97 | 2.72 | ||||||||||||||||
| Total from investment operations | 0.78 | 3.03 | (1.17 | ) | (0.76 | ) | 2.14 | 2.82 | ||||||||||||||||
| Less distributions: | ||||||||||||||||||||||||
| Dividends from net investment income | — | (0.11 | ) | (0.17 | ) | (0.13 | ) | (0.16 | ) | (0.08 | ) | |||||||||||||
| Dividends from net realized | ||||||||||||||||||||||||
| gain on investments | — | (0.03 | ) | (0.25 | ) | — | — | — | ||||||||||||||||
| Total distributions | — | (0.14 | ) | (0.42 | ) | (0.13 | ) | (0.16 | ) | (0.08 | ) | |||||||||||||
| Redemption fees retained | — | 0.00 | (1)(2) | 0.00 | (1)(2) | 0.00 | (1)(2) | — | — | |||||||||||||||
| Net asset value, end of period | $ | 12.65 | $ | 11.87 | $ | 8.98 | $ | 10.57 | $ | 11.46 | $ | 9.48 | ||||||||||||
| TOTAL RETURN | 6.57 | %(3) | 33.96 | % | -11.51 | % | -6.57 | % | 22.63 | % | 42.01 | % | ||||||||||||
| SUPPLEMENTAL DATA AND RATIOS: | ||||||||||||||||||||||||
| Net assets, end of period (thousands) | $ | 490,256 | $ | 403,412 | $ | 299,920 | $ | 298,532 | $ | 41,223 | $ | 21,821 | ||||||||||||
| Ratio of expenses to average net assets: | ||||||||||||||||||||||||
| Before fee waivers and | ||||||||||||||||||||||||
| expense reimbursement | 1.15 | %(4) | 1.21 | % | 1.23 | % | 1.26 | % | 1.75 | % | 2.88 | % | ||||||||||||
| After fee waivers and | ||||||||||||||||||||||||
| expense reimbursement | 1.08 | %(4) | 1.08 | % | 1.21 | % | 1.25 | % | 1.25 | % | 1.25 | % | ||||||||||||
| Ratio of net investment income/(loss) | ||||||||||||||||||||||||
| to average net assets: | ||||||||||||||||||||||||
| Before fee waivers and | ||||||||||||||||||||||||
| expense reimbursement | 1.94 | %(4) | 1.67 | % | 1.90 | % | 1.59 | % | 1.10 | % | (0.45 | )% | ||||||||||||
| After fee waivers and | ||||||||||||||||||||||||
| expense reimbursement | 2.01 | %(4) | 1.80 | % | 1.92 | % | 1.60 | % | 1.60 | % | 1.18 | % | ||||||||||||
Portfolio turnover rate(5) | 7 | %(3) | 43 | % | 18 | % | 21 | % | 7 | % | 29 | % | ||||||||||||
(1) | Based on average shares outstanding. |
(2) | Amount is less than $0.01 per share. |
(3) | Not annualized. |
(4) | Annualized. |
(5) | Portfolio turnover is calculated on the basis of the Fund as a whole. |
The accompanying notes are an integral part of these financial statements.
42
Pzena Small Cap Value Fund – Investor Class
Financial Highlights
For a share outstanding throughout each period
| Six Months | ||||||||||||||||||||||||
| Ended | For the Period | |||||||||||||||||||||||
| August 31, | Year Ended | Year Ended | Year Ended | Year Ended | April 27, 2016(1) | |||||||||||||||||||
| 2021 | February 28, | February 29, | February 28, | February 28, | through | |||||||||||||||||||
| (Unaudited) | 2021 | 2020 | 2019 | 2018 | February 28, 2017 | |||||||||||||||||||
| PER SHARE DATA: | ||||||||||||||||||||||||
| Net asset value, beginning of period | $ | 13.07 | $ | 9.57 | $ | 10.90 | $ | 11.10 | $ | 11.96 | $ | 10.00 | ||||||||||||
| Income from investment operations: | ||||||||||||||||||||||||
| Net investment income/(loss) | 0.01 | (2) | 0.11 | (2) | 0.06 | (2) | 0.00 | (2)(3) | (0.03 | ) | (0.03 | ) | ||||||||||||
| Net realized and unrealized | ||||||||||||||||||||||||
| gain/(loss) on investments | 1.09 | 3.55 | (1.39 | ) | 0.22 | 0.03 | 2.00 | |||||||||||||||||
| Total from investment operations | 1.10 | 3.66 | (1.33 | ) | 0.22 | — | 1.97 | |||||||||||||||||
| Less distributions: | ||||||||||||||||||||||||
| Dividends from net realized | ||||||||||||||||||||||||
| gain on investments | — | (0.16 | ) | — | (0.42 | ) | (0.86 | ) | (0.01 | ) | ||||||||||||||
| Total distributions | — | (0.16 | ) | — | (0.42 | ) | (0.86 | ) | (0.01 | ) | ||||||||||||||
| Redemption fees retained | — | — | 0.00 | (2)(3) | 0.00 | (2)(3) | 0.00 | (2)(3) | 0.00 | (2)(3) | ||||||||||||||
| Net asset value, end of period | $ | 14.17 | $ | 13.07 | $ | 9.57 | $ | 10.90 | $ | 11.10 | $ | 11.96 | ||||||||||||
| TOTAL RETURN | 8.42 | %(4) | 38.46 | % | -12.20 | % | 2.40 | % | -0.11 | % | 19.72 | %(4) | ||||||||||||
| SUPPLEMENTAL DATA AND RATIOS: | ||||||||||||||||||||||||
| Net assets, end of period (thousands) | $ | 3,398 | $ | 2,409 | $ | 1,310 | $ | 6,139 | $ | 5,583 | $ | 5,711 | ||||||||||||
| Ratio of expenses to average net assets: | ||||||||||||||||||||||||
| Before fee waivers and | ||||||||||||||||||||||||
| expense reimbursement | 1.48 | %(5) | 1.69 | % | 2.09 | % | 2.36 | % | 2.91 | % | 4.96 | %(5) | ||||||||||||
| After fee waivers and | ||||||||||||||||||||||||
| expense reimbursement | 1.40 | %(5) | 1.38 | % | 1.42 | % | 1.52 | % | 1.51 | % | 1.55 | %(5) | ||||||||||||
| Ratio of net investment income/(loss) | ||||||||||||||||||||||||
| to average net assets: | ||||||||||||||||||||||||
| Before fee waivers and | ||||||||||||||||||||||||
| expense reimbursement | 0.04 | %(5) | 0.90 | % | (0.13 | )% | (0.81 | )% | (1.65 | )% | (3.79 | )%(5) | ||||||||||||
| After fee waivers and | ||||||||||||||||||||||||
| expense reimbursement | 0.12 | %(5) | 1.21 | % | 0.54 | % | 0.03 | % | (0.25 | )% | (0.38 | )%(5) | ||||||||||||
Portfolio turnover rate(6) | 4 | %(4) | 26 | % | 38 | % | 52 | % | 56 | % | 13 | %(4) | ||||||||||||
(1) | Commencement of operations. |
(2) | Based on average shares outstanding. |
(3) | Amount is less than $0.01 per share. |
(4) | Not annualized. |
(5) | Annualized. |
(6) | Portfolio turnover is calculated on the basis of the Fund as a whole. |
The accompanying notes are an integral part of these financial statements.
43
Pzena Small Cap Value Fund – Institutional Class
Financial Highlights
For a share outstanding throughout each period
| Six Months | ||||||||||||||||||||||||
| Ended | For the Period | |||||||||||||||||||||||
| August 31, | Year Ended | Year Ended | Year Ended | Year Ended | April 27, 2016(1) | |||||||||||||||||||
| 2021 | February 28, | February 29, | February 28, | February 28, | through | |||||||||||||||||||
| (Unaudited) | 2021 | 2020 | 2019 | 2018 | February 28, 2017 | |||||||||||||||||||
| PER SHARE DATA: | ||||||||||||||||||||||||
| Net asset value, beginning of period | $ | 13.14 | $ | 9.60 | $ | 10.99 | $ | 11.17 | $ | 11.99 | $ | 10.00 | ||||||||||||
| Income from investment operations: | ||||||||||||||||||||||||
| Net investment income/(loss) | 0.03 | (2) | 0.14 | (2) | 0.09 | (2) | 0.04 | (2) | 0.01 | (0.00 | )(3) | |||||||||||||
| Net realized and unrealized | ||||||||||||||||||||||||
| gain/(loss) on investments | 1.09 | 3.57 | (1.40 | ) | 0.23 | 0.03 | 2.00 | |||||||||||||||||
| Total from investment operations | 1.12 | 3.71 | (1.31 | ) | 0.27 | 0.04 | 2.00 | |||||||||||||||||
| Less distributions: | ||||||||||||||||||||||||
| Dividends from net investment income | — | (0.01 | ) | (0.08 | ) | (0.03 | ) | — | (0.01 | ) | ||||||||||||||
| Dividends from net realized | ||||||||||||||||||||||||
| gain on investments | — | (0.16 | ) | — | (0.42 | ) | (0.86 | ) | — | |||||||||||||||
| Total distributions | — | (0.17 | ) | (0.08 | ) | (0.45 | ) | (0.86 | ) | (0.01 | ) | |||||||||||||
| Redemption fees retained | — | 0.00 | (2)(3) | 0.00 | (2)(3) | 0.00 | (2)(3) | 0.00 | (2)(3) | 0.00 | (2)(3) | |||||||||||||
| Net asset value, end of period | $ | 14.26 | $ | 13.14 | $ | 9.60 | $ | 10.99 | $ | 11.17 | $ | 11.99 | ||||||||||||
| TOTAL RETURN | 8.52 | %(4) | 38.87 | % | -12.07 | % | 2.83 | % | 0.22 | % | 20.02 | %(4) | ||||||||||||
| SUPPLEMENTAL DATA AND RATIOS: | ||||||||||||||||||||||||
| Net assets, end of period (thousands) | $ | 101,138 | $ | 70,012 | $ | 30,593 | $ | 20,083 | $ | 10,355 | $ | 9,114 | ||||||||||||
| Ratio of expenses to average net assets: | ||||||||||||||||||||||||
| Before fee waivers and | ||||||||||||||||||||||||
| expense reimbursement | 1.18 | %(5) | 1.41 | % | 1.77 | % | 2.03 | % | 2.56 | % | 4.31 | %(5) | ||||||||||||
| After fee waivers and | ||||||||||||||||||||||||
| expense reimbursement | 1.10 | %(5) | 1.10 | % | 1.10 | % | 1.19 | % | 1.20 | % | 1.20 | %(5) | ||||||||||||
| Ratio of net investment income/(loss) | ||||||||||||||||||||||||
| to average net assets: | ||||||||||||||||||||||||
| Before fee waivers and | ||||||||||||||||||||||||
| expense reimbursement | 0.34 | %(5) | 1.18 | % | 0.19 | % | (0.48 | )% | (1.27 | )% | (3.20 | )%(5) | ||||||||||||
| After fee waivers and | ||||||||||||||||||||||||
| expense reimbursement | 0.42 | %(5) | 1.49 | % | 0.86 | % | 0.36 | % | 0.09 | % | (0.09 | )%(5) | ||||||||||||
Portfolio turnover rate(6) | 4 | %(4) | 26 | % | 38 | % | 52 | % | 56 | % | 13 | %(4) | ||||||||||||
(1) | Commencement of operations. |
(2) | Based on average shares outstanding. |
(3) | Amount is less than $0.01 per share. |
(4) | Not annualized. |
(5) | Annualized. |
(6) | Portfolio turnover is calculated on the basis of the Fund as a whole. |
The accompanying notes are an integral part of these financial statements.
44
Pzena International Small Cap Value Fund – Investor Class
Financial Highlights
For a share outstanding throughout each period
| Six Months | ||||||||||||||||
| Ended | For the Period | |||||||||||||||
| August 31, | Year Ended | Year Ended | July 2, 2018(1) | |||||||||||||
| 2021 | February 28, | February 29, | through | |||||||||||||
| (Unaudited) | 2021 | 2020 | February 28, 2019 | |||||||||||||
| PER SHARE DATA: | ||||||||||||||||
| Net asset value, beginning of period | $ | 9.48 | $ | 7.48 | $ | 9.07 | $ | 10.00 | ||||||||
| Income from investment operations: | ||||||||||||||||
Net investment income(2) | 0.09 | 0.09 | 0.18 | 0.03 | ||||||||||||
| Net realized and unrealized gain/(loss) on investments | 1.26 | 2.01 | (1.59 | ) | (0.79 | ) | ||||||||||
| Total from investment operations | 1.35 | 2.10 | (1.41 | ) | (0.76 | ) | ||||||||||
| Less distributions: | ||||||||||||||||
| Dividends from net investment income | — | (0.09 | ) | (0.18 | ) | (0.04 | ) | |||||||||
| Dividends from net realized gain on investments | — | (0.01 | ) | (0.00 | )(3) | (0.13 | ) | |||||||||
| Total distributions | — | (0.10 | ) | (0.18 | ) | (0.17 | ) | |||||||||
| Net asset value, end of period | $ | 10.83 | $ | 9.48 | $ | 7.48 | $ | 9.07 | ||||||||
| TOTAL RETURN | 14.13 | %(4) | 28.19 | % | -15.83 | % | -7.48 | %(4) | ||||||||
| SUPPLEMENTAL DATA AND RATIOS: | ||||||||||||||||
| Net assets, end of period (thousands) | $ | 1,601 | $ | 1,254 | $ | 819 | $ | 925 | ||||||||
| Ratio of expenses to average net assets: | ||||||||||||||||
| Before expense reimbursement | 3.37 | %(5) | 8.18 | % | 13.43 | % | 13.92 | %(5) | ||||||||
| After expense reimbursement | 1.45 | %(5) | 1.42 | % | 1.42 | % | 1.44 | %(5) | ||||||||
| Ratio of net investment income/(loss) to average net assets: | ||||||||||||||||
| Before expense reimbursement | (0.21 | )%(5) | (5.56 | )% | (9.91 | )% | (12.05 | )%(5) | ||||||||
| After expense reimbursement | 1.71 | %(5) | 1.20 | % | 2.10 | % | 0.43 | %(5) | ||||||||
Portfolio turnover rate(6) | 13 | %(4) | 32 | % | 18 | % | 32 | %(4) | ||||||||
(1) | Commencement of operations. |
(2) | Based on average shares outstanding. |
(3) | Amount is less than $0.01 per share. |
(4) | Not annualized. |
(5) | Annualized. |
(6) | Portfolio turnover is calculated on the basis of the Fund as a whole. |
The accompanying notes are an integral part of these financial statements.
45
Pzena International Small Cap Value Fund – Institutional Class
Financial Highlights
For a share outstanding throughout each period
| Six Months | ||||||||||||||||
| Ended | For the Period | |||||||||||||||
| August 31, | Year Ended | Year Ended | July 2, 2018(1) | |||||||||||||
| 2021 | February 28, | February 29, | through | |||||||||||||
| (Unaudited) | 2021 | 2020 | February 28, 2019 | |||||||||||||
| PER SHARE DATA: | ||||||||||||||||
| Net asset value, beginning of period | $ | 9.49 | $ | 7.49 | $ | 9.07 | $ | 10.00 | ||||||||
| Income from investment operations: | ||||||||||||||||
Net investment income(2) | 0.11 | 0.10 | 0.20 | 0.04 | ||||||||||||
| Net realized and unrealized gain/(loss) on investments | 1.25 | 2.01 | (1.59 | ) | (0.78 | ) | ||||||||||
| Total from investment operations | 1.36 | 2.11 | (1.39 | ) | (0.74 | ) | ||||||||||
| Less distributions: | ||||||||||||||||
| Dividends from net investment income | — | (0.10 | ) | (0.19 | ) | (0.06 | ) | |||||||||
| Dividends from net realized gain on investments | — | (0.01 | ) | (0.00 | )(3) | (0.13 | ) | |||||||||
| Total distributions | — | (0.11 | ) | (0.19 | ) | (0.19 | ) | |||||||||
| Net asset value, end of period | $ | 10.85 | $ | 9.49 | $ | 7.49 | $ | 9.07 | ||||||||
| TOTAL RETURN | 14.33 | %(4) | 28.40 | % | -15.55 | % | -7.32 | %(4) | ||||||||
| SUPPLEMENTAL DATA AND RATIOS: | ||||||||||||||||
| Net assets, end of period (thousands) | $ | 14,745 | $ | 2,107 | $ | 1,424 | $ | 1,006 | ||||||||
| Ratio of expenses to average net assets: | ||||||||||||||||
| Before expense reimbursement | 3.09 | %(5) | 7.93 | % | 13.18 | % | 13.65 | %(5) | ||||||||
| After expense reimbursement | 1.17 | %(5) | 1.17 | % | 1.17 | % | 1.17 | %(5) | ||||||||
| Ratio of net investment income/(loss) to average net assets: | ||||||||||||||||
| Before expense reimbursement | 0.07 | %(5) | (5.31 | )% | (9.66 | )% | (11.78 | )%(5) | ||||||||
| After expense reimbursement | 1.99 | %(5) | 1.45 | % | 2.35 | % | 0.70 | %(5) | ||||||||
Portfolio turnover rate(6) | 13 | %(4) | 32 | % | 18 | % | 32 | %(4) | ||||||||
(1) | Commencement of operations. |
(2) | Based on average shares outstanding. |
(3) | Amount is less than $0.01 per share. |
(4) | Not annualized. |
(5) | Annualized. |
(6) | Portfolio turnover is calculated on the basis of the Fund as a whole. |
The accompanying notes are an integral part of these financial statements.
46
Pzena International Value Fund – Investor Class
Financial Highlights
For a share outstanding throughout the period
| For the Period | ||||
June 28, 2021(1) | ||||
| through | ||||
| August 31, 2021 | ||||
| (Unaudited) | ||||
| PER SHARE DATA: | ||||
Net asset value, beginning of period | $ | 10.00 | ||
Income from investment operations: | ||||
Net investment income(2) | 0.02 | |||
| Net realized and unrealized loss on investments | (0.10 | ) | ||
| Total from investment operations | (0.08 | ) | ||
Net asset value, end of period | $ | 9.92 | ||
| TOTAL RETURN | -0.80 | %(3) | ||
| SUPPLEMENTAL DATA AND RATIOS: | ||||
Net assets, end of period (thousands) | $ | 992 | ||
Ratio of expenses to average net assets: | ||||
| Before expense reimbursement | 13.94 | %(4) | ||
| After expense reimbursement | 1.01 | %(4) | ||
Ratio of net investment income/(loss) to average net assets: | ||||
| Before expense reimbursement | (11.85 | )%(4) | ||
| After expense reimbursement | 1.08 | %(4) | ||
Portfolio turnover rate(5) | 1 | %(3) | ||
(1) | Commencement of operations. |
(2) | Based on average shares outstanding. |
(3) | Not annualized. |
(4) | Annualized. |
(5) | Portfolio turnover is calculated on the basis of the Fund as a whole. |
The accompanying notes are an integral part of these financial statements.
47
Pzena International Value Fund – Institutional Class
Financial Highlights
For a share outstanding throughout the period
| For the Period | ||||
June 28, 2021(1) | ||||
| through | ||||
| August 31, 2021 | ||||
| (Unaudited) | ||||
| PER SHARE DATA: | ||||
Net asset value, beginning of period | $ | 10.00 | ||
Income from investment operations: | ||||
Net investment income(2) | 0.02 | |||
| Net realized and unrealized loss on investments | (0.09 | ) | ||
| Total from investment operations | (0.07 | ) | ||
Net asset value, end of period | $ | 9.93 | ||
| TOTAL RETURN | -0.70 | %(3) | ||
| SUPPLEMENTAL DATA AND RATIOS: | ||||
Net assets, end of period (thousands) | $ | 993 | ||
Ratio of expenses to average net assets: | ||||
| Before expense reimbursement | 13.67 | %(4) | ||
| After expense reimbursement | 0.74 | %(4) | ||
Ratio of net investment income/(loss) to average net assets: | ||||
| Before expense reimbursement | (11.58 | )%(4) | ||
| After expense reimbursement | 1.35 | %(4) | ||
Portfolio turnover rate(5) | 1 | %(3) | ||
(1) | Commencement of operations. |
(2) | Based on average shares outstanding. |
(3) | Not annualized. |
(4) | Annualized. |
(5) | Portfolio turnover is calculated on the basis of the Fund as a whole. |
The accompanying notes are an integral part of these financial statements.
48
Pzena Funds
Notes to Financial Statements
August 31, 2021 (Unaudited)
NOTE 1 – ORGANIZATION
The Pzena Mid Cap Value Fund (the “Mid Cap Value Fund”), Pzena Emerging Markets Value Fund (the “Emerging Markets Value Fund”), Pzena Small Cap Value Fund (the “Small Cap Value Fund”), Pzena International Small Cap Value Fund (the “International Small Cap Value Fund”), and Pzena International Value Fund (the “International Value Fund”) (collectively, the “Funds”), are each a diversified series of Advisors Series Trust (the “Trust”), which is registered under the Investment Company Act of 1940, as amended, (the “1940 Act”) as an open-end management investment company. The Funds follow the investment company accounting and reporting guidance of the Financial Accounting Standards Board (“FASB”) Accounting Standard Codification Topic 946 “Financial Services – Investment Companies”.
The primary investment objective for each Fund is to achieve long-term capital appreciation. Currently, each Fund offers Investor Class and Institutional Class shares. Each class of shares differs principally in its respective distribution and shareholder servicing expenses and sales charges, if any. Each class of shares has identical rights to earnings, assets and voting privileges, except for class-specific expenses and exclusive rights to vote on matters affecting only individual classes.
The Mid Cap Value Fund and Emerging Markets Value Fund commenced operations on March 31, 2014. The Small Cap Value Fund commenced operations on April 27, 2016, the International Small Cap Value Fund commenced operations on July 2, 2018, and the International Value Fund commenced operations on June 28, 2021.
NOTE 2 – SIGNIFICANT ACCOUNTING POLICIES
The following is a summary of significant accounting policies consistently followed by the Funds in the preparation of their financial statements. These policies are in conformity with accounting principles generally accepted in the United States of America.
Security Valuation – All investments in securities are recorded at their estimated fair value, as described in Note 3.
Federal Income Taxes – It is the policy of the Funds to comply with the requirements of Subchapter M of the Internal Revenue Code applicable to regulated investment companies and to distribute substantially all of its taxable income to shareholders. Therefore, no Federal income or excise tax provision is required.
The Funds recognize the tax benefits of uncertain tax positions only where the position is “more likely than not” to be sustained assuming examination by tax authorities. The tax returns of the Funds’ prior three fiscal years are open for examination. Management has reviewed all open tax years in major jurisdictions and concluded that there is no impact on the Funds’ net assets and no tax liability resulting from unrecognized tax events relating to uncertain income tax positions taken or expected to be taken on a tax return. The Funds identify their major tax jurisdictions as U.S. Federal and the state of Wisconsin. The Funds are not aware of any tax positions for which it is reasonably possible that the total amounts of unrecognized tax benefits will change materially in the next twelve months.
Security Transactions, Income and Distributions – Security transactions are accounted for on the trade date. Realized gains and losses on securities sold are determined on the basis of identified cost. Dividend income and distributions to shareholders are recorded on the ex-dividend date. Withholding taxes on foreign dividends have been provided for in accordance with each Fund’s understanding of the applicable country’s tax rules and rates. The Funds will make distributions of dividends and capital gains, if any, at least annually, typically in December. The amount of dividends and distributions to shareholders from net investment income and net realized capital gains is determined in accordance with Federal income tax regulations which differ from accounting principles generally accepted in the United States of America.
Investment income, expenses (other than those specific to the class of shares), and realized and unrealized gains and losses on investments are allocated to the separate classes of each Fund based upon their relative net assets on the date income is earned or expensed and realized and unrealized gains and losses are incurred.
Each Fund is charged for those expenses that are directly attributable to the Fund, such as investment advisory, custody and transfer agent fees. Expenses that are not attributable to a Fund are typically allocated among the Funds in proportion to their respective net assets. Common expenses of the Trust are typically allocated among the funds in the Trust based on a fund’s respective net assets, or by other equitable means.
Reclassification of Capital Accounts – Accounting principles generally accepted in the United States of America require that certain components of net assets relating to permanent differences be reclassified between financial and tax reporting. These reclassifications have no effect on net assets or net asset value per share.
49
Pzena Funds
Notes to Financial Statements (Continued)
August 31, 2021 (Unaudited)
Use of Estimates – The preparation of financial statements in conformity with accounting principles generally accepted in the United States of America requires management to make estimates and assumptions that affect the reported amounts of assets and liabilities and disclosure of contingent assets and liabilities at the date of the financial statements and the reported amounts of increases and decreases in net assets from operation during the reporting period. Actual results could differ from those estimates.
Foreign Currency – Investment securities and other assets and liabilities denominated in foreign currencies are translated into U.S. dollar amounts at the date of valuation. Purchases and sales of investment securities and income and expense items denominated in foreign currencies are translated to U.S. dollar amounts on the respective dates of such transactions.
The Funds do not isolate those portions of the results of operations resulting from changes in foreign exchange rates on investments from the fluctuations arising from changes in market prices of securities held. Such fluctuations are included with the net realized and unrealized gain or loss from investments.
Reported net realized foreign exchange gains or losses arise from sales of foreign currencies, currency gains or losses realized between the trade and settlement dates on securities transactions, and the difference between the amounts of dividends, interest, and foreign withholding taxes recorded on the Funds’ books and the U.S. dollar equivalent of the amounts actually received or paid. Net unrealized foreign exchange gains and losses arise from changes in the fair values of assets and liabilities, other than investments in securities at fiscal period-end, resulting from changes in exchange rates.
REITs – The Funds can make certain investments in real estate investment trusts (“REITs”) which pay dividends to their shareholders based upon funds available from operations. It is quite common for these dividends to exceed the REITs’ taxable earnings and profits resulting in the excess portion of such dividends being designated as a return of capital. Each Fund intends to include the gross dividends from such REITs in its annual distributions to its shareholders and, accordingly, a portion of each Fund’s distributions may also be designated as a return of capital.
Events Subsequent to the Fiscal Period End – In preparing the financial statements as of August 31, 2021, management considered the impact of subsequent events for the potential recognition or disclosure in the financial statements. Management has determined there were no subsequent events that would need to be disclosed in the Funds’ financial statements.
NOTE 3 – SECURITIES VALUATION
The Funds have adopted authoritative fair value accounting standards which establish an authoritative definition of fair value and set out a hierarchy for measuring fair value. These standards require additional disclosures about the various inputs and valuation techniques used to develop the measurements of fair value, a discussion in changes in valuation techniques and related inputs during the period and expanded disclosure of valuation levels for major security types. These inputs are summarized in the three broad levels listed below:
| Level 1 – | Unadjusted quoted prices in active markets for identical assets or liabilities that the Fund has the ability to access. |
| Level 2 – | Observable inputs other than quoted prices included in Level 1 that are observable for the asset or liability, either directly or indirectly. These inputs may include quoted prices for the identical instrument on an inactive market, prices for similar instruments, interest rates, prepayment speeds, credit risk, yield curves, default rates and similar data. |
| Level 3 – | Unobservable inputs for the asset or liability, to the extent relevant observable inputs are not available, representing the Funds’ own assumptions about the assumptions a market participant would use in valuing the asset or liability, and would be based on the best information available. |
Following is a description of the valuation techniques applied to the Funds’ major categories of assets and liabilities measured at fair value on a recurring basis:
Each Fund determines the fair value of its investments and computes its net asset value per share as of the close of regular trading on the New York Stock Exchange (4:00 pm EST).
Equity Securities – Equity securities, including common stocks, preferred stocks, foreign-issued common stocks, exchange-traded funds, closed-end mutual funds and REITs, that are primarily traded on a national securities exchange shall be valued at the last sale price on the exchange on which they are primarily traded on the day of valuation or, if there has been no sale on such day, at the mean between the bid and asked prices. Securities primarily traded in the NASDAQ Global Market System for which market quotations are readily available shall be valued using the NASDAQ Official Closing Price (“NOCP”). If the NOCP is not available, such securities shall be valued at the last sale price on the day of valuation, or if there has been no sale on such day, at the mean between the bid and
50
Pzena Funds
Notes to Financial Statements (Continued)
August 31, 2021 (Unaudited)
asked prices. Over-the-counter securities which are not traded in the NASDAQ Global Market System shall be valued at the most recent sales price. The values for foreign securities are reported in local currency and converted to U.S. dollars using currency exchange rates. Exchange rates are provided daily by a recognized independent pricing agent. To the extent these securities are actively traded and valuation adjustments are not applied, they are categorized in Level 1 of the fair value hierarchy.
Participatory Notes – Participatory notes are valued with an evaluated price provided by an independent pricing service. These securities will generally be classified in Level 2 of the fair value hierarchy.
Investment Companies – Investments in open-end mutual funds, including money market funds, are valued at their net asset value per share provided by the service agent of the funds and will be classified in Level 1 of the fair value hierarchy.
Short-Term Securities – Short-term securities having a maturity of less than 60 days are valued at the evaluated mean between bid and asked price. To the extent the inputs are observable and timely, these securities would be classified in Level 2 of the fair value hierarchy.
Restricted Securities – The Funds may invest in securities that are subject to legal or contractual restrictions on resale (“restricted securities”). Restricted securities are often purchased in private placement transactions, are not registered under the Securities Act of 1933, may have contractual restrictions on resale, and may be valued under methods approved by the Board as reflecting fair value. Certain restricted securities eligible for resale to qualified institutional investors, including Rule 144a securities, are not subject to the limitation on the Funds’ investment in illiquid securities if they are determined to be liquid in accordance with the procedures adopted by the Board.
Securities for which market quotations are not readily available or if the closing price does not represent fair value, are valued following procedures approved by the Board. These procedures consider many factors, including the type of security, size of holding, trading volume and news events. There can be no assurance that the Funds could obtain the fair value assigned to a security if they were to sell the security at approximately the time at which the Funds determine their net asset value per share.
The Board has delegated day-to-day valuation issues to a Valuation Committee of the Trust which is comprised of representatives from the Funds’ administrator, U.S. Bancorp Fund Services, LLC, doing business as U.S. Bank Global Fund Services (“Fund Services”). The function of the Valuation Committee is to value securities where current and reliable market quotations are not readily available or the closing price does not represent fair value by following procedures approved by the Board. These procedures consider many factors, including the type of security, size of holding, trading volume and news events. All actions taken by the Valuation Committee are subsequently reviewed and ratified by the Board.
Depending on the relative significance of the valuation inputs, fair valued securities may be classified in either Level 2 or Level 3 of the fair value hierarchy.
The inputs or methodology used for valuing securities are not an indication of the risk associated with investing in those securities.
The following is a summary of the inputs used to value the Funds’ securities as of August 31, 2021:
| Mid Cap Value Fund | Level 1 | Level 2 | Level 3 | Total | ||||||||||||
| Common Stocks | ||||||||||||||||
| Basic Materials | $ | 7,319,276 | $ | — | $ | — | $ | 7,319,276 | ||||||||
| Consumer Discretionary | 22,652,333 | — | — | 22,652,333 | ||||||||||||
| Consumer Staples | 2,774,671 | — | — | 2,774,671 | ||||||||||||
| Energy | 11,888,108 | — | — | 11,888,108 | ||||||||||||
| Financials | 39,891,267 | — | — | 39,891,267 | ||||||||||||
| Health Care | 3,399,661 | — | — | 3,399,661 | ||||||||||||
| Industrials | 24,799,312 | — | — | 24,799,312 | ||||||||||||
| Technology | 9,925,807 | — | — | 9,925,807 | ||||||||||||
| Utilities | 10,045,537 | — | — | 10,045,537 | ||||||||||||
| Total Common Stocks | 132,695,972 | — | — | 132,695,972 | ||||||||||||
| Short-Term Investment | 814,609 | — | — | 814,609 | ||||||||||||
| Total Investments | $ | 133,510,581 | $ | — | $ | — | $ | 133,510,581 | ||||||||
51
Pzena Funds
Notes to Financial Statements (Continued)
August 31, 2021 (Unaudited)
| Emerging Markets Value Fund | Level 1 | Level 2 | Level 3 | Total | ||||||||||||
| Common Stocks | ||||||||||||||||
| Brazil | $ | 19,409,507 | $ | — | $ | — | $ | 19,409,507 | ||||||||
| China | 65,131,141 | — | 5,403 | 65,136,544 | ||||||||||||
| Czech Republic | 10,893,613 | — | — | 10,893,613 | ||||||||||||
| Hong Kong | 54,816,615 | — | — | 54,846,615 | ||||||||||||
| Hungary | 12,044,175 | — | — | 12,044,175 | ||||||||||||
| India | 28,097,195 | — | — | 28,097,195 | ||||||||||||
| Indonesia | 4,270,577 | — | — | 4,270,577 | ||||||||||||
| Malaysia | 3,701,819 | — | — | 3,701,819 | ||||||||||||
| Republic of Korea | 82,751,225 | — | — | 82,751,225 | ||||||||||||
| Romania | 5,151,408 | — | — | 5,151,408 | ||||||||||||
| Russian Federation | 20,759,971 | — | — | 20,759,971 | ||||||||||||
| Singapore | 9,562,539 | — | — | 9,562,539 | ||||||||||||
| South Africa | 13,742,415 | — | — | 13,742,415 | ||||||||||||
| Taiwan | 60,819,148 | — | — | 60,819,148 | ||||||||||||
| Thailand | 17,602,282 | — | — | 17,602,282 | ||||||||||||
| Turkey | 12,359,629 | — | — | 12,359,629 | ||||||||||||
| United Arab Emirates | 10,320,118 | — | — | 10,320,118 | ||||||||||||
| United Kingdom | 14,899,389 | — | — | 14,899,389 | ||||||||||||
| United States | 21,581,135 | — | — | 21,581,135 | ||||||||||||
| Total Common Stocks | 467,943,901 | — | 5,403 | 467,949,304 | ||||||||||||
| Preferred Stocks | ||||||||||||||||
| Brazil | 23,122,850 | — | — | 23,122,850 | ||||||||||||
| Republic of Korea | 2,127,265 | — | — | 2,127,265 | ||||||||||||
| Total Preferred Stocks | 25,250,115 | — | — | 25,250,115 | ||||||||||||
| Short-Term Investment | 15,979,641 | — | — | 15,979,641 | ||||||||||||
| Total Investments | $ | 509,173,657 | $ | — | $ | 5,403 | $ | 509,179,060 | ||||||||
| Small Cap Value Fund | Level 1 | Level 2 | Level 3 | Total | ||||||||||||
| Common Stocks | ||||||||||||||||
| Basic Materials | $ | 5,571,036 | $ | — | $ | — | $ | 5,571,036 | ||||||||
| Consumer Discretionary | 11,349,207 | — | — | 11,349,207 | ||||||||||||
| Consumer Staples | 3,360,140 | — | — | 3,360,140 | ||||||||||||
| Energy | 7,164,758 | — | — | 7,164,758 | ||||||||||||
| Financials | 29,582,093 | — | — | 29,582,093 | ||||||||||||
| Health Care | 6,089,311 | — | — | 6,089,311 | ||||||||||||
| Industrials | 25,644,514 | — | — | 25,644,514 | ||||||||||||
| Technology | 10,248,298 | — | — | 10,248,298 | ||||||||||||
| Total Common Stocks | 99,009,357 | — | — | 99,009,357 | ||||||||||||
| REIT | 1,459,544 | — | — | 1,459,544 | ||||||||||||
| Short-Term Investment | 4,032,739 | — | — | 4,032,739 | ||||||||||||
| Total Investments | $ | 104,501,640 | $ | — | $ | — | $ | 104,501,640 | ||||||||
52
Pzena Funds
Notes to Financial Statements (Continued)
August 31, 2021 (Unaudited)
| International Small Cap Value Fund | Level 1 | Level 2 | Level 3 | Total | ||||||||||||
| Common Stocks | ||||||||||||||||
| Austria | $ | 319,106 | $ | — | $ | — | $ | 319,106 | ||||||||
| Canada | 1,248,285 | — | — | 1,248,285 | ||||||||||||
| France | 1,686,223 | — | — | 1,686,223 | ||||||||||||
| Germany | 1,104,822 | — | — | 1,104,822 | ||||||||||||
| Hong Kong | 964,286 | — | — | 964,286 | ||||||||||||
| Ireland | 717,571 | — | — | 717,571 | ||||||||||||
| Israel | 319,811 | — | — | 319,811 | ||||||||||||
| Italy | 1,546,706 | — | — | 1,546,706 | ||||||||||||
| Japan | 2,393,483 | — | — | 2,393,483 | ||||||||||||
| Netherlands | 667,895 | — | — | 667,895 | ||||||||||||
| Norway | 255,923 | — | — | 255,923 | ||||||||||||
| Republic of Korea | 774,153 | — | — | 774,153 | ||||||||||||
| Spain | 292,835 | — | — | 292,835 | ||||||||||||
| Taiwan | 301,586 | — | — | 301,586 | ||||||||||||
| United Kingdom | 3,278,640 | — | — | 3,278,640 | ||||||||||||
| Total Common Stocks | 15,871,325 | — | — | 15,871,325 | ||||||||||||
| Short-Term Investment | 432,554 | — | — | 432,554 | ||||||||||||
| Total Investments | $ | 16,303,879 | $ | — | $ | — | $ | 16,303,879 | ||||||||
| International Value Fund | Level 1 | Level 2 | Level 3 | Total | ||||||||||||
| Common Stocks | ||||||||||||||||
| Belgium | $ | 17,605 | $ | — | $ | — | $ | 17,605 | ||||||||
| Brazil | 36,721 | — | — | 36,721 | ||||||||||||
| China | 17,024 | — | — | 17,024 | ||||||||||||
| Denmark | 65,061 | — | — | 65,061 | ||||||||||||
| Finland | 54,677 | — | — | 54,677 | ||||||||||||
| France | 271,472 | — | — | 271,472 | ||||||||||||
| Germany | 175,473 | — | — | 175,473 | ||||||||||||
| Hong Kong | 19,229 | — | — | 19,229 | ||||||||||||
| Italy | 38,990 | — | — | 38,990 | ||||||||||||
| Japan | 333,479 | — | — | 333,479 | ||||||||||||
| Luxembourg | 23,134 | — | — | 23,134 | ||||||||||||
| Netherlands | 53,652 | — | — | 53,652 | ||||||||||||
| Republic of Korea | 61,468 | — | — | 61,468 | ||||||||||||
| Singapore | 48,392 | — | — | 48,392 | ||||||||||||
| Spain | 25,710 | — | — | 25,710 | ||||||||||||
| Switzerland | 163,842 | — | — | 163,842 | ||||||||||||
| Taiwan | 47,556 | — | — | 47,556 | ||||||||||||
| United Kingdom | 434,486 | — | — | 434,486 | ||||||||||||
Total Common Stocks | 1,887,971 | — | — | 1,887,971 | ||||||||||||
| Preferred Stock | ||||||||||||||||
| Germany | 46,349 | — | — | 46,349 | ||||||||||||
| Total Preferred Stock | 46,349 | — | — | 46,349 | ||||||||||||
| Short-Term Investment | 70,954 | — | — | 70,954 | ||||||||||||
| Total Investments | $ | 2,005,274 | $ | — | $ | — | $ | 2,005,274 | ||||||||
Refer to the Funds’ schedule of investments for a detailed break-out of securities.
53
Pzena Funds
Notes to Financial Statements (Continued)
August 31, 2021 (Unaudited)
Pzena Emerging Markets Value Fund
Level 3 Reconciliation Disclosure (Unaudited)
| Common Stock | ||||
Balance as of February 28, 2021 | $ | — | ||
| Transfer in at August 31, 2021 | 2,205,607 | |||
| Purchases | 1,558,879 | |||
| Change in unrealized depreciation | (3,759,083 | ) | ||
Balance as of August 31, 2021 | $ | 5,403 | ||
Change in unrealized depreciation during the period for | ||||
Level 3 investments held at August 31, 2021 | $ | (3,759,083 | ) | |
The Level 3 investments as of August 31, 2021 represented less than 0.01% of net assets and did not warrant a disclosure of significant unobservable valuation inputs.
In December 2020, the SEC adopted a new rule providing a framework for fund valuation practices (“Rule 2a-5”). Rule 2a-5 establishes requirements for determining fair value in good faith for purposes of the 1940 Act. Rule 2a-5 will permit fund boards to designate certain parties to perform fair value determinations, subject to board oversight and certain other conditions. Rule 2a-5 also defines when market quotations are “readily available” for purposes of the 1940 Act and the threshold for determining whether a fund must fair value a security. In connection with Rule 2a-5, the SEC also adopted related recordkeeping requirements and is rescinding previously issued guidance, including with respect to the role of a board in determining fair value and the accounting and auditing of fund investments. The Funds will be required to comply with the rules by September 8, 2022. Management is currently assessing the potential impact of the new rules on the Funds’ financial statements.
The global outbreak of COVID-19 (commonly referred to as “coronavirus”) has disrupted economic markets and the prolonged economic impact is uncertain. The ultimate economic fallout from the pandemic, and the long-term impact on economies, markets, industries and individual issuers, are not known. The operational and financial performance of the issuers of securities in which the Funds invest depends on future developments, including the duration and spread of the outbreak, and such uncertainty may in turn adversely affect the value and liquidity of the Funds’ investments, impair the Funds’ ability to satisfy redemption requests, and negatively impact the Funds’ performance.
NOTE 4 – INVESTMENT ADVISORY FEE AND OTHER TRANSACTIONS WITH AFFILIATES
The Funds have an investment advisory agreement with Pzena Investment Management, LLC (the “Adviser) pursuant to which the Adviser is responsible for providing investment management services to each Fund. The Adviser furnishes all investment advice, office space and facilities, and provides most of the personnel needed by the Funds. As compensation for its services, the Adviser is entitled to a monthly management fee, based upon the average daily net assets of the Funds at the annual rates of:
Mid Cap Value Fund | 0.80 | % | |||
Emerging Markets Value Fund | 1.00 | % | |||
Small Cap Value Fund | 0.95 | % | |||
International Small Cap Value Fund | 1.00 | % | |||
International Value Fund | 0.65 | % |
For the six months ended August 31, 2021, the Funds incurred the following in advisory fees:
| Advisory Fees | |||||
Mid Cap Value Fund | $ | 524,467 | |||
Emerging Markets Value Fund | 2,361,332 | ||||
Small Cap Value Fund | 429,824 | ||||
International Small Cap Value Fund | 43,820 | ||||
International Value Fund | 2,214 | ||||
54
Pzena Funds
Notes to Financial Statements (Continued)
August 31, 2021 (Unaudited)
The Funds are responsible for their own operating expenses. The Adviser has contractually agreed to waive a portion or all of its management fees and pay expenses of the Funds to ensure that the net annual operating expenses (excluding acquired fund fees, interest expense, taxes, dividends on securities sold short, extraordinary expenses, Rule 12b-1 fees, shareholder servicing fees, and other class-specific expenses) do not exceed the following amounts of the average daily net assets for each class of shares:
| Emerging | International | |||
| Mid Cap | Markets | Small Cap | Small Cap | International |
Value Fund | Value Fund | Value Fund | Value Fund | Value Fund |
| 0.90% | 1.08% | 1.10% | 1.17% | 0.74% |
Any such reduction made by the Adviser in its fees or payment of expenses which are the Funds’ obligation are subject to reimbursement by the Funds to the Adviser, if so requested by the Adviser, in any subsequent month in the 36-month period from the date of the management fee reduction and expense payment if the aggregate amount actually paid by the Funds toward the operating expenses for such fiscal year (taking into account the reimbursement) will not cause the Fund to exceed the lesser of: (1) the expense limitation in place at the time of the management fee reduction and expense payment; or (2) the expense limitation in place at the time of the reimbursement. Any such reimbursement is also contingent upon Board of Trustees review and approval at the time the reimbursement is made. Such reimbursement may not be paid prior to the Funds’ payment of current ordinary operating expenses. For the six months ended August 31, 2021, the Adviser reduced its fees and reduced other operating expenses in the amount of $47,424 for the Mid Cap Value Fund, $162,148 for the Emerging Markets Value Fund, $36,881 for the Small Cap Value Fund, $84,043 for the International Small Cap Value Fund, and $44,045 for the International Value Fund. The Adviser may recapture portions of the amounts shown below no later than the corresponding dates:
| 2/28/2022 | 2/28/2023 | 2/28/2024 | 8/31/2024 | Total | |||||||||||||||||
Mid Cap Value Fund | $ | 95,776 | $ | 172,679 | $ | 131,027 | $ | 47,424 | $ | 446,906 | |||||||||||
Emerging Markets Value Fund | 39,870 | 101,496 | 401,667 | 162,148 | 705,181 | ||||||||||||||||
Small Cap Value Fund | 84,941 | 194,936 | 121,914 | 36,881 | 438,672 | ||||||||||||||||
International Small Cap Value Fund | 113,544 | 234,010 | 158,624 | 84,043 | 590,221 | ||||||||||||||||
International Value Fund | N/A | N/A | N/A | 44,045 | 44,045 | ||||||||||||||||
Fund Services serves as the Funds’ administrator, fund accountant, and transfer agent. U.S. Bank N.A. serves as custodian (the “Custodian”) to the Funds. The Custodian is an affiliate of Fund Services. Fund Services maintains the Funds’ books and records, calculates the Funds’ NAV, prepares various federal and state regulatory filings, coordinates the payment of fund expenses, reviews expense accruals and prepares materials supplied to the Board. The officers of the Trust and the Chief Compliance Officer are also employees of Fund Services. Fees paid by the Funds for administration and accounting, transfer agency, custody and compliance services for the six months ended August 31, 2021 are disclosed in the statements of operations.
Quasar Distributors, LLC (“Quasar” or the “Distributor”) acts as the Fund’s principal underwriter in a continuous public offering of the Fund’s shares. Quasar is a wholly-owned broker-dealer subsidiary of Foreside Financial Group, LLC. “). On July 7, 2021, Foreside announced that it had entered into a definitive purchase and sale agreement with Genstar Capital (“Genstar”) such that Genstar would acquire a majority stake in Foreside. The transaction is expected to close at the end of the third quarter of 2021. The Board approved continuing the distribution agreement with Quasar at the close of the transaction.
NOTE 5 – 12b-1 DISTRIBUTION FEES
The Funds have adopted a Distribution Plan pursuant to Rule 12b-1 (the “Plan”). The Plan permits the Funds to pay for distribution and related expenses at an annual rate of up to 0.25% of the average daily net assets of the Funds’ Investor Class shares. The expenses covered by the Plan may include the cost in connection with the promotion and distribution of shares and the provision of personal services to shareholders, including, but not necessarily limited to, advertising, compensation to underwriters, dealers and selling personnel, the printing and mailing of prospectuses to other than current Fund shareholders, and the printing and mailing of sales literature. Payments made pursuant to the Plan will represent compensation for distribution and service activities, not reimbursements for specific expenses incurred. For the six months ended August 31, 2021, the 12b-1 distribution fees incurred under the Plan by each of the Fund’s Investor Class shares are disclosed in the statements of operations.
55
Pzena Funds
Notes to Financial Statements (Continued)
August 31, 2021 (Unaudited)
NOTE 6 – SHAREHOLDER SERVICING FEES
The Funds have entered into a shareholder servicing agreement (the “Agreement”) with the Adviser, under which the Adviser will provide, or arrange for others to provide, certain specified shareholder services. As compensation for the provision of shareholder services, the Funds may pay servicing fees at an annual rate of up to 0.10% of the average daily net assets of the Investor Class shares. Payments to the Adviser under the Agreement may reimburse the Adviser for payments it makes to selected brokers, dealers and administrators which have entered into service agreements with the Adviser for services provided to shareholders of each Fund. The services provided by such intermediaries are primarily designed to assist shareholders of the Funds and include the furnishing of office space and equipment, telephone facilities, personnel, and assistance to the Funds in servicing such shareholders. Services provided by such intermediaries also include the provision of support services to the Funds and include establishing and maintaining shareholders’ accounts and record processing, purchase and redemption transactions, answering routine client inquiries regarding the Funds, and providing such other personal services to shareholders as the Funds may reasonably request. For the six months ended August 31, 2021, the shareholder servicing fees incurred under the Agreement by each of the Fund’s Investor Class shares are disclosed in the statements of operations.
NOTE 7 – PURCHASES AND SALES OF SECURITIES
For the six months ended August 31, 2021, the cost of purchases and the proceeds from sales of securities, excluding short-term securities, were as follows:
| Purchases | Sales | ||||||||
Mid Cap Value Fund | $ | 18,823,552 | $ | 14,313,058 | |||||
Emerging Markets Value Fund | 94,100,460 | 29,650,613 | |||||||
Small Cap Value Fund | 28,830,702 | 3,798,428 | |||||||
International Small Cap Value Fund | 13,021,698 | 1,153,089 | |||||||
International Value Fund | 1,962,467 | 9,804 | |||||||
There were no purchases or sales of long-term U.S. Government securities.
NOTE 8 – CONTROL OWNERSHIP
The beneficial ownership, either directly or indirectly of more than 25% of the voting securities of a Fund creates a presumption of control of the Fund, under Section 2(a)(9) of the 1940 Act. The following table reflects shareholders that maintain accounts of more than 25% of the voting securities of a Fund as of August 31, 2021:
Fund | Shareholder | Percent of Shares Held |
Mid Cap Value Fund | Mac & Co. | 45% |
Emerging Markets Value Fund | National Financial Services, LLC | 55% |
Small Cap Value Fund | Pershing, LLC | 44% |
Charles Schwab & Co. | 32% | |
International Small Cap Value Fund | Pzena Investment Management, LLC | 51% |
ValueQuest Partners, LLC | 37% | |
International Value Fund | Pzena Investment Management, LLC | 100% |
NOTE 9 – LINE OF CREDIT
The Funds have a secured line of credit in the amount of $25,000,000. This line of credit is intended to provide short-term financing, if necessary, subject to certain restrictions, in connection with shareholder redemptions. The credit facility is with the Funds’ custodian, U.S. Bank N.A. During the six months ended August 31, 2021, the Emerging Markets Value Fund, the Small Cap Value Fund, the International Small Cap Value Fund, and the International Value Fund did not draw upon the line of credit. During the six months ended August 31, 2021, the Mid Cap Value Fund had an average daily outstanding balance of $17,652, a weighted average interest rate of 3.25%, incurred interest expense of $293 and had a maximum amount outstanding of $1,716,000. At August 31, 2021, the Funds had no outstanding loan amounts.
56
Pzena Funds
Notes to Financial Statements (Continued)
August 31, 2021 (Unaudited)
NOTE 10 – INCOME TAXES AND DISTRIBUTIONS TO SHAREHOLDERS
As of February 28, 2021, the Funds’ most recently completed fiscal year end, the components of accumulated earnings/(losses) on a tax basis were as follows:
| Emerging | International | |||||||||||||||
| Mid Cap | Markets | Small Cap | Small Cap | |||||||||||||
| Value Fund | Value Fund | Value Fund | Value Fund | |||||||||||||
Cost of investments(a) | $ | 81,143,928 | $ | 371,013,334 | $ | 59,878,248 | $ | 3,011,978 | ||||||||
| Gross unrealized appreciation | 41,656,619 | 87,900,071 | 15,792,325 | 669,661 | ||||||||||||
| Gross unrealized depreciation | (4,945,383 | ) | (43,200,456 | ) | (2,575,792 | ) | (276,385 | ) | ||||||||
Net unrealized appreciation(a) | 36,711,236 | 44,699,615 | 13,216,533 | 393,276 | ||||||||||||
| Net unrealized on foreign currency | — | (54,124 | ) | — | (94 | ) | ||||||||||
| Undistributed ordinary income | 1,071,635 | 1,600,044 | 570,926 | 33,493 | ||||||||||||
| Total distributable earnings | 1,071,635 | 1,600,044 | 570,926 | 33,493 | ||||||||||||
| Other accumulated gains/(losses) | (786,746 | ) | (2,195,384 | ) | (1,078,724 | ) | (329,183 | ) | ||||||||
| Total accumulated earnings/(losses) | $ | 36,996,125 | $ | 44,050,151 | $ | 12,708,735 | $ | 97,492 | ||||||||
| (a) | The difference between the book basis and tax basis net unrealized appreciation and cost is attributable primarily to the tax deferral of losses on wash sales adjustments. |
At February 28, 2021, the following Funds had tax basis capital losses to offset future capital gains:
| Long-Term Capital | Short-Term Capital | |||||||||
| Loss Carryover | Loss Carryover | Expires | ||||||||
Mid Cap Value Fund | $ | 786,746 | $ | — | Indefinite | |||||
Emerging Markets Value Fund | 2,195,384 | — | Indefinite | |||||||
Small Cap Value Fund | 1,078,724 | — | Indefinite | |||||||
International Small Cap Value Fund | 291,427 | 37,756 | Indefinite | |||||||
The tax character of distributions paid during the six months ended August 31, 2021 and the year ended February 28, 2021 was as follows:
| Six Months Ended | Year Ended | ||||||||
| August 31, 2021 | February 28, 2021 | ||||||||
| Mid Cap Value Fund | |||||||||
| Ordinary income | $ | — | $ | 1,034,328 | |||||
| Long-term capital gains | — | 1,595,007 | |||||||
| Emerging Markets Value Fund | |||||||||
| Ordinary income | $ | — | $ | 3,686,619 | |||||
| Long-term capital gains | — | 913,668 | |||||||
| Small Cap Value Fund | |||||||||
| Ordinary income | $ | — | $ | 41,860 | |||||
| Long-term capital gains | — | 717,640 | |||||||
| International Small Cap Value Fund | |||||||||
| Ordinary income | $ | — | $ | 35,826 | |||||
57
Pzena Funds
Notes to Financial Statements (Continued)
August 31, 2021 (Unaudited)
NOTE 11 – PRINCIPAL RISKS
Below is a summary of some, but not all, of the principal risks of investing in the Funds, each of which may adversely affect a Fund’s net asset value and total return. The Funds’ most recent prospectus provides further descriptions of each Fund’s investment objective, principal investment strategies and principal risks. The following risks apply to all Funds, unless specifically noted.
• Currency Risk. Changes in foreign currency exchange rates will affect the value of what the Funds own and the Funds’ share price. Generally, when the U.S. dollar rises in value against a foreign currency, an investment in that country loses value because that currency is worth fewer U.S. dollars. Devaluation of a currency by a country’s government or banking authority also will have a significant impact on the value of any investments denominated in that currency. Currency markets generally are not as regulated as securities markets and the risk may be higher in emerging markets.
• Emerging Markets Risk. In addition to the risks of foreign securities in general, investments in emerging markets may be riskier than investments in or exposure to investments in the U.S. and other developed markets for many reasons, including smaller market capitalizations, greater price volatility, less liquidity, a higher degree of political and economic instability (which can freeze, restrict or suspend transactions in those investments, including cash), the impact of economic sanctions, less governmental regulation and supervision of the financial industry and markets, and less stringent financial reporting and accounting standards and controls.
• Equity Securities Risk. The price of equity securities may rise or fall because of economic or political changes or changes in a company’s financial condition, sometimes rapidly or unpredictably. These price movements may result from factors affecting individual companies, sectors or industries selected for the Funds’ portfolio or the securities market as a whole, such as changes in economic or political conditions.
• Foreign Securities Risk. Foreign securities are subject to special risks in addition to those of issuers located in the U.S. Foreign securities can be more volatile than domestic (U.S.) securities. Securities markets of other countries are generally smaller than U.S. securities markets. Many foreign securities may be less liquid than U.S. securities, which could affect the Funds’ investments. Foreign securities may be adversely affected by political instability; changes in currency exchange rates; inefficient markets and higher transaction costs; foreign economic conditions; or inadequate or different regulatory and accounting standards.
• Management Risk. Each Fund is an actively managed investment portfolio and each Fund relies on the Adviser’s ability to pursue the Fund’s goal. The Adviser will apply its investment techniques and risk analyses in making investment decisions for the Funds, but there can be no guarantee that its decisions will produce the desired results.
• Market and Regulatory Risk. Events in the financial markets and economy may cause volatility and uncertainty and adversely affect performance. Such adverse effect on performance could include a decline in the value and liquidity of securities held by the Funds, unusually high and unanticipated levels of redemptions, an increase in portfolio turnover, a decrease in NAV, and an increase in Fund expenses. In addition, because of interdependencies between markets, events in one market may adversely impact markets or issuers in which the Funds invest in unforeseen ways. Traditionally, liquid investments may experience periods of diminished liquidity. During a general downturn in the financial markets, multiple asset classes may decline in value and the Funds may lose value, regardless of the individual results of the securities and other instruments in which the Funds invest. It is impossible to predict whether or for how long such market events will continue, particularly if they are unprecedented, unforeseen or widespread events or conditions. Therefore, it is important to understand that the value of your investment may fall, sometimes sharply and for extended periods, and you could lose money.
• Mid Cap Company Risk (Mid Cap Value Fund). A mid cap company may be more vulnerable to adverse business or economic events than stocks of larger companies. These stocks present greater risks than securities of larger, more diversified companies.
• Small Cap Company Risk (Small Cap Value Fund and International Small Cap Value Fund). Securities of companies with smaller market capitalizations tend to be more volatile and less liquid than larger company stocks. Smaller companies may have no or relatively short operating histories, or be newly public companies.
• Value Style Investing Risk. The Funds emphasize a “value” style of investing, which targets undervalued companies with characteristics for improved valuations. This style of investing is subject to the risk that the valuations never improve or that the returns on “value” securities may not move in tandem with the returns on other styles of investing or the stock market in general.
58
Pzena Funds
Expense Example
August 31, 2021 (Unaudited)
As a shareholder of a Fund, you incur two types of costs: (1) transaction costs including sales charges (loads), if applicable; redemption fees, if applicable; and exchange fees; and (2) ongoing costs, including management fees; distribution and/or service (12b-1 fees); and other Fund expenses. This Example is intended to help you understand your ongoing costs (in dollars) of investing in the Fund and to compare these costs with the ongoing costs of investing in other mutual funds.
The Examples for the Mid Cap Value Fund, Emerging Markets Value Fund, Small Cap Value Fund, and International Small Cap Value Fund are based on an investment of $1,000 invested at the beginning of the period indicated and held for the entire period (March 1, 2021 to August 31, 2021). The Example for the International Value Fund is based on an investment of $1,000 invested at the beginning of the period indicated and held for the partial period (June 28, 2021 to August 31, 2021).
Actual Expenses
The first line of the tables below provides information about actual account values and actual expenses. The example below includes, but is not limited to, management fees, fund accounting, custody and transfer agent fees. However, the example below does not include portfolio trading commissions and related expenses. In addition, you will be assessed fees for outgoing wire transfers, returned checks, and stop payment orders at prevailing rates changes by U.S. Bancorp Fund Services, LLC, the Funds’ transfer agent. You may use the information in these columns, together with the amount you invested, to estimate the expenses that you paid over the period. Simply divide your account value by $1,000 (for example, an $8,600 account value divided by $1,000 = 8.6), then multiply the result by the number in the row entitled “Expenses Paid During Period” to estimate the expenses you paid on your account during this period.
Hypothetical Example for Comparison Purposes
The second line of the tables below provides information about hypothetical account values and hypothetical expenses based on the Funds’ actual expense ratio and assumed rate of return of 5% per year before expenses, which is not the Fund’s actual return. The hypothetical account values and expenses may not be used to estimate the actual ending account balance or expenses you paid for the period. You may use this information to compare the ongoing costs of investing in the Fund and other funds. To do so, compare this 5% hypothetical example with the 5% hypothetical examples that appear in the shareholder reports of the other funds. Please note that the expenses shown in the table are meant to highlight your ongoing costs only and will not help you determine the relative total costs of owning different funds, as they may charge transactional costs, such as sales charges (loads), redemption fees, or exchange fees. Therefore, the second line of each table is useful in comparing ongoing costs only and will not help you determine the relative total costs of owning different funds. In addition, if these transactional costs were included, your costs would have been higher.
59
Pzena Funds
Expense Example (Continued)
August 31, 2021 (Unaudited)
| Beginning | Ending | Expenses Paid | ||||||||||
| Account Value | Account Value | During Period(1) | ||||||||||
Investor Class | 3/1/21 | 8/31/21 | 3/1/21 – 8/31/21 | |||||||||
| Actual | ||||||||||||
| Mid Cap Value Fund | $ | 1,000.00 | $ | 1,112.30 | $ | 6.66 | ||||||
| Emerging Markets Value Fund | 1,000.00 | 1,063.30 | 7.44 | |||||||||
| Small Cap Value Fund | 1,000.00 | 1,084.20 | 7.35 | |||||||||
| International Small Cap Value Fund | 1,000.00 | 1,141.30 | 7.83 | |||||||||
| International Value Fund | 1,000.00 | 992.00 | 1.76 | |||||||||
| Hypothetical (5% return before expenses) | ||||||||||||
| Mid Cap Value Fund | $ | 1,000.00 | $ | 1,018.90 | $ | 6.36 | ||||||
| Emerging Markets Value Fund | 1,000.00 | 1,018.00 | 7.27 | |||||||||
| Small Cap Value Fund | 1,000.00 | 1,018.15 | 7.12 | |||||||||
| International Small Cap Value Fund | 1,000.00 | 1,017.90 | 7.37 | |||||||||
| International Value Fund | 1,000.00 | 1,007.00 | 1.78 | |||||||||
(1) | The Mid Cap Value Fund, Emerging Markets Value Fund, Small Cap Value Fund, International Small Cap Value Fund, and International Value Fund expenses are equal to the expense ratio of 1.25%, 1.43%, 1.40%, 1.45%, and 1.01%, respectively, multiplied by the average account value over the period, multiplied by 184/365 days (to reflect the six-month period of operation of the Mid Cap Value Fund, Emerging Markets Value Fund, Small Cap Value Fund, and International Small Cap Value Fund), and 64/365 days (to reflect the shortened period of operation of the International Value Fund).The ending account values in the table are based on its actual total returns of the Investor Class shares of each Fund. The Mid Cap Value Fund, Emerging Markets Value Fund, Small Cap Value Fund, International Small Cap Value Fund, and International Value Fund’s Investor Class shares returned 11.23%, 6.33%, 8.42%, 14.13%, and (0.80)%, respectively. |
| Beginning | Ending | Expenses Paid | ||||||||||
| Account Value | Account Value | During Period(2) | ||||||||||
| Institutional Class | 3/1/21 | 8/31/21 | 3/1/21 – 8/31/21 | |||||||||
| Actual | ||||||||||||
| Mid Cap Value Fund | $ | 1,000.00 | $ | 1,115.00 | $ | 4.80 | ||||||
| Emerging Markets Value Fund | 1,000.00 | 1,065.70 | 5.62 | |||||||||
| Small Cap Value Fund | 1,000.00 | 1,085.20 | 5.78 | |||||||||
| International Small Cap Value Fund | 1,000.00 | 1,143.30 | 6.32 | |||||||||
| International Value Fund | 1,000.00 | 993.00 | 1.29 | |||||||||
| Hypothetical (5% return before expenses) | ||||||||||||
| Mid Cap Value Fund | $ | 1,000.00 | $ | 1,020.67 | $ | 4.58 | ||||||
| Emerging Markets Value Fund | 1,000.00 | 1,019.76 | 5.50 | |||||||||
| Small Cap Value Fund | 1,000.00 | 1,019.66 | 5.60 | |||||||||
| International Small Cap Value Fund | 1,000.00 | 1,019.31 | 5.96 | |||||||||
| International Value Fund | 1,000.00 | 1,007.47 | 1.30 | |||||||||
(2) | The Mid Cap Value Fund, Emerging Markets Value Fund, Small Cap Value Fund, International Small Cap Value Fund, and International Value Fund expenses are equal to the expense ratio of 0.90%, 1.08%, 1.10%, 1.17%, and 0.74%, respectively, multiplied by the average account value over the period, multiplied by 184/365 days (to reflect the six-month period of operation of the Mid Cap Value Fund, Emerging Markets Value Fund, Small Cap Value Fund, and International Small Cap Value Fund), and 64/365 days (to reflect the shortened period of operation of the International Value Fund).The ending account values in the table are based on its actual total returns of the Institutional Class shares of each Fund. The Mid Cap Value Fund, Emerging Markets Value Fund, Small Cap Value Fund, International Small Cap Value Fund, and International Value Fund’s Institutional Class shares returned 11.50%, 6.57%, 8.52%, 14.33%, and (0.70)%, respectively. |
60
Pzena International Value Fund
Approval of Investment Advisory Agreement
(Unaudited)
At a meeting held on June 9-10, 2021, the Board (all of whom are Independent Trustees as defined under the Investment Company Act of 1940, as amended), considered the initial approval of an Investment Advisory Agreement (the “Advisory Agreement”) between Advisors Series Trust (the “Trust”) and Pzena Investment Management, LLC (the “Adviser”) on behalf of the Pzena International Value Fund (the “Fund”), a new series of the Trust. At the meeting, the Board received and reviewed substantial information regarding the Fund, the Adviser and the services to be provided by the Adviser to the Fund under the Advisory Agreement. This information, together with the information provided to the Board prior to the meeting and throughout the course of the year, formed the primary (but not exclusive) basis for the Board’s determinations. Below is a summary of the factors considered by the Board and the conclusions that formed the basis for the Board’s initial approval of the Advisory Agreement:
| 1. | THE NATURE, EXTENT AND QUALITY OF THE SERVICES TO BE PROVIDED BY THE ADVISER UNDER THE ADVISORY AGREEMENT. The Board considered the nature, extent and quality of the Adviser’s overall services to be provided to the Fund, as well as its specific responsibilities in all aspects of day-to-day investment management of the Fund. The Board considered the qualifications, experience and responsibilities of the portfolio managers, as well as the responsibilities of other key personnel of the Adviser that would be involved in the day-to-day activities of the Fund. The Board also considered that the Advisor had previously managed the strategy for many years as a sub-adviser to another registered investment company and also considered the resources and compliance structure of the Adviser, including information regarding their compliance programs, its chief compliance officers and the Adviser’s compliance record, as well as the Adviser’s cybersecurity program, liquidity risk management program, business continuity plan, and risk management processes. Additionally, the Board considered how the Adviser’s business continuity plan have operated during the recent COVID-19 pandemic. The Board further considered the prior relationship between the Adviser and the Trust, with respect to their management of other funds in the Trust, as well as the Board’s knowledge of the Adviser’s operations. The Board concluded that the Adviser had the quality and depth of personnel, resources, investment processes, and compliance policies and procedures essential to performing their duties under the Advisory agreement and that they were satisfied with the nature, overall quality and extent of such management services. |
| 2. | THE FUND’S HISTORICAL PERFORMANCE AND THE OVERALL PERFORMANCE OF THE ADVISER. As the Fund was newly created, the Board was unable to review the performance of the Fund. The Board did consider the performance history of the Adviser with respect to similarly-managed separate accounts as well as a sub-adviser to another registered investment company. |
| 3. | THE COSTS OF THE SERVICES TO BE PROVIDED BY THE ADVISER AND THE STRUCTURE OF THE ADVISER’S FEE UNDER THE ADVISORY AGREEMENT. In considering the proposed advisory fees and the total fees and expenses of the Fund, the Board reviewed comparisons to the peer funds and the Adviser’s similarly managed accounts for other types of clients, as well as all expense waivers and reimbursements. When reviewing fees charged to other separately managed accounts, the Board took into account the type of account and the differences in the management of that account that might be germane to the difference, if any, in the fees charged to such accounts. The Board noted that the Adviser had contractually agreed to maintain an annual expense ratio (excluding acquired fund fees and expenses, interest, taxes, extraordinary expenses, Rule 12b-1 fees, shareholder servicing fees and any other class-specific expenses) for the Fund of 0.74% (the “Expense Cap”). The Board noted that the Fund’s total expense ratio was below the peer group median and average. Additionally, the Board noted that when the Fund’s peer group was adjusted to include only funds with similar asset sizes, the Fund’s total expense ratio was below the peer group median and average. The Board determined that it would continue to monitor the appropriateness of the advisory fees for the Fund and concluded that, at this time, the fees to be paid to the Adviser were fair and reasonable. |
| 4. | ECONOMIES OF SCALE. The Board also considered whether economies of scale could be expected to be realized by the Adviser as assets of the Fund grow. The Board noted that the Adviser has contractually agreed to reduce its advisory fees or reimburse Fund expenses so that the Fund does not exceed the specified Expense Cap. The Board additionally noted that the Adviser has represented that it continues to reinvest free cash into growing its resources. The Board noted that as the Fund was new, there were no economies of scale being realized by the Adviser at this time. |
| 5. | THE PROFITS TO BE REALIZED BY THE ADVISER AND ITS AFFILIATES FROM ITS RELATIONSHIP WITH THE FUND. The Board discussed the likely overall profitability of the Adviser from managing the new Fund. In assessing possible profitability, the Trustees reviewed the Adviser’s financial information and took into account both the likely direct and indirect benefits to the Adviser from advising the Fund, including 12b-1 distribution fees for Investor Class shares of the |
61
Pzena International Value Fund
Approval of Investment Advisory Agreement (Continued)
(Unaudited)
| Fund. The Trustees concluded that the Adviser’s profit from managing the Fund would likely not be excessive and, after review of relevant financial information, the Adviser would have adequate capitalization and/or would maintain adequate profit levels to support the Fund. |
No single factor was determinative of the Board’s decision to approve the Advisory Agreement for the Fund, but rather the Trustees based their determination on the total mix of information available to them. Based on a consideration of all the factors in their totality, the Trustees determined that the advisory arrangements with the Adviser, including the advisory fees, were fair and reasonable to the Fund. The Board, including a majority of the Independent Trustees, therefore determined that the Advisory Agreement would be in the best interest for the Fund and its shareholders.
62
Pzena Funds
Notice to Shareholders
August 31, 2021 (Unaudited)
How to Obtain a Copy of the Funds’ Proxy Voting Policies
A description of the policies and procedures that the Funds use to determine how to vote proxies relating to portfolio securities is available without charge, upon request, by calling 1-844-PZN-1996 (1-844-796-1996) or on the U.S. Securities and Exchange Commission’s (“SEC”) website at http://www.sec.gov.
How to Obtain a Copy of the Funds’ Proxy Voting Records for the 12-Month Period Ended June 30
Information regarding how a Fund voted proxies relating to portfolio securities during the most recent 12-month period ended June 30 is available without charge, upon request, by calling 1-844-PZN-1996 (1-844-796-1996). Furthermore, you can obtain a Fund’s proxy voting records on the SEC’s website at http://www.sec.gov.
Quarterly Filings on Form N-PORT
The Funds file their complete schedule of portfolio holdings with the SEC for the first and third quarters of each fiscal year on Part F of Form N-PORT. The Funds’ Form N-PORT is available on the SEC website at http://www.sec.gov. Information included in the Funds’ Form N-PORT is also available by calling 1-844-PZN-1996 (1-844-796-1996).
Householding
In an effort to decrease costs, the Funds will reduce the number of duplicate prospectuses, supplements, and certain other shareholder documents that you receive by sending only one copy of each to those addresses shown by two or more accounts. Please call the Funds’ transfer agent toll free at 1-844-PZN-1996 (1-844-796-1996) to request individual copies of these documents. The Funds will begin sending individual copies 30 days after receiving your request. This policy does not apply to account statements.
63
Pzena Funds
Privacy Notice
The Funds collect non-public information about you from the following sources:
• Information we receive about you on applications or other forms;
• Information you give us orally; and/or
• Information about your transactions with us or others.
We do not disclose any non-public personal information about our customers or former customers without the customer’s authorization, except as permitted by law or in response to inquiries from governmental authorities. We may share information with affiliated and unaffiliated third parties with whom we have contracts for servicing the Funds. We will provide unaffiliated third parties with only the information necessary to carry out their assigned responsibilities. We maintain physical, electronic and procedural safeguards to guard your non-public personal information and require third parties to treat your personal information with the same high degree of confidentiality.
In the event that you hold shares of the Funds through a financial intermediary, including, but not limited to, a broker-dealer, bank, or trust company, the privacy policy of your financial intermediary would govern how your non-public personal information would be shared by those entities with unaffiliated third parties.
64
(This Page Intentionally Left Blank.)
Investment Adviser
Pzena Investment Management, LLC
320 Park Avenue, 8th Floor
New York, New York 10022
Independent Registered Public Accounting Firm
Tait, Weller & Baker LLP
Two Liberty Place
50 South 16th Street, Suite 2900
Philadelphia, Pennsylvania 19102
Legal Counsel
Sullivan & Worcester LLP
1633 Broadway, 32nd Floor
New York, New York 10019
Custodian
U.S. Bank N.A.
1555 North RiverCenter Drive, Suite 302
Milwaukee, Wisconsin 53212
Transfer Agent, Fund Accountant and Fund Administrator
U.S. Bank Global Fund Services
615 East Michigan Street
Milwaukee, Wisconsin 53202
Distributor
Quasar Distributors, LLC
111 East Kilbourn Avenue, Suite 2200
Milwaukee, Wisconsin 53202
This report is intended for the shareholders of the Funds and may not be used as sales literature unless preceded or accompanied by a current prospectus, To obtain a free prospectus, please call 1-844-PZN-1996 (1-844-796-1996).
(b) Not Applicable.
Item 2. Code of Ethics.
Not applicable for semi-annual reports.
Item 3. Audit Committee Financial Expert.
Not applicable for semi-annual reports.
Item 4. Principal Accountant Fees and Services.
Not applicable for semi-annual reports.
Item 5. Audit Committee of Listed Registrants.
(a) | Not applicable to registrants who are not listed issuers (as defined in Rule 10A-3 under the Securities Exchange Act of 1934). |
(b) | Not Applicable. |
Item 6. Investments.
(a) | Schedule of Investments is included as part of the report to shareholders filed under Item 1 of this Form. |
(b) | Not Applicable. |
Item 7. Disclosure of Proxy Voting Policies and Procedures for Closed-End Management Investment Companies.
Not applicable to open-end investment companies.
Item 8. Portfolio Managers of Closed-End Management Investment Companies.
Not applicable to open-end investment companies.
Item 9. Purchases of Equity Securities by Closed‑End Management Investment Company and Affiliated Purchasers.
Not applicable to open-end investment companies.
Item 10. Submission of Matters to a Vote of Security Holders.
There have been no material changes to the procedures by which shareholders may recommend nominees to the Registrant’s Board of Trustees.
Item 11. Controls and Procedures.
(a) | The Registrant’s President/Chief Executive Officer/Principal Executive Officer and Vice President/Treasurer/Principal Financial Officer have reviewed the Registrant's disclosure controls and procedures (as defined in Rule 30a-3(c) under the Investment Company Act of 1940, as amended, (the “Act”)) as of a date within 90 days of the filing of this report, as required by Rule 30a-3(b) under the Act and Rules 13a-15(b) or 15d‑15(b) under the Securities Exchange Act of 1934. Based on their review, such officers have concluded that the disclosure controls and procedures are effective in ensuring that information required to be disclosed in this report is appropriately recorded, processed, summarized and reported and made known to them by others within the Registrant and by the Registrant’s service provider. |
(b) | There were no changes in the Registrant's internal control over financial reporting (as defined in Rule 30a-3(d) under the Act) that occurred during the period covered by this report that have materially affected, or is reasonably likely to materially affect, the Registrant's internal control over financial reporting. |
Item 12. Disclosure of Securities Lending Activities for Closed-End Management Investment Companies.
Not applicable to open-end investment companies.
Item 13. Exhibits.
| (a) | (1) Any code of ethics or amendment thereto, that is the subject of the disclosure required by Item 2, to the extent that the registrant intends to satisfy Item 2 requirements through filing an exhibit. Not Applicable. |
(3) Any written solicitation to purchase securities under Rule 23c‑1 under the Act sent or given during the period covered by the report by or on behalf of the registrant to 10 or more persons. Not applicable to open-end investment companies.
(4) Change in the registrant’s independent public accountant. There was no change in the registrant’s independent public accountant for the period covered by this report.
SIGNATURES
Pursuant to the requirements of the Securities Exchange Act of 1934 and the Investment Company Act of 1940, the registrant has duly caused this report to be signed on its behalf by the undersigned, thereunto duly authorized.
(Registrant) Advisors Series Trust
By (Signature and Title) /s/ Jeffrey T. Rauman
Jeffrey T. Rauman, President/Chief Executive Officer/Principal Executive Officer
Date 11/4/21
Pursuant to the requirements of the Securities Exchange Act of 1934 and the Investment Company Act of 1940, this report has been signed below by the following persons on behalf of the registrant and in the capacities and on the dates indicated.
By (Signature and Title) /s/ Jeffrey T. Rauman
Jeffrey T. Rauman, President/Chief Executive Officer/Principal Executive Officer
Date 11/4/21
By (Signature and Title) /s/ Cheryl L. King
Cheryl L. King, Vice President/Treasurer/Principal Financial Officer
Date 11/4/21