UNITED STATES
SECURITIES AND EXCHANGE COMMISSION
Washington, D.C. 20549
SECURITIES AND EXCHANGE COMMISSION
Washington, D.C. 20549
FORM N-CSR
CERTIFIED SHAREHOLDER REPORT OF REGISTERED
MANAGEMENT INVESTMENT COMPANIES
Investment Company Act file number 811-07959
Advisors Series Trust
(Exact name of registrant as specified in charter)
(Exact name of registrant as specified in charter)
615 East Michigan Street
Milwaukee, WI 53202
(Address of principal executive offices) (Zip code)
(Address of principal executive offices) (Zip code)
Jeffrey T. Rauman, President/Chief Executive Officer
Advisors Series Trust
c/o U.S. Bancorp Fund Services, LLC
777 East Wisconsin Avenue, 5th Floor
Milwaukee, WI 53202
(Name and address of agent for service)
(Name and address of agent for service)
(626) 914-7363
Registrant's telephone number, including area code
Date of fiscal year end: October 31, 2023
Date of reporting period: October 31, 2023
Item 1. Reports to Stockholders.
HUBER SELECT LARGE CAP VALUE FUND
HUBER SMALL CAP VALUE FUND
HUBER LARGE CAP VALUE FUND
HUBER MID CAP VALUE FUND
Investor Class
Institutional Class
ANNUAL REPORT
October 31, 2023
Huber Funds
TABLE OF CONTENTS
| Letter to Shareholders | 1 |
| Performance Summary | 6 |
| Expense Example | 11 |
| Sector Allocation of Portfolio Assets | 14 |
| Schedules of Investments | 16 |
| Statements of Assets and Liabilities | 28 |
| Statements of Operations | 32 |
| Statements of Changes in Net Assets | 34 |
| Financial Highlights | 42 |
| Notes to Financial Statements | 50 |
| Report of Independent Registered Public Accounting Firm | 66 |
| Notice to Shareholders | 67 |
| Statement Regarding Liquidity Risk Management Program | 68 |
| Information about Trustees and Officers | 69 |
| Householding | 73 |
| Privacy Notice | 74 |
December 1, 2023
Dear Shareholder:
As of October 31, 2023, the broad equity market has shown resilience and continued to increase in value despite a year where the Federal Reserve increased the federal fund rates. U.S. GDP experienced steady growth, and unemployment remained relatively low, indicating a strong economic foundation. Fortunately, the United States has managed to avoid a recession. However, political tensions persisted throughout the year, notably in the ongoing Russia-Ukraine conflict. In addition, in October, Hamas, an Islamist militant group that controls Gaza, launched a surprise attack on Israel, adding to the geopolitical challenges in the region. These factors have created a complex and dynamic environment for the global economy and financial markets.
For the 10/31/23 fiscal year, the Huber Select Large Cap Value Fund (“Select Large Cap Value Fund”) outperformed the Bloomberg US 1000 Value Index and underperformed the S&P 500® Index. The Huber Small Cap Value Fund (“Small Cap Value Fund”) outperformed its benchmark, the Bloomberg US 2000 Value Index. The Huber Large Cap Value Fund (“Large Cap Value Fund”) outperformed the Bloomberg US 1000 Value Index and underperformed the S&P 500® Index. The Huber Mid Cap Value Fund (“Mid Cap Value Fund”) underperformed its benchmark, the Bloomberg US 2500 Value Index.
Select Large Cap Value Fund Review
The Investor Class and Institutional Class of the Select Large Cap Value Fund returned 5.61% and 6.01%, respectively, outperforming the -1.01% total return of the Bloomberg US 1000 Value Index and underperforming the 10.14% total return of the S&P 500® Index for the fiscal year ending October 31, 2023. Relative to the Bloomberg US 1000 Value Index, the largest positive contributors to the Fund’s performance were Health Care and Information Technology, while the largest detractors were Financials and Materials.
Within Health Care, the portfolio’s ownership of Eli Lilly (“LLY”), a drug developer and manufacturer, contributed to relative out-performance. Eli Lilly benefitted in the period from increasing demand for the diabetes and weight loss medication, Mounjaro. While initially intended as a diabetes treatment, Mounjaro demonstrated exceptional effectiveness in promoting weight loss, revealing a market potential that could surpass its use in diabetes.
Within Information Technology, the portfolio benefitted from its ownership of Microsoft (“MSFT”), a global software and cloud services provider. Microsoft benefited in the period due to strong performance across all business lines. Although growth rates have slowed, the market’s concern regarding widespread contraction in cloud services appeared to be exaggerated.
Within Financials, the portfolio was negatively impacted by its ownership of First Horizon Corp (“FHN”), a provider of commercial and retail banking services. The cancellation of First Horizon’s merger with Toronto Dominion had
1
a detrimental impact on their performance during the period, as regional bank shareholders panicked in response to the failure of Silicon Valley Bank (SVB). We believe that the panic among regional bank shareholders, driven primarily by investor fear, is short-term in nature, and we observe no substantial deterioration in First Horizon Corp’s underlying fundamentals.
Within Materials, the portfolio was negatively impacted by its ownership of Mercer International Inc. (“MERC”), a diversified global manufacturing company that produces and supplies a wide range of specialty materials, chemicals, and pulp products. The sluggish demand and pricing for pulp in China, mainly due to the delayed reopening of the Chinese economy after the removal of COVID restrictions, led to Mercer’s underperformance.
Small Cap Value Fund Review
The Investor Class and Institutional Class of the Small Cap Value Fund returned -3.54% and -3.37%, respectively, outperforming the -6.42% total return of the Bloomberg US 2000 Value Index for the fiscal year ending October 31, 2023. Relative to the Bloomberg US 2000 Value Index, the largest positive contributors to the Fund’s performance were Financials and Industrials, while the largest detractors were Materials and Energy.
Within Financials, the portfolio benefitted from its ownership of First Citizens BancShares (“FCNCA”), a provider of banking products and services to individuals, businesses, and organizations. During the period, First Citizens BancShares experienced a notable benefit from the successful acquisition of distressed assets from Silicon Valley Bank at a favorable price. This accomplishment was credited to their established reputation for acquiring struggling competitors, allowing them to capitalize on the opportunity.
Within Industrials, the portfolio benefitted from its ownership of Miller Industries (“MLR”), a company operating in the towing and recovery equipment industry. Miller Industries performed strongly during the period due to their ability to surpass quarterly expectations by implementing effective pricing strategies and improvements to their supply chain.
Within Materials, Mercer International Inc. (“MERC”) detracted from relative performance. Mercer International Inc. was discussed in the Select Large Cap Value Fund Review section.
Within Energy, the portfolio was negatively impacted by its ownership of Golar LNG LTD (“GLNG”), an operator of liquefied natural gas (LNG) transportation and liquefaction vessels. After a successful 2022, Dutch TTF prices softened in 2023. We continue to expect Golar LNG to have a robust pipeline of floating liquefied natural gas (FLNG) contracts in 2024.
Large Cap Value Fund Review
The Investor Class and Institutional Class of the Large Cap Value Fund returned 0.12% and 0.41%, respectively, outperforming the -1.01% total return of the Bloomberg US 1000 Value Index and underperforming the 10.14% total return of the S&P 500® Index for the fiscal year ending October 31, 2023.
2
Relative to the Bloomberg US 1000 Value Index, the largest positive contributors to the Fund’s performance were Health Care and Information Technology, while the largest detractors were Energy and Financials.
Within Health Care, Eli Lilly (“LLY”) contributed favorably to relative performance. Eli Lilly was discussed in the Select Large Cap Value Fund Review section.
Within Information Technology, Microsoft (“MSFT”) contributed favorably to relative performance. Microsoft was discussed in the Select Large Cap Value Fund Review section.
Within Energy, Golar LNG LTD (“GLNG”) detracted from relative performance. Golar LNG LTD was discussed in the Small Cap Value Fund Review section.
Within Financials, First Horizon Corp (“FHN”) detracted from relative performance. First Horizon Corp was discussed in the Select Large Cap Value Fund Review section.
Mid Cap Value Fund Review
The Investor Class and Institutional Class of the Mid Cap Value Fund returned -7.72% and -7.66%, respectively, underperforming the -4.07% total return of the Bloomberg US 2500 Value Index for the fiscal year ending October 31, 2023. Relative to the Bloomberg US 2500 Value Index, the largest positive contributors to the Fund’s performance were Industrials and Financials, while the largest detractors were Materials and Energy.
Within Industrials, the portfolio benefitted from its ownership of KBR Inc (“KBR”), a government services firm that supports military and civilian agencies. KBR was a relative outperformer compared to peers as investors seemed to value the growth potential from its STS segment that has had strong bookings for petrochemical and renewable energy-related work, as well as the relative stability of KBR’s Government Solutions segment.
Within Financials, First Citizens BancShares (“FCNCA”) contributed favorably to relative performance. First Citizens BancShares was discussed in the Small Cap Value Fund Review section.
Within Materials, Mercer International Inc. (“MERC”) detracted from relative performance. Mercer International Inc. was discussed in the Select Large Cap Value Fund Review section.
Within Energy, Golar LNG LTD (“GLNG”), detracted from relative performance. Golar LNG LTD was discussed in the Small Cap Value Fund Review section.
Outlook
Despite the Federal Reserve’s efforts to raise the federal fund rates in response to inflation, the broad equity market has demonstrated resilience. U.S. GDP has consistently risen, indicating a robust overall economy, while unemployment has remained relatively low. We emphasize the difficulty in predicting economic
3
recessions and remain steadfast to Huber Capital’s core philosophy of investing in stocks we view as under-appreciated with favorable long-term fundamentals.
The Huber Capital team remains committed to our philosophy and process, populating its Funds with companies we believe embody meaningful upside potential and tangible valuation support. It continues to be our view that a company’s valuation ultimately reverts to reflect its normalized cash generation capabilities and that investing in companies trading at a discount to normalized earnings can produce attractive risk-adjusted returns over time.
Consistent with our value philosophy, we strive to generate outperformance through fundamental bottom-up investing, rather than betting on macroeconomic factors. In our view, benchmarks have become price momentum strategies, a trend exacerbated by the shift to passive investing, and index sector weights often fail to reflect factor weights in the broader economy. Furthermore, frequently used classification schema (e.g. GICS) may assign companies to sectors which, we believe, may not accurately reflect a company’s primary exposure. For this reason, although we maintain macroeconomic factor neutrality, we may at certain times appear over- or under-weight relative to the sector weights of the Funds’ corresponding benchmarks.
Currently, relative to the Bloomberg US 2000 Value Index, the Small Cap Value Fund is overweight Industrials, Energy, Information Technology, Communication Services, and Financials and underweight Materials, Consumer Discretionary, Utilities, Consumer Staples, Health Care, and Real Estate. Relative to the Bloomberg US 1000 Value Index, the Select Large Cap Value Fund is overweight Energy, Information Technology, Industrials, Financials, Consumer Discretionary, and Health Care and underweight Materials, Communication Services, Real Estate, Utilities, and Consumer Staples. Relative to the Bloomberg US 1000 Value Index, the Large Cap Value Fund is overweight Industrials, Energy, Information Technology, and Consumer Discretionary and underweight Health Care, Materials, Communication Services, Financials, Utilities, Real Estate, and Consumer Staples. Relative to the Bloomberg US 2500 Value Index, the Mid Cap Value Fund is overweight Industrials, Energy, Information Technology, and Communication Services and underweight Materials, Health Care, Utilities, Consumer Staples, Consumer Discretionary, Real Estate, and Financials.
Thank you for your support and for entrusting us with your investment dollars. We continue to work hard to earn your trust and aim to meet your investment needs in the years to come.
Sincerely,
The Huber Capital Management Team
Past performance is not a guarantee of future results.
Mutual fund investing involves risk. Principal loss is possible. The Funds may invest in foreign securities which involve greater volatility and political, economic and currency risks and
4
differences in accounting methods. The risks are greater for investments in emerging markets. Additionally, the Funds are subject to sector emphasis risk meaning that companies in the same or related businesses may comprise a significant portion of a Fund’s portfolio and adversely affect the value of the portfolio to a greater extent than if such business comprised a lesser portion of a portfolio. Investments in initial public offerings (“IPOs”) carry additional risk such as market and liquidity risk and can fluctuate considerably. When a Fund’s asset base is small, the impact of IPOs on the Fund’s performance could be magnified. Investments in smaller companies involve additional risks such as limited liquidity and greater volatility. Small- and medium-capitalization companies tend to have limited liquidity and greater price volatility than large-capitalization companies. Value stocks have a lower expected growth rate in earnings and sales, versus growth stocks.
Fund holdings and sector allocations are subject to change at any time and should not be considered a recommendation to buy or sell any security. Please see the schedule of investments in this report for complete Fund holdings.
Current and future portfolio holdings are subject to risk.
The information provided herein represents the opinion of Huber Capital Management, LLC and is not intended to be a forecast of future events, a guarantee of future results, nor investment advice.
The Bloomberg US 1000 Value Index is screened from the Bloomberg US 1000 Index and is constructed based on a linear combination of risk factors. The four factors are: 1) Earnings Yield, 2) Valuation, 3) Dividend Yield and 4) Growth. The factors are equally weighted when forming a composite signal where Growth is considered to be a negative indicator and thus flipped to be a negative. The Index is market-capitalization-weighted.
The Bloomberg US 2500 Value Index is screened from the Bloomberg US 2500 Index and is constructed based on a linear combination of risk factors. The four factors are: 1) Earnings Yield, 2) Valuation, 3) Dividend Yield and 4) Growth. The factors are equally weighted when forming a composite signal where Growth is considered to be a negative indicator and thus flipped to be a negative. The Index is market-capitalization-weighted.
The Bloomberg US 2000 Value Index is screened from the Bloomberg US 2000 Index and is constructed based on a linear combination of risk factors. The four factors are: 1) Earnings Yield, 2) Valuation, 3) Dividend Yield and 4) Growth. The factors are equally weighted when forming a composite signal where Growth is considered to be a negative indicator and thus flipped to be a negative. The Index is market-capitalization-weighted.
The Bloomberg US 2000 Index is a float market-cap-weighted benchmark of the lower 2000 in capitalization of the Bloomberg US 3000 Index.
The S&P 500® Index, an unmanaged index, consists of 500 stocks chosen for market size, liquidity, and industry group representation. It is a market-value weighted index (stock price times number of shares outstanding), with each stock’s weight in the Index proportionate to its market value.
Indices in general do not reflect the payment of transaction costs, fees and expenses associated with actual investment in the Funds. The Funds’ value disciplines may prevent or restrict investment in major stocks in the benchmark indices. It is not possible to invest directly in an index. The Funds’ returns may not correlate with the returns of their benchmark indexes.
Short term performance may reflect conditions that are unsustainable and thus are unlikely to be repeated in the future. High double-digit returns are attributable, in part, to unusually favorable market conditions and may not be repeated or consistently achieved in the future.
Diversification does not assure a profit, nor does it protect against a loss in a declining market.
Global Industry Classification Standard (GICS) is a method for assigning companies to a specific economic sector and industry group that best defines its business operations.
Gross Domestic Product (GDP) is the monetary value of all finished goods and services made within a country during a specific period.
5
Huber Funds
HUBER SELECT LARGE CAP VALUE FUND
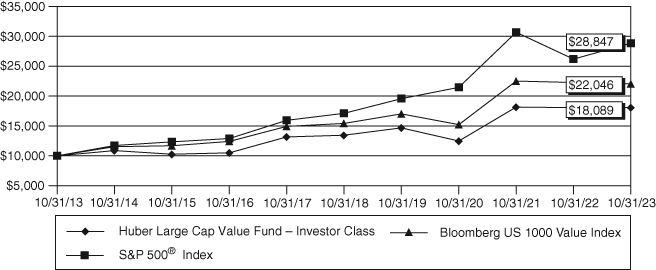
Comparison of the change in value of a hypothetical $10,000 investment in the
Huber Select Large Cap Value Fund – Investor Class vs the S&P 500® Index and the
Bloomberg US 1000 Value Index

Average Annual Total Return
| Since | Since | ||||
| Inception* | Inception** | ||||
1 Year | 5 Year | 10 Year | (6/29/07) | (10/25/11) | |
Huber Select Large Cap | |||||
Value Fund – | |||||
Investor Class (HULIX) | 5.61% | 10.90% | 7.90% | 7.09% | — |
Huber Select Large Cap | |||||
Value Fund – | |||||
Institutional Class (HULEX) | 6.01% | 11.27% | 8.29% | — | 10.88% |
S&P 500® Index | 10.14% | 11.01% | 11.18% | 8.64% | 12.93% |
Bloomberg US 1000 | |||||
Value Index | -1.01% | 7.41% | 8.23% | 6.58% | 10.61% |
Performance data quoted represents past performance and does not guarantee future results. The investment return and principal value of an investment will fluctuate so that an investor’s shares, when redeemed, may be worth more or less than their original cost. Current performance of the Fund may be lower or higher than the performance quoted. The most recent month-end performance may be obtained by calling 1-888-482-3726 (888-HUBERCM).
HULIX Expense Ratio – Gross: 1.65%
HULEX Expense Ratio – Gross: 1.25%
Expense ratios shown are as of the Fund’s prospectus dated February 28, 2023.
Returns reflect reinvestment of dividends and capital gains distributions. Fee waivers are in effect. In the absence of fee waivers, returns would be reduced. The performance data and graph do not reflect the deduction of taxes that a shareholder may pay on dividends, capital gains distributions, or redemption of Fund shares. Performance data shown does not reflect the 1.00% redemption fee imposed on shares held 60 days or less. If it did, total returns would be reduced. Indices do not incur expenses and are not available for investment.
6
Huber Funds
The S&P 500® Index is an unmanaged capitalization-weighted index of 500 stocks designed to represent the broad domestic economy.
The Bloomberg US 1000 Value Index is screened from the Bloomberg US 1000 Index and is constructed based on a linear combination of risk factors. The four factors are: 1) Earnings Yield, 2) Valuation, 3) Dividend Yield and 4) Growth. The factors are equally weighted when forming a composite signal where Growth is considered to be a negative indicator and thus flipped to be negative. The indices are market-capitalization-weighted.
| * | The Select Large Cap Value Fund – Investor Class commenced operations on June 29, 2007. | |
| ** | The Select Large Cap Value Fund – Institutional Class commenced operations on October 25, 2011. |
7
Huber Funds
HUBER SMALL CAP VALUE FUND
Comparison of the change in value of a hypothetical $10,000 investment in the
Huber Small Cap Value Fund – Investor Class vs the Bloomberg US 2000 Value Index

Average Annual Total Return
| Since | Since | ||||
| Inception* | Inception** | ||||
1 Year | 5 Year | 10 Year | (6/29/07) | (10/25/11) | |
Huber Small Cap Value Fund – | |||||
Investor Class (HUSIX) | -3.54% | 6.58% | 3.32% | 5.62% | — |
Huber Small Cap Value Fund – | |||||
Institutional Class (HUSEX) | -3.37% | 6.80% | 3.60% | — | 8.12% |
Bloomberg US 2000 | |||||
Value Index | -6.42% | 5.44% | 6.40% | 6.58% | 9.84% |
Performance data quoted represents past performance and does not guarantee future results. The investment return and principal value of an investment will fluctuate so that an investor’s shares, when redeemed, may be worth more or less than their original cost. Current performance of the Fund may be lower or higher than the performance quoted. The most recent month-end performance may be obtained by calling 1-888-482-3726 (888-HUBERCM).
HUSIX Expense Ratio – Gross: 1.93%
HUSEX Expense Ratio – Gross: 1.53%
Expense ratios shown are as of the Fund’s prospectus dated February 28, 2023.
Returns reflect reinvestment of dividends and capital gains distributions. Fee waivers are in effect. In the absence of fee waivers, returns would be reduced. The performance data and graph do not reflect the deduction of taxes that a shareholder may pay on dividends, capital gains distributions, or redemption of Fund shares. Performance data shown does not reflect the 1.00% redemption fee imposed on shares held 60 days or less. If it did, total returns would be reduced. Indices do not incur expenses and are not available for investment.
The Bloomberg US 2000 Value Index is screened from the Bloomberg US 2000 Index and is constructed based on a linear combination of risk factors. The four factors are: 1) Earnings Yield, 2) Valuation, 3) Dividend Yield and 4) Growth. The factors are equally weighted when forming a composite signal where Growth is considered to be a negative indicator and thus flipped to be negative. The indices are market-capitalization-weighted.
| * | The Small Cap Value Fund – Investor Class commenced operations on June 29, 2007. | |
| ** | The Small Cap Value Fund – Institutional Class commenced operations on October 25, 2011. |
8
Huber Funds
HUBER LARGE CAP VALUE FUND
Comparison of the change in value of a hypothetical $10,000 investment in the
Huber Large Cap Value Fund – Investor Class vs the S&P 500® Index and the
Bloomberg US 1000 Value Index
Average Annual Total Return
| Since Inception* | ||||
1 Year | 5 Year | 10 Year | (12/31/12) | |
| Huber Large Cap Value Fund – | ||||
| Investor Class (HUDIX) | 0.12% | 6.11% | 6.11% | 7.86% |
| Huber Large Cap Value Fund – | ||||
| Institutional Class (HUDEX) | 0.41% | 6.32% | 6.36% | 8.14% |
S&P 500® Index | 10.14% | 11.01% | 11.18% | 12.59% |
Bloomberg US 1000 Value Index | -1.01% | 7.41% | 8.23% | 9.90% |
Performance data quoted represents past performance and does not guarantee future results. The investment return and principal value of an investment will fluctuate so that an investor’s shares, when redeemed, may be worth more or less than their original cost. Current performance of the Fund may be lower or higher than the performance quoted. The most recent month-end performance may be obtained by calling 1-888-482-3726 (888-HUBERCM).
HUDIX Expense Ratio – Gross: 2.50%
HUDEX Expense Ratio – Gross: 2.10%
Expense ratios shown are as of the Fund's prospectus dated February 28, 2023.
Returns reflect reinvestment of dividends and capital gains distributions. Fee waivers are in effect. In the absence of fee waivers, returns would be reduced. The performance data and graph do not reflect the deduction of taxes that a shareholder may pay on dividends, capital gains distributions, or redemption of Fund shares. Performance data shown does not reflect the 1.00% redemption fee imposed on shares held 60 days or less. If it did, total returns would be reduced. Indices do not incur expenses and are not available for investment.
The S&P 500® Index is an unmanaged capitalization-weighted index of 500 stocks designed to represent the broad domestic economy.
The Bloomberg US 1000 Value Index is screened from the Bloomberg US 1000 Index and is constructed based on a linear combination of risk factors. The four factors are: 1) Earnings Yield, 2) Valuation, 3) Dividend Yield and 4) Growth. The factors are equally weighted when forming a composite signal where Growth is considered to be a negative indicator and thus flipped to be negative. The indices are market-capitalization-weighted.
| * | The Fund commenced operations on December 31, 2012. |
9
Huber Funds
HUBER MID CAP VALUE FUND
Comparison of the change in value of a hypothetical $10,000 investment in the Huber Mid
Cap Value Fund – Investor Class vs the Bloomberg US 2500 Value Index
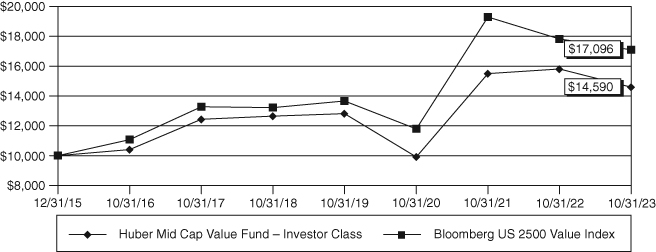
Average Annual Total Return
| Since Inception* | |||
1 Year | 5 Year | (12/31/15) | |
| Huber Mid Cap Value Fund – | |||
| Investor Class (HUMDX) | -7.72% | 2.89% | 4.94% |
| Huber Mid Cap Value Fund – | |||
| Institutional Class (HUMEX) | -7.66% | 2.98% | 5.10% |
| Bloomberg US 2500 Value Index | -4.07% | 5.29% | 7.08% |
Performance data quoted represents past performance and does not guarantee future results. The investment return and principal value of an investment will fluctuate so that an investor’s shares, when redeemed, may be worth more or less than their original cost. Current performance of the Fund may be lower or higher than the performance quoted. The most recent month-end performance may be obtained by calling 1-888-482-3726 (888-HUBERCM).
HUMDX Expense Ratio – Gross: 3.11%
HUMEX Expense Ratio – Gross: 2.81%
Expense ratios shown are as of the Fund’s prospectus dated February 28, 2023.
Returns reflect reinvestment of dividends and capital gains distributions. Fee waivers are in effect. In the absence of fee waivers, returns would be reduced. The performance data and graph do not reflect the deduction of taxes that a shareholder may pay on dividends, capital gains distributions, or redemption of Fund shares. Performance data shown does not reflect the 1.00% redemption fee imposed on shares held 60 days or less. If it did, total returns would be reduced. Indices do not incur expenses and are not available for investment.
The Bloomberg US 2500 Value Index is screened from the Bloomberg US 2500 Index and is constructed based on a linear combination of risk factors. The four factors are: 1) Earnings Yield, 2) Valuation, 3) Dividend Yield and 4) Growth. The factors are equally weighted when forming a composite signal where Growth is considered to be a negative indicator and thus flipped to be negative. The indices are market-capitalization-weighted.
| * | The Fund commenced operations on December 31, 2015. |
10
Huber Funds
EXPENSE EXAMPLE – October 31, 2023 (Unaudited)
As a shareholder of a mutual fund, you incur two types of costs: (1) transaction costs, including sales charges (loads) on purchase payments, redemption fees, and exchange fees, and (2) ongoing costs, including management fees, distribution and/or service fees, and other Fund expenses. These Examples are intended to help you understand your ongoing costs (in dollars) of investing in the Funds and to compare these costs with the ongoing costs of investing in other mutual funds. The Example is based on an investment of $1,000 invested in each Fund at the beginning of the period and held for the entire period (5/1/23 – 10/31/23).
Actual Expenses
For each class of the Select Large Cap Value Fund, the Small Cap Value Fund, the Large Cap Value Fund and the Mid Cap Value Fund, two lines are presented in the tables below – the first line for each class provides information about actual account values and actual expenses. You may be assessed a fee for outgoing wire transfers, returned checks, and stop payment orders at prevailing rates charged by U.S. Bancorp Fund Services, LLC, the Funds’ transfer agent. The Examples below include, but are not limited to, management fees, fund accounting, custody and transfer agent fees. You may use the information in this line, together with the amount you invested, to estimate the expenses that you paid over the period. Simply divide your account value by $1,000 (for example, an $8,600 account value divided by $1,000 = 8.6), then multiply the result by the number in the first line under the heading entitled “Expenses Paid During Period” for your Fund and class to estimate the expenses you paid on your account during this period.
Hypothetical Example for Comparison Purposes
For each class of each Fund, the second line for each class provides information about hypothetical account values and hypothetical expenses based on the respective Fund’s actual expense ratio and an assumed rate of return of 5% per year before expenses, which is not the Fund’s actual return. The hypothetical account values and expenses may not be used to estimate the actual ending account balance or expenses you paid for the period. You may use this information to compare the ongoing costs of investing in the Funds and other funds. To do so, compare this 5% hypothetical example with the 5% hypothetical examples that appear in the shareholder reports of the other funds. Please note that the expenses shown in the table are meant to highlight your ongoing costs only and do not reflect any transaction costs, such as sales charges (loads), redemption fees, or exchange fees. Therefore, the second line of the table is useful in comparing ongoing costs only and will not help you determine the relative total costs of owning different funds. In addition, if these transaction costs were included, your costs would have been higher.
11
Huber Funds
EXPENSE EXAMPLE – October 31, 2023 (Unaudited), Continued
| Select Large Cap Value Fund | ||||
| Beginning | Ending | Expenses Paid | Annualized | |
| Account Value | Account Value | During Period | Expense | |
5/1/23 | 10/31/23 | 5/1/23 – 10/31/23 | Ratio* | |
| Investor Class | ||||
| Actual | $1,000.00 | $ 983.40 | $6.70 | 1.34% |
| Hypothetical (5% return | ||||
| before expenses) | $1,000.00 | $1,018.45 | $6.82 | 1.34% |
| Institutional Class | ||||
| Actual | $1,000.00 | $ 984.50 | $4.95 | 0.99% |
| Hypothetical (5% return | ||||
| before expenses) | $1,000.00 | $1,020.21 | $5.04 | 0.99% |
| Small Cap Value Fund | ||||
| Beginning | Ending | Expenses Paid | Annualized | |
| Account Value | Account Value | During Period | Expense | |
5/1/23 | 10/31/23 | 5/1/23 – 10/31/23 | Ratio* | |
| Investor Class | ||||
| Actual | $1,000.00 | $1,021.20 | $7.79 | 1.53% |
| Hypothetical (5% return | ||||
| before expenses) | $1,000.00 | $1,017.49 | $7.78 | 1.53% |
| Institutional Class | ||||
| Actual | $1,000.00 | $1,022.30 | $6.88 | 1.35% |
| Hypothetical (5% return | ||||
| before expenses) | $1,000.00 | $1,018.40 | $6.87 | 1.35% |
| Large Cap Value Fund | ||||
| Beginning | Ending | Expenses Paid | Annualized | |
| Account Value | Account Value | During Period | Expense | |
5/1/23 | 10/31/23 | 5/1/23 – 10/31/23 | Ratio* | |
| Investor Class | ||||
| Actual | $1,000.00 | $ 983.40 | $5.00 | 1.00% |
| Hypothetical (5% return | ||||
| before expenses) | $1,000.00 | $1,020.16 | $5.09 | 1.00% |
| Institutional Class | ||||
| Actual | $1,000.00 | $ 984.50 | $3.75 | 0.75% |
| Hypothetical (5% return | ||||
| before expenses) | $1,000.00 | $1,021.42 | $3.82 | 0.75% |
12
Huber Funds
EXPENSE EXAMPLE – October 31, 2023 (Unaudited), Continued
| Mid Cap Value Fund | ||||
| Beginning | Ending | Expenses Paid | Annualized | |
| Account Value | Account Value | During Period | Expense | |
5/1/23 | 10/31/23 | 5/1/23 – 10/31/23 | Ratio* | |
| Investor Class | ||||
| Actual | $1,000.00 | $1,016.50 | $5.34 | 1.05% |
| Hypothetical (5% return | ||||
| before expenses) | $1,000.00 | $1,019.91 | $5.35 | 1.05% |
| Institutional Class | ||||
| Actual | $1,000.00 | $1,017.30 | $5.08 | 1.00% |
| Hypothetical (5% return | ||||
| before expenses) | $1,000.00 | $1,020.16 | $5.09 | 1.00% |
| * | Expenses are equal to the annualized expense ratio of each class, multiplied by the average account value over the period, multiplied by 181 (days in most recent fiscal half-year) / 365 days to reflect the one-half year expense. |
13
Huber Funds
SECTOR ALLOCATION OF PORTFOLIO ASSETS – October 31, 2023 (Unaudited)
HUBER SELECT LARGE CAP VALUE FUND

HUBER SMALL CAP VALUE FUND

Percentages represent market value as a percentage of total investments.
14
Huber Funds
SECTOR ALLOCATION OF PORTFOLIO ASSETS – October 31, 2023 (Unaudited)
HUBER LARGE CAP VALUE FUND

HUBER MID CAP VALUE FUND
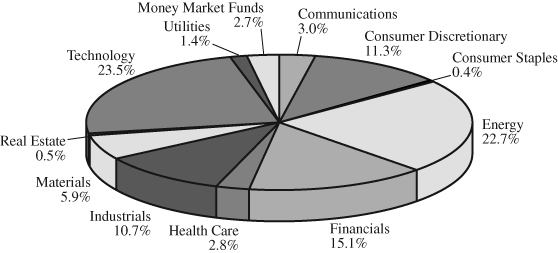
Percentages represent market value as a percentage of total investments.
15
Huber Select Large Cap Value Fund
SCHEDULE OF INVESTMENTS at October 31, 2023
| Shares | COMMON STOCKS - 96.7% | Value | |||||
| Aerospace & Defense - 4.5% | |||||||
8,593 | Northrop Grumman Corp. | $ | 4,050,998 | ||||
| Asset Management - 0.1% | |||||||
1,269 | Voya Financial, Inc. | 84,731 | |||||
| Automotive - 0.4% | |||||||
30,000 | Goodyear Tire & Rubber Co. (a) | 357,000 | |||||
| Banking - 16.0% | |||||||
63,246 | Bank of America Corp. | 1,665,900 | |||||
113,168 | Citigroup, Inc. | 4,469,004 | |||||
1,000 | First Citizens BancShares, Inc. - Class A | 1,380,740 | |||||
235,426 | First Horizon Corp. | 2,530,829 | |||||
18,233 | JPMorgan Chase & Co. | 2,535,481 | |||||
60,500 | Regions Financial Corp. | 879,065 | |||||
36,700 | Truist Financial Corp. | 1,040,812 | |||||
14,501,831 | |||||||
| Beverages - 0.6% | |||||||
9,000 | Anheuser-Busch InBev SA/NV - ADR | 511,830 | |||||
| Biotech & Pharmaceuticals - 14.5% | |||||||
20,437 | Eli Lilly & Co. | 11,320,668 | |||||
14,193 | Merck & Co., Inc. | 1,457,621 | |||||
9,530 | Pfizer, Inc. | 291,237 | |||||
13,069,526 | |||||||
| Chemicals - 2.8% | |||||||
17,352 | Innospec, Inc. | 1,700,496 | |||||
20,000 | Olin Corp. | 854,400 | |||||
2,554,896 | |||||||
| Consumer Services - 3.8% | |||||||
132,880 | Rent-A-Center, Inc. | 3,462,853 | |||||
| Electric Utilities - 1.1% | |||||||
6,977 | Constellation Energy Corp. | 787,843 | |||||
5,933 | Exelon Corp. | 231,031 | |||||
1,018,874 | |||||||
| Entertainment Content - 1.5% | |||||||
180,000 | Lions Gate Entertainment Corp. - Class B (a) | 1,342,800 | |||||
| Food - 0.6% | |||||||
11,458 | Tyson Foods, Inc. - Class A | 531,078 | |||||
The accompanying notes are an integral part of these financial statements.
16
Huber Select Large Cap Value Fund
SCHEDULE OF INVESTMENTS at October 31, 2023, Continued
| Shares | COMMON STOCKS - 96.7%, Continued | Value | |||||
| Health Care Facilities & Services - 0.3% | |||||||
10,000 | Select Medical Holdings Corp. | $ | 227,300 | ||||
| Home Construction - 0.6% | |||||||
5,560 | Lennar Corp. - Class B | 548,271 | |||||
| Industrial Support Services - 2.3% | |||||||
5,200 | United Rentals, Inc. | 2,112,604 | |||||
| Insurance - 1.9% | |||||||
74,421 | CNO Financial Group, Inc. | 1,725,079 | |||||
| Oil & Gas Producers - 18.3% | |||||||
124,100 | BP PLC - ADR | 4,539,578 | |||||
5,600 | Cheniere Energy, Inc. | 931,952 | |||||
9,000 | Devon Energy Corp. | 419,130 | |||||
134,700 | Golar LNG Ltd. | 3,021,321 | |||||
80,500 | New Fortress Energy, Inc. | 2,439,150 | |||||
74,000 | Shell PLC - ADR | 4,820,360 | |||||
3,357 | TE Connectivity Ltd. | 395,622 | |||||
16,567,113 | |||||||
| Retail - Discretionary - 1.7% | |||||||
5,398 | Home Depot, Inc. | 1,536,757 | |||||
| Software - 10.4% | |||||||
27,928 | Microsoft Corp. | 9,442,736 | |||||
| Specialty Finance - 1.9% | |||||||
43,309 | Enova International, Inc. (a) | 1,727,163 | |||||
| Technology Hardware - 0.3% | |||||||
16,471 | Hewlett Packard Enterprise Co. | 253,324 | |||||
| Technology Services - 9.0% | |||||||
99,777 | KBR, Inc. | 5,802,032 | |||||
6,259 | Mastercard, Inc. - Class A | 2,355,575 | |||||
8,157,607 | |||||||
| Telecommunications - 2.6% | |||||||
155,200 | AT&T, Inc. | 2,390,080 | |||||
| Tobacco & Cannabis - 0.2% | |||||||
2,259 | Philip Morris International, Inc. | 201,413 | |||||
| Transportation & Logistics - 1.3% | |||||||
4,900 | FedEx Corp. | 1,176,490 | |||||
| TOTAL COMMON STOCKS | |||||||
(Cost $49,815,125) | 87,552,354 | ||||||
The accompanying notes are an integral part of these financial statements.
17
Huber Select Large Cap Value Fund
SCHEDULE OF INVESTMENTS at October 31, 2023, Continued
| Shares | MONEY MARKET FUNDS - 2.0% | Value | |||||
908,186 | First American Government Obligations | ||||||
Fund, Class X, 5.279% (b) | $ | 908,186 | |||||
908,185 | First American Treasury Obligations | ||||||
Fund, Class X, 5.275% (b) | 908,185 | ||||||
| TOTAL MONEY MARKET FUNDS | |||||||
(Cost $1,816,371) | 1,816,371 | ||||||
| TOTAL INVESTMENTS | |||||||
(Cost $51,631,496) - 98.7% | 89,368,725 | ||||||
Other Assets in Excess | |||||||
of Liabilities - 1.3% | 1,146,514 | ||||||
| TOTAL NET ASSETS - 100.00% | $ | 90,515,239 | |||||
ADR | American Depositary Receipt |
NV | Naamloze Vennootschap |
PLC | Public Limited Company |
SA/NV | Société Anonyme/Naamloze Vennootschap |
(a) | Non-income producing security. |
(b) | Rate shown represents the 7-day annualized yield as of October 31, 2023. |
The accompanying notes are an integral part of these financial statements.
18
Huber Small Cap Value Fund
SCHEDULE OF INVESTMENTS at October 31, 2023
| Shares | COMMON STOCKS - 98.5% | Value | |||||
| Asset Management - 2.3% | |||||||
7,281 | Virtus Investment Partners, Inc. | $ | 1,341,378 | ||||
| Automotive - 6.4% | |||||||
66,181 | Goodyear Tire & Rubber Co. (a) | 787,554 | |||||
80,374 | Miller Industries, Inc. | 2,923,202 | |||||
3,710,756 | |||||||
| Banking - 21.3% | |||||||
26,170 | C&F Financial Corp. | 1,378,112 | |||||
22,536 | Capstar Financial Holdings, Inc. | 342,097 | |||||
176,195 | Carter Bankshares, Inc. (a) | 1,983,956 | |||||
2,683 | First Citizens BancShares, Inc. - Class A | 3,704,525 | |||||
151,679 | First Horizon Corp. | 1,630,549 | |||||
79,008 | First United Corp. | 1,294,151 | |||||
843 | HomeTrust Bancshares, Inc. | 17,374 | |||||
35,550 | Northrim BanCorp, Inc. | 1,482,791 | |||||
9,241 | South State Corp. | 610,830 | |||||
12,444,385 | |||||||
| Biotech & Pharmaceuticals - 1.2% | |||||||
224,700 | Cipher Pharmaceuticals, Inc. (a)(b) | 706,466 | |||||
| Chemicals - 2.9% | |||||||
17,287 | Innospec, Inc. | 1,694,126 | |||||
| Commercial Support Services - 1.4% | |||||||
20,100 | H&R Block, Inc. | 825,105 | |||||
| Consumer Services - 4.4% | |||||||
98,784 | Rent-A-Center, Inc. | 2,574,311 | |||||
| Entertainment Content - 3.2% | |||||||
251,106 | Lions Gate Entertainment Corp. - Class B (a) | 1,873,251 | |||||
| Health Care Facilities & Services - 1.6% | |||||||
13,884 | Select Medical Holdings Corp. | 315,583 | |||||
11,801 | Tenet Healthcare Corp. (a) | 633,714 | |||||
949,297 | |||||||
| Home Construction - 0.3% | |||||||
5,000 | Taylor Morrison Home Corp. (a) | 191,600 | |||||
| Insurance - 2.7% | |||||||
67,244 | CNO Financial Group, Inc. | 1,558,716 | |||||
| Internet Media & Services - 1.3% | |||||||
81,700 | Lyft, Inc. - Class A (a) | 749,189 | |||||
The accompanying notes are an integral part of these financial statements.
19
Huber Small Cap Value Fund
SCHEDULE OF INVESTMENTS at October 31, 2023, Continued
| Shares | COMMON STOCKS - 98.5%, Continued | Value | |||||
| Leisure Facilities & Services - 1.8% | |||||||
97,754 | Boston Pizza Royalties Income Fund (b) | $ | 1,034,110 | ||||
| Leisure Products - 2.1% | |||||||
73,515 | JAKKS Pacific, Inc. (a) | 1,232,847 | |||||
| Metals & Mining - 1.3% | |||||||
43,537 | Sprott Physical Uranium Trust (a)(b) | 788,328 | |||||
| Oil & Gas Producers - 11.6% | |||||||
181,238 | Golar LNG Ltd. | 4,065,168 | |||||
800 | Gulfport Energy Corp. (a) | 98,888 | |||||
628,730 | W&T Offshore, Inc. (a) | 2,609,230 | |||||
6,773,286 | |||||||
| Oil & Gas Services & Equipment - 7.2% | |||||||
483,558 | CSI Compressco LP | 647,968 | |||||
24,165 | Ranger Energy Services, Inc. | 280,556 | |||||
690,298 | TETRA Technologies, Inc. (a) | 3,272,012 | |||||
4,200,536 | |||||||
| Specialty Finance - 2.3% | |||||||
33,549 | Enova International, Inc. (a) | 1,337,934 | |||||
| Technology Hardware - 7.6% | |||||||
151,551 | Comtech Telecommunications Corp. | 1,848,922 | |||||
301,367 | Xperi, Inc. (a) | 2,558,606 | |||||
4,407,528 | |||||||
| Technology Services - 11.3% | |||||||
84,475 | KBR, Inc. | 4,912,221 | |||||
15,110 | Science Applications International Corp. | 1,650,617 | |||||
6,562,838 | |||||||
| Transportation Equipment - 4.3% | |||||||
355,646 | Commercial Vehicle Group, Inc. (a) | 2,478,852 | |||||
| TOTAL COMMON STOCKS | |||||||
(Cost $37,915,500) | 57,434,839 | ||||||
The accompanying notes are an integral part of these financial statements.
20
Huber Small Cap Value Fund
SCHEDULE OF INVESTMENTS at October 31, 2023, Continued
| Shares | REIT - 1.3% | Value | |||||
16,937 | Granite Real Estate Investment Trust | $ | 773,767 | ||||
| TOTAL REIT | |||||||
(Cost $521,812) | 773,767 | ||||||
MONEY MARKET FUNDS - 0.7% | |||||||
202,540 | First American Government Obligations | ||||||
Fund, Class X, 5.279% (c) | 202,540 | ||||||
202,541 | First American Treasury Obligations | ||||||
Fund, Class X, 5.275% (c) | 202,541 | ||||||
| TOTAL MONEY MARKET FUNDS | |||||||
(Cost $405,081) | 405,081 | ||||||
| TOTAL INVESTMENTS | |||||||
(Cost $38,842,393) - 100.5% | 58,613,687 | ||||||
Liabilities in Excess | |||||||
of Other Assets - (0.5)% | (289,797 | ) | |||||
| TOTAL NET ASSETS - 100.00% | $ | 58,323,890 | |||||
REIT | Real Estate Investment Trust |
(a) | Non-income producing security. |
(b) | Foreign issued security. |
(c) | Rate shown represents the 7-day annualized yield as of October 31, 2023. |
The accompanying notes are an integral part of these financial statements.
21
Huber Large Cap Value Fund
SCHEDULE OF INVESTMENTS at October 31, 2023
| Shares | COMMON STOCKS - 96.9% | Value | |||||
| Aerospace & Defense - 3.2% | |||||||
700 | Northrop Grumman Corp. | $ | 330,001 | ||||
| Automotive - 2.3% | |||||||
3,403 | Goodyear Tire & Rubber Co. (a) | 40,496 | |||||
5,251 | Miller Industries, Inc. | 190,979 | |||||
231,475 | |||||||
| Banking - 10.5% | |||||||
5,300 | Bank of America Corp. | 139,602 | |||||
12,800 | Citigroup, Inc. | 505,472 | |||||
25,292 | First Horizon Corp. | 271,889 | |||||
1,100 | JPMorgan Chase & Co. | 152,966 | |||||
1,069,929 | |||||||
| Biotech & Pharmaceuticals - 13.3% | |||||||
2,000 | Eli Lilly & Co. | 1,107,860 | |||||
1,100 | Merck & Co., Inc. | 112,970 | |||||
4,300 | Pfizer, Inc. | 131,408 | |||||
1,352,238 | |||||||
| Chemicals - 0.8% | |||||||
800 | Innospec, Inc. | 78,400 | |||||
| Consumer Services - 3.6% | |||||||
13,894 | Rent-A-Center, Inc. | 362,077 | |||||
| Electric Utilities - 2.7% | |||||||
300 | American Electric Power Co., Inc. | 22,662 | |||||
533 | Constellation Energy Corp. | 60,186 | |||||
900 | Entergy Corp. | 86,031 | |||||
1,600 | Exelon Corp. | 62,304 | |||||
800 | NextEra Energy, Inc. | 46,640 | |||||
277,823 | |||||||
| Entertainment Content - 2.1% | |||||||
28,200 | Lions Gate Entertainment Corp. - Class B (a) | 210,372 | |||||
| Food - 0.9% | |||||||
500 | Lamb Weston Holdings, Inc. | 44,900 | |||||
1,100 | Tyson Foods, Inc. - Class A | 50,985 | |||||
95,885 | |||||||
| Health Care Facilities & Services - 0.3% | |||||||
1,100 | Select Medical Holdings Corp. | 25,003 | |||||
The accompanying notes are an integral part of these financial statements.
22
Huber Large Cap Value Fund
SCHEDULE OF INVESTMENTS at October 31, 2023, Continued
| Shares | COMMON STOCKS - 96.9%, Continued | Value | |||||
| Industrial Support Services - 0.8% | |||||||
200 | United Rentals, Inc. | $ | 81,254 | ||||
| Institutional Financial Services - 0.6% | |||||||
200 | Goldman Sachs Group, Inc. | 60,722 | |||||
| Insurance - 1.8% | |||||||
8,073 | CNO Financial Group, Inc. | 187,132 | |||||
| Oil & Gas Producers - 20.7% | |||||||
14,900 | BP PLC - ADR | 545,042 | |||||
1,000 | Chesapeake Energy Corp. | 86,080 | |||||
31,803 | Golar LNG Ltd. | 713,341 | |||||
4,000 | New Fortress Energy, Inc. | 121,200 | |||||
9,300 | Shell PLC - ADR | 605,802 | |||||
300 | TE Connectivity Ltd. | 35,355 | |||||
2,106,820 | |||||||
| Retail - Consumer Staples - 2.4% | |||||||
1,500 | Wal-Mart Stores, Inc. | 245,115 | |||||
| Retail - Discretionary - 1.7% | |||||||
600 | Home Depot, Inc. | 170,814 | |||||
| Software - 9.6% | |||||||
2,600 | Microsoft Corp. | 879,086 | |||||
900 | Oracle Corp. | 93,060 | |||||
972,146 | |||||||
| Specialty Finance - 2.1% | |||||||
5,410 | Enova International, Inc. (a) | 215,751 | |||||
| Technology Services - 15.7% | |||||||
23,530 | KBR, Inc. | 1,368,270 | |||||
550 | Mastercard, Inc. - Class A | 206,993 | |||||
100 | Visa, Inc. - Class A | 23,510 | |||||
1,598,773 | |||||||
| Telecommunications - 0.6% | |||||||
3,900 | AT&T, Inc. | 60,060 | |||||
| Tobacco & Cannabis - 0.5% | |||||||
600 | Philip Morris International, Inc. | 53,496 | |||||
| Transportation & Logistics - 0.7% | |||||||
300 | FedEx Corp. | 72,030 | |||||
| TOTAL COMMON STOCKS | |||||||
(Cost $5,119,854) | 9,857,316 | ||||||
The accompanying notes are an integral part of these financial statements.
23
Huber Large Cap Value Fund
SCHEDULE OF INVESTMENTS at October 31, 2023, Continued
| Shares | MONEY MARKET FUNDS - 3.3% | Value | |||||
168,527 | First American Government Obligations | ||||||
Fund, Class X, 5.279% (b) | $ | 168,527 | |||||
168,526 | First American Treasury Obligations | ||||||
Fund, Class X, 5.275% (b) | 168,526 | ||||||
| TOTAL MONEY MARKET FUNDS | |||||||
(Cost $337,053) | 337,053 | ||||||
| TOTAL INVESTMENTS | |||||||
(Cost $5,456,907) - 100.2% | 10,194,369 | ||||||
Liabilities in Excess | |||||||
of Other Assets - (0.2)% | (22,159 | ) | |||||
| TOTAL NET ASSETS - 100.00% | $ | 10,172,210 | |||||
ADR | American Depositary Receipt |
PLC | Public Limited Company |
(a) | Non-income producing security. |
(b) | Rate shown represents the 7-day annualized yield as of October 31, 2023. |
The accompanying notes are an integral part of these financial statements.
24
Huber Mid Cap Value Fund
SCHEDULE OF INVESTMENTS at October 31, 2023
| Shares | COMMON STOCKS - 97.0% | Value | |||||
| Aerospace & Defense - 1.9% | |||||||
400 | Northrop Grumman Corp. | $ | 188,572 | ||||
| Asset Management - 0.2% | |||||||
109 | Virtus Investment Partners, Inc. | 20,081 | |||||
| Automotive - 6.0% | |||||||
8,100 | Goodyear Tire & Rubber Co. (a) | 96,390 | |||||
13,511 | Miller Industries, Inc. | 491,395 | |||||
587,785 | |||||||
| Banking - 11.4% | |||||||
5,800 | Citigroup, Inc. | 229,042 | |||||
350 | First Citizens BancShares, Inc. - Class A | 483,258 | |||||
24,217 | First Horizon Corp. | 260,333 | |||||
2,052 | South State Corp. | 135,637 | |||||
1,108,270 | |||||||
| Biotech & Pharmaceuticals - 0.9% | |||||||
2,500 | GSK PLC - ADR | 89,250 | |||||
| Chemicals - 4.3% | |||||||
3,388 | Innospec, Inc. | 332,024 | |||||
2,000 | Olin Corp. | 85,440 | |||||
417,464 | |||||||
| Consumer Services - 4.4% | |||||||
16,500 | Rent-A-Center, Inc. | 429,990 | |||||
| Electric Utilities - 0.4% | |||||||
400 | Entergy Corp. | 38,236 | |||||
| Food - 0.4% | |||||||
700 | Conagra Brands, Inc. | 19,152 | |||||
266 | Lamb Weston Holdings, Inc. | 23,887 | |||||
43,039 | |||||||
| Gas & Water Utilities - 1.0% | |||||||
2,000 | National Fuel Gas Co. | 101,900 | |||||
| Health Care Facilities & Services - 1.9% | |||||||
2,200 | Select Medical Holdings Corp. | 50,006 | |||||
2,500 | Tenet Healthcare Corp. (a) | 134,250 | |||||
184,256 | |||||||
| Industrial Support Services - 2.1% | |||||||
500 | United Rentals, Inc. | 203,135 | |||||
The accompanying notes are an integral part of these financial statements.
25
Huber Mid Cap Value Fund
SCHEDULE OF INVESTMENTS at October 31, 2023, Continued
| Shares | COMMON STOCKS - 97.0%, Continued | Value | |||||
| Insurance - 1.1% | |||||||
4,510 | CNO Financial Group, Inc. | $ | 104,542 | ||||
| Leisure Products - 0.9% | |||||||
5,139 | JAKKS Pacific, Inc. (a) | 86,181 | |||||
| Metals & Mining - 1.6% | |||||||
8,550 | Sprott Physical Uranium Trust (a)(b) | 154,816 | |||||
| �� | |||||||
| Oil & Gas Producers - 15.8% | |||||||
4,700 | BP PLC - ADR | 171,926 | |||||
1,000 | Chesapeake Energy Corp. | 86,080 | |||||
27,339 | Golar LNG Ltd. | 613,214 | |||||
10,900 | New Fortress Energy, Inc. | 330,270 | |||||
81,466 | W&T Offshore, Inc. (a) | 338,084 | |||||
1,539,574 | |||||||
| Oil & Gas Services & Equipment - 7.0% | |||||||
142,924 | TETRA Technologies, Inc. (a) | 677,460 | |||||
| Software - 2.0% | |||||||
1,300 | VMware, Inc. - Class A (a) | 189,345 | |||||
| Specialty Finance - 2.4% | |||||||
5,904 | Enova International, Inc. (a) | 235,452 | |||||
| Technology Hardware - 10.0% | |||||||
44,887 | Comtech Telecommunications Corp. | 547,621 | |||||
50,153 | Xperi, Inc. (a) | 425,799 | |||||
973,420 | |||||||
| Technology Services - 11.7% | |||||||
18,185 | KBR, Inc. | 1,057,457 | |||||
700 | Science Applications International Corp. | 76,468 | |||||
1,133,925 | |||||||
| Telecommunications - 3.0% | |||||||
18,700 | AT&T, Inc. | 287,980 | |||||
| Transportation & Logistics - 2.7% | |||||||
1,100 | FedEx Corp. | 264,110 | |||||
| Transportation Equipment - 3.9% | |||||||
54,947 | Commercial Vehicle Group, Inc. (a) | 382,981 | |||||
| TOTAL COMMON STOCKS | |||||||
(Cost $7,124,843) | 9,441,764 | ||||||
The accompanying notes are an integral part of these financial statements.
26
Huber Mid Cap Value Fund
SCHEDULE OF INVESTMENTS at October 31, 2023, Continued
| Shares | REIT - 0.5% | Value | |||||
1,100 | Granite Real Estate Investment Trust | $ | 50,254 | ||||
| TOTAL REITS | |||||||
(Cost $29,536) | 50,254 | ||||||
MONEY MARKET FUNDS - 2.7% | |||||||
131,751 | First American Government Obligations | ||||||
Fund, Class X, 5.279% (c) | 131,751 | ||||||
131,752 | First American Treasury Obligations | ||||||
Fund, Class X, 5.275% (c) | 131,752 | ||||||
| TOTAL MONEY MARKET FUNDS | |||||||
(Cost $263,503) | 263,503 | ||||||
| TOTAL INVESTMENTS | |||||||
(Cost $7,417,882) - 100.2% | 9,755,521 | ||||||
Liabilities in Excess | |||||||
of Other Assets - (0.2)% | (21,043 | ) | |||||
| TOTAL NET ASSETS - 100.00% | $ | 9,734,478 | |||||
ADR | American Depositary Receipt |
PLC | Public Limited Company |
REIT | Real Estate Investment Trust |
(a) | Non-income producing security. |
(b) | Foreign issued security. |
(c) | Rate shown represents the 7-day annualized yield as of October 31, 2023. |
The accompanying notes are an integral part of these financial statements.
27
Huber Funds
STATEMENTS OF ASSETS AND LIABILITIES at October 31, 2023
| Huber Select | Huber | |||||||
| Large Cap | Small Cap | |||||||
| Value Fund | Value Fund | |||||||
ASSETS | ||||||||
| Investments in securities, at value | ||||||||
| (identified cost $51,631,496 and | ||||||||
| $38,842,393, respectively) | $ | 89,368,725 | $ | 58,613,687 | ||||
| Cash | — | 6,421 | ||||||
| Receivables | ||||||||
| Fund shares issued | 52,223 | 601 | ||||||
| Return of capital | — | 4,836 | ||||||
| Investment securities sold | 1,263,613 | 43,993 | ||||||
| Dividends and interest | 54,120 | 36,057 | ||||||
| Dividend tax reclaim | 11,054 | 6,181 | ||||||
| Prepaid expenses | 21,781 | 19,229 | ||||||
| Total assets | 90,771,516 | 58,731,005 | ||||||
LIABILITIES | ||||||||
| Payables | ||||||||
| Investment securities purchased | 72,749 | 205,613 | ||||||
| Advisory fees | 48,113 | 43,814 | ||||||
| 12b-1 distribution fees | 12,348 | 34,464 | ||||||
| Administration fees | 32,183 | 27,481 | ||||||
| Audit fees | 22,500 | 22,500 | ||||||
| Chief Compliance Officer fee | 3,750 | 3,750 | ||||||
| Custody fees | 1,027 | 2,202 | ||||||
| Fund accounting fees | 13,051 | 11,516 | ||||||
| Shareholder servicing fees | 21,247 | 25,793 | ||||||
| Transfer agent fees and expenses | 17,700 | 17,524 | ||||||
| Trustee fees and expenses | 4,419 | 4,419 | ||||||
| Accrued expenses | 7,190 | 8,039 | ||||||
| Total liabilities | 256,277 | 407,115 | ||||||
NET ASSETS | $ | 90,515,239 | $ | 58,323,890 | ||||
The accompanying notes are an integral part of these financial statements.
28
Huber Funds
STATEMENTS OF ASSETS AND LIABILITIES at October 31, 2023, Continued
| Huber Select | Huber | |||||||
| Large Cap | Small Cap | |||||||
| Value Fund | Value Fund | |||||||
CALCULATION OF NET ASSET VALUE PER SHARE | ||||||||
| Investor Class | ||||||||
| Net assets applicable to shares outstanding | $ | 17,537,975 | $ | 23,926,404 | ||||
| Shares issued and outstanding [unlimited number | �� | |||||||
| of shares (par value $0.01) authorized] | 687,671 | 1,057,555 | ||||||
| Net asset value, offering and | ||||||||
| redemption price per share (Note 1)^ | $ | 25.50 | $ | 22.62 | ||||
| Institutional Class | ||||||||
| Net assets applicable to shares outstanding | $ | 72,977,264 | $ | 34,397,486 | ||||
| Shares issued and outstanding [unlimited number | ||||||||
| of shares (par value $0.01) authorized] | 2,860,742 | 1,499,989 | ||||||
| Net asset value, offering and | ||||||||
| redemption price per share (Note 1)^ | $ | 25.51 | $ | 22.93 | ||||
COMPONENTS OF NET ASSETS | ||||||||
| Paid-in capital | $ | 58,620,765 | $ | 52,697,106 | ||||
| Total distributable earnings | 31,894,474 | 5,626,784 | ||||||
| Net assets | $ | 90,515,239 | $ | 58,323,890 | ||||
^ | A redemption fee of 1% is assessed against shares redeemed within 60 days of purchase. |
The accompanying notes are an integral part of these financial statements.
29
Huber Funds
STATEMENTS OF ASSETS AND LIABILITIES at October 31, 2023
| Huber | Huber | |||||||
| Large Cap | Mid Cap | |||||||
| Value Fund | Value Fund | |||||||
ASSETS | ||||||||
| Investments in securities, at value | ||||||||
| (identified cost $5,456,907 and | ||||||||
| $7,417,882, respectively) | $ | 10,194,369 | $ | 9,755,521 | ||||
| Receivables | ||||||||
| Fund shares sold | 600 | — | ||||||
| Investment securities sold | 102,147 | 97,504 | ||||||
| Dividends and interest | 2,225 | 6,943 | ||||||
| Dividend tax reclaim | 742 | 22 | ||||||
| Due from Adviser (Note 4) | 13,217 | 11,173 | ||||||
| Prepaid expenses | 14,511 | 14,238 | ||||||
| Total assets | 10,327,811 | 9,885,401 | ||||||
LIABILITIES | ||||||||
| Payables | ||||||||
| Investment securities purchased | 69,883 | 72,749 | ||||||
| 12b-1 distribution fees | 5,498 | 281 | ||||||
| Administration fees | 18,292 | 18,304 | ||||||
| Audit fees | 22,500 | 22,501 | ||||||
| Chief Compliance Officer fee | 3,750 | 3,750 | ||||||
| Custody fees | 904 | 912 | ||||||
| Fund accounting fees | 10,516 | 10,536 | ||||||
| Shareholder servicing fees | 2,610 | 833 | ||||||
| Transfer agent fees and expenses | 11,492 | 11,320 | ||||||
| Trustees fees and expenses | 4,419 | 4,419 | ||||||
| Accrued expenses | 5,737 | 5,318 | ||||||
| Total liabilities | 155,601 | 150,923 | ||||||
NET ASSETS | $ | 10,172,210 | $ | 9,734,478 | ||||
The accompanying notes are an integral part of these financial statements.
30
Huber Funds
STATEMENTS OF ASSETS AND LIABILITIES at October 31, 2023, Continued
| Huber | Huber | |||||||
| Large Cap | Mid Cap | |||||||
| Value Fund | Value Fund | |||||||
CALCULATION OF NET ASSET VALUE PER SHARE | ||||||||
| Investor Class | ||||||||
| Net assets applicable to shares outstanding | $ | 1,577,311 | $ | 370,589 | ||||
| Shares issued and outstanding [unlimited number | ||||||||
| of shares (par value $0.01) authorized] | 85,945 | 27,381 | ||||||
| Net asset value, offering and | ||||||||
| redemption price per share (Note 1)^ | $ | 18.35 | $ | 13.53 | ||||
| Institutional Class | ||||||||
| Net assets applicable to shares outstanding | $ | 8,594,899 | $ | 9,363,889 | ||||
| Shares issued and outstanding [unlimited number | ||||||||
| of shares (par value $0.01) authorized] | 465,514 | 690,890 | ||||||
| Net asset value, offering and | ||||||||
| redemption price per share (Note 1)^ | $ | 18.46 | $ | 13.55 | ||||
COMPONENTS OF NET ASSETS | ||||||||
| Paid-in capital | $ | 6,974,180 | $ | 8,575,008 | ||||
| Total distributable earnings | 3,198,030 | 1,159,470 | ||||||
| Net assets | $ | 10,172,210 | $ | 9,734,478 | ||||
^ | A redemption fee of 1% is assessed against shares redeemed within 60 days of purchase. |
The accompanying notes are an integral part of these financial statements.
31
Huber Funds
STATEMENTS OF OPERATIONS For the Year Ended October 31, 2023
| Huber Select | Huber | |||||||
| Large Cap | Small Cap | |||||||
| Value Fund | Value Fund | |||||||
INVESTMENT INCOME | ||||||||
| Dividends (net of foreign taxes and issuance fees | ||||||||
| withheld of $2,159 and $23,794, respectively) | $ | 1,970,604 | $ | 948,467 | ||||
| Interest | 85,671 | 39,072 | ||||||
| Total investment income | 2,056,275 | 987,539 | ||||||
| Expenses | ||||||||
| Advisory fees (Note 4) | 605,539 | 570,856 | ||||||
| Administration fees (Note 4) | 98,991 | 81,654 | ||||||
| Transfer agent fees and expenses (Note 4) | 53,740 | 51,862 | ||||||
| 12b-1 distribution fees - Investor Class (Note 6) | 43,827 | 27,367 | ||||||
| Fund accounting fees (Note 4) | 39,439 | 33,642 | ||||||
| Registration fees | 31,352 | 30,310 | ||||||
| Audit fees | 22,500 | 22,500 | ||||||
| Trustee fees and expenses | 18,418 | 18,418 | ||||||
| Shareholder servicing fees - Investor Class (Note 5) | 17,531 | 17,415 | ||||||
| Chief Compliance Officer fee (Note 4) | 11,250 | 11,250 | ||||||
| Reports to shareholders | 6,938 | 6,878 | ||||||
| Custody fees (Note 4) | 6,082 | 13,455 | ||||||
| Legal fees | 6,143 | 5,858 | ||||||
| Miscellaneous expense | 6,047 | 6,075 | ||||||
| Insurance expense | 2,837 | 2,689 | ||||||
| Total expenses | 970,634 | 900,229 | ||||||
| Less: advisory fee waiver (Note 4) | (109,964 | ) | (77,007 | ) | ||||
| Net expenses | 860,670 | 823,222 | ||||||
| Net investment income | 1,195,605 | 164,317 | ||||||
REALIZED AND UNREALIZED GAIN/(LOSS) | ||||||||
ON INVESTMENTS AND FOREIGN CURRENCY | ||||||||
| Net realized loss on: | ||||||||
| Investments | (3,950,623 | ) | (1,423,395 | ) | ||||
| Foreign currency | — | (1,761 | ) | |||||
| Net change in unrealized appreciation/(depreciation) on: | ||||||||
| Investments | 7,201,923 | (851,384 | ) | |||||
| Foreign currency | — | 604 | ||||||
| Net realized and unrealized gain/(loss) | ||||||||
| on investments and foreign currency | 3,251,300 | (2,275,936 | ) | |||||
| Net Increase/(Decrease) in Net Assets | ||||||||
| Resulting from Operations | $ | 4,446,905 | $ | (2,111,619 | ) | |||
The accompanying notes are an integral part of these financial statements.
32
Huber Funds
STATEMENTS OF OPERATIONS For the Year Ended October 31, 2023
| Huber | Huber | |||||||
| Large Cap | Mid Cap | |||||||
| Value Fund | Value Fund | |||||||
INVESTMENT INCOME | ||||||||
| Dividends (net of foreign taxes and issuance fees | ||||||||
| withheld of $288 and $864, respectively) | $ | 254,328 | $ | 181,014 | ||||
| Interest | 8,914 | 17,345 | ||||||
| Total investment income | 263,242 | 198,359 | ||||||
| Expenses | ||||||||
| Administration fees (Note 4) | 54,424 | 54,381 | ||||||
| Transfer agent fees and expenses (Note 4) | 33,730 | 33,617 | ||||||
| Fund accounting fees (Note 4) | 30,781 | 30,872 | ||||||
| Registration fees | 28,850 | 29,414 | ||||||
| Audit fees | 22,500 | 22,500 | ||||||
| Trustee fees and expenses | 20,578 | 18,419 | ||||||
| Chief Compliance Officer fee (Note 4) | 11,250 | 11,250 | ||||||
| Legal fees | 5,843 | 5,843 | ||||||
| Miscellaneous expense | 5,840 | 7,080 | ||||||
| Custody fees (Note 4) | 5,125 | 5,514 | ||||||
| 12b-1 distribution fees - Investor Class (Note 6) | 3,913 | 232 | ||||||
| Reports to shareholders | 3,581 | 3,511 | ||||||
| Insurance expense | 2,183 | 2,155 | ||||||
| Total expenses | 228,598 | 224,788 | ||||||
| Less: advisory fee waiver and | ||||||||
| expenses reimbursed (Note 4) | (147,840 | ) | (137,835 | ) | ||||
| Net expenses | 80,758 | 86,953 | ||||||
| Net investment income | 182,484 | 111,406 | ||||||
REALIZED AND UNREALIZED GAIN/(LOSS) | ||||||||
ON INVESTMENTS AND FOREIGN CURRENCY | ||||||||
| Net realized gain/(loss) on: | ||||||||
| Investments | $ | (441,278 | ) | (514,111 | ) | |||
| Foreign currency | — | 5 | ||||||
| Net change in unrealized appreciation/(depreciation) on: | ||||||||
| Investments | 295,766 | (335,967 | ) | |||||
| Foreign currency | — | 6 | ||||||
| Net realized and unrealized loss | ||||||||
| on investments and foreign currency | (145,512 | ) | (850,067 | ) | ||||
| Net Increase/(Decrease) in Net Assets | ||||||||
| Resulting from Operations | $ | 36,972 | $ | (738,661 | ) | |||
The accompanying notes are an integral part of these financial statements.
33
Huber Select Large Cap Value Fund
STATEMENTS OF CHANGES IN NET ASSETS
| Year Ended | Year Ended | |||||||
| October 31, 2023 | October 31, 2022 | |||||||
INCREASE/(DECREASE) IN NET ASSETS FROM: | ||||||||
OPERATIONS | ||||||||
| Net investment income | $ | 1,195,605 | $ | 413,357 | ||||
| Net realized loss on investments | (3,950,623 | ) | (1,873,017 | ) | ||||
| Net change in unrealized | ||||||||
| appreciation/(depreciation) on investments | 7,201,923 | 1,954,330 | ||||||
| Net increase in net assets | ||||||||
| resulting from operations | 4,446,905 | 494,670 | ||||||
DISTRIBUTIONS TO SHAREHOLDERS | ||||||||
| Net dividends and distributions to shareholders – | ||||||||
| Investor Class shares | (109,488 | ) | (20,037 | ) | ||||
| Net dividends and distributions to shareholders – | ||||||||
| Institutional Class shares | (461,084 | ) | (236,551 | ) | ||||
| Total distributions to shareholders | (570,572 | ) | (256,588 | ) | ||||
CAPITAL SHARE TRANSACTIONS | ||||||||
| Net increase in net assets derived from | ||||||||
| net change in outstanding shares (a) | 18,654,983 | 20,702,454 | ||||||
| Total increase in net assets | 22,531,316 | 20,940,536 | ||||||
NET ASSETS | ||||||||
| Beginning of year | 67,983,923 | 47,043,387 | ||||||
| End of year | $ | 90,515,239 | $ | 67,983,923 | ||||
The accompanying notes are an integral part of these financial statements.
34
Huber Select Large Cap Value Fund
STATEMENTS OF CHANGES IN NET ASSETS, Continued
(a) | A summary of share transactions is as follows: |
| Investor Class | ||||||||||||||||
| Year Ended | Year Ended | |||||||||||||||
| October 31, 2023 | October 31, 2022 | |||||||||||||||
| Shares | Paid-in Capital | Shares | Paid-in Capital | |||||||||||||
Shares sold | 136,916 | $ | 3,403,244 | 477,071 | $ | 11,539,821 | ||||||||||
Shares issued | ||||||||||||||||
on reinvestments | ||||||||||||||||
of distributions | 4,356 | 105,894 | 773 | 18,837 | ||||||||||||
Shares redeemed** | (138,843 | ) | (3,491,346 | ) | (48,371 | ) | (1,139,222 | ) | ||||||||
Net increase | 2,429 | $ | 17,792 | 429,473 | $ | 10,419,436 | ||||||||||
** Net of redemption | ||||||||||||||||
fees of | $ | — | $ | 545 | ||||||||||||
| Institutional Class | ||||||||||||||||
| Year Ended | Year Ended | |||||||||||||||
| October 31, 2023 | October 31, 2022 | |||||||||||||||
| Shares | Paid-in Capital | Shares | Paid-in Capital | |||||||||||||
Shares sold | 971,313 | $ | 24,203,655 | 682,749 | $ | 16,134,325 | ||||||||||
Shares issued | ||||||||||||||||
on reinvestments | ||||||||||||||||
of distributions | 18,687 | 452,975 | 7,238 | 175,670 | ||||||||||||
Shares redeemed** | (244,527 | ) | (6,019,439 | ) | (246,908 | ) | (6,026,977 | ) | ||||||||
Net increase | 745,473 | $ | 18,637,191 | 443,079 | $ | 10,283,018 | ||||||||||
** Net of redemption | ||||||||||||||||
fees of | $ | 281 | $ | 995 | ||||||||||||
The accompanying notes are an integral part of these financial statements.
35
Huber Small Cap Value Fund
STATEMENTS OF CHANGES IN NET ASSETS
| Year Ended | Year Ended | |||||||
| October 31, 2023 | October 31, 2022 | |||||||
INCREASE/(DECREASE) IN NET ASSETS FROM: | ||||||||
OPERATIONS | ||||||||
| Net investment income | $ | 164,317 | $ | 9,513 | ||||
| Net realized loss on: | ||||||||
| Investments | (1,423,395 | ) | (1,775,545 | ) | ||||
| Foreign currency | (1,761 | ) | (5,029 | ) | ||||
| Net change in unrealized | ||||||||
| appreciation/(depreciation) on: | ||||||||
| Investments | (851,384 | ) | 2,897,100 | |||||
| Foreign currency | 604 | (507 | ) | |||||
| Net increase/(decrease) in net assets | ||||||||
| resulting from operations | (2,111,619 | ) | 1,125,532 | |||||
DISTRIBUTIONS TO SHAREHOLDERS | ||||||||
| Net dividends and distributions to shareholders – | ||||||||
| Investor Class shares | — | (234,934 | ) | |||||
| Net dividends and distributions to shareholders – | ||||||||
| Institutional Class shares | — | (312,340 | ) | |||||
| Total distributions to shareholders | — | (547,274 | ) | |||||
CAPITAL SHARE TRANSACTIONS | ||||||||
| Net increase in net assets derived from | ||||||||
| net change in outstanding shares (a) | 2,501,083 | 5,940,881 | ||||||
| Total increase in net assets | 389,464 | 6,519,139 | ||||||
NET ASSETS | ||||||||
| Beginning of year | 57,934,426 | 51,415,287 | ||||||
| End of year | $ | 58,323,890 | $ | 57,934,426 | ||||
The accompanying notes are an integral part of these financial statements.
36
Huber Small Cap Value Fund
STATEMENTS OF CHANGES IN NET ASSETS, Continued
(a) | A summary of share transactions is as follows: |
| Investor Class | ||||||||||||||||
| Year Ended | Year Ended | |||||||||||||||
| October 31, 2023 | October 31, 2022 | |||||||||||||||
| Shares | Paid-in Capital | Shares | Paid-in Capital | |||||||||||||
Shares sold | 63,999 | $ | 1,460,859 | 102,542 | $ | 2,359,466 | ||||||||||
Shares issued | ||||||||||||||||
on reinvestments | ||||||||||||||||
of distributions | — | — | 10,147 | 229,323 | ||||||||||||
Shares redeemed** | (77,086 | ) | (1,764,826 | ) | (108,717 | ) | (2,408,749 | ) | ||||||||
Net increase/(decrease) | (13,087 | ) | $ | (303,967 | ) | 3,972 | $ | 180,040 | ||||||||
** Net of redemption | ||||||||||||||||
fees of | $ | — | $ | 2,485 | ||||||||||||
| Institutional Class | ||||||||||||||||
| Year Ended | Year Ended | |||||||||||||||
| October 31, 2023 | October 31, 2022 | |||||||||||||||
| Shares | Paid-in Capital | Shares | Paid-in Capital | |||||||||||||
Shares sold | 190,305 | $ | 4,541,447 | 285,298 | $ | 6,609,452 | ||||||||||
Shares issued | ||||||||||||||||
on reinvestments | ||||||||||||||||
of distributions | — | — | 5,443 | 124,260 | ||||||||||||
Shares redeemed** | (73,844 | ) | (1,736,397 | ) | (42,671 | ) | (972,871 | ) | ||||||||
Net increase | 116,461 | $ | 2,805,050 | 248,070 | $ | 5,760,841 | ||||||||||
** Net of redemption | ||||||||||||||||
fees of | $ | 272 | $ | 2,777 | ||||||||||||
The accompanying notes are an integral part of these financial statements.
37
Huber Large Cap Value Fund
STATEMENTS OF CHANGES IN NET ASSETS
| Year Ended | Year Ended | |||||||
| October 31, 2023 | October 31, 2022 | |||||||
INCREASE/(DECREASE) IN NET ASSETS FROM: | ||||||||
OPERATIONS | ||||||||
| Net investment income | $ | 182,484 | $ | 136,622 | ||||
| Net realized loss on investments | (441,278 | ) | (546,460 | ) | ||||
| Net change in unrealized | ||||||||
| appreciation/(depreciation) on investments | 295,766 | 383,772 | ||||||
| Net increase/(decrease) in net assets | ||||||||
| resulting from operations | 36,972 | (26,066 | ) | |||||
DISTRIBUTIONS TO SHAREHOLDERS | ||||||||
| Net dividends and distributions to shareholders – | ||||||||
| Investor Class shares | (20,900 | ) | (18,780 | ) | ||||
| Net dividends and distributions to shareholders – | ||||||||
| Institutional Class shares | (136,174 | ) | (111,808 | ) | ||||
| Total distributions to shareholders | (157,074 | ) | (130,588 | ) | ||||
CAPITAL SHARE TRANSACTIONS | ||||||||
| Net increase/(decrease) in net assets derived | ||||||||
| from net change in outstanding shares (a) | 190,710 | (196,063 | ) | |||||
| Total increase/(decrease) in net assets | 70,608 | (352,717 | ) | |||||
NET ASSETS | ||||||||
| Beginning of year | 10,101,602 | 10,454,319 | ||||||
| End of year | $ | 10,172,210 | $ | 10,101,602 | ||||
The accompanying notes are an integral part of these financial statements.
38
Huber Large Cap Value Fund
STATEMENTS OF CHANGES IN NET ASSETS, Continued
(a) | A summary of share transactions is as follows: |
| Investor Class | ||||||||||||||||
| Year Ended | Year Ended | |||||||||||||||
| October 31, 2023 | October 31, 2022 | |||||||||||||||
| Shares | Paid-in Capital | Shares | Paid-in Capital | |||||||||||||
Shares sold | 2,840 | $ | 53,039 | 2,971 | $ | 55,612 | ||||||||||
Shares issued | ||||||||||||||||
on reinvestments | ||||||||||||||||
of distributions | 1,135 | 20,898 | 1,009 | 18,780 | ||||||||||||
Shares redeemed | (6 | ) | (112 | ) | (9,155 | ) | (172,934 | ) | ||||||||
Net increase/(decrease) | 3,969 | $ | 73,825 | (5,175 | ) | $ | (98,542 | ) | ||||||||
| Institutional Class | ||||||||||||||||
| Year Ended | Year Ended | |||||||||||||||
| October 31, 2023 | October 31, 2022 | |||||||||||||||
| Shares | Paid-in Capital | Shares | Paid-in Capital | |||||||||||||
Shares sold | 265 | $ | 5,000 | 2,783 | $ | 53,716 | ||||||||||
Shares issued | ||||||||||||||||
on reinvestments | ||||||||||||||||
of distributions | 7,365 | 136,174 | 2,611 | 48,777 | ||||||||||||
Shares redeemed** | (1,306 | ) | (24,289 | ) | (10,263 | ) | (200,014 | ) | ||||||||
Net increase/(decrease) | 6,324 | $ | 116,885 | (4,869 | ) | $ | (97,521 | ) | ||||||||
** Net of redemption | ||||||||||||||||
fees of | $ | — | $ | 1 | ||||||||||||
The accompanying notes are an integral part of these financial statements.
39
Huber Mid Cap Value Fund
STATEMENTS OF CHANGES IN NET ASSETS
| Year Ended | Year Ended | |||||||
| October 31, 2023 | October 31, 2022 | |||||||
INCREASE/(DECREASE) IN NET ASSETS FROM: | ||||||||
OPERATIONS | ||||||||
| Net investment income | $ | 111,406 | $ | 71,128 | ||||
| Net realized gain/(loss) on: | ||||||||
| Investments | (514,111 | ) | (464,322 | ) | ||||
| Foreign currency | 5 | (1,167 | ) | |||||
| Net change in unrealized | ||||||||
| appreciation/(depreciation) on: | ||||||||
| Investments | (335,967 | ) | 656,800 | |||||
| Foreign currency | 6 | (14 | ) | |||||
| Net increase/(decrease) in net assets | ||||||||
| resulting from operations | (738,661 | ) | 262,425 | |||||
DISTRIBUTIONS TO SHAREHOLDERS | ||||||||
| Net dividends and distributions to shareholders – | ||||||||
| Investor Class shares | (9,347 | ) | (4,836 | ) | ||||
| Net dividends and distributions to shareholders – | ||||||||
| Institutional Class shares | (157,585 | ) | (73,192 | ) | ||||
| Total distributions to shareholders | (166,932 | ) | (78,028 | ) | ||||
CAPITAL SHARE TRANSACTIONS | ||||||||
| Net increase in net assets derived from | ||||||||
| net change in outstanding shares (a) | 1,632,344 | 1,355,659 | ||||||
| Total increase in net assets | 726,751 | 1,540,056 | ||||||
NET ASSETS | ||||||||
| Beginning of year | 9,007,727 | 7,467,671 | ||||||
| End of year | $ | 9,734,478 | $ | 9,007,727 | ||||
The accompanying notes are an integral part of these financial statements.
40
Huber Mid Cap Value Fund
STATEMENTS OF CHANGES IN NET ASSETS, Continued
(a) | A summary of share transactions is as follows: |
| Investor Class | ||||||||||||||||
| Year Ended | Year Ended | |||||||||||||||
| October 31, 2023 | October 31, 2022 | |||||||||||||||
| Shares | Paid-in Capital | Shares | Paid-in Capital | |||||||||||||
Shares sold | — | $ | — | 6,171 | $ | 92,339 | ||||||||||
Shares issued | ||||||||||||||||
on reinvestments | ||||||||||||||||
of distributions | 665 | 9,162 | 334 | 4,836 | ||||||||||||
Shares redeemed** | (7,750 | ) | (111,089 | ) | (6,460 | ) | (95,306 | ) | ||||||||
Net increase/(decrease) | (7,085 | ) | $ | (101,927 | ) | 45 | $ | 1,869 | ||||||||
** Net of redemption | ||||||||||||||||
fees of | $ | — | $ | 41 | ||||||||||||
| Institutional Class | ||||||||||||||||
| Year Ended | Year Ended | |||||||||||||||
| October 31, 2023 | October 31, 2022 | |||||||||||||||
| Shares | Paid-in Capital | Shares | Paid-in Capital | |||||||||||||
Shares sold | 139,105 | $ | 1,960,879 | 101,994 | $ | 1,411,189 | ||||||||||
Shares issued | ||||||||||||||||
on reinvestments | ||||||||||||||||
of distributions | 11,436 | 157,585 | 1,348 | 19,545 | ||||||||||||
Shares redeemed** | (26,774 | ) | (384,193 | ) | (5,315 | ) | (76,944 | ) | ||||||||
Net increase | 123,767 | $ | 1,734,271 | 98,027 | $ | 1,353,790 | ||||||||||
** Net of redemption | ||||||||||||||||
fees of | $ | — | $ | 622 | ||||||||||||
The accompanying notes are an integral part of these financial statements.
41
Huber Select Large Cap Value Fund
FINANCIAL HIGHLIGHTS – For a share outstanding throughout each year
Investor Class
| Year Ended October 31, | ||||||||||||||||||||
| 2023 | 2022 | 2021 | 2020 | 2019 | ||||||||||||||||
| Net asset value, beginning of year | $ | 24.30 | $ | 24.44 | $ | 16.33 | $ | 17.63 | $ | 15.94 | ||||||||||
| Income from investment operations: | ||||||||||||||||||||
| Net investment income^ | 0.31 | 0.13 | 0.11 | 0.10 | 0.14 | |||||||||||||||
| Net realized and unrealized gain/(loss) | ||||||||||||||||||||
| on investments and foreign currency | ||||||||||||||||||||
| related transactions | 1.05 | (0.19 | ) | 8.33 | (1.26 | ) | 1.74 | |||||||||||||
Total from investment operations | 1.36 | (0.06 | ) | 8.44 | (1.16 | ) | 1.88 | |||||||||||||
| Less distributions: | ||||||||||||||||||||
| From net investment income | (0.16 | ) | (0.08 | ) | (0.33 | ) | (0.14 | ) | (0.19 | ) | ||||||||||
Redemption fees retained | — | 0.00 | ^+ | 0.00 | ^+ | 0.00 | ^+ | 0.00 | ^+ | |||||||||||
| Net asset value, end of year | $ | 25.50 | $ | 24.30 | $ | 24.44 | $ | 16.33 | $ | 17.63 | ||||||||||
| Total return | 5.61 | % | -0.26 | % | 52.32 | % | -6.68 | % | 12.03 | % | ||||||||||
| Ratios/supplemental data: | ||||||||||||||||||||
Net assets, end of year (thousands) | $ | 17,538 | $ | 16,648 | $ | 6,251 | $ | 5,043 | $ | 6,258 | ||||||||||
Ratio of expenses to average net assets: | ||||||||||||||||||||
| Before advisory fee waiver | 1.48 | % | 1.59 | % | 1.67 | % | 1.66 | % | 1.57 | % | ||||||||||
| After advisory fee waiver | 1.34 | % | 1.33 | % | 1.26 | % | 1.35 | % | 1.34 | % | ||||||||||
Ratio of net investment income | ||||||||||||||||||||
to average net assets: | ||||||||||||||||||||
| Before advisory fee waiver | 1.09 | % | 0.28 | % | 0.09 | % | 0.30 | % | 0.64 | % | ||||||||||
| After advisory fee waiver | 1.23 | % | 0.54 | % | 0.50 | % | 0.61 | % | 0.87 | % | ||||||||||
Portfolio turnover rate | 30.78 | % | 35.89 | % | 48.63 | % | 19.50 | % | 19.52 | % | ||||||||||
+ | Less than $0.005 per share. |
^ | Based on average shares outstanding. |
The accompanying notes are an integral part of these financial statements.
42
Huber Select Large Cap Value Fund
FINANCIAL HIGHLIGHTS – For a share outstanding throughout each year
Institutional Class
| Year Ended October 31, | ||||||||||||||||||||
| 2023 | 2022 | 2021 | 2020 | 2019 | ||||||||||||||||
| Net asset value, beginning of year | $ | 24.27 | $ | 24.39 | $ | 16.32 | $ | 17.62 | $ | 15.92 | ||||||||||
| Income from investment operations: | ||||||||||||||||||||
| Net investment income^ | 0.39 | 0.21 | 0.16 | 0.17 | 0.20 | |||||||||||||||
| Net realized and unrealized gain/(loss) | ||||||||||||||||||||
| on investments and foreign currency | ||||||||||||||||||||
| related transactions | 1.06 | (0.19 | ) | 8.31 | (1.28 | ) | 1.73 | |||||||||||||
Total from investment operations | 1.45 | 0.02 | 8.47 | (1.11 | ) | 1.93 | ||||||||||||||
| Less distributions: | ||||||||||||||||||||
| From net investment income | (0.21 | ) | (0.14 | ) | (0.40 | ) | (0.19 | ) | (0.23 | ) | ||||||||||
Redemption fees retained^+ | 0.00 | 0.00 | 0.00 | 0.00 | 0.00 | |||||||||||||||
| Net asset value, end of year | $ | 25.51 | $ | 24.27 | $ | 24.39 | $ | 16.32 | $ | 17.62 | ||||||||||
| Total return | 6.01 | % | 0.07 | % | 52.71 | % | -6.38 | % | 12.43 | % | ||||||||||
| Ratios/supplemental data: | ||||||||||||||||||||
Net assets, end of year (thousands) | $ | 72,977 | $ | 51,336 | $ | 40,792 | $ | 41,902 | $ | 43,912 | ||||||||||
Ratio of expenses to average net assets: | ||||||||||||||||||||
| Before advisory fee waiver | 1.13 | % | 1.25 | % | 1.40 | % | 1.30 | % | 1.22 | % | ||||||||||
| After advisory fee waiver | 0.99 | % | 0.99 | % | 0.99 | % | 0.99 | % | 0.99 | % | ||||||||||
Ratio of net investment income | ||||||||||||||||||||
to average net assets: | ||||||||||||||||||||
| Before advisory fee waiver | 1.41 | % | 0.61 | % | 0.36 | % | 0.66 | % | 0.99 | % | ||||||||||
| After advisory fee waiver | 1.55 | % | 0.87 | % | 0.77 | % | 0.97 | % | 1.22 | % | ||||||||||
Portfolio turnover rate | 30.78 | % | 35.89 | % | 48.63 | % | 19.50 | % | 19.52 | % | ||||||||||
+ | Less than $0.005 per share. |
^ | Based on average shares outstanding. |
The accompanying notes are an integral part of these financial statements.
43
Huber Small Cap Value Fund
FINANCIAL HIGHLIGHTS – For a share outstanding throughout each year
Investor Class
| Year Ended October 31, | ||||||||||||||||||||
| 2023 | 2022 | 2021 | 2020 | 2019 | ||||||||||||||||
| Net asset value, beginning of year | $ | 23.45 | $ | 23.21 | $ | 13.86 | $ | 18.02 | $ | 16.74 | ||||||||||
| Income from investment operations: | ||||||||||||||||||||
| Net investment income/(loss)^ | 0.04 | (0.02 | ) | (0.04 | ) | 0.00 | + | 0.00 | + | |||||||||||
| Net realized and unrealized gain/(loss) | ||||||||||||||||||||
| on investments and foreign currency | ||||||||||||||||||||
| related transactions | (0.87 | ) | 0.48 | 9.47 | (4.15 | ) | 1.31 | |||||||||||||
Total from investment operations | (0.83 | ) | 0.46 | 9.43 | (4.15 | ) | 1.31 | |||||||||||||
| Less distributions: | ||||||||||||||||||||
| From net investment income | — | (0.22 | ) | (0.08 | ) | (0.01 | ) | (0.03 | ) | |||||||||||
Redemption fees retained | — | 0.00 | ^+ | 0.00 | ^+ | 0.00 | ^+ | 0.00 | ^+ | |||||||||||
| Net asset value, end of year | $ | 22.62 | $ | 23.45 | $ | 23.21 | $ | 13.86 | $ | 18.02 | ||||||||||
| Total return | -3.54 | % | 2.02 | % | 68.19 | % | -23.03 | % | 7.97 | % | ||||||||||
| Ratios/supplemental data: | ||||||||||||||||||||
Net assets, end of year (thousands) | $ | 23,926 | $ | 25,107 | $ | 24,753 | $ | 14,937 | $ | 21,003 | ||||||||||
Ratio of expenses to average net assets: | ||||||||||||||||||||
| Before advisory fee waiver | 1.66 | % | 1.71 | % | 1.86 | % | 2.03 | % | 1.77 | % | ||||||||||
| After advisory fee waiver | 1.53 | % | 1.53 | % | 1.56 | % | 1.65 | % | 1.58 | % | ||||||||||
Ratio of net investment income/(loss) | ||||||||||||||||||||
to average net assets: | ||||||||||||||||||||
| Before advisory fee waiver | 0.05 | % | (0.27 | %) | (0.48 | %) | (0.35 | %) | (0.16 | %) | ||||||||||
| After advisory fee waiver | 0.18 | % | (0.09 | %) | (0.18 | %) | 0.03 | % | 0.03 | % | ||||||||||
Portfolio turnover rate | 43.63 | % | 41.12 | % | 75.60 | % | 71.53 | % | 37.26 | % | ||||||||||
+ | Less than $0.005 per share. |
^ | Based on average shares outstanding. |
The accompanying notes are an integral part of these financial statements.
44
Huber Small Cap Value Fund
FINANCIAL HIGHLIGHTS – For a share outstanding throughout each year
Institutional Class
| Year Ended October 31, | ||||||||||||||||||||
| 2023 | 2022 | 2021 | 2020 | 2019 | ||||||||||||||||
| Net asset value, beginning of year | $ | 23.73 | $ | 23.48 | $ | 14.04 | $ | 18.23 | $ | 16.95 | ||||||||||
| Income from investment operations: | ||||||||||||||||||||
| Net investment income^ | 0.08 | 0.03 | 0.01 | 0.05 | 0.04 | |||||||||||||||
| Net realized and unrealized gain/(loss) | ||||||||||||||||||||
| on investments and foreign currency | ||||||||||||||||||||
| related transactions | (0.88 | ) | 0.49 | 9.56 | (4.20 | ) | 1.32 | |||||||||||||
Total from investment operations | (0.80 | ) | 0.52 | 9.57 | (4.15 | ) | 1.36 | |||||||||||||
| Less distributions: | ||||||||||||||||||||
| From net investment income | — | (0.27 | ) | (0.13 | ) | (0.04 | ) | (0.08 | ) | |||||||||||
Redemption fees retained^+ | 0.00 | 0.00 | 0.00 | 0.00 | 0.00 | |||||||||||||||
| Net asset value, end of year | $ | 22.93 | $ | 23.73 | $ | 23.48 | $ | 14.04 | $ | 18.23 | ||||||||||
| Total return | -3.37 | % | 2.25 | % | 68.47 | % | -22.80 | % | 8.16 | % | ||||||||||
| Ratios/supplemental data: | ||||||||||||||||||||
Net assets, end of year (thousands) | $ | 34,398 | $ | 32,827 | $ | 26,662 | $ | 18,188 | $ | 20,051 | ||||||||||
Ratio of expenses to average net assets: | ||||||||||||||||||||
| Before advisory fee waiver | 1.48 | % | 1.53 | % | 1.65 | % | 1.73 | % | 1.54 | % | ||||||||||
| After advisory fee waiver | 1.35 | % | 1.35 | % | 1.35 | % | 1.35 | % | 1.35 | % | ||||||||||
Ratio of net investment income/(loss) | ||||||||||||||||||||
to average net assets: | ||||||||||||||||||||
| Before advisory fee waiver | 0.23 | % | (0.07 | %) | (0.27 | %) | (0.05 | %) | 0.07 | % | ||||||||||
| After advisory fee waiver | 0.36 | % | 0.11 | % | 0.03 | % | 0.33 | % | 0.26 | % | ||||||||||
Portfolio turnover rate | 43.63 | % | 41.12 | % | 75.60 | % | 71.53 | % | 37.26 | % | ||||||||||
+ | Less than $0.005 per share. |
^ | Based on average shares outstanding. |
The accompanying notes are an integral part of these financial statements.
45
Huber Large Cap Value Fund
FINANCIAL HIGHLIGHTS – For a share outstanding throughout each year
Investor Class
| Year Ended October 31, | ||||||||||||||||||||
| 2023 | 2022 | 2021 | 2020 | 2019 | ||||||||||||||||
| Net asset value, beginning of year | $ | 18.58 | $ | 18.89 | $ | 13.18 | $ | 15.69 | $ | 14.58 | ||||||||||
| Income from investment operations: | ||||||||||||||||||||
| Net investment income^ | 0.29 | 0.21 | 0.20 | 0.20 | 0.22 | |||||||||||||||
| Net realized and unrealized gain/(loss) | ||||||||||||||||||||
| on investments and foreign currency | ||||||||||||||||||||
| related transactions | (0.27 | ) | (0.31 | ) | 5.74 | (2.52 | ) | 1.08 | ||||||||||||
Total from investment operations | 0.02 | (0.10 | ) | 5.94 | (2.32 | ) | 1.30 | |||||||||||||
| Less distributions: | ||||||||||||||||||||
| From net investment income | (0.25 | ) | (0.21 | ) | (0.23 | ) | (0.19 | ) | (0.19 | ) | ||||||||||
| Net asset value, end of year | $ | 18.35 | $ | 18.58 | $ | 18.89 | $ | 13.18 | $ | 15.69 | ||||||||||
| Total return | 0.12 | % | -0.50 | % | 45.52 | % | -15.00 | % | 9.17 | % | ||||||||||
| Ratios/supplemental data: | ||||||||||||||||||||
Net assets, end of year (thousands) | $ | 1,577 | $ | 1,523 | $ | 1,646 | $ | 1,074 | $ | 1,296 | ||||||||||
Ratio of expenses to average net assets: | ||||||||||||||||||||
| Before advisory fee waiver and | ||||||||||||||||||||
| expense reimbursement | 2.44 | % | 2.32 | % | 2.74 | % | 4.94 | % | 4.52 | % | ||||||||||
| After advisory fee waiver and | ||||||||||||||||||||
| expense reimbursement | 1.00 | % | 0.97 | % | 0.89 | % | 1.00 | % | 0.85 | % | ||||||||||
Ratio of net investment income/(loss) | ||||||||||||||||||||
to average net assets: | ||||||||||||||||||||
| Before advisory fee waiver and | ||||||||||||||||||||
| expense reimbursement | 0.12 | % | (0.19 | %) | (0.66 | %) | (2.58 | %) | (2.17 | %) | ||||||||||
| After advisory fee waiver and | ||||||||||||||||||||
| expense reimbursement | 1.56 | % | 1.16 | % | 1.19 | % | 1.36 | % | 1.50 | % | ||||||||||
Portfolio turnover rate | 33.77 | % | 44.34 | % | 26.45 | % | 36.17 | % | 35.66 | % | ||||||||||
^ | Based on average shares outstanding. |
The accompanying notes are an integral part of these financial statements.
46
Huber Large Cap Value Fund
FINANCIAL HIGHLIGHTS – For a share outstanding throughout each year
Institutional Class
| Year Ended October 31, | ||||||||||||||||||||
| 2023 | 2022 | 2021 | 2020 | 2019 | ||||||||||||||||
| Net asset value, beginning of year | $ | 18.68 | $ | 18.98 | $ | 13.26 | $ | 15.75 | $ | 14.66 | ||||||||||
| Income from investment operations: | ||||||||||||||||||||
| Net investment income^ | 0.34 | 0.26 | 0.23 | 0.23 | 0.23 | |||||||||||||||
| Net realized and unrealized gain/(loss) | ||||||||||||||||||||
| on investments and foreign currency | ||||||||||||||||||||
| related transactions | (0.26 | ) | (0.32 | ) | 5.76 | (2.51 | ) | 1.09 | ||||||||||||
Total from investment operations | 0.08 | (0.06 | ) | 5.99 | (2.28 | ) | 1.32 | |||||||||||||
| Less distributions: | ||||||||||||||||||||
| From net investment income | (0.30 | ) | (0.24 | ) | (0.27 | ) | (0.21 | ) | (0.23 | ) | ||||||||||
Redemption fees retained | — | 0.00 | ^+ | — | — | — | ||||||||||||||
| Net asset value, end of year | $ | 18.46 | $ | 18.68 | $ | 18.98 | $ | 13.26 | $ | 15.75 | ||||||||||
| Total return | 0.41 | % | -0.31 | % | 45.66 | % | -14.73 | % | 9.25 | % | ||||||||||
| Ratios/supplemental data: | ||||||||||||||||||||
Net assets, end of year (thousands) | $ | 8,595 | $ | 8,579 | $ | 8,808 | $ | 2,788 | $ | 3,805 | ||||||||||
Ratio of expenses to average net assets: | ||||||||||||||||||||
| Before advisory fee waiver and | ||||||||||||||||||||
| expense reimbursement | 2.19 | % | 2.10 | % | 2.60 | % | 4.69 | % | 4.42 | % | ||||||||||
| After advisory fee waiver and | ||||||||||||||||||||
| expense reimbursement | 0.75 | % | 0.75 | % | 0.75 | % | 0.75 | % | 0.75 | % | ||||||||||
Ratio of net investment income/(loss) | ||||||||||||||||||||
to average net assets: | ||||||||||||||||||||
| Before advisory fee waiver and | ||||||||||||||||||||
| expense reimbursement | 0.38 | % | 0.04 | % | (0.52 | %) | (2.33 | %) | (2.07 | %) | ||||||||||
| After advisory fee waiver and | ||||||||||||||||||||
| expense reimbursement | 1.82 | % | 1.39 | % | 1.33 | % | 1.61 | % | 1.60 | % | ||||||||||
Portfolio turnover rate | 33.77 | % | 44.34 | % | 26.45 | % | 36.17 | % | 35.66 | % | ||||||||||
+ | Less than $0.005 per share. |
^ | Based on average shares outstanding. |
The accompanying notes are an integral part of these financial statements.
47
Huber Mid Cap Value Fund
FINANCIAL HIGHLIGHTS – For a share outstanding throughout each year
Investor Class
| Year Ended October 31, | ||||||||||||||||||||
| 2023 | 2022 | 2021 | 2020 | 2019 | ||||||||||||||||
| Net asset value, beginning of year | $ | 14.95 | $ | 14.80 | $ | 9.53 | $ | 12.32 | $ | 12.29 | ||||||||||
| Income from investment operations: | ||||||||||||||||||||
| Net investment income^ | 0.18 | 0.13 | 0.05 | 0.04 | 0.05 | |||||||||||||||
| Net realized and unrealized gain/(loss) | ||||||||||||||||||||
| on investments and foreign currency | ||||||||||||||||||||
| related transactions | (1.33 | ) | 0.16 | 5.30 | (2.83 | ) | 0.10 | |||||||||||||
Total from investment operations | (1.15 | ) | 0.29 | 5.35 | (2.79 | ) | 0.15 | |||||||||||||
| Less distributions: | ||||||||||||||||||||
| From net investment income | (0.27 | ) | (0.14 | ) | (0.08 | ) | (0.00 | )+ | (0.12 | ) | ||||||||||
Redemption fees retained | — | 0.00 | ^+ | — | — | — | ||||||||||||||
| Net asset value, end of year | $ | 13.53 | $ | 14.95 | $ | 14.80 | $ | 9.53 | $ | 12.32 | ||||||||||
| Total return | -7.72 | % | 1.99 | % | 56.34 | % | -22.65 | % | 1.32 | % | ||||||||||
| Ratios/supplemental data: | ||||||||||||||||||||
Net assets, end of year (thousands) | $ | 370 | $ | 516 | $ | 510 | $ | 256 | $ | 331 | ||||||||||
Ratio of expenses to average net assets: | ||||||||||||||||||||
| Before advisory fee waiver and | ||||||||||||||||||||
| expense reimbursement | 2.64 | % | 2.76 | % | 3.71 | % | 13.99 | % | 12.16 | % | ||||||||||
| After advisory fee waiver and | ||||||||||||||||||||
| expense reimbursement | 1.05 | % | 1.05 | % | 1.14 | % | 1.30 | % | 1.08 | % | ||||||||||
Ratio of net investment income/(loss) | ||||||||||||||||||||
to average net assets: | ||||||||||||||||||||
| Before advisory fee waiver and | ||||||||||||||||||||
| expense reimbursement | (0.33 | %) | (0.86 | %) | (2.18 | %) | (12.29 | %) | (10.62 | %) | ||||||||||
| After advisory fee waiver and | ||||||||||||||||||||
| expense reimbursement | 1.26 | % | 0.85 | % | 0.39 | % | 0.40 | % | 0.46 | % | ||||||||||
Portfolio turnover rate | 66.66 | % | 73.00 | % | 59.38 | % | 118.94 | % | 90.36 | % | ||||||||||
^ | Based on average shares outstanding. |
+ | Less than $0.005 per share. |
The accompanying notes are an integral part of these financial statements.
48
Huber Mid Cap Value Fund
FINANCIAL HIGHLIGHTS – For a share outstanding throughout each year
Institutional Class
| Year Ended October 31, | ||||||||||||||||||||
| 2023 | 2022 | 2021 | 2020 | 2019 | ||||||||||||||||
| Net asset value, beginning of year | $ | 14.97 | $ | 14.83 | $ | 9.55 | $ | 12.33 | $ | 12.33 | ||||||||||
| Income from investment operations: | ||||||||||||||||||||
| Net investment income^ | 0.18 | 0.13 | 0.08 | 0.07 | 0.06 | |||||||||||||||
| Net realized and unrealized gain/(loss) | ||||||||||||||||||||
| on investments and foreign currency | ||||||||||||||||||||
| related transactions | (1.32 | ) | 0.17 | 5.30 | (2.85 | ) | 0.09 | |||||||||||||
Total from investment operations | (1.14 | ) | 0.30 | 5.38 | (2.78 | ) | 0.15 | |||||||||||||
| Less distributions: | ||||||||||||||||||||
| From net investment income | (0.28 | ) | (0.16 | ) | (0.10 | ) | (0.00 | )+ | (0.15 | ) | ||||||||||
Redemption fees retained | — | 0.00 | ^+ | — | — | — | ||||||||||||||
| Net asset value, end of year | $ | 13.55 | $ | 14.97 | $ | 14.83 | $ | 9.55 | $ | 12.33 | ||||||||||
| Total return | -7.66 | % | 2.02 | % | 56.61 | % | -22.55 | % | 1.35 | % | ||||||||||
| Ratios/supplemental data: | ||||||||||||||||||||
Net assets, end of year (thousands) | $ | 9,364 | $ | 8,492 | $ | 6,958 | $ | 1,310 | $ | 1,549 | ||||||||||
Ratio of expenses to average net assets: | ||||||||||||||||||||
| Before advisory fee waiver and | ||||||||||||||||||||
| expense reimbursement | 2.59 | % | 2.71 | % | 3.57 | % | 13.69 | % | 12.08 | % | ||||||||||
| After advisory fee waiver and | ||||||||||||||||||||
| expense reimbursement | 1.00 | % | 1.00 | % | 1.00 | % | 1.00 | % | 1.00 | % | ||||||||||
Ratio of net investment income/(loss) | ||||||||||||||||||||
to average net assets: | ||||||||||||||||||||
| Before advisory fee waiver and | ||||||||||||||||||||
| expense reimbursement | (0.30 | %) | (0.81 | %) | (2.05 | %) | (11.99 | %) | (10.54 | %) | ||||||||||
| After advisory fee waiver and | ||||||||||||||||||||
| expense reimbursement | 1.29 | % | 0.90 | % | 0.52 | % | 0.70 | % | 0.54 | % | ||||||||||
Portfolio turnover rate | 66.66 | % | 73.00 | % | 59.38 | % | 118.94 | % | 90.36 | % | ||||||||||
^ | Based on average shares outstanding. |
+ | Less than $0.005 per share. |
The accompanying notes are an integral part of these financial statements.
49
Huber Funds
NOTES TO FINANCIAL STATEMENTS at October 31, 2023
NOTE 1 – ORGANIZATION
The Huber Select Large Cap Value Fund, the Huber Small Cap Value Fund, the Huber Large Cap Value Fund, and the Huber Mid Cap Value Fund (each a “Fund” and collectively, the “Funds”) are each a diversified series of Advisors Series Trust (the “Trust”), which is registered under the Investment Company Act of 1940, as amended, as an open-end management investment company. Each of the Funds has separate assets and liabilities and differing investment objectives. The investment objective of the Huber Select Large Cap Value Fund (the “Select Large Cap Value Fund”), Huber Large Cap Value Fund (the “Large Cap Value Fund”), and the Huber Mid Cap Value Fund (the “Mid Cap Value Fund”) is current income and capital appreciation. The investment objective of the Huber Small Cap Value Fund (the “Small Cap Value Fund”) is capital appreciation. The Funds follow the investment company accounting and reporting guidance of the Financial Accounting Standards Board (“FASB”) Accounting Standard Codification Topic 946 “Financial Services – Investment Companies”.
The Investor Class of the Select Large Cap Value Fund and the Small Cap Value Fund commenced operations on June 29, 2007. As of October 25, 2011, the former Institutional shares were re-designated as Investor Class shares. The Select Large Cap Value Fund and the Small Cap Value Institutional Classes subsequently commenced operations on October 25, 2011. The Large Cap Value Fund commenced operations on December 31, 2012. The Mid Cap Value Fund commenced operations on December 31, 2015.
NOTE 2 – SIGNIFICANT ACCOUNTING POLICIES
The following is a summary of significant accounting policies consistently followed by the Funds in the preparation of their financial statements. These policies are in conformity with accounting principles generally accepted in the United States of America.
| A. | Security Valuation: All investments in securities are recorded at their estimated fair value, as described in Note 3. | |
| B. | Federal Income Taxes: It is the Funds’ policy to comply with the requirements of Subchapter M of the Internal Revenue Code applicable to regulated investment companies and to distribute substantially all of its taxable income to shareholders. Therefore, no Federal income or excise tax provision is required. | |
| The Funds recognize the tax benefits of uncertain tax positions only where the position is “more likely than not” to be sustained assuming examination by tax authorities. The tax returns of the Funds’ prior three fiscal years are open for examination. Management has reviewed all open tax years in major jurisdictions and concluded that there is no impact on |
50
Huber Funds
NOTES TO FINANCIAL STATEMENTS at October 31, 2023, Continued
| the Funds’ net assets and no tax liability resulting from unrecognized tax events relating to uncertain income tax positions taken or expected to be taken on a tax return. The Funds identify their major tax jurisdictions as U.S. Federal and the state of Wisconsin; however, the Funds are not aware of any tax positions for which it is reasonably possible that the total amounts of unrecognized tax benefits will change materially in the next twelve months. | ||
| C. | Securities Transactions, Income and Distributions: Security transactions are accounted for on the trade date. Realized gains and losses on securities sold are calculated on the basis of specified cost. Interest income is recorded on an accrual basis. Dividend income and distributions to shareholders are recorded on the ex-dividend date. Withholding taxes on foreign dividends have been provided for in accordance with the Funds’ understanding of the applicable country’s tax rules and rates. | |
| Investment income, expenses (other than those specific to the class of shares), and realized and unrealized gains and losses on investments are allocated to the separate classes of each Fund based upon their relative net assets on the date income is earned or expensed and realized and unrealized gains and losses are incurred. | ||
| Each Fund is charged for those expenses that are directly attributable to the Fund, such as investment advisory, custody and transfer agent fees. Expenses that are not attributable to a Fund are typically allocated among the Funds in proportion to their respective net assets. Common expenses of the Trust are typically allocated among funds in the Trust based on a fund’s respective net assets, or by other equitable means. | ||
| The Funds distribute substantially all net investment income, if any, annually and net realized capital gains, if any, annually. Distributions from net realized gains for book purposes may include short-term capital gains. All short-term capital gains are included in ordinary income for tax purposes. | ||
| The amount and character of income and net realized gains to be distributed are determined in accordance with Federal income tax rules and regulations which may differ from accounting principles generally accepted in the United States of America. To the extent these book/tax differences are permanent, such amounts are reclassified within the capital accounts based on their Federal tax treatment. | ||
| D. | Reclassification of Capital Accounts: Accounting principles generally accepted in the United States of America require that certain components |
51
Huber Funds
NOTES TO FINANCIAL STATEMENTS at October 31, 2023, Continued
| of net assets relating to permanent differences be reclassified between financial and tax reporting. These reclassifications have no effect on net assets or net asset value per share. | ||
| For the year ended October 31, 2023, the Funds made the following permanent tax adjustments on the statements of assets and liabilities: |
| Distributable | Paid-in | ||||||||
| Earnings | Capital | ||||||||
| Huber Select Large Cap Value Fund | $ | — | $ | — | |||||
| Huber Small Cap Value Fund | 7,239 | (7,239 | ) | ||||||
| Huber Large Cap Value Fund | — | — | |||||||
| Huber Mid Cap Value Fund | — | — | |||||||
| E. | Use of Estimates: The preparation of financial statements in conformity with accounting principles generally accepted in the United States of America requires management to make estimates and assumptions that affect the reported amounts of assets and liabilities and disclosure of contingent assets and liabilities at the date of the financial statements and the reported amounts of increases and decreases in net assets from operation during the reporting period. Actual results could differ from those estimates. | |
| F. | Redemption Fees: The Funds charge a 1.00% redemption fee to shareholders who redeem shares held for 60 days or less. Such fees are retained by the Funds and accounted for as an addition to paid-in capital. The redemption fees retained by each Fund are disclosed in the statements of changes. | |
| G. | REITs: The Funds have made certain investments in real estate investment trusts (“REITs”) which pay dividends to their shareholders based upon funds available from operations. It is quite common for these dividends to exceed the REIT’s taxable earnings and profits resulting in the excess portion of such dividends being designated as a return of capital. The Funds intend to include the gross dividends from such REITs in their annual distributions to its shareholders and, accordingly, a portion of the Funds’ distributions may also be designated as a return of capital. | |
| H. | Foreign Currency: Investment securities and other assets and liabilities denominated in foreign currencies are translated into U.S. dollar amounts at the date of valuation. Purchases and sales of investment securities and income and expense items denominated in foreign currencies are translated to U.S. dollar amounts on the respective dates of such transactions. | |
| The Funds do not isolate those portions of the results of operations resulting from changes in foreign exchange rates on investments from the |
52
Huber Funds
NOTES TO FINANCIAL STATEMENTS at October 31, 2023, Continued
| fluctuations arising from changes in market prices of securities held. Such fluctuations are included with the net realized and unrealized gain or loss from investments. | ||
| Reported net realized foreign exchange gains or losses arise from sales of foreign currencies, currency gains or losses realized between the trade and settlement dates on securities transactions, and the difference between the amounts of dividends, interest, and foreign withholding taxes recorded on the Funds’ books and the U.S. dollar equivalent of the amounts actually received or paid. Net unrealized foreign exchange gains and losses arise from changes in the fair values of assets and liabilities, other than investments in securities at fiscal period-end, resulting from changes in exchange rates. | ||
| I. | Events Subsequent to the Fiscal Year End: In preparing the financial statements as of October 31, 2023, management considered the impact of subsequent events for potential recognition or disclosure in the financial statements. See Note 13 for information on a subsequent event. |
NOTE 3 – SECURITIES VALUATION
The Funds have adopted authoritative fair value accounting standards which establish an authoritative definition of fair value and set out a hierarchy for measuring fair value. These standards require additional disclosures about the various inputs and valuation techniques used to develop the measurements of fair value, a discussion in changes in valuation techniques and related inputs during the period and expanded disclosure of valuation levels for major security types. These inputs are summarized in the three broad levels listed below:
| Level 1 – | Unadjusted quoted prices in active markets for identical assets or liabilities that the Funds have the ability to access. | |
| Level 2 – | Observable inputs other than quoted prices included in level 1 that are observable for the asset or liability, either directly or indirectly. These inputs may include quoted prices for identical instrument on an inactive market, prices for similar instruments, interest rates, prepayment speed, credit risk, yield curves, default rates, and similar data. | |
| Level 3 – | Unobservable inputs for the asset or liability, to the extent relevant observable inputs are not available, representing the Fund’s own assumptions about the assumptions a market participant would use in valuing the asset or liability, and would be based on the best information available. |
Following is a description of the valuation techniques applied to the Funds’ major categories of assets and liabilities measured at fair value on a recurring basis.
53
Huber Funds
NOTES TO FINANCIAL STATEMENTS at October 31, 2023, Continued
Each Fund determines the fair value of its investments and computes its net asset value per share as of the close of regular trading on the New York Stock Exchange (4:00 EST).
Equity Securities: The Funds’ investments are carried at fair value. Securities that are primarily traded on a national securities exchange shall be valued at the last sale price on the exchange on which they are primarily traded on the day of valuation or, if there has been no sale on such day, at the mean between the bid and asked prices. Securities primarily traded in the NASDAQ Global Market System for which market quotations are readily available shall be valued using the NASDAQ Official Closing Price (“NOCP”). If the NOCP is not available, such securities shall be valued at the last sale price on the day of valuation, or if there has been no sale on such day, at the mean between the bid and asked prices. Over-the-counter securities which are not traded in the NASDAQ Global Market System shall be valued at the most recent sales price. The values for foreign securities are reported in local currency and converted to U.S. dollars using currency exchange rates. Exchange rates are provided daily by a recognized independent pricing agent. To the extent, these securities are actively traded, and valuation adjustments are not applied, they are categorized in level 1 of the fair value hierarchy.
Investment Companies: Investments in open-end mutual funds, including money market funds, are generally priced at their net asset value per share provided by the service agent of the funds and will be classified in level 1 of the fair value hierarchy.
Short-Term Securities: Short-term debt securities, including those securities having a maturity of 60 days or less, are valued at the evaluated mean between the bid and asked prices. To the extent the inputs are observable and timely, these securities would be classified in level 2 of the fair value hierarchy.
The Board of Trustees (the “Board”) has adopted a valuation policy for use by the Funds and their Valuation Designee (as defined below) in calculating each Fund’s net asset value (“NAV”). Pursuant to Rule 2a-5 under the 1940 Act, the Board has designated the Fund’s investment adviser, Huber Capital Management, LLC (“Adviser”), as the “Valuation Designee” to perform all of the fair value determinations as well as to perform all of the responsibilities that may be performed by the Valuation Designee in accordance with Rule 2a-5, subject to the Board’s oversight. The Adviser, as Valuation Designee is, authorized to make all necessary determinations of the fair values of portfolio securities and other assets for which market quotations are not readily available or if it is deemed that the prices obtained from brokers and dealers or independent pricing services are unreliable.
54
Huber Funds
NOTES TO FINANCIAL STATEMENTS at October 31, 2023, Continued
Depending on the relative significance of the valuation inputs, fair valued securities may be classified in either level 2 or level 3 of the fair value hierarchy.
The inputs or methodology used for valuing securities are not an indication of the risk associated with investing in those securities. The following is a summary of the inputs used to value the Funds’ securities as of October 31, 2023:
| Huber Select Large Cap Value Fund | ||||||||||||||||
| Level 1 | Level 2 | Level 3 | Total | |||||||||||||
| Common Stocks | ||||||||||||||||
| Communications | $ | 3,732,880 | $ | — | $ | — | $ | 3,732,880 | ||||||||
| Consumer Discretionary | 5,904,881 | — | — | 5,904,881 | ||||||||||||
| Consumer Staples | 1,244,321 | — | — | 1,244,321 | ||||||||||||
| Energy | 16,171,491 | — | — | 16,171,491 | ||||||||||||
| Financials | 18,038,804 | — | — | 18,038,804 | ||||||||||||
| Health Care | 13,296,825 | — | — | 13,296,825 | ||||||||||||
| Industrials | 7,735,715 | — | — | 7,735,715 | ||||||||||||
| Materials | 2,554,896 | — | — | 2,554,896 | ||||||||||||
| Technology | 17,853,667 | — | — | 17,853,667 | ||||||||||||
| Utilities | 1,018,874 | — | — | 1,018,874 | ||||||||||||
| Total Common Stocks | 87,552,354 | — | — | 87,552,354 | ||||||||||||
| Money Market Funds | 1,816,371 | — | — | 1,816,371 | ||||||||||||
| Total Investments | ||||||||||||||||
| in Securities | $ | 89,368,725 | $ | — | $ | — | $ | 89,368,725 | ||||||||
| Huber Small Cap Value Fund | ||||||||||||||||
| Level 1 | Level 2 | Level 3 | Total | |||||||||||||
| Common Stocks | ||||||||||||||||
| Communications | $ | 2,622,440 | $ | — | $ | — | $ | 2,622,440 | ||||||||
| Consumer Discretionary | 8,743,623 | — | — | 8,743,623 | ||||||||||||
| Energy | 10,973,822 | — | — | 10,973,822 | ||||||||||||
| Financials | 16,682,413 | — | — | 16,682,413 | ||||||||||||
| Health Care | 1,655,763 | — | — | 1,655,763 | ||||||||||||
| Industrials | 3,303,958 | — | — | 3,303,958 | ||||||||||||
| Materials | 2,482,454 | — | — | 2,482,454 | ||||||||||||
| Technology | 10,970,366 | — | — | 10,970,366 | ||||||||||||
| Total Common Stocks | 57,434,839 | — | — | 57,434,839 | ||||||||||||
| REIT | 773,767 | — | — | 773,767 | ||||||||||||
| Money Market Funds | 405,081 | — | — | 405,081 | ||||||||||||
| Total Investments | ||||||||||||||||
| in Securities | $ | 58,613,687 | $ | — | $ | — | $ | 58,613,687 | ||||||||
55
Huber Funds
NOTES TO FINANCIAL STATEMENTS at October 31, 2023, Continued
| Huber Large Cap Value Fund | ||||||||||||||||
| Level 1 | Level 2 | Level 3 | Total | |||||||||||||
| Common Stocks | ||||||||||||||||
| Communications | $ | 270,432 | $ | — | $ | — | $ | 270,432 | ||||||||
| Consumer Discretionary | 764,366 | — | — | 764,366 | ||||||||||||
| Consumer Staples | 394,496 | — | — | 394,496 | ||||||||||||
| Energy | 2,071,465 | — | — | 2,071,465 | ||||||||||||
| Financials | 1,533,534 | — | — | 1,533,534 | ||||||||||||
| Health Care | 1,377,241 | — | — | 1,377,241 | ||||||||||||
| Industrials | 518,640 | — | — | 518,640 | ||||||||||||
| Materials | 78,400 | — | — | 78,400 | ||||||||||||
| Technology | 2,570,918 | — | — | 2,570,918 | ||||||||||||
| Utilities | 277,824 | — | — | 277,824 | ||||||||||||
| Total Common Stocks | 9,857,316 | — | — | 9,857,316 | ||||||||||||
| Money Market Funds | 337,053 | — | — | 337,053 | ||||||||||||
| Total Investments | ||||||||||||||||
| in Securities | $ | 10,194,369 | $ | — | $ | — | $ | 10,194,369 | ||||||||
| Huber Mid Cap Value Fund | ||||||||||||||||
| Level 1 | Level 2 | Level 3 | Total | |||||||||||||
| Common Stocks | ||||||||||||||||
| Communications | $ | 287,980 | $ | — | $ | — | $ | 287,980 | ||||||||
| Consumer Discretionary | 1,103,956 | — | — | 1,103,956 | ||||||||||||
| Consumer Staples | 43,039 | — | — | 43,039 | ||||||||||||
| Energy | 2,217,033 | — | — | 2,217,033 | ||||||||||||
| Financials | 1,468,345 | — | — | 1,468,345 | ||||||||||||
| Health Care | 273,506 | — | — | 273,506 | ||||||||||||
| Industrials | 1,038,798 | — | — | 1,038,798 | ||||||||||||
| Materials | 572,280 | — | — | 572,280 | ||||||||||||
| Technology | 2,296,691 | — | — | 2,296,691 | ||||||||||||
| Utilities | 140,136 | — | — | 140,136 | ||||||||||||
| Total Common Stocks | 9,441,764 | — | — | 9,441,764 | ||||||||||||
| REIT | 50,254 | — | — | 50,254 | ||||||||||||
| Money Market Funds | 263,503 | — | — | 263,503 | ||||||||||||
| Total Investments | ||||||||||||||||
| in Securities | $ | 9,755,521 | $ | — | $ | — | $ | 9,755,521 | ||||||||
In June 2022, the FASB issued Accounting Standards Update 2022-03, which amends Fair Value Measurement (Topic 820): Fair Value Measurement of Equity Securities Subject to Contractual Sale Restrictions (“ASU 2022-03”). ASU 2022-03 clarifies guidance for fair value measurement of an equity security
56
Huber Funds
NOTES TO FINANCIAL STATEMENTS at October 31, 2023, Continued
subject to a contractual sale restriction and establishes new disclosure requirements for such equity securities. ASU 2022-03 is effective for fiscal years beginning after December 15, 2023 and for interim periods within those fiscal years, with early adoption permitted. Management is currently evaluating the impact of these amendments on the Funds’ financial statements.
In October 2022, the Securities and Exchange Commission (the “SEC”) adopted a final rule relating to Tailored Shareholder Reports for Mutual Funds and Exchange-Traded Funds; Fee Information in Investment Company Advertisements. The rule and form amendments will, among other things, require the Funds to transmit concise and visually engaging shareholder reports that highlight key information. The amendments will require that funds tag information in a structured data format and that certain more in-depth information be made available online and available for delivery free of charge to investors on request. The amendments became effective January 24, 2023. There is an 18-month transition period after the effective date of the amendment.
NOTE 4 – INVESTMENT ADVISORY FEE AND OTHER TRANSACTIONS WITH AFFILIATES
The Funds have an investment advisory agreement with the Adviser pursuant to which the Adviser is responsible for providing investment management services to the Funds. The Adviser furnishes all investment advice, office space and facilities, and provides most of the personnel needed by the Funds. As compensation for its services, the Adviser is entitled to a fee, computed daily and payable monthly. The Select Large Cap Value Fund pays fees calculated at an annual rate of 0.99% based upon the Fund’s average daily net assets for the first $10 billion, 0.75% based upon the Fund’s average daily net assets for the next $10 billion, and 0.50% based upon the Fund’s average daily net assets in excess of $20 billion. The Adviser has agreed to voluntarily reduce the Select Large Cap Value Fund’s contractual management fee from 0.99% to 0.75% through February 28, 2024. The Small Cap Value Fund pays fees calculated at an annual rate of 1.35% based upon the Fund’s average daily net assets for the first $5 billion and 1.00% based upon the Fund’s average daily net assets in excess of $5 billion. The Adviser has agreed to voluntarily reduce the Small Cap Value Fund’s contractual management fee from 1.35% to 0.99% through February 28, 2024. The Large Cap Value Fund pays fees calculated at an annual rate of 0.75% based upon the Fund’s average daily net assets for the first $10 billion and 0.50% based upon the Fund’s average daily net assets in excess of $10 billion. The Adviser has agreed to voluntarily reduce the Large Cap Value Fund’s contractual management fee from 0.75% to 0.00% through February 28, 2024. The Mid Cap Value Fund pays fees calculated at an annual rate of 1.00% based upon the Fund’s average daily net assets. The Adviser has agreed to voluntarily reduce the Mid Cap Value Fund’s contractual management fee from 1.00% to 0.00% through February 28,
57
Huber Funds
NOTES TO FINANCIAL STATEMENTS at October 31, 2023, Continued
2024. For the year ended October 31, 2023, the advisory fees incurred by the Funds are disclosed in the statements of operations.
The Funds are responsible for their own operating expenses. The Adviser has contractually agreed to reduce fees payable to it by the Funds and to pay Fund operating expenses (excluding class specific expenses such as the 0.25% 12b-1 fees applied to the Investor Class, 0.15% shareholder servicing fees applied to the Investor Class and 0.10% applied to the Institutional Class of the Mid Cap Value Fund, acquired fund fees and expenses, interest expense, taxes and extraordinary expenses) to the extent necessary to limit the Funds’ aggregate annual operating expenses as follows:
Expense Caps | |
| Select Large Cap Value Fund | 0.99% |
| Small Cap Value Fund | 1.35% |
| Large Cap Value Fund | 0.75% |
| Mid Cap Value Fund | 1.00% |
Percent of average daily net assets of the Funds.
Any such reduction made by the Adviser in its fees or payment of expenses which are the Funds’ obligation are subject to reimbursement by the Funds to the Adviser, if so requested by the Adviser, in any subsequent month in the 36-month period from the date of the management fee reduction and expense payment if the aggregate amount actually paid by the Funds toward the operating expenses for such fiscal year (taking into account the reimbursement) will not cause the Fund to exceed the lesser of: (1) the expense limitation in place at the time of the management fee reduction and expense payment; or (2) the expense limitation in place at the time of the reimbursement. Any such reimbursement is also contingent upon Board of Trustees review and approval. Such reimbursement may not be paid prior to the Funds’ payment of current ordinary operating expenses. For the year ended October 31, 2023, the Adviser reduced its fees and absorbed Fund expenses in the amount of $109,964 for the Select Large Cap Value Fund, $77,007 for the Small Cap Value Fund, $147,840 for the Large Cap Value Fund, and $137,835 for the Mid Cap Value Fund.
No amounts were recouped by the Adviser. The Adviser may recapture portions of the amounts shown below no later than the corresponding dates:
| Select | ||||||||||||||||
| Large Cap | Small Cap | Large Cap | Mid Cap | |||||||||||||
Date | Value Fund | Value Fund | Value Fund | Value Fund | ||||||||||||
| 10/31/2024 | $ | 163,721 | $ | 120,526 | $ | 165,712 | $ | 167,037 | ||||||||
| 10/31/2025 | 132,170 | 91,741 | 136,091 | 135,635 | ||||||||||||
| 10/31/2026 | 109,964 | 77,007 | 147,840 | 137,835 | ||||||||||||
$ | 405,855 | $ | 289,274 | $ | 449,643 | $ | 440,507 | |||||||||
58
Huber Funds
NOTES TO FINANCIAL STATEMENTS at October 31, 2023, Continued
U.S. Bancorp Fund Services, LLC, doing business as U.S. Bank Global Fund Services (“Fund Services”) serves as the Funds’ administrator, fund accountant and transfer agent. U.S. Bank N.A. serves as the Funds’ custodian (the “Custodian”). The Custodian is an affiliate of Fund Services. Fund Services maintains the Funds’ books and records, calculates the Fund’s NAV, prepares various federal and state regulatory filings, coordinates the payment of fund expenses, reviews expense accruals and prepares materials supplied to the Board of Trustees. The officers of the Trust, including the Chief Compliance Officer, are employees of Fund Services. Fees paid by the Funds for administration and accounting, transfer agency, custody and compliance services for the year ended October 31, 2023, are disclosed in the statements of operations.
Quasar Distributors, LLC (“Quasar” or the “Distributor”) acts as the Funds’ principal underwriter in a continuous public offering of the Funds’ shares. Quasar is a wholly-owned broker-dealer subsidiary of Foreside Financial Group, LLC, doing business as ACA Foreside, a division of ACA Group.
NOTE 5 – SHAREHOLDER SERVICING FEE
The Funds have entered into a shareholder servicing agreement (the “Agreement”) with the Adviser, under which the Investor Class of the Funds may pay servicing fees at an annual rate of up to 0.15% of the average daily net assets of each Investor Class and at an annual rate of up to 0.10% of the average daily net assets of the Institutional Class of the Mid Cap Value Fund. Payments to the Adviser under the Agreement may reimburse the Adviser for payments it makes to selected brokers, dealers and administrators which have entered into service agreements with the Adviser for services provided to shareholders of the Funds. The services provided by such intermediaries are primarily designed to assist shareholders of the Funds and include the furnishing of office space and equipment, telephone facilities, personnel and assistance to the Funds in servicing such shareholders. Services provided by such intermediaries also include the provision of support services to the Funds and include establishing and maintaining shareholders’ accounts and record processing, purchase and redemption transactions, answering routine client inquiries regarding the Funds, and providing such other personal services to shareholders as the Funds may reasonably request. For the year ended October 31, 2023, the shareholder servicing fees accrued by each Fund’s Investor Class are disclosed in the statements of operations. The Mid Cap Value Fund Institutional Class did not accrue shareholder servicing fees during the year ended October 31, 2023.
NOTE 6 – 12B- 1 DISTRIBUTION AGREEMENT AND PLAN
The Funds have adopted a Distribution Plan pursuant to Rule 12b-1 (the “Plan”). The Plan permits the Funds to pay Quasar Distributors, LLC for distribution and related expenses at an annual rate of up to 0.25% of each Fund’s
59
Huber Funds
NOTES TO FINANCIAL STATEMENTS at October 31, 2023, Continued
Investor Class’ average daily net assets. The expenses covered by the Plan may include the cost of preparing and distributing prospectuses and other sales material, advertising and public relations expenses, payments to financial intermediaries and compensation of personnel involved in selling shares of the Funds. Payments made pursuant to the Plan will represent reimbursement for specific expenses incurred in connection with the promotion and distribution of shares. For the year ended October 31, 2023, the 12b-1 fees accrued by each Fund’s Investor Class are disclosed in the statements of operations.
NOTE 7 – PURCHASES AND SALES OF SECURITIES
For the year ended October 31, 2023, the cost of purchases and the proceeds from sales of securities (excluding short-term securities) were as follows:
| Select Large | Small Cap | Large Cap | Mid Cap | |||||||||||||
| Cap Value Fund | Value Fund | Value Fund | Value Fund | |||||||||||||
| Purchases | $ | 45,083,022 | $ | 28,566,481 | $ | 3,765,759 | $ | 7,429,984 | ||||||||
| Sales | 24,178,598 | 24,918,759 | 3,393,120 | 5,642,086 | ||||||||||||
During the year ended October 31, 2023, there were no purchases or sales of U.S. Government securities in any of the Funds.
NOTE 8 – INCOME TAXES AND DISTRIBUTIONS TO SHAREHOLDERS
The tax character of distributions paid during the year ended October 31, 2023, and the year ended October 31, 2022, was as follows:
| Select Large Cap Value Fund | ||||||||
| Year Ended | Year Ended | |||||||
| October 31, 2023 | October 31, 2022 | |||||||
| Ordinary income | $ | 570,572 | $ | 256,588 | ||||
| Small Cap Value Fund | ||||||||
| Year Ended | Year Ended | |||||||
| October 31, 2023 | October 31, 2022 | |||||||
| Ordinary income | $ | — | $ | 547,274 | ||||
| Large Cap Value Fund | ||||||||
| Year Ended | Year Ended | |||||||
| October 31, 2023 | October 31, 2022 | |||||||
| Ordinary income | $ | 157,074 | $ | 130,588 | ||||
| Mid Cap Value Fund | ||||||||
| Year Ended | Year Ended | |||||||
| October 31, 2023 | October 31, 2022 | |||||||
| Ordinary income | $ | 166,932 | $ | 78,028 | ||||
60
Huber Funds
NOTES TO FINANCIAL STATEMENTS at October 31, 2023, Continued
As of October 31, 2023, the components of accumulated earnings/(losses) on a tax basis were as follows:
| Select | ||||||||
| Large Cap | Small Cap | |||||||
| Value Fund | Value Fund | |||||||
| Cost of investments for tax purposes (a) | $ | 52,049,280 | $ | 39,477,960 | ||||
| Gross tax unrealized appreciation | 39,674,765 | 21,596,004 | ||||||
| Gross tax unrealized depreciation | (2,355,320 | ) | (2,460,277 | ) | ||||
| Net tax unrealized appreciation | 37,319,445 | 19,135,727 | ||||||
| Net unrealized depreciation | ||||||||
| on foreign currency | — | (180 | ) | |||||
| Undistributed ordinary income | 952,699 | 275,713 | ||||||
| Undistributed long-term capital gain | — | — | ||||||
| Total distributable earnings | 952,699 | 275,713 | ||||||
| Other accumulated losses | (6,377,670 | ) | (13,784,476 | ) | ||||
| Total accumulated earnings/(losses) | $ | 31,894,474 | $ | 5,626,784 | ||||
| Large Cap | Mid Cap | |||||||
| Value Fund | Value Fund | |||||||
| Cost of investments for tax purposes (a) | $ | 5,510,653 | $ | 7,539,423 | ||||
| Gross tax unrealized appreciation | 4,898,812 | 2,643,931 | ||||||
| Gross tax unrealized depreciation | (215,096 | ) | (427,833 | ) | ||||
| Net tax unrealized appreciation | 4,683,716 | 2,216,098 | ||||||
| Net unrealized depreciation | ||||||||
| on foreign currency | — | — | ||||||
| Undistributed ordinary income | 137,934 | 96,688 | ||||||
| Undistributed long-term capital gain | — | — | ||||||
| Total distributable earnings | 137,934 | 96,688 | ||||||
| Other accumulated losses | (1,623,620 | ) | (1,153,316 | ) | ||||
| Total accumulated earnings/(losses) | $ | 3,198,030 | $ | 1,159,470 | ||||
| (a) | The difference between book-basis and tax-basis net unrealized appreciation and cost is attributable primarily to the tax deferral of losses on wash sales, PFICs and partnerships. |
At October 31, 2023, the Funds had capital loss carryforwards as follows:
| Capital Loss Carryforwards | ||||||||
| Short-Term | Long-Term | |||||||
| Select Large Cap Value Fund | $ | 5,918,033 | $ | 459,637 | ||||
| Small Cap Value Fund | 10,304,963 | 3,203,175 | ||||||
| Large Cap Value Fund | 1,120,076 | 503,544 | ||||||
| Mid Cap Value Fund | 821,060 | 332,256 | ||||||
These capital losses may be carried forward indefinitely to offset future gains.
61
Huber Funds
NOTES TO FINANCIAL STATEMENTS at October 31, 2023, Continued
NOTE 9 – CONTROL OWNERSHIP
A beneficial ownership, either directly or indirectly, of more than 25% of the voting securities of a fund creates a presumption of control of the fund, under Section 2(a)(9) of the 1940 Act. As of October 31, 2023, each Fund’s percentage of control ownership positions greater than 25% are as follows:
Select Large Cap Value Fund | Investor Class | Institutional Class |
| RBC Capital Markets LLC | — | 35.10% |
| Pershing LLC | 42.99% | — |
Small Cap Value Fund | Investor Class | Institutional Class |
| National Financial Services LLC | — | 46.17% |
| Shadowlawn Investments LP | 49.04% | — |
Large Cap Value Fund | Investor Class | Institutional Class |
| Lizanne Falsetto Living Trust | — | 57.43% |
| Morgan Stanley Smith Barney LLC | 72.77% | 27.59% |
| National Financial Services LLC | 27.01% | — |
Mid Cap Value Fund | Investor Class | Institutional Class |
| Lizanne Falsetto Living Trust | — | 51.37% |
| Hilton Family Trust | 87.42% | — |
NOTE 10 – PRINCIPAL RISKS
Below is a summary of some, but not all, of the principal risks of investing in the Funds, each of which may adversely affect a Fund’s net asset value and total return. The Funds’ most recent prospectus provides further descriptions of each Fund’s investment objective, principal investment strategies and principal risks.
| • | Foreign Securities and Emerging Markets Risk – Investments in foreign currencies and foreign issuers are subject to additional risks, including political and economic risks, greater volatility, civil conflicts and war, sanctions or other measures by the United States or other governments, liquidity risks, currency fluctuations, higher transaction costs, delayed settlement, possible foreign controls on investment, expropriation and nationalization risks, and less stringent investor protection and disclosure standards of foreign markets. Events and evolving conditions in certain economies or markets may alter the risks associated with investments tied to countries or regions that historically were perceived as comparatively stable becoming riskier and more volatile. These risks are magnified in countries in “emerging markets.” Emerging market countries typically have less-established market economies than developed countries and may face greater social, economic, regulatory and political uncertainties. In addition, emerging markets typically present greater illiquidity and price volatility |
62
Huber Funds
NOTES TO FINANCIAL STATEMENTS at October 31, 2023, Continued
| concerns due to smaller or limited local capital markets and greater difficulty in determining market valuations of securities due to limited public information on issuers. | ||
| • | Initial Public Offering (“IPO”) Risk – The risk exists that the market value of IPO shares will fluctuate considerably due to factors such as the absence of a prior public market, unseasoned trading, the small number of shares available for trading and limited information about the issuer. The purchase of IPO shares may involve high transaction costs. IPO shares are subject to market risk and liquidity risk. When an asset base is small, a significant portion of the Fund’s performance could be attributable to investments in IPOs, because such investments would have a magnified impact on the Fund. As the Fund’s assets grow, the effect of the Fund’s investments in IPOs on the Fund’s performance probably will decline, which could reduce the Fund’s performance. | |
| • | Value Style Investing Risk – A style of investing which targets undervalued companies with characteristics for improved valuations. This style of investing is subject to the risk that the valuations never improve or that the returns on “value” securities may not move in tandem with the returns on other styles of investing or the stock market in general. | |
| • | Sector Emphasis Risk – Securities of companies in the same or related businesses, if comprising a significant portion of each portfolio, could react in some circumstances negatively to market conditions, interest rates and economic, regulatory or fiscal developments and adversely affect the value of the portfolio to a greater extent than if such business comprised a lesser portion of a Fund’s portfolio. | |
| • | General Market Risk – Economies and financial markets throughout the world are becoming increasingly interconnected, which increases the likelihood that events or conditions in one country or region will adversely impact markets or issuers in other countries or regions. Securities in the Fund’s portfolio may underperform in comparison to securities in general financial markets, a particular financial market or other asset classes due to a number of factors, including: inflation (or expectations for inflation); interest rates; global demand for particular products or resources; natural disasters or events; pandemic diseases; terrorism; regulatory events; and government controls. U.S. and international markets have experienced significant periods of volatility in recent years and months due to a number of economic, political and global macro factors including the impact of COVID-19 as a global pandemic, which has resulted in a public health crisis, disruptions to business operations and supply chains, stress on the |
63
Huber Funds
NOTES TO FINANCIAL STATEMENTS at October 31, 2023, Continued
| global healthcare system, growth concerns in the U.S. and overseas, staffing shortages and the inability to meet consumer demand, and widespread concern and uncertainty. The global recovery from COVID-19 is proceeding at slower than expected rates due to the emergence of variant strains and may last for an extended period of time. Continuing uncertainties regarding interest rates, rising inflation, political events, rising government debt in the U.S. and trade tensions also contribute to market volatility. As a result of continuing political tensions and armed conflicts, including the war between Ukraine and Russia, the U.S. and the European Union imposed sanctions on certain Russian individuals and companies, including certain financial institutions, and have limited certain exports and imports to and from Russia. The war has contributed to recent market volatility and may continue to do so. | ||
| • | Small Companies Risk (Small Cap Value Fund only) – Investing in securities of small-sized companies may involve greater volatility than investing in larger and more established companies because companies with small market capitalizations can be subject to more abrupt or erratic share price changes than larger, more established companies. | |
| • | Mid-Sized Company Risk (Mid Cap Value Fund only) – A mid cap company may be more vulnerable to adverse business or economic events than stocks of larger companies. These stocks present greater risks than securities of larger, more diversified companies. |
NOTE 11 – TRUSTEE AND OFFICER CHANGES
At a meeting held on June 22-23, 2023, the Board of Trustees of the Trust appointed Ms. Lillian A. Kabakali as the Assistant Secretary of the Trust, effective July 10, 2023. Effective July 20, 2023, Mr. Michael L. Ceccato retired from his service as Vice President, Chief Compliance Officer and Anti-Money Laundering Officer of the Trust. At a meeting held on July 20, 2023, the Board of Trustees of the Trust appointed Mr. Joseph Kolinsky as the successor Vice President, Chief Compliance Officer and Anti-Money Laundering Officer of the Trust, effective July 20, 2023.
Effective October 18, 2023, Mr. Ray Woolson retired from his service as Trustee and Chairman of the Board of Trustees of the Trust (the “Board”) to attend to health-related matters. At the recommendation of the Nominating and Governance Committee, on October 24, 2023, the Board appointed Mr. David Mertens as the successor Chairman of the Board, and Ms. Michele Rackey was appointed as Chairman of the Nominating and Governance Committee of the Board.
64
Huber Funds
NOTES TO FINANCIAL STATEMENTS at October 31, 2023, Continued
NOTE 12 – OTHER TAX INFORMATION
The Funds declared an income distribution to be paid on December 8, 2023, to shareholders of record on December 7, 2023, as follows:
Distribution rate per share | |
| Select Large Cap Value Fund | |
| Investor Class | $0.21083234 |
| Institutional Class | $0.30078786 |
| Small Cap Value Fund | |
| Investor Class | $0.08763431 |
| Institutional Class | $0.12373937 |
| Large Cap Value Fund | |
| Investor Class | $0.29684151 |
| Institutional Class | $0.34272536 |
| Mid Cap Value Fund | |
| Investor Class | $0.16829450 |
| Institutional Class | $0.17641136 |
NOTE 13 – SUBSEQUENT EVENT
Effective December 1, 2023, the Small Cap Value Fund’s expense cap was reduced from 1.35% to 1.28%. The new expense cap will remain in effect through at least February 28, 2025.
65
Huber Funds
REPORT OF INDEPENDENT REGISTERED PUBLIC ACCOUNTING FIRM
To the Board of Trustees Advisors Series Trust and Shareholders of
Huber Select Large Cap Value Fund, Huber Small Cap Value Fund,
Huber Large Cap Value Fund and Huber Mid Cap Value Fund
Opinion on the Financial Statements
We have audited the accompanying statements of assets and liabilities of Huber Select Large Cap Value Fund, Huber Small Cap Value Fund, Huber Large Cap Value Fund, and Huber Mid Cap Value Fund) (the “Funds”), each a series of Advisors Series Trust (the “Trust”), including the schedules of investments, as of October 31, 2023, the related statements of operations for the year then ended, the statements of changes in net assets for each of the two years in the period then ended, and financial highlights for each of the five years in the period then ended, and the related notes (collectively referred to as the “financial statements”). In our opinion, the financial statements present fairly, in all material respects, the financial position of the Funds as of October 31, 2023, the results of their operations for the year then ended, the changes in their net assets for each of the two years in the period then ended, and their financial highlights for each of the five years in the period then ended, in conformity with accounting principles generally accepted in the United States of America.
Basis for Opinion
These financial statements are the responsibility of the Funds’ management. Our responsibility is to express an opinion on the Funds’ financial statements based on our audits. We are a public accounting firm registered with the Public Company Accounting Oversight Board (United States) (“PCAOB”) and are required to be independent with respect to the Funds in accordance with the U.S. federal securities laws and the applicable rules and regulations of the Securities and Exchange Commission and the PCAOB. We have served as the auditor of one or more of the funds in the Trust since 2003.
We conducted our audits in accordance with the standards of the PCAOB. Those standards require that we plan and perform the audits to obtain reasonable assurance about whether the financial statements are free of material misstatement, whether due to error or fraud. The Funds are not required to have, nor were we engaged to perform, an audit of the Funds’ internal control over financial reporting. As part of our audits we are required to obtain an understanding of internal control over financial reporting, but not for the purpose of expressing an opinion on the effectiveness of the Funds’ internal control over financial reporting. Accordingly, we express no such opinion.
Our audits included performing procedures to assess the risks of material misstatement of the financial statements, whether due to error or fraud, and performing procedures that respond to those risks. Such procedures included examining, on a test basis, evidence regarding the amounts and disclosures in the financial statements. Our audits also included evaluating the accounting principles used and significant estimates made by management, as well as evaluating the overall presentation of the financial statements. Our procedures included confirmation of securities owned as of October 31, 2023 by correspondence with the custodian and brokers; when replies were not received from brokers, we performed other auditing procedures. We believe that our audits provide a reasonable basis for our opinion.
| TAIT, WELLER & BAKER LLP |
Philadelphia, Pennsylvania
December 29, 2023
66
Huber Funds
NOTICE TO SHAREHOLDERS at October 31, 2023 (Unaudited)
For the year ended October 31, 2023, the Select Large Cap Fund, the Small Cap Value Fund, the Large Cap Value Fund and the Mid Cap Value Fund designated $570,572, $0, $157,074 and $166,932, respectively, as ordinary income for purposes of the dividends paid deduction.
Certain dividends paid by the Funds may be subject to a maximum tax rate of 23.8%, as provided by the Tax Cuts and Jobs Act of 2017. For the year ended October 31, 2023, the percentage of dividends declared from ordinary income designated as qualified dividend income in the Select Large Cap Value Fund, the Small Cap Value Fund, the Large Cap Value Fund and the Mid Cap Value Fund was 100.00%, 0.00%, 100.00% and 100.00%, respectively.
For corporate shareholders in the Select Large Cap Value Fund, the Small Cap Value Fund, the Large Cap Value Fund and the Mid Cap Value Fund, the percent of ordinary income distributions qualifying for the corporate dividends received deduction for the year ended October 31, 2023 was 100.00%, 0.00%, 100.00% and 100.00%, respectively.
The percentage of taxable ordinary income distributions that are designated as short-term capital gain distributions under Internal Revenue Section 871(k)(2)(C) for the Select Large Cap Value Fund, the Small Cap Value Fund, the Large Cap Value Fund, and the Mid Cap Value Fund was 0.00%, 0.00%, 0.00%, and 0.00%, respectively.
How to Obtain a Copy of the Funds’ Proxy Voting Policies
A description of the policies and procedures that the Funds use to determine how to vote proxies relating to portfolio securities is available without charge upon request by calling 1-888-482-3726 (888-HUBERCM) or on the U.S. Securities and Exchange Commission’s (“SEC”) website at http://www.sec.gov.
How to Obtain a Copy of the Funds’ Proxy Voting Records for the 12-Month Period Ended June 30
Information regarding how the Funds voted proxies relating to portfolio securities during the most recent period ended June 30 is available without charge, upon request, by calling 1-888-482-3726 (888-HUBERCM). Furthermore, you can obtain the Funds’ proxy voting records on the SEC’s website at http://www.sec.gov.
Quarterly Filings on Form N-PORT
The Funds file their complete schedule of portfolio holdings with the SEC for the first and third quarters of each fiscal year on Part F of Form N-PORT. The Funds’ Form N-PORT is available on the SEC’s website at http://www.sec.gov. Information included in the Funds’ Form N-PORT is also available by calling 1-888-482-3726 (888-HUBERCM).
67
Huber Funds
STATEMENT REGARDING LIQUIDITY RISK MANAGEMENT PROGRAM (Unaudited)
Each Fund has adopted a liquidity risk management program (the “program”). The Board has designated a committee at the Adviser to serve as the administrator of the program. The Adviser’s committee conducts the day-to-day operation of the programs pursuant to policies and procedures administered by the committee.
Under the program, the Adviser’s committee manages each Fund’s liquidity risk, which is the risk that the Fund could not meet shareholder redemption requests without significant dilution of remaining shareholders’ interests in the Fund. This risk is managed by monitoring the degree of liquidity of each Fund’s investments, limiting the amount of each Fund’s illiquid investments, and utilizing various risk management tools and facilities available to each Fund for meeting shareholder redemptions, among other means. The committee’s process of determining the degree of liquidity of each Fund’s investments is supported by one or more third-party liquidity assessment vendors.
The Board reviewed a report prepared by the committee regarding the operation and effectiveness of the program for the period July 1, 2022 through June 30, 2023. No significant liquidity events impacting the Fund were noted in the report. In addition, the committee provided its assessment that the program had been effective in managing each Fund’s liquidity risk.
68
Huber Funds
INFORMATION ABOUT TRUSTEES AND OFFICERS (Unaudited)
This chart provides information about the Trustees and Officers who oversee the Funds. Officers elected by the Trustees manage the day-to-day operations of the Funds and execute policies formulated by the Trustees.
Independent Trustees(1)
| Number of | |||||
| Term of | Portfolios | ||||
| Office | in Fund | Other | |||
| Position | and | Principal | Complex | Directorships | |
| Held | Length | Occupation | Overseen | Held During | |
| Name, Address | with the | of Time | During Past | by | Past Five |
and Age | Trust | Served* | Five Years | Trustee(2) | Years(3) |
David G. Mertens | Chairman | Indefinite | Partner and | 4 | Trustee, |
(age 63) | of the | term; | Head of | Advisors Series | |
615 E. Michigan Street | Board | since | Business | Trust (for series | |
Milwaukee, WI 53202 | October | Development, | not affiliated | ||
2023. | QSV Equity | with the Funds). | |||
Investors, LLC, | |||||
Trustee | Indefinite | (formerly known | |||
term; | as Ballast Equity | ||||
since | Management, | ||||
March | LLC) (a privately- | ||||
2017. | held investment | ||||
advisory firm) | |||||
(February 2019 | |||||
to present); | |||||
Managing Director | |||||
and Vice President, | |||||
Jensen Investment | |||||
Management, | |||||
Inc. (a privately- | |||||
held investment | |||||
advisory firm) | |||||
(2002 to 2017). | |||||
Joe D. Redwine | Trustee | Indefinite | Retired; formerly | 4 | Trustee, |
(age 76) | term; | Manager, | Advisors Series | ||
615 E. Michigan Street | since | President, CEO, | Trust (for series | ||
Milwaukee, WI 53202 | September | U.S. Bancorp | not affiliated | ||
2008. | Fund Services, | with the Funds). | |||
LLC, and its | |||||
predecessors, | |||||
(May 1991 to | |||||
July 2017). |
69
Huber Funds
INFORMATION ABOUT TRUSTEES AND OFFICERS (Unaudited), Continued
| Number of | |||||
| Term of | Portfolios | ||||
| Office | in Fund | Other | |||
| Position | and | Principal | Complex | Directorships | |
| Held | Length | Occupation | Overseen | Held During | |
| Name, Address | with the | of Time | During Past | by | Past Five |
and Age | Trust | Served* | Five Years | Trustee(2) | Years(3) |
Michele Rackey | Trustee | Indefinite | Chief Executive | 4 | Trustee, |
(age 64) | term; | Officer, | Advisors Series | ||
615 E. Michigan Street | since | Government | Trust (for series | ||
Milwaukee, WI 53202 | January | Employees | not affiliated | ||
2023. | Benefit | with the Funds). | |||
Association | |||||
(GEBA) (benefits | |||||
and wealth | |||||
management | |||||
organization) | |||||
(2004 to 2020); | |||||
Board Member, | |||||
Association | |||||
Business Services | |||||
Inc. (ABSI) (for- | |||||
profit subsidiary | |||||
of the American | |||||
Society of | |||||
Association | |||||
Executives) | |||||
(2019 to 2020). |
70
Huber Funds
INFORMATION ABOUT TRUSTEES AND OFFICERS (Unaudited), Continued
Officers
| Term of | |||
| Office | |||
| Position | and | ||
| Held | Length | ||
| Name, Address | with the | of Time | Principal Occupation |
and Age | Trust | Served | During Past Five Years |
Jeffrey T. Rauman | President, | Indefinite | Senior Vice President, Compliance and |
(age 54) | Chief | term; | Administration, U.S. Bank Global Fund |
615 E. Michigan Street | Executive | since | Services (February 1996 to present). |
Milwaukee, WI 53202 | Officer and | December | |
Principal | 2018. | ||
Executive | |||
Officer | |||
Kevin J. Hayden | Vice | Indefinite | Vice President, Compliance and |
(age 52) | President, | term; | Administration, U.S. Bank Global Fund |
615 E. Michigan Street | Treasurer | since | Services (June 2005 to present). |
Milwaukee, WI 53202 | and Principal | January | |
Financial | 2023. | ||
Officer | |||
Cheryl L. King | Assistant | Indefinite | Vice President, Compliance and |
(age 62) | Treasurer | term; | Administration, U.S. Bank Global Fund |
615 E. Michigan Street | since | Services (October 1998 to present). | |
Milwaukee, WI 53202 | January | ||
2023. | |||
Richard R. Conner | Assistant | Indefinite | Assistant Vice President, Compliance and |
(age 41) | Treasurer | term; | Administration, U.S. Bank Global Fund |
615 E. Michigan Street | since | Services (July 2010 to present). | |
Milwaukee, WI 53202 | December | ||
2018. | |||
Joseph R. Kolinsky | Vice | Indefinite | Vice President, U.S. Bank Global Fund |
(age 52) | President, | term; | Services (May 2023 to present); Chief |
2020 E. Financial Way, | Chief | since | Compliance Officer, Chandler Asset |
Suite 100 | Compliance | July | Management, Inc. (2020 to 2022); Director, |
Glendora, CA 91741 | Officer and | 2023. | Corporate Compliance, Pacific Life Insurance |
AML Officer | Company (2018 to 2019). | ||
Elaine E. Richards | Vice | Indefinite | Senior Vice President, U.S. Bank Global Fund |
(age 55) | President | term; | Services (July 2007 to present). |
2020 E. Financial Way, | and | since | |
Suite 100 | Secretary | September | |
Glendora, CA 91741 | 2019. |
71
Huber Funds
INFORMATION ABOUT TRUSTEES AND OFFICERS (Unaudited), Continued
| Term of | |||
| Office | |||
| Position | and | ||
| Held | Length | ||
| Name, Address | with the | of Time | Principal Occupation |
and Age | Trust | Served | During Past Five Years |
Lillian A. Kabakali | Assistant | Indefinite | Vice President, U.S. Bank Global Fund |
(age 42) | Secretary | term; | Services (April 2023 to present); Vice |
2020 E. Financial Way, | since | President, Compliance, Guggenheim Partners | |
Suite 100 | July | Investment Management Holdings, LLC | |
Glendora, CA 91741 | 2023. | (April 2019 to April 2023); Senior Associate, | |
Compliance, Guggenheim Partners | |||
Investment Management Holdings, LLC | |||
(January 2018 to April 2019). |
| * | The Trustees have designated a mandatory retirement age of 75, such that each Trustee, serving as such on the date he or she reaches the age of 75, shall submit his or her resignation not later than the last day of the calendar year in which his or her 75th birthday occurs (“Retiring Trustee”). Upon request, the Board may, by vote of a majority of Trustees eligible to vote on such matter, determine whether or not to extend such Retiring Trustee’s term and on the length of a one-time extension of up to three additional years. At a meeting held December 7-8, 2022, by vote of the majority of Trustees (not including Mr. Redwine), Mr. Redwine’s term as Trustee was extended for three additional years to expire December 31, 2025. |
| (1) | The Trustees of the Trust who are not “interested persons” of the Trust as defined under the 1940 Act (“Independent Trustees”). |
| (2) | As of October 31, 2023, the Trust was comprised of 34 active portfolios managed by unaffiliated investment advisers. The term “Fund Complex” applies only to the Funds. The Funds do not hold themselves out as related to any other series within the Trust for investment purposes, nor do they share the same investment adviser with any other series. |
| (3) | “Other Directorships Held” includes only directorship of companies required to register or file reports with the SEC under the Securities Exchange Act of 1934 Act, as amended, (that is, “public companies”) or other investment companies registered under the 1940 Act. |
The Statement of Additional Information includes additional information about the Funds’ Trustees and Officers and is available, without charge, upon request by calling 1-888-482-3726.
72
Huber Funds
HOUSEHOLDING (Unaudited)
In an effort to decrease costs, the Funds will reduce the number of duplicate prospectuses, supplements, and certain other shareholder documents that you receive by sending only one copy of each to those addresses shown by two or more accounts. Please call the Funds’ transfer agent toll free at 1-888-482-3726 (888-HUBERCM) to request individual copies of these documents. The Funds will begin sending individual copies 30 days after receiving your request. This policy does not apply to account statements.
73
Huber Funds
PRIVACY NOTICE
The Funds collect non-public information about you from the following sources:
| • | Information we receive about you on applications or other forms; |
| • | Information you give us orally; and/or |
| • | Information about your transactions with us or others. |
We do not disclose any non-public personal information about our customers or former customers without the customer’s authorization, except as permitted by law or in response to inquiries from governmental authorities. We may share information with affiliated and unaffiliated third parties with whom we have contracts for servicing the Funds. We will provide unaffiliated third parties with only the information necessary to carry out their assigned responsibilities. We maintain physical, electronic and procedural safeguards to guard your non-public personal information and require third parties to treat your personal information with the same high degree of confidentiality.
In the event that you hold shares of the Funds through a financial intermediary, including, but not limited to, a broker-dealer, bank, or trust company, the privacy policy of your financial intermediary would govern how your non-public personal information would be shared by those entities with unaffiliated third parties.
74
(This Page Intentionally Left Blank.)
Investment Adviser
Huber Capital Management, LLC
2321 Rosecrans Avenue, Suite 3245
El Segundo, CA 90245
Independent Registered Public Accounting Firm
Tait, Weller & Baker LLP
Two Liberty Place
50 South 16th Street, Suite 2900
Philadelphia, PA 19102
Legal Counsel
Sullivan & Worcester LLP
1633 Broadway, 32nd Floor
New York, NY 10019
Custodian
U.S. Bank National Association
1555 North RiverCenter Drive, Suite 302
Milwaukee, WI 53212
Transfer Agent, Fund Accountant and Fund Administrator
U.S. Bank Global Fund Services
615 East Michigan Street
Milwaukee, WI 53202
1-888-482-3726 (888-HUBERCM)
Distributor
Quasar Distributors, LLC
111 East Kilbourn Avenue, Suite 2200
Milwaukee, WI 53202
This report is intended for shareholders of the Huber Funds and may not be used as sales literature unless preceded or accompanied by a current prospectus. For a current prospectus, please call 1-888-482-3726 (888-HUBERCM). Statements and other information herein are dated and are subject to change.
(b) Not Applicable
Item 2. Code of Ethics.
The registrant has adopted a code of ethics that applies to the registrant’s principal executive officer and principal financial officer. The registrant has not made any substantive amendments to its code of ethics during the period covered by this report. The registrant has not granted any waivers from any provisions of the code of ethics during the period covered by this report.
A copy of the registrant’s Code of Ethics is filed herewith.
Item 3. Audit Committee Financial Expert.
The registrant’s Board of Trustees has determined that there is at least one audit committee financial expert serving on its audit committee. Mr. Joe D. Redwine and Ms. Michele Rackey are the “audit committee financial experts” and are considered to be “independent” as each term is defined in Item 3 of Form N CSR.
Item 4. Principal Accountant Fees and Services.
The registrant has engaged its principal accountant to perform audit services, audit-related services, tax services and other services during the past two fiscal years. “Audit services” refer to performing an audit of the registrant's annual financial statements or services that are normally provided by the accountant in connection with statutory and regulatory filings or engagements for those fiscal years. “Audit-related services” refer to the assurance and related services by the principal accountant that are reasonably related to the performance of the audit. “Tax services” refer to professional services rendered by the principal accountant including the review of federal income tax returns, review of federal excise tax returns, review of state tax returns, if any, and assistance with calculation of required income, capital gain and excise distributions. There were no “other services” provided by the principal accountant. The following table details the aggregate fees billed or expected to be billed for each of the last two fiscal years for audit fees, audit-related fees, tax fees and other fees by the principal accountant.
| FYE 10/31/2023 | FYE 10/31/2022 | |
Audit Fees | $75,600 | $75,600 |
Audit-Related Fees | N/A | N/A |
Tax Fees | $14,400 | $14,400 |
All Other Fees | N/A | N/A |
(e)(1) The audit committee has adopted pre-approval policies and procedures that require the audit committee to pre‑approve all audit and non‑audit services of the registrant, including services provided to any entity affiliated with the registrant.
(e)(2) The percentage of fees billed by Tait, Weller, & Baker LLP applicable to non-audit services pursuant to waiver of pre-approval requirement were as follows:
| FYE 10/31/2023 | FYE 10/31/2022 | |
Audit-Related Fees | 0% | 0% |
Tax Fees | 0% | 0% |
All Other Fees | 0% | 0% |
(f) All of the principal accountant’s hours spent on auditing the registrant’s financial statements were attributed to work performed by full‑time permanent employees of the principal accountant.
(g) The following table indicates the non-audit fees billed or expected to be billed by the registrant’s accountant for services to the registrant and to the registrant’s investment adviser (and any other controlling entity, etc.—not sub-adviser) for the last two years.
Non-Audit Related Fees | FYE 10/31/2023 | FYE 10/31/2022 |
Registrant | N/A | N/A |
Registrant’s Investment Adviser | N/A | N/A |
(h) The audit committee of the board of trustees/directors has considered whether the provision of non-audit services that were rendered to the registrant's investment adviser is compatible with maintaining the principal accountant's independence and has concluded that the provision of such non-audit services by the accountant has not compromised the accountant’s independence.
The registrant has not been identified by the U.S. Securities and Exchange Commission as having filed an annual report issued by a registered public accounting firm branch or office that is located in a foreign jurisdiction where the Public Company Accounting Oversight Board is unable to inspect or completely investigate because of a position taken by an authority in that jurisdiction.
The registrant is not a foreign issuer.
Item 5. Audit Committee of Listed Registrants.
| (a) | Not applicable to registrants who are not listed issuers (as defined in Rule 10A-3 under the Securities Exchange Act of 1934). |
| (b) | Not Applicable. |
Item 6. Investments.
| (a) | Schedule of Investments is included as part of the report to shareholders filed under Item 1 of this Form. |
| (b) | Not Applicable. |
Item 7. Disclosure of Proxy Voting Policies and Procedures for Closed-End Management Investment Companies.
Not applicable to open-end investment companies.
Item 8. Portfolio Managers of Closed-End Management Investment Companies.
Not applicable to open-end investment companies.
Item 9. Purchases of Equity Securities by Closed‑End Management Investment Company and Affiliated Purchasers.
Not applicable to open-end investment companies.
Item 10. Submission of Matters to a Vote of Security Holders.
There have been no material changes to the procedures by which shareholders may recommend nominees to the Registrant’s Board of Trustees.
Item 11. Controls and Procedures.
| (a) | The Registrant’s President/Chief Executive Officer/Principal Executive Officer and Vice President/Treasurer/Principal Financial Officer have reviewed the Registrant's disclosure controls and procedures (as defined in Rule 30a-3(c) under the Investment Company Act of 1940, as amended, (the “Act”)) as of a date within 90 days of the filing of this report, as required by Rule 30a-3(b) under the Act and Rules 13a-15(b) or 15d‑15(b) under the Securities Exchange Act of 1934. Based on their review, such officers have concluded that the disclosure controls and procedures are effective in ensuring that information required to be disclosed in this report is appropriately recorded, processed, summarized and reported and made known to them by others within the Registrant and by the Registrant’s service provider. |
| (b) | There were no changes in the Registrant's internal control over financial reporting (as defined in Rule 30a-3(d) under the Act) that occurred during the period covered by this report that has materially affected, or is reasonably likely to materially affect, the Registrant's internal control over financial reporting. |
Item 12. Disclosure of Securities Lending Activities for Closed-End Management Investment Companies.
Not applicable to open-end investment companies.
Item 13. Exhibits.
(3) Any written solicitation to purchase securities under Rule 23c‑1 under the Act sent or given during the period covered by the report by or on behalf of the registrant to 10 or more persons. Not applicable to open-end investment companies.
(4) Change in the registrant’s independent public accountant. There was no change in the registrant’s independent public accountant for the period covered by this report.
SIGNATURES
Pursuant to the requirements of the Securities Exchange Act of 1934 and the Investment Company Act of 1940, as amended, the registrant has duly caused this report to be signed on its behalf by the undersigned, thereunto duly authorized.
(Registrant) Advisors Series Trust
By (Signature and Title)* /s/ Jeffrey T. Rauman
Jeffrey T. Rauman, President/Chief Executive Officer/Principal
Executive Officer
Date 2/26/2024
Pursuant to the requirements of the Securities Exchange Act of 1934 and the Investment Company Act of 1940, as amended, this report has been signed below by the following persons on behalf of the registrant and in the capacities and on the dates indicated.
By (Signature and Title)* /s/ Jeffrey T. Rauman
Jeffrey T. Rauman, President/Chief Executive Officer/Principal
Executive Officer
Date 2/26/2024
By (Signature and Title)* /s/ Kevin J. Hayden
Kevin J. Hayden, Vice President/Treasurer/Principal Financial Officer
Date 2/26/2024
* Print the name and title of each signing officer under his or her signature.