ADVISORS SERIES TRUST
Medalist Partners MBS Total Return Fund
Medalist Partners Short Duration Fund
Core Financial Statements
November 30, 2024
UNITED STATES
SECURITIES AND EXCHANGE COMMISSION
Washington, D.C. 20549
FORM N-CSR
CERTIFIED SHAREHOLDER REPORT OF REGISTERED
MANAGEMENT INVESTMENT COMPANIES
Investment Company Act file number 811-07959
Advisors Series Trust
(Exact name of registrant as specified in charter)
615 East Michigan Street
Milwaukee, WI 53202
(Address of principal executive offices) (Zip code)
Jeffrey T. Rauman, President/Chief Executive Officer
Advisors Series Trust
c/o U.S. Bancorp Fund Services, LLC
777 East Wisconsin Avenue, 4th Floor
Milwaukee, WI 53202
(Name and address of agent for service)
(626) 914-7235
(Registrant’s telephone number, including area code)
Date of fiscal year end: November 30, 2024
Date of reporting period: November 30, 2024
Item 1. Reports to Stockholders.
(a)
 | Medalist Partners MBS Total Return Fund |  |
| Class A Shares | SEMOX | ||
| Annual Shareholder Report | November 30, 2024 |
Class Name | Costs of a $10,000 investment | Costs paid as a percentage of a $10,000 investment |
| Class A Shares | $127 | 1.17% |
| Medalist Partners MBS Total Return Fund | PAGE 1 | TSR-AR-00768D152 |
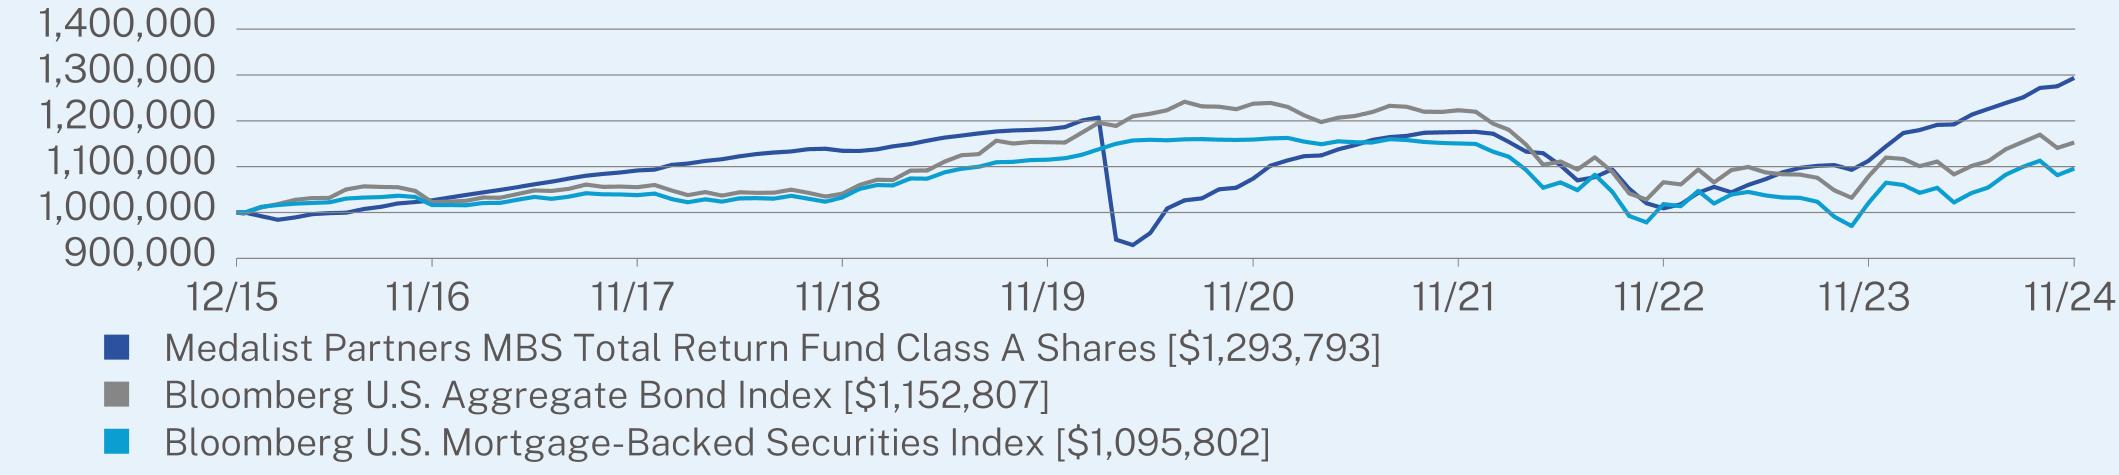
1 Year | 5 Year | Since Inception (12/18/2015) | |
Medalist Partners MBS Total Return Fund Class A Shares (without sales charge) | 16.27 | 1.82 | 2.92 |
Medalist Partners MBS Total Return Fund Class A Shares (with sales charge) | 13.98 | 1.42 | 2.69 |
Bloomberg U.S. Aggregate Bond Index | 6.88 | -0.01 | 1.60 |
Bloomberg U.S. Mortgage-Backed Securities Index | 7.33 | -0.35 | 1.03 |
| * | The Fund’s past performance is not a good predictor of how the Fund will perform in the future. The graph and table do not reflect the deduction of taxes that a shareholder would pay on Fund distributions or redemption of Fund shares. |
Net Assets | $304,438,921 |
Number of Holdings | 180 |
Net Advisory Fee | $1,254,558 |
Portfolio Turnover | 30% |
30-Day SEC Yield | 6.67% |
30-Day SEC Yield Unsubsidized | 6.71% |

| * | Expressed as a percentage of net assets. |
| Medalist Partners MBS Total Return Fund | PAGE 2 | TSR-AR-00768D152 |
| Medalist Partners MBS Total Return Fund | PAGE 3 | TSR-AR-00768D152 |
 | Medalist Partners MBS Total Return Fund |  |
| Investor Share Class | SEMPX | ||
| Annual Shareholder Report | November 30, 2024 |
Class Name | Costs of a $10,000 investment | Costs paid as a percentage of a $10,000 investment |
| Investor Share Class | $126 | 1.17% |
| Medalist Partners MBS Total Return Fund | PAGE 1 | TSR-AR-00770X741 |
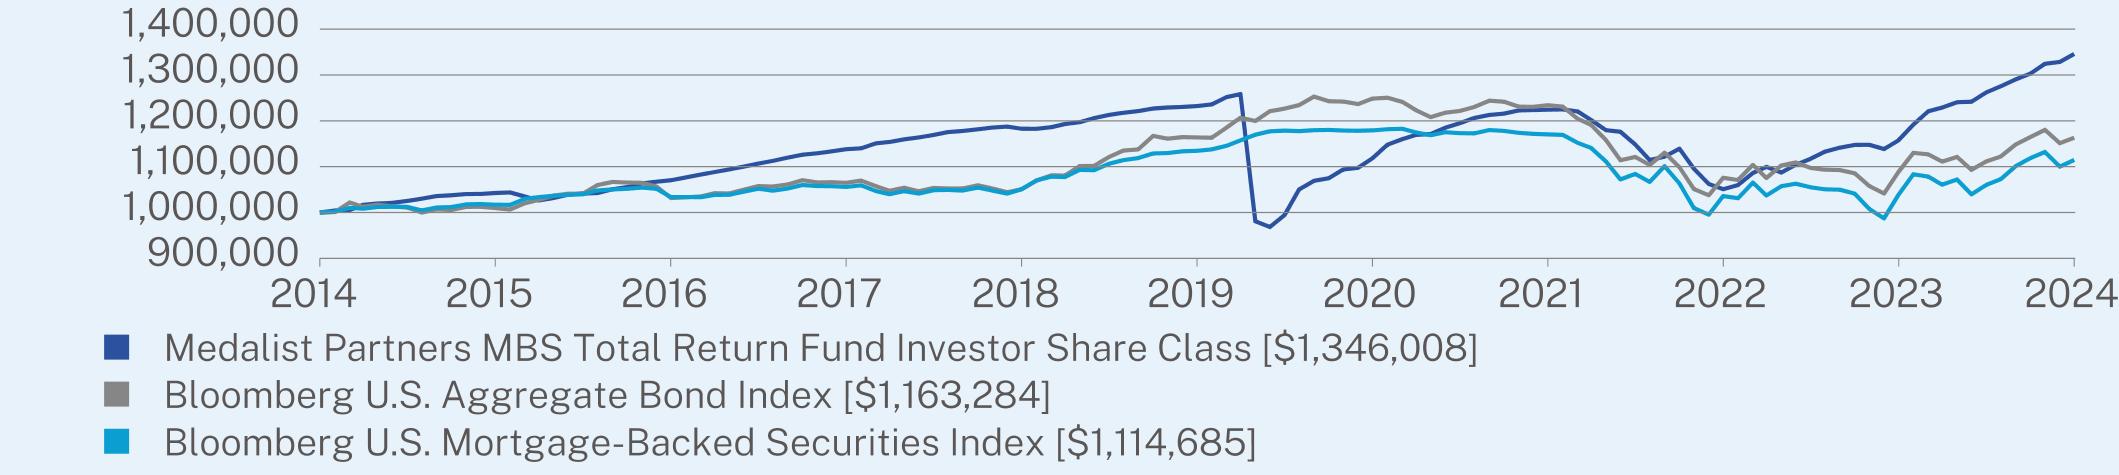
1 Year | 5 Year | 10 Year | |
Medalist Partners MBS Total Return Fund Investor Share Class | 16.15 | 1.78 | 3.02 |
Bloomberg U.S. Aggregate Bond Index | 6.88 | -0.01 | 1.52 |
Bloomberg U.S. Mortgage-Backed Securities Index | 7.33 | -0.35 | 1.09 |
| * | The Fund’s past performance is not a good predictor of how the Fund will perform in the future. The graph and table do not reflect the deduction of taxes that a shareholder would pay on Fund distributions or redemption of Fund shares. |
Net Assets | $304,438,921 |
Number of Holdings | 180 |
Net Advisory Fee | $1,254,558 |
Portfolio Turnover | 30% |
30-Day SEC Yield | 6.82% |
30-Day SEC Yield Unsubsidized | 6.85% |
| * | Expressed as a percentage of net assets. |
| Medalist Partners MBS Total Return Fund | PAGE 2 | TSR-AR-00770X741 |
| Medalist Partners MBS Total Return Fund | PAGE 3 | TSR-AR-00770X741 |
 | Medalist Partners MBS Total Return Fund |  |
| Institutional Share Class | SEMMX | ||
| Annual Shareholder Report | November 30, 2024 |
Class Name | Costs of a $10,000 investment | Costs paid as a percentage of a $10,000 investment |
| Institutional Share Class | $100 | 0.92% |
| Medalist Partners MBS Total Return Fund | PAGE 1 | TSR-AR-00770X758 |
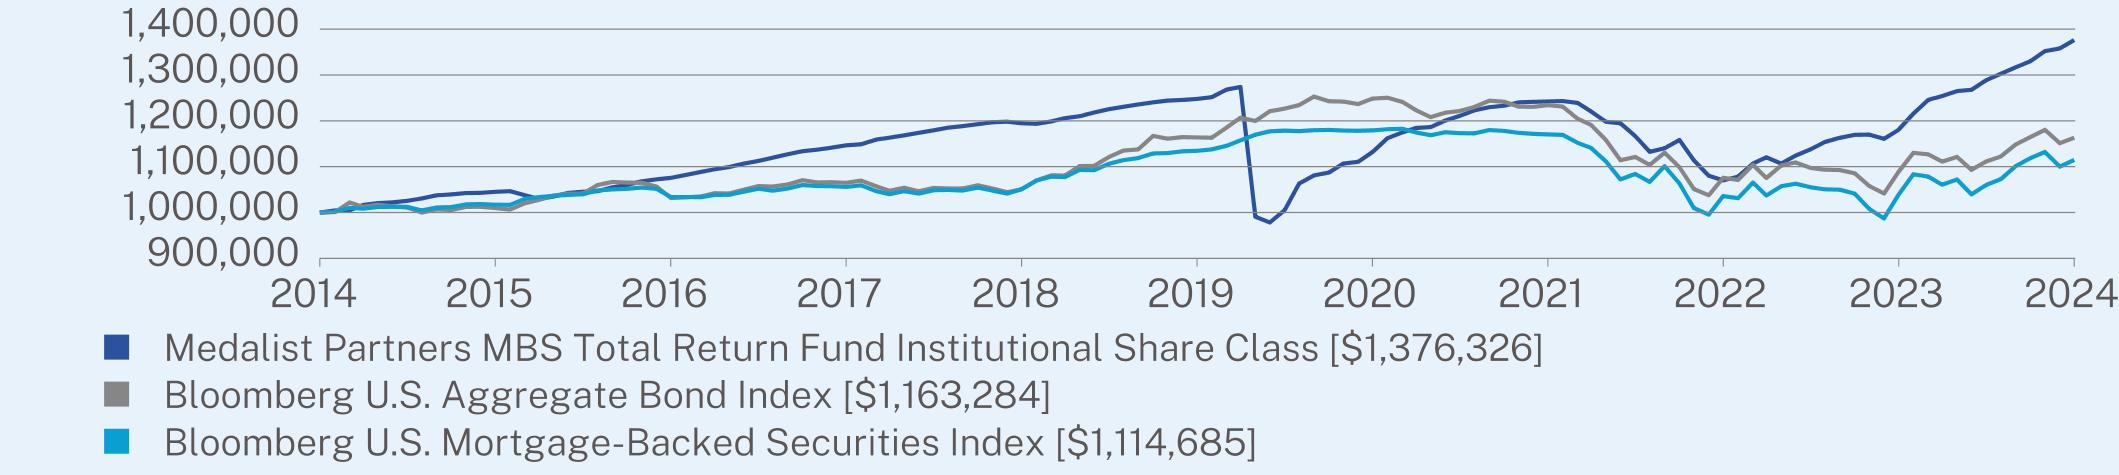
1 Year | 5 Year | 10 Year | |
Medalist Partners MBS Total Return Fund Institutional Share Class | 16.46 | 1.98 | 3.25 |
Bloomberg U.S. Aggregate Bond Index | 6.88 | -0.01 | 1.52 |
Bloomberg U.S. Mortgage-Backed Securities Index | 7.33 | -0.35 | 1.09 |
| * | The Fund’s past performance is not a good predictor of how the Fund will perform in the future. The graph and table do not reflect the deduction of taxes that a shareholder would pay on Fund distributions or redemption of Fund shares. |
Net Assets | $304,438,921 |
Number of Holdings | 180 |
Net Advisory Fee | $1,254,558 |
Portfolio Turnover | 30% |
30-Day SEC Yield | 7.06% |
30-Day SEC Yield Unsubsidized | 7.09% |

| * | Expressed as a percentage of net assets. |
| Medalist Partners MBS Total Return Fund | PAGE 2 | TSR-AR-00770X758 |
| Medalist Partners MBS Total Return Fund | PAGE 3 | TSR-AR-00770X758 |
 | Medalist Partners Short Duration Fund |  |
| Investor Share Class | SEMRX | ||
| Annual Shareholder Report | November 30, 2024 |
Class Name | Costs of a $10,000 investment | Costs paid as a percentage of a $10,000 investment |
| Investor Share Class | $89 | 0.85% |
| Medalist Partners Short Duration Fund | PAGE 1 | TSR-AR-00770X618 |
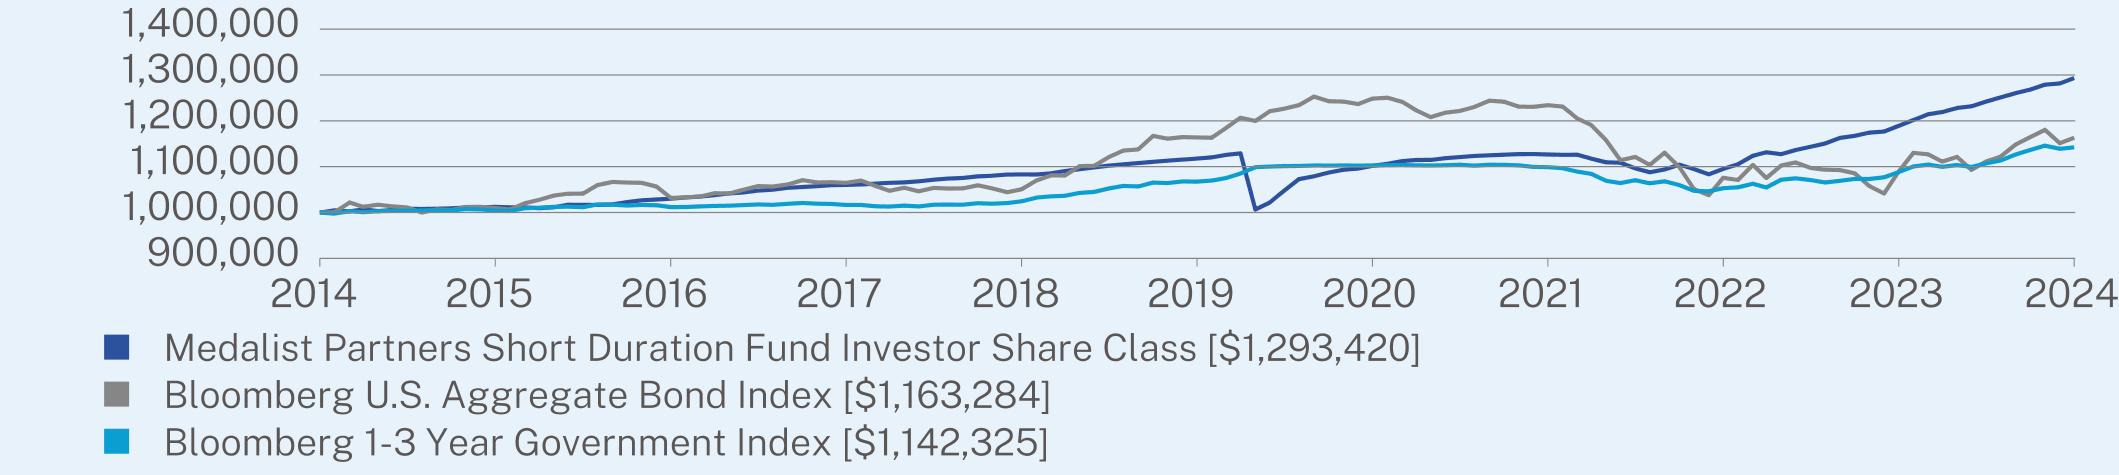
1 Year | 5 Year | 10 Year | |
Medalist Partners Short Duration Fund Investor Share Class | 8.79 | 2.96 | 2.61 |
Bloomberg U.S. Aggregate Bond Index | 6.88 | -0.01 | 1.52 |
Bloomberg 1-3 Year Government Index | 5.00 | 1.37 | 1.34 |
| * | The Fund’s past performance is not a good predictor of how the Fund will perform in the future. The graph and table do not reflect the deduction of taxes that a shareholder would pay on Fund distributions or redemption of Fund shares. |
Net Assets | $274,516,874 |
Number of Holdings | 162 |
Net Advisory Fee | $848,381 |
Portfolio Turnover | 86% |
30-Day SEC Yield | 5.94% |
30-Day SEC Yield Unsubsidized | 5.85% |

| * | Expressed as a percentage of net assets. |
| Medalist Partners Short Duration Fund | PAGE 2 | TSR-AR-00770X618 |
| Medalist Partners Short Duration Fund | PAGE 3 | TSR-AR-00770X618 |
 | Medalist Partners Short Duration Fund |  |
| Institutional Share Class | SEMIX | ||
| Annual Shareholder Report | November 30, 2024 |
Class Name | Costs of a $10,000 investment | Costs paid as a percentage of a $10,000 investment |
| Institutional Share Class | $63 | 0.60% |
| Medalist Partners Short Duration Fund | PAGE 1 | TSR-AR-00770X592 |
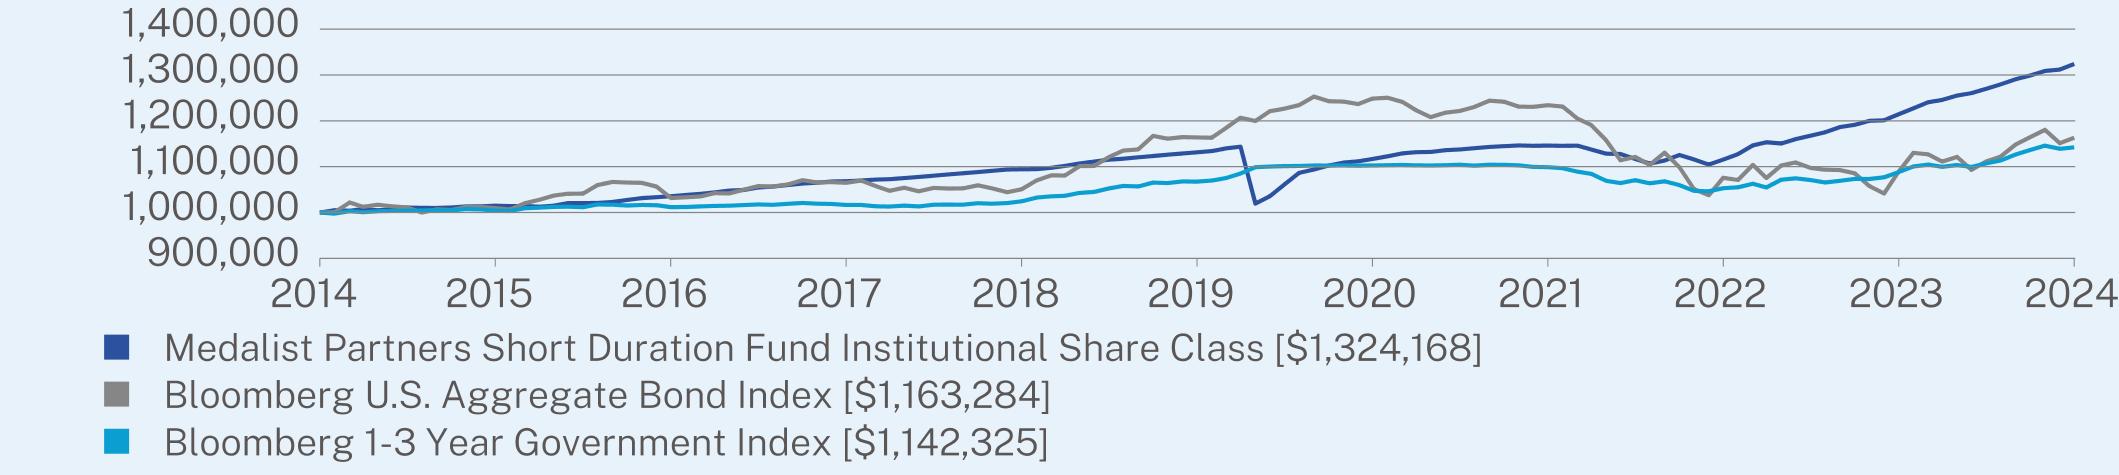
1 Year | 5 Year | 10 Year | |
Medalist Partners Short Duration Fund Institutional Share Class | 9.06 | 3.20 | 2.85 |
Bloomberg U.S. Aggregate Bond Index | 6.88 | -0.01 | 1.52 |
Bloomberg 1-3 Year Government Index | 5.00 | 1.37 | 1.34 |
| * | The Fund’s past performance is not a good predictor of how the Fund will perform in the future. The graph and table do not reflect the deduction of taxes that a shareholder would pay on Fund distributions or redemption of Fund shares. |
Net Assets | $274,516,874 |
Number of Holdings | 162 |
Net Advisory Fee | $848,381 |
Portfolio Turnover | 86% |
30-Day SEC Yield | 6.20% |
30-Day SEC Yield Unsubsidized | 6.10% |
| * | Expressed as a percentage of net assets. |
| Medalist Partners Short Duration Fund | PAGE 2 | TSR-AR-00770X592 |
| Medalist Partners Short Duration Fund | PAGE 3 | TSR-AR-00770X592 |
(b) Not applicable.
Item 2. Code of Ethics.
The registrant has adopted a code of ethics that applies to the registrant’s principal executive officer and principal financial officer. The registrant has not made any substantive amendments to its code of ethics during the period covered by this report. The registrant has not granted any waivers from any provisions of the code of ethics during the period covered by this report.
A copy of the registrant’s Code of Ethics is filed herewith.
Item 3. Audit Committee Financial Expert.
The registrant’s Board of Trustees has determined that there is at least one audit committee financial expert serving on its audit committee. Mr. Joe D. Redwine, Ms. Michele Rackey, Ms. Anne Kritzmire, and Mr. Craig Wainscott are the “audit committee financial experts” and are considered to be “independent” as each term is defined in Item 3 of Form N-CSR.
Item 4. Principal Accountant Fees and Services.
The registrant has engaged its principal accountant to perform audit services, audit-related services, tax services and other services during the past two fiscal years. “Audit services” refer to performing an audit of the registrant’s annual financial statements or services that are normally provided by the accountant in connection with statutory and regulatory filings or engagements for those fiscal years. “Audit-related services” refer to the assurance and related services by the principal accountant that are reasonably related to the performance of the audit. “Tax services” refer to professional services rendered by the principal accountant including the review of federal income tax returns, review of federal excise tax returns, review of state tax returns, if any, and assistance with calculation of required income, capital gain and excise distributions. There were no “other services” provided by the principal accountant. The following table details the aggregate fees billed or expected to be billed for each of the last two fiscal years for audit fees, audit-related fees, tax fees and other fees by the principal accountant.
| FYE 11/30/2024 | FYE11/30/2023 | |
| (a) Audit Fees | $50,700 | $49,450 |
| (b) Audit-Related Fees | N/A | N/A |
| (c) Tax Fees | $7,200 | $7,200 |
| (d) All Other Fees | N/A | N/A |
(e)(1) The audit committee has adopted pre-approval policies and procedures that require the audit committee to pre-approve all audit and non-audit services of the registrant, including services provided to any entity affiliated with the registrant.
(e)(2) The percentage of fees billed by Tait, Weller & Baker LLP applicable to non-audit services pursuant to waiver of pre-approval requirement were as follows:
| FYE 11/30/2024 | FYE 11/30/2023 | |
| Audit-Related Fees | 0% | 0% |
| Tax Fees | 0% | 0% |
| All Other Fees | 0% | 0% |
(f) During the audit of the registrant’s financial statements, 100 percent of the hours were attributed to work performed by persons other than full-time permanent employees of the principal accountant.
(g) The following table indicates the non-audit fees billed or expected to be billed by the registrant’s accountant for services to the registrant and to the registrant’s investment adviser (and any other controlling entity, etc.—not sub-adviser) for the last two years.
| Non-Audit Related Fees | FYE 11/30/2024 | FYE 11/30/2023 |
| Registrant | N/A | N/A |
| Registrant’s Investment Adviser | N/A | N/A |
(h) The audit committee of the board of trustees/directors has considered whether the provision of non-audit services that were rendered to the registrant’s investment adviser is compatible with maintaining the principal accountant’s independence and has concluded that the provision of such non-audit services by the accountant has not compromised the accountant’s independence.
(i) The registrant has not been identified by the U.S. Securities and Exchange Commission as having filed an annual report issued by a registered public accounting firm branch or office that is located in a foreign jurisdiction where the Public Company Accounting Oversight Board is unable to inspect or completely investigate because of a position taken by an authority in that jurisdiction.
(j) The registrant is not a foreign issuer.
Item 5. Audit Committee of Listed Registrants.
Not applicable.
Item 6. Investments.
| (a) | Schedule of Investments is included as part of the report to shareholders filed under Item 7 of this Form. |
(b) Not applicable.
Item 7. Financial Statements and Financial Highlights for Open-End Investment Companies.
| (a) |
Page | |||
Par | Value | ||||||
NON-AGENCY RESIDENTIAL MORTGAGE-BACKED SECURITIES — 63.2% | |||||||
AFC Home Equity Loan Trust, Series 1997-3, Class 1A4, 7.47%, 09/27/2027(a) | $28,092 | $27,827 | |||||
AMSR Trust | |||||||
Series 2020-SFR4, Class G1, 4.00%, 11/17/2037(b) | 750,000 | 735,005 | |||||
Series 2021-SFR3, Class H, 4.90%, 10/17/2038(b) | 1,750,000 | 1,641,531 | |||||
Angel Oak Mortgage Trust, Series 2023-6, Class A3, 6.50%, 12/25/2067(a)(b) | 1,222,316 | 1,231,873 | |||||
Angel Oak Mortgage Trust LLC, Series 2022-3, Class A3, 4.14%, 01/25/2067(b)(c) | 1,596,778 | 1,485,139 | |||||
Asset Backed Securities Corp. Home Equity Loan Trust, Series 1999-LB1, Class A1F, 7.11%, 06/21/2029 | 163,149 | 163,195 | |||||
Banc of America Funding Corp. | |||||||
Series 2006-D, Class 5A2, 5.40%, 05/20/2036(c) | 5,558 | 4,957 | |||||
Series 2008-R4, Class 1A4, 5.30% (1 mo. Term SOFR + 0.56%), 07/25/2037(b) | 1,051,788 | 716,065 | |||||
BRAVO Residential Funding Trust, Series 2024-NQM2, Class B1, 7.91%, 02/25/2064(b) | 1,335,000 | 1,351,066 | |||||
Chase Mortgage Finance Corp. | |||||||
Series 2020-CL1, Class M4, 9.05% (1 mo. Term SOFR + 4.46%), 10/25/2057(b) | 247,811 | 260,817 | |||||
Series 2024-RPL4, Class A1A, 3.38%, 12/25/2064(b)(c) | 1,525,702 | 1,402,047 | |||||
CHNGE Mortgage Trust, Series 2022-1, Class A1, 3.01%, 01/25/2067(b)(c) | 2,045,698 | 1,911,569 | |||||
Citigroup Mortgage Loan Trust, Series 2004-HYB4, Class WA, 6.70%, 12/25/2034(c) | 2,700 | 2,656 | |||||
COLT Funding LLC | |||||||
Series 2021-6, Class B1, 4.15%, 12/25/2066(b)(c) | 1,713,000 | 1,458,985 | |||||
Series 2022-1, Class B1, 4.05%, 12/27/2066(b)(c) | 3,000,000 | 2,635,821 | |||||
Par | Value | ||||||
Series 2022-6, Class A2, 4.65%, 06/27/2067(a)(b) | $1,535,518 | $1,523,894 | |||||
COLT Mortgage Loan Trust | |||||||
Series 2021-3, Class B2, 4.12%, 09/27/2066(b)(c) | 1,578,000 | 1,217,800 | |||||
Series 2021-4, Class B2, 4.14%, 10/25/2066(b)(c) | 2,625,000 | 1,973,790 | |||||
Conseco Finance Home Loan Trust, Series 2000-E, Class B1, 10.26%, 08/15/2031(c) | 54,062 | 7,181 | |||||
CoreVest American Finance Trust | |||||||
Series 2019-1, Class D, 4.82%, 03/15/2052(b) | 1,457,813 | 1,394,588 | |||||
Series 2019-1, Class E, 5.70%, 03/15/2052(b)(c) | 242,500 | 230,822 | |||||
Countrywide Alternative Loan Trust | |||||||
Series 2004-15, Class 2A2, 6.61%, 09/25/2034(c) | 158,691 | 146,011 | |||||
Series 2006-4CB, Class 2A3, 5.50%, 04/25/2036 | 3,322 | 2,442 | |||||
Series 2006-OA3, Class 1A1, 5.10% (1 mo. Term SOFR + 0.51%), 05/25/2036 | 6,573 | 6,011 | |||||
Series 2006-OA9, Class 1A1, 4.92% (1 mo. Term SOFR + 0.31%), 07/20/2046 | 21,300 | 17,716 | |||||
Credit Suisse Mortgage Trust | |||||||
Series 2020-AFC1, Class B1, 3.45%, 02/25/2050(b)(c) | 4,228,000 | 3,878,956 | |||||
Series 2020-AFC1, Class B2, 4.42%, 02/25/2050(b)(c) | 5,459,650 | 4,871,916 | |||||
Deephaven Residential Mortgage Trust | |||||||
Series 2021-1, Class B2, 3.96%, 05/25/2065(b)(c) | 3,200,000 | 2,765,181 | |||||
Series 2021-4, Class B2, 4.44%, 11/25/2066(b)(c) | 4,000,000 | 3,146,532 | |||||
Eagle Re Ltd., Series 2023-1, Class M1A, 6.73% (30 day avg SOFR US + 2.00%), 09/26/2033(b) | 623,957 | 627,074 | |||||
Ellington Financial Mortgage Trust | |||||||
Series 2022-4, Class B1, 5.93%, 09/25/2067(b)(c) | 3,000,000 | 2,939,981 | |||||
Series 2024-RM2, Class A1A, 5.00%, 07/25/2054(b) | 1,093,867 | 1,010,468 | |||||
1 |
Par | Value | ||||||
NON-AGENCY RESIDENTIAL MORTGAGE-BACKED SECURITIES — (Continued) | |||||||
Fannie Mae Connecticut Avenue Securities | |||||||
Series 2020-SBT1, Class 1B1, 11.60% (30 day avg SOFR US + 6.86%), 02/25/2040(b) | $2,000,000 | $2,166,988 | |||||
Series 2024-R01, Class 1B1, 7.43% (30 day avg SOFR US + 2.70%), 01/25/2044(b) | 1,000,000 | 1,023,732 | |||||
Series 2024-R01, Class 1B2, 8.73% (30 day avg SOFR US + 4.00%), 01/25/2044(b) | 1,000,000 | 1,043,244 | |||||
Series 2024-R02, Class 1B2, 8.43% (30 day avg SOFR US + 3.70%), 02/25/2044(b) | 2,500,000 | 2,574,020 | |||||
Series 2024-R03, Class 2B1, 7.53% (30 day avg SOFR US + 2.80%), 03/25/2044(b) | 1,500,000 | 1,523,434 | |||||
FIGRE Trust 2023-HE1 | |||||||
Series 2024-HE4, Class A, 5.06%, 09/25/2054(b)(c) | 1,454,243 | 1,457,725 | |||||
Series 2024-HE4, Class B, 5.25%, 09/25/2054(b)(c) | 969,496 | 953,029 | |||||
Flagstar Mortgage Trust, Series 2018-1, Class B5, 3.94%, 03/25/2048(b)(c) | 1,206,000 | 855,904 | |||||
Fort KL, Series 2021-SFR1, Class G, 4.11%, 09/17/2038(b) | 2,811,000 | 2,550,476 | |||||
Freddie Mac Structured Agency Credit Risk | |||||||
Series 2019-DNA4, Class B2, 11.10% (30 day avg SOFR US + 6.36%), 10/25/2049(b) | 2,216,000 | 2,439,498 | |||||
Series 2019-FTR3, Class B2, 9.77% (30 day avg SOFR US + 4.91%), 09/25/2047(b) | 2,533,500 | 2,724,293 | |||||
Series 2019-FTR4, Class B2, 9.85% (30 day avg SOFR US + 5.11%), 11/25/2047(b) | 2,800,000 | 3,038,200 | |||||
Par | Value | ||||||
Series 2022-DNA2, Class M2, 8.48% (30 day avg SOFR US + 3.75%), 02/25/2042(b) | $750,000 | $786,660 | |||||
Freddie Mac Structured Agency Credit Risk Debt Notes, Series 2024-DNA2, Class M2, 6.43% (30 day avg SOFR US + 1.70%), 05/25/2044(b) | 1,300,000 | 1,309,309 | |||||
Freddie Mac Structured Agency Credit Risk REMIC Trust | |||||||
Series 2020-DNA2, Class B2, 9.65% (30 day avg SOFR US + 4.91%), 02/25/2050(b) | 2,590,000 | 2,793,358 | |||||
Series 2020-HQA1, Class B2, 9.95% (30 day avg SOFR US + 5.21%), 01/25/2050(b) | 2,300,000 | 2,511,557 | |||||
Freddie Mac Whole Loan Securities Trust | |||||||
Series 2017-SC01, Class M2, 3.64%, 12/25/2046(b)(c) | 595,000 | 531,399 | |||||
Series 2017-SC02, Class M2, 3.86%, 05/25/2047(b)(c) | 1,411,000 | 1,309,670 | |||||
GreenPoint Mortgage Funding Trust, Series 2005-AR4, Class 4A1A, 5.32% (1 mo. Term SOFR + 0.73%), 10/25/2045 | 9,472,029 | 9,054,865 | |||||
GS Mortgage-Backed Securities Trust, Series 2021-GR1, Class B4, 3.09%, 11/25/2051(b)(c) | 2,139,299 | 1,728,796 | |||||
GSAA Home Equity Trust, Series 2006-5, Class 2A1, 4.84% (1 mo. Term SOFR + 0.25%), 03/25/2036 | 24,191 | 7,940 | |||||
Imperial Fund Mortgage Trust, Series 2020-NQM1, Class B1, 4.00%, 10/25/2055(b)(c) | 1,602,000 | 1,429,002 | |||||
JP Morgan Mortgage Trust | |||||||
Series 2019-5, Class B5, 4.46%, 11/25/2049(b)(c) | 1,232,439 | 1,040,084 | |||||
Series 2019-5, Class B6, 4.37%, 11/25/2049(b)(c) | 3,606,176 | 2,259,427 | |||||
Series 2019-HYB1, Class B4, 4.97%, 10/25/2049(b)(c) | 4,715,262 | 4,687,793 | |||||
Series 2020-2, Class B6Z, 6.87%, 07/25/2050(b)(c) | 3,864,437 | 2,872,641 | |||||
2 |
Par | Value | ||||||
NON-AGENCY RESIDENTIAL MORTGAGE-BACKED SECURITIES — (Continued) | |||||||
Series 2021-3, Class A3X, 0.50%, 07/25/2051(b)(c)(d) | $55,914,559 | $1,639,826 | |||||
Series 2022-INV1, Class B4, 3.29%, 03/25/2052(b)(c) | 3,284,024 | 2,631,508 | |||||
Series 2024-CCM1, Class A9, 6.00%, 04/25/2055(b)(c) | 4,000,000 | 4,000,000 | |||||
JP Morgan Wealth Management | |||||||
Series 2021-CL1, Class M4, 7.48% (30 day avg SOFR US + 2.75%), 03/25/2051(b) | 883,915 | 850,800 | |||||
Series 2021-CL1, Class M5, 8.58% (30 day avg SOFR US + 3.85%), 03/25/2051(b) | 601,632 | 551,241 | |||||
Merrill Lynch Mortgage Investors Trust, Series 2005-AR1, Class M2, 5.71% (1 mo. Term SOFR + 1.12%), 06/25/2036 | 1,898,267 | 1,506,323 | |||||
Mill City Mortgage Loan Trust, Series 2019-1, Class B1, 3.50%, 10/25/2069(b)(c) | 2,245,863 | 1,935,726 | |||||
Morgan Stanley Residential Mortgage Loan Trust, Series 2024-INV2, Class A1, 6.50%, 02/25/2054(b)(c) | 1,628,002 | 1,653,498 | |||||
New Residential Mortgage Loan Trust | |||||||
Series 2021-NQ2R, Class B1, 3.01%, 10/25/2058(b)(c) | 2,034,000 | 1,958,596 | |||||
Series 2021-NQ2R, Class B2, 3.96%, 10/25/2058(b)(c) | 1,813,000 | 1,760,583 | |||||
NMLT Trust, Series 2021-INV1, Class B1, 3.61%, 05/25/2056(b)(c) | 2,326,000 | 1,840,705 | |||||
Onslow Bay Mortgage Loan Trust | |||||||
Series 2024-NQM2, Class A3, 6.18%, 12/25/2063(a)(b) | 1,262,164 | 1,266,894 | |||||
Series 2024-NQM2, Class M1, 6.86%, 12/25/2063(b)(c) | 1,238,000 | 1,253,491 | |||||
Point Securitization Trust 2023-1, Series 2024-1, Class A1, 6.50%, 06/25/2054(b) | 2,931,436 | 2,918,125 | |||||
Par | Value | ||||||
Pretium Mortgage Credit Partners LLC, Series 2021-NPL6, Class A2, 5.07%, 07/25/2051(a)(b)(e) | $2,259,509 | $2,228,825 | |||||
PRPM LLC | |||||||
Series 2024-4, Class A1, 6.41%, 08/25/2029(a)(b) | 957,451 | 958,944 | |||||
Series 2024-6, Class A1, 5.70%, 11/25/2029(a)(b) | 2,000,000 | 2,018,022 | |||||
Series 2024-RCF1, Class A1, 4.00%, 01/25/2054(a)(b) | 708,271 | 694,325 | |||||
Series 2024-RCF2, Class A2, 3.75%, 03/25/2054(a)(b) | 1,758,000 | 1,658,610 | |||||
RAAC Series Trust, Series 2004-SP1, Class AI3, 6.12%, 03/25/2034(a) | 610 | 604 | |||||
Radnor Re Ltd. | |||||||
Series 2023-1, Class M1A, 7.43% (30 day avg SOFR US + 2.70%), 07/25/2033(b) | 868,049 | 877,099 | |||||
Series 2023-1, Class M1B, 9.08% (30 day avg SOFR US + 4.35%), 07/25/2033(b) | 1,250,000 | 1,314,026 | |||||
RALI Series Trust, Series 2006-QS6, Class 1AV, 0.77%, 06/25/2036(c)(d) | 4,300,413 | 87,533 | |||||
RAMP Series Trust, Series 2007-RS1, Class A3, 5.04% (1 mo. Term SOFR + 0.45%), 02/25/2037 | 9,723,687 | 2,225,259 | |||||
Residential Accredit Loans, Inc. Series Trust | |||||||
Series 2006-QS18, Class 1A1, 5.30% (1 mo. Term SOFR + 0.71%), 12/25/2036 | 2,035,136 | 1,720,947 | |||||
Series 2008-QR1, Class 2A1, 5.20% (1 mo. Term SOFR + 0.61%), 09/25/2036 | 1,289,285 | 918,116 | |||||
Residential Funding Securities Corp., Series 2002-RP1, Class A1, 5.56% (1 mo. Term SOFR + 0.97%), 03/25/2033(b) | 321,949 | 305,200 | |||||
SAIF Securitization Trust, Series 2024-CES1, Class A1, 5.97%, 07/25/2054(a)(b) | 2,125,472 | 2,123,167 | |||||
3 |
Par | Value | ||||||
NON-AGENCY RESIDENTIAL MORTGAGE-BACKED SECURITIES — (Continued) | |||||||
Seasoned Credit Risk Transfer Trust | |||||||
Series 2018-2, Class BX, 3.40%, 11/25/2057(c) | $3,140,067 | $1,170,151 | |||||
Series 2018-2, Class XSIO, 0.07%, 11/25/2057(c)(d) | 374,945,954 | 1,018,953 | |||||
SGR Residential Mortgage Trust, Series 2022-2, Class A3, 5.35%, 08/25/2062(b)(c) | 818,468 | 812,507 | |||||
Star Trust | |||||||
Series 2021-SFR1, Class H, 9.17% (1 mo. Term SOFR + 4.56%), 04/17/2038(b) | 1,000,000 | 971,344 | |||||
Series 2021-SFR2, Class H, 8.87% (1 mo. Term SOFR + 4.26%), 01/17/2039(b) | 746,643 | 717,154 | |||||
Starwood Mortgage Residential Trust | |||||||
Series 2020-3, Class B2, 4.75%, 04/25/2065(b)(c) | 1,460,000 | 1,222,783 | |||||
Series 2020-INV1, Class B2, 4.26%, 11/25/2055(b) | 1,000,000 | 906,335 | |||||
Structured Adjustable Rate Mortgage Loan Trust, Series 2005-21, Class 3A1, 4.52%, 11/25/2035(c) | 17,451 | 16,071 | |||||
Toorak Mortgage Corp., Series 2024-RRTL2, Class A1, 5.50%, 09/25/2039(a)(b) | 2,500,000 | 2,487,657 | |||||
Toorak Mortgage Trust, Series 2024-RRTL1, Class A2, 7.57%, 02/25/2039(a)(b) | 1,200,000 | 1,224,882 | |||||
Towd Point Mortgage Trust | |||||||
Series 2018-6, Class B2, 3.92%, 03/25/2058(b)(c) | 2,750,000 | 2,304,316 | |||||
Series 2019-1, Class B2, 1.07%, 03/25/2058(b)(c) | 4,000,000 | 3,251,639 | |||||
Series 2019-HY1, Class B3, 6.85% (1 mo. Term SOFR + 2.26%), 10/25/2048(b) | 6,170,000 | 5,510,220 | |||||
Series 2019-HY2, Class B2, 6.95% (1 mo. Term SOFR + 2.36%), 05/25/2058(b) | 1,000,000 | 990,800 | |||||
Series 2019-HY2, Class B4, 6.95% (1 mo. Term SOFR + 2.36%), 05/25/2058(b) | 1,836,000 | 1,637,765 | |||||
Par | Value | ||||||
Series 2019-HY3, Class B1, 6.70% (1 mo. Term SOFR + 2.11%), 10/25/2059(b) | $4,704,000 | $4,767,630 | |||||
Series 2019-HY3, Class B2, 6.70% (1 mo. Term SOFR + 2.11%), 10/25/2059(b) | 3,320,000 | 3,270,203 | |||||
Series 2019-HY3, Class B3, 6.70% (1 mo. Term SOFR + 2.11%), 10/25/2059(b) | 1,106,000 | 941,845 | |||||
Series 2019-HY3, Class B4, 6.70% (1 mo. Term SOFR + 2.11%), 10/25/2059(b) | 1,105,000 | 1,000,660 | |||||
Series 2024-CES1, Class A1B, 6.05%, 01/25/2064(b)(c) | 624,650 | 627,547 | |||||
Series 2024-CES6, Class A2, 6.00%, 11/25/2064(b)(c)(f) | 1,500,000 | 1,499,955 | |||||
UWM Mortgage Trust, Series 2021-INV4, Class B4, 3.22%, 12/25/2051(b)(c) | 2,810,847 | 2,229,900 | |||||
Vericrest Opportunity Loan Transferee | |||||||
Series 2021-CF2, Class A1, 5.49%, 11/27/2051(a)(b) | 2,701,444 | 2,699,286 | |||||
Series 2021-NP11, Class A1, 4.87%, 08/25/2051(a)(b) | 718,398 | 721,147 | |||||
Series 2021-NPL2, Class A1, 4.89%, 02/27/2051(a)(b) | 442,270 | 444,640 | |||||
Series 2021-NPL4, Class A2, 4.95%, 03/27/2051(a)(b)(e) | 1,563,019 | 1,480,383 | |||||
Series 2021-NPL6, Class A1, 5.24%, 04/25/2051(a)(b) | 1,266,433 | 1,267,245 | |||||
Verus Securitization Trust | |||||||
Series 2019-INV3, Class B2, 4.79%, 11/25/2059(b)(c) | 1,000,000 | 984,957 | |||||
Series 2021-5, Class B2, 3.94%, 09/25/2066(b)(c) | 2,000,000 | 1,484,930 | |||||
Series 2021-8, Class B2, 4.33%, 11/25/2066(b)(c) | 795,000 | 652,678 | |||||
Series 2021-R3, Class B2, 4.07%, 04/25/2064(b)(c) | 3,609,000 | 3,217,496 | |||||
Washington Mutual Mortgage Pass-Through Certificates Series Trust, Series 2007-4, Class 1A5, 7.00%, 06/25/2037 | 4,649,328 | 2,430,456 | |||||
TOTAL NON-AGENCY RESIDENTIAL MORTGAGE-BACKED SECURITIES (Cost $210,314,157) | 192,323,488 | ||||||
4 |
Par | Value | ||||||
NON-AGENCY COMMERCIAL MORTGAGE-BACKED SECURITIES — 24.8% | |||||||
Atrium Hotel Portfolio Trust, Series 2024-ATRM, Class E, 9.52%, 11/10/2029(b)(c) | $3,000,000 | $3,030,472 | |||||
BANK5 Trust, Series 2024-5YR7, Class D, 4.00%, 06/15/2057(b) | 3,119,500 | 2,712,201 | |||||
Bayview Commercial Asset Trust | |||||||
Series 2006-2A, Class M1, 5.17% (1 mo. Term SOFR + 0.58%), 07/25/2036(b) | 467,928 | 447,578 | |||||
Series 2006-2A, Class M3, 5.23% (1 mo. Term SOFR + 0.64%), 07/25/2036(b) | 676,408 | 640,835 | |||||
Series 2006-3A, Class M1, 5.21% (1 mo. Term SOFR + 0.62%), 10/25/2036(b) | 518,572 | 496,851 | |||||
BBCMS Trust | |||||||
Series 2024-5C25, Class D, 4.00%, 03/15/2057(b) | 1,000,000 | 874,328 | |||||
Series 2024-5C27, Class D, 4.00%, 07/15/2057(b) | 2,000,000 | 1,736,220 | |||||
Series 2024-5C29, Class E, 4.00%, 09/15/2057(b) | 1,500,000 | 1,250,958 | |||||
Benchmark Mortgage Trust | |||||||
Series 2023-V2, Class D, 4.00%, 05/15/2055(b) | 1,500,000 | 1,341,644 | |||||
Series 2024-V9, Class D, 4.50%, 08/15/2057 | 1,000,000 | 885,705 | |||||
Blackstone Mortgage Trust, Inc., Series 2021-FL4, Class A, 5.77% (1 mo. Term SOFR + 1.16%), 05/15/2038(b) | 3,143,700 | 3,041,821 | |||||
BPR Trust, Series 2023-STON, Class D, 8.13%, 12/05/2039(b)(c) | 2,500,000 | 2,494,100 | |||||
BX Trust, Series 2021-ARIA, Class E, 6.97% (1 mo. Term SOFR + 2.36%), 10/15/2036(b) | 1,670,000 | 1,660,462 | |||||
BXMT Ltd. | |||||||
Series 2020-FL2, Class C, 6.37% (1 mo. Term SOFR + 1.76%), 02/15/2038(b) | 2,000,000 | 1,834,872 | |||||
Series 2020-FL3, Class A, 6.12% (1 mo. Term SOFR + 1.51%), 11/15/2037(b) | 1,065,688 | 1,046,561 | |||||
Par | Value | ||||||
Series 2020-FL3, Class C, 7.27% (1 mo. Term SOFR + 2.66%), 11/15/2037(b) | $2,850,000 | $2,579,772 | |||||
CFK Trust, Series 2020-MF2, Class D, 3.35%, 03/15/2039(b) | 4,300,000 | 3,622,859 | |||||
Federal Home Loan Mortgage Corp. | |||||||
Series 2024-MN9, Class B1, 10.73% (30 day avg SOFR US + 6.00%), 10/25/2044(b) | 2,950,000 | 3,040,631 | |||||
Series 2024-MN9, Class M2, 7.98% (30 day avg SOFR US + 3.25%), 10/25/2044(b) | 1,250,000 | 1,255,855 | |||||
Freddie Mac Multi-Family Structured Credit Risk | |||||||
Series 2021-MN2, Class M2, 8.08% (30 day avg SOFR US + 3.35%), 07/25/2041(b) | 5,000,000 | 4,949,925 | |||||
Series 2021-MN3, Class B1, 11.58% (30 day avg SOFR US + 6.85%), 11/25/2051(b) | 6,063,000 | 6,515,768 | |||||
Granite Point Mortgage Trust, Inc., Series 2021-FL4, Class C, 7.06% (1 mo. Term SOFR + 2.46%), 12/15/2036(b) | 3,500,000 | 3,305,944 | |||||
Greystone Commercial Real Estate Ltd., Series 2024-HC3, Class B, 8.24% (1 mo. Term SOFR + 3.63%), 03/15/2041(b) | 2,075,000 | 2,077,918 | |||||
Harvest Commercial Capital Loan Trust | |||||||
Series 2024-1, Class M2, 6.90%, 10/25/2056(c) | 1,940,128 | 1,957,131 | |||||
Series 2024-1, Class M3, 7.55%, 10/25/2056(c) | 1,234,807 | 1,246,153 | |||||
JP Morgan Chase Commercial Mortgage Securities, Series 2021-NYAH, Class D, 6.51% (1 mo. Term SOFR + 1.90%), 06/15/2038(b) | 3,200,000 | 2,993,843 | |||||
5 |
Par | Value | ||||||
NON-AGENCY COMMERCIAL MORTGAGE-BACKED SECURITIES — (Continued) | |||||||
Madison Avenue Trust, Series 2015-11MD, Class D, 3.67%, 09/10/2035(b)(c) | $2,500,000 | $2,356,154 | |||||
Morgan Stanley ABS Capital I, Inc., Series 2024-BPR2, Class A, 7.29%, 05/05/2029(b) | 3,614,181 | 3,759,610 | |||||
Morgan Stanley Capital I Trust, Series 2014-150E, Class A, 3.91%, 09/09/2032(b) | 1,150,000 | 1,002,344 | |||||
Multi-Family Connecticut Avenue Securities Trust | |||||||
Series 2019-01, Class B10, 10.35% (30 day avg SOFR US + 5.61%), 10/25/2049(b) | 2,384,000 | 2,426,871 | |||||
Series 2019-01, Class M10, 8.10% (30 day avg SOFR US + 3.36%), 10/25/2049(b) | 2,120,320 | 2,146,836 | |||||
Series 2023-01, Class B1, 14.48% (30 day avg SOFR US + 9.75%), 11/25/2053(b) | 1,485,000 | 1,761,237 | |||||
Multi-Family Housing Mortgage Loan Trust, Series 2024-FL14, Class D, 9.45% (1 mo. Term SOFR + 4.84%), 03/19/2039(b) | 2,500,000 | 2,539,935 | |||||
Velocity Commercial Capital Loan Trust | |||||||
Series 2017-2, Class M4, 5.00%, 11/25/2047(b)(c) | 2,084,519 | 1,847,157 | |||||
Series 2018-1, Class M5, 6.26%, 04/25/2048(b) | 176,719 | 164,185 | |||||
Series 2018-2, Class M3, 4.72%, 10/26/2048(b)(c) | 168,133 | 148,979 | |||||
Series 2019-1, Class M5, 5.70%, 03/25/2049(b)(c) | 436,213 | 375,190 | |||||
TOTAL NON-AGENCY COMMERCIAL MORTGAGE-BACKED SECURITIES (Cost $74,460,659) | 75,568,905 | ||||||
Par | Value | ||||||
ASSET-BACKED SECURITIES — 8.8% | |||||||
Apollo Aviation Securitization Equity Trust | |||||||
Series 2019-2, Class A, 3.38%, 10/16/2039(b) | $1,915,145 | $1,839,874 | |||||
Series 2024-1A, Class A2, 6.26%, 05/16/2049(b) | 1,101,193 | 1,123,535 | |||||
Foundation Finance Trust, Series 2024-2A, Class C, 5.32%, 03/15/2050(b) | 3,000,000 | 2,981,296 | |||||
Labrador Aviation Finance Ltd., Series 2016-1A, Class A1, 4.30%, 01/15/2042(b) | 1,657,133 | 1,599,222 | |||||
Pagaya AI Debt Selection Trust, Series 2024-8, Class D, 6.53%, 01/15/2032(b) | 2,999,866 | 3,008,106 | |||||
Pioneer Aircraft Finance Ltd., Series 2019-1, Class A, 3.97%, 06/15/2044(b) | 2,199,246 | 2,069,459 | |||||
Sabey Data Center Issuer LLC, Series 2023-1, Class A2, 6.25%, 04/20/2048(b) | 3,000,000 | 3,033,096 | |||||
SoFi Professional Loan Program LLC, Series 2021-B, Class AFX, 1.14%, 02/15/2047(b) | 1,289,854 | 1,113,447 | |||||
Thunderbolt Aircraft Lease, Series 2019-1, Class A, 3.67%, 11/15/2039(b) | 2,269,606 | 2,137,949 | |||||
Volofin Finance Designated Activity Co., Series 2024-1A, Class A, 5.94%, 06/15/2037(b) | 2,100,000 | 2,114,162 | |||||
Westlake Automobile Receivables Trust, Series 2022-1A, Class D, 3.49%, 03/15/2027(b) | 2,375,000 | 2,351,466 | |||||
Wheels Fleet Lease Funding 1 LLC | |||||||
Series 2023-1A, Class B, 5.80%, 04/18/2038(b) | 2,000,000 | 2,025,530 | |||||
Series 2024-2A, Class A1, 4.87%, 06/21/2039(b) | 1,400,000 | 1,400,505 | |||||
TOTAL ASSET-BACKED SECURITIES (Cost $26,547,143) | 26,797,647 | ||||||
6 |
Par | Value | |||||||||
AGENCY RESIDENTIAL MORTGAGE- BACKED SECURITIES — 0.8% | ||||||||||
FARM Mortgage Trust, Series 2024-2, Class B, 5.60%, 08/01/2054(b)(c) | $2,500,000 | $2,224,533 | ||||||||
Federal National Mortgage Association, Pool 888534, 5.00%, 08/01/2037 | 4,331 | 4,299 | ||||||||
FNMA Grantor Trust | ||||||||||
Series 2003-T2, Class A1, 5.13% (30 day avg SOFR US + 0.39%), 03/25/2033 | 19,441 | 19,263 | ||||||||
Series 2004-T3, Class 2A, 5.01%, 08/25/2043(c) | 21,261 | 21,280 | ||||||||
FNMA REMIC Trust | ||||||||||
Series 2007-30, Class ZM, 4.25%, 04/25/2037(e) | 65,595 | 61,548 | ||||||||
Series 2007-W8, Class 1A5, 6.55%, 09/25/2037(c) | 5,479 | 5,385 | ||||||||
TOTAL AGENCY RESIDENTIAL MORTGAGE-BACKED SECURITIES (Cost $2,314,468) | 2,336,308 | |||||||||
AGENCY COMMERCIAL MORTGAGE- BACKED SECURITIES - 0.0%(g) | ||||||||||
Fannie Mae-Aces, Series 2006-M1, Class IO, 0.23%, 03/25/2036(c)(d) | 470,494 | 6 | ||||||||
Government National Mortgage Association | ||||||||||
Series 2002-28, Class IO, 1.11%, 01/16/2042(c)(d) | 5,353 | 0 | ||||||||
Series 2005-23, Class IO, 0.00%, 06/17/2045(c)(d) | 104,861 | 0 | ||||||||
Series 2006-68, Class IO, 0.51%, 05/16/2046(c)(d) | 83,415 | 3 | ||||||||
TOTAL AGENCY COMMERCIAL MORTGAGE-BACKED SECURITIES (Cost $1,693) | 9 | |||||||||
Shares | Value | ||||||
PRIVATE PLACEMENTS — 0.0%(g) | |||||||
NewStream Energy Technologies Group, Inc., Convertible Promissory Note(f) | 749,058 | $0 | |||||
TOTAL PRIVATE PLACEMENTS (Cost $749,058) | 0 | ||||||
SHORT-TERM INVESTMENTS — 2.9% | |||||||
Money Market Funds — 2.9% | |||||||
First American Government Obligations Fund - Class X, 4.56%(h) | 8,906,921 | 8,906,921 | |||||
TOTAL SHORT-TERM INVESTMENTS (Cost $8,906,921) | 8,906,921 | ||||||
TOTAL INVESTMENTS — 100.5% | |||||||
(Cost $323,294,099) | 305,933,278 | ||||||
Liabilities in Excess of Other Assets — (0.5)% | (1,494,357) | ||||||
TOTAL NET ASSETS — 100.0% | $304,438,921 | ||||||
(a) | Step coupon bond. The rate disclosed is as of November 30, 2024. |
(b) | Security is exempt from registration pursuant to Rule 144A under the Securities Act of 1933, as amended. These securities may only be resold in transactions exempt from registration to qualified institutional investors. As of November 30, 2024, the value of these securities total $272,290,370 or 89.4% of the Fund’s net assets. |
(c) | Coupon rate is variable based on the weighted average coupon of the underlying collateral. To the extent the weighted average coupon of the underlying assets which comprise the collateral increases or decreases, the coupon rate of this security will increase or decrease correspondingly. The rate disclosed is as of November 30, 2024. |
(d) | Interest only security. |
(e) | DL Custom Z Tranche - This security accrues interest which is added to the outstanding principal balance. The interest payment will be deferred until all other tranches in the structure are paid off. The rate disclosed is as of November 30, 2024. |
(f) | Fair value determined using significant unobservable inputs in accordance with procedures established by and under the supervision of the Adviser, acting as Valuation Designee. These securities represented $1,499,955 or 0.5% of net assets as of November 30, 2024. |
(g) | Represents less than 0.05% of net assets. |
(h) | The rate shown represents the 7-day annualized effective yield as of November 30, 2024. |
7 |
Par | Value | ||||||
NON-AGENCY RESIDENTIAL MORTGAGE- BACKED SECURITIES — 24.2% | |||||||
AMSR Trust, Series 2020-SFR4, Class G2, 4.87%, 11/17/2037(a) | $2,727,000 | $2,697,379 | |||||
Angel Oak Mortgage Trust | |||||||
Series 2019-6, Class A1, 2.62%, 11/25/2059(a)(b) | 1,235,413 | 1,209,947 | |||||
Series 2021-3, Class M1, 2.48%, 05/25/2066(a)(b) | 620,000 | 454,030 | |||||
Series 2023-6, Class A3, 6.50%, 12/25/2067(a)(c) | 824,443 | 830,889 | |||||
Bellemeade Re Ltd., Series 2021-3A, Class M1C, 6.28% (30 day avg SOFR US + 1.55%), 09/25/2031(a) | 1,725,000 | 1,727,592 | |||||
Bombardier Capital Mortgage Securitization Corp., Series 1999-B, Class A3, 7.18%, 12/15/2029(b) | 86,567 | 6,986 | |||||
Boston Lending Trust, Series 2021-1, Class M2, 2.00%, 07/25/2061(a)(b)(d)(e) | 533,966 | 251,328 | |||||
Brean Asset Backed Securities Trust, Series 2022-RM5, Class A, 4.50%, 09/25/2062(a)(b) | 2,160,242 | 2,059,738 | |||||
Chase Mortgage Finance Corp., Series 2021-CL1, Class M2, 6.08% (30 day avg SOFR US + 1.35%), 02/25/2050(a) | 1,082,852 | 1,041,530 | |||||
CHNGE Mortgage Trust, Series 2022-NQM1, Class A2, 5.82%, 06/25/2067(a)(c) | 988,975 | 987,060 | |||||
Credit Suisse Mortgage Trust, Series 2021-NQM4, Class A1, 1.10%, 05/25/2066(a)(b) | 1,280,532 | 1,109,403 | |||||
Credit-Based Asset Servicing and Securitization, Series 2003-CB1, Class AF, 3.95%, 01/25/2033(c) | 2 | 1 | |||||
Deephaven Residential Mortgage Trust, Series 2021-3, Class A2, 1.40%, 08/25/2066(a)(b) | 1,154,825 | 1,010,730 | |||||
Eagle Re Ltd. | |||||||
Series 2021-1, Class M1C, 7.43% (30 day avg SOFR US + 2.70%), 10/25/2033(a) | 40,945 | 41,047 | |||||
Par | Value | ||||||
Series 2023-1, Class M1A, 6.73% (30 day avg SOFR US + 2.00%), 09/26/2033(a) | $663,437 | $666,751 | |||||
Ellington Financial Mortgage Trust, Series 2024-RM2, Class A1A, 5.00%, 07/25/2054(a) | 1,392,195 | 1,286,050 | |||||
FIGRE Trust 2023-HE1 | |||||||
Series 2024-HE4, Class A, 5.06%, 09/25/2054(a)(b) | 969,496 | 971,817 | |||||
Series 2024-HE5, Class A, 5.44%, 10/25/2054(a)(b) | 1,955,857 | 1,953,283 | |||||
GCAT Trust, Series 2023-NQM1, Class A1, 4.25%, 10/25/2057(a)(b) | 2,104,261 | 1,982,920 | |||||
Home Re Ltd., Series 2021-1, Class M2, 7.70% (30 day avg SOFR US + 2.96%), 07/25/2033(a) | 963,840 | 971,263 | |||||
IMC Home Equity Loan Trust, Series 1998-3, Class A8, 5.43%, 08/20/2029(c) | 1,158 | 1,157 | |||||
JP Morgan Mortgage Trust | |||||||
Series 2014-IVR6, Class 2A4, 6.38%, 07/25/2044(a)(b) | 1,085 | 1,083 | |||||
Series 2018-7FRB, Class B3, 6.52%, 04/25/2046(a)(b) | 2,325,157 | 2,262,635 | |||||
Series 2019-6, Class B3, 4.26%, 12/25/2049(a)(b) | 3,931,950 | 3,630,096 | |||||
Series 2023-HE3, Class A1, 6.36% (30 day avg SOFR US + 1.60%), 05/25/2054(a) | 1,032,619 | 1,042,849 | |||||
JP Morgan Wealth Management, Series 2021-CL1, Class M3, 6.53% (30 day avg SOFR US + 1.80%), 03/25/2051(a) | 1,054,995 | 1,015,217 | |||||
MFRA Trust | |||||||
Series 2023-NQM3, Class A2, 7.02%, 07/25/2068(a)(c) | 1,957,329 | 1,987,291 | |||||
Series 2024-RTL2, Class A1, 7.25%, 05/25/2029(a)(c) | 1,500,000 | 1,524,260 | |||||
Pretium Mortgage Credit Partners LLC | |||||||
Series 2024-NPL4, Class A1, 7.00%, 07/25/2054(a)(c) | 981,475 | 990,859 | |||||
Series 2024-NPL5, Class A1, 5.96%, 09/25/2054(a)(c) | 1,503,457 | 1,501,681 | |||||
Progress Residential Trust | |||||||
Series 2021-SFR1, Class B, 1.30%, 04/17/2038(a) | 2,750,000 | 2,637,700 | |||||
8 |
Par | Value | ||||||
NON-AGENCY RESIDENTIAL MORTGAGE- BACKED SECURITIES — (Continued) | |||||||
Series 2022-SFR3, Class E1, 5.20%, 04/17/2039(a) | $3,000,000 | $2,928,990 | |||||
PRPM LLC, Series 2024-RCF1, Class A1, 4.00%, 01/25/2054(a)(c) | 1,062,407 | 1,041,488 | |||||
Radnor Re Ltd. | |||||||
Series 2021-1, Class M1C, 7.43% (30 day avg SOFR US + 2.70%), 12/27/2033(a) | 646,388 | 650,529 | |||||
Series 2022-1, Class M1A, 8.48% (30 day avg SOFR US + 3.75%), 09/25/2032(a) | 939,003 | 946,488 | |||||
Series 2023-1, Class M1A, 7.43% (30 day avg SOFR US + 2.70%), 07/25/2033(a) | 868,049 | 877,099 | |||||
RESIDENTIAL MORTGAGE LOAN TRUST, Series 2019-3, Class B1, 3.81%, 09/25/2059(a)(b) | 2,750,000 | 2,581,938 | |||||
Rithm Capital Corp., Series 2023-NQM1, Class A2, 7.32%, 10/25/2063(a)(c) | 783,746 | 797,482 | |||||
SGR Residential Mortgage Trust, Series 2022-2, Class A3, 5.35%, 08/25/2062(a)(b) | 818,468 | 812,507 | |||||
Star Trust, Series 2021-SFR1, Class E, 6.42% (1 mo. Term SOFR + 1.81%), 04/17/2038(a) | 3,460,000 | 3,397,619 | |||||
Toorak Mortgage Trust, Series 2024-RRTL1, Class A2, 7.57%, 02/25/2039(a)(c) | 1,650,000 | 1,684,213 | |||||
Towd Point HE Trust, Series 2021-HE1, Class M2, 2.50%, 02/25/2063(a)(b) | 1,730,000 | 1,638,000 | |||||
Towd Point Mortgage Trust | |||||||
Series 2019-HY2, Class B2, 6.95% (1 mo. Term SOFR + 2.36%), 05/25/2058(a) | 2,000,000 | 1,981,600 | |||||
Series 2024-CES1, Class A1B, 6.05%, 01/25/2064(a)(b) | 1,665,734 | 1,673,458 | |||||
Vericrest Opportunity Loan Transferee | |||||||
Series 2021-CF2, Class A1, 5.49%, 11/27/2051(a)(c) | 2,161,155 | 2,159,429 | |||||
Series 2021-NP11, Class A1, 4.87%, 08/25/2051(a)(c) | 869,640 | 872,968 | |||||
Par | Value | ||||||
Series 2021-NPL6, Class A1, 5.24%, 04/25/2051(a)(c) | $633,081 | $633,487 | |||||
Verus Securitization Trust | |||||||
Series 2022-4, Class A2, 4.74%, 04/25/2067(a)(b) | 1,068,370 | 1,026,946 | |||||
Series 2023-8, Class A3, 6.97%, 12/25/2068(a)(c) | 1,882,282 | 1,922,344 | |||||
Vista Point Securitization Trust, Series 2024-CES1, Class A1, 6.68%, 05/25/2054(a)(c) | 863,949 | 880,293 | |||||
TOTAL NON-AGENCY RESIDENTIAL MORTGAGE-BACKED SECURITIES (Cost $66,342,528) | 66,361,450 | ||||||
NON-AGENCY COMMERCIAL MORTGAGE-BACKED SECURITIES — 24.1% | |||||||
BANK5 Trust, Series 2024-5YR7, Class D, 4.00%, 06/15/2057(a) | 1,519,500 | 1,321,106 | |||||
Barclays Commercial Mortgage Securities LLC, Series 2019-BWAY, Class A, 5.68% (1 mo. Term SOFR + 1.07%), 11/15/2034(a) | 1,324,000 | 853,993 | |||||
BBCMS Trust | |||||||
Series 2024-5C25, Class D, 4.00%, 03/15/2057(a) | 1,050,000 | 918,044 | |||||
Series 2024-5C27, Class D, 4.00%, 07/15/2057(a) | 1,000,000 | 868,110 | |||||
BDS Ltd., Series 2021-FL7, Class D, 7.07% (1 mo. Term SOFR + 2.46%), 06/16/2036(a) | 3,315,000 | 3,275,200 | |||||
Benchmark Mortgage Trust, Series 2023-V2, Class D, 4.00%, 05/15/2055(a) | 2,700,000 | 2,414,960 | |||||
Blackstone Mortgage Trust, Inc., Series 2021-FL4, Class A, 5.77% (1 mo. Term SOFR + 1.16%), 05/15/2038(a) | 2,888,545 | 2,794,935 | |||||
BX Commercial Mortgage Trust, Series 2021-VOLT, Class F, 7.12% (1 mo. Term SOFR + 2.51%), 09/15/2036(a) | 2,500,000 | 2,501,723 | |||||
BX Trust | |||||||
Series 2021-ARIA, Class E, 6.97% (1 mo. Term SOFR + 2.36%), 10/15/2036(a) | 2,330,000 | 2,316,692 | |||||
9 |
Par | Value | ||||||
NON-AGENCY COMMERCIAL MORTGAGE-BACKED SECURITIES — (Continued) | |||||||
Series 2021-LBA, Class DJV, 6.32% (1 mo. Term SOFR + 1.71%), 02/15/2036(a) | $3,010,000 | $3,000,420 | |||||
BXMT Ltd. | |||||||
Series 2020-FL2, Class C, 6.37% (1 mo. Term SOFR + 1.76%), 02/15/2038(a) | 3,050,000 | 2,798,180 | |||||
Series 2020-FL3, Class A, 6.12% (1 mo. Term SOFR + 1.51%), 11/15/2037(a) | 1,496,062 | 1,469,210 | |||||
Series 2021-FL4, Class C, 6.47% (1 mo. Term SOFR + 1.86%), 05/15/2038(a) | 3,000,000 | 2,464,971 | |||||
Series 2021-FL4, Class D, 6.97% (1 mo. Term SOFR + 2.36%), 05/15/2038(a) | 3,500,000 | 2,672,341 | |||||
Federal Home Loan Mortgage Corp. | |||||||
Series 2024-MN9, Class B1, 10.73% (30 day avg SOFR US + 6.00%), 10/25/2044(a) | 2,550,000 | 2,628,342 | |||||
Series 2024-MN9, Class M2, 7.98% (30 day avg SOFR US + 3.25%), 10/25/2044(a) | 1,000,000 | 1,004,684 | |||||
GPMT Ltd., Series 2021-FL3, Class B, 6.67% (1 mo. Term SOFR + 2.06%), 07/16/2035(a) | 1,000,000 | 945,006 | |||||
Granite Point Mortgage Trust, Inc., Series 2021-FL4, Class C, 7.06% (1 mo. Term SOFR + 2.46%), 12/15/2036(a) | 2,900,000 | 2,739,211 | |||||
Greystone Commercial Real Estate Ltd. | |||||||
Series 2021-HC2, Class A, 6.52% (1 mo. Term SOFR + 1.91%), 12/15/2039(a) | 2,500,000 | 2,501,261 | |||||
Series 2024-HC3, Class B, 8.24% (1 mo. Term SOFR + 3.63%), 03/15/2041(a) | 2,925,000 | 2,929,113 | |||||
Harvest Commercial Capital Loan Trust | |||||||
Series 2024-1, Class M2, 6.90%, 10/25/2056(b) | 2,706,696 | 2,730,417 | |||||
Series 2024-1, Class M3, 7.55%, 10/25/2056(b) | 1,728,729 | 1,744,614 | |||||
Par | Value | ||||||
HGI CRE CLO Ltd. | |||||||
Series 2021-FL1, Class AS, 6.12% (1 mo. Term SOFR + 1.51%), 06/16/2036(a) | $934,000 | $934,930 | |||||
Series 2021-FL2, Class D, 6.87% (1 mo. Term SOFR + 2.26%), 09/17/2036(a) | 1,500,000 | 1,487,747 | |||||
Series 2021-FL2, Class E, 7.17% (1 mo. Term SOFR + 2.56%), 09/17/2036(a) | 2,038,000 | 2,001,664 | |||||
JP Morgan Chase Commercial Mortgage Securities, Series 2021-NYAH, Class D, 6.51% (1 mo. Term SOFR + 1.90%), 06/15/2038(a) | 730,000 | 682,970 | |||||
Lehman Brothers Small Balance Commercial Mortgage Trust, Series 2007-1A, Class M1, 5.20% (1 mo. Term SOFR + 0.61%), 03/25/2037(a) | 2,613,180 | 2,419,053 | |||||
Morgan Stanley Capital I Trust, Series 2014-150E, Class A, 3.91%, 09/09/2032(a) | 2,000,000 | 1,743,208 | |||||
MULTI-FAMILY CONNECTICUT AVENUE SECURITIES TRUST, Series 2023-01, Class B1, 14.48% (30 day avg SOFR US + 9.75%), 11/25/2053(a) | 665,000 | 788,702 | |||||
Multi-Family Housing Mortgage Loan Trust | |||||||
Series 2021-FL5, Class D, 7.22% (1 mo. Term SOFR + 2.61%), 07/15/2036(a) | 1,000,000 | 988,002 | |||||
Series 2021-FL6, Class C, 6.57% (1 mo. Term SOFR + 1.96%), 07/16/2036(a) | 1,300,000 | 1,275,653 | |||||
Series 2021-FL7, Class E, 7.52% (1 mo. Term SOFR + 2.91%), 10/16/2036(a) | 1,700,000 | 1,606,137 | |||||
Shelter Growth CRE Issuer Ltd., Series 2023-FL5, Class A, 7.36% (1 mo. Term SOFR + 2.75%), 05/19/2038(a) | 1,403,705 | 1,410,891 | |||||
TPG Real Estate Finance Issuer Ltd., Series 2022-FL5, Class AS, 6.76% (1 mo. Term SOFR + 2.15%), 02/15/2039(a) | 3,640,000 | 3,615,304 | |||||
10 |
Par | Value | ||||||
NON-AGENCY COMMERCIAL MORTGAGE- BACKED SECURITIES — (Continued) | |||||||
Velocity Commercial Capital Loan Trust | |||||||
Series 2017-2, Class AFL, 5.75% (1 mo. LIBOR US + 0.90%), 11/25/2047(a)(f) | $42,587 | $42,390 | |||||
Series 2019-2, Class M3, 3.48%, 07/25/2049(a)(b) | 249,222 | 211,940 | |||||
TOTAL NON-AGENCY COMMERCIAL MORTGAGE-BACKED SECURITIES (Cost $67,734,023) | 66,101,124 | ||||||
ASSET - BACKED SECURITIES — 23.4% | |||||||
ACHV ABS TRUST, Series 2023-3PL, Class C, 7.35%, 08/19/2030(a) | 3,500,000 | 3,522,997 | |||||
Affirm, Inc., Series 2023-A, Class A, 6.61%, 01/18/2028(a) | 2,700,000 | 2,705,172 | |||||
Ally Bank Auto Credit-Linked Notes, Series 2024-B, Class C, 5.22%, 09/15/2032(a) | 1,000,000 | 1,002,218 | |||||
American Credit Acceptance Receivables Trust, Series 2021-4, Class E, 3.12%, 02/14/2028(a) | 3,000,000 | 2,972,905 | |||||
BOF URSA Funding Trust, Series 2024-EDU1, Class A, 6.18% (30 day avg SOFR US + 1.45%), 06/25/2047(a) | 2,197,551 | 2,205,026 | |||||
CPS Auto Trust, Series 2022-D, Class D, 8.73%, 01/16/2029(a) | 2,000,000 | 2,101,249 | |||||
Exeter Automobile Receivables Trust | |||||||
Series 2021-3A, Class D, 1.55%, 06/15/2027 | 2,790,000 | 2,715,229 | |||||
Series 2021-4A, Class D, 1.96%, 01/17/2028 | 2,878,000 | 2,827,442 | |||||
Flagship Credit Auto Trust, Series 2019-3, Class E, 3.84%, 12/15/2026(a) | 2,332,847 | 2,324,397 | |||||
Labrador Aviation Finance Ltd., Series 2016-1A, Class A1, 4.30%, 01/15/2042(a) | 3,274,692 | 3,160,253 | |||||
Mosaic Solar Loan Trust, Series 2020-1A, Class B, 3.10%, 04/20/2046(a) | 475,531 | 409,554 | |||||
Par | Value | ||||||
Oportun Financial Corp. | |||||||
Series 2021-A, Class C, 3.44%, 03/08/2028(a) | $704,975 | $693,389 | |||||
Series 2021-B, Class B, 1.96%, 05/08/2031(a) | 989,479 | 958,625 | |||||
Series 2024-2, Class C, 6.61%, 02/09/2032(a) | 1,425,000 | 1,435,183 | |||||
Oxford Finance Funding Trust, Series 2023-1A, Class A2, 6.72%, 02/15/2031(a) | 2,166,000 | 2,194,537 | |||||
PagayaAI Debt Selection Trust | |||||||
Series 2021-HG1, Class A, 1.22%, 01/16/2029(a) | 1,364,306 | 1,348,312 | |||||
Series 2022-2, Class B, 6.63%, 01/15/2030(a) | 1,918,892 | 1,923,757 | |||||
Series 2022-5, Class B, 10.31%, 06/17/2030(a) | 999,963 | 1,047,043 | |||||
Series 2022-6, Class A3, 7.66%, 05/15/2030(a) | 2,000,000 | 2,010,778 | |||||
Series 2023-8, Class A, 7.30%, 06/16/2031(a) | 1,723,872 | 1,754,718 | |||||
Series 2023-8, Class B, 7.96%, 06/16/2031(a) | 3,576,381 | 3,651,826 | |||||
Series 2024-1, Class C, 8.34%, 07/15/2031(a) | 3,834,627 | 3,915,843 | |||||
Series 2024-8, Class A, 5.33%, 01/15/2032(a) | 1,575,532 | 1,582,774 | |||||
Series 2024-8, Class D, 6.53%, 01/15/2032(a) | 2,999,866 | 3,008,106 | |||||
Pioneer Aircraft Finance Ltd., Series 2019-1, Class A, 3.97%, 06/15/2044(a) | 3,141,780 | 2,956,370 | |||||
Santander Drive Auto Receivables Trust, Series 2021-3, Class D, 1.33%, 09/15/2027 | 1,820,190 | 1,793,506 | |||||
South Carolina Student Loan Corp., Series 2013-1, Class A, 5.35% (30 day avg SOFR US + 0.61%), 01/25/2041 | 53,094 | 52,460 | |||||
SpringCastle America LLC, Series 2020-AA, Class A, 1.97%, 09/25/2037(a) | 2,874,256 | 2,646,760 | |||||
Thunderbolt Aircraft Lease, Series 2019-1, Class A, 3.67%, 11/15/2039(a) | 2,811,601 | 2,648,504 | |||||
11 |
Par | Value | ||||||
ASSET - BACKED SECURITIES — (Continued) | |||||||
Westlake Automobile Receivables Trust, Series 2022-1A, Class D, 3.49%, 03/15/2027(a) | $2,700,000 | $2,673,246 | |||||
TOTAL ASSET - BACKED SECURITIES | |||||||
(Cost $63,706,432) | 64,242,179 | ||||||
AGENCY RESIDENTIAL MORTGAGE- BACKED SECURITIES — 16.1% | |||||||
Connecticut Avenue Securities Trust 2024-R04, Series 2024-R05, Class 2B1, 6.73% (30 day avg SOFR US + 2.00%), 07/25/2044(a) | 2,596,000 | 2,616,169 | |||||
Fannie Mae Connecticut Avenue Securities | |||||||
Series 2019-R06, Class 2B1, 8.60% (30 day avg SOFR US + 3.86%), 09/25/2039(a) | 1,621,158 | 1,682,093 | |||||
Series 2020-SBT1, Class 1M2, 8.50% (30 day avg SOFR US + 3.76%), 02/25/2040(a) | 1,983,000 | 2,095,234 | |||||
Series 2021-R01, Class 1B1, 7.83% (30 day avg SOFR US + 3.10%), 10/25/2041(a) | 1,150,000 | 1,185,938 | |||||
Series 2021-R01, Class 1M2, 6.28% (30 day avg SOFR US + 1.55%), 10/25/2041(a) | 1,626,215 | 1,634,863 | |||||
Series 2021-R02, Class 2M2, 6.73% (30 day avg SOFR US + 2.00%), 11/25/2041(a) | 2,000,000 | 2,020,159 | |||||
Series 2022-R01, Class 1M2, 6.63% (30 day avg SOFR US + 1.90%), 12/25/2041(a) | 1,300,000 | 1,318,030 | |||||
Series 2023-R01, Class 1M2, 8.48% (30 day avg SOFR US + 3.75%), 12/25/2042(a) | 1,000,000 | 1,072,928 | |||||
Series 2023-R03, Class 2M2, 8.63% (30 day avg SOFR US + 3.90%), 04/25/2043(a) | 1,460,000 | 1,575,285 | |||||
Series 2023-R04, Class 1M2, 8.28% (30 day avg SOFR US + 3.55%), 05/25/2043(a) | 2,750,000 | 2,948,297 | |||||
Series 2024-R01, Class 1B1, 7.43% (30 day avg SOFR US + 2.70%), 01/25/2044(a) | 1,200,000 | 1,228,478 | |||||
Par | Value | ||||||
Series 2024-R02, Class 1B1, 7.23% (30 day avg SOFR US + 2.50%), 02/25/2044(a) | $2,350,000 | $2,406,894 | |||||
Series 2024-R03, Class 2B1, 7.53% (30 day avg SOFR US + 2.80%), 03/25/2044(a) | 1,000,000 | 1,015,623 | |||||
Series 2024-R03, Class 2M2, 6.68% (30 day avg SOFR US + 1.95%), 03/25/2044(a) | 1,000,000 | 1,011,263 | |||||
Freddie Mac Structured Agency Credit Risk | |||||||
Series 2018-SPI2, Class M2, 3.85%, 05/25/2048(a)(b) | 29,416 | 28,711 | |||||
Series 2020-HQA5, Class B1, 8.73% (30 day avg SOFR US + 4.00%), 11/25/2050(a) | 1,350,000 | 1,524,235 | |||||
Series 2021-DNA2, Class B1, 8.13% (30 day avg SOFR US + 3.40%), 08/25/2033(a) | 2,060,000 | 2,307,501 | |||||
Series 2021-DNA2, Class M2, 7.03% (30 day avg SOFR US + 2.30%), 08/25/2033(a) | 3,001,569 | 3,080,246 | |||||
Series 2021-DNA6, Class M2, 6.23% (30 day avg SOFR US + 1.50%), 10/25/2041(a) | 1,285,000 | 1,292,147 | |||||
Series 2022-DNA1, Class M2, 7.23% (30 day avg SOFR US + 2.50%), 01/25/2042(a) | 2,500,000 | 2,553,680 | |||||
Series 2023-HQA2, Class M1A, 6.73% (30 day avg SOFR US + 2.00%), 06/25/2043(a) | 1,192,501 | 1,204,461 | |||||
Freddie Mac Structured Agency Credit Risk Debt Notes, Series 2023-HQA2, Class M2, 8.58% (30 day avg SOFR US + 3.85%), 06/25/2043(a) | 1,000,000 | 1,071,259 | |||||
Freddie Mac Structured Agency Credit Risk REMIC Trust | |||||||
Series 2021-DNA1, Class B1, 7.38% (30 day avg SOFR US + 2.65%), 01/25/2051(a) | 1,060,000 | 1,125,550 | |||||
Series 2021-DNA5, Class B1, 7.78% (30 day avg SOFR US + 3.05%), 01/25/2034(a) | 2,000,000 | 2,155,731 | |||||
Series 2022-DNA3, Class M1B, 7.63% (30 day avg SOFR US + 2.90%), 04/25/2042(a) | 3,000,000 | 3,116,870 | |||||
Series 2022-DNA4, Class M1B, 8.08% (30 day avg SOFR US + 3.35%), 05/25/2042(a) | 1,000,000 | 1,047,703 | |||||
12 |
Par | Value | ||||||
AGENCY RESIDENTIAL MORTGAGE-BACKED SECURITIES — (Continued) | |||||||
Government National Mortgage Association, Series 2008-55, Class WT, 5.41%, 06/20/2037(b) | $4,914 | $4,953 | |||||
TOTAL AGENCY RESIDENTIAL MORTGAGE-BACKED SECURITIES (Cost $42,450,463) | 44,324,301 | ||||||
COLLATERALIZED LOAN OBLIGATIONS — 9.9% | |||||||
BCC Middle Market CLO LLC, Series 2023-2A, Class A1, 7.12% (3 mo. Term SOFR + 2.50%), 10/21/2035(a) | 2,500,000 | 2,532,560 | |||||
Carlyle Global Market Strategies CLO Ltd., Series 2014-5A, Class A1RR, 6.06% (3 mo. Term SOFR + 1.40%), 07/15/2031(a) | 1,436,662 | 1,439,104 | |||||
Cent CLO, Series 2022-32A, Class A1R, 6.08% (3 mo. Term SOFR + 1.45%), 07/24/2034(a) | 2,860,000 | 2,862,954 | |||||
Crown Point CLO IV Ltd., Series 2018-4A, Class A, 5.98% (3 mo. Term SOFR + 1.36%), 04/20/2031(a) | 1,268,018 | 1,268,957 | |||||
Deerpath Capital CLO Ltd., Series 2023-1A, Class A1, 7.46% (3 mo. Term SOFR + 2.80%), 04/15/2035(a) | 3,000,000 | 3,021,261 | |||||
ICG US CLO Ltd., Series 2014-1A, Class A1A2, 6.08% (3 mo. Term SOFR + 1.46%), 10/20/2034(a) | 1,500,000 | 1,503,680 | |||||
KKR CLO 9 Ltd., Series 9, Class AR2, 5.87% (3 mo. Term SOFR + 1.21%), 07/15/2030(a) | 236,150 | 236,310 | |||||
LCM LP, Series 39A, Class A1R, 6.00% (3 mo. Term SOFR + 1.34%), 10/15/2034(a) | 2,000,000 | 2,000,000 | |||||
Owl Rock CLO Ltd., Series 2020-3A, Class AR, 6.47% (3 mo. Term SOFR + 1.85%), 04/20/2036(a) | 1,730,000 | 1,740,818 | |||||
Par | Value | ||||||
OZLM VIII Ltd., Series 2014-8A, Class A1R3, 5.89% (3 mo. Term SOFR + 1.24%), 10/17/2029(a) | $319,363 | $319,520 | |||||
PennantPark CLO Ltd., Series 2021-3A, Class A1, 6.51% (3 mo. Term SOFR + 1.88%), 10/22/2032(a) | 2,000,000 | 2,001,532 | |||||
Saranac CLO III Ltd., Series 2014-3A, Class ALR, 6.61% (3 mo. LIBOR US + 1.60%), 06/22/2030(a)(f) | 324,921 | 325,585 | |||||
Sound Point CLO Ltd., Series 2018-3A, Class A1AR, 5.92% (3 mo. Term SOFR + 1.30%), 10/26/2031(a) | 907,403 | 907,356 | |||||
Telos CLO Ltd., Series 2013-4A, Class AR, 6.15% (3 mo. Term SOFR + 1.50%), 01/17/2030(a) | 140,003 | 140,073 | |||||
THL Credit Lake Shore MM CLO Ltd. | |||||||
Series 2019-2A, Class A1RR, 6.05% (3 mo. Term SOFR + 1.40%), 10/17/2031(a) | 2,287,667 | 2,288,456 | |||||
Series 2021-1A, Class AR, 6.26% (3 mo. Term SOFR + 1.70%), 01/15/2037(a) | 4,500,000 | 4,513,442 | |||||
TOTAL COLLATERALIZED LOAN OBLIGATIONS (Cost $27,090,174) | 27,101,608 | ||||||
CORPORATE BONDS — 0.7% | |||||||
Financial — 0.7% | |||||||
Korth Direct Mortgage, Inc., 10.00%, 03/25/2025(a)(d) | 2,000,000 | 1,891,250 | |||||
TOTAL CORPORATE BONDS (Cost $1,984,019) | 1,891,250 | ||||||
AGENCY COMMERCIAL MORTGAGE-BACKED SECURITIES — 0.0%(g) | |||||||
Government National Mortgage Association, Series 2009-4, Class IO, 0.39%, 01/16/2049(b)(h) | 266,121 | 319 | |||||
13 |
Par | Value | ||||||
TOTAL AGENCY COMMERCIAL MORTGAGE-BACKED SECURITIES (Cost $1,593) | $319 | ||||||
Shares | | ||||||
SHORT-TERM INVESTMENTS — 2.0% | |||||||
Money Market Funds — 2.0% | |||||||
First American Government Obligations Fund - Class X, 4.56%(i) | 5,622,209 | 5,622,209 | |||||
TOTAL SHORT-TERM INVESTMENTS | |||||||
(Cost $5,622,209) | 5,622,209 | ||||||
TOTAL INVESTMENTS — 100.4% (Cost $274,931,441) | 275,644,440 | ||||||
Liabilities in Excess of Other Assets - (0.4)% | (1,127,566) | ||||||
TOTAL NET ASSETS — 100.0% | $274,516,874 | ||||||
(a) | Security is exempt from registration pursuant to Rule 144A under the Securities Act of 1933, as amended. These |
(b) | Coupon rate is variable based on the weighted average coupon of the underlying collateral. To the extent the weighted average coupon of the underlying assets which comprise the collateral increases or decreases, the coupon rate of this security will increase or decrease correspondingly. The rate disclosed is as of November 30, 2024. |
(c) | Step coupon bond. The rate disclosed is as of |
(d) | Fair value determined using significant unobservable inputs in accordance with procedures established by and under the supervision of the Adviser, acting as Valuation Designee. These securities represented $2,142,578 or 0.8% of net assets as of November 30, 2024. |
(e) | DL Custom Z Tranche - This security accrues interest which is added to the outstanding principal balance. The interest payment will be deferred until all other tranches in the structure are paid off. The rate disclosed is as of November 30, 2024. |
(f) | Securities referencing LIBOR are expected to transition to an alternative reference rate by the security’s next scheduled coupon reset date. |
(g) | Represents less than 0.05% of net assets. |
(h) | Interest only security. |
(i) | The rate shown represents the 7-day annualized effective yield as of November 30, 2024. |
14 |
Medalist Partners MBS Total Return Fund | Medalist Partners Short Duration Fund | ||||||
ASSETS | |||||||
Investments in securities, at value (identified cost $323,294,099 and $274,931,441, respectively) | $305,933,278 | $275,644,440 | |||||
Cash | 85,126 | 33,104 | |||||
Receivables | |||||||
Fund shares issued | 488,740 | 1,441 | |||||
Interest | 966,393 | 807,153 | |||||
Prepaid expenses | 30,020 | 28,442 | |||||
Total assets | 307,503,557 | 276,514,580 | |||||
LIABILITIES | |||||||
Payables | |||||||
Dividends | 382,157 | 411,516 | |||||
Investments purchased | 2,099,998 | 999,984 | |||||
Fund shares redeemed | 217,832 | 279,422 | |||||
Due to Adviser | 141,302 | 55,001 | |||||
Administration and fund accounting fees | 64,003 | 60,403 | |||||
Sub-transfer agency fees | 77,743 | 101,686 | |||||
Transfer agent fees and expenses | 16,472 | 16,040 | |||||
12b-1 distribution fees | 23,527 | 27,852 | |||||
Audit fees | 29,150 | 27,499 | |||||
Custody fees | 6,187 | 11,617 | |||||
Chief Compliance Officer fee | 2,082 | 2,083 | |||||
Accrued expenses | 4,183 | 4,603 | |||||
Total liabilities | 3,064,636 | 1,997,706 | |||||
NET ASSETS | $ 304,438,921 | $274,516,874 | |||||
CALCULATION OF NET ASSET VALUE PER SHARE | |||||||
Class A | |||||||
Net assets applicable to shares outstanding | $7,133,977 | ||||||
Shares issued and outstanding [unlimited number of shares (par value $0.01) authorized] | 827,510 | ||||||
Net asset value and redemption price per share | $8.62 | ||||||
Maximum offering price per share (Net asset value per share divided by 98.00%) | $8.80 | ||||||
Investor Class | |||||||
Net assets applicable to shares outstanding | $25,155,464 | $27,288,896 | |||||
Shares issued and outstanding [unlimited number of shares (par value $0.01) authorized] | 2,923,612 | 2,870,468 | |||||
Net asset value, offering and redemption price per share | $8.60 | $9.51 | |||||
15 |
Medalist Partners MBS Total Return Fund | Medalist Partners Short Duration Fund | ||||||
Institutional Class | |||||||
Net assets applicable to shares outstanding | $272,149,480 | $247,227,978 | |||||
Shares issued and outstanding [unlimited number of shares (par value $0.01) authorized] | 31,707,102 | 26,024,927 | |||||
Net asset value, offering and redemption price per share | $8.58 | $9.50 | |||||
COMPONENTS OF NET ASSETS | |||||||
Paid-in capital | $750,596,932 | $300,327,989 | |||||
Total accumulated deficit | (446,158,011) | (25,811,115) | |||||
Net assets | $304,438,921 | $274,516,874 | |||||
16 |
Medalist Partners MBS Total Return Fund | Medalist Partners Short Duration Fund | ||||||
INVESTMENT INCOME | |||||||
Income | |||||||
Interest | $17,410,133 | $20,176,775 | |||||
Total income | 17,410,133 | 20,176,775 | |||||
Expenses | |||||||
Advisory fees (Note 4) | 1,328,050 | 1,005,556 | |||||
Administration and fund accounting fees (Note 4) | 290,875 | 340,414 | |||||
Sub-transfer agency expenses (Note 4) | 173,434 | 248,457 | |||||
Transfer agent fees and expenses (Note 4) | 91,648 | 87,002 | |||||
Registration fees | 57,600 | 62,192 | |||||
12b-1 fees - Class A (Note 5) | 15,134 | — | |||||
12b-1 fees - Investor Class (Note 5) | 40,273 | 49,527 | |||||
Custody fees (Note 4) | 29,445 | 45,734 | |||||
Audit fees | 28,889 | 27,252 | |||||
Trustees fees and expenses | 18,617 | 18,618 | |||||
Chief Compliance Officer fee (Note 4) | 12,503 | 12,503 | |||||
Miscellaneous | 9,393 | 9,327 | |||||
Legal fees | 9,281 | 9,429 | |||||
Shareholder reporting | 8,259 | 7,983 | |||||
Insurance expense | 5,889 | 6,519 | |||||
Total expenses before interest expense and waiver | 2,119,290 | 1,930,513 | |||||
Interest expense (Note 7) | 41,970 | 3,464 | |||||
Total expenses before waiver | 2,161,260 | 1,933,977 | |||||
Less: Advisory fee waiver (Note 4) | (73,492) | (157,175) | |||||
Net expenses | 2,087,768 | 1,776,802 | |||||
Net investment income | 15,322,365 | 18,399,973 | |||||
REALIZED AND UNREALIZED GAIN ON INVESTMENTS | |||||||
Net realized gain on investments | 1,321,386 | 1,122,746 | |||||
Net change in unrealized appreciation/(depreciation) on investments | 15,973,165 | 5,403,088 | |||||
Net realized and unrealized gain on investments | 17,294,551 | 6,525,834 | |||||
Net Increase in Net Assets Resulting from Operations | $32,616,916 | $24,925,807 | |||||
17 |
Medalist Partners MBS Total Return Fund | |||||||
Year Ended November 30, | |||||||
2024 | 2023 | ||||||
NET INCREASE/(DECREASE) IN NET ASSETS FROM: | |||||||
OPERATIONS | |||||||
Net investment income | $15,322,365 | $22,676,325 | |||||
Net realized gain/(loss) from investments | 1,321,386 | (42,307,390) | |||||
Net change in unrealized appreciation/(depreciation) on investments | 15,973,165 | 45,838,236 | |||||
Net increase in net assets resulting from operations | 32,616,916 | 26,207,171 | |||||
DISTRIBUTIONS TO SHAREHOLDERS | |||||||
Class A | (414,745) | (360,140) | |||||
Institutional Class | (14,108,283) | (22,626,221) | |||||
Investor Class | (1,105,652) | (1,326,737) | |||||
Total distributions to shareholders | (15,628,680) | (24,313,098) | |||||
CAPITAL SHARE TRANSACTIONS | |||||||
Net increase/(decrease) in net assets derived from net change in outstanding shares(a) | 90,691,714 | (145,624,503) | |||||
Total increase/(decrease) in net assets | 107,679,950 | (143,730,430) | |||||
NET ASSETS | |||||||
Beginning of year | 196,758,971 | 340,489,401 | |||||
End of year | $304,438,921 | $196,758,971 | |||||
(a) | A summary of share transactions is as follows: |
Class A | |||||||||||||
Year Ended November 30, | |||||||||||||
2024 | 2023 | ||||||||||||
Shares | Paid-in Capital | Shares | Paid-in Capital | ||||||||||
Shares sold | 408,725 | $3,378,255 | 140,290 | $1,118,583 | |||||||||
Shares issued on reinvestments of distributions | 47,962 | 402,504 | 41,962 | 334,912 | |||||||||
Shares redeemed | (169,027) | (1,407,123) | (224,213) | (1,780,860) | |||||||||
Net increase/(decrease) | 287,660 | $2,373,636 | (41,961) | $(327,365) | |||||||||
Investor Class | |||||||||||||
Year Ended November 30, | |||||||||||||
2024 | 2023 | ||||||||||||
Shares | Paid-in Capital | Shares | Paid-in Capital | ||||||||||
Shares sold | 2,498,326 | $21,061,190 | 1,001,802 | $8,038,132 | |||||||||
Shares issued on reinvestments of distributions | 113,375 | 950,860 | 143,515 | 1,143,477 | |||||||||
Shares redeemed | (1,326,366) | (11,110,506) | (1,751,161) | (13,961,400) | |||||||||
Net increase/(decrease) | 1,285,335 | $10,901,544 | (605,844) | $(4,779,791) | |||||||||
18 |
Institutional Class | |||||||||||||
Year Ended November 30, | |||||||||||||
2024 | 2023 | ||||||||||||
Shares | Paid-in Capital | Shares | Paid-in Capital | ||||||||||
Shares sold | 27,327,494 | $228,034,581 | 13,038,096 | $104,248,126 | |||||||||
Shares issued on reinvestments of distributions | 1,158,653 | 9,690,423 | 1,583,231 | 12,590,209 | |||||||||
Shares redeemed | (19,475,077) | (160,308,470) | (32,430,788) | (257,355,682) | |||||||||
Net increase/(decrease) | 9,011,070 | $77,416,534 | (17,809,461) | $(140,517,347) | |||||||||
19 |
Medalist Partners Short Duration Fund | |||||||
Year Ended November 30, | |||||||
2024 | 2023 | ||||||
NET INCREASE/(DECREASE) IN NET ASSETS FROM: | |||||||
OPERATIONS | |||||||
Net investment income | $18,399,973 | $14,311,633 | |||||
Net realized gain/(loss) from investments | 1,122,746 | (1,147,162) | |||||
Capital gain distributons from regulated investment companies | — | 4 | |||||
Net change in unrealized appreciation/(depreciation) on investments | 5,403,088 | 5,885,594 | |||||
Net increase in net assets resulting from operations | 24,925,807 | 19,050,069 | |||||
DISTRIBUTIONS TO SHAREHOLDERS | |||||||
Investor Class | (1,246,542) | (972,041) | |||||
Institutional Class | (17,558,338) | (13,322,405) | |||||
Total distributions to shareholders | (18,804,880) | (14,294,446) | |||||
CAPITAL SHARE TRANSACTIONS | |||||||
Net increase in net assets derived from net change in outstanding shares(a) | 24,432,002 | 41,912,266 | |||||
Total increase in net assets | 30,552,929 | 46,667,889 | |||||
NET ASSETS | |||||||
Beginning of year | 243,963,945 | 197,296,056 | |||||
End of year | $ 274,516,874 | $ 243,963,945 | |||||
(a) | A summary of share transactions is as follows: |
Investor Class | |||||||||||||
Year Ended November 30, | |||||||||||||
2024 | 2023 | ||||||||||||
Shares | Paid-in Capital | Shares | Paid-in Capital | ||||||||||
Shares sold | 1,783,926 | $ 16,843,091 | 216,447 | $2,002,513 | |||||||||
Shares issued on reinvestments of distributions | 115,912 | 1,094,217 | 96,348 | 890,349 | |||||||||
Shares redeemed | (592,598) | (5,592,296) | (908,071) | (8,369,975) | |||||||||
Net increase/(decrease) | 1,307,240 | $ 12,345,012 | (595,276) | $(5,477,113) | |||||||||
Institutional Class | |||||||||||||
Year Ended November 30, | |||||||||||||
2024 | 2023 | ||||||||||||
Shares | Paid-in Capital | Shares | Paid-in Capital | ||||||||||
Shares sold | 14,818,270 | $139,279,283 | 19,401,125 | $179,133,536 | |||||||||
Shares issued on reinvestments of distributions | 1,362,472 | 12,838,104 | 1,214,318 | 11,226,002 | |||||||||
Shares redeemed | (14,824,693) | (140,030,397) | (15,464,311) | (142,970,159) | |||||||||
Net increase | 1,356,049 | $12,086,990 | 5,151,132 | $47,389,379 | |||||||||
20 |
Year Ended November 30, | ||||||||||||||||
2024 | 2023 | 2022 | 2021 | 2020 | ||||||||||||
Net asset value, beginning of year | $7.93 | $7.87 | $9.63 | $9.07 | $10.43 | |||||||||||
Income from investment operations: | ||||||||||||||||
Net investment income^ | 0.56 | 0.67 | 0.38 | 0.26 | 0.36 | |||||||||||
Net realized and unrealized gain/(loss) on investments | 0.69 | 0.11 | (1.71) | 0.59 | (1.33) | |||||||||||
Total from investment operations | 1.25 | 0.78 | (1.33) | 0.85 | (0.97) | |||||||||||
Less distributions: | ||||||||||||||||
From net investment income | (0.58) | (0.72) | (0.43) | (0.29) | (0.39) | |||||||||||
Total distributions | (0.58) | (0.72) | (0.43) | (0.29) | (0.39) | |||||||||||
Net asset value, end of year | $8.60 | $7.93 | $7.87 | $9.63 | $9.07 | |||||||||||
Total return | 16.15% | 10.28% | −14.16% | 9.46% | −9.24% | |||||||||||
Ratios/supplemental data: | ||||||||||||||||
Net assets, end of year (thousands) | $25,155 | $12,988 | $17,668 | $54,546 | $73,022 | |||||||||||
Ratio of expenses to average net assets*: | ||||||||||||||||
Before waiver | 1.20% | 1.17% | 1.12% | 1.05% | 1.09% | |||||||||||
After waiver | 1.17% | 1.17% | 1.12% | 1.05% | 1.09% | |||||||||||
Ratio of net investment income to average net assets: | ||||||||||||||||
Before waiver | 6.68% | 8.40% | 4.05% | 2.77% | 3.81% | |||||||||||
After waiver | 6.71% | 8.40% | 4.05% | 2.77% | 3.81% | |||||||||||
Portfolio turnover rate | 30% | 36% | 13% | 78% | 79% | |||||||||||
^ | Based on average shares outstanding. |
* | Includes interest expense of 0.05% for the year ended November 30, 2022. Includes interest and excise tax expenses of 0.04% for the year ended November 30, 2023. Includes interest expense of 0.02% for the year ended November 30, 2024. |
21 |
Year Ended November 30, | ||||||||||||||||
2024 | 2023 | 2022 | 2021 | 2020 | ||||||||||||
Net asset value, beginning of year | $7.91 | $7.86 | $9.61 | $9.05 | $10.44 | |||||||||||
Income from investment operations: | ||||||||||||||||
Net investment income^ | 0.58 | 0.69 | 0.39 | 0.29 | 0.38 | |||||||||||
Net realized and unrealized gain/(loss) on investments | 0.69 | 0.10 | (1.69) | 0.59 | (1.36) | |||||||||||
Total from investment operations | 1.27 | 0.79 | (1.30) | 0.88 | (0.98) | |||||||||||
Less distributions: | ||||||||||||||||
From net investment income | (0.60) | (0.74) | (0.45) | (0.32) | (0.41) | |||||||||||
Total distributions | (0.60) | (0.74) | (0.45) | (0.32) | (0.41) | |||||||||||
Net asset value, end of year | $8.58 | $7.91 | $7.86 | $9.61 | $9.05 | |||||||||||
Total return | 16.46% | 10.44% | −13.87% | 9.75% | −9.28% | |||||||||||
Ratios/supplemental data: | ||||||||||||||||
Net assets, end of year (thousands) | $272,150 | $179,483 | $318,235 | $1,125,605 | $1,065,862 | |||||||||||
Ratio of expenses to average net assets*: | ||||||||||||||||
Before waiver | 0.95% | 0.92% | 0.87% | 0.80% | 0.84% | |||||||||||
After waiver | 0.92% | 0.92% | 0.87% | 0.80% | 0.84% | |||||||||||
Ratio of net investment income to average net assets: | ||||||||||||||||
Before waiver | 6.91% | 8.67% | 4.30% | 3.02% | 4.04% | |||||||||||
After waiver | 6.94% | 8.67% | 4.30% | 3.02% | 4.04% | |||||||||||
Portfolio turnover rate | 30% | 36% | 13% | 78% | 79% | |||||||||||
^ | Based on average shares outstanding. |
* | Includes interest expense of 0.05% for the year ended November 30, 2022. Includes interest and excise tax expenses of 0.04% for the year ended November 30, 2023. Includes interest expense of 0.02% for the year ended November 30, 2024. |
22 |
Year Ended November 30, | ||||||||||||||||
2024 | 2023 | 2022 | 2021 | 2020 | ||||||||||||
Net asset value, beginning of year | $7.94 | $7.88 | $9.64 | $9.08 | $10.43 | |||||||||||
Income from investment operations: | ||||||||||||||||
Net investment income^ | 0.56 | 0.66 | 0.39 | 0.26 | 0.36 | |||||||||||
Net realized and unrealized gain/(loss) on investments | 0.70 | 0.12 | (1.73) | 0.59 | (1.32) | |||||||||||
Total from investment operations | 1.26 | 0.78 | (1.34) | 0.85 | (0.96) | |||||||||||
Less distributions: | ||||||||||||||||
From net investment income | (0.58) | (0.72) | (0.42) | (0.29) | (0.39) | |||||||||||
Total distributions | (0.58) | (0.72) | (0.42) | (0.29) | (0.39) | |||||||||||
Net asset value, end of year | $8.62 | $7.94 | $7.88 | $9.64 | $9.08 | |||||||||||
Total return | 16.27% | 10.26% | −14.15% | 9.45% | −9.14% | |||||||||||
Ratios/supplemental data: | ||||||||||||||||
Net assets, end of year (thousands) | $7,134 | $4,288 | $4,586 | $8,810 | $10,256 | |||||||||||
Ratio of expenses to average net assets*: | ||||||||||||||||
Before waiver | 1.20% | 1.17% | 1.12% | 1.05% | 1.09% | |||||||||||
After waiver | 1.17% | 1.17% | 1.12% | 1.05% | 1.09% | |||||||||||
Ratio of net investment income to average net assets: | ||||||||||||||||
Before waiver | 6.68% | 8.22% | 4.05% | 2.77% | 3.83% | |||||||||||
After waiver | 6.71% | 8.22% | 4.05% | 2.77% | 3.83% | |||||||||||
Portfolio turnover rate | 30% | 36% | 13% | 78% | 79% | |||||||||||
^ | Based on average shares outstanding. |
* | Includes interest expense of 0.05% for the year ended November 30, 2022. Includes interest and excise tax expenses of 0.04% for the year ended November 30, 2023. Includes interest expense of 0.02% for the year ended November 30, 2024. |
23 |
Year Ended November 30, | ||||||||||||||||
2024 | 2023 | 2022 | 2021 | 2020 | ||||||||||||
Net asset value, beginning of year | $9.31 | $9.11 | $9.63 | $9.56 | $9.89 | |||||||||||
Income from investment operations: | ||||||||||||||||
Net investment income^ | 0.58 | 0.56 | 0.21 | 0.14 | 0.18 | |||||||||||
Net realized and unrealized gain/(loss) on investments | 0.21 | 0.20 | (0.48) | 0.08 | (0.33) | |||||||||||
Total from investment operations | 0.79 | 0.76 | (0.27) | 0.22 | (0.15) | |||||||||||
Less distributions: | ||||||||||||||||
From net investment income | (0.59) | (0.56) | (0.25) | (0.15) | (0.18) | |||||||||||
Total distributions | (0.59) | (0.56) | (0.25) | (0.15) | (0.18) | |||||||||||
Net asset value, end of year | $9.51 | $9.31 | $9.11 | $9.63 | $9.56 | |||||||||||
Total return | 8.79% | 8.57% | −2.80% | 2.25% | −1.43% | |||||||||||
Ratios/supplemental data: | ||||||||||||||||
Net assets, end of year (thousands) | $27,289 | $14,548 | $19,655 | $44,379 | $60,465 | |||||||||||
Ratio of expenses to average net assets: | ||||||||||||||||
Before fee waiver | 0.91% | 0.91% | 0.91% | 0.87% | 0.88% | |||||||||||
After fee waiver | 0.85% | 0.85% | 0.86%* | 0.85% | 0.85% | |||||||||||
Ratio of net investment income to average net assets: | ||||||||||||||||
Before fee waiver | 6.11% | 5.97% | 2.34% | 1.48% | 1.87% | |||||||||||
After fee waiver | 6.17% | 6.03% | 2.39% | 1.50% | 1.90% | |||||||||||
Portfolio turnover rate | 86% | 43% | 42% | 83% | 107% | |||||||||||
^ | Based on average shares outstanding. |
* | Includes interest expense of 0.01%. |
24 |
Year Ended November 30, | ||||||||||||||||
2024 | 2023 | 2022 | 2021 | 2020 | ||||||||||||
Net asset value, beginning of year | $9.30 | $9.10 | $9.63 | $9.55 | $9.90 | |||||||||||
Income from investment operations: | ||||||||||||||||
Net investment income^ | 0.60 | 0.58 | 0.25 | 0.17 | 0.20 | |||||||||||
Net realized and unrealized gain/(loss) on investments | 0.22 | 0.20 | (0.50) | 0.08 | (0.34) | |||||||||||
Total from investment operations | 0.82 | 0.78 | (0.25) | 0.25 | (0.14) | |||||||||||
Less distributions: | ||||||||||||||||
From net investment income | (0.62) | (0.58) | (0.28) | (0.17) | (0.21) | |||||||||||
Total distributions | (0.62) | (0.58) | (0.28) | (0.17) | (0.21) | |||||||||||
Net asset value, end of year | $9.50 | $9.30 | $9.10 | $9.63 | $9.55 | |||||||||||
Total return | 9.06% | 8.85% | −2.66% | 2.61% | −1.28% | |||||||||||
Ratios/supplemental data: | ||||||||||||||||
Net assets, end of year (thousands) | $247,228 | $229,416 | $177,641 | $269,554 | $327,719 | |||||||||||
Ratio of expenses to average net assets: | ||||||||||||||||
Before fee waiver | 0.66% | 0.66% | 0.66% | 0.62% | 0.63% | |||||||||||
After fee waiver | 0.60% | 0.60% | 0.61%* | 0.60% | 0.60% | |||||||||||
Ratio of net investment income to average net assets: | ||||||||||||||||
Before fee waiver | 6.36% | 6.25% | 2.59% | 1.73% | 2.06% | |||||||||||
After fee waiver | 6.42% | 6.31% | 2.64% | 1.75% | 2.09% | |||||||||||
Portfolio turnover rate | 86% | 43% | 42% | 83% | 107% | |||||||||||
^ | Based on average shares outstanding. |
* | Includes interest expense of 0.01%. |
25 |
| A. | Security Valuation: All investments in securities are recorded at their estimated fair value, as described in Note 3. |
| B. | Federal Income Taxes: It is the Funds’ policy to comply with the requirements of Subchapter M of the Internal Revenue Code applicable to regulated investment companies and to distribute substantially all of its taxable income to its shareholders. Each Fund will be liable for an excise tax on the amount by which it does not meet the distribution requirements and will accrue an excise tax liability at the time that the liability can be estimated and is probable. |
| C. | Security Transactions, Income and Distributions: Security transactions are accounted for on the trade date. Realized gains and losses on securities sold are calculated on the basis of high amortized cost. Interest income is recorded on an accrual basis. Discounts and premiums on securities purchased are accreted/amortized over the life of the respective security using the effective interest method, except for premiums on certain callable debt securities that are amortized to the earliest call date. Non-cash interest income included in interest income, if any, is recorded at the fair market value of additional par received. Paydown gains and losses on mortgage-related and other asset-backed securities are recorded as components of interest income on the statement of operations. Distributions to shareholders are recorded on the ex-dividend date. |
26 |
| D. | Restricted Securities: The Funds may invest in securities that are subject to legal or contractual restrictions on resale (“restricted securities”). Restricted securities may be resold in transactions that are exempt from registration under the Federal securities laws. The sale or other disposition of these securities may involve additional expenses and the prompt sale of these securities at an acceptable price may be difficult. At November 30, 2024, the Funds held securities issued pursuant to Rule 144A under the Securities Act of 1933. All Rule 144A securities except for four securities in the Total Return Fund and no securities in the Short Duration Fund have been classified as liquid under the Funds’ liquidity risk management program. At November 30, 2024, the Total Return Fund held $8 or 0.0% in 144A securities classified as illiquid. Other restricted investments held by the Funds at November 30, 2024 are disclosed in the notes to the schedules of investments. |
| E. | Reclassification of Capital Accounts: Accounting principles generally accepted in the United States of America require that certain components of net assets relating to permanent differences be reclassified between financial and tax reporting. These reclassifications have no effect on net assets or net asset value per share. There were no reclassifications made in the Funds for the year ended November 30, 2024. |
| F. | Use of Estimates: The preparation of financial statements in conformity with accounting principles generally accepted in the United States of America requires management to make estimates and assumptions that affect the reported amounts of assets and liabilities at the date of the financial statements and the reported amounts of increases and decreases in net assets during the reporting period. Actual results could differ from those estimates. |
| G. | Events Subsequent to the Fiscal Year End: In preparing the financial statements as of November 30, 2024, management considered the impact of subsequent events for potential recognition or disclosure in the financial statements. Management has determined there were no subsequent events that would need to be disclosed in the Funds’ financial statements. |
27 |
28 |
Level 1 | Level 2 | Level 3 | Total | ||||||||||
Investments | |||||||||||||
Non-Agency Residential Mortgage-Backed Securities | $— | $190,823,533 | $1,499,955 | $192,323,488 | |||||||||
Non-Agency Commercial Mortgage-Backed Securities | — | 75,568,905 | — | 75,568,905 | |||||||||
Asset-Backed Securities | — | 26,797,647 | — | 26,797,647 | |||||||||
Agency Residential Mortgage-Backed Securities | — | 2,336,308 | — | 2,336,308 | |||||||||
Agency Commercial Mortgage-Backed Securities | — | 9 | — | 9 | |||||||||
Private Placements | — | — | — | — | |||||||||
Money Market Fund | 8,906,921 | — | — | 8,906,921 | |||||||||
Total Investments | $8,906,921 | $295,526,402 | $1,499,955 | $305,933,278 | |||||||||
29 |
Level 1 | Level 2 | Level 3 | Total | ||||||||||
Fixed Income | |||||||||||||
Non-Agency Residential Mortgage-Backed Securities | $ — | $66,110,122 | $251,328 | $66,361,450 | |||||||||
Non-Agency Commercial Mortgage-Backed Securities | — | 66,101,124 | — | 66,101,124 | |||||||||
Asset-Backed Securities | — | 64,242,179 | — | 64,242,179 | |||||||||
Agency Residential Mortgage-Backed Securities | — | 44,324,301 | — | 44,324,301 | |||||||||
Collateralized Loan Obligations | — | 27,101,608 | — | 27,101,608 | |||||||||
Corporate Bonds | — | — | 1,891,250 | 1,891,250 | |||||||||
Agency Commercial Mortgage-Backed Securities | — | 319 | — | 319 | |||||||||
Money Market Fund | 5,622,209 | — | — | 5,622,209 | |||||||||
Total Investments | $5,622,209 | $267,879,653 | $2,142,578 | $275,644,440 | |||||||||
Investments in Securities, at Value | ||||
Non-Agency Residential Mortgage-Backed Securities | ||||
Balance as of November 30, 2023 | $— | |||
Accrued discounts/premiums | — | |||
Realized gain/(loss) | — | |||
Change in unrealized appreciation/(depreciation) | — | |||
Purchases | 1,499,955 | |||
Sales | — | |||
Transfers in and/or out of Level 3 | — | |||
Balance as of November 30, 2024 | $1,499,955 | |||
11/30/24 | Valuation Technique(s) | Unobservable Input | Input/Range | Impact to Valuation From an Increase in Input | ||||||||||||
Non-Agency Residential Mortgage-Backed Securities | $1,499,955 | Market Transaction Method | Prior/Recent Transaction | $100.00 | Increase | |||||||||||
30 |
Investments in Securities, at Value | |||||||
Non-Agency Residential Mortgage- Backed Securities | Corporate Bonds | ||||||
Balance as of November 30, 2023 | $— | $1,891,250 | |||||
Accrued discounts/premiums | — | 46,510 | |||||
Realized gain/(loss) | — | — | |||||
Change in unrealized appreciation/(depreciation) | — | (46,510) | |||||
Purchases | — | — | |||||
Sales | — | — | |||||
Transfers in and/or out of Level 3 | 251,328 | — | |||||
Balance as of November 30, 2024 | $251,328 | $1,891,250 | |||||
11/30/24 | Valuation Technique(s) | Unobservable Input | Input/Range | Impact to Valuation From an Increase in Input | ||||||||||||
Corporate Bonds | $1,891,250 | Market Transaction Method | Prior/Recent Transaction | $94.56 | Increase | |||||||||||
Non-Agency Residential Mortgage-Backed Securities | $251,328 | Market Transaction Method | Prior/Recent Transaction | $47.07 | Increase | |||||||||||
31 |
Total Return Fund | Short Duration Fund | |||||||||
Expiration | Amount | Expiration | Amount | |||||||
11/30/27 | $73,492 | 11/30/26 | $23,876 | |||||||
$73,492 | 11/30/27 | 157,175 | ||||||||
$181,051 | ||||||||||
32 |
Non-Government | Government | ||||||||||||
Purchases | Sales | Purchases | Sales | ||||||||||
Total Return Fund | $172,776,969 | $65,701,491 | $2,725 | $10,795 | |||||||||
Short Duration Fund | $262,623,466 | $236,156,795 | $0 | $45,316 | |||||||||
Days Utilized | Average Amount of Borrowing | Weighted Average Borrowing Rate | Interest Expense | Maximum Amount of Borrowing | Date of Maximum Borrowing | ||||||||||||||
Total Return Fund | 35 | $5,396,171 | 8.00% | $41,970 | $8,145,000 | 7/1/2024 | |||||||||||||
SD Fund | 8 | $2,021,125 | 7.71% | $3,464 | $6,903,000 | 9/10/2024 | |||||||||||||
33 |
Total Return Fund | Short Duration Fund | ||||||||||||
Nov. 30, 2024 | Nov. 30, 2023 | Nov. 30, 2024 | Nov. 30, 2023 | ||||||||||
Ordinary income | $15,628,680 | $24,313,098 | $18,804,880 | $14,294,446 | |||||||||
Total Return Fund | Short Duration Fund | ||||||
Cost of investments (a) | $323,294,099 | $274,931,441 | |||||
Gross unrealized appreciation | 5,095,819 | 4,416,429 | |||||
Gross unrealized depreciation | (22,456,640) | (3,703,430) | |||||
Net unrealized appreciation/(depreciation) (a) | (17,360,821) | 712,999 | |||||
Undistributed ordinary income | 478,516 | 436,884 | |||||
Undistributed long-term capital gain | — | — | |||||
Total distributable earnings | 478,516 | 436,884 | |||||
Other accumulated gains/(losses) | (429,275,706) | (26,960,998) | |||||
Total accumulated earnings/(losses) | $(446,158,011) | $(25,811,115) | |||||
(a) | The book basis and tax basis cost are the same in the Short Duration Fund. The difference between book basis and tax basis net unrealized depreciation and cost is attributable primarily to wash sales in the Total Return Fund. The difference between book basis and tax basis distributable earnings are primarily due to losses disallowed and recognized on wash sales, capital loss carryforwards, and tax adjustments to dividends payable. |
Short-Term Indefinite | Long-Term Indefinite | ||||||
Total Return Fund | $208,030,766 | $220,862,783 | |||||
Short Duration Fund | 19,599,231 | 6,950,251 | |||||
34 |
35 |
Fund | Shareholder | Percent of Shares Held | |||||
Total Return Fund | Charles Schwab & Co., Inc. | 34.50% | |||||
Short Duration Fund | Charles Schwab & Co., Inc. | 44.40% | |||||
Outstanding Shares | Total Shares | Voted(1) | |||||
610,254,146.13 | 422,548,104.53 | 69.24% | |||||
(1) | To approve the election of three Trustees to serve until his or her successor is elected and qualified. |
FOR(2) | WITHHOLD | ||||||||||||||||||
Shares Voted | % of Voted Shares | % of Outstanding Shares | Shares Voted | % of Voted Shares | % of Outstanding Shares | ||||||||||||||
(01) Craig Wainscott | 420,753,222.93 | 99.58% | 68.95% | 1,794,881.60 | 0.42% | 0.29% | |||||||||||||
(02) Anne Kritzmire | 420,814,806.36 | 99.59% | 68.96% | 1,733,298.17 | 0.41% | 0.28% | |||||||||||||
(3) Michele Rackey | 419,476,647.18 | 99.27% | 68.74% | 3,071,457.36 | 0.73% | 0.50% | |||||||||||||
(1) | Quorum: |
(2) | Vote Required: |
36 |

37 |
| (b) | Financial Highlights are included within the financial statements filed under Item 7 of this Form. |
Item 8. Changes in and Disagreements with Accountants for Open-End Investment Companies.
There were no changes in or disagreements with accountants during the period covered by this report.
Item 9. Proxy Disclosure for Open-End Investment Companies.
See Item 7(a).
Item 10. Remuneration Paid to Directors, Officers, and Others of Open-End Investment Companies.
See Item 7(a).
Item 11. Statement Regarding Basis for Approval of Investment Advisory Contract.
Not applicable.
Item 12. Disclosure of Proxy Voting Policies and Procedures for Closed-End Management Investment Companies.
Not applicable to open-end investment companies.
Item 13. Portfolio Managers of Closed-End Management Investment Companies.
Not applicable to open-end investment companies.
Item 14. Purchases of Equity Securities by Closed-End Management Investment Company and Affiliated Purchasers.
Not applicable to open-end investment companies.
Item 15. Submission of Matters to a Vote of Security Holders.
There have been no material changes to the procedures by which shareholders may recommend nominees to the Registrant’s Board of Trustees.
Item 16. Controls and Procedures.
| (a) | The Registrant’s Principal Executive Officer and Principal Financial Officer have reviewed the Registrant’s disclosure controls and procedures (as defined in Rule 30a-3(c) under the Investment Company Act of 1940, as amended, (the “Act”)) as of a date within 90 days of the filing of this report, as required by Rule 30a-3(b) under the Act and Rules 13a-15(b) or 15d-15(b) under the Securities Exchange Act of 1934. Based on their review, such officers have concluded that the disclosure controls and procedures are effective in ensuring that information required to be disclosed in this report is appropriately recorded, processed, summarized and reported and made known to them by others within the Registrant and by the Registrant’s service provider. |
| (b) | There were no changes in the Registrant’s internal control over financial reporting (as defined in Rule 30a-3(d) under the Act) that occurred during the period covered by this report that have materially affected, or are reasonably likely to materially affect, the Registrant’s internal control over financial reporting. |
Item 17. Disclosure of Securities Lending Activities for Closed-End Management Investment Companies.
Not applicable to open-end investment companies.
Item 18. Recovery of Erroneously Awarded Compensation.
Not applicable.
Item 19. Exhibits.
(2) Any policy required by the listing standards adopted pursuant to Rule 10D-1 under the Exchange Act (17 CFR 240.10D-1) by the registered national securities exchange or registered national securities association upon which the registrant’s securities are listed. Not applicable.
(4) Any written solicitation to purchase securities under Rule 23c-1 under the Act sent or given during the period covered by the report by or on behalf of the registrant to 10 or more persons. Not applicable.
(5) Change in the registrant’s independent public accountant. Provide the information called for by Item 4 of Form 8-K under the Exchange Act (17 CFR 249.308). Unless otherwise specified by Item 4, or related to and necessary for a complete understanding of information not previously disclosed, the information should relate to events occurring during the reporting period. Not applicable.
| (b) | Certifications pursuant to Section 906 of the Sarbanes-Oxley Act of 2002. Furnished herewith. |
SIGNATURES
Pursuant to the requirements of the Securities Exchange Act of 1934 and the Investment Company Act of 1940, the registrant has duly caused this report to be signed on its behalf by the undersigned, thereunto duly authorized.
| (Registrant) | Advisors Series Trust |
| By (Signature and Title)* | /s/ Jeffrey T. Rauman | ||
| Jeffrey T. Rauman, President/Chief Executive Officer/Principal Executive Officer |
| Date | 2/6/25 |
Pursuant to the requirements of the Securities Exchange Act of 1934 and the Investment Company Act of 1940, this report has been signed below by the following persons on behalf of the registrant and in the capacities and on the dates indicated.
| By (Signature and Title)* | /s/ Jeffrey T. Rauman | ||
| Jeffrey T. Rauman, President/Chief Executive Officer/Principal Executive Officer |
| Date | 2/6/25 |
| By (Signature and Title)* | /s/ Kevin J. Hayden | ||
| Kevin J. Hayden, Vice President/Treasurer/Principal Financial Officer |
| Date | 2/6/25 |
* Print the name and title of each signing officer under his or her signature.