UNITED STATES
SECURITIES AND EXCHANGE COMMISSION
Washington, D.C. 20549
FORM N-CSR
CERTIFIED SHAREHOLDER REPORT OF REGISTERED
MANAGEMENT INVESTMENT COMPANIES
Investment Company Act file Number 811-01807
Value Line Larger Companies Focused Fund, Inc.
(Exact name of registrant as specified in charter)
1605 Main Street, Sarasota, FL 34236
(Address of principal executive offices) (Zip Code)
Registrant’s telephone number, including area code: 212-907-1900
Date of fiscal year end: December 31, 2024
Date of reporting period: December 31, 2024
Item I. Reports to Stockholders.
| | (a) | A copy of the Tailored Shareholder Report to Stockholders for the period ended 12/31/24 is included with this Form. |
Value Line Larger Companies Focused Fund, Inc.
Institutional Class VLLIX
Annual Shareholder Report - December 31, 2024
This annual shareholder report contains important information about Value Line Larger Companies Focused Fund, Inc. (the "Fund") for the period of January 1, 2024 to December 31, 2024. You can find additional information about the Fund at www.vlfunds.com. You can also request this information by contacting us at 1-800-243-2729 or investorservices@vlfunds.com.
What were the Fund costs for last year?
(based on a hypothetical $10,000 investment)
| Class Name | Cost of a $10,000 investment | Costs paid as a percentage of a $10,000 investment |
|---|
| Institutional Class | $101 | 0.89% |
|---|
How did the Fund perform last year?
The Fund's Institutional Class generated a total return of 26.78% during the year ended December 31, 2024.
• The Fund outperformed the S&P 500® Index, attributable primarily to sector allocation. The Fund also benefited from its focus on growth companies, which outperformed value-oriented stocks, and from having positions in all of the Magnificent Seven, the mega-cap stocks that drove equity performance. Stock selection overall detracted, albeit modestly.
• An overweight to information technology and having no allocation to consumer staples contributed positively. Stock selection in information technology and financials also added value. Stock selection in health care, consumer discretionary and industrials detracted.
• Individual stocks contributing most positively to the Fund’s relative results were MicroStrategy, an AI-powered enterprise analytics software and Bitcoin treasury company; NVIDIA, a computer graphics processors maker; and Robinhood Markets, a financial services platform operator—each of which enjoyed a triple-digit share price gain. Out-of-Index holdings in new Fund position MicroStrategy and in Robinhood Markets advanced mostly on Bitcoin’s appreciation. An overweight in NVIDIA benefited from strong AI demand.
• Stocks that detracted most from the Fund’s relative performance were molecular diagnostics company Exact Sciences, semiconductor company Advanced Micro Devices and electric vehicle maker Rivian Automotive—each of which saw a double-digit share price decline. An out-of-Index position in Exact Sciences was negatively affected by execution issues and competitive pressures associated with the launch of its next-gen Cologuard screening test. An overweight to Advanced Micro Devices was impacted by weakness in the communications and industrials markets. An out-of-Index position in Rivian Automotive was volatile, as the company ramped up its production of electric trucks and SUVs while balancing profitability and market dynamics.
Total Return based on a $10,000 Investment
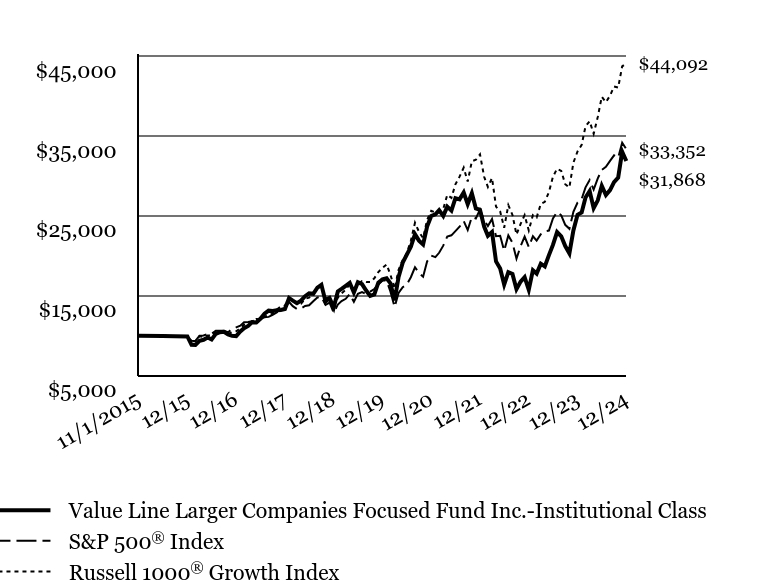
| Value Line Larger Companies Focused Fund Inc.-Institutional Class | S&P 500® Index | Russell 1000® Growth Index |
|---|
| 11/1/2015 | $10,000 | $10,000 | $10,000 |
|---|
| 11/30/2015 | $9,975 | $10,030 | $10,028 |
|---|
| 12/31/2015 | $9,927 | $9,872 | $9,881 |
|---|
| 1/31/2016 | $8,880 | $9,382 | $9,329 |
|---|
| 2/29/2016 | $8,861 | $9,369 | $9,325 |
|---|
| 3/31/2016 | $9,373 | $10,005 | $9,954 |
|---|
| 4/30/2016 | $9,506 | $10,043 | $9,863 |
|---|
| 5/31/2016 | $9,798 | $10,224 | $10,055 |
|---|
| 6/30/2016 | $9,540 | $10,250 | $10,015 |
|---|
| 7/31/2016 | $10,241 | $10,628 | $10,488 |
|---|
| 8/31/2016 | $10,450 | $10,643 | $10,436 |
|---|
| 9/30/2016 | $10,496 | $10,645 | $10,474 |
|---|
| 10/31/2016 | $10,181 | $10,451 | $10,228 |
|---|
| 11/30/2016 | $9,995 | $10,838 | $10,451 |
|---|
| 12/31/2016 | $9,966 | $11,052 | $10,580 |
|---|
| 1/31/2017 | $10,546 | $11,262 | $10,937 |
|---|
| 2/28/2017 | $10,962 | $11,709 | $11,391 |
|---|
| 3/31/2017 | $11,239 | $11,723 | $11,523 |
|---|
| 4/30/2017 | $11,711 | $11,843 | $11,786 |
|---|
| 5/31/2017 | $11,667 | $12,010 | $12,093 |
|---|
| 6/30/2017 | $12,131 | $12,085 | $12,061 |
|---|
| 7/31/2017 | $12,767 | $12,333 | $12,381 |
|---|
| 8/31/2017 | $13,152 | $12,371 | $12,608 |
|---|
| 9/30/2017 | $13,122 | $12,626 | $12,772 |
|---|
| 10/31/2017 | $13,200 | $12,921 | $13,267 |
|---|
| 11/30/2017 | $13,243 | $13,317 | $13,670 |
|---|
| 12/31/2017 | $13,351 | $13,465 | $13,777 |
|---|
| 1/31/2018 | $14,721 | $14,236 | $14,752 |
|---|
| 2/28/2018 | $14,404 | $13,711 | $14,366 |
|---|
| 3/31/2018 | $14,092 | $13,363 | $13,972 |
|---|
| 4/30/2018 | $14,409 | $13,414 | $14,020 |
|---|
| 5/31/2018 | $14,954 | $13,737 | $14,635 |
|---|
| 6/30/2018 | $15,318 | $13,822 | $14,776 |
|---|
| 7/31/2018 | $15,257 | $14,336 | $15,210 |
|---|
| 8/31/2018 | $16,021 | $14,803 | $16,041 |
|---|
| 9/30/2018 | $16,375 | $14,887 | $16,131 |
|---|
| 10/31/2018 | $14,311 | $13,870 | $14,688 |
|---|
| 11/30/2018 | $14,716 | $14,153 | $14,844 |
|---|
| 12/31/2018 | $13,558 | $12,875 | $13,568 |
|---|
| 1/31/2019 | $15,549 | $13,906 | $14,788 |
|---|
| 2/28/2019 | $15,874 | $14,353 | $15,317 |
|---|
| 3/31/2019 | $16,258 | $14,632 | $15,753 |
|---|
| 4/30/2019 | $16,632 | $15,224 | $16,464 |
|---|
| 5/31/2019 | $15,426 | $14,257 | $15,424 |
|---|
| 6/30/2019 | $16,712 | $15,262 | $16,484 |
|---|
| 7/31/2019 | $16,477 | $15,481 | $16,856 |
|---|
| 8/31/2019 | $15,666 | $15,236 | $16,727 |
|---|
| 9/30/2019 | $15,004 | $15,521 | $16,729 |
|---|
| 10/31/2019 | $15,191 | $15,857 | $17,200 |
|---|
| 11/30/2019 | $16,653 | $16,433 | $17,964 |
|---|
| 12/31/2019 | $17,072 | $16,928 | $18,506 |
|---|
| 1/31/2020 | $17,207 | $16,922 | $18,919 |
|---|
| 2/29/2020 | $16,572 | $15,529 | $17,631 |
|---|
| 3/31/2020 | $14,438 | $13,611 | $15,896 |
|---|
| 4/30/2020 | $17,360 | $15,356 | $18,249 |
|---|
| 5/31/2020 | $19,160 | $16,087 | $19,474 |
|---|
| 6/30/2020 | $20,124 | $16,407 | $20,322 |
|---|
| 7/31/2020 | $21,130 | $17,332 | $21,885 |
|---|
| 8/31/2020 | $22,712 | $18,578 | $24,144 |
|---|
| 9/30/2020 | $21,906 | $17,872 | $23,008 |
|---|
| 10/31/2020 | $21,430 | $17,397 | $22,226 |
|---|
| 11/30/2020 | $23,665 | $19,301 | $24,502 |
|---|
| 12/31/2020 | $24,988 | $20,043 | $25,629 |
|---|
| 1/31/2021 | $25,201 | $19,841 | $25,439 |
|---|
| 2/28/2021 | $25,718 | $20,388 | $25,433 |
|---|
| 3/31/2021 | $25,001 | $21,281 | $25,870 |
|---|
| 4/30/2021 | $26,157 | $22,416 | $27,630 |
|---|
| 5/31/2021 | $25,659 | $22,573 | $27,248 |
|---|
| 6/30/2021 | $27,223 | $23,100 | $28,958 |
|---|
| 7/31/2021 | $27,074 | $23,649 | $29,912 |
|---|
| 8/31/2021 | $27,927 | $24,368 | $31,030 |
|---|
| 9/30/2021 | $26,480 | $23,234 | $29,293 |
|---|
| 10/31/2021 | $27,824 | $24,862 | $31,830 |
|---|
| 11/30/2021 | $25,924 | $24,690 | $32,024 |
|---|
| 12/31/2021 | $25,768 | $25,797 | $32,701 |
|---|
| 1/31/2022 | $23,672 | $24,462 | $29,895 |
|---|
| 2/28/2022 | $22,509 | $23,729 | $28,625 |
|---|
| 3/31/2022 | $22,990 | $24,610 | $29,745 |
|---|
| 4/30/2022 | $19,309 | $22,464 | $26,153 |
|---|
| 5/31/2022 | $18,435 | $22,505 | $25,545 |
|---|
| 6/30/2022 | $16,406 | $20,648 | $23,521 |
|---|
| 7/31/2022 | $17,969 | $22,552 | $26,344 |
|---|
| 8/31/2022 | $17,739 | $21,632 | $25,117 |
|---|
| 9/30/2022 | $15,836 | $19,640 | $22,675 |
|---|
| 10/31/2022 | $16,784 | $21,230 | $24,001 |
|---|
| 11/30/2022 | $17,339 | $22,416 | $25,094 |
|---|
| 12/31/2022 | $15,757 | $21,125 | $23,173 |
|---|
| 1/31/2023 | $18,213 | $22,452 | $25,105 |
|---|
| 2/28/2023 | $17,794 | $21,904 | $24,807 |
|---|
| 3/31/2023 | $19,026 | $22,708 | $26,502 |
|---|
| 4/30/2023 | $18,682 | $23,063 | $26,764 |
|---|
| 5/31/2023 | $20,099 | $23,163 | $27,984 |
|---|
| 6/30/2023 | $21,373 | $24,693 | $29,897 |
|---|
| 7/31/2023 | $22,982 | $25,487 | $30,904 |
|---|
| 8/31/2023 | $22,454 | $25,081 | $30,627 |
|---|
| 9/30/2023 | $21,230 | $23,885 | $28,961 |
|---|
| 10/31/2023 | $20,308 | $23,383 | $28,549 |
|---|
| 11/30/2023 | $23,192 | $25,518 | $31,661 |
|---|
| 12/31/2023 | $25,136 | $26,678 | $33,063 |
|---|
| 1/31/2024 | $25,430 | $27,126 | $33,888 |
|---|
| 2/29/2024 | $27,299 | $28,574 | $36,200 |
|---|
| 3/31/2024 | $28,112 | $29,494 | $36,837 |
|---|
| 4/30/2024 | $25,966 | $28,289 | $35,275 |
|---|
| 5/31/2024 | $26,947 | $29,692 | $37,386 |
|---|
| 6/30/2024 | $28,765 | $30,757 | $39,907 |
|---|
| 7/31/2024 | $27,617 | $31,132 | $39,229 |
|---|
| 8/31/2024 | $28,229 | $31,887 | $40,046 |
|---|
| 9/30/2024 | $29,226 | $32,568 | $41,180 |
|---|
| 10/31/2024 | $29,796 | $32,272 | $41,044 |
|---|
| 11/30/2024 | $33,032 | $34,167 | $43,706 |
|---|
| 12/31/2024 | $31,868 | $33,352 | $44,092 |
|---|
The S&P 500® Index is an unmanaged index that is representative of the larger-capitalization stocks traded in the United States.
The Russell 1000® Growth Index is an unmanaged index that is representative of the 1,000 top companies by market capitalization in the United States.
Average Annual Total Returns (%)
| 1 Year | 5 Years | Since InceptionFootnote Reference* |
|---|
| Institutional Class | 26.78% | 13.30% | 13.48% |
|---|
S&P 500® Index | 25.02% | 14.53% | 14.05% |
|---|
Russell 1000® Growth Index | 33.36% | 18.96% | 17.57% |
|---|
The performance data quoted represent past performance and are no guarantee of future performance. The investment return and principal value of an investment will fluctuate so that an investment, when redeemed, may be worth more or less than its original cost. The performance data includes reinvestments of all dividends and distributions but does not reflect the deduction of taxes that a shareholder would pay on fund distributions or the redemption of fund shares.
| Footnote | Description |
Footnote* | 11/01/2015 |
Annual Shareholder Report - December 31, 2024
Value Line Larger Companies Focused Fund, Inc.
| Total Net Assets | $357,495,335 |
|---|
| # of Portfolio Holdings | 37 |
|---|
| Portfolio Turnover Rate | 23% |
|---|
| Total Advisory Fees Paid | $2,537,256 |
|---|
Ten Largest Holdings (% of Net Assets)*
| NVIDIA Corp. | 8.6% |
| Meta Platforms, Inc. | 7.7% |
| Amazon.com, Inc. | 6.0% |
| Uber Technologies, Inc. | 5.0% |
| Advanced Micro Devices, Inc. | 4.5% |
| Netflix, Inc. | 4.0% |
| Alphabet, Inc. | 3.8% |
| MicroStrategy, Inc. | 3.6% |
| Microsoft Corp. | 3.5% |
| Visa, Inc. | 3.4% |
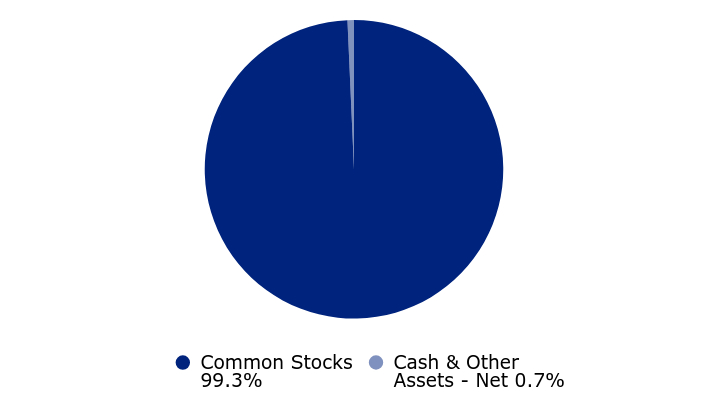
Asset Allocation (% of Net Assets)
| Value | Value |
|---|
| Common Stocks | 99.3% |
| Cash & Other Assets - Net | 0.7% |
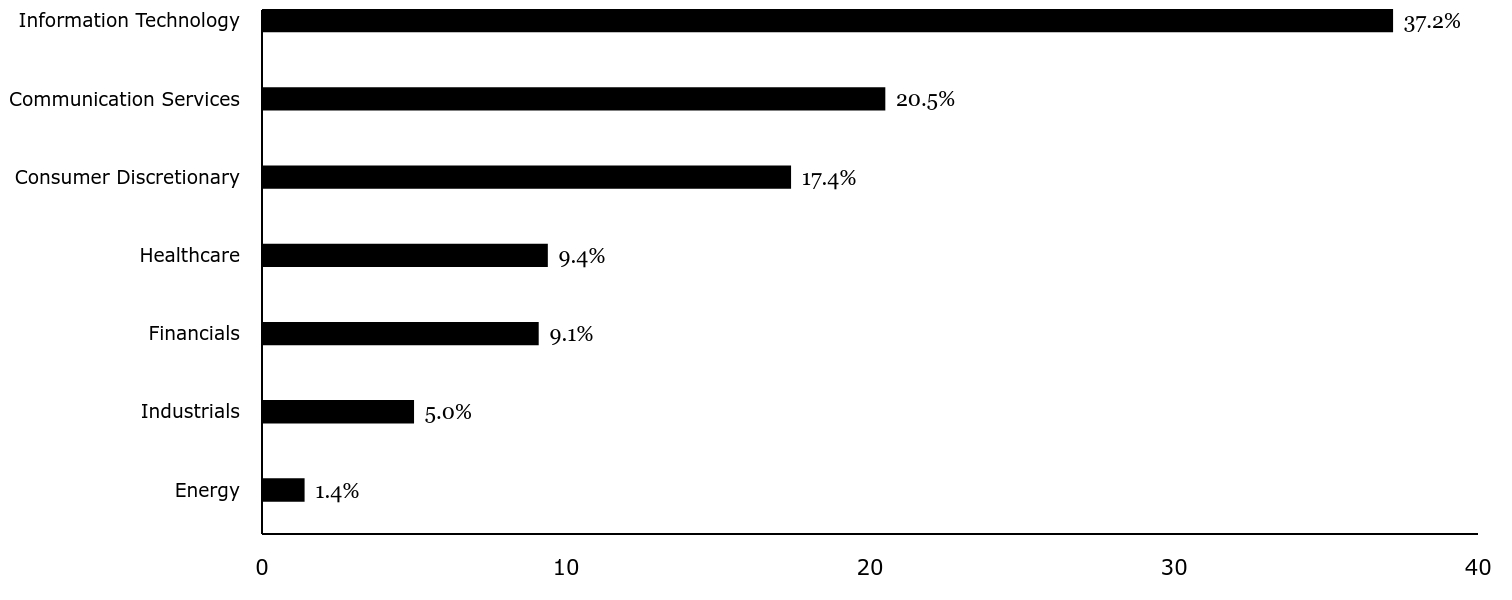
Sector Weightings (% of Total Investments In Securities)*
| Value | Value |
|---|
| Energy | 1.4% |
| Industrials | 5.0% |
| Financials | 9.1% |
| Healthcare | 9.4% |
| Consumer Discretionary | 17.4% |
| Communication Services | 20.5% |
| Information Technology | 37.2% |
* Excludes Short-term Investments, if any.
If you wish to view additional information about the Fund, including but not limited to financial statements or holdings, please scan the QR code, visit www.vlfunds.com, email investorservices@vlfunds.com, or call us at 800-243-2729.
Value Line Larger Companies Focused Fund, Inc.
Annual Shareholder Report
December 31, 2024
Value Line Larger Companies Focused Fund, Inc.
Annual Shareholder Report - December 31, 2024
This annual shareholder report contains important information about Value Line Larger Companies Focused Fund, Inc. (the "Fund") for the period of January 1, 2024 to December 31, 2024. You can find additional information about the Fund at www.vlfunds.com. You can also request this information by contacting us at 1-800-243-2729 or investorservices@vlfunds.com.
What were the Fund costs for last year?
(based on a hypothetical $10,000 investment)
| Class Name | Cost of a $10,000 investment | Costs paid as a percentage of a $10,000 investment |
|---|
| Investor Class | $129 | 1.14% |
|---|
How did the Fund perform last year?
The Fund's Investor Class generated a total return of 26.49% during the year ended December 31, 2024.
• The Fund outperformed the S&P 500® Index, attributable primarily to sector allocation. The Fund also benefited from its focus on growth companies, which outperformed value-oriented stocks, and from having positions in all of the Magnificent Seven, the mega-cap stocks that drove equity performance. Stock selection overall detracted, albeit modestly.
• An overweight to information technology and having no allocation to consumer staples contributed positively. Stock selection in information technology and financials also added value. Stock selection in health care, consumer discretionary and industrials detracted.
• Individual stocks contributing most positively to the Fund’s relative results were MicroStrategy, an AI-powered enterprise analytics software and Bitcoin treasury company; NVIDIA, a computer graphics processors maker; and Robinhood Markets, a financial services platform operator—each of which enjoyed a triple-digit share price gain. Out-of-Index holdings in new Fund position MicroStrategy and in Robinhood Markets advanced mostly on Bitcoin’s appreciation. An overweight in NVIDIA benefited from strong AI demand.
• Stocks that detracted most from the Fund’s relative performance were molecular diagnostics company Exact Sciences, semiconductor company Advanced Micro Devices and electric vehicle maker Rivian Automotive—each of which saw a double-digit share price decline. An out-of-Index position in Exact Sciences was negatively affected by execution issues and competitive pressures associated with the launch of its next-gen Cologuard screening test. An overweight to Advanced Micro Devices was impacted by weakness in the communications and industrials markets. An out-of-Index position in Rivian Automotive was volatile, as the company ramped up its production of electric trucks and SUVs while balancing profitability and market dynamics.
Total Return based on a $10,000 Investment
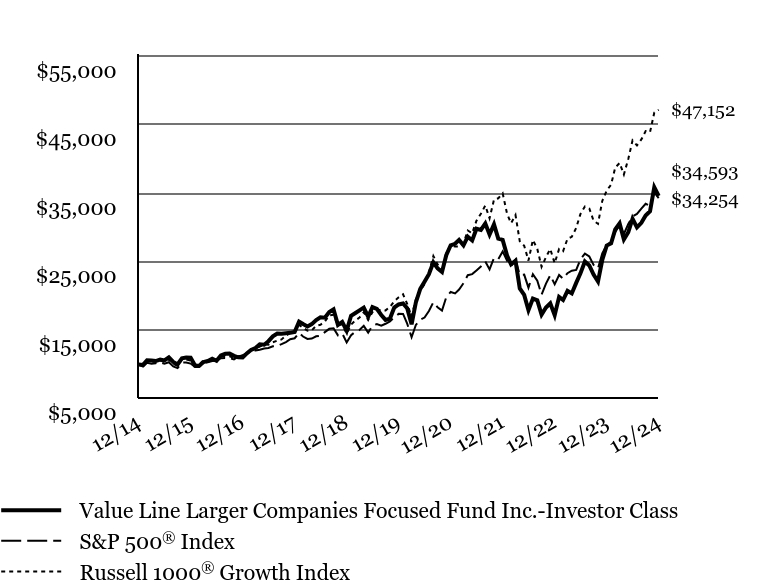
| Value Line Larger Companies Focused Fund Inc.-Investor Class | S&P 500® Index | Russell 1000® Growth Index |
|---|
| 12/14 | $10,000 | $10,000 | $10,000 |
|---|
| 01/15 | $9,941 | $9,700 | $9,847 |
|---|
| 02/15 | $10,609 | $10,257 | $10,503 |
|---|
| 03/15 | $10,578 | $10,095 | $10,384 |
|---|
| 04/15 | $10,498 | $10,192 | $10,436 |
|---|
| 05/15 | $10,724 | $10,323 | $10,583 |
|---|
| 06/15 | $10,597 | $10,123 | $10,396 |
|---|
| 07/15 | $11,044 | $10,335 | $10,749 |
|---|
| 08/15 | $10,364 | $9,712 | $10,096 |
|---|
| 09/15 | $9,996 | $9,471 | $9,846 |
|---|
| 10/15 | $10,894 | $10,270 | $10,694 |
|---|
| 11/15 | $11,013 | $10,301 | $10,724 |
|---|
| 12/15 | $10,988 | $10,138 | $10,567 |
|---|
| 01/16 | $9,845 | $9,635 | $9,977 |
|---|
| 02/16 | $9,807 | $9,622 | $9,973 |
|---|
| 03/16 | $10,368 | $10,275 | $10,645 |
|---|
| 04/16 | $10,515 | $10,315 | $10,548 |
|---|
| 05/16 | $10,841 | $10,500 | $10,753 |
|---|
| 06/16 | $10,553 | $10,527 | $10,711 |
|---|
| 07/16 | $11,323 | $10,915 | $11,216 |
|---|
| 08/16 | $11,557 | $10,931 | $11,160 |
|---|
| 09/16 | $11,603 | $10,933 | $11,201 |
|---|
| 10/16 | $11,256 | $10,733 | $10,938 |
|---|
| 11/16 | $11,046 | $11,131 | $11,176 |
|---|
| 12/16 | $11,015 | $11,351 | $11,314 |
|---|
| 01/17 | $11,655 | $11,566 | $11,696 |
|---|
| 02/17 | $12,109 | $12,025 | $12,182 |
|---|
| 03/17 | $12,415 | $12,039 | $12,322 |
|---|
| 04/17 | $12,935 | $12,163 | $12,604 |
|---|
| 05/17 | $12,888 | $12,334 | $12,932 |
|---|
| 06/17 | $13,399 | $12,411 | $12,898 |
|---|
| 07/17 | $14,097 | $12,666 | $13,241 |
|---|
| 08/17 | $14,522 | $12,705 | $13,483 |
|---|
| 09/17 | $14,484 | $12,967 | $13,659 |
|---|
| 10/17 | $14,570 | $13,270 | $14,188 |
|---|
| 11/17 | $14,613 | $13,677 | $14,619 |
|---|
| 12/17 | $14,737 | $13,829 | $14,733 |
|---|
| 01/18 | $16,239 | $14,621 | $15,776 |
|---|
| 02/18 | $15,894 | $14,082 | $15,363 |
|---|
| 03/18 | $15,549 | $13,724 | $14,941 |
|---|
| 04/18 | $15,889 | $13,777 | $14,994 |
|---|
| 05/18 | $16,491 | $14,108 | $15,651 |
|---|
| 06/18 | $16,887 | $14,195 | $15,801 |
|---|
| 07/18 | $16,820 | $14,724 | $16,265 |
|---|
| 08/18 | $17,658 | $15,203 | $17,155 |
|---|
| 09/18 | $18,044 | $15,290 | $17,251 |
|---|
| 10/18 | $15,771 | $14,245 | $15,708 |
|---|
| 11/18 | $16,213 | $14,535 | $15,875 |
|---|
| 12/18 | $14,929 | $13,223 | $14,510 |
|---|
| 01/19 | $17,120 | $14,282 | $15,814 |
|---|
| 02/19 | $17,480 | $14,741 | $16,380 |
|---|
| 03/19 | $17,898 | $15,027 | $16,846 |
|---|
| 04/19 | $18,305 | $15,636 | $17,607 |
|---|
| 05/19 | $16,973 | $14,642 | $16,495 |
|---|
| 06/19 | $18,381 | $15,674 | $17,628 |
|---|
| 07/19 | $18,122 | $15,899 | $18,026 |
|---|
| 08/19 | $17,226 | $15,648 | $17,888 |
|---|
| 09/19 | $16,502 | $15,940 | $17,890 |
|---|
| 10/19 | $16,696 | $16,286 | $18,394 |
|---|
| 11/19 | $18,305 | $16,877 | $19,210 |
|---|
| 12/19 | $18,762 | $17,386 | $19,790 |
|---|
| 01/20 | $18,905 | $17,379 | $20,232 |
|---|
| 02/20 | $18,203 | $15,949 | $18,854 |
|---|
| 03/20 | $15,858 | $13,979 | $17,000 |
|---|
| 04/20 | $19,054 | $15,771 | $19,515 |
|---|
| 05/20 | $21,029 | $16,522 | $20,825 |
|---|
| 06/20 | $22,081 | $16,850 | $21,732 |
|---|
| 07/20 | $23,179 | $17,801 | $23,404 |
|---|
| 08/20 | $24,914 | $19,080 | $25,819 |
|---|
| 09/20 | $24,024 | $18,355 | $24,604 |
|---|
| 10/20 | $23,498 | $17,867 | $23,769 |
|---|
| 11/20 | $25,947 | $19,823 | $26,203 |
|---|
| 12/20 | $27,389 | $20,585 | $27,408 |
|---|
| 01/21 | $27,610 | $20,377 | $27,205 |
|---|
| 02/21 | $28,175 | $20,939 | $27,199 |
|---|
| 03/21 | $27,389 | $21,856 | $27,666 |
|---|
| 04/21 | $28,646 | $23,022 | $29,548 |
|---|
| 05/21 | $28,096 | $23,183 | $29,140 |
|---|
| 06/21 | $29,803 | $23,724 | $30,968 |
|---|
| 07/21 | $29,631 | $24,288 | $31,988 |
|---|
| 08/21 | $30,567 | $25,026 | $33,184 |
|---|
| 09/21 | $28,967 | $23,863 | $31,326 |
|---|
| 10/21 | $30,439 | $25,534 | $34,039 |
|---|
| 11/21 | $28,353 | $25,357 | $34,247 |
|---|
| 12/21 | $28,180 | $26,494 | $34,971 |
|---|
| 01/22 | $25,883 | $25,123 | $31,970 |
|---|
| 02/22 | $24,612 | $24,371 | $30,612 |
|---|
| 03/22 | $25,129 | $25,276 | $31,809 |
|---|
| 04/22 | $21,094 | $23,071 | $27,968 |
|---|
| 05/22 | $20,142 | $23,114 | $27,318 |
|---|
| 06/22 | $17,920 | $21,206 | $25,154 |
|---|
| 07/22 | $19,617 | $23,161 | $28,173 |
|---|
| 08/22 | $19,363 | $22,217 | $26,861 |
|---|
| 09/22 | $17,280 | $20,170 | $24,249 |
|---|
| 10/22 | $18,313 | $21,804 | $25,667 |
|---|
| 11/22 | $18,920 | $23,022 | $26,836 |
|---|
| 12/22 | $17,194 | $21,696 | $24,782 |
|---|
| 01/23 | $19,862 | $23,059 | $26,847 |
|---|
| 02/23 | $19,407 | $22,496 | $26,528 |
|---|
| 03/23 | $20,746 | $23,322 | $28,342 |
|---|
| 04/23 | $20,364 | $23,686 | $28,621 |
|---|
| 05/23 | $21,908 | $23,789 | $29,926 |
|---|
| 06/23 | $23,294 | $25,361 | $31,972 |
|---|
| 07/23 | $25,032 | $26,176 | $33,050 |
|---|
| 08/23 | $24,447 | $25,759 | $32,753 |
|---|
| 09/23 | $23,117 | $24,531 | $30,972 |
|---|
| 10/23 | $22,103 | $24,015 | $30,531 |
|---|
| 11/23 | $25,237 | $26,208 | $33,859 |
|---|
| 12/23 | $27,348 | $27,399 | $35,358 |
|---|
| 01/24 | $27,664 | $27,859 | $36,240 |
|---|
| 02/24 | $29,691 | $29,347 | $38,713 |
|---|
| 03/24 | $30,575 | $30,291 | $39,394 |
|---|
| 04/24 | $28,231 | $29,054 | $37,723 |
|---|
| 05/24 | $29,291 | $30,494 | $39,981 |
|---|
| 06/24 | $31,263 | $31,589 | $42,677 |
|---|
| 07/24 | $30,007 | $31,973 | $41,951 |
|---|
| 08/24 | $30,668 | $32,749 | $42,825 |
|---|
| 09/24 | $31,737 | $33,448 | $44,038 |
|---|
| 10/24 | $32,351 | $33,145 | $43,893 |
|---|
| 11/24 | $35,856 | $35,090 | $46,740 |
|---|
| 12/24 | $34,593 | $34,254 | $47,152 |
|---|
The S&P 500® Index is an unmanaged index that is representative of the larger-capitalization stocks traded in the United States.
The Russell 1000® Growth Index is an unmanaged index that is representative of the 1,000 top companies by market capitalization in the United States.
Average Annual Total Returns (%)
| 1 Year | 5 Years | 10 Years |
|---|
| Investor Class | 26.49% | 13.02% | 13.21% |
|---|
S&P 500® Index | 25.02% | 14.53% | 13.10% |
|---|
Russell 1000® Growth Index | 33.36% | 18.96% | 16.78% |
|---|
The performance data quoted represent past performance and are no guarantee of future performance. The investment return and principal value of an investment will fluctuate so that an investment, when redeemed, may be worth more or less than its original cost. The performance data includes reinvestments of all dividends and distributions but does not reflect the deduction of taxes that a shareholder would pay on fund distributions or the redemption of fund shares.
Annual Shareholder Report - December 31, 2024
Value Line Larger Companies Focused Fund, Inc.
| Total Net Assets | $357,495,335 |
|---|
| # of Portfolio Holdings | 37 |
|---|
| Portfolio Turnover Rate | 23% |
|---|
| Total Advisory Fees Paid | $2,537,256 |
|---|
Ten Largest Holdings (% of Net Assets)*
| NVIDIA Corp. | 8.6% |
| Meta Platforms, Inc. | 7.7% |
| Amazon.com, Inc. | 6.0% |
| Uber Technologies, Inc. | 5.0% |
| Advanced Micro Devices, Inc. | 4.5% |
| Netflix, Inc. | 4.0% |
| Alphabet, Inc. | 3.8% |
| MicroStrategy, Inc. | 3.6% |
| Microsoft Corp. | 3.5% |
| Visa, Inc. | 3.4% |
Asset Allocation (% of Net Assets)
| Value | Value |
|---|
| Common Stocks | 99.3% |
| Cash & Other Assets - Net | 0.7% |
Sector Weightings (% of Total Investments In Securities)*
| Value | Value |
|---|
| Energy | 1.4% |
| Industrials | 5.0% |
| Financials | 9.1% |
| Healthcare | 9.4% |
| Consumer Discretionary | 17.4% |
| Communication Services | 20.5% |
| Information Technology | 37.2% |
* Excludes Short-term Investments, if any.
If you wish to view additional information about the Fund, including but not limited to financial statements or holdings, please scan the QR code, visit www.vlfunds.com, email investorservices@vlfunds.com, or call us at 800-243-2729.
Value Line Larger Companies Focused Fund, Inc.
Annual Shareholder Report
December 31, 2024
(b) Not Applicable
Item 2 Code of Ethics
(a) The Registrant has adopted a Code of Ethics that applies to its principal executive officer and principal financial officer.
(f) Pursuant to item 12(a), the Registrant is attaching as an exhibit a copy of its Code of Ethics that applies to its principal executive officer and principal financial officer.
Item 3. Audit Committee Financial Expert
(a)(1)The Registrant has an Audit Committee Financial Expert serving on its Audit Committee.
(2) The Registrant’s Board has designated James Hillman, member of the Registrant’s Audit Committee, as the Registrant’s Audit Committee Financial Expert. Mr. Hillman is an independent director.
A person who is designated as an “audit committee financial expert” shall not make such person an “expert” for any purpose, including without limitation under Section 11 of the Securities Act of 1933 or under applicable fiduciary laws, as a result of being designated or identified as an audit committee financial expert. The designation or identification of a person as an audit committee financial expert does not impose on such person any duties, obligations, or liabilities that are greater than the duties, obligations, and liabilities imposed on such person as a member of the audit committee and Board of Trustees in the absence of such designation or identification.
Item 4. Principal Accountant Fees and Services
(a) Audit Fees 2024 - $29,315
Audit Fees 2023 - $27,727
(b) Audit-Related fees – None.
(c) Tax Preparation Fees 2024 - $0
Tax Preparation Fees 2023 - $0
(d) All Other Fees – None
(e) (1) Disclose the audit committee’s pre-approval policies and procedures described in paragraph (c)(7) of Rule 2-01 of Regulation S-X
The Value Line Larger Companies Focused Fund, Inc. (the “Fund”) Board has adopted policies and procedures with regard to the pre-approval of services provided by the Audit firm. Audit, audit-related and tax compliance services provided to the Fund on an annual basis require specific pre-approval by the Board. As noted above, the Board must also approve other non-audit services provided to the Fund and those non-audit services provided to the Fund’s Affiliate Service Providers that related directly to the operations and financial reporting of the Fund. Certain of these non-audit services that the Board believes are a) consistent with the SEC’s auditor independence rules and b) routine and recurring services that will not impair the independence of the independent auditors may be approved by the Board.
General Audit Committee Approval Policy:
Potential services by the auditors will be classified by officers of the Fund and the auditors into the four non-restricted service categories denoted above and this “Approval of Audit, Audit-Related, Tax and Other Services” Policy above will be applied. Any services outside the specific pre-approved service subcategories set forth in this Policy must be specifically approved by the Audit Committee (or such member or members of the Audit Committee as the Audit Committee may authorize to grant such approval).
At least sem-annually, the Audit Committee shall review a report summarizing the services by service category, including fees, provided by the Audit firm as set forth in the above policy.
(e) (2) Not applicable.
(f) Not applicable.
(g) Aggregate Non-Audit Fees 2024 -$0
Aggregate Non-Audit Fees 2023 -$0
(h) Not applicable.
Item 5. Audit Committee of Listed Registrants
Not Applicable.
Item 6. Investments
Not Applicable
Item 7. Financial Statements
| | (a) | A copy of the Annual Financial Statements and Other Information for the period ended 12/31/24 is included with this Form. |
Annual Financial Statements and Other Information |
|
|
Value Line Small Cap Opportunities Fund, Inc. |
|
Institutional Class (VLEIX) |
Value Line Mid Cap Focused Fund, Inc. |
|
Institutional Class (VLMIX) |
Value Line Select Growth Fund, Inc. |
|
Institutional Class (VILSX) |
Value Line Larger Companies Focused Fund, Inc. |
|
Institutional Class (VLLIX) |
Value Line Asset Allocation Fund, Inc. |
|
Institutional Class (VLAIX) |
Value Line Capital Appreciation Fund, Inc. |
|
Institutional Class (VLIIX) |
Value Line Core Bond Fund |
|
Go Paperless
VLFunds.com/edelivery
This audited report is issued for information to shareholders. It is not authorized for distribution to prospective investors unless preceded or accompanied by a currently effective prospectus of the Fund (obtainable from the Distributor).
Value Line Small Cap Opportunities Fund, Inc.
| | |
|
CONSUMER DISCRETIONARY 8.6% |
| |
| | |
| ENGINEERING & CONSTRUCTION 1.0% |
| | |
| |
| | |
| |
| Cavco Industries, Inc.(1) | |
| |
| Group 1 Automotive, Inc.(2) | |
| | |
| | |
| | |
| | |
|
| |
| J & J Snack Foods Corp.(2) | |
| | |
| | |
|
| |
| First Financial Bankshares, Inc. | |
| | |
| | |
| DIVERSIFIED FINANCIALS 1.5% |
| | |
| |
| | |
| | |
| | |
| Selective Insurance Group, Inc. | |
| | |
| | |
|
| |
| Merit Medical Systems, Inc.(1) | |
| |
| | |
| | |
| Medpace Holdings, Inc.(1) | |
| U.S. Physical Therapy, Inc. | |
| | |
| | |
|
| |
| | |
| Lennox International, Inc. | |
| | |
| | |
| | |
COMMON STOCKS 96.9% (continued) |
INDUSTRIALS 46.2% (continued) |
| |
| | |
| | |
| | |
| | |
| |
| CACI International, Inc. Class A(1) | |
| ExlService Holdings, Inc.(1) | |
| Science Applications International Corp. | |
| | |
| DISTRIBUTION/WHOLESALE 2.2% |
| Rush Enterprises, Inc. Class A | |
| SiteOne Landscape Supply, Inc.(1) | |
| | |
| ELECTRICAL EQUIPMENT 1.5% |
| | |
| |
| | |
| ENGINEERING & CONSTRUCTION 8.9% |
| Comfort Systems USA, Inc. | |
| | |
| | |
| | |
| |
| Franklin Electric Co., Inc. | |
| | |
| | |
| MACHINERY - DIVERSIFIED 5.6% |
| Applied Industrial Technologies, Inc. | |
| | |
| Watts Water Technologies, Inc. Class A | |
| | |
| METAL FABRICATE/HARDWARE 2.2% |
| | |
| MISCELLANEOUS MANUFACTURERS 4.4% |
| | |
| | |
| | |
| | |
| |
| | |
| |
| | |
| | |
INFORMATION TECHNOLOGY 16.4% |
| |
| | |
| | |
| Insight Enterprises, Inc.(1)(2) | |
See Notes to Financial Statements.
Schedule of Investments (continued)
| | |
COMMON STOCKS 96.9% (continued) |
INFORMATION TECHNOLOGY 16.4% (continued) |
| COMPUTERS 2.2% (continued) |
| | |
| | |
| ELECTRICAL EQUIPMENT 0.1% |
| | |
| |
| | |
| | |
| | |
| |
| | |
| MISCELLANEOUS MANUFACTURERS 2.1% |
| | |
| |
| MACOM Technology Solutions Holdings, Inc.(1) | |
| |
| | |
| Appfolio, Inc. Class A(1) | |
| | |
| | |
| | |
| | |
|
| |
| | |
| |
| Carpenter Technology Corp. | |
| PACKAGING & CONTAINERS 1.8% |
| | |
| | |
| | |
| | |
| | |
COMMON STOCKS 96.9% (continued) |
|
| |
| American States Water Co. | |
TOTAL COMMON STOCKS
(Cost $382,974,739) | |
SHORT-TERM INVESTMENTS 4.0% |
| |
| State Street Institutional U.S. Government Money Market Fund, Premier Class, 4.43%(3) | |
| State Street Navigator Securities Lending Government Money Market Portfolio(4) | |
| | |
TOTAL SHORT-TERM INVESTMENTS
(Cost $28,837,794) | |
TOTAL INVESTMENTS IN SECURITIES 100.9%
(Cost $411,812,533) | |
EXCESS OF LIABILITIES OVER CASH AND OTHER ASSETS (0.9)% | |
| |
| |
| A portion or all of the security was held on loan. As of December 31, 2024, the market value of the securities on loan was $41,543,670. |
| Rate reflects 7 day yield as of December 31, 2024. |
| Securities with an aggregate market value of $41,543,670 were out on loan in exchange for collateral including $6,383,124 of cash collateral as of December 31, 2024. The collateral was invested in a cash collateral reinvestment vehicle. See Note 1(K). |
The following table summarizes the inputs used to value the Fund's investments in securities as of December 31, 2024 (See Note 1(B)):
Investments in Securities: | | | | |
| | | | |
| | | | |
| | | | |
Total Investments in Securities | | | | |
| See Schedule of Investments for further breakdown by category. |
See Notes to Financial Statements.
Value Line Mid Cap Focused Fund, Inc.
| | |
|
CONSUMER DISCRETIONARY 4.0% |
| DISTRIBUTION/WHOLESALE 2.7% |
| | |
| |
| | |
| | |
|
| |
| | |
| |
| Casey's General Stores, Inc. | |
| | |
|
| |
| American Financial Group, Inc. | |
| | |
| | |
| | |
| |
| Jack Henry & Associates, Inc. | |
| | |
| | |
| | |
|
| |
| Mettler-Toledo International, Inc.(1) | |
| |
| IDEXX Laboratories, Inc.(1) | |
| | |
| West Pharmaceutical Services, Inc. | |
| | |
| |
| | |
| | |
| | |
| | |
| | |
|
| |
| | |
| | |
| | |
| |
| Lennox International, Inc.(2) | |
| |
| | |
| | |
| | |
| |
| CACI International, Inc. Class A(1) | |
| | |
COMMON STOCKS 97.1% (continued) |
INDUSTRIALS 28.4% (continued) |
| DISTRIBUTION/WHOLESALE 1.2% |
| | |
| ENGINEERING & CONSTRUCTION 2.3% |
| Comfort Systems USA, Inc. | |
| | |
| | |
| ENVIRONMENTAL CONTROL 6.3% |
| | |
| | |
| | |
| | |
INFORMATION TECHNOLOGY 29.8% |
| |
| | |
| | |
| | |
| | |
| |
| | |
| MISCELLANEOUS MANUFACTURERS 1.0% |
| Teledyne Technologies, Inc.(1) | |
| |
| Monolithic Power Systems, Inc. | |
| |
| | |
| Cadence Design Systems, Inc.(1) | |
| | |
| | |
| Tyler Technologies, Inc.(1) | |
| | |
| |
| | |
| | |
| | |
| | |
|
| PACKAGING & CONTAINERS 2.1% |
| | |
TOTAL COMMON STOCKS
(Cost $1,481,623,667) | |
SHORT-TERM INVESTMENTS 3.2% |
| |
| State Street Institutional U.S. Government Money Market Fund, Premier Class, 4.43%(3) | |
See Notes to Financial Statements.
Schedule of Investments (continued)
| | |
SHORT-TERM INVESTMENTS 3.2% (continued) |
| MONEY MARKET FUNDS 3.2% (continued) |
| State Street Navigator Securities Lending Government Money Market Portfolio(4) | |
| | |
TOTAL SHORT-TERM INVESTMENTS
(Cost $61,061,149) | |
TOTAL INVESTMENTS IN SECURITIES 100.3%
(Cost $1,542,684,816) | |
EXCESS OF LIABILITIES OVER CASH AND OTHER ASSETS (0.3)% | |
| |
| |
| A portion or all of the security was held on loan. As of December 31, 2024, the market value of the securities on loan was $4,508,537. |
| Rate reflects 7 day yield as of December 31, 2024. |
| Securities with an aggregate market value of $4,508,537 were out on loan in exchange for collateral including $1,394,942 of cash collateral as of December 31, 2024. The collateral was invested in a cash collateral reinvestment vehicle. See Note 1(K). |
| American Depositary Receipt. |
The following table summarizes the inputs used to value the Fund's investments in securities as of December 31, 2024 (See Note 1(B)):
Investments in Securities: | | | | |
| | | | |
| | | | |
| | | | |
Total Investments in Securities | | | | |
| See Schedule of Investments for further breakdown by category. |
See Notes to Financial Statements.
Value Line Select Growth Fund, Inc.
| | |
|
|
| |
| | |
|
| |
| | |
| DIVERSIFIED FINANCIALS 6.8% |
| Intercontinental Exchange, Inc. | |
| | |
| | |
| |
| | |
| Marsh & McLennan Cos., Inc. | |
| | |
| | |
| |
| | |
| | |
|
| HEALTHCARE PRODUCTS 13.1% |
| | |
| IDEXX Laboratories, Inc.(1) | |
| | |
| Thermo Fisher Scientific, Inc. | |
| | |
| |
| | |
| | |
|
| |
| | |
| |
| | |
| |
| | |
| ENVIRONMENTAL CONTROL 7.4% |
| | |
| | |
COMMON STOCKS 98.4% (continued) |
INDUSTRIALS 25.1% (continued) |
| ENVIRONMENTAL CONTROL 7.4% (continued) |
| | |
| | |
| | |
INFORMATION TECHNOLOGY 32.7% |
| |
| | |
| |
| | |
| Cadence Design Systems, Inc.(1) | |
| | |
| | |
| | |
| | |
| | |
| |
| | |
| | |
|
| |
| | |
TOTAL COMMON STOCKS
(Cost $187,634,705) | |
SHORT-TERM INVESTMENTS 1.7% |
| |
| State Street Institutional U.S. Government Money Market Fund, Premier Class, 4.43%(2) | |
TOTAL SHORT-TERM INVESTMENTS
(Cost $7,253,422) | |
TOTAL INVESTMENTS IN SECURITIES 100.1%
(Cost $194,888,127) | |
EXCESS OF LIABILITIES OVER CASH AND OTHER ASSETS (0.1)% | |
| |
| |
| Rate reflects 7 day yield as of December 31, 2024. |
The following table summarizes the inputs used to value the Fund's investments in securities as of December 31, 2024 (See Note 1(B)):
Investments in Securities: | | | | |
| | | | |
| | | | |
| | | | |
Total Investments in Securities | | | | |
| See Schedule of Investments for further breakdown by category. |
See Notes to Financial Statements.
Value Line Larger Companies Focused Fund, Inc.
| | |
|
COMMUNICATION SERVICES 20.3% |
| |
| | |
| | |
| Meta Platforms, Inc. Class A | |
| | |
| | |
| | |
| | |
CONSUMER DISCRETIONARY 17.3% |
| |
| Rivian Automotive, Inc. Class A(1)(2) | |
| | |
| | |
| |
| DraftKings, Inc. Class A(1) | |
| |
| | |
| | |
| | |
| |
| Chipotle Mexican Grill, Inc.(1) | |
| Lululemon Athletica, Inc.(1) | |
| | |
| | |
|
| |
| | |
|
| DIVERSIFIED FINANCIALS 6.0% |
| Coinbase Global, Inc. Class A(1) | |
| | |
| | |
| |
| Robinhood Markets, Inc. Class A(1) | |
| | |
|
| |
| BioMarin Pharmaceutical, Inc.(1) | |
| | |
| Vertex Pharmaceuticals, Inc.(1) | |
| | |
| |
| Exact Sciences Corp.(1)(2) | |
| |
| | |
| | |
|
| |
| Uber Technologies, Inc.(1) | |
| | |
COMMON STOCKS 99.3% (continued) |
INFORMATION TECHNOLOGY 36.9% |
| |
| | |
| Crowdstrike Holdings, Inc. Class A(1) | |
| | |
| |
| | |
| |
| Advanced Micro Devices, Inc.(1) | |
| | |
| | |
| | |
| |
| | |
| | |
| MicroStrategy, Inc. Class A(1)(2) | |
| | |
| | |
| | |
| | |
| | |
TOTAL COMMON STOCKS
(Cost $175,532,333) | |
SHORT-TERM INVESTMENTS 1.0% |
| |
| State Street Institutional U.S. Government Money Market Fund, Premier Class, 4.43%(3) | |
| State Street Navigator Securities Lending Government Money Market Portfolio(4) | |
| | |
TOTAL SHORT-TERM INVESTMENTS
(Cost $3,447,393) | |
TOTAL INVESTMENTS IN SECURITIES 100.3%
(Cost $178,979,726) | |
EXCESS OF LIABILITIES OVER CASH AND OTHER ASSETS (0.3)% | |
| |
| |
| A portion or all of the security was held on loan. As of December 31, 2024, the market value of the securities on loan was $30,376,646. |
| Rate reflects 7 day yield as of December 31, 2024. |
| Securities with an aggregate market value of $30,376,646 were out on loan in exchange for collateral including $196,448 of cash collateral as of December 31, 2024. The collateral was invested in a cash collateral reinvestment vehicle. See Note 1(K). |
See Notes to Financial Statements.
The following table summarizes the inputs used to value the Fund's investments in securities as of December 31, 2024 (See Note 1(B)):
Investments in Securities: | | | | |
| | | | |
| | | | |
| | | | |
Total Investments in Securities | | | | |
| See Schedule of Investments for further breakdown by category. |
See Notes to Financial Statements.
Value Line Asset Allocation Fund, Inc.
| | |
|
CONSUMER DISCRETIONARY 1.3% |
| DISTRIBUTION/WHOLESALE 1.3% |
| | |
|
| |
| | |
|
| |
| | |
| DIVERSIFIED FINANCIALS 3.0% |
| Intercontinental Exchange, Inc. | |
| |
| American Financial Group, Inc. | |
| Marsh & McLennan Cos., Inc. | |
| | |
| | |
| | |
| |
| | |
| | |
|
| |
| IDEXX Laboratories, Inc.(1) | |
| | |
| | |
| |
| | |
| |
| | |
| | |
|
| |
| | |
| | |
| | |
| |
| Lennox International, Inc. | |
| |
| | |
| DISTRIBUTION/WHOLESALE 0.3% |
| | |
| ENGINEERING & CONSTRUCTION 0.4% |
| | |
| ENVIRONMENTAL CONTROL 4.3% |
| | |
| | |
| | |
| | |
INFORMATION TECHNOLOGY 27.1% |
| |
| | |
| | |
COMMON STOCKS 65.0% (continued) |
INFORMATION TECHNOLOGY 27.1% (continued) |
| COMPUTERS 5.3% (continued) |
| | |
| | |
| | |
| | |
| |
| | |
| |
| | |
| Cadence Design Systems, Inc.(1) | |
| | |
| | |
| | |
| | |
| | |
| Tyler Technologies, Inc.(1) | |
| | |
| |
| | |
| | |
TOTAL COMMON STOCKS
(Cost $284,653,328) | |
| | |
COLLATERALIZED MORTGAGE OBLIGATIONS 0.6% |
| FHLMC, Series 2023-DNA1, Class M1A, REMIC, (30 day USD SOFR Average + 2.10%), 6.66%, 3/25/43(3)(4) | |
| FNMA, Series 2023-R02, Class 1M1, (30 day USD SOFR Average + 2.30%), 6.87%, 1/25/43(3)(4) | |
| FNMA, Series 2023-R04, Class 1M1, (30 day USD SOFR Average + 2.30%), 6.86%, 5/25/43(3)(4) | |
TOTAL COLLATERALIZED MORTGAGE OBLIGATIONS
(Cost $5,009,723) | |
COMMERCIAL MORTGAGE-BACKED SECURITIES 0.6% |
| FHLMC Multifamily Structured Pass-Through Certificates, Series K055, Class A2, 2.67%, 3/25/26 | |
| FHLMC Multifamily Structured Pass-Through Certificates, Series K064, Class A2, 3.22%, 3/25/27 | |
| FHLMC Multifamily Structured Pass-Through Certificates, Series K084, Class A2, 3.78%, 10/25/28(4) | |
| FHLMC Multifamily Structured Pass-Through Certificates, Series K089, Class A1, 3.34%, 10/25/28 | |
| GNMA, Series 2013-12, Class B, 2.07%, 11/16/52(4) | |
See Notes to Financial Statements.
| | |
COMMERCIAL MORTGAGE-BACKED SECURITIES 0.6% (continued) |
| Morgan Stanley Capital I Trust, Series 2021-L7, Class A4, 2.32%, 10/15/54 | |
TOTAL COMMERCIAL MORTGAGE-BACKED SECURITIES
(Cost $6,392,920) | |
CORPORATE BONDS & NOTES 11.7% |
|
| |
| Eastman Chemical Co., Senior Unsecured Notes, 5.63%, 2/20/34 | |
| |
| ArcelorMittal SA, Senior Unsecured Notes, 4.25%, 7/16/29(2) | |
| |
| Freeport-McMoRan, Inc., Guaranteed Notes, 4.63%, 8/1/30(2) | |
| Newmont Corp., Guaranteed Notes, 2.60%, 7/15/32(2) | |
| | |
| | |
|
| |
| Expedia Group, Inc., Guaranteed Notes, 3.25%, 2/15/30(2) | |
| Netflix, Inc., Senior Unsecured Notes, 4.90%, 8/15/34(2) | |
| | |
| |
| Comcast Corp., Guaranteed Notes, 4.15%, 10/15/28 | |
| |
| AT&T, Inc., Senior Unsecured Notes, 2.55%, 12/1/33 | |
| Motorola Solutions, Inc., Senior Unsecured Notes, 2.30%, 11/15/30 | |
| T-Mobile USA, Inc., Guaranteed Notes, 3.50%, 4/15/31 | |
| Verizon Communications, Inc., Senior Unsecured Notes, 4.13%, 3/16/27 | |
| Vodafone Group PLC, Senior Unsecured Notes, 4.25%, 9/17/50 | |
| | |
| | |
|
| |
| Tapestry, Inc., Senior Unsecured Notes, 5.10%, 3/11/30 | |
| |
| Ford Motor Credit Co. LLC, Senior Unsecured Notes, 6.05%, 3/5/31 | |
| General Motors Financial Co., Inc., Senior Unsecured Notes, 5.45%, 9/6/34(2) | |
| | |
| AUTO PARTS & EQUIPMENT 0.1% |
| BorgWarner, Inc., Senior Unsecured Notes, 5.40%, 8/15/34(2) | |
| | |
CORPORATE BONDS & NOTES 11.7% (continued) |
CONSUMER, CYCLICAL 1.2% (continued) |
| |
| Lennar Corp., Guaranteed Notes, 4.75%, 5/30/25 | |
| |
| Hyatt Hotels Corp., Senior Unsecured Notes, 5.38%, 12/15/31 | |
| Marriott International, Inc., 4.90%, 4/15/29(2) | |
| | |
| |
| Costco Wholesale Corp., Senior Unsecured Notes, 1.75%, 4/20/32(2) | |
| TJX Cos., Inc., 2.25%, 9/15/26 | |
| | |
| | |
CONSUMER, NON-CYCLICAL 1.6% |
| |
| Constellation Brands, Inc., Guaranteed Notes, 5.25%, 11/15/48 | |
| |
| Amgen, Inc., Senior Unsecured Notes, 2.20%, 2/21/27 | |
| Gilead Sciences, Inc., 4.60%, 9/1/35 | |
| Regeneron Pharmaceuticals, Inc., Senior Unsecured Notes, 1.75%, 9/15/30(2) | |
| | |
| |
| PayPal Holdings, Inc., Senior Unsecured Notes, 2.65%, 10/1/26 | |
| |
| GE HealthCare Technologies, Inc., Senior Unsecured Notes, 4.80%, 8/14/29 | |
| Smith & Nephew PLC, Senior Unsecured Notes, 2.03%, 10/14/30 | |
| Stryker Corp., 3.38%, 11/1/25 | |
| | |
| |
| HCA, Inc., Guaranteed Notes, 5.38%, 2/1/25 | |
| |
| AbbVie, Inc., Senior Unsecured Notes, 2.95%, 11/21/26 | |
| Eli Lilly & Co., Senior Unsecured Notes, 5.00%, 2/9/54 | |
| Pfizer Investment Enterprises Pte. Ltd., Guaranteed Notes, 5.30%, 5/19/53 | |
| | |
| | |
|
| |
| Devon Energy Corp., Senior Unsecured Notes, 5.20%, 9/15/34(2) | |
| Diamondback Energy, Inc., Guaranteed Notes, 5.15%, 1/30/30(2) | |
See Notes to Financial Statements.
Schedule of Investments (continued)
| | |
CORPORATE BONDS & NOTES 11.7% (continued) |
|
| OIL & GAS 0.8% (continued) |
| Hess Corp., Senior Unsecured Notes, 4.30%, 4/1/27 | |
| Murphy Oil Corp., Senior Unsecured Notes, 6.00%, 10/1/32 | |
| Occidental Petroleum Corp., Senior Unsecured Notes, 5.55%, 10/1/34(2) | |
| Phillips 66 Co., Guaranteed Notes, 5.25%, 6/15/31 | |
| | |
| |
| Enbridge, Inc., Guaranteed Notes, 2.50%, 8/1/33 | |
| Kinder Morgan, Inc., 5.20%, 6/1/33 | |
| Targa Resources Corp., 6.50%, 3/30/34 | |
| | |
| | |
|
| |
| Bank of America Corp., (1 day USD SOFR + 2.16%), 5.02%, 7/22/33(4) | |
| Bank of New York Mellon Corp., (1 day USD SOFR + 1.51%), 4.71%, 2/1/34(4) | |
| Citigroup, Inc., Senior Unsecured Notes, (1 day USD SOFR + 1.34%), 4.54%, 9/19/30(2)(4) | |
| Citigroup, Inc., Senior Unsecured Notes, (1 day USD SOFR + 2.09%), 4.91%, 5/24/33(4) | |
| Citigroup, Inc., Subordinated Notes, 5.30%, 5/6/44 | |
| Goldman Sachs Group, Inc., Senior Unsecured Notes, 3.75%, 2/25/26 | |
| HSBC Holdings PLC, Senior Unsecured Notes, (3 mo. USD Term SOFR + 1.80%), 4.58%, 6/19/29(4) | |
| JPMorgan Chase & Co., Subordinated Notes, 4.13%, 12/15/26 | |
| JPMorgan Chase & Co., Senior Unsecured Notes, (3 mo. USD Term SOFR + 1.64%), 3.96%, 11/15/48(4) | |
| KeyCorp, Senior Unsecured Notes, 4.10%, 4/30/28(2) | |
| M&T Bank Corp., Senior Unsecured Notes, (1 day USD SOFR Index + 1.78%), 4.55%, 8/16/28(4) | |
| Morgan Stanley, (1 day USD SOFR + 2.56%), 6.34%, 10/18/33(4) | |
| NatWest Group PLC, (1 yr. CMT + 1.35%), 5.85%, 3/2/27(4) | |
| Regions Financial Corp., Senior Unsecured Notes, (1 day USD SOFR + 2.06%), 5.50%, 9/6/35(2)(4) | |
| Wells Fargo & Co., Senior Unsecured Notes, (1 day USD SOFR + 1.07%), 5.71%, 4/22/28(4) | |
| | |
CORPORATE BONDS & NOTES 11.7% (continued) |
FINANCIAL 4.2% (continued) |
| |
| Wells Fargo & Co., (1 day USD SOFR + 2.13%), 4.61%, 4/25/53(4) | |
| | |
| DIVERSIFIED FINANCIALS 0.7% |
| AerCap Ireland Capital DAC/AerCap Global Aviation Trust, Guaranteed Notes, 3.30%, 1/30/32 | |
| Ally Financial, Inc., Senior Unsecured Notes, 4.75%, 6/9/27(2) | |
| American Express Co., Senior Unsecured Notes, (1 day USD SOFR Index + 1.28%), 5.28%, 7/27/29(4) | |
| Discover Financial Services, Senior Unsecured Notes, 4.10%, 2/9/27 | |
| Synchrony Financial, 4.88%, 6/13/25 | |
| | |
| |
| Aflac, Inc., Senior Unsecured Notes, 3.60%, 4/1/30 | |
| |
| Alexandria Real Estate Equities, Inc., Guaranteed Notes, 4.90%, 12/15/30(2) | |
| American Tower Corp., 5.50%, 3/15/28 | |
| Crown Castle, Inc., Senior Unsecured Notes, 3.80%, 2/15/28 | |
| Equinix, Inc., Senior Unsecured Notes, 2.50%, 5/15/31 | |
| Extra Space Storage LP, Guaranteed Notes, 5.40%, 2/1/34(2) | |
| Host Hotels & Resorts LP, Senior Unsecured Notes, 3.50%, 9/15/30 | |
| Kimco Realty OP LLC, Senior Unsecured Notes, 2.25%, 12/1/31 | |
| Sabra Health Care LP, Guaranteed Notes, 3.20%, 12/1/31 | |
| Welltower OP LLC, Senior Unsecured Notes, 4.25%, 4/15/28 | |
| Weyerhaeuser Co., 4.75%, 5/15/26 | |
| | |
| | |
|
| |
| | |
| |
| Amphenol Corp., Senior Unsecured Notes, 2.20%, 9/15/31 | |
| Flex Ltd., Senior Unsecured Notes, 4.75%, 6/15/25 | |
| | |
| MISCELLANEOUS MANUFACTURERS 0.1% |
| Teledyne Technologies, Inc., 2.25%, 4/1/28 | |
| | |
See Notes to Financial Statements.
| | |
CORPORATE BONDS & NOTES 11.7% (continued) |
|
| |
| Dell International LLC/EMC Corp., Guaranteed Notes, 5.40%, 4/15/34(2) | |
| Hewlett Packard Enterprise Co., Senior Unsecured Notes, 5.00%, 10/15/34 | |
| Kyndryl Holdings, Inc., Senior Unsecured Notes, 3.15%, 10/15/31(2) | |
| | |
| |
| Analog Devices, Inc., Senior Unsecured Notes, 2.80%, 10/1/41(2) | |
| Broadcom, Inc., 4.30%, 11/15/32 | |
| Microchip Technology, Inc., Guaranteed Notes, 5.05%, 2/15/30 | |
| Micron Technology, Inc., Senior Unsecured Notes, 5.30%, 1/15/31 | |
| | |
| |
| Oracle Corp., 6.25%, 11/9/32 | |
| | |
|
| |
| Duke Energy Corp., Senior Unsecured Notes, 4.50%, 8/15/32(2) | |
| National Grid PLC, Senior Unsecured Notes, 5.42%, 1/11/34(2) | |
| Public Service Enterprise Group, Inc., Senior Unsecured Notes, 5.20%, 4/1/29 | |
| Southern Co., 5.70%, 3/15/34(2) | |
| | |
TOTAL CORPORATE BONDS & NOTES
(Cost $108,746,994) | |
LONG-TERM MUNICIPAL SECURITIES 1.0% |
| |
| Regents of the University of California Medical Center Pooled Revenue, Series Q, 4.13%, 5/15/32 | |
| State of California, GO, 5.70%, 10/1/32 | |
| | |
| |
| Town of Andover, GO, 2.17%, 11/1/32 | |
| |
| University of Michigan, 5.18%, 4/1/35 | |
| |
| Minnesota Housing Finance Agency, Series J, 5.85%, 7/1/44 | |
| |
| New York City Transitional Finance Authority Building Aid Revenue, (ST AID WITHHLDG), 4.80%, 7/15/26 | |
| |
| State of Oregon, Series C, GO, 2.38%, 5/1/36 | |
| | |
LONG-TERM MUNICIPAL SECURITIES 1.0% (continued) |
| |
| City of Austin Electric Utility Revenue, Series A, 2.84%, 11/15/27 | |
TOTAL LONG-TERM MUNICIPAL SECURITIES
(Cost $9,367,686) | |
RESIDENTIAL MORTGAGE-BACKED SECURITIES 8.8% |
| FHLMC, Series 4151, Class PA, 2.00%, 1/15/33 | |
| FHLMC Gold PC Pool #G08488, 3.50%, 4/1/42 | |
| FHLMC Pool #QB2462, 3.00%, 8/1/50 | |
| FHLMC Pool #QB2958, 3.00%, 9/1/50 | |
| FHLMC Pool #QF1236, 4.50%, 10/1/52 | |
| FHLMC Pool #QG6306, 5.00%, 7/1/53 | |
| FHLMC Pool #RA6817, 2.50%, 2/1/52 | |
| FHLMC Pool #RB5022, 3.00%, 11/1/39 | |
| FHLMC Pool #SD7514, 3.50%, 4/1/50 | |
| FHLMC Pool #SD8108, 3.00%, 11/1/50 | |
| FHLMC Pool #SD8196, 3.50%, 2/1/52 | |
| FHLMC Pool #SD8256, 4.00%, 10/1/52 | |
| FHLMC Pool #ZS4647, 3.50%, 1/1/46 | |
| FNMA Pool #AS0516, 3.00%, 9/1/43 | |
| FNMA Pool #AX9528, 3.50%, 2/1/45 | |
| FNMA Pool #AZ6194, 3.50%, 10/1/45 | |
| FNMA Pool #BM3634, 3.50%, 5/1/47 | |
| FNMA Pool #BP5709, 2.50%, 5/1/50 | |
| FNMA Pool #CA5540, 3.00%, 4/1/50 | |
| FNMA Pool #CB2403, 2.50%, 12/1/51 | |
| FNMA Pool #CB5892, 4.50%, 3/1/53 | |
| FNMA Pool #FM2202, 4.00%, 12/1/48 | |
| FNMA Pool #FM3254, 3.50%, 5/1/49 | |
| FNMA Pool #FM4140, 2.50%, 9/1/50 | |
| FNMA Pool #FM9509, 3.00%, 11/1/36 | |
| FNMA Pool #FM9760, 3.50%, 11/1/51 | |
| FNMA Pool #FM9834, 3.50%, 6/1/49 | |
| FNMA Pool #FM9939, 4.00%, 1/1/52 | |
| FNMA Pool #MA4055, 2.50%, 6/1/50 | |
| FNMA Pool #MA4078, 2.50%, 7/1/50 | |
| FNMA Pool #MA4222, 3.50%, 12/1/50 | |
| FNMA Pool #MA4494, 3.00%, 12/1/51 | |
| FNMA Pool #MA4495, 3.50%, 12/1/51 | |
| FNMA Pool #MA5283, MBS, 4.00%, 2/1/54 | |
| FNMA REMIC Trust Series 2013-18, Series 2013-18, Class AE, 2.00%, 3/25/28 | |
| FNMA REMIC Trust Series 2013-41, Series 2013-41, Class WD, 2.00%, 11/25/42 | |
| GNMA, Series 2021-98, Class IG, IO, 3.00%, 6/20/51 | |
| GNMA II Pool #MA3937, 3.50%, 9/20/46 | |
| GNMA II Pool #MA7054, 3.50%, 12/20/50 | |
| GNMA II Pool #MA7651, 3.50%, 10/20/51 | |
| GNMA II Pool #MA7705, MBS, 2.50%, 11/20/51 | |
See Notes to Financial Statements.
Schedule of Investments (continued)
| | |
RESIDENTIAL MORTGAGE-BACKED SECURITIES 8.8% (continued) |
| GNMA II Pool #MA8043, POOL #MA8043, 3.00%, 5/20/52 | |
| GNMA II Pool #MA8945, 4.00%, 6/20/53 | |
| GNMA II Pool #MA9527, 5.00%, 3/20/54 | |
TOTAL RESIDENTIAL MORTGAGE-BACKED SECURITIES
(Cost $86,088,339) | |
U.S. TREASURY OBLIGATIONS 9.8% |
| U.S. Treasury Bonds, 5.38%, 2/15/31 | |
| U.S. Treasury Bonds, 3.50%, 2/15/39 | |
| U.S. Treasury Bonds, 3.88%, 5/15/43 | |
| U.S. Treasury Bonds, 3.00%, 2/15/48 | |
| U.S. Treasury Bonds, 3.63%, 5/15/53 | |
| U.S. Treasury Bonds, 4.25%, 8/15/54(2) | |
| U.S. Treasury Notes, 3.00%, 9/30/25(2) | |
| U.S. Treasury Notes, 4.63%, 2/28/26 | |
| U.S. Treasury Notes, 1.63%, 5/15/26 | |
| U.S. Treasury Notes, 4.50%, 7/15/26 | |
| U.S. Treasury Notes, 2.25%, 8/15/27 | |
| U.S. Treasury Notes, 2.75%, 2/15/28 | |
| U.S. Treasury Notes, 1.63%, 8/15/29 | |
| U.S. Treasury Notes, 3.63%, 8/31/29 | |
| U.S. Treasury Notes, 1.50%, 2/15/30 | |
| U.S. Treasury Notes, 3.88%, 8/15/33 | |
| U.S. Treasury Notes, 4.00%, 2/15/34 | |
TOTAL U.S. TREASURY OBLIGATIONS
(Cost $89,923,700) | |
| | |
SHORT-TERM INVESTMENTS 4.6% |
| |
| State Street Institutional U.S. Government Money Market Fund, Premier Class, 4.43%(5) | |
| State Street Navigator Securities Lending Government Money Market Portfolio(6) | |
| | |
TOTAL SHORT-TERM INVESTMENTS
(Cost $41,619,401) | |
TOTAL INVESTMENTS IN SECURITIES 102.1%
(Cost $631,802,091) | |
EXCESS OF LIABILITIES OVER CASH AND OTHER ASSETS (2.1)% | |
| |
| |
| A portion or all of the security was held on loan. As of December 31, 2024, the market value of the securities on loan was $40,656,514. |
| Pursuant to Rule 144A under the Securities Act of 1933, this security can only be sold to qualified institutional investors. |
| Floating or variable rate security. The rate disclosed is the rate in effect as of December 31, 2024. The information in parentheses represents the benchmark and reference rate for each relevant security and the rate adjusts based upon the reference rate and spread. The security may be further subject to interest rate floor and caps. For securities which do not indicate a reference rate and spread in their descriptions, the interest rate adjusts periodically based on current interest rates and, for mortgage-backed securities, prepayments in the underlying pool of assets. |
| Rate reflects 7 day yield as of December 31, 2024. |
| Securities with an aggregate market value of $40,656,514 were out on loan in exchange for collateral including $20,474,643 of cash collateral as of December 31, 2024. The collateral was invested in a cash collateral reinvestment vehicle. See Note 1(K). |
| Constant Maturity Treasury. |
| Federal Home Loan Mortgage Corp. |
| Federal National Mortgage Association. |
| Government National Mortgage Association. |
| Real Estate Investment Trusts. |
| Real Estate Mortgage Investment Conduit. |
| Secured Overnight Financing Rate. |
| |
The following table summarizes the inputs used to value the Fund's investments in securities as of December 31, 2024 (See Note 1(B)):
Investments in Securities: | | | | |
| | | | |
| | | | |
Collateralized Mortgage Obligations | | | | |
Commercial Mortgage-Backed Securities | | | | |
| | | | |
See Notes to Financial Statements.
Investments in Securities: | | | | |
Long-Term Municipal Securities* | | | | |
Residential Mortgage-Backed Securities | | | | |
U.S. Treasury Obligations | | | | |
| | | | |
Total Investments in Securities | | | | |
| See Schedule of Investments for further breakdown by category. |
See Notes to Financial Statements.
Value Line Capital Appreciation Fund, Inc.
| | |
|
COMMUNICATION SERVICES 11.5% |
| |
| | |
| | |
| Meta Platforms, Inc. Class A | |
| | |
| | |
| | |
| | |
| |
| | |
| | |
CONSUMER DISCRETIONARY 10.5% |
| |
| Rivian Automotive, Inc. Class A(1)(2) | |
| | |
| | |
| |
| DraftKings, Inc. Class A(1) | |
| |
| Alibaba Group Holding Ltd. ADR | |
| | |
| | |
| | |
| |
| Hilton Worldwide Holdings, Inc. | |
| |
| Chipotle Mexican Grill, Inc.(1) | |
| Lululemon Athletica, Inc.(1) | |
| | |
| | |
|
| |
| Constellation Brands, Inc. Class A | |
|
| |
| | |
|
| |
| | |
| |
| | |
| Goldman Sachs Group, Inc. | |
| | |
| | |
| |
| | |
| DIVERSIFIED FINANCIALS 3.9% |
| Coinbase Global, Inc. Class A(1) | |
| Interactive Brokers Group, Inc. Class A | |
| | |
COMMON STOCKS 65.2% (continued) |
FINANCIALS 8.8% (continued) |
| DIVERSIFIED FINANCIALS 3.9% (continued) |
| | |
| | |
| |
| Robinhood Markets, Inc. Class A(1) | |
| | |
|
| |
| BioMarin Pharmaceutical, Inc.(1) | |
| | |
| Vertex Pharmaceuticals, Inc.(1) | |
| | |
| |
| Exact Sciences Corp.(1)(2) | |
| |
| | |
| Madrigal Pharmaceuticals, Inc.(1)(2) | |
| | |
| | |
| | |
|
| |
| | |
| |
| | |
| Uber Technologies, Inc.(1) | |
| | |
| | |
INFORMATION TECHNOLOGY 23.7% |
| |
| | |
| Crowdstrike Holdings, Inc. Class A(1) | |
| | |
| |
| | |
| |
| Advanced Micro Devices, Inc.(1) | |
| | |
| | |
| | |
| | |
| | |
| | |
| |
| | |
| | |
| | |
| MicroStrategy, Inc. Class A(1)(2) | |
| | |
| | |
See Notes to Financial Statements.
| | |
COMMON STOCKS 65.2% (continued) |
INFORMATION TECHNOLOGY 23.7% (continued) |
| SOFTWARE 8.7% (continued) |
| | |
| | |
| | |
TOTAL COMMON STOCKS
(Cost $140,749,198) | |
| | |
COLLATERALIZED MORTGAGE OBLIGATIONS 0.3% |
| FHLMC, Series 2023-DNA1, Class M1A, REMIC, (30 day USD SOFR Average + 2.10%), 6.66%, 3/25/43(3)(4) | |
| FNMA, Series 2023-R02, Class 1M1, (30 day USD SOFR Average + 2.30%), 6.87%, 1/25/43(3)(4) | |
| FNMA, Series 2023-R04, Class 1M1, (30 day USD SOFR Average + 2.30%), 6.86%, 5/25/43(3)(4) | |
TOTAL COLLATERALIZED MORTGAGE OBLIGATIONS
(Cost $1,507,766) | |
COMMERCIAL MORTGAGE-BACKED SECURITIES 0.3% |
| FHLMC Multifamily Structured Pass-Through Certificates, Series K052, Class A2, 3.15%, 11/25/25 | |
| FHLMC Multifamily Structured Pass-Through Certificates, Series K055, Class A2, 2.67%, 3/25/26 | |
| FHLMC Multifamily Structured Pass-Through Certificates, Series K064, Class A2, 3.22%, 3/25/27 | |
| FHLMC Multifamily Structured Pass-Through Certificates, Series K074, Class A2, 3.60%, 1/25/28 | |
| FHLMC Multifamily Structured Pass-Through Certificates, Series K084, Class A2, 3.78%, 10/25/28(4) | |
| GNMA, Series 2013-12, Class AB, 1.83%, 11/16/52 | |
| GNMA, Series 2013-12, Class B, 2.07%, 11/16/52(4) | |
TOTAL COMMERCIAL MORTGAGE-BACKED SECURITIES
(Cost $1,606,931) | |
CORPORATE BONDS & NOTES 9.6% |
|
| |
| Eastman Chemical Co., Senior Unsecured Notes, 5.63%, 2/20/34 | |
| |
| ArcelorMittal SA, Senior Unsecured Notes, 4.25%, 7/16/29(2) | |
| |
| Freeport-McMoRan, Inc., Guaranteed Notes, 4.63%, 8/1/30(2) | |
| | |
CORPORATE BONDS & NOTES 9.6% (continued) |
BASIC MATERIALS 0.4% (continued) |
| |
| Newmont Corp., Guaranteed Notes, 2.60%, 7/15/32(2) | |
| | |
| | |
|
| |
| Expedia Group, Inc., Guaranteed Notes, 3.25%, 2/15/30(2) | |
| Netflix, Inc., Senior Unsecured Notes, 4.90%, 8/15/34(2) | |
| | |
| |
| Comcast Corp., Guaranteed Notes, 3.95%, 10/15/25 | |
| |
| AT&T, Inc., Senior Unsecured Notes, 2.55%, 12/1/33 | |
| Motorola Solutions, Inc., Senior Unsecured Notes, 2.30%, 11/15/30 | |
| T-Mobile USA, Inc., Guaranteed Notes, 3.50%, 4/15/31 | |
| Verizon Communications, Inc., Senior Unsecured Notes, 4.13%, 3/16/27(2) | |
| Vodafone Group PLC, Senior Unsecured Notes, 4.25%, 9/17/50 | |
| | |
| | |
|
| |
| Tapestry, Inc., Senior Unsecured Notes, 5.10%, 3/11/30 | |
| |
| Ford Motor Credit Co. LLC, Senior Unsecured Notes, 6.05%, 3/5/31 | |
| General Motors Financial Co., Inc., Senior Unsecured Notes, 5.45%, 9/6/34(2) | |
| | |
| AUTO PARTS & EQUIPMENT 0.1% |
| BorgWarner, Inc., Senior Unsecured Notes, 5.40%, 8/15/34(2) | |
| |
| Lennar Corp., Guaranteed Notes, 4.75%, 5/30/25 | |
| |
| Hyatt Hotels Corp., Senior Unsecured Notes, 5.38%, 12/15/31 | |
| Marriott International, Inc., 4.90%, 4/15/29(2) | |
| | |
| |
| Costco Wholesale Corp., Senior Unsecured Notes, 1.75%, 4/20/32(2) | |
See Notes to Financial Statements.
Schedule of Investments (continued)
| | |
CORPORATE BONDS & NOTES 9.6% (continued) |
CONSUMER, CYCLICAL 1.0% (continued) |
| |
| TJX Cos., Inc., 2.25%, 9/15/26 | |
| | |
| | |
CONSUMER, NON-CYCLICAL 1.4% |
| |
| Constellation Brands, Inc., 2.25%, 8/1/31 | |
| Constellation Brands, Inc., Guaranteed Notes, 5.25%, 11/15/48 | |
| | |
| |
| Amgen, Inc., Senior Unsecured Notes, 2.20%, 2/21/27 | |
| Gilead Sciences, Inc., 4.60%, 9/1/35 | |
| Regeneron Pharmaceuticals, Inc., Senior Unsecured Notes, 1.75%, 9/15/30(2) | |
| | |
| |
| PayPal Holdings, Inc., Senior Unsecured Notes, 2.65%, 10/1/26(2) | |
| Service Corp. International, Senior Unsecured Notes, 4.00%, 5/15/31 | |
| | |
| |
| GE HealthCare Technologies, Inc., Senior Unsecured Notes, 4.80%, 8/14/29 | |
| Smith & Nephew PLC, Senior Unsecured Notes, 2.03%, 10/14/30 | |
| Stryker Corp., 3.38%, 11/1/25(2) | |
| | |
| |
| HCA, Inc., Guaranteed Notes, 5.38%, 2/1/25 | |
| |
| AbbVie, Inc., Senior Unsecured Notes, 2.95%, 11/21/26 | |
| Eli Lilly & Co., Senior Unsecured Notes, 5.00%, 2/9/54 | |
| Pfizer Investment Enterprises Pte. Ltd., Guaranteed Notes, 5.30%, 5/19/53(2) | |
| | |
| | |
|
| |
| Devon Energy Corp., Senior Unsecured Notes, 5.20%, 9/15/34(2) | |
| Diamondback Energy, Inc., Guaranteed Notes, 5.15%, 1/30/30(2) | |
| Hess Corp., Senior Unsecured Notes, 4.30%, 4/1/27 | |
| Murphy Oil Corp., Senior Unsecured Notes, 6.00%, 10/1/32 | |
| Occidental Petroleum Corp., Senior Unsecured Notes, 5.55%, 10/1/34(2) | |
| | |
CORPORATE BONDS & NOTES 9.6% (continued) |
|
| OIL & GAS 0.7% (continued) |
| Phillips 66 Co., Guaranteed Notes, 5.25%, 6/15/31 | |
| | |
| |
| Enbridge, Inc., Guaranteed Notes, 2.50%, 8/1/33 | |
| Kinder Morgan, Inc., 5.20%, 6/1/33(2) | |
| Targa Resources Corp., 6.50%, 3/30/34 | |
| | |
| | |
|
| |
| Bank of America Corp., (1 day USD SOFR + 2.16%), 5.02%, 7/22/33(2)(4) | |
| Bank of New York Mellon Corp., (1 day USD SOFR + 1.51%), 4.71%, 2/1/34(4) | |
| Citigroup, Inc., Senior Unsecured Notes, (1 day USD SOFR + 1.34%), 4.54%, 9/19/30(2)(4) | |
| Citigroup, Inc., Senior Unsecured Notes, (1 day USD SOFR + 2.09%), 4.91%, 5/24/33(2)(4) | |
| Citigroup, Inc., Subordinated Notes, 5.30%, 5/6/44 | |
| Goldman Sachs Group, Inc., Senior Unsecured Notes, 3.75%, 2/25/26(2) | |
| HSBC Holdings PLC, Senior Unsecured Notes, (3 mo. USD Term SOFR + 1.80%), 4.58%, 6/19/29(4) | |
| JPMorgan Chase & Co., Subordinated Notes, 4.13%, 12/15/26 | |
| JPMorgan Chase & Co., Senior Unsecured Notes, (3 mo. USD Term SOFR + 1.64%), 3.96%, 11/15/48(4) | |
| KeyCorp, Senior Unsecured Notes, 4.10%, 4/30/28(2) | |
| M&T Bank Corp., Senior Unsecured Notes, (1 day USD SOFR Index + 1.78%), 4.55%, 8/16/28(2)(4) | |
| Morgan Stanley, (1 day USD SOFR + 2.56%), 6.34%, 10/18/33(4) | |
| NatWest Group PLC, (1 yr. CMT + 1.35%), 5.85%, 3/2/27(4) | |
| Regions Financial Corp., Senior Unsecured Notes, (1 day USD SOFR + 2.06%), 5.50%, 9/6/35(2)(4) | |
| Royal Bank of Canada, 5.00%, 2/1/33 | |
| Wells Fargo & Co., Senior Unsecured Notes, (1 day USD SOFR + 1.07%), 5.71%, 4/22/28(4) | |
| Wells Fargo & Co., (1 day USD SOFR + 2.13%), 4.61%, 4/25/53(4) | |
| | |
See Notes to Financial Statements.
| | |
CORPORATE BONDS & NOTES 9.6% (continued) |
FINANCIAL 3.4% (continued) |
| DIVERSIFIED FINANCIALS 0.5% |
| AerCap Ireland Capital DAC/AerCap Global Aviation Trust, Guaranteed Notes, 3.30%, 1/30/32 | |
| Ally Financial, Inc., Senior Unsecured Notes, 4.75%, 6/9/27(2) | |
| American Express Co., Senior Unsecured Notes, (1 day USD SOFR Index + 1.28%), 5.28%, 7/27/29(4) | |
| Discover Financial Services, Senior Unsecured Notes, 4.10%, 2/9/27 | |
| Synchrony Financial, 4.88%, 6/13/25 | |
| | |
| |
| Aflac, Inc., Senior Unsecured Notes, 3.60%, 4/1/30(2) | |
| |
| Alexandria Real Estate Equities, Inc., Guaranteed Notes, 4.90%, 12/15/30(2) | |
| American Tower Corp., 5.50%, 3/15/28 | |
| Crown Castle, Inc., Senior Unsecured Notes, 3.80%, 2/15/28(2) | |
| Equinix, Inc., Senior Unsecured Notes, 2.50%, 5/15/31 | |
| Extra Space Storage LP, Guaranteed Notes, 5.40%, 2/1/34(2) | |
| Host Hotels & Resorts LP, Senior Unsecured Notes, 3.50%, 9/15/30 | |
| Kimco Realty OP LLC, Senior Unsecured Notes, 2.25%, 12/1/31 | |
| Sabra Health Care LP, Guaranteed Notes, 3.20%, 12/1/31 | |
| Welltower OP LLC, Senior Unsecured Notes, 4.25%, 4/15/28 | |
| Weyerhaeuser Co., 4.75%, 5/15/26 | |
| | |
| | |
|
| |
| | |
| |
| Amphenol Corp., Senior Unsecured Notes, 2.20%, 9/15/31 | |
| Flex Ltd., Senior Unsecured Notes, 4.75%, 6/15/25(2) | |
| | |
| MISCELLANEOUS MANUFACTURERS 0.1% |
| Teledyne Technologies, Inc., 2.25%, 4/1/28 | |
| | |
|
| |
| Dell International LLC/EMC Corp., Guaranteed Notes, 5.40%, 4/15/34(2) | |
| Hewlett Packard Enterprise Co., Senior Unsecured Notes, 5.00%, 10/15/34 | |
| | |
CORPORATE BONDS & NOTES 9.6% (continued) |
TECHNOLOGY 0.8% (continued) |
| COMPUTERS 0.3% (continued) |
| Kyndryl Holdings, Inc., Senior Unsecured Notes, 3.15%, 10/15/31(2) | |
| | |
| |
| Analog Devices, Inc., Senior Unsecured Notes, 2.80%, 10/1/41(2) | |
| Broadcom, Inc., 4.30%, 11/15/32 | |
| Microchip Technology, Inc., Guaranteed Notes, 5.05%, 2/15/30(2) | |
| Micron Technology, Inc., Senior Unsecured Notes, 5.30%, 1/15/31(2) | |
| | |
| |
| Oracle Corp., 6.25%, 11/9/32 | |
| | |
|
| |
| Duke Energy Corp., Senior Unsecured Notes, 4.50%, 8/15/32(2) | |
| National Grid PLC, Senior Unsecured Notes, 5.42%, 1/11/34(2) | |
| Public Service Enterprise Group, Inc., Senior Unsecured Notes, 5.20%, 4/1/29(2) | |
| Southern Co., 5.70%, 3/15/34(2) | |
| | |
TOTAL CORPORATE BONDS & NOTES
(Cost $45,085,314) | |
LONG-TERM MUNICIPAL SECURITIES 0.9% |
| |
| Regents of the University of California Medical Center Pooled Revenue, Series Q, 4.13%, 5/15/32 | |
| State of California, GO, 5.70%, 10/1/32 | |
| | |
| |
| City & County Honolulu Wastewater System Revenue, Series B, 2.50%, 7/1/27 | |
| |
| Illinois State Toll Highway Authority, Series B, 5.85%, 12/1/34 | |
| |
| Commonwealth of Massachusetts, Series A, 3.77%, 7/15/29 | |
| |
| University of Michigan, 5.18%, 4/1/35 | |
| |
| Minnesota Housing Finance Agency, Series J, 5.85%, 7/1/44 | |
See Notes to Financial Statements.
Schedule of Investments (continued)
| | |
LONG-TERM MUNICIPAL SECURITIES 0.9% (continued) |
| |
| New York City Transitional Finance Authority Future Tax Secured Revenue, Series D-3, 2.25%, 11/1/31 | |
TOTAL LONG-TERM MUNICIPAL SECURITIES
(Cost $3,903,673) | |
RESIDENTIAL MORTGAGE-BACKED SECURITIES 7.2% |
| FHLMC, Series 4151, Class PA, 2.00%, 1/15/33 | |
| FHLMC Gold PC Pool #A47613, 5.00%, 11/1/35 | |
| FHLMC Gold Pool #C09027, 3.00%, 2/1/43 | |
| FHLMC Pool #QB9661, 2.50%, 3/1/51 | |
| FHLMC Pool #QD2419, 3.00%, 12/1/51 | |
| FHLMC Pool #QE8017, 3.50%, 8/1/52 | |
| FHLMC Pool #QF1236, 4.50%, 10/1/52 | |
| FHLMC Pool #QG6306, 5.00%, 7/1/53 | |
| FHLMC Pool #RA6817, 2.50%, 2/1/52 | |
| FHLMC Pool #SB8215, 4.00%, 3/1/38 | |
| FHLMC Pool #SD4553, 3.00%, 9/1/53 | |
| FHLMC Pool #SD8093, 3.50%, 9/1/50 | |
| FHLMC Pool #SD8108, 3.00%, 11/1/50 | |
| FHLMC Pool #SD8255, 3.50%, 10/1/52 | |
| FHLMC Pool #SD8256, 4.00%, 10/1/52 | |
| FHLMC Pool #SD8266, MBS, 4.50%, 11/1/52 | |
| FHLMC Pool #SD8328, 4.50%, 6/1/53 | |
| FNMA Pool #AH3226, 5.00%, 2/1/41 | |
| FNMA Pool #AL0657, 5.00%, 8/1/41 | |
| FNMA Pool #AQ1853, 3.00%, 11/1/42 | |
| FNMA Pool #AU5409, 3.00%, 8/1/43 | |
| FNMA Pool #CA5540, 3.00%, 4/1/50 | |
| FNMA Pool #CB5892, 4.50%, 3/1/53 | |
| FNMA Pool #FM2202, 4.00%, 12/1/48 | |
| FNMA Pool #FM4140, 2.50%, 9/1/50 | |
| FNMA Pool #FM9760, 3.50%, 11/1/51 | |
| FNMA Pool #FM9834, 3.50%, 6/1/49 | |
| FNMA Pool #FS3526, 4.00%, 12/1/52 | |
| FNMA Pool #MA4222, 3.50%, 12/1/50 | |
| FNMA Pool #MA4512, 2.50%, 1/1/52 | |
| FNMA Pool #MA5131, 3.50%, 7/1/53 | |
| FNMA Pool #MA5283, MBS, 4.00%, 2/1/54 | |
| FNMA REMIC Trust Series 2013-18, Series 2013-18, Class AE, 2.00%, 3/25/28 | |
| GNMA, Series 2021-98, Class IG, IO, 3.00%, 6/20/51 | |
| GNMA II Pool #MA1521, 3.50%, 12/20/43 | |
| GNMA II Pool #MA1839, 4.00%, 4/20/44 | |
| GNMA II Pool #MA4836, 3.00%, 11/20/47 | |
| GNMA II Pool #MA7054, 3.50%, 12/20/50 | |
| GNMA II Pool #MA7651, 3.50%, 10/20/51 | |
| GNMA II Pool #MA7705, MBS, 2.50%, 11/20/51 | |
| | |
RESIDENTIAL MORTGAGE-BACKED SECURITIES 7.2% (continued) |
| GNMA II Pool #MA8043, POOL #MA8043, 3.00%, 5/20/52 | |
| GNMA II Pool #MA8945, 4.00%, 6/20/53 | |
| GNMA II Pool #MA9527, 5.00%, 3/20/54 | |
TOTAL RESIDENTIAL MORTGAGE-BACKED SECURITIES
(Cost $35,135,263) | |
U.S. TREASURY OBLIGATIONS 9.2% |
| U.S. Treasury Bonds, 3.50%, 2/15/39 | |
| U.S. Treasury Bonds, 1.13%, 5/15/40 | |
| U.S. Treasury Bonds, 3.88%, 5/15/43 | |
| U.S. Treasury Bonds, 3.00%, 2/15/48 | |
| U.S. Treasury Bonds, 4.25%, 8/15/54(2) | |
| U.S. Treasury Notes, 3.00%, 9/30/25(2) | |
| U.S. Treasury Notes, 4.50%, 7/15/26 | |
| U.S. Treasury Notes, 2.25%, 8/15/27 | |
| U.S. Treasury Notes, 2.75%, 2/15/28 | |
| U.S. Treasury Notes, 1.63%, 8/15/29(2) | |
| U.S. Treasury Notes, 3.63%, 8/31/29 | |
| U.S. Treasury Notes, 1.50%, 2/15/30 | |
| U.S. Treasury Notes, 2.75%, 8/15/32 | |
| U.S. Treasury Notes, 3.38%, 5/15/33 | |
| U.S. Treasury Notes, 4.00%, 2/15/34 | |
TOTAL U.S. TREASURY OBLIGATIONS
(Cost $43,506,332) | |
| | |
SHORT-TERM INVESTMENTS 8.4% |
| |
| State Street Institutional U.S. Government Money Market Fund, Premier Class, 4.43%(5) | |
| State Street Navigator Securities Lending Government Money Market Portfolio(6) | |
| | |
TOTAL SHORT-TERM INVESTMENTS
(Cost $39,036,189) | |
TOTAL INVESTMENTS IN SECURITIES 101.1%
(Cost $310,530,666) | |
EXCESS OF LIABILITIES OVER CASH AND OTHER ASSETS (1.1)% | |
| |
See Notes to Financial Statements.
| |
| A portion or all of the security was held on loan. As of December 31, 2024, the market value of the securities on loan was $44,989,932. |
| Pursuant to Rule 144A under the Securities Act of 1933, this security can only be sold to qualified institutional investors. |
| Floating or variable rate security. The rate disclosed is the rate in effect as of December 31, 2024. The information in parentheses represents the benchmark and reference rate for each relevant security and the rate adjusts based upon the reference rate and spread. The security may be further subject to interest rate floor and caps. For securities which do not indicate a reference rate and spread in their descriptions, the interest rate adjusts periodically based on current interest rates and, for mortgage-backed securities, prepayments in the underlying pool of assets. |
| Rate reflects 7 day yield as of December 31, 2024. |
| Securities with an aggregate market value of $44,989,932 were out on loan in exchange for collateral including $10,973,608 of cash collateral as of December 31, 2024. The collateral was invested in a cash collateral reinvestment vehicle. See Note 1(K). |
| American Depositary Receipt. |
| Constant Maturity Treasury. |
| Federal Home Loan Mortgage Corp. |
| Federal National Mortgage Association. |
| Government National Mortgage Association. |
| Real Estate Investment Trusts. |
| Real Estate Mortgage Investment Conduit. |
| Secured Overnight Financing Rate. |
The following table summarizes the inputs used to value the Fund's investments in securities as of December 31, 2024 (See Note 1(B)):
Investments in Securities: | | | | |
| | | | |
| | | | |
Collateralized Mortgage Obligations | | | | |
Commercial Mortgage-Backed Securities | | | | |
| | | | |
Long-Term Municipal Securities* | | | | |
Residential Mortgage-Backed Securities | | | | |
U.S. Treasury Obligations | | | | |
| | | | |
Total Investments in Securities | | | | |
| See Schedule of Investments for further breakdown by category. |
See Notes to Financial Statements.
Value Line Core Bond Fund
| | |
COLLATERALIZED MORTGAGE OBLIGATIONS 2.0% |
| FHLMC, Series 2023-DNA1, Class M1A, REMIC, (30 day USD SOFR Average + 2.10%), 6.66%, 3/25/43(1)(2) | |
| FNMA, Series 2023-R02, Class 1M1, (30 day USD SOFR Average + 2.30%), 6.87%, 1/25/43(1)(2) | |
| FNMA, Series 2023-R04, Class 1M1, (30 day USD SOFR Average + 2.30%), 6.86%, 5/25/43(1)(2) | |
TOTAL COLLATERALIZED MORTGAGE OBLIGATIONS
(Cost $709,647) | |
COMMERCIAL MORTGAGE-BACKED SECURITIES 1.1% |
| FHLMC Multifamily Structured Pass-Through Certificates, Series K092, Class A2, 3.30%, 4/25/29 | |
| GNMA, Series 2012-125, Class AB, 2.11%, 2/16/53(2) | |
| GNMA, Series 2013-12, Class AB, 1.83%, 11/16/52 | |
| Sequoia Mortgage Trust, Series 2004-8, Class A1, (1 mo. USD Term SOFR + 0.81%), 5.18%, 9/20/34(2) | |
| Wells Fargo Commercial Mortgage Trust, Series 2015-NXS2, Class ASB, 3.46%, 7/15/58 | |
TOTAL COMMERCIAL MORTGAGE-BACKED SECURITIES
(Cost $475,626) | |
CORPORATE BONDS & NOTES 35.4% |
|
| |
| Eastman Chemical Co., Senior Unsecured Notes, 5.63%, 2/20/34 | |
| |
| ArcelorMittal SA, Senior Unsecured Notes, 4.25%, 7/16/29 | |
| |
| Freeport-McMoRan, Inc., Guaranteed Notes, 4.63%, 8/1/30(3) | |
| Newmont Corp., Guaranteed Notes, 2.60%, 7/15/32(3) | |
| | |
| | |
|
| |
| Expedia Group, Inc., Guaranteed Notes, 3.25%, 2/15/30 | |
| Netflix, Inc., Senior Unsecured Notes, 4.90%, 8/15/34(3) | |
| | |
| |
| Comcast Corp., Guaranteed Notes, 4.15%, 10/15/28 | |
| |
| AT&T, Inc., Senior Unsecured Notes, 2.55%, 12/1/33 | |
| Motorola Solutions, Inc., Senior Unsecured Notes, 2.30%, 11/15/30 | |
| | |
CORPORATE BONDS & NOTES 35.4% (continued) |
COMMUNICATIONS 2.6% (continued) |
| TELECOMMUNICATIONS 1.4% (continued) |
| T-Mobile USA, Inc., Guaranteed Notes, 3.50%, 4/15/31 | |
| Vodafone Group PLC, Senior Unsecured Notes, 4.25%, 9/17/50 | |
| | |
| | |
|
| |
| Tapestry, Inc., Senior Unsecured Notes, 5.10%, 3/11/30 | |
| |
| Ford Motor Credit Co. LLC, Senior Unsecured Notes, 6.05%, 3/5/31 | |
| General Motors Financial Co., Inc., Senior Unsecured Notes, 5.45%, 9/6/34(3) | |
| | |
| AUTO PARTS & EQUIPMENT 0.4% |
| BorgWarner, Inc., Senior Unsecured Notes, 5.40%, 8/15/34(3) | |
| |
| Lennar Corp., Guaranteed Notes, 4.75%, 5/30/25 | |
| |
| Hyatt Hotels Corp., Senior Unsecured Notes, 5.38%, 12/15/31 | |
| Marriott International, Inc., 4.90%, 4/15/29 | |
| | |
| |
| Costco Wholesale Corp., Senior Unsecured Notes, 1.75%, 4/20/32(3) | |
| TJX Cos., Inc., 2.25%, 9/15/26 | |
| | |
| | |
CONSUMER, NON-CYCLICAL 5.2% |
| |
| Constellation Brands, Inc., Guaranteed Notes, 5.25%, 11/15/48 | |
| |
| Amgen, Inc., Senior Unsecured Notes, 2.20%, 2/21/27 | |
| Gilead Sciences, Inc., 4.60%, 9/1/35 | |
| Regeneron Pharmaceuticals, Inc., Senior Unsecured Notes, 1.75%, 9/15/30(3) | |
| | |
| |
| PayPal Holdings, Inc., Senior Unsecured Notes, 2.65%, 10/1/26 | |
| Service Corp. International, Senior Unsecured Notes, 4.00%, 5/15/31 | |
| | |
See Notes to Financial Statements.
| | |
CORPORATE BONDS & NOTES 35.4% (continued) |
CONSUMER, NON-CYCLICAL 5.2% (continued) |
| |
| GE HealthCare Technologies, Inc., Senior Unsecured Notes, 4.80%, 8/14/29 | |
| Smith & Nephew PLC, Senior Unsecured Notes, 2.03%, 10/14/30 | |
| Stryker Corp., 3.38%, 11/1/25 | |
| | |
| |
| HCA, Inc., Guaranteed Notes, 5.38%, 2/1/25 | |
| |
| AbbVie, Inc., Senior Unsecured Notes, 2.95%, 11/21/26 | |
| Eli Lilly & Co., Senior Unsecured Notes, 5.00%, 2/9/54 | |
| Pfizer Investment Enterprises Pte. Ltd., Guaranteed Notes, 5.30%, 5/19/53 | |
| | |
| | |
|
| |
| Devon Energy Corp., Senior Unsecured Notes, 5.20%, 9/15/34 | |
| Diamondback Energy, Inc., Guaranteed Notes, 5.15%, 1/30/30(3) | |
| Hess Corp., Senior Unsecured Notes, 4.30%, 4/1/27 | |
| Murphy Oil Corp., Senior Unsecured Notes, 6.00%, 10/1/32 | |
| Occidental Petroleum Corp., Senior Unsecured Notes, 5.55%, 10/1/34 | |
| Phillips 66 Co., Guaranteed Notes, 5.25%, 6/15/31 | |
| | |
| |
| Enbridge, Inc., Guaranteed Notes, 2.50%, 8/1/33 | |
| Kinder Morgan, Inc., 5.20%, 6/1/33 | |
| Targa Resources Corp., 6.50%, 3/30/34 | |
| | |
| | |
|
| |
| Bank of America Corp., (1 day USD SOFR + 2.16%), 5.02%, 7/22/33(2) | |
| Bank of New York Mellon Corp., (1 day USD SOFR + 1.51%), 4.71%, 2/1/34(2) | |
| Citigroup, Inc., Senior Unsecured Notes, (1 day USD SOFR + 1.34%), 4.54%, 9/19/30(2) | |
| Citigroup, Inc., Senior Unsecured Notes, (1 day USD SOFR + 2.09%), 4.91%, 5/24/33(2) | |
| Citigroup, Inc., Subordinated Notes, 5.30%, 5/6/44 | |
| | |
CORPORATE BONDS & NOTES 35.4% (continued) |
FINANCIAL 12.6% (continued) |
| |
| Goldman Sachs Group, Inc., Senior Unsecured Notes, 3.75%, 2/25/26 | |
| HSBC Holdings PLC, Senior Unsecured Notes, (3 mo. USD Term SOFR + 1.80%), 4.58%, 6/19/29(2) | |
| JPMorgan Chase & Co., Subordinated Notes, 4.13%, 12/15/26 | |
| JPMorgan Chase & Co., Senior Unsecured Notes, (3 mo. USD Term SOFR + 1.64%), 3.96%, 11/15/48(2) | |
| KeyCorp, Senior Unsecured Notes, 4.10%, 4/30/28(3) | |
| Morgan Stanley, (1 day USD SOFR + 2.56%), 6.34%, 10/18/33(2) | |
| NatWest Group PLC, (1 yr. CMT + 1.35%), 5.85%, 3/2/27(2) | |
| Regions Financial Corp., Senior Unsecured Notes, (1 day USD SOFR + 2.06%), 5.50%, 9/6/35(2)(3) | |
| Wells Fargo & Co., Senior Unsecured Notes, (1 day USD SOFR + 1.07%), 5.71%, 4/22/28(2) | |
| Wells Fargo & Co., (1 day USD SOFR + 2.13%), 4.61%, 4/25/53(2) | |
| | |
| DIVERSIFIED FINANCIALS 2.0% |
| AerCap Ireland Capital DAC/AerCap Global Aviation Trust, Guaranteed Notes, 3.30%, 1/30/32 | |
| Ally Financial, Inc., Senior Unsecured Notes, 4.75%, 6/9/27(3) | |
| American Express Co., Senior Unsecured Notes, (1 day USD SOFR Index + 1.28%), 5.28%, 7/27/29(2) | |
| Discover Financial Services, Senior Unsecured Notes, 4.10%, 2/9/27 | |
| Synchrony Financial, 4.88%, 6/13/25 | |
| | |
| |
| Aflac, Inc., Senior Unsecured Notes, 3.60%, 4/1/30 | |
| |
| Alexandria Real Estate Equities, Inc., Guaranteed Notes, 4.90%, 12/15/30(3) | |
| American Tower Corp., 5.50%, 3/15/28 | |
| Crown Castle, Inc., Senior Unsecured Notes, 3.80%, 2/15/28 | |
| Equinix, Inc., Senior Unsecured Notes, 2.50%, 5/15/31 | |
| Extra Space Storage LP, Guaranteed Notes, 5.40%, 2/1/34 | |
| Host Hotels & Resorts LP, Senior Unsecured Notes, 3.50%, 9/15/30 | |
| Kimco Realty OP LLC, Senior Unsecured Notes, 2.25%, 12/1/31 | |
See Notes to Financial Statements.
Schedule of Investments (continued)
| | |
CORPORATE BONDS & NOTES 35.4% (continued) |
FINANCIAL 12.6% (continued) |
| |
| Sabra Health Care LP, Guaranteed Notes, 3.20%, 12/1/31 | |
| Welltower OP LLC, Senior Unsecured Notes, 4.25%, 4/15/28 | |
| Weyerhaeuser Co., 4.75%, 5/15/26 | |
| | |
| | |
|
| |
| | |
| |
| Amphenol Corp., Senior Unsecured Notes, 2.20%, 9/15/31 | |
| Flex Ltd., Senior Unsecured Notes, 4.75%, 6/15/25 | |
| | |
| MISCELLANEOUS MANUFACTURERS 0.4% |
| Teledyne Technologies, Inc., 2.25%, 4/1/28 | |
| | |
|
| |
| Dell International LLC/EMC Corp., Guaranteed Notes, 5.40%, 4/15/34(3) | |
| Hewlett Packard Enterprise Co., Senior Unsecured Notes, 5.00%, 10/15/34 | |
| Kyndryl Holdings, Inc., Senior Unsecured Notes, 3.15%, 10/15/31(3) | |
| | |
| |
| Analog Devices, Inc., Senior Unsecured Notes, 2.80%, 10/1/41 | |
| Broadcom, Inc., 4.30%, 11/15/32 | |
| Microchip Technology, Inc., Guaranteed Notes, 5.05%, 2/15/30 | |
| Micron Technology, Inc., Senior Unsecured Notes, 5.30%, 1/15/31 | |
| | |
| | |
|
| |
| Duke Energy Corp., Senior Unsecured Notes, 4.50%, 8/15/32(3) | |
| National Grid PLC, Senior Unsecured Notes, 5.42%, 1/11/34 | |
| Public Service Enterprise Group, Inc., Senior Unsecured Notes, 5.20%, 4/1/29 | |
| Southern Co., 5.70%, 3/15/34(3) | |
| | |
TOTAL CORPORATE BONDS & NOTES
(Cost $12,937,139) | |
| | |
LONG-TERM MUNICIPAL SECURITIES 2.8% |
| |
| Regents of the University of California Medical Center Pooled Revenue, Series Q, 4.13%, 5/15/32 | |
| San Diego Public Facilities Financing Authority, Series B, 2.13%, 8/1/29 | |
| State of California, GO, 5.70%, 10/1/32 | |
| | |
| |
| Illinois State Toll Highway Authority, Series B, 5.85%, 12/1/34 | |
| |
| Maryland Department of Housing & Community Development, Series F, (GNMA/FNMA/FHLMC), 5.06%, 3/1/33 | |
| |
| Minnesota Housing Finance Agency, Series J, 5.85%, 7/1/44 | |
| |
| State of Oregon, Series C, GO, 2.38%, 5/1/36 | |
TOTAL LONG-TERM MUNICIPAL SECURITIES
(Cost $1,032,250) | |
RESIDENTIAL MORTGAGE-BACKED SECURITIES 26.1% |
| FHLMC Gold PC Pool #C91749, 4.00%, 1/1/34 | |
| FHLMC Gold PC Pool #G06224, 3.50%, 1/1/41 | |
| FHLMC Gold PC Pool #J11587, 4.00%, 1/1/25 | |
| FHLMC Gold PC Pool #Q06307, 3.50%, 2/1/42 | |
| FHLMC Gold PC Pool #Q08656, 4.00%, 6/1/42 | |
| FHLMC Gold PC Pool #Q08903, 3.50%, 6/1/42 | |
| FHLMC Gold PC Pool #Q14593, 3.00%, 1/1/43 | |
| FHLMC Gold Pool #Q34167, 4.00%, 6/1/45 | |
| FHLMC Gold Pool #Q57991, 4.00%, 8/1/48 | |
| FHLMC Pool #QB2958, 3.00%, 9/1/50 | |
| FHLMC Pool #QB5314, 2.50%, 11/1/50 | |
| FHLMC Pool #QB8153, 2.50%, 1/1/51 | |
| FHLMC Pool #QF1236, 4.50%, 10/1/52 | |
| FHLMC Pool #SD8023, 2.50%, 11/1/49 | |
| FHLMC Pool #SD8163, 3.50%, 8/1/51 | |
| FHLMC Pool #SD8173, 2.50%, 10/1/51 | |
| FHLMC Pool #SD8256, 4.00%, 10/1/52 | |
| FNMA Pool #AB2346, 4.50%, 2/1/41 | |
| FNMA Pool #AB5231, 2.50%, 5/1/27 | |
| FNMA Pool #AB5716, 3.00%, 7/1/27 | |
| FNMA Pool #AI4285, 5.00%, 6/1/41 | |
| FNMA Pool #AR6394, 3.00%, 2/1/43 | |
| FNMA Pool #AS5892, 3.50%, 10/1/45 | |
| FNMA Pool #AS6102, 3.50%, 11/1/45 | |
See Notes to Financial Statements.
| | |
RESIDENTIAL MORTGAGE-BACKED SECURITIES 26.1% (continued) |
| FNMA Pool #AS6205, 3.50%, 11/1/45 | |
| FNMA Pool #AS6385, 4.00%, 12/1/45 | |
| FNMA Pool #AS9562, 3.00%, 5/1/47 | |
| FNMA Pool #AU4279, 3.00%, 9/1/43 | |
| FNMA Pool #AV0703, 4.00%, 12/1/43 | |
| FNMA Pool #AW7362, 2.50%, 8/1/29 | |
| FNMA Pool #AX0416, 4.00%, 8/1/44 | |
| FNMA Pool #AY1670, 3.50%, 2/1/45 | |
| FNMA Pool #AY4195, 4.00%, 5/1/45 | |
| FNMA Pool #BA3885, 3.50%, 11/1/45 | |
| FNMA Pool #CA2320, 3.50%, 9/1/48 | |
| FNMA Pool #CA5540, 3.00%, 4/1/50 | |
| FNMA Pool #CB0856, 3.00%, 6/1/51 | |
| FNMA Pool #CB5892, 4.50%, 3/1/53 | |
| FNMA Pool #FM9834, 3.50%, 6/1/49 | |
| FNMA Pool #MA0641, 4.00%, 2/1/31 | |
| FNMA Pool #MA4012, 2.00%, 5/1/35 | |
| FNMA Pool #MA4548, 2.50%, 2/1/52 | |
| FNMA REMIC Trust Series 2013-18, Series 2013-18, Class AE, 2.00%, 3/25/28 | |
| GNMA, Series 2011-136, Class GB, 2.50%, 5/20/40 | |
| GNMA, Series 2021-98, Class IG, IO, 3.00%, 6/20/51 | |
| GNMA II Pool #5332, 4.00%, 3/20/42 | |
| GNMA II Pool #MA3937, 3.50%, 9/20/46 | |
| GNMA II Pool #MA7054, 3.50%, 12/20/50 | |
| GNMA II Pool #MA7651, 3.50%, 10/20/51 | |
| GNMA II Pool #MA7705, MBS, 2.50%, 11/20/51 | |
| GNMA II Pool #MA8043, POOL #MA8043, 3.00%, 5/20/52 | |
| GNMA II Pool #MA8945, 4.00%, 6/20/53 | |
| GNMA II Pool #MA9527, 5.00%, 3/20/54 | |
TOTAL RESIDENTIAL MORTGAGE-BACKED SECURITIES
(Cost $10,187,978) | |
U.S. TREASURY OBLIGATIONS 27.4% |
| U.S. Treasury Bonds, 3.50%, 2/15/39 | |
| U.S. Treasury Bonds, 1.13%, 5/15/40 | |
| U.S. Treasury Bonds, 3.88%, 5/15/43 | |
| U.S. Treasury Bonds, 3.00%, 2/15/48 | |
| U.S. Treasury Bonds, 2.25%, 2/15/52 | |
| U.S. Treasury Notes, 3.00%, 9/30/25(3) | |
| U.S. Treasury Notes, 4.63%, 2/28/26 | |
| U.S. Treasury Notes, 4.50%, 7/15/26 | |
| U.S. Treasury Notes, 2.25%, 8/15/27 | |
| U.S. Treasury Notes, 2.75%, 2/15/28 | |
| U.S. Treasury Notes, 3.63%, 8/31/29 | |
| U.S. Treasury Notes, 1.50%, 2/15/30 | |
| | |
U.S. TREASURY OBLIGATIONS 27.4% (continued) |
| U.S. Treasury Notes, 2.75%, 8/15/32 | |
| U.S. Treasury Notes, 3.88%, 8/15/33 | |
| U.S. Treasury Notes, 4.00%, 2/15/34 | |
TOTAL U.S. TREASURY OBLIGATIONS
(Cost $9,967,775) | |
| | |
SHORT-TERM INVESTMENTS 8.7% |
| |
| State Street Institutional U.S. Government Money Market Fund, Premier Class, 4.43%(4) | |
| State Street Navigator Securities Lending Government Money Market Portfolio(5) | |
| | |
TOTAL SHORT-TERM INVESTMENTS
(Cost $3,058,926) | |
TOTAL INVESTMENTS IN SECURITIES 103.5%
(Cost $38,369,341) | |
EXCESS OF LIABILITIES OVER CASH AND OTHER ASSETS (3.5)% | |
| |
| Pursuant to Rule 144A under the Securities Act of 1933, this security can only be sold to qualified institutional investors. |
| Floating or variable rate security. The rate disclosed is the rate in effect as of December 31, 2024. The information in parentheses represents the benchmark and reference rate for each relevant security and the rate adjusts based upon the reference rate and spread. The security may be further subject to interest rate floor and caps. For securities which do not indicate a reference rate and spread in their descriptions, the interest rate adjusts periodically based on current interest rates and, for mortgage-backed securities, prepayments in the underlying pool of assets. |
| A portion or all of the security was held on loan. As of December 31, 2024, the market value of the securities on loan was $2,998,375. |
| Rate reflects 7 day yield as of December 31, 2024. |
| Securities with an aggregate market value of $2,998,375 were out on loan in exchange for collateral including $1,438,938 of cash collateral as of December 31, 2024. The collateral was invested in a cash collateral reinvestment vehicle. See Note 1(K). |
| Constant Maturity Treasury. |
| Federal Home Loan Mortgage Corp. |
| Federal National Mortgage Association. |
| Government National Mortgage Association. |
| Real Estate Investment Trusts. |
| Real Estate Mortgage Investment Conduit. |
| Secured Overnight Financing Rate. |
See Notes to Financial Statements.
Schedule of Investments (continued)
The following table summarizes the inputs used to value the Fund's investments in securities as of December 31, 2024 (See Note 1(B)):
Investments in Securities: | | | | |
| | | | |
Collateralized Mortgage Obligations | | | | |
Commercial Mortgage-Backed Securities | | | | |
| | | | |
Long-Term Municipal Securities* | | | | |
Residential Mortgage-Backed Securities | | | | |
U.S. Treasury Obligations | | | | |
| | | | |
Total Investments in Securities | | | | |
| See Schedule of Investments for further breakdown by category. |
See Notes to Financial Statements.
Statements of Assets and Liabilitiesat December 31, 2024
| Value Line Small Cap
Opportunities Fund, Inc. | Value Line Mid Cap
Focused
Fund, Inc. |
| | |
Investments in securities, at value* | | |
Receivable for capital shares sold | | |
Dividends and interest receivable | | |
| | |
Receivable for securities lending income | | |
| | |
| | |
Payable upon return of securities on loan (See Note 1(K)) | | |
Payable for securities purchased | | |
Payable for capital shares redeemed | | |
| | |
| | |
Service and distribution plan fees | | |
| | |
Custody and accounting fees payable | | |
Auditing and legal fees payable | | |
| | |
| | |
Directors’ fees and expenses | | |
| | |
| | |
Commitments and contingent liabilities(1) | | |
| | |
| | |
Capital stock, at $0.001 and $1.00 par value, respectively (authorized 300,000,000 and 50,000,000 shares, respectively) | | |
Additional paid-in capital | | |
Distributable Earnings/(Loss) | | |
| | |
Net Asset Value Per Share | | |
| | |
| | |
| | |
Net Asset Value, Offering and Redemption Price per Outstanding Share | | |
| | |
| | |
| | |
Net Asset Value, Offering and Redemption Price per Outstanding Share | | |
*Includes securities on loan of | | |
| | |
| See Note 5 in Notes to the Financial Statements. |
See Notes to Financial Statements.
Statements of Assets and Liabilities at December 31, 2024 (continued)
| Value Line Select
Growth
Fund, Inc. | Value Line Larger
Companies Focused
Fund, Inc. |
| | |
Investments in securities, at value* | | |
| | |
Dividends and interest receivable | | |
| | |
Receivable for capital shares sold | | |
Receivable for securities lending income | | |
| | |
| | |
Payable for capital shares redeemed | | |
Payable upon return of securities on loan (See Note 1(K)) | | |
| | |
| | |
Service and distribution plan fees | | |
Custody and accounting fees payable | | |
| | |
Auditing and legal fees payable | | |
| | |
Directors’ fees and expenses | | |
| | |
| | |
Commitments and contingent liabilities(1) | | |
| | |
| | |
Capital stock, at $1.00 par value (authorized 100,000,000 and 50,000,000 shares, respectively) | | |
Additional paid-in capital | | |
Distributable Earnings/(Loss) | | |
| | |
Net Asset Value Per Share | | |
| | |
| | |
| | |
Net Asset Value, Offering and Redemption Price per Outstanding Share | | |
| | |
| | |
| | |
Net Asset Value, Offering and Redemption Price per Outstanding Share | | |
*Includes securities on loan of | | |
| | |
| See Note 5 in Notes to the Financial Statements. |
See Notes to Financial Statements.
Statements of Assets and Liabilities at December 31, 2024 (continued)
| Value Line Asset
Allocation Fund, Inc. | Value Line Capital
Appreciation
Fund, Inc. |
| | |
Investments in securities, at value* | | |
Dividends and interest receivable | | |
Receivable for capital shares sold | | |
| | |
Receivable for securities lending income | | |
Receivable for securities sold | | |
| | |
| | |
Payable upon return of securities on loan (See Note 1(K)) | | |
Payable for capital shares redeemed | | |
| | |
| | |
Service and distribution plan fees | | |
Custody and accounting fees payable | | |
| | |
Auditing and legal fees payable | | |
| | |
Directors’ fees and expenses | | |
| | |
| | |
Commitments and contingent liabilities(1) | | |
| | |
| | |
Capital stock, at $0.001 and $1.00 par value, respectively (authorized 300,000,000 and 75,000,000 shares, respectively) | | |
Additional paid-in capital | | |
Distributable Earnings/(Loss) | | |
| | |
Net Asset Value Per Share | | |
| | |
| | |
| | |
Net Asset Value, Offering and Redemption Price per Outstanding Share | | |
| | |
| | |
| | |
Net Asset Value, Offering and Redemption Price per Outstanding Share | | |
*Includes securities on loan of | | |
| | |
| See Note 5 in Notes to the Financial Statements. |
See Notes to Financial Statements.
Statements of Assets and Liabilities at December 31, 2024 (continued)
| |
| |
Investments in securities, at value* | |
Dividends and interest receivable | |
| |
Receivable for capital shares sold | |
Receivable for securities lending income | |
| |
| |
Payable upon return of securities on loan (See Note 1(K)) | |
Dividends payable to shareholders | |
Payable for capital shares redeemed | |
| |
Custody and accounting fees payable | |
Auditing and legal fees payable | |
| |
| |
| |
Directors’ fees and expenses | |
| |
| |
Commitments and contingent liabilities(1) | |
| |
| |
Capital stock, at $0.01 par value (authorized unlimited shares) | |
Additional paid-in capital | |
Distributable Earnings/(Loss) | |
| |
Net Asset Value Per Share | |
| |
| |
| |
Net Asset Value, Offering and Redemption Price per Outstanding Share | |
*Includes securities on loan of | |
| |
| See Note 5 in Notes to the Financial Statements. |
See Notes to Financial Statements.
| Value Line Small Cap
Opportunities Fund, Inc. | Value Line Mid Cap
Focused
Fund, Inc. |
| | |
Dividends (net of foreign withholding tax of $0 and $77,401, respectively) | | |
Securities lending income (Net) | | |
| | |
| | |
| | |
Service and distribution plan fees | | |
| | |
| | |
Printing and postage fees | | |
Custody and accounting fees | | |
Registration and filing fees | | |
| | |
Directors’ fees and expenses | | |
| | |
Compliance and tax service fees | | |
| | |
| | |
Total Expenses Before Fees Waived (See Note 5) | | |
Less: Fees Waived/Reimbursed by the Advisor | | |
| | |
Net Investment Income/(Loss) | | |
Net Realized and Unrealized Gain/(Loss) on Investments and Foreign Exchange Transactions: | | |
Net Realized Gain/(Loss) From: | | |
Investments in securities | | |
Foreign currency transactions | | |
| | |
Change in Net Unrealized Appreciation/(Depreciation) of: | | |
Investments in securities | | |
Net Realized Gain/(Loss) and Change in Net Unrealized Appreciation/(Depreciation) on Investments and Foreign Exchange Transactions | | |
Net Increase/(Decrease) in Net Assets from Operations | | |
See Notes to Financial Statements.
Statements of Operations (continued)
| Value Line Select
Growth
Fund, Inc. | Value Line Larger
Companies Focused
Fund, Inc. |
| | |
Dividends (net of foreign withholding tax of $9,979 and $0, respectively) | | |
Securities lending income (Net) | | |
| | |
| | |
| | |
Service and distribution plan fees | | |
| | |
| | |
| | |
Custody and accounting fees | | |
Registration and filing fees | | |
Directors’ fees and expenses | | |
Printing and postage fees | | |
| | |
Compliance and tax service fees | | |
| | |
| | |
| | |
Total Expenses Before Fees Waived (See Note 5) | | |
Less: Fees Waived/Reimbursed by the Advisor | | |
| | |
Net Investment Income/(Loss) | | |
Net Realized and Unrealized Gain/(Loss) on Investments and Foreign Exchange Transactions: | | |
Net Realized Gain/(Loss) From: | | |
Investments in securities | | |
Foreign currency transactions | | |
| | |
Change in Net Unrealized Appreciation/(Depreciation) of: | | |
Investments in securities | | |
Net Realized Gain/(Loss) and Change in Net Unrealized Appreciation/(Depreciation) on Investments and Foreign Exchange Transactions | | |
Net Increase/(Decrease) in Net Assets from Operations | | |
See Notes to Financial Statements.
Statements of Operations (continued)
| Value Line Asset
Allocation Fund, Inc. | Value Line Capital
Appreciation
Fund, Inc. |
| | |
| | |
Dividends (net of foreign withholding tax of $2,488 and $10,951, respectively) | | |
Securities lending income (Net) | | |
| | |
| | |
| | |
Service and distribution plan fees | | |
| | |
| | |
| | |
Custody and accounting fees | | |
Printing and postage fees | | |
Directors’ fees and expenses | | |
Registration and filing fees | | |
Compliance and tax service fees | | |
| | |
| | |
| | |
| | |
Total Expenses Before Fees Waived (See Note 5) | | |
Less: Fees Waived/Reimbursed by the Advisor | | |
| | |
Net Investment Income/(Loss) | | |
Net Realized and Unrealized Gain/(Loss) on Investments and Foreign Exchange Transactions: | | |
Net Realized Gain/(Loss) From: | | |
Investments in securities | | |
Foreign currency transactions | | |
| | |
Change in Net Unrealized Appreciation/(Depreciation) of: | | |
Investments in securities | | |
Net Realized Gain/(Loss) and Change in Net Unrealized Appreciation/(Depreciation) on Investments | | |
Net Increase/(Decrease) in Net Assets from Operations | | |
See Notes to Financial Statements.
Statements of Operations (continued)
| |
| |
| |
| |
Securities lending income (Net) | |
| |
| |
| |
Service and distribution plan fees | |
Custody and accounting fees | |
| |
| |
| |
Registration and filing fees | |
Compliance and tax service fees | |
Printing and postage fees | |
Directors’ fees and expenses | |
| |
| |
Total Expenses Before Fees Waived (See Note 5) | |
Less: Fees Waived/Reimbursed by the Advisor | |
Less: Service and Distribution Plan Fees Waived | |
| |
Net Investment Income/(Loss) | |
Net Realized and Unrealized Gain/(Loss) on Investments: | |
Net Realized Gain/(Loss) From: | |
Investments in securities | |
Change in Net Unrealized Appreciation/(Depreciation) of: | |
Investments in securities | |
Net Realized Gain/(Loss) and Change in Net Unrealized Appreciation/(Depreciation) on Investments | |
Net Increase/(Decrease) in Net Assets from Operations | |
See Notes to Financial Statements.
Statements of Changes in Net Assets
| Value Line Small Cap
Opportunities Fund, Inc. | Value Line Mid Cap
Focused Fund, Inc. |
| Year Ended
December 31, 2024 | Year Ended
December 31, 2023 | Year Ended
December 31, 2024 | Year Ended
December 31, 2023 |
| | | | |
Net investment income/(loss) | | | | |
Net realized gain/(loss) on investments | | | | |
Change in net unrealized appreciation/(depreciation) on investments | | | | |
Net increase/(decrease) in net assets from operations | | | | |
Distributions to Shareholders from: | | | | |
| | | | |
| | | | |
| | | | |
| | | | |
Proceeds from sale of shares | | | | |
| | | | |
| | | | |
Proceeds from reinvestment of distributions to shareholders | | | | |
| | | | |
| | | | |
| | | | |
| | | | |
| | | | |
Net increase/(decrease) in net assets from capital share transactions | | | | |
Total increase in net assets | | | | |
| | | | |
| | | | |
| | | | |
Capital Share Transactions: | | | | |
| | | | |
| | | | |
| | | | |
Shares issued to shareholders in reinvestment of distributions | | | | |
| | | | |
| | | | |
| | | | |
| | | | |
| | | | |
See Notes to Financial Statements.
Statements of Changes in Net Assets (continued)
| Value Line Select
Growth Fund, Inc. | Value Line Larger Companies
Focused Fund, Inc. |
| Year Ended
December 31, 2024 | Year Ended
December 31, 2023 | Year Ended
December 31, 2024 | Year Ended
December 31, 2023 |
| | | | |
Net investment income/(loss) | | | | |
Net realized gain/(loss) on investments and foreign currency | | | | |
Change in net unrealized appreciation/(depreciation) on investments | | | | |
Net increase/(decrease) in net assets from operations | | | | |
Distributions to Shareholders from: | | | | |
| | | | |
| | | | |
| | | | |
| | | | |
Proceeds from sale of shares | | | | |
| | | | |
| | | | |
Proceeds from reinvestment of distributions to shareholders | | | | |
| | | | |
| | | | |
| | | | |
| | | | |
| | | | |
Net increase/(decrease) in net assets from capital share transactions | | | | |
Total increase in net assets | | | | |
| | | | |
| | | | |
| | | | |
Capital Share Transactions: | | | | |
| | | | |
| | | | |
| | | | |
Shares issued to shareholders in reinvestment of distributions | | | | |
| | | | |
| | | | |
| | | | |
| | | | |
| | | | |
See Notes to Financial Statements.
Statements of Changes in Net Assets (continued)
| Value Line Asset
Allocation Fund, Inc. | Value Line Capital
Appreciation Fund, Inc. |
| Year Ended
December 31, 2024 | Year Ended
December 31, 2023 | Year Ended
December 31, 2024 | Year Ended
December 31, 2023 |
| | | | |
Net investment income/(loss) | | | | |
Net realized gain/(loss) on investments and foreign currency | | | | |
Change in net unrealized appreciation/(depreciation) on investments | | | | |
Net increase/(decrease) in net assets from operations | | | | |
Distributions to Shareholders from: | | | | |
| | | | |
| | | | |
| | | | |
| | | | |
Proceeds from sale of shares | | | | |
| | | | |
| | | | |
Proceeds from reinvestment of distributions to shareholders | | | | |
| | | | |
| | | | |
| | | | |
| | | | |
| | | | |
Net increase/(decrease) in net assets from capital share transactions | | | | |
Total increase/(decrease) in net assets | | | | |
| | | | |
| | | | |
| | | | |
Capital Share Transactions: | | | | |
| | | | |
| | | | |
| | | | |
Shares issued to shareholders in reinvestment of distributions | | | | |
| | | | |
| | | | |
| | | | |
| | | | |
| | | | |
See Notes to Financial Statements.
Statements of Changes in Net Assets (continued)
| |
| Year Ended
December 31, 2024 | Year Ended
December 31, 2023 |
| | |
Net investment income/(loss) | | |
Net realized gain/(loss) on investments | | |
Change in net unrealized appreciation/(depreciation) on investments | | |
Net increase/(decrease) in net assets from operations | | |
Distributions to Shareholders from: | | |
| | |
Share Transactions (Investor Class): | | |
Proceeds from sale of shares | | |
Proceeds from reinvestment of distributions to shareholders | | |
| | |
Net increase/(decrease) in net assets from capital share transactions | | |
Total decrease in net assets | | |
| | |
| | |
| | |
Capital Share Transactions (Investor Class): | | |
| | |
Shares issued to shareholders in reinvestment of dividends | | |
| | |
See Notes to Financial Statements.
Value Line Small Cap Opportunities Fund, Inc.
Financial Highlights
Selected data for a share of capital stock outstanding throughout each year:
| Value Line Small Cap Opportunities Fund, Inc.
Investor Class |
| | | |
| | | | | | |
| | | | | | |
Net asset value, beginning of year | | | | | | |
Income/(loss) from investment operations: | | | | | |
Net investment income/(loss)(1) | | | | | | |
Net gains/(losses) on securities (both realized and unrealized) | | | | | | |
Total from investment operations | | | | | | |
| | | | | | |
Distributions from net realized gains | | | | | | |
| | | | | | |
Net asset value, end of year | | | | | | |
| | | | | | |
Ratios/Supplemental Data: | | | | | | |
Net assets, end of year (in thousands) | | | | | | |
Ratio of expenses to average net assets | | | | | | |
Ratio of net investment income/(loss) to average net assets | | | | | | |
| | | | | | |
| Value Line Small Cap Opportunities Fund, Inc.
Institutional Class |
| | | |
| | | | | | |
| | | | | | |
Net asset value, beginning of year | | | | | | |
Income/(loss) from investment operations: | | | | | |
Net investment income/(loss)(1) | | | | | | |
Net gains/(losses) on securities (both realized and unrealized) | | | | | | |
Total from investment operations | | | | | | |
| | | | | | |
Distributions from net realized gains | | | | | | |
| | | | | | |
Net asset value, end of year | | | | | | |
| | | | | | |
Ratios/Supplemental Data: | | | | | | |
Net assets, end of year (in thousands) | | | | | | |
Ratio of gross expenses to average net assets | | | | | | |
Ratio of net expenses to average net assets | | | | | | |
Ratio of net investment income/(loss) to average net assets | | | | | | |
| | | | | | |
| For the nine month period ended December 31, 2022. |
| Per share amounts are calculated based on average shares outstanding during the year. |
| |
| |
| Amount is less than $0.01 per share. |
See Notes to Financial Statements.
Value Line Mid Cap Focused Fund, Inc.
Financial Highlights
Selected data for a share of capital stock outstanding throughout each year:
| Value Line Mid Cap Focused Fund, Inc.
Investor Class |
| |
| | | | | |
| | | | | |
Net asset value, beginning of year | | | | | |
Income/(loss) from investment operations: | | | | |
Net investment income/(loss)(1) | | | | | |
Net gains/(losses) on securities (both realized and unrealized) | | | | | |
Total from investment operations | | | | | |
| | | | | |
Dividends from net investment income | | | | | |
Distributions from net realized gains | | | | | |
| | | | | |
Net asset value, end of year | | | | | |
| | | | | |
Ratios/Supplemental Data: | | | | | |
Net assets, end of year (in thousands) | | | | | |
Ratio of expenses to average net assets | | | | | |
Ratio of net investment income/(loss) to average net assets | | | | | |
| | | | | |
| Value Line Mid Cap Focused Fund, Inc.
Institutional Class |
| |
| | | | | |
| | | | | |
Net asset value, beginning of year | | | | | |
Income/(loss) from investment operations: | | | | |
Net investment income/(loss)(1) | | | | | |
Net gains/(losses) on securities (both realized and unrealized) | | | | | |
Total from investment operations | | | | | |
| | | | | |
Dividends from net investment income | | | | | |
Distributions from net realized gains | | | | | |
| | | | | |
Net asset value, end of year | | | | | |
| | | | | |
Ratios/Supplemental Data: | | | | | |
Net assets, end of year (in thousands) | | | | | |
Ratio of gross expenses to average net assets | | | | | |
Ratio of net expenses to average net assets | | | | | |
Ratio of net investment income/(loss) to average net assets | | | | | |
| | | | | |
| Per share amounts are calculated based on average shares outstanding during the year. |
| Includes income resulting from special dividends. For the year ended December 31, 2021, without these dividends, the per share value for the Investor Class and Institutional Class would have been $(0.18) and $(0.09), respectively, and the ratio for the Investor Class and Institutional Class would have been (0.59)% and (0.30)%, respectively. |
| Amount is less than 0.50%. |
See Notes to Financial Statements.
Value Line Select Growth Fund, Inc.
Financial Highlights
Selected data for a share of capital stock outstanding throughout each year:
| Value Line Select Growth Fund, Inc.
Investor Class |
| |
| | | | | |
| | | | | |
Net asset value, beginning of year | | | | | |
Income/(loss) from investment operations: | | | | |
Net investment income/(loss)(1) | | | | | |
Net gains/(losses) on securities (both realized and unrealized) | | | | | |
Total from investment operations | | | | | |
| | | | | |
Dividends from net investment income | | | | | |
Distributions from net realized gains | | | | | |
| | | | | |
Net asset value, end of year | | | | | |
| | | | | |
Ratios/Supplemental Data: | | | | | |
Net assets, end of year (in thousands) | | | | | |
Ratio of expenses to average net assets | | | | | |
Ratio of net investment income/(loss) to average net assets | | | | | |
| | | | | |
| Value Line Select Growth Fund, Inc.
Institutional Class |
| | |
| | | | | |
| | | | | |
Net asset value, beginning of year | | | | | |
Income/(loss) from investment operations: | | | | |
Net investment income/(loss)(1) | | | | | |
Net gains/(losses) on securities (both realized and unrealized) | | | | | |
Total from investment operations | | | | | |
| | | | | |
Dividends from net investment income | | | | | |
Distributions from net realized gains | | | | | |
| | | | | |
Net asset value, end of year | | | | | |
| | | | | |
Ratios/Supplemental Data: | | | | | |
Net assets, end of year (in thousands) | | | | | |
Ratio of gross expenses to average net assets | | | | | |
Ratio of net expenses to average net assets | | | | | |
Ratio of net investment income/(loss) to average net assets | | | | | |
| | | | | |
| Per share amounts are calculated based on average shares outstanding during the year. |
| Commenced operations on May 1, 2020. |
| |
| |
See Notes to Financial Statements.
Value Line Larger Companies Focused Fund, Inc.
Financial Highlights
Selected data for a share of capital stock outstanding throughout each year:
| Value Line Larger Companies Focused Fund, Inc.
Investor Class |
| |
| | | | | |
| | | | | |
Net asset value, beginning of year | | | | | |
Income/(loss) from investment operations: | | | | |
Net investment income/(loss)(1) | | | | | |
Net gains/(losses) on securities (both realized and unrealized) | | | | | |
Total from investment operations | | | | | |
| | | | | |
Distributions from net realized gains | | | | | |
| | | | | |
Net asset value, end of year | | | | | |
| | | | | |
Ratios/Supplemental Data: | | | | | |
Net assets, end of year (in thousands) | | | | | |
Ratio of gross expenses to average net assets | | | | | |
Ratio of net expenses to average net assets | | | | | |
Ratio of net investment income/(loss) to average net assets | | | | | |
| | | | | |
| Value Line Larger Companies Focused Fund, Inc.
Institutional Class |
| |
| | | | | |
| | | | | |
Net asset value, beginning of year | | | | | |
Income/(loss) from investment operations: | | | | |
Net investment income/(loss)(1) | | | | | |
Net gains/(losses) on securities (both realized and unrealized) | | | | | |
Total from investment operations | | | | | |
| | | | | |
Distributions from net realized gains | | | | | |
| | | | | |
Net asset value, end of year | | | | | |
| | | | | |
Ratios/Supplemental Data: | | | | | |
Net assets, end of year (in thousands) | | | | | |
Ratio of gross expenses to average net assets | | | | | |
Ratio of net expenses to average net assets | | | | | |
Ratio of net investment income/(loss) to average net assets | | | | | |
| | | | | |
| Per share amounts are calculated based on average shares outstanding during the year. |
See Notes to Financial Statements.
Value Line Asset Allocation Fund, Inc.
Financial Highlights
Selected data for a share of capital stock outstanding throughout each year:
| Value Line Asset Allocation Fund, Inc.
Investor Class |
| | | |
| | | | | | |
| | | | | | |
Net asset value, beginning of year | | | | | | |
Income/(loss) from investment operations: | | | | | |
Net investment income/(loss)(1) | | | | | | |
Net gains/(losses) on securities (both realized and unrealized) | | | | | | |
Total from investment operations | | | | | | |
| | | | | | |
Dividends from net investment income | | | | | | |
Distributions from net realized gains | | | | | | |
| | | | | | |
Net asset value, end of year | | | | | | |
| | | | | | |
Ratios/Supplemental Data: | | | | | | |
Net assets, end of year (in thousands) | | | | | | |
Ratio of gross expenses to average net assets | | | | | | |
Ratio of net investment income/(loss) to average net assets | | | | | | |
| | | | | | |
| Value Line Asset Allocation Fund, Inc.
Institutional Class |
| | | |
| | | | | | |
| | | | | | |
Net asset value, beginning of year | | | | | | |
Income/(loss) from investment operations: | | | | | |
Net investment income/(loss)(1) | | | | | | |
Net gains/(losses) on securities (both realized and unrealized) | | | | | | |
Total from investment operations | | | | | | |
| | | | | | |
Dividends from net investment income | | | | | | |
Distributions from net realized gains | | | | | | |
| | | | | | |
Net asset value, end of year | | | | | | |
| | | | | | |
Ratios/Supplemental Data: | | | | | | |
Net assets, end of year (in thousands) | | | | | | |
Ratio of gross expenses to average net assets | | | | | | |
Ratio of net expenses to average net assets | | | | | | |
Ratio of net investment income/(loss) to average net assets | | | | | | |
| | | | | | |
| For the nine month period ended December 31, 2022. |
| Per share amounts are calculated based on average shares outstanding during the year. |
| Amount is less than $0.01 per share. |
| |
| |
See Notes to Financial Statements.
Value Line Capital Appreciation Fund, Inc.
Financial Highlights
Selected data for a share of capital stock outstanding throughout each year:
| Value Line Capital Appreciation Fund, Inc.
Investor Class |
| |
| | | | | |
| | | | | |
Net asset value, beginning of year | | | | | |
Income/(loss) from investment operations: | | | | |
Net investment income/(loss)(1) | | | | | |
Net gains/(losses) on securities (both realized and unrealized) | | | | | |
Total from investment operations | | | | | |
| | | | | |
Dividends from net investment income | | | | | |
Distributions from net realized gains | | | | | |
| | | | | |
Net asset value, end of year | | | | | |
| | | | | |
Ratios/Supplemental Data: | | | | | |
Net assets, end of year (in thousands) | | | | | |
Ratio of expenses to average net assets | | | | | |
Ratio of net investment income/(loss) to average net assets | | | | | |
| | | | | |
| Value Line Capital Appreciation Fund, Inc.
Institutional Class |
| |
| | | | | |
| | | | | |
Net asset value, beginning of year | | | | | |
Income/(loss) from investment operations: | | | | |
Net investment income/(loss)(1) | | | | | |
Net gains/(losses) on securities (both realized and unrealized) | | | | | |
Total from investment operations | | | | | |
| | | | | |
Dividends from net investment income | | | | | |
Distributions from net realized gains | | | | | |
| | | | | |
Net asset value, end of year | | | | | |
| | | | | |
Ratios/Supplemental Data: | | | | | |
Net assets, end of year (in thousands) | | | | | |
Ratio of gross expenses to average net assets | | | | | |
Ratio of net expenses to average net assets | | | | | |
Ratio of net investment income/(loss) to average net assets | | | | | |
| | | | | |
| Per share amounts are calculated based on average shares outstanding during the year. |
| Amount is less than $0.01 per share. |
See Notes to Financial Statements.
Value Line Core Bond Fund
Financial Highlights
Selected data for a share of capital stock outstanding throughout each year:
| Value Line Core Bond Fund
Investor Class |
| |
| | | | | |
Net asset value, beginning of year | | | | | |
Income/(loss) from investment operations: | | | | | |
Net investment income/(loss)(1) | | | | | |
Net gains/(losses) on securities (both realized and unrealized) | | | | | |
Total from investment operations | | | | | |
| | | | | |
Dividends from net investment income | | | | | |
Distributions from net realized gains | | | | | |
| | | | | |
Net asset value, end of year | | | | | |
| | | | | |
Ratios/Supplemental Data: | | | | | |
Net assets, end of year (in thousands) | | | | | |
Ratio of gross expenses to average net assets | | | | | |
Ratio of net expenses to average net assets | | | | | |
Ratio of net investment income/(loss) to average net assets | | | | | |
| | | | | |
| Per share amounts are calculated based on average shares outstanding during the year. |
See Notes to Financial Statements.
Notes to Financial Statements
1. Significant Accounting Policies
Value Line Small Cap Opportunities Fund, Inc., Value Line Mid Cap Focused Fund, Inc., Value Line Select Growth Fund, Inc., Value Line Larger Companies Focused Fund, Inc., Value Line Asset Allocation Fund, Inc., Value Line Capital Appreciation Fund, Inc. and Value Line Core Bond Fund (individually a “Fund” and collectively, the “Funds”) are each registered under the Investment Company Act of 1940, as amended (the “1940 Act”), as diversified, open-end management investment companies. The Funds each (except for Value Line Core Bond Fund) offer two classes of shares: Investor Class shares and Institutional Class shares. Value Line Core Bond Fund offers only Investor Class shares. Investor Class shares are available to any investor who meets the Fund’s minimum purchase requirement. Institutional Class shares are designed for investors who meet certain administrative, service and account size criteria. The Value Line Family of Funds (the “Value Line Funds”) is a family of mutual funds that consists of a variety of equity, fixed income, and hybrid funds. The investment objective of each Fund is listed below.
| |
Value Line Small Cap Opportunities Fund, Inc. | The Fund seeks long-term capital growth. |
Value Line Mid Cap Focused Fund, Inc. | The Fund seeks long-term capital growth. |
Value Line Select Growth Fund, Inc. | The Fund seeks long-term capital growth. |
Value Line Larger Companies Focused Fund, Inc. | The Fund seeks long-term capital growth. |
Value Line Asset Allocation Fund, Inc. | The Fund seeks high total investment return. |
Value Line Capital Appreciation Fund, Inc. | The Fund seeks capital appreciation and income. |
Value Line Core Bond Fund | The Fund seeks to maximize current income and secondarily capital appreciation. |
Each Fund follows the investment company accounting and reporting guidance of the Financial Accounting Standards Board (“FASB”) Accounting Standards Codification Topic 946 Financial Services — Investment Companies.
The preparation of financial statements in conformity with generally accepted accounting principles requires management to make estimates and assumptions that affect the reported amounts of assets and liabilities and disclosure of contingent assets and liabilities at the date of the financial statements and the reported amounts of revenues and expenses during the reporting period. Actual results may differ from those estimates. The following is a summary of significant accounting policies consistently followed by the Funds in the preparation of their financial statements.
(A) Security Valuation: In accordance with Rule 2a-5 under the 1940 Act, the Board of Directors (the "Board") has designated EULAV Asset Management (the "Adviser") as its valuation designee (the "Valuation Designee"). As Valuation Designee, the Adviser, subject to the oversight of the Board, is responsible for making fair valuation determinations in accordance with procedures (the "Pricing Procedures") approved by the Board. The Adviser's day-to-day responsibilities as Valuation Designee are performed by a pricing committee established by the Adviser (the "Committee").
Securities listed on a securities exchange are valued at the closing sales prices on the date as of which the net asset value (“NAV”) is being determined. Securities traded on the National Association of Securities Dealers Automated Quotations (“NASDAQ”) Stock Market are valued at the NASDAQ Official Closing Price. In the absence of closing sales prices for such securities and for securities traded in the over-the-counter market, the security is valued at the midpoint between the latest available and representative asked and bid prices. Short-term instruments with maturities of 60 days or less at the date of purchase are valued at amortized cost, which approximates fair value. Short-term instruments with maturities greater than 60 days at the date of purchase are valued at the midpoint between the latest available and representative asked and bid prices, and commencing 60 days prior to maturity such securities are valued at amortized cost.
Investments in shares of open-end mutual funds, including money market funds, are valued at their daily NAV which is calculated as of the close of regular trading on the New York Stock Exchange (“NYSE”) (usually 4:00 P.M. Eastern Time) on each day on which the NYSE is open for business. NAV per share is determined by dividing the funds' total net assets by the funds' total number of shares outstanding at the time of calculation.
Bonds and other fixed income securities are calculated on the valuation date by reference to valuations obtained from an independent pricing service that determines valuations for normal institutional-size trading units of debt securities, without exclusive reliance upon quoted prices. This service takes into account appropriate factors such as institutional-size trading in similar groups of securities, yield, quality, coupon rate, maturity, type of issue, trading characteristics and other market data in determining valuations. Bonds and fixed income securities are valued at the evaluated bid on the date as of which the NAV is being determined.
The Committee monitors the continued appropriateness of methods applied and determines if adjustments should be made in light of market changes, events affecting the issuer, or other factors. If the Committee determines that a valuation method may no longer be appropriate, another valuation method may be selected. The Board shall review the appropriateness of the valuation methods and these methods may be amended or supplemented from time to time by the Committee. In addition, the Funds may use the fair value of a security when the closing market price on the primary exchange where the security is traded no longer reflects the value of a security due to factors affecting one or more relevant securities markets or the specific issuer.
(B) Fair Value Measurements: The Funds follow fair valuation accounting standards which establish a definition of fair value and set out a hierarchy for measuring fair value. These standards require additional disclosures about the various inputs and valuation techniques used to develop the measurements of fair value and a discussion of changes in valuation techniques and related inputs during the period. These inputs are summarized in the three broad levels listed below:
•
Level 1 — Inputs that reflect unadjusted quoted prices in active markets for identical assets or liabilities that the Fund has the ability to access at the measurement date;
•
Level 2 — Inputs other than quoted prices that are observable for the asset or liability either directly or indirectly, including inputs in markets that are not considered to be active;
•
Level 3 — Inputs that are unobservable.
Transfers between investment levels may occur as the markets fluctuate and/or the availability of data used in an investment’s valuation changes. The inputs or methodologies used for valuing securities are not necessarily an indication of the risk associated with investing in those securities.
An investment asset's or liability's level within the fair value hierarchy is based on the lowest level input, individually or in aggregate, that is significant to fair value measurement. The objective of fair value measurement remains the same even when there is a significant decrease in the volume and level of activity for an asset or liability and regardless of the valuation techniques used.
(C) Federal Income Taxes: It is the policy of each Fund to continue to qualify as a regulated investment company by complying with the provisions available to regulated investment companies, as defined in applicable sections of the Internal Revenue Code, and to distribute all of its investment income and capital gains to its shareholders. Therefore, no provision for federal income tax is required.
As of December 31, 2024, and for all open tax years, management has analyzed the Funds’ tax positions taken on federal and state income tax returns, and has concluded that no provision for federal or state income tax is required in the Funds' financial statements. The Funds' federal and state income tax returns for tax years for which the applicable statutes of limitations have not expired are subject to examination by the Internal Revenue Service and the state departments of revenue. The Funds are not aware of any tax positions for which it is reasonably possible that the total amounts of unrecognized tax benefits will significantly change in the next twelve months.
(D) Security Transactions and Income: Securities transactions are recorded on a trade date basis. Realized gains and losses from securities transactions are calculated using the identified cost method. Interest income on investments, adjusted for amortization of discount and premium, if applicable, is earned from settlement date and recognized on the accrual basis. Dividend income is recorded on the ex-dividend date.
The Value Line Asset Allocation Fund, Inc., Value Line Capital Appreciation Fund, Inc. and Value Line Core Bond Fund may purchase mortgage pass-through securities on a to-be-announced (“TBA”) basis, with payment and delivery scheduled for a future date. These Funds may enter into a TBA agreement, sell the obligation to purchase the pools stipulated in the TBA agreement prior to the stipulated settlement date and enter into a new TBA agreement for future delivery of pools of mortgage pass-through securities (a “TBA roll”). A TBA roll is treated by the Fund as a purchase transaction and a sale transaction in which the Fund realizes a gain or loss. The Fund’s use of TBA rolls may cause the Fund to experience higher portfolio turnover and higher transaction costs. The Fund could be exposed to possible risk if there is an adverse market reaction, expenses or delays in connection with TBA transactions, or if the counterparty fails to complete the transaction.
The Value Line Core Bond Fund may invest in Treasury Inflation-Protected Securities (“TIPS”). The principal value and interest payout of TIPS are periodically adjusted according to the rate of inflation based on the Consumer Price Index. The adjustments for principal and income due to inflation are reflected in interest income in the Fund's Statement of Operations.
(E) Fund Distributions: Income dividends and capital gains distributions are automatically reinvested in additional shares of each Fund unless the shareholder has requested otherwise. Income earned by the Fund on weekends, holidays and other days on which the Fund is closed for business is declared as a dividend on the next day on which the Fund is open for business. The Funds (except for Value Line Core Bond Fund) distribute all of their net investment income annually. Value Line Core Bond Fund declares and pays dividends from its net investment income monthly. Net realized capital gains, if any, are distributed to shareholders annually or more frequently if necessary, to comply with the Internal Revenue Code.
Notes to Financial Statements (continued)
(F) Class Allocations: All income earned and expenses incurred by the Funds are borne on a pro-rata basis by each outstanding class of shares, based on the proportionate interest in the Fund represented by the shares of such class, except for class specific expenses which are allocated to the respective class. Expenses of the Fund are charged proportionately to each Fund or based on other appropriate methods. Realized and unrealized gains and losses are allocated between the share classes based on respective net assets.
| | | |
Value Line Small Cap Opportunities Fund, Inc. | | | |
| | | |
| | | |
Registration and filing fees | | | |
| | | |
| | | |
Value Line Mid Cap Focused Fund, Inc. | | | |
| | | |
| | | |
Registration and filing fees | | | |
| | | |
| | | |
Value Line Select Growth Fund, Inc. | | | |
| | | |
| | | |
Registration and filing fees | | | |
| | | |
| | | |
Value Line Larger Companies Focused Fund, Inc. | | | |
| | | |
| | | |
Registration and filing fees | | | |
| | | |
| | | |
Value Line Asset Allocation Fund, Inc. | | | |
| | | |
| | | |
Registration and filing fees | | | |
| | | |
| | | |
Value Line Capital Appreciation Fund, Inc. | | | |
| | | |
| | | |
Registration and filing fees | | | |
| | | |
(G) Foreign Currency Translation: The books and records of the Funds are maintained in U.S. dollars. Assets and liabilities which are denominated in foreign currencies are translated to U.S. dollars at the prevailing rates of exchange at the valuation date. The Funds do not isolate changes in the value of investments caused by foreign exchange rate differences from the changes due to other circumstances.
Income and expenses are translated to U.S. dollars based upon the rates of exchange on the respective dates of such transactions.
Net realized foreign exchange gains or losses arise from currency fluctuations realized between the trade and settlement dates on securities transactions, the differences between the U.S. dollar amounts of dividends, interest, and foreign withholding taxes recorded by the Funds, and the U.S. dollar equivalent of the amounts actually received or paid. Net unrealized foreign exchange gains and losses arise from changes in the value of assets and liabilities, other than investments, at the end of the fiscal period, resulting from changes in the exchange rates. The effect of the change in foreign exchange rates on the value of investments is included in realized gain/(loss) on investments and change in net unrealized appreciation/(depreciation) on investments.
(H) Representations and Indemnifications: In the normal course of business, the Funds enter into contracts that contain a variety of representations and warranties which provide general indemnifications. The Funds’ maximum exposure under these arrangements is unknown, as this would involve future claims that may be made against the Funds that have not yet occurred. However, based on experience, management expects the risk of loss to be remote.
(I) Accounting for Real Estate Investment Trusts: The Funds may own shares of Real Estate Investment Trusts (“REITs”) which report information on the source of their distributions annually. Distributions received from REITs during the year which represent a return of capital are recorded as a reduction of cost and distributions which represent a capital gain dividend are recorded as a realized long-term capital gain on investments.
(J) Foreign Taxes: The Funds may be subject to foreign taxes on income, gains on investments, or currency repatriation, a portion of which may be recoverable. The Funds will accrue such taxes and recoveries as applicable, based upon its current interpretation of tax rules and regulations that exist in the markets in which it invests.
(K) Securities Lending: Under an agreement with State Street Bank & Trust Company (“State Street”), the Funds can lend their securities to brokers, dealers and other financial institutions approved by the Board. The Funds or the borrower may terminate the loan at any time. By lending their investment securities, the Funds attempt to increase their net investment income through receipt of interest on the loan. Any gain or loss in the market price of the securities loaned that might occur and any interest or dividends declared during the term of the loan would accrue to the account of the Funds. Risks of delay in recovery of the securities or even loss of rights in the collateral may occur should the borrower of the securities fail financially. Generally, in the event of a counter-party default, the Funds have the right to use the collateral to offset the losses incurred. The lending fees received and the Funds’ portion of the interest income earned on the cash collateral are included in “Securities lending income (Net)” in the Statements of Operations.
Upon entering into a securities lending transaction, the Funds receive cash or other securities as collateral in an amount equal to or exceeding 102% of the current market value of the loaned securities. Any cash received as collateral is invested by State Street, acting in its capacity as securities lending agent (the “Agent”), in the Value Line Funds collateral account, which is subsequently invested into joint repurchase agreements and/or State Street Navigator Securities Lending Government Money Market Portfolio. When the Funds invest the cash collateral in the State Street Navigator Securities Lending Government Money Market Portfolio, a portion of the dividends received on the collateral is rebated to the borrower of the securities and the remainder is split between the Agent and the Funds. Investments made with the cash collateral are disclosed in the Schedules of Investments.
As of December 31, 2024, certain Funds loaned securities which were collateralized by cash and other securities. The value of the securities on loan and the value of the related collateral were as follows:
| Value of Securities
Loaned | |
Value Line Small Cap Opportunities Fund, Inc. | | |
Value Line Mid Cap Focused Fund, Inc. | | |
Value Line Larger Companies Focused Fund, Inc. | | |
Value Line Asset Allocation Fund, Inc. | | |
Notes to Financial Statements (continued)
| Value of Securities Loaned | |
Value Line Capital Appreciation Fund, Inc. | | |
Value Line Core Bond Fund | | |
| Value Line Small Cap Opportunities Fund, Inc., Value Line Mid Cap Focused Fund, Inc., Value Line Larger Companies Focused Fund, Inc., Value Line Asset Allocation Fund, Inc., Value Line Capital Appreciation Fund, Inc. and Value Line Core Bond Fund received cash collateral of $6,383,124, $1,394,942, $196,448, $20,474,643, $10,973,608 and $1,438,938, respectively, which was subsequently invested in the State Street Navigator Securities Lending Government Money Market Portfolio as reported in the Schedule of Investments. In addition, Value Line Small Cap Opportunities Fund, Inc. received non cash-collateral of $36,065,633 in the form of U.S. Government obligations, ranging from 0.38% — 4.63%, maturing 1/31/25 — 11/15/40, Value Line Mid Cap Focused Fund, Inc. received non cash-collateral of $3,226,830 in the form of U.S. Government obligations, ranging from 0.38% — 4.63%, maturing 1/31/26 — 8/15/53, Value Line Larger Companies Focused Fund, Inc. received non cash-collateral of $30,889,012 in the form of U.S. Government obligations, ranging from 0.01% — 5.38%, maturing 1/15/25 — 5/15/54, Value Line Asset Allocation Fund, Inc. received non cash-collateral of $21,088,215 in the form of U.S. Government obligations, ranging from 0.01% — 5.25%, maturing 1/2/25 — 8/15/54, Value Line Capital Appreciation Fund, Inc. received non cash-collateral of $35,021,333 in the form of U.S. Government obligations, ranging from 0.01% — 6.25%, maturing 1/15/25 — 8/15/54 and Value Line Core Bond Fund received non cash-collateral of $1,626,762 in the form of U.S. Government obligations, ranging from 0.01% — 6.25%, maturing 1/16/25 — 2/15/54. The Funds cannot sell or repledge the non-cash collateral which accordingly is not reflected in the Schedule of Investments. The value of securities loaned is determined at the close of business of the Funds and any additional required collateral is delivered to the Funds on the next business day. |
(L) Other Risks: The value of the Funds’ shares will go up and down, sometimes rapidly or unpredictably, based on the performance of the securities owned by the Funds and other factors generally affecting the securities market. Market risks, including political, regulatory, economic and social developments, can affect the value of the Funds’ investments. Natural disasters, public health emergencies, war, terrorism and other unforeseeable events may lead to increased market volatility and may have adverse long-term effects on world economies and markets generally.
(M) Subsequent Events: Management has evaluated all subsequent transactions and events through the date on which these financial statements were issued and has determined that no additional items require adjustment to or disclosure in the financial statements.
Securities issued by U.S. Government agencies or government-sponsored enterprises may not be guaranteed by the U.S. Treasury. The Government National Mortgage Association (“GNMA” or “Ginnie Mae”), a wholly-owned U.S. Government corporation, is authorized to guarantee, with the full faith and credit of the U.S. Government, the timely payment of principal and interest on securities issued by institutions approved by GNMA and backed by pools of mortgages insured by the Federal Housing Administration or guaranteed by the Department of Veterans Affairs. Government-related guarantors (i.e., not backed by the full faith and credit of the U.S. Government) include the Federal National Mortgage Association (“FNMA” or “Fannie Mae”) and the Federal Home Loan Mortgage Corporation (“FHLMC” or “Freddie Mac”). Pass-through securities issued by FNMA are guaranteed as to timely payment of principal and interest by FNMA, but are not backed by the full faith and credit of the U.S. Government. FHLMC guarantees the timely payment of interest and ultimate collection of principal, but its participation certificates are not backed by the full faith and credit of the U.S. Government.
3. Purchases and Sales of Securities
Purchases and sales of securities, excluding short-term investments, for the year ended December 31, 2024, were as follows:
| Purchases of
Investment
Securities
Excluding
U.S. Government
Securities | Sales of
Investment
Securities
Excluding
U.S. Government
Securities | Purchases of
U.S. Government
Obligations | Sales of U.S.
Government
Obligations |
Value Line Small Cap Opportunities Fund, Inc. | | | | |
Value Line Mid Cap Focused Fund, Inc. | | | | |
Value Line Select Growth Fund, Inc. | | | | |
Value Line Larger Companies Focused Fund, Inc. | | | | |
Value Line Asset Allocation Fund, Inc. | | | | |
| Purchases of Investment Securities Excluding U.S. Government Securities | Sales of Investment Securities Excluding U.S. Government Securities | Purchases of U.S. Government Obligations | Sales of U.S. Government Obligations |
Value Line Capital Appreciation Fund, Inc. | | | | |
Value Line Core Bond Fund | | | | |
At December 31, 2024, the federal tax cost and net unrealized appreciation (depreciation) in value of investments held were:
| Cost of
Investments
for Tax
Purposes | Gross Tax
Unrealized
Appreciation | Gross Tax
Unrealized
Depreciation | Net Tax
Unrealized
Appreciation/
(Depreciation)
on Investments |
Value Line Small Cap Opportunities Fund, Inc. | | | | |
Value Line Mid Cap Focused Fund, Inc. | | | | |
Value Line Select Growth Fund, Inc. | | | | |
Value Line Larger Companies Focused Fund, Inc. | | | | |
Value Line Asset Allocation Fund, Inc. | | | | |
Value Line Capital Appreciation Fund, Inc. | | | | |
Value Line Core Bond Fund | | | | |
Net unrealized appreciation/depreciation differs for financial statements and tax purposes primarily due to wash sales, return of capital distribution received, and market premium amortization.
As of December 31, 2024, the components of distributable earnings on a tax basis were as follows:
| Undistributed
Ordinary
Income | Undistributed
Long-Term
Gain | | Unrealized
Appreciation
(Depreciation) | Capital Loss
Carryforwards | | Distributable
Earnings (Loss) |
Value Line Small Cap Opportunities Fund, Inc. | | | | | | | |
Value Line Mid Cap Focused Fund, Inc. | | | | | | | |
Value Line Select Growth Fund, Inc. | | | | | | | |
Value Line Larger Companies Focused Fund, Inc. | | | | | | | |
Value Line Asset Allocation Fund, Inc. | | | | | | | |
Value Line Capital Appreciation Fund, Inc. | | | | | | | |
| | | | | | | |
Notes to Financial Statements (continued)
At December 31, 2024, the Value Line Core Bond Fund has net short-term capital loss carryforwards of $336,556 and net long-term capital loss carryforwards of $4,616,427. These losses can be carried forward indefinitely.
During the current fiscal year, the Value Line Larger Companies Focused Fund and the Value Line Capital Appreciation Fund utilized $2,782,700 and $24,073,115, respectively, of capital loss carryforwards to offset current year realized gains.
In accordance with federal tax laws applicable to investment companies, all or a portion of losses resulting from capital loss or net specified losses realized between November 1 and the Funds' fiscal year-end are not recognized for tax purposes until the subsequent year (late-year loss deferrals); however, such losses are recognized for financial reporting purposes in the year realized. As of December 31, 2024, the Funds did not have any such losses.
A reclassification has been made on the Statements of Assets and Liabilities to increase/(decrease) total distributable earnings/(loss) and additional paid-in capital for the Funds as follows:
| Total Distributable
Earnings/(Loss) | |
| Undistributed Net
Investment
Income/(Loss) | Accumulated Net
Realized Gains/(Losses) | Additional
Paid-In Capital |
Value Line Small Cap Opportunities Fund, Inc. | | | |
Value Line Mid Cap Focused Fund, Inc. | | | |
Value Line Select Growth Fund, Inc. | | | |
Value Line Larger Companies Focused Fund, Inc. | | | |
Value Line Asset Allocation Fund, Inc. | | | |
Value Line Capital Appreciation Fund, Inc. | | | |
Value Line Core Bond Fund | | | |
These reclassifications were primarily due to net operating losses and prior year excise tax paid. Net assets were not affected by these reclassifications.
The tax composition of distributions paid to shareholders during fiscal years ended December 31, 2024 and December 31, 2023 were as follows:
| Year Ended December 31, 2024
Distributions Paid from |
| | | | |
Value Line Small Cap Opportunities Fund, Inc. | | | | |
Value Line Mid Cap Focused Fund, Inc. | | | | |
Value Line Select Growth Fund, Inc. | | | | |
Value Line Larger Companies Focused Fund, Inc. | | | | |
Value Line Asset Allocation Fund, Inc. | | | | |
Value Line Capital Appreciation Fund, Inc. | | | | |
Value Line Core Bond Fund | | | | |
| Year Ended December 31, 2023
Distributions Paid from |
| | | | |
Value Line Small Cap Opportunities Fund, Inc. | | | | |
Value Line Mid Cap Focused Fund, Inc. | | | | |
Value Line Select Growth Fund, Inc. | | | | |
Value Line Larger Companies Focused Fund, Inc. | | | | |
Value Line Asset Allocation Fund, Inc. | | | | |
Value Line Capital Appreciation Fund, Inc. | | | | |
Value Line Core Bond Fund | | | | |
5. Investment Advisory Fees, Service and Distribution Fees and Transactions With Affiliates
For providing advisory services to the Value Line Small Cap Opportunities Fund, Inc., Value Line Mid Cap Focused Fund, Inc., Value Line Select Growth Fund, Inc., Value Line Larger Companies Focused Fund, Inc., Value Line Asset Allocation Fund, Inc., Value Line Capital Appreciation Fund, Inc. and Value Line Core Bond Fund, and managing each Fund’s investments for the year ended December 31, 2024, the Adviser was paid a fee at an annual rate of 0.74%, 0.65%, 0.73%, 0.73%, 0.64%, 0.64% and 0.30%, respectively, of each Fund’s average daily net assets. The investment advisory agreement between each Fund and the Adviser provides for a combined fee for both advisory services and Administrative Services (as defined in the investment advisory agreement) at an annual rate, based on each Fund’s average daily net assets, equal to 0.75% for Value Line Select Growth Fund, Inc., Value Line Larger Companies Focused Fund, Inc. and Value Line Small Cap Opportunities Fund and 0.70% on the first $100 million of average daily net assets, and 0.65% on the remaining net assets for Value Line Mid Cap Focused Fund, Inc. and Value Line Capital Appreciation Fund, Inc. and 0.65% on the first $750 million of average daily net assets, and 0.60% on the net assets over $750 million for Value Line Asset Allocation Fund, Inc. and 0.50% for Value Line Core Bond Fund (the “Combined Rate”). The advisory fee component paid by each Fund to the Adviser for each period is calculated by subtracting the amount paid by each Fund for Administrative Services with respect to the same period from the respective Combined Rate. The Adviser provides (or arranges for the provision of) such Administrative Services pursuant to a separate administration agreement with the Funds.
For the Value Line Larger Companies Focused Fund, the Adviser has contractually agreed to waive through May 1, 2025 certain Fund-wide fees and further assume certain Fund-wide expenses to the extent necessary to limit such expenses (excluding brokerage commissions, interest, taxes, and certain non-routine Fund-wide expenses) to 0.90% of the average daily net assets of each class (the “Fund-Level Expense Limitation 1”).
Effective May 1, 2023, for the Value Line Core Bond Fund, the Adviser and the Distributor have agreed to waive a portion of their advisory and Rule 12b-1 fee and the Adviser has further agreed to reimburse certain expenses of the Fund to the extent necessary to limit the Fund’s total annual operating expenses (other than those attributable to interest, taxes, brokerage and futures commissions, and extraordinary expenses not incurred in the ordinary course of the Fund’s business) to 0.80% of the Fund’s average daily net assets (the “Fund-Level Expense Limitation 2”). Prior to May 1, 2023 the Fund-Level Expense Limitation 2 was 0.90%. The Adviser and the Distributor may subsequently recover from the Value Line Core Bond Fund reimbursed expenses and/or waived fees (within 3 years from the month in which the waiver/reimbursement occurred) to the extent that the Fund’s expense ratio is less than the Expense Limitation. The Fund-Level Expense Limitation 2 can be terminated or modified before May 1, 2025 only with the agreement of the Fund’s Board.
For Value Line Asset Allocation Fund, Inc., the Adviser contractually agreed to waive and not recoup a portion of its annual advisory fee rate by 0.05% with respect to the portion of the Fund’s average daily net assets that exceed $750 million. This contractual waiver creates a breakpoint in the advisory fee.
The Funds have a Service and Distribution Plan (the “Plan”), adopted pursuant to Rule 12b-1 under the 1940 Act, which compensates EULAV Securities, LLC (the “Distributor”) for advertising, marketing and distributing the Funds’ shares and for servicing the Funds’ shareholders at an annual rate of 0.25% of the Funds’ average daily net assets attributable to Investor Class shares. Institutional Class shares do not pay Rule 12b-1 distribution and service fees, and are not subject to the Plan.
The Funds (except Value Line Core Bond Fund) have a Sub-Transfer Agent Plan (the “sub TA plan”) which compensates financial intermediaries that provide sub-transfer agency and related services to investors that hold their Fund shares of such class in omnibus accounts maintained by the financial intermediaries with the Funds. The sub-transfer agency fee, which the Fund may pay directly to the financial intermediary or indirectly via the Distributor, will not exceed (unless approved by the Board) the lower of: (i) the aggregate amount of additional transfer agency fees and expenses that the Funds would otherwise pay to the transfer agent if each subaccount in the omnibus account for such class of shares maintained by the financial intermediary with the Funds were a direct account with the Funds or (ii) the amount by which the fees charged by the financial intermediary for including the Funds on its platform and providing shareholder, sub-transfer agency and related services exceed the amount paid under the Funds’ Plan with respect to each Fund’s assets attributable to shares held by the financial intermediary in the omnibus account. If the sub-transfer agency fee is paid to financial intermediaries indirectly via the Distributor, the Distributor does not retain any amount thereof and such fee otherwise reduces the amount that the Distributor is contractually obligated to pay to the financial intermediary.
The Adviser agreed to pay or reimburse certain class-specific expenses of the Value Line Select Growth Fund, Inc., Value Line Larger Companies Focused Fund, Inc., and Value Line Capital Appreciation Fund, Inc. attributable to the Institutional Class, so that the Institutional Class bears its class-specific fees and expenses at the same annual percentage of its average daily net assets as the Investor Class’s class-specific fees and expenses (excluding the 12b-1 fees paid by the Investor Class and certain non-routine class-specific expenses, if applicable) (the “Class Expense Limitation”, together with the Fund-level Expense Limitations (attributable to the Value Line Larger Companies Focused Fund and Value Line Core Bond Fund), the “Expense Limitations”). The Adviser may subsequently recover from the Fund contractually reimbursed expenses and/or waived fees (within 3 years from the month in which the waiver/reimbursement occurred) to the extent that such class’ expense ratio is less than the applicable Expense Limitation or, if lower, the expense limitation in effect when the waiver or reimbursement occurred. The Class Expense Limitation can be terminated
Notes to Financial Statements (continued)
or modified only with the agreement of the Board of Directors. With the approval of the Value Line Small Cap Opportunities Fund’s Board, this Class Expense Limitation was terminated effective May 1, 2024 and amounts previously reimbursed and/or waived by the Adviser and eligible for recovery by the Adviser were forfeited.
As of December 31, 2024, fees contractually waived/reimbursed by the Adviser amounted to $35,522, $29,672, $25,375, $44,608 and $77,627 for the Value Line Small Cap Opportunities Fund, Inc., Value Line Select Growth Fund, Inc., Value Line Larger Companies Focused Fund, Inc., Value Line Capital Appreciation Fund, Inc. and Value Line Core Bond Fund, respectively. As of December 31, 2024, the Adviser and Distributor may seek reimbursement of the remaining waived fees and reimbursed expenses as follows:
| Expiration for the 12
months ended | Fees Waived and
Reimbursed by
the Adviser | Fees Waived and
Reimbursed by
the Distributor |
Value Line Select Growth Fund, Inc. | | | |
Value Line Select Growth Fund, Inc. | | | |
Value Line Select Growth Fund, Inc. | | | |
Value Line Larger Companies Focused Fund, Inc. | | | |
Value Line Larger Companies Focused Fund, Inc. | | | |
Value Line Larger Companies Focused Fund, Inc. | | | |
Value Line Capital Appreciation Fund, Inc. | | | |
Value Line Capital Appreciation Fund, Inc. | | | |
Value Line Capital Appreciation Fund, Inc. | | | |
Value Line Core Bond Fund | | | |
Value Line Core Bond Fund | | | |
Value Line Core Bond Fund | | | |
During the year ended December 31, 2024, the Advisor recouped previously waived and reimbursed fees from Value Line Larger Companies Focused Fund, Inc. and Value Line Capital Appreciation Fund, Inc. in the amounts of $33,018 and $4,359 respectively.
In the normal course of business, each Fund enters into a variety of agreements that may expose the Funds to some risk of loss. These could include certain agreements related to preferred shares, which are each described elsewhere in these Notes to Financial Statements. The risk of future loss arising from such agreements, while not quantifiable, is expected to be remote. As of the end of the reporting period, the Funds did not have any unfunded commitments.
From time to time, the Funds may be a party to certain legal proceedings in the ordinary course of business, including proceedings relating to the enforcement of the Funds' rights under contracts. As of the end of the reporting period, management has determined that any legal proceeding(s) the Funds are subject to, including those described within this report, are unlikely to have a material impact to any of the Funds' financial statements.
6. Recent Accounting Standards
In this reporting period, the Funds adopted FASB Accounting Standards Update 2023-07, Segment Reporting (Topic 280) - Improvements to Reportable Segment Disclosures ("ASU 2023-07"). Adoption of the new standard impacted financial statement disclosures only and did not affect each Fund’s financial position or results of operations. The President and Principal Financial Officer act as each Fund's chief operating decision maker (“CODM”), as defined in Topic 280, assessing performance and making decisions about resource allocation. The CODM has determined that each Fund has a single operating segment based on the fact that the CODM monitors the operating results of each Fund as a whole and each Fund’s long-term strategic asset allocation is guided by the Fund’s investment objective and principal investment strategies, as described in its respective prospectus, and executed by the Fund’s portfolio management team, comprised of investment professionals employed by the Adviser. The financial information provided to and reviewed by the CODM is consistent with that presented in each Fund’s Schedule of Investments, Statements of Operations and Changes in Net Assets and Financial Highlights.
Report of Independent Registered Public Accounting Firm
To the Board of Directors and Shareholders of Value Line Small Cap Opportunities Fund, Inc., Value Line Mid Cap Focused Fund, Inc., Value Line Select Growth Fund, Inc., Value Line Larger Companies Focused Fund, Inc., Value Line Asset Allocation Fund, Inc., Value Line Capital Appreciation Fund, Inc. and Value Line Core Bond Fund
Opinions on the Financial Statements
We have audited the accompanying statements of assets and liabilities, including the schedules of investments, of each of the funds listed in the table below (hereafter collectively referred to as the "Funds") as of December 31, 2024, the related statements of operations and of changes in net assets for each of the periods indicated in the table below, including the related notes, and the financial highlights for each of the periods indicated in the table below (collectively referred to as the “financial statements”). In our opinion, the financial statements present fairly, in all material respects, the financial position of each of the Funds listed in the table below as of December 31, 2024, the results of each of their operations, the changes in each of their net assets, and each of the financial highlights for each of the periods indicated in the table below, in conformity with accounting principles generally accepted in the United States of America.
Value Line Small Cap Opportunities Fund, Inc. (1)
Value Line Mid Cap Focused Fund, Inc. (2)
Value Line Select Growth Fund, Inc. (3)
Value Line Larger Companies Focused Fund, Inc. (2)
Value Line Asset Allocation Fund, Inc. (1)
Value Line Capital Appreciation Fund, Inc. (2)
Value Line Core Bond Fund (2)
(1)
Statement of operations for the year ended December 31, 2024, statement of changes in net assets for each of the two years in the period ended December 31, 2024 and the financial highlights for the years ended December 31, 2024 and December 31, 2023, the period April 1, 2022 through December 31, 2022 and for each of the three years in the period ended March 31, 2022
(2)
Statement of operations for the year ended December 31, 2024, statement of changes in net assets for each of the two years in the period ended December 31, 2024 and the financial highlights for each of the five years in the period ended December 31, 2024
(3)
Statement of operations for the year ended December 31, 2024, statement of changes in net assets for each of the two years in the period ended December 31, 2024 and the financial highlights for each of the periods indicated therein
These financial statements are the responsibility of the Funds’ management. Our responsibility is to express an opinion on the Funds’ financial statements based on our audits. We are a public accounting firm registered with the Public Company Accounting Oversight Board (United States) (PCAOB) and are required to be independent with respect to the Funds in accordance with the U.S. federal securities laws and the applicable rules and regulations of the Securities and Exchange Commission and the PCAOB.
We conducted our audits of these financial statements in accordance with the standards of the PCAOB. Those standards require that we plan and perform the audit to obtain reasonable assurance about whether the financial statements are free of material misstatement, whether due to error or fraud.
Our audits included performing procedures to assess the risks of material misstatement of the financial statements, whether due to error or fraud, and performing procedures that respond to those risks. Such procedures included examining, on a test basis, evidence regarding the amounts and disclosures in the financial statements. Our audits also included evaluating the accounting principles used and significant estimates made by management, as well as evaluating the overall presentation of the financial statements. Our procedures included confirmation of securities owned as of December 31, 2024 by correspondence with the custodian, transfer agent and brokers; when replies were not received from brokers, we performed other auditing procedures. We believe that our audits provide a reasonable basis for our opinions.
/s/PricewaterhouseCoopers LLP
New York, New York
February 14, 2025
We have served as the auditor of one or more investment companies in the Value Line Funds since 1983.
Federal Tax Notice (unaudited)
Each Fund designates the following amounts distributed during the fiscal year ended December 31, 2024, if any, as capital gain dividends, dividends eligible for the corporate dividends received deduction and/or qualified dividend income:
| % of
Qualifying
Dividend
Income | % of
Dividends
Eligible for the
Corporate
Dividends
Received
Deduction | |
Value Line Small Cap Opportunities Fund, Inc. | | | |
Value Line Mid Cap Focused Fund, Inc. | | | |
Value Line Select Growth Fund, Inc. | | | |
Value Line Larger Companies Focused Fund, Inc. | | | |
Value Line Asset Allocation Fund, Inc. | | | |
Value Line Capital Appreciation Fund, Inc. | | | |
Value Line Core Bond Fund | | | |
Each Fund files its complete schedule of portfolio holdings with the Securities and Exchange Commission ("SEC") for the first and third quarters of each fiscal year as an exhibit to Form N-PORT within 60 days of the end of such fiscal quarter. Regulatory filings of Forms N-PORT are available on the SEC's website at http://www.sec.gov.
A description of the policies and procedures that the Funds use to determine how to vote proxies relating to portfolio securities, and information regarding how the Funds voted these proxies for the 12-month period ended June 30 is available through the Funds' website at http://www.vlfunds.com and on the SEC's website at http://www.sec.gov. The description of the policies and procedures is also available without charge, upon request, by calling 1-800-243-2729.
In 1950, Value Line started its first mutual fund. For seven decades, knowledgeable investors and financial advisors have been relying on the Value Line Funds to help them build their financial futures. Over the years, Value Line Funds has evolved into what it is today - a diversified family of mutual funds with a wide range of investment objectives.
Strategies That Have Stood the Test of Time
1950Value Line Mid Cap Focused Fund
1952Value Line Capital Appreciation Fund
1956Value Line Select Growth Fund
1972Value Line Larger Companies Focused Fund
1986Value Line Core Bond Fund
1993Value Line Small Cap Opportunities Fund
1993Value Line Asset Allocation Fund
2015Institutional shares launched for the Value Line
Larger Companies Focused Fund, Small Cap
Opportunities Fund, Asset Allocation Fund
and Capital Appreciation Fund
2017Insitutional shares launched for the
Value Line Mid Cap Focused Fund
2020Institutional shares launched for the
Value Line Select Growth Fund
For more complete information about any of the Value Line Funds, including charges and expenses, send for a prospectus from EULAV Securities LLC, 1605 Main Street, Suite 912, Sarasota, Florida 34236 or call 1-800-243-2729, 9am-5pm CST, Monday-Friday, or visit us at www.vlfunds.com. Read the prospectus carefully before you invest or send money.
(b) Not Applicable
Item 8. Changes in and Disagreements with Accountants for Open-End Management Investment Companies.
Included in Item 7
Item 9. Proxy Disclosure for Open End Management Investment Companies.
At a special meeting of shareholders of the Funds held on November 15, 2024, shareholders approved a proposal to elect three nominees, Messrs. James E. Hillman and Cornelius V. Kilbane, Jr. and Ms. Linda R. Ridolfi (the “Nominees”), to serve as directors. Mr. Kilbane and Ms. Ridolfi assumed the role of director with immediate effect. Mr. Hillman, who has served by appointment of the Board in accordance with the requirements of the Investment Company Act of 1940 since 2015, continues to serve without interruption. Dr. Paul Craig Roberts, an existing director, will resign from the Board, after decades of exemplary service, effective December 31, 2024
Item 10 Remuneration Paid to Directors, Officers and Others of Open-End Management Investment Companies.
Included in Item 7
Item 11. Statement Regarding Basis for Approval of Investment Advisory Contracts.
Included in item 7
Item 12. Disclosure of Proxy Voting Policies and Procedures for Closed-End Management Investment Companies.
Not Applicable
Item 13. Portfolio Managers of Closed-End Management Investment Companies.
Not Applicable
Item 14. Purchase of Equity Securities by Closed-End Management Investment Company and Affiliated Purchasers.
Not Applicable
Item 16. Controls and Procedures
| | (a) | The registrant’s principal executive officer and principal financial officer have concluded that the registrant’s disclosure controls and procedures (as defined in rule 30a-2(c) under the Act (17 CFR 270.30a-2(c) ) based on their evaluation of these controls and procedures as of a date within 90 days of the filing date of this report, are appropriately designed to ensure that material information relating to the registrant is made known to such officers and are operating effectively. |
| | (b) | The registrant’s principal executive officer and principal financial officer have determined that there have been no significant changes in the registrant’s internal controls or in other factors that could significantly affect these controls during the period covered by this report, including corrective actions with regard to significant deficiencies and material weaknesses. |
Item 17. Disclosure of Securities Lending Activities for Closed-End Management Investment Companies.
Not Applicable
Item 18. Recovery of Erroneously Awarded Compensation
Not Applicable
Item 19. Exhibits.
SIGNATURES
Pursuant to the requirements of the Securities Exchange Act of 1934 and the Investment Company Act of 1940, the registrant has duly caused this report to be signed on its behalf by the undersigned, thereunto duly authorized.
| | |
| By: | | /s/ Mitchell E. Appel |
| | Mitchell E. Appel, President |
| |
| Date: | | March 3, 2025 |
Pursuant to the requirements of the Securities Exchange Act of 1934 and the Investment Company Act of 1940, this report has been signed below by the following persons on behalf of the registrant and in the capacities and on the dates indicated.
| | |
| By: | | /s/ Mitchell E. Appel |
| | Mitchell E. Appel, President, Principal Executive Officer |
| |
| Date: | | March 3, 2025 |
| |
| By: | | /s/ James Gallo |
| | James Gallo, Treasurer, Principal Financial Officer |
| |
| Date: | | March 3, 2025 |