0000102816eatonvance:EATONVANCEIndexMSCIACWIIndex19220AdditionalIndexMember2021-09-300000102816eatonvance:EATONVANCEIndexMSCIWorldHealthCareIndex19122AdditionalIndexMember2018-04-300000102816eatonvance:C000081646Membereatonvance:ManagedHealthCareSectorMember2024-08-31
UNITED STATES
SECURITIES AND EXCHANGE COMMISSION
Washington, D.C. 20549
Form N-CSR
CERTIFIED SHAREHOLDER REPORT OF REGISTERED
MANAGEMENT INVESTMENT COMPANIES
Investment Company Act File Number: 811-01241
Eaton Vance Growth Trust
(Exact Name of Registrant as Specified in Charter)
One Post Office Square, Boston, Massachusetts 02109
(Address of Principal Executive Offices)
Deidre E. Walsh
One Post Office Square, Boston, Massachusetts 02109
(Name and Address of Agent for Services)
(617) 482-8260
(Registrant’s Telephone Number)
August 31
Date of Fiscal Year End
August 31, 2024
Date of Reporting Period
Item 1. Reports to Stockholders
(a)
Eaton Vance Greater China Growth Fund
Annual Shareholder Report August 31, 2024
This annual shareholder report contains important information about the Eaton Vance Greater China Growth Fund for the period of September 1, 2023 to August 31, 2024. You can find additional information about the Fund at www.eatonvance.com/open-end-mutual-fund-documents.php. You can also request this information by contacting us at 1-800-262-1122.
What were the Fund costs for the last year?
(based on a hypothetical $10,000 investment)
| Class Name | Costs of a $10,000 investment | Costs paid as a percentage of a $10,000 investment |
|---|
| Class A | $141 | 1.51% |
How did the Fund perform last year and what affected its performance?
Key contributors to (↑) and detractors from (↓) performance, relative to the MSCI China Index (the Index):
↓ An overweight position in online retailer Meituan declined in value amid weak consumer spending, intensified competition, and reduced profit margins
↓ An overweight position in pharmaceutical firm Wuxi Biologics fell in value amid weak profits and potential lost sales if the U.S. Biosecure Act is passed
↓ An overweight position in online services provider NetEase fell in value as profits declined and the U.S. barred NetEase from buying Nvidia microchips
↓ On a sector basis, stock selections and an overweight in health care; an overweight in consumer staples; and stock selections in industrials hurt returns
↑ An overweight position in online gaming firm Tencent Holdings rose in value on higher gaming activity, stronger ad revenue, and more earnings visibility
↑ Not owning internet search engine and Index component Baidu helped returns as its stock price fell amid weak ad revenue and concern over China’s economy
↑ An overweight position in air conditioner maker Gree Electric Appliances rose in value after China announced measures supporting new A/C purchases
↑ On a sector basis, an overweight position in communication services helped Index-relative performance during the period
Comparison of the change in value of a $10,000 investment for the period indicated.
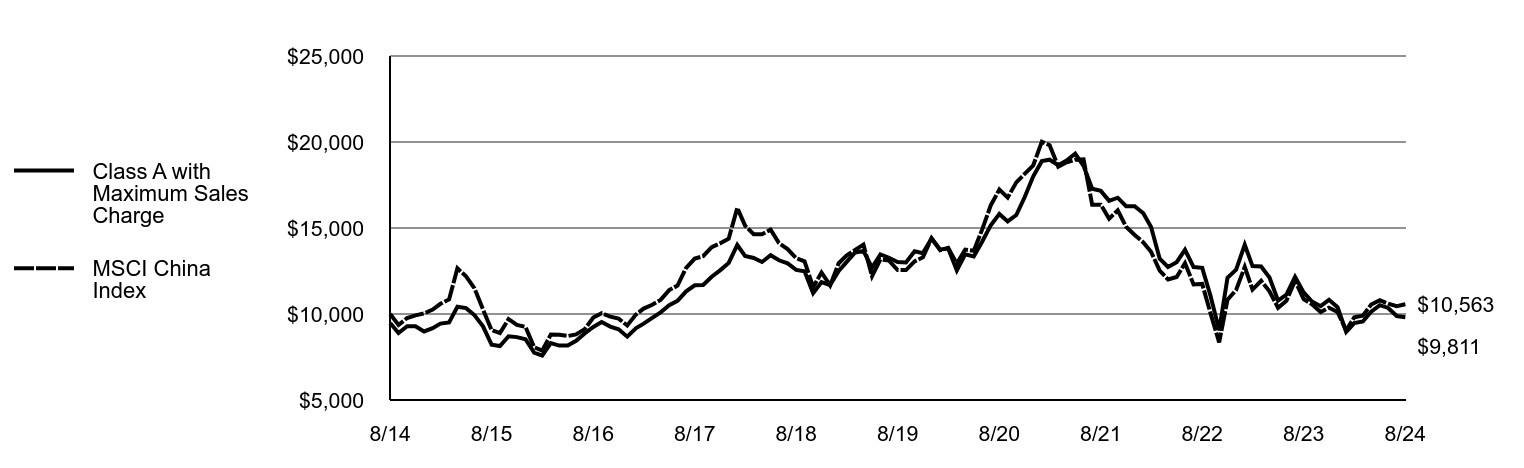
| Class A with Maximum Sales Charge | MSCI China Index |
|---|
| 8/14 | $9,475 | $10,000 |
| 9/14 | $8,895 | $9,362 |
| 10/14 | $9,287 | $9,766 |
| 11/14 | $9,283 | $9,919 |
| 12/14 | $8,984 | $10,034 |
| 1/15 | $9,172 | $10,261 |
| 2/15 | $9,441 | $10,593 |
| 3/15 | $9,509 | $10,848 |
| 4/15 | $10,423 | $12,657 |
| 5/15 | $10,341 | $12,189 |
| 6/15 | $9,939 | $11,503 |
| 7/15 | $9,280 | $10,265 |
| 8/15 | $8,219 | $9,066 |
| 9/15 | $8,138 | $8,890 |
| 10/15 | $8,707 | $9,698 |
| 11/15 | $8,655 | $9,370 |
| 12/15 | $8,534 | $9,248 |
| 1/16 | $7,753 | $8,072 |
| 2/16 | $7,586 | $7,868 |
| 3/16 | $8,307 | $8,804 |
| 4/16 | $8,162 | $8,787 |
| 5/16 | $8,175 | $8,721 |
| 6/16 | $8,443 | $8,815 |
| 7/16 | $8,869 | $9,122 |
| 8/16 | $9,246 | $9,794 |
| 9/16 | $9,532 | $10,042 |
| 10/16 | $9,269 | $9,847 |
| 11/16 | $9,110 | $9,729 |
| 12/16 | $8,682 | $9,331 |
| 1/17 | $9,167 | $9,965 |
| 2/17 | $9,442 | $10,317 |
| 3/17 | $9,772 | $10,538 |
| 4/17 | $10,097 | $10,819 |
| 5/17 | $10,513 | $11,389 |
| 6/17 | $10,765 | $11,652 |
| 7/17 | $11,315 | $12,687 |
| 8/17 | $11,667 | $13,222 |
| 9/17 | $11,690 | $13,359 |
| 10/17 | $12,166 | $13,890 |
| 11/17 | $12,537 | $14,107 |
| 12/17 | $12,969 | $14,377 |
| 1/18 | $14,012 | $16,172 |
| 2/18 | $13,378 | $15,136 |
| 3/18 | $13,255 | $14,638 |
| 4/18 | $13,025 | $14,635 |
| 5/18 | $13,414 | $14,904 |
| 6/18 | $13,122 | $14,126 |
| 7/18 | $12,943 | $13,773 |
| 8/18 | $12,565 | $13,250 |
| 9/18 | $12,478 | $13,065 |
| 10/18 | $11,214 | $11,567 |
| 11/18 | $11,854 | $12,414 |
| 12/18 | $11,676 | $11,663 |
| 1/19 | $12,501 | $12,953 |
| 2/19 | $13,017 | $13,400 |
| 3/19 | $13,579 | $13,726 |
| 4/19 | $13,663 | $14,032 |
| 5/19 | $12,698 | $12,196 |
| 6/19 | $13,461 | $13,175 |
| 7/19 | $13,270 | $13,104 |
| 8/19 | $13,023 | $12,555 |
| 9/19 | $12,995 | $12,552 |
| 10/19 | $13,646 | $13,059 |
| 11/19 | $13,540 | $13,292 |
| 12/19 | $14,389 | $14,399 |
| 1/20 | $13,752 | $13,707 |
| 2/20 | $13,804 | $13,841 |
| 3/20 | $12,534 | $12,928 |
| 4/20 | $13,467 | $13,744 |
| 5/20 | $13,340 | $13,676 |
| 6/20 | $14,204 | $14,905 |
| 7/20 | $15,154 | $16,312 |
| 8/20 | $15,815 | $17,238 |
| 9/20 | $15,381 | $16,767 |
| 10/20 | $15,757 | $17,654 |
| 11/20 | $16,789 | $18,144 |
| 12/20 | $18,006 | $18,646 |
| 1/21 | $18,887 | $20,019 |
| 2/21 | $18,970 | $19,811 |
| 3/21 | $18,651 | $18,566 |
| 4/21 | $18,919 | $18,824 |
| 5/21 | $19,328 | $18,969 |
| 6/21 | $18,613 | $18,987 |
| 7/21 | $17,278 | $16,359 |
| 8/21 | $17,157 | $16,359 |
| 9/21 | $16,576 | $15,538 |
| 10/21 | $16,761 | $16,028 |
| 11/21 | $16,269 | $15,071 |
| 12/21 | $16,270 | $14,596 |
| 1/22 | $15,854 | $14,165 |
| 2/22 | $15,054 | $13,613 |
| 3/22 | $13,214 | $12,524 |
| 4/22 | $12,737 | $12,013 |
| 5/22 | $13,012 | $12,155 |
| 6/22 | $13,731 | $12,952 |
| 7/22 | $12,730 | $11,722 |
| 8/22 | $12,683 | $11,748 |
| 9/22 | $11,044 | $10,038 |
| 10/22 | $9,049 | $8,351 |
| 11/22 | $12,112 | $10,832 |
| 12/22 | $12,578 | $11,395 |
| 1/23 | $14,023 | $12,737 |
| 2/23 | $12,784 | $11,416 |
| 3/23 | $12,763 | $11,931 |
| 4/23 | $12,122 | $11,316 |
| 5/23 | $10,776 | $10,362 |
| 6/23 | $11,125 | $10,773 |
| 7/23 | $12,157 | $11,932 |
| 8/23 | $11,253 | $10,864 |
| 9/23 | $10,726 | $10,564 |
| 10/23 | $10,455 | $10,114 |
| 11/23 | $10,826 | $10,369 |
| 12/23 | $10,399 | $10,119 |
| 1/24 | $8,961 | $9,045 |
| 2/24 | $9,471 | $9,804 |
| 3/24 | $9,564 | $9,897 |
| 4/24 | $10,136 | $10,550 |
| 5/24 | $10,515 | $10,803 |
| 6/24 | $10,352 | $10,599 |
| 7/24 | $9,881 | $10,458 |
| 8/24 | $9,811 | $10,563 |
Average Annual Total Returns (%)
| 1 Year | 5 Years | 10 Years |
|---|
| Class A | (12.81)% | (5.50)% | 0.35% |
| Class A with 5.25% Maximum Sales Charge | (17.41)% | (6.52)% | (0.19)% |
| MSCI China Index (net of foreign withholding taxes) | (2.77)% | (3.39)% | 0.55% |
Performance does not reflect the deduction of taxes that a shareholder would pay on Fund distributions or redemption of Fund shares. Performance assumes that all dividends and distributions, if any, were reinvested. For more recent performance information, visit www.eatonvance.com/performance.php.
THE FUND'S PAST PERFORMANCE IS NO GUARANTEE OF FUTURE RESULTS.
| Total Net Assets | $32,112,625 |
| # of Portfolio Holdings | 35 |
| Portfolio Turnover Rate | 77% |
| Total Advisory Fees Paid | $124,295 |
What did the Fund invest in?
The following tables reflect what the Fund invested in as of the report date.
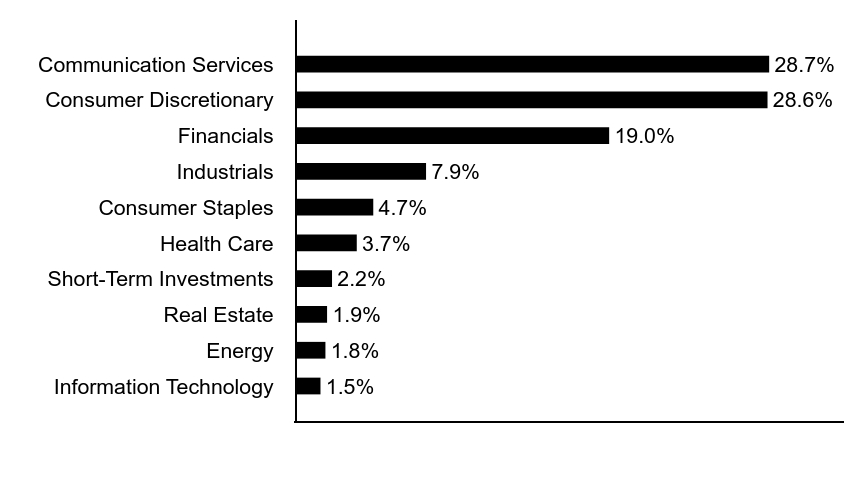
Sector Allocation (% of total investments)
| Value | Value |
|---|
| Information Technology | 1.5% |
| Energy | 1.8% |
| Real Estate | 1.9% |
| Short-Term Investments | 2.2% |
| Health Care | 3.7% |
| Consumer Staples | 4.7% |
| Industrials | 7.9% |
| Financials | 19.0% |
| Consumer Discretionary | 28.6% |
| Communication Services | 28.7% |
Top Ten Holdings (% of total investments)Footnote Referencea
| Tencent Holdings Ltd. | 22.9% |
| China Construction Bank Corp., Class H | 12.1% |
| PDD Holdings, Inc., ADR | 6.1% |
| Meituan, Class B | 5.0% |
| NetEase, Inc. | 4.8% |
| China Merchants Bank Co. Ltd., Class H | 4.8% |
| Trip.com Group Ltd. | 4.6% |
| Kweichow Moutai Co. Ltd., Class A | 3.2% |
| BYD Co. Ltd., Class H | 2.2% |
| China State Construction International Holdings Ltd. | 2.0% |
| Total | 67.7% |
| Footnote | Description |
Footnotea | Excluding cash equivalents |
If you wish to view additional information about the Fund, including the prospectus, statement of additional information, financial statements and holdings, please scan the QR code or visit www.eatonvance.com/open-end-mutual-fund-documents.php. For proxy information, please visit www.eatonvance.com/proxyvoting.
The Funds may deliver a single copy of certain required shareholder documents (including prospectuses, shareholder reports, and proxy materials) to investors with the same last name and the same address. Your participation will continue indefinitely unless you instruct otherwise by calling 1-800-262-1122 or by contacting your financial intermediary. Your instruction will typically be effective within 30 days of receipt.
Not FDIC Insured | May Lose Value | No Bank Guarantee
Annual Shareholder Report August 31, 2024
Eaton Vance Greater China Growth Fund
Annual Shareholder Report August 31, 2024
This annual shareholder report contains important information about the Eaton Vance Greater China Growth Fund for the period of September 1, 2023 to August 31, 2024. You can find additional information about the Fund at www.eatonvance.com/open-end-mutual-fund-documents.php. You can also request this information by contacting us at 1-800-262-1122.
What were the Fund costs for the last year?
(based on a hypothetical $10,000 investment)
| Class Name | Costs of a $10,000 investment | Costs paid as a percentage of a $10,000 investment |
|---|
| Class C | $211 | 2.26% |
How did the Fund perform last year and what affected its performance?
Key contributors to (↑) and detractors from (↓) performance, relative to the MSCI China Index (the Index):
↓ An overweight position in online retailer Meituan declined in value amid weak consumer spending, intensified competition, and reduced profit margins
↓ An overweight position in pharmaceutical firm Wuxi Biologics fell in value amid weak profits and potential lost sales if the U.S. Biosecure Act is passed
↓ An overweight position in online services provider NetEase fell in value as profits declined and the U.S. barred NetEase from buying Nvidia microchips
↓ On a sector basis, stock selections and an overweight in health care; an overweight in consumer staples; and stock selections in industrials hurt returns
↑ An overweight position in online gaming firm Tencent Holdings rose in value on higher gaming activity, stronger ad revenue, and more earnings visibility
↑ Not owning internet search engine and Index component Baidu helped returns as its stock price fell amid weak ad revenue and concern over China’s economy
↑ An overweight position in air conditioner maker Gree Electric Appliances rose in value after China announced measures supporting new A/C purchases
↑ On a sector basis, an overweight position in communication services helped Index-relative performance during the period
Comparison of the change in value of a $10,000 investment for the period indicated.
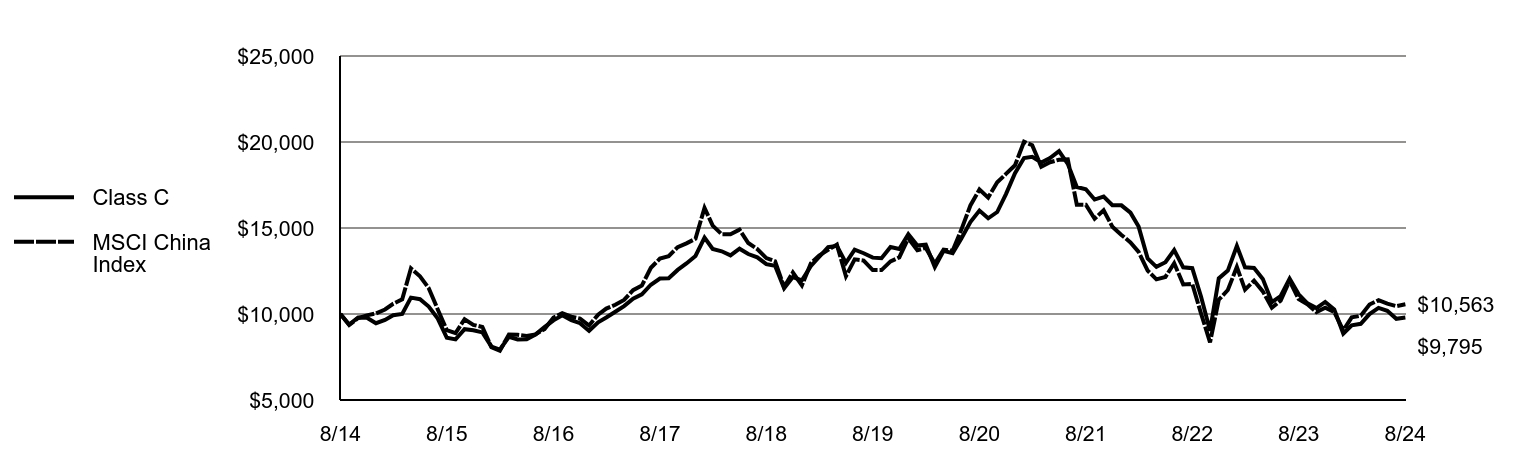
| Class C | MSCI China Index |
|---|
| 8/14 | $10,000 | $10,000 |
| 9/14 | $9,384 | $9,362 |
| 10/14 | $9,795 | $9,766 |
| 11/14 | $9,785 | $9,919 |
| 12/14 | $9,463 | $10,034 |
| 1/15 | $9,655 | $10,261 |
| 2/15 | $9,930 | $10,593 |
| 3/15 | $10,000 | $10,848 |
| 4/15 | $10,952 | $12,657 |
| 5/15 | $10,859 | $12,189 |
| 6/15 | $10,434 | $11,503 |
| 7/15 | $9,734 | $10,265 |
| 8/15 | $8,618 | $9,066 |
| 9/15 | $8,525 | $8,890 |
| 10/15 | $9,118 | $9,698 |
| 11/15 | $9,057 | $9,370 |
| 12/15 | $8,929 | $9,248 |
| 1/16 | $8,105 | $8,072 |
| 2/16 | $7,926 | $7,868 |
| 3/16 | $8,671 | $8,804 |
| 4/16 | $8,517 | $8,787 |
| 5/16 | $8,527 | $8,721 |
| 6/16 | $8,800 | $8,815 |
| 7/16 | $9,242 | $9,122 |
| 8/16 | $9,629 | $9,794 |
| 9/16 | $9,922 | $10,042 |
| 10/16 | $9,639 | $9,847 |
| 11/16 | $9,465 | $9,729 |
| 12/16 | $9,017 | $9,331 |
| 1/17 | $9,517 | $9,965 |
| 2/17 | $9,797 | $10,317 |
| 3/17 | $10,132 | $10,538 |
| 4/17 | $10,462 | $10,819 |
| 5/17 | $10,887 | $11,389 |
| 6/17 | $11,142 | $11,652 |
| 7/17 | $11,702 | $12,687 |
| 8/17 | $12,062 | $13,222 |
| 9/17 | $12,077 | $13,359 |
| 10/17 | $12,563 | $13,890 |
| 11/17 | $12,938 | $14,107 |
| 12/17 | $13,373 | $14,377 |
| 1/18 | $14,440 | $16,172 |
| 2/18 | $13,781 | $15,136 |
| 3/18 | $13,647 | $14,638 |
| 4/18 | $13,407 | $14,635 |
| 5/18 | $13,798 | $14,904 |
| 6/18 | $13,485 | $14,126 |
| 7/18 | $13,295 | $13,773 |
| 8/18 | $12,898 | $13,250 |
| 9/18 | $12,803 | $13,065 |
| 10/18 | $11,496 | $11,567 |
| 11/18 | $12,144 | $12,414 |
| 12/18 | $11,961 | $11,663 |
| 1/19 | $12,793 | $12,953 |
| 2/19 | $13,314 | $13,400 |
| 3/19 | $13,883 | $13,726 |
| 4/19 | $13,963 | $14,032 |
| 5/19 | $12,971 | $12,196 |
| 6/19 | $13,736 | $13,175 |
| 7/19 | $13,534 | $13,104 |
| 8/19 | $13,277 | $12,555 |
| 9/19 | $13,240 | $12,552 |
| 10/19 | $13,895 | $13,059 |
| 11/19 | $13,779 | $13,292 |
| 12/19 | $14,634 | $14,399 |
| 1/20 | $13,977 | $13,707 |
| 2/20 | $14,028 | $13,841 |
| 3/20 | $12,727 | $12,928 |
| 4/20 | $13,668 | $13,744 |
| 5/20 | $13,529 | $13,676 |
| 6/20 | $14,394 | $14,905 |
| 7/20 | $15,348 | $16,312 |
| 8/20 | $16,011 | $17,238 |
| 9/20 | $15,563 | $16,767 |
| 10/20 | $15,929 | $17,654 |
| 11/20 | $16,971 | $18,144 |
| 12/20 | $18,184 | $18,646 |
| 1/21 | $19,070 | $20,019 |
| 2/21 | $19,139 | $19,811 |
| 3/21 | $18,807 | $18,566 |
| 4/21 | $19,063 | $18,824 |
| 5/21 | $19,465 | $18,969 |
| 6/21 | $18,731 | $18,987 |
| 7/21 | $17,382 | $16,359 |
| 8/21 | $17,250 | $16,359 |
| 9/21 | $16,655 | $15,538 |
| 10/21 | $16,828 | $16,028 |
| 11/21 | $16,323 | $15,071 |
| 12/21 | $16,317 | $14,596 |
| 1/22 | $15,893 | $14,165 |
| 2/22 | $15,081 | $13,613 |
| 3/22 | $13,225 | $12,524 |
| 4/22 | $12,742 | $12,013 |
| 5/22 | $13,013 | $12,155 |
| 6/22 | $13,722 | $12,952 |
| 7/22 | $12,713 | $11,722 |
| 8/22 | $12,662 | $11,748 |
| 9/22 | $11,017 | $10,038 |
| 10/22 | $9,021 | $8,351 |
| 11/22 | $12,069 | $10,832 |
| 12/22 | $12,524 | $11,395 |
| 1/23 | $13,951 | $12,737 |
| 2/23 | $12,712 | $11,416 |
| 3/23 | $12,680 | $11,931 |
| 4/23 | $12,041 | $11,316 |
| 5/23 | $10,693 | $10,362 |
| 6/23 | $11,036 | $10,773 |
| 7/23 | $12,049 | $11,932 |
| 8/23 | $11,145 | $10,864 |
| 9/23 | $10,623 | $10,564 |
| 10/23 | $10,342 | $10,114 |
| 11/23 | $10,701 | $10,369 |
| 12/23 | $10,266 | $10,119 |
| 1/24 | $8,852 | $9,045 |
| 2/24 | $9,346 | $9,804 |
| 3/24 | $9,431 | $9,897 |
| 4/24 | $9,994 | $10,550 |
| 5/24 | $10,351 | $10,803 |
| 6/24 | $10,190 | $10,599 |
| 7/24 | $9,721 | $10,458 |
| 8/24 | $9,795 | $10,563 |
Average Annual Total Returns (%)
| 1 Year | 5 Years | 10 Years |
|---|
| Class C | (13.47)% | (6.19)% | (0.21)% |
| Class C with 1% Maximum Deferred Sales Charge | (14.26)% | (6.19)% | (0.21)% |
| MSCI China Index (net of foreign withholding taxes) | (2.77)% | (3.39)% | 0.55% |
Performance does not reflect the deduction of taxes that a shareholder would pay on Fund distributions or redemption of Fund shares. Performance assumes that all dividends and distributions, if any, were reinvested. For more recent performance information, visit www.eatonvance.com/performance.php.
THE FUND'S PAST PERFORMANCE IS NO GUARANTEE OF FUTURE RESULTS.
| Total Net Assets | $32,112,625 |
| # of Portfolio Holdings | 35 |
| Portfolio Turnover Rate | 77% |
| Total Advisory Fees Paid | $124,295 |
What did the Fund invest in?
The following tables reflect what the Fund invested in as of the report date.
Sector Allocation (% of total investments)
| Value | Value |
|---|
| Information Technology | 1.5% |
| Energy | 1.8% |
| Real Estate | 1.9% |
| Short-Term Investments | 2.2% |
| Health Care | 3.7% |
| Consumer Staples | 4.7% |
| Industrials | 7.9% |
| Financials | 19.0% |
| Consumer Discretionary | 28.6% |
| Communication Services | 28.7% |
Top Ten Holdings (% of total investments)Footnote Referencea
| Tencent Holdings Ltd. | 22.9% |
| China Construction Bank Corp., Class H | 12.1% |
| PDD Holdings, Inc., ADR | 6.1% |
| Meituan, Class B | 5.0% |
| NetEase, Inc. | 4.8% |
| China Merchants Bank Co. Ltd., Class H | 4.8% |
| Trip.com Group Ltd. | 4.6% |
| Kweichow Moutai Co. Ltd., Class A | 3.2% |
| BYD Co. Ltd., Class H | 2.2% |
| China State Construction International Holdings Ltd. | 2.0% |
| Total | 67.7% |
| Footnote | Description |
Footnotea | Excluding cash equivalents |
If you wish to view additional information about the Fund, including the prospectus, statement of additional information, financial statements and holdings, please scan the QR code or visit www.eatonvance.com/open-end-mutual-fund-documents.php. For proxy information, please visit www.eatonvance.com/proxyvoting.
The Funds may deliver a single copy of certain required shareholder documents (including prospectuses, shareholder reports, and proxy materials) to investors with the same last name and the same address. Your participation will continue indefinitely unless you instruct otherwise by calling 1-800-262-1122 or by contacting your financial intermediary. Your instruction will typically be effective within 30 days of receipt.
Not FDIC Insured | May Lose Value | No Bank Guarantee
Annual Shareholder Report August 31, 2024
Eaton Vance Greater China Growth Fund
Annual Shareholder Report August 31, 2024
This annual shareholder report contains important information about the Eaton Vance Greater China Growth Fund for the period of September 1, 2023 to August 31, 2024. You can find additional information about the Fund at www.eatonvance.com/open-end-mutual-fund-documents.php. You can also request this information by contacting us at 1-800-262-1122.
What were the Fund costs for the last year?
(based on a hypothetical $10,000 investment)
| Class Name | Costs of a $10,000 investment | Costs paid as a percentage of a $10,000 investment |
|---|
| Class I | $118 | 1.26% |
How did the Fund perform last year and what affected its performance?
Key contributors to (↑) and detractors from (↓) performance, relative to the MSCI China Index (the Index):
↓ An overweight position in online retailer Meituan declined in value amid weak consumer spending, intensified competition, and reduced profit margins
↓ An overweight position in pharmaceutical firm Wuxi Biologics fell in value amid weak profits and potential lost sales if the U.S. Biosecure Act is passed
↓ An overweight position in online services provider NetEase fell in value as profits declined and the U.S. barred NetEase from buying Nvidia microchips
↓ On a sector basis, stock selections and an overweight in health care; an overweight in consumer staples; and stock selections in industrials hurt returns
↑ An overweight position in online gaming firm Tencent Holdings rose in value on higher gaming activity, stronger ad revenue, and more earnings visibility
↑ Not owning internet search engine and Index component Baidu helped returns as its stock price fell amid weak ad revenue and concern over China’s economy
↑ An overweight position in air conditioner maker Gree Electric Appliances rose in value after China announced measures supporting new A/C purchases
↑ On a sector basis, an overweight position in communication services helped Index-relative performance during the period
Comparison of the change in value of a $1,000,000 investment for the period indicated.

| Class I | MSCI China Index |
|---|
| 8/14 | $1,000,000 | $1,000,000 |
| 9/14 | $938,849 | $936,219 |
| 10/14 | $980,665 | $976,570 |
| 11/14 | $980,665 | $991,870 |
| 12/14 | $949,191 | $1,003,351 |
| 1/15 | $969,424 | $1,026,060 |
| 2/15 | $997,752 | $1,059,305 |
| 3/15 | $1,005,396 | $1,084,802 |
| 4/15 | $1,102,068 | $1,265,709 |
| 5/15 | $1,094,012 | $1,218,863 |
| 6/15 | $1,051,552 | $1,150,335 |
| 7/15 | $981,991 | $1,026,492 |
| 8/15 | $869,970 | $906,558 |
| 9/15 | $861,388 | $889,046 |
| 10/15 | $922,367 | $969,765 |
| 11/15 | $916,946 | $937,050 |
| 12/15 | $904,584 | $924,846 |
| 1/16 | $821,740 | $807,211 |
| 2/16 | $804,021 | $786,802 |
| 3/16 | $880,640 | $880,443 |
| 4/16 | $865,796 | $878,705 |
| 5/16 | $867,232 | $872,103 |
| 6/16 | $895,964 | $881,450 |
| 7/16 | $941,936 | $912,206 |
| 8/16 | $982,161 | $979,424 |
| 9/16 | $1,012,330 | $1,004,177 |
| 10/16 | $984,555 | $984,730 |
| 11/16 | $967,795 | $972,943 |
| 12/16 | $922,491 | $933,136 |
| 1/17 | $974,735 | $996,473 |
| 2/17 | $1,004,243 | $1,031,733 |
| 3/17 | $1,039,556 | $1,053,759 |
| 4/17 | $1,073,902 | $1,081,862 |
| 5/17 | $1,118,890 | $1,138,940 |
| 6/17 | $1,145,979 | $1,165,156 |
| 7/17 | $1,204,995 | $1,268,686 |
| 8/17 | $1,242,243 | $1,322,185 |
| 9/17 | $1,245,629 | $1,335,924 |
| 10/17 | $1,296,422 | $1,389,019 |
| 11/17 | $1,336,089 | $1,410,671 |
| 12/17 | $1,382,425 | $1,437,675 |
| 1/18 | $1,493,972 | $1,617,214 |
| 2/18 | $1,426,827 | $1,513,646 |
| 3/18 | $1,414,373 | $1,463,826 |
| 4/18 | $1,390,006 | $1,463,479 |
| 5/18 | $1,431,701 | $1,490,357 |
| 6/18 | $1,400,836 | $1,412,561 |
| 7/18 | $1,382,425 | $1,377,328 |
| 8/18 | $1,342,355 | $1,325,042 |
| 9/18 | $1,333,149 | $1,306,505 |
| 10/18 | $1,198,318 | $1,156,658 |
| 11/18 | $1,267,088 | $1,241,438 |
| 12/18 | $1,248,748 | $1,166,303 |
| 1/19 | $1,336,923 | $1,295,283 |
| 2/19 | $1,392,330 | $1,339,995 |
| 3/19 | $1,453,099 | $1,372,636 |
| 4/19 | $1,462,036 | $1,403,213 |
| 5/19 | $1,359,562 | $1,219,573 |
| 6/19 | $1,441,184 | $1,317,515 |
| 7/19 | $1,420,927 | $1,310,374 |
| 8/19 | $1,395,309 | $1,255,527 |
| 9/19 | $1,392,330 | $1,255,208 |
| 10/19 | $1,462,632 | $1,305,877 |
| 11/19 | $1,451,312 | $1,329,162 |
| 12/19 | $1,542,850 | $1,439,884 |
| 1/20 | $1,474,992 | $1,370,724 |
| 2/20 | $1,481,161 | $1,384,053 |
| 3/20 | $1,344,827 | $1,292,791 |
| 4/20 | $1,445,381 | $1,374,421 |
| 5/20 | $1,432,426 | $1,367,636 |
| 6/20 | $1,525,577 | $1,490,475 |
| 7/20 | $1,627,982 | $1,631,236 |
| 8/20 | $1,699,541 | $1,723,816 |
| 9/20 | $1,653,274 | $1,676,712 |
| 10/20 | $1,693,989 | $1,765,397 |
| 11/20 | $1,805,647 | $1,814,353 |
| 12/20 | $1,937,075 | $1,864,563 |
| 1/21 | $2,032,364 | $2,001,852 |
| 2/21 | $2,041,892 | $1,981,123 |
| 3/21 | $2,007,861 | $1,856,615 |
| 4/21 | $2,037,128 | $1,882,382 |
| 5/21 | $2,081,369 | $1,896,862 |
| 6/21 | $2,005,138 | $1,898,718 |
| 7/21 | $1,862,206 | $1,635,874 |
| 8/21 | $1,849,274 | $1,635,939 |
| 9/21 | $1,786,656 | $1,553,770 |
| 10/21 | $1,807,075 | $1,602,800 |
| 11/21 | $1,754,666 | $1,507,083 |
| 12/21 | $1,754,743 | $1,459,592 |
| 1/22 | $1,710,373 | $1,416,533 |
| 2/22 | $1,624,497 | $1,361,291 |
| 3/22 | $1,426,265 | $1,252,440 |
| 4/22 | $1,374,739 | $1,201,294 |
| 5/22 | $1,404,796 | $1,215,453 |
| 6/22 | $1,482,801 | $1,295,184 |
| 7/22 | $1,374,739 | $1,172,179 |
| 8/22 | $1,370,445 | $1,174,797 |
| 9/22 | $1,193,683 | $1,003,813 |
| 10/22 | $978,276 | $835,074 |
| 11/22 | $1,309,616 | $1,083,160 |
| 12/22 | $1,360,653 | $1,139,496 |
| 1/23 | $1,516,806 | $1,273,736 |
| 2/23 | $1,383,394 | $1,141,587 |
| 3/23 | $1,381,119 | $1,193,142 |
| 4/23 | $1,312,139 | $1,131,610 |
| 5/23 | $1,166,599 | $1,036,195 |
| 6/23 | $1,204,500 | $1,077,307 |
| 7/23 | $1,316,687 | $1,193,211 |
| 8/23 | $1,219,660 | $1,086,354 |
| 9/23 | $1,162,809 | $1,056,439 |
| 10/23 | $1,134,004 | $1,011,408 |
| 11/23 | $1,174,179 | $1,036,899 |
| 12/23 | $1,127,142 | $1,011,901 |
| 1/24 | $972,129 | $904,519 |
| 2/24 | $1,027,373 | $980,446 |
| 3/24 | $1,038,092 | $989,693 |
| 4/24 | $1,099,933 | $1,054,973 |
| 5/24 | $1,141,160 | $1,080,278 |
| 6/24 | $1,123,844 | $1,059,866 |
| 7/24 | $1,073,547 | $1,045,786 |
| 8/24 | $1,066,127 | $1,056,292 |
Average Annual Total Returns (%)
| 1 Year | 5 Years | 10 Years |
|---|
| Class I | (12.59)% | (5.23)% | 0.64% |
| MSCI China Index (net of foreign withholding taxes) | (2.77)% | (3.39)% | 0.55% |
Performance does not reflect the deduction of taxes that a shareholder would pay on Fund distributions or redemption of Fund shares. Performance assumes that all dividends and distributions, if any, were reinvested. For more recent performance information, visit www.eatonvance.com/performance.php.
THE FUND'S PAST PERFORMANCE IS NO GUARANTEE OF FUTURE RESULTS.
| Total Net Assets | $32,112,625 |
| # of Portfolio Holdings | 35 |
| Portfolio Turnover Rate | 77% |
| Total Advisory Fees Paid | $124,295 |
What did the Fund invest in?
The following tables reflect what the Fund invested in as of the report date.
Sector Allocation (% of total investments)
| Value | Value |
|---|
| Information Technology | 1.5% |
| Energy | 1.8% |
| Real Estate | 1.9% |
| Short-Term Investments | 2.2% |
| Health Care | 3.7% |
| Consumer Staples | 4.7% |
| Industrials | 7.9% |
| Financials | 19.0% |
| Consumer Discretionary | 28.6% |
| Communication Services | 28.7% |
Top Ten Holdings (% of total investments)Footnote Referencea
| Tencent Holdings Ltd. | 22.9% |
| China Construction Bank Corp., Class H | 12.1% |
| PDD Holdings, Inc., ADR | 6.1% |
| Meituan, Class B | 5.0% |
| NetEase, Inc. | 4.8% |
| China Merchants Bank Co. Ltd., Class H | 4.8% |
| Trip.com Group Ltd. | 4.6% |
| Kweichow Moutai Co. Ltd., Class A | 3.2% |
| BYD Co. Ltd., Class H | 2.2% |
| China State Construction International Holdings Ltd. | 2.0% |
| Total | 67.7% |
| Footnote | Description |
Footnotea | Excluding cash equivalents |
If you wish to view additional information about the Fund, including the prospectus, statement of additional information, financial statements and holdings, please scan the QR code or visit www.eatonvance.com/open-end-mutual-fund-documents.php. For proxy information, please visit www.eatonvance.com/proxyvoting.
The Funds may deliver a single copy of certain required shareholder documents (including prospectuses, shareholder reports, and proxy materials) to investors with the same last name and the same address. Your participation will continue indefinitely unless you instruct otherwise by calling 1-800-262-1122 or by contacting your financial intermediary. Your instruction will typically be effective within 30 days of receipt.
Not FDIC Insured | May Lose Value | No Bank Guarantee
Annual Shareholder Report August 31, 2024
Eaton Vance Richard Bernstein All Asset Strategy Fund
Annual Shareholder Report August 31, 2024
This annual shareholder report contains important information about the Eaton Vance Richard Bernstein All Asset Strategy Fund for the period of September 1, 2023 to August 31, 2024. You can find additional information about the Fund at www.eatonvance.com/open-end-mutual-fund-documents.php. You can also request this information by contacting us at 1-800-262-1122.
What were the Fund costs for the last year?
(based on a hypothetical $10,000 investment)
| Class Name | Costs of a $10,000 investment | Costs paid as a percentage of a $10,000 investment |
|---|
| Class A | $130 | 1.23% |
How did the Fund perform last year and what affected its performance?
Key contributors to (↑) and detractors from (↓) performance, relative to 60% Bloomberg U.S. Aggregate Bond Index/40% MSCI ACWI Index (the Blended Index):
↓ An underweight position in the information technology sector -- mainly in the semiconductors & semiconductor equipment industry -- detracted from returns
↓ Despite small-cap stocks having low valuations relative to large-cap stocks, an overweight position in global small-cap stocks detracted from returns
↓ An overweight position in short-term and long-term U.S. Treasurys, which underperformed the Blended Index, detracted from relative returns
↓ Overweight positions in U.S. energy and consumer staples -- two of the weaker-performing equity sectors within the Blended Index -- hurt returns
↓ An overweight position in China -- through investments in the MSCI China ETF -- hampered returns relative to the Blended Index, and was sold in July 2024
↑ An overweight position in equities and an underweight position in fixed-income assets helped relative returns as stocks generally outperformed bonds
↑ Stock selections in the financials and health care sectors contributed to performance relative to the Blended Index during the period
↑ An overweight position in securitized mortgages -- through investments in the Janus Henderson Mortgage-Backed Securities ETF -- helped relative returns
Comparison of the change in value of a $10,000 investment for the period indicated.
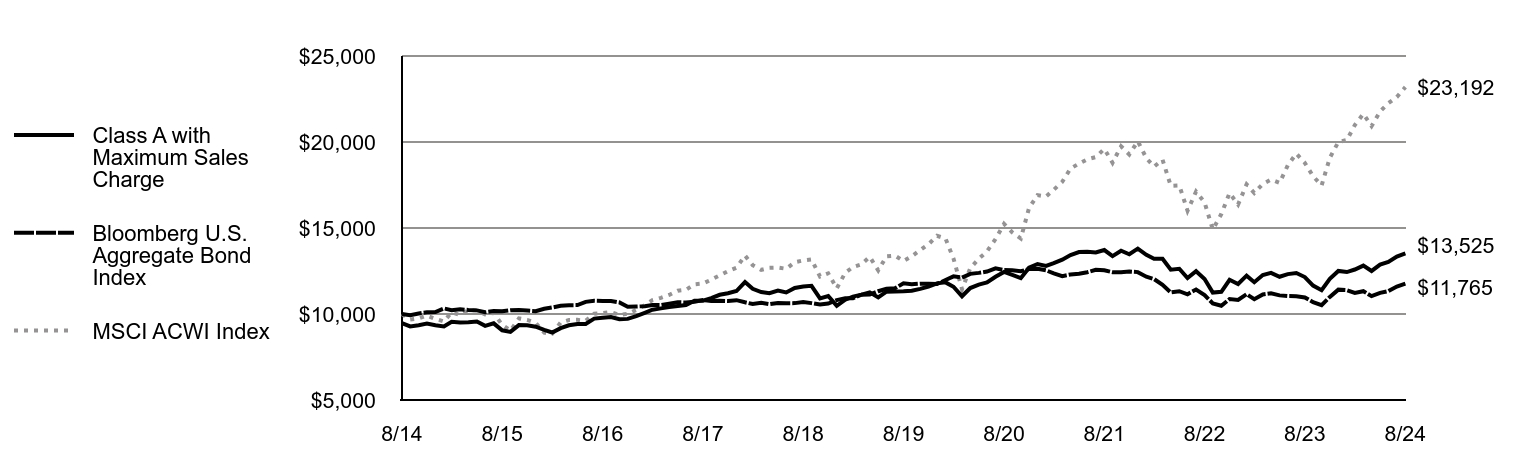
| Class A with Maximum Sales Charge | Bloomberg U.S. Aggregate Bond Index | MSCI ACWI Index |
|---|
| 8/14 | $9,475 | $10,000 | $10,000 |
| 9/14 | $9,278 | $9,932 | $9,676 |
| 10/14 | $9,351 | $10,030 | $9,744 |
| 11/14 | $9,439 | $10,101 | $9,907 |
| 12/14 | $9,346 | $10,110 | $9,716 |
| 1/15 | $9,279 | $10,322 | $9,564 |
| 2/15 | $9,553 | $10,225 | $10,096 |
| 3/15 | $9,508 | $10,273 | $9,940 |
| 4/15 | $9,523 | $10,236 | $10,228 |
| 5/15 | $9,567 | $10,211 | $10,215 |
| 6/15 | $9,309 | $10,100 | $9,974 |
| 7/15 | $9,457 | $10,170 | $10,061 |
| 8/15 | $9,050 | $10,156 | $9,371 |
| 9/15 | $8,962 | $10,224 | $9,032 |
| 10/15 | $9,353 | $10,226 | $9,741 |
| 11/15 | $9,346 | $10,199 | $9,660 |
| 12/15 | $9,259 | $10,166 | $9,486 |
| 1/16 | $9,072 | $10,306 | $8,914 |
| 2/16 | $8,923 | $10,379 | $8,853 |
| 3/16 | $9,177 | $10,474 | $9,509 |
| 4/16 | $9,342 | $10,514 | $9,649 |
| 5/16 | $9,424 | $10,517 | $9,661 |
| 6/16 | $9,417 | $10,706 | $9,603 |
| 7/16 | $9,731 | $10,774 | $10,016 |
| 8/16 | $9,776 | $10,761 | $10,050 |
| 9/16 | $9,828 | $10,755 | $10,112 |
| 10/16 | $9,693 | $10,673 | $9,940 |
| 11/16 | $9,716 | $10,420 | $10,016 |
| 12/16 | $9,882 | $10,435 | $10,232 |
| 1/17 | $10,070 | $10,456 | $10,512 |
| 2/17 | $10,251 | $10,526 | $10,807 |
| 3/17 | $10,326 | $10,520 | $10,939 |
| 4/17 | $10,401 | $10,601 | $11,109 |
| 5/17 | $10,469 | $10,683 | $11,355 |
| 6/17 | $10,522 | $10,672 | $11,406 |
| 7/17 | $10,770 | $10,718 | $11,725 |
| 8/17 | $10,777 | $10,814 | $11,770 |
| 9/17 | $10,920 | $10,763 | $11,997 |
| 10/17 | $11,116 | $10,769 | $12,246 |
| 11/17 | $11,206 | $10,755 | $12,484 |
| 12/17 | $11,335 | $10,805 | $12,685 |
| 1/18 | $11,857 | $10,680 | $13,400 |
| 2/18 | $11,466 | $10,579 | $12,838 |
| 3/18 | $11,274 | $10,647 | $12,563 |
| 4/18 | $11,205 | $10,568 | $12,683 |
| 5/18 | $11,366 | $10,643 | $12,699 |
| 6/18 | $11,251 | $10,630 | $12,630 |
| 7/18 | $11,512 | $10,633 | $13,011 |
| 8/18 | $11,604 | $10,701 | $13,113 |
| 9/18 | $11,635 | $10,632 | $13,170 |
| 10/18 | $10,905 | $10,548 | $12,183 |
| 11/18 | $11,043 | $10,611 | $12,361 |
| 12/18 | $10,471 | $10,806 | $11,491 |
| 1/19 | $10,833 | $10,921 | $12,398 |
| 2/19 | $11,014 | $10,914 | $12,729 |
| 3/19 | $11,125 | $11,124 | $12,890 |
| 4/19 | $11,259 | $11,127 | $13,325 |
| 5/19 | $10,967 | $11,324 | $12,534 |
| 6/19 | $11,298 | $11,466 | $13,355 |
| 7/19 | $11,306 | $11,492 | $13,394 |
| 8/19 | $11,322 | $11,789 | $13,077 |
| 9/19 | $11,353 | $11,727 | $13,352 |
| 10/19 | $11,463 | $11,762 | $13,717 |
| 11/19 | $11,597 | $11,756 | $14,052 |
| 12/19 | $11,780 | $11,748 | $14,547 |
| 1/20 | $11,838 | $11,974 | $14,386 |
| 2/20 | $11,583 | $12,189 | $13,224 |
| 3/20 | $11,032 | $12,118 | $11,439 |
| 4/20 | $11,509 | $12,333 | $12,664 |
| 5/20 | $11,706 | $12,391 | $13,215 |
| 6/20 | $11,830 | $12,469 | $13,637 |
| 7/20 | $12,167 | $12,655 | $14,358 |
| 8/20 | $12,446 | $12,553 | $15,237 |
| 9/20 | $12,274 | $12,546 | $14,746 |
| 10/20 | $12,084 | $12,490 | $14,388 |
| 11/20 | $12,693 | $12,612 | $16,161 |
| 12/20 | $12,907 | $12,630 | $16,911 |
| 1/21 | $12,797 | $12,539 | $16,834 |
| 2/21 | $12,957 | $12,358 | $17,224 |
| 3/21 | $13,161 | $12,204 | $17,684 |
| 4/21 | $13,431 | $12,300 | $18,458 |
| 5/21 | $13,601 | $12,340 | $18,745 |
| 6/21 | $13,618 | $12,427 | $18,992 |
| 7/21 | $13,575 | $12,566 | $19,123 |
| 8/21 | $13,719 | $12,542 | $19,601 |
| 9/21 | $13,364 | $12,433 | $18,792 |
| 10/21 | $13,677 | $12,430 | $19,751 |
| 11/21 | $13,474 | $12,467 | $19,275 |
| 12/21 | $13,801 | $12,435 | $20,046 |
| 1/22 | $13,444 | $12,167 | $19,062 |
| 2/22 | $13,212 | $12,031 | $18,569 |
| 3/22 | $13,212 | $11,697 | $18,972 |
| 4/22 | $12,578 | $11,253 | $17,453 |
| 5/22 | $12,632 | $11,326 | $17,474 |
| 6/22 | $12,087 | $11,148 | $16,001 |
| 7/22 | $12,489 | $11,420 | $17,118 |
| 8/22 | $12,034 | $11,098 | $16,488 |
| 9/22 | $11,248 | $10,618 | $14,909 |
| 10/22 | $11,293 | $10,481 | $15,809 |
| 11/22 | $11,989 | $10,866 | $17,035 |
| 12/22 | $11,743 | $10,817 | $16,365 |
| 1/23 | $12,229 | $11,150 | $17,538 |
| 2/23 | $11,851 | $10,862 | $17,035 |
| 3/23 | $12,265 | $11,138 | $17,561 |
| 4/23 | $12,391 | $11,205 | $17,813 |
| 5/23 | $12,166 | $11,083 | $17,622 |
| 6/23 | $12,319 | $11,044 | $18,645 |
| 7/23 | $12,382 | $11,036 | $19,328 |
| 8/23 | $12,148 | $10,965 | $18,788 |
| 9/23 | $11,653 | $10,687 | $18,011 |
| 10/23 | $11,383 | $10,518 | $17,469 |
| 11/23 | $12,040 | $10,994 | $19,082 |
| 12/23 | $12,503 | $11,415 | $19,998 |
| 1/24 | $12,439 | $11,384 | $20,116 |
| 2/24 | $12,586 | $11,223 | $20,979 |
| 3/24 | $12,816 | $11,327 | $21,637 |
| 4/24 | $12,503 | $11,041 | $20,924 |
| 5/24 | $12,872 | $11,228 | $21,773 |
| 6/24 | $13,028 | $11,334 | $22,258 |
| 7/24 | $13,341 | $11,599 | $22,617 |
| 8/24 | $13,525 | $11,765 | $23,192 |
Average Annual Total Returns (%)
| 1 Year | 5 Years | 10 Years |
|---|
| Class A | 11.34% | 3.62% | 3.62% |
| Class A with 5.25% Maximum Sales Charge | 5.48% | 2.50% | 3.06% |
| Bloomberg U.S. Aggregate Bond Index | 7.30% | (0.04)% | 1.64% |
| MSCI ACWI Index (net of foreign withholding taxes) | 23.44% | 12.13% | 8.77% |
| Blended Index | 13.58% | 4.94% | 4.67% |
Performance does not reflect the deduction of taxes that a shareholder would pay on Fund distributions or redemption of Fund shares. Performance assumes that all dividends and distributions, if any, were reinvested. For more recent performance information, visit www.eatonvance.com/performance.php.
THE FUND'S PAST PERFORMANCE IS NO GUARANTEE OF FUTURE RESULTS.
| Total Net Assets | $425,009,041 |
| # of Portfolio Holdings | 272 |
| Portfolio Turnover Rate | 49% |
| Total Advisory Fees Paid | $3,892,902 |
What did the Fund invest in?
The following tables reflect what the Fund invested in as of the report date.
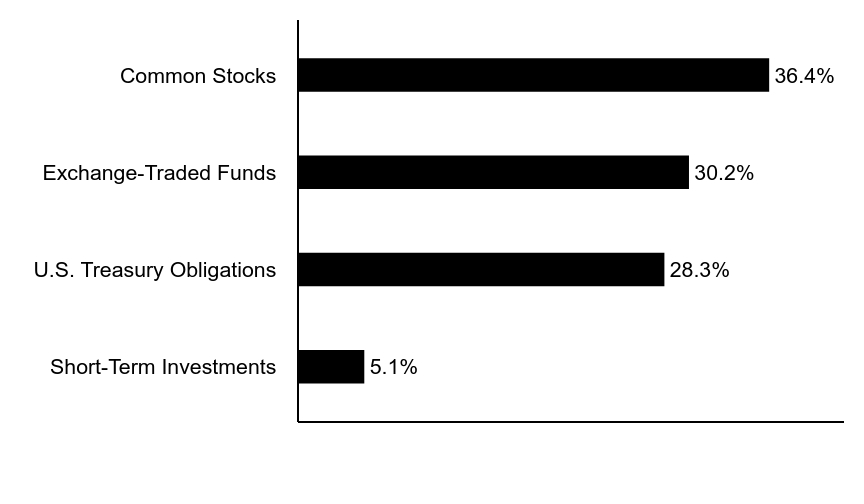
Asset Allocation (% of total investments)
| Value | Value |
|---|
| Short-Term Investments | 5.1% |
| U.S. Treasury Obligations | 28.3% |
| Exchange-Traded Funds | 30.2% |
| Common Stocks | 36.4% |
Top Ten Holdings (% of total investments)Footnote Referencea
| Janus Henderson Mortgage-Backed Securities ETF | 22.1% |
| iShares MSCI Taiwan ETF | 3.1% |
| iShares MSCI India ETF | 3.1% |
| U.S. Treasury Notes, 4.50%, 11/15/25 | 2.3% |
| U.S. Treasury Notes, 4.00%, 2/15/26 | 2.2% |
| U.S. Treasury Bonds, 2.25%, 5/15/41 | 2.0% |
| Apple, Inc. | 2.0% |
| iShares MSCI South Korea ETF | 1.9% |
| NVIDIA Corp. | 1.8% |
| Microsoft Corp. | 1.8% |
| Total | 42.3% |
| Footnote | Description |
Footnotea | Excluding cash equivalents |
If you wish to view additional information about the Fund, including the prospectus, statement of additional information, financial statements and holdings, please scan the QR code or visit www.eatonvance.com/open-end-mutual-fund-documents.php. For proxy information, please visit www.eatonvance.com/proxyvoting.
The Funds may deliver a single copy of certain required shareholder documents (including prospectuses, shareholder reports, and proxy materials) to investors with the same last name and the same address. Your participation will continue indefinitely unless you instruct otherwise by calling 1-800-262-1122 or by contacting your financial intermediary. Your instruction will typically be effective within 30 days of receipt.
Not FDIC Insured | May Lose Value | No Bank Guarantee
Annual Shareholder Report August 31, 2024
Eaton Vance Richard Bernstein All Asset Strategy Fund
Annual Shareholder Report August 31, 2024
This annual shareholder report contains important information about the Eaton Vance Richard Bernstein All Asset Strategy Fund for the period of September 1, 2023 to August 31, 2024. You can find additional information about the Fund at www.eatonvance.com/open-end-mutual-fund-documents.php. You can also request this information by contacting us at 1-800-262-1122.
What were the Fund costs for the last year?
(based on a hypothetical $10,000 investment)
| Class Name | Costs of a $10,000 investment | Costs paid as a percentage of a $10,000 investment |
|---|
| Class C | $208 | 1.98% |
How did the Fund perform last year and what affected its performance?
Key contributors to (↑) and detractors from (↓) performance, relative to 60% Bloomberg U.S. Aggregate Bond Index/40% MSCI ACWI Index (the Blended Index):
↓ An underweight position in the information technology sector -- mainly in the semiconductors & semiconductor equipment industry -- detracted from returns
↓ Despite small-cap stocks having low valuations relative to large-cap stocks, an overweight position in global small-cap stocks detracted from returns
↓ An overweight position in short-term and long-term U.S. Treasurys, which underperformed the Blended Index, detracted from relative returns
↓ Overweight positions in U.S. energy and consumer staples -- two of the weaker-performing equity sectors within the Blended Index -- hurt returns
↓ An overweight position in China -- through investments in the MSCI China ETF -- hampered returns relative to the Blended Index, and was sold in July 2024
↑ An overweight position in equities and an underweight position in fixed-income assets helped relative returns as stocks generally outperformed bonds
↑ Stock selections in the financials and health care sectors contributed to performance relative to the Blended Index during the period
↑ An overweight position in securitized mortgages -- through investments in the Janus Henderson Mortgage-Backed Securities ETF -- helped relative returns
Comparison of the change in value of a $10,000 investment for the period indicated.
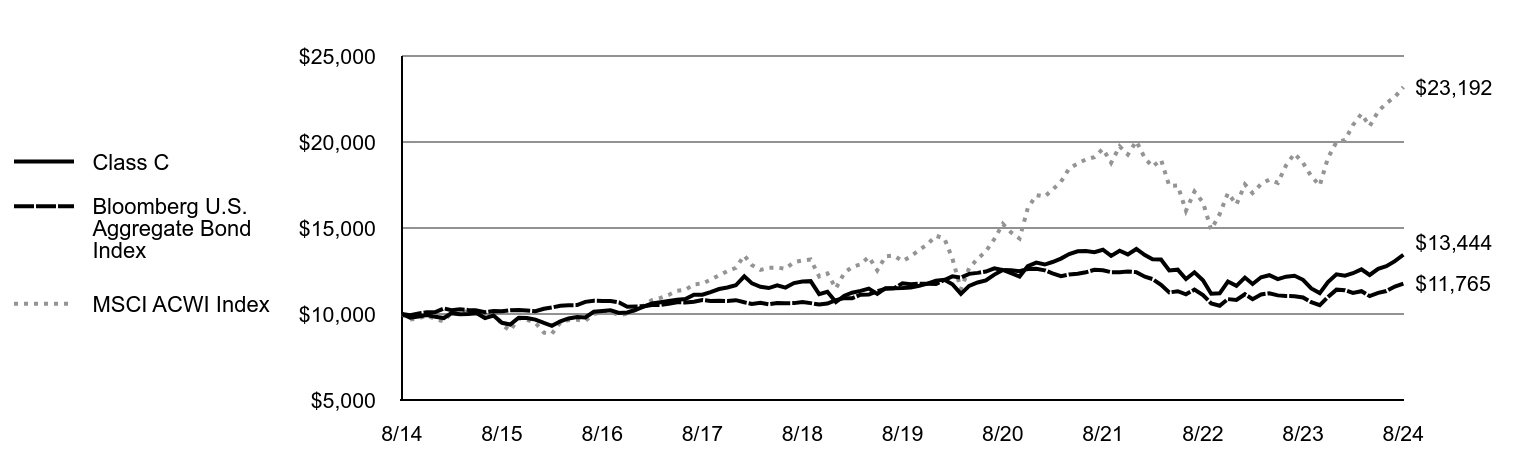
| Class C | Bloomberg U.S. Aggregate Bond Index | MSCI ACWI Index |
|---|
| 8/14 | $10,000 | $10,000 | $10,000 |
| 9/14 | $9,789 | $9,932 | $9,676 |
| 10/14 | $9,859 | $10,030 | $9,744 |
| 11/14 | $9,945 | $10,101 | $9,907 |
| 12/14 | $9,835 | $10,110 | $9,716 |
| 1/15 | $9,764 | $10,322 | $9,564 |
| 2/15 | $10,048 | $10,225 | $10,096 |
| 3/15 | $9,992 | $10,273 | $9,940 |
| 4/15 | $10,000 | $10,236 | $10,228 |
| 5/15 | $10,048 | $10,211 | $10,215 |
| 6/15 | $9,764 | $10,100 | $9,974 |
| 7/15 | $9,914 | $10,170 | $10,061 |
| 8/15 | $9,488 | $10,156 | $9,371 |
| 9/15 | $9,385 | $10,224 | $9,032 |
| 10/15 | $9,787 | $10,226 | $9,741 |
| 11/15 | $9,772 | $10,199 | $9,660 |
| 12/15 | $9,676 | $10,166 | $9,486 |
| 1/16 | $9,478 | $10,306 | $8,914 |
| 2/16 | $9,312 | $10,379 | $8,853 |
| 3/16 | $9,573 | $10,474 | $9,509 |
| 4/16 | $9,740 | $10,514 | $9,649 |
| 5/16 | $9,819 | $10,517 | $9,661 |
| 6/16 | $9,803 | $10,706 | $9,603 |
| 7/16 | $10,128 | $10,774 | $10,016 |
| 8/16 | $10,168 | $10,761 | $10,050 |
| 9/16 | $10,215 | $10,755 | $10,112 |
| 10/16 | $10,065 | $10,673 | $9,940 |
| 11/16 | $10,088 | $10,420 | $10,016 |
| 12/16 | $10,247 | $10,435 | $10,232 |
| 1/17 | $10,437 | $10,456 | $10,512 |
| 2/17 | $10,619 | $10,526 | $10,807 |
| 3/17 | $10,683 | $10,520 | $10,939 |
| 4/17 | $10,754 | $10,601 | $11,109 |
| 5/17 | $10,826 | $10,683 | $11,355 |
| 6/17 | $10,873 | $10,672 | $11,406 |
| 7/17 | $11,119 | $10,718 | $11,725 |
| 8/17 | $11,119 | $10,814 | $11,770 |
| 9/17 | $11,269 | $10,763 | $11,997 |
| 10/17 | $11,451 | $10,769 | $12,246 |
| 11/17 | $11,539 | $10,755 | $12,484 |
| 12/17 | $11,669 | $10,805 | $12,685 |
| 1/18 | $12,192 | $10,680 | $13,400 |
| 2/18 | $11,782 | $10,579 | $12,838 |
| 3/18 | $11,581 | $10,647 | $12,563 |
| 4/18 | $11,509 | $10,568 | $12,683 |
| 5/18 | $11,661 | $10,643 | $12,699 |
| 6/18 | $11,533 | $10,630 | $12,630 |
| 7/18 | $11,798 | $10,633 | $13,011 |
| 8/18 | $11,886 | $10,701 | $13,113 |
| 9/18 | $11,910 | $10,632 | $13,170 |
| 10/18 | $11,155 | $10,548 | $12,183 |
| 11/18 | $11,291 | $10,611 | $12,361 |
| 12/18 | $10,698 | $10,806 | $11,491 |
| 1/19 | $11,067 | $10,921 | $12,398 |
| 2/19 | $11,239 | $10,914 | $12,729 |
| 3/19 | $11,346 | $11,124 | $12,890 |
| 4/19 | $11,477 | $11,127 | $13,325 |
| 5/19 | $11,166 | $11,324 | $12,534 |
| 6/19 | $11,502 | $11,466 | $13,355 |
| 7/19 | $11,502 | $11,492 | $13,394 |
| 8/19 | $11,510 | $11,789 | $13,077 |
| 9/19 | $11,535 | $11,727 | $13,352 |
| 10/19 | $11,642 | $11,762 | $13,717 |
| 11/19 | $11,765 | $11,756 | $14,052 |
| 12/19 | $11,942 | $11,748 | $14,547 |
| 1/20 | $11,993 | $11,974 | $14,386 |
| 2/20 | $11,730 | $12,189 | $13,224 |
| 3/20 | $11,169 | $12,118 | $11,439 |
| 4/20 | $11,636 | $12,333 | $12,664 |
| 5/20 | $11,832 | $12,391 | $13,215 |
| 6/20 | $11,951 | $12,469 | $13,637 |
| 7/20 | $12,291 | $12,655 | $14,358 |
| 8/20 | $12,563 | $12,553 | $15,237 |
| 9/20 | $12,376 | $12,546 | $14,746 |
| 10/20 | $12,180 | $12,490 | $14,388 |
| 11/20 | $12,784 | $12,612 | $16,161 |
| 12/20 | $12,989 | $12,630 | $16,911 |
| 1/21 | $12,876 | $12,539 | $16,834 |
| 2/21 | $13,023 | $12,358 | $17,224 |
| 3/21 | $13,223 | $12,204 | $17,684 |
| 4/21 | $13,484 | $12,300 | $18,458 |
| 5/21 | $13,649 | $12,340 | $18,745 |
| 6/21 | $13,658 | $12,427 | $18,992 |
| 7/21 | $13,597 | $12,566 | $19,123 |
| 8/21 | $13,736 | $12,542 | $19,601 |
| 9/21 | $13,380 | $12,433 | $18,792 |
| 10/21 | $13,675 | $12,430 | $19,751 |
| 11/21 | $13,466 | $12,467 | $19,275 |
| 12/21 | $13,781 | $12,435 | $20,046 |
| 1/22 | $13,426 | $12,167 | $19,062 |
| 2/22 | $13,180 | $12,031 | $18,569 |
| 3/22 | $13,171 | $11,697 | $18,972 |
| 4/22 | $12,534 | $11,253 | $17,453 |
| 5/22 | $12,579 | $11,326 | $17,474 |
| 6/22 | $12,033 | $11,148 | $16,001 |
| 7/22 | $12,425 | $11,420 | $17,118 |
| 8/22 | $11,960 | $11,098 | $16,488 |
| 9/22 | $11,178 | $10,618 | $14,909 |
| 10/22 | $11,205 | $10,481 | $15,809 |
| 11/22 | $11,888 | $10,866 | $17,035 |
| 12/22 | $11,635 | $10,817 | $16,365 |
| 1/23 | $12,117 | $11,150 | $17,538 |
| 2/23 | $11,744 | $10,862 | $17,035 |
| 3/23 | $12,135 | $11,138 | $17,561 |
| 4/23 | $12,254 | $11,205 | $17,813 |
| 5/23 | $12,026 | $11,083 | $17,622 |
| 6/23 | $12,172 | $11,044 | $18,645 |
| 7/23 | $12,226 | $11,036 | $19,328 |
| 8/23 | $11,990 | $10,965 | $18,788 |
| 9/23 | $11,489 | $10,687 | $18,011 |
| 10/23 | $11,216 | $10,518 | $17,469 |
| 11/23 | $11,853 | $10,994 | $19,082 |
| 12/23 | $12,306 | $11,415 | $19,998 |
| 1/24 | $12,232 | $11,384 | $20,116 |
| 2/24 | $12,371 | $11,223 | $20,979 |
| 3/24 | $12,593 | $11,327 | $21,637 |
| 4/24 | $12,269 | $11,041 | $20,924 |
| 5/24 | $12,629 | $11,228 | $21,773 |
| 6/24 | $12,777 | $11,334 | $22,258 |
| 7/24 | $13,073 | $11,599 | $22,617 |
| 8/24 | $13,444 | $11,765 | $23,192 |
Average Annual Total Returns (%)
| 1 Year | 5 Years | 10 Years |
|---|
| Class C | 10.50% | 2.85% | 3.00% |
| Class C with 1% Maximum Deferred Sales Charge | 9.50% | 2.85% | 3.00% |
| Bloomberg U.S. Aggregate Bond Index | 7.30% | (0.04)% | 1.64% |
| MSCI ACWI Index (net of foreign withholding taxes) | 23.44% | 12.13% | 8.77% |
| Blended Index | 13.58% | 4.94% | 4.67% |
Performance does not reflect the deduction of taxes that a shareholder would pay on Fund distributions or redemption of Fund shares. Performance assumes that all dividends and distributions, if any, were reinvested. For more recent performance information, visit www.eatonvance.com/performance.php.
THE FUND'S PAST PERFORMANCE IS NO GUARANTEE OF FUTURE RESULTS.
| Total Net Assets | $425,009,041 |
| # of Portfolio Holdings | 272 |
| Portfolio Turnover Rate | 49% |
| Total Advisory Fees Paid | $3,892,902 |
What did the Fund invest in?
The following tables reflect what the Fund invested in as of the report date.
Asset Allocation (% of total investments)
| Value | Value |
|---|
| Short-Term Investments | 5.1% |
| U.S. Treasury Obligations | 28.3% |
| Exchange-Traded Funds | 30.2% |
| Common Stocks | 36.4% |
Top Ten Holdings (% of total investments)Footnote Referencea
| Janus Henderson Mortgage-Backed Securities ETF | 22.1% |
| iShares MSCI Taiwan ETF | 3.1% |
| iShares MSCI India ETF | 3.1% |
| U.S. Treasury Notes, 4.50%, 11/15/25 | 2.3% |
| U.S. Treasury Notes, 4.00%, 2/15/26 | 2.2% |
| U.S. Treasury Bonds, 2.25%, 5/15/41 | 2.0% |
| Apple, Inc. | 2.0% |
| iShares MSCI South Korea ETF | 1.9% |
| NVIDIA Corp. | 1.8% |
| Microsoft Corp. | 1.8% |
| Total | 42.3% |
| Footnote | Description |
Footnotea | Excluding cash equivalents |
If you wish to view additional information about the Fund, including the prospectus, statement of additional information, financial statements and holdings, please scan the QR code or visit www.eatonvance.com/open-end-mutual-fund-documents.php. For proxy information, please visit www.eatonvance.com/proxyvoting.
The Funds may deliver a single copy of certain required shareholder documents (including prospectuses, shareholder reports, and proxy materials) to investors with the same last name and the same address. Your participation will continue indefinitely unless you instruct otherwise by calling 1-800-262-1122 or by contacting your financial intermediary. Your instruction will typically be effective within 30 days of receipt.
Not FDIC Insured | May Lose Value | No Bank Guarantee
Annual Shareholder Report August 31, 2024
Eaton Vance Richard Bernstein All Asset Strategy Fund
Annual Shareholder Report August 31, 2024
This annual shareholder report contains important information about the Eaton Vance Richard Bernstein All Asset Strategy Fund for the period of September 1, 2023 to August 31, 2024. You can find additional information about the Fund at www.eatonvance.com/open-end-mutual-fund-documents.php. You can also request this information by contacting us at 1-800-262-1122.
What were the Fund costs for the last year?
(based on a hypothetical $10,000 investment)
| Class Name | Costs of a $10,000 investment | Costs paid as a percentage of a $10,000 investment |
|---|
| Class I | $104 | 0.98% |
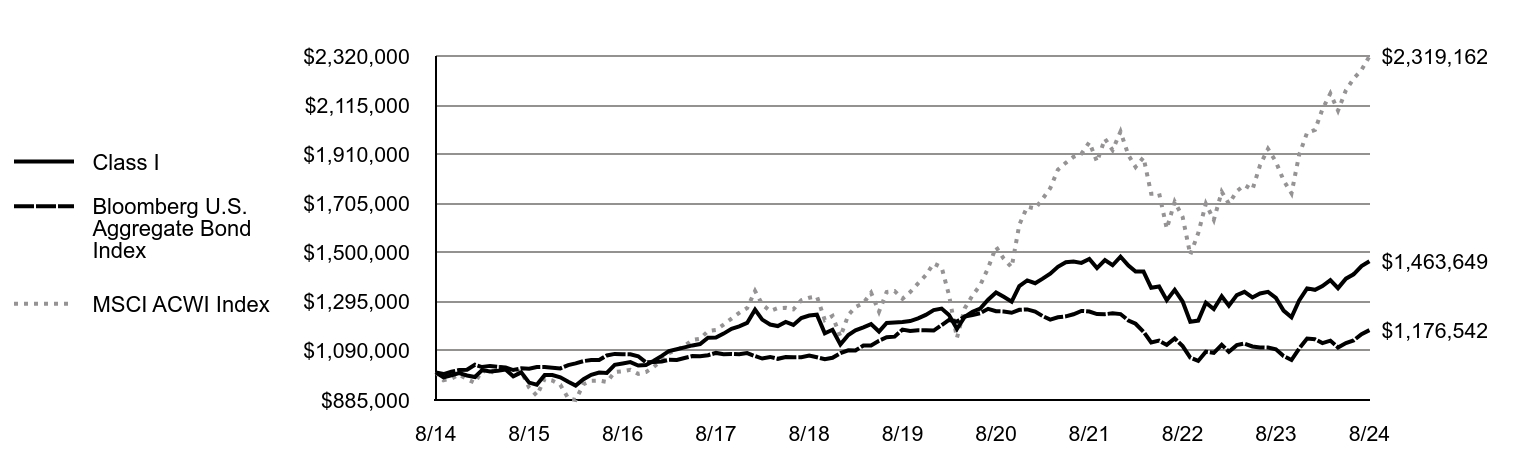
How did the Fund perform last year and what affected its performance?
Key contributors to (↑) and detractors from (↓) performance, relative to 60% Bloomberg U.S. Aggregate Bond Index/40% MSCI ACWI Index (the Blended Index):
↓ An underweight position in the information technology sector -- mainly in the semiconductors & semiconductor equipment industry -- detracted from returns
↓ Despite small-cap stocks having low valuations relative to large-cap stocks, an overweight position in global small-cap stocks detracted from returns
↓ An overweight position in short-term and long-term U.S. Treasurys, which underperformed the Blended Index, detracted from relative returns
↓ Overweight positions in U.S. energy and consumer staples -- two of the weaker-performing equity sectors within the Blended Index -- hurt returns
↓ An overweight position in China -- through investments in the MSCI China ETF -- hampered returns relative to the Blended Index, and was sold in July 2024
↑ An overweight position in equities and an underweight position in fixed-income assets helped relative returns as stocks generally outperformed bonds
↑ Stock selections in the financials and health care sectors contributed to performance relative to the Blended Index during the period
↑ An overweight position in securitized mortgages -- through investments in the Janus Henderson Mortgage-Backed Securities ETF -- helped relative returns
Comparison of the change in value of a $1,000,000 investment for the period indicated.
| Class I | Bloomberg U.S. Aggregate Bond Index | MSCI ACWI Index |
|---|
| 8/14 | $1,000,000 | $1,000,000 | $1,000,000 |
| 9/14 | $979,330 | $993,213 | $967,570 |
| 10/14 | $987,752 | $1,002,974 | $974,384 |
| 11/14 | $996,935 | $1,010,089 | $990,684 |
| 12/14 | $987,116 | $1,011,034 | $971,563 |
| 1/15 | $980,890 | $1,032,235 | $956,377 |
| 2/15 | $1,009,669 | $1,022,529 | $1,009,620 |
| 3/15 | $1,004,229 | $1,027,277 | $993,973 |
| 4/15 | $1,006,559 | $1,023,591 | $1,022,816 |
| 5/15 | $1,012,007 | $1,021,126 | $1,021,481 |
| 6/15 | $984,004 | $1,009,992 | $997,432 |
| 7/15 | $1,000,335 | $1,017,013 | $1,006,095 |
| 8/15 | $957,546 | $1,015,552 | $937,126 |
| 9/15 | $948,992 | $1,022,422 | $903,176 |
| 10/15 | $989,439 | $1,022,592 | $974,058 |
| 11/15 | $989,434 | $1,019,890 | $966,016 |
| 12/15 | $979,764 | $1,016,594 | $948,596 |
| 1/16 | $960,799 | $1,030,584 | $891,386 |
| 2/16 | $944,998 | $1,037,895 | $885,250 |
| 3/16 | $971,862 | $1,047,417 | $950,856 |
| 4/16 | $990,038 | $1,051,438 | $964,891 |
| 5/16 | $999,514 | $1,051,707 | $966,110 |
| 6/16 | $997,928 | $1,070,604 | $960,258 |
| 7/16 | $1,031,909 | $1,077,373 | $1,001,642 |
| 8/16 | $1,037,445 | $1,076,141 | $1,005,010 |
| 9/16 | $1,042,969 | $1,075,510 | $1,011,169 |
| 10/16 | $1,028,753 | $1,067,284 | $994,007 |
| 11/16 | $1,031,124 | $1,042,039 | $1,001,561 |
| 12/16 | $1,049,002 | $1,043,508 | $1,023,197 |
| 1/17 | $1,068,906 | $1,045,556 | $1,051,174 |
| 2/17 | $1,088,801 | $1,052,583 | $1,080,661 |
| 3/17 | $1,096,754 | $1,052,031 | $1,093,881 |
| 4/17 | $1,104,714 | $1,060,150 | $1,110,929 |
| 5/17 | $1,112,671 | $1,068,310 | $1,135,461 |
| 6/17 | $1,118,247 | $1,067,234 | $1,140,625 |
| 7/17 | $1,144,505 | $1,071,827 | $1,172,501 |
| 8/17 | $1,145,301 | $1,081,441 | $1,176,993 |
| 9/17 | $1,162,020 | $1,076,290 | $1,199,733 |
| 10/17 | $1,181,915 | $1,076,914 | $1,224,646 |
| 11/17 | $1,192,260 | $1,075,531 | $1,248,353 |
| 12/17 | $1,206,440 | $1,080,468 | $1,268,478 |
| 1/18 | $1,261,835 | $1,068,024 | $1,340,042 |
| 2/18 | $1,220,294 | $1,057,900 | $1,283,762 |
| 3/18 | $1,199,934 | $1,064,684 | $1,256,281 |
| 4/18 | $1,193,423 | $1,056,765 | $1,268,278 |
| 5/18 | $1,210,523 | $1,064,307 | $1,269,861 |
| 6/18 | $1,198,308 | $1,062,998 | $1,262,985 |
| 7/18 | $1,226,821 | $1,063,251 | $1,301,072 |
| 8/18 | $1,237,410 | $1,070,093 | $1,311,294 |
| 9/18 | $1,240,672 | $1,063,202 | $1,317,001 |
| 10/18 | $1,163,285 | $1,054,800 | $1,218,306 |
| 11/18 | $1,177,948 | $1,061,097 | $1,236,124 |
| 12/18 | $1,116,918 | $1,080,590 | $1,149,059 |
| 1/19 | $1,156,303 | $1,092,066 | $1,239,788 |
| 2/19 | $1,175,579 | $1,091,433 | $1,272,949 |
| 3/19 | $1,188,150 | $1,112,391 | $1,288,957 |
| 4/19 | $1,201,559 | $1,112,675 | $1,332,480 |
| 5/19 | $1,170,556 | $1,132,427 | $1,253,438 |
| 6/19 | $1,206,587 | $1,146,648 | $1,335,513 |
| 7/19 | $1,208,255 | $1,149,170 | $1,339,426 |
| 8/19 | $1,209,928 | $1,178,947 | $1,307,652 |
| 9/19 | $1,214,117 | $1,172,668 | $1,335,167 |
| 10/19 | $1,225,845 | $1,176,201 | $1,371,709 |
| 11/19 | $1,240,095 | $1,175,602 | $1,405,194 |
| 12/19 | $1,260,156 | $1,174,782 | $1,454,678 |
| 1/20 | $1,266,290 | $1,197,390 | $1,438,610 |
| 2/20 | $1,239,121 | $1,218,942 | $1,322,414 |
| 3/20 | $1,181,278 | $1,211,768 | $1,143,884 |
| 4/20 | $1,231,228 | $1,233,309 | $1,266,422 |
| 5/20 | $1,253,129 | $1,239,051 | $1,321,500 |
| 6/20 | $1,266,273 | $1,246,856 | $1,363,725 |
| 7/20 | $1,303,075 | $1,265,481 | $1,435,849 |
| 8/20 | $1,333,736 | $1,255,266 | $1,523,730 |
| 9/20 | $1,315,333 | $1,254,578 | $1,474,600 |
| 10/20 | $1,295,174 | $1,248,976 | $1,438,755 |
| 11/20 | $1,360,020 | $1,261,231 | $1,616,100 |
| 12/20 | $1,383,886 | $1,262,969 | $1,691,134 |
| 1/21 | $1,372,140 | $1,253,914 | $1,683,443 |
| 2/21 | $1,390,215 | $1,235,806 | $1,722,437 |
| 3/21 | $1,411,919 | $1,220,375 | $1,768,443 |
| 4/21 | $1,440,834 | $1,230,016 | $1,845,763 |
| 5/21 | $1,459,810 | $1,234,035 | $1,874,488 |
| 6/21 | $1,462,533 | $1,242,705 | $1,899,192 |
| 7/21 | $1,457,117 | $1,256,600 | $1,912,276 |
| 8/21 | $1,473,388 | $1,254,207 | $1,960,139 |
| 9/21 | $1,435,423 | $1,243,349 | $1,879,166 |
| 10/21 | $1,468,868 | $1,243,006 | $1,975,085 |
| 11/21 | $1,447,174 | $1,246,683 | $1,927,524 |
| 12/21 | $1,482,957 | $1,243,493 | $2,004,626 |
| 1/22 | $1,445,692 | $1,216,703 | $1,906,174 |
| 2/22 | $1,420,849 | $1,203,129 | $1,856,943 |
| 3/22 | $1,420,849 | $1,169,704 | $1,897,162 |
| 4/22 | $1,353,007 | $1,125,316 | $1,745,310 |
| 5/22 | $1,358,740 | $1,132,572 | $1,747,352 |
| 6/22 | $1,301,410 | $1,114,804 | $1,600,057 |
| 7/22 | $1,344,408 | $1,142,044 | $1,711,793 |
| 8/22 | $1,295,676 | $1,109,774 | $1,648,773 |
| 9/22 | $1,211,591 | $1,061,824 | $1,490,938 |
| 10/22 | $1,216,369 | $1,048,071 | $1,580,911 |
| 11/22 | $1,290,899 | $1,086,615 | $1,703,532 |
| 12/22 | $1,264,571 | $1,081,713 | $1,636,496 |
| 1/23 | $1,317,704 | $1,114,991 | $1,753,795 |
| 2/23 | $1,278,095 | $1,086,163 | $1,703,532 |
| 3/23 | $1,322,534 | $1,113,754 | $1,756,056 |
| 4/23 | $1,336,059 | $1,120,504 | $1,781,295 |
| 5/23 | $1,312,873 | $1,108,303 | $1,762,216 |
| 6/23 | $1,329,296 | $1,104,350 | $1,864,532 |
| 7/23 | $1,336,059 | $1,103,580 | $1,932,789 |
| 8/23 | $1,310,941 | $1,096,532 | $1,878,779 |
| 9/23 | $1,257,808 | $1,068,667 | $1,801,090 |
| 10/23 | $1,229,792 | $1,051,802 | $1,746,937 |
| 11/23 | $1,300,315 | $1,099,434 | $1,908,172 |
| 12/23 | $1,350,626 | $1,141,519 | $1,999,829 |
| 1/24 | $1,344,680 | $1,138,385 | $2,011,553 |
| 2/24 | $1,360,535 | $1,122,301 | $2,097,875 |
| 3/24 | $1,385,308 | $1,132,664 | $2,163,742 |
| 4/24 | $1,351,617 | $1,104,055 | $2,092,353 |
| 5/24 | $1,391,253 | $1,122,772 | $2,177,331 |
| 6/24 | $1,409,090 | $1,133,402 | $2,225,825 |
| 7/24 | $1,443,772 | $1,159,875 | $2,261,722 |
| 8/24 | $1,463,649 | $1,176,542 | $2,319,162 |
Average Annual Total Returns (%)
| 1 Year | 5 Years | 10 Years |
|---|
| Class I | 11.64% | 3.88% | 3.88% |
| Bloomberg U.S. Aggregate Bond Index | 7.30% | (0.04)% | 1.64% |
| MSCI ACWI Index (net of foreign withholding taxes) | 23.44% | 12.13% | 8.77% |
| Blended Index | 13.58% | 4.94% | 4.67% |
Performance does not reflect the deduction of taxes that a shareholder would pay on Fund distributions or redemption of Fund shares. Performance assumes that all dividends and distributions, if any, were reinvested. For more recent performance information, visit www.eatonvance.com/performance.php.
THE FUND'S PAST PERFORMANCE IS NO GUARANTEE OF FUTURE RESULTS.
| Total Net Assets | $425,009,041 |
| # of Portfolio Holdings | 272 |
| Portfolio Turnover Rate | 49% |
| Total Advisory Fees Paid | $3,892,902 |
What did the Fund invest in?
The following tables reflect what the Fund invested in as of the report date.
Asset Allocation (% of total investments)
| Value | Value |
|---|
| Short-Term Investments | 5.1% |
| U.S. Treasury Obligations | 28.3% |
| Exchange-Traded Funds | 30.2% |
| Common Stocks | 36.4% |
Top Ten Holdings (% of total investments)Footnote Referencea
| Janus Henderson Mortgage-Backed Securities ETF | 22.1% |
| iShares MSCI Taiwan ETF | 3.1% |
| iShares MSCI India ETF | 3.1% |
| U.S. Treasury Notes, 4.50%, 11/15/25 | 2.3% |
| U.S. Treasury Notes, 4.00%, 2/15/26 | 2.2% |
| U.S. Treasury Bonds, 2.25%, 5/15/41 | 2.0% |
| Apple, Inc. | 2.0% |
| iShares MSCI South Korea ETF | 1.9% |
| NVIDIA Corp. | 1.8% |
| Microsoft Corp. | 1.8% |
| Total | 42.3% |
| Footnote | Description |
Footnotea | Excluding cash equivalents |
If you wish to view additional information about the Fund, including the prospectus, statement of additional information, financial statements and holdings, please scan the QR code or visit www.eatonvance.com/open-end-mutual-fund-documents.php. For proxy information, please visit www.eatonvance.com/proxyvoting.
The Funds may deliver a single copy of certain required shareholder documents (including prospectuses, shareholder reports, and proxy materials) to investors with the same last name and the same address. Your participation will continue indefinitely unless you instruct otherwise by calling 1-800-262-1122 or by contacting your financial intermediary. Your instruction will typically be effective within 30 days of receipt.
Not FDIC Insured | May Lose Value | No Bank Guarantee
Annual Shareholder Report August 31, 2024
Eaton Vance Richard Bernstein Equity Strategy Fund
Annual Shareholder Report August 31, 2024
This annual shareholder report contains important information about the Eaton Vance Richard Bernstein Equity Strategy Fund for the period of September 1, 2023 to August 31, 2024. You can find additional information about the Fund at www.eatonvance.com/open-end-mutual-fund-documents.php. You can also request this information by contacting us at 1-800-262-1122.
What were the Fund costs for the last year?
(based on a hypothetical $10,000 investment)
| Class Name | Costs of a $10,000 investment | Costs paid as a percentage of a $10,000 investment |
|---|
| Class A | $131 | 1.19% |
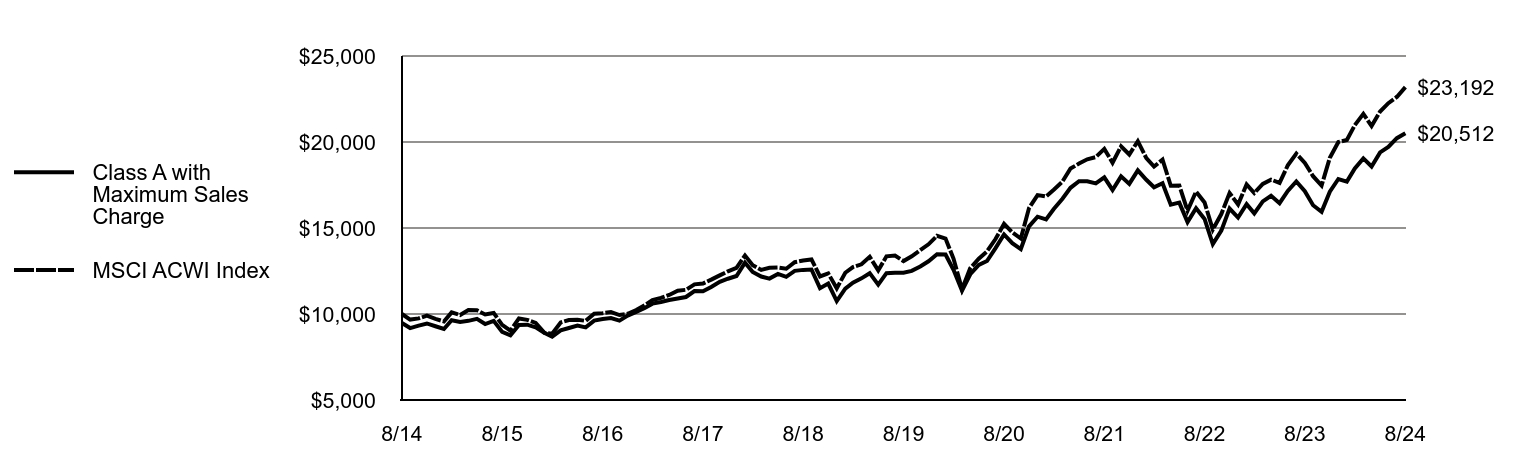
How did the Fund perform last year and what affected its performance?
Key contributors to (↑) and detractors from (↓) performance, relative to the MSCI ACWI Index (the Index):
↓ An underweight position in the information technology sector -- mainly in the semiconductors & semiconductor equipment industry -- detracted from returns
↓ An overweight position in China -- through investments in the MSCI China ETF -- detracted from Index-relative performance, and was sold in July 2024
↓ Despite small-cap stocks having low valuations relative to large-cap stocks, an overweight position in global small-cap stocks detracted from returns
↓ An overweight position in the U.S. energy sector -- particularly in the oil, gas & consumable fuels industry -- detracted from Index-relative performance
↑ In the consumer discretionary sector, underweight positions in the hotels, restaurants & leisure industry; and the textiles, apparel & luxury goods industry contributed to Index-relative returns. Stock selections in the household durables and specialty retail industries also helped relative returns
↑ Stock selections in the financials sector -- most notably in the capital markets, banks, and financial services industries -- contributed to returns
↑ In the health care sector, stock selections in the health care equipment & supplies industry, and biotechnology industry contributed to relative returns
Comparison of the change in value of a $10,000 investment for the period indicated.
| Class A with Maximum Sales Charge | MSCI ACWI Index |
|---|
| 8/14 | $9,475 | $10,000 |
| 9/14 | $9,182 | $9,676 |
| 10/14 | $9,322 | $9,744 |
| 11/14 | $9,450 | $9,907 |
| 12/14 | $9,289 | $9,716 |
| 1/15 | $9,128 | $9,564 |
| 2/15 | $9,635 | $10,096 |
| 3/15 | $9,539 | $9,940 |
| 4/15 | $9,603 | $10,228 |
| 5/15 | $9,719 | $10,215 |
| 6/15 | $9,417 | $9,974 |
| 7/15 | $9,603 | $10,061 |
| 8/15 | $8,955 | $9,371 |
| 9/15 | $8,762 | $9,032 |
| 10/15 | $9,366 | $9,741 |
| 11/15 | $9,379 | $9,660 |
| 12/15 | $9,220 | $9,486 |
| 1/16 | $8,912 | $8,914 |
| 2/16 | $8,683 | $8,853 |
| 3/16 | $9,050 | $9,509 |
| 4/16 | $9,188 | $9,649 |
| 5/16 | $9,332 | $9,661 |
| 6/16 | $9,220 | $9,603 |
| 7/16 | $9,614 | $10,016 |
| 8/16 | $9,705 | $10,050 |
| 9/16 | $9,764 | $10,112 |
| 10/16 | $9,614 | $9,940 |
| 11/16 | $9,908 | $10,016 |
| 12/16 | $10,115 | $10,232 |
| 1/17 | $10,345 | $10,512 |
| 2/17 | $10,602 | $10,807 |
| 3/17 | $10,697 | $10,939 |
| 4/17 | $10,812 | $11,109 |
| 5/17 | $10,906 | $11,355 |
| 6/17 | $10,988 | $11,406 |
| 7/17 | $11,333 | $11,725 |
| 8/17 | $11,319 | $11,770 |
| 9/17 | $11,570 | $11,997 |
| 10/17 | $11,875 | $12,246 |
| 11/17 | $12,051 | $12,484 |
| 12/17 | $12,208 | $12,685 |
| 1/18 | $12,987 | $13,400 |
| 2/18 | $12,444 | $12,838 |
| 3/18 | $12,180 | $12,563 |
| 4/18 | $12,058 | $12,683 |
| 5/18 | $12,330 | $12,699 |
| 6/18 | $12,158 | $12,630 |
| 7/18 | $12,508 | $13,011 |
| 8/18 | $12,565 | $13,113 |
| 9/18 | $12,586 | $13,170 |
| 10/18 | $11,501 | $12,183 |
| 11/18 | $11,772 | $12,361 |
| 12/18 | $10,750 | $11,491 |
| 1/19 | $11,479 | $12,398 |
| 2/19 | $11,825 | $12,729 |
| 3/19 | $12,073 | $12,890 |
| 4/19 | $12,373 | $13,325 |
| 5/19 | $11,704 | $12,534 |
| 6/19 | $12,373 | $13,355 |
| 7/19 | $12,396 | $13,394 |
| 8/19 | $12,403 | $13,077 |
| 9/19 | $12,509 | $13,352 |
| 10/19 | $12,764 | $13,717 |
| 11/19 | $13,065 | $14,052 |
| 12/19 | $13,475 | $14,547 |
| 1/20 | $13,458 | $14,386 |
| 2/20 | $12,572 | $13,224 |
| 3/20 | $11,359 | $11,439 |
| 4/20 | $12,310 | $12,664 |
| 5/20 | $12,851 | $13,215 |
| 6/20 | $13,081 | $13,637 |
| 7/20 | $13,827 | $14,358 |
| 8/20 | $14,623 | $15,237 |
| 9/20 | $14,122 | $14,746 |
| 10/20 | $13,778 | $14,388 |
| 11/20 | $15,098 | $16,161 |
| 12/20 | $15,657 | $16,911 |
| 1/21 | $15,498 | $16,834 |
| 2/21 | $16,103 | $17,224 |
| 3/21 | $16,691 | $17,684 |
| 4/21 | $17,338 | $18,458 |
| 5/21 | $17,716 | $18,745 |
| 6/21 | $17,716 | $18,992 |
| 7/21 | $17,590 | $19,123 |
| 8/21 | $17,943 | $19,601 |
| 9/21 | $17,212 | $18,792 |
| 10/21 | $18,002 | $19,751 |
| 11/21 | $17,565 | $19,275 |
| 12/21 | $18,353 | $20,046 |
| 1/22 | $17,803 | $19,062 |
| 2/22 | $17,366 | $18,569 |
| 3/22 | $17,603 | $18,972 |
| 4/22 | $16,359 | $17,453 |
| 5/22 | $16,473 | $17,474 |
| 6/22 | $15,344 | $16,001 |
| 7/22 | $16,151 | $17,118 |
| 8/22 | $15,524 | $16,488 |
| 9/22 | $14,062 | $14,909 |
| 10/22 | $14,850 | $15,809 |
| 11/22 | $16,132 | $17,035 |
| 12/22 | $15,610 | $16,365 |
| 1/23 | $16,382 | $17,538 |
| 2/23 | $15,850 | $17,035 |
| 3/23 | $16,543 | $17,561 |
| 4/23 | $16,874 | $17,813 |
| 5/23 | $16,442 | $17,622 |
| 6/23 | $17,154 | $18,645 |
| 7/23 | $17,706 | $19,328 |
| 8/23 | $17,144 | $18,788 |
| 9/23 | $16,322 | $18,011 |
| 10/23 | $15,941 | $17,469 |
| 11/23 | $17,114 | $19,082 |
| 12/23 | $17,849 | $19,998 |
| 1/24 | $17,696 | $20,116 |
| 2/24 | $18,458 | $20,979 |
| 3/24 | $19,046 | $21,637 |
| 4/24 | $18,578 | $20,924 |
| 5/24 | $19,395 | $21,773 |
| 6/24 | $19,711 | $22,258 |
| 7/24 | $20,223 | $22,617 |
| 8/24 | $20,512 | $23,192 |
Average Annual Total Returns (%)
| 1 Year | 5 Years | 10 Years |
|---|
| Class A | 19.67% | 10.58% | 8.03% |
| Class A with 5.25% Maximum Sales Charge | 13.37% | 9.40% | 7.44% |
| MSCI ACWI Index (net of foreign withholding taxes) | 23.44% | 12.13% | 8.77% |
Performance does not reflect the deduction of taxes that a shareholder would pay on Fund distributions or redemption of Fund shares. Performance assumes that all dividends and distributions, if any, were reinvested. For more recent performance information, visit www.eatonvance.com/performance.php.
THE FUND'S PAST PERFORMANCE IS NO GUARANTEE OF FUTURE RESULTS.
| Total Net Assets | $721,658,889 |
| # of Portfolio Holdings | 248 |
| Portfolio Turnover Rate | 35% |
| Total Advisory Fees Paid | $5,831,235 |
What did the Fund invest in?
The following tables reflect what the Fund invested in as of the report date.
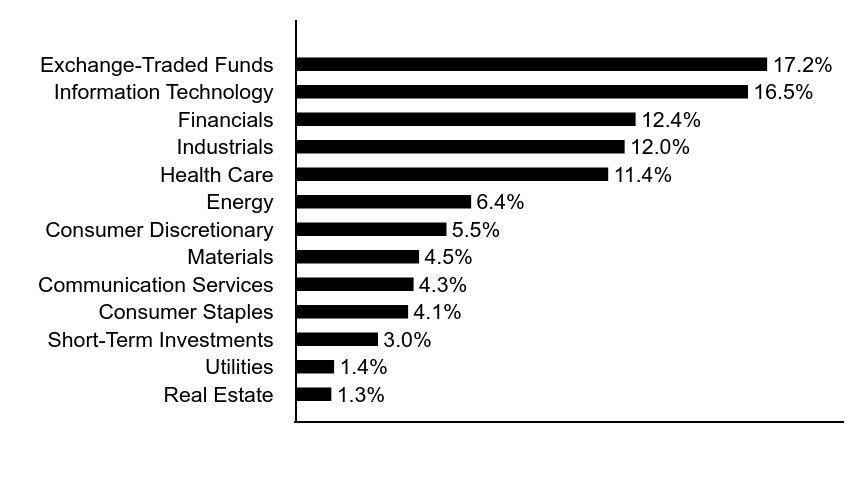
Sector Allocation (% of total investments)
| Value | Value |
|---|
| Real Estate | 1.3% |
| Utilities | 1.4% |
| Short-Term Investments | 3.0% |
| Consumer Staples | 4.1% |
| Communication Services | 4.3% |
| Materials | 4.5% |
| Consumer Discretionary | 5.5% |
| Energy | 6.4% |
| Health Care | 11.4% |
| Industrials | 12.0% |
| Financials | 12.4% |
| Information Technology | 16.5% |
| Exchange-Traded Funds | 17.2% |
Top Ten Holdings (% of total investments)Footnote Referencea
| iShares MSCI Taiwan ETF | 6.6% |
| iShares MSCI India ETF | 6.5% |
| Apple, Inc. | 4.3% |
| iShares MSCI South Korea ETF | 4.1% |
| NVIDIA Corp. | 3.9% |
| Microsoft Corp. | 3.8% |
| Amazon.com, Inc. | 2.1% |
| Meta Platforms, Inc., Class A | 1.4% |
| Alphabet, Inc., Class A | 1.2% |
| Alphabet, Inc., Class C | 1.0% |
| Total | 34.9% |
| Footnote | Description |
Footnotea | Excluding cash equivalents |
If you wish to view additional information about the Fund, including the prospectus, statement of additional information, financial statements and holdings, please scan the QR code or visit www.eatonvance.com/open-end-mutual-fund-documents.php. For proxy information, please visit www.eatonvance.com/proxyvoting.
The Funds may deliver a single copy of certain required shareholder documents (including prospectuses, shareholder reports, and proxy materials) to investors with the same last name and the same address. Your participation will continue indefinitely unless you instruct otherwise by calling 1-800-262-1122 or by contacting your financial intermediary. Your instruction will typically be effective within 30 days of receipt.
Not FDIC Insured | May Lose Value | No Bank Guarantee
Annual Shareholder Report August 31, 2024
Eaton Vance Richard Bernstein Equity Strategy Fund
Annual Shareholder Report August 31, 2024
This annual shareholder report contains important information about the Eaton Vance Richard Bernstein Equity Strategy Fund for the period of September 1, 2023 to August 31, 2024. You can find additional information about the Fund at www.eatonvance.com/open-end-mutual-fund-documents.php. You can also request this information by contacting us at 1-800-262-1122.
What were the Fund costs for the last year?
(based on a hypothetical $10,000 investment)
| Class Name | Costs of a $10,000 investment | Costs paid as a percentage of a $10,000 investment |
|---|
| Class C | $212 | 1.94% |
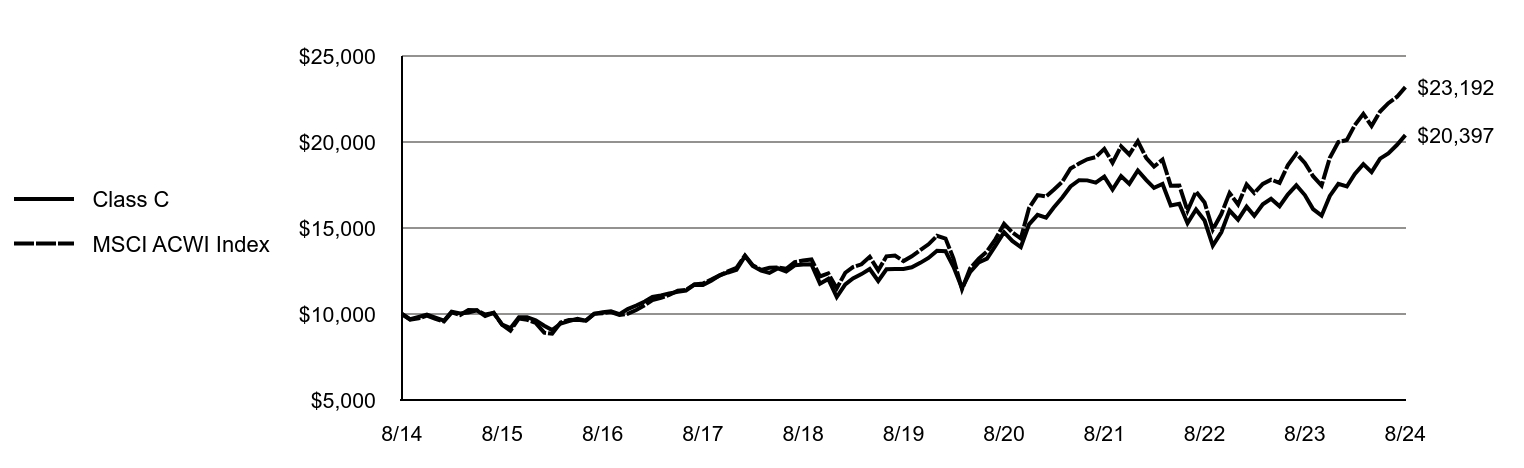
How did the Fund perform last year and what affected its performance?
Key contributors to (↑) and detractors from (↓) performance, relative to the MSCI ACWI Index (the Index):
↓ An underweight position in the information technology sector -- mainly in the semiconductors & semiconductor equipment industry -- detracted from returns
↓ An overweight position in China -- through investments in the MSCI China ETF -- detracted from Index-relative performance, and was sold in July 2024
↓ Despite small-cap stocks having low valuations relative to large-cap stocks, an overweight position in global small-cap stocks detracted from returns
↓ An overweight position in the U.S. energy sector -- particularly in the oil, gas & consumable fuels industry -- detracted from Index-relative performance
↑ In the consumer discretionary sector, underweight positions in the hotels, restaurants & leisure industry; and the textiles, apparel & luxury goods industry contributed to Index-relative returns. Stock selections in the household durables and specialty retail industries also helped relative returns
↑ Stock selections in the financials sector -- most notably in the capital markets, banks, and financial services industries -- contributed to returns
↑ In the health care sector, stock selections in the health care equipment & supplies industry, and biotechnology industry contributed to relative returns
Comparison of the change in value of a $10,000 investment for the period indicated.
| Class C | MSCI ACWI Index |
|---|
| 8/14 | $10,000 | $10,000 |
| 9/14 | $9,694 | $9,676 |
| 10/14 | $9,830 | $9,744 |
| 11/14 | $9,959 | $9,907 |
| 12/14 | $9,785 | $9,716 |
| 1/15 | $9,608 | $9,564 |
| 2/15 | $10,133 | $10,096 |
| 3/15 | $10,031 | $9,940 |
| 4/15 | $10,086 | $10,228 |
| 5/15 | $10,208 | $10,215 |
| 6/15 | $9,881 | $9,974 |
| 7/15 | $10,072 | $10,061 |
| 8/15 | $9,383 | $9,371 |
| 9/15 | $9,178 | $9,032 |
| 10/15 | $9,806 | $9,741 |
| 11/15 | $9,806 | $9,660 |
| 12/15 | $9,640 | $9,486 |
| 1/16 | $9,315 | $8,914 |
| 2/16 | $9,066 | $8,853 |
| 3/16 | $9,446 | $9,509 |
| 4/16 | $9,584 | $9,649 |
| 5/16 | $9,723 | $9,661 |
| 6/16 | $9,605 | $9,603 |
| 7/16 | $10,006 | $10,016 |
| 8/16 | $10,096 | $10,050 |
| 9/16 | $10,151 | $10,112 |
| 10/16 | $9,985 | $9,940 |
| 11/16 | $10,289 | $10,016 |
| 12/16 | $10,494 | $10,232 |
| 1/17 | $10,728 | $10,512 |
| 2/17 | $10,990 | $10,807 |
| 3/17 | $11,082 | $10,939 |
| 4/17 | $11,195 | $11,109 |
| 5/17 | $11,287 | $11,355 |
| 6/17 | $11,358 | $11,406 |
| 7/17 | $11,713 | $11,725 |
| 8/17 | $11,691 | $11,770 |
| 9/17 | $11,939 | $11,997 |
| 10/17 | $12,244 | $12,246 |
| 11/17 | $12,414 | $12,484 |
| 12/17 | $12,574 | $12,685 |
| 1/18 | $13,368 | $13,400 |
| 2/18 | $12,797 | $12,838 |
| 3/18 | $12,522 | $12,563 |
| 4/18 | $12,389 | $12,683 |
| 5/18 | $12,656 | $12,699 |
| 6/18 | $12,470 | $12,630 |
| 7/18 | $12,827 | $13,011 |
| 8/18 | $12,879 | $13,113 |
| 9/18 | $12,886 | $13,170 |
| 10/18 | $11,765 | $12,183 |
| 11/18 | $12,040 | $12,361 |
| 12/18 | $10,988 | $11,491 |
| 1/19 | $11,720 | $12,398 |
| 2/19 | $12,070 | $12,729 |
| 3/19 | $12,319 | $12,890 |
| 4/19 | $12,615 | $13,325 |
| 5/19 | $11,922 | $12,534 |
| 6/19 | $12,599 | $13,355 |
| 7/19 | $12,615 | $13,394 |
| 8/19 | $12,615 | $13,077 |
| 9/19 | $12,716 | $13,352 |
| 10/19 | $12,973 | $13,717 |
| 11/19 | $13,261 | $14,052 |
| 12/19 | $13,676 | $14,547 |
| 1/20 | $13,650 | $14,386 |
| 2/20 | $12,740 | $13,224 |
| 3/20 | $11,500 | $11,439 |
| 4/20 | $12,453 | $12,664 |
| 5/20 | $13,001 | $13,215 |
| 6/20 | $13,220 | $13,637 |
| 7/20 | $13,971 | $14,358 |
| 8/20 | $14,755 | $15,237 |
| 9/20 | $14,249 | $14,746 |
| 10/20 | $13,895 | $14,388 |
| 11/20 | $15,210 | $16,161 |
| 12/20 | $15,764 | $16,911 |
| 1/21 | $15,601 | $16,834 |
| 2/21 | $16,194 | $17,224 |
| 3/21 | $16,771 | $17,684 |
| 4/21 | $17,416 | $18,458 |
| 5/21 | $17,777 | $18,745 |
| 6/21 | $17,769 | $18,992 |
| 7/21 | $17,640 | $19,123 |
| 8/21 | $17,984 | $19,601 |
| 9/21 | $17,235 | $18,792 |
| 10/21 | $18,018 | $19,751 |
| 11/21 | $17,562 | $19,275 |
| 12/21 | $18,342 | $20,046 |
| 1/22 | $17,782 | $19,062 |
| 2/22 | $17,337 | $18,569 |
| 3/22 | $17,560 | $18,972 |
| 4/22 | $16,314 | $17,453 |
| 5/22 | $16,410 | $17,474 |
| 6/22 | $15,280 | $16,001 |
| 7/22 | $16,072 | $17,118 |
| 8/22 | $15,435 | $16,488 |
| 9/22 | $13,976 | $14,909 |
| 10/22 | $14,749 | $15,809 |
| 11/22 | $16,014 | $17,035 |
| 12/22 | $15,482 | $16,365 |
| 1/23 | $16,244 | $17,538 |
| 2/23 | $15,706 | $17,035 |
| 3/23 | $16,376 | $17,561 |
| 4/23 | $16,701 | $17,813 |
| 5/23 | $16,265 | $17,622 |
| 6/23 | $16,945 | $18,645 |
| 7/23 | $17,484 | $19,328 |
| 8/23 | $16,915 | $18,788 |
| 9/23 | $16,102 | $18,011 |
| 10/23 | $15,716 | $17,469 |
| 11/23 | $16,864 | $19,082 |
| 12/23 | $17,567 | $19,998 |
| 1/24 | $17,414 | $20,116 |
| 2/24 | $18,148 | $20,979 |
| 3/24 | $18,717 | $21,637 |
| 4/24 | $18,246 | $20,924 |
| 5/24 | $19,035 | $21,773 |
| 6/24 | $19,342 | $22,258 |
| 7/24 | $19,824 | $22,617 |
| 8/24 | $20,397 | $23,192 |
Average Annual Total Returns (%)
| 1 Year | 5 Years | 10 Years |
|---|
| Class C | 18.82% | 9.75% | 7.38% |
| Class C with 1% Maximum Deferred Sales Charge | 17.82% | 9.75% | 7.38% |
| MSCI ACWI Index (net of foreign withholding taxes) | 23.44% | 12.13% | 8.77% |
Performance does not reflect the deduction of taxes that a shareholder would pay on Fund distributions or redemption of Fund shares. Performance assumes that all dividends and distributions, if any, were reinvested. For more recent performance information, visit www.eatonvance.com/performance.php.
THE FUND'S PAST PERFORMANCE IS NO GUARANTEE OF FUTURE RESULTS.
| Total Net Assets | $721,658,889 |
| # of Portfolio Holdings | 248 |
| Portfolio Turnover Rate | 35% |
| Total Advisory Fees Paid | $5,831,235 |
What did the Fund invest in?
The following tables reflect what the Fund invested in as of the report date.
Sector Allocation (% of total investments)
| Value | Value |
|---|
| Real Estate | 1.3% |
| Utilities | 1.4% |
| Short-Term Investments | 3.0% |
| Consumer Staples | 4.1% |
| Communication Services | 4.3% |
| Materials | 4.5% |
| Consumer Discretionary | 5.5% |
| Energy | 6.4% |
| Health Care | 11.4% |
| Industrials | 12.0% |
| Financials | 12.4% |
| Information Technology | 16.5% |
| Exchange-Traded Funds | 17.2% |
Top Ten Holdings (% of total investments)Footnote Referencea
| iShares MSCI Taiwan ETF | 6.6% |
| iShares MSCI India ETF | 6.5% |
| Apple, Inc. | 4.3% |
| iShares MSCI South Korea ETF | 4.1% |
| NVIDIA Corp. | 3.9% |
| Microsoft Corp. | 3.8% |
| Amazon.com, Inc. | 2.1% |
| Meta Platforms, Inc., Class A | 1.4% |
| Alphabet, Inc., Class A | 1.2% |
| Alphabet, Inc., Class C | 1.0% |
| Total | 34.9% |
| Footnote | Description |
Footnotea | Excluding cash equivalents |
If you wish to view additional information about the Fund, including the prospectus, statement of additional information, financial statements and holdings, please scan the QR code or visit www.eatonvance.com/open-end-mutual-fund-documents.php. For proxy information, please visit www.eatonvance.com/proxyvoting.
The Funds may deliver a single copy of certain required shareholder documents (including prospectuses, shareholder reports, and proxy materials) to investors with the same last name and the same address. Your participation will continue indefinitely unless you instruct otherwise by calling 1-800-262-1122 or by contacting your financial intermediary. Your instruction will typically be effective within 30 days of receipt.
Not FDIC Insured | May Lose Value | No Bank Guarantee
Annual Shareholder Report August 31, 2024
Eaton Vance Richard Bernstein Equity Strategy Fund
Annual Shareholder Report August 31, 2024
This annual shareholder report contains important information about the Eaton Vance Richard Bernstein Equity Strategy Fund for the period of September 1, 2023 to August 31, 2024. You can find additional information about the Fund at www.eatonvance.com/open-end-mutual-fund-documents.php. You can also request this information by contacting us at 1-800-262-1122.
What were the Fund costs for the last year?
(based on a hypothetical $10,000 investment)
| Class Name | Costs of a $10,000 investment | Costs paid as a percentage of a $10,000 investment |
|---|
| Class I | $103 | 0.94% |
How did the Fund perform last year and what affected its performance?
Key contributors to (↑) and detractors from (↓) performance, relative to the MSCI ACWI Index (the Index):
↓ An underweight position in the information technology sector -- mainly in the semiconductors & semiconductor equipment industry -- detracted from returns
↓ An overweight position in China -- through investments in the MSCI China ETF -- detracted from Index-relative performance, and was sold in July 2024
↓ Despite small-cap stocks having low valuations relative to large-cap stocks, an overweight position in global small-cap stocks detracted from returns
↓ An overweight position in the U.S. energy sector -- particularly in the oil, gas & consumable fuels industry -- detracted from Index-relative performance
↑ In the consumer discretionary sector, underweight positions in the hotels, restaurants & leisure industry; and the textiles, apparel & luxury goods industry contributed to Index-relative returns. Stock selections in the household durables and specialty retail industries also helped relative returns
↑ Stock selections in the financials sector -- most notably in the capital markets, banks, and financial services industries -- contributed to returns
↑ In the health care sector, stock selections in the health care equipment & supplies industry, and biotechnology industry contributed to relative returns
Comparison of the change in value of a $1,000,000 investment for the period indicated.
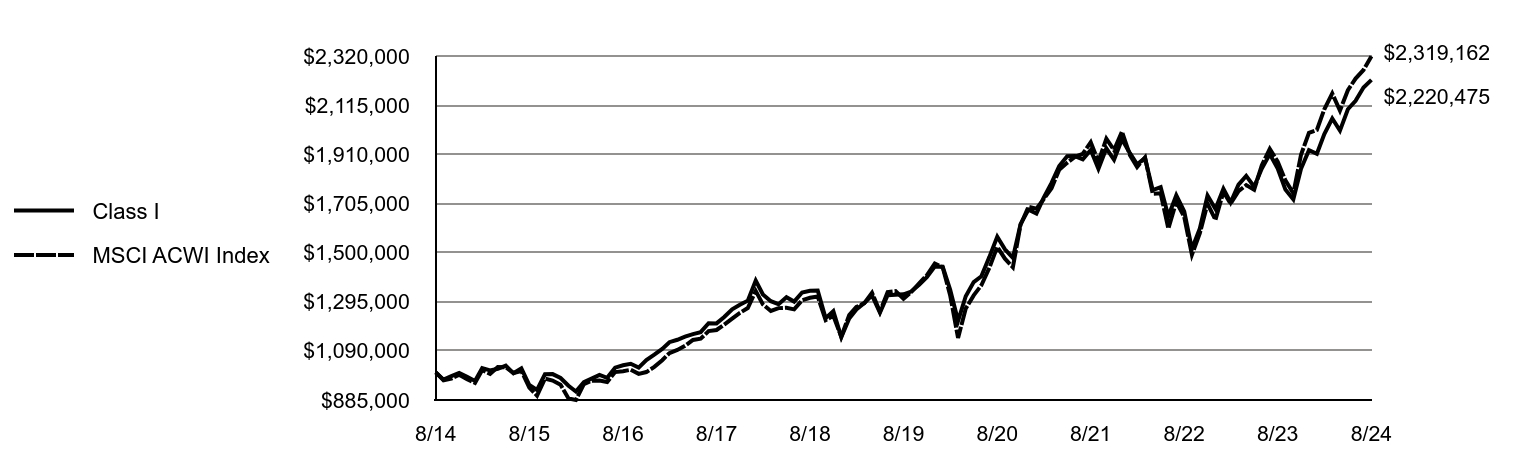
| Class I | MSCI ACWI Index |
|---|
| 8/14 | $1,000,000 | $1,000,000 |
| 9/14 | $969,856 | $967,570 |
| 10/14 | $984,595 | $974,384 |
| 11/14 | $997,987 | $990,684 |
| 12/14 | $981,431 | $971,563 |
| 1/15 | $964,481 | $956,377 |
| 2/15 | $1,018,057 | $1,009,620 |
| 3/15 | $1,008,557 | $993,973 |
| 4/15 | $1,015,332 | $1,022,816 |
| 5/15 | $1,028,215 | $1,021,481 |
| 6/15 | $996,337 | $997,432 |
| 7/15 | $1,016,691 | $1,006,095 |
| 8/15 | $947,508 | $937,126 |
| 9/15 | $927,161 | $903,176 |
| 10/15 | $992,274 | $974,058 |
| 11/15 | $992,957 | $966,016 |
| 12/15 | $976,952 | $948,596 |
| 1/16 | $944,345 | $891,386 |
| 2/16 | $920,055 | $885,250 |
| 3/16 | $959,607 | $950,856 |
| 4/16 | $974,184 | $964,891 |
| 5/16 | $989,448 | $966,110 |
| 6/16 | $977,649 | $960,258 |
| 7/16 | $1,019,970 | $1,001,642 |
| 8/16 | $1,029,681 | $1,005,010 |
| 9/16 | $1,035,919 | $1,011,169 |
| 10/16 | $1,019,957 | $994,007 |
| 11/16 | $1,051,870 | $1,001,561 |
| 12/16 | $1,074,489 | $1,023,197 |
| 1/17 | $1,098,213 | $1,051,174 |
| 2/17 | $1,126,243 | $1,080,661 |
| 3/17 | $1,136,302 | $1,093,881 |
| 4/17 | $1,149,237 | $1,110,929 |
| 5/17 | $1,160,016 | $1,135,461 |
| 6/17 | $1,167,924 | $1,140,625 |
| 7/17 | $1,205,289 | $1,172,501 |
| 8/17 | $1,204,564 | $1,176,993 |
| 9/17 | $1,231,159 | $1,199,733 |
| 10/17 | $1,263,499 | $1,224,646 |
| 11/17 | $1,282,190 | $1,248,353 |
| 12/17 | $1,299,309 | $1,268,478 |
| 1/18 | $1,382,945 | $1,340,042 |
| 2/18 | $1,325,158 | $1,283,762 |
| 3/18 | $1,297,020 | $1,256,281 |
| 4/18 | $1,284,863 | $1,268,278 |
| 5/18 | $1,313,762 | $1,269,861 |
| 6/18 | $1,295,507 | $1,262,985 |
| 7/18 | $1,333,511 | $1,301,072 |
| 8/18 | $1,340,364 | $1,311,294 |
| 9/18 | $1,341,873 | $1,317,001 |
| 10/18 | $1,226,307 | $1,218,306 |
| 11/18 | $1,255,952 | $1,236,124 |
| 12/18 | $1,147,184 | $1,149,059 |
| 1/19 | $1,224,999 | $1,239,788 |
| 2/19 | $1,262,706 | $1,272,949 |
| 3/19 | $1,289,171 | $1,288,957 |
| 4/19 | $1,321,265 | $1,332,480 |
| 5/19 | $1,249,858 | $1,253,438 |
| 6/19 | $1,322,061 | $1,335,513 |
| 7/19 | $1,324,476 | $1,339,426 |
| 8/19 | $1,326,073 | $1,307,652 |
| 9/19 | $1,337,302 | $1,335,167 |
| 10/19 | $1,365,380 | $1,371,709 |
| 11/19 | $1,397,459 | $1,405,194 |
| 12/19 | $1,441,605 | $1,454,678 |
| 1/20 | $1,440,721 | $1,438,610 |
| 2/20 | $1,345,953 | $1,322,414 |
| 3/20 | $1,215,217 | $1,143,884 |
| 4/20 | $1,317,871 | $1,266,422 |
| 5/20 | $1,376,660 | $1,321,500 |
| 6/20 | $1,401,231 | $1,363,725 |
| 7/20 | $1,481,066 | $1,435,849 |
| 8/20 | $1,566,182 | $1,523,730 |
| 9/20 | $1,513,526 | $1,474,600 |
| 10/20 | $1,477,552 | $1,438,755 |
| 11/20 | $1,618,803 | $1,616,100 |
| 12/20 | $1,679,120 | $1,691,134 |
| 1/21 | $1,662,903 | $1,683,443 |
| 2/21 | $1,727,756 | $1,722,437 |
| 3/21 | $1,790,825 | $1,768,443 |
| 4/21 | $1,861,096 | $1,845,763 |
| 5/21 | $1,901,644 | $1,874,488 |
| 6/21 | $1,902,548 | $1,899,192 |
| 7/21 | $1,889,017 | $1,912,276 |
| 8/21 | $1,927,752 | $1,960,139 |
| 9/21 | $1,849,381 | $1,879,166 |
| 10/21 | $1,934,958 | $1,975,085 |
| 11/21 | $1,887,215 | $1,927,524 |
| 12/21 | $1,972,806 | $2,004,626 |
| 1/22 | $1,914,662 | $1,906,174 |
| 2/22 | $1,867,739 | $1,856,943 |
| 3/22 | $1,894,261 | $1,897,162 |
| 4/22 | $1,760,632 | $1,745,310 |
| 5/22 | $1,772,873 | $1,747,352 |
| 6/22 | $1,651,485 | $1,600,057 |
| 7/22 | $1,739,211 | $1,711,793 |
| 8/22 | $1,671,887 | $1,648,773 |
| 9/22 | $1,514,797 | $1,490,938 |
| 10/22 | $1,600,482 | $1,580,911 |
| 11/22 | $1,738,191 | $1,703,532 |
| 12/22 | $1,681,753 | $1,636,496 |
| 1/23 | $1,766,057 | $1,753,795 |
| 2/23 | $1,708,773 | $1,703,532 |
| 3/23 | $1,783,350 | $1,756,056 |
| 4/23 | $1,820,098 | $1,781,295 |
| 5/23 | $1,774,703 | $1,762,216 |
| 6/23 | $1,850,361 | $1,864,532 |
| 7/23 | $1,910,886 | $1,932,789 |
| 8/23 | $1,850,361 | $1,878,779 |
| 9/23 | $1,762,814 | $1,801,090 |
| 10/23 | $1,721,743 | $1,746,937 |
| 11/23 | $1,849,280 | $1,908,172 |
| 12/23 | $1,927,481 | $1,999,829 |
| 1/24 | $1,912,193 | $2,011,553 |
| 2/24 | $1,994,514 | $2,097,875 |
| 3/24 | $2,059,194 | $2,163,742 |
| 4/24 | $2,008,626 | $2,092,353 |
| 5/24 | $2,098,003 | $2,177,331 |
| 6/24 | $2,133,283 | $2,225,825 |
| 7/24 | $2,188,556 | $2,261,722 |
| 8/24 | $2,220,475 | $2,319,162 |
Average Annual Total Returns (%)
| 1 Year | 5 Years | 10 Years |
|---|
| Class I | 19.99% | 10.85% | 8.30% |
| MSCI ACWI Index (net of foreign withholding taxes) | 23.44% | 12.13% | 8.77% |
Performance does not reflect the deduction of taxes that a shareholder would pay on Fund distributions or redemption of Fund shares. Performance assumes that all dividends and distributions, if any, were reinvested. For more recent performance information, visit www.eatonvance.com/performance.php.
THE FUND'S PAST PERFORMANCE IS NO GUARANTEE OF FUTURE RESULTS.
| Total Net Assets | $721,658,889 |
| # of Portfolio Holdings | 248 |
| Portfolio Turnover Rate | 35% |
| Total Advisory Fees Paid | $5,831,235 |
What did the Fund invest in?
The following tables reflect what the Fund invested in as of the report date.
Sector Allocation (% of total investments)
| Value | Value |
|---|
| Real Estate | 1.3% |
| Utilities | 1.4% |
| Short-Term Investments | 3.0% |
| Consumer Staples | 4.1% |
| Communication Services | 4.3% |
| Materials | 4.5% |
| Consumer Discretionary | 5.5% |
| Energy | 6.4% |
| Health Care | 11.4% |
| Industrials | 12.0% |
| Financials | 12.4% |
| Information Technology | 16.5% |
| Exchange-Traded Funds | 17.2% |
Top Ten Holdings (% of total investments)Footnote Referencea
| iShares MSCI Taiwan ETF | 6.6% |
| iShares MSCI India ETF | 6.5% |
| Apple, Inc. | 4.3% |
| iShares MSCI South Korea ETF | 4.1% |
| NVIDIA Corp. | 3.9% |
| Microsoft Corp. | 3.8% |
| Amazon.com, Inc. | 2.1% |
| Meta Platforms, Inc., Class A | 1.4% |
| Alphabet, Inc., Class A | 1.2% |
| Alphabet, Inc., Class C | 1.0% |
| Total | 34.9% |
| Footnote | Description |
Footnotea | Excluding cash equivalents |
If you wish to view additional information about the Fund, including the prospectus, statement of additional information, financial statements and holdings, please scan the QR code or visit www.eatonvance.com/open-end-mutual-fund-documents.php. For proxy information, please visit www.eatonvance.com/proxyvoting.
The Funds may deliver a single copy of certain required shareholder documents (including prospectuses, shareholder reports, and proxy materials) to investors with the same last name and the same address. Your participation will continue indefinitely unless you instruct otherwise by calling 1-800-262-1122 or by contacting your financial intermediary. Your instruction will typically be effective within 30 days of receipt.
Not FDIC Insured | May Lose Value | No Bank Guarantee
Annual Shareholder Report August 31, 2024
Eaton Vance Worldwide Health Sciences Fund
Annual Shareholder Report August 31, 2024
This annual shareholder report contains important information about the Eaton Vance Worldwide Health Sciences Fund for the period of September 1, 2023 to August 31, 2024. You can find additional information about the Fund at www.eatonvance.com/open-end-mutual-fund-documents.php. You can also request this information by contacting us at 1-800-262-1122.
What were the Fund costs for the last year?
(based on a hypothetical $10,000 investment)
| Class Name | Costs of a $10,000 investment | Costs paid as a percentage of a $10,000 investment |
|---|
| Class A | $129 | 1.16% |
How did the Fund perform last year and what affected its performance?
Key contributors to (↑) and detractors from (↓) performance, relative to the MSCI World Health Care Index (the Index):
↑ An overweight position in drugmaker Eli Lilly rose in value on strong sales of Mounjaro and Zepbound -- so-called “GLP-1” drugs for diabetes and obesity
↑ An overweight position in robotic surgical systems firm Intuitive Surgical rose in value as it launched a new robot platform and U.S. surgeries increased
↑ An overweight position in medical device firm Boston Scientific rose in value on strong sales, particularly in its heart rhythm treatments business
↑ On an industry basis, stock selections in health care equipment & supplies, pharmaceuticals, and biotechnology helped Index-relative performance
↓ An overweight position in health insurer Humana declined in value amid increased use of services by subscribers and aggressive competitor pricing
↓ An overweight position in Zoetis, a drugmaker for animal use, declined in value amid weak earnings linked to the costly launch of a new pain medicine
↓ An out-of-Index holding in Neogen, a food safety test kit maker, detracted from returns as shipping backlogs hindered sales and lowered its stock price
↓ On an industry basis, stock selections in health care providers & services, and an overweight position in life sciences tools & services hurt returns
Comparison of the change in value of a $10,000 investment for the period indicated.

| Class A with Maximum Sales Charge | MSCI World Index | S&P 500® Index | MSCI World Health Care Index |
|---|
| 8/14 | $9,475 | $10,000 | $10,000 | $10,000 |
| 9/14 | $9,447 | $9,729 | $9,860 | $10,043 |
| 10/14 | $10,055 | $9,792 | $10,101 | $10,289 |
| 11/14 | $10,246 | $9,988 | $10,372 | $10,616 |
| 12/14 | $10,132 | $9,827 | $10,346 | $10,347 |
| 1/15 | $10,347 | $9,649 | $10,036 | $10,582 |
| 2/15 | $10,761 | $10,214 | $10,612 | $11,062 |
| 3/15 | $11,042 | $10,054 | $10,444 | $11,205 |
| 4/15 | $10,810 | $10,290 | $10,545 | $11,193 |
| 5/15 | $11,381 | $10,325 | $10,680 | $11,510 |
| 6/15 | $11,348 | $10,085 | $10,474 | $11,375 |
| 7/15 | $11,753 | $10,266 | $10,693 | $11,858 |
| 8/15 | $10,926 | $9,587 | $10,048 | $10,988 |
| 9/15 | $9,975 | $9,233 | $9,799 | $10,310 |
| 10/15 | $10,520 | $9,965 | $10,626 | $10,937 |
| 11/15 | $10,752 | $9,915 | $10,657 | $10,864 |
| 12/15 | $10,981 | $9,741 | $10,489 | $11,029 |
| 1/16 | $9,763 | $9,158 | $9,969 | $10,161 |
| 2/16 | $9,509 | $9,090 | $9,955 | $10,034 |
| 3/16 | $9,745 | $9,707 | $10,631 | $10,277 |
| 4/16 | $10,081 | $9,861 | $10,672 | $10,617 |
| 5/16 | $10,354 | $9,916 | $10,864 | $10,766 |
| 6/16 | $10,109 | $9,805 | $10,892 | $10,852 |
| 7/16 | $10,654 | $10,219 | $11,293 | $11,345 |
| 8/16 | $10,127 | $10,228 | $11,309 | $10,874 |
| 9/16 | $10,127 | $10,282 | $11,311 | $10,860 |
| 10/16 | $9,218 | $10,083 | $11,105 | $10,110 |
| 11/16 | $9,200 | $10,228 | $11,516 | $10,119 |
| 12/16 | $9,346 | $10,473 | $11,744 | $10,278 |
| 1/17 | $9,592 | $10,725 | $11,967 | $10,503 |
| 2/17 | $10,146 | $11,023 | $12,442 | $11,110 |
| 3/17 | $10,208 | $11,140 | $12,456 | $11,146 |
| 4/17 | $10,454 | $11,305 | $12,584 | $11,356 |
| 5/17 | $10,393 | $11,545 | $12,761 | $11,604 |
| 6/17 | $10,762 | $11,589 | $12,841 | $11,919 |
| 7/17 | $10,834 | $11,866 | $13,105 | $11,927 |
| 8/17 | $10,988 | $11,883 | $13,145 | $12,045 |
| 9/17 | $11,039 | $12,150 | $13,416 | $12,207 |
| 10/17 | $10,670 | $12,379 | $13,729 | $12,049 |
| 11/17 | $10,937 | $12,648 | $14,150 | $12,321 |
| 12/17 | $10,864 | $12,819 | $14,308 | $12,313 |
| 1/18 | $11,455 | $13,495 | $15,127 | $13,003 |
| 2/18 | $10,906 | $12,936 | $14,569 | $12,420 |
| 3/18 | $10,737 | $12,654 | $14,199 | $12,162 |
| 4/18 | $10,875 | $12,800 | $14,254 | $12,278 |
| 5/18 | $11,043 | $12,880 | $14,597 | $12,336 |
| 6/18 | $11,254 | $12,874 | $14,687 | $12,500 |
| 7/18 | $11,972 | $13,276 | $15,233 | $13,268 |
| 8/18 | $12,341 | $13,440 | $15,730 | $13,660 |
| 9/18 | $12,573 | $13,515 | $15,819 | $13,937 |
| 10/18 | $11,782 | $12,523 | $14,738 | $13,021 |
| 11/18 | $12,489 | $12,665 | $15,038 | $13,730 |
| 12/18 | $11,514 | $11,702 | $13,680 | $12,623 |
| 1/19 | $12,279 | $12,612 | $14,777 | $13,273 |
| 2/19 | $12,556 | $12,992 | $15,251 | $13,534 |
| 3/19 | $12,800 | $13,162 | $15,547 | $13,650 |
| 4/19 | $12,412 | $13,629 | $16,177 | $13,298 |
| 5/19 | $12,168 | $12,843 | $15,149 | $12,979 |
| 6/19 | $13,044 | $13,689 | $16,217 | $13,855 |
| 7/19 | $12,878 | $13,757 | $16,450 | $13,701 |
| 8/19 | $12,878 | $13,475 | $16,189 | $13,697 |
| 9/19 | $12,789 | $13,762 | $16,492 | $13,682 |
| 10/19 | $13,344 | $14,112 | $16,849 | $14,365 |
| 11/19 | $13,954 | $14,505 | $17,461 | $15,044 |
| 12/19 | $14,507 | $14,940 | $17,988 | $15,557 |
| 1/20 | $14,272 | $14,849 | $17,981 | $15,336 |
| 2/20 | $13,347 | $13,594 | $16,501 | $14,287 |
| 3/20 | $12,901 | $11,795 | $14,463 | $13,771 |
| 4/20 | $14,343 | $13,083 | $16,317 | $15,370 |
| 5/20 | $14,882 | $13,715 | $17,094 | $15,990 |
| 6/20 | $14,729 | $14,078 | $17,434 | $15,776 |
| 7/20 | $15,268 | $14,752 | $18,417 | $16,423 |
| 8/20 | $15,678 | $15,737 | $19,740 | $16,761 |
| 9/20 | $15,432 | $15,194 | $18,990 | $16,530 |
| 10/20 | $14,729 | $14,728 | $18,485 | $15,724 |
| 11/20 | $15,807 | $16,611 | $20,509 | $17,131 |
| 12/20 | $16,397 | $17,316 | $21,297 | $17,660 |
| 1/21 | $16,334 | $17,144 | $21,082 | $17,848 |
| 2/21 | $16,107 | $17,583 | $21,664 | $17,362 |
| 3/21 | $16,460 | $18,168 | $22,612 | $17,788 |
| 4/21 | $17,140 | $19,013 | $23,819 | $18,467 |
| 5/21 | $17,492 | $19,287 | $23,986 | $18,846 |
| 6/21 | $17,971 | $19,575 | $24,546 | $19,411 |
| 7/21 | $18,588 | $19,925 | $25,129 | $20,133 |
| 8/21 | $19,218 | $20,421 | $25,893 | $20,692 |
| 9/21 | $18,097 | $19,573 | $24,688 | $19,607 |
| 10/21 | $19,306 | $20,682 | $26,418 | $20,435 |
| 11/21 | $18,462 | $20,229 | $26,235 | $19,706 |
| 12/21 | $20,013 | $21,093 | $27,411 | $21,157 |
| 1/22 | $18,234 | $19,977 | $25,992 | $19,594 |
| 2/22 | $18,302 | $19,472 | $25,214 | $19,506 |
| 3/22 | $19,301 | $20,007 | $26,150 | $20,446 |
| 4/22 | $18,302 | $18,344 | $23,870 | $19,499 |
| 5/22 | $18,179 | $18,358 | $23,914 | $19,595 |
| 6/22 | $17,864 | $16,768 | $21,940 | $18,973 |
| 7/22 | $18,466 | $18,099 | $23,963 | $19,593 |
| 8/22 | $17,043 | $17,343 | $22,986 | $18,412 |
| 9/22 | $16,290 | $15,731 | $20,869 | $17,687 |
| 10/22 | $17,494 | $16,860 | $22,558 | $19,174 |
| 11/22 | $18,425 | $18,033 | $23,819 | $20,251 |
| 12/22 | $18,126 | $17,267 | $22,446 | $20,012 |
| 1/23 | $18,026 | $18,488 | $23,857 | $19,882 |
| 2/23 | $17,355 | $18,044 | $23,275 | $19,071 |
| 3/23 | $18,055 | $18,602 | $24,129 | $19,691 |
| 4/23 | $18,697 | $18,928 | $24,506 | $20,380 |
| 5/23 | $18,126 | $18,739 | $24,612 | $19,545 |
| 6/23 | $18,669 | $19,872 | $26,239 | $20,168 |
| 7/23 | $18,897 | $20,540 | $27,082 | $20,429 |
| 8/23 | $18,783 | $20,049 | $26,650 | $20,271 |
| 9/23 | $18,069 | $19,184 | $25,380 | $19,612 |
| 10/23 | $17,283 | $18,627 | $24,846 | $18,805 |
| 11/23 | $18,355 | $20,374 | $27,115 | $19,884 |
| 12/23 | $19,153 | $21,374 | $28,347 | $20,763 |
| 1/24 | $19,651 | $21,631 | $28,824 | $21,321 |
| 2/24 | $20,296 | $22,548 | $30,363 | $21,801 |
| 3/24 | $20,677 | $23,272 | $31,339 | $22,315 |
| 4/24 | $19,841 | $22,408 | $30,059 | $21,433 |
| 5/24 | $20,545 | $23,408 | $31,550 | $22,005 |
| 6/24 | $21,087 | $23,885 | $32,682 | $22,422 |
| 7/24 | $21,761 | $24,306 | $33,080 | $23,155 |
| 8/24 | $22,952 | $24,948 | $33,882 | $24,427 |
Average Annual Total Returns (%)
| 1 Year | 5 Years | 10 Years |
|---|
| Class A | 22.17% | 12.23% | 9.24% |
| Class A with 5.25% Maximum Sales Charge | 15.75% | 11.04% | 8.66% |
MSCI World Index (net of foreign withholding taxes)Footnote Reference1 | 24.43% | 13.09% | 9.56% |
| MSCI World Health Care Index (net of foreign withholding taxes) | 20.50% | 12.25% | 9.33% |
S&P 500® Index | 27.14% | 15.90% | 12.97% |
| Footnote | Description |
Footnote1 | In accordance with regulatory changes requiring the Fund's primary benchmark to represent the overall applicable market, the Fund's primary prospectus benchmark changed to the indicated benchmark effective May 1, 2024. |
Performance does not reflect the deduction of taxes that a shareholder would pay on Fund distributions or redemption of Fund shares. Performance assumes that all dividends and distributions, if any, were reinvested. For more recent performance information, visit www.eatonvance.com/performance.php.
THE FUND'S PAST PERFORMANCE IS NO GUARANTEE OF FUTURE RESULTS.
| Total Net Assets | $1,115,758,999 |
| # of Portfolio Holdings | 46 |
| Portfolio Turnover Rate | 15% |
| Total Advisory Fees Paid | $6,175,444 |
What did the Fund invest in?
The following tables reflect what the Fund invested in as of the report date.
Sector Allocation (% of total investments)
| Value | Value |
|---|
| Short-Term Investments | 0.3% |
| Health Care Services | 0.5% |
| Metal, Glass & Plastic Containers | 0.6% |
| Health Care Technology | 0.8% |
| Exchange Traded Funds | 2.2% |
| Health Care Distributors | 2.5% |
| Health Care Supplies | 5.3% |
| Managed Health Care | 10.5% |
| Life Sciences Tools & Services | 11.3% |
| Health Care Equipment | 11.5% |
| Biotechnology | 12.2% |
| Pharmaceuticals | 42.3% |
Top Ten Holdings (% of total investments)Footnote Referencea
| Eli Lilly & Co. | 10.8% |
| UnitedHealth Group, Inc. | 7.6% |
| Novo Nordisk AS, Class B | 7.0% |
| AbbVie, Inc. | 5.2% |
| AstraZeneca PLC | 5.0% |
| Thermo Fisher Scientific, Inc. | 4.5% |
| Danaher Corp. | 3.8% |
| Roche Holding AG PC | 3.8% |
| Intuitive Surgical, Inc. | 3.7% |
| Johnson & Johnson | 3.4% |
| Total | 54.8% |
| Footnote | Description |
Footnotea | Excluding cash equivalents |
If you wish to view additional information about the Fund, including the prospectus, statement of additional information, financial statements and holdings, please scan the QR code or visit www.eatonvance.com/open-end-mutual-fund-documents.php. For proxy information, please visit www.eatonvance.com/proxyvoting.
The Funds may deliver a single copy of certain required shareholder documents (including prospectuses, shareholder reports, and proxy materials) to investors with the same last name and the same address. Your participation will continue indefinitely unless you instruct otherwise by calling 1-800-262-1122 or by contacting your financial intermediary. Your instruction will typically be effective within 30 days of receipt.
Not FDIC Insured | May Lose Value | No Bank Guarantee
Annual Shareholder Report August 31, 2024
Eaton Vance Worldwide Health Sciences Fund
Annual Shareholder Report August 31, 2024
This annual shareholder report contains important information about the Eaton Vance Worldwide Health Sciences Fund for the period of September 1, 2023 to August 31, 2024. You can find additional information about the Fund at www.eatonvance.com/open-end-mutual-fund-documents.php. You can also request this information by contacting us at 1-800-262-1122.
What were the Fund costs for the last year?
(based on a hypothetical $10,000 investment)
| Class Name | Costs of a $10,000 investment | Costs paid as a percentage of a $10,000 investment |
|---|
| Class C | $211 | 1.91% |
How did the Fund perform last year and what affected its performance?
Key contributors to (↑) and detractors from (↓) performance, relative to the MSCI World Health Care Index (the Index):
↑ An overweight position in drugmaker Eli Lilly rose in value on strong sales of Mounjaro and Zepbound -- so-called “GLP-1” drugs for diabetes and obesity
↑ An overweight position in robotic surgical systems firm Intuitive Surgical rose in value as it launched a new robot platform and U.S. surgeries increased
↑ An overweight position in medical device firm Boston Scientific rose in value on strong sales, particularly in its heart rhythm treatments business
↑ On an industry basis, stock selections in health care equipment & supplies, pharmaceuticals, and biotechnology helped Index-relative performance
↓ An overweight position in health insurer Humana declined in value amid increased use of services by subscribers and aggressive competitor pricing
↓ An overweight position in Zoetis, a drugmaker for animal use, declined in value amid weak earnings linked to the costly launch of a new pain medicine
↓ An out-of-Index holding in Neogen, a food safety test kit maker, detracted from returns as shipping backlogs hindered sales and lowered its stock price
↓ On an industry basis, stock selections in health care providers & services, and an overweight position in life sciences tools & services hurt returns
Comparison of the change in value of a $10,000 investment for the period indicated.

| Class C | MSCI World Index | S&P 500® Index | MSCI World Health Care Index |
|---|
| 8/14 | $10,000 | $10,000 | $10,000 | $10,000 |
| 9/14 | $9,964 | $9,729 | $9,860 | $10,043 |
| 10/14 | $10,603 | $9,792 | $10,101 | $10,289 |
| 11/14 | $10,792 | $9,988 | $10,372 | $10,616 |
| 12/14 | $10,667 | $9,827 | $10,346 | $10,347 |
| 1/15 | $10,887 | $9,649 | $10,036 | $10,582 |
| 2/15 | $11,319 | $10,214 | $10,612 | $11,062 |
| 3/15 | $11,598 | $10,054 | $10,444 | $11,205 |
| 4/15 | $11,352 | $10,290 | $10,545 | $11,193 |
| 5/15 | $11,945 | $10,325 | $10,680 | $11,510 |
| 6/15 | $11,902 | $10,085 | $10,474 | $11,375 |
| 7/15 | $12,317 | $10,266 | $10,693 | $11,858 |
| 8/15 | $11,445 | $9,587 | $10,048 | $10,988 |
| 9/15 | $10,447 | $9,233 | $9,799 | $10,310 |
| 10/15 | $11,006 | $9,965 | $10,626 | $10,937 |
| 11/15 | $11,243 | $9,915 | $10,657 | $10,864 |
| 12/15 | $11,477 | $9,741 | $10,489 | $11,029 |
| 1/16 | $10,196 | $9,158 | $9,969 | $10,161 |
| 2/16 | $9,927 | $9,090 | $9,955 | $10,034 |
| 3/16 | $10,159 | $9,707 | $10,631 | $10,277 |
| 4/16 | $10,512 | $9,861 | $10,672 | $10,617 |
| 5/16 | $10,781 | $9,916 | $10,864 | $10,766 |
| 6/16 | $10,530 | $9,805 | $10,892 | $10,852 |
| 7/16 | $11,078 | $10,219 | $11,293 | $11,345 |
| 8/16 | $10,530 | $10,228 | $11,309 | $10,874 |
| 9/16 | $10,521 | $10,282 | $11,311 | $10,860 |
| 10/16 | $9,575 | $10,083 | $11,105 | $10,110 |
| 11/16 | $9,556 | $10,228 | $11,516 | $10,119 |
| 12/16 | $9,687 | $10,473 | $11,744 | $10,278 |
| 1/17 | $9,948 | $10,725 | $11,967 | $10,503 |
| 2/17 | $10,502 | $11,023 | $12,442 | $11,110 |
| 3/17 | $10,565 | $11,140 | $12,456 | $11,146 |
| 4/17 | $10,816 | $11,305 | $12,584 | $11,356 |
| 5/17 | $10,753 | $11,545 | $12,761 | $11,604 |
| 6/17 | $11,119 | $11,589 | $12,841 | $11,919 |
| 7/17 | $11,192 | $11,866 | $13,105 | $11,927 |
| 8/17 | $11,338 | $11,883 | $13,145 | $12,045 |
| 9/17 | $11,390 | $12,150 | $13,416 | $12,207 |
| 10/17 | $11,004 | $12,379 | $13,729 | $12,049 |
| 11/17 | $11,265 | $12,648 | $14,150 | $12,321 |
| 12/17 | $11,181 | $12,819 | $14,308 | $12,313 |
| 1/18 | $11,782 | $13,495 | $15,127 | $13,003 |
| 2/18 | $11,213 | $12,936 | $14,569 | $12,420 |
| 3/18 | $11,041 | $12,654 | $14,199 | $12,162 |
| 4/18 | $11,159 | $12,800 | $14,254 | $12,278 |
| 5/18 | $11,342 | $12,880 | $14,597 | $12,336 |
| 6/18 | $11,546 | $12,874 | $14,687 | $12,500 |
| 7/18 | $12,265 | $13,276 | $15,233 | $13,268 |
| 8/18 | $12,641 | $13,440 | $15,730 | $13,660 |
| 9/18 | $12,867 | $13,515 | $15,819 | $13,937 |
| 10/18 | $12,050 | $12,523 | $14,738 | $13,021 |
| 11/18 | $12,770 | $12,665 | $15,038 | $13,730 |
| 12/18 | $11,767 | $11,702 | $13,680 | $12,623 |
| 1/19 | $12,540 | $12,612 | $14,777 | $13,273 |
| 2/19 | $12,809 | $12,992 | $15,251 | $13,534 |
| 3/19 | $13,055 | $13,162 | $15,547 | $13,650 |
| 4/19 | $12,652 | $13,629 | $16,177 | $13,298 |
| 5/19 | $12,395 | $12,843 | $15,149 | $12,979 |
| 6/19 | $13,279 | $13,689 | $16,217 | $13,855 |
| 7/19 | $13,100 | $13,757 | $16,450 | $13,701 |
| 8/19 | $13,089 | $13,475 | $16,189 | $13,697 |
| 9/19 | $12,977 | $13,762 | $16,492 | $13,682 |
| 10/19 | $13,536 | $14,112 | $16,849 | $14,365 |
| 11/19 | $14,141 | $14,505 | $17,461 | $15,044 |
| 12/19 | $14,698 | $14,940 | $17,988 | $15,557 |
| 1/20 | $14,453 | $14,849 | $17,981 | $15,336 |
| 2/20 | $13,505 | $13,594 | $16,501 | $14,287 |
| 3/20 | $13,037 | $11,795 | $14,463 | $13,771 |
| 4/20 | $14,499 | $13,083 | $16,317 | $15,370 |
| 5/20 | $15,038 | $13,715 | $17,094 | $15,990 |
| 6/20 | $14,862 | $14,078 | $17,434 | $15,776 |
| 7/20 | $15,400 | $14,752 | $18,417 | $16,423 |
| 8/20 | $15,798 | $15,737 | $19,740 | $16,761 |
| 9/20 | $15,541 | $15,194 | $18,990 | $16,530 |
| 10/20 | $14,827 | $14,728 | $18,485 | $15,724 |
| 11/20 | $15,904 | $16,611 | $20,509 | $17,131 |
| 12/20 | $16,485 | $17,316 | $21,297 | $17,660 |
| 1/21 | $16,410 | $17,144 | $21,082 | $17,848 |
| 2/21 | $16,174 | $17,583 | $21,664 | $17,362 |
| 3/21 | $16,522 | $18,168 | $22,612 | $17,788 |
| 4/21 | $17,195 | $19,013 | $23,819 | $18,467 |
| 5/21 | $17,543 | $19,287 | $23,986 | $18,846 |
| 6/21 | $18,004 | $19,575 | $24,546 | $19,411 |
| 7/21 | $18,614 | $19,925 | $25,129 | $20,133 |
| 8/21 | $19,224 | $20,421 | $25,893 | $20,692 |
| 9/21 | $18,091 | $19,573 | $24,688 | $19,607 |
| 10/21 | $19,286 | $20,682 | $26,418 | $20,435 |
| 11/21 | $18,440 | $20,229 | $26,235 | $19,706 |
| 12/21 | $19,978 | $21,093 | $27,411 | $21,157 |
| 1/22 | $18,181 | $19,977 | $25,992 | $19,594 |
| 2/22 | $18,248 | $19,472 | $25,214 | $19,506 |
| 3/22 | $19,227 | $20,007 | $26,150 | $20,446 |
| 4/22 | $18,221 | $18,344 | $23,870 | $19,499 |
| 5/22 | $18,087 | $18,358 | $23,914 | $19,595 |
| 6/22 | $17,765 | $16,768 | $21,940 | $18,973 |
| 7/22 | $18,342 | $18,099 | $23,963 | $19,593 |
| 8/22 | $16,934 | $17,343 | $22,986 | $18,412 |
| 9/22 | $16,170 | $15,731 | $20,869 | $17,687 |
| 10/22 | $17,350 | $16,860 | $22,558 | $19,174 |
| 11/22 | $18,261 | $18,033 | $23,819 | $20,251 |
| 12/22 | $17,945 | $17,267 | $22,446 | $20,012 |
| 1/23 | $17,847 | $18,488 | $23,857 | $19,882 |
| 2/23 | $17,178 | $18,044 | $23,275 | $19,071 |
| 3/23 | $17,847 | $18,602 | $24,129 | $19,691 |
| 4/23 | $18,475 | $18,928 | $24,506 | $20,380 |
| 5/23 | $17,903 | $18,739 | $24,612 | $19,545 |
| 6/23 | $18,420 | $19,872 | $26,239 | $20,168 |
| 7/23 | $18,643 | $20,540 | $27,082 | $20,429 |
| 8/23 | $18,517 | $20,049 | $26,650 | $20,271 |
| 9/23 | $17,792 | $19,184 | $25,380 | $19,612 |
| 10/23 | $17,024 | $18,627 | $24,846 | $18,805 |
| 11/23 | $18,057 | $20,374 | $27,115 | $19,884 |
| 12/23 | $18,826 | $21,374 | $28,347 | $20,763 |
| 1/24 | $19,297 | $21,631 | $28,824 | $21,321 |
| 2/24 | $19,926 | $22,548 | $30,363 | $21,801 |
| 3/24 | $20,298 | $23,272 | $31,339 | $22,315 |
| 4/24 | $19,455 | $22,408 | $30,059 | $21,433 |
| 5/24 | $20,141 | $23,408 | $31,550 | $22,005 |
| 6/24 | $20,655 | $23,885 | $32,682 | $22,422 |
| 7/24 | $21,313 | $24,306 | $33,080 | $23,155 |
| 8/24 | $22,802 | $24,948 | $33,882 | $24,427 |
Average Annual Total Returns (%)
| 1 Year | 5 Years | 10 Years |
|---|
| Class C | 21.20% | 11.37% | 8.58% |
| Class C with 1% Maximum Deferred Sales Charge | 20.20% | 11.37% | 8.58% |
MSCI World Index (net of foreign withholding taxes)Footnote Reference1 | 24.43% | 13.09% | 9.56% |
| MSCI World Health Care Index (net of foreign withholding taxes) | 20.50% | 12.25% | 9.33% |
S&P 500® Index | 27.14% | 15.90% | 12.97% |
| Footnote | Description |
Footnote1 | In accordance with regulatory changes requiring the Fund's primary benchmark to represent the overall applicable market, the Fund's primary prospectus benchmark changed to the indicated benchmark effective May 1, 2024. |
Performance does not reflect the deduction of taxes that a shareholder would pay on Fund distributions or redemption of Fund shares. Performance assumes that all dividends and distributions, if any, were reinvested. For more recent performance information, visit www.eatonvance.com/performance.php.
THE FUND'S PAST PERFORMANCE IS NO GUARANTEE OF FUTURE RESULTS.
| Total Net Assets | $1,115,758,999 |
| # of Portfolio Holdings | 46 |
| Portfolio Turnover Rate | 15% |
| Total Advisory Fees Paid | $6,175,444 |
What did the Fund invest in?
The following tables reflect what the Fund invested in as of the report date.
Sector Allocation (% of total investments)
| Value | Value |
|---|
| Short-Term Investments | 0.3% |
| Health Care Services | 0.5% |
| Metal, Glass & Plastic Containers | 0.6% |
| Health Care Technology | 0.8% |
| Exchange Traded Funds | 2.2% |
| Health Care Distributors | 2.5% |
| Health Care Supplies | 5.3% |
| Managed Health Care | 10.5% |
| Life Sciences Tools & Services | 11.3% |
| Health Care Equipment | 11.5% |
| Biotechnology | 12.2% |
| Pharmaceuticals | 42.3% |
Top Ten Holdings (% of total investments)Footnote Referencea
| Eli Lilly & Co. | 10.8% |
| UnitedHealth Group, Inc. | 7.6% |
| Novo Nordisk AS, Class B | 7.0% |
| AbbVie, Inc. | 5.2% |
| AstraZeneca PLC | 5.0% |
| Thermo Fisher Scientific, Inc. | 4.5% |
| Danaher Corp. | 3.8% |
| Roche Holding AG PC | 3.8% |
| Intuitive Surgical, Inc. | 3.7% |
| Johnson & Johnson | 3.4% |
| Total | 54.8% |
| Footnote | Description |
Footnotea | Excluding cash equivalents |
If you wish to view additional information about the Fund, including the prospectus, statement of additional information, financial statements and holdings, please scan the QR code or visit www.eatonvance.com/open-end-mutual-fund-documents.php. For proxy information, please visit www.eatonvance.com/proxyvoting.
The Funds may deliver a single copy of certain required shareholder documents (including prospectuses, shareholder reports, and proxy materials) to investors with the same last name and the same address. Your participation will continue indefinitely unless you instruct otherwise by calling 1-800-262-1122 or by contacting your financial intermediary. Your instruction will typically be effective within 30 days of receipt.
Not FDIC Insured | May Lose Value | No Bank Guarantee
Annual Shareholder Report August 31, 2024
Eaton Vance Worldwide Health Sciences Fund
Annual Shareholder Report August 31, 2024
This annual shareholder report contains important information about the Eaton Vance Worldwide Health Sciences Fund for the period of September 1, 2023 to August 31, 2024. You can find additional information about the Fund at www.eatonvance.com/open-end-mutual-fund-documents.php. You can also request this information by contacting us at 1-800-262-1122.
What were the Fund costs for the last year?
(based on a hypothetical $10,000 investment)
| Class Name | Costs of a $10,000 investment | Costs paid as a percentage of a $10,000 investment |
|---|
| Class I | $101 | 0.91% |
How did the Fund perform last year and what affected its performance?
Key contributors to (↑) and detractors from (↓) performance, relative to the MSCI World Health Care Index (the Index):
↑ An overweight position in drugmaker Eli Lilly rose in value on strong sales of Mounjaro and Zepbound -- so-called “GLP-1” drugs for diabetes and obesity
↑ An overweight position in robotic surgical systems firm Intuitive Surgical rose in value as it launched a new robot platform and U.S. surgeries increased
↑ An overweight position in medical device firm Boston Scientific rose in value on strong sales, particularly in its heart rhythm treatments business
↑ On an industry basis, stock selections in health care equipment & supplies, pharmaceuticals, and biotechnology helped Index-relative performance
↓ An overweight position in health insurer Humana declined in value amid increased use of services by subscribers and aggressive competitor pricing
↓ An overweight position in Zoetis, a drugmaker for animal use, declined in value amid weak earnings linked to the costly launch of a new pain medicine
↓ An out-of-Index holding in Neogen, a food safety test kit maker, detracted from returns as shipping backlogs hindered sales and lowered its stock price
↓ On an industry basis, stock selections in health care providers & services, and an overweight position in life sciences tools & services hurt returns
Comparison of the change in value of a $1,000,000 investment for the period indicated.
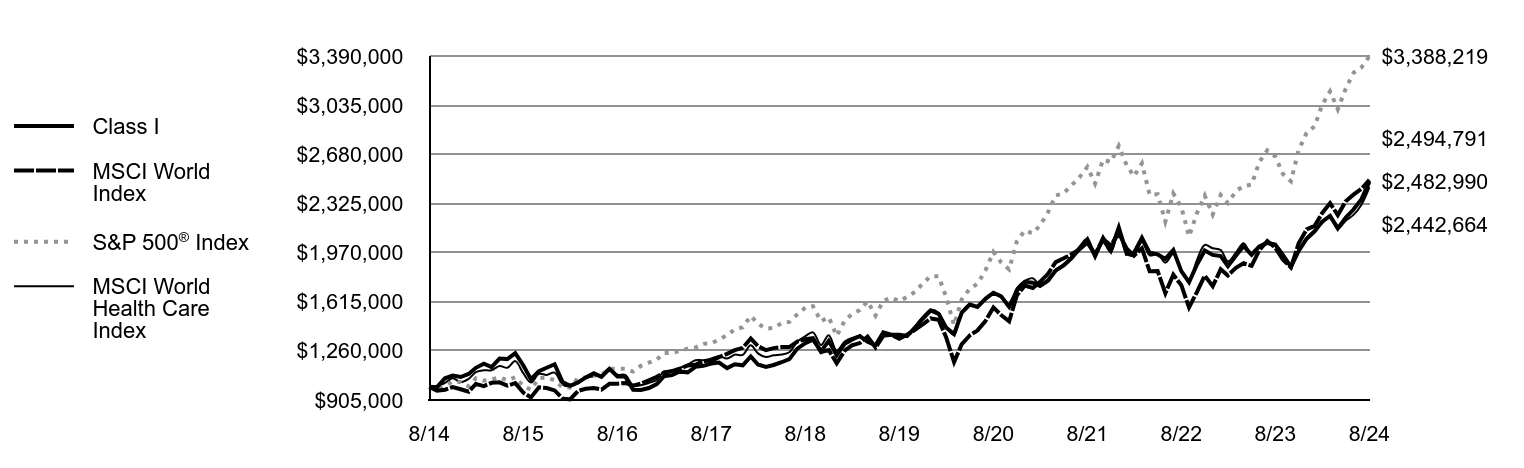
| Class I | MSCI World Index | S&P 500® Index | MSCI World Health Care Index |
|---|
| 8/14 | $1,000,000 | $1,000,000 | $1,000,000 | $1,000,000 |
| 9/14 | $997,774 | $972,859 | $985,976 | $1,004,278 |
| 10/14 | $1,062,123 | $979,152 | $1,010,059 | $1,028,944 |
| 11/14 | $1,082,095 | $998,775 | $1,037,224 | $1,061,609 |
| 12/14 | $1,070,961 | $982,670 | $1,034,611 | $1,034,691 |
| 1/15 | $1,093,396 | $964,864 | $1,003,553 | $1,058,201 |
| 2/15 | $1,137,413 | $1,021,395 | $1,061,229 | $1,106,222 |
| 3/15 | $1,166,762 | $1,005,406 | $1,044,446 | $1,120,475 |
| 4/15 | $1,142,591 | $1,028,985 | $1,054,466 | $1,119,275 |
| 5/15 | $1,203,867 | $1,032,530 | $1,068,025 | $1,150,966 |
| 6/15 | $1,200,422 | $1,008,521 | $1,047,350 | $1,137,512 |
| 7/15 | $1,243,577 | $1,026,624 | $1,069,294 | $1,185,829 |
| 8/15 | $1,156,410 | $958,688 | $1,004,779 | $1,098,822 |
| 9/15 | $1,055,442 | $923,327 | $979,917 | $1,031,021 |
| 10/15 | $1,113,260 | $996,496 | $1,062,577 | $1,093,668 |
| 11/15 | $1,138,281 | $991,537 | $1,065,737 | $1,086,426 |
| 12/15 | $1,163,047 | $974,109 | $1,048,929 | $1,102,950 |
| 1/16 | $1,034,238 | $915,833 | $996,876 | $1,016,051 |
| 2/16 | $1,007,718 | $909,017 | $995,531 | $1,003,372 |
| 3/16 | $1,032,343 | $970,702 | $1,063,066 | $1,027,727 |
| 4/16 | $1,068,332 | $986,062 | $1,067,188 | $1,061,734 |
| 5/16 | $1,097,686 | $991,601 | $1,086,352 | $1,076,606 |
| 6/16 | $1,072,111 | $980,489 | $1,089,167 | $1,085,173 |
| 7/16 | $1,129,881 | $1,021,913 | $1,129,323 | $1,134,534 |
| 8/16 | $1,073,999 | $1,022,763 | $1,130,909 | $1,087,396 |
| 9/16 | $1,074,940 | $1,028,196 | $1,131,123 | $1,085,963 |
| 10/16 | $978,341 | $1,008,297 | $1,110,490 | $1,011,004 |
| 11/16 | $977,390 | $1,022,795 | $1,151,617 | $1,011,907 |
| 12/16 | $991,707 | $1,047,269 | $1,174,380 | $1,027,811 |
| 1/17 | $1,019,433 | $1,072,545 | $1,196,654 | $1,050,277 |
| 2/17 | $1,077,021 | $1,102,301 | $1,244,168 | $1,111,013 |
| 3/17 | $1,084,487 | $1,114,043 | $1,245,619 | $1,114,557 |
| 4/17 | $1,111,141 | $1,130,538 | $1,258,411 | $1,135,606 |
| 5/17 | $1,104,740 | $1,154,454 | $1,276,121 | $1,160,369 |
| 6/17 | $1,144,194 | $1,158,896 | $1,284,086 | $1,191,851 |
| 7/17 | $1,151,662 | $1,186,631 | $1,310,490 | $1,192,742 |
| 8/17 | $1,168,729 | $1,188,302 | $1,314,502 | $1,204,493 |
| 9/17 | $1,175,129 | $1,214,973 | $1,341,617 | $1,220,684 |
| 10/17 | $1,135,672 | $1,237,934 | $1,372,925 | $1,204,880 |
| 11/17 | $1,163,401 | $1,264,757 | $1,415,032 | $1,232,125 |
| 12/17 | $1,155,868 | $1,281,861 | $1,430,765 | $1,231,319 |
| 1/18 | $1,219,417 | $1,349,543 | $1,512,682 | $1,300,327 |
| 2/18 | $1,161,346 | $1,293,635 | $1,456,929 | $1,242,030 |
| 3/18 | $1,143,821 | $1,265,438 | $1,419,904 | $1,216,192 |
| 4/18 | $1,158,059 | $1,279,980 | $1,425,352 | $1,227,804 |
| 5/18 | $1,177,775 | $1,288,001 | $1,459,677 | $1,233,608 |
| 6/18 | $1,199,684 | $1,287,386 | $1,468,661 | $1,250,013 |
| 7/18 | $1,276,373 | $1,327,596 | $1,523,316 | $1,326,801 |
| 8/18 | $1,315,816 | $1,344,022 | $1,572,953 | $1,366,030 |
| 9/18 | $1,341,016 | $1,351,506 | $1,581,907 | $1,393,713 |
| 10/18 | $1,256,649 | $1,252,268 | $1,473,783 | $1,302,071 |
| 11/18 | $1,332,246 | $1,266,493 | $1,503,816 | $1,373,032 |
| 12/18 | $1,228,618 | $1,170,192 | $1,368,035 | $1,262,270 |
| 1/19 | $1,310,530 | $1,261,239 | $1,477,664 | $1,327,254 |
| 2/19 | $1,340,522 | $1,299,165 | $1,525,109 | $1,353,449 |
| 3/19 | $1,367,063 | $1,316,228 | $1,554,745 | $1,364,981 |
| 4/19 | $1,325,529 | $1,362,901 | $1,617,696 | $1,329,792 |
| 5/19 | $1,300,146 | $1,284,260 | $1,514,894 | $1,297,938 |
| 6/19 | $1,393,588 | $1,368,887 | $1,621,658 | $1,385,498 |
| 7/19 | $1,376,276 | $1,375,667 | $1,644,965 | $1,370,087 |
| 8/19 | $1,376,271 | $1,347,529 | $1,618,908 | $1,369,677 |
| 9/19 | $1,367,037 | $1,376,205 | $1,649,199 | $1,368,239 |
| 10/19 | $1,427,022 | $1,411,226 | $1,684,920 | $1,436,546 |
| 11/19 | $1,491,629 | $1,450,529 | $1,746,081 | $1,504,428 |
| 12/19 | $1,551,560 | $1,493,984 | $1,798,781 | $1,555,669 |
| 1/20 | $1,527,158 | $1,484,891 | $1,798,076 | $1,533,562 |
| 2/20 | $1,428,352 | $1,359,380 | $1,650,059 | $1,428,738 |
| 3/20 | $1,380,780 | $1,179,476 | $1,446,256 | $1,377,124 |
| 4/20 | $1,535,687 | $1,308,327 | $1,631,657 | $1,536,973 |
| 5/20 | $1,594,233 | $1,371,530 | $1,709,370 | $1,598,989 |
| 6/20 | $1,577,154 | $1,407,808 | $1,743,364 | $1,577,598 |
| 7/20 | $1,635,713 | $1,475,160 | $1,841,664 | $1,642,305 |
| 8/20 | $1,679,620 | $1,573,722 | $1,974,044 | $1,676,063 |
| 9/20 | $1,654,013 | $1,519,430 | $1,899,037 | $1,652,995 |
| 10/20 | $1,578,380 | $1,472,821 | $1,848,534 | $1,572,351 |
| 11/20 | $1,694,264 | $1,661,138 | $2,050,882 | $1,713,081 |
| 12/20 | $1,758,580 | $1,731,565 | $2,129,735 | $1,765,979 |
| 1/21 | $1,752,018 | $1,714,356 | $2,108,233 | $1,784,785 |
| 2/21 | $1,728,406 | $1,758,285 | $2,166,368 | $1,736,247 |
| 3/21 | $1,766,447 | $1,816,787 | $2,261,245 | $1,778,756 |
| 4/21 | $1,839,883 | $1,901,340 | $2,381,925 | $1,846,662 |
| 5/21 | $1,877,918 | $1,928,730 | $2,398,561 | $1,884,643 |
| 6/21 | $1,929,051 | $1,957,481 | $2,454,555 | $1,941,114 |
| 7/21 | $1,995,933 | $1,992,541 | $2,512,863 | $2,013,343 |
| 8/21 | $2,064,125 | $2,042,132 | $2,589,268 | $2,069,197 |
| 9/21 | $1,943,478 | $1,957,342 | $2,468,842 | $1,960,740 |
| 10/21 | $2,074,616 | $2,068,207 | $2,641,813 | $2,043,512 |
| 11/21 | $1,985,442 | $2,022,886 | $2,623,508 | $1,970,561 |
| 12/21 | $2,152,035 | $2,109,345 | $2,741,084 | $2,115,703 |
| 1/22 | $1,961,060 | $1,997,738 | $2,599,241 | $1,959,382 |
| 2/22 | $1,968,186 | $1,947,212 | $2,521,416 | $1,950,634 |
| 3/22 | $2,076,500 | $2,000,650 | $2,615,035 | $2,044,579 |
| 4/22 | $1,968,186 | $1,834,450 | $2,386,999 | $1,949,874 |
| 5/22 | $1,956,784 | $1,835,839 | $2,391,378 | $1,959,487 |
| 6/22 | $1,924,005 | $1,676,815 | $2,193,985 | $1,897,328 |
| 7/22 | $1,988,138 | $1,809,948 | $2,396,280 | $1,959,267 |
| 8/22 | $1,835,643 | $1,734,278 | $2,298,555 | $1,841,247 |
| 9/22 | $1,755,832 | $1,573,060 | $2,086,861 | $1,768,745 |
| 10/22 | $1,884,099 | $1,686,026 | $2,255,816 | $1,917,378 |
| 11/22 | $1,985,288 | $1,803,256 | $2,381,881 | $2,025,142 |
| 12/22 | $1,953,180 | $1,726,676 | $2,244,650 | $2,001,155 |
| 1/23 | $1,944,248 | $1,848,849 | $2,385,690 | $1,988,204 |
| 2/23 | $1,871,301 | $1,804,406 | $2,327,482 | $1,907,079 |
| 3/23 | $1,947,225 | $1,860,161 | $2,412,933 | $1,969,131 |
| 4/23 | $2,017,194 | $1,892,769 | $2,450,595 | $2,037,980 |
| 5/23 | $1,954,669 | $1,873,873 | $2,461,247 | $1,954,528 |
| 6/23 | $2,014,217 | $1,987,200 | $2,623,875 | $2,016,823 |
| 7/23 | $2,039,525 | $2,053,956 | $2,708,167 | $2,042,853 |
| 8/23 | $2,027,615 | $2,004,896 | $2,665,049 | $2,027,117 |
| 9/23 | $1,951,691 | $1,918,408 | $2,537,985 | $1,961,189 |
| 10/23 | $1,866,835 | $1,862,743 | $2,484,620 | $1,880,539 |
| 11/23 | $1,981,466 | $2,037,380 | $2,711,528 | $1,988,369 |
| 12/23 | $2,069,884 | $2,137,403 | $2,834,715 | $2,076,339 |
| 1/24 | $2,123,429 | $2,163,053 | $2,882,350 | $2,132,113 |
| 2/24 | $2,193,802 | $2,254,761 | $3,036,255 | $2,180,140 |
| 3/24 | $2,235,108 | $2,327,218 | $3,133,945 | $2,231,462 |
| 4/24 | $2,144,847 | $2,240,774 | $3,005,941 | $2,143,263 |
| 5/24 | $2,222,869 | $2,340,829 | $3,154,989 | $2,200,507 |
| 6/24 | $2,281,003 | $2,388,460 | $3,268,197 | $2,242,150 |
| 7/24 | $2,355,966 | $2,430,550 | $3,307,979 | $2,315,468 |
| 8/24 | $2,482,990 | $2,494,791 | $3,388,219 | $2,442,664 |
Average Annual Total Returns (%)
| 1 Year | 5 Years | 10 Years |
|---|
| Class I | 22.46% | 12.51% | 9.51% |
MSCI World Index (net of foreign withholding taxes)Footnote Reference1 | 24.43% | 13.09% | 9.56% |
| MSCI World Health Care Index (net of foreign withholding taxes) | 20.50% | 12.25% | 9.33% |
S&P 500® Index | 27.14% | 15.90% | 12.97% |
| Footnote | Description |
Footnote1 | In accordance with regulatory changes requiring the Fund's primary benchmark to represent the overall applicable market, the Fund's primary prospectus benchmark changed to the indicated benchmark effective May 1, 2024. |
Performance does not reflect the deduction of taxes that a shareholder would pay on Fund distributions or redemption of Fund shares. Performance assumes that all dividends and distributions, if any, were reinvested. For more recent performance information, visit www.eatonvance.com/performance.php.
THE FUND'S PAST PERFORMANCE IS NO GUARANTEE OF FUTURE RESULTS.
| Total Net Assets | $1,115,758,999 |
| # of Portfolio Holdings | 46 |
| Portfolio Turnover Rate | 15% |
| Total Advisory Fees Paid | $6,175,444 |
What did the Fund invest in?
The following tables reflect what the Fund invested in as of the report date.
Sector Allocation (% of total investments)
| Value | Value |
|---|
| Short-Term Investments | 0.3% |
| Health Care Services | 0.5% |
| Metal, Glass & Plastic Containers | 0.6% |
| Health Care Technology | 0.8% |
| Exchange Traded Funds | 2.2% |
| Health Care Distributors | 2.5% |
| Health Care Supplies | 5.3% |
| Managed Health Care | 10.5% |
| Life Sciences Tools & Services | 11.3% |
| Health Care Equipment | 11.5% |
| Biotechnology | 12.2% |
| Pharmaceuticals | 42.3% |
Top Ten Holdings (% of total investments)Footnote Referencea
| Eli Lilly & Co. | 10.8% |
| UnitedHealth Group, Inc. | 7.6% |
| Novo Nordisk AS, Class B | 7.0% |
| AbbVie, Inc. | 5.2% |
| AstraZeneca PLC | 5.0% |
| Thermo Fisher Scientific, Inc. | 4.5% |
| Danaher Corp. | 3.8% |
| Roche Holding AG PC | 3.8% |
| Intuitive Surgical, Inc. | 3.7% |
| Johnson & Johnson | 3.4% |
| Total | 54.8% |
| Footnote | Description |
Footnotea | Excluding cash equivalents |
If you wish to view additional information about the Fund, including the prospectus, statement of additional information, financial statements and holdings, please scan the QR code or visit www.eatonvance.com/open-end-mutual-fund-documents.php. For proxy information, please visit www.eatonvance.com/proxyvoting.
The Funds may deliver a single copy of certain required shareholder documents (including prospectuses, shareholder reports, and proxy materials) to investors with the same last name and the same address. Your participation will continue indefinitely unless you instruct otherwise by calling 1-800-262-1122 or by contacting your financial intermediary. Your instruction will typically be effective within 30 days of receipt.
Not FDIC Insured | May Lose Value | No Bank Guarantee
Annual Shareholder Report August 31, 2024
Eaton Vance Worldwide Health Sciences Fund
Annual Shareholder Report August 31, 2024
This annual shareholder report contains important information about the Eaton Vance Worldwide Health Sciences Fund for the period of September 1, 2023 to August 31, 2024. You can find additional information about the Fund at www.eatonvance.com/open-end-mutual-fund-documents.php. You can also request this information by contacting us at 1-800-262-1122.
What were the Fund costs for the last year?
(based on a hypothetical $10,000 investment)
| Class Name | Costs of a $10,000 investment | Costs paid as a percentage of a $10,000 investment |
|---|
| Class R | $156 | 1.41% |
How did the Fund perform last year and what affected its performance?
Key contributors to (↑) and detractors from (↓) performance, relative to the MSCI World Health Care Index (the Index):
↑ An overweight position in drugmaker Eli Lilly rose in value on strong sales of Mounjaro and Zepbound -- so-called “GLP-1” drugs for diabetes and obesity
↑ An overweight position in robotic surgical systems firm Intuitive Surgical rose in value as it launched a new robot platform and U.S. surgeries increased
↑ An overweight position in medical device firm Boston Scientific rose in value on strong sales, particularly in its heart rhythm treatments business
↑ On an industry basis, stock selections in health care equipment & supplies, pharmaceuticals, and biotechnology helped Index-relative performance
↓ An overweight position in health insurer Humana declined in value amid increased use of services by subscribers and aggressive competitor pricing
↓ An overweight position in Zoetis, a drugmaker for animal use, declined in value amid weak earnings linked to the costly launch of a new pain medicine
↓ An out-of-Index holding in Neogen, a food safety test kit maker, detracted from returns as shipping backlogs hindered sales and lowered its stock price
↓ On an industry basis, stock selections in health care providers & services, and an overweight position in life sciences tools & services hurt returns
Comparison of the change in value of a $10,000 investment for the period indicated.
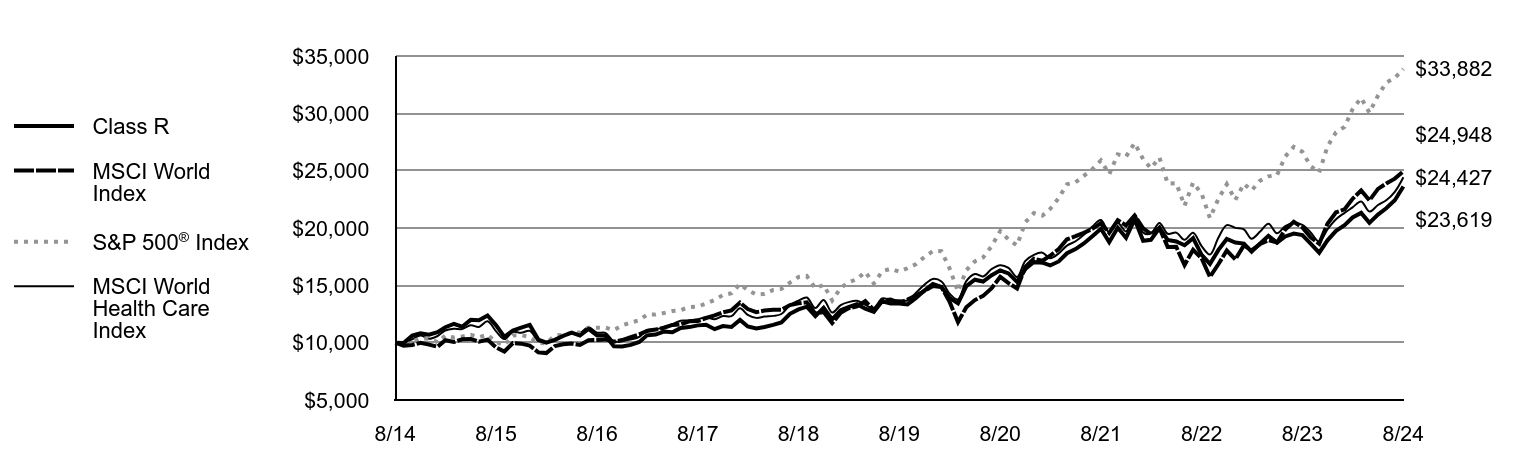
| Class R | MSCI World Index | S&P 500® Index | MSCI World Health Care Index |
|---|
| 8/14 | $10,000 | $10,000 | $10,000 | $10,000 |
| 9/14 | $9,972 | $9,729 | $9,860 | $10,043 |
| 10/14 | $10,611 | $9,792 | $10,101 | $10,289 |
| 11/14 | $10,810 | $9,988 | $10,372 | $10,616 |
| 12/14 | $10,688 | $9,827 | $10,346 | $10,347 |
| 1/15 | $10,910 | $9,649 | $10,036 | $10,582 |
| 2/15 | $11,347 | $10,214 | $10,612 | $11,062 |
| 3/15 | $11,635 | $10,054 | $10,444 | $11,205 |
| 4/15 | $11,388 | $10,290 | $10,545 | $11,193 |
| 5/15 | $11,989 | $10,325 | $10,680 | $11,510 |
| 6/15 | $11,956 | $10,085 | $10,474 | $11,375 |
| 7/15 | $12,376 | $10,266 | $10,693 | $11,858 |
| 8/15 | $11,512 | $9,587 | $10,048 | $10,988 |
| 9/15 | $10,499 | $9,233 | $9,799 | $10,310 |
| 10/15 | $11,067 | $9,965 | $10,626 | $10,937 |
| 11/15 | $11,314 | $9,915 | $10,657 | $10,864 |
| 12/15 | $11,550 | $9,741 | $10,489 | $11,029 |
| 1/16 | $10,272 | $9,158 | $9,969 | $10,161 |
| 2/16 | $10,001 | $9,090 | $9,955 | $10,034 |
| 3/16 | $10,244 | $9,707 | $10,631 | $10,277 |
| 4/16 | $10,596 | $9,861 | $10,672 | $10,617 |
| 5/16 | $10,875 | $9,916 | $10,864 | $10,766 |
| 6/16 | $10,622 | $9,805 | $10,892 | $10,852 |
| 7/16 | $11,190 | $10,219 | $11,293 | $11,345 |
| 8/16 | $10,632 | $10,228 | $11,309 | $10,874 |
| 9/16 | $10,632 | $10,282 | $11,311 | $10,860 |
| 10/16 | $9,677 | $10,083 | $11,105 | $10,110 |
| 11/16 | $9,659 | $10,228 | $11,516 | $10,119 |
| 12/16 | $9,804 | $10,473 | $11,744 | $10,278 |
| 1/17 | $10,066 | $10,725 | $11,967 | $10,503 |
| 2/17 | $10,641 | $11,023 | $12,442 | $11,110 |
| 3/17 | $10,702 | $11,140 | $12,456 | $11,146 |
| 4/17 | $10,964 | $11,305 | $12,584 | $11,356 |
| 5/17 | $10,903 | $11,545 | $12,761 | $11,604 |
| 6/17 | $11,277 | $11,589 | $12,841 | $11,919 |
| 7/17 | $11,357 | $11,866 | $13,105 | $11,927 |
| 8/17 | $11,509 | $11,883 | $13,145 | $12,045 |
| 9/17 | $11,569 | $12,150 | $13,416 | $12,207 |
| 10/17 | $11,176 | $12,379 | $13,729 | $12,049 |
| 11/17 | $11,448 | $12,648 | $14,150 | $12,321 |
| 12/17 | $11,367 | $12,819 | $14,308 | $12,313 |
| 1/18 | $11,988 | $13,495 | $15,127 | $13,003 |
| 2/18 | $11,418 | $12,936 | $14,569 | $12,420 |
| 3/18 | $11,242 | $12,654 | $14,199 | $12,162 |
| 4/18 | $11,367 | $12,800 | $14,254 | $12,278 |
| 5/18 | $11,553 | $12,880 | $14,597 | $12,336 |
| 6/18 | $11,770 | $12,874 | $14,687 | $12,500 |
| 7/18 | $12,516 | $13,276 | $15,233 | $13,268 |
| 8/18 | $12,899 | $13,440 | $15,730 | $13,660 |
| 9/18 | $13,137 | $13,515 | $15,819 | $13,937 |
| 10/18 | $12,309 | $12,523 | $14,738 | $13,021 |
| 11/18 | $13,044 | $12,665 | $15,038 | $13,730 |
| 12/18 | $12,028 | $11,702 | $13,680 | $12,623 |
| 1/19 | $12,829 | $12,612 | $14,777 | $13,273 |
| 2/19 | $13,099 | $12,992 | $15,251 | $13,534 |
| 3/19 | $13,359 | $13,162 | $15,547 | $13,650 |
| 4/19 | $12,959 | $13,629 | $16,177 | $13,298 |
| 5/19 | $12,688 | $12,843 | $15,149 | $12,979 |
| 6/19 | $13,608 | $13,689 | $16,217 | $13,855 |
| 7/19 | $13,424 | $13,757 | $16,450 | $13,701 |
| 8/19 | $13,424 | $13,475 | $16,189 | $13,697 |
| 9/19 | $13,326 | $13,762 | $16,492 | $13,682 |
| 10/19 | $13,900 | $14,112 | $16,849 | $14,365 |
| 11/19 | $14,539 | $14,505 | $17,461 | $15,044 |
| 12/19 | $15,112 | $14,940 | $17,988 | $15,557 |
| 1/20 | $14,862 | $14,849 | $17,981 | $15,336 |
| 2/20 | $13,907 | $13,594 | $16,501 | $14,287 |
| 3/20 | $13,430 | $11,795 | $14,463 | $13,771 |
| 4/20 | $14,930 | $13,083 | $16,317 | $15,370 |
| 5/20 | $15,487 | $13,715 | $17,094 | $15,990 |
| 6/20 | $15,328 | $14,078 | $17,434 | $15,776 |
| 7/20 | $15,884 | $14,752 | $18,417 | $16,423 |
| 8/20 | $16,305 | $15,737 | $19,740 | $16,761 |
| 9/20 | $16,043 | $15,194 | $18,990 | $16,530 |
| 10/20 | $15,305 | $14,728 | $18,485 | $15,724 |
| 11/20 | $16,419 | $16,611 | $20,509 | $17,131 |
| 12/20 | $17,035 | $17,316 | $21,297 | $17,660 |
| 1/21 | $16,975 | $17,144 | $21,082 | $17,848 |
| 2/21 | $16,733 | $17,583 | $21,664 | $17,362 |
| 3/21 | $17,084 | $18,168 | $22,612 | $17,788 |
| 4/21 | $17,799 | $19,013 | $23,819 | $18,467 |
| 5/21 | $18,162 | $19,287 | $23,986 | $18,846 |
| 6/21 | $18,647 | $19,575 | $24,546 | $19,411 |
| 7/21 | $19,289 | $19,925 | $25,129 | $20,133 |
| 8/21 | $19,931 | $20,421 | $25,893 | $20,692 |
| 9/21 | $18,768 | $19,573 | $24,688 | $19,607 |
| 10/21 | $20,016 | $20,682 | $26,418 | $20,435 |
| 11/21 | $19,144 | $20,229 | $26,235 | $19,706 |
| 12/21 | $20,754 | $21,093 | $27,411 | $21,157 |
| 1/22 | $18,888 | $19,977 | $25,992 | $19,594 |
| 2/22 | $18,966 | $19,472 | $25,214 | $19,506 |
| 3/22 | $19,997 | $20,007 | $26,150 | $20,446 |
| 4/22 | $18,953 | $18,344 | $23,870 | $19,499 |
| 5/22 | $18,822 | $18,358 | $23,914 | $19,595 |
| 6/22 | $18,496 | $16,768 | $21,940 | $18,973 |
| 7/22 | $19,110 | $18,099 | $23,963 | $19,593 |
| 8/22 | $17,648 | $17,343 | $22,986 | $18,412 |
| 9/22 | $16,864 | $15,731 | $20,869 | $17,687 |
| 10/22 | $18,091 | $16,860 | $22,558 | $19,174 |
| 11/22 | $19,044 | $18,033 | $23,819 | $20,251 |
| 12/22 | $18,737 | $17,267 | $22,446 | $20,012 |
| 1/23 | $18,642 | $18,488 | $23,857 | $19,882 |
| 2/23 | $17,938 | $18,044 | $23,275 | $19,071 |
| 3/23 | $18,656 | $18,602 | $24,129 | $19,691 |
| 4/23 | $19,319 | $18,928 | $24,506 | $20,380 |
| 5/23 | $18,723 | $18,739 | $24,612 | $19,545 |
| 6/23 | $19,265 | $19,872 | $26,239 | $20,168 |
| 7/23 | $19,509 | $20,540 | $27,082 | $20,429 |
| 8/23 | $19,387 | $20,049 | $26,650 | $20,271 |
| 9/23 | $18,642 | $19,184 | $25,380 | $19,612 |
| 10/23 | $17,843 | $18,627 | $24,846 | $18,805 |
| 11/23 | $18,927 | $20,374 | $27,115 | $19,884 |
| 12/23 | $19,755 | $21,374 | $28,347 | $20,763 |
| 1/24 | $20,254 | $21,631 | $28,824 | $21,321 |
| 2/24 | $20,919 | $22,548 | $30,363 | $21,801 |
| 3/24 | $21,320 | $23,272 | $31,339 | $22,315 |
| 4/24 | $20,448 | $22,408 | $30,059 | $21,433 |
| 5/24 | $21,168 | $23,408 | $31,550 | $22,005 |
| 6/24 | $21,722 | $23,885 | $32,682 | $22,422 |
| 7/24 | $22,415 | $24,306 | $33,080 | $23,155 |
| 8/24 | $23,619 | $24,948 | $33,882 | $24,427 |
Average Annual Total Returns (%)
| 1 Year | 5 Years | 10 Years |
|---|
| Class R | 21.83% | 11.95% | 8.97% |
MSCI World Index (net of foreign withholding taxes)Footnote Reference1 | 24.43% | 13.09% | 9.56% |
| MSCI World Health Care Index (net of foreign withholding taxes) | 20.50% | 12.25% | 9.33% |
S&P 500® Index | 27.14% | 15.90% | 12.97% |
| Footnote | Description |
Footnote1 | In accordance with regulatory changes requiring the Fund's primary benchmark to represent the overall applicable market, the Fund's primary prospectus benchmark changed to the indicated benchmark effective May 1, 2024. |
Performance does not reflect the deduction of taxes that a shareholder would pay on Fund distributions or redemption of Fund shares. Performance assumes that all dividends and distributions, if any, were reinvested. For more recent performance information, visit www.eatonvance.com/performance.php.
THE FUND'S PAST PERFORMANCE IS NO GUARANTEE OF FUTURE RESULTS.
| Total Net Assets | $1,115,758,999 |
| # of Portfolio Holdings | 46 |
| Portfolio Turnover Rate | 15% |
| Total Advisory Fees Paid | $6,175,444 |
What did the Fund invest in?
The following tables reflect what the Fund invested in as of the report date.
Sector Allocation (% of total investments)
| Value | Value |
|---|
| Short-Term Investments | 0.3% |
| Health Care Services | 0.5% |
| Metal, Glass & Plastic Containers | 0.6% |
| Health Care Technology | 0.8% |
| Exchange Traded Funds | 2.2% |
| Health Care Distributors | 2.5% |
| Health Care Supplies | 5.3% |
| Managed Health Care | 10.5% |
| Life Sciences Tools & Services | 11.3% |
| Health Care Equipment | 11.5% |
| Biotechnology | 12.2% |
| Pharmaceuticals | 42.3% |
Top Ten Holdings (% of total investments)Footnote Referencea
| Eli Lilly & Co. | 10.8% |
| UnitedHealth Group, Inc. | 7.6% |
| Novo Nordisk AS, Class B | 7.0% |
| AbbVie, Inc. | 5.2% |
| AstraZeneca PLC | 5.0% |
| Thermo Fisher Scientific, Inc. | 4.5% |
| Danaher Corp. | 3.8% |
| Roche Holding AG PC | 3.8% |
| Intuitive Surgical, Inc. | 3.7% |
| Johnson & Johnson | 3.4% |
| Total | 54.8% |
| Footnote | Description |
Footnotea | Excluding cash equivalents |
If you wish to view additional information about the Fund, including the prospectus, statement of additional information, financial statements and holdings, please scan the QR code or visit www.eatonvance.com/open-end-mutual-fund-documents.php. For proxy information, please visit www.eatonvance.com/proxyvoting.
The Funds may deliver a single copy of certain required shareholder documents (including prospectuses, shareholder reports, and proxy materials) to investors with the same last name and the same address. Your participation will continue indefinitely unless you instruct otherwise by calling 1-800-262-1122 or by contacting your financial intermediary. Your instruction will typically be effective within 30 days of receipt.
Not FDIC Insured | May Lose Value | No Bank Guarantee
Annual Shareholder Report August 31, 2024
(b) Not applicable.
Item 2. Code of Ethics
The registrant (sometimes referred to as the “Fund”) has adopted a code of ethics applicable to its Principal Executive Officer, Principal Financial Officer and Principal Accounting Officer. The registrant undertakes to provide a copy of such code of ethics to any person upon request, without charge, by calling 1-800-262-1122. The registrant has not amended the code of ethics as described in Form N-CSR during the period covered by this report. The registrant has not granted any waiver, including an implicit waiver, from a provision of the code of ethics as described in Form N-CSR during the period covered by this report.
Item 3. Audit Committee Financial Expert
The registrant’s Board of Trustees (the “Board”) has designated George J. Gorman and Scott E. Wennerholm, each an independent trustee, as audit committee financial experts. Mr. Gorman is a certified public accountant who is the Principal at George J. Gorman LLC (a consulting firm). Previously, Mr. Gorman served in various capacities at Ernst & Young LLP (a registered public accounting firm), including as Senior Partner. Mr. Gorman also has experience serving as an independent trustee and audit committee financial expert of other mutual fund complexes. Mr. Wennerholm is a private investor. Previously, Mr. Wennerholm served as a Trustee at Wheelock College (postsecondary institution), as a Consultant at GF Parish Group (executive recruiting firm), Chief Operating Officer and Executive Vice President at BNY Mellon Asset Management (investment management firm), Chief Operating Officer and Chief Financial Officer at Natixis Global Asset Management (investment management firm), and Vice President at Fidelity Investments Institutional Services (investment management firm).
Item 4. Principal Accountant Fees and Services
Eaton Vance Greater China Growth Fund, Eaton Vance Richard Bernstein All Asset Strategy Fund, Eaton Vance Richard Bernstein Equity Strategy Fund and Eaton Vance Worldwide Health Sciences Fund (the “Fund(s)”) are series of Eaton Vance Growth Trust (the “Trust”), a Massachusetts business trust, which, including the Funds, contains a total of 10 series (the “Series”). The Trust is registered under the Investment Company Act of 1940 as an open-end management investment company. This Form N-CSR relates to the Funds’ annual reports.
(a)-(d)
The following tables present the aggregate fees billed to each Fund for each Fund’s fiscal years ended August 31, 2023 and August 31, 2024 by the registrant’s principal accountant, Deloitte & Touche LLP (“D&T”), for professional services rendered for the audit of the Funds’ annual financial statements and fees billed for other services rendered by D&T during those periods.
Eaton Vance Greater China Growth Fund
| | | | | | | | |
Fiscal Years Ended | | 8/31/23 | | | 8/31/24 | |
Audit Fees | | $ | 43,200 | | | $ | 33,900 | |
Audit-Related Fees(1) | | $ | 0 | | | $ | 0 | |
Tax Fees(2) | | $ | 0 | | | $ | 0 | |
All Other Fees(3) | | $ | 0 | | | $ | 0 | |
| | | | | | | | |
Total | | $ | 43,200 | | | $ | 33,900 | |
| | | | | | | | |
Eaton Vance Richard Bernstein All Asset Strategy Fund
| | | | | | | | |
Fiscal Years Ended | | 8/31/23 | | | 8/31/24 | |
Audit Fees | | $ | 39,300 | | | $ | 35,100 | |
Audit-Related Fees(1) | | $ | 0 | | | $ | 0 | |
Tax Fees(2) | | $ | 0 | | | $ | 0 | |
All Other Fees(3) | | $ | 0 | | | $ | 0 | |
| | | | | | | | |
Total | | $ | 39,300 | | | $ | 35,100 | |
| | | | | | | | |
Eaton Vance Richard Bernstein Equity Strategy Fund
| | | | | | | | |
Fiscal Years Ended | | 8/31/23 | | | 8/31/24 | |
Audit Fees | | $ | 37,900 | | | $ | 35,100 | |
Audit-Related Fees(1) | | $ | 0 | | | $ | 0 | |
Tax Fees(2) | | $ | 0 | | | $ | 0 | |
All Other Fees(3) | | $ | 0 | | | $ | 0 | |
| | | | | | | | |
Total | | $ | 37,900 | | | $ | 35,100 | |
| | | | | | | | |
Eaton Vance Worldwide Health Sciences Fund
| | | | | | | | |
Fiscal Years Ended | | 8/31/23 | | | 8/31/24 | |
Audit Fees | | $ | 56,300 | | | $ | 68,200 | |
Audit-Related Fees(1) | | $ | 0 | | | $ | 0 | |
Tax Fees(2) | | $ | 0 | | | $ | 0 | |
All Other Fees(3) | | $ | 0 | | | $ | 0 | |
| | | | | | | | |
Total | | $ | 56,300 | | | $ | 68,200 | |
| | | | | | | | |
| (1) | Audit-related fees consist of the aggregate fees billed for assurance and related services that are reasonably related to the performance of the audit of the registrant’s financial statements and are not reported under the category of audit fees. |
| (2) | Tax fees consist of the aggregate fees billed for professional services rendered by the principal accountant relating to tax compliance, tax advice, and tax planning and specifically include fees for tax return preparation and other related tax compliance/planning matters. |
| (3) | All other fees consist of the aggregate fees billed for products and services provided by the principal accountant other than audit, audit-related, and tax services. |
The various Series comprising the Trust have varying fiscal year ends (February 28/29, August 31, September 30 or November 30). The following table presents the aggregate audit, audit-related, tax, and other fees billed to all of the Series in the Trust by D&T for the last two fiscal years of each Series.
| | | | | | | | | | | | | | | | | | | | | | | | | | | | | | | | |
Fiscal Years Ended | | 9/30/22 | | | 11/30/22 | | | 2/28/23 | | | 8/31/23 | | | 9/30/23 | | | 11/30/23 | | | 2/29/24 | | | 8/31/24 | |
Audit Fees | | $ | 105,450 | | | $ | 63,600 | | | $ | 60,900 | | | $ | 176,700 | | | $ | 116,300 | | | $ | 30,700 | | | $ | 61,800 | | | $ | 172,300 | |
Audit-Related Fees(1) | | $ | 0 | | | $ | 0 | | | $ | 0 | | | $ | 0 | | | $ | 0 | | | $ | 0 | | | $ | 0 | | | $ | 0 | |
Tax Fees(2) | | $ | 7,000 | | | $ | 4,350 | | | $ | 4,350 | | | $ | 0 | | | $ | 0 | | | $ | 0 | | | $ | 0 | | | $ | 0 | |
All Other Fees(3) | | $ | 0 | | | $ | 0 | | | $ | 0 | | | $ | 0 | | | $ | 0 | | | $ | 0 | | | $ | 0 | | | $ | 0 | |
| | | | | | | | | | | | | | | | | | | | | | | | | | | | | | | | |
Total | | $ | 112,450 | | | $ | 67,950 | | | $ | 65,250 | | | $ | 176,700 | | | $ | 116,300 | | | $ | 30,700 | | | $ | 61,800 | | | $ | 172,300 | |
| | | | | | | | | | | | | | | | | | | | | | | | | | | | | | | | |
| (1) | Audit-related fees consist of the aggregate fees billed for assurance and related services that are reasonably related to the performance of the audit of the registrant’s financial statements and are not reported under the category of audit fees. |
| (2) | Tax fees consist of the aggregate fees billed for professional services rendered by the principal accountant relating to tax compliance, tax advice, and tax planning and specifically include fees for tax return preparation and other related tax compliance/planning matters. |
| (3) | All other fees consist of the aggregate fees billed for products and services provided by the principal accountant other than audit, audit-related, and tax services. |
(e)(1) The registrant’s audit committee has adopted policies and procedures relating to the pre-approval of services provided by the registrant’s principal accountant (the “Pre-Approval Policies”). The Pre-Approval Policies establish a framework intended to assist the audit committee in the proper discharge of its pre-approval responsibilities. As a general matter, the Pre-Approval Policies (i) specify certain types of audit, audit-related, tax, and other services determined to be pre-approved by the audit committee; and (ii) delineate specific procedures governing the mechanics of the pre-approval process, including the approval and monitoring of audit and non-audit service fees. Unless a service is specifically pre-approved under the Pre-Approval Policies, it must be separately pre-approved by the audit committee.
The Pre-Approval Policies and the types of audit and non-audit services pre-approved therein must be reviewed and ratified by the registrant’s audit committee at least annually. The registrant’s audit committee maintains full responsibility for the appointment, compensation, and oversight of the work of the registrant’s principal accountant.
(e)(2) No services described in paragraphs (b)-(d) above were approved by the registrant’s audit committee pursuant to the “de minimis exception” set forth in Rule 2-01(c)(7)(i)(C) of Regulation S-X.
(f) Not applicable.
(g) The following table presents (i) the aggregate non-audit fees (i.e., fees for audit-related, tax, and other services) billed for services rendered to all of the Series in the Trust by D&T for the last two fiscal years of each Series; and (ii) the aggregate non-audit fees (i.e., fees for audit-related, tax, and other services) billed for services rendered to the Eaton Vance organization by D&T for the last 2 fiscal years of each Series.
| | | | | | | | | | | | | | | | | | | | | | | | | | | | | | | | |
Fiscal Years Ended | | 9/30/22 | | | 11/30/22 | | | 2/28/23 | | | 8/31/23 | | | 9/30/23 | | | 11/30/23 | | | 2/29/24 | | | 8/31/24 | |
Registrant(1) | | $ | 7,000 | | | $ | 4,350 | | | $ | 4,350 | | | $ | 0 | | | $ | 0 | | | $ | 0 | | | $ | 0 | | | $ | 0 | |
Eaton Vance(2) | | $ | 52,836 | | | $ | 52,836 | | | $ | 52,836 | | | $ | 52,836 | | | $ | 52,836 | | | $ | 52,836 | | | $ | 52,836 | | | $ | 18,490 | |
| (1) | Includes all of the Series of the Trust. During the fiscal years reported above, certain of the Funds were “feeder” funds in a “master-feeder” fund structure or funds of funds. |
| (2) | Various subsidiaries of Morgan Stanley act in either an investment advisory and/or service provider capacity with respect to the Series and/or their respective “master” funds (if applicable). |
(h) The registrant’s audit committee has considered whether the provision by the registrant’s principal accountant of non-audit services to the registrant’s investment adviser and any entity controlling, controlled by, or under common control with the adviser that provides ongoing services to the registrant that were not pre-approved pursuant to Rule 2-01(c)(7)(ii) of Regulation S-X is compatible with maintaining the principal accountant’s independence.
(i) Not applicable.
(j) Not applicable.
Item 5. Audit Committee of Listed Registrants
Not applicable.
Item 6. Schedule of Investments
| (a) | Please see schedule of investments contained in the Financial Statements and Financial Highlights included under Item 7 of this Form N-CSR. |
Item 7. Financial Statements and Financial Highlights for Open-End Management Investment Companies
Eaton Vance
Greater China Growth Fund
Annual Financial Statements and Additional Information
August 31, 2024
This report must be preceded or accompanied by a current summary prospectus or prospectus. Before investing, investors should consider carefully the investment objective, risks, and charges and expenses of a mutual fund. This and other important information is contained in the prospectus and/or statement of additional information, which can be obtained by calling 1-800-262-1122 or from a financial intermediary. Prospective investors should read the prospectus carefully before investing.
Annual Financial Statements and Additional Information August 31, 2024
Eaton Vance
Greater China Growth Fund
Eaton Vance
Greater China Growth Fund
August 31, 2024
| Security | Shares | Value |
| China — 98.0% |
| Automobile Components — 1.9% |
| Fuyao Glass Industry Group Co. Ltd., Class H(1) | | 104,800 | $ 599,206 |
| | | | $ 599,206 |
| Automobiles — 4.9% |
| Brilliance China Automotive Holdings Ltd. | | 1,502,000 | $ 626,211 |
| BYD Co. Ltd., Class H | | 23,500 | 719,734 |
| Li Auto, Inc., Class A(2) | | 22,000 | 214,136 |
| | | | $ 1,560,081 |
| Banks — 18.4% |
| China Construction Bank Corp., Class H | | 5,547,000 | $ 3,894,768 |
| China Merchants Bank Co. Ltd., Class H | | 372,000 | 1,526,577 |
| Postal Savings Bank of China Co. Ltd., Class H(1) | | 926,000 | 494,800 |
| | | | $ 5,916,145 |
| Beverages — 3.2% |
| Kweichow Moutai Co. Ltd., Class A | | 5,000 | $ 1,015,069 |
| | | | $ 1,015,069 |
| Broadline Retail — 6.1% |
| PDD Holdings, Inc. ADR(2) | | 20,568 | $ 1,976,790 |
| | | | $ 1,976,790 |
| Construction & Engineering — 2.7% |
| China Communications Services Corp. Ltd., Class H | | 422,000 | $ 214,940 |
| China State Construction International Holdings Ltd. | | 450,000 | 641,703 |
| | | | $ 856,643 |
| Electronic Equipment, Instruments & Components — 1.5% |
| Shanghai BOCHU Electronic Technology Corp. Ltd., Class A | | 21,121 | $ 481,219 |
| | | | $ 481,219 |
| Entertainment — 4.8% |
| NetEase, Inc. | | 95,700 | $ 1,538,340 |
| | | | $ 1,538,340 |
| Ground Transportation — 0.8% |
| Full Truck Alliance Co. Ltd. ADR | | 35,812 | $ 259,638 |
| | | | $ 259,638 |
| Security | Shares | Value |
| Health Care Equipment & Supplies — 2.0% |
| Shenzhen Mindray Bio-Medical Electronics Co. Ltd., Class A | | 18,000 | $ 635,228 |
| | | | $ 635,228 |
| Health Care Providers & Services — 0.9% |
| Hygeia Healthcare Holdings Co. Ltd.(1)(2) | | 111,800 | $ 280,130 |
| | | | $ 280,130 |
| Hotels, Restaurants & Leisure — 12.7% |
| H World Group Ltd. | | 101,400 | $ 312,147 |
| Luckin Coffee, Inc. ADR(2) | | 19,519 | 388,428 |
| Meituan, Class B(1)(2) | | 106,510 | 1,611,645 |
| Trip.com Group Ltd.(2) | | 31,650 | 1,490,809 |
| Yum China Holdings, Inc. | | 8,350 | 283,976 |
| | | | $ 4,087,005 |
| Household Durables — 1.7% |
| Gree Electric Appliances, Inc., Class A | | 98,046 | $ 548,098 |
| | | | $ 548,098 |
| Insurance — 0.6% |
| PICC Property & Casualty Co. Ltd., Class H | | 142,000 | $ 183,904 |
| | | | $ 183,904 |
| Interactive Media & Services — 24.0% |
| Kanzhun Ltd. ADR | | 25,258 | $ 314,715 |
| Tencent Holdings Ltd. | | 152,400 | 7,391,386 |
| | | | $ 7,706,101 |
| Life Sciences Tools & Services — 0.9% |
| WuXi Biologics Cayman, Inc.(1)(2) | | 203,500 | $ 289,661 |
| | | | $ 289,661 |
| Machinery — 3.6% |
| CRRC Corp. Ltd., Class H | | 426,000 | $ 258,044 |
| Weichai Power Co. Ltd., Class H | | 315,000 | 481,804 |
| Zoomlion Heavy Industry Science and Technology Co. Ltd., Class H | | 788,800 | 410,898 |
| | | | $ 1,150,746 |
| Oil, Gas & Consumable Fuels — 1.8% |
| China Shenhua Energy Co. Ltd., Class H | | 137,500 | $ 590,934 |
| | | | $ 590,934 |
1
See Notes to Financial Statements.
Eaton Vance
Greater China Growth Fund
August 31, 2024
Portfolio of Investments — continued
| Security | Shares | Value |
| Personal Care Products — 1.5% |
| Proya Cosmetics Co. Ltd., Class A | | 36,720 | $ 494,146 |
| | | | $ 494,146 |
| Real Estate Management & Development — 1.9% |
| KE Holdings, Inc. ADR | | 42,124 | $ 625,120 |
| | | | $ 625,120 |
| Textiles, Apparel & Luxury Goods — 1.3% |
| ANTA Sports Products Ltd. | | 43,000 | $ 419,515 |
| | | | $ 419,515 |
| Transportation Infrastructure — 0.8% |
| China Merchants Port Holdings Co. Ltd. | | 176,000 | $ 263,476 |
| | | | $ 263,476 |
Total China
(identified cost $27,205,327) | | | $31,477,195 |
Total Common Stocks
(identified cost $27,205,327) | | | $31,477,195 |
| Short-Term Investments — 2.2% |
| Security | Shares | Value |
| Morgan Stanley Institutional Liquidity Funds - Government Portfolio, Institutional Class, 5.19%(3) | | 707,855 | $ 707,855 |
Total Short-Term Investments
(identified cost $707,855) | | | $ 707,855 |
Total Investments — 100.2%
(identified cost $27,913,182) | | | $32,185,050 |
| Other Assets, Less Liabilities — (0.2)% | | | $ (72,425) |
| Net Assets — 100.0% | | | $32,112,625 |
| The percentage shown for each investment category in the Portfolio of Investments is based on net assets. |
| (1) | Security exempt from registration under Rule 144A of the Securities Act of 1933, as amended. These securities may be sold in certain transactions in reliance on an exemption from registration (normally to qualified institutional buyers). At August 31, 2024, the aggregate value of these securities is $3,275,442 or 10.2% of the Fund's net assets. |
| (2) | Non-income producing security. |
| (3) | May be deemed to be an affiliated investment company. The rate shown is the annualized seven-day yield as of August 31, 2024. |
| Abbreviations: |
| ADR | – American Depositary Receipt |
2
See Notes to Financial Statements.
Eaton Vance
Greater China Growth Fund
August 31, 2024
Statement of Assets and Liabilities
| | August 31, 2024 |
| Assets | |
| Unaffiliated investments, at value (identified cost $27,205,327) | $31,477,195 |
| Affiliated investments, at value (identified cost $707,855) | 707,855 |
| Cash | 50 |
| Dividends receivable | 1,336 |
| Dividends receivable from affiliated investments | 3,474 |
| Receivable for Fund shares sold | 78,597 |
| Receivable from affiliates | 12,377 |
| Trustees' deferred compensation plan | 11,390 |
| Total assets | $32,292,274 |
| Liabilities | |
| Payable for Fund shares redeemed | $87,848 |
| Payable to affiliates: | |
| Investment adviser fee | 20,757 |
| Administration fee | 4,170 |
| Distribution and service fees | 6,406 |
| Trustees' deferred compensation plan | 11,390 |
| Payable for custodian fee | 13,899 |
| Payable for transfer and dividend disbursing agent fees | 17,520 |
| Payable for legal and accounting services | 15,173 |
| Accrued expenses | 2,486 |
| Total liabilities | $179,649 |
| Net Assets | $32,112,625 |
| Sources of Net Assets | |
| Paid-in capital | $37,217,090 |
| Accumulated loss | (5,104,465) |
| Net Assets | $32,112,625 |
| Class A Shares | |
| Net Assets | $28,164,128 |
| Shares Outstanding | 2,218,726 |
Net Asset Value and Redemption Price Per Share
(net assets ÷ shares of beneficial interest outstanding) | $12.69 |
Maximum Offering Price Per Share
(100 ÷ 94.75 of net asset value per share) | $13.39 |
| Class C Shares | |
| Net Assets | $375,601 |
| Shares Outstanding | 33,171 |
Net Asset Value and Offering Price Per Share*
(net assets ÷ shares of beneficial interest outstanding) | $11.32 |
| Class I Shares | |
| Net Assets | $3,572,896 |
| Shares Outstanding | 276,344 |
Net Asset Value, Offering Price and Redemption Price Per Share
(net assets ÷ shares of beneficial interest outstanding) | $12.93 |
| On sales of $50,000 or more, the offering price of Class A shares is reduced. |
| * | Redemption price per share is equal to the net asset value less any applicable contingent deferred sales charge. |
3
See Notes to Financial Statements.
Eaton Vance
Greater China Growth Fund
August 31, 2024
| | Year Ended |
| | August 31, 2024 |
| Investment Income | |
| Dividend income (net of foreign taxes withheld of $69,571) | $1,382,629 |
| Dividend income from affiliated investments | 39,063 |
| Total investment income | $1,421,692 |
| Expenses | |
| Investment adviser fee | $282,907 |
| Administration fee | 56,581 |
| Distribution and service fees: | |
| Class A | 80,450 |
| Class C | 5,011 |
| Trustees’ fees and expenses | 2,753 |
| Custodian fee | 42,878 |
| Transfer and dividend disbursing agent fees | 88,610 |
| Legal and accounting services | 79,620 |
| Printing and postage | 4,976 |
| Registration fees | 58,480 |
| Interest expense and fees | 4,730 |
| Miscellaneous | 12,346 |
| Total expenses | $719,342 |
| Deduct: | |
| Waiver and/or reimbursement of expenses by affiliates | $158,612 |
| Total expense reductions | $158,612 |
| Net expenses | $560,730 |
| Net investment income | $860,962 |
| Realized and Unrealized Gain (Loss) | |
| Net realized gain (loss): | |
| Investment transactions | $(9,208,265) |
| Foreign currency transactions | (18,603) |
| Net realized loss | $(9,226,868) |
| Change in unrealized appreciation (depreciation): | |
| Investments | $2,858,319 |
| Foreign currency | (4) |
| Net change in unrealized appreciation (depreciation) | $2,858,315 |
| Net realized and unrealized loss | $(6,368,553) |
| Net decrease in net assets from operations | $(5,507,591) |
4
See Notes to Financial Statements.
Eaton Vance
Greater China Growth Fund
August 31, 2024
Statements of Changes in Net Assets
| | Year Ended August 31, |
| | 2024 | 2023 |
| Increase (Decrease) in Net Assets | | |
| From operations: | | |
| Net investment income | $860,962 | $295,817 |
| Net realized gain (loss) | (9,226,868) | 3,079,108 |
| Net change in unrealized appreciation (depreciation) | 2,858,315 | (10,432,841) |
| Net decrease in net assets from operations | $(5,507,591) | $(7,057,916) |
| Distributions to shareholders: | | |
| Class A | $(2,605,923) | $(2,918,441) |
| Class C | (46,435) | (54,815) |
| Class I | (401,940) | (440,721) |
| Total distributions to shareholders | $(3,054,298) | $(3,413,977) |
| Transactions in shares of beneficial interest: | | |
| Class A | $(5,456,536) | $(3,963,912) |
| Class C | (168,072) | (122,705) |
| Class I | (1,302,331) | (875,335) |
| Net decrease in net assets from Fund share transactions | $(6,926,939) | $(4,961,952) |
| Net decrease in net assets | $(15,488,828) | $(15,433,845) |
| Net Assets | | |
| At beginning of year | $47,601,453 | $63,035,298 |
| At end of year | $32,112,625 | $47,601,453 |
5
See Notes to Financial Statements.
Eaton Vance
Greater China Growth Fund
August 31, 2024
| | Class A |
| | Year Ended August 31, |
| | 2024 | 2023 | 2022 | 2021 | 2020 |
| Net asset value — Beginning of year | $15.80 | $18.88 | $26.87 | $27.28 | $23.20 |
| Income (Loss) From Operations | | | | | |
| Net investment income (loss)(1) | $0.32(2) | $0.09 | $0.03 | $(0.02) | $0.09 |
| Net realized and unrealized gain (loss) | (2.29) | (2.09) | (6.71) | 2.39 | 4.78 |
| Total income (loss) from operations | $(1.97) | $(2.00) | $(6.68) | $2.37 | $4.87 |
| Less Distributions | | | | | |
| From net investment income | $(0.03) | $— | $— | $(0.07) | $(0.07) |
| From net realized gain | (1.11) | (1.08) | (1.31) | (2.71) | (0.72) |
| Total distributions | $(1.14) | $(1.08) | $(1.31) | $(2.78) | $(0.79) |
| Net asset value — End of year | $12.69 | $15.80 | $18.88 | $26.87 | $27.28 |
| Total Return(3) | (12.81)% | (11.28)% | (26.08)% | 8.48% | 21.44% |
| Ratios/Supplemental Data | | | | | |
| Net assets, end of year (000’s omitted) | $28,164 | $40,926 | $53,597 | $84,359 | $85,096 |
| Ratios (as a percentage of average daily net assets):(4) | | | | | |
| Total expenses | 1.93%(5) | 1.68% | 1.60% | 1.73% | 1.80% |
| Net expenses | 1.51%(5)(6) | 1.50%(6) | 1.53%(6) | 1.73% | 1.80% |
| Net investment income (loss) | 2.33%(2) | 0.52% | 0.13% | (0.05)% | 0.36% |
| Portfolio Turnover | 77% | 34% | 78% | 10% | 9% |
| (1) | Computed using average shares outstanding. |
| (2) | Net investment income (loss) per share includes special dividends which amounted to $0.20 per share. Excluding special dividends, the ratio of net investment income (loss) to average daily net assets would have been 0.89%. |
| (3) | Returns are historical and are calculated by determining the percentage change in net asset value with all distributions reinvested and do not reflect the effect of sales charges. |
| (4) | Total expenses do not reflect amounts reimbursed and/or waived by the adviser and administrator and certain of its affiliates, if applicable. Net expenses are net of all reductions and represent the net expenses paid by the Fund. |
| (5) | Includes interest expense of 0.01% for the year ended August 31, 2024. |
| (6) | Includes a reduction by the investment adviser of a portion of its adviser fee due to the Fund’s investment in the Liquidity Fund (equal to less than 0.005% of average daily net assets for the years ended August 31, 2024, 2023 and 2022). |
6
See Notes to Financial Statements.
Eaton Vance
Greater China Growth Fund
August 31, 2024
Financial Highlights — continued
| | Class C |
| | Year Ended August 31, |
| | 2024 | 2023 | 2022 | 2021 | 2020 |
| Net asset value — Beginning of year | $14.30 | $17.32 | $24.93 | $25.35 | $21.69 |
| Income (Loss) From Operations | | | | | |
| Net investment income (loss)(1) | $0.16(2) | $(0.04) | $(0.13) | $(0.21) | $(0.11) |
| Net realized and unrealized gain (loss) | (2.03) | (1.90) | (6.17) | 2.23 | 4.49 |
| Total income (loss) from operations | $(1.87) | $(1.94) | $(6.30) | $2.02 | $4.38 |
| Less Distributions | | | | | |
| From net realized gain | $(1.11) | $(1.08) | $(1.31) | $(2.44) | $(0.72) |
| Total distributions | $(1.11) | $(1.08) | $(1.31) | $(2.44) | $(0.72) |
| Net asset value — End of year | $11.32 | $14.30 | $17.32 | $24.93 | $25.35 |
| Total Return(3) | (13.47)% | (11.98)% | (26.60)% | 7.74% | 20.59% |
| Ratios/Supplemental Data | | | | | |
| Net assets, end of year (000’s omitted) | $376 | $669 | $955 | $1,460 | $2,261 |
| Ratios (as a percentage of average daily net assets):(4) | | | | | |
| Total expenses | 2.68%(5) | 2.43% | 2.35% | 2.43% | 2.50% |
| Net expenses | 2.26%(5)(6) | 2.25%(6) | 2.28%(6) | 2.43% | 2.50% |
| Net investment income (loss) | 1.33%(2) | (0.26)% | (0.61)% | (0.77)% | (0.47)% |
| Portfolio Turnover | 77% | 34% | 78% | 10% | 9% |
| (1) | Computed using average shares outstanding. |
| (2) | Net investment income (loss) per share includes special dividends which amounted to $0.18 per share. Excluding special dividends, the ratio of net investment income (loss) to average daily net assets would have been (0.11)%. |
| (3) | Returns are historical and are calculated by determining the percentage change in net asset value with all distributions reinvested and do not reflect the effect of sales charges. |
| (4) | Total expenses do not reflect amounts reimbursed and/or waived by the adviser and administrator and certain of its affiliates, if applicable. Net expenses are net of all reductions and represent the net expenses paid by the Fund. |
| (5) | Includes interest expense of 0.01% for the year ended August 31, 2024. |
| (6) | Includes a reduction by the investment adviser of a portion of its adviser fee due to the Fund’s investment in the Liquidity Fund (equal to less than 0.005% of average daily net assets for the years ended August 31, 2024, 2023 and 2022). |
7
See Notes to Financial Statements.
Eaton Vance
Greater China Growth Fund
August 31, 2024
Financial Highlights — continued
| | Class I |
| | Year Ended August 31, |
| | 2024 | 2023 | 2022 | 2021 | 2020 |
| Net asset value — Beginning of year | $16.09 | $19.15 | $27.17 | $27.55 | $23.42 |
| Income (Loss) From Operations | | | | | |
| Net investment income(1) | $0.29(2) | $0.12 | $0.07 | $0.09 | $0.11 |
| Net realized and unrealized gain (loss) | (2.26) | (2.10) | (6.78) | 2.39 | 4.88 |
| Total income (loss) from operations | $(1.97) | $(1.98) | $(6.71) | $2.48 | $4.99 |
| Less Distributions | | | | | |
| From net investment income | $(0.08) | $— | $— | $(0.15) | $(0.14) |
| From net realized gain | (1.11) | (1.08) | (1.31) | (2.71) | (0.72) |
| Total distributions | $(1.19) | $(1.08) | $(1.31) | $(2.86) | $(0.86) |
| Net asset value — End of year | $12.93 | $16.09 | $19.15 | $27.17 | $27.55 |
| Total Return(3) | (12.59)% | (11.00)% | (25.89)% | 8.81% | 21.81% |
| Ratios/Supplemental Data | | | | | |
| Net assets, end of year (000’s omitted) | $3,573 | $6,006 | $8,483 | $24,472 | $17,646 |
| Ratios (as a percentage of average daily net assets):(4) | | | | | |
| Total expenses | 1.68%(5) | 1.43% | 1.35% | 1.43% | 1.50% |
| Net expenses | 1.26%(5)(6) | 1.25%(6) | 1.28%(6) | 1.43% | 1.50% |
| Net investment income | 2.11%(2) | 0.71% | 0.29% | 0.32% | 0.45% |
| Portfolio Turnover | 77% | 34% | 78% | 10% | 9% |
| (1) | Computed using average shares outstanding. |
| (2) | Net investment income per share includes special dividends which amounted to $0.20 per share. Excluding special dividends, the ratio of net investment income to average daily net assets would have been 0.67%. |
| (3) | Returns are historical and are calculated by determining the percentage change in net asset value with all distributions reinvested. |
| (4) | Total expenses do not reflect amounts reimbursed and/or waived by the adviser and administrator and certain of its affiliates, if applicable. Net expenses are net of all reductions and represent the net expenses paid by the Fund. |
| (5) | Includes interest expense of 0.01% for the year ended August 31, 2024. |
| (6) | Includes a reduction by the investment adviser of a portion of its adviser fee due to the Fund’s investment in the Liquidity Fund (equal to less than 0.005% of average daily net assets for the years ended August 31, 2024, 2023 and 2022). |
8
See Notes to Financial Statements.
Eaton Vance
Greater China Growth Fund
August 31, 2024
Notes to Financial Statements
1 Significant Accounting Policies
Eaton Vance Greater China Growth Fund (the Fund) is a non-diversified series of Eaton Vance Growth Trust (the Trust). The Trust is a Massachusetts business trust registered under the Investment Company Act of 1940, as amended (the 1940 Act), as an open-end management investment company. The Fund’s investment objective is to seek long-term capital appreciation. The Fund offers three classes of shares. Class A shares are generally sold subject to a sales charge imposed at time of purchase. Class C shares are sold at net asset value and are generally subject to a contingent deferred sales charge (see Note 5). Effective November 5, 2020, Class C shares automatically convert to Class A shares eight years after their purchase as described in the Fund’s prospectus. Class I shares are sold at net asset value and are not subject to a sales charge. Each class represents a pro rata interest in the Fund, but votes separately on class-specific matters and (as noted below) is subject to different expenses. Realized and unrealized gains and losses and net investment income and losses, other than class-specific expenses, are allocated daily to each class of shares based on the relative net assets of each class to the total net assets of the Fund. Each class of shares differs in its distribution plan and certain other class-specific expenses.
The following is a summary of significant accounting policies of the Fund. The policies are in conformity with accounting principles generally accepted in the United States of America (U.S. GAAP). The Fund is an investment company and follows accounting and reporting guidance in the Financial Accounting Standards Board (FASB) Accounting Standards Codification Topic 946.
A Investment Valuation—The following methodologies are used to determine the market value or fair value of investments.
Equity Securities. Equity securities listed on a U.S. securities exchange generally are valued at the last sale or closing price on the day of valuation or, if no sales took place on such date, at the mean between the closing bid and ask prices on the exchange where such securities are principally traded. Equity securities listed on the NASDAQ National Market System are valued at the NASDAQ official closing price. Unlisted or listed securities for which closing sales prices or closing quotations are not available are valued at the mean between the latest available bid and ask prices.
Foreign Securities and Currencies. Foreign securities and currencies are valued in U.S. dollars, based on foreign currency exchange rate quotations supplied by a third party pricing service. The pricing service uses a proprietary model to determine the exchange rate. Inputs to the model include reported trades and implied bid/ask spreads. The daily valuation of exchange-traded foreign securities generally is determined as of the close of trading on the principal exchange on which such securities trade. Events occurring after the close of trading on foreign exchanges may result in adjustments to the valuation of foreign securities to more accurately reflect their fair value as of the close of regular trading on the New York Stock Exchange. When valuing foreign equity securities that meet certain criteria, the Fund's Trustees have approved the use of a fair value service that values such securities to reflect market trading that occurs after the close of the applicable foreign markets of comparable securities or other instruments that have a strong correlation to the fair-valued securities.
Other. Investments in management investment companies (including money market funds) that do not trade on an exchange are valued at the net asset value as of the close of each business day.
Fair Valuation. In connection with Rule 2a-5 of the 1940 Act, the Trustees have designated the Fund’s investment adviser as its valuation designee. Investments for which valuations or market quotations are not readily available or are deemed unreliable are valued by the investment adviser, as valuation designee, at fair value using methods that most fairly reflect the security’s “fair value”, which is the amount that the Fund might reasonably expect to receive for the security upon its current sale in the ordinary course. Each such determination is based on a consideration of relevant factors, which are likely to vary from one pricing context to another. These factors may include, but are not limited to, the type of security, the existence of any contractual restrictions on the security’s disposition, the price and extent of public trading in similar securities of the issuer or of comparable companies or entities, quotations or relevant information obtained from broker/dealers or other market participants, information obtained from the issuer, analysts, and/or the appropriate stock exchange (for exchange-traded securities), an analysis of the company’s or entity’s financial statements, and an evaluation of the forces that influence the issuer and the market(s) in which the security is purchased and sold.
B Investment Transactions—Investment transactions for financial statement purposes are accounted for on a trade date basis. Realized gains and losses on investments sold are determined on the basis of identified cost.
C Income—Dividend income is recorded on the ex-dividend date for dividends received in cash and/or securities. However, if the ex-dividend date has passed, certain dividends from foreign securities are recorded as the Fund is informed of the ex-dividend date. Withholding taxes on foreign dividends and capital gains have been provided for in accordance with the Fund's understanding of the applicable countries’ tax rules and rates.
D Federal Taxes—The Fund’s policy is to comply with the provisions of the Internal Revenue Code applicable to regulated investment companies and to distribute to shareholders each year substantially all of its net investment income, and all or substantially all of its net realized capital gains. Accordingly, no provision for federal income or excise tax is necessary.
As of August 31, 2024, the Fund had no uncertain tax positions that would require financial statement recognition, de-recognition, or disclosure. The Fund files a U.S. federal income tax return annually after its fiscal year-end, which is subject to examination by the Internal Revenue Service for a period of three years from the date of filing.
E Expenses—The majority of expenses of the Trust are directly identifiable to an individual fund. Expenses which are not readily identifiable to a specific fund are allocated taking into consideration, among other things, the nature and type of expense and the relative size of the funds.
Eaton Vance
Greater China Growth Fund
August 31, 2024
Notes to Financial Statements — continued
F Foreign Currency Translation—Investment valuations, other assets, and liabilities initially expressed in foreign currencies are translated each business day into U.S. dollars based upon current exchange rates. Purchases and sales of foreign investment securities and income and expenses denominated in foreign currencies are translated into U.S. dollars based upon currency exchange rates in effect on the respective dates of such transactions. Recognized gains or losses on investment transactions attributable to changes in foreign currency exchange rates are recorded for financial statement purposes as net realized gains and losses on investments. That portion of unrealized gains and losses on investments that results from fluctuations in foreign currency exchange rates is not separately disclosed.
G Use of Estimates—The preparation of the financial statements in conformity with U.S. GAAP requires management to make estimates and assumptions that affect the reported amounts of assets and liabilities at the date of the financial statements and the reported amounts of income and expense during the reporting period. Actual results could differ from those estimates.
H Indemnifications—Under the Trust’s organizational documents, its officers and Trustees may be indemnified against certain liabilities and expenses arising out of the performance of their duties to the Fund. Under Massachusetts law, if certain conditions prevail, shareholders of a Massachusetts business trust (such as the Trust) could be deemed to have personal liability for the obligations of the Trust. However, the Trust’s Declaration of Trust contains an express disclaimer of liability on the part of Fund shareholders and the By-laws provide that the Trust shall assume, upon request by the shareholder, the defense on behalf of any Fund shareholders. Moreover, the By-laws also provide for indemnification out of Fund property of any shareholder held personally liable solely by reason of being or having been a shareholder for all loss or expense arising from such liability. Additionally, in the normal course of business, the Fund enters into agreements with service providers that may contain indemnification clauses. The Fund’s maximum exposure under these arrangements is unknown as this would involve future claims that may be made against the Fund that have not yet occurred.
2 Distributions to Shareholders and Income Tax Information
It is the present policy of the Fund to make at least one distribution annually (normally in December) of all or substantially all of its net investment income and to distribute annually all or substantially all of its net realized capital gains. Distributions to shareholders are recorded on the ex-dividend date. Distributions are declared separately for each class of shares. Shareholders may reinvest income and capital gain distributions in additional shares of the same class of the Fund at the net asset value as of the ex-dividend date or, at the election of the shareholder, receive distributions in cash. Distributions to shareholders are determined in accordance with income tax regulations, which may differ from U.S. GAAP. As required by U.S. GAAP, only distributions in excess of tax basis earnings and profits are reported in the financial statements as a return of capital. Permanent differences between book and tax accounting relating to distributions are reclassified to paid-in capital. For tax purposes, distributions from short-term capital gains are considered to be from ordinary income.
The tax character of distributions declared for the years ended August 31, 2024 and August 31, 2023 was as follows:
| | Year Ended August 31, |
| | 2024 | 2023 |
| Ordinary income | $86,037 | $ — |
| Long-term capital gains | $2,968,261 | $3,413,977 |
During the year ended August 31, 2024, accumulated loss was increased by $400,040 and paid-in capital was increased by $400,040 due to the Fund’s use of equalization accounting. Tax equalization accounting allows the Fund to treat as a distribution that portion of redemption proceeds representing a redeeming shareholder’s portion of undistributed taxable income and net capital gains. These reclassifications had no effect on the net assets or net asset value per share of the Fund.
As of August 31, 2024, the components of distributable earnings (accumulated loss) on a tax basis were as follows:
| Undistributed ordinary income | $ 526,692 |
| Post October capital losses | (9,699,196) |
| Net unrealized appreciation | 4,068,039 |
| Accumulated loss | $(5,104,465) |
At August 31, 2024, the Fund had a net capital loss of $9,699,196 attributable to security transactions incurred after October 31, 2023 that it has elected to defer. This net capital loss is treated as arising on the first day of the Fund’s taxable year ending August 31, 2025.
Eaton Vance
Greater China Growth Fund
August 31, 2024
Notes to Financial Statements — continued
The cost and unrealized appreciation (depreciation) of investments of the Fund at August 31, 2024, as determined on a federal income tax basis, were as follows:
| Aggregate cost | $28,116,991 |
| Gross unrealized appreciation | $8,659,163 |
| Gross unrealized depreciation | (4,591,104) |
| Net unrealized appreciation | $4,068,059 |
3 Investment Adviser Fee and Other Transactions with Affiliates
The investment adviser fee is earned by Boston Management and Research (BMR), an indirect, wholly-owned subsidiary of Morgan Stanley, as compensation for investment advisory services rendered to the Fund. The fee is computed at an annual rate as a percentage of average daily net assets as follows and is payable monthly:
| Average Daily Net Assets | Annual Fee Rate |
| Up to $500 million | 0.750% |
| $500 million but less than $1 billion | 0.700% |
| $1 billion but less than $1.5 billion | 0.675% |
| $1.5 billion but less than $2 billion | 0.675% |
| $2 billion but less than $3 billion | 0.660% |
| $3 billion and over | 0.580% |
For the year ended August 31, 2024, the investment adviser fee amounted to $282,907 or 0.75% of the Fund's average daily net assets. Pursuant to an investment sub-advisory agreement, BMR has delegated the investment management of the Fund to Morgan Stanley Investment Management Company (MSIM Company), a wholly-owned subsidiary of Morgan Stanley. MSIM Company uses the portfolio management, research and other resources of its affiliate, Morgan Stanley Asia Limited (MSAL), in rendering investment advisory services to the Fund. MSAL has entered into a Memorandum of Understanding with MSIM Company pursuant to which MSAL is considered a participating affiliate of the sub-adviser as that term is used in relief granted by the staff of the U.S. Securities and Exchange Commission allowing U.S. registered investment advisers to use portfolio management or research resources of unregistered advisory affiliates subject to the supervision of a U.S. registered adviser. BMR pays MSIM Company a portion of its investment adviser fee for sub-advisory services provided to the Fund. The Fund may invest in a money market fund, the Institutional Class of the Morgan Stanley Institutional Liquidity Funds - Government Portfolio (the “Liquidity Fund”), an open-end management investment company managed by Morgan Stanley Investment Management Inc., a wholly-owned subsidiary of Morgan Stanley. The investment adviser fee paid by the Fund is reduced by an amount equal to its pro rata share of the advisory and administration fees paid by the Fund due to its investment in the Liquidity Fund. For the year ended August 31, 2024, the investment adviser fee paid was reduced by $997 relating to the Fund’s investment in the Liquidity Fund.
The administration fee is earned by Eaton Vance Management (EVM), an affiliate of BMR and an indirect, wholly-owned subsidiary of Morgan Stanley, for administering the business affairs of the Fund and is computed at an annual rate of 0.15% of the Fund’s average daily net assets. For the year ended August 31, 2024, the administration fee amounted to $56,581.
EVM and MSIM Company have agreed to reimburse the Fund’s expenses to the extent that total annual operating expenses (relating to ordinary operating expenses only and excluding expenses such as brokerage commissions, acquired fund fees and expenses of unaffiliated funds, borrowing costs, taxes or litigation expenses) exceed 1.50%, 2.25% and 1.25% of the Fund’s average daily net assets for Class A, Class C and Class I, respectively. This agreement may be changed or terminated after January 1, 2025. Pursuant to this agreement, EVM and MSIM Company were allocated $157,615 in total of the Fund’s operating expenses for the year ended August 31, 2024.
EVM provides sub-transfer agency and related services to the Fund pursuant to a Sub-Transfer Agency Support Services Agreement. For the year ended August 31, 2024, EVM earned $26,734 from the Fund pursuant to such agreement, which is included in transfer and dividend disbursing agent fees on the Statement of Operations. The Fund was informed that Eaton Vance Distributors, Inc. (EVD), an affiliate of EVM and the Fund's principal underwriter, received $127 as its portion of the sales charge on sales of Class A shares for the year ended August 31, 2024. EVD also received distribution and service fees from Class A and Class C shares (see Note 4) and contingent deferred sales charges (see Note 5).
Eaton Vance
Greater China Growth Fund
August 31, 2024
Notes to Financial Statements — continued
Trustees and officers of the Fund who are members of EVM’s or BMR's organizations receive remuneration for their services to the Fund out of the investment adviser fee. Trustees of the Fund who are not affiliated with the investment adviser and administrator may elect to defer receipt of all or a percentage of their annual fees in accordance with the terms of the Trustees Deferred Compensation Plan. Certain officers and Trustees of the Fund are officers of the above organizations.
4 Distribution Plans
The Fund has in effect a distribution plan for Class A shares (Class A Plan) pursuant to Rule 12b-1 under the 1940 Act. Pursuant to the Class A Plan, the Fund pays EVD a distribution and service fee of 0.25% per annum of its average daily net assets attributable to Class A shares for distribution services and facilities provided to the Fund by EVD, as well as for personal services and/or the maintenance of shareholder accounts. Distribution and service fees paid or accrued to EVD for the year ended August 31, 2024 amounted to $80,450 for Class A shares.
The Fund also has in effect a distribution plan for Class C shares (Class C Plan) pursuant to Rule 12b-1 under the 1940 Act. Pursuant to the Class C Plan, the Fund pays EVD amounts equal to 0.75% per annum of its average daily net assets attributable to Class C shares for providing ongoing distribution services and facilities to the Fund. For the year ended August 31, 2024, the Fund paid or accrued to EVD $3,759 for Class C shares.
Pursuant to the Class C Plan, the Fund also makes payments of service fees to EVD, financial intermediaries and other persons in amounts equal to 0.25% per annum of its average daily net assets attributable to that class. Service fees paid or accrued are for personal services and/or the maintenance of shareholder accounts. They are separate and distinct from the sales commissions and distribution fees payable to EVD. Service fees paid or accrued for the year ended August 31, 2024 amounted to $1,252 for Class C shares.
Distribution and service fees are subject to the limitations contained in the Financial Industry Regulatory Authority Rule 2341(d).
5 Contingent Deferred Sales Charges
A contingent deferred sales charge (CDSC) of 1% generally is imposed on redemptions of Class C shares made within 12 months of purchase. Class A shares may be subject to a 1% CDSC if redeemed within 12 months of purchase (depending on the circumstances of purchase). Generally, the CDSC is based upon the lower of the net asset value at date of redemption or date of purchase. No charge is levied on shares acquired by reinvestment of dividends or capital gain distributions. For the year ended August 31, 2024, the Fund was informed that EVD received $35,434 and less than $100 of CDSCs paid by Class A and Class C shareholders, respectively.
6 Purchases and Sales of Investments
Purchases and sales of investments, other than short-term obligations, aggregated $28,251,692 and $38,127,725, respectively, for the year ended August 31, 2024.
7 Shares of Beneficial Interest
The Fund’s Declaration of Trust permits the Trustees to issue an unlimited number of full and fractional shares of beneficial interest (without par value). Such shares may be issued in a number of different series (such as the Fund) and classes. Transactions in Fund shares, including direct exchanges pursuant to share class conversions, were as follows:
| | Year Ended
August 31, 2024 | | Year Ended
August 31, 2023 |
| | Shares | Amount | | Shares | Amount |
| Class A | | | | | |
| Sales | 168,962 | $ 2,092,843 | | 56,693 | $ 1,020,036 |
| Issued to shareholders electing to receive payments of distributions in Fund shares | 171,002 | 2,276,037 | | 142,913 | 2,553,864 |
| Redemptions | (710,777) | (9,825,416) | | (448,364) | (7,537,812) |
| Net decrease | (370,813) | $(5,456,536) | | (248,758) | $(3,963,912) |
Eaton Vance
Greater China Growth Fund
August 31, 2024
Notes to Financial Statements — continued
| | Year Ended
August 31, 2024 | | Year Ended
August 31, 2023 |
| | Shares | Amount | | Shares | Amount |
| Class C | | | | | |
| Sales | 276 | $ 3,309 | | 1,307 | $ 21,767 |
| Issued to shareholders electing to receive payments of distributions in Fund shares | 3,889 | 46,435 | | 3,369 | 54,815 |
| Redemptions | (17,773) | (217,816) | | (13,062) | (199,287) |
| Net decrease | (13,608) | $ (168,072) | | (8,386) | $ (122,705) |
| Class I | | | | | |
| Sales | 1,870,158 | $24,265,028 | | 935,350 | $16,947,624 |
| Issued to shareholders electing to receive payments of distributions in Fund shares | 28,995 | 392,303 | | 23,738 | 431,078 |
| Redemptions | (1,996,180) | (25,959,662) | | (1,028,646) | (18,254,037) |
| Net decrease | (97,027) | $(1,302,331) | | (69,558) | $ (875,335) |
8 Line of Credit
The Fund participates with other portfolios and funds managed by EVM and its affiliates in a $650 million unsecured revolving line of credit agreement with a group of banks, which is in effect through October 22, 2024. In connection with the renewal of the agreement on October 24, 2023, the borrowing limit was decreased from $725 million. Borrowings are made by the Fund solely for temporary purposes related to redemptions and other short-term cash needs. Interest is charged to the Fund based on its borrowings at an amount above either the Secured Overnight Financing Rate (SOFR) or Federal Funds rate. In addition, a fee computed at an annual rate of 0.15% on the daily unused portion of the line of credit is allocated among the participating portfolios and funds at the end of each quarter. In connection with the renewal of the agreement in October 2023, an arrangement fee of $150,000 was incurred that was allocated to the participating portfolios and funds. Because the line of credit is not available exclusively to the Fund, it may be unable to borrow some or all of its requested amounts at any particular time. Average borrowings and the average annual interest rate (excluding fees) for the year ended August 31, 2024 were $74,278 and 6.37%, respectively.
9 Affiliated Investments
At August 31, 2024, the value of the Fund's investment in funds that may be deemed to be affiliated was $707,855, which represents 2.2% of the Fund's net assets. Transactions in such investments by the Fund for the year ended August 31, 2024 were as follows:
| Name | Value,
beginning
of period | Purchases | Sales
proceeds | Net realized
gain (loss) | Change in
unrealized
appreciation
(depreciation) | Value, end
of period | Dividend
income | Shares,
end of period |
| Short-Term Investments |
| Liquidity Fund | $148,573 | $34,274,467 | $(33,715,185) | $ — | $ — | $707,855 | $39,063 | 707,855 |
10 Fair Value Measurements
Under generally accepted accounting principles for fair value measurements, a three-tier hierarchy to prioritize the assumptions, referred to as inputs, is used in valuation techniques to measure fair value. The three-tier hierarchy of inputs is summarized in the three broad levels listed below.
| • | Level 1 – quoted prices in active markets for identical investments |
| • | Level 2 – other significant observable inputs (including quoted prices for similar investments, interest rates, prepayment speeds, credit risk, etc.) |
| • | Level 3 – significant unobservable inputs (including a fund's own assumptions in determining the fair value of investments) |
Eaton Vance
Greater China Growth Fund
August 31, 2024
Notes to Financial Statements — continued
In cases where the inputs used to measure fair value fall in different levels of the fair value hierarchy, the level disclosed is determined based on the lowest level input that is significant to the fair value measurement in its entirety. The inputs or methodology used for valuing securities are not necessarily an indication of the risk associated with investing in those securities.
At August 31, 2024, the hierarchy of inputs used in valuing the Fund's investments, which are carried at fair value, were as follows:
| Asset Description | Level 1 | Level 2 | Level 3 | Total |
| Common Stocks: | | | | |
| Communication Services | $ 314,715 | $ 8,929,726 | $ — | $ 9,244,441 |
| Consumer Discretionary | 2,365,218 | 6,825,477 | — | 9,190,695 |
| Consumer Staples | — | 1,509,215 | — | 1,509,215 |
| Energy | — | 590,934 | — | 590,934 |
| Financials | — | 6,100,049 | — | 6,100,049 |
| Health Care | — | 1,205,019 | — | 1,205,019 |
| Industrials | 259,638 | 2,270,865 | — | 2,530,503 |
| Information Technology | — | 481,219 | — | 481,219 |
| Real Estate | 625,120 | — | — | 625,120 |
| Total Common Stocks | $3,564,691 | $27,912,504* | $ — | $31,477,195 |
| Short-Term Investments | $ 707,855 | $ — | $ — | $ 707,855 |
| Total Investments | $4,272,546 | $ 27,912,504 | $ — | $32,185,050 |
| * | Includes foreign equity securities whose values were adjusted to reflect market trading of comparable securities or other correlated instruments that occurred after the close of trading in their applicable foreign markets. |
11 Risks and Uncertainties
Risks Associated with Foreign Investments
Foreign investments can be adversely affected by political, economic and market developments abroad, including the imposition of economic and other sanctions by the United States or another country, and by acts of terrorism and war. There may be less publicly available information about foreign issuers because they may not be subject to reporting practices, requirements or regulations comparable to those to which United States companies are subject. Foreign markets may be smaller, less liquid and more volatile than the major markets in the United States. Trading in foreign markets typically involves higher expense than trading in the United States. The Fund may have difficulties enforcing its legal or contractual rights in a foreign country. Securities that trade or are denominated in currencies other than the U.S. dollar may be adversely affected by fluctuations in currency exchange rates.
The securities markets in the China region, which includes Hong Kong, China and Taiwan, are impacted by the economies of countries in the region, which differ from the U.S. economy in various ways, such as structure, general development, government involvement, wealth distribution, interest rates, rate of growth of gross national product, rate of inflation, capital reinvestment, resource self-sufficiency and balance of payments position. As export-driven economies, the economies of countries in the China region are affected by developments in the economies and governmental actions of their principal trading partners, such as the imposition of trading restrictions and tariffs. China’s governmental actions and the actions of other governments can also have a significant effect on the economic conditions in the China region or a particular issuer or industry, which could adversely affect the value and liquidity of investments. A government may restrict investment in companies or industries considered important to national interests, intervene in the financial markets, maintain strict currency controls, or impose repatriation restrictions. Although larger and/or more established than many emerging markets, markets in the China region carry the high levels of risk associated with emerging markets.
Eaton Vance
Greater China Growth Fund
August 31, 2024
Report of Independent Registered Public Accounting Firm
To the Trustees of Eaton Vance Growth Trust and Shareholders of Eaton Vance Greater China Growth Fund:
Opinion on the Financial Statements and Financial Highlights
We have audited the accompanying statement of assets and liabilities of Eaton Vance Greater China Growth Fund (the “Fund”) (one of the funds constituting Eaton Vance Growth Trust), including the portfolio of investments, as of August 31, 2024, the related statement of operations for the year then ended, the statements of changes in net assets for each of the two years in the period then ended, the financial highlights for each of the five years in the period then ended, and the related notes. In our opinion, the financial statements and financial highlights present fairly, in all material respects, the financial position of the Fund as of August 31, 2024, and the results of its operations for the year then ended, the changes in its net assets for each of the two years in the period then ended, and the financial highlights for each of the five years in the period then ended, in conformity with accounting principles generally accepted in the United States of America.
Basis for Opinion
These financial statements and financial highlights are the responsibility of the Fund's management. Our responsibility is to express an opinion on the Fund's financial statements and financial highlights based on our audits. We are a public accounting firm registered with the Public Company Accounting Oversight Board (United States) (PCAOB) and are required to be independent with respect to the Fund in accordance with the U.S. federal securities laws and the applicable rules and regulations of the Securities and Exchange Commission and the PCAOB.
We conducted our audits in accordance with the standards of the PCAOB. Those standards require that we plan and perform the audit to obtain reasonable assurance about whether the financial statements and financial highlights are free of material misstatement, whether due to error or fraud. The Fund is not required to have, nor were we engaged to perform, an audit of its internal control over financial reporting. As part of our audits, we are required to obtain an understanding of internal control over financial reporting but not for the purpose of expressing an opinion on the effectiveness of the Fund’s internal control over financial reporting. Accordingly, we express no such opinion.
Our audits included performing procedures to assess the risks of material misstatement of the financial statements and financial highlights, whether due to error or fraud, and performing procedures that respond to those risks. Such procedures included examining, on a test basis, evidence regarding the amounts and disclosures in the financial statements and financial highlights. Our audits also included evaluating the accounting principles used and significant estimates made by management, as well as evaluating the overall presentation of the financial statements and financial highlights. Our procedures included confirmation of securities owned as of August 31, 2024, by correspondence with the custodian and brokers; when replies were not received from brokers, we performed other auditing procedures. We believe that our audits provide a reasonable basis for our opinion.
/s/ Deloitte & Touche LLP
Boston, Massachusetts
October 17, 2024
We have served as the auditor of one or more Eaton Vance investment companies since 1959.
Eaton Vance
Greater China Growth Fund
August 31, 2024
Federal Tax Information (Unaudited)
The Form 1099-DIV you receive in February 2025 will show the tax status of all distributions paid to your account in calendar year 2024. Shareholders are advised to consult their own tax adviser with respect to the tax consequences of their investment in the Fund. As required by the Internal Revenue Code and/or regulations, shareholders must be notified regarding the status of qualified dividend income for individuals, the dividends received deduction for corporations, the foreign tax credit and capital gains dividends.
Qualified Dividend Income. For the fiscal year ended August 31, 2024, the Fund designates approximately $645,531, or up to the maximum amount of such dividends allowable pursuant to the Internal Revenue Code, as qualified dividend income eligible for the reduced tax rate of 15%.
Dividends Received Deduction. Corporate shareholders are generally entitled to take the dividends received deduction on the portion of the Fund’s dividend distribution that qualifies under tax law. For the Fund’s fiscal 2024 ordinary income dividends, 5.76% qualifies for the corporate dividends received deduction.
Foreign Tax Credit. For the fiscal year ended August 31, 2024, the Fund paid foreign taxes of $62,772 and recognized foreign source income of $1,427,303.
Capital Gains Dividends. The Fund hereby designates as a capital gain dividend with respect to the taxable year ended August 31, 2024, $610,213
or, if subsequently determined to be different, the net capital gain of such year.
Eaton Vance
Greater China Growth Fund
August 31, 2024
Board of Trustees’ Contract Approval
Overview of the Contract Review Process
The Investment Company Act of 1940, as amended (the “1940 Act”), provides, in substance, that the investment advisory agreement between a fund and its investment adviser will continue in effect from year-to-year only if its continuation is approved on an annual basis by a vote of the fund’s board of trustees, including a majority of the trustees who are not “interested persons” of the fund (“independent trustees”), cast in person at a meeting called for the purpose of considering such approval.
At a meeting held on June 6, 2024, the Boards of Trustees/Directors (collectively, the “Board”) that oversee the registered investment companies advised by Eaton Vance Management or its affiliate, Boston Management and Research (the “Eaton Vance Funds”), including a majority of the independent trustees (the “Independent Trustees”), voted to approve the continuation of existing investment advisory agreements and sub-advisory agreements1 for each of the Eaton Vance Funds for an additional one-year period. The Board relied upon the affirmative recommendation of its Contract Review Committee, which is a committee comprised of all of the Independent Trustees. Prior to making its recommendation, the Contract Review Committee reviewed information furnished by the adviser and sub-adviser to each of the Eaton Vance Funds (including information specifically requested by the Board) for a series of meetings held between April and June 2024, as well as certain additional information provided in response to specific requests from the Independent Trustees as members of the Contract Review Committee. Members of the Contract Review Committee also considered information received at prior meetings of the Board and its committees, to the extent such information was relevant to the Contract Review Committee’s annual evaluation of the investment advisory agreements and sub-advisory agreements.
In connection with its evaluation of the investment advisory agreements and sub-advisory agreements, the Board considered various information relating to the Eaton Vance Funds. This included information applicable to all or groups of Eaton Vance Funds, which is referenced immediately below, and information applicable to the particular Eaton Vance Fund covered by this report (each “Eaton Vance Fund” is referred to below as a “fund”). (For funds that invest through one or more underlying portfolios, references to “each fund” in this section may include information that was considered at the portfolio-level.)
Information about Fees, Performance and Expenses
• A report from an independent data provider comparing advisory and other fees paid by each fund to such fees paid by comparable funds, as identified by the independent data provider (“comparable funds”);
• A report from an independent data provider comparing each fund’s total expense ratio (and its components) to those of comparable funds;
• A report from an independent data provider comparing the investment performance of each fund (including, as relevant, total return data, income data, Sharpe ratios, and information ratios) to the investment performance of comparable funds and, as applicable, benchmark indices, over various time periods;
• In certain instances, data regarding investment performance relative to customized groups of peer funds and blended indices identified by the adviser in consultation with the Portfolio Management Committee of the Board (a committee exclusively comprised of Independent Trustees);
• Comparative information concerning the fees charged and services provided by the adviser and sub-adviser to each fund in managing other accounts (which may include other funds, collective investment trusts and institutional accounts) with the same or substantially similar investment objective as the fund and with a significant overlap in holdings based on criteria set by the Board, if any;
• Profitability analyses with respect to the adviser and sub-adviser to each of the funds;
Information about Portfolio Management and Trading
• Descriptions of the investment management services provided to each fund, as well as each of the funds’ investment strategies and policies;
• The procedures and processes used by the adviser to determine the value of fund assets, including, when necessary, the determination of “fair value” by the adviser in its role as each funds’ valuation designee and actions taken to monitor and test the effectiveness of such procedures and processes;
• Information about the policies and practices of each fund’s adviser and sub-adviser with respect to trading, including their processes for seeking best execution of portfolio transactions;
• Information about the allocation of brokerage transactions and the benefits, if any, received by the adviser and sub-adviser to each fund as a result of brokerage allocation, including, as applicable, information concerning the acquisition of research through client commission arrangements and policies with respect to “soft dollars”;
• Data relating to the portfolio turnover rate of each fund and related information regarding active management in the context of particular strategies;
Information about each Adviser and Sub-adviser
• Reports detailing the financial results and condition of the adviser and sub-adviser to each fund;
1 Not all Eaton Vance Funds have entered into a sub-advisory agreement with a sub-adviser. Accordingly, references to “sub-adviser” or “sub-advisory agreement” in this “Overview” section may not be applicable to the particular Eaton Vance Fund covered by this report. Eaton Vance Management and Boston Management and Research are referred to collectively as the “adviser.”
Eaton Vance
Greater China Growth Fund
August 31, 2024
Board of Trustees’ Contract Approval — continued
• Information regarding the individual investment professionals whose responsibilities include portfolio management and investment research for the funds, and, for portfolio managers and certain other investment professionals, information relating to their responsibilities with respect to managing other funds and investment accounts, as applicable;
• Information regarding the adviser’s and its parent company’s (Morgan Stanley’s) efforts to retain and attract talented investment professionals, including in the context of a competitive marketplace for talent;
• Information regarding the adviser’s compensation methodology for its investment professionals and the incentives and accountability it creates, along with investment professionals’ investments in the fund(s) they manage;
• The personal trading codes of ethics of the adviser and its affiliates and the sub-adviser of each fund, together with information relating to compliance with, and the administration of, such codes;
• Policies and procedures relating to proxy voting, including regular reporting with respect to fund proxy voting activities;
• Information regarding the handling of corporate actions and class actions, as well as information regarding litigation and other regulatory matters;
• Information concerning the resources devoted to compliance efforts undertaken by the adviser and its affiliates and the sub-adviser of each fund, including descriptions of their various compliance programs and their record of compliance and remediation;
• Information concerning the business continuity and disaster recovery plans of the adviser and its affiliates and the sub-adviser of each fund;
• A description of the adviser’s oversight of sub-advisers, including with respect to regulatory and compliance issues, investment management and other matters;
Other Relevant Information
• Information regarding ongoing initiatives to further integrate and harmonize, where applicable, the investment management and other departments of the adviser and its affiliates with the overall investment management infrastructure of Morgan Stanley, in light of Morgan Stanley’s acquisition of Eaton Vance Corp. on March 1, 2021;
• Information concerning the nature, cost, and character of the administrative and other non-investment advisory services provided by the adviser and its affiliates;
• Information concerning oversight of the relationship with the custodian, subcustodians, fund accountants, and other third-party service providers by the adviser and/or administrator to each of the funds;
• Information concerning efforts to implement policies and procedures with respect to various regulations applicable to the funds, including Rule 12d1-4 (the Fund-of-Funds Rule), Rule 18f-4 (the Derivatives Rule), and Rule 2a-5 (the Fair Valuation Rule);
• For an Eaton Vance Fund structured as an exchange-listed closed-end fund, information concerning the benefits of the closed-end fund structure, as well as, where relevant, the closed-end fund’s market prices (including as compared to the closed-end fund’s net asset value (NAV)), trading volume data, continued use of auction preferred shares (where applicable), distribution rates, and other relevant matters;
• The risks that the adviser and/or its affiliates incur in connection with the management and operation of the funds, including, among others, litigation, regulatory, entrepreneurial, and other business risks (and the associated costs of such risks); and
• The terms of each investment advisory agreement and sub-advisory agreement.
During the various meetings of the Board and its committees over the course of the year leading up to the June 6, 2024 meeting, the Board and its committees received information from portfolio managers and other investment professionals of the adviser and sub-advisers of the funds regarding investment and performance matters, and considered various investment and trading strategies used in pursuing the funds’ investment objectives. The Board and its committees also received information regarding risk management techniques employed in connection with the management of the funds. The Board and its committees evaluated issues pertaining to industry and regulatory developments, compliance procedures, fund governance, and other issues with respect to the funds, and received and participated in reports and presentations provided by the adviser and sub-advisers, with respect to such matters. In addition to the formal meetings of the Board and its committees, the Independent Trustees held regular video or telephone conferences to discuss, among other topics, matters relating to the continuation of investment advisory agreements and sub-advisory agreements.
The Contract Review Committee was advised throughout the contract review process by Kirkland & Ellis LLP, independent legal counsel for the Independent Trustees. The members of the Contract Review Committee, with the advice of such counsel, exercised their own business judgment in determining the material factors to be considered in evaluating each investment advisory agreement and sub-advisory agreement and the weight to be given to each such factor. The conclusions reached with respect to each investment advisory agreement and sub-advisory agreement were based on a comprehensive evaluation of all the information provided and not any single factor. Moreover, each member of the Contract Review Committee may have placed varying emphasis on particular factors in reaching conclusions with respect to each investment advisory agreement and sub-advisory agreement. In evaluating each investment advisory agreement and sub-advisory agreement, including the fee structures and other terms contained in such agreements, the members of the Contract Review Committee were also informed by multiple years of analysis and discussion with the adviser and sub-adviser to each of the Eaton Vance Funds.
Results of the Contract Review Process
Based on its consideration of the foregoing, and such other information it deemed relevant, including the factors and conclusions described below, the Contract Review Committee concluded that the continuation of the investment advisory agreement between Eaton Vance Greater China Growth Fund (the “Fund”) and Boston Management and Research (the “Adviser”) and the sub-advisory agreement between the Adviser and Morgan Stanley Investment
Eaton Vance
Greater China Growth Fund
August 31, 2024
Board of Trustees’ Contract Approval — continued
Management Company (the “Sub-adviser”), an affiliate of the Adviser, with respect to the Fund, including their respective fee structures, are in the interests of shareholders and, therefore, recommended to the Board approval of each agreement. Based on the recommendation of the Contract Review Committee, the Board, including a majority of the Independent Trustees, voted to approve continuation of the investment advisory agreement and the sub-advisory agreement for the Fund.
Nature, Extent and Quality of Services
In considering whether to approve the investment advisory agreement and the sub-advisory agreement for the Fund, the Board evaluated the nature, extent and quality of services provided to the Fund by the Adviser and the Sub-adviser.
The Board considered the Adviser’s and the Sub-adviser’s management capabilities and investment processes in light of the types of investments held by the Fund, including the education and experience of the investment professionals who provide services to the Fund. Regarding the Adviser, the Board considered the Adviser’s responsibilities with respect to oversight of the Sub-adviser. With respect to the Sub-adviser, the Board took into account the resources available to the Sub-adviser in fulfilling its duties under the sub-advisory agreement and the Sub-adviser’s experience in managing equity portfolios. The Board also took into account the resources dedicated to portfolio management and other services, the compensation methods of the Adviser and other factors, including the reputation and resources of the Adviser to recruit and retain highly qualified research, advisory and supervisory investment professionals. In addition, the Board considered the time and attention devoted to the Eaton Vance Funds, including the Fund, by senior management, as well as the infrastructure, operational capabilities and support staff in place to assist in the portfolio management and operations of the Fund, including the provision of administrative services. The Board also considered the business-related and other risks to which the Adviser or its affiliates may be subject in managing the Fund.
The Board considered the compliance programs of the Adviser and relevant affiliates thereof, including the Sub-adviser. The Board considered compliance and reporting matters regarding, among other things, personal trading by investment professionals, disclosure of portfolio holdings, compliance with policies and procedures, portfolio valuation, business continuity and the allocation of investment opportunities. The Board also considered relevant examinations of the Adviser and its affiliates by regulatory authorities, such as the Securities and Exchange Commission and the Financial Industry Regulatory Authority.
The Board considered other administrative services provided or overseen by Eaton Vance Management and its affiliates, including transfer agency and accounting services. The Board evaluated the benefits to shareholders of investing in a fund that is a part of a large fund complex offering exposure to a variety of asset classes and investment disciplines, as well as the ability, in many cases, to exchange an investment among different funds without incurring additional sales charges.
After consideration of the foregoing factors, among others, the Board concluded that the nature, extent and quality of services provided by the Adviser and the Sub-adviser, taken as a whole, are appropriate and consistent with the terms of the investment advisory agreement and the sub-advisory agreement.
Fund Performance
The Board compared the Fund’s investment performance to that of comparable funds identified by an independent data provider (the peer group), as well as an appropriate benchmark index. The Board’s review included comparative performance data with respect to the Fund for the one-, three-, five- and ten-year periods ended December 31, 2023. In this regard, the Board noted that the performance of the Fund was higher than the median performance of the Fund’s peer group for the three-year period. The Board also noted that the performance of the Fund was higher than its benchmark index for the three-year period. The Board concluded that the performance of the Fund was satisfactory.
Management Fees and Expenses
The Board considered contractual fee rates payable by the Fund for advisory and administrative services (referred to collectively as “management fees”). As part of its review, the Board considered the Fund’s management fees and total expense ratio for the one-year period ended December 31, 2023, as compared to those of comparable funds, before and after giving effect to any undertaking to waive fees or reimburse expenses. The Board also considered factors that had an impact on the Fund’s total expense ratio relative to comparable funds.
After considering the foregoing information, and in light of the nature, extent and quality of the services provided by the Adviser and the Sub-adviser, the Board concluded that the management fees charged for advisory and related services are reasonable.
Profitability and “Fall-Out” Benefits
The Board considered the level of profits realized by the Adviser and relevant affiliates thereof, including the Sub-adviser, in providing investment advisory and administrative services to the Fund and to all Eaton Vance Funds as a group. The Board considered the level of profits realized without regard to marketing support or other payments by the Adviser and its affiliates to third parties in respect of distribution or other services.
The Board concluded that, in light of the foregoing factors and the nature, extent and quality of the services rendered, the profits realized by the Adviser and its affiliates, including the Sub-adviser, are not excessive.
Eaton Vance
Greater China Growth Fund
August 31, 2024
Board of Trustees’ Contract Approval — continued
The Board also considered direct or indirect fall-out benefits received by the Adviser and its affiliates, including the Sub-adviser, in connection with their respective relationships with the Fund, including the benefits of research services that may be available to the Adviser or the Sub-adviser as a result of securities transactions effected for the Fund and other investment advisory clients.
Economies of Scale
In reviewing management fees and profitability, the Board also considered the extent to which the Adviser and its affiliates, on the one hand, and the Fund, on the other hand, can expect to realize benefits from economies of scale as the assets of the Fund increase. The Board acknowledged the difficulty in accurately measuring the benefits resulting from economies of scale, if any, with respect to the management of any specific fund or group of funds. To assist in the evaluation of the sharing of any economies of scale, the Board received data showing for recent years, asset levels, Adviser profitability and total expense ratios. Based upon the foregoing, the Board concluded that the Fund currently shares in the benefits from economies of scale, if any, when they are realized by the Adviser. The Board also concluded that the structure of the advisory fee, which includes breakpoints at several asset levels, will allow the Fund to continue to benefit from any economies of scale in the future.
Eaton Vance
Worldwide Health Sciences Fund
Annual Financial Statements and Additional Information
August 31, 2024
This report must be preceded or accompanied by a current summary prospectus or prospectus. Before investing, investors should consider carefully the investment objective, risks, and charges and expenses of a mutual fund. This and other important information is contained in the prospectus and/or statement of additional information, which can be obtained by calling 1-800-262-1122 or from a financial intermediary. Prospective investors should read the prospectus carefully before investing.
Annual Financial Statements and Additional Information August 31, 2024
Eaton Vance
Worldwide Health Sciences Fund
Eaton Vance
Worldwide Health Sciences Fund
August 31, 2024
| Security | Shares | Value |
| Biotechnology — 12.1% |
| AbbVie, Inc. | | 297,922 | $ 58,485,068 |
| argenx SE ADR(1) | | 27,268 | 14,106,282 |
| CSL Ltd. | | 115,187 | 23,921,397 |
| Neurocrine Biosciences, Inc.(1) | | 84,879 | 10,784,726 |
| Vertex Pharmaceuticals, Inc.(1) | | 56,083 | 27,810,999 |
| | | | $ 135,108,472 |
| Health Care Distributors — 2.5% |
| Amplifon SpA | | 246,195 | $ 7,961,229 |
| McKesson Corp. | | 35,677 | 20,017,651 |
| | | | $ 27,978,880 |
| Health Care Equipment — 11.5% |
| Boston Scientific Corp.(1) | | 408,534 | $ 33,413,996 |
| IDEXX Laboratories, Inc.(1) | | 25,907 | 12,469,816 |
| Intuitive Surgical, Inc.(1) | | 83,609 | 41,188,302 |
| Straumann Holding AG | | 48,874 | 7,241,539 |
| Stryker Corp. | | 69,288 | 24,972,781 |
| Teleflex, Inc. | | 36,499 | 8,948,460 |
| | | | $ 128,234,894 |
| Health Care Services — 0.5% |
| Option Care Health, Inc.(1) | | 178,995 | $ 5,731,420 |
| | | | $ 5,731,420 |
| Health Care Supplies — 5.3% |
| Alcon, Inc. | | 179,682 | $ 17,507,759 |
| Asahi Intecc Co. Ltd. | | 255,800 | 4,699,547 |
| Coloplast AS, Class B | | 81,388 | 11,081,460 |
| Cooper Cos., Inc.(1) | | 172,754 | 18,265,281 |
| Neogen Corp.(1) | | 420,833 | 7,259,369 |
| | | | $ 58,813,416 |
| Health Care Technology — 0.9% |
| JMDC, Inc. | | 83,700 | $ 2,528,276 |
| Waystar Holding Corp.(1) | | 246,999 | 6,723,313 |
| | | | $ 9,251,589 |
| Life Sciences Tools & Services — 11.3% |
| Danaher Corp. | | 157,718 | $ 42,475,034 |
| Lonza Group AG | | 22,692 | 14,926,847 |
| Mettler-Toledo International, Inc.(1) | | 8,857 | 12,745,931 |
| Security | Shares | Value |
| Life Sciences Tools & Services (continued) |
| Sartorius AG, PFC Shares | | 21,871 | $ 6,042,912 |
| Thermo Fisher Scientific, Inc. | | 81,139 | 49,906,165 |
| | | | $ 126,096,889 |
| Managed Health Care — 10.5% |
| Centene Corp.(1) | | 164,203 | $ 12,944,122 |
| Humana, Inc. | | 55,766 | 19,767,374 |
| UnitedHealth Group, Inc. | | 143,518 | 84,704,324 |
| | | | $ 117,415,820 |
| Metal, Glass & Plastic Containers — 0.6% |
| AptarGroup, Inc. | | 44,675 | $ 6,843,763 |
| | | | $ 6,843,763 |
| Pharmaceuticals — 42.3% |
| AstraZeneca PLC | | 317,368 | $ 55,623,634 |
| Bristol-Myers Squibb Co. | | 492,929 | 24,621,803 |
| Eli Lilly & Co. | | 124,891 | 119,897,858 |
| Johnson & Johnson | | 225,695 | 37,433,773 |
| Merck & Co., Inc. | | 189,441 | 22,439,286 |
| Novo Nordisk AS, Class B | | 565,583 | 78,565,216 |
| Pfizer, Inc. | | 359,209 | 10,420,653 |
| Roche Holding AG PC | | 123,574 | 41,832,349 |
| Royalty Pharma PLC, Class A | | 320,270 | 9,297,438 |
| Sanofi SA | | 328,219 | 36,838,673 |
| Zoetis, Inc. | | 191,881 | 35,208,245 |
| | | | $ 472,178,928 |
Total Common Stocks
(identified cost $535,495,888) | | | $1,087,654,071 |
| Convertible Preferred Stocks — 0.0%(2) |
| Security | Shares | Value |
| Biotechnology — 0.0%(2) |
| Caris Life Sciences, Inc., Series D(1)(3)(4) | | 370,370 | $ 459,259 |
Total Convertible Preferred Stocks
(identified cost $3,000,000) | | | $ 459,259 |
1
See Notes to Financial Statements.
Eaton Vance
Worldwide Health Sciences Fund
August 31, 2024
Portfolio of Investments — continued
| Exchange-Traded Funds — 2.2% |
| Security | Shares | Value |
| Equity Funds — 2.2% |
| iShares Global Healthcare ETF | | 77,212 | $ 7,817,715 |
| SPDR S&P Biotech ETF(5) | | 165,025 | 16,710,431 |
Total Exchange-Traded Funds
(identified cost $19,109,661) | | | $ 24,528,146 |
| Short-Term Investments — 0.3% |
| Affiliated Fund — 0.1% |
| Security | Shares | Value |
| Morgan Stanley Institutional Liquidity Funds - Government Portfolio, Institutional Class, 5.19%(6) | | 1,285,435 | $ 1,285,435 |
Total Affiliated Fund
(identified cost $1,285,435) | | | $ 1,285,435 |
| Securities Lending Collateral — 0.2% |
| Security | Shares | Value |
| State Street Navigator Securities Lending Government Money Market Portfolio, 5.29%(7) | | 1,707,122 | $ 1,707,122 |
Total Securities Lending Collateral
(identified cost $1,707,122) | | | $ 1,707,122 |
Total Short-Term Investments
(identified cost $2,992,557) | | | $ 2,992,557 |
Total Investments — 100.0%
(identified cost $560,598,106) | | | $1,115,634,033 |
| Other Assets, Less Liabilities — 0.0%(2) | | | $ 124,966 |
| Net Assets — 100.0% | | | $1,115,758,999 |
| The percentage shown for each investment category in the Portfolio of Investments is based on net assets. |
| (1) | Non-income producing security. |
| (2) | Amount is less than 0.05%. |
| (3) | For fair value measurement disclosure purposes, security is categorized as Level 3 (see Note 12). |
| (4) | Restricted security (see Note 8). |
| (5) | All or a portion of this security was on loan at August 31, 2024. The aggregate market value of securities on loan at August 31, 2024 was $1,678,283. |
| (6) | May be deemed to be an affiliated investment company. The rate shown is the annualized seven-day yield as of August 31, 2024. |
| (7) | Represents investment of cash collateral received in connection with securities lending. |
| Country Concentration of Portfolio |
| Country | Percentage
of Net Assets | Value |
| United States | 79.6% | $888,328,945 |
| Denmark | 8.0 | 89,646,676 |
| United Kingdom | 5.0 | 55,623,634 |
| Switzerland | 2.0 | 22,168,386 |
| Netherlands | 1.3 | 14,106,282 |
| Italy | 0.7 | 7,961,229 |
| Japan | 0.7 | 7,227,823 |
| Germany | 0.5 | 6,042,912 |
| Exchange-Traded Funds | 2.2 | 24,528,146 |
| Total Investments | 100.0% | $1,115,634,033 |
| Abbreviations: |
| ADR | – American Depositary Receipt |
| PC | – Participation Certificate |
| PFC Shares | – Preference Shares |
2
See Notes to Financial Statements.
Eaton Vance
Worldwide Health Sciences Fund
August 31, 2024
Statement of Assets and Liabilities
| | August 31, 2024 |
| Assets | |
| Unaffiliated investments, at value (identified cost $559,312,671) — including $1,678,283 of securities on loan | $1,114,348,598 |
| Affiliated investments, at value (identified cost $1,285,435) | 1,285,435 |
| Dividends receivable | 1,148,133 |
| Dividends receivable from affiliated investments | 3,381 |
| Receivable for Fund shares sold | 538,378 |
| Securities lending income receivable | 10,789 |
| Tax reclaims receivable | 2,165,372 |
| Receivable from affiliates | 33,866 |
| Trustees' deferred compensation plan | 79,841 |
| Total assets | $1,119,613,793 |
| Liabilities | |
| Collateral for securities loaned | $1,707,122 |
| Payable for Fund shares redeemed | 736,799 |
| Payable to affiliates: | |
| Investment adviser fee | 611,510 |
| Administration fee | 137,446 |
| Distribution and service fees | 208,842 |
| Trustees' deferred compensation plan | 79,841 |
| Accrued expenses | 373,234 |
| Total liabilities | $3,854,794 |
| Net Assets | $1,115,758,999 |
| Sources of Net Assets | |
| Paid-in capital | $540,501,400 |
| Distributable earnings | 575,257,599 |
| Net Assets | $1,115,758,999 |
| Class A Shares | |
| Net Assets | $777,744,399 |
| Shares Outstanding | 49,673,030 |
Net Asset Value and Redemption Price Per Share
(net assets ÷ shares of beneficial interest outstanding) | $15.66 |
Maximum Offering Price Per Share
(100 ÷ 94.75 of net asset value per share) | $16.53 |
| Class C Shares | |
| Net Assets | $26,079,267 |
| Shares Outstanding | 1,660,947 |
Net Asset Value and Offering Price Per Share*
(net assets ÷ shares of beneficial interest outstanding) | $15.70 |
| Class I Shares | |
| Net Assets | $245,069,962 |
| Shares Outstanding | 15,098,148 |
Net Asset Value, Offering Price and Redemption Price Per Share
(net assets ÷ shares of beneficial interest outstanding) | $16.23 |
3
See Notes to Financial Statements.
Eaton Vance
Worldwide Health Sciences Fund
August 31, 2024
Statement of Assets and Liabilities — continued
| | August 31, 2024 |
| Class R Shares | |
| Net Assets | $66,865,371 |
| Shares Outstanding | 3,921,037 |
Net Asset Value, Offering Price and Redemption Price Per Share
(net assets ÷ shares of beneficial interest outstanding) | $17.05 |
| On sales of $50,000 or more, the offering price of Class A shares is reduced. |
| * | Redemption price per share is equal to the net asset value less any applicable contingent deferred sales charge. |
4
See Notes to Financial Statements.
Eaton Vance
Worldwide Health Sciences Fund
August 31, 2024
| | Year Ended |
| | August 31, 2024 |
| Investment Income | |
| Dividend income (net of foreign taxes withheld of $607,892) | $13,605,100 |
| Dividend income from affiliated investments | 105,879 |
| Securities lending income, net | 137,379 |
| Total investment income | $13,848,358 |
| Expenses | |
| Investment adviser fee | $6,480,331 |
| Administration fee | 1,508,930 |
| Distribution and service fees: | |
| Class A | 1,770,085 |
| Class C | 258,276 |
| Class R | 304,584 |
| Trustees’ fees and expenses | 63,732 |
| Custodian fee | 265,626 |
| Transfer and dividend disbursing agent fees | 837,852 |
| Legal and accounting services | 141,306 |
| Printing and postage | 69,238 |
| Registration fees | 69,980 |
| Miscellaneous | 66,402 |
| Total expenses | $11,836,342 |
| Deduct: | |
| Waiver and/or reimbursement of expenses by affiliates | $304,887 |
| Total expense reductions | $304,887 |
| Net expenses | $11,531,455 |
| Net investment income | $2,316,903 |
| Realized and Unrealized Gain (Loss) | |
| Net realized gain (loss): | |
| Investment transactions | $35,032,377 |
| Foreign currency transactions | (25,692) |
| Net realized gain | $35,006,685 |
| Change in unrealized appreciation (depreciation): | |
| Investments | $168,477,371 |
| Foreign currency | 88,330 |
| Net change in unrealized appreciation (depreciation) | $168,565,701 |
| Net realized and unrealized gain | $203,572,386 |
| Net increase in net assets from operations | $205,889,289 |
5
See Notes to Financial Statements.
Eaton Vance
Worldwide Health Sciences Fund
August 31, 2024
Statements of Changes in Net Assets
| | Year Ended August 31, |
| | 2024 | 2023 |
| Increase (Decrease) in Net Assets | | |
| From operations: | | |
| Net investment income | $2,316,903 | $2,918,279 |
| Net realized gain | 35,006,685 | 28,720,837 |
| Net change in unrealized appreciation (depreciation) | 168,565,701 | 67,292,213 |
| Net increase in net assets from operations | $205,889,289 | $98,931,329 |
| Distributions to shareholders: | | |
| Class A | $(16,988,889) | $(31,184,360) |
| Class C | (607,410) | (1,571,533) |
| Class I | (5,264,238) | (9,520,729) |
| Class R | (1,256,108) | (2,378,115) |
| Total distributions to shareholders | $(24,116,645) | $(44,654,737) |
| Transactions in shares of beneficial interest: | | |
| Class A | $(58,279,425) | $(33,637,575) |
| Class C | (7,232,554) | (12,057,321) |
| Class I | 2,394,549 | (17,229,141) |
| Class R | (6,842,408) | 325,762 |
| Net decrease in net assets from Fund share transactions | $(69,959,838) | $(62,598,275) |
| Net increase (decrease) in net assets | $111,812,806 | $(8,321,683) |
| Net Assets | | |
| At beginning of year | $1,003,946,193 | $1,012,267,876 |
| At end of year | $1,115,758,999 | $1,003,946,193 |
6
See Notes to Financial Statements.
Eaton Vance
Worldwide Health Sciences Fund
August 31, 2024
| | Class A |
| | Year Ended August 31, |
| | 2024 | 2023 | 2022 | 2021 | 2020 |
| Net asset value — Beginning of year | $13.15 | $12.45 | $15.26 | $13.38 | $11.61 |
| Income (Loss) From Operations | | | | | |
| Net investment income(1) | $0.03 | $0.04 | $0.03 | $0.04 | $0.06 |
| Net realized and unrealized gain (loss) | 2.81 | 1.22 | (1.63) | 2.80 | 2.38 |
| Total income (loss) from operations | $2.84 | $1.26 | $(1.60) | $2.84 | $2.44 |
| Less Distributions | | | | | |
| From net investment income | $(0.02) | $(0.02) | $(0.04) | $(0.07) | $(0.07) |
| From net realized gain | (0.31) | (0.54) | (1.17) | (0.89) | (0.60) |
| Total distributions | $(0.33) | $(0.56) | $(1.21) | $(0.96) | $(0.67) |
| Net asset value — End of year | $15.66 | $13.15 | $12.45 | $15.26 | $13.38 |
| Total Return(2) | 22.17% | 10.21% | (11.32)% | 22.58% | 21.74% |
| Ratios/Supplemental Data | | | | | |
| Net assets, end of year (000’s omitted) | $777,744 | $708,283 | $703,965 | $853,051 | $761,814 |
| Ratios (as a percentage of average daily net assets):(3) | | | | | |
| Total expenses | 1.19% | 1.17% | 1.21% | 1.17% | 1.26% |
| Net expenses | 1.16%(4) | 1.13%(4) | 1.20%(4) | 1.16% | 1.22% |
| Net investment income | 0.21% | 0.28% | 0.22% | 0.30% | 0.50% |
| Portfolio Turnover | 15% | 21% | 27% | 32% | 38% |
| (1) | Computed using average shares outstanding. |
| (2) | Returns are historical and are calculated by determining the percentage change in net asset value with all distributions reinvested and do not reflect the effect of sales charges. |
| (3) | Total expenses do not reflect amounts reimbursed and/or waived by the adviser and administrator and certain of its affiliates, if applicable. Net expenses are net of all reductions and represent the net expenses paid by the Fund. |
| (4) | Includes a reduction by the investment adviser of a portion of its adviser fee due to the Fund’s investment in the Liquidity Fund (equal to less than 0.005% of average daily net assets for the years ended August 31, 2024, 2023 and 2022). |
7
See Notes to Financial Statements.
Eaton Vance
Worldwide Health Sciences Fund
August 31, 2024
Financial Highlights — continued
| | Class C |
| | Year Ended August 31, |
| | 2024 | 2023 | 2022 | 2021 | 2020 |
| Net asset value — Beginning of year | $13.27 | $12.63 | $15.44 | $13.50 | $11.69 |
| Income (Loss) From Operations | | | | | |
| Net investment loss(1) | $(0.07) | $(0.06) | $(0.08) | $(0.07) | $(0.03) |
| Net realized and unrealized gain (loss) | 2.81 | 1.24 | (1.64) | 2.84 | 2.38 |
| Total income (loss) from operations | $2.74 | $1.18 | $(1.72) | $2.77 | $2.35 |
| Less Distributions | | | | | |
| From net realized gain | $(0.31) | $(0.54) | $(1.09) | $(0.83) | $(0.54) |
| Total distributions | $(0.31) | $(0.54) | $(1.09) | $(0.83) | $(0.54) |
| Net asset value — End of year | $15.70 | $13.27 | $12.63 | $15.44 | $13.50 |
| Total Return(2) | 21.20% | 9.35% | (11.91)% | 21.68% | 20.70% |
| Ratios/Supplemental Data | | | | | |
| Net assets, end of year (000’s omitted) | $26,079 | $29,164 | $39,615 | $56,172 | $62,657 |
| Ratios (as a percentage of average daily net assets):(3) | | | | | |
| Total expenses | 1.94% | 1.92% | 1.96% | 1.92% | 2.01% |
| Net expenses | 1.91%(4) | 1.88%(4) | 1.95%(4) | 1.91% | 1.97% |
| Net investment loss | (0.54)% | (0.49)% | (0.54)% | (0.47)% | (0.26)% |
| Portfolio Turnover | 15% | 21% | 27% | 32% | 38% |
| (1) | Computed using average shares outstanding. |
| (2) | Returns are historical and are calculated by determining the percentage change in net asset value with all distributions reinvested and do not reflect the effect of sales charges. |
| (3) | Total expenses do not reflect amounts reimbursed and/or waived by the adviser and administrator and certain of its affiliates, if applicable. Net expenses are net of all reductions and represent the net expenses paid by the Fund. |
| (4) | Includes a reduction by the investment adviser of a portion of its adviser fee due to the Fund’s investment in the Liquidity Fund (equal to less than 0.005% of average daily net assets for the years ended August 31, 2024, 2023 and 2022). |
8
See Notes to Financial Statements.
Eaton Vance
Worldwide Health Sciences Fund
August 31, 2024
Financial Highlights — continued
| | Class I |
| | Year Ended August 31, |
| | 2024 | 2023 | 2022 | 2021 | 2020 |
| Net asset value — Beginning of year | $13.62 | $12.88 | $15.74 | $13.77 | $11.93 |
| Income (Loss) From Operations | | | | | |
| Net investment income(1) | $0.07 | $0.07 | $0.07 | $0.08 | $0.09 |
| Net realized and unrealized gain (loss) | 2.90 | 1.27 | (1.69) | 2.88 | 2.45 |
| Total income (loss) from operations | $2.97 | $1.34 | $(1.62) | $2.96 | $2.54 |
| Less Distributions | | | | | |
| From net investment income | $(0.05) | $(0.06) | $(0.07) | $(0.10) | $(0.10) |
| From net realized gain | (0.31) | (0.54) | (1.17) | (0.89) | (0.60) |
| Total distributions | $(0.36) | $(0.60) | $(1.24) | $(0.99) | $(0.70) |
| Net asset value — End of year | $16.23 | $13.62 | $12.88 | $15.74 | $13.77 |
| Total Return(2) | 22.46% | 10.46% | (11.07)% | 22.89% | 22.04% |
| Ratios/Supplemental Data | | | | | |
| Net assets, end of year (000’s omitted) | $245,070 | $203,614 | $209,646 | $221,892 | $192,629 |
| Ratios (as a percentage of average daily net assets):(3) | | | | | |
| Total expenses | 0.94% | 0.92% | 0.96% | 0.92% | 1.01% |
| Net expenses | 0.91%(4) | 0.88%(4) | 0.95%(4) | 0.91% | 0.97% |
| Net investment income | 0.46% | 0.52% | 0.47% | 0.55% | 0.75% |
| Portfolio Turnover | 15% | 21% | 27% | 32% | 38% |
| (1) | Computed using average shares outstanding. |
| (2) | Returns are historical and are calculated by determining the percentage change in net asset value with all distributions reinvested. |
| (3) | Total expenses do not reflect amounts reimbursed and/or waived by the adviser and administrator and certain of its affiliates, if applicable. Net expenses are net of all reductions and represent the net expenses paid by the Fund. |
| (4) | Includes a reduction by the investment adviser of a portion of its adviser fee due to the Fund’s investment in the Liquidity Fund (equal to less than 0.005% of average daily net assets for the years ended August 31, 2024, 2023 and 2022). |
9
See Notes to Financial Statements.
Eaton Vance
Worldwide Health Sciences Fund
August 31, 2024
Financial Highlights — continued
| | Class R |
| | Year Ended August 31, |
| | 2024 | 2023 | 2022 | 2021 | 2020 |
| Net asset value — Beginning of year | $14.31 | $13.52 | $16.45 | $14.35 | $12.40 |
| Income (Loss) From Operations | | | | | |
| Net investment income (loss)(1) | $(0.01) | $0.00(2) | $(0.00)(2) | $0.01 | $0.03 |
| Net realized and unrealized gain (loss) | 3.06 | 1.33 | (1.76) | 3.01 | 2.55 |
| Total income (loss) from operations | $3.05 | $1.33 | $(1.76) | $3.02 | $2.58 |
| Less Distributions | | | | | |
| From net investment income | $— | $— | $— | $(0.03) | $(0.03) |
| From net realized gain | (0.31) | (0.54) | (1.17) | (0.89) | (0.60) |
| Total distributions | $(0.31) | $(0.54) | $(1.17) | $(0.92) | $(0.63) |
| Net asset value — End of year | $17.05 | $14.31 | $13.52 | $16.45 | $14.35 |
| Total Return(3) | 21.83% | 9.86% | (11.46)% | 22.24% | 21.46% |
| Ratios/Supplemental Data | | | | | |
| Net assets, end of year (000’s omitted) | $66,865 | $62,885 | $59,042 | $70,502 | $60,480 |
| Ratios (as a percentage of average daily net assets):(4) | | | | | |
| Total expenses | 1.44% | 1.42% | 1.46% | 1.42% | 1.51% |
| Net expenses | 1.41%(5) | 1.38%(5) | 1.45%(5) | 1.41% | 1.47% |
| Net investment income (loss) | (0.04)% | 0.03% | (0.02)% | 0.05% | 0.25% |
| Portfolio Turnover | 15% | 21% | 27% | 32% | 38% |
| (1) | Computed using average shares outstanding. |
| (2) | Amount is less than $0.005 or $(0.005), as applicable. |
| (3) | Returns are historical and are calculated by determining the percentage change in net asset value with all distributions reinvested. |
| (4) | Total expenses do not reflect amounts reimbursed and/or waived by the adviser and administrator and certain of its affiliates, if applicable. Net expenses are net of all reductions and represent the net expenses paid by the Fund. |
| (5) | Includes a reduction by the investment adviser of a portion of its adviser fee due to the Fund’s investment in the Liquidity Fund (equal to less than 0.005% of average daily net assets for the years ended August 31, 2024, 2023 and 2022). |
10
See Notes to Financial Statements.
Eaton Vance
Worldwide Health Sciences Fund
August 31, 2024
Notes to Financial Statements
1 Significant Accounting Policies
Eaton Vance Worldwide Health Sciences Fund (the Fund) is a diversified series of Eaton Vance Growth Trust (the Trust). The Trust is a Massachusetts business trust registered under the Investment Company Act of 1940, as amended (the 1940 Act), as an open-end management investment company. The Fund’s investment objective is to seek long-term capital growth by investing in a worldwide and diversified portfolio of health sciences companies. The Fund offers four classes of shares. Class A shares are generally sold subject to a sales charge imposed at time of purchase. Class C shares are sold at net asset value and are generally subject to a contingent deferred sales charge (see Note 5). Effective November 5, 2020, Class C shares automatically convert to Class A shares eight years after their purchase as described in the Fund’s prospectus. Class I and Class R shares are sold at net asset value and are not subject to a sales charge. Each class represents a pro rata interest in the Fund, but votes separately on class-specific matters and (as noted below) is subject to different expenses. Realized and unrealized gains and losses and net investment income and losses, other than class-specific expenses, are allocated daily to each class of shares based on the relative net assets of each class to the total net assets of the Fund. Each class of shares differs in its distribution plan and certain other class-specific expenses.
The following is a summary of significant accounting policies of the Fund. The policies are in conformity with accounting principles generally accepted in the United States of America (U.S. GAAP). The Fund is an investment company and follows accounting and reporting guidance in the Financial Accounting Standards Board (FASB) Accounting Standards Codification Topic 946.
A Investment Valuation—The following methodologies are used to determine the market value or fair value of investments.
Equity Securities. Equity securities (common stocks and exchange-traded funds) listed on a U.S. securities exchange generally are valued at the last sale or closing price on the day of valuation or, if no sales took place on such date, at the mean between the closing bid and ask prices on the exchange where such securities are principally traded. Equity securities listed on the NASDAQ National Market System are valued at the NASDAQ official closing price. Unlisted or listed securities for which closing sales prices or closing quotations are not available are valued at the mean between the latest available bid and ask prices.
Foreign Securities and Currencies. Foreign securities and currencies are valued in U.S. dollars, based on foreign currency exchange rate quotations supplied by a third party pricing service. The pricing service uses a proprietary model to determine the exchange rate. Inputs to the model include reported trades and implied bid/ask spreads. The daily valuation of exchange-traded foreign securities generally is determined as of the close of trading on the principal exchange on which such securities trade. Events occurring after the close of trading on foreign exchanges may result in adjustments to the valuation of foreign securities to more accurately reflect their fair value as of the close of regular trading on the New York Stock Exchange. When valuing foreign equity securities that meet certain criteria, the Fund's Trustees have approved the use of a fair value service that values such securities to reflect market trading that occurs after the close of the applicable foreign markets of comparable securities or other instruments that have a strong correlation to the fair-valued securities.
Other. Investments in management investment companies (including money market funds) that do not trade on an exchange are valued at the net asset value as of the close of each business day.
Fair Valuation. In connection with Rule 2a-5 of the 1940 Act, the Trustees have designated the Fund’s investment adviser as its valuation designee. Investments for which valuations or market quotations are not readily available or are deemed unreliable are valued by the investment adviser, as valuation designee, at fair value using methods that most fairly reflect the security’s “fair value”, which is the amount that the Fund might reasonably expect to receive for the security upon its current sale in the ordinary course. Each such determination is based on a consideration of relevant factors, which are likely to vary from one pricing context to another. These factors may include, but are not limited to, the type of security, the existence of any contractual restrictions on the security’s disposition, the price and extent of public trading in similar securities of the issuer or of comparable companies or entities, quotations or relevant information obtained from broker/dealers or other market participants, information obtained from the issuer, analysts, and/or the appropriate stock exchange (for exchange-traded securities), an analysis of the company’s or entity’s financial statements, and an evaluation of the forces that influence the issuer and the market(s) in which the security is purchased and sold.
B Investment Transactions—Investment transactions for financial statement purposes are accounted for on a trade date basis. Realized gains and losses on investments sold are determined on the basis of identified cost.
C Income—Dividend income is recorded on the ex-dividend date for dividends received in cash and/or securities. However, if the ex-dividend date has passed, certain dividends from foreign securities are recorded as the Fund is informed of the ex-dividend date. Withholding taxes on foreign dividends and capital gains have been provided for in accordance with the Fund's understanding of the applicable countries’ tax rules and rates. In consideration of recent decisions rendered by European courts, the Fund has filed additional tax reclaims for previously withheld taxes on dividends earned in certain European Union countries. These filings are subject to various administrative and judicial proceedings within these countries. Due to the uncertainty as to the ultimate resolution of these proceedings, the likelihood of receipt of these reclaims, and the potential timing of payment, no amounts are reflected in the financial statements for such outstanding reclaims. Distributions from investment companies are recorded as dividend income, capital gains or return of capital based on the nature of the distribution.
Eaton Vance
Worldwide Health Sciences Fund
August 31, 2024
Notes to Financial Statements — continued
D Federal Taxes—The Fund's policy is to comply with the provisions of the Internal Revenue Code applicable to regulated investment companies and to distribute to shareholders each year substantially all of its net investment income, and all or substantially all of its net realized capital gains. Accordingly, no provision for federal income or excise tax is necessary.
As of August 31, 2024, the Fund had no uncertain tax positions that would require financial statement recognition, de-recognition, or disclosure. The Fund files a U.S. federal income tax return annually after its fiscal year-end, which is subject to examination by the Internal Revenue Service for a period of three years from the date of filing.
E Expenses—The majority of expenses of the Trust are directly identifiable to an individual fund. Expenses which are not readily identifiable to a specific fund are allocated taking into consideration, among other things, the nature and type of expense and the relative size of the funds.
F Foreign Currency Translation—Investment valuations, other assets, and liabilities initially expressed in foreign currencies are translated each business day into U.S. dollars based upon current exchange rates. Purchases and sales of foreign investment securities and income and expenses denominated in foreign currencies are translated into U.S. dollars based upon currency exchange rates in effect on the respective dates of such transactions. Recognized gains or losses on investment transactions attributable to changes in foreign currency exchange rates are recorded for financial statement purposes as net realized gains and losses on investments. That portion of unrealized gains and losses on investments that results from fluctuations in foreign currency exchange rates is not separately disclosed.
G Use of Estimates—The preparation of the financial statements in conformity with U.S. GAAP requires management to make estimates and assumptions that affect the reported amounts of assets and liabilities at the date of the financial statements and the reported amounts of income and expense during the reporting period. Actual results could differ from those estimates.
H Indemnifications—Under the Trust’s organizational documents, its officers and Trustees may be indemnified against certain liabilities and expenses arising out of the performance of their duties to the Fund. Under Massachusetts law, if certain conditions prevail, shareholders of a Massachusetts business trust (such as the Trust) could be deemed to have personal liability for the obligations of the Trust. However, the Trust’s Declaration of Trust contains an express disclaimer of liability on the part of Fund shareholders and the By-laws provide that the Trust shall assume, upon request by the shareholder, the defense on behalf of any Fund shareholders. Moreover, the By-laws also provide for indemnification out of Fund property of any shareholder held personally liable solely by reason of being or having been a shareholder for all loss or expense arising from such liability. Additionally, in the normal course of business, the Fund enters into agreements with service providers that may contain indemnification clauses. The maximum exposure under these arrangements is unknown as this would involve future claims that may be made against the Fund that have not yet occurred.
2 Distributions to Shareholders and Income Tax Information
It is the present policy of the Fund to make at least one distribution annually (normally in December) of all or substantially all of its net investment income and to distribute annually all or substantially all of its net realized capital gains. Distributions to shareholders are recorded on the ex-dividend date. Distributions are declared separately for each class of shares. Shareholders may reinvest income and capital gain distributions in additional shares of the same class of the Fund at the net asset value as of the ex-dividend date or, at the election of the shareholder, receive distributions in cash. Distributions to shareholders are determined in accordance with income tax regulations, which may differ from U.S. GAAP. As required by U.S. GAAP, only distributions in excess of tax basis earnings and profits are reported in the financial statements as a return of capital. Permanent differences between book and tax accounting relating to distributions are reclassified to paid-in capital. For tax purposes, distributions from short-term capital gains are considered to be from ordinary income.
The tax character of distributions declared for the years ended August 31, 2024 and August 31, 2023 was as follows:
| | Year Ended August 31, |
| | 2024 | 2023 |
| Ordinary income | $1,607,989 | $2,485,613 |
| Long-term capital gains | $22,508,656 | $42,169,124 |
During the year ended August 31, 2024, distributable earnings was decreased by $1,437,554 and paid-in capital was increased by $1,437,554 due to the Fund’s use of equalization accounting. Tax equalization accounting allows the Fund to treat as a distribution that portion of redemption proceeds representing a redeeming shareholder’s portion of undistributed taxable income and net capital gains. These reclassifications had no effect on the net assets or net asset value per share of the Fund.
Eaton Vance
Worldwide Health Sciences Fund
August 31, 2024
Notes to Financial Statements — continued
As of August 31, 2024, the components of distributable earnings (accumulated loss) on a tax basis were as follows:
| Undistributed ordinary income | $ 2,101,087 |
| Undistributed long-term capital gains | 24,099,813 |
| Net unrealized appreciation | 549,056,699 |
| Distributable earnings | $575,257,599 |
The cost and unrealized appreciation (depreciation) of investments of the Fund at August 31, 2024, as determined on a federal income tax basis, were as follows:
| Aggregate cost | $566,711,662 |
| Gross unrealized appreciation | $569,065,974 |
| Gross unrealized depreciation | (20,143,603) |
| Net unrealized appreciation | $548,922,371 |
3 Investment Adviser Fee and Other Transactions with Affiliates
The investment adviser fee is earned by Eaton Vance Management (EVM), an indirect, wholly-owned subsidiary of Morgan Stanley, as compensation for investment advisory services rendered to the Fund. The fee is computed at an annual rate as a percentage of the Fund’s average daily net assets as follows and is payable monthly:
| Average Daily Net Assets | Annual Fee Rate |
| Up to $500 million | 0.675% |
| $500 million but less than $1 billion | 0.590% |
| $1 billion but less than $1.5 billion | 0.520% |
| $1.5 billion but less than $2 billion | 0.490% |
| $2 billion but less than $2.5 billion | 0.470% |
| $2.5 billion and over | 0.450% |
In addition, EVM’s fee is subject to an upward or downward performance adjustment of up to 0.15% (annually) of the average daily net assets of the Fund depending on whether, and to what extent, the investment performance of the Fund differs by at least one percentage point from the record of the MSCI World Health Care Index over a 36-month performance period. For the year ended August 31, 2024, the investment adviser fee, including an upward performance adjustment of $134,935, amounted to $6,480,331 or 0.64% of the Fund’s average daily net assets. Pursuant to an investment sub-advisory agreement, EVM has delegated a portion of the investment management of the Fund to Eaton Vance Advisers International Ltd. (EVAIL), an affiliate of EVM and an indirect, wholly-owned subsidiary of Morgan Stanley. EVM pays EVAIL a portion of its investment adviser fee for sub-advisory services provided to the Fund. The Fund may invest in a money market fund, the Institutional Class of the Morgan Stanley Institutional Liquidity Funds - Government Portfolio (the “Liquidity Fund”), an open-end management investment company managed by Morgan Stanley Investment Management Inc., a wholly-owned subsidiary of Morgan Stanley. The investment adviser fee paid by the Fund is reduced by an amount equal to its pro rata share of the advisory and administration fees paid by the Fund due to its investment in the Liquidity Fund. For the year ended August 31, 2024, the investment adviser fee paid was reduced by $2,962 relating to the Fund’s investment in the Liquidity Fund.
The administration fee is earned by EVM for administering the business affairs of the Fund and is computed at an annual rate of 0.15% of the Fund’s average daily net assets. For the year ended August 31, 2024, the administration fee amounted to $1,508,930.
EVM and EVAIL have agreed to reimburse the Fund’s expenses to the extent that total annual operating expenses (relating to ordinary operating expenses only and excluding expenses such as brokerage commissions, acquired fund fees and expenses of unaffiliated funds, any performance-based adjustment to an asset-based investment advisory fee, borrowing costs, taxes or litigation expenses) exceed 1.15%, 1.90%, 0.90% and 1.40% of the Fund’s average daily net assets for Class A, Class C, Class I and Class R, respectively. This agreement may be changed or terminated after January 1, 2025. Pursuant to this agreement, EVM and EVAIL were allocated $301,925 in total of the Fund’s operating expenses for the year ended August 31, 2024.
Eaton Vance
Worldwide Health Sciences Fund
August 31, 2024
Notes to Financial Statements — continued
EVM provides sub-transfer agency and related services to the Fund pursuant to a Sub-Transfer Agency Support Services Agreement. For the year ended August 31, 2024, EVM earned $160,104 from the Fund pursuant to such agreement, which is included in transfer and dividend disbursing agent fees on the Statement of Operations. The Fund was informed that Eaton Vance Distributors, Inc. (EVD), an affiliate of EVM and the Fund’s principal underwriter, received $11,700 as its portion of the sales charge on sales of Class A shares for the year ended August 31, 2024. The Fund was informed that Morgan Stanley affiliated broker-dealers, which may be deemed to be affiliates of EVM and EVD, also received a portion of the sales charge on sales of Class A shares for the year ended August 31, 2024 in the amount of $1,055. EVD also received distribution and service fees from Class A, Class C and Class R shares (see Note 4) and contingent deferred sales charges (see Note 5).
Trustees and officers of the Fund who are members of EVM’s organization receive remuneration for their services to the Fund out of the investment adviser fee. Trustees of the Fund who are not affiliated with the investment adviser may elect to defer receipt of all or a percentage of their annual fees in accordance with the terms of the Trustees Deferred Compensation Plan. Certain officers and Trustees of the Fund are officers of EVM.
4 Distribution Plans
The Fund has in effect a distribution plan for Class A shares (Class A Plan) pursuant to Rule 12b-1 under the 1940 Act. Pursuant to the Class A Plan, the Fund pays EVD a distribution and service fee of 0.25% per annum of its average daily net assets attributable to Class A shares for distribution services and facilities provided to the Fund by EVD, as well as for personal services and/or the maintenance of shareholder accounts. Distribution and service fees paid or accrued to EVD for the year ended August 31, 2024 amounted to $1,770,085 for Class A shares.
The Fund also has in effect distribution plans for Class C shares (Class C Plan) and Class R shares (Class R Plan) pursuant to Rule 12b-1 under the 1940 Act. Pursuant to the Class C Plan, the Fund pays EVD amounts equal to 0.75% per annum of its average daily net assets attributable to Class C shares for providing ongoing distribution services and facilities to the Fund. For the year ended August 31, 2024, the Fund paid or accrued to EVD $193,707 for Class C shares.
The Class R Plan requires the Fund to pay EVD an amount up to 0.50% per annum of its average daily net assets attributable to Class R shares for providing ongoing distribution services and facilities to the Fund. The Trustees of the Trust have currently limited Class R distribution payments to 0.25% per annum of the average daily net assets attributable to Class R shares. For the year ended August 31, 2024, the Fund paid or accrued to EVD $152,292 for Class R shares.
Pursuant to the Class C and Class R Plans, the Fund also makes payments of service fees to EVD, financial intermediaries and other persons in amounts equal to 0.25% per annum of its average daily net assets attributable to that class. Service fees paid or accrued are for personal services and/or the maintenance of shareholder accounts. They are separate and distinct from the sales commissions and distribution fees payable to EVD. Service fees paid or accrued for the year ended August 31, 2024 amounted to $64,569 and $152,292 for Class C and Class R shares, respectively.
Distribution and service fees are subject to the limitations contained in the Financial Industry Regulatory Authority Rule 2341(d).
5 Contingent Deferred Sales Charges
A contingent deferred sales charge (CDSC) of 1% generally is imposed on redemptions of Class C shares made within 12 months of purchase. Class A shares may be subject to a 1% CDSC if redeemed within 12 months of purchase (depending on the circumstances of purchase). Generally, the CDSC is based upon the lower of the net asset value at date of redemption or date of purchase. No charge is levied on shares acquired by reinvestment of dividends or capital gain distributions. For the year ended August 31, 2024, the Fund was informed that EVD received $762 of CDSCs paid by Class C shareholders and no CDSCs paid by Class A shareholders.
6 Purchases and Sales of Investments
Purchases and sales of investments, other than short-term obligations, aggregated $146,289,051 and $237,011,598, respectively, for the year ended August 31, 2024.
Eaton Vance
Worldwide Health Sciences Fund
August 31, 2024
Notes to Financial Statements — continued
7 Shares of Beneficial Interest
The Fund’s Declaration of Trust permits the Trustees to issue an unlimited number of full and fractional shares of beneficial interest (without par value). Such shares may be issued in a number of different series (such as the Fund) and classes. Transactions in Fund shares, including direct exchanges pursuant to share class conversions, were as follows:
| | Year Ended
August 31, 2024 | | Year Ended
August 31, 2023 |
| | Shares | Amount | | Shares | Amount |
| Class A | | | | | |
| Sales | 1,416,252 | $19,008,416 | | 1,862,519 | $23,768,264 |
| Issued to shareholders electing to receive payments of distributions in Fund shares | 1,217,420 | 15,229,921 | | 2,158,139 | 27,926,322 |
| Redemptions | (6,815,509) | (92,517,762) | | (6,686,737) | (85,332,161) |
| Net decrease | (4,181,837) | $(58,279,425) | | (2,666,079) | $(33,637,575) |
| Class C | | | | | |
| Sales | 158,774 | $ 2,162,984 | | 188,599 | $ 2,415,884 |
| Issued to shareholders electing to receive payments of distributions in Fund shares | 47,253 | 596,336 | | 117,840 | 1,547,245 |
| Redemptions | (743,065) | (9,991,874) | | (1,245,545) | (16,020,450) |
| Net decrease | (537,038) | $(7,232,554) | | (939,106) | $(12,057,321) |
| Class I | | | | | |
| Sales | 2,213,993 | $31,340,663 | | 2,203,781 | $29,179,286 |
| Issued to shareholders electing to receive payments of distributions in Fund shares | 335,120 | 4,339,809 | | 600,437 | 8,033,848 |
| Redemptions | (2,397,349) | (33,285,923) | | (4,131,027) | (54,442,275) |
| Net increase (decrease) | 151,764 | $ 2,394,549 | | (1,326,809) | $(17,229,141) |
| Class R | | | | | |
| Sales | 341,278 | $ 5,120,988 | | 574,116 | $ 7,917,261 |
| Issued to shareholders electing to receive payments of distributions in Fund shares | 91,902 | 1,254,455 | | 168,280 | 2,374,425 |
| Redemptions | (905,848) | (13,217,851) | | (716,936) | (9,965,924) |
| Net increase (decrease) | (472,668) | $(6,842,408) | | 25,460 | $ 325,762 |
Eaton Vance
Worldwide Health Sciences Fund
August 31, 2024
Notes to Financial Statements — continued
8 Restricted Securities
At August 31, 2024, the Fund owned the following security (representing less than 0.05% of net assets) which was restricted as to public resale and not registered under the Securities Act of 1933 (excluding Rule 144A securities). The Fund has limited registration rights with respect to this security. The value of restricted securities is determined based on valuations provided by brokers when available, or if not available, they are valued by the investment adviser as the Trustees' valuation designee.
| Description | Date(s) of
Acquisition | Shares | Cost | Value |
| Convertible Preferred Stocks | | | | |
| Caris Life Sciences, Inc., Series D | 5/12/21, 9/23/21 | 370,370 | $3,000,000 | $459,259 |
| Total Restricted Securities | | | $3,000,000 | $459,259 |
9 Line of Credit
The Fund participates with other portfolios and funds managed by EVM and its affiliates in a $650 million unsecured revolving line of credit agreement with a group of banks, which is in effect through October 22, 2024. In connection with the renewal of the agreement on October 24, 2023, the borrowing limit was decreased from $725 million. Borrowings are made by the Fund solely for temporary purposes related to redemptions and other short-term cash needs. Interest is charged to the Fund based on its borrowings at an amount above either the Secured Overnight Financing Rate (SOFR) or Federal Funds rate. In addition, a fee computed at an annual rate of 0.15% on the daily unused portion of the line of credit is allocated among the participating portfolios and funds at the end of each quarter. In connection with the renewal of the agreement in October 2023, an arrangement fee of $150,000 was incurred that was allocated to the participating portfolios and funds. Because the line of credit is not available exclusively to the Fund, it may be unable to borrow some or all of its requested amounts at any particular time. The Fund did not have any significant borrowings or allocated fees during the year ended August 31, 2024.
10 Securities Lending Agreement
The Fund has established a securities lending agreement with State Street Bank and Trust Company (SSBT) as securities lending agent in which the Fund lends portfolio securities to qualified borrowers in exchange for collateral consisting of either cash or securities issued or guaranteed by the U.S. government or its agencies or instrumentalities in an amount at least equal to the market value of the securities on loan. The market value of securities loaned is determined daily and any additional required collateral is delivered to the Fund on the next business day. Cash collateral is invested in the State Street Navigator Securities Lending Government Money Market Portfolio, a money market fund registered under the 1940 Act. The Fund earns interest on the amount invested but it must pay (and at times receive from) the broker a loan rebate fee computed as a varying percentage of the collateral received. For security loans secured by non-cash collateral, the Fund earns a negotiated lending fee from the borrower. A portion of the income earned by the Fund from its investment of cash collateral, net of rebate fees, and lending fees received is allocated to SSBT for its services as lending agent and the portion allocated to the Fund is presented as securities lending income, net on the Statement of Operations. Non-cash collateral is held by the lending agent on behalf of the Fund and cannot be sold or re-pledged by the Fund; accordingly, such collateral is not reflected in the Statement of Assets and Liabilities.
The Fund is subject to possible delay in the recovery of loaned securities. Pursuant to the securities lending agreement, SSBT has provided indemnification to the Fund in the event of default by a borrower with respect to a loan. The Fund bears the risk of loss with respect to the investment of cash collateral.
At August 31, 2024, the value of the securities loaned and the value of the collateral received, which exceeded the value of the securities loaned, amounted to $1,678,283 and $1,707,122, respectively. Collateral received was comprised of cash. The securities lending transactions have no contractual maturity date and each of the Fund and borrower has the option to terminate a loan at any time.
The following table provides a breakdown of securities lending transactions accounted for as secured borrowings, the obligations by class of collateral pledged, and the remaining contractual maturity of those transactions as of August 31, 2024.
| | Remaining Contractual Maturity of the Transactions |
| | Overnight and
Continuous | <30 days | 30 to 90 days | >90 days | Total |
| Exchange-Traded Funds | $1,707,122 | $ — | $ — | $ — | $1,707,122 |
Eaton Vance
Worldwide Health Sciences Fund
August 31, 2024
Notes to Financial Statements — continued
The carrying amount of the liability for collateral for securities loaned at August 31, 2024 approximated its fair value. If measured at fair value, such liability would have been considered as Level 2 in the fair value hierarchy (see Note 12) at August 31, 2024.
11 Affiliated Investments
At August 31, 2024, the value of the Fund's investment in funds that may be deemed to be affiliated was $1,285,435, which represents 0.1% of the Fund's net assets. Transactions in such investments by the Fund for the year ended August 31, 2024 were as follows:
| Name | Value,
beginning
of period | Purchases | Sales
proceeds | Net realized
gain (loss) | Change in
unrealized
appreciation
(depreciation) | Value, end
of period | Dividend
income | Shares,
end of period |
| Short-Term Investments |
| Liquidity Fund | $4,890,453 | $88,774,037 | $(92,379,055) | $ — | $ — | $1,285,435 | $105,879 | 1,285,435 |
12 Fair Value Measurements
Under generally accepted accounting principles for fair value measurements, a three-tier hierarchy to prioritize the assumptions, referred to as inputs, is used in valuation techniques to measure fair value. The three-tier hierarchy of inputs is summarized in the three broad levels listed below.
| • | Level 1 – quoted prices in active markets for identical investments |
| • | Level 2 – other significant observable inputs (including quoted prices for similar investments, interest rates, prepayment speeds, credit risk, etc.) |
| • | Level 3 – significant unobservable inputs (including a fund's own assumptions in determining the fair value of investments) |
In cases where the inputs used to measure fair value fall in different levels of the fair value hierarchy, the level disclosed is determined based on the lowest level input that is significant to the fair value measurement in its entirety. The inputs or methodology used for valuing securities are not necessarily an indication of the risk associated with investing in those securities.
At August 31, 2024, the hierarchy of inputs used in valuing the Fund's investments, which are carried at fair value, were as follows:
| Asset Description | Level 1 | Level 2 | Level 3* | Total |
| Common Stocks: | | | | |
| Biotechnology | $111,187,075 | $ 23,921,397 | $ — | $ 135,108,472 |
| Health Care Distributors | 20,017,651 | 7,961,229 | — | 27,978,880 |
| Health Care Equipment | 120,993,355 | 7,241,539 | — | 128,234,894 |
| Health Care Services | 5,731,420 | — | — | 5,731,420 |
| Health Care Supplies | 25,524,650 | 33,288,766 | — | 58,813,416 |
| Health Care Technology | 6,723,313 | 2,528,276 | — | 9,251,589 |
| Life Sciences Tools & Services | 105,127,130 | 20,969,759 | — | 126,096,889 |
| Managed Health Care | 117,415,820 | — | — | 117,415,820 |
| Metal, Glass & Plastic Containers | 6,843,763 | — | — | 6,843,763 |
| Pharmaceuticals | 259,319,056 | 212,859,872 | — | 472,178,928 |
| Total Common Stocks | $778,883,233 | $ 308,770,838** | $ — | $1,087,654,071 |
| Convertible Preferred Stocks | $ — | $ — | $459,259 | $ 459,259 |
| Exchange-Traded Funds | 24,528,146 | — | — | 24,528,146 |
| Short-Term Investments: | | | | |
| Affiliated Fund | 1,285,435 | — | — | 1,285,435 |
Eaton Vance
Worldwide Health Sciences Fund
August 31, 2024
Notes to Financial Statements — continued
| Asset Description (continued) | Level 1 | Level 2 | Level 3* | Total |
| Securities Lending Collateral | $ 1,707,122 | $ — | $ — | $ 1,707,122 |
| Total Investments | $806,403,936 | $ 308,770,838 | $459,259 | $1,115,634,033 |
| * | None of the unobservable inputs for Level 3 assets, individually or collectively, had a material impact on the Fund. |
| ** | Includes foreign equity securities whose values were adjusted to reflect market trading of comparable securities or other correlated instruments that occurred after the close of trading in their applicable foreign markets. |
Level 3 investments at the beginning and/or end of the period in relation to net assets were not significant and accordingly, a reconciliation of Level 3 assets for the year ended August 31, 2024 is not presented.
13 Risks and Uncertainties
Risks Associated with Foreign Investments
Foreign investments can be adversely affected by political, economic and market developments abroad, including the imposition of economic and other sanctions by the United States or another country, and by acts of terrorism and war. There may be less publicly available information about foreign issuers because they may not be subject to reporting practices, requirements or regulations comparable to those to which United States companies are subject. Foreign markets may be smaller, less liquid and more volatile than the major markets in the United States. Trading in foreign markets typically involves higher expense than trading in the United States. The Fund may have difficulties enforcing its legal or contractual rights in a foreign country. Securities that trade or are denominated in currencies other than the U.S. dollar may be adversely affected by fluctuations in currency exchange rates.
Concentration of Risk
As the Fund invests a significant portion of its assets in pharmaceutical, biotechnology, life sciences, and health care equipment and services companies, it may be affected by developments that adversely affect such companies. These developments include product obsolescence, the failure of a company to develop new products and the expiration of patent rights. The value of the Fund’s shares can also be impacted by regulatory activities that affect health sciences companies. The Fund has historically held approximately 60 stocks or less at any one time; therefore, it is more sensitive to developments affecting particular stocks than would be a more broadly diversified fund.
Eaton Vance
Worldwide Health Sciences Fund
August 31, 2024
Report of Independent Registered Public Accounting Firm
To the Trustees of Eaton Vance Growth Trust and Shareholders of Eaton Vance Worldwide Health Sciences Fund:
Opinion on the Financial Statements and Financial Highlights
We have audited the accompanying statement of assets and liabilities of Eaton Vance Worldwide Health Sciences Fund (the “Fund”) (one of the funds constituting Eaton Vance Growth Trust), including the portfolio of investments, as of August 31, 2024, the related statement of operations for the year then ended, the statements of changes in net assets for each of the two years in the period then ended, the financial highlights for each of the five years in the period then ended, and the related notes. In our opinion, the financial statements and financial highlights present fairly, in all material respects, the financial position of the Fund as of August 31, 2024, and the results of its operations for the year then ended, the changes in its net assets for each of the two years in the period then ended, and the financial highlights for each of the five years in the period then ended, in conformity with accounting principles generally accepted in the United States of America.
Basis for Opinion
These financial statements and financial highlights are the responsibility of the Fund's management. Our responsibility is to express an opinion on the Fund's financial statements and financial highlights based on our audits. We are a public accounting firm registered with the Public Company Accounting Oversight Board (United States) (PCAOB) and are required to be independent with respect to the Fund in accordance with the U.S. federal securities laws and the applicable rules and regulations of the Securities and Exchange Commission and the PCAOB.
We conducted our audits in accordance with the standards of the PCAOB. Those standards require that we plan and perform the audit to obtain reasonable assurance about whether the financial statements and financial highlights are free of material misstatement, whether due to error or fraud. The Fund is not required to have, nor were we engaged to perform, an audit of its internal control over financial reporting. As part of our audits, we are required to obtain an understanding of internal control over financial reporting but not for the purpose of expressing an opinion on the effectiveness of the Fund’s internal control over financial reporting. Accordingly, we express no such opinion.
Our audits included performing procedures to assess the risks of material misstatement of the financial statements and financial highlights, whether due to error or fraud, and performing procedures that respond to those risks. Such procedures included examining, on a test basis, evidence regarding the amounts and disclosures in the financial statements and financial highlights. Our audits also included evaluating the accounting principles used and significant estimates made by management, as well as evaluating the overall presentation of the financial statements and financial highlights. Our procedures included confirmation of securities owned as of August 31, 2024, by correspondence with the custodian and brokers; when replies were not received from brokers, we performed other auditing procedures. We believe that our audits provide a reasonable basis for our opinion.
/s/ Deloitte & Touche LLP
Boston, Massachusetts
October 17, 2024
We have served as the auditor of one or more Eaton Vance investment companies since 1959.
Eaton Vance
Worldwide Health Sciences Fund
August 31, 2024
Federal Tax Information (Unaudited)
The Form 1099-DIV you receive in February 2025 will show the tax status of all distributions paid to your account in calendar year 2024. Shareholders are advised to consult their own tax adviser with respect to the tax consequences of their investment in the Fund. As required by the Internal Revenue Code and/or regulations, shareholders must be notified regarding the status of qualified dividend income for individuals, the dividends received deduction for corporations and capital gains dividends.
Qualified Dividend Income. For the fiscal year ended August 31, 2024, the Fund designates approximately $13,889,999, or up to the maximum amount of such dividends allowable pursuant to the Internal Revenue Code, as qualified dividend income eligible for the reduced tax rate of 15%.
Dividends Received Deduction. Corporate shareholders are generally entitled to take the dividends received deduction on the portion of the Fund’s dividend distribution that qualifies under tax law. For the Fund’s fiscal 2024 ordinary income dividends, 100% qualifies for the corporate dividends received deduction.
Capital Gains Dividends. The Fund hereby designates as a capital gain dividend with respect to the taxable year ended August 31, 2024, $33,727,338
or, if subsequently determined to be different, the net capital gain of such year.
Eaton Vance
Worldwide Health Sciences Fund
August 31, 2024
Board of Trustees’ Contract Approval
Overview of the Contract Review Process
The Investment Company Act of 1940, as amended (the “1940 Act”), provides, in substance, that the investment advisory agreement between a fund and its investment adviser will continue in effect from year-to-year only if its continuation is approved on an annual basis by a vote of the fund’s board of trustees, including a majority of the trustees who are not “interested persons” of the fund (“independent trustees”), cast in person at a meeting called for the purpose of considering such approval.
At a meeting held on June 6, 2024, the Boards of Trustees/Directors (collectively, the “Board”) that oversee the registered investment companies advised by Eaton Vance Management or its affiliate, Boston Management and Research (the “Eaton Vance Funds”), including a majority of the independent trustees (the “Independent Trustees”), voted to approve the continuation of existing investment advisory agreements and sub-advisory agreements1 for each of the Eaton Vance Funds for an additional one-year period. The Board relied upon the affirmative recommendation of its Contract Review Committee, which is a committee comprised of all of the Independent Trustees. Prior to making its recommendation, the Contract Review Committee reviewed information furnished by the adviser and sub-adviser to each of the Eaton Vance Funds (including information specifically requested by the Board) for a series of meetings held between April and June 2024, as well as certain additional information provided in response to specific requests from the Independent Trustees as members of the Contract Review Committee. Members of the Contract Review Committee also considered information received at prior meetings of the Board and its committees, to the extent such information was relevant to the Contract Review Committee’s annual evaluation of the investment advisory agreements and sub-advisory agreements.
In connection with its evaluation of the investment advisory agreements and sub-advisory agreements, the Board considered various information relating to the Eaton Vance Funds. This included information applicable to all or groups of Eaton Vance Funds, which is referenced immediately below, and information applicable to the particular Eaton Vance Fund covered by this report (each “Eaton Vance Fund” is referred to below as a “fund”). (For funds that invest through one or more underlying portfolios, references to “each fund” in this section may include information that was considered at the portfolio-level.)
Information about Fees, Performance and Expenses
• A report from an independent data provider comparing advisory and other fees paid by each fund to such fees paid by comparable funds, as identified by the independent data provider (“comparable funds”);
• A report from an independent data provider comparing each fund’s total expense ratio (and its components) to those of comparable funds;
• A report from an independent data provider comparing the investment performance of each fund (including, as relevant, total return data, income data, Sharpe ratios, and information ratios) to the investment performance of comparable funds and, as applicable, benchmark indices, over various time periods;
• In certain instances, data regarding investment performance relative to customized groups of peer funds and blended indices identified by the adviser in consultation with the Portfolio Management Committee of the Board (a committee exclusively comprised of Independent Trustees);
• Comparative information concerning the fees charged and services provided by the adviser and sub-adviser to each fund in managing other accounts (which may include other funds, collective investment trusts and institutional accounts) with the same or substantially similar investment objective as the fund and with a significant overlap in holdings based on criteria set by the Board, if any;
• Profitability analyses with respect to the adviser and sub-adviser to each of the funds;
Information about Portfolio Management and Trading
• Descriptions of the investment management services provided to each fund, as well as each of the funds’ investment strategies and policies;
• The procedures and processes used by the adviser to determine the value of fund assets, including, when necessary, the determination of “fair value” by the adviser in its role as each funds’ valuation designee and actions taken to monitor and test the effectiveness of such procedures and processes;
• Information about the policies and practices of each fund’s adviser and sub-adviser with respect to trading, including their processes for seeking best execution of portfolio transactions;
• Information about the allocation of brokerage transactions and the benefits, if any, received by the adviser and sub-adviser to each fund as a result of brokerage allocation, including, as applicable, information concerning the acquisition of research through client commission arrangements and policies with respect to “soft dollars”;
• Data relating to the portfolio turnover rate of each fund and related information regarding active management in the context of particular strategies;
Information about each Adviser and Sub-adviser
• Reports detailing the financial results and condition of the adviser and sub-adviser to each fund;
1 Not all Eaton Vance Funds have entered into a sub-advisory agreement with a sub-adviser. Accordingly, references to “sub-adviser” or “sub-advisory agreement” in this “Overview” section may not be applicable to the particular Eaton Vance Fund covered by this report. Eaton Vance Management and Boston Management and Research are referred to collectively as the “adviser.”
Eaton Vance
Worldwide Health Sciences Fund
August 31, 2024
Board of Trustees’ Contract Approval — continued
• Information regarding the individual investment professionals whose responsibilities include portfolio management and investment research for the funds, and, for portfolio managers and certain other investment professionals, information relating to their responsibilities with respect to managing other funds and investment accounts, as applicable;
• Information regarding the adviser’s and its parent company’s (Morgan Stanley’s) efforts to retain and attract talented investment professionals, including in the context of a competitive marketplace for talent;
• Information regarding the adviser’s compensation methodology for its investment professionals and the incentives and accountability it creates, along with investment professionals’ investments in the fund(s) they manage;
• The personal trading codes of ethics of the adviser and its affiliates and the sub-adviser of each fund, together with information relating to compliance with, and the administration of, such codes;
• Policies and procedures relating to proxy voting, including regular reporting with respect to fund proxy voting activities;
• Information regarding the handling of corporate actions and class actions, as well as information regarding litigation and other regulatory matters;
• Information concerning the resources devoted to compliance efforts undertaken by the adviser and its affiliates and the sub-adviser of each fund, including descriptions of their various compliance programs and their record of compliance and remediation;
• Information concerning the business continuity and disaster recovery plans of the adviser and its affiliates and the sub-adviser of each fund;
• A description of the adviser’s oversight of sub-advisers, including with respect to regulatory and compliance issues, investment management and other matters;
Other Relevant Information
• Information regarding ongoing initiatives to further integrate and harmonize, where applicable, the investment management and other departments of the adviser and its affiliates with the overall investment management infrastructure of Morgan Stanley, in light of Morgan Stanley’s acquisition of Eaton Vance Corp. on March 1, 2021;
• Information concerning the nature, cost, and character of the administrative and other non-investment advisory services provided by the adviser and its affiliates;
• Information concerning oversight of the relationship with the custodian, subcustodians, fund accountants, and other third-party service providers by the adviser and/or administrator to each of the funds;
• Information concerning efforts to implement policies and procedures with respect to various regulations applicable to the funds, including Rule 12d1-4 (the Fund-of-Funds Rule), Rule 18f-4 (the Derivatives Rule), and Rule 2a-5 (the Fair Valuation Rule);
• For an Eaton Vance Fund structured as an exchange-listed closed-end fund, information concerning the benefits of the closed-end fund structure, as well as, where relevant, the closed-end fund’s market prices (including as compared to the closed-end fund’s net asset value (NAV)), trading volume data, continued use of auction preferred shares (where applicable), distribution rates, and other relevant matters;
• The risks that the adviser and/or its affiliates incur in connection with the management and operation of the funds, including, among others, litigation, regulatory, entrepreneurial, and other business risks (and the associated costs of such risks); and
• The terms of each investment advisory agreement and sub-advisory agreement.
During the various meetings of the Board and its committees over the course of the year leading up to the June 6, 2024 meeting, the Board and its committees received information from portfolio managers and other investment professionals of the adviser and sub-advisers of the funds regarding investment and performance matters, and considered various investment and trading strategies used in pursuing the funds’ investment objectives. The Board and its committees also received information regarding risk management techniques employed in connection with the management of the funds. The Board and its committees evaluated issues pertaining to industry and regulatory developments, compliance procedures, fund governance, and other issues with respect to the funds, and received and participated in reports and presentations provided by the adviser and sub-advisers, with respect to such matters. In addition to the formal meetings of the Board and its committees, the Independent Trustees held regular video or telephone conferences to discuss, among other topics, matters relating to the continuation of investment advisory agreements and sub-advisory agreements.
The Contract Review Committee was advised throughout the contract review process by Kirkland & Ellis LLP, independent legal counsel for the Independent Trustees. The members of the Contract Review Committee, with the advice of such counsel, exercised their own business judgment in determining the material factors to be considered in evaluating each investment advisory agreement and sub-advisory agreement and the weight to be given to each such factor. The conclusions reached with respect to each investment advisory agreement and sub-advisory agreement were based on a comprehensive evaluation of all the information provided and not any single factor. Moreover, each member of the Contract Review Committee may have placed varying emphasis on particular factors in reaching conclusions with respect to each investment advisory agreement and sub-advisory agreement. In evaluating each investment advisory agreement and sub-advisory agreement, including the fee structures and other terms contained in such agreements, the members of the Contract Review Committee were also informed by multiple years of analysis and discussion with the adviser and sub-adviser to each of the Eaton Vance Funds.
Results of the Contract Review Process
Based on its consideration of the foregoing, and such other information it deemed relevant, including the factors and conclusions described below, the Contract Review Committee concluded that the continuation of the investment advisory agreement between Eaton Vance Worldwide Health Sciences Fund (the “Fund”) and Eaton Vance Management (the “Adviser”) and the sub-advisory agreement between the Adviser and Eaton Vance Advisers International
Eaton Vance
Worldwide Health Sciences Fund
August 31, 2024
Board of Trustees’ Contract Approval — continued
Ltd. (the “Sub-adviser”), an affiliate of the Adviser, with respect to the Fund, including their respective fee structures, are in the interests of shareholders and, therefore, recommended to the Board approval of each agreement. Based on the recommendation of the Contract Review Committee, the Board, including a majority of the Independent Trustees, voted to approve continuation of the investment advisory agreement and the sub-advisory agreement for the Fund.
Nature, Extent and Quality of Services
In considering whether to approve the investment advisory agreement and the sub-advisory agreement for the Fund, the Board evaluated the nature, extent and quality of services provided to the Fund by the Adviser and the Sub-adviser.
The Board considered the Adviser’s and the Sub-adviser’s management capabilities and investment processes in light of the types of investments held by the Fund, including the education and experience of the investment professionals who provide services to the Fund. Regarding the Adviser, the Board considered the Adviser’s responsibilities with respect to oversight of the Sub-adviser. With respect to the Sub-adviser, the Board considered the resources available to the Sub-adviser in fulfilling its duties under the sub-advisory agreement. In particular, the Board considered the abilities and experience of the Adviser’s and the Sub-adviser’s investment professionals in investing in equity securities, particularly in managing health sciences portfolios and in the health care sector more broadly. The Board also considered the international investment capabilities of the Sub-adviser, which is based in London, and the benefits to the Fund of having portfolio management services involving investments in international equities provided by investment professionals located abroad. The Board also took into account the resources dedicated to portfolio management and other services, the compensation methods of the Adviser and other factors, including the reputation and resources of the Adviser to recruit and retain highly qualified research, advisory and supervisory investment professionals. In addition, the Board considered the time and attention devoted to the Eaton Vance Funds, including the Fund, by senior management, as well as the infrastructure, operational capabilities and support staff in place to assist in the portfolio management and operations of the Fund, including the provision of administrative services. The Board also considered the business-related and other risks to which the Adviser or its affiliates may be subject in managing the Fund.
The Board considered the compliance programs of the Adviser and relevant affiliates thereof, including the Sub-adviser. The Board considered compliance and reporting matters regarding, among other things, personal trading by investment professionals, disclosure of portfolio holdings, compliance with policies and procedures, portfolio valuation, business continuity and the allocation of investment opportunities. The Board also considered relevant examinations of the Adviser and its affiliates by regulatory authorities, such as the Securities and Exchange Commission and the Financial Industry Regulatory Authority.
The Board considered other administrative services provided or overseen by Eaton Vance Management and its affiliates, including transfer agency and accounting services. The Board evaluated the benefits to shareholders of investing in a fund that is a part of a large fund complex offering exposure to a variety of asset classes and investment disciplines, as well as the ability, in many cases, to exchange an investment among different funds without incurring additional sales charges.
After consideration of the foregoing factors, among others, the Board concluded that the nature, extent and quality of services provided by the Adviser and the Sub-adviser, taken as a whole, are appropriate and consistent with the terms of the investment advisory agreement and the sub-advisory agreement.
Fund Performance
The Board compared the Fund’s investment performance to that of comparable funds identified by an independent data provider (the peer group), as well as appropriate benchmark indices. The Board’s review included comparative performance data with respect to the Fund for the one-, three-, five- and ten-year periods ended December 31, 2023. In this regard, the Board noted that the performance of the Fund was higher than the median performance of the Fund’s peer group for the three-year period. The Board also noted that the performance of the Fund was lower than its primary and secondary benchmark indexes for the three-year period. The Board concluded that the performance of the Fund was satisfactory.
Management Fees and Expenses
The Board considered contractual fee rates payable by the Fund for advisory and administrative services (referred to collectively as “management fees”). As part of its review, the Board considered the Fund’s management fees and total expense ratio for the one-year period ended December 31, 2023, as compared to those of comparable funds, before and after giving effect to any undertaking to waive fees or reimburse expenses. The Board also considered factors that had an impact on the Fund’s total expense ratio relative to comparable funds.
After considering the foregoing information, and in light of the nature, extent and quality of the services provided by the Adviser and the Sub-adviser, the Board concluded that the management fees charged for advisory and related services are reasonable.
Profitability and “Fall-Out” Benefits
The Board considered the level of profits realized by the Adviser and relevant affiliates thereof, including the Sub-adviser, in providing investment advisory and administrative services to the Fund and to all Eaton Vance Funds as a group. The Board considered the level of profits realized without regard to marketing support or other payments by the Adviser and its affiliates to third parties in respect of distribution or other services.
Eaton Vance
Worldwide Health Sciences Fund
August 31, 2024
Board of Trustees’ Contract Approval — continued
The Board concluded that, in light of the foregoing factors and the nature, extent and quality of the services rendered, the profits realized by the Adviser and its affiliates, including the Sub-adviser, are not excessive.
The Board also considered direct or indirect fall-out benefits received by the Adviser and its affiliates, including the Sub-adviser, in connection with their respective relationships with the Fund, including the benefits of research services that may be available to the Adviser or the Sub-adviser as a result of securities transactions effected for the Fund and other investment advisory clients.
Economies of Scale
In reviewing management fees and profitability, the Board also considered the extent to which the Adviser and its affiliates, on the one hand, and the Fund, on the other hand, can expect to realize benefits from economies of scale as the assets of the Fund increase. The Board acknowledged the difficulty in accurately measuring the benefits resulting from economies of scale, if any, with respect to the management of any specific fund or group of funds. To assist in the evaluation of the sharing of any economies of scale, the Board received data showing for recent years, asset levels, Adviser profitability and total expense ratios. Based upon the foregoing, the Board concluded that the Fund currently shares in the benefits from economies of scale, if any, when they are realized by the Adviser. The Board also concluded that the structure of the advisory fee, which includes breakpoints at several asset levels, will allow the Fund to continue to benefit from any economies of scale in the future.
Eaton Vance
Richard Bernstein Equity
Strategy Fund
Annual Financial Statements and Additional Information
August 31, 2024
This report must be preceded or accompanied by a current summary prospectus or prospectus. Before investing, investors should consider carefully the investment objective, risks, and charges and expenses of a mutual fund. This and other important information is contained in the prospectus and/or statement of additional information, which can be obtained by calling 1-800-262-1122 or from a financial intermediary. Prospective investors should read the prospectus carefully before investing.
Annual Financial Statements and Additional Information August 31, 2024
Eaton Vance
Richard Bernstein Equity Strategy Fund
Eaton Vance
Richard Bernstein Equity Strategy Fund
August 31, 2024
| Security | Shares | Value |
| Aerospace & Defense — 2.6% |
| Airbus SE | | 8,771 | $ 1,347,352 |
| BAE Systems PLC | | 98,294 | 1,767,303 |
| Boeing Co.(1) | | 3,885 | 674,980 |
| General Dynamics Corp. | | 8,626 | 2,582,279 |
| General Electric Co. | | 15,342 | 2,679,020 |
| Howmet Aerospace, Inc. | | 21,131 | 2,042,523 |
| L3Harris Technologies, Inc. | | 6,743 | 1,595,866 |
| Lockheed Martin Corp. | | 3,221 | 1,829,850 |
| Northrop Grumman Corp. | | 3,600 | 1,883,556 |
| RTX Corp. | | 20,455 | 2,522,920 |
| | | | $ 18,925,649 |
| Air Freight & Logistics — 0.2% |
| FedEx Corp. | | 2,696 | $ 805,484 |
| United Parcel Service, Inc., Class B | | 5,551 | 713,581 |
| | | | $ 1,519,065 |
| Automobiles — 1.6% |
| Ford Motor Co. | | 104,247 | $ 1,166,524 |
| Mercedes-Benz Group AG | | 34,687 | 2,390,803 |
| Tesla, Inc.(1) | | 27,447 | 5,876,677 |
| Toyota Motor Corp. | | 91,500 | 1,747,003 |
| | | | $ 11,181,007 |
| Banks — 3.2% |
| Bank of America Corp. | | 78,553 | $ 3,201,035 |
| BNP Paribas SA | | 22,875 | 1,582,208 |
| Citigroup, Inc. | | 24,639 | 1,543,387 |
| Citizens Financial Group, Inc. | | 50,650 | 2,180,482 |
| Eastern Bankshares, Inc. | | 106,241 | 1,802,910 |
| FB Financial Corp. | | 46,594 | 2,246,763 |
| First Hawaiian, Inc. | | 91,379 | 2,223,251 |
| JPMorgan Chase & Co. | | 14,313 | 3,217,562 |
| Stellar Bancorp, Inc. | | 56,223 | 1,533,201 |
| Veritex Holdings, Inc. | | 69,457 | 1,749,622 |
| Wells Fargo & Co. | | 32,069 | 1,875,074 |
| | | | $ 23,155,495 |
| Beverages — 1.3% |
| Anheuser-Busch InBev SA(2) | | 38,495 | $ 2,362,519 |
| Coca-Cola Co. | | 43,620 | 3,161,141 |
| Security | Shares | Value |
| Beverages (continued) |
| Heineken NV | | 20,284 | $ 1,830,105 |
| Pernod Ricard SA | | 12,569 | 1,789,552 |
| | | | $ 9,143,317 |
| Biotechnology — 1.5% |
| AbbVie, Inc. | | 16,781 | $ 3,294,278 |
| Amgen, Inc. | | 6,887 | 2,299,087 |
| Gilead Sciences, Inc. | | 14,614 | 1,154,506 |
| Regeneron Pharmaceuticals, Inc.(1) | | 2,028 | 2,402,551 |
| Vertex Pharmaceuticals, Inc.(1) | | 3,557 | 1,763,881 |
| | | | $ 10,914,303 |
| Broadline Retail — 2.2% |
| Amazon.com, Inc.(1) | | 87,058 | $ 15,539,853 |
| | | | $ 15,539,853 |
| Building Products — 1.2% |
| Carrier Global Corp. | | 25,841 | $ 1,880,708 |
| CSW Industrials, Inc. | | 7,450 | 2,515,343 |
| Johnson Controls International PLC | | 16,918 | 1,232,476 |
| Resideo Technologies, Inc.(1) | | 75,117 | 1,514,359 |
| Trane Technologies PLC | | 3,642 | 1,317,166 |
| | | | $ 8,460,052 |
| Capital Markets — 3.3% |
| Ares Management Corp., Class A | | 12,825 | $ 1,877,580 |
| Brightsphere Investment Group, Inc. | | 65,089 | 1,587,521 |
| Brookfield Asset Management Ltd., Class A | | 37,067 | 1,511,120 |
| Brookfield Corp. | | 64,662 | 3,253,132 |
| CME Group, Inc. | | 7,087 | 1,528,949 |
| Hamilton Lane, Inc., Class A | | 14,689 | 2,245,067 |
| Houlihan Lokey, Inc. | | 12,613 | 1,975,448 |
| KKR & Co., Inc. | | 14,414 | 1,784,021 |
| Moelis & Co., Class A | | 26,752 | 1,786,766 |
| Partners Group Holding AG | | 1,224 | 1,770,800 |
| Tradeweb Markets, Inc., Class A | | 16,575 | 1,959,828 |
| Victory Capital Holdings, Inc., Class A | | 39,628 | 2,162,500 |
| | | | $ 23,442,732 |
| Chemicals — 2.0% |
| AdvanSix, Inc. | | 35,991 | $ 1,063,894 |
| Arkema SA | | 14,645 | 1,358,730 |
| Corteva, Inc. | | 26,047 | 1,492,493 |
| Dow, Inc. | | 37,005 | 1,982,728 |
| DuPont de Nemours, Inc. | | 31,415 | 2,646,714 |
| EMS-Chemie Holding AG | | 2,036 | 1,708,756 |
1
See Notes to Financial Statements.
Eaton Vance
Richard Bernstein Equity Strategy Fund
August 31, 2024
Portfolio of Investments — continued
| Security | Shares | Value |
| Chemicals (continued) |
| Linde PLC | | 3,744 | $ 1,790,568 |
| Novonesis (Novozymes), Class B | | 17,462 | 1,212,342 |
| Nutrien Ltd.(2) | | 23,254 | 1,126,248 |
| | | | $ 14,382,473 |
| Commercial Services & Supplies — 0.3% |
| Waste Management, Inc. | | 8,853 | $ 1,877,190 |
| | | | $ 1,877,190 |
| Communications Equipment — 0.2% |
| Arista Networks, Inc.(1) | | 3,573 | $ 1,262,627 |
| | | | $ 1,262,627 |
| Construction & Engineering — 0.4% |
| API Group Corp.(1) | | 51,892 | $ 1,844,761 |
| Eiffage SA | | 12,726 | 1,335,786 |
| | | | $ 3,180,547 |
| Construction Materials — 0.3% |
| Vulcan Materials Co. | | 7,282 | $ 1,785,619 |
| | | | $ 1,785,619 |
| Consumer Finance — 0.9% |
| American Express Co. | | 8,407 | $ 2,174,470 |
| SLM Corp. | | 96,711 | 2,133,445 |
| Synchrony Financial | | 42,727 | 2,147,459 |
| | | | $ 6,455,374 |
| Consumer Staples Distribution & Retail — 0.6% |
| Aeon Co. Ltd.(2) | | 51,600 | $ 1,292,583 |
| Alimentation Couche-Tard, Inc. | | 35,989 | 2,054,416 |
| Walmart, Inc. | | 14,912 | 1,151,654 |
| | | | $ 4,498,653 |
| Containers & Packaging — 0.5% |
| Silgan Holdings, Inc. | | 35,090 | $ 1,834,154 |
| Sonoco Products Co. | | 29,777 | 1,684,485 |
| | | | $ 3,518,639 |
| Diversified Telecommunication Services — 0.2% |
| AT&T, Inc. | | 66,680 | $ 1,326,932 |
| | | | $ 1,326,932 |
| Electric Utilities — 1.4% |
| Constellation Energy Corp. | | 10,441 | $ 2,053,745 |
| Security | Shares | Value |
| Electric Utilities (continued) |
| Enel SpA | | 398,417 | $ 3,028,247 |
| Exelon Corp. | | 38,065 | 1,449,896 |
| Hydro One Ltd.(3) | | 77,032 | 2,618,511 |
| Iberdrola SA(2) | | 88,964 | 1,262,279 |
| | | | $ 10,412,678 |
| Electrical Equipment — 0.7% |
| Eaton Corp. PLC | | 8,919 | $ 2,737,509 |
| GE Vernova, Inc.(1) | | 3,835 | 770,835 |
| nVent Electric PLC | | 20,890 | 1,419,684 |
| | | | $ 4,928,028 |
| Electronic Equipment, Instruments & Components — 0.4% |
| Hexagon AB, Class B(2) | | 72,889 | $ 746,132 |
| Keyence Corp. | | 1,400 | 672,588 |
| Knowles Corp.(1) | | 72,920 | 1,345,374 |
| | | | $ 2,764,094 |
| Energy Equipment & Services — 0.5% |
| Baker Hughes Co. | | 37,015 | $ 1,301,817 |
| Halliburton Co. | | 32,513 | 1,010,829 |
| Schlumberger NV | | 23,540 | 1,035,525 |
| | | | $ 3,348,171 |
| Financial Services — 2.6% |
| Apollo Global Management, Inc. | | 11,912 | $ 1,378,576 |
| Berkshire Hathaway, Inc., Class B(1) | | 12,486 | 5,942,337 |
| Corebridge Financial, Inc. | | 67,106 | 1,983,653 |
| Enact Holdings, Inc. | | 48,134 | 1,711,164 |
| Equitable Holdings, Inc. | | 47,727 | 2,029,352 |
| Mastercard, Inc., Class A | | 4,526 | 2,187,597 |
| PayPal Holdings, Inc.(1) | | 22,600 | 1,636,918 |
| Visa, Inc., Class A | | 6,784 | 1,874,894 |
| | | | $ 18,744,491 |
| Food Products — 1.6% |
| Barry Callebaut AG(2) | | 1,436 | $ 2,324,229 |
| Danone SA | | 37,734 | 2,622,020 |
| Kerry Group PLC, Class A | | 12,198 | 1,224,967 |
| Nestle SA | | 35,095 | 3,763,591 |
| Saputo, Inc. | | 55,589 | 1,236,228 |
| | | | $ 11,171,035 |
| Ground Transportation — 1.5% |
| Canadian National Railway Co. | | 11,988 | $ 1,412,514 |
| CSX Corp. | | 34,321 | 1,176,181 |
2
See Notes to Financial Statements.
Eaton Vance
Richard Bernstein Equity Strategy Fund
August 31, 2024
Portfolio of Investments — continued
| Security | Shares | Value |
| Ground Transportation (continued) |
| Schneider National, Inc., Class B | | 47,833 | $ 1,296,753 |
| TFI International, Inc. | | 13,393 | 1,982,142 |
| Uber Technologies, Inc.(1) | | 30,640 | 2,240,703 |
| U-Haul Holding Co., Non Voting Shares | | 24,784 | 1,693,986 |
| Union Pacific Corp. | | 4,711 | 1,206,440 |
| | | | $ 11,008,719 |
| Health Care Equipment & Supplies — 3.0% |
| Abbott Laboratories | | 13,387 | $ 1,516,345 |
| Becton Dickinson & Co. | | 7,156 | 1,734,686 |
| Boston Scientific Corp.(1) | | 44,373 | 3,629,268 |
| Cochlear Ltd. | | 7,153 | 1,452,227 |
| EssilorLuxottica SA | | 10,469 | 2,482,553 |
| Intuitive Surgical, Inc.(1) | | 6,360 | 3,133,127 |
| Medtronic PLC | | 25,101 | 2,223,447 |
| Smith & Nephew PLC | | 104,856 | 1,614,707 |
| Stryker Corp. | | 5,401 | 1,946,628 |
| Zimmer Biomet Holdings, Inc. | | 15,583 | 1,799,213 |
| | | | $ 21,532,201 |
| Health Care Providers & Services — 2.6% |
| Cardinal Health, Inc. | | 7,322 | $ 825,336 |
| Cencora, Inc. | | 10,578 | 2,534,171 |
| Centene Corp.(1) | | 17,304 | 1,364,074 |
| Fresenius SE & Co. KGaA(1) | | 22,821 | 842,710 |
| HCA Healthcare, Inc. | | 5,713 | 2,260,006 |
| McKesson Corp. | | 6,198 | 3,477,574 |
| Sonic Healthcare Ltd. | | 66,505 | 1,244,439 |
| UnitedHealth Group, Inc. | | 10,289 | 6,072,568 |
| | | | $ 18,620,878 |
| Hotels, Restaurants & Leisure — 0.4% |
| Airbnb, Inc., Class A(1) | | 8,562 | $ 1,004,408 |
| Booking Holdings, Inc. | | 430 | 1,680,969 |
| | | | $ 2,685,377 |
| Household Durables — 0.8% |
| Installed Building Products, Inc. | | 9,499 | $ 2,111,722 |
| Sony Group Corp. | | 12,400 | 1,207,687 |
| Tri Pointe Homes, Inc.(1) | | 60,004 | 2,666,578 |
| | | | $ 5,985,987 |
| Household Products — 0.1% |
| Procter & Gamble Co. | | 4,904 | $ 841,232 |
| | | | $ 841,232 |
| Security | Shares | Value |
| Industrial Conglomerates — 1.0% |
| Hitachi Ltd. | | 124,500 | $ 3,071,416 |
| Honeywell International, Inc. | | 6,056 | 1,259,103 |
| Siemens AG | | 5,714 | 1,074,835 |
| Smiths Group PLC | | 73,039 | 1,737,603 |
| | | | $ 7,142,957 |
| Industrial REITs — 0.2% |
| ProLogis, Inc. | | 10,172 | $ 1,300,185 |
| | | | $ 1,300,185 |
| Insurance — 2.5% |
| Allianz SE | | 4,446 | $ 1,381,177 |
| American International Group, Inc. | | 33,551 | 2,585,105 |
| Brighthouse Financial, Inc.(1) | | 27,569 | 1,265,417 |
| Fairfax Financial Holdings Ltd. | | 1,067 | 1,288,143 |
| Hartford Financial Services Group, Inc. | | 14,015 | 1,627,142 |
| Markel Group, Inc.(1) | | 1,630 | 2,609,108 |
| Muenchener Rueckversicherungs-Gesellschaft AG in Muenchen | | 9,350 | 5,058,753 |
| Prudential Financial, Inc. | | 12,124 | 1,468,944 |
| QBE Insurance Group Ltd. | | 101,619 | 1,083,663 |
| | | | $ 18,367,452 |
| Interactive Media & Services — 3.7% |
| Alphabet, Inc., Class A | | 53,534 | $ 8,746,385 |
| Alphabet, Inc., Class C | | 46,128 | 7,616,194 |
| Meta Platforms, Inc., Class A | | 19,925 | 10,387,102 |
| | | | $ 26,749,681 |
| IT Services — 0.6% |
| International Business Machines Corp. | | 8,974 | $ 1,813,915 |
| Otsuka Corp. | | 52,600 | 1,251,368 |
| Shopify, Inc., Class A(1) | | 17,918 | 1,327,047 |
| | | | $ 4,392,330 |
| Life Sciences Tools & Services — 0.2% |
| IQVIA Holdings, Inc.(1) | | 6,629 | $ 1,667,525 |
| | | | $ 1,667,525 |
| Machinery — 1.7% |
| Caterpillar, Inc. | | 7,223 | $ 2,572,110 |
| Deere & Co. | | 4,200 | 1,620,108 |
| Fortive Corp. | | 21,127 | 1,571,849 |
| Illinois Tool Works, Inc. | | 6,404 | 1,621,365 |
| Ingersoll Rand, Inc. | | 15,315 | 1,400,557 |
3
See Notes to Financial Statements.
Eaton Vance
Richard Bernstein Equity Strategy Fund
August 31, 2024
Portfolio of Investments — continued
| Security | Shares | Value |
| Machinery (continued) |
| Otis Worldwide Corp. | | 16,783 | $ 1,589,182 |
| PACCAR, Inc. | | 21,198 | 2,038,824 |
| | | | $ 12,413,995 |
| Media — 0.4% |
| Fox Corp., Class B | | 38,374 | $ 1,474,713 |
| News Corp., Class B | | 47,161 | 1,387,948 |
| | | | $ 2,862,661 |
| Metals & Mining — 1.8% |
| Alamos Gold, Inc., Class A | | 68,367 | $ 1,317,979 |
| Barrick Gold Corp. | | 79,787 | 1,610,955 |
| BHP Group Ltd.(2) | | 38,038 | 1,047,324 |
| Freeport-McMoRan, Inc. | | 59,185 | 2,620,712 |
| Ivanhoe Mines Ltd., Class A(1)(2) | | 84,343 | 1,124,657 |
| Newmont Corp. | | 24,744 | 1,321,082 |
| Rio Tinto Ltd.(2) | | 18,617 | 1,393,790 |
| Teck Resources Ltd., Class B | | 24,976 | 1,195,935 |
| Wheaton Precious Metals Corp. | | 25,437 | 1,572,105 |
| | | | $ 13,204,539 |
| Oil, Gas & Consumable Fuels — 6.0% |
| Antero Midstream Corp. | | 113,509 | $ 1,687,879 |
| California Resources Corp. | | 27,648 | 1,450,691 |
| Cenovus Energy, Inc. | | 58,269 | 1,080,505 |
| Cheniere Energy, Inc. | | 8,289 | 1,535,620 |
| Chevron Corp. | | 22,303 | 3,299,729 |
| ConocoPhillips | | 11,259 | 1,281,162 |
| Devon Energy Corp. | | 58,734 | 2,630,108 |
| Diamondback Energy, Inc. | | 8,742 | 1,705,652 |
| DT Midstream, Inc. | | 26,306 | 2,067,388 |
| Enbridge, Inc. | | 31,859 | 1,281,783 |
| Exxon Mobil Corp. | | 58,441 | 6,892,531 |
| Hess Corp. | | 8,737 | 1,206,230 |
| Magnolia Oil & Gas Corp., Class A(2) | | 58,411 | 1,495,906 |
| Marathon Oil Corp. | | 50,501 | 1,446,854 |
| Occidental Petroleum Corp. | | 21,009 | 1,197,093 |
| Phillips 66 | | 11,248 | 1,578,207 |
| PrairieSky Royalty Ltd.(2) | | 66,136 | 1,370,176 |
| Repsol SA | | 96,746 | 1,328,513 |
| Shell PLC | | 57,079 | 2,022,510 |
| Suncor Energy, Inc.(2) | | 66,563 | 2,699,761 |
| Targa Resources Corp. | | 16,399 | 2,409,013 |
| TC Energy Corp. | | 35,130 | 1,627,140 |
| | | | $ 43,294,451 |
| Security | Shares | Value |
| Passenger Airlines — 0.3% |
| Air Canada(1)(2) | | 94,261 | $ 1,079,946 |
| Delta Air Lines, Inc. | | 33,075 | 1,405,357 |
| | | | $ 2,485,303 |
| Personal Care Products — 0.2% |
| L'Oreal SA | | 3,584 | $ 1,572,496 |
| | | | $ 1,572,496 |
| Pharmaceuticals — 4.1% |
| AstraZeneca PLC | | 14,860 | $ 2,604,444 |
| Bristol-Myers Squibb Co. | | 36,600 | 1,828,170 |
| Eli Lilly & Co. | | 7,041 | 6,759,501 |
| GSK PLC | | 94,086 | 2,049,150 |
| Johnson & Johnson | | 8,547 | 1,417,605 |
| Merck & Co., Inc. | | 13,030 | 1,543,403 |
| Novartis AG | | 33,582 | 4,057,315 |
| Novo Nordisk AS, Class B | | 16,942 | 2,353,416 |
| Pfizer, Inc. | | 46,212 | 1,340,610 |
| Roche Holding AG PC | | 7,291 | 2,468,154 |
| Sanofi SA | | 17,702 | 1,986,839 |
| Takeda Pharmaceutical Co. Ltd. | | 45,900 | 1,366,535 |
| | | | $ 29,775,142 |
| Professional Services — 1.1% |
| Automatic Data Processing, Inc. | | 8,064 | $ 2,224,938 |
| Parsons Corp.(1) | | 24,461 | 2,335,047 |
| Science Applications International Corp. | | 12,687 | 1,656,795 |
| Verra Mobility Corp.(1) | | 71,947 | 1,986,457 |
| | | | $ 8,203,237 |
| Retail REITs — 0.1% |
| Realty Income Corp. | | 13,212 | $ 820,597 |
| | | | $ 820,597 |
| Semiconductors & Semiconductor Equipment — 6.0% |
| Advanced Micro Devices, Inc.(1) | | 14,795 | $ 2,197,945 |
| ASML Holding NV | | 2,993 | 2,699,189 |
| Broadcom, Inc. | | 39,360 | 6,408,595 |
| GlobalFoundries, Inc.(1)(2) | | 19,282 | 900,084 |
| Marvell Technology, Inc. | | 19,753 | 1,505,969 |
| Micron Technology, Inc. | | 10,400 | 1,000,896 |
| NVIDIA Corp. | | 237,420 | 28,340,825 |
| | | | $ 43,053,503 |
| Software — 4.6% |
| Adobe, Inc.(1) | | 2,149 | $ 1,234,407 |
4
See Notes to Financial Statements.
Eaton Vance
Richard Bernstein Equity Strategy Fund
August 31, 2024
Portfolio of Investments — continued
| Security | Shares | Value |
| Software (continued) |
| Alarm.com Holdings, Inc.(1) | | 33,131 | $ 1,972,620 |
| Atlassian Corp., Class A(1) | | 6,692 | 1,108,195 |
| Microsoft Corp. | | 66,160 | 27,597,982 |
| Salesforce, Inc. | | 5,951 | 1,505,008 |
| | | | $ 33,418,212 |
| Specialized REITs — 1.0% |
| Equinix, Inc. | | 1,786 | $ 1,490,167 |
| Four Corners Property Trust, Inc. | | 106,411 | 3,016,752 |
| VICI Properties, Inc. | | 88,238 | 2,954,208 |
| | | | $ 7,461,127 |
| Specialty Retail — 0.5% |
| Home Depot, Inc. | | 5,809 | $ 2,140,616 |
| Industria de Diseno Textil SA | | 31,849 | 1,725,436 |
| | | | $ 3,866,052 |
| Technology Hardware, Storage & Peripherals — 4.8% |
| Apple, Inc. | | 137,791 | $ 31,554,139 |
| Hewlett Packard Enterprise Co. | | 66,191 | 1,282,120 |
| Pure Storage, Inc., Class A(1) | | 19,730 | 1,011,952 |
| Western Digital Corp.(1) | | 16,804 | 1,102,174 |
| | | | $ 34,950,385 |
| Textiles, Apparel & Luxury Goods — 0.1% |
| adidas AG | | 4,107 | $ 1,053,706 |
| | | | $ 1,053,706 |
| Tobacco — 0.3% |
| Philip Morris International, Inc. | | 18,363 | $ 2,263,974 |
| | | | $ 2,263,974 |
| Trading Companies & Distributors — 1.0% |
| Brenntag SE | | 36,205 | $ 2,692,324 |
| Ferguson Enterprises, Inc. | | 5,627 | 1,157,530 |
| GMS, Inc.(1) | | 21,646 | 1,878,656 |
| United Rentals, Inc. | | 1,710 | 1,267,555 |
| | | | $ 6,996,065 |
Total Common Stocks
(identified cost $355,969,961) | | | $579,927,993 |
| Exchange-Traded Funds — 17.3% |
| Security | Shares | Value |
| Equity Funds — 17.3% |
| iShares MSCI India ETF(1)(2) | | 816,200 | $ 47,111,064 |
| iShares MSCI South Korea ETF(2) | | 451,600 | 29,579,800 |
| iShares MSCI Taiwan ETF | | 893,800 | 48,086,440 |
Total Exchange-Traded Funds
(identified cost $123,705,653) | | | $124,777,304 |
| Short-Term Investments — 3.1% |
| Security | Shares | Value |
| Morgan Stanley Institutional Liquidity Funds - Government Portfolio, Institutional Class, 5.19%(4) | | 16,101,587 | $ 16,101,587 |
Total Affiliated Fund
(identified cost $16,101,587) | | | $ 16,101,587 |
| Securities Lending Collateral — 0.8% |
| Security | Shares | Value |
| State Street Navigator Securities Lending Government Money Market Portfolio, 5.29%(5) | | 5,923,596 | $ 5,923,596 |
Total Securities Lending Collateral
(identified cost $5,923,596) | | | $ 5,923,596 |
Total Short-Term Investments
(identified cost $22,025,183) | | | $ 22,025,183 |
Total Investments — 100.7%
(identified cost $501,700,797) | | | $726,730,480 |
| Other Assets, Less Liabilities — (0.7)% | | | $ (5,071,591) |
| Net Assets — 100.0% | | | $721,658,889 |
| The percentage shown for each investment category in the Portfolio of Investments is based on net assets. |
| (1) | Non-income producing security. |
| (2) | All or a portion of this security was on loan at August 31, 2024. The aggregate market value of securities on loan at August 31, 2024 was $47,223,142. |
| (3) | Security exempt from registration under Rule 144A of the Securities Act of 1933, as amended. These securities may be sold in certain transactions in reliance on an exemption from registration (normally to qualified institutional buyers). At August 31, 2024, the aggregate value of these securities is $2,618,511 or 0.4% of the Fund's net assets. |
5
See Notes to Financial Statements.
Eaton Vance
Richard Bernstein Equity Strategy Fund
August 31, 2024
Portfolio of Investments — continued
| (4) | May be deemed to be an affiliated investment company. The rate shown is the annualized seven-day yield as of August 31, 2024. |
| (5) | Represents investment of cash collateral received in connection with securities lending. |
| Country Concentration of Portfolio |
| Country | Percentage
of Net Assets | Value |
| United States | 67.3% | $485,408,803 |
| Canada | 4.4 | 32,198,338 |
| Germany | 2.0 | 14,494,308 |
| France | 1.9 | 14,090,697 |
| Japan | 1.5 | 10,609,180 |
| Switzerland | 1.4 | 9,861,100 |
| United Kingdom | 1.1 | 7,724,057 |
| Australia | 0.9 | 6,221,443 |
| Netherlands | 0.6 | 4,529,294 |
| Spain | 0.6 | 4,316,228 |
| Denmark | 0.5 | 3,565,758 |
| Italy | 0.4 | 3,028,247 |
| Belgium | 0.3 | 2,362,519 |
| Brazil | 0.2 | 1,572,105 |
| Ireland | 0.2 | 1,224,967 |
| Sweden | 0.1 | 746,132 |
| Exchange-Traded Funds | 17.3 | 124,777,304 |
| Total Investments | 100.7% | $726,730,480 |
| Abbreviations: |
| PC | – Participation Certificate |
| REITs | – Real Estate Investment Trusts |
6
See Notes to Financial Statements.
Eaton Vance
Richard Bernstein Equity Strategy Fund
August 31, 2024
Statement of Assets and Liabilities
| | August 31, 2024 |
| Assets | |
| Unaffiliated investments, at value (identified cost $485,599,210) — including $47,223,142 of securities on loan | $710,628,893 |
| Affiliated investments, at value (identified cost $16,101,587) | 16,101,587 |
| Dividends receivable | 727,199 |
| Dividends receivable from affiliated investments | 82,094 |
| Receivable for Fund shares sold | 468,094 |
| Securities lending income receivable | 5,059 |
| Tax reclaims receivable | 861,198 |
| Trustees' deferred compensation plan | 89,362 |
| Total assets | $728,963,486 |
| Liabilities | |
| Collateral for securities loaned | $5,923,596 |
| Payable for Fund shares redeemed | 532,718 |
| Due to custodian — foreign currency, at value (identified cost $6,589) | 6,632 |
| Payable to affiliates: | |
| Investment adviser and administration fee | 494,928 |
| Distribution and service fees | 55,543 |
| Trustees' deferred compensation plan | 89,362 |
| Accrued expenses | 201,818 |
| Total liabilities | $7,304,597 |
| Net Assets | $721,658,889 |
| Sources of Net Assets | |
| Paid-in capital | $479,510,907 |
| Distributable earnings | 242,147,982 |
| Net Assets | $721,658,889 |
| Class A Shares | |
| Net Assets | $180,756,427 |
| Shares Outstanding | 9,596,525 |
Net Asset Value and Redemption Price Per Share
(net assets ÷ shares of beneficial interest outstanding) | $18.84 |
Maximum Offering Price Per Share
(100 ÷ 94.75 of net asset value per share) | $19.88 |
| Class C Shares | |
| Net Assets | $21,704,491 |
| Shares Outstanding | 1,182,924 |
Net Asset Value and Offering Price Per Share*
(net assets ÷ shares of beneficial interest outstanding) | $18.35 |
| Class I Shares | |
| Net Assets | $519,197,971 |
| Shares Outstanding | 27,503,547 |
Net Asset Value, Offering Price and Redemption Price Per Share
(net assets ÷ shares of beneficial interest outstanding) | $18.88 |
| On sales of $50,000 or more, the offering price of Class A shares is reduced. |
| * | Redemption price per share is equal to the net asset value less any applicable contingent deferred sales charge. |
7
See Notes to Financial Statements.
Eaton Vance
Richard Bernstein Equity Strategy Fund
August 31, 2024
| | Year Ended |
| | August 31, 2024 |
| Investment Income | |
| Dividend income (net of foreign taxes withheld of $535,496) | $13,420,677 |
| Dividend income from affiliated investments | 881,466 |
| Securities lending income, net | 121,986 |
| Total investment income | $14,424,129 |
| Expenses | |
| Investment adviser and administration fee | $5,856,074 |
| Distribution and service fees: | |
| Class A | 430,376 |
| Class C | 228,320 |
| Trustees’ fees and expenses | 44,654 |
| Custodian fee | 196,878 |
| Transfer and dividend disbursing agent fees | 305,440 |
| Legal and accounting services | 83,620 |
| Printing and postage | 36,266 |
| Registration fees | 62,145 |
| Miscellaneous | 57,169 |
| Total expenses | $7,300,942 |
| Deduct: | |
| Waiver and/or reimbursement of expenses by affiliates | $24,839 |
| Total expense reductions | $24,839 |
| Net expenses | $7,276,103 |
| Net investment income | $7,148,026 |
| Realized and Unrealized Gain (Loss) | |
| Net realized gain (loss): | |
| Investment transactions | $22,581,119 |
| Foreign currency transactions | (255,122) |
| Capital gain distributions received | 1,404,084 |
| Net realized gain | $23,730,081 |
| Change in unrealized appreciation (depreciation): | |
| Investments | $96,361,953 |
| Foreign currency | 41,749 |
| Net change in unrealized appreciation (depreciation) | $96,403,702 |
| Net realized and unrealized gain | $120,133,783 |
| Net increase in net assets from operations | $127,281,809 |
8
See Notes to Financial Statements.
Eaton Vance
Richard Bernstein Equity Strategy Fund
August 31, 2024
Statements of Changes in Net Assets
| | Year Ended August 31, |
| | 2024 | 2023 |
| Increase (Decrease) in Net Assets | | |
| From operations: | | |
| Net investment income | $7,148,026 | $9,206,049 |
| Net realized gain | 23,730,081 | 62,355,476 |
| Net change in unrealized appreciation (depreciation) | 96,403,702 | (674,438) |
| Net increase in net assets from operations | $127,281,809 | $70,887,087 |
| Distributions to shareholders: | | |
| Class A | $(13,818,446) | $(8,803,667) |
| Class C | (1,705,707) | (1,458,884) |
| Class I | (42,140,949) | (28,423,260) |
| Total distributions to shareholders | $(57,665,102) | $(38,685,811) |
| Transactions in shares of beneficial interest: | | |
| Class A | $(6,984,858) | $(4,726,834) |
| Class C | (4,964,961) | (9,505,182) |
| Class I | (62,319,861) | (49,181,257) |
| Net decrease in net assets from Fund share transactions | $(74,269,680) | $(63,413,273) |
| Net decrease in net assets | $(4,652,973) | $(31,211,997) |
| Net Assets | | |
| At beginning of year | $726,311,862 | $757,523,859 |
| At end of year | $721,658,889 | $726,311,862 |
9
See Notes to Financial Statements.
Eaton Vance
Richard Bernstein Equity Strategy Fund
August 31, 2024
| | Class A |
| | Year Ended August 31, |
| | 2024 | 2023 | 2022 | 2021 | 2020 |
| Net asset value — Beginning of year | $17.09 | $16.35 | $21.35 | $17.83 | $16.50 |
| Income (Loss) From Operations | | | | | |
| Net investment income(1) | $0.15 | $0.19 | $0.18 | $0.12 | $0.09 |
| Net realized and unrealized gain (loss) | 3.00 | 1.43 | (2.70) | 3.86 | 2.68 |
| Total income (loss) from operations | $3.15 | $1.62 | $(2.52) | $3.98 | $2.77 |
| Less Distributions | | | | | |
| From net investment income | $(0.19) | $(0.09) | $(0.37) | $(0.09) | $(0.16) |
| From net realized gain | (1.21) | (0.79) | (2.11) | (0.37) | (1.28) |
| Total distributions | $(1.40) | $(0.88) | $(2.48) | $(0.46) | $(1.44) |
| Net asset value — End of year | $18.84 | $17.09 | $16.35 | $21.35 | $17.83 |
| Total Return(2) | 19.67% | 10.44% | (13.48)% | 22.71% | 17.89% |
| Ratios/Supplemental Data | | | | | |
| Net assets, end of year (000’s omitted) | $180,756 | $170,105 | $167,077 | $198,721 | $156,477 |
| Ratios (as a percentage of average daily net assets):(3) | | | | | |
| Total expenses | 1.19% | 1.20% | 1.18% | 1.21% | 1.26% |
| Net expenses | 1.19%(4) | 1.20%(4) | 1.18%(4) | 1.21% | 1.26% |
| Net investment income | 0.86% | 1.13% | 0.94% | 0.63% | 0.57% |
| Portfolio Turnover | 35% | 35% | 33% | 31% | 29% |
| (1) | Computed using average shares outstanding. |
| (2) | Returns are historical and are calculated by determining the percentage change in net asset value with all distributions reinvested and do not reflect the effect of sales charges. |
| (3) | Total expenses do not reflect amounts reimbursed and/or waived by the adviser and certain of its affiliates, if applicable. Net expenses are net of all reductions and represent the net expenses paid by the Fund. |
| (4) | Includes a reduction by the investment adviser of a portion of its adviser and administration fee due to the Fund’s investment in the Liquidity Fund (equal to less than 0.005% of average daily net assets for the year ended August 31, 2024 and less than 0.01% of average daily net assets for the years ended August 31, 2023 and 2022). |
10
See Notes to Financial Statements.
Eaton Vance
Richard Bernstein Equity Strategy Fund
August 31, 2024
Financial Highlights — continued
| | Class C |
| | Year Ended August 31, |
| | 2024 | 2023 | 2022 | 2021 | 2020 |
| Net asset value — Beginning of year | $16.65 | $15.98 | $20.90 | $17.50 | $16.21 |
| Income (Loss) From Operations | | | | | |
| Net investment income (loss)(1) | $0.02 | $0.07 | $0.03 | $(0.03) | $(0.03) |
| Net realized and unrealized gain (loss) | 2.93 | 1.39 | (2.65) | 3.80 | 2.62 |
| Total income (loss) from operations | $2.95 | $1.46 | $(2.62) | $3.77 | $2.59 |
| Less Distributions | | | | | |
| From net investment income | $(0.04) | $— | $(0.19) | $— | $(0.02) |
| From net realized gain | (1.21) | (0.79) | (2.11) | (0.37) | (1.28) |
| Total distributions | $(1.25) | $(0.79) | $(2.30) | $(0.37) | $(1.30) |
| Net asset value — End of year | $18.35 | $16.65 | $15.98 | $20.90 | $17.50 |
| Total Return(2) | 18.82% | 9.59% | (14.18)% | 21.88% | 16.96% |
| Ratios/Supplemental Data | | | | | |
| Net assets, end of year (000’s omitted) | $21,704 | $24,526 | $32,995 | $54,977 | $67,549 |
| Ratios (as a percentage of average daily net assets):(3) | | | | | |
| Total expenses | 1.94% | 1.95% | 1.93% | 1.96% | 2.01% |
| Net expenses | 1.94%(4) | 1.95%(4) | 1.93%(4) | 1.96% | 2.01% |
| Net investment income (loss) | 0.12% | 0.42% | 0.17% | (0.15)% | (0.16)% |
| Portfolio Turnover | 35% | 35% | 33% | 31% | 29% |
| (1) | Computed using average shares outstanding. |
| (2) | Returns are historical and are calculated by determining the percentage change in net asset value with all distributions reinvested and do not reflect the effect of sales charges. |
| (3) | Total expenses do not reflect amounts reimbursed and/or waived by the adviser and certain of its affiliates, if applicable. Net expenses are net of all reductions and represent the net expenses paid by the Fund. |
| (4) | Includes a reduction by the investment adviser of a portion of its adviser and administration fee due to the Fund’s investment in the Liquidity Fund (equal to less than 0.005% of average daily net assets for the year ended August 31, 2024 and less than 0.01% of average daily net assets for the years ended August 31, 2023 and 2022). |
11
See Notes to Financial Statements.
Eaton Vance
Richard Bernstein Equity Strategy Fund
August 31, 2024
Financial Highlights — continued
| | Class I |
| | Year Ended August 31, |
| | 2024 | 2023 | 2022 | 2021 | 2020 |
| Net asset value — Beginning of year | $17.12 | $16.39 | $21.40 | $17.85 | $16.53 |
| Income (Loss) From Operations | | | | | |
| Net investment income(1) | $0.19 | $0.22 | $0.22 | $0.17 | $0.13 |
| Net realized and unrealized gain (loss) | 3.01 | 1.44 | (2.70) | 3.87 | 2.67 |
| Total income (loss) from operations | $3.20 | $1.66 | $(2.48) | $4.04 | $2.80 |
| Less Distributions | | | | | |
| From net investment income | $(0.23) | $(0.14) | $(0.42) | $(0.12) | $(0.20) |
| From net realized gain | (1.21) | (0.79) | (2.11) | (0.37) | (1.28) |
| Total distributions | $(1.44) | $(0.93) | $(2.53) | $(0.49) | $(1.48) |
| Net asset value — End of year | $18.88 | $17.12 | $16.39 | $21.40 | $17.85 |
| Total Return(2) | 19.99% | 10.68% | (13.27)% | 23.09% | 18.11% |
| Ratios/Supplemental Data | | | | | |
| Net assets, end of year (000’s omitted) | $519,198 | $531,680 | $557,452 | $667,963 | $548,888 |
| Ratios (as a percentage of average daily net assets):(3) | | | | | |
| Total expenses | 0.94% | 0.95% | 0.93% | 0.96% | 1.01% |
| Net expenses | 0.94%(4) | 0.95%(4) | 0.93%(4) | 0.96% | 1.01% |
| Net investment income | 1.11% | 1.36% | 1.19% | 0.87% | 0.83% |
| Portfolio Turnover | 35% | 35% | 33% | 31% | 29% |
| (1) | Computed using average shares outstanding. |
| (2) | Returns are historical and are calculated by determining the percentage change in net asset value with all distributions reinvested. |
| (3) | Total expenses do not reflect amounts reimbursed and/or waived by the adviser and certain of its affiliates, if applicable. Net expenses are net of all reductions and represent the net expenses paid by the Fund. |
| (4) | Includes a reduction by the investment adviser of a portion of its adviser and administration fee due to the Fund’s investment in the Liquidity Fund (equal to less than 0.005% of average daily net assets for the year ended August 31, 2024 and less than 0.01% of average daily net assets for the years ended August 31, 2023 and 2022). |
12
See Notes to Financial Statements.
Eaton Vance
Richard Bernstein Equity Strategy Fund
August 31, 2024
Notes to Financial Statements
1 Significant Accounting Policies
Eaton Vance Richard Bernstein Equity Strategy Fund (the Fund) is a diversified series of Eaton Vance Growth Trust (the Trust). The Trust is a Massachusetts business trust registered under the Investment Company Act of 1940, as amended (the 1940 Act), as an open-end management investment company. The Fund’s investment objective is to seek total return. The Fund offers three classes of shares. Class A shares are generally sold subject to a sales charge imposed at time of purchase. Class C shares are sold at net asset value and are generally subject to a contingent deferred sales charge (see Note 5). Effective November 5, 2020, Class C shares automatically convert to Class A shares eight years after their purchase as described in the Fund’s prospectus. Class I shares are sold at net asset value and are not subject to a sales charge. Each class represents a pro rata interest in the Fund, but votes separately on class-specific matters and (as noted below) is subject to different expenses. Realized and unrealized gains and losses and net investment income and losses, other than class-specific expenses, are allocated daily to each class of shares based on the relative net assets of each class to the total net assets of the Fund. Each class of shares differs in its distribution plan and certain other class-specific expenses.
The following is a summary of significant accounting policies of the Fund. The policies are in conformity with accounting principles generally accepted in the United States of America (U.S. GAAP). The Fund is an investment company and follows accounting and reporting guidance in the Financial Accounting Standards Board (FASB) Accounting Standards Codification Topic 946.
A Investment Valuation—The following methodologies are used to determine the market value or fair value of investments.
Equity Securities. Equity securities (common stocks and exchange-traded funds) listed on a U.S. securities exchange generally are valued at the last sale or closing price on the day of valuation or, if no sales took place on such date, at the mean between the closing bid and ask prices on the exchange where such securities are principally traded. Equity securities listed on the NASDAQ National Market System are valued at the NASDAQ official closing price. Unlisted or listed securities for which closing sales prices or closing quotations are not available are valued at the mean between the latest available bid and ask prices.
Foreign Securities and Currencies. Foreign securities and currencies are valued in U.S. dollars, based on foreign currency exchange rate quotations supplied by a third party pricing service. The pricing service uses a proprietary model to determine the exchange rate. Inputs to the model include reported trades and implied bid/ask spreads. The daily valuation of exchange-traded foreign securities generally is determined as of the close of trading on the principal exchange on which such securities trade. Events occurring after the close of trading on foreign exchanges may result in adjustments to the valuation of foreign securities to more accurately reflect their fair value as of the close of regular trading on the New York Stock Exchange. When valuing foreign equity securities that meet certain criteria, the Fund's Trustees have approved the use of a fair value service that values such securities to reflect market trading that occurs after the close of the applicable foreign markets of comparable securities or other instruments that have a strong correlation to the fair-valued securities.
Other. Investments in management investment companies (including money market funds) that do not trade on an exchange are valued at the net asset value as of the close of each business day.
Fair Valuation. In connection with Rule 2a-5 of the 1940 Act, the Trustees have designated the Fund’s investment adviser as its valuation designee. Investments for which valuations or market quotations are not readily available or are deemed unreliable are valued by the investment adviser, as valuation designee, at fair value using methods that most fairly reflect the security’s “fair value”, which is the amount that the Fund might reasonably expect to receive for the security upon its current sale in the ordinary course. Each such determination is based on a consideration of relevant factors, which are likely to vary from one pricing context to another. These factors may include, but are not limited to, the type of security, the existence of any contractual restrictions on the security’s disposition, the price and extent of public trading in similar securities of the issuer or of comparable companies or entities, quotations or relevant information obtained from broker/dealers or other market participants, information obtained from the issuer, analysts, and/or the appropriate stock exchange (for exchange-traded securities), an analysis of the company’s or entity’s financial statements, and an evaluation of the forces that influence the issuer and the market(s) in which the security is purchased and sold.
B Investment Transactions—Investment transactions for financial statement purposes are accounted for on a trade date basis. Realized gains and losses on investments sold are determined on the basis of identified cost.
C Income—Dividend income is recorded on the ex-dividend date for dividends received in cash and/or securities. However, if the ex-dividend date has passed, certain dividends from foreign securities are recorded as the Fund is informed of the ex-dividend date. Distributions from investment companies are recorded as dividend income, capital gains or return of capital based on the nature of the distribution. Withholding taxes on foreign dividends and capital gains have been provided for in accordance with the Fund's understanding of the applicable countries’ tax rules and rates. In consideration of recent decisions rendered by European courts, the Fund has filed additional tax reclaims for previously withheld taxes on dividends earned in certain European Union countries. These filings are subject to various administrative and judicial proceedings within these countries. Due to the uncertainty as to the ultimate resolution of these proceedings, the likelihood of receipt of these reclaims, and the potential timing of payment, no amounts are reflected in the financial statements for such outstanding reclaims.
D Federal Taxes—The Fund's policy is to comply with the provisions of the Internal Revenue Code applicable to regulated investment companies and to distribute to shareholders each year substantially all of its net investment income, and all or substantially all of its net realized capital gains. Accordingly, no provision for federal income or excise tax is necessary.
Eaton Vance
Richard Bernstein Equity Strategy Fund
August 31, 2024
Notes to Financial Statements — continued
As of August 31, 2024, the Fund had no uncertain tax positions that would require financial statement recognition, de-recognition, or disclosure. The Fund files a U.S. federal income tax return annually after its fiscal year-end, which is subject to examination by the Internal Revenue Service for a period of three years from the date of filing.
E Expenses—The majority of expenses of the Trust are directly identifiable to an individual fund. Expenses which are not readily identifiable to a specific fund are allocated taking into consideration, among other things, the nature and type of expense and the relative size of the funds. Expenses do not include the Fund’s pro rata share of the indirect expenses borne by the Fund from its investments in exchange-traded funds.
F Foreign Currency Translation—Investment valuations, other assets, and liabilities initially expressed in foreign currencies are translated each business day into U.S. dollars based upon current exchange rates. Purchases and sales of foreign investment securities and income and expenses denominated in foreign currencies are translated into U.S. dollars based upon currency exchange rates in effect on the respective dates of such transactions. Recognized gains or losses on investment transactions attributable to changes in foreign currency exchange rates are recorded for financial statement purposes as net realized gains and losses on investments. That portion of unrealized gains and losses on investments that results from fluctuations in foreign currency exchange rates is not separately disclosed.
G Use of Estimates—The preparation of the financial statements in conformity with U.S. GAAP requires management to make estimates and assumptions that affect the reported amounts of assets and liabilities at the date of the financial statements and the reported amounts of income and expense during the reporting period. Actual results could differ from those estimates.
H Indemnifications—Under the Trust’s organizational documents, its officers and Trustees may be indemnified against certain liabilities and expenses arising out of the performance of their duties to the Fund. Under Massachusetts law, if certain conditions prevail, shareholders of a Massachusetts business trust (such as the Trust) could be deemed to have personal liability for the obligations of the Trust. However, the Trust’s Declaration of Trust contains an express disclaimer of liability on the part of Fund shareholders and the By-laws provide that the Trust shall assume, upon request by the shareholder, the defense on behalf of any Fund shareholders. Moreover, the By-laws also provide for indemnification out of Fund property of any shareholder held personally liable solely by reason of being or having been a shareholder for all loss or expense arising from such liability. Additionally, in the normal course of business, the Fund enters into agreements with service providers that may contain indemnification clauses. The Fund’s maximum exposure under these arrangements is unknown as this would involve future claims that may be made against the Fund that have not yet occurred.
2 Distributions to Shareholders and Income Tax Information
It is the present policy of the Fund to make at least one distribution annually (normally in December) of all or substantially all of its net investment income and to distribute annually all or substantially all of its net realized capital gains. Distributions to shareholders are recorded on the ex-dividend date. Distributions are declared separately for each class of shares. Shareholders may reinvest income and capital gain distributions in additional shares of the same class of the Fund at the net asset value as of the ex-dividend date or, at the election of the shareholder, receive distributions in cash. Distributions to shareholders are determined in accordance with income tax regulations, which may differ from U.S. GAAP. As required by U.S. GAAP, only distributions in excess of tax basis earnings and profits are reported in the financial statements as a return of capital. Permanent differences between book and tax accounting relating to distributions are reclassified to paid-in capital. For tax purposes, distributions from short-term capital gains are considered to be from ordinary income.
The tax character of distributions declared for the years ended August 31, 2024 and August 31, 2023 was as follows:
| | Year Ended August 31, |
| | 2024 | 2023 |
| Ordinary income | $8,713,937 | $5,121,175 |
| Long-term capital gains | $48,951,165 | $33,564,636 |
During the year ended August 31, 2024, distributable earnings was decreased by $3,950,649 and paid-in capital was increased by $3,950,649 due to the Fund’s use of equalization accounting. Tax equalization accounting allows the Fund to treat as a distribution that portion of redemption proceeds representing a redeeming shareholder’s portion of undistributed taxable income and net capital gains. These reclassifications had no effect on the net assets or net asset value per share of the Fund.
Eaton Vance
Richard Bernstein Equity Strategy Fund
August 31, 2024
Notes to Financial Statements — continued
As of August 31, 2024, the components of distributable earnings (accumulated loss) on a tax basis were as follows:
| Undistributed ordinary income | $ 1,739,568 |
| Undistributed long-term capital gains | 15,342,313 |
| Net unrealized appreciation | 225,066,101 |
| Distributable earnings | $242,147,982 |
The cost and unrealized appreciation (depreciation) of investments of the Fund at August 31, 2024, as determined on a federal income tax basis, were as follows:
| Aggregate cost | $501,726,100 |
| Gross unrealized appreciation | $239,273,316 |
| Gross unrealized depreciation | (14,268,936) |
| Net unrealized appreciation | $225,004,380 |
3 Investment Adviser and Administration Fee and Other Transactions with Affiliates
The investment adviser and administration fee is earned by Eaton Vance Management (EVM), an indirect, wholly-owned subsidiary of Morgan Stanley, as compensation for investment advisory and administrative services rendered to the Fund. The investment adviser and administration fee is computed at an annual rate as a percentage of the Fund’s average daily net assets as follows and is payable monthly:
| Average Daily Net Assets | Annual Fee Rate |
| Up to $500 million | 0.850% |
| $500 million but less than $1 billion | 0.800% |
| $1 billion but less than $2.5 billion | 0.775% |
| $2.5 billion but less than $5 billion | 0.750% |
| $5 billion and over | 0.730% |
For the year ended August 31, 2024, the investment adviser and administration fee amounted to $5,856,074 or 0.84% of the Fund’s average daily net assets. Pursuant to an investment sub-advisory agreement, EVM has delegated the investment management of the Fund to Richard Bernstein Advisors LLC (RBA). EVM pays RBA a portion of its investment adviser and administration fee for sub-advisory services provided to the Fund.
The Fund may invest in a money market fund, the Institutional Class of the Morgan Stanley Institutional Liquidity Funds - Government Portfolio (the “Liquidity Fund”), an open-end management investment company managed by Morgan Stanley Investment Management Inc., a wholly-owned subsidiary of Morgan Stanley. The investment adviser and administration fee paid by the Fund is reduced by an amount equal to its pro rata share of the advisory and administration fees paid by the Fund due to its investment in the Liquidity Fund. For the year ended August 31, 2024, the investment adviser and administration fee paid was reduced by $24,839 relating to the Fund’s investment in the Liquidity Fund.
EVM provides sub-transfer agency and related services to the Fund pursuant to a Sub-Transfer Agency Support Services Agreement. For the year ended August 31, 2024, EVM earned $10,824 from the Fund pursuant to such agreement, which is included in transfer and dividend disbursing agent fees on the Statement of Operations. The Fund was informed that Eaton Vance Distributors, Inc. (EVD), an affiliate of EVM and the Fund’s principal underwriter, received $1,788 as its portion of the sales charge on sales of Class A shares for the year ended August 31, 2024. The Fund was informed that Morgan Stanley affiliated broker-dealers, which may be deemed to be affiliates of EVM and EVD, also received a portion of the sales charge on sales of Class A shares for the year ended August 31, 2024 in the amount of $623. EVD also received distribution and service fees from Class A and Class C shares (see Note 4) and contingent deferred sales charges (see Note 5).
Trustees and officers of the Fund who are members of EVM’s organization receive remuneration for their services to the Fund out of the investment adviser and administration fee. Trustees of the Fund who are not affiliated with EVM may elect to defer receipt of all or a percentage of their annual fees in accordance with the terms of the Trustees Deferred Compensation Plan. Certain officers and Trustees of the Fund are officers of EVM.
Eaton Vance
Richard Bernstein Equity Strategy Fund
August 31, 2024
Notes to Financial Statements — continued
4 Distribution Plans
The Fund has in effect a distribution plan for Class A shares (Class A Plan) pursuant to Rule 12b-1 under the 1940 Act. Pursuant to the Class A Plan, the Fund pays EVD a distribution and service fee of 0.25% per annum of its average daily net assets attributable to Class A shares for distribution services and facilities provided to the Fund by EVD, as well as for personal services and/or the maintenance of shareholder accounts. Distribution and service fees paid or accrued to EVD for the year ended August 31, 2024 amounted to $430,376 for Class A shares.
The Fund also has in effect a distribution plan for Class C shares (Class C Plan) pursuant to Rule 12b-1 under the 1940 Act. Pursuant to the Class C Plan, the Fund pays EVD amounts equal to 0.75% per annum of its average daily net assets attributable to Class C shares for providing ongoing distribution services and facilities to the Fund. For the year ended August 31, 2024, the Fund paid or accrued to EVD $171,240 for Class C shares.
Pursuant to the Class C Plan, the Fund also makes payments of service fees to EVD, financial intermediaries and other persons in amounts equal to 0.25% per annum of its average daily net assets attributable to that class. Service fees paid or accrued are for personal services and/or the maintenance of shareholder accounts. They are separate and distinct from the sales commissions and distribution fees payable to EVD. Service fees paid or accrued for the year ended August 31, 2024 amounted to $57,080 for Class C shares.
Distribution and service fees are subject to the limitations contained in the Financial Industry Regulatory Authority Rule 2341(d).
5 Contingent Deferred Sales Charges
A contingent deferred sales charge (CDSC) of 1% generally is imposed on redemptions of Class C shares made within 12 months of purchase. Class A shares may be subject to a 1% CDSC if redeemed within 12 months of purchase (depending on the circumstances of purchase). Generally, the CDSC is based upon the lower of the net asset value at date of redemption or date of purchase. No charge is levied on shares acquired by reinvestment of dividends or capital gain distributions. For the year ended August 31, 2024, the Fund was informed that EVD received less than $100 and $4,258 of CDSCs paid by Class A and Class C shareholders, respectively.
6 Purchases and Sales of Investments
Purchases and sales of investments, other than short-term obligations, aggregated $240,577,749 and $364,046,591, respectively, for the year ended August 31, 2024.
7 Shares of Beneficial Interest
The Fund’s Declaration of Trust permits the Trustees to issue an unlimited number of full and fractional shares of beneficial interest (without par value). Such shares may be issued in a number of different series (such as the Fund) and classes. Transactions in Fund shares, including direct exchanges pursuant to share class conversions, were as follows:
| | Year Ended
August 31, 2024 | | Year Ended
August 31, 2023 |
| | Shares | Amount | | Shares | Amount |
| Class A | | | | | |
| Sales | 1,087,039 | $ 18,363,923 | | 1,168,537 | $ 18,911,163 |
| Issued to shareholders electing to receive payments of distributions in Fund shares | 443,440 | 7,272,419 | | 296,054 | 4,621,402 |
| Redemptions | (1,889,904) | (32,621,200) | | (1,728,343) | (28,259,399) |
| Net decrease | (359,425) | $ (6,984,858) | | (263,752) | $ (4,726,834) |
| Class C | | | | | |
| Sales | 151,972 | $ 2,492,409 | | 147,260 | $ 2,311,448 |
| Issued to shareholders electing to receive payments of distributions in Fund shares | 80,538 | 1,293,440 | | 68,898 | 1,053,450 |
| Redemptions | (522,288) | (8,750,810) | | (807,816) | (12,870,080) |
| Net decrease | (289,778) | $ (4,964,961) | | (591,658) | $ (9,505,182) |
Eaton Vance
Richard Bernstein Equity Strategy Fund
August 31, 2024
Notes to Financial Statements — continued
| | Year Ended
August 31, 2024 | | Year Ended
August 31, 2023 |
| | Shares | Amount | | Shares | Amount |
| Class I | | | | | |
| Sales | 4,433,039 | $ 74,872,405 | | 7,059,328 | $114,030,021 |
| Issued to shareholders electing to receive payments of distributions in Fund shares | 1,151,400 | 18,894,477 | | 851,357 | 13,289,687 |
| Redemptions | (9,134,668) | (156,086,743) | | (10,873,111) | (176,500,965) |
| Net decrease | (3,550,229) | $(62,319,861) | | (2,962,426) | $(49,181,257) |
8 Line of Credit
The Fund participates with other portfolios and funds managed by EVM and its affiliates in a $650 million unsecured revolving line of credit agreement with a group of banks, which is in effect through October 22, 2024. In connection with the renewal of the agreement on October 24, 2023, the borrowing limit was decreased from $725 million. Borrowings are made by the Fund solely for temporary purposes related to redemptions and other short-term cash needs. Interest is charged to the Fund based on its borrowings at an amount above either the Secured Overnight Financing Rate (SOFR) or Federal Funds rate. In addition, a fee computed at an annual rate of 0.15% on the daily unused portion of the line of credit is allocated among the participating portfolios and funds at the end of each quarter. In connection with the renewal of the agreement in October 2023, an arrangement fee of $150,000 was incurred that was allocated to the participating portfolios and funds. Because the line of credit is not available exclusively to the Fund, it may be unable to borrow some or all of its requested amounts at any particular time. The Fund did not have any significant borrowings or allocated fees during the year ended August 31, 2024.
9 Securities Lending Agreement
The Fund has established a securities lending agreement with State Street Bank and Trust Company (SSBT) as securities lending agent in which the Fund lends portfolio securities to qualified borrowers in exchange for collateral consisting of either cash or securities issued or guaranteed by the U.S. government or its agencies or instrumentalities in an amount at least equal to the market value of the securities on loan. The market value of securities loaned is determined daily and any additional required collateral is delivered to the Fund on the next business day. Cash collateral is invested in the State Street Navigator Securities Lending Government Money Market Portfolio, a money market fund registered under the 1940 Act. The Fund earns interest on the amount invested but it must pay (and at times receive from) the broker a loan rebate fee computed as a varying percentage of the collateral received. For security loans secured by non-cash collateral, the Fund earns a negotiated lending fee from the borrower. A portion of the income earned by the Fund from its investment of cash collateral, net of rebate fees, and lending fees received is allocated to SSBT for its services as lending agent and the portion allocated to the Fund is presented as securities lending income, net on the Statement of Operations. Non-cash collateral is held by the lending agent on behalf of the Fund and cannot be sold or re-pledged by the Fund; accordingly, such collateral is not reflected in the Statement of Assets and Liabilities.
The Fund is subject to possible delay in the recovery of loaned securities. Pursuant to the securities lending agreement, SSBT has provided indemnification to the Fund in the event of default by a borrower with respect to a loan. The Fund bears the risk of loss with respect to the investment of cash collateral.
At August 31, 2024, the value of the securities loaned and the value of the collateral received, which exceeded the value of the securities loaned, amounted to $47,223,142 and $48,517,317, respectively. Collateral received was comprised of cash of $5,923,596 and U.S. government and/or agencies securities of $42,593,721. The securities lending transactions have no contractual maturity date and each of the Fund and borrower has the option to terminate a loan at any time.
The following table provides a breakdown of securities lending transactions accounted for as secured borrowings, the obligations by class of collateral pledged, and the remaining contractual maturity of those transactions as of August 31, 2024.
| | Remaining Contractual Maturity of the Transactions |
| | Overnight and
Continuous | <30 days | 30 to 90 days | >90 days | Total |
| Common Stocks | $5,850,171 | $ — | $ — | $ — | $5,850,171 |
| Exchange-Traded Funds | 73,425 | — | — | — | 73,425 |
| Total | $5,923,596 | $ — | $ — | $ — | $5,923,596 |
Eaton Vance
Richard Bernstein Equity Strategy Fund
August 31, 2024
Notes to Financial Statements — continued
The carrying amount of the liability for collateral for securities loaned at August 31, 2024 approximated its fair value. If measured at fair value, such liability would have been considered as Level 2 in the fair value hierarchy (see Note 11) at August 31, 2024.
10 Affiliated Investments
At August 31, 2024, the value of the Fund's investment in funds that may be deemed to be affiliated was $16,101,587, which represents 2.3% of the Fund's net assets. Transactions in such investments by the Fund for the year ended August 31, 2024 were as follows:
| Name | Value,
beginning
of period | Purchases | Sales
proceeds | Net realized
gain (loss) | Change in
unrealized
appreciation
(depreciation) | Value, end
of period | Dividend
income | Shares,
end of period |
| Short-Term Investments |
| Liquidity Fund | $16,967,233 | $135,401,606 | $(136,267,252) | $ — | $ — | $16,101,587 | $881,466 | 16,101,587 |
11 Fair Value Measurements
Under generally accepted accounting principles for fair value measurements, a three-tier hierarchy to prioritize the assumptions, referred to as inputs, is used in valuation techniques to measure fair value. The three-tier hierarchy of inputs is summarized in the three broad levels listed below.
| • | Level 1 – quoted prices in active markets for identical investments |
| • | Level 2 – other significant observable inputs (including quoted prices for similar investments, interest rates, prepayment speeds, credit risk, etc.) |
| • | Level 3 – significant unobservable inputs (including a fund's own assumptions in determining the fair value of investments) |
In cases where the inputs used to measure fair value fall in different levels of the fair value hierarchy, the level disclosed is determined based on the lowest level input that is significant to the fair value measurement in its entirety. The inputs or methodology used for valuing securities are not necessarily an indication of the risk associated with investing in those securities.
At August 31, 2024, the hierarchy of inputs used in valuing the Fund's investments, which are carried at fair value, were as follows:
| Asset Description | Level 1 | Level 2 | Level 3 | Total |
| Common Stocks: | | | | |
| Communication Services | $ 30,939,274 | $ — | $ — | $ 30,939,274 |
| Consumer Discretionary | 32,187,347 | 8,124,635 | — | 40,311,982 |
| Consumer Staples | 10,708,645 | 18,782,062 | — | 29,490,707 |
| Energy | 43,291,599 | 3,351,023 | — | 46,642,622 |
| Financials | 79,288,943 | 10,876,601 | — | 90,165,544 |
| Health Care | 57,987,560 | 24,522,489 | — | 82,510,049 |
| Industrials | 74,114,188 | 13,026,619 | — | 87,140,807 |
| Information Technology | 114,471,874 | 5,369,277 | — | 119,841,151 |
| Materials | 26,170,328 | 6,720,942 | — | 32,891,270 |
| Real Estate | 9,581,909 | — | — | 9,581,909 |
| Utilities | 6,122,152 | 4,290,526 | — | 10,412,678 |
| Total Common Stocks | $484,863,819 | $95,064,174* | $ — | $579,927,993 |
| Exchange-Traded Funds | $124,777,304 | $ — | $ — | $124,777,304 |
| Short-Term Investments: | | | | |
| Affiliated Fund | 16,101,587 | — | — | 16,101,587 |
Eaton Vance
Richard Bernstein Equity Strategy Fund
August 31, 2024
Notes to Financial Statements — continued
| Asset Description (continued) | Level 1 | Level 2 | Level 3 | Total |
| Securities Lending Collateral | $ 5,923,596 | $ — | $ — | $ 5,923,596 |
| Total Investments | $631,666,306 | $ 95,064,174 | $ — | $726,730,480 |
| * | Includes foreign equity securities whose values were adjusted to reflect market trading of comparable securities or other correlated instruments that occurred after the close of trading in their applicable foreign markets. |
12 Risks and Uncertainties
Risks Associated with Foreign Investments
Foreign investments can be adversely affected by political, economic and market developments abroad, including the imposition of economic and other sanctions by the United States or another country, and by acts of terrorism and war. There may be less publicly available information about foreign issuers because they may not be subject to reporting practices, requirements or regulations comparable to those to which United States companies are subject. Foreign markets may be smaller, less liquid and more volatile than the major markets in the United States. Trading in foreign markets typically involves higher expense than trading in the United States. The Fund may have difficulties enforcing its legal or contractual rights in a foreign country. Securities that trade or are denominated in currencies other than the U.S. dollar may be adversely affected by fluctuations in currency exchange rates.
Eaton Vance
Richard Bernstein Equity Strategy Fund
August 31, 2024
Report of Independent Registered Public Accounting Firm
To the Trustees of Eaton Vance Growth Trust and Shareholders of Eaton Vance Richard Bernstein Equity Strategy Fund:
Opinion on the Financial Statements and Financial Highlights
We have audited the accompanying statement of assets and liabilities of Eaton Vance Richard Bernstein Equity Strategy Fund (the "Fund") (one of the funds constituting Eaton Vance Growth Trust), including the portfolio of investments, as of August 31, 2024, the related statement of operations for the year then ended, the statements of changes in net assets for each of the two years in the period then ended, the financial highlights for each of the five years in the period then ended, and the related notes. In our opinion, the financial statements and financial highlights present fairly, in all material respects, the financial position of the Fund as of August 31, 2024, and the results of its operations for the year then ended, the changes in its net assets for each of the two years in the period then ended, and the financial highlights for each of the five years in the period then ended, in conformity with accounting principles generally accepted in the United States of America.
Basis for Opinion
These financial statements and financial highlights are the responsibility of the Fund's management. Our responsibility is to express an opinion on the Fund's financial statements and financial highlights based on our audits. We are a public accounting firm registered with the Public Company Accounting Oversight Board (United States) (PCAOB) and are required to be independent with respect to the Fund in accordance with the U.S. federal securities laws and the applicable rules and regulations of the Securities and Exchange Commission and the PCAOB.
We conducted our audits in accordance with the standards of the PCAOB. Those standards require that we plan and perform the audit to obtain reasonable assurance about whether the financial statements and financial highlights are free of material misstatement, whether due to error or fraud. The Fund is not required to have, nor were we engaged to perform, an audit of its internal control over financial reporting. As part of our audits, we are required to obtain an understanding of internal control over financial reporting but not for the purpose of expressing an opinion on the effectiveness of the Fund’s internal control over financial reporting. Accordingly, we express no such opinion.
Our audits included performing procedures to assess the risks of material misstatement of the financial statements and financial highlights, whether due to error or fraud, and performing procedures that respond to those risks. Such procedures included examining, on a test basis, evidence regarding the amounts and disclosures in the financial statements and financial highlights. Our audits also included evaluating the accounting principles used and significant estimates made by management, as well as evaluating the overall presentation of the financial statements and financial highlights. Our procedures included confirmation of securities owned as of August 31, 2024, by correspondence with the custodian and brokers; when replies were not received from brokers, we performed other auditing procedures. We believe that our audits provide a reasonable basis for our opinion.
/s/ Deloitte & Touche LLP
Boston, Massachusetts
October 17, 2024
We have served as the auditor of one or more Eaton Vance investment companies since 1959.
Eaton Vance
Richard Bernstein Equity Strategy Fund
August 31, 2024
Federal Tax Information (Unaudited)
The Form 1099-DIV you receive in February 2025 will show the tax status of all distributions paid to your account in calendar year 2024. Shareholders are advised to consult their own tax adviser with respect to the tax consequences of their investment in the Fund. As required by the Internal Revenue Code and/or regulations, shareholders must be notified regarding the status of qualified dividend income for individuals, the dividends received deduction for corporations and capital gains dividends.
Qualified Dividend Income. For the fiscal year ended August 31, 2024, the Fund designates approximately $11,392,678, or up to the maximum amount of such dividends allowable pursuant to the Internal Revenue Code, as qualified dividend income eligible for the reduced tax rate of 15%.
Dividends Received Deduction. Corporate shareholders are generally entitled to take the dividends received deduction on the portion of the Fund’s dividend distribution that qualifies under tax law. For the Fund’s fiscal 2024 ordinary income dividends, 71.03% qualifies for the corporate dividends received deduction.
Capital Gains Dividends. The Fund hereby designates as a capital gain dividend with respect to the taxable year ended August 31, 2024, $23,537,862
or, if subsequently determined to be different, the net capital gain of such year.
Eaton Vance
Richard Bernstein Equity Strategy Fund
August 31, 2024
Board of Trustees’ Contract Approval
Overview of the Contract Review Process
The Investment Company Act of 1940, as amended (the “1940 Act”), provides, in substance, that the investment advisory agreement between a fund and its investment adviser will continue in effect from year-to-year only if its continuation is approved on an annual basis by a vote of the fund’s board of trustees, including a majority of the trustees who are not “interested persons” of the fund (“independent trustees”), cast in person at a meeting called for the purpose of considering such approval.
At a meeting held on June 6, 2024, the Boards of Trustees/Directors (collectively, the “Board”) that oversee the registered investment companies advised by Eaton Vance Management or its affiliate, Boston Management and Research (the “Eaton Vance Funds”), including a majority of the independent trustees (the “Independent Trustees”), voted to approve the continuation of existing investment advisory agreements and sub-advisory agreements1 for each of the Eaton Vance Funds for an additional one-year period. The Board relied upon the affirmative recommendation of its Contract Review Committee, which is a committee comprised of all of the Independent Trustees. Prior to making its recommendation, the Contract Review Committee reviewed information furnished by the adviser and sub-adviser to each of the Eaton Vance Funds (including information specifically requested by the Board) for a series of meetings held between April and June 2024, as well as certain additional information provided in response to specific requests from the Independent Trustees as members of the Contract Review Committee. Members of the Contract Review Committee also considered information received at prior meetings of the Board and its committees, to the extent such information was relevant to the Contract Review Committee’s annual evaluation of the investment advisory agreements and sub-advisory agreements.
In connection with its evaluation of the investment advisory agreements and sub-advisory agreements, the Board considered various information relating to the Eaton Vance Funds. This included information applicable to all or groups of Eaton Vance Funds, which is referenced immediately below, and information applicable to the particular Eaton Vance Fund covered by this report (each “Eaton Vance Fund” is referred to below as a “fund”). (For funds that invest through one or more underlying portfolios, references to “each fund” in this section may include information that was considered at the portfolio-level.)
Information about Fees, Performance and Expenses
• A report from an independent data provider comparing advisory and other fees paid by each fund to such fees paid by comparable funds, as identified by the independent data provider (“comparable funds”);
• A report from an independent data provider comparing each fund’s total expense ratio (and its components) to those of comparable funds;
• A report from an independent data provider comparing the investment performance of each fund (including, as relevant, total return data, income data, Sharpe ratios, and information ratios) to the investment performance of comparable funds and, as applicable, benchmark indices, over various time periods;
• In certain instances, data regarding investment performance relative to customized groups of peer funds and blended indices identified by the adviser in consultation with the Portfolio Management Committee of the Board (a committee exclusively comprised of Independent Trustees);
• Comparative information concerning the fees charged and services provided by the adviser and sub-adviser to each fund in managing other accounts (which may include other funds, collective investment trusts and institutional accounts) with the same or substantially similar investment objective as the fund and with a significant overlap in holdings based on criteria set by the Board, if any;
• Profitability analyses with respect to the adviser and sub-adviser to each of the funds;
Information about Portfolio Management and Trading
• Descriptions of the investment management services provided to each fund, as well as each of the funds’ investment strategies and policies;
• The procedures and processes used by the adviser to determine the value of fund assets, including, when necessary, the determination of “fair value” by the adviser in its role as each funds’ valuation designee and actions taken to monitor and test the effectiveness of such procedures and processes;
• Information about the policies and practices of each fund’s adviser and sub-adviser with respect to trading, including their processes for seeking best execution of portfolio transactions;
• Information about the allocation of brokerage transactions and the benefits, if any, received by the adviser and sub-adviser to each fund as a result of brokerage allocation, including, as applicable, information concerning the acquisition of research through client commission arrangements and policies with respect to “soft dollars”;
• Data relating to the portfolio turnover rate of each fund and related information regarding active management in the context of particular strategies;
Information about each Adviser and Sub-adviser
• Reports detailing the financial results and condition of the adviser and sub-adviser to each fund;
1 Not all Eaton Vance Funds have entered into a sub-advisory agreement with a sub-adviser. Accordingly, references to “sub-adviser” or “sub-advisory agreement” in this “Overview” section may not be applicable to the particular Eaton Vance Fund covered by this report. Eaton Vance Management and Boston Management and Research are referred to collectively as the “adviser.”
Eaton Vance
Richard Bernstein Equity Strategy Fund
August 31, 2024
Board of Trustees’ Contract Approval — continued
• Information regarding the individual investment professionals whose responsibilities include portfolio management and investment research for the funds, and, for portfolio managers and certain other investment professionals, information relating to their responsibilities with respect to managing other funds and investment accounts, as applicable;
• Information regarding the adviser’s and its parent company’s (Morgan Stanley’s) efforts to retain and attract talented investment professionals, including in the context of a competitive marketplace for talent;
• Information regarding the adviser’s compensation methodology for its investment professionals and the incentives and accountability it creates, along with investment professionals’ investments in the fund(s) they manage;
• The personal trading codes of ethics of the adviser and its affiliates and the sub-adviser of each fund, together with information relating to compliance with, and the administration of, such codes;
• Policies and procedures relating to proxy voting, including regular reporting with respect to fund proxy voting activities;
• Information regarding the handling of corporate actions and class actions, as well as information regarding litigation and other regulatory matters;
• Information concerning the resources devoted to compliance efforts undertaken by the adviser and its affiliates and the sub-adviser of each fund, including descriptions of their various compliance programs and their record of compliance and remediation;
• Information concerning the business continuity and disaster recovery plans of the adviser and its affiliates and the sub-adviser of each fund;
• A description of the adviser’s oversight of sub-advisers, including with respect to regulatory and compliance issues, investment management and other matters;
Other Relevant Information
• Information regarding ongoing initiatives to further integrate and harmonize, where applicable, the investment management and other departments of the adviser and its affiliates with the overall investment management infrastructure of Morgan Stanley, in light of Morgan Stanley’s acquisition of Eaton Vance Corp. on March 1, 2021;
• Information concerning the nature, cost, and character of the administrative and other non-investment advisory services provided by the adviser and its affiliates;
• Information concerning oversight of the relationship with the custodian, subcustodians, fund accountants, and other third-party service providers by the adviser and/or administrator to each of the funds;
• Information concerning efforts to implement policies and procedures with respect to various regulations applicable to the funds, including Rule 12d1-4 (the Fund-of-Funds Rule), Rule 18f-4 (the Derivatives Rule), and Rule 2a-5 (the Fair Valuation Rule);
• For an Eaton Vance Fund structured as an exchange-listed closed-end fund, information concerning the benefits of the closed-end fund structure, as well as, where relevant, the closed-end fund’s market prices (including as compared to the closed-end fund’s net asset value (NAV)), trading volume data, continued use of auction preferred shares (where applicable), distribution rates, and other relevant matters;
• The risks that the adviser and/or its affiliates incur in connection with the management and operation of the funds, including, among others, litigation, regulatory, entrepreneurial, and other business risks (and the associated costs of such risks); and
• The terms of each investment advisory agreement and sub-advisory agreement.
During the various meetings of the Board and its committees over the course of the year leading up to the June 6, 2024 meeting, the Board and its committees received information from portfolio managers and other investment professionals of the adviser and sub-advisers of the funds regarding investment and performance matters, and considered various investment and trading strategies used in pursuing the funds’ investment objectives. The Board and its committees also received information regarding risk management techniques employed in connection with the management of the funds. The Board and its committees evaluated issues pertaining to industry and regulatory developments, compliance procedures, fund governance, and other issues with respect to the funds, and received and participated in reports and presentations provided by the adviser and sub-advisers, with respect to such matters. In addition to the formal meetings of the Board and its committees, the Independent Trustees held regular video or telephone conferences to discuss, among other topics, matters relating to the continuation of investment advisory agreements and sub-advisory agreements.
The Contract Review Committee was advised throughout the contract review process by Kirkland & Ellis LLP, independent legal counsel for the Independent Trustees. The members of the Contract Review Committee, with the advice of such counsel, exercised their own business judgment in determining the material factors to be considered in evaluating each investment advisory agreement and sub-advisory agreement and the weight to be given to each such factor. The conclusions reached with respect to each investment advisory agreement and sub-advisory agreement were based on a comprehensive evaluation of all the information provided and not any single factor. Moreover, each member of the Contract Review Committee may have placed varying emphasis on particular factors in reaching conclusions with respect to each investment advisory agreement and sub-advisory agreement. In evaluating each investment advisory agreement and sub-advisory agreement, including the fee structures and other terms contained in such agreements, the members of the Contract Review Committee were also informed by multiple years of analysis and discussion with the adviser and sub-adviser to each of the Eaton Vance Funds.
Results of the Contract Review Process
Based on its consideration of the foregoing, and such other information it deemed relevant, including the factors and conclusions described below, the Contract Review Committee concluded that the continuation of the investment advisory and administrative agreement between Eaton Vance Richard Bernstein Equity Strategy Fund (the “Fund”) and Eaton Vance Management (the “Adviser”) and the sub-advisory agreement between the Adviser and
Eaton Vance
Richard Bernstein Equity Strategy Fund
August 31, 2024
Board of Trustees’ Contract Approval — continued
Richard Bernstein Advisors LLC (the “Sub-adviser”), with respect to the Fund, including their respective fee structures, are in the interests of shareholders and, therefore, recommended to the Board approval of each agreement. Based on the recommendation of the Contract Review Committee, the Board, including a majority of the Independent Trustees, voted to approve continuation of the investment advisory and administrative agreement and the sub-advisory agreement for the Fund.
Nature, Extent and Quality of Services
In considering whether to approve the investment advisory and administrative agreement and the sub-advisory agreement for the Fund, the Board evaluated the nature, extent and quality of services provided to the Fund by the Adviser and the Sub-adviser.
The Board considered the Adviser’s and the Sub-adviser’s management capabilities and investment processes in light of the types of investments held by the Fund, including the education and experience of the investment professionals who provide services to the Fund. Regarding the Adviser, the Board considered the Adviser’s responsibilities with respect to oversight of the Sub-adviser and coordinating activities in implementing the Fund’s investment strategies. With respect to the Sub-adviser, the Board took into account the resources available to the Sub-adviser in fulfilling its duties under the sub-advisory agreement and the principal elements of the investment process and portfolio construction techniques employed by the Sub-adviser. The Board also took into account the resources dedicated to portfolio management and other services, the compensation methods of the Adviser and other factors, including the reputation and resources of the Adviser to recruit and retain highly qualified research, advisory and supervisory investment professionals. In addition, the Board considered the time and attention devoted to the Eaton Vance Funds, including the Fund, by senior management, as well as the infrastructure, operational capabilities and support staff in place to assist in the portfolio management and operations of the Fund, including the provision of administrative services. The Board also considered the business-related and other risks to which the Adviser or its affiliates may be subject in managing the Fund.
The Board considered the compliance programs of the Adviser, the Sub-adviser and relevant affiliates thereof. The Board considered compliance and reporting matters regarding, among other things, personal trading by investment professionals, disclosure of portfolio holdings, compliance with policies and procedures, portfolio valuation, business continuity and the allocation of investment opportunities. The Board also considered relevant examinations of the Adviser and its affiliates by regulatory authorities, such as the Securities and Exchange Commission and the Financial Industry Regulatory Authority.
The Board considered other administrative services provided or overseen by Eaton Vance Management and its affiliates, including transfer agency and accounting services. The Board evaluated the benefits to shareholders of investing in a fund that is a part of a large fund complex offering exposure to a variety of asset classes and investment disciplines, as well as the ability, in many cases, to exchange an investment among different funds without incurring additional sales charges.
After consideration of the foregoing factors, among others, the Board concluded that the nature, extent and quality of services provided by the Adviser and the Sub-adviser, taken as a whole, are appropriate and consistent with the terms of the investment advisory and administrative agreement and the sub-advisory agreement.
Fund Performance
The Board compared the Fund’s investment performance to that of comparable funds identified by an independent data provider (the peer group), as well as an appropriate benchmark index. The Board’s review included comparative performance data with respect to the Fund for the one-, three-, five- and ten-year periods ended December 31, 2023. In this regard, the Board noted that the performance of the Fund was lower than the median performance of the Fund’s peer group for the three-year period. The Board also noted that the performance of the Fund was lower than its benchmark index for the three-year period. On the basis of the foregoing, the performance of the Fund over other periods, and other relevant information provided by the Adviser in response to requests from the Contract Review Committee, the Board concluded that the performance of the Fund was satisfactory.
Management Fees and Expenses
The Board considered contractual fee rates payable by the Fund for advisory and administrative services (referred to collectively as “management fees”). As part of its review, the Board considered the Fund’s management fees and total expense ratio for the one-year period ended December 31, 2023, as compared to those of comparable funds, before and after giving effect to any undertaking to waive fees or reimburse expenses. The Board also considered certain factors identified by management in response to requests from the Contract Review Committee regarding the Fund’s total expense ratio relative to comparable funds. The Board also received and considered information about the services offered and the fee rates charged by the Adviser and/or Sub-adviser to other types of accounts with the same or substantially similar investment objective as the Fund and with a significant overlap in holdings based on criteria set by the Board. For any such type of account, the Board received information about the differences in the nature and scope of services the Adviser and/or Sub-adviser provide to the Fund as compared to other type of account and the material differences in compliance, reporting and other legal burdens and risks to the Adviser and/or Sub-adviser as between the Fund and other type of account. The Board also considered that the management fees paid by the Fund are for services provided in addition to, and are not duplicative of, services provided under the advisory contract(s) of the exchange traded funds in which the Fund may invest.
After considering the foregoing information, and in light of the nature, extent and quality of the services provided by the Adviser and the Sub-adviser, the Board concluded that the management fees charged for advisory and related services are reasonable.
Eaton Vance
Richard Bernstein Equity Strategy Fund
August 31, 2024
Board of Trustees’ Contract Approval — continued
Profitability and “Fall-Out” Benefits
The Board considered the level of profits realized by the Adviser and relevant affiliates thereof in providing investment advisory and administrative services to the Fund and to all Eaton Vance Funds as a group. The Board considered the level of profits realized without regard to marketing support or other payments by the Adviser and its affiliates to third parties in respect of distribution or other services.
The Board concluded that, in light of the foregoing factors and the nature, extent and quality of the services rendered, the profits realized by the Adviser and its affiliates are not excessive. The Board also concluded that, in light of its role as a sub-adviser not affiliated with the Adviser, the Sub-adviser’s expected profitability in managing the Fund was not a material factor.
The Board also considered direct or indirect fall-out benefits received by the Adviser and its affiliates in connection with their respective relationships with the Fund, including the benefits of research services that may be available to the Adviser as a result of securities transactions effected for the Fund and other investment advisory clients.
Economies of Scale
In reviewing management fees and profitability, the Board also considered the extent to which the Adviser and its affiliates, on the one hand, and the Fund, on the other hand, can expect to realize benefits from economies of scale as the assets of the Fund increase. The Board acknowledged the difficulty in accurately measuring the benefits resulting from economies of scale, if any, with respect to the management of any specific fund or group of funds. To assist in the evaluation of the sharing of any economies of scale, the Board received data showing for recent years, asset levels, Adviser profitability and total expense ratios. Based upon the foregoing, the Board concluded that the Fund currently shares in the benefits from economies of scale, if any, when they are realized by the Adviser. The Board also concluded that the structure of the advisory fee, which includes breakpoints at several asset levels, will allow the Fund to continue to benefit from any economies of scale in the future.
This Page Intentionally Left Blank
This Page Intentionally Left Blank
This Page Intentionally Left Blank
Eaton Vance
Richard Bernstein All Asset Strategy Fund
Annual Financial Statements and Additional Information
August 31, 2024
This report must be preceded or accompanied by a current summary prospectus or prospectus. Before investing, investors should consider carefully the investment objective, risks, and charges and expenses of a mutual fund. This and other important information is contained in the prospectus and/or statement of additional information, which can be obtained by calling 1-800-262-1122 or from a financial intermediary. Prospective investors should read the prospectus carefully before investing.
Annual Financial Statements and Additional Information August 31, 2024
Eaton Vance
Richard Bernstein All Asset Strategy Fund
Eaton Vance
Richard Bernstein All Asset Strategy Fund
August 31, 2024
| Security | Shares | Value |
| Aerospace & Defense — 1.0% |
| Airbus SE | | 3,240 | $ 497,711 |
| BAE Systems PLC | | 33,836 | 608,363 |
| Boeing Co.(1) | | 1,527 | 265,301 |
| General Dynamics Corp. | | 1,774 | 531,065 |
| General Electric Co. | | 5,014 | 875,545 |
| Howmet Aerospace, Inc. | | 2,952 | 285,340 |
| L3Harris Technologies, Inc. | | 1,215 | 287,554 |
| Lockheed Martin Corp. | | 507 | 288,027 |
| Northrop Grumman Corp. | | 712 | 372,525 |
| RTX Corp. | | 2,520 | 310,817 |
| | | | $ 4,322,248 |
| Air Freight & Logistics — 0.2% |
| FedEx Corp. | | 1,265 | $ 377,944 |
| United Parcel Service, Inc., Class B | | 2,230 | 286,667 |
| | | | $ 664,611 |
| Automobiles — 0.7% |
| Ford Motor Co. | | 30,348 | $ 339,594 |
| Mercedes-Benz Group AG | | 7,613 | 524,726 |
| Tesla, Inc.(1) | | 6,598 | 1,412,698 |
| Toyota Motor Corp. | | 28,200 | 538,421 |
| | | | $ 2,815,439 |
| Banks — 1.3% |
| Bank of America Corp. | | 20,862 | $ 850,126 |
| BNP Paribas SA | | 5,907 | 408,573 |
| Citigroup, Inc. | | 6,361 | 398,453 |
| Citizens Financial Group, Inc. | | 13,251 | 570,456 |
| Eastern Bankshares, Inc. | | 27,663 | 469,441 |
| FB Financial Corp. | | 12,791 | 616,782 |
| First Hawaiian, Inc. | | 24,943 | 606,863 |
| JPMorgan Chase & Co. | | 1,886 | 423,973 |
| Stellar Bancorp, Inc. | | 15,610 | 425,685 |
| Veritex Holdings, Inc. | | 19,228 | 484,353 |
| Wells Fargo & Co. | | 5,818 | 340,178 |
| | | | $ 5,594,883 |
| Beverages — 0.6% |
| Anheuser-Busch InBev SA | | 5,938 | $ 364,427 |
| Coca-Cola Co. | | 20,317 | 1,472,373 |
| Security | Shares | Value |
| Beverages (continued) |
| Heineken NV(2) | | 4,017 | $ 362,430 |
| Pernod Ricard SA | | 2,054 | 292,445 |
| | | | $ 2,491,675 |
| Biotechnology — 0.7% |
| AbbVie, Inc. | | 2,510 | $ 492,738 |
| Amgen, Inc. | | 1,757 | 586,539 |
| Gilead Sciences, Inc. | | 8,927 | 705,233 |
| Regeneron Pharmaceuticals, Inc.(1) | | 418 | 495,200 |
| Vertex Pharmaceuticals, Inc.(1) | | 1,349 | 668,956 |
| | | | $ 2,948,666 |
| Broadline Retail — 1.0% |
| Amazon.com, Inc.(1) | | 24,273 | $ 4,332,731 |
| | | | $ 4,332,731 |
| Building Products — 0.5% |
| Carrier Global Corp. | | 6,260 | $ 455,603 |
| CSW Industrials, Inc. | | 1,967 | 664,118 |
| Johnson Controls International PLC | | 4,357 | 317,407 |
| Resideo Technologies, Inc.(1) | | 20,993 | 423,219 |
| Trane Technologies PLC | | 938 | 339,237 |
| | | | $ 2,199,584 |
| Capital Markets — 1.5% |
| Ares Management Corp., Class A | | 3,371 | $ 493,514 |
| Brightsphere Investment Group, Inc. | | 18,092 | 441,264 |
| Brookfield Asset Management Ltd., Class A | | 14,444 | 588,842 |
| Brookfield Corp.(2) | | 13,399 | 674,101 |
| CME Group, Inc. | | 1,471 | 317,354 |
| Hamilton Lane, Inc., Class A | | 3,824 | 584,460 |
| Houlihan Lokey, Inc. | | 3,302 | 517,159 |
| KKR & Co., Inc. | | 4,301 | 532,335 |
| Moelis & Co., Class A | | 7,455 | 497,919 |
| Partners Group Holding AG(2) | | 412 | 596,054 |
| Tradeweb Markets, Inc., Class A | | 4,307 | 509,260 |
| Victory Capital Holdings, Inc., Class A | | 10,363 | 565,509 |
| | | | $ 6,317,771 |
| Chemicals — 0.9% |
| AdvanSix, Inc. | | 10,061 | $ 297,403 |
| Arkema SA | | 3,254 | 301,899 |
| Corteva, Inc. | | 6,781 | 388,551 |
| Dow, Inc. | | 15,463 | 828,508 |
| DuPont de Nemours, Inc. | | 6,801 | 572,984 |
| EMS-Chemie Holding AG(2) | | 336 | 281,995 |
1
See Notes to Financial Statements.
Eaton Vance
Richard Bernstein All Asset Strategy Fund
August 31, 2024
Portfolio of Investments — continued
| Security | Shares | Value |
| Chemicals (continued) |
| Linde PLC | | 1,266 | $ 605,464 |
| Novonesis (Novozymes), Class B | | 5,713 | 396,639 |
| Nutrien Ltd.(2) | | 5,982 | 289,723 |
| | | | $ 3,963,166 |
| Commercial Services & Supplies — 0.1% |
| Waste Management, Inc. | | 2,488 | $ 527,556 |
| | | | $ 527,556 |
| Communications Equipment — 0.1% |
| Arista Networks, Inc.(1) | | 921 | $ 325,463 |
| | | | $ 325,463 |
| Construction & Engineering — 0.2% |
| API Group Corp.(1) | | 13,493 | $ 479,676 |
| Eiffage SA | | 3,138 | 329,381 |
| | | | $ 809,057 |
| Construction Materials — 0.1% |
| Vulcan Materials Co. | | 1,418 | $ 347,708 |
| | | | $ 347,708 |
| Consumer Finance — 0.4% |
| American Express Co. | | 2,080 | $ 537,992 |
| SLM Corp. | | 25,415 | 560,655 |
| Synchrony Financial | | 11,093 | 557,534 |
| | | | $ 1,656,181 |
| Consumer Staples Distribution & Retail — 0.3% |
| Aeon Co. Ltd.(2) | | 15,100 | $ 378,256 |
| Alimentation Couche-Tard, Inc.(2) | | 11,402 | 650,878 |
| Walmart, Inc. | | 2,472 | 190,912 |
| | | | $ 1,220,046 |
| Containers & Packaging — 0.2% |
| Silgan Holdings, Inc. | | 7,506 | $ 392,339 |
| Sonoco Products Co. | | 5,574 | 315,321 |
| | | | $ 707,660 |
| Diversified Telecommunication Services — 0.1% |
| AT&T, Inc. | | 20,843 | $ 414,776 |
| | | | $ 414,776 |
| Electric Utilities — 0.7% |
| Constellation Energy Corp. | | 3,135 | $ 616,655 |
| Security | Shares | Value |
| Electric Utilities (continued) |
| Enel SpA | | 91,059 | $ 692,112 |
| Exelon Corp. | | 7,734 | 294,588 |
| Hydro One Ltd.(3) | | 34,567 | 1,175,019 |
| Iberdrola SA(2) | | 28,270 | 401,113 |
| | | | $ 3,179,487 |
| Electrical Equipment — 0.3% |
| Eaton Corp. PLC | | 2,106 | $ 646,394 |
| GE Vernova, Inc.(1) | | 1,253 | 251,853 |
| nVent Electric PLC | | 6,232 | 423,527 |
| | | | $ 1,321,774 |
| Electronic Equipment, Instruments & Components — 0.3% |
| Hexagon AB, Class B(2) | | 32,299 | $ 330,630 |
| Keyence Corp. | | 700 | 336,294 |
| Knowles Corp.(1) | | 30,087 | 555,105 |
| | | | $ 1,222,029 |
| Energy Equipment & Services — 0.2% |
| Baker Hughes Co. | | 9,672 | $ 340,164 |
| Halliburton Co. | | 8,455 | 262,866 |
| Schlumberger NV | | 7,342 | 322,975 |
| | | | $ 926,005 |
| Financial Services — 1.1% |
| Apollo Global Management, Inc. | | 4,111 | $ 475,766 |
| Berkshire Hathaway, Inc., Class B(1) | | 2,921 | 1,390,162 |
| Corebridge Financial, Inc. | | 17,560 | 519,073 |
| Enact Holdings, Inc. | | 12,600 | 447,930 |
| Equitable Holdings, Inc. | | 12,532 | 532,861 |
| Mastercard, Inc., Class A | | 955 | 461,590 |
| PayPal Holdings, Inc.(1) | | 5,860 | 424,440 |
| Visa, Inc., Class A | | 1,751 | 483,924 |
| | | | $ 4,735,746 |
| Food Products — 0.7% |
| Barry Callebaut AG(2) | | 180 | $ 291,338 |
| Danone SA | | 6,346 | 440,964 |
| Kerry Group PLC, Class A | | 3,542 | 355,700 |
| Nestle SA | | 10,874 | 1,166,129 |
| Saputo, Inc.(2) | | 23,295 | 518,051 |
| | | | $ 2,772,182 |
| Ground Transportation — 0.7% |
| Canadian National Railway Co. | | 2,699 | $ 318,016 |
| CSX Corp. | | 13,567 | 464,941 |
2
See Notes to Financial Statements.
Eaton Vance
Richard Bernstein All Asset Strategy Fund
August 31, 2024
Portfolio of Investments — continued
| Security | Shares | Value |
| Ground Transportation (continued) |
| Schneider National, Inc., Class B | | 12,556 | $ 340,393 |
| TFI International, Inc. | | 3,458 | 511,778 |
| Uber Technologies, Inc.(1) | | 8,418 | 615,608 |
| U-Haul Holding Co., Non Voting Shares | | 6,484 | 443,182 |
| Union Pacific Corp. | | 1,711 | 438,170 |
| | | | $ 3,132,088 |
| Health Care Equipment & Supplies — 1.2% |
| Abbott Laboratories | | 5,567 | $ 630,574 |
| Becton Dickinson & Co. | | 1,240 | 300,588 |
| Boston Scientific Corp.(1) | | 10,917 | 892,901 |
| Cochlear Ltd. | | 1,957 | 397,317 |
| EssilorLuxottica SA | | 1,776 | 421,150 |
| Intuitive Surgical, Inc.(1) | | 1,642 | 808,898 |
| Medtronic PLC | | 7,389 | 654,518 |
| Stryker Corp. | | 1,228 | 442,596 |
| Zimmer Biomet Holdings, Inc. | | 2,913 | 336,335 |
| | | | $ 4,884,877 |
| Health Care Providers & Services — 0.9% |
| Cardinal Health, Inc. | | 3,635 | $ 409,737 |
| Cencora, Inc. | | 1,718 | 411,581 |
| Centene Corp.(1) | | 4,413 | 347,877 |
| Fresenius SE & Co. KGaA(1) | | 11,554 | 426,654 |
| HCA Healthcare, Inc. | | 1,326 | 524,552 |
| McKesson Corp. | | 752 | 421,932 |
| Sonic Healthcare Ltd. | | 16,079 | 300,870 |
| UnitedHealth Group, Inc. | | 1,798 | 1,061,180 |
| | | | $ 3,904,383 |
| Hotels, Restaurants & Leisure — 0.2% |
| Airbnb, Inc., Class A(1) | | 2,480 | $ 290,929 |
| Booking Holdings, Inc. | | 147 | 574,657 |
| | | | $ 865,586 |
| Household Durables — 0.6% |
| Installed Building Products, Inc. | | 3,587 | $ 797,426 |
| Sony Group Corp. | | 7,600 | 740,195 |
| Tri Pointe Homes, Inc.(1) | | 22,865 | 1,016,121 |
| | | | $ 2,553,742 |
| Household Products — 0.1% |
| Procter & Gamble Co. | | 2,467 | $ 423,189 |
| | | | $ 423,189 |
| Security | Shares | Value |
| Industrial Conglomerates — 0.5% |
| Hitachi Ltd. | | 33,000 | $ 814,110 |
| Honeywell International, Inc. | | 2,248 | 467,382 |
| Siemens AG | | 2,117 | 398,219 |
| Smiths Group PLC | | 14,453 | 343,838 |
| | | | $ 2,023,549 |
| Industrial REITs — 0.1% |
| ProLogis, Inc. | | 2,170 | $ 277,369 |
| | | | $ 277,369 |
| Insurance — 1.1% |
| Allianz SE | | 1,601 | $ 497,361 |
| American International Group, Inc. | | 10,842 | 835,376 |
| Brighthouse Financial, Inc.(1) | | 7,232 | 331,949 |
| Fairfax Financial Holdings Ltd. | | 275 | 331,996 |
| Hartford Financial Services Group, Inc. | | 5,039 | 585,028 |
| Markel Group, Inc.(1) | | 355 | 568,241 |
| Muenchener Rueckversicherungs-Gesellschaft AG in Muenchen | | 1,557 | 842,404 |
| Prudential Financial, Inc. | | 3,771 | 456,894 |
| QBE Insurance Group Ltd. | | 33,792 | 360,357 |
| | | | $ 4,809,606 |
| Interactive Media & Services — 1.7% |
| Alphabet, Inc., Class A | | 14,598 | $ 2,385,021 |
| Alphabet, Inc., Class C | | 12,476 | 2,059,913 |
| Meta Platforms, Inc., Class A | | 5,500 | 2,867,205 |
| | | | $ 7,312,139 |
| IT Services — 0.3% |
| International Business Machines Corp. | | 1,635 | $ 330,483 |
| Otsuka Corp. | | 19,200 | 456,773 |
| Shopify, Inc., Class A(1) | | 4,100 | 303,655 |
| | | | $ 1,090,911 |
| Life Sciences Tools & Services — 0.1% |
| IQVIA Holdings, Inc.(1) | | 1,228 | $ 308,903 |
| | | | $ 308,903 |
| Machinery — 0.8% |
| Caterpillar, Inc. | | 1,767 | $ 629,229 |
| Deere & Co. | | 1,150 | 443,601 |
| Fortive Corp. | | 6,449 | 479,805 |
| Illinois Tool Works, Inc. | | 1,729 | 437,748 |
| Ingersoll Rand, Inc. | | 4,577 | 418,567 |
3
See Notes to Financial Statements.
Eaton Vance
Richard Bernstein All Asset Strategy Fund
August 31, 2024
Portfolio of Investments — continued
| Security | Shares | Value |
| Machinery (continued) |
| Otis Worldwide Corp. | | 4,846 | $ 458,868 |
| PACCAR, Inc. | | 7,012 | 674,414 |
| | | | $ 3,542,232 |
| Media — 0.2% |
| Fox Corp., Class B | | 11,208 | $ 430,724 |
| News Corp., Class B | | 17,717 | 521,411 |
| | | | $ 952,135 |
| Metals & Mining — 0.7% |
| Alamos Gold, Inc., Class A | | 17,588 | $ 339,061 |
| Barrick Gold Corp. | | 16,042 | 323,899 |
| BHP Group Ltd.(2) | | 10,961 | 301,796 |
| Freeport-McMoRan, Inc. | | 13,209 | 584,895 |
| Ivanhoe Mines Ltd., Class A(1)(2) | | 21,559 | 287,475 |
| Newmont Corp. | | 6,367 | 339,934 |
| Rio Tinto Ltd.(2) | | 4,853 | 363,327 |
| Teck Resources Ltd., Class B | | 6,384 | 305,687 |
| Wheaton Precious Metals Corp. | | 5,207 | 321,813 |
| | | | $ 3,167,887 |
| Oil, Gas & Consumable Fuels — 2.8% |
| Antero Midstream Corp. | | 29,666 | $ 441,133 |
| California Resources Corp. | | 7,710 | 404,544 |
| Cenovus Energy, Inc.(2) | | 15,037 | 278,837 |
| Cheniere Energy, Inc. | | 2,596 | 480,935 |
| Chevron Corp. | | 7,383 | 1,092,315 |
| ConocoPhillips | | 3,306 | 376,190 |
| Devon Energy Corp. | | 13,202 | 591,186 |
| Diamondback Energy, Inc. | | 2,275 | 443,875 |
| DT Midstream, Inc. | | 7,539 | 592,490 |
| Enbridge, Inc. | | 8,186 | 329,347 |
| Exxon Mobil Corp. | | 15,508 | 1,829,014 |
| Hess Corp. | | 2,278 | 314,501 |
| Magnolia Oil & Gas Corp., Class A(2) | | 15,206 | 389,426 |
| Marathon Oil Corp. | | 13,137 | 376,375 |
| Occidental Petroleum Corp. | | 5,477 | 312,079 |
| Phillips 66 | | 2,920 | 409,705 |
| PrairieSky Royalty Ltd.(2) | | 26,792 | 555,065 |
| Shell PLC | | 19,421 | 688,154 |
| Suncor Energy, Inc.(2) | | 14,639 | 593,750 |
| Targa Resources Corp. | | 5,328 | 782,683 |
| TC Energy Corp. | | 9,665 | 447,660 |
| | | | $ 11,729,264 |
| Security | Shares | Value |
| Passenger Airlines — 0.2% |
| Air Canada(1)(2) | | 24,074 | $ 275,816 |
| Delta Air Lines, Inc. | | 9,870 | 419,376 |
| | | | $ 695,192 |
| Personal Care Products — 0.1% |
| L'Oreal SA | | 1,302 | $ 571,258 |
| | | | $ 571,258 |
| Pharmaceuticals — 1.9% |
| AstraZeneca PLC | | 3,695 | $ 647,606 |
| Bristol-Myers Squibb Co. | | 12,765 | 637,612 |
| Eli Lilly & Co. | | 2,049 | 1,967,081 |
| GSK PLC | | 14,182 | 308,877 |
| Johnson & Johnson | | 5,143 | 853,018 |
| Merck & Co., Inc. | | 5,175 | 612,979 |
| Novartis AG | | 8,581 | 1,036,741 |
| Novo Nordisk AS, Class B | | 2,822 | 392,004 |
| Pfizer, Inc. | | 19,304 | 560,009 |
| Roche Holding AG PC | | 1,098 | 371,696 |
| Sanofi SA | | 4,338 | 486,889 |
| Takeda Pharmaceutical Co. Ltd. | | 13,700 | 407,876 |
| | | | $ 8,282,388 |
| Professional Services — 0.5% |
| Automatic Data Processing, Inc. | | 1,583 | $ 436,765 |
| Parsons Corp.(1) | | 6,380 | 609,035 |
| Science Applications International Corp. | | 3,293 | 430,033 |
| Verra Mobility Corp.(1) | | 19,964 | 551,206 |
| | | | $ 2,027,039 |
| Retail REITs — 0.1% |
| Realty Income Corp. | | 4,804 | $ 298,376 |
| | | | $ 298,376 |
| Semiconductors & Semiconductor Equipment — 2.8% |
| Advanced Micro Devices, Inc.(1) | | 3,080 | $ 457,565 |
| ASML Holding NV | | 886 | 799,025 |
| Broadcom, Inc. | | 10,180 | 1,657,507 |
| GlobalFoundries, Inc.(1)(2) | | 7,731 | 360,883 |
| Marvell Technology, Inc. | | 6,027 | 459,498 |
| Micron Technology, Inc. | | 2,671 | 257,057 |
| NVIDIA Corp. | | 65,472 | 7,815,393 |
| | | | $ 11,806,928 |
| Software — 2.2% |
| Adobe, Inc.(1) | | 552 | $ 317,074 |
4
See Notes to Financial Statements.
Eaton Vance
Richard Bernstein All Asset Strategy Fund
August 31, 2024
Portfolio of Investments — continued
| Security | Shares | Value |
| Software (continued) |
| Alarm.com Holdings, Inc.(1) | | 11,496 | $ 684,472 |
| Atlassian Corp., Class A(1) | | 1,995 | 330,372 |
| Microsoft Corp. | | 18,215 | 7,598,205 |
| Salesforce, Inc. | | 1,194 | 301,963 |
| | | | $ 9,232,086 |
| Specialized REITs — 0.4% |
| Equinix, Inc. | | 351 | $ 292,860 |
| Four Corners Property Trust, Inc. | | 28,153 | 798,138 |
| VICI Properties, Inc. | | 20,810 | 696,719 |
| | | | $ 1,787,717 |
| Specialty Retail — 0.4% |
| Home Depot, Inc. | | 2,565 | $ 945,203 |
| Industria de Diseno Textil SA | | 11,351 | 614,946 |
| | | | $ 1,560,149 |
| Technology Hardware, Storage & Peripherals — 2.2% |
| Apple, Inc. | | 36,983 | $ 8,469,107 |
| Hewlett Packard Enterprise Co. | | 24,248 | 469,684 |
| Pure Storage, Inc., Class A(1) | | 5,062 | 259,630 |
| Western Digital Corp.(1) | | 4,292 | 281,512 |
| | | | $ 9,479,933 |
| Textiles, Apparel & Luxury Goods — 0.1% |
| adidas AG | | 2,000 | $ 513,127 |
| | | | $ 513,127 |
| Tobacco — 0.1% |
| Philip Morris International, Inc. | | 4,852 | $ 598,203 |
| | | | $ 598,203 |
| Trading Companies & Distributors — 0.4% |
| Brenntag SE | | 9,349 | $ 695,222 |
| Ferguson Enterprises, Inc. | | 1,445 | 297,251 |
| GMS, Inc.(1) | | 5,976 | 518,657 |
| United Rentals, Inc. | | 442 | 327,637 |
| | | | $ 1,838,767 |
Total Common Stocks
(identified cost $97,717,791) | | | $155,485,467 |
| Exchange-Traded Funds — 30.4% |
| Security | Shares | Value |
| Equity Funds — 8.2% |
| iShares MSCI India ETF(1) | | 227,900 | $ 13,154,388 |
| iShares MSCI South Korea ETF(2) | | 124,900 | 8,180,950 |
| iShares MSCI Taiwan ETF | | 249,800 | 13,439,240 |
| | | | $ 34,774,578 |
| Fixed Income Funds — 22.2% |
| Janus Henderson Mortgage-Backed Securities ETF | | 2,042,099 | $ 94,487,967 |
| | | | $ 94,487,967 |
Total Exchange-Traded Funds
(identified cost $123,146,600) | | | $129,262,545 |
| U.S. Treasury Obligations — 28.5% |
| Security | Principal
Amount
(000's omitted) | Value |
| U.S. Treasury Bonds: | | | |
| 1.125%, 8/15/40 | $ | 7,949 | $ 5,102,794 |
| 1.375%, 11/15/40 | | 7,503 | 4,985,911 |
| 1.75%, 8/15/41 | | 9,628 | 6,696,182 |
| 1.875%, 2/15/41 | | 7,255 | 5,220,058 |
| 2.00%, 11/15/41 | | 6,564 | 4,739,509 |
| 2.25%, 5/15/41 | | 11,251 | 8,555,662 |
| 2.75%, 8/15/42 | | 6,337 | 5,114,900 |
| 3.375%, 8/15/42 | | 3,890 | 3,443,068 |
| 3.875%, 8/15/40 | | 2,232 | 2,167,937 |
| 4.00%, 11/15/42 | | 4,169 | 4,023,833 |
| 4.375%, 11/15/39(2) | | 1,781 | 1,839,159 |
| U.S. Treasury Notes: | | | |
| 0.25%, 8/31/25 | | 4,372 | 4,197,553 |
| 0.75%, 5/31/26 | | 4,760 | 4,501,364 |
| 1.00%, 12/15/24(2) | | 1,856 | 1,835,847 |
| 1.50%, 11/30/24 | | 3,917 | 3,884,992 |
| 1.50%, 2/15/25 | | 2,256 | 2,221,964 |
| 2.25%, 11/15/25 | | 3,745 | 3,657,689 |
| 3.875%, 1/15/26 | | 5,951 | 5,928,750 |
| 4.00%, 12/15/25 | | 6,611 | 6,593,170 |
| 4.00%, 2/15/26 | | 9,294 | 9,279,841 |
| 4.00%, 1/15/27 | | 4,233 | 4,245,910 |
| 4.25%, 10/15/25 | | 4,776 | 4,773,368 |
| 4.25%, 3/15/27 | | 4,053 | 4,094,291 |
| 4.50%, 11/15/25 | | 9,744 | 9,773,519 |
5
See Notes to Financial Statements.
Eaton Vance
Richard Bernstein All Asset Strategy Fund
August 31, 2024
Portfolio of Investments — continued
| Security | Principal
Amount
(000's omitted) | Value |
| U.S. Treasury Notes: (continued) | | | |
| 4.625%, 2/28/26 | $ | 4,292 | $ 4,323,033 |
Total U.S. Treasury Obligations
(identified cost $125,568,390) | | | $121,200,304 |
| Short-Term Investments — 5.1% |
| Security | Shares | Value |
| Morgan Stanley Institutional Liquidity Funds - Government Portfolio, Institutional Class, 5.19%(4) | | 18,229,478 | $ 18,229,478 |
Total Affiliated Fund
(identified cost $18,229,478) | | | $ 18,229,478 |
| Securities Lending Collateral — 0.8% |
| Security | Shares | Value |
| State Street Navigator Securities Lending Government Money Market Portfolio, 5.29%(5) | | 3,479,342 | $ 3,479,342 |
Total Securities Lending Collateral
(identified cost $3,479,342) | | | $ 3,479,342 |
Total Short-Term Investments
(identified cost $21,708,820) | | | $ 21,708,820 |
Total Investments — 100.6%
(identified cost $368,141,601) | | | $427,657,136 |
| Other Assets, Less Liabilities — (0.6)% | | | $ (2,648,095) |
| Net Assets — 100.0% | | | $425,009,041 |
| The percentage shown for each investment category in the Portfolio of Investments is based on net assets. |
| (1) | Non-income producing security. |
| (2) | All or a portion of this security was on loan at August 31, 2024. The aggregate market value of securities on loan at August 31, 2024 was $16,869,698. |
| (3) | Security exempt from registration under Rule 144A of the Securities Act of 1933, as amended. These securities may be sold in certain transactions in reliance on an exemption from registration (normally to qualified institutional buyers). At August 31, 2024, the aggregate value of these securities is $1,175,019 or 0.3% of the Fund's net assets. |
| (4) | May be deemed to be an affiliated investment company. The rate shown is the annualized seven-day yield as of August 31, 2024. |
| (5) | Represents investment of cash collateral received in connection with securities lending. |
| Country Concentration of Portfolio |
| Country | Percentage
of Net Assets | Value |
| United States | 63.0% | $267,902,475 |
| Canada | 2.1 | 9,098,656 |
| Germany | 0.9 | 3,897,713 |
| Japan | 0.9 | 3,671,925 |
| France | 0.8 | 3,263,381 |
| Switzerland | 0.5 | 2,206,128 |
| Australia | 0.4 | 1,723,667 |
| United Kingdom | 0.4 | 1,599,807 |
| Netherlands | 0.3 | 1,161,455 |
| Spain | 0.2 | 1,016,059 |
| Denmark | 0.2 | 788,643 |
| Italy | 0.1 | 692,112 |
| Belgium | 0.1 | 364,427 |
| Ireland | 0.1 | 355,700 |
| Sweden | 0.1 | 330,630 |
| Brazil | 0.1 | 321,813 |
| Exchange-Traded Funds | 30.4 | 129,262,545 |
| Total Investments | 100.6% | $427,657,136 |
| Abbreviations: |
| PC | – Participation Certificate |
| REITs | – Real Estate Investment Trusts |
6
See Notes to Financial Statements.
Eaton Vance
Richard Bernstein All Asset Strategy Fund
August 31, 2024
Statement of Assets and Liabilities
| | August 31, 2024 |
| Assets | |
| Unaffiliated investments, at value (identified cost $349,912,123) — including $16,869,698 of securities on loan | $409,427,658 |
| Affiliated investments, at value (identified cost $18,229,478) | 18,229,478 |
| Foreign currency, at value (identified cost $104) | 186 |
| Interest and dividends receivable | 1,030,450 |
| Dividends receivable from affiliated investments | 78,267 |
| Receivable for Fund shares sold | 276,188 |
| Securities lending income receivable | 1,965 |
| Tax reclaims receivable | 368,843 |
| Trustees' deferred compensation plan | 52,659 |
| Total assets | $429,465,694 |
| Liabilities | |
| Collateral for securities loaned | $3,479,342 |
| Payable for Fund shares redeemed | 399,946 |
| Payable to affiliates: | |
| Investment adviser and administration fee | 303,918 |
| Distribution and service fees | 52,922 |
| Trustees' deferred compensation plan | 52,659 |
| Accrued expenses | 167,866 |
| Total liabilities | $4,456,653 |
| Net Assets | $425,009,041 |
| Sources of Net Assets | |
| Paid-in capital | $385,412,816 |
| Distributable earnings | 39,596,225 |
| Net Assets | $425,009,041 |
| Class A Shares | |
| Net Assets | $89,980,754 |
| Shares Outstanding | 6,124,786 |
Net Asset Value and Redemption Price Per Share
(net assets ÷ shares of beneficial interest outstanding) | $14.69 |
Maximum Offering Price Per Share
(100 ÷ 94.75 of net asset value per share) | $15.50 |
| Class C Shares | |
| Net Assets | $40,187,268 |
| Shares Outstanding | 2,803,188 |
Net Asset Value and Offering Price Per Share*
(net assets ÷ shares of beneficial interest outstanding) | $14.34 |
| Class I Shares | |
| Net Assets | $294,841,019 |
| Shares Outstanding | 19,962,317 |
Net Asset Value, Offering Price and Redemption Price Per Share
(net assets ÷ shares of beneficial interest outstanding) | $14.77 |
| On sales of $50,000 or more, the offering price of Class A shares is reduced. |
| * | Redemption price per share is equal to the net asset value less any applicable contingent deferred sales charge. |
7
See Notes to Financial Statements.
Eaton Vance
Richard Bernstein All Asset Strategy Fund
August 31, 2024
| | Year Ended |
| | August 31, 2024 |
| Investment Income | |
| Dividend income (net of foreign taxes withheld of $151,545) | $10,768,525 |
| Dividend income from affiliated investments | 950,886 |
| Interest income | 4,341,642 |
| Securities lending income, net | 64,643 |
| Total investment income | $16,125,696 |
| Expenses | |
| Investment adviser and administration fee | $3,920,269 |
| Distribution and service fees: | |
| Class A | 222,206 |
| Class C | 455,769 |
| Trustees’ fees and expenses | 28,910 |
| Custodian fee | 132,662 |
| Transfer and dividend disbursing agent fees | 244,522 |
| Legal and accounting services | 75,292 |
| Printing and postage | 32,954 |
| Registration fees | 53,398 |
| Miscellaneous | 49,205 |
| Total expenses | $5,215,187 |
| Deduct: | |
| Waiver and/or reimbursement of expenses by affiliates | $27,367 |
| Total expense reductions | $27,367 |
| Net expenses | $5,187,820 |
| Net investment income | $10,937,876 |
| Realized and Unrealized Gain (Loss) | |
| Net realized gain (loss): | |
| Investment transactions | $(14,766,068) |
| Foreign currency transactions | (86,551) |
| Capital gain distributions received | 386,637 |
| Net realized loss | $(14,465,982) |
| Change in unrealized appreciation (depreciation): | |
| Investments | $50,935,817 |
| Foreign currency | 14,626 |
| Net change in unrealized appreciation (depreciation) | $50,950,443 |
| Net realized and unrealized gain | $36,484,461 |
| Net increase in net assets from operations | $47,422,337 |
8
See Notes to Financial Statements.
Eaton Vance
Richard Bernstein All Asset Strategy Fund
August 31, 2024
Statements of Changes in Net Assets
| | Year Ended August 31, |
| | 2024 | 2023 |
| Increase (Decrease) in Net Assets | | |
| From operations: | | |
| Net investment income | $10,937,876 | $11,343,047 |
| Net realized loss | (14,465,982) | (77) |
| Net change in unrealized appreciation (depreciation) | 50,950,443 | (9,837,313) |
| Net increase in net assets from operations | $47,422,337 | $1,505,657 |
| Distributions to shareholders: | | |
| Class A | $(2,053,082) | $(739,421) |
| Class C | (723,699) | (10,105) |
| Class I | (8,196,177) | (4,482,837) |
| Total distributions to shareholders | $(10,972,958) | $(5,232,363) |
| Transactions in shares of beneficial interest: | | |
| Class A | $(11,434,822) | $(8,778,252) |
| Class C | (17,381,180) | (14,918,214) |
| Class I | (89,124,775) | (176,026,671) |
| Net decrease in net assets from Fund share transactions | $(117,940,777) | $(199,723,137) |
| Net decrease in net assets | $(81,491,398) | $(203,449,843) |
| Net Assets | | |
| At beginning of year | $506,500,439 | $709,950,282 |
| At end of year | $425,009,041 | $506,500,439 |
9
See Notes to Financial Statements.
Eaton Vance
Richard Bernstein All Asset Strategy Fund
August 31, 2024
| | Class A |
| | Year Ended August 31, |
| | 2024 | 2023 | 2022 | 2021 | 2020 |
| Net asset value — Beginning of year | $13.50 | $13.48 | $16.21 | $15.14 | $14.37 |
| Income (Loss) From Operations | | | | | |
| Net investment income(1) | $0.31 | $0.26 | $0.15 | $0.13 | $0.10 |
| Net realized and unrealized gain (loss) | 1.20 | (0.13) | (2.04) | 1.39 | 1.28 |
| Total income (loss) from operations | $1.51 | $0.13 | $(1.89) | $1.52 | $1.38 |
| Less Distributions | | | | | |
| From net investment income | $(0.32) | $(0.11) | $(0.14) | $(0.09) | $(0.19) |
| From net realized gain | — | (0.00)(2) | (0.70) | (0.36) | (0.42) |
| Total distributions | $(0.32) | $(0.11) | $(0.84) | $(0.45) | $(0.61) |
| Net asset value — End of year | $14.69 | $13.50 | $13.48 | $16.21 | $15.14 |
| Total Return(3) | 11.34% | 0.95% | (12.29)% | 10.23% | 9.93% |
| Ratios/Supplemental Data | | | | | |
| Net assets, end of year (000’s omitted) | $89,981 | $94,064 | $102,903 | $118,419 | $97,873 |
| Ratios (as a percentage of average daily net assets):(4) | | | | | |
| Total expenses | 1.23% | 1.23% | 1.18% | 1.18% | 1.21% |
| Net expenses | 1.23%(5) | 1.23%(5) | 1.18%(5) | 1.18% | 1.21% |
| Net investment income | 2.27% | 1.91% | 1.03% | 0.82% | 0.68% |
| Portfolio Turnover | 49% | 35% | 70% | 63% | 70% |
| (1) | Computed using average shares outstanding. |
| (2) | Amount is less than $(0.005). |
| (3) | Returns are historical and are calculated by determining the percentage change in net asset value with all distributions reinvested and do not reflect the effect of sales charges. |
| (4) | Total expenses do not reflect amounts reimbursed and/or waived by the adviser and certain of its affiliates, if applicable. Net expenses are net of all reductions and represent the net expenses paid by the Fund. |
| (5) | Includes a reduction by the investment adviser of a portion of its adviser and administration fee due to the Fund’s investment in the Liquidity Fund
(equal to less than 0.01% of average daily net assets for the years ended August 31, 2024, 2023 and 2022). |
10
See Notes to Financial Statements.
Eaton Vance
Richard Bernstein All Asset Strategy Fund
August 31, 2024
Financial Highlights — continued
| | Class C |
| | Year Ended August 31, |
| | 2024 | 2023 | 2022 | 2021 | 2020 |
| Net asset value — Beginning of year | $13.17 | $13.14 | $15.81 | $14.78 | $14.03 |
| Income (Loss) From Operations | | | | | |
| Net investment income (loss)(1) | $0.21 | $0.15 | $0.04 | $0.01 | $(0.01) |
| Net realized and unrealized gain (loss) | 1.16 | (0.12) | (1.99) | 1.35 | 1.26 |
| Total income (loss) from operations | $1.37 | $0.03 | $(1.95) | $1.36 | $1.25 |
| Less Distributions | | | | | |
| From net investment income | $(0.20) | $— | $(0.02) | $— | $(0.08) |
| From net realized gain | — | (0.00)(2) | (0.70) | (0.33) | (0.42) |
| Total distributions | $(0.20) | $(0.00)(2) | $(0.72) | $(0.33) | $(0.50) |
| Net asset value — End of year | $14.34 | $13.17 | $13.14 | $15.81 | $14.78 |
| Total Return(3) | 10.50% | 0.24% | (12.92)% | 9.34% | 9.14% |
| Ratios/Supplemental Data | | | | | |
| Net assets, end of year (000’s omitted) | $40,187 | $54,117 | $69,060 | $95,493 | $101,075 |
| Ratios (as a percentage of average daily net assets):(4) | | | | | |
| Total expenses | 1.98% | 1.98% | 1.93% | 1.93% | 1.96% |
| Net expenses | 1.98%(5) | 1.98%(5) | 1.93%(5) | 1.93% | 1.96% |
| Net investment income (loss) | 1.54% | 1.15% | 0.28% | 0.05% | (0.07)% |
| Portfolio Turnover | 49% | 35% | 70% | 63% | 70% |
| (1) | Computed using average shares outstanding. |
| (2) | Amount is less than $(0.005). |
| (3) | Returns are historical and are calculated by determining the percentage change in net asset value with all distributions reinvested and do not reflect the effect of sales charges. |
| (4) | Total expenses do not reflect amounts reimbursed and/or waived by the adviser and certain of its affiliates, if applicable. Net expenses are net of all reductions and represent the net expenses paid by the Fund. |
| (5) | Includes a reduction by the investment adviser of a portion of its adviser and administration fee due to the Fund’s investment in the Liquidity Fund
(equal to less than 0.01% of average daily net assets for the years ended August 31, 2024, 2023 and 2022). |
11
See Notes to Financial Statements.
Eaton Vance
Richard Bernstein All Asset Strategy Fund
August 31, 2024
Financial Highlights — continued
| | Class I |
| | Year Ended August 31, |
| | 2024 | 2023 | 2022 | 2021 | 2020 |
| Net asset value — Beginning of year | $13.57 | $13.56 | $16.30 | $15.22 | $14.44 |
| Income (Loss) From Operations | | | | | |
| Net investment income(1) | $0.35 | $0.29 | $0.19 | $0.17 | $0.13 |
| Net realized and unrealized gain (loss) | 1.20 | (0.13) | (2.05) | 1.39 | 1.30 |
| Total income (loss) from operations | $1.55 | $0.16 | $(1.86) | $1.56 | $1.43 |
| Less Distributions | | | | | |
| From net investment income | $(0.35) | $(0.15) | $(0.18) | $(0.12) | $(0.23) |
| From net realized gain | — | (0.00)(2) | (0.70) | (0.36) | (0.42) |
| Total distributions | $(0.35) | $(0.15) | $(0.88) | $(0.48) | $(0.65) |
| Net asset value — End of year | $14.77 | $13.57 | $13.56 | $16.30 | $15.22 |
| Total Return(3) | 11.64% | 1.18% | (12.06)% | 10.47% | 10.24% |
| Ratios/Supplemental Data | | | | | |
| Net assets, end of year (000’s omitted) | $294,841 | $358,320 | $537,988 | $665,055 | $546,890 |
| Ratios (as a percentage of average daily net assets):(4) | | | | | |
| Total expenses | 0.98% | 0.98% | 0.93% | 0.93% | 0.96% |
| Net expenses | 0.98%(5) | 0.98%(5) | 0.93%(5) | 0.93% | 0.96% |
| Net investment income | 2.52% | 2.16% | 1.28% | 1.06% | 0.92% |
| Portfolio Turnover | 49% | 35% | 70% | 63% | 70% |
| (1) | Computed using average shares outstanding. |
| (2) | Amount is less than $(0.005). |
| (3) | Returns are historical and are calculated by determining the percentage change in net asset value with all distributions reinvested. |
| (4) | Total expenses do not reflect amounts reimbursed and/or waived by the adviser and certain of its affiliates, if applicable. Net expenses are net of all reductions and represent the net expenses paid by the Fund. |
| (5) | Includes a reduction by the investment adviser of a portion of its adviser and administration fee due to the Fund’s investment in the Liquidity Fund
(equal to less than 0.01% of average daily net assets for the years ended August 31, 2024, 2023 and 2022). |
12
See Notes to Financial Statements.
Eaton Vance
Richard Bernstein All Asset Strategy Fund
August 31, 2024
Notes to Financial Statements
1 Significant Accounting Policies
Eaton Vance Richard Bernstein All Asset Strategy Fund (the Fund) is a diversified series of Eaton Vance Growth Trust (the Trust). The Trust is a Massachusetts business trust registered under the Investment Company Act of 1940, as amended (the 1940 Act), as an open-end management investment company. The Fund’s investment objective is to seek total return. The Fund offers three classes of shares. Class A shares are generally sold subject to a sales charge imposed at time of purchase. Class C shares are sold at net asset value and are generally subject to a contingent deferred sales charge (see Note 5). Effective November 5, 2020, Class C shares automatically convert to Class A shares eight years after their purchase as described in the Fund’s prospectus. Class I shares are sold at net asset value and are not subject to a sales charge. Each class represents a pro rata interest in the Fund, but votes separately on class-specific matters and (as noted below) is subject to different expenses. Realized and unrealized gains and losses and net investment income and losses, other than class-specific expenses, are allocated daily to each class of shares based on the relative net assets of each class to the total net assets of the Fund. Each class of shares differs in its distribution plan and certain other class-specific expenses.
The following is a summary of significant accounting policies of the Fund. The policies are in conformity with accounting principles generally accepted in the United States of America (U.S. GAAP). The Fund is an investment company and follows accounting and reporting guidance in the Financial Accounting Standards Board (FASB) Accounting Standards Codification Topic 946.
A Investment Valuation—The following methodologies are used to determine the market value or fair value of investments.
Equity Securities. Equity securities (common stocks and exchange-traded funds) listed on a U.S. securities exchange generally are valued at the last sale or closing price on the day of valuation or, if no sales took place on such date, at the mean between the closing bid and ask prices on the exchange where such securities are principally traded. Equity securities listed on the NASDAQ National Market System are valued at the NASDAQ official closing price. Unlisted or listed securities for which closing sales prices or closing quotations are not available are valued at the mean between the latest available bid and ask prices.
Debt Obligations. Debt obligations are generally valued on the basis of valuations provided by third party pricing services, as derived from such services’ pricing models. Inputs to the models may include, but are not limited to, reported trades, executable bid and ask prices, broker/dealer quotations, prices or yields of securities with similar characteristics, interest rates, anticipated prepayments, benchmark curves or information pertaining to the issuer, as well as industry and economic events. The pricing services may use a matrix approach, which considers information regarding securities with similar characteristics to determine the valuation for a security. Short-term debt obligations purchased with a remaining maturity of sixty days or less for which a valuation from a third party pricing service is not readily available may be valued at amortized cost, which approximates fair value.
Foreign Securities and Currencies. Foreign securities and currencies are valued in U.S. dollars, based on foreign currency exchange rate quotations supplied by a third party pricing service. The pricing service uses a proprietary model to determine the exchange rate. Inputs to the model include reported trades and implied bid/ask spreads. The daily valuation of exchange-traded foreign securities generally is determined as of the close of trading on the principal exchange on which such securities trade. Events occurring after the close of trading on foreign exchanges may result in adjustments to the valuation of foreign securities to more accurately reflect their fair value as of the close of regular trading on the New York Stock Exchange. When valuing foreign equity securities that meet certain criteria, the Fund's Trustees have approved the use of a fair value service that values such securities to reflect market trading that occurs after the close of the applicable foreign markets of comparable securities or other instruments that have a strong correlation to the fair-valued securities.
Other. Investments in management investment companies (including money market funds) that do not trade on an exchange are valued at the net asset value as of the close of each business day.
Fair Valuation. In connection with Rule 2a-5 of the 1940 Act, the Trustees have designated the Fund’s investment adviser as its valuation designee. Investments for which valuations or market quotations are not readily available or are deemed unreliable are valued by the investment adviser, as valuation designee, at fair value using methods that most fairly reflect the security’s “fair value”, which is the amount that the Fund might reasonably expect to receive for the security upon its current sale in the ordinary course. Each such determination is based on a consideration of relevant factors, which are likely to vary from one pricing context to another. These factors may include, but are not limited to, the type of security, the existence of any contractual restrictions on the security’s disposition, the price and extent of public trading in similar securities of the issuer or of comparable companies or entities, quotations or relevant information obtained from broker/dealers or other market participants, information obtained from the issuer, analysts, and/or the appropriate stock exchange (for exchange-traded securities), an analysis of the company’s or entity’s financial statements, and an evaluation of the forces that influence the issuer and the market(s) in which the security is purchased and sold.
B Investment Transactions—Investment transactions for financial statement purposes are accounted for on a trade date basis. Realized gains and losses on investments sold are determined on the basis of identified cost.
C Income—Dividend income is recorded on the ex-dividend date for dividends received in cash and/or securities. However, if the ex-dividend date has passed, certain dividends from foreign securities are recorded as the Fund is informed of the ex-dividend date. Distributions from investment companies are recorded as dividend income, capital gains or return of capital based on the nature of the distribution. Withholding taxes on foreign dividends and capital gains have been provided for in accordance with the Fund's understanding of the applicable countries’ tax rules and rates. In consideration of recent decisions rendered by European courts, the Fund has filed additional tax reclaims for previously withheld taxes on dividends earned in certain European
Eaton Vance
Richard Bernstein All Asset Strategy Fund
August 31, 2024
Notes to Financial Statements — continued
Union countries. These filings are subject to various administrative and judicial proceedings within these countries. Due to the uncertainty as to the ultimate resolution of these proceedings, the likelihood of receipt of these reclaims, and the potential timing of payment, no amounts are reflected in the financial statements for such outstanding reclaims. Interest income is recorded on the basis of interest accrued, adjusted for amortization of premium or accretion of discount.
D Federal Taxes—The Fund's policy is to comply with the provisions of the Internal Revenue Code applicable to regulated investment companies and to distribute to shareholders each year substantially all of its net investment income, and all or substantially all of its net realized capital gains. Accordingly, no provision for federal income or excise tax is necessary.
As of August 31, 2024, the Fund had no uncertain tax positions that would require financial statement recognition, de-recognition, or disclosure. The Fund files a U.S. federal income tax return annually after its fiscal year-end, which is subject to examination by the Internal Revenue Service for a period of three years from the date of filing.
E Expenses—The majority of expenses of the Trust are directly identifiable to an individual fund. Expenses which are not readily identifiable to a specific fund are allocated taking into consideration, among other things, the nature and type of expense and the relative size of the funds. Expenses do not include the Fund’s pro rata share of the indirect expenses borne by the Fund from its investments in exchange-traded funds.
F Foreign Currency Translation—Investment valuations, other assets, and liabilities initially expressed in foreign currencies are translated each business day into U.S. dollars based upon current exchange rates. Purchases and sales of foreign investment securities and income and expenses denominated in foreign currencies are translated into U.S. dollars based upon currency exchange rates in effect on the respective dates of such transactions. Recognized gains or losses on investment transactions attributable to changes in foreign currency exchange rates are recorded for financial statement purposes as net realized gains and losses on investments. That portion of unrealized gains and losses on investments that results from fluctuations in foreign currency exchange rates is not separately disclosed.
G Use of Estimates—The preparation of the financial statements in conformity with U.S. GAAP requires management to make estimates and assumptions that affect the reported amounts of assets and liabilities at the date of the financial statements and the reported amounts of income and expense during the reporting period. Actual results could differ from those estimates.
H Indemnifications—Under the Trust’s organizational documents, its officers and Trustees may be indemnified against certain liabilities and expenses arising out of the performance of their duties to the Fund. Under Massachusetts law, if certain conditions prevail, shareholders of a Massachusetts business trust (such as the Trust) could be deemed to have personal liability for the obligations of the Trust. However, the Trust’s Declaration of Trust contains an express disclaimer of liability on the part of Fund shareholders and the By-laws provide that the Trust shall assume, upon request by the shareholder, the defense on behalf of any Fund shareholders. Moreover, the By-laws also provide for indemnification out of Fund property of any shareholder held personally liable solely by reason of being or having been a shareholder for all loss or expense arising from such liability. Additionally, in the normal course of business, the Fund enters into agreements with service providers that may contain indemnification clauses. The Fund’s maximum exposure under these arrangements is unknown as this would involve future claims that may be made against the Fund that have not yet occurred.
2 Distributions to Shareholders and Income Tax Information
It is the present policy of the Fund to make at least one distribution annually (normally in December) of all or substantially all of its net investment income and to distribute annually all or substantially all of its net realized capital gains. Distributions to shareholders are recorded on the ex-dividend date. Distributions are declared separately for each class of shares. Shareholders may reinvest income and capital gain distributions in additional shares of the same class of the Fund at the net asset value as of the ex-dividend date or, at the election of the shareholder, receive distributions in cash. Distributions to shareholders are determined in accordance with income tax regulations, which may differ from U.S. GAAP. As required by U.S. GAAP, only distributions in excess of tax basis earnings and profits are reported in the financial statements as a return of capital. Permanent differences between book and tax accounting relating to distributions are reclassified to paid-in capital. For tax purposes, distributions from short-term capital gains are considered to be from ordinary income.
The tax character of distributions declared for the years ended August 31, 2024 and August 31, 2023 was as follows:
| | Year Ended August 31, |
| | 2024 | 2023 |
| Ordinary income | $10,972,958 | $5,142,473 |
| Long-term capital gains | $ — | $89,890 |
Eaton Vance
Richard Bernstein All Asset Strategy Fund
August 31, 2024
Notes to Financial Statements — continued
During the year ended August 31, 2024, distributable earnings was decreased by $1,636,314 and paid-in capital was increased by $1,636,314 due to the Fund’s use of equalization accounting. Tax equalization accounting allows the Fund to treat as a distribution that portion of redemption proceeds representing a redeeming shareholder’s portion of undistributed taxable income and net capital gains. These reclassifications had no effect on the net assets or net asset value per share of the Fund.
As of August 31, 2024, the components of distributable earnings (accumulated loss) on a tax basis were as follows:
| Undistributed ordinary income | $ 4,972,393 |
| Deferred capital losses | (24,413,634) |
| Net unrealized appreciation | 59,037,466 |
| Distributable earnings | $39,596,225 |
At August 31, 2024, the Fund, for federal income tax purposes, had deferred capital losses of $24,413,634 which would reduce its taxable income arising from future net realized gains on investment transactions, if any, to the extent permitted by the Internal Revenue Code, and thus would reduce the amount of distributions to shareholders, which would otherwise be necessary to relieve the Fund of any liability for federal income or excise tax. The deferred capital losses are treated as arising on the first day of the Fund’s next taxable year and retain the same short-term or long-term character as when originally deferred. Of the deferred capital losses at August 31, 2024, $13,857,248 are short-term and $10,556,386 are long-term.
The cost and unrealized appreciation (depreciation) of investments of the Fund at August 31, 2024, as determined on a federal income tax basis, were as follows:
| Aggregate cost | $368,639,205 |
| Gross unrealized appreciation | $67,482,493 |
| Gross unrealized depreciation | (8,464,562) |
| Net unrealized appreciation | $59,017,931 |
3 Investment Adviser and Administration Fee and Other Transactions with Affiliates
The investment adviser and administration fee is earned by Eaton Vance Management (EVM), an indirect, wholly-owned subsidiary of Morgan Stanley, as compensation for investment advisory and administrative services rendered to the Fund. The investment adviser and administration fee is computed at an annual rate as a percentage of the Fund’s average daily net assets as follows and is payable monthly:
| Average Daily Net Assets | Annual Fee Rate |
| Up to $500 million | 0.850% |
| $500 million but less than $1 billion | 0.800% |
| $1 billion but less than $2.5 billion | 0.775% |
| $2.5 billion but less than $5 billion | 0.750% |
| $5 billion and over | 0.730% |
For the year ended August 31, 2024, the investment adviser and administration fee amounted to $3,920,269 or 0.85% of the Fund’s average daily net assets. Pursuant to an investment sub-advisory agreement, EVM has delegated the investment management of the Fund to Richard Bernstein Advisors LLC (RBA). EVM pays RBA a portion of its investment adviser and administration fee for sub-advisory services provided to the Fund.
The Fund may invest in a money market fund, the Institutional Class of the Morgan Stanley Institutional Liquidity Funds - Government Portfolio (the “Liquidity Fund”), an open-end management investment company managed by Morgan Stanley Investment Management Inc., a wholly-owned subsidiary of Morgan Stanley. The investment adviser and administration fee paid by the Fund is reduced by an amount equal to its pro rata share of the advisory and administration fees paid by the Fund due to its investment in the Liquidity Fund. For the year ended August 31, 2024, the investment adviser and administration fee paid was reduced by $27,367 relating to the Fund’s investment in the Liquidity Fund.
EVM provides sub-transfer agency and related services to the Fund pursuant to a Sub-Transfer Agency Support Services Agreement. For the year ended August 31, 2024, EVM earned $21,142 from the Fund pursuant to such agreement, which is included in transfer and dividend disbursing agent fees on
Eaton Vance
Richard Bernstein All Asset Strategy Fund
August 31, 2024
Notes to Financial Statements — continued
the Statement of Operations. The Fund was informed that Eaton Vance Distributors, Inc. (EVD), an affiliate of EVM and the Fund’s principal underwriter, received $2,648 as its portion of the sales charge on sales of Class A shares for the year ended August 31, 2024. The Fund was informed that Morgan Stanley affiliated broker-dealers, which may be deemed to be affiliates of EVM and EVD, also received a portion of the sales charge on sales of Class A shares for the year ended August 31, 2024 in the amount of $175. EVD also received distribution and service fees from Class A and Class C shares (see Note 4) and contingent deferred sales charges (see Note 5).
Trustees and officers of the Fund who are members of EVM’s organization receive remuneration for their services to the Fund out of the investment adviser and administration fee. Trustees of the Fund who are not affiliated with EVM may elect to defer receipt of all or a percentage of their annual fees in accordance with the terms of the Trustees Deferred Compensation Plan. Certain officers and Trustees of the Fund are officers of EVM.
4 Distribution Plans
The Fund has in effect a distribution plan for Class A shares (Class A Plan) pursuant to Rule 12b-1 under the 1940 Act. Pursuant to the Class A Plan, the Fund pays EVD a distribution and service fee of 0.25% per annum of its average daily net assets attributable to Class A shares for distribution services and facilities provided to the Fund by EVD, as well as for personal services and/or the maintenance of shareholder accounts. Distribution and service fees paid or accrued to EVD for the year ended August 31, 2024 amounted to $222,206 for Class A shares.
The Fund also has in effect a distribution plan for Class C shares (Class C Plan) pursuant to Rule 12b-1 under the 1940 Act. Pursuant to the Class C Plan, the Fund pays EVD amounts equal to 0.75% per annum of its average daily net assets attributable to Class C shares for providing ongoing distribution services and facilities to the Fund. For the year ended August 31, 2024, the Fund paid or accrued to EVD $341,827 for Class C shares.
Pursuant to the Class C Plan, the Fund also makes payments of service fees to EVD, financial intermediaries and other persons in amounts equal to 0.25% per annum of its average daily net assets attributable to that class. Service fees paid or accrued are for personal services and/or the maintenance of shareholder accounts. They are separate and distinct from the sales commissions and distribution fees payable to EVD. Service fees paid or accrued for the year ended August 31, 2024 amounted to $113,942 for Class C shares.
Distribution and service fees are subject to the limitations contained in the Financial Industry Regulatory Authority Rule 2341(d).
5 Contingent Deferred Sales Charges
A contingent deferred sales charge (CDSC) of 1% generally is imposed on redemptions of Class C shares made within 12 months of purchase. Class A shares may be subject to a 1% CDSC if redeemed within 12 months of purchase (depending on the circumstances of purchase). Generally, the CDSC is based upon the lower of the net asset value at date of redemption or date of purchase. No charge is levied on shares acquired by reinvestment of dividends or capital gain distributions. For the year ended August 31, 2024, the Fund was informed that EVD received $3,750 and $2,514 of CDSCs paid by Class A and Class C shareholders, respectively.
6 Purchases and Sales of Investments
Purchases and sales of investments, other than short-term obligations, for the year ended August 31, 2024 were as follows:
| | Purchases | Sales |
| Investments (non-U.S. Government) | $162,773,512 | $228,621,528 |
| U.S. Government and Agency Securities | 51,750,775 | 97,465,606 |
| | $214,524,287 | $326,087,134 |
Eaton Vance
Richard Bernstein All Asset Strategy Fund
August 31, 2024
Notes to Financial Statements — continued
7 Shares of Beneficial Interest
The Fund’s Declaration of Trust permits the Trustees to issue an unlimited number of full and fractional shares of beneficial interest (without par value). Such shares may be issued in a number of different series (such as the Fund) and classes. Transactions in Fund shares, including direct exchanges pursuant to share class conversions, were as follows:
| | Year Ended
August 31, 2024 | | Year Ended
August 31, 2023 |
| | Shares | Amount | | Shares | Amount |
| Class A | | | | | |
| Sales | 953,821 | $ 13,064,242 | | 1,254,616 | $ 16,662,677 |
| Issued to shareholders electing to receive payments of distributions in Fund shares | 83,627 | 1,137,321 | | 32,063 | 419,380 |
| Redemptions | (1,879,277) | (25,636,385) | | (1,954,038) | (25,860,309) |
| Net decrease | (841,829) | $(11,434,822) | | (667,359) | $ (8,778,252) |
| Class C | | | | | |
| Sales | 164,234 | $ 2,187,671 | | 331,086 | $ 4,299,985 |
| Issued to shareholders electing to receive payments of distributions in Fund shares | 42,235 | 563,421 | | 590 | 7,564 |
| Redemptions | (1,513,326) | (20,132,272) | | (1,476,969) | (19,225,763) |
| Net decrease | (1,306,857) | $(17,381,180) | | (1,145,293) | $(14,918,214) |
| Class I | | | | | |
| Sales | 4,836,116 | $ 65,537,530 | | 8,375,804 | $111,641,966 |
| Issued to shareholders electing to receive payments of distributions in Fund shares | 397,862 | 5,430,819 | | 236,554 | 3,105,953 |
| Redemptions | (11,668,673) | (160,093,124) | | (21,894,982) | (290,774,590) |
| Net decrease | (6,434,695) | $(89,124,775) | | (13,282,624) | $(176,026,671) |
8 Line of Credit
The Fund participates with other portfolios and funds managed by EVM and its affiliates in a $650 million unsecured revolving line of credit agreement with a group of banks, which is in effect through October 22, 2024. In connection with the renewal of the agreement on October 24, 2023, the borrowing limit was decreased from $725 million. Borrowings are made by the Fund solely for temporary purposes related to redemptions and other short-term cash needs. Interest is charged to the Fund based on its borrowings at an amount above either the Secured Overnight Financing Rate (SOFR) or Federal Funds rate. In addition, a fee computed at an annual rate of 0.15% on the daily unused portion of the line of credit is allocated among the participating portfolios and funds at the end of each quarter. In connection with the renewal of the agreement in October 2023, an arrangement fee of $150,000 was incurred that was allocated to the participating portfolios and funds. Because the line of credit is not available exclusively to the Fund, it may be unable to borrow some or all of its requested amounts at any particular time. The Fund did not have any significant borrowings or allocated fees during the year ended August 31, 2024.
Eaton Vance
Richard Bernstein All Asset Strategy Fund
August 31, 2024
Notes to Financial Statements — continued
9 Securities Lending Agreement
The Fund has established a securities lending agreement with State Street Bank and Trust Company (SSBT) as securities lending agent in which the Fund lends portfolio securities to qualified borrowers in exchange for collateral consisting of either cash or securities issued or guaranteed by the U.S. government or its agencies or instrumentalities in an amount at least equal to the market value of the securities on loan. The market value of securities loaned is determined daily and any additional required collateral is delivered to the Fund on the next business day. Cash collateral is invested in the State Street Navigator Securities Lending Government Money Market Portfolio, a money market fund registered under the 1940 Act. The Fund earns interest on the amount invested but it must pay (and at times receive from) the broker a loan rebate fee computed as a varying percentage of the collateral received. For security loans secured by non-cash collateral, the Fund earns a negotiated lending fee from the borrower. A portion of the income earned by the Fund from its investment of cash collateral, net of rebate fees, and lending fees received is allocated to SSBT for its services as lending agent and the portion allocated to the Fund is presented as securities lending income, net on the Statement of Operations. Non-cash collateral is held by the lending agent on behalf of the Fund and cannot be sold or re-pledged by the Fund; accordingly, such collateral is not reflected in the Statement of Assets and Liabilities.
The Fund is subject to possible delay in the recovery of loaned securities. Pursuant to the securities lending agreement, SSBT has provided indemnification to the Fund in the event of default by a borrower with respect to a loan. The Fund bears the risk of loss with respect to the investment of cash collateral.
At August 31, 2024, the value of the securities loaned and the value of the collateral received, which exceeded the value of the securities loaned, amounted to $16,869,698 and $17,411,795, respectively. Collateral received was comprised of cash of $3,479,342 and U.S. government and/or agencies securities of $13,932,453. The securities lending transactions have no contractual maturity date and each of the Fund and borrower has the option to terminate a loan at any time.
The following table provides a breakdown of securities lending transactions accounted for as secured borrowings, the obligations by class of collateral pledged, and the remaining contractual maturity of those transactions as of August 31, 2024.
| | Remaining Contractual Maturity of the Transactions |
| | Overnight and
Continuous | <30 days | 30 to 90 days | >90 days | Total |
| Common Stocks | $3,479,342 | $ — | $ — | $ — | $3,479,342 |
The carrying amount of the liability for collateral for securities loaned at August 31, 2024 approximated its fair value. If measured at fair value, such liability would have been considered as Level 2 in the fair value hierarchy (see Note 11) at August 31, 2024.
10 Affiliated Investments
At August 31, 2024, the value of the Fund's investment in funds that may be deemed to be affiliated was $18,229,478, which represents 4.3% of the Fund's net assets. Transactions in such investments by the Fund for the year ended August 31, 2024 were as follows:
| Name | Value,
beginning
of period | Purchases | Sales
proceeds | Net realized
gain (loss) | Change in
unrealized
appreciation
(depreciation) | Value, end
of period | Dividend
income | Shares,
end of period |
| Short-Term Investments |
| Liquidity Fund | $23,911,666 | $159,141,173 | $(164,823,361) | $ — | $ — | $18,229,478 | $950,886 | 18,229,478 |
11 Fair Value Measurements
Under generally accepted accounting principles for fair value measurements, a three-tier hierarchy to prioritize the assumptions, referred to as inputs, is used in valuation techniques to measure fair value. The three-tier hierarchy of inputs is summarized in the three broad levels listed below.
| • | Level 1 – quoted prices in active markets for identical investments |
| • | Level 2 – other significant observable inputs (including quoted prices for similar investments, interest rates, prepayment speeds, credit risk, etc.) |
| • | Level 3 – significant unobservable inputs (including a fund's own assumptions in determining the fair value of investments) |
Eaton Vance
Richard Bernstein All Asset Strategy Fund
August 31, 2024
Notes to Financial Statements — continued
In cases where the inputs used to measure fair value fall in different levels of the fair value hierarchy, the level disclosed is determined based on the lowest level input that is significant to the fair value measurement in its entirety. The inputs or methodology used for valuing securities are not necessarily an indication of the risk associated with investing in those securities.
At August 31, 2024, the hierarchy of inputs used in valuing the Fund's investments, which are carried at fair value, were as follows:
| Asset Description | Level 1 | Level 2 | Level 3 | Total |
| Common Stocks: | | | | |
| Communication Services | $ 8,679,050 | $ — | $ — | $ 8,679,050 |
| Consumer Discretionary | 9,709,359 | 2,931,415 | — | 12,640,774 |
| Consumer Staples | 3,853,606 | 4,222,947 | — | 8,076,553 |
| Energy | 11,967,115 | 688,154 | — | 12,655,269 |
| Financials | 20,409,438 | 2,704,749 | — | 23,114,187 |
| Health Care | 15,131,537 | 5,197,680 | — | 20,329,217 |
| Industrials | 19,416,853 | 3,686,844 | — | 23,103,697 |
| Information Technology | 31,234,628 | 1,922,722 | — | 33,157,350 |
| Materials | 6,540,765 | 1,645,656 | — | 8,186,421 |
| Real Estate | 2,363,462 | — | — | 2,363,462 |
| Utilities | 2,086,262 | 1,093,225 | — | 3,179,487 |
| Total Common Stocks | $131,392,075 | $24,093,392* | $ — | $155,485,467 |
| Exchange-Traded Funds | $129,262,545 | $ — | $ — | $129,262,545 |
| U.S. Treasury Obligations | — | 121,200,304 | — | 121,200,304 |
| Short-Term Investments: | | | | |
| Affiliated Fund | 18,229,478 | — | — | 18,229,478 |
| Securities Lending Collateral | 3,479,342 | — | — | 3,479,342 |
| Total Investments | $282,363,440 | $145,293,696 | $ — | $427,657,136 |
| * | Includes foreign equity securities whose values were adjusted to reflect market trading of comparable securities or other correlated instruments that occurred after the close of trading in their applicable foreign markets. |
12 Risks and Uncertainties
Risks Associated with Foreign Investments
Foreign investments can be adversely affected by political, economic and market developments abroad, including the imposition of economic and other sanctions by the United States or another country, and by acts of terrorism and war. There may be less publicly available information about foreign issuers because they may not be subject to reporting practices, requirements or regulations comparable to those to which United States companies are subject. Foreign markets may be smaller, less liquid and more volatile than the major markets in the United States. Trading in foreign markets typically involves higher expense than trading in the United States. The Fund may have difficulties enforcing its legal or contractual rights in a foreign country. Securities that trade or are denominated in currencies other than the U.S. dollar may be adversely affected by fluctuations in currency exchange rates.
Eaton Vance
Richard Bernstein All Asset Strategy Fund
August 31, 2024
Report of Independent Registered Public Accounting Firm
To the Trustees of Eaton Vance Growth Trust and Shareholders of Eaton Vance Richard Bernstein All Asset Strategy Fund:
Opinion on the Financial Statements and Financial Highlights
We have audited the accompanying statement of assets and liabilities of Eaton Vance Richard Bernstein All Asset Strategy Fund (the "Fund") (one of the funds constituting Eaton Vance Growth Trust), including the portfolio of investments, as of August 31, 2024, the related statement of operations for the year then ended, the statements of changes in net assets for each of the two years in the period then ended, the financial highlights for each of the five years in the period then ended, and the related notes. In our opinion, the financial statements and financial highlights present fairly, in all material respects, the financial position of the Fund as of August 31, 2024, and the results of its operations for the year then ended, the changes in its net assets for each of the two years in the period then ended, and the financial highlights for each of the five years in the period then ended, in conformity with accounting principles generally accepted in the United States of America.
Basis for Opinion
These financial statements and financial highlights are the responsibility of the Fund's management. Our responsibility is to express an opinion on the Fund's financial statements and financial highlights based on our audits. We are a public accounting firm registered with the Public Company Accounting Oversight Board (United States) (PCAOB) and are required to be independent with respect to the Fund in accordance with the U.S. federal securities laws and the applicable rules and regulations of the Securities and Exchange Commission and the PCAOB.
We conducted our audits in accordance with the standards of the PCAOB. Those standards require that we plan and perform the audit to obtain reasonable assurance about whether the financial statements and financial highlights are free of material misstatement, whether due to error or fraud. The Fund is not required to have, nor were we engaged to perform, an audit of its internal control over financial reporting. As part of our audits, we are required to obtain an understanding of internal control over financial reporting but not for the purpose of expressing an opinion on the effectiveness of the Fund’s internal control over financial reporting. Accordingly, we express no such opinion.
Our audits included performing procedures to assess the risks of material misstatement of the financial statements and financial highlights, whether due to error or fraud, and performing procedures that respond to those risks. Such procedures included examining, on a test basis, evidence regarding the amounts and disclosures in the financial statements and financial highlights. Our audits also included evaluating the accounting principles used and significant estimates made by management, as well as evaluating the overall presentation of the financial statements and financial highlights. Our procedures included confirmation of securities owned as of August 31, 2024, by correspondence with the custodian and brokers; when replies were not received from brokers, we performed other auditing procedures. We believe that our audits provide a reasonable basis for our opinion.
/s/ Deloitte & Touche LLP
Boston, Massachusetts
October 17, 2024
We have served as the auditor of one or more Eaton Vance investment companies since 1959.
Eaton Vance
Richard Bernstein All Asset Strategy Fund
August 31, 2024
Federal Tax Information (Unaudited)
The Form 1099-DIV you receive in February 2025 will show the tax status of all distributions paid to your account in calendar year 2024. Shareholders are advised to consult their own tax adviser with respect to the tax consequences of their investment in the Fund. As required by the Internal Revenue Code and/or regulations, shareholders must be notified regarding the status of qualified business income, qualified dividend income for individuals, the dividends received deduction for corporations and 163(j) interest dividends.
Qualified Business Income. For the fiscal year ended August 31, 2024, the Fund designates approximately $59,148, or up to the maximum amount of such dividends allowable pursuant to the Internal Revenue Code, as qualified business income.
Qualified Dividend Income. For the fiscal year ended August 31, 2024, the Fund designates approximately $3,338,478, or up to the maximum amount of such dividends allowable pursuant to the Internal Revenue Code, as qualified dividend income eligible for the reduced tax rate of 15%.
Dividends Received Deduction. Corporate shareholders are generally entitled to take the dividends received deduction on the portion of the Fund’s dividend distribution that qualifies under tax law. For the Fund’s fiscal 2024 ordinary income dividends, 13.83% qualifies for the corporate dividends received deduction.
163(j) Interest Dividends. For the fiscal year ended August 31, 2024, the Fund designates 32.44% of distributions from net investment income as a 163(j) interest dividend.
Eaton Vance
Richard Bernstein All Asset Strategy Fund
August 31, 2024
Board of Trustees’ Contract Approval
Overview of the Contract Review Process
The Investment Company Act of 1940, as amended (the “1940 Act”), provides, in substance, that the investment advisory agreement between a fund and its investment adviser will continue in effect from year-to-year only if its continuation is approved on an annual basis by a vote of the fund’s board of trustees, including a majority of the trustees who are not “interested persons” of the fund (“independent trustees”), cast in person at a meeting called for the purpose of considering such approval.
At a meeting held on June 6, 2024, the Boards of Trustees/Directors (collectively, the “Board”) that oversee the registered investment companies advised by Eaton Vance Management or its affiliate, Boston Management and Research (the “Eaton Vance Funds”), including a majority of the independent trustees (the “Independent Trustees”), voted to approve the continuation of existing investment advisory agreements and sub-advisory agreements1 for each of the Eaton Vance Funds for an additional one-year period. The Board relied upon the affirmative recommendation of its Contract Review Committee, which is a committee comprised of all of the Independent Trustees. Prior to making its recommendation, the Contract Review Committee reviewed information furnished by the adviser and sub-adviser to each of the Eaton Vance Funds (including information specifically requested by the Board) for a series of meetings held between April and June 2024, as well as certain additional information provided in response to specific requests from the Independent Trustees as members of the Contract Review Committee. Members of the Contract Review Committee also considered information received at prior meetings of the Board and its committees, to the extent such information was relevant to the Contract Review Committee’s annual evaluation of the investment advisory agreements and sub-advisory agreements.
In connection with its evaluation of the investment advisory agreements and sub-advisory agreements, the Board considered various information relating to the Eaton Vance Funds. This included information applicable to all or groups of Eaton Vance Funds, which is referenced immediately below, and information applicable to the particular Eaton Vance Fund covered by this report (each “Eaton Vance Fund” is referred to below as a “fund”). (For funds that invest through one or more underlying portfolios, references to “each fund” in this section may include information that was considered at the portfolio-level.)
Information about Fees, Performance and Expenses
• A report from an independent data provider comparing advisory and other fees paid by each fund to such fees paid by comparable funds, as identified by the independent data provider (“comparable funds”);
• A report from an independent data provider comparing each fund’s total expense ratio (and its components) to those of comparable funds;
• A report from an independent data provider comparing the investment performance of each fund (including, as relevant, total return data, income data, Sharpe ratios, and information ratios) to the investment performance of comparable funds and, as applicable, benchmark indices, over various time periods;
• In certain instances, data regarding investment performance relative to customized groups of peer funds and blended indices identified by the adviser in consultation with the Portfolio Management Committee of the Board (a committee exclusively comprised of Independent Trustees);
• Comparative information concerning the fees charged and services provided by the adviser and sub-adviser to each fund in managing other accounts (which may include other funds, collective investment trusts and institutional accounts) with the same or substantially similar investment objective as the fund and with a significant overlap in holdings based on criteria set by the Board, if any;
• Profitability analyses with respect to the adviser and sub-adviser to each of the funds;
Information about Portfolio Management and Trading
• Descriptions of the investment management services provided to each fund, as well as each of the funds’ investment strategies and policies;
• The procedures and processes used by the adviser to determine the value of fund assets, including, when necessary, the determination of “fair value” by the adviser in its role as each funds’ valuation designee and actions taken to monitor and test the effectiveness of such procedures and processes;
• Information about the policies and practices of each fund’s adviser and sub-adviser with respect to trading, including their processes for seeking best execution of portfolio transactions;
• Information about the allocation of brokerage transactions and the benefits, if any, received by the adviser and sub-adviser to each fund as a result of brokerage allocation, including, as applicable, information concerning the acquisition of research through client commission arrangements and policies with respect to “soft dollars”;
• Data relating to the portfolio turnover rate of each fund and related information regarding active management in the context of particular strategies;
Information about each Adviser and Sub-adviser
• Reports detailing the financial results and condition of the adviser and sub-adviser to each fund;
1 Not all Eaton Vance Funds have entered into a sub-advisory agreement with a sub-adviser. Accordingly, references to “sub-adviser” or “sub-advisory agreement” in this “Overview” section may not be applicable to the particular Eaton Vance Fund covered by this report. Eaton Vance Management and Boston Management and Research are referred to collectively as the “adviser.”
Eaton Vance
Richard Bernstein All Asset Strategy Fund
August 31, 2024
Board of Trustees’ Contract Approval — continued
• Information regarding the individual investment professionals whose responsibilities include portfolio management and investment research for the funds, and, for portfolio managers and certain other investment professionals, information relating to their responsibilities with respect to managing other funds and investment accounts, as applicable;
• Information regarding the adviser’s and its parent company’s (Morgan Stanley’s) efforts to retain and attract talented investment professionals, including in the context of a competitive marketplace for talent;
• Information regarding the adviser’s compensation methodology for its investment professionals and the incentives and accountability it creates, along with investment professionals’ investments in the fund(s) they manage;
• The personal trading codes of ethics of the adviser and its affiliates and the sub-adviser of each fund, together with information relating to compliance with, and the administration of, such codes;
• Policies and procedures relating to proxy voting, including regular reporting with respect to fund proxy voting activities;
• Information regarding the handling of corporate actions and class actions, as well as information regarding litigation and other regulatory matters;
• Information concerning the resources devoted to compliance efforts undertaken by the adviser and its affiliates and the sub-adviser of each fund, including descriptions of their various compliance programs and their record of compliance and remediation;
• Information concerning the business continuity and disaster recovery plans of the adviser and its affiliates and the sub-adviser of each fund;
• A description of the adviser’s oversight of sub-advisers, including with respect to regulatory and compliance issues, investment management and other matters;
Other Relevant Information
• Information regarding ongoing initiatives to further integrate and harmonize, where applicable, the investment management and other departments of the adviser and its affiliates with the overall investment management infrastructure of Morgan Stanley, in light of Morgan Stanley’s acquisition of Eaton Vance Corp. on March 1, 2021;
• Information concerning the nature, cost, and character of the administrative and other non-investment advisory services provided by the adviser and its affiliates;
• Information concerning oversight of the relationship with the custodian, subcustodians, fund accountants, and other third-party service providers by the adviser and/or administrator to each of the funds;
• Information concerning efforts to implement policies and procedures with respect to various regulations applicable to the funds, including Rule 12d1-4 (the Fund-of-Funds Rule), Rule 18f-4 (the Derivatives Rule), and Rule 2a-5 (the Fair Valuation Rule);
• For an Eaton Vance Fund structured as an exchange-listed closed-end fund, information concerning the benefits of the closed-end fund structure, as well as, where relevant, the closed-end fund’s market prices (including as compared to the closed-end fund’s net asset value (NAV)), trading volume data, continued use of auction preferred shares (where applicable), distribution rates, and other relevant matters;
• The risks that the adviser and/or its affiliates incur in connection with the management and operation of the funds, including, among others, litigation, regulatory, entrepreneurial, and other business risks (and the associated costs of such risks); and
• The terms of each investment advisory agreement and sub-advisory agreement.
During the various meetings of the Board and its committees over the course of the year leading up to the June 6, 2024 meeting, the Board and its committees received information from portfolio managers and other investment professionals of the adviser and sub-advisers of the funds regarding investment and performance matters, and considered various investment and trading strategies used in pursuing the funds’ investment objectives. The Board and its committees also received information regarding risk management techniques employed in connection with the management of the funds. The Board and its committees evaluated issues pertaining to industry and regulatory developments, compliance procedures, fund governance, and other issues with respect to the funds, and received and participated in reports and presentations provided by the adviser and sub-advisers, with respect to such matters. In addition to the formal meetings of the Board and its committees, the Independent Trustees held regular video or telephone conferences to discuss, among other topics, matters relating to the continuation of investment advisory agreements and sub-advisory agreements.
The Contract Review Committee was advised throughout the contract review process by Kirkland & Ellis LLP, independent legal counsel for the Independent Trustees. The members of the Contract Review Committee, with the advice of such counsel, exercised their own business judgment in determining the material factors to be considered in evaluating each investment advisory agreement and sub-advisory agreement and the weight to be given to each such factor. The conclusions reached with respect to each investment advisory agreement and sub-advisory agreement were based on a comprehensive evaluation of all the information provided and not any single factor. Moreover, each member of the Contract Review Committee may have placed varying emphasis on particular factors in reaching conclusions with respect to each investment advisory agreement and sub-advisory agreement. In evaluating each investment advisory agreement and sub-advisory agreement, including the fee structures and other terms contained in such agreements, the members of the Contract Review Committee were also informed by multiple years of analysis and discussion with the adviser and sub-adviser to each of the Eaton Vance Funds.
Results of the Contract Review Process
Based on its consideration of the foregoing, and such other information it deemed relevant, including the factors and conclusions described below, the Contract Review Committee concluded that the continuation of the investment advisory and administrative agreement between Eaton Vance Richard Bernstein All Asset Strategy Fund (the “Fund”) and Eaton Vance Management (the “Adviser”) and the sub-advisory agreement between the Adviser and
Eaton Vance
Richard Bernstein All Asset Strategy Fund
August 31, 2024
Board of Trustees’ Contract Approval — continued
Richard Bernstein Advisors LLC (the “Sub-adviser”), with respect to the Fund, including their respective fee structures, are in the interests of shareholders and, therefore, recommended to the Board approval of each agreement. Based on the recommendation of the Contract Review Committee, the Board, including a majority of the Independent Trustees, voted to approve continuation of the investment advisory and administrative agreement and the sub-advisory agreement for the Fund.
Nature, Extent and Quality of Services
In considering whether to approve the investment advisory and administrative agreement and the sub-advisory agreement for the Fund, the Board evaluated the nature, extent and quality of services provided to the Fund by the Adviser and the Sub-adviser.
The Board considered the Adviser’s and the Sub-adviser’s management capabilities and investment processes in light of the types of investments held by the Fund, including the education and experience of the investment professionals who provide services to the Fund. Regarding the Adviser, the Board considered the Adviser’s responsibilities with respect to oversight of the Sub-adviser and coordinating activities in implementing the Fund’s investment strategies. In particular, the Board evaluated the abilities and experience of the Sub-adviser’s investment professionals in investing in assets around the world and among various asset classes, including equity, fixed-income, commodity, currency and cash investments. With respect to the Sub-adviser, the Board took into account the resources available to the Sub-adviser in fulfilling its duties under the sub-advisory agreement and the principal elements of the investment process and portfolio construction techniques employed by the Sub-adviser. The Board also took into account the resources dedicated to portfolio management and other services, the compensation methods of the Adviser and other factors, including the reputation and resources of the Adviser to recruit and retain highly qualified research, advisory and supervisory investment professionals. In addition, the Board considered the time and attention devoted to the Eaton Vance Funds, including the Fund, by senior management, as well as the infrastructure, operational capabilities and support staff in place to assist in the portfolio management and operations of the Fund, including the provision of administrative services. The Board also considered the business-related and other risks to which the Adviser or its affiliates may be subject in managing the Fund.
The Board considered the compliance programs of the Adviser, the Sub-adviser and relevant affiliates thereof. The Board considered compliance and reporting matters regarding, among other things, personal trading by investment professionals, disclosure of portfolio holdings, compliance with policies and procedures, portfolio valuation, business continuity and the allocation of investment opportunities. The Board also considered relevant examinations of the Adviser and its affiliates by regulatory authorities, such as the Securities and Exchange Commission and the Financial Industry Regulatory Authority.
The Board considered other administrative services provided or overseen by Eaton Vance Management and its affiliates, including transfer agency and accounting services. The Board evaluated the benefits to shareholders of investing in a fund that is a part of a large fund complex offering exposure to a variety of asset classes and investment disciplines, as well as the ability, in many cases, to exchange an investment among different funds without incurring additional sales charges.
After consideration of the foregoing factors, among others, the Board concluded that the nature, extent and quality of services provided by the Adviser and the Sub-adviser, taken as a whole, are appropriate and consistent with the terms of the investment advisory and administrative agreement and the sub-advisory agreement.
Fund Performance
The Board compared the Fund’s investment performance to that of comparable funds identified by an independent data provider (the peer group), as well as appropriate benchmark indices and a customized peer group of similarly managed funds. The Board’s review included comparative performance data with respect to the Fund for the one-, three-, five- and ten-year periods ended December 31, 2023. In this regard, the Board noted that the performance of the Fund was lower than the median performance of the Fund’s peer group and custom peer group for the three-year period. The Board also noted that the performance of the Fund was higher than its primary benchmark index and lower than its blended and secondary benchmark indexes for the three-year period. The Board considered information from the Adviser and the Sub-adviser regarding the reasons for the Fund’s relative underperformance, including the Fund’s relatively higher exposure to fixed income securities, which underperformed equity securities during the period. On the basis of the foregoing and other relevant information provided by the Adviser and Sub-adviser in response to supplemental requests from the Contract Review Committee, the Board determined to continue to monitor the performance of the Fund.
Management Fees and Expenses
The Board considered contractual fee rates payable by the Fund for advisory and administrative services (referred to collectively as “management fees”). As part of its review, the Board considered the Fund’s management fees and total expense ratio for the one-year period ended December 31, 2023, as compared to those of comparable funds, before and after giving effect to any undertaking to waive fees or reimburse expenses. The Board also considered factors that had an impact on the Fund’s total expense ratio relative to comparable funds. The Board also considered that the management fees paid by the Fund are for services provided in addition to, and are not duplicative of, services provided under the advisory contract(s) of the exchange traded funds in which the Fund may invest.
After considering the foregoing information, and in light of the nature, extent and quality of the services provided by the Adviser and the Sub-adviser, the Board concluded that the management fees charged for advisory and related services are reasonable.
Eaton Vance
Richard Bernstein All Asset Strategy Fund
August 31, 2024
Board of Trustees’ Contract Approval — continued
Profitability and “Fall-Out” Benefits
The Board considered the level of profits realized by the Adviser and relevant affiliates thereof in providing investment advisory and administrative services to the Fund and to all Eaton Vance Funds as a group. The Board considered the level of profits realized without regard to marketing support or other payments by the Adviser and its affiliates to third parties in respect of distribution or other services.
The Board concluded that, in light of the foregoing factors and the nature, extent and quality of the services rendered, the profits realized by the Adviser and its affiliates are not excessive. The Board also concluded that, in light of its role as a sub-adviser not affiliated with the Adviser, the Sub-adviser’s expected profitability in managing the Fund was not a material factor.
The Board also considered direct or indirect fall-out benefits received by the Adviser and its affiliates in connection with their respective relationships with the Fund, including the benefits of research services that may be available to the Adviser as a result of securities transactions effected for the Fund and other investment advisory clients.
Economies of Scale
In reviewing management fees and profitability, the Board also considered the extent to which the Adviser and its affiliates, on the one hand, and the Fund, on the other hand, can expect to realize benefits from economies of scale as the assets of the Fund increase. The Board acknowledged the difficulty in accurately measuring the benefits resulting from economies of scale, if any, with respect to the management of any specific fund or group of funds. To assist in the evaluation of the sharing of any economies of scale, the Board received data showing for recent years, asset levels, Adviser profitability and total expense ratios. Based upon the foregoing, the Board concluded that the Fund currently shares in the benefits from economies of scale, if any, when they are realized by the Adviser. The Board also concluded that the structure of the advisory fee, which includes breakpoints at several asset levels, will allow the Fund to continue to benefit from any economies of scale in the future.
This Page Intentionally Left Blank
This Page Intentionally Left Blank
This Page Intentionally Left Blank
Item 8. Changes in and Disagreements with Accountants for Open-End Management Investment Companies
Not applicable.
Item 9. Proxy Disclosures for Open-End Management Investment Companies
Not applicable.
Item 10. Remuneration Paid to Directors, Officers, and Others of Open-End Management Investment Companies
The information is disclosed as part of the Financial Statements included in Item 7 of this Form N-CSR.
Item 11. Statement Regarding Basis for Approval of Investment Advisory Contract
The information is included in Item 7 of this Form N-CSR.
Item 12. Disclosure of Proxy Voting Policies and Procedures for Closed-End Management Investment Companies
Not applicable.
Item 13. Portfolio Managers of Closed-End Management Investment Companies
Not applicable.
Item 14. Purchases of Equity Securities by Closed-End Management Investment Company and Affiliated Purchasers
Not applicable.
Item 15. Submission of Matters to a Vote of Security Holders
There have been no material changes to the procedures by which shareholders may recommend nominee to the Fund’s Board of Trustees since the Fund last provided disclosure in response to this item.
Item 16. Controls and Procedures
| (a) | It is the conclusion of the registrant’s principal executive officer and principal financial officer that the effectiveness of the registrant’s current disclosure controls and procedures (such disclosure controls and procedures having been evaluated within 90 days of the date of this filing) provide reasonable assurance that the information required to be disclosed by the registrant has been recorded, processed, summarized and reported within the time period specified in the Commission’s rules and forms and that the information required to be disclosed by the registrant has been accumulated and communicated to the registrant’s principal executive officer and principal financial officer in order to allow timely decisions regarding required disclosure. |
| (b) | There have been no changes in the registrant’s internal controls over financial reporting during the period covered by this report that has materially affected, or is reasonably likely to materially affect, the registrant’s internal control over financial reporting. |
Item 17. Disclosure of Securities Lending Activities for Closed-End Management Investment Companies
Not applicable.
Item 18. Recovery of Erroneously Awarded Compensation
Not applicable.
Item 19. Exhibits
Signatures
Pursuant to the requirements of the Securities Exchange Act of 1934 and the Investment Company Act of 1940, the registrant has duly caused this report to be signed on its behalf by the undersigned, thereunto duly authorized.
| | |
| Eaton Vance Growth Trust |
| |
| By: | | /s/ Kenneth A. Topping |
| | Kenneth A. Topping |
| | Principal Executive Officer |
Date: October 21, 2024
Pursuant to the requirements of the Securities Exchange Act of 1934 and the Investment Company Act of 1940, this report has been signed below by the following persons on behalf of the registrant and in the capacities and on the dates indicated.
| | |
| By: | | /s/ James F. Kirchner |
| | James F. Kirchner |
| | Principal Financial Officer |
Date: October 21, 2024
| | |
| By: | | /s/ Kenneth A. Topping |
| | Kenneth A. Topping |
| | Principal Executive Officer |
Date: October 21, 2024