UNITED STATES
SECURITIES AND EXCHANGE COMMISSION
Washington, D.C. 20549
FORM N-CSR
CERTIFIED SHAREHOLDER REPORT OF REGISTERED
MANAGEMENT INVESTMENT COMPANIES
Investment Company Act file number | 811-02589 |
|
Eaton Vance Series Trust |
(Exact name of registrant as specified in charter) |
|
The Eaton Vance Building, 255 State Street, Boston, Massachusetts | | 02109 |
(Address of principal executive offices) | | (Zip code) |
|
Alan R. Dynner The Eaton Vance Building, 255 State Street, Boston, Massachusetts 02109 |
(Name and address of agent for service) |
|
Registrant’s telephone number, including area code: | (617) 482-8260 | |
|
Date of fiscal year end: | December 31 | |
|
Date of reporting period: | December 31, 2006 | |
| | | | | | | | |
Item 1. Reports to Stockholders

Annual Report December 31, 2006


EATON VANCE
TAX-MANAGED
GROWTH
FUND
1.0
IMPORTANT NOTICES REGARDING PRIVACY,
DELIVERY OF SHAREHOLDER DOCUMENTS,
PORTFOLIO HOLDINGS, AND PROXY VOTING
Privacy. The Eaton Vance organization is committed to ensuring your financial privacy. Each of the financial institutions identified below has in effect the following policy ("Privacy Policy") with respect to nonpublic personal information about its customers:
• Only such information received from you, through application forms or otherwise, and information about your Eaton Vance fund transactions will be collected. This may include information such as name, address, social security number, tax status, account balances and transactions.
• None of such information about you (or former customers) will be disclosed to anyone, except as permitted by law (which includes disclosure to employees necessary to service your account). In the normal course of servicing a customer's account, Eaton Vance may share information with unaffiliated third parties that perform various required services such as transfer agents, custodians and broker/dealers.
• Policies and procedures (including physical, electronic and procedural safeguards) are in place that are designed to protect the confidentiality of such information.
• We reserve the right to change our Privacy Policy at any time upon proper notification to you. Customers may want to review our Policy periodically for changes by accessing the link on our homepage: www.eatonvance.com.
Our pledge of privacy applies to the following entities within the Eaton Vance organization: the Eaton Vance Family of Funds, Eaton Vance Management, Eaton Vance Investment Counsel, Boston Management and Research, and Eaton Vance Distributors, Inc.
In addition, our Privacy Policy only applies to those Eaton Vance customers who are individuals and who have a direct relationship with us. If a customer's account (i.e., fund shares) is held in the name of a third-party financial adviser/broker-dealer, it is likely that only such adviser's privacy policies apply to the customer. This notice supersedes all previously issued privacy disclosures.
For more information about Eaton Vance's Privacy Policy, please call 1-800-262-1122.
Delivery of Shareholder Documents. The Securities and Exchange Commission (the "SEC") permits funds to deliver only one copy of shareholder documents, including prospectuses, proxy statements and shareholder reports, to fund investors with multiple accounts at the same residential or post office box address. This practice is often called "householding" and it helps eliminate duplicate mailings to shareholders.
Eaton Vance, or your financial adviser, may household the mailing of your documents indefinitely unless you instruct Eaton Vance, or your financial adviser, otherwise.
If you would prefer that your Eaton Vance documents not be householded, please contact Eaton Vance at 1-800-262-1122, or contact your financial adviser.
Your instructions that householding not apply to delivery of your Eaton Vance documents will be effective within 30 days of receipt by Eaton Vance or your financial adviser.
Portfolio Holdings. Each Eaton Vance Fund and its underlying Portfolio (if applicable) will file a schedule of its portfolio holdings on Form N-Q with the SEC for the first and third quarters of each fiscal year. The Form N-Q will be available on the Eaton Vance website www.eatonvance.com, by calling Eaton Vance at 1-800-262-1122 or in the EDGAR database on the SEC's website at www.sec.gov. Form N-Q may also be reviewed and copied at the SEC's public reference room in Washington, D.C. (call 1-800-732-0330 for information on the operation of the public reference room).
Proxy Voting. From time to time, funds are required to vote proxies related to the securities held by the funds. The Eaton Vance Funds or their underlying Portfolios (if applicable) vote proxies according to a set of policies and procedures approved by the Funds' and Portfolios' Boards. You may obtain a description of these policies and procedures and information on how the Funds or Portfolios voted proxies relating to portfolio securities during the most recent 12 month period ended June 30, without charge, upon request, by calling 1-800-262-1122. This description is also available on the SEC's website at www.sec.gov.
Eaton Vance Tax-Managed Growth Fund 1.0 as of December 31, 2006
MANAGEMENT’S DISCUSSION OF FUND PERFORMANCE

Lewis R. Piantedosi
Co-Portfolio Manager

Duncan W. Richardson, CFA
Co-Portfolio Manager
The Fund
Performance for the Past Year
· For the year ended December 31, 2006, Eaton Vance Tax-Managed Growth Fund 1.0 (the Fund) had a total return of 13.62%. This return was the result of an increase in net asset value per share to $603.37 on December 31, 2006, from $546.87 on December 31, 2005, and the reinvestment of $8.030 per share in dividend income and $9.5115 per share in capital gains.
· For comparison, the S&P 500 Index – a broad-based, unmanaged market index commonly used as a measure of overall U.S. stock market performance – had a total return of 15.78% for the same period. The Lipper Large-Cap Core Classification had a total return of 13.53% for the same period.(1)
See pages 3 and 4 for more performance information, including after-tax returns.
Management Discussion
· The year ended December 31, 2006 marked another impressive year for equities as broad U.S. markets locked in a fourth consecutive annual gain. Helping fuel the rally were easing inflation and housing concerns, as well as declining oil prices and a continued pause in interest rate increases. Record levels of mergers and private equity activity further supported higher stock prices during the year, as did better than expected earnings and profit results. Price gains for the year were broad-based, but of particular note were the double digit gains realized by the blue chip Dow Industrial Average and the S&P 500 Index.
· For the year ended December 31, 2006, each of the 10 major sectors included in the S&P 500 Index registered positive returns. Telecommunications, energy and utilities were top performing S&P 500 Index sectors during the year, while the health care and information technology sectors had the weakest performance. Market leading industries of 2006 included diversified telecommunications, real estate investment trusts and investment bank and brokerage. In contrast, internet and catalog retailers, biotechnology and educational service industries realized weaker returns for the year. During the course of the year, on average, small-cap stocks outperformed large-cap stocks and the value investment style continued to lead growth.
· The Fund invests its assets in Tax-Managed Growth Portfolio (the Portfolio), a separate registered investment company with the same objective and investment policies as the Fund. The Portfolio in turn invests primarily in common stocks of established growth companies. The Fund underperformed its benchmark due in part to differences in sector allocation and stock selection in the Portfolio versus the S&P 500 Index.
· During the year ended December 31, 2006, the Portfolio remained overweight in the industrials, consumer staples and consumer discretionary sectors, while continuing to underweight the technology, telecommunications and utilities sectors. The Portfolio benefited from its emphasis of the strong performing energy and consumer discretionary sectors and relatively stronger investment selection within commercial banks and metals and mining versus the S&P 500 Index. The Portfolio’s underweight of the technology sector was also helpful, particularly within the semiconductor and internet software industries, as stocks in those sectors experienced significant declines over the course of the year.
(1) It is not possible to invest directly in an Index or a Lipper Classification. The Index’s total return does not reflect commissions or expenses that would have been incurred if an investor individually purchased or sold the securities represented in the Index. The Lipper Classification return shown is the average total return, at net asset value, of the funds that are in the same Lipper Classification as the Fund.
Past performance is no guarantee of future results. Returns are historical and are calculated by determining the percentage change in net asset value or offering price (as applicable) with all distributions reinvested. Investment return and principal value will fluctuate so that shares, when redeemed, may be worth more or less than their original cost. Performance is for the stated time period only; due to market volatility, the Fund’s current performance may be lower or higher than the quoted return. For performance as of the most recent month-end, please refer to www.eatonvance.com.
Fund shares are not insured by the FDIC and are not deposits or other obligations of, or guaranteed by, any depository institution. Shares are subject to investment risks, including possible loss of principal invested.
1
Eaton Vance Tax-Managed Growth Fund 1.0 as of December 31, 2006
Management’s Discussion of Fund Performance
· During the year ended December 31, 2006, the Portfolio’s de-emphasis of high dividend yielding stocks, such as those in the utilities and telecommunications sectors, hurt performance, as did the weak performance of certain Portfolio holdings in the health care and consumer staples sectors. Despite positive performance from holdings in the air freight and machinery stocks industries, the Portfolio’s overweight of the lagging industrials sector negatively impacted returns.
The views expressed throughout this report are those of the portfolio managers and are current only through the end of the period of the report as stated on the cover. These views are subject to change at any time based upon market or other conditions, and the investment adviser disclaims any responsibility to update such views. These views may not be relied on as investment advice and, because investment decisions for a fund are based on many factors, may not be relied on as an indication of trading intent on behalf of any Eaton Vance fund.
Ten Largest Holdings*
By net assets
Exxon Mobil Corp. | | 2.64 | % |
General Electric Co. | | 2.37 | % |
Procter & Gamble Co. | | 2.34 | % |
American International Group | | 2.22 | % |
ConocoPhillips | | 2.17 | % |
Pepsico Inc. | | 1.90 | % |
BP PLC Spons ADR | | 1.68 | % |
Deere & Co. | | 1.55 | % |
Amgen Inc. | | 1.47 | % |
Danaher Corp. | | 1.44 | % |
Common Stock Investments by Sector**
By net assets

* Ten Largest Holdings represented 19.78% of Portfolio net assets as of December 31, 2006. Holdings are subject to change due to active management.
**As a percentage of the Portfolio’s net assets as of December 31, 2006. Portfolio information may not be representative of current or future investments and may change due to active management.
2
Eaton Vance Tax-Managed Growth Fund 1.0 as of December 31, 2006
FUND PERFORMANCE
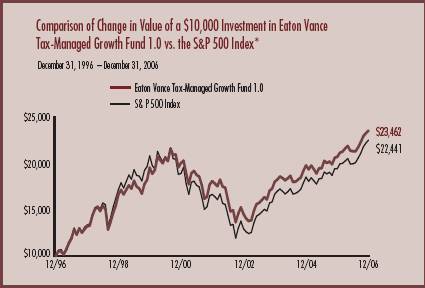
The line graph and table set forth below provide information about the Fund’s performance. The line graph compares the performance of the Fund with that of the S&P 500 Index, a broad-based, unmanaged market index commonly used as a measure of U.S. stock market performance. The lines on the graph represent the total returns of a hypothetical investment of $10,000 in each of the Fund and the S&P 500 Index. The table includes the total returns of the Fund. The performance presented below does not reflect the deduction of taxes, if any, that a shareholder would pay on distributions or redemptions of Fund shares.
Performance
Average Annual Total Returns (at net asset value) | | | |
One Year | | 13.62 | % |
Five Years | | 5.38 | % |
Ten Years | | 8.90 | % |
Life of Fund (3/29/66) | | 10.27 | % |
Past performance is no guarantee of future results. Returns are historical and are calculated by determining the percentage change in net asset value or offering price (as applicable) with all distributions reinvested. Investment return and principal value will fluctuate so that shares, when redeemed, may be worth more or less than their original cost. Performance is for the stated time period only; due to market volatility, the Fund’s current performance may be lower or higher than the quoted return. For performance as of the most recent month-end, please refer to www.eatonvance.com.
* Source: Thomson Financial. The Fund commenced investment operations on 3/29/66.
It is not possible to invest directly in an Index. The Index’s total return does not reflect any commissions or expenses that would have been incurred if an investor individually purchased or sold the securities represented in the Index.
3
Eaton Vance Tax-Managed Growth Fund 1.0 as of December 31, 2006
FUND PERFORMANCE
“Return Before Taxes” does not take into consideration shareholder taxes. It is most relevant to tax-free or tax-deferred shareholder accounts. “Return After Taxes on Distributions” reflects the impact of federal income taxes due on Fund distributions of dividends and capital gains. It is most relevant to taxpaying shareholders who continue to hold their shares. “Return After Taxes on Distributions and Sale of Fund Shares” also reflects the impact of taxes on capital gain or loss realized upon a sale of shares. It is most relevant to taxpaying shareholders who sell their shares.
Average Annual Total Returns (For the periods ended December 31, 2006)
Returns at net asset Value (NAV)
| | One Year | | Five Years | | Ten Years | |
Return Before Taxes | | 13.62 | % | 5.38 | % | 8.90 | % |
Return After Taxes on Distributions | | 13.19 | % | 5.00 | % | 8.60 | % |
Return After Taxes on Distributions and Sale of Fund Shares | | 9.54 | % | 4.53 | % | 7.83 | % |
Past performance is no guarantee of future results. Returns are historical and are calculated by determining the percentage change in net asset value or offering price (as applicable) with all distributions reinvested. Investment return and principal value will fluctuate so that shares, when redeemed, may be worth more or less than their original cost. Performance is for the stated time period only; due to market volatility, the Fund’s current performance may be lower or higher than the quoted return. For performance as of the most recent month-end, please refer to www.eatonvance.com.
The Fund commenced investment operations 3/29/66.
After-tax returns are calculated using the highest historical individual federal income tax rate and do not reflect the impact of state and local taxes. Actual after-tax returns depend on a shareholder’s tax situation and may differ from those shown. After-tax returns are not relevant for shareholders who hold shares in tax-deferred accounts or to shares held by non-taxable entities. Return After Taxes on Distributions for a period may be the same as Return Before Taxes for that period because no distributions were paid during that period or because the taxable portion of distributions made during the period was insignificant. Also, Return After Taxes on Distributions and Sale of Fund Shares for a period may be greater than Return After Taxes on Distributions for the same period because of realized losses on the sale of Fund shares.
4
Eaton Vance Tax-Managed Growth Fund 1.0 as of December 31, 2006
FUND EXPENSES
Example: As a shareholder of the Fund, you incur two types of costs: (1) transaction costs, including sales charges (loads) on purchases and redemption fees (if applicable); and (2) ongoing costs, including management fees; distribution or service fees; and other Fund expenses. This Example is intended to help you understand your ongoing costs (in dollars) of investing in the Fund and to compare these costs with the ongoing costs of investing in other mutual funds. The Example is based on an investment of $1,000 invested at the beginning of the period and held for the entire period (July 1, 2006 – December 31, 2006).
Actual Expenses: The first section of the table below provides information about actual account values and actual expenses. You may use the information in this section, together with the amount you invested, to estimate the expenses that you paid over the period. Simply divide your account value by $1,000 (for example, an $8,600 account value divided by $1,000 = 8.6), then multiply the result by the number in the first section under the heading entitled "Expenses Paid During Period" to estimate the expenses you paid on your account during this period.
Hypothetical Example for Comparison Purposes: The second section of the table below provides information about hypothetical account values and hypothetical expenses based on the actual Fund expense ratio and an assumed rate of return of 5% per year (before expenses), which is not the actual return of the Fund. The hypothetical account values and expenses may not be used to estimate the actual ending account balance or expenses you paid for the period. You may use this information to compare the ongoing costs of investing in your Fund and other funds. To do so, compare this 5% hypothetical example with the 5% hypothetical examples that appear in the shareholder reports of the other funds.
Please note that the expenses shown in the table are meant to highlight your ongoing costs only and do not reflect any transactional costs, such as sales charges (loads) or redemption fees (if applicable). Therefore, the second section of the table is useful in comparing ongoing costs only, and will not help you determine the relative total costs of owning different funds. In addition, if these transactional costs were included, your costs would have been higher.
Eaton Vance Tax-Managed Growth Fund 1.0
| | | Beginning Account Value
(7/1/06) | | Ending Account Value
(12/31/06) | | Expenses Paid During Period*
(7/1/06 – 12/31/06) | |
| Actual | | $ | 1,000.00 | | | $ | 1,103.90 | | | $ | 2.44 | | |
| Hypothetical | |
| (5% return per year before expenses) | | $ | 1,000.00 | | | $ | 1,022.90 | | | $ | 2.35 | | |
* Expenses are equal to the Fund's annualized expense ratio of 0.46% multiplied by the average account value over the period, multiplied by 184/365 (to reflect the one-half year period). The Example assumes that the $1,000 was invested at the net asset value per share determined at the close of business on June 30, 2006. The Example reflects the expenses of both the Fund and the Portfolio.
5
Eaton Vance Tax-Managed Growth Fund 1.0 as of December 31, 2006
FINANCIAL STATEMENTS
Statement of Assets and Liabilities
As of December 31, 2006
| Assets | |
Investment in Tax-Managed Growth Portfolio, at value
(identified cost, $289,570,032) | | $ | 1,032,844,274 | | |
| Total assets | | $ | 1,032,844,274 | | |
| Liabilities | |
| Payable for Fund shares redeemed | | $ | 202,872 | | |
| Payable to affiliate for Trustees' fees | | | 842 | | |
| Accrued expenses | | | 47,234 | | |
| Total liabilities | | $ | 250,948 | | |
| Net Assets for 1,711,376 shares of beneficial interest outstanding | | $ | 1,032,593,326 | | |
| Sources of Net Assets | |
| Paid-in capital | | $ | 334,782,664 | | |
Accumulated net realized loss from Portfolio (computed on
the basis of identified cost) | | | (26,080,944 | ) | |
| Accumulated undistributed net investment income | | | 126,536 | | |
Accumulated federal tax on undistributed net realized long-term
capital gain, paid on behalf of the shareholders | | | (19,509,172 | ) | |
Net unrealized appreciation from Portfolio (computed on the basis of
identified cost) | | | 743,274,242 | | |
| Total | | $ | 1,032,593,326 | | |
Net Asset Value and
Redemption Price Per Share | |
| ($1,032,593,326 ÷ 1,711,376 shares of beneficial interest outstanding) | | $ | 603.37 | | |
Statement of Operations
For the Year Ended
December 31, 2006
| Investment Income | |
| Dividends allocated from Portfolio (net of foreign taxes, $247,260) | | $ | 18,286,271 | | |
| Interest allocated from Portfolio | | | 137,182 | | |
| Security lending income allocated from Portfolio, net | | | 23,364 | | |
| Expenses allocated from Portfolio | | | (4,465,042 | ) | |
| Net investment income from Portfolio | | $ | 13,981,775 | | |
| Expenses | |
| Trustees' fees and expenses | | $ | 3,516 | | |
| Custodian fee | | | 36,654 | | |
| Transfer and dividend disbursing agent fees | | | 35,173 | | |
| Legal and accounting services | | | 28,399 | | |
| Printing and postage | | | 14,218 | | |
| Miscellaneous | | | 8,918 | | |
| Total expenses | | $ | 126,878 | | |
| Net investment income | | $ | 13,854,897 | | |
| Realized and Unrealized Gain (Loss) from Portfolio | |
Net realized gain (loss) —
Investment transactions (identified cost basis) | | $ | 52,037,170 | | |
| Foreign currency transactions | | | (1,219 | ) | |
| Net realized gain | | $ | 52,035,951 | | |
Change in unrealized appreciation (depreciation) —
Investments (identified cost basis) | | $ | 62,965,559 | | |
| Foreign currency | | | 5,239 | | |
| Net change in unrealized appreciation (depreciation) | | $ | 62,970,798 | | |
| Net realized and unrealized gain | | $ | 115,006,749 | | |
| Net increase in net assets from operations | | $ | 128,861,646 | | |
See notes to financial statements
6
Eaton Vance Tax-Managed Growth Fund 1.0 as of December 31, 2006
FINANCIAL STATEMENTS CONT'D
Statements of Changes in Net Assets
Increase (Decrease)
in Net Assets | | Year Ended
December 31, 2006 | | Year Ended
December 31, 2005* | |
From operations —
Net investment income | | $ | 13,854,897 | | | $ | 12,135,866 | | |
Net realized gain from investment
transactions, securities sold short and
foreign currency transactions | | | 52,035,951 | | | | 10,141,509 | | |
Net change in unrealized appreciation
(depreciation) of investments, securities
sold short and foreign currency | | | 62,970,798 | | | | 22,423,541 | | |
| Net increase in net assets from operations | | $ | 128,861,646 | | | $ | 44,700,916 | | |
Distributions to shareholders —
From net investment income | | $ | (13,878,065 | ) | | $ | (11,933,965 | ) | |
From net realized gain on investment
transactions | | | (16,167,277 | ) | | | (3,401,078 | ) | |
| Total distributions to shareholders | | $ | (30,045,342 | ) | | $ | (15,335,043 | ) | |
Transactions in shares of beneficial interest —
Net asset value of shares issued to
shareholders in payment of
distributions declared | | $ | 9,756,490 | | | $ | 4,352,380 | | |
| Cost of shares redeemed | | | (68,830,449 | ) | | | (44,505,867 | ) | |
Net decrease in net assets
from Fund share transactions | | $ | (59,073,959 | ) | | $ | (40,153,487 | ) | |
| Net increase (decrease) in net assets | | $ | 39,742,345 | | | $ | (10,787,614 | ) | |
| Net Assets | |
| At beginning of year | | $ | 992,850,981 | | | $ | 1,003,638,595 | | |
| At end of year | | $ | 1,032,593,326 | | | $ | 992,850,981 | | |
Accumulated undistributed
net investment income
included in net assets | |
| At end of year | | $ | 126,536 | | | $ | 183,287 | | |
* Amounts were reclassified for the year ended December 31, 2005 resulting in an increase in net realized gain (loss) and a decrease in net change in unrealized appreciation (depreciation) of $49,188,852. This amount was reclassified due to the correction of the allocation of realized gain (loss). These changes had no effect on the Fund's net asset value, net assets, net investment income, net increase in net assets from operations, financial highlights or total return.
See notes to financial statements
7
Eaton Vance Tax-Managed Growth Fund 1.0 as of December 31, 2006
FINANCIAL STATEMENTS CONT'D
Financial Highlights
| | | Year Ended December 31, | |
| | | 2006 | | 2005 | | 2004 | | 2003 | | 2002 | |
| Net asset value — Beginning of year | | $ | 546.870 | | | $ | 530.770 | | | $ | 493.870 | | | $ | 410.040 | | | $ | 514.030 | | |
| Income (loss) from operations | |
| Net investment income | | $ | 8.023 | | | $ | 6.586 | | | $ | 5.964 | | | $ | 4.627 | | | $ | 3.840 | | |
| Net realized and unrealized gain (loss) | | | 66.019 | | | | 17.864 | | | | 41.533 | | | | 92.657 | | | | (104.030 | ) | |
| Total income (loss) from operations | | $ | 74.042 | | | $ | 24.450 | | | $ | 47.497 | | | $ | 97.284 | | | $ | (100.190 | ) | |
| Less distributions | |
| From net investment income | | $ | (8.030 | ) | | $ | (6.475 | ) | | $ | (5.950 | ) | | $ | (4.550 | ) | | $ | (3.800 | ) | |
| From net realized gain | | | (9.512 | ) | | | (1.875 | ) | | | (4.647 | ) | | | (8.904 | ) | | | — | | |
| Total distributions | | $ | (17.542 | ) | | $ | (8.350 | ) | | $ | (10.597 | ) | | $ | (13.454 | ) | | $ | (3.800 | ) | |
| Net asset value — End of year | | $ | 603.370 | | | $ | 546.870 | | | $ | 530.770 | | | $ | 493.870 | | | $ | 410.040 | | |
| Total Return(1) | | | 13.62 | % | | | 4.64 | % | | | 9.68 | % | | | 23.86 | % | | | (19.54 | )% | |
| Ratios/Supplemental Data | |
| Net assets, end of year (000's omitted) | | $ | 1,032,593 | | | $ | 992,851 | | | $ | 1,003,639 | | | $ | 979,183 | | | $ | 863,009 | | |
| Ratios (As a percentage of average daily net assets): | |
| Expenses before custodian fee reduction(2) | | | 0.46 | % | | | 0.46 | %† | | | 0.46 | %† | | | 0.47 | % | | | 0.47 | % | |
| Expenses after custodian fee reduction(2) | | | 0.46 | % | | | 0.46 | %† | | | 0.46 | %† | | | 0.47 | % | | | 0.47 | % | |
| Net investment income | | | 1.38 | % | | | 1.24 | %† | | | 1.17 | %† | | | 1.04 | % | | | 0.83 | % | |
| Portfolio Turnover of the Portfolio(3) | | | 1 | % | | | 0 | %(4) | | | 3 | % | | | 15 | % | | | 23 | % | |
† The operating expenses of the Portfolio reflect a reduction of the investment adviser fee. Had such action not been taken, the ratios and net investment income per share would have changed by less than 0.005% and $0.0005, respectively.
(1) Returns are historical and are calculated by determining the percentage change in net asset value with all distributions reinvested.
(2) Includes the Fund's share of the Portfolio's allocated expenses.
(3) Excludes the value of the portfolio securities contributed or distributed as a result of in-kind shareholder transactions. The total turnover rate of the Portfolio including in-kind contributions and distributions of securities was 7%, 6%, 10%, 21%, and 30% for 2006, 2005, 2004, 2003, and 2002, respectively.
(4) Amounts to less than 1%.
See notes to financial statements
8
Eaton Vance Tax-Managed Growth Fund 1.0 as of December 31, 2006
NOTES TO FINANCIAL STATEMENTS
1 Significant Accounting Policies
Eaton Vance Tax-Managed Growth Fund 1.0 (the Fund), is a diversified series of Eaton Vance Series Trust (the Trust). The Trust is an entity of the type commonly known as a Massachusetts business trust and is registered under the Investment Company Act of 1940, as amended, as an open-end management investment company. The Fund invests all of its investable assets in interests of Tax-Managed Growth Portfolio (the Portfolio), a New York trust, having the same investment objective as the Fund. The value of the Fund's investment in the Portfolio reflects the Fund's proportionate interest in the net assets of the Portfolio (5.1% at December 31, 2006). The performance of the Fund is directly affected by the performance of the Portfolio. The financial statements of the Portfolio, including the Portfolio of Investments, are included elsewhere in this report and should be read in conjunction with the Fund's financial statements.
The following is a summary of significant accounting policies consistently followed by the Fund in the preparation of its financial statements. The policies are in conformity with accounting principles generally accepted in the United States of America.
A Investment Valuation — Valuation of securities by the Portfolio is discussed in Note 1A of the Portfolio's Notes to Financial Statements, which are included elsewhere in this report.
B Income — The Fund's net investment income or loss consists of the Fund's pro rata share of the net investment income or loss of the Portfolio, less all actual and accrued expenses of the Fund.
C Expenses — The majority of expenses of the Trust are directly identifiable to an individual fund. Expenses which are not readily identifiable to a specific fund are allocated taking into consideration, among other things, the nature and type of expense and the relative size of the funds.
D Federal Taxes — The Fund's policy is to comply with the provisions of the Internal Revenue Code applicable to regulated investment companies and to distribute to shareholders, each year, substantially all of its net investment income and all or substantially all of its net realized capital gains. Accordingly, no provision for federal income or excise tax is necessary. Although the Fund intends to distribute net realized long-term gains to shareholders each year, the Fund reserves the right to designate such gains as undistributed and pay the federal
tax thereon on behalf of shareholders. Provision for such tax is recorded on the Fund's records on the last business day of the Fund's fiscal year because the Internal Revenue Code provides that such tax is allocated among shareholders of record on that date.
At December 31, 2006, net losses of $371 attributable to currency transactions incurred after October 31, 2006 are treated as arising on the first day of the Fund's taxable year ending December 31, 2007.
E Expense Reduction — Investors Bank & Trust Company (IBT) serves as custodian of the Fund. Pursuant to the custodian agreement, IBT receives a fee reduced by credits which are determined based on the average daily cash balance the Fund maintains with IBT. All credit balances used to reduce the Fund's custodian fees are reported as a reduction of expenses in the Statement of Operations. For the year ended December 31, 2006, there were no credit balances used to reduce the Fund's custodian fee.
F Indemnifications — Under the Trust's organizational documents, its officers and Trustees may be indemnified against certain liabilities and expenses arising out of the performance of their duties to the Fund, and shareholders are indemnified against personal liability for the obligations of the Trust. Additionally, in the normal course of business, the Fund enters into agreements with service providers that may contain indemnification clauses. The Fund's maximum exposure under these arrangements is unknown as this would involve future claims that may be made against the Fund that have not yet occurred.
G Other — Investment transactions are accounted for on the date the securities are purchased or sold. Dividends to shareholders are recorded on the ex-dividend date.
H Use of Estimates — The preparation of the financial statements in conformity with accounting principles generally accepted in the United States of America requires management to make estimates and assumptions that affect the reported amounts of assets and liabilities at the date of the financial statements and the reported amounts of income and expense during the reporting period. Actual results could differ from those estimates.
9
Eaton Vance Tax-Managed Growth Fund 1.0 as of December 31, 2006
NOTES TO FINANCIAL STATEMENTS CONT'D
2 Distributions to Shareholders
The Fund's policy is to distribute all or substantially all of the net investment income allocated by the Portfolio to the Fund (less the Fund's direct expenses) and to distribute all or substantially all of its net realized capital gains (reduced by any available capital loss carryforwards from prior years) allocated by the Portfolio to the Fund, if any. Distributions are paid in the form of additional shares of the Fund or, at the election of the shareholder, in cash. Shareholders may reinvest all distributions in additional shares of the Fund at net asset value as of the close of business on the ex-dividend date. The Fund distinguishes between distributions on a tax basis and a financial reporting basis. Accounting principles generally accepted in the United States of America require that only distributions in excess of tax basis earnings and profits be reported in the financial statements as a return of capital. Permanent di fferences between book and tax accounting relating to distributions are re-classified to paid-in capital.
The tax character of distributions paid for the years ended December 31, 2006 and December 31, 2005 was as follows:
| | | Year Ended December 31, | |
| | | 2006 | | 2005 | |
| Distributions declared from: | |
| Ordinary income | | $ | 13,878,065 | | | $ | 11,934,174 | | |
| Long-term capital gain | | $ | 16,167,277 | | | $ | 3,400,869 | | |
During the year ended December 31, 2006, accumulated paid-in capital was increased by $49,490,104, accumulated undistributed net investment income was decreased by $33,583, and accumulated net realized gain was decreased by $49,456,521 primarily due to differences between book and tax accounting treatment of foreign currency gain (loss) and redemptions in-kind. Additionally, amounts were reclassified resulting in an increase in accumulated paid-in capital and a decrease in accumulated net realized gains of $229,220,496 due to the correction of the allocation of realized gain (loss). These changes had no effect on the Fund's net assets or net asset value per share.
As of December 31, 2006, the components of distributable earnings (accumulated losses) on a tax basis were as follows:
| Accumulated undistributed income | | $ | 121,715 | | |
| Unrealized appreciation | | $ | 714,657,964 | | |
| Undistributed long-term capital gain | | $ | 2,540,526 | | |
| Other temporary differences | | $ | (371 | ) | |
3 Shares of Beneficial Interest
The Fund's Declaration of Trust permits the Trustees to issue an unlimited number of full and fractional shares of beneficial interest (without par value). Such shares may be issued in a number of different series (such as the Fund) and classes. Transactions in Fund shares were as follows:
| | | Year Ended December 31, | |
| | | 2006 | | 2005 | |
Issued to shareholders electing to
receive payments of distributions
in Fund shares | | | 16,401 | | | | 8,074 | | |
| Redemptions | | | (120,554 | ) | | | (83,456 | ) | |
| Net decrease | | | (104,153 | ) | | | (75,382 | ) | |
4 Investment Transactions
Decreases in the Fund's investment in the Portfolio aggregated $89,368,871 for the year ended December 31, 2006. Decreases in the Fund's investment in the Portfolio include the distribution of common stock as the result of redemptions in-kind of $67,426,991 for the year ended December 31, 2006.
5 Transactions with Affiliates
Eaton Vance Management (EVM) serves as the administrator of the Fund, but receives no compensation. The Portfolio has engaged Boston Management and Research (BMR), a subsidiary of EVM, to render investment advisory services. See Note 2 of the Portfolio's Notes to Financial Statements which are included elsewhere in this report. EVM serves as the sub-transfer agent of the Fund and receives an aggregate fee based upon the actual expenses incurred by EVM in the performance of those services. For the year ended December 31, 2006, EVM received $3,541 in sub-transfer agent fees.
Except for Trustees of the Fund and the Portfolio who are not members of EVM's or BMR's organization, officers and Trustees receive remuneration for their services to the Fund out of the investment adviser fee earned by BMR. Trustees of the Fund who are not affiliated with EVM or BMR may elect to defer receipt of all or a percentage of these annual fees in accordance with terms of the Trustees Deferred Compensation Plan. For the year ended December 31, 2006, no significant amounts have been deferred.
Certain officers and Trustees of the Fund are officers of the above organizations.
10
Eaton Vance Tax-Managed Growth Fund 1.0 as of December 31, 2006
NOTES TO FINANCIAL STATEMENTS CONT'D
6 Recently Issued Accounting Pronouncements
In June 2006, the Financial Accounting Standards Board (FASB) issued FASB Interpretation No. 48, (FIN 48) "Accounting for Uncertainty in Income Taxes – an interpretation of FASB Statement No. 109". FIN 48 clarifies the accounting for uncertainty in income taxes recognized in accordance with FASB Statement No. 109, "Accounting for Income Taxes." This interpretation prescribes a recognition threshold and measurement attribute for the financial statement recognition and measurement of a tax position taken or expected to be taken in a tax return. It also provides guidance on de-recognition, classification, interest and penalties, accounting in interim periods, disclosure and transition. FIN 48 is effective during the first required financial reporting period for fiscal years beginning after December 15, 2006. Management is currently evaluating the impact of applying the various provisions of FIN 48.
In September 2006, FASB issued Statement of Financial Accounting Standards No. 157, (FAS 157) "Fair Value Measurements". FAS 157 defines fair value, establishes a framework for measuring fair value in accordance with generally accepted accounting principles and expands disclosure about fair value measurements. FAS 157 is effective for fiscal years beginning after November 15, 2007. Management is currently evaluating the impact the adoption of FAS 157 will have on the Fund's financial statement disclosures.
11
Eaton Vance Tax-Managed Growth Fund 1.0 as of December 31, 2006
REPORT OF INDEPENDENT REGISTERED PUBLIC ACCOUNTING FIRM
To the Trustees of Eaton Vance Series Trust and
Shareholders of Eaton Vance Tax-Managed
Growth Fund 1.0:
We have audited the accompanying statement of assets and liabilities of Eaton Vance Tax-Managed Growth Fund 1.0 (the Fund) (one of the series of Eaton Vance Series Trust) as of December 31, 2006, and the related statement of operations for the year then ended, the statements of changes in net assets for each of the two years in the period then ended, and the financial highlights for each of the five years in the period then ended. These financial statements and financial highlights are the responsibility of the Fund's management. Our responsibility is to express an opinion on these financial statements and financial highlights based on our audits.
We conducted our audits in accordance with the standards of the Public Company Accounting Oversight Board (United States). Those standards require that we plan and perform the audits to obtain reasonable assurance about whether the financial statements are free of material misstatement. The Fund is not required to have, nor were we engaged to perform, an audit of its internal control over financial reporting. Our audits included consideration of internal control over financial reporting as a basis for designing audit procedures that are appropriate in the circumstances, but not for the purpose of expressing an opinion on the effectiveness of the Fund's internal control over financial reporting. Accordingly, we express no such opinion. An audit also includes examining, on a test basis, evidence supporting the amounts and disclosures in the financial statements, assessing the accounting principles used and significant estimates ma de by management, as well as evaluating the overall financial statement presentation. We believe that our audits provide a reasonable basis for our opinion.
In our opinion, such financial statements and financial highlights referred to above present fairly, in all material respects, the financial position of Eaton Vance Tax-Managed Growth Fund 1.0 as of December 31, 2006, the results of its operations for the year then ended, the changes in its net assets for each of the two years in the period then ended, and the financial highlights for each of the five years in the period then ended, in conformity with accounting principles generally accepted in the United States of America.
DELOITTE & TOUCHE LLP
Boston, Massachusetts
February 20, 2007
12
Eaton Vance Tax-Managed Growth Fund 1.0 as of December 31, 2006
FEDERAL TAX INFORMATION (Unaudited)
The Form 1099-DIV you received in January 2007 showed the tax status of all distributions paid to your account in calendar 2006. Shareholders are advised to consult their own tax adviser with respect to the tax consequences of their investment in the Fund. As required by the Internal Revenue Code regulations, shareholders must be notified within 60 days of the Fund's fiscal year end regarding the status of qualified dividend income for individuals, the dividends received deduction for corporations, and capital gains dividends.
Qualified Dividend Income. The Fund designates $14,528,003 or up to the maximum amount of such dividends allowable pursuant to the Internal Revenue Code, as qualified dividend income eligible for the reduced tax rate of 15%.
Dividends Received Deduction. Corporate shareholders are generally entitled to take the dividends received deduction on the portion of the Fund's dividend distribution that qualified under tax law. For the Fund's fiscal 2006 ordinary income dividends, 100% qualified for the corporate dividends received deduction.
Capital Gains Dividends. The Fund designates $16,167,277 as a capital gain dividend.
13
Tax-Managed Growth Portfolio as of December 31, 2006
PORTFOLIO OF INVESTMENTS
| Common Stocks — 99.7% | |
| Security | | Shares | | Value | |
| Aerospace & Defense — 3.3% | |
| Boeing Company (The) | | | 948,774 | | | $ | 84,289,082 | | |
| General Dynamics Corp. | | | 1,470,000 | | | | 109,294,500 | | |
| Honeywell International, Inc. | | | 293,060 | | | | 13,258,034 | | |
| Northrop Grumman Corp. | | | 3,106,377 | | | | 210,301,723 | | |
| Raytheon Co. | | | 350,050 | | | | 18,482,640 | | |
| Rockwell Collins, Inc. | | | 129,632 | | | | 8,204,409 | | |
| United Technologies Corp. | | | 3,693,938 | | | | 230,945,004 | | |
| | | $ | 674,775,392 | | |
| Air Freight & Logistics — 2.7% | |
| C.H. Robinson Worldwide, Inc. | | | 2,078,589 | | | $ | 84,993,504 | | |
| FedEx Corp. | | | 2,219,776 | | | | 241,112,069 | | |
| United Parcel Service, Inc., Class B | | | 2,979,416 | | | | 223,396,612 | | |
| | | $ | 549,502,185 | | |
| Airlines — 0.0% | |
| Southwest Airlines Co. | | | 386,112 | | | $ | 5,915,236 | | |
| | | $ | 5,915,236 | | |
| Auto Components — 0.1% | |
| BorgWarner, Inc. | | | 95,849 | | | $ | 5,657,008 | | |
| Delphi Corp.(1) | | | 5,361 | | | | 20,479 | | |
| Johnson Controls, Inc. | | | 213,523 | | | | 18,345,896 | | |
| Visteon Corp.(1) | | | 4,426 | | | | 37,532 | | |
| | | $ | 24,060,915 | | |
| Automobiles — 0.1% | |
| DaimlerChrysler AG(2) | | | 24,284 | | | $ | 1,491,280 | | |
| Ford Motor Co. | | | 83,266 | | | | 625,328 | | |
| General Motors Corp. | | | 33,939 | | | | 1,042,606 | | |
| Harley-Davidson, Inc. | | | 141,140 | | | | 9,946,136 | | |
| | | $ | 13,105,350 | | |
| Beverages — 4.5% | |
| Anheuser-Busch Companies, Inc. | | | 4,881,907 | | | $ | 240,189,824 | | |
| Brown-Forman Corp., Class A | | | 479,732 | | | | 32,348,329 | | |
| Brown-Forman Corp., Class B | | | 45,820 | | | | 3,035,117 | | |
| Coca Cola Co. (The) | | | 4,721,933 | | | | 227,833,267 | | |
| Coca-Cola Enterprises, Inc. | | | 1,606,930 | | | | 32,813,511 | | |
| PepsiCo, Inc. | | | 6,177,920 | | | | 386,428,896 | | |
| | | $ | 922,648,944 | | |
| Security | | Shares | | Value | |
| Biotechnology — 1.7% | |
| Amgen, Inc.(1) | | | 4,383,782 | | | $ | 299,456,148 | | |
| Biogen Idec, Inc.(1) | | | 211,200 | | | | 10,388,928 | | |
| Celera Group(1) | | | 8,870 | | | | 124,091 | | |
| Genzyme Corp.(1) | | | 501,099 | | | | 30,857,676 | | |
| Gilead Sciences, Inc.(1) | | | 115,482 | | | | 7,498,246 | | |
| Vertex Pharmaceuticals, Inc.(1) | | | 13,000 | | | | 486,460 | | |
| | | $ | 348,811,549 | | |
| Building Products — 0.7% | |
| American Standard Companies, Inc. | | | 868,699 | | | $ | 39,829,849 | | |
| Masco Corp. | | | 3,420,182 | | | | 102,160,836 | | |
| | | $ | 141,990,685 | | |
| Capital Markets — 5.4% | |
| Affiliated Managers Group, Inc.(1) | | | 20,520 | | | $ | 2,157,268 | | |
| Ameriprise Financial, Inc. | | | 67,969 | | | | 3,704,311 | | |
| Bank of New York Co., Inc. | | | 426,888 | | | | 16,806,581 | | |
| Bear Stearns Companies, Inc. | | | 95,736 | | | | 15,583,906 | | |
| Charles Schwab Corp. (The) | | | 847,738 | | | | 16,395,253 | | |
| Credit Suisse Group(2) | | | 155,136 | | | | 10,796,273 | | |
| Federated Investors, Inc., Class B | | | 1,599,819 | | | | 54,041,886 | | |
| Franklin Resources, Inc. | | | 797,053 | | | | 87,811,329 | | |
| Goldman Sachs Group, Inc. | | | 1,115,548 | | | | 222,384,494 | | |
| Investors Financial Services Corp. | | | 450,386 | | | | 19,217,971 | | |
| Knight Capital Group, Inc., Class A(1) | | | 1,750,000 | | | | 33,547,500 | | |
| Legg Mason, Inc. | | | 46,784 | | | | 4,446,819 | | |
| Lehman Brothers Holdings, Inc. | | | 192,474 | | | | 15,036,069 | | |
| Mellon Financial Corp. | | | 321,392 | | | | 13,546,673 | | |
| Merrill Lynch & Co., Inc. | | | 2,472,803 | | | | 230,217,959 | | |
| Morgan Stanley | | | 3,053,604 | | | | 248,654,974 | | |
| Northern Trust Corp. | | | 725,484 | | | | 44,029,624 | | |
| Nuveen Investments, Class A | | | 110,000 | | | | 5,706,800 | | |
| Piper Jaffray Cos., Inc.(1) | | | 27,517 | | | | 1,792,733 | | |
| Raymond James Financial, Inc. | | | 221,005 | | | | 6,698,662 | | |
| State Street Corp. | | | 146,764 | | | | 9,897,764 | | |
| T. Rowe Price Group, Inc. | | | 341,862 | | | | 14,963,300 | | |
| UBS AG(2) | | | 192,683 | | | | 11,624,565 | | |
| Waddell & Reed Financial, Inc., Class A | | | 273,635 | | | | 7,486,654 | | |
| | | $ | 1,096,549,368 | | |
See notes to financial statements
14
Tax-Managed Growth Portfolio as of December 31, 2006
PORTFOLIO OF INVESTMENTS CONT'D
| Security | | Shares | | Value | |
| Chemicals — 0.8% | |
| Arch Chemicals, Inc. | | | 4,950 | | | $ | 164,885 | | |
| Arkema (ADR)(1) | | | 20,000 | | | | 1,026,702 | | |
| Ashland, Inc. | | | 46,969 | | | | 3,249,315 | | |
| Dow Chemical Co. (The) | | | 250,250 | | | | 9,994,985 | | |
| E.I. du Pont de Nemours and Co. | | | 1,031,498 | | | | 50,244,268 | | |
| Ecolab, Inc. | | | 407,411 | | | | 18,414,977 | | |
| MacDermid, Inc. | | | 41,355 | | | | 1,410,206 | | |
| Monsanto Co. | | | 39,066 | | | | 2,052,137 | | |
| Olin Corp. | | | 9,900 | | | | 163,548 | | |
| PPG Industries, Inc. | | | 27,142 | | | | 1,742,788 | | |
| Rohm and Haas Co. | | | 2,601 | | | | 132,963 | | |
| Sigma-Aldrich Corp. | | | 630,897 | | | | 49,033,315 | | |
| Tronox, Inc., Class B | | | 37,854 | | | | 597,715 | | |
| Valspar Corp. (The) | | | 1,219,107 | | | | 33,696,117 | | |
| | | $ | 171,923,921 | | |
| Commercial Banks — 7.8% | |
| Associated Banc-Corp. | | | 991,726 | | | $ | 34,591,403 | | |
| Bank of Hawaii Corp. | | | 69,735 | | | | 3,762,203 | | |
| Bank of Montreal(2) | | | 255,949 | | | | 15,149,621 | | |
| BB&T Corp. | | | 1,867,960 | | | | 82,059,483 | | |
| City National Corp. | | | 184,221 | | | | 13,116,535 | | |
| Colonial BancGroup, Inc. (The) | | | 52,095 | | | | 1,340,925 | | |
| Comerica, Inc. | | | 466,015 | | | | 27,345,760 | | |
| Commerce Bancshares, Inc. | | | 171,056 | | | | 8,280,821 | | |
| Compass Bancshares, Inc. | | | 54,254 | | | | 3,236,251 | | |
| Fifth Third Bancorp | | | 2,711,753 | | | | 110,992,050 | | |
| First Citizens BancShares, Inc., Class A | | | 22,480 | | | | 4,555,347 | | |
| First Horizon National Corp. | | | 148,868 | | | | 6,219,705 | | |
| First Midwest Bancorp, Inc. | | | 523,358 | | | | 20,243,487 | | |
| HSBC Holdings PLC (Hungary) (ADR) | | | 220,592 | | | | 4,037,864 | | |
| HSBC Holdings PLC (UK) (ADR) | | | 580,708 | | | | 53,221,888 | | |
| Huntington Bancshares, Inc. | | | 583,001 | | | | 13,846,274 | | |
| KeyCorp | | | 663,862 | | | | 25,246,672 | | |
| M&T Bank Corp. | | | 81,234 | | | | 9,923,545 | | |
| Marshall & Ilsley Corp. | | | 663,221 | | | | 31,907,562 | | |
| National City Corp. | | | 1,511,282 | | | | 55,252,470 | | |
| PNC Financial Services Group, Inc. | | | 166,675 | | | | 12,340,617 | | |
| Popular, Inc.(2) | | | 1,432 | | | | 25,704 | | |
| Regions Financial Corp. | | | 2,294,230 | | | | 85,804,202 | | |
| Royal Bank of Canada(2) | | | 574,109 | | | | 27,356,294 | | |
| Societe Generale(2) | | | 1,606,685 | | | | 271,515,830 | | |
| SunTrust Banks, Inc. | | | 1,252,412 | | | | 105,766,193 | | |
| Security | | Shares | | Value | |
| Commercial Banks (continued) | |
| Synovus Financial Corp. | | | 1,065,458 | | | $ | 32,848,070 | | |
| Toronto-Dominion Bank (The)(2) | | | 17,915 | | | | 1,072,571 | | |
| Trustmark Corp. | | | 205,425 | | | | 6,719,452 | | |
| U.S. Bancorp | | | 4,831,496 | | | | 174,851,840 | | |
| Valley National Bancorp. | | | 109,831 | | | | 2,911,620 | | |
| Wachovia Corp. | | | 2,539,881 | | | | 144,646,223 | | |
| Wells Fargo & Co. | | | 4,253,936 | | | | 151,269,964 | | |
| Westamerica Bancorporation | | | 258,826 | | | | 13,104,360 | | |
| Whitney Holding Corp. | | | 117,128 | | | | 3,820,715 | | |
| Zions Bancorporation | | | 454,096 | | | | 37,435,674 | | |
| | | $ | 1,595,819,195 | | |
| Commercial Services & Supplies — 0.8% | |
| Acco Brands Corp.(1) | | | 15,490 | | | $ | 410,020 | | |
| Allied Waste Industries, Inc.(1) | | | 1,240,437 | | | | 15,244,971 | | |
| Avery Dennison Corp. | | | 65,769 | | | | 4,467,688 | | |
| Cintas Corp. | | | 1,251,060 | | | | 49,679,593 | | |
| Donnelley (R.R.) & Sons Co. | | | 60,262 | | | | 2,141,711 | | |
| Herman Miller, Inc. | | | 541,800 | | | | 19,699,848 | | |
| HNI Corp. | | | 765,839 | | | | 34,010,910 | | |
| Hudson Highland Group, Inc.(1) | | | 5,226 | | | | 87,170 | | |
| Manpower, Inc. | | | 706 | | | | 52,901 | | |
| Monster Worldwide, Inc.(1) | | | 39,395 | | | | 1,837,383 | | |
| PHH Corp.(1) | | | 27,409 | | | | 791,298 | | |
| Pitney Bowes, Inc. | | | 31,857 | | | | 1,471,475 | | |
| School Specialty, Inc.(1) | | | 12,603 | | | | 472,486 | | |
| Waste Management, Inc. | | | 671,011 | | | | 24,673,074 | | |
| | | $ | 155,040,528 | | |
| Communications Equipment — 1.6% | |
| 3Com Corp.(1) | | | 472,985 | | | $ | 1,943,968 | | |
| ADC Telecommunications, Inc.(1) | | | 21,341 | | | | 310,084 | | |
| Alcatel SA (ADR) | | | 89,240 | | | | 1,268,993 | | |
| Avaya, Inc.(1) | | | 20,404 | | | | 285,248 | | |
| Cisco Systems, Inc.(1) | | | 6,198,467 | | | | 169,404,103 | | |
| Comverse Technology, Inc.(1) | | | 165,755 | | | | 3,499,088 | | |
| Corning, Inc.(1) | | | 3,671,953 | | | | 68,702,241 | | |
| Dycom Industries, Inc.(1) | | | 61,019 | | | | 1,288,721 | | |
| Juniper Networks, Inc.(1) | | | 35,691 | | | | 675,988 | | |
| Motorola, Inc. | | | 1,266,823 | | | | 26,045,881 | | |
| Nokia Oyj (ADR) | | | 2,042,478 | | | | 41,503,153 | | |
| Nortel Networks Corp.(1)(2) | | | 72,544 | | | | 1,939,101 | | |
See notes to financial statements
15
Tax-Managed Growth Portfolio as of December 31, 2006
PORTFOLIO OF INVESTMENTS CONT'D
| Security | | Shares | | Value | |
| Communications Equipment (continued) | |
| QUALCOMM, Inc. | | | 347,456 | | | $ | 13,130,362 | | |
| Riverstone Networks, Inc.(3) | | | 28,706 | | | | 0 | | |
| Tellabs, Inc.(1) | | | 32,678 | | | | 335,276 | | |
| | | $ | 330,332,207 | | |
| Computer Peripherals — 2.3% | |
| Dell, Inc.(1) | | | 4,406,741 | | | $ | 110,565,132 | | |
| EMC Corp.(1) | | | 1,747,812 | | | | 23,071,118 | | |
| Gateway, Inc.(1) | | | 65,556 | | | | 131,768 | | |
| Hewlett-Packard Co. | | | 887,799 | | | | 36,568,441 | | |
| International Business Machines Corp. | | | 1,575,883 | | | | 153,097,033 | | |
| Lexmark International, Inc., Class A(1) | | | 1,714,509 | | | | 125,502,059 | | |
| McDATA Corp., Class A(1) | | | 7,666 | | | | 42,546 | | |
| Network Appliance, Inc.(1) | | | 364,967 | | | | 14,335,904 | | |
| Palm, Inc.(1) | | | 68,379 | | | | 963,460 | | |
| Sun Microsystems, Inc.(1) | | | 319,180 | | | | 1,729,956 | | |
| | | $ | 466,007,417 | | |
| Construction & Engineering — 0.1% | |
| Jacobs Engineering Group, Inc.(1) | | | 157,319 | | | $ | 12,827,791 | | |
| | | $ | 12,827,791 | | |
| Construction Materials — 0.1% | |
| CRH PLC(2) | | | 207,894 | | | $ | 8,634,999 | | |
| Vulcan Materials Co. | | | 206,614 | | | | 18,568,400 | | |
| | | $ | 27,203,399 | | |
| Consumer Finance — 1.0% | |
| American Express Co. | | | 618,260 | | | $ | 37,509,834 | | |
| Capital One Financial Corp. | | | 1,705,714 | | | | 131,032,949 | | |
| SLM Corp. | | | 916,399 | | | | 44,692,779 | | |
| | | $ | 213,235,562 | | |
| Containers & Packaging — 0.1% | |
| Bemis Co., Inc. | | | 295,186 | | | $ | 10,030,420 | | |
| Sealed Air Corp. | | | 21,264 | | | | 1,380,459 | | |
| Sonoco Products Co. | | | 128,617 | | | | 4,895,163 | | |
| Temple-Inland, Inc. | | | 115,924 | | | | 5,335,982 | | |
| | | $ | 21,642,024 | | |
| Distributors — 0.0% | |
| Genuine Parts Co. | | | 190,459 | | | $ | 9,033,470 | | |
| | | $ | 9,033,470 | | |
| Security | | Shares | | Value | |
| Diversified Consumer Services — 0.3% | |
| Apollo Group, Inc., Class A(1) | | | 31,893 | | | $ | 1,242,870 | | |
| H&R Block, Inc. | | | 1,599,312 | | | | 36,848,148 | | |
| Laureate Education, Inc.(1) | | | 302,518 | | | | 14,711,450 | | |
| ServiceMaster Co. (The) | | | 1,156,537 | | | | 15,162,200 | | |
| | | $ | 67,964,668 | | |
| Diversified Financial Services — 3.1% | |
| Bank of America Corp. | | | 4,074,755 | | | $ | 217,551,169 | | |
| Citigroup, Inc. | | | 4,486,846 | | | | 249,917,322 | | |
| ING Groep N.V. (ADR) | | | 257,281 | | | | 11,364,102 | | |
| JPMorgan Chase & Co. | | | 2,748,807 | | | | 132,767,378 | | |
| Moody's Corp. | | | 309,906 | | | | 21,402,108 | | |
| | | $ | 633,002,079 | | |
| Diversified Telecommunication Services — 1.4% | |
| AT&T, Inc. | | | 1,201,387 | | | $ | 42,949,585 | | |
| BCE, Inc.(2) | | | 2,653,500 | | | | 71,644,500 | | |
| Bell Aliant Regional Communications, Inc.(1)(2)(3)(5) | | | 210,251 | | | | 4,870,986 | | |
| BellSouth Corp. | | | 165,981 | | | | 7,819,365 | | |
| Cincinnati Bell, Inc.(1) | | | 169,013 | | | | 772,389 | | |
| Citizens Communications Co. | | | 6,949 | | | | 99,857 | | |
| Deutsche Telekom AG (ADR) | | | 1,843,732 | | | | 33,555,922 | | |
| Embarq Corp. | | | 16,420 | | | | 863,035 | | |
| McLeod USA, Inc., Class A(1)(3) | | | 947 | | | | 0 | | |
| Qwest Communications International, Inc.(1) | | | 38,011 | | | | 318,152 | | |
| RSL Communications, Ltd., Class A(1)(2)(3) | | | 247,161 | | | | 0 | | |
| Telefonos de Mexico SA de CV (ADR) | | | 2,883,026 | | | | 81,416,654 | | |
| Verizon Communications, Inc. | | | 462,191 | | | | 17,211,993 | | |
| Windstream Corp. | | | 1,105,386 | | | | 15,718,589 | | |
| | | $ | 277,241,027 | | |
| Electric Utilities — 0.4% | |
| American Electric Power Co., Inc. | | | 960 | | | $ | 40,877 | | |
| Duke Energy Corp. | | | 417,250 | | | | 13,856,873 | | |
| Exelon Corp. | | | 1,003,134 | | | | 62,083,963 | | |
| Southern Co. (The) | | | 65,985 | | | | 2,432,207 | | |
| | | $ | 78,413,920 | | |
| Electrical Equipment — 0.6% | |
| American Power Conversion Corp. | | | 15,654 | | | $ | 478,856 | | |
| Emerson Electric Co. | | | 2,533,434 | | | | 111,648,436 | | |
| Rockwell Automation, Inc. | | | 160,084 | | | | 9,777,931 | | |
| Roper Industries, Inc. | | | 46,244 | | | | 2,323,299 | | |
| Thomas & Betts Corp.(1) | | | 106,648 | | | | 5,042,317 | | |
| | | $ | 129,270,839 | | |
See notes to financial statements
16
Tax-Managed Growth Portfolio as of December 31, 2006
PORTFOLIO OF INVESTMENTS CONT'D
| Security | | Shares | | Value | |
| Electronic Equipment & Instruments — 0.4% | |
| Agilent Technologies, Inc.(1) | | | 451,772 | | | $ | 15,744,254 | | |
| Arrow Electronics, Inc.(1) | | | 8,750 | | | | 276,063 | | |
| Flextronics International, Ltd.(1)(2) | | | 441,607 | | | | 5,069,648 | | |
| Jabil Circuit, Inc. | | | 2,082,013 | | | | 51,113,419 | | |
| National Instruments Corp. | | | 278,794 | | | | 7,594,349 | | |
| Plexus Corp.(1) | | | 146,273 | | | | 3,492,999 | | |
| Sanmina-SCI Corp.(1) | | | 540,602 | | | | 1,865,077 | | |
| Solectron Corp.(1) | | | 1,670,613 | | | | 5,379,374 | | |
| | | $ | 90,535,183 | | |
| Energy Equipment & Services — 0.7% | |
| Baker Hughes, Inc. | | | 194,687 | | | $ | 14,535,331 | | |
| GlobalSantaFe Corp.(2) | | | 20,000 | | | | 1,175,600 | | |
| Grant Prideco, Inc.(1) | | | 11,694 | | | | 465,070 | | |
| Halliburton Co. | | | 1,251,578 | | | | 38,861,497 | | |
| Schlumberger, Ltd.(2) | | | 1,178,674 | | | | 74,445,050 | | |
| Smith International, Inc. | | | 120,165 | | | | 4,935,177 | | |
| Transocean, Inc.(1)(2) | | | 103,602 | | | | 8,380,366 | | |
| | | $ | 142,798,091 | | |
| Food & Staples Retailing — 1.8% | |
| Casey's General Stores, Inc. | | | 12,551 | | | $ | 295,576 | | |
| Costco Wholesale Corp. | | | 928,292 | | | | 49,078,798 | | |
| CVS Corp. | | | 365,636 | | | | 11,301,809 | | |
| Kroger Co. (The) | | | 1,344,295 | | | | 31,012,886 | | |
| Safeway, Inc. | | | 1,135,280 | | | | 39,235,277 | | |
| SUPERVALU, Inc. | | | 98,710 | | | | 3,528,883 | | |
| Sysco Corp. | | | 2,229,368 | | | | 81,951,568 | | |
| Walgreen Co. | | | 1,063,420 | | | | 48,800,344 | | |
| Wal-Mart Stores, Inc. | | | 2,141,995 | | | | 98,917,329 | | |
| | | $ | 364,122,470 | | |
| Food Products — 2.5% | |
| Archer-Daniels-Midland Co. | | | 1,376,641 | | | $ | 43,997,446 | | |
| Campbell Soup Co. | | | 1,295,515 | | | | 50,382,578 | | |
| ConAgra Foods, Inc. | | | 954,451 | | | | 25,770,177 | | |
| Dean Foods Co.(1) | | | 286,449 | | | | 12,111,064 | | |
| Del Monte Foods Co. | | | 99,492 | | | | 1,097,397 | | |
| General Mills, Inc. | | | 151,524 | | | | 8,727,782 | | |
| H.J. Heinz Co. | | | 292,513 | | | | 13,166,010 | | |
| Hershey Co. (The) | | | 497,578 | | | | 24,779,384 | | |
| J.M. Smucker Co. (The) | | | 7,152 | | | | 346,657 | | |
| Security | | Shares | | Value | |
| Food Products (continued) | |
| Kellogg Co. | | | 54,076 | | | $ | 2,707,045 | | |
| Kraft Foods, Inc. | | | 465 | | | | 16,601 | | |
| Nestle SA(2) | | | 275,000 | | | | 97,368,672 | | |
| Sara Lee Corp. | | | 4,504,598 | | | | 76,713,304 | | |
| Smithfield Foods, Inc.(1) | | | 3,650,830 | | | | 93,680,298 | | |
| TreeHouse Foods, Inc.(1) | | | 64,797 | | | | 2,021,666 | | |
| Tyson Foods, Inc., Class A | | | 265,272 | | | | 4,363,724 | | |
| William Wrigley Jr. Co. | | | 996,034 | | | | 51,514,878 | | |
| | | $ | 508,764,683 | | |
| Gas Utilities — 0.0% | |
| National Fuel Gas Co. | | | 4,000 | | | $ | 154,160 | | |
| | | $ | 154,160 | | |
| Health Care Equipment & Supplies — 1.0% | |
| Advanced Medical Optics, Inc.(1) | | | 9,834 | | | $ | 346,157 | | |
| Baxter International, Inc. | | | 241,562 | | | | 11,206,061 | | |
| Becton, Dickinson and Co. | | | 63,708 | | | | 4,469,116 | | |
| Biomet, Inc. | | | 419,890 | | | | 17,328,860 | | |
| Boston Scientific Corp.(1) | | | 1,138,837 | | | | 19,565,220 | | |
| DENTSPLY International, Inc. | | | 7,701 | | | | 229,875 | | |
| Edwards Lifesciences Corp.(1) | | | 3,070 | | | | 144,413 | | |
| Hillenbrand Industries, Inc. | | | 188,606 | | | | 10,737,340 | | |
| Hospira, Inc.(1) | | | 114,611 | | | | 3,848,637 | | |
| Medtronic, Inc. | | | 1,886,733 | | | | 100,959,083 | | |
| Medtronic, Inc.(3)(4) | | | 7,500 | | | | 401,074 | | |
| St. Jude Medical, Inc.(1) | | | 84,585 | | | | 3,092,428 | | |
| Stryker Corp. | | | 151,918 | | | | 8,372,201 | | |
| Zimmer Holdings, Inc.(1) | | | 302,863 | | | | 23,738,402 | | |
| | | $ | 204,438,867 | | |
| Health Care Providers & Services — 1.9% | |
| AmerisourceBergen Corp. | | | 369,925 | | | $ | 16,631,828 | | |
| Cardinal Health, Inc. | | | 2,189,814 | | | | 141,089,716 | | |
| Caremark Rx, Inc. | | | 1,087,504 | | | | 62,107,353 | | |
| CIGNA Corp. | | | 15,036 | | | | 1,978,287 | | |
| Express Scripts, Inc.(1) | | | 74,800 | | | | 5,355,680 | | |
| Health Management Associates, Inc., Class A | | | 124,425 | | | | 2,626,612 | | |
| Henry Schein, Inc.(1) | | | 1,143,408 | | | | 56,004,124 | | |
| McKesson Corp. | | | 2,631 | | | | 133,392 | | |
| Medco Health Solutions, Inc.(1) | | | 174,081 | | | | 9,302,889 | | |
| Sunrise Senior Living, Inc.(1) | | | 8,000 | | | | 245,760 | | |
See notes to financial statements
17
Tax-Managed Growth Portfolio as of December 31, 2006
PORTFOLIO OF INVESTMENTS CONT'D
| Security | | Shares | | Value | |
| Health Care Providers & Services (continued) | |
| Tenet Healthcare Corp.(1) | | | 3,478 | | | $ | 24,242 | | |
| Unitedhealth Group | | | 453,594 | | | | 24,371,606 | | |
| WellPoint, Inc.(1) | | | 834,692 | | | | 65,681,913 | | |
| | | $ | 385,553,402 | | |
| Health Care Technology — 0.0% | |
| IMS Health, Inc. | | | 120,055 | | | $ | 3,299,111 | | |
| | | $ | 3,299,111 | | |
| Hotels, Restaurants & Leisure — 1.5% | |
| Bob Evans Farms, Inc. | | | 49,985 | | | $ | 1,710,487 | | |
| Brinker International, Inc. | | | 185,881 | | | | 5,606,171 | | |
| Carnival Corp.(2) | | | 550,082 | | | | 26,981,522 | | |
| Darden Restaurants, Inc. | | | 184,714 | | | | 7,419,961 | | |
| Gaylord Entertainment Co.(1) | | | 428,482 | | | | 21,822,588 | | |
| International Game Technology | | | 409,904 | | | | 18,937,565 | | |
| International Speedway Corp., Class A | | | 118,344 | | | | 6,040,278 | | |
| Jack in the Box, Inc.(1) | | | 74,400 | | | | 4,541,376 | | |
| Marriott International, Inc., Class A | | | 395,881 | | | | 18,891,441 | | |
| McDonald's Corp. | | | 915,891 | | | | 40,601,448 | | |
| MGM MIRAGE(1) | | | 188,890 | | | | 10,832,842 | | |
| OSI Restaurant Partners, Inc. | | | 1,034,548 | | | | 40,554,282 | | |
| Papa John's International, Inc.(1) | | | 157,179 | | | | 4,559,763 | | |
| Sonic Corp.(1) | | | 43,809 | | | | 1,049,226 | | |
| Starbucks Corp.(1) | | | 2,254,271 | | | | 79,846,279 | | |
| Wyndham Worldwide Corp.(1) | | | 128,223 | | | | 4,105,700 | | |
| Yum! Brands, Inc. | | | 247,333 | | | | 14,543,180 | | |
| | | $ | 308,044,109 | | |
| Household Durables — 0.4% | |
| Blyth, Inc. | | | 583,297 | | | $ | 12,103,413 | | |
| D.R. Horton, Inc. | | | 637,557 | | | | 16,888,885 | | |
| Fortune Brands, Inc. | | | 115,429 | | | | 9,856,482 | | |
| Leggett & Platt, Inc. | | | 1,794,941 | | | | 42,899,090 | | |
| Newell Rubbermaid, Inc. | | | 291,589 | | | | 8,441,502 | | |
| | | $ | 90,189,372 | | |
| Household Products — 3.1% | |
| Clorox Co. (The) | | | 14,873 | | | $ | 954,103 | | |
| Colgate-Palmolive Co. | | | 702,684 | | | | 45,843,104 | | |
| Energizer Holdings, Inc.(1) | | | 168,981 | | | | 11,995,961 | | |
| Kimberly-Clark Corp. | | | 1,398,706 | | | | 95,042,073 | | |
| Procter & Gamble Co. (The) | | | 7,412,101 | | | | 476,375,731 | | |
| | | $ | 630,210,972 | | |
| Security | | Shares | | Value | |
Independent Power Producers &
Energy Traders — 0.1% | |
| AES Corp. (The)(1) | | | 40,339 | | | $ | 889,072 | | |
| Dynegy, Inc., Class A(1) | | | 22,688 | | | | 164,261 | | |
| TXU Corp. | | | 196,092 | | | | 10,630,147 | | |
| | | $ | 11,683,480 | | |
| Industrial Conglomerates — 2.9% | |
| 3M Co. | | | 911,246 | | | $ | 71,013,401 | | |
| General Electric Co. | | | 12,987,699 | | | | 483,272,280 | | |
| Teleflex, Inc. | | | 14,497 | | | | 935,926 | | |
| Textron, Inc. | | | 12,838 | | | | 1,203,819 | | |
| Tyco International, Ltd.(2) | | | 1,125,841 | | | | 34,225,566 | | |
| | | $ | 590,650,992 | | |
| Insurance — 5.8% | |
| Aegon, N.V. (ADR) | | | 5,182,849 | | | $ | 98,214,989 | | |
| AFLAC, Inc. | | | 2,198,053 | | | | 101,110,438 | | |
| Allstate Corp. (The) | | | 191,646 | | | | 12,478,071 | | |
| American International Group, Inc. | | | 6,322,481 | | | | 453,068,988 | | |
| AON Corp. | | | 517,325 | | | | 18,282,266 | | |
| Arthur J. Gallagher & Co. | | | 557,196 | | | | 16,465,142 | | |
| Berkshire Hathaway, Inc., Class A(1) | | | 641 | | | | 70,503,590 | | |
| Berkshire Hathaway, Inc., Class B(1) | | | 40,436 | | | | 148,238,376 | | |
| Chubb Corp. (The) | | | 30,869 | | | | 1,633,279 | | |
| Commerce Group, Inc. (The) | | | 84,309 | | | | 2,508,193 | | |
| Hartford Financial Services Group, Inc. (The) | | | 45,700 | | | | 4,264,267 | | |
| Lincoln National Corp. | | | 224,854 | | | | 14,930,306 | | |
| Manulife Financial Corp.(2) | | | 210,896 | | | | 7,126,176 | | |
| Marsh & McLennan Cos., Inc. | | | 478,800 | | | | 14,680,008 | | |
| MetLife, Inc. | | | 803,028 | | | | 47,386,682 | | |
| Old Republic International Corp. | | | 300,685 | | | | 6,999,947 | | |
| Principal Financial Group, Inc. | | | 113,328 | | | | 6,652,354 | | |
| Progressive Corp. (The) | | | 3,784,948 | | | | 91,671,441 | | |
| SAFECO Corp. | | | 161,000 | | | | 10,070,550 | | |
| St. Paul Travelers Cos., Inc. (The) | | | 349,428 | | | | 18,760,789 | | |
| Torchmark Corp. | | | 318,929 | | | | 20,334,913 | | |
| UnumProvident Corp. | | | 53,710 | | | | 1,116,094 | | |
| XL Capital Ltd., Class A(2) | | | 187,100 | | | | 13,474,942 | | |
| | | $ | 1,179,971,801 | | |
See notes to financial statements
18
Tax-Managed Growth Portfolio as of December 31, 2006
PORTFOLIO OF INVESTMENTS CONT'D
| Security | | Shares | | Value | |
| Internet & Catalog Retail — 0.2% | |
| Amazon.com, Inc.(1) | | | 42,476 | | | $ | 1,676,103 | | |
| Expedia, Inc.(1) | | | 403,096 | | | | 8,456,954 | | |
| IAC/InterActiveCorp(1) | | | 429,832 | | | | 15,972,557 | | |
| Liberty Media Corp. - Interactive(1) | | | 275,760 | | | | 5,948,143 | | |
| | | $ | 32,053,757 | | |
| Internet Software & Services — 0.4% | |
| eBay, Inc.(1) | | | 1,257,244 | | | $ | 37,805,327 | | |
| Google, Inc., Class A(1) | | | 91,634 | | | | 42,195,624 | | |
| | | $ | 80,000,951 | | |
| IT Services — 2.5% | |
| Accenture Ltd., Class A(2) | | | 2,739,520 | | | $ | 101,170,474 | | |
| Acxiom Corp. | | | 455,893 | | | | 11,693,655 | | |
| Affiliated Computer Services, Inc.(1) | | | 183,730 | | | | 8,973,373 | | |
| Automatic Data Processing, Inc. | | | 1,491,647 | | | | 73,463,615 | | |
| BISYS Group, Inc. (The)(1) | | | 65,000 | | | | 839,150 | | |
| Computer Sciences Corp.(1) | | | 226,702 | | | | 12,099,086 | | |
| DST Systems, Inc.(1) | | | 72,199 | | | | 4,521,823 | | |
| Electronic Data Systems Corp. | | | 1,252 | | | | 34,493 | | |
| Fidelity National Information Services, Inc. | | | 42,862 | | | | 1,718,338 | | |
| First Data Corp. | | | 3,488,152 | | | | 89,017,639 | | |
| Fiserv, Inc.(1) | | | 832,355 | | | | 43,632,049 | | |
| Gartner, Inc., Class A(1) | | | 30,576 | | | | 605,099 | | |
| Paychex, Inc. | | | 1,623,499 | | | | 64,193,150 | | |
| Perot Systems Corp.(1) | | | 649,037 | | | | 10,637,716 | | |
| Safeguard Scientifics, Inc.(1) | | | 26,579 | | | | 64,321 | | |
| Western Union Co. | | | 3,488,152 | | | | 78,204,368 | | |
| | | $ | 500,868,349 | | |
| Leisure Equipment & Products — 0.0% | |
| Eastman Kodak Co. | | | 90,761 | | | $ | 2,341,634 | | |
| Mattel, Inc. | | | 30,514 | | | | 691,447 | | |
| | | $ | 3,033,081 | | |
| Life Sciences Tools & Services — 0.2% | |
| Dionex Corp.(1) | | | 37,300 | | | $ | 2,115,283 | | |
| Invitrogen Corp.(1) | | | 429,910 | | | | 24,328,607 | | |
| PerkinElmer, Inc. | | | 254,526 | | | | 5,658,113 | | |
| Waters Corp.(1) | | | 97,439 | | | | 4,771,588 | | |
| | | $ | 36,873,591 | | |
| Security | | Shares | | Value | |
| Machinery — 3.6% | |
| Caterpillar, Inc. | | | 185,437 | | | $ | 11,372,851 | | |
| Danaher Corp. | | | 4,060,343 | | | | 294,131,247 | | |
| Deere & Co. | | | 3,312,500 | | | | 314,919,375 | | |
| Donaldson Co., Inc. | | | 77,792 | | | | 2,700,160 | | |
| Dover Corp. | | | 532,425 | | | | 26,099,474 | | |
| Illinois Tool Works, Inc. | | | 1,656,572 | | | | 76,517,061 | | |
| ITT Industries, Inc. | | | 8,428 | | | | 478,879 | | |
| Nordson Corp. | | | 72,383 | | | | 3,606,845 | | |
| Parker Hannifin Corp. | | | 35,571 | | | | 2,734,698 | | |
| | | $ | 732,560,590 | | |
| Media — 4.9% | |
| ADVO, Inc. | | | 750,000 | | | $ | 24,450,000 | | |
| Belo Corp., Class A | | | 330,817 | | | | 6,080,416 | | |
| Cablevision Systems Corp., Class A | | | 4 | | | | 114 | | |
| Catalina Marketing Corp. | | | 79,803 | | | | 2,194,583 | | |
| CBS Corp., Class A | | | 14,887 | | | | 464,772 | | |
| CBS Corp., Class B | | | 556,629 | | | | 17,355,692 | | |
| Clear Channel Communications, Inc. | | | 129,887 | | | | 4,616,184 | | |
| Comcast Corp., Class A(1) | | | 1,895,538 | | | | 80,238,124 | | |
| Comcast Corp., Class A Special(1) | | | 2,367,010 | | | | 99,130,379 | | |
| Discovery Holding Co., Class A(1) | | | 102,540 | | | | 1,649,869 | | |
| E.W. Scripps Co. (The), Class A | | | 51,066 | | | | 2,550,236 | | |
| EchoStar Communications Corp., Class A(1) | | | 35,150 | | | | 1,336,755 | | |
| Entercom Communications Corp. | | | 220,000 | | | | 6,199,600 | | |
| Gannett Co., Inc. | | | 423,389 | | | | 25,598,099 | | |
| Havas SA (ADR) | | | 3,142,938 | | | | 17,367,670 | | |
| Idearc, Inc.(1) | | | 23,103 | | | | 661,901 | | |
| Interpublic Group of Companies, Inc., (The)(1) | | | 932,692 | | | | 11,416,150 | | |
| Lamar Advertising Co.(1) | | | 241,409 | | | | 15,785,735 | | |
| Liberty Global, Inc., Class A(1) | | | 46,731 | | | | 1,362,209 | | |
| Liberty Global, Inc., Class C(1) | | | 48,416 | | | | 1,355,648 | | |
| Liberty Media Holding Corp.-Capital, Series A(1) | | | 55,152 | | | | 5,403,793 | | |
| Liberty Media Holding Corp.-Capital, Series B(1) | | | 526 | | | | 51,614 | | |
| Live Nation, Inc.(1) | | | 16,410 | | | | 367,584 | | |
| McClatchy Co., (The), Class A | | | 9,394 | | | | 406,760 | | |
| McGraw-Hill Companies, Inc., (The) | | | 482,884 | | | | 32,845,770 | | |
| New York Times Co. (The), Class A | | | 300,468 | | | | 7,319,400 | | |
| News Corp., Class A | | | 187,934 | | | | 4,036,822 | | |
| Omnicom Group, Inc. | | | 2,410,418 | | | | 251,985,098 | | |
| Publicis Groupe(1) | | | 329,132 | | | | 13,849,518 | | |
| Time Warner, Inc. | | | 4,059,654 | | | | 88,419,264 | | |
| Tribune Co. | | | 1,694,658 | | | | 52,161,573 | | |
See notes to financial statements
19
Tax-Managed Growth Portfolio as of December 31, 2006
PORTFOLIO OF INVESTMENTS CONT'D
| Security | | Shares | | Value | |
| Media (continued) | |
| Univision Communications, Inc., Class A(1) | | | 27,009 | | | $ | 956,659 | | |
| Viacom, Inc., Class A(1) | | | 13,791 | | | | 565,569 | | |
| Viacom, Inc., Class B(1) | | | 524,573 | | | | 21,523,230 | | |
| Vivendi SA (ADR) | | | 174,913 | | | | 6,815,149 | | |
| Walt Disney Co. (The) | | | 4,955,298 | | | | 169,818,062 | | |
| Washington Post Co. (The), Class B | | | 16,470 | | | | 12,280,032 | | |
| WPP Group PLC(2) | | | 139,450 | | | | 1,881,113 | | |
| WPP Group PLC (ADR) | | | 256,051 | | | | 17,344,895 | | |
| | | $ | 1,007,846,041 | | |
| Metals & Mining — 0.3% | |
| Alcoa, Inc. | | | 85,947 | | | $ | 2,579,269 | | |
| Nucor Corp. | | | 741,928 | | | | 40,553,784 | | |
| Phelps Dodge Corp. | | | 29,724 | | | | 3,558,557 | | |
| Steel Dynamics, Inc. | | | 623,600 | | | | 20,235,820 | | |
| | | $ | 66,927,430 | | |
| Multiline Retail — 1.6% | |
| 99 Cents Only Stores(1) | | | 807,619 | | | $ | 9,828,723 | | |
| Dollar General Corp. | | | 52,668 | | | | 845,848 | | |
| Dollar Tree Stores, Inc.(1) | | | 646,996 | | | | 19,474,580 | | |
| Family Dollar Stores, Inc. | | | 2,249,176 | | | | 65,968,332 | | |
| Federated Department Stores, Inc. | | | 231,607 | | | | 8,831,175 | | |
| J.C. Penney Company, Inc. | | | 130,349 | | | | 10,083,799 | | |
| Nordstrom, Inc. | | | 131,384 | | | | 6,482,487 | | |
| Sears Holdings Corp.(1) | | | 4,563 | | | | 766,265 | | |
| Target Corp. | | | 3,504,497 | | | | 199,931,554 | | |
| | | $ | 322,212,763 | | |
| Multi-Utilities — 0.0% | |
| Ameren Corp. | | | 5,000 | | | $ | 268,650 | | |
| Dominion Resources, Inc. | | | 3,249 | | | | 272,396 | | |
| PG&E Corp. | | | 3,000 | | | | 141,990 | | |
| TECO Energy, Inc. | | | 20,354 | | | | 350,699 | | |
| Wisconsin Energy Corp. | | | 9,576 | | | | 454,477 | | |
| | | $ | 1,488,212 | | |
| Office Electronics — 0.0% | |
| Xerox Corp.(1) | | | 22,878 | | | $ | 387,782 | | |
| Zebra Technologies Corp., Class A(1) | | | 13,500 | | | | 469,665 | | |
| | | $ | 857,447 | | |
| Security | | Shares | | Value | |
| Oil, Gas & Consumable Fuels — 10.1% | |
| Anadarko Petroleum Corp. | | | 5,118,262 | | | $ | 222,746,762 | | |
| Apache Corp. | | | 2,145,450 | | | | 142,693,880 | | |
| BP PLC (ADR) | | | 5,110,159 | | | | 342,891,669 | | |
| Chevron Corp. | | | 545,679 | | | | 40,123,777 | | |
| ConocoPhillips | | | 6,155,436 | | | | 442,883,620 | | |
| Devon Energy Corp. | | | 818,602 | | | | 54,911,822 | | |
| El Paso Corp. | | | 97,665 | | | | 1,492,321 | | |
| Exxon Mobil Corp. | | | 7,018,803 | | | | 537,850,874 | | |
| Hess Corp. | | | 56,192 | | | | 2,785,437 | | |
| Kinder Morgan, Inc. | | | 1,762,113 | | | | 186,343,450 | | |
| Marathon Oil Corp. | | | 19,294 | | | | 1,784,695 | | |
| Murphy Oil Corp. | | | 39,036 | | | | 1,984,981 | | |
| Newfield Exploration Co.(1) | | | 30,851 | | | | 1,417,603 | | |
| Royal Dutch Shell PLC (ADR) | | | 116,941 | | | | 8,278,253 | | |
| Total SA (ADR) | | | 762,250 | | | | 54,821,020 | | |
| Valero Energy Corp. | | | 11,481 | | | | 587,368 | | |
| Williams Cos., Inc. (The) | | | 223,515 | | | | 5,838,212 | | |
| | | $ | 2,049,435,744 | | |
| Paper and Forest Products — 0.1% | |
| International Paper Co. | | | 150,301 | | | $ | 5,125,264 | | |
| MeadWestvaco Corp. | | | 45,590 | | | | 1,370,435 | | |
| Neenah Paper, Inc. | | | 33,028 | | | | 1,166,549 | | |
| Weyerhaeuser Co. | | | 85,020 | | | | 6,006,663 | | |
| | | $ | 13,668,911 | | |
| Personal Products — 0.3% | |
| Avon Products, Inc. | | | 173,400 | | | $ | 5,729,136 | | |
| Estee Lauder Cos., Inc., (The) Class A | | | 1,160,940 | | | | 47,389,571 | | |
| | | $ | 53,118,707 | | |
| Pharmaceuticals — 6.6% | |
| Abbott Laboratories | | | 3,244,908 | | | $ | 158,059,469 | | |
| Allergan, Inc. | | | 138,300 | | | | 16,560,042 | | |
| Bristol-Myers Squibb Co. | | | 4,735,992 | | | | 124,651,309 | | |
| Eli Lilly & Co. | | | 3,934,161 | | | | 204,969,788 | | |
| Forest Laboratories, Inc.(1) | | | 56,729 | | | | 2,870,487 | | |
| GlaxoSmithKline PLC (ADR) | | | 419,815 | | | | 22,149,439 | | |
| Johnson & Johnson | | | 3,883,957 | | | | 256,418,841 | | |
| King Pharmaceuticals, Inc.(1) | | | 152,305 | | | | 2,424,696 | | |
| Merck & Co., Inc. | | | 2,720,051 | | | | 118,594,224 | | |
| Mylan Laboratories, Inc. | | | 27,992 | | | | 558,720 | | |
See notes to financial statements
20
Tax-Managed Growth Portfolio as of December 31, 2006
PORTFOLIO OF INVESTMENTS CONT'D
| Security | | Shares | | Value | |
| Pharmaceuticals (continued) | |
| Novo Nordisk A/S (ADR) | | | 269,510 | | | $ | 22,539,121 | | |
| Pfizer, Inc. | | | 9,928,570 | | | | 257,149,963 | | |
| Schering-Plough Corp. | | | 1,739,845 | | | | 41,129,936 | | |
| Sepracor, Inc.(1) | | | 4,000 | | | | 246,320 | | |
| Shering AG (ADR) | | | 25,000 | | | | 3,334,543 | | |
| Teva Pharmaceutical Industries, Ltd. (ADR) | | | 1,676,190 | | | | 52,095,985 | | |
| Watson Pharmaceuticals, Inc.(1) | | | 562,702 | | | | 14,647,133 | | |
| Wyeth | | | 828,310 | | | | 42,177,545 | | |
| | | $ | 1,340,577,561 | | |
| Real Estate Investment Trusts (REITs) — 0.0% | |
| ProLogis | | | 104,563 | | | $ | 6,354,294 | | |
| | | $ | 6,354,294 | | |
| Real Estate Management & Development — 0.0% | |
| Forest City Enterprises, Inc., Class A | | | 58,779 | | | $ | 3,432,694 | | |
| Realogy Corp.(1) | | | 160,279 | | | | 4,859,659 | | |
| | | $ | 8,292,353 | | |
| Road & Rail — 0.1% | |
| Avis Budget Group, Inc. | | | 64,111 | | | $ | 1,390,568 | | |
| Burlington Northern Santa Fe Corp. | | | 192,210 | | | | 14,187,020 | | |
| CSX Corp. | | | 76,268 | | | | 2,625,907 | | |
| Heartland Express, Inc. | | | 1 | | | | 15 | | |
| Kansas City Southern(1) | | | 6,815 | | | | 197,499 | | |
| Norfolk Southern Corp. | | | 3,990 | | | | 200,657 | | |
| Union Pacific Corp. | | | 14,580 | | | | 1,341,652 | | |
| | | $ | 19,943,318 | | |
| Semiconductors & Semiconductor Equipment — 1.9% | |
| Agere Systems, Inc.(1) | | | 7,696 | | | $ | 147,532 | | |
| Analog Devices, Inc. | | | 600,378 | | | | 19,734,425 | | |
| Applied Materials, Inc. | | | 1,094,431 | | | | 20,192,252 | | |
| Broadcom Corp., Class A(1) | | | 911,708 | | | | 29,457,286 | | |
| Cypress Semiconductor Corp.(1) | | | 52,742 | | | | 889,758 | | |
| Intel Corp. | | | 11,168,974 | | | | 226,171,724 | | |
| KLA-Tencor Corp. | | | 148,373 | | | | 7,381,557 | | |
| Linear Technology Corp. | | | 395,760 | | | | 11,999,443 | | |
| LSI Logic Corp.(1) | | | 132,810 | | | | 1,195,290 | | |
| Maxim Integrated Products, Inc. | | | 263,099 | | | | 8,056,091 | | |
| Skyworks Solutions, Inc.(1) | | | 98,685 | | | | 698,690 | | |
| Teradyne, Inc.(1) | | | 7,248 | | | | 108,430 | | |
| Security | | Shares | | Value | |
Semiconductors & Semiconductor
Equipment (continued) | |
| Texas Instruments, Inc. | | | 2,086,420 | | | $ | 60,088,896 | | |
| Verigy, Ltd.(1)(2) | | | 29,129 | | | | 517,040 | | |
| Xilinx, Inc. | | | 23,033 | | | | 548,416 | | |
| | | $ | 387,186,830 | | |
| Software — 2.0% | |
| Adobe Systems, Inc.(1) | | | 489,938 | | | $ | 20,146,251 | | |
| CA, Inc. | | | 39,583 | | | | 896,555 | | |
| Cadence Design Systems, Inc.(1) | | | 269,092 | | | | 4,819,438 | | |
| Compuware Corp.(1) | | | 150,944 | | | | 1,257,364 | | |
| Electronic Arts, Inc.(1) | | | 21,405 | | | | 1,077,956 | | |
| Fair Isaac Corp. | | | 236,946 | | | | 9,631,855 | | |
| Intuit, Inc.(1) | | | 997,878 | | | | 30,445,258 | | |
| Jack Henry & Associates, Inc. | | | 201,006 | | | | 4,301,528 | | |
| Microsoft Corp. | | | 6,910,072 | | | | 206,334,750 | | |
| Oracle Corp.(1) | | | 4,797,138 | | | | 82,222,945 | | |
| SAP AG (ADR) | | | 615,900 | | | | 32,704,290 | | |
| Symantec Corp.(1) | | | 197,186 | | | | 4,111,328 | | |
| Wind River Systems, Inc.(1) | | | 59,479 | | | | 609,660 | | |
| | | $ | 398,559,178 | | |
| Specialty Retail — 1.8% | |
| Abercrombie & Fitch Co., Class A | | | 5,929 | | | $ | 412,836 | | |
| AutoNation, Inc.(1) | | | 890,018 | | | | 18,975,184 | | |
| Best Buy Co., Inc. | | | 170,415 | | | | 8,382,714 | | |
| CarMax, Inc.(1) | | | 61,533 | | | | 3,300,015 | | |
| Circuit City Stores, Inc. | | | 104,507 | | | | 1,983,543 | | |
| Gap, Inc. (The) | | | 540,888 | | | | 10,547,316 | | |
| Home Depot, Inc. | | | 4,483,290 | | | | 180,048,926 | | |
| Limited Brands, Inc. | | | 603,584 | | | | 17,467,721 | | |
| Lowe's Companies, Inc. | | | 1,785,216 | | | | 55,609,478 | | |
| Office Depot, Inc.(1) | | | 79,998 | | | | 3,053,524 | | |
| Payless ShoeSource, Inc.(1) | | | 23,100 | | | | 758,142 | | |
| Pep Boys (The) - Manny, Moe & Jack | | | 62,500 | | | | 928,750 | | |
| RadioShack Corp. | | | 502,318 | | | | 8,428,896 | | |
| Sherwin-Williams Co. (The) | | | 35,899 | | | | 2,282,458 | | |
| Staples, Inc. | | | 275,430 | | | | 7,353,981 | | |
| TJX Companies, Inc. (The) | | | 1,716,834 | | | | 48,895,432 | | |
| Tween Brands, Inc.(1) | | | 8,057 | | | | 321,716 | | |
| | | $ | 368,750,632 | | |
See notes to financial statements
21
Tax-Managed Growth Portfolio as of December 31, 2006
PORTFOLIO OF INVESTMENTS CONT'D
| Security | | Shares | | Value | |
Textiles, Apparel & Luxury
Goods — 1.0% | |
| Coach, Inc.(1) | | | 735,936 | | | $ | 31,615,811 | | |
| Hanesbrands, Inc.(1) | | | 563,704 | | | | 13,314,689 | | |
| NIKE, Inc., Class B | | | 1,529,222 | | | | 151,438,855 | | |
| | | $ | 196,369,355 | | |
| Thrifts & Mortgage Finance — 0.3% | |
| Fannie Mae | | | 335,606 | | | $ | 19,931,640 | | |
| Freddie Mac | | | 146,695 | | | | 9,960,591 | | |
| MGIC Investment Corp. | | | 95,045 | | | | 5,944,114 | | |
| Washington Mutual, Inc. | | | 625,699 | | | | 28,463,048 | | |
| | | $ | 64,299,393 | | |
| Tobacco — 0.3% | |
| Altria Group, Inc. | | | 621,907 | | | $ | 53,372,059 | | |
| | | $ | 53,372,059 | | |
| Trading Companies & Distributors — 0.0% | |
| United Rentals, Inc.(1) | | | 391,179 | | | $ | 9,947,682 | | |
| | | $ | 9,947,682 | | |
| Wireless Telecommunication Services — 0.5% | |
| Alltel Corp. | | | 1,421,969 | | | $ | 86,000,685 | | |
| Sprint Nextel Corp. | | | 344,624 | | | | 6,509,947 | | |
| Telephone & Data Systems, Inc., Special Shares | | | 25,844 | | | | 1,281,862 | | |
| Telephone and Data Systems, Inc. | | | 25,844 | | | | 1,404,105 | | |
| Vodafone Group PLC (ADR) | | | 299,500 | | | | 8,320,110 | | |
| | | $ | 103,516,709 | | |
Total Common Stocks
(identified cost $13,972,240,872) | | | | | | $ | 20,334,849,302 | | |
| Convertible Preferred Stocks — 0.0% | |
| Security | | Shares | | Value | |
Independent Power Producers & Energy
Traders — 0.0% | |
| Enron Corp.(1)(3) | | | 11,050 | | | $ | 0 | | |
| | | $ | 0 | | |
Total Convertible Preferred Stocks
(identified cost $16,626,069) | | | | | | $ | 0 | | |
| Other Issues — 0.0% | |
| Security | | Shares | | Value | |
| Commercial Banks — 0.0% | |
Wachovia Corp. (Dividend Equalization
Preferred Shares)(1) | | | 166,518 | | | $ | 416 | | |
| | | $ | 416 | | |
| Software — 0.0% | |
| Seagate Technology, Inc. (Tax Refund Rights)(1)(3) | | | 197,392 | | | $ | 0 | | |
| | | $ | 0 | | |
Total Other Issues
(identified cost $39,407) | | | | | | $ | 416 | | |
| Warrants — 0.0% | |
| Security | | Shares | | Value | |
| Communications Equipment — 0.0% | |
| Lucent Technologies, Inc.(1) | | | 18,106 | | | $ | 5,613 | | |
| | | $ | 5,613 | | |
Total Warrants
(identified cost $0) | | | | | | $ | 5,613 | | |
See notes to financial statements
22
Tax-Managed Growth Portfolio as of December 31, 2006
PORTFOLIO OF INVESTMENTS CONT'D
| Affiliated Investments — 0.1% | |
| Description | | Interest
(000's omitted) | | Value | |
| Investment in Cash Management Portfolio, 4.87%(6) | | $ | 21,137 | | | $ | 21,136,709 | | |
Total Affiliated Investments
(at amortized cost, $21,136,709) | | | | $ | 21,136,709 | | |
Total Investments — 99.8%
(identified cost $14,010,043,057) | | | | $ | 20,355,992,040 | | |
| Other Assets, Less Liabilities — 0.2% | | | | $ | 31,300,207 | | |
| Net Assets — 100.0% | | | | $ | 20,387,292,247 | | |
ADR - American Depository Receipt
(1) Non-income producing security.
(2) Foreign security.
(3) Security valued at fair value using methods determined in good faith by or at the direction of the Trustees.
(4) Security subject to restrictions on resale (see Note 7).
(5) Security exempt from registration under Rule 144A of the Securities Act of 1933. These securities may be sold in transactions exempt from registration, normally to qualified institutional buyers. At December 31, 2006, the aggregate value of the securities is $4,870,986 or 0.02% of the Portfolio's net assets.
(6) Affiliated investment investing in high quality, U.S. Dollar denominated money market instruments, and that is available to Eaton Vance portfolios and funds. The rate shown is the annualized seven-day yield as of December 31, 2006.
See notes to financial statements
23
Tax-Managed Growth Portfolio as of December 31, 2006
FINANCIAL STATEMENTS
Statement of Assets and Liabilities
As of December 31, 2006
| Assets | |
| Unaffiliated Investments, at value (identified cost, $13,988,906,348) | | $ | 20,334,855,331 | | |
| Affiliated Investments, at value (amortized cost, $21,136,709) | | | 21,136,709 | | |
| Cash | | | 2,010 | | |
| Receivable for investments sold | | | 9,565,416 | | |
| Dividends and interest receivable | | | 28,247,780 | | |
| Tax reclaim receivable | | | 1,478,224 | | |
| Total assets | | $ | 20,395,285,470 | | |
| Liabilities | |
| Payable to affiliate for investment adviser fee | | $ | 7,278,009 | | |
| Payable to affiliate for Trustees' fees | | | 9,161 | | |
| Other accrued expenses | | | 706,053 | | |
| Total liabilities | | $ | 7,993,223 | | |
| Net Assets applicable to investors' interest in Portfolio | | $ | 20,387,292,247 | | |
| Sources of Net Assets | |
| Net proceeds from capital contributions and withdrawals | | $ | 14,041,287,771 | | |
| Net unrealized appreciation (computed on the basis of identified cost) | | | 6,346,004,476 | | |
| Total | | $ | 20,387,292,247 | | |
Statement of Operations
For the Year Ended
December 31, 2006
| Investment Income | |
| Dividends (net of foreign taxes, $5,508,449) | | $ | 352,655,089 | | |
| Interest | | | 2,633,384 | | |
| Security lending income, net | | | 450,588 | | |
| Interest income allocated from affiliated investment | | | 85,831 | | |
| Expense allocated from affiliated investment | | | (7,961 | ) | |
| Total investment income | | $ | 355,816,931 | | |
| Expenses | |
| Investment adviser fee | | $ | 83,323,602 | | |
| Trustees' fees and expenses | | | 28,217 | | |
| Custodian fee | | | 2,217,430 | | |
| Legal and accounting services | | | 92,496 | | |
| Miscellaneous | | | 628,068 | | |
| Total expenses | | $ | 86,289,813 | | |
Deduct —
Reduction of custodian fee | | $ | 99 | | |
| Total expense reductions | | $ | 99 | | |
| Net expenses | | $ | 86,289,714 | | |
| Net investment income | | $ | 269,527,217 | | |
| Realized and Unrealized Gain (Loss) | |
Net realized gain (loss) —
Investment transactions (identified cost basis) | | $ | 644,762,039 | | |
| Foreign currency transactions | | | (23,541 | ) | |
| Net realized gain | | $ | 644,738,498 | | |
Change in unrealized appreciation (depreciation) —
Investments (identified cost basis) | | $ | 1,577,869,222 | | |
| Foreign currency | | | 101,821 | | |
| Net change in unrealized appreciation (depreciation) | | $ | 1,577,971,043 | | |
| Net realized and unrealized gain | | $ | 2,222,709,541 | | |
| Net increase in net assets from operations | | $ | 2,492,236,758 | | |
See notes to financial statements
24
Tax-Managed Growth Portfolio as of December 31, 2006
FINANCIAL STATEMENTS CONT'D
Statements of Changes in Net Assets
Increase (Decrease)
in Net Assets | | Year Ended
December 31, 2006 | | Year Ended
December 31, 2005 | |
From operations —
Net investment income | | $ | 269,527,217 | | | $ | 232,904,646 | | |
Net realized gain from investment
transactions, securities sold short and
foreign currency transactions | | | 644,738,498 | | | | 70,889,149 | | |
Net change in unrealized appreciation
(depreciation) of investments, securities
sold short and foreign currency | | | 1,577,971,043 | | | | 551,019,603 | | |
| Net increase in net assets from operations | | $ | 2,492,236,758 | | | $ | 854,813,398 | | |
Capital transactions —
Contributions | | $ | 1,447,009,081 | | | $ | 1,237,495,815 | | |
| Withdrawals | | | (2,584,560,445 | ) | | | (2,200,844,762 | ) | |
Net decrease in net assets
from capital transactions | | $ | (1,137,551,364 | ) | | $ | (963,348,947 | ) | |
| Net increase (decrease) in net assets | | $ | 1,354,685,394 | | | $ | (108,535,549 | ) | |
| Net Assets | |
| At beginning of year | | $ | 19,032,606,853 | | | $ | 19,141,142,402 | | |
| At end of year | | $ | 20,387,292,247 | | | $ | 19,032,606,853 | | |
See notes to financial statements
25
Tax-Managed Growth Portfolio as of December 31, 2006
FINANCIAL STATEMENTS CONT'D
Supplementary Data
| | | Year Ended December 31, | |
| | | 2006 | | 2005 | | 2004 | | 2003 | | 2002 | |
| Ratios/Supplemental Data | |
| Ratios (As a percentage of average daily net assets): | |
| Expenses before custodian fee reduction | | | 0.45 | % | | | 0.45 | %(2) | | | 0.45 | %(2) | | | 0.45 | % | | | 0.45 | % | |
| Expenses after custodian fee reduction | | | 0.45 | % | | | 0.45 | %(2) | | | 0.45 | %(2) | | | 0.45 | % | | | 0.45 | % | |
| Net investment income | | | 1.39 | % | | | 1.25 | %(2) | | | 1.18 | %(2) | | | 1.05 | % | | | 0.85 | % | |
| Portfolio Turnover(1) | | | 1 | % | | | 0 | %(3) | | | 3 | % | | | 15 | % | | | 23 | % | |
| Total Return | | | 13.69 | % | | | 4.70 | % | | | 9.67 | % | | | 23.88 | % | | | (19.52 | )% | |
| Net assets, end of year (000's omitted) | | $ | 20,387,292 | | | $ | 19,032,607 | | | $ | 19,141,142 | | | $ | 17,609,589 | | | $ | 14,571,522 | | |
(1) Excludes the value of the portfolio securities contributed or distributed as a result of in-kind shareholder transactions. The total turnover rate of the Portfolio including in-kind contributions and distributions was 7%, 6%, 10%, 21%, and 30% for 2006, 2005, 2004, 2003, and 2002, respectively.
(2) The investment adviser waived a portion of its investment advisory fee (equal to less than 0.01% and 0.01% of average daily net assets for 2005 and 2004, respectively).
(3) Amounts to less than 1%.
See notes to financial statements
26
Tax-Managed Growth Portfolio as of December 31, 2006
NOTES TO FINANCIAL STATEMENTS
1 Significant Accounting Policies
Tax-Managed Growth Portfolio (the Portfolio) is registered under the Investment Company Act of 1940 (the 1940 Act), as amended, as a diversified, open-end management investment company. The Portfolio, which was organized as a trust under the laws of the State of New York on December 1, 1995, seeks to achieve long-term, after-tax returns for its interestholders through investing in a diversified portfolio of equity securities. The Declaration of Trust permits the Trustees to issue interests in the Portfolio. The following is a summary of significant accounting policies consistently followed by the Portfolio in the preparation of its financial statements. The policies are in conformity with accounting principles generally accepted in the United States of America.
A Investment Valuations — Securities listed on a U.S. securities exchange generally are valued at the last sale price on the day of valuation or, if no sales took place on such date, at the mean between the closing bid and asked prices therefore on the exchange where such securities are principally traded. Equity securities listed on the NASDAQ Global Market generally are valued at the official NASDAQ closing price. Unlisted or listed securities for which closing sales prices or closing quotations are not available are valued at the mean between the latest available bid and asked prices or, in the case of preferred equity securities that are not listed or traded in the over-the-counter market, by an i ndependent pricing service. Exchange-traded options are valued at the last sale price for the day of valuation as quoted on the principal exchange or board of trade on which the options are traded or, in the absence of sales on such date, at the mean between the latest bid and asked prices therefore. Futures positions on securities and currencies generally are valued at closing settlement prices. Short-term debt securities with a remaining maturity of 60 days or less are valued at amortized cost. If short-term debt securities are acquired with a remaining maturity of more than 60 days, they will be valued by a pricing service. Other fixed income and debt securities, including listed securities and securities for which price quotations are available, will normally be valued on the basis of valuations furnished by a pricing service. Foreign securities and currencies are valued in U.S. dollars, based on foreign currency exchange rate quotations supplied by an independent quotation service. The daily valuation o f exchange-traded foreign securities generally is determined as of the close of trading on the principal exchange on which such securities trade. Events occurring after the close of trading on foreign exchanges may result in adjustments to the valuation of foreign securities to more accurately reflect their fair value as of the close of regular trading on the New York Stock Exchange. When valuing foreign
equity securities that meet certain criteria, the Trustees have approved the use of a fair value service that values such securities to reflect market trading that occurs after the close of the applicable foreign markets of comparable securities or other instruments that have a strong correlation to the fair-valued securities. Investments held by the Portfolio for which valuations or market quotations are unavailable are valued at fair value using methods determined in good faith by or at the direction of the Trustees of the Portfolio considering relevant factors, data and information including the market value of freely tradable securities of the same class in the principal market on which such securities are normally traded.
The Portfolio may invest in Cash Management Portfolio (Cash Management) and Cash Collateral Fund, LLC (Cash Collateral), both are affiliated investment companies managed by Boston Management and Research (BMR) and Eaton Vance Management (EVM), respectively. Cash Management values its investment securities utilizing the amortized cost valuation technique permitted by Rule 2a-7 of the 1940 Act. This technique involves initially valuing a portfolio security at its cost and thereafter assuming a constant amortization to maturity of any discount or premium. Investments in Cash Collateral are valued at the net asset value per share on the valuation date.
B Federal Taxes — The Portfolio has elected to be treated as a partnership for federal tax purposes. No provision is made by the Portfolio for federal or state taxes on any taxable income of the Portfolio because each investor in the Portfolio is ultimately responsible for the payment of any taxes on its share of taxable income. Since at least one of the Portfolio's investors is a regulated investment company that invests all or substantially all of its assets in the Portfolio, the Portfolio normally must satisfy the applicable source of income and diversification requirements (under the Internal Revenue Code) in order for its investors to satisfy them. The Portfolio will allocate, at least annually a mong its investors, each investor's distributive share of the Portfolio's net investment income, net realized capital gains, and any other items of income, gain, loss, deduction or credit.
C Futures Contracts — Upon the entering of a financial futures contract, the Portfolio is required to deposit either in cash or securities an amount (initial margin) equal to a certain percentage of the purchase price indicated in the financial futures contract. Subsequent payments are made or received by the Portfolio (margin maintenance) each day, dependent on daily fluctuations in the value of the underlying security, and are recorded for
27
Tax-Managed Growth Portfolio as of December 31, 2006
NOTES TO FINANCIAL STATEMENTS CONT'D
book purposes as unrealized gains or losses by the Portfolio. The Portfolio's investment in financial futures contracts is designed to hedge against anticipated future changes in the price of current or anticipated portfolio positions. Should prices move unexpectedly, the Portfolio may not achieve the anticipated benefits of the financial futures contracts and may realize a loss.
D Put Options — Upon the purchase of a put option by the Portfolio, the premium paid is recorded as an investment, the value of which is marked-to-market daily. When a purchased option expires, the Portfolio will realize a loss in the amount of the cost of the option. When the Portfolio enters into a closing sale transaction, the Portfolio will realize a gain or loss depending on whether the sales proceeds from the closing sale transaction are greater or less than the cost of the option. When the Portfolio exercises a put option, settlement is made in cash. The risk associated with purchasing options is limited to the premium originally paid.
E Securities Sold Short — The Portfolio may sell individual securities short if it owns at least an equal amount of the security sold short or has at the time of the sale a right to obtain securities equivalent in kind and amount to the securities sold short provided that, if such right is conditional, the sale is made upon the same conditions (a covered short sale). The Portfolio may sell short securities representing an index or basket of securities whose constituents the Portfolio holds in whole or in part. A short sale of an index or basket of securities will be a covered short sale if the underlying index or basket of securities is the same or substantially identical to securities held by the Por tfolio. Upon executing the transaction, the Portfolio records the proceeds as deposits with brokers in the Statement of Assets and Liabilities and establishes an offsetting payable for securities sold short for the securities due on settlement. The proceeds are retained by the broker as collateral for the short position. The liability is marked-to-market and the Portfolio is required to pay the lending broker any dividend or interest income earned while the short position is open. The seller of a short position generally realizes a profit on the transaction if the price it receives on the short sale exceeds the cost of closing out the position by purchasing securities in the market, but generally realizes a loss if the cost of closing out the short position exceeds the proceeds of the short sale. The exposure to loss on covered short sales (to the extent the value of the security sold short rises instead of falls) is offset by the increase in the value of the underlying security or securities retained. The p rofit or loss on a covered short sale is also affected by the borrowing cost of any securities borrowed in connection with the short sale (which will vary
with market conditions) and use of the proceeds of the short sale. The Portfolio expects normally to close covered short sales against-the-box by delivering newly acquired stocks. Exposure to loss on an index or basket of securities sold short will not be offset by gains on other securities holdings to the extent that the constituent securities of the index or a basket of securities sold short are not held by the Portfolio. Such losses may be substantial.
F Foreign Currency Translation — Investment valuations, other assets, and liabilities initially expressed in foreign currencies are converted each business day into U.S. dollars based upon current exchange rates. Purchases and sales of foreign investment securities and income and expenses are converted into U.S. dollars based upon currency exchange rates prevailing on the respective dates of such transactions. Recognized gains or losses on investment transactions attributable to changes in foreign currency exchange rates are recorded for financial statement purposes as net realized gains and losses on investments. That portion of unrealized gains and losses on investments that results from fluctuation s in foreign currency exchange rates is not separately disclosed.
G Indemnifications — Under the Portfolio's organizational documents, its officers and Trustees may be indemnified against certain liabilities and expenses arising out of the performance of their duties to the Portfolio. Interestholders in the Portfolio are jointly and severally liable for the liabilities and obligations of the Portfolio in the event that the Portfolio fails to satisfy such liabilities and obligations; provided, however, that, to the extent assets are available in the Portfolio, the Portfolio may, under certain circumstances, indemnify interestholders from and against any claim or liability to which such holder may become subject by reason of being or having been an interestholder in t he Portfolio. Additionally, in the normal course of business, the Portfolio enters into agreements with service providers that may contain indemnification clauses. The Portfolio's maximum exposure under these arrangements is unknown as this would involve future claims that may be made against the Portfolio that have not yet occurred.
H Other — Investment transactions are accounted for on the date the securities are purchased or sold. Realized gains and losses on securities sold are determined on the basis of identified cost. Dividend income is recorded on the ex-dividend date. However, if the ex-dividend date has passed, certain dividends from foreign securities are recorded as the Portfolio is informed of the ex-dividend date. Interest income is recorded on the accrual basis.
28
Tax-Managed Growth Portfolio as of December 31, 2006
NOTES TO FINANCIAL STATEMENTS CONT'D
I Expense Reduction — Investors Bank & Trust Company (IBT) serves as custodian to the Portfolio. Pursuant to the custodian agreement, IBT receives a fee reduced by credits which are determined based on the average daily cash balance the Portfolio maintains with IBT. All credit balances used to reduce the Portfolio's custodian fees are reported as a reduction of expenses in the Statement of Operations. For the year ended December 31, 2006, there were $99 in credit balances used to reduce the Portfolio's custodian fee.
J Use of Estimates — The preparation of the financial statements in conformity with accounting principles generally accepted in the United States of America requires management to make estimates and assumptions that affect the reported amounts of assets and liabilities at the date of the financial statements and the reported amounts of income and expense during the reporting period. Actual results could differ from those estimates.
2 Investment Adviser Fee and Other Transactions with Affiliates
The investment adviser fee is earned by BMR, a wholly-owned subsidiary of EVM, as compensation for management and investment advisory services rendered to the Portfolio. Under the advisory agreement, BMR receives a monthly advisory fee of 5/96 of 1% (0.625% annually) of the average daily net assets of the Portfolio up to $500,000,000, and at reduced rates as daily net assets exceed that level. Certain of the advisory fee rate reductions are pursuant to an agreement between the Portfolio's Board of Trustees and BMR. Those reductions may not be changed without Trustee and interestholder approval. In addition, the investment adviser fee payable by the Portfolio is reduced by the Portfolio's allocable portion of the advisory fee paid by Cash Management, an affiliated investment company managed by BMR. The Portfolio's allocated portion of the advisory fee paid by Cash Management totaled $7,775 and the advisory fee incurred directly b y the Portfolio amounted to $83,323,602 for the year ended December 31, 2006. For the year ended December 31, 2006, the effective annual rate of investment advisory fees paid or accrued on a direct and indirect basis by the Portfolio, based on average net assets, was 0.43%.
Except for Trustees of the Portfolio who are not members of EVM's or BMR's organization, officers and Trustees receive remuneration for their services to the Portfolio out of such investment adviser fee. Trustees of the Portfolio that are not affiliated with the investment adviser may elect to defer receipt of all or a percentage of their annual fees in
accordance with the terms of the Trustees Deferred Compensation Plan. For the year ended December 31, 2006, no significant amounts have been deferred.
Certain officers and Trustees of the Portfolio are officers of the above organizations.
3 Investment Transactions
For the year ended December 31, 2006, purchases and sales of investments, other than short-term obligations, aggregated $112,574,873 and $621,537,755, respectively. In addition, investments having an aggregate market value of $1,585,969,823 at dates of withdrawal were distributed in payment for capital withdrawals and investors contributed securities with a value of $1,240,104,202, during the year ended December 31, 2006.
4 Federal Income Tax Basis of Unrealized Appreciation (Depreciation)
The cost and unrealized appreciation (depreciation) in value of the investments owned at December 31, 2006 as computed on a federal income tax basis, were as follows:
| Aggregate cost | | $ | 4,054,619,301 | | |
| Gross unrealized appreciation | | $ | 26,261,456,216 | | |
| Gross unrealized depreciation | | | (9,960,083,477 | ) | |
| Net unrealized appreciation | | $ | 16,301,372,739 | | |
Unrealized appreciation on foreign currency is $55,493.
5 Financial Instruments
The Portfolio may trade in financial instruments with off-balance sheet risk in the normal course of its investing activities to assist in managing exposure to various market risks. These financial instruments include written options, forward foreign currency exchange contracts and financial futures contracts and may involve, to a varying degree, elements of risk in excess of the amounts recognized for financial statement purposes.
The notional or contractual amounts of these instruments represent the investment the Portfolio has in particular classes of financial instruments and does not necessarily represent the amounts potentially subject to risk. The measurement of the risks associated with these instruments is meaningful only when all related and offsetting transactions are considered. The Portfolio did not have any
29
Tax-Managed Growth Portfolio as of December 31, 2006
NOTES TO FINANCIAL STATEMENTS CONT'D
open obligations under these financial instruments at December 31, 2006.
6 Line of Credit
The Portfolio participates with other portfolios and funds managed by BMR and EVM and its affiliates in a $150 million unsecured line of credit agreement with a group of banks. Borrowings will be made by the Portfolio solely to facilitate the handling of unusual and/or unanticipated short-term cash requirements. Interest is charged to each participating portfolio or fund based on its borrowings at an amount above either the Eurodollar rate or Federal Funds rate. In addition, a fee computed at an annual rate of 0.10% on the daily unused portion of the line of credit is allocated among the participating portfolios and funds at the end of each quarter. The Portfolio did not have any significant borrowings or allocated fees during the year ended December 31, 2006.
7 Restricted Securities
At December 31, 2006, the Portfolio owned the following securities (representing less than 0.01% of net assets) which were restricted as to public resale and not registered under the Securities Act of 1933. The securities are valued at fair value using methods determined in good faith by or at the direction of the Trustees.
| Common Stocks | | Date of
Acquisition | | Eligible
for Resale | | Shares | | Cost | | Fair Value | |
| Medtronic, Inc. | | | 5/18/06 | | | | 5/19/07 | | | | 7,500 | | | $ | 368,372 | | | $ | 401,074 | | |
| | | | | | | | | | | | | | | $ | 368,372 | | | $ | 401,074 | | |
8 Securities Lending Agreement
The Portfolio has established a securities lending agreement with a securities lending agent, IBT, in which the Portfolio lends portfolio securities to qualified borrowers in exchange for collateral consisting of either cash or U.S. government securities in an amount at least equal to the market value of the securities on loan. Cash collateral is invested in Cash Collateral which invests in high quality money market instruments. The Portfolio earns interest on the amount invested in Cash Collateral but it must pay the broker a loan rebate fee computed as a varying percentage of the collateral received. The loan rebate fee paid by the Portfolio amounted to $2,160,185 for the year ended December 31, 2006. In the event of counterparty default, the Portfolio is subject to potential loss if it is delayed or prevented from exercising its right to dispose of the collateral. The Portfolio bears risk in the event that invested collateral is not
sufficient to meet obligations due on loans. The Portfolio did not have any securities on loan at December 31, 2006.
9 Recently Issued Accounting Pronouncements
In June 2006, the Financial Accounting Standards Board (FASB) issued FASB Interpretation No. 48, (FIN 48) "Accounting for Uncertainty in Income Taxes – an interpretation of FASB Statement No. 109". FIN 48 clarifies the accounting for uncertainty in income taxes recognized in accordance with FASB Statement No. 109, "Accounting for Income Taxes." This interpretation prescribes a recognition threshold and measurement attribute for the financial statement recognition and measurement of a tax position taken or expected to be taken in a tax return. It also provides guidance on de-recognition, classification, interest and penalties, accounting in interim periods, disclosure and transition. FIN 48 is effective during the first required financial reporting period for fiscal years beginning after December 15, 2006. Management is currently evaluating the impact of applying the various provisions of FIN 48.
In September 2006, the FASB issued Statement of Financial Accounting Standards No. 157, (FAS 157) "Fair Value Measurements". FAS 157 defines fair value, establishes a framework for measuring fair value in accordance with generally accepted accounting principles and expands disclosure about fair value measurements. FAS 157 is effective for fiscal years beginning after November 15, 2007. Management is currently evaluating the impact the adoption of FAS 157 will have on the Portfolio's financial statement disclosures.
30
Tax-Managed Growth Portfolio as of December 31, 2006
REPORT OF INDEPENDENT REGISTERED PUBLIC ACCOUNTING FIRM
To the Trustees and Investors of
Tax-Managed Growth Portfolio:
We have audited the accompanying statement of assets and liabilities of Tax-Managed Growth Portfolio (the Portfolio), including the portfolio of investments, as of December 31, 2006, and the related statement of operations for the year then ended, the statements of changes in net assets for each of the two years in the period then ended, and the supplementary data for each of the five years in the period then ended. These financial statements and supplementary data are the responsibility of the Portfolio's management. Our responsibility is to express an opinion on these financial statements and supplementary data based on our audits.
We conducted our audits in accordance with the standards of the Public Company Accounting Oversight Board (United States). Those standards require that we plan and perform the audit to obtain reasonable assurance about whether the financial statements and supplementary data are free of material misstatement. The Portfolio is not required to have, nor were we engaged to perform, an audit of its internal control over financial reporting. Our audits included consideration of internal control over financial reporting as a basis for designing audit procedures that are appropriate in the circumstances, but not for the purpose of expressing an opinion on the effectiveness of the Portfolio's internal control over financial reporting. Accordingly, we express no such opinion. An audit also includes examining, on a test basis, evidence supporting the amounts and disclosures in the financial statements, assessing the accounting principles u sed and significant estimates made by management, as well as evaluating the overall financial statement presentation. Our procedures included confirmation of securities owned as of December 31, 2006 by correspondence with the custodian and brokers; where replies were not received from brokers, we performed other auditing procedures. We believe that our audits provide a reasonable basis for our opinion.
In our opinion, such financial statements and supplementary data referred to above present fairly, in all material respects, the financial position of Tax-Managed Growth Portfolio as of December 31, 2006, the results of its operations for the year then ended, the changes in its net assets for each of the two years in the period then ended, and the supplementary data for each of the five years in the period then ended, in conformity with accounting principles generally accepted in the United States of America.
DELOITTE & TOUCHE LLP
Boston, Massachusetts
February 20, 2007
31
Eaton Vance Tax-Managed Growth Fund 1.0
BOARD OF TRUSTEES' ANNUAL APPROVAL OF THE INVESTMENT ADVISORY AGREEMENT
Overview of the Contract Review Process
The Investment Company Act of 1940, as amended (the "1940 Act"), provides, in substance, that each investment advisory agreement between a fund and its investment adviser will continue in effect from year to year only if its continuance is approved at least annually by the fund's board of trustees, including by a vote of a majority of the trustees who are not "interested persons" of the fund ("Independent Trustees") cast in person at a meeting called for the purpose of considering such approval.
At a meeting of the Boards of Trustees (each a "Board") of the Eaton Vance group of mutual funds (the "Eaton Vance Funds") held on March 27, 2006, the Board, including a majority of the Independent Trustees, voted to approve continuation of existing advisory and sub-advisory agreements for the Eaton Vance Funds for an additional one-year period. In voting its approval, the Board relied upon the affirmative recommendation of the Special Committee of the Board, which is a committee comprised exclusively of Independent Trustees. Prior to making its recommendation, the Special Committee reviewed information furnished for a series of meetings of the Special Committee held in February and March 2006. Such information included, among other things, the following:
Information about Fees, Performance and Expenses
• An independent report comparing the advisory and related fees paid by each fund with fees paid by comparable funds;
• An independent report comparing each fund's total expense ratio and its components to comparable funds;
• An independent report comparing the investment performance of each fund to the investment performance of comparable funds over various time periods;
• Data regarding investment performance in comparison to relevant peer groups of funds and appropriate indices;
• Comparative information concerning fees charged by each adviser for managing other mutual funds and institutional accounts using investment strategies and techniques similar to those used in managing the fund;
• Profitability analyses for each adviser with respect to each fund managed by it;
Information about Portfolio Management
• Descriptions of the investment management services provided to each fund, including the investment strategies and processes employed;
• Information concerning the allocation of brokerage and the benefits received by each adviser as a result of brokerage allocation, including information concerning the acquisition of research through "soft dollar" benefits received in connection with the funds' brokerage, and the implementation of a soft dollar reimbursement program established with respect to the funds;
• Data relating to portfolio turnover rates of each fund;
• The procedures and processes used to determine the fair value of fund assets and actions taken to monitor and test the effectiveness of such procedures and processes;
Information about each Adviser
• Reports detailing the financial results and condition of each adviser;
• Descriptions of the qualifications, education and experience of the individual investment professionals whose responsibilities include portfolio management and investment research for the funds, and information relating to their compensation and responsibilities with respect to managing other mutual funds and investment accounts;
• Copies of the Codes of Ethics of each adviser and its affiliates, together with information relating to compliance with and the administration of such codes;
• Information concerning the resources devoted to compliance efforts undertaken by each adviser and its affiliates on behalf of the funds (including descriptions of various compliance programs) and their record of compliance with investment policies and restrictions, including policies with respect to market-timing, late trading and selective portfolio disclosure, and with policies on personal securities transactions;
• Descriptions of the business continuity and disaster recovery plans of each adviser and its affiliates;
Other Relevant Information
• Information concerning the nature, cost and character of the administrative and other non-investment management services provided by Eaton Vance Management and its affiliates;
• Information concerning management of the relationship with the custodian, subcustodians and fund accountants by each adviser or the funds' administrator; and
• The terms of each advisory agreement.
In addition to the information identified above, the Special Committee considered information provided from time to time by each adviser throughout the year at meetings of the Board and its committees. Over the course of the twelve month period ended March 31, 2006, the
32
Eaton Vance Tax-Managed Growth Fund 1.0
BOARD OF TRUSTEES' ANNUAL APPROVAL OF THE INVESTMENT ADVISORY AGREEMENT CONT'D
Board met nine times and the Special Committee, the Audit Committee and the Governance Committee, each of which is a Committee comprised solely of Independent Trustees, met eight, twelve and five times, respectively. At such meetings, the Trustees received, among other things, presentations by the portfolio managers and other investment professionals of each adviser relating to the investment performance of each fund and the investment strategies used in pursuing the fund's investment objective.
For funds that invest through one or more underlying portfolios, the Board considered similar information about the portfolio(s) when considering the approval of advisory agreements. In addition, in cases where the fund's investment adviser has engaged a sub-adviser, the Board considered similar information about the sub-adviser when considering the approval of any sub-advisory agreement.
The Special Committee was assisted throughout the contract review process by Goodwin Procter LLP, legal counsel for the Independent Trustees. The members of the Special Committee relied upon the advice of such counsel and their own business judgment in determining the material factors to be considered in evaluating each advisory and sub-advisory agreement and the weight to be given to each such factor. The conclusions reached with respect to each advisory and sub-advisory agreement were based on a comprehensive evaluation of all the information provided and not any single factor. Moreover, each member of the Special Committee may have placed varying emphasis on particular factors in reaching conclusions with respect to each advisory and sub-advisory agreement.
Results of the Process
Based on its consideration of the foregoing, and such other information as it deemed relevant, including the factors and conclusions described below, the Special Committee concluded that the continuance of the investment advisory agreement of the Tax-Managed Growth Portfolio (the "Portfolio"), the portfolio in which the Eaton Vance Tax-Managed Growth Fund 1.0 (the "Fund") invests, with Boston Management and Research (the "Adviser"), including its fee structure, is in the interests of shareholders and, therefore, the Special Committee recommended to the Board approval of the agreement. The Board accepted the recommendation of the Special Committee as well as the factors considered and conclusions reached by the Special Committee with respect to the agreement. Accordingly, the Board, including a majority of the Independent Trustees, voted to approve continuation of the investment advisory agreement for the Portfolio.
Nature, Extent and Quality of Services
In considering whether to approve the investment advisory agreement of the Portfolio, the Board evaluated the nature, extent and quality of services provided to the Portfolio by the Adviser.
The Board considered the Adviser's management capabilities and investment process with respect to the types of investments held by the Portfolio, including the education, experience and number of its investment professionals and other personnel who provide portfolio management, investment research, and similar services to the Portfolio. The Board specifically noted the Adviser's in-house equity research capabilities and experience in managing funds that seek to maximize after-tax returns. The Board also took into account the resources dedicated to portfolio management and other services, including the compensation paid to recruit and retain investment personnel, and the time and attention devoted to each Portfolio in the complex by senior management.
The Board reviewed the compliance programs of the Adviser and relevant affiliates thereof. Among other matters, the Board considered compliance and reporting matters relating to personal trading by investment personnel, selective disclosure of portfolio holdings, late trading, frequent trading, portfolio valuation, business continuity and the allocation of investment opportunities. The Board also evaluated the responses of the Adviser and its affiliates to requests from regulatory authorities such as the Securities and Exchange Commission and the National Association of Securities Dealers.
The Board considered shareholder and other administrative services provided or managed by Eaton Vance Management and its affiliates, including transfer agency and accounting services. The Board evaluated the benefits to shareholders of investing in a fund that is a part of a large family of funds, including the ability, in many cases, to exchange an investment among different funds without incurring additional sales charges.
After consideration of the foregoing factors, among others, the Board concluded that the nature, extent and quality of services provided by the Adviser, taken as a whole, are appropriate and consistent with the terms of the investment advisory agreement.
Fund Performance
The Board compared the Fund's investment performance to a relevant universe of similarly managed funds identified by an independent data provider and appropriate benchmark indices. The Board reviewed comparative performance data for the one-, three-, five- and ten-year periods ended September 30, 2005 for the Fund. The Board noted the Fund's excellent long-term performance record. The Board noted that, unlike many other funds in its peer group, the Fund is managed by the Adviser with an emphasis on
33
Eaton Vance Tax-Managed Growth Fund 1.0
BOARD OF TRUSTEES' ANNUAL APPROVAL OF THE INVESTMENT ADVISORY AGREEMENT CONT'D
growth-oriented stocks, while value-oriented stocks have generally outperformed growth-oriented stocks in recent years. These differences have adversely affected the Fund's performance in recent years, relative to its peers. The Board concluded that the Fund's performance is satisfactory.
Management Fees and Expenses
The Board reviewed contractual investment advisory fee rates payable by the Portfolio and the Fund (referred to as "management fees"). As part of its review, the Board considered the management fees and the Fund's total expense ratio for the one-year period ended September 30, 2005, as compared to a group of similarly managed funds selected by an independent data provider.
After reviewing the foregoing information, and in light of the nature, extent and quality of the services provided by the Adviser, the Board concluded that the management fees charged for advisory and related services and the Fund's total expense ratio are reasonable.
Profitability
The Board reviewed the level of profits realized by the Adviser and relevant affiliates thereof in providing investment advisory and administrative services to the Portfolio, the Fund and to all Eaton Vance Funds as a group. The Board considered the level of profits realized without regard to revenue sharing or other payments by the Adviser and its affiliates to third parties in respect of distribution services. The Board also considered other direct or indirect benefits received by the Adviser and its affiliates in connection with its relationship with the Portfolio and the Fund, including the benefits of research services that may be available to the Adviser as a result of securities transactions effected for the Portfolio and other advisory clients.
The Board concluded that, in light of the foregoing factors and the nature, extent and quality of the services rendered, the profits realized by the Adviser and its affiliates are reasonable.
Economies of Scale
In reviewing management fees and profitability, the Board also considered the extent to which the Adviser and its affiliates, on the one hand, and the Fund, on the other hand, can expect to realize benefits from economies of scale as the assets of the Fund and the Portfolio increase. The Board acknowledged the difficulty in accurately measuring the benefits resulting from the economies of scale with respect to the management of any specific fund or group of funds. The Board reviewed data summarizing the increases and decreases in the assets of the Fund and of all Eaton Vance Funds as a group over various time periods, and evaluated the extent to which the total expense ratio of the Fund and the profitability of the Adviser and its affiliates may have been affected by such increases or decreases. The Board noted that, at its request, the Adviser had agreed to add a breakpoint with respect to assets that exceed $20 billion. Based upon the foregoing, the Board concluded that the benefits from economies of scale are currently being shared equitably by the Adviser and its affiliates and the Fund. The Board also concluded that, assuming reasonably foreseeable increases in the assets of the Portfolio, the structure of the advisory fee, which includes breakpoints at several asset levels, can be expected to cause the Adviser and its affiliates and the Fund to continue to share such benefits equitably.
34
Eaton Vance Tax-Managed Growth Fund 1.0
MANAGEMENT AND ORGANIZATION
Fund Management. The Trustees of Eaton Vance Series Trust (the Trust) and Tax-Managed Growth Portfolio (the Portfolio) are responsible for the overall management and supervision of the Trust's and Portfolio's affairs. The Trustees and officers of the Trust and the Portfolio are listed below. Except as indicated, each individual has held the office shown or other offices in the same company for the last five years. Trustees and officers of the Trust and the Portfolio hold indefinite terms of office. The "noninterested Trustees" consist of those Trustees who are not "interested persons" of the Trust and the Portfolio, as that term is defined under the 1940 Act. The business address of each Trustee and officer is The Eaton Vance Building, 255 State Street, Boston, Massachusetts 02109. As used below, "EVC" refers to Eaton Vance Corp., "EV" refers to Eaton Vance, Inc., "EVM" refers to Eaton Vance Management, "BMR" refers to Boston Management and Research and "EVD" refers to Eaton Vance Distributors, Inc. EVC and EV are the corporate parent and trustee, respectively, of EVM and BMR. EVD is the Fund's principal underwriter, the Portfolio's placement agent and a wholly-owned subsidiary of EVM. Each officer affiliated with Eaton Vance may hold a position with other Eaton Vance affiliates that is comparable to his or her position with EVM listed below.
Name and
Date of Birth | | Position(s)
with the
Trust and
the Portfolio | | Term of
Office and
Length of
Service | | Principal Occupation(s)
During Past Five Years | | Number of Portfolios
in Fund Complex
Overseen By
Trustee(1) | | Other Directorships Held | |
| Interested Trustee | | | | | | | | | | | | | |
|
| James B. Hawkes 11/9/41 | | Trustee | | Since 1997 | | Chairman and Chief Executive Officer of EVC, BMR, EVM and EV; Director of EV; Vice President and Director of EVD. Trustee and/or officer of 170 registered investment companies in the Eaton Vance Fund Complex. Mr. Hawkes is an interested person because of his positions with BMR, EVM, EVC and EV, which are affiliates of the Trust and Portfolio. | | | 170 | | | Director of EVC | |
|
| Noninterested Trustee(s) | | | | | | | | | | | | | |
|
| Benjamin C. Esty 1/2/63 | | Trustee | | Since 2005 | | Roy and Elizabeth Simmons Professor of Business Administration, Harvard University Graduate School of Business Administration (since 2003). Formerly, Associate Professor, Harvard University Graduate School of Business Administration (2000-2003). | | | 170 | | | None | |
|
| Samuel L. Hayes, III 2/23/35 | | Trustee and Chairman of the Board | | Trustee of the Trust since 1996; of the Portfolio since 1995 and Chairman of the Board since 2005 | | Jacob H. Schiff Professor of Investment Banking Emeritus, Harvard University Graduate School of Business Administration. Director of Yakima Products, Inc. (manufacturer of automotive accessories) (since 2001) and Director of Telect, Inc. (telecommunications services company). | | | 170 | | | Director of Tiffany & Co. (specialty retailer) | |
|
| William H. Park 9/19/47 | | Trustee | | Since 2003 | | Vice Chairman, Commercial Industrial Finance Corp. (specialty finance company) (since 2006). Formerly, President and Chief Executive Officer, Prizm Capital Management, LLC (investment management firm) (2002-2005). Formerly, Executive Vice President and Chief Financial Officer, United Asset Management Corporation (a holding company owning institutional investment management firms) (1982-2001). | | | 170 | | | None | |
|
| Ronald A. Pearlman 7/10/40 | | Trustee | | Since 2003 | | Professor of Law, Georgetown University Law Center. | | | 170 | | | None | |
|
| Norton H. Reamer 9/21/35 | | Trustee | | Trustee of the Trust since 1996 and of the Portfolio since 1995 | | President, Chief Executive Officer and a Director of Asset Management Finance Corp. (a specialty finance company serving the investment management industry) (since October 2003). President, Unicorn Corporation (an investment and financial advisory services company) (since September 2000). Formerly, Chairman and Chief Operating Officer, Hellman, Jordan Management Co., Inc. (an investment management company) (2000-2003). Formerly, Advisory Director of Berkshire Capital Corporation (investment banking firm) (2002-2003). | | | 170 | | | None | |
|
35
Eaton Vance Tax-Managed Growth Fund 1.0
MANAGEMENT AND ORGANIZATION CONT'D
Name and
Date of Birth | | Position(s)
with the
Trust and
the Portfolio | | Term of
Office and
Length of
Service | | Principal Occupation(s)
During Past Five Years | | Number of Portfolios
in Fund Complex
Overseen By
Trustee(1) | | Other Directorships Held | |
| Noninterested Trustee(s) (continued) | | | | | | | | | | | |
|
| Lynn A. Stout 9/14/57 | | Trustee | | Since 2003 | | Professor of Law, University of California at Los Angeles School of Law. | | | 170 | | | None | |
|
| Ralph F. Verni 1/26/43 | | Trustee | | Since 2005 | | Consultant and private investor. | | | 170 | | | None | |
|
| Principal Officers who are not Trustees | | | | | | | |
|
Name and
Date of Birth | | Position(s)
with the
Trust and
the Portfolio | | Term of
Office and
Length of
Service | | Principal Occupation(s)
During Past Five Years | |
| Thomas E. Faust Jr. 5/31/58 | | Vice President | | Vice President of the Trust since 1998 and the Portfolio since 2002 | | President of EVC, EVM, BMR and EV and Director of EVC. Chief Investment Officer of EVC, EVM and BMR. Officer of 71 registered investment companies and 5 private investment companies managed by EVM or BMR. | |
|
| Lewis R. Piantedosi 8/10/65 | | Vice President of the Portfolio | | Since 2006 | | Vice President of EVM and BMR. Officer of 5 registered investment companies managed by EVM or BMR. | |
|
| Duncan W. Richardson 10/26/57 | | President | | Since 2002(2) | | Executive Vice President and Chief Equity Investment Officer of EVC, EVM and BMR. Officer of 71 registered investment companies managed by EVM or BMR. | |
|
| Alan R. Dynner 10/10/40 | | Secretary | | Since 1997 | | Vice President, Secretary and Chief Legal Officer of BMR, EVM, EVD, EV and EVC. Officer of 170 registered investment companies managed by EVM or BMR. | |
|
| Michelle A. Green 8/25/69 | | Treasurer | | Since 2002(2) | | Vice President of EVM and BMR. Officer of 63 registered investment companies managed by EVM or BMR. | |
|
| Paul M. O'Neil 7/11/53 | | Chief Compliance Officer | | Since 2004 | | Vice President of EVM and BMR. Officer of 170 registered investment companies managed by EVM or BMR. | |
|
(1) Includes both master and feeder funds in a master-feeder structure.
(2) Prior to 2002, Ms. Green served as Assistant Treasurer of the Trust and Portfolio since 1998 and Mr. Richardson served as Vice President of the Portfolio since 1995.
The SAI for the Fund includes additional information about the Trustees and officers of the Fund and the Portfolio and can be obtained without charge on Eaton Vance's website at www.eatonvance.com or by calling 1-800-225-6265.
36
Investment Adviser of Tax-Managed Growth Portfolio
Boston Management and Research
The Eaton Vance Building
255 State Street
Boston, MA 02109
Administrator of Eaton Vance Tax-Managed Growth Fund 1.0
Eaton Vance Management
The Eaton Vance Building
255 State Street
Boston, MA 02109
Principal Underwriter
Eaton Vance Distributors, Inc.
The Eaton Vance Building
255 State Street
Boston, MA 02109
(617) 482-8260
Custodian
Investors Bank & Trust Company
200 Clarendon Street
Boston, MA 02116
Transfer Agent
PFPC Inc.
Attn: Eaton Vance Funds
P.O. Box 9653
Providence, RI 02940-9653
(800) 262-1122
Independent Registered Public Accounting Firm
Deloitte & Touche LLP
200 Berkeley Street
Boston, MA 02116-5022
Eaton Vance Tax-Managed Growth Fund 1.0
The Eaton Vance Building
255 State Street
Boston, MA 02109
157-2/07 TGSRC
Item 2. Code of Ethics
The registrant has adopted a code of ethics applicable to its Principal Executive Officer, Principal Financial Officer and Principal Accounting Officer. The registrant undertakes to provide a copy of such code of ethics to any person upon request, without charge, by calling 1-800-262-1122.
Item 3. Audit Committee Financial Expert
The registrant’s Board has designated William H. Park, Samuel L. Hayes, III and Norton H. Reamer, each an independent trustee, as its audit committee financial experts. Mr. Park is a certified public
accountant who is the Vice Chairman of Commercial Industrial Finance Corp (specialty finance company). Previously, he served as President and Chief Executive Officer of Prizm Capital Management, LLC (investment management firm) and as Executive Vice President and Chief Financial Officer of United Asset Management Corporation (“UAM”) (a holding company owning institutional investment management firms). Mr. Hayes is the Jacob H. Schiff Professor of Investment Banking Emeritus of the Harvard University Graduate School of Business Administration. Mr. Reamer is the President, Chief Executive Officer and a Director of Asset Management Finance Corp. (a specialty finance company serving the investment management industry) and is President of Unicorn Corporation (an investment and financial advisory services company). Formerly, Mr. Reamer was Chairman and Chief Operating Officer of Hellman, Jordan Management Co., Inc. (an investment management company) and Advisory Director of Berkshire Capital Corporation (an investment banking firm), Chairman of the Board of UAM and Chairman, President and Director of the UAM Funds (mutual funds).
Item 4. Principal Accountant Fees and Services
(a)-(d)
The following table presents aggregate fees billed to the registrant for the fiscal years ended December 31, 2005, and December 31, 2006 by the registrant’s principal accountant for professional services rendered for the audit of the registrant’s annual financial statements and fees billed for other services rendered by the principal accountant during those periods.
Eaton Vance Tax-Managed Growth Fund 1.0
Fiscal Years Ended | | 12/31/05 | | 12/31/06 | |
| | | | | |
Audit Fees | | $ | 10,705 | | $ | 11,130 | |
| | | | | |
Audit-Related Fees(1) | | $ | 0 | | $ | 0 | |
| | | | | |
Tax Fees(2) | | $ | 5,565 | | $ | 5,775 | |
| | | | | |
All Other Fees(3) | | $ | 0 | | $ | 0 | |
| | | | | |
Total | | $ | 16,270 | | $ | 16,905 | |
(1) Audit-related fees consist of the aggregate fees billed for assurance and related services that are reasonably related to the performance of the audit of the registrant’s financial statements and are not reported under the category of audit fees.
(2) Tax fees consist of the aggregate fees billed for professional services rendered by the principal accountant relating to tax compliance, tax advice, and tax planning and specifically include fees for tax return preparation.
(3) All other fees consist of the aggregate fees billed for products and services provided by the registrant’s principal accountant other than audit, audit-related, and tax services.
During each of the fiscal years ended December 31, 2005 and December 31, 2006, $35,000 was billed by D&T, the principal accountant to the Fund for work done in connection with its Rule 17Ad-13 examination of Eaton Vance Management’s assertion that it has maintained an effective internal control structure over sub-transfer agent and registrar functions, such services being pre-approved in accordance with Rule 2-01(c)(7)(ii) of Regulation S-X.
(e)(1) The registrant’s audit committee has adopted policies and procedures relating to the pre-approval of services provided by the registrant’s principal accountant (the “Pre-Approval Policies”). The Pre-Approval Policies establish a framework intended to assist the audit committee in the proper discharge of its pre-approval responsibilities. As a general matter, the Pre-Approval Policies (i) specify certain types of audit, audit-related, tax, and other services determined to be pre-approved by the audit committee; and (ii) delineate specific procedures governing the mechanics of the pre-approval process, including the approval and monitoring of audit and non-audit service fees. Unless a service is specifically pre-approved under the Pre-Approval Policies, it must be separately pre-approved by the audit committee.
The Pre-Approval Policies and the types of audit and non-audit services pre-approved therein must be reviewed and ratified by the registrant’s audit committee at least annually. The registrant’s audit committee maintains full responsibility for the appointment, compensation, and oversight of the work of the registrant’s principal accountant.
(e)(2) No services described in paragraphs (b)-(d) above were approved by the registrant’s audit committee pursuant to the “de minimis exception” set forth in Rule 2-01 (c)(7)(i)(C) of Regulation S-X.
(f) Not applicable.
(g) The following table presents (i) the aggregate non-audit fees (i.e., fees for audit-related, tax, and other services) billed to the registrant by the registrant’s principal accountant for the last two fiscal years of the registrant; and (ii) the aggregate non-audit fees (i.e., fees for audit-related, tax, and other services) billed to the Eaton Vance organization by the registrant’s principal accountant for the last two fiscal years of the registrant.
Fiscal Years Ended | | 12/31/05 | | 12/31/06 | |
| | | | | |
Registrant | | $ | 5,565 | | $ | 5,775 | |
| | | | | |
Eaton Vance (1) | | $ | 179,500 | | $ | 69,600 | |
(1) The investment adviser to the registrant, as well as any of its affiliates that provide ongoing services to the registrant, are subsidiaries of Eaton Vance Corp.
(h) The registrant’s audit committee has considered whether the provision by the registrant’s principal accountant of non-audit services to the registrant’s investment adviser and any entity controlling, controlled by, or under common control with the adviser that provides ongoing services to the registrant that were not pre-approved pursuant to Rule 2-01(c)(7)(ii) of Regulation S-X is compatible with maintaining the principal accountant’s independence.
Item 5. Audit Committee of Listed registrants
Not required in this filing.
Item 6. Schedule of Investments
Please see schedule of investments contained in the Report to Stockholders included under Item 1 of this Form N-CSR.
Item 7. Disclosure of Proxy Voting Policies and Procedures for Closed-End Management Investment Companies
Not required in this filing.
Item 8. Portfolio Managers of Closed-End Management Investment Companies
Not required in this filing.
Item 9. Purchase of Equity Securities by Closed-End Management Investment Company and Affiliated Purchases.
Not required in this filing.
Item 10. Submission of Matters to a Vote of Security Holders.
No Material Changes.
Item 11. Controls and Procedures
(a) It is the conclusion of the registrant’s principal executive officer and principal financial officer that the effectiveness of the registrant’s current disclosure controls and procedures (such disclosure controls and procedures having been evaluated within 90 days of the date of this filing) provide reasonable assurance that the information required to be disclosed by the registrant has been recorded, processed, summarized and reported within the time period specified in the Commission’s rules and forms and that the information required to be disclosed by the registrant has been accumulated and communicated to the registrant’s principal executive officer and principal financial officer in order to allow timely decisions regarding required disclosure.
(b) There have been no changes in the registrant’s internal controls over financial reporting during the second fiscal quarter of the period covered by this report that has materially affected, or is reasonably likely to materially affect the registrant’s internal control over financial reporting.
Item 12. Exhibits
(a)(1) | | Registrant’s Code of Ethics – Not applicable (please see Item 2). |
(a)(2)(i) | | Treasurer’s Section 302 certification. |
(a)(2)(ii) | | President’s Section 302 certification. |
(b) | | Combined Section 906 certification. |
Signatures
Pursuant to the requirements of the Securities Exchange Act of 1934 and the Investment Company Act of 1940, the registrant has duly caused this report to be signed on its behalf by the undersigned, thereunto duly authorized.
Eaton Vance Series Trust |
|
|
By: | | /s/ Duncan W. Richardson | |
| | Duncan W. Richardson |
| | President |
| | |
| | |
Date: | | February 20, 2007 |
Pursuant to the requirements of the Securities Exchange Act of 1934 and the Investment Company Act of 1940, this report has been signed below by the following persons on behalf of the registrant and in the capacities and on the dates indicated.
By: | | /s/ Michelle A. Green | |
| | Michelle A. Green |
| | Treasurer |
| | |
| | |
Date: | | February 20, 2007 |
By: | | /s/ Duncan W. Richardson | |
| | Duncan W. Richardson |
| | President |
| | |
| | |
Date: | | February 20, 2007 |