UNITED STATES
SECURITIES AND EXCHANGE COMMISSION
Washington, D.C. 20549
Form N-CSR
CERTIFIED SHAREHOLDER REPORT OF REGISTERED
MANAGEMENT INVESTMENT COMPANIES
Investment Company Act File Number: 811-02589
Eaton Vance Series Trust
(Exact Name of Registrant as Specified in Charter)
Two International Place, Boston, Massachusetts 02110
(Address of Principal Executive Offices)
Maureen A. Gemma
Two International Place, Boston, Massachusetts 02110
(Name and Address of Agent for Services)
(617) 482-8260
(Registrant’s Telephone Number)
December 31
Date of Fiscal Year End
December 31, 2020
Date of Reporting Period
| Item 1. | Reports to Stockholders |

Eaton Vance
Tax-Managed Growth Fund 1.0
Annual Report
December 31, 2020

Commodity Futures Trading Commission Registration. The Commodity Futures Trading Commission (“CFTC”) has adopted regulations that subject registered investment companies and advisers to regulation by the CFTC if a fund invests more than a prescribed level of its assets in certain CFTC-regulated instruments (including futures, certain options and swap agreements) or markets itself as providing investment exposure to such instruments. The investment adviser has claimed an exclusion from the definition of “commodity pool operator” under the Commodity Exchange Act with respect to its management of the Fund. Accordingly, neither the Fund nor the adviser with respect to the operation of the Fund is subject to CFTC regulation. Because of its management of other strategies, the Fund’s adviser is registered with the CFTC as a commodity pool operator. The adviser is also registered as a commodity trading advisor.
Fund shares are not insured by the FDIC and are not deposits or other obligations of, or guaranteed by, any depository institution. Shares are subject to investment risks, including possible loss of principal invested.
Annual Report December 31, 2020
Eaton Vance
Tax-Managed Growth Fund 1.0
Eaton Vance
Tax-Managed Growth Fund 1.0
December 31, 2020
Management’s Discussion of Fund Performance1
Economic and Market Conditions
The 12-month period that began January 1, 2020, included some of the best and worst U.S. equity performances in over a decade.
As the period opened, news of a novel coronavirus outbreak in China began to raise investor concerns. As the virus turned into a global pandemic in February and March, it ended the longest-ever U.S. economic expansion and triggered a global economic slowdown. Economic activity declined dramatically and equity markets plunged in value amid unprecedented volatility.
In response, the U.S. Federal Reserve (the Fed) announced two emergency rate cuts in March 2020 — lowering the federal funds rate to 0.00%-0.25% — along with other measures designed to shore up equity and credit markets. At its July meeting, the Fed provided additional reassurances that it would use all the tools at its disposal to support the U.S. economy.
These actions helped calm markets and initiated a new equity rally that began in April and lasted through most of the summer. As consumers started to emerge from coronavirus lockdowns and factories gradually resumed production, stock prices reflected investor optimism. In the second quarter of 2020, U.S. stocks reported their best quarterly returns since 1998 — on the heels of the worst first quarter for American stocks since the 2007-2008 global financial crisis.
In September 2020, however, the equity rally stalled, as stock prices on Wall Street began to reflect the reality on Main Street, where coronavirus cases were on the rise in nearly every state. In September and October 2020, most U.S. stock indexes reported negative returns, reflecting concerns about the economic outlook for fall and winter, uncertainties related to the presidential election, and the failure of Congress to pass additional financial relief for struggling businesses and workers facing unemployment.
In the final two months of the period, however, stocks reversed course again. Joe Biden’s victory in the November presidential election eased political uncertainties that had dogged investment markets through much of the fall. Additionally, the announcement that two COVID-19 vaccine candidates had proven more than 90% effective in late-stage trials boosted investor optimism that powered a new stock market rally. Unlike the largely tech-centered rally of the previous spring and summer, this rally was more broad-based, with strong participation by value and growth stocks across the market cap range. As both vaccines were approved for emergency use and vaccinations began in December 2020, an eventual end to the pandemic seemed to be in sight and the equity rally continued.
For the period as a whole, positive equity returns belied the dramatic volatility during the period, but demonstrated the dominance of technology stocks. The S&P 500® Index, a broad measure of U.S. stocks, returned 18.40%; the blue-chip Dow Jones Industrial Average® returned 9.72%; and the technology-laden Nasdaq Composite Index returned 44.92%. Small-cap U.S. stocks, as measured by the Russell 2000® Index, kept pace with their large-cap counterparts, as measured
by the S&P 500® Index and Russell 1000® Index. As a group, growth stocks significantly outpaced value stocks, as measured by the Russell growth and value indexes.
Fund Performance
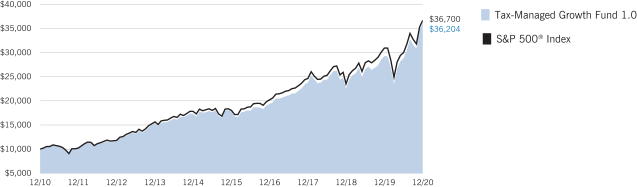
For the 12-month period ended December 31, 2020, Eaton Vance Tax-Managed Growth Fund 1.0 (the Fund) returned 23.49% at net asset value (NAV), outperforming its benchmark, the S&P 500® Index (the Index), which returned 18.40%.
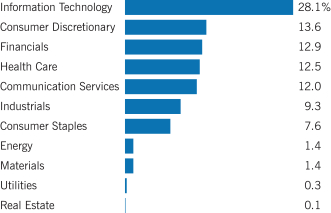
Stock selections in the information technology (IT) and communication services sectors contributed to Fund performance versus the Index during the period. An underweight position relative to the Index in the energy sector — where stock prices were battered by a steep decline in demand and commodity prices during the COVID-19 pandemic — helped performance versus the Index as well.
Within IT, the Fund’s out-of-Index position in DocuSign, Inc. (DocuSign), a cloud-based provider of electronic signature technology for digital documents, contributed to relative returns. DocuSign’s stock performed strongly as demand for the firm’s digital workflow solutions increased during the pandemic, due to offices closing and employees switching to working remotely.
Elsewhere in IT, the Fund’s overweight position in QUALCOMM, Inc. (Qualcomm), which produces and licenses chip technology for mobile devices, rose in value as companies introduced 5G cellphones using Qualcomm technology. The favorable resolution of an antitrust suit before the Federal Communications Commission was an additional tailwind for Qualcomm’s stock price during the period.
In communication services, underweighting AT&T, Inc. (AT&T) also helped performance relative to the Index. The telecom giant’s stock price declined during the period due to competitive pressures in its wireless business. Rising expenses for the rollout of premium video streaming services and its new 5G network weighed on AT&T’s stock price as well.
In contrast, the Fund’s overweight position in the financials sector, and stock selections and an underweight position in the materials sector detracted from performance versus the Index. In financials, the Fund’s overweight positions in Wells Fargo & Co. (Wells Fargo) and JPMorgan Chase & Co. declined in value and detracted from performance relative to the Index. Like many other banking firms during the period, both companies were negatively affected by falling interest rates, which lowered profits on lending, and by concerns about worsening corporate and consumer credit trends. In addition, Wells Fargo’s new management team struggled to turn the business around after legal issues surfaced under its previous leadership.
Not owning Index component Freeport-McMoRan, Inc. (Freeport- McMoRan), a copper and gold mining firm in the materials sector, hurt relative performance as well. As the ongoing global shift from internal combustion to electric vehicles accelerated during the period, Freeport-McMoRan’s stock price benefited from increased demand for copper, a key material in electric vehicle batteries.
See Endnotes and Additional Disclosures in this report.
Past performance is no guarantee of future results. Returns are historical and are calculated by determining the percentage change in net asset value (NAV) or offering price (as applicable) with all distributions reinvested. Investment return and principal value will fluctuate so that shares, when redeemed, may be worth more or less than their original cost. Performance for periods less than or equal to one year is cumulative. Performance is for the stated time period only; due to market volatility, current Fund performance may be lower or higher than the quoted return. For performance as of the most recent month-end, please refer to eatonvance.com.
Eaton Vance
Tax-Managed Growth Fund 1.0
December 31, 2020
|
|
Performance2,3 |
| Portfolio Managers Lewis R. Piantedosi, Michael A. Allison, CFA and Yana S. Barton, CFA |
| | | | | | | | | | | | | | | | | | | | |
| % Average Annual Total Returns | | Inception Date | | | Performance
Inception Date | | | One Year | | | Five Years | | | Ten Years | |
| | | | | |
Fund at NAV | | | 03/29/1966 | | | | 03/29/1966 | | | | 23.49 | % | | | 15.27 | % | | | 13.72 | % |
|
| |
| | | | | |
S&P 500® Index | | | — | | | | — | | | | 18.40 | % | | | 15.20 | % | | | 13.87 | % |
| | | | | |
| % After-Tax Returns | | Inception Date | | | Performance
Inception Date | | | One Year | | | Five Years | | | Ten Years | |
| | | | | |
After Taxes on Distributions | | | 03/29/1966 | | | | 03/29/1966 | | | | 23.21 | % | | | 14.95 | % | | | 13.39 | % |
After Taxes on Distributions and Sale of Fund Shares | | | — | | | | — | | | | 14.10 | | | | 12.70 | | | | 11.79 | |
Growth of $10,000
This graph shows the change in value of a hypothetical investment of $10,000 in Tax-Managed Growth Fund 1.0 for the period indicated. For comparison, the same investment is shown in the indicated index.
See Endnotes and Additional Disclosures in this report.
Past performance is no guarantee of future results. Returns are historical and are calculated by determining the percentage change in net asset value (NAV) or offering price (as applicable) with all distributions reinvested. Investment return and principal value will fluctuate so that shares, when redeemed, may be worth more or less than their original cost. Performance for periods less than or equal to one year is cumulative. Performance is for the stated time period only; due to market volatility, current Fund performance may be lower or higher than the quoted return. For performance as of the most recent month-end, please refer to eatonvance.com.
Eaton Vance
Tax-Managed Growth Fund 1.0
December 31, 2020
Fund Profile4
Sector Allocation (% of net assets)5
Top 10 Holdings (% of net assets)5
| | | | |
| |
Amazon.com, Inc. | | | 4.7 | % |
| |
Apple, Inc. | | | 4.5 | |
| |
Microsoft Corp. | | | 3.4 | |
| |
Facebook, Inc., Class A | | | 3.3 | |
| |
Alphabet, Inc., Class C | | | 2.5 | |
| |
QUALCOMM, Inc. | | | 2.2 | |
| |
Alphabet, Inc., Class A | | | 2.0 | |
| |
Walt Disney Co. (The) | | | 2.0 | |
| |
JPMorgan Chase & Co. | | | 1.8 | |
| |
Berkshire Hathaway, Inc., Class B | | | 1.6 | |
| |
Total | | | 28.0 | % |
See Endnotes and Additional Disclosures in this report.
Eaton Vance
Tax-Managed Growth Fund 1.0
December 31, 2020
Endnotes and Additional Disclosures
| 1 | The views expressed in this report are those of the portfolio manager(s) and are current only through the date stated at the top of this page. These views are subject to change at any time based upon market or other conditions, and Eaton Vance and the Fund(s) disclaim any responsibility to update such views. These views may not be relied upon as investment advice and, because investment decisions are based on many factors, may not be relied upon as an indication of trading intent on behalf of any Eaton Vance fund. This commentary may contain statements that are not historical facts, referred to as “forward looking statements.” The Fund’s actual future results may differ significantly from those stated in any forward looking statement, depending on factors such as changes in securities or financial markets or general economic conditions, the volume of sales and purchases of Fund shares, the continuation of investment advisory, administrative and service contracts, and other risks discussed from time to time in the Fund’s filings with the Securities and Exchange Commission. |
| 2 | S&P 500® Index is an unmanaged index of large-cap stocks commonly used as a measure of U.S. stock market performance. S&P Dow Jones Indices are a product of S&P Dow Jones Indices LLC (“S&P DJI”) and have been licensed for use. S&P® and S&P 500® are registered trademarks of S&P DJI; Dow Jones® is a registered trademark of Dow Jones Trademark Holdings LLC (“Dow Jones”); S&P DJI, Dow Jones and their respective affiliates do not sponsor, endorse, sell or promote the Fund, will not have any liability with respect thereto and do not have any liability for any errors, omissions, or interruptions of the S&P Dow Jones Indices. Unless otherwise stated, index returns do not reflect the effect of any applicable sales charges, commissions, expenses, taxes or leverage, as applicable. It is not possible to invest directly in an index. |
| 3 | Returns are historical and are calculated by determining the percentage change in net asset value (NAV) with all distributions reinvested. Unless otherwise stated, performance does not reflect the deduction of taxes on Fund distributions or redemptions of Fund shares. Performance since inception for an index, if presented, is the performance since the Fund’s or oldest share class’ inception, as applicable. After-tax returns are calculated using certain assumptions, including using the highest individual federal income tax rates in effect at the time of the distributions and do not reflect the impact of state/local taxes. Actual after-tax returns depend on a shareholder’s tax situation and the actual characterization of distributions and may differ from those shown. After-tax returns are not relevant to shareholders who hold shares in tax-deferred accounts or shares held by nontaxable entities. Return After Taxes on Distributions may be the same as Return Before Taxes for the same period because no taxable distributions were made during that period. Return After Taxes on Distributions and Sale of Fund Shares may be greater than or equal to Return After Taxes on Distributions for the same period because of losses realized on the sale of Fund shares. The Fund’s after-tax returns also may reflect foreign tax credits passed by the Fund to its shareholders |
| 4 | Fund invests in an affiliated investment company (Portfolio) with the same objective(s) and policies as the Fund. References to investments are to the Portfolio’s holdings |
| 5 | Excludes cash and cash equivalents. |
Fund profile subject to change due to active management.
Additional Information
Dow Jones Industrial Average® is a price-weighted average of 30 blue-chip stocks that are generally the leaders in their industry. Nasdaq Composite Index is a market capitalization-weighted index of all domestic and international securities listed on Nasdaq. Source: Nasdaq, Inc. The information is provided by Nasdaq (with its affiliates, are referred to as the “Corporations”) and Nasdaq’s third party licensors on an “as is” basis and the Corporations make no guarantees and bear no liability of any kind with respect to the information or the Fund. Russell 2000® Index is an unmanaged index of 2,000 U.S. small-cap stocks. Russell 1000® Index is an unmanaged index of 1,000 U.S. large-cap stocks.
Important Notice to Shareholders
The Fund typically meets redemptions of Fund shares by distributing portfolio securities equal in value to the Fund shares being redeemed. The selection of each security to be distributed in a redemption is in the sole discretion of the Fund’s investment adviser. Settlement of redemptions ordinarily will occur within five business days of the processing of a redemption, provided that all requested delivery information has been provided by the redeeming shareholder. Redeeming shareholders will be exposed to the risk of fluctuations in the value of the securities distributed by the Fund upon redemptions until the securities are received and/or sold by the shareholder. If portfolio securities distributed to meet a redemption are sold by the redeeming shareholder, the shareholder will incur brokerage commissions or other transaction costs. Shareholders should consult with their financial intermediary in connection with a redemption request. Questions concerning redemptions may be directed to Eaton Vance Investor Services at 1-866-910-2425.
Eaton Vance
Tax-Managed Growth Fund 1.0
December 31, 2020
Fund Expenses
Example: As a Fund shareholder, you incur two types of costs: (1) transaction costs, including sales charges (loads) on purchases and redemption fees (if applicable); and (2) ongoing costs, including management fees; distribution and/or service fees; and other Fund expenses. This Example is intended to help you understand your ongoing costs (in dollars) of Fund investing and to compare these costs with the ongoing costs of investing in other mutual funds. The Example is based on an investment of $1,000 invested at the beginning of the period and held for the entire period (July 1, 2020 – December 31, 2020).
Actual Expenses: The first section of the table below provides information about actual account values and actual expenses. You may use the information in this section, together with the amount you invested, to estimate the expenses that you paid over the period. Simply divide your account value by $1,000 (for example, an $8,600 account value divided by $1,000 = 8.6), then multiply the result by the number in the first section under the heading entitled “Expenses Paid During Period” to estimate the expenses you paid on your account during this period.
Hypothetical Example for Comparison Purposes: The second section of the table below provides information about hypothetical account values and hypothetical expenses based on the actual Fund expense ratio and an assumed rate of return of 5% per year (before expenses), which is not the actual Fund return. The hypothetical account values and expenses may not be used to estimate the actual ending account balance or expenses you paid for the period. You may use this information to compare the ongoing costs of investing in your Fund and other funds. To do so, compare this 5% hypothetical example with the 5% hypothetical examples that appear in the shareholder reports of the other funds.
Please note that the expenses shown in the table are meant to highlight your ongoing costs only and do not reflect any transactional costs, such as sales charges (loads) or redemption fees (if applicable). Therefore, the second section of the table is useful in comparing ongoing costs only, and will not help you determine the relative total costs of owning different funds. In addition, if these transactional costs were included, your costs would be higher.
| | | | | | | | | | | | | | | | |
| | | Beginning
Account Value
(7/1/20) | | | Ending
Account Value
(12/31/20) | | | Expenses Paid
During Period*
(7/1/20 – 12/31/20) | | | Annualized
Expense
Ratio | |
| | | |
Actual | | | | | | | | | | | | | |
| | $ | 1,000.00 | | | $ | 1,255.30 | | | $ | 2.61 | | | | 0.46 | % |
| | | | |
Hypothetical | | | | | | | | | | | | | |
(5% return per year before expenses) | | | | | | | | | | | | | |
| | $ | 1,000.00 | | | $ | 1,022.80 | | | $ | 2.34 | | | | 0.46 | % |
| * | Expenses are equal to the Fund’s annualized expense ratio, multiplied by the average account value over the period, multiplied by 184/366 (to reflect the one-half year period). The Example assumes that the $1,000 was invested at the net asset value per share determined at the close of business on June 30, 2020. The Example reflects the expenses of both the Fund and the Portfolio. |
Eaton Vance
Tax-Managed Growth Fund 1.0
December 31, 2020
Statement of Assets and Liabilities
| | | | |
| Assets | | December 31, 2020 | |
| |
Investment in Tax-Managed Growth Portfolio, at value (identified cost, $218,594,064) | | $ | 1,197,089,661 | |
| |
Total assets | | $ | 1,197,089,661 | |
|
| Liabilities | |
| |
Payable for Fund shares redeemed | | $ | 302,985 | |
| |
Payable to affiliates: | | | | |
| |
Trustees’ fees | | | 125 | |
| |
Accrued expenses | | | 99,437 | |
| |
Total liabilities | | $ | 402,547 | |
| |
Net Assets | | $ | 1,196,687,114 | |
|
| Sources of Net Assets | |
| |
Paid-in capital | | $ | 25,175,873 | |
| |
Distributable earnings | | | 1,171,511,241 | |
| |
Total | | $ | 1,196,687,114 | |
| |
| Net Asset Value and Redemption Price Per Share | | | | |
| |
($1,196,687,114 ÷ 710,973 shares of beneficial interest outstanding) | | $ | 1,683.17 | |
| | | | |
| | 7 | | See Notes to Financial Statements. |
Eaton Vance
Tax-Managed Growth Fund 1.0
December 31, 2020
Statement of Operations
| | | | |
| Investment Income | | Year Ended
December 31, 2020 | |
| |
Dividends allocated from Portfolio (net of foreign taxes, $142,513) | | $ | 15,527,061 | |
| |
Expenses allocated from Portfolio | | | (4,528,103 | ) |
| |
Total investment income from Portfolio | | $ | 10,998,958 | |
| |
| Expenses | | | | |
| |
Trustees’ fees and expenses | | $ | 500 | |
| |
Custodian fee | | | 63,730 | |
| |
Transfer and dividend disbursing agent fees | | | 67,565 | |
| |
Professional fees | | | 34,055 | |
| |
Printing and postage | | | 15,956 | |
| |
Miscellaneous | | | 18,439 | |
| |
Total expenses | | $ | 200,245 | |
| |
Net investment income | | $ | 10,798,713 | |
| |
| Realized and Unrealized Gain (Loss) from Portfolio | | | | |
| |
Net realized gain (loss) — | | | | |
| |
Investment transactions(1) | | $ | 26,115,987 | |
| |
Foreign currency transactions | | | (290 | ) |
| |
Net realized gain | | $ | 26,115,697 | |
| |
Change in unrealized appreciation (depreciation) — | | | | |
| |
Investments | | $ | 189,843,125 | |
| |
Foreign currency | | | 3,607 | |
| |
Net change in unrealized appreciation (depreciation) | | $ | 189,846,732 | |
| |
Net realized and unrealized gain | | $ | 215,962,429 | |
| |
Net increase in net assets from operations | | $ | 226,761,142 | |
| (1) | Includes $25,792,118 of net realized gains from redemptions in-kind. |
| | | | |
| | 8 | | See Notes to Financial Statements. |
Eaton Vance
Tax-Managed Growth Fund 1.0
December 31, 2020
Statements of Changes in Net Assets
| | | | | | | | |
| | | Year Ended December 31, | |
| Increase (Decrease) in Net Assets | | 2020 | | | 2019 | |
| | |
From operations — | | | | | | | | |
| | |
Net investment income | | $ | 10,798,713 | | | $ | 12,217,799 | |
| | |
Net realized gain | | | 26,115,697 | | | | 25,042,254 | |
| | |
Net change in unrealized appreciation (depreciation) | | | 189,846,732 | | | | 210,164,497 | |
| | |
Net increase in net assets from operations | | $ | 226,761,142 | | | $ | 247,424,550 | |
| | |
Distributions to shareholders | | $ | (10,770,512 | ) | | $ | (12,113,654 | ) |
| | |
Transactions in shares of beneficial interest — | | | | | | | | |
| | |
Net asset value of shares issued to shareholders in payment of distributions declared | | $ | 2,676,508 | | | $ | 2,858,046 | |
| | |
Cost of shares redeemed | | | (55,713,335 | ) | | | (65,880,246 | ) |
| | |
Net decrease in net assets from Fund share transactions | | $ | (53,036,827 | ) | | $ | (63,022,200 | ) |
| | |
Net increase in net assets | | $ | 162,953,803 | | | $ | 172,288,696 | |
|
| Net Assets | |
| | |
At beginning of year | | $ | 1,033,733,311 | | | $ | 861,444,615 | |
| | |
At end of year | | $ | 1,196,687,114 | | | $ | 1,033,733,311 | |
| | | | |
| | 9 | | See Notes to Financial Statements. |
Eaton Vance
Tax-Managed Growth Fund 1.0
December 31, 2020
Financial Highlights
| | | | | | | | | | | | | | | | | | | | |
| | | Year Ended December 31, | |
| | | 2020 | | | 2019 | | | 2018 | | | 2017 | | | 2016 | |
| | | | | |
Net asset value — Beginning of year | | $ | 1,378.390 | | | $ | 1,075.910 | | | $ | 1,146.130 | | | $ | 946.160 | | | $ | 880.890 | |
| | | | | |
| Income (Loss) From Operations | | | | | | | | | | | | | | | | | | | | |
| | | | | |
Net investment income(1) | | $ | 14.813 | | | $ | 15.815 | | | $ | 14.556 | | | $ | 13.613 | | | $ | 12.991 | |
| | | | | |
Net realized and unrealized gain (loss) | | | 304.817 | | | | 302.465 | | | | (70.176 | ) | | | 200.107 | | | | 65.579 | |
| | | | | |
Total income (loss) from operations | | $ | 319.630 | | | $ | 318.280 | | | $ | (55.620 | ) | | $ | 213.720 | | | $ | 78.570 | |
| | | | | |
| Less Distributions | | | | | | | | | | | | | | | | | | | | |
| | | | | |
From net investment income | | $ | (14.850 | ) | | $ | (15.800 | ) | | $ | (14.180 | ) | | $ | (13.750 | ) | | $ | (13.300 | ) |
| | | | | |
Tax return of capital | | | — | | | | — | | | | (0.420 | ) | | | — | | | | — | |
| | | | | |
Total distributions | | $ | (14.850 | ) | | $ | (15.800 | ) | | $ | (14.600 | ) | | $ | (13.750 | ) | | $ | (13.300 | ) |
| | | | | |
Net asset value — End of year | | $ | 1,683.170 | | | $ | 1,378.390 | | | $ | 1,075.910 | | | $ | 1,146.130 | | | $ | 946.160 | |
| | | | | |
Total Return(2) | | | 23.49 | % | | | 29.83 | % | | | (5.04 | )% | | | 22.73 | % | | | 9.00 | % |
| | | | | |
| Ratios/Supplemental Data | | | | | | | | | | | | | | | | | | | | |
| | | | | |
Net assets, end of year (000’s omitted) | | $ | 1,196,687 | | | $ | 1,033,733 | | | $ | 861,445 | | | $ | 983,065 | | | $ | 827,340 | |
| | | | | |
Ratios (as a percentage of average daily net assets):(3) | | | | | | | | | | | | | | | | | | | | |
| | | | | |
Expenses | | | 0.46 | % | | | 0.47 | % | | | 0.48 | % | | | 0.48 | % | | | 0.49 | % |
| | | | | |
Net investment income | | | 1.06 | % | | | 1.27 | % | | | 1.23 | % | | | 1.31 | % | | | 1.46 | % |
| | | | | |
Portfolio Turnover of the Portfolio(4) | | | 1 | % | | | 1 | % | | | 1 | % | | | 0 | %(5) | | | 1 | % |
| (1) | Computed using average shares outstanding. |
| (2) | Returns are historical and are calculated by determining the percentage change in net asset value with all distributions reinvested. |
| (3) | Includes the Fund’s share of the Portfolio’s allocated expenses. |
| (4) | Excludes the value of portfolio securities contributed or distributed as a result of in-kind shareholder transactions. The portfolio turnover of the Portfolio including in-kind contributions and distributions of securities was 6%, 6%, 6%, 5% and 6% for the years ended December 31, 2020, 2019, 2018, 2017 and 2016, respectively. |
| (5) | Amount is less than 0.5%. |
| | | | |
| | 10 | | See Notes to Financial Statements. |
Eaton Vance
Tax-Managed Growth Fund 1.0
December 31, 2020
Notes to Financial Statements
1 Significant Accounting Policies
Eaton Vance Tax-Managed Growth Fund 1.0 (the Fund) is a diversified series of the Eaton Vance Series Trust (the Trust). The Trust is a Massachusetts business trust registered under the Investment Company Act of 1940, as amended, as an open-end management investment company. The Fund invests all of its investable assets in interests in Tax-Managed Growth Portfolio (the Portfolio), a Massachusetts business trust, having the same investment objective and policies as the Fund. The value of the Fund’s investment in the Portfolio reflects the Fund’s proportionate interest in the net assets of the Portfolio (4.3% at December 31, 2020). The performance of the Fund is directly affected by the performance of the Portfolio. The financial statements of the Portfolio, including the portfolio of investments, are included elsewhere in this report and should be read in conjunction with the Fund’s financial statements.
The following is a summary of significant accounting policies of the Fund. The policies are in conformity with accounting principles generally accepted in the United States of America (U.S. GAAP). The Fund is an investment company and follows accounting and reporting guidance in the Financial Accounting Standards Board (FASB) Accounting Standards Codification Topic 946 “Financial Services — Investment Companies.”
A Investment Valuation — Valuation of securities by the Portfolio is discussed in Note 1A of the Portfolio’s Notes to Financial Statements, which are included elsewhere in this report.
B Income — The Fund’s net investment income or loss consists of the Fund’s pro-rata share of the net investment income or loss of the Portfolio, less all actual and accrued expenses of the Fund.
C Federal Taxes — The Fund’s policy is to comply with the provisions of the Internal Revenue Code applicable to regulated investment companies and to distribute to shareholders each year substantially all of its net investment income, and all or substantially all of its net realized capital gains. Accordingly, no provision for federal income or excise tax is necessary.
As of December 31, 2020, the Fund had no uncertain tax positions that would require financial statement recognition, de-recognition, or disclosure. The Fund files a U.S. federal income tax return annually after its fiscal year-end, which is subject to examination by the Internal Revenue Service for a period of three years from the date of filing.
D Expenses — The majority of expenses of the Trust are directly identifiable to an individual fund. Expenses which are not readily identifiable to a specific fund are allocated taking into consideration, among other things, the nature and type of expense and the relative size of the funds.
E Use of Estimates — The preparation of the financial statements in conformity with U.S. GAAP requires management to make estimates and assumptions that affect the reported amounts of assets and liabilities at the date of the financial statements and the reported amounts of income and expense during the reporting period. Actual results could differ from those estimates.
F Indemnifications — Under the Trust’s organizational documents, its officers and Trustees may be indemnified against certain liabilities and expenses arising out of the performance of their duties to the Fund. Under Massachusetts law, if certain conditions prevail, shareholders of a Massachusetts business trust (such as the Trust) could be deemed to have personal liability for the obligations of the Trust. However, the Trust’s Declaration of Trust contains an express disclaimer of liability on the part of Fund shareholders and the By-laws provide that the Trust shall assume, upon request by the shareholder, the defense on behalf of any Fund shareholders. Moreover, the By-laws also provide for indemnification out of Fund property of any shareholder held personally liable solely by reason of being or having been a shareholder for all loss or expense arising from such liability. Additionally, in the normal course of business, the Fund enters into agreements with service providers that may contain indemnification clauses. The Fund’s maximum exposure under these arrangements is unknown as this would involve future claims that may be made against the Fund that have not yet occurred.
G Other — Investment transactions are accounted for on a trade date basis.
2 Distributions to Shareholders and Income Tax Information
It is the present policy of the Fund to make quarterly distributions of all or substantially all of its net investment income and to distribute annually all or substantially all of its net realized capital gains (reduced by available capital loss carryforwards from prior years). Distributions to shareholders are recorded on the ex-dividend date. Shareholders may reinvest income and capital gain distributions in additional shares of the Fund at the net asset value as of the ex-dividend date or, at the election of the shareholder, receive distributions in cash. Distributions to shareholders are determined in accordance with income tax regulations, which may differ from U.S. GAAP. As required by U.S. GAAP, only distributions in excess of tax basis earnings and profits are reported in the financial statements as a return of capital. Permanent differences between book and tax accounting relating to distributions are reclassified to paid-in capital. For tax purposes, distributions from short-term capital gains are considered to be from ordinary income.
Eaton Vance
Tax-Managed Growth Fund 1.0
December 31, 2020
Notes to Financial Statements — continued
The tax character of distributions declared for the years ended December 31, 2020 and December 31, 2019 was as follows:
| | | | | | | | |
| | | Year Ended December 31, | |
| | | 2020 | | | 2019 | |
| | |
Ordinary income | | $ | 10,770,512 | | | $ | 12,113,654 | |
During the year ended December 31, 2020, distributable earnings was decreased by $50,937,344 and paid-in capital was increased by $50,937,344 due to the Fund’s use of equalization accounting and differences between book and tax accounting for the Fund’s investment in the Portfolio. Tax equalization accounting allows the Fund to treat as a distribution that portion of redemption proceeds representing a redeeming shareholder’s portion of undistributed taxable income and net capital gains. These reclassifications had no effect on the net assets or net asset value per share of the Fund.
As of December 31, 2020, the components of distributable earnings (accumulated loss) on a tax basis were as follows:
| | | | |
| | |
Undistributed ordinary income | | $ | 64,797 | |
| |
Deferred capital losses | | $ | (3,275,486 | ) |
| |
Net unrealized appreciation | | $ | 1,174,721,930 | |
At December 31, 2020, the Fund, for federal income tax purposes, had deferred capital losses of $3,275,486 which would reduce its taxable income arising from future net realized gains on investment transactions, if any, to the extent permitted by the Internal Revenue Code, and thus would reduce the amount of distributions to shareholders, which would otherwise be necessary to relieve the Fund of any liability for federal income or excise tax. The deferred capital losses are treated as arising on the first day of the Fund’s next taxable year and retain the same short-term or long-term character as when originally deferred. Of the deferred capital losses at December 31, 2020, $3,275,486 are short-term.
3 Transactions with Affiliates
Eaton Vance Management (EVM), a wholly-owned subsidiary of Eaton Vance Corp., serves as the administrator to the Fund, but receives no compensation. The Portfolio has engaged Boston Management and Research (BMR), a subsidiary of EVM, to render investment advisory services. See Note 2 of the Portfolio’s Notes to Financial Statements which are included elsewhere in this report.
EVM provides sub-transfer agency and related services to the Fund pursuant to a Sub-Transfer Agency Support Services Agreement. For the year ended December 31, 2020, EVM earned $12,154 from the Fund pursuant to such agreement, which is included in transfer and dividend disbursing agent fees on the Statement of Operations.
Trustees and officers of the Fund who are members of EVM’s or BMR’s organizations receive remuneration for their services to the Fund out of the investment adviser fee. Certain officers and Trustees of the Fund and the Portfolio are officers of the above organizations.
4 Investment Transactions
For the year ended December 31, 2020, increases and decreases in the Fund’s investment in the Portfolio aggregated $58,184 and $63,798,248, respectively. Decreases in the Fund’s investment in the Portfolio include distributions of securities as the result of redemptions in-kind with a value of $55,259,733.
5 Shares of Beneficial Interest
The Fund’s Declaration of Trust permits the Trustees to issue an unlimited number of full and fractional shares of beneficial interest (without par value). Transactions in Fund shares were as follows:
| | | | | | | | |
| | | Year Ended December 31, | |
| | | 2020 | | | 2019 | |
| | |
Issued to shareholders electing to receive payments of distributions in Fund shares | | | 1,957 | | | | 2,232 | |
| | |
Redemptions | | | (40,943 | ) | | | (52,937 | ) |
| | |
Net decrease | | | (38,986 | ) | | | (50,705 | ) |
Eaton Vance
Tax-Managed Growth Fund 1.0
December 31, 2020
Notes to Financial Statements — continued
6 Risks and Uncertainties
Pandemic Risk
An outbreak of respiratory disease caused by a novel coronavirus was first detected in China in December 2019 and subsequently spread internationally. This coronavirus has resulted in closing borders, enhanced health screenings, changes to healthcare service preparation and delivery, quarantines, cancellations, disruptions to supply chains and customer activity, as well as general concern and uncertainty. Health crises caused by outbreaks, such as the coronavirus outbreak, may exacerbate other pre-existing political, social and economic risks and disrupt normal market conditions and operations. The impact of this outbreak has negatively affected the worldwide economy, the economies of individual countries, individual companies, and the market in general, and may continue to do so in significant and unforeseen ways, as may other epidemics and pandemics that may arise in the future. Any such impact could adversely affect the Fund’s performance, or the performance of the securities in which the Fund invests.
7 Additional Information
On November 24, 2020, the Fund’s Board of Trustees approved an investment advisory agreement between EVM and the Fund pursuant to which fees will be based on average daily net assets per annum that are not invested in other investment companies for which the adviser or its affiliates (i) serves as adviser and (ii) receives an advisory fee. The investment advisory agreement was approved by Fund shareholders at a joint meeting of shareholders held on February 18, 2021, and would become effective upon the consummation of the acquisition of Eaton Vance Corp. by Morgan Stanley or on another date determined by an officer of the Fund.
Eaton Vance
Tax-Managed Growth Fund 1.0
December 31, 2020
Report of Independent Registered Public Accounting Firm
To the Trustees of Eaton Vance Series Trust and Shareholders of Eaton Vance Tax-Managed Growth Fund 1.0:
Opinion on the Financial Statements and Financial Highlights
We have audited the accompanying statement of assets and liabilities of Eaton Vance Tax-Managed Growth Fund 1.0 (the “Fund”) (one of the funds constituting Eaton Vance Series Trust), as of December 31, 2020, the related statement of operations for the year then ended, the statements of changes in net assets for each of the two years in the period then ended, the financial highlights for each of the five years in the period then ended, and the related notes. In our opinion, the financial statements and financial highlights present fairly, in all material respects, the financial position of the Fund as of December 31, 2020, and the results of its operations for the year then ended, the changes in its net assets for each of the two years in the period then ended, and the financial highlights for each of the five years in the period then ended in conformity with accounting principles generally accepted in the United States of America.
Basis for Opinion
These financial statements and financial highlights are the responsibility of the Fund’s management. Our responsibility is to express an opinion on the Fund’s financial statements and financial highlights based on our audits. We are a public accounting firm registered with the Public Company Accounting Oversight Board (United States) (PCAOB) and are required to be independent with respect to the Fund in accordance with the U.S. federal securities laws and the applicable rules and regulations of the Securities and Exchange Commission and the PCAOB.
We conducted our audits in accordance with the standards of the PCAOB. Those standards require that we plan and perform the audit to obtain reasonable assurance about whether the financial statements and financial highlights are free of material misstatement, whether due to error or fraud. The Fund is not required to have, nor were we engaged to perform, an audit of its internal control over financial reporting. As part of our audits we are required to obtain an understanding of internal control over financial reporting but not for the purpose of expressing an opinion on the effectiveness of the Fund’s internal control over financial reporting. Accordingly, we express no such opinion.
Our audits included performing procedures to assess the risks of material misstatement of the financial statements and financial highlights, whether due to error or fraud, and performing procedures that respond to those risks. Such procedures included examining, on a test basis, evidence regarding the amounts and disclosures in the financial statements and financial highlights. Our audits also included evaluating the accounting principles used and significant estimates made by management, as well as evaluating the overall presentation of the financial statements and financial highlights. We believe that our audits provide a reasonable basis for our opinion.
/s/ Deloitte & Touche LLP
Boston, Massachusetts
February 22, 2021
We have served as the auditor of one or more Eaton Vance investment companies since 1959.
Eaton Vance
Tax-Managed Growth Fund 1.0
December 31, 2020
Federal Tax Information (Unaudited)
The Form 1099-DIV you received in February 2021 will show the tax status of all distributions paid to your account in calendar year 2020. Shareholders are advised to consult their own tax adviser with respect to the tax consequences of their investment in the Fund. As required by the Internal Revenue Code and/or regulations, shareholders must be notified regarding the status of qualified dividend income for individuals and the dividends received deduction for corporations.
Qualified Dividend Income. For the fiscal year ended December 31, 2020, the Fund designates approximately $15,505,249, or up to the maximum amount of such dividends allowable pursuant to the Internal Revenue Code, as qualified dividend income eligible for the reduced tax rate of 15%.
Dividends Received Deduction. Corporate shareholders are generally entitled to take the dividends received deduction on the portion of the Fund’s dividend distribution that qualifies under tax law. For the Fund’s fiscal 2020 ordinary income dividends, 100% qualifies for the corporate dividends received deduction.
Tax-Managed Growth Portfolio
December 31, 2020
Portfolio of Investments
| | | | | | | | |
| Common Stocks — 99.2% | |
| Security | | Shares | | | Value | |
|
| Aerospace & Defense — 1.2% | |
| | |
Boeing Co. (The) | | | 882,743 | | | $ | 188,959,967 | |
| | |
General Dynamics Corp. | | | 141,321 | | | | 21,031,391 | |
| | |
Howmet Aerospace, Inc. | | | 4 | | | | 114 | |
| | |
Huntington Ingalls Industries, Inc. | | | 1,274 | | | | 217,192 | |
| | |
L3Harris Technologies, Inc. | | | 5,971 | | | | 1,128,638 | |
| | |
Lockheed Martin Corp. | | | 122,831 | | | | 43,602,548 | |
| | |
Northrop Grumman Corp. | | | 50,885 | | | | 15,505,678 | |
| | |
Northrop Grumman Corp.(1) | | | 2,913 | | | | 887,427 | |
| | |
Raytheon Technologies Corp. | | | 1,024,406 | | | | 73,255,273 | |
| | |
Textron, Inc. | | | 9,022 | | | | 436,033 | |
| | |
TransDigm Group, Inc. | | | 2,016 | | | | 1,247,602 | |
| | |
| | | | | | | $ | 346,271,863 | |
|
| Air Freight & Logistics — 1.6% | |
| | |
C.H. Robinson Worldwide, Inc. | | | 939,486 | | | $ | 88,189,551 | |
| | |
Expeditors International of Washington, Inc. | | | 12,800 | | | | 1,217,408 | |
| | |
FedEx Corp. | | | 345,061 | | | | 89,584,737 | |
| | |
United Parcel Service, Inc., Class B | | | 1,512,501 | | | | 254,705,168 | |
| | |
XPO Logistics, Inc.(2) | | | 57,458 | | | | 6,848,994 | |
| | |
| | | | | | | $ | 440,545,858 | |
|
| Airlines — 0.0%(3) | |
| | |
American Airlines Group, Inc. | | | 66,989 | | | $ | 1,056,417 | |
| | |
Delta Air Lines, Inc. | | | 60,606 | | | | 2,436,967 | |
| | |
Southwest Airlines Co. | | | 27,758 | | | | 1,293,800 | |
| | |
| | | | | | | $ | 4,787,184 | |
|
| Auto Components — 0.7% | |
| | |
Adient PLC(2) | | | 15,053 | | | $ | 523,393 | |
| | |
Aptiv PLC | | | 1,015,600 | | | | 132,322,524 | |
| | |
BorgWarner, Inc. | | | 800 | | | | 30,912 | |
| | |
Dorman Products, Inc.(2) | | | 20,730 | | | | 1,799,779 | |
| | |
Garrett Motion, Inc.(2) | | | 36,184 | | | | 160,295 | |
| | |
Gentex Corp. | | | 1,443,192 | | | | 48,967,504 | |
| | |
| | | | | | | $ | 183,804,407 | |
|
| Automobiles — 0.2% | |
| | |
Daimler AG | | | 38,000 | | | $ | 2,671,400 | |
| | |
Ford Motor Co. | | | 1,212,501 | | | | 10,657,884 | |
| | |
General Motors Co. | | | 82,498 | | | | 3,435,217 | |
| | |
Harley-Davidson, Inc. | | | 20,162 | | | | 739,945 | |
| | |
Tesla, Inc.(2) | | | 36,985 | | | | 26,099,205 | |
| | |
Toyota Motor Corp. ADR | | | 5,000 | | | | 772,850 | |
| | |
| | | | | | | $ | 44,376,501 | |
| | | | | | | | |
| Security | | Shares | | | Value | |
|
| Banks — 3.9% | |
| | |
Bank of America Corp. | | | 3,980,104 | | | $ | 120,636,952 | |
| | |
Bank of Hawaii Corp. | | | 557 | | | | 42,677 | |
| | |
Bank of Montreal | | | 4 | | | | 304 | |
| | |
CIT Group, Inc. | | | 1,490 | | | | 53,491 | |
| | |
Citigroup, Inc. | | | 860,832 | | | | 53,078,901 | |
| | |
Commerce Bancshares, Inc. | | | 69,629 | | | | 4,574,625 | |
| | |
CVB Financial Corp. | | | 608,432 | | | | 11,864,424 | |
| | |
Fifth Third Bancorp | | | 1,719,235 | | | | 47,399,309 | |
| | |
First Republic Bank | | | 1,652 | | | | 242,729 | |
| | |
HSBC Holdings PLC | | | 220,592 | | | | 1,145,184 | |
| | |
HSBC Holdings PLC ADR | | | 424 | | | | 10,986 | |
| | |
Huntington Bancshares, Inc. | | | 144,510 | | | | 1,825,161 | |
| | |
ING Groep NV ADR | | | 125 | | | | 1,180 | |
| | |
JPMorgan Chase & Co. | | | 4,052,886 | | | | 515,000,224 | |
| | |
KeyCorp | | | 112,574 | | | | 1,847,339 | |
| | |
M&T Bank Corp. | | | 151,517 | | | | 19,288,114 | |
| | |
Pinnacle Financial Partners, Inc. | | | 34,686 | | | | 2,233,779 | |
| | |
PNC Financial Services Group, Inc. (The) | | | 107,711 | | | | 16,048,939 | |
| | |
Regions Financial Corp. | | | 714,736 | | | | 11,521,544 | |
| | |
Signature Bank | | | 3,359 | | | | 454,439 | |
| | |
Societe Generale S.A.(2) | | | 405,793 | | | | 8,435,871 | |
| | |
Sterling Bancorp | | | 103,627 | | | | 1,863,214 | |
| | |
SVB Financial Group(2) | | | 29,245 | | | | 11,342,088 | |
| | |
Synovus Financial Corp. | | | 1,565 | | | | 50,659 | |
| | |
Toronto-Dominion Bank (The) | | | 569 | | | | 32,103 | |
| | |
Truist Financial Corp. | | | 1,713,775 | | | | 82,141,236 | |
| | |
U.S. Bancorp | | | 859,714 | | | | 40,054,075 | |
| | |
Wells Fargo & Co. | | | 4,123,713 | | | | 124,453,658 | |
| | |
Western Alliance Bancorp | | | 23,987 | | | | 1,438,021 | |
| | |
| | | | | | | $ | 1,077,081,226 | |
|
| Beverages — 2.1% | |
| | |
Anheuser-Busch InBev SA/NV ADR | | | 75,379 | | | $ | 5,269,746 | |
| | |
Boston Beer Co., Inc. (The), Class A(2) | | | 4,730 | | | | 4,702,992 | |
| | |
Brown-Forman Corp., Class A | | | 17,399 | | | | 1,278,304 | |
| | |
Brown-Forman Corp., Class B | | | 378,835 | | | | 30,090,864 | |
| | |
Coca-Cola Co. (The) | | | 3,506,980 | | | | 192,322,783 | |
| | |
Constellation Brands, Inc., Class A | | | 106,872 | | | | 23,410,312 | |
| | |
Diageo PLC ADR | | | 8,721 | | | | 1,384,982 | |
| | |
Keurig Dr Pepper, Inc. | | | 2,700 | | | | 86,400 | |
| | |
Molson Coors Beverage Co., Class B | | | 186,000 | | | | 8,405,340 | |
| | |
Monster Beverage Corp.(2) | | | 171,250 | | | | 15,837,200 | |
| | |
PepsiCo, Inc. | | | 2,056,881 | | | | 305,035,452 | |
| | |
| | | | | | | $ | 587,824,375 | |
| | | | |
| | 16 | | See Notes to Financial Statements. |
Tax-Managed Growth Portfolio
December 31, 2020
Portfolio of Investments — continued
| | | | | | | | |
| Security | | Shares | | | Value | |
|
| Biotechnology — 2.5% | |
| | |
AbbVie, Inc. | | | 818,966 | | | $ | 87,752,207 | |
| | |
Agios Pharmaceuticals, Inc.(2) | | | 74,972 | | | | 3,248,537 | |
| | |
Alexion Pharmaceuticals, Inc.(2) | | | 469,856 | | | | 73,410,301 | |
| | |
Alkermes PLC(2) | | | 5,000 | | | | 99,750 | |
| | |
Alnylam Pharmaceuticals, Inc.(2) | | | 117,352 | | | | 15,252,239 | |
| | |
Amgen, Inc. | | | 737,078 | | | | 169,468,974 | |
| | |
argenx SE ADR(2) | | | 308,910 | | | | 90,847,342 | |
| | |
Biogen, Inc.(2) | | | 100,682 | | | | 24,652,995 | |
| | |
Bluebird Bio, Inc.(2) | | | 500 | | | | 21,635 | |
| | |
Blueprint Medicines Corp.(2) | | | 255,000 | | | | 28,598,250 | |
| | |
Exact Sciences Corp.(2) | | | 181,454 | | | | 24,040,840 | |
| | |
Gilead Sciences, Inc. | | | 1,099,221 | | | | 64,040,615 | |
| | |
Incyte Corp.(2) | | | 103,220 | | | | 8,978,076 | |
| | |
Moderna, Inc.(2) | | | 4,723 | | | | 493,412 | |
| | |
Neurocrine Biosciences, Inc.(2) | | | 64,045 | | | | 6,138,713 | |
| | |
Regeneron Pharmaceuticals, Inc.(2) | | | 22,695 | | | | 10,964,181 | |
| | |
Seattle Genetics, Inc.(2) | | | 5,662 | | | | 991,643 | |
| | |
Vertex Pharmaceuticals, Inc.(2) | | | 346,315 | | | | 81,848,087 | |
| | |
| | | | | | | $ | 690,847,797 | |
|
| Building Products — 0.5% | |
| | |
A.O. Smith Corp. | | | 31,693 | | | $ | 1,737,410 | |
| | |
Carrier Global Corp. | | | 569,759 | | | | 21,491,309 | |
| | |
Fortune Brands Home & Security, Inc. | | | 2,923 | | | | 250,560 | |
| | |
Johnson Controls International PLC | | | 348,024 | | | | 16,214,438 | |
| | |
Lennox International, Inc. | | | 339,213 | | | | 92,934,186 | |
| | |
Masco Corp. | | | 38,156 | | | | 2,095,909 | |
| | |
Resideo Technologies, Inc.(2) | | | 14,542 | | | | 309,163 | |
| | |
Trane Technologies PLC | | | 26,539 | | | | 3,852,401 | |
| | |
| | | | | | | $ | 138,885,376 | |
|
| Capital Markets — 4.3% | |
| | |
Affiliated Managers Group, Inc. | | | 58,716 | | | $ | 5,971,417 | |
| | |
Ameriprise Financial, Inc. | | | 214,951 | | | | 41,771,428 | |
| | |
Bank of New York Mellon Corp. (The) | | | 709,152 | | | | 30,096,411 | |
| | |
BlackRock, Inc. | | | 41,065 | | | | 29,630,040 | |
| | |
Brookfield Asset Management, Inc., Class A | | | 192,123 | | | | 7,928,916 | |
| | |
Cboe Global Markets, Inc. | | | 175,414 | | | | 16,334,552 | |
| | |
Charles Schwab Corp. (The) | | | 3,911,424 | | | | 207,461,929 | |
| | |
CME Group, Inc. | | | 225,113 | | | | 40,981,822 | |
| | |
FactSet Research Systems, Inc. | | | 97,299 | | | | 32,351,918 | |
| | |
Federated Hermes, Inc., Class B | | | 549 | | | | 15,861 | |
| | |
Franklin Resources, Inc. | | | 211,191 | | | | 5,277,663 | |
| | |
Goldman Sachs Group, Inc. (The) | | | 1,011,714 | | | | 266,799,099 | |
| | |
Intercontinental Exchange, Inc. | | | 153,966 | | | | 17,750,740 | |
| | | | | | | | |
| Security | | Shares | | | Value | |
|
| Capital Markets (continued) | |
| | |
Invesco, Ltd. | | | 11,064 | | | $ | 192,846 | |
| | |
LPL Financial Holdings, Inc. | | | 209,488 | | | | 21,832,839 | |
| | |
Moody’s Corp. | | | 257,675 | | | | 74,787,592 | |
| | |
Morgan Stanley | | | 2,676,704 | | | | 183,434,525 | |
| | |
Morningstar, Inc. | | | 4,694 | | | | 1,086,990 | |
| | |
Nasdaq, Inc. | | | 71,203 | | | | 9,451,486 | |
| | |
Northern Trust Corp. | | | 2,500 | | | | 232,850 | |
| | |
Raymond James Financial, Inc. | | | 55,363 | | | | 5,296,578 | |
| | |
S&P Global, Inc. | | | 279,873 | | | | 92,002,651 | |
| | |
SEI Investments Co. | | | 150,000 | | | | 8,620,500 | |
| | |
State Street Corp. | | | 215,676 | | | | 15,696,899 | |
| | |
Stifel Financial Corp. | | | 169,194 | | | | 8,537,529 | |
| | |
T. Rowe Price Group, Inc. | | | 513,634 | | | | 77,759,051 | |
| | |
UBS Group AG(2) | | | 9 | | | | 127 | |
| | |
Waddell & Reed Financial, Inc., Class A | | | 9,248 | | | | 235,547 | |
| | |
| | | | | | | $ | 1,201,539,806 | |
|
| Chemicals — 1.1% | |
| | |
AdvanSix, Inc.(2) | | | 1,768 | | | $ | 35,342 | |
| | |
Air Products and Chemicals, Inc. | | | 13,331 | | | | 3,642,296 | |
| | |
Albemarle Corp. | | | 93,722 | | | | 13,825,870 | |
| | |
Balchem Corp. | | | 17,292 | | | | 1,992,384 | |
| | |
Celanese Corp. | | | 16,713 | | | | 2,171,687 | |
| | |
Chemours Co. (The) | | | 1 | | | | 25 | |
| | |
Corteva, Inc. | | | 242,479 | | | | 9,388,787 | |
| | |
Dow, Inc. | | | 80,280 | | | | 4,455,540 | |
| | |
DuPont de Nemours, Inc. | | | 498,374 | | | | 35,439,375 | |
| | |
Eastman Chemical Co. | | | 650 | | | | 65,182 | |
| | |
Ecolab, Inc. | | | 594,981 | | | | 128,730,089 | |
| | |
FMC Corp. | | | 817 | | | | 93,898 | |
| | |
International Flavors & Fragrances, Inc. | | | 5,000 | | | | 544,200 | |
| | |
Linde PLC | | | 8,469 | | | | 2,231,666 | |
| | |
Linde PLC(1) | | | 12,068 | | | | 3,178,528 | |
| | |
LyondellBasell Industries NV, Class A | | | 4,274 | | | | 391,755 | |
| | |
NewMarket Corp. | | | 13,626 | | | | 5,427,100 | |
| | |
PPG Industries, Inc. | | | 410,670 | | | | 59,226,827 | |
| | |
RPM International, Inc. | | | 3,433 | | | | 311,648 | |
| | |
Sherwin-Williams Co. (The) | | | 52,823 | | | | 38,820,151 | |
| | |
Westlake Chemical Corp. | | | 1,000 | | | | 81,600 | |
| | |
| | | | | | | $ | 310,053,950 | |
|
| Commercial Services & Supplies — 0.1% | |
| | |
Brady Corp., Class A | | | 258 | | | $ | 13,627 | |
| | |
Cintas Corp. | | | 395 | | | | 139,617 | |
| | |
Copart, Inc.(2) | | | 4,771 | | | | 607,110 | |
| | | | |
| | 17 | | See Notes to Financial Statements. |
Tax-Managed Growth Portfolio
December 31, 2020
Portfolio of Investments — continued
| | | | | | | | |
| Security | | Shares | | | Value | |
|
| Commercial Services & Supplies (continued) | |
| | |
Pitney Bowes, Inc. | | | 14,270 | | | $ | 87,903 | |
| | |
Republic Services, Inc. | | | 1,750 | | | | 168,525 | |
| | |
Rollins, Inc. | | | 60,814 | | | | 2,376,003 | |
| | |
Stericycle, Inc.(2) | | | 8,000 | | | | 554,640 | |
| | |
Waste Connections, Inc. | | | 115,655 | | | | 11,862,733 | |
| | |
Waste Management, Inc. | | | 208,149 | | | | 24,547,012 | |
| | |
| | | | | | | $ | 40,357,170 | |
|
| Communications Equipment — 1.5% | |
| | |
Arista Networks, Inc.(2) | | | 802,596 | | | $ | 233,210,320 | |
| | |
Arista Networks, Inc.(1)(2) | | | 88,600 | | | | 25,744,502 | |
| | |
Arista Networks, Inc.(1)(2) | | | 105,064 | | | | 30,510,129 | |
| | |
Cisco Systems, Inc. | | | 2,727,494 | | | | 122,055,356 | |
| | |
Juniper Networks, Inc. | | | 285,300 | | | | 6,422,103 | |
| | |
Motorola Solutions, Inc. | | | 47,514 | | | | 8,080,231 | |
| | |
Nokia Oyj ADR(2) | | | 192 | | | | 751 | |
| | |
| | | | | | | $ | 426,023,392 | |
|
| Construction & Engineering — 0.0%(3) | |
| | |
Fluor Corp. | | | 3,250 | | | $ | 51,903 | |
| | |
Jacobs Engineering Group, Inc. | | | 85,615 | | | | 9,328,610 | |
| | |
Quanta Services, Inc. | | | 2,000 | | | | 144,040 | |
| | |
| | | | | | | $ | 9,524,553 | |
|
| Construction Materials — 0.0%(3) | |
| | |
Vulcan Materials Co. | | | 57,559 | | | $ | 8,536,575 | |
| | |
| | | | | | | $ | 8,536,575 | |
|
| Consumer Finance — 1.1% | |
| | |
American Express Co. | | | 1,075,262 | | | $ | 130,009,928 | |
| | |
Capital One Financial Corp. | | | 133,434 | | | | 13,189,951 | |
| | |
Discover Financial Services | | | 1,253,950 | | | | 113,520,094 | |
| | |
LendingClub Corp.(2) | | | 15,938 | | | | 168,305 | |
| | |
Navient Corp. | | | 10,200 | | | | 100,164 | |
| | |
Synchrony Financial | | | 1,497,811 | | | | 51,989,020 | |
| | |
| | | | | | | $ | 308,977,462 | |
|
| Containers & Packaging — 0.1% | |
| | |
Amcor PLC | | | 936,184 | | | $ | 11,018,886 | |
| | |
AptarGroup, Inc. | | | 65,000 | | | | 8,897,850 | |
| | |
Avery Dennison Corp. | | | 5,508 | | | | 854,346 | |
| | |
Ball Corp. | | | 53,090 | | | | 4,946,926 | |
| | |
Crown Holdings, Inc.(2) | | | 13,787 | | | | 1,381,457 | |
| | |
International Paper Co. | | | 5,124 | | | | 254,765 | |
| | | | | | | | |
| Security | | Shares | | | Value | |
|
| Containers & Packaging (continued) | |
| | |
Packaging Corp. of America | | | 11,985 | | | $ | 1,652,851 | |
| | |
Sealed Air Corp. | | | 27,104 | | | | 1,241,092 | |
| | |
Sonoco Products Co. | | | 774 | | | | 45,860 | |
| | |
WestRock Co. | | | 42,750 | | | | 1,860,908 | |
| | |
| | | | | | | $ | 32,154,941 | |
|
| Distributors — 0.0%(3) | |
| | |
Genuine Parts Co. | | | 49,501 | | | $ | 4,971,386 | |
| | |
LKQ Corp.(2) | | | 79,518 | | | | 2,802,214 | |
| | |
| | | | | | | $ | 7,773,600 | |
|
| Diversified Consumer Services — 0.0%(3) | |
| | |
H&R Block, Inc. | | | 25,610 | | | $ | 406,175 | |
| | |
Service Corp. International | | | 15,900 | | | | 780,690 | |
| | |
| | | | | | | $ | 1,186,865 | |
|
| Diversified Financial Services — 2.3% | |
| | |
Berkshire Hathaway, Inc., Class A(2) | | | 546 | | | $ | 189,906,990 | |
| | |
Berkshire Hathaway, Inc., Class B(2) | | | 1,903,185 | | | | 441,291,506 | |
| | |
| | | | | | | $ | 631,198,496 | |
|
| Diversified Telecommunication Services — 0.3% | |
| | |
AT&T, Inc. | | | 557,960 | | | $ | 16,046,930 | |
| | |
CenturyLink, Inc. | | | 4,871 | | | | 47,492 | |
| | |
Frontier Communications Corp.(2) | | | 894 | | | | 80 | |
| | |
Liberty Global PLC, Class A(2) | | | 8,854 | | | | 214,444 | |
| | |
Liberty Global PLC, Class C(2) | | | 27,614 | | | | 653,071 | |
| | |
Liberty Latin America, Ltd., Class A(2) | | | 1,546 | | | | 17,207 | |
| | |
Liberty Latin America, Ltd., Class C(2) | | | 4,825 | | | | 53,509 | |
| | |
Verizon Communications, Inc. | | | 945,002 | | | | 55,518,868 | |
| | |
| | | | | | | $ | 72,551,601 | |
|
| Electric Utilities — 0.2% | |
| | |
Duke Energy Corp. | | | 31,500 | | | $ | 2,884,140 | |
| | |
Edison International | | | 1,134 | | | | 71,238 | |
| | |
Entergy Corp. | | | 2,340 | | | | 233,626 | |
| | |
Exelon Corp. | | | 28,310 | | | | 1,195,248 | |
| | |
NextEra Energy, Inc. | | | 688,108 | | | | 53,087,532 | |
| | |
NRG Energy, Inc. | | | 461 | | | | 17,311 | |
| | |
Southern Co. (The) | | | 103,526 | | | | 6,359,602 | |
| | |
| | | | | | | $ | 63,848,697 | |
|
| Electrical Equipment — 0.8% | |
| | |
Acuity Brands, Inc. | | | 9,321 | | | $ | 1,128,680 | |
| | | | |
| | 18 | | See Notes to Financial Statements. |
Tax-Managed Growth Portfolio
December 31, 2020
Portfolio of Investments — continued
| | | | | | | | |
| Security | | Shares | | | Value | |
|
| Electrical Equipment (continued) | |
| | |
AMETEK, Inc. | | | 68,343 | | | $ | 8,265,402 | |
| | |
Eaton Corp. PLC | | | 87,733 | | | | 10,540,243 | |
| | |
Emerson Electric Co. | | | 2,202,703 | | | | 177,031,240 | |
| | |
Hubbell, Inc. | | | 14,950 | | | | 2,344,010 | |
| | |
nVent Electric PLC | | | 4 | | | | 93 | |
| | |
Rockwell Automation, Inc. | | | 112,165 | | | | 28,132,104 | |
| | |
| | | | | | | $ | 227,441,772 | |
|
| Electronic Equipment, Instruments & Components — 0.4% | |
| | |
Amphenol Corp., Class A | | | 15,644 | | | $ | 2,045,766 | |
| | |
CDW Corp. | | | 142,695 | | | | 18,805,774 | |
| | |
Corning, Inc. | | | 1,555,689 | | | | 56,004,804 | |
| | |
FLIR Systems, Inc. | | | 2,030 | | | | 88,975 | |
| | |
Keysight Technologies, Inc.(2) | | | 15,146 | | | | 2,000,635 | |
| | |
Knowles Corp.(2) | | | 8,001 | | | | 147,458 | |
| | |
Littelfuse, Inc. | | | 52,675 | | | | 13,414,216 | |
| | |
TE Connectivity, Ltd. | | | 57,005 | | | | 6,901,595 | |
| | |
Trimble, Inc.(2) | | | 3,200 | | | | 213,664 | |
| | |
Vontier Corp.(2) | | | 3,985 | | | | 133,099 | |
| | |
Zebra Technologies Corp., Class A(2) | | | 50,772 | | | | 19,513,203 | |
| | |
| | | | | | | $ | 119,269,189 | |
|
| Energy Equipment & Services — 0.1% | |
| | |
ChampionX Corp. | | | 18,853 | | | $ | 288,451 | |
| | |
Core Laboratories NV | | | 16,652 | | | | 441,445 | |
| | |
Frank’s International NV(2) | | | 1,500,000 | | | | 4,110,000 | |
| | |
Halliburton Co. | | | 440,924 | | | | 8,333,464 | |
| | |
NOV, Inc. | | | 10,391 | | | | 142,668 | |
| | |
Schlumberger NV | | | 857,134 | | | | 18,711,235 | |
| | |
Transocean, Ltd.(2) | | | 3,548 | | | | 8,196 | |
| | |
| | | | | | | $ | 32,035,459 | |
|
| Entertainment — 2.6% | |
| | |
Activision Blizzard, Inc. | | | 241,143 | | | $ | 22,390,128 | |
| | |
Electronic Arts, Inc. | | | 140,557 | | | | 20,183,985 | |
| | |
Liberty Braves Group, Series A(2) | | | 1,236 | | | | 30,739 | |
| | |
Liberty Braves Group, Series C(2) | | | 2,473 | | | | 61,528 | |
| | |
Liberty Formula One Group, Series A(2) | | | 3,091 | | | | 117,427 | |
| | |
Liberty Formula One Group, Series C(2) | | | 6,183 | | | | 263,396 | |
| | |
Live Nation Entertainment, Inc.(2) | | | 20,744 | | | | 1,524,269 | |
| | |
Netflix, Inc.(2) | | | 204,934 | | | | 110,813,962 | |
| | |
Spotify Technology S.A.(2) | | | 79,019 | | | | 24,864,119 | |
| | |
Walt Disney Co. (The)(2) | | | 3,021,389 | | | | 547,415,259 | |
| | |
| | | | | | | $ | 727,664,812 | |
| | | | | | | | |
| Security | | Shares | | | Value | |
|
| Equity Real Estate Investment Trusts (REITs) — 0.1% | |
| | |
American Tower Corp. | | | 56,291 | | | $ | 12,635,078 | |
| | |
AvalonBay Communities, Inc. | | | 7,000 | | | | 1,123,010 | |
| | |
Extra Space Storage, Inc. | | | 1,800 | | | | 208,548 | |
| | |
Federal Realty Investment Trust | | | 1,300 | | | | 110,656 | |
| | |
Host Hotels & Resorts, Inc. | | | 528,986 | | | | 7,739,065 | |
| | |
ProLogis, Inc. | | | 28,120 | | | | 2,802,439 | |
| | |
Public Storage | | | 1,949 | | | | 450,082 | |
| | |
Simon Property Group, Inc. | | | 25,563 | | | | 2,180,013 | |
| | |
| | | | | | | $ | 27,248,891 | |
|
| Food & Staples Retailing — 1.6% | |
| | |
Costco Wholesale Corp. | | | 938,803 | | | $ | 353,722,194 | |
| | |
Kroger Co. (The) | | | 155,213 | | | | 4,929,565 | |
| | |
Sprouts Farmers Market, Inc.(2) | | | 750,036 | | | | 15,075,724 | |
| | |
Sysco Corp. | | | 635,859 | | | | 47,218,889 | |
| | |
Walgreens Boots Alliance, Inc. | | | 442,345 | | | | 17,640,719 | |
| | |
Walmart, Inc. | | | 15,881 | | | | 2,289,246 | |
| | |
| | | | | | | $ | 440,876,337 | |
|
| Food Products — 1.4% | |
| | |
Archer-Daniels-Midland Co. | | | 137,778 | | | $ | 6,945,389 | |
| | |
Campbell Soup Co. | | | 748,065 | | | | 36,168,943 | |
| | |
Conagra Brands, Inc. | | | 668,102 | | | | 24,225,379 | |
| | |
Flowers Foods, Inc. | | | 586,273 | | | | 13,267,358 | |
| | |
General Mills, Inc. | | | 135,948 | | | | 7,993,742 | |
| | |
Hain Celestial Group, Inc. (The)(2) | | | 17,240 | | | | 692,186 | |
| | |
Hershey Co. (The) | | | 389,366 | | | | 59,312,123 | |
| | |
Hormel Foods Corp. | | | 333,454 | | | | 15,542,291 | |
| | |
JM Smucker Co. (The) | | | 20,034 | | | | 2,315,930 | |
| | |
Kellogg Co. | | | 67,139 | | | | 4,178,060 | |
| | |
Kraft Heinz Co. (The) | | | 106,315 | | | | 3,684,878 | |
| | |
Lamb Weston Holdings, Inc. | | | 125,847 | | | | 9,909,193 | |
| | |
McCormick & Co., Inc., Non Voting Shares | | | 156,988 | | | | 15,008,053 | |
| | |
Mondelez International, Inc., Class A | | | 875,402 | | | | 51,184,755 | |
| | |
Nestle S.A. | | | 1,118,348 | | | | 132,201,333 | |
| | |
Tyson Foods, Inc., Class A | | | 27,528 | | | | 1,773,904 | |
| | |
| | | | | | | $ | 384,403,517 | |
|
| Health Care Equipment & Supplies — 3.2% | |
| | |
Abbott Laboratories | | | 1,993,135 | | | $ | 218,228,351 | |
| | |
ABIOMED, Inc.(2) | | | 88,267 | | | | 28,616,161 | |
| | |
Alcon, Inc.(2) | | | 22,924 | | | | 1,512,525 | |
| | |
Align Technology, Inc.(2) | | | 18,700 | | | | 9,992,906 | |
| | |
Avanos Medical, Inc.(2) | | | 542 | | | | 24,867 | |
| | |
Baxter International, Inc. | | | 37,745 | | | | 3,028,659 | |
| | | | |
| | 19 | | See Notes to Financial Statements. |
Tax-Managed Growth Portfolio
December 31, 2020
Portfolio of Investments — continued
| | | | | | | | |
| Security | | Shares | | | Value | |
|
| Health Care Equipment & Supplies (continued) | |
| | |
Becton, Dickinson and Co. | | | 90,691 | | | $ | 22,692,702 | |
| | |
Boston Scientific Corp.(2) | | | 444,159 | | | | 15,967,516 | |
| | |
Danaher Corp. | | | 171,936 | | | | 38,193,863 | |
| | |
DexCom, Inc.(2) | | | 95,592 | | | | 35,342,274 | |
| | |
DexCom, Inc.(1)(2) | | | 30,000 | | | | 11,087,441 | |
| | |
Edwards Lifesciences Corp.(2) | | | 31,284 | | | | 2,854,039 | |
| | |
Haemonetics Corp.(2) | | | 110,000 | | | | 13,062,500 | |
| | |
Hill-Rom Holdings, Inc. | | | 36,482 | | | | 3,574,142 | |
| | |
IDEXX Laboratories, Inc.(2) | | | 13,040 | | | | 6,518,305 | |
| | |
Insulet Corp.(2) | | | 9,898 | | | | 2,530,226 | |
| | |
Integra LifeSciences Holdings Corp.(2) | | | 1,011,345 | | | | 65,656,517 | |
| | |
Integra LifeSciences Holdings Corp.(1)(2) | | | 200,000 | | | | 12,976,210 | |
| | |
Integra LifeSciences Holdings Corp.(1)(2) | | | 200,000 | | | | 12,980,754 | |
| | |
Integra LifeSciences Holdings Corp.(1)(2) | | | 600,000 | | | | 38,952,000 | |
| | |
Intuitive Surgical, Inc.(2) | | | 173,309 | | | | 141,784,093 | |
| | |
Medtronic PLC | | | 543,055 | | | | 63,613,463 | |
| | |
Penumbra, Inc.(2) | | | 91,462 | | | | 16,005,850 | |
| | |
ResMed, Inc. | | | 21,305 | | | | 4,528,591 | |
| | |
Smith & Nephew PLC ADR | | | 5,500 | | | | 231,935 | |
| | |
Stryker Corp. | | | 305,404 | | | | 74,836,196 | |
| | |
Teleflex, Inc. | | | 14,325 | | | | 5,895,740 | |
| | |
Varian Medical Systems, Inc.(2) | | | 45,609 | | | | 7,982,031 | |
| | |
West Pharmaceutical Services, Inc. | | | 5,623 | | | | 1,593,052 | |
| | |
Zimmer Biomet Holdings, Inc. | | | 152,758 | | | | 23,538,480 | |
| | |
| | | | | | | $ | 883,801,389 | |
|
| Health Care Providers & Services — 1.9% | |
| | |
Acadia Healthcare Co., Inc.(2) | | | 32,000 | | | $ | 1,608,320 | |
| | |
Anthem, Inc. | | | 145,701 | | | | 46,783,134 | |
| | |
Cardinal Health, Inc. | | | 29,103 | | | | 1,558,757 | |
| | |
Centene Corp.(2) | | | 167,893 | | | | 10,078,617 | |
| | |
Cigna Corp. | | | 39,731 | | | | 8,271,200 | |
| | |
Cigna Corp.(1) | | | 7,416 | | | | 1,542,937 | |
| | |
Covetrus, Inc.(2) | | | 10,538 | | | | 302,862 | |
| | |
CVS Health Corp. | | | 1,187,193 | | | | 81,085,282 | |
| | |
DaVita, Inc.(2) | | | 157,055 | | | | 18,438,257 | |
| | |
Guardant Health, Inc.(2) | | | 83,152 | | | | 10,716,630 | |
| | |
HCA Healthcare, Inc. | | | 188,518 | | | | 31,003,670 | |
| | |
Henry Schein, Inc.(2) | | | 26,384 | | | | 1,764,034 | |
| | |
Humana, Inc. | | | 2,438 | | | | 1,000,238 | |
| | |
Laboratory Corp. of America Holdings(2) | | | 745 | | | | 151,645 | |
| | |
McKesson Corp. | | | 150,389 | | | | 26,155,655 | |
| | |
Molina Healthcare, Inc.(2) | | | 18,585 | | | | 3,952,658 | |
| | |
UnitedHealth Group, Inc. | | | 807,436 | | | | 283,151,656 | |
| | |
| | | | | | | $ | 527,565,552 | |
| | | | | | | | |
| Security | | Shares | | | Value | |
|
| Health Care Technology — 0.0%(3) | |
| | |
Cerner Corp. | | | 18,346 | | | $ | 1,439,794 | |
| | |
Teladoc Health, Inc.(2) | | | 26,210 | | | | 5,240,952 | |
| | |
| | | | | | | $ | 6,680,746 | |
|
| Hotels, Restaurants & Leisure — 3.4% | |
| | |
Aramark | | | 137,669 | | | $ | 5,297,503 | |
| | |
Carnival Corp. | | | 22,069 | | | | 478,014 | |
| | |
Chipotle Mexican Grill, Inc.(2) | | | 121,117 | | | | 167,954,155 | |
| | |
Choice Hotels International, Inc. | | | 49,631 | | | | 5,297,117 | |
| | |
Darden Restaurants, Inc. | | | 66,114 | | | | 7,875,500 | |
| | |
Domino’s Pizza, Inc. | | | 2,815 | | | | 1,079,440 | |
| | |
Hilton Worldwide Holdings, Inc. | | | 106,201 | | | | 11,815,923 | |
| | |
Hyatt Hotels Corp., Class A | | | 1,353,442 | | | | 100,493,068 | |
| | |
Marriott International, Inc., Class A | | | 1,575,495 | | | | 207,839,300 | |
| | |
McDonald’s Corp. | | | 104,208 | | | | 22,360,953 | |
| | |
MGM Resorts International | | | 892,202 | | | | 28,113,285 | |
| | |
Penn National Gaming, Inc.(2) | | | 30,956 | | | | 2,673,670 | |
| | |
Royal Caribbean Cruises, Ltd. | | | 1,900 | | | | 141,911 | |
| | |
Starbucks Corp. | | | 3,057,660 | | | | 327,108,467 | |
| | |
Texas Roadhouse, Inc. | | | 416,807 | | | | 32,577,635 | |
| | |
Yum China Holdings, Inc. | | | 367,698 | | | | 20,991,879 | |
| | |
Yum! Brands, Inc. | | | 123,810 | | | | 13,440,814 | |
| | |
| | | | | | | $ | 955,538,634 | |
|
| Household Durables — 0.1% | |
| | |
D.R. Horton, Inc. | | | 19,682 | | | $ | 1,356,483 | |
| | |
Leggett & Platt, Inc. | | | 92,079 | | | | 4,079,100 | |
| | |
Lennar Corp., Class A | | | 8,688 | | | | 662,286 | |
| | |
Lennar Corp., Class B | | | 21 | | | | 1,285 | |
| | |
Mohawk Industries, Inc.(2) | | | 4,820 | | | | 679,379 | |
| | |
Newell Brands, Inc. | | | 123,465 | | | | 2,621,162 | |
| | |
NVR, Inc.(2) | | | 1,822 | | | | 7,433,505 | |
| | |
PulteGroup, Inc. | | | 221,275 | | | | 9,541,378 | |
| | |
Tempur Sealy International, Inc.(2) | | | 540,100 | | | | 14,582,700 | |
| | |
Toll Brothers, Inc. | | | 4,378 | | | | 190,312 | |
| | |
Whirlpool Corp. | | | 1,391 | | | | 251,062 | |
| | |
| | | | | | | $ | 41,398,652 | |
|
| Household Products — 2.0% | |
| | |
Church & Dwight Co., Inc. | | | 172,129 | | | $ | 15,014,813 | |
| | |
Church & Dwight Co., Inc.(1) | | | 17,504 | | | | 1,525,958 | |
| | |
Clorox Co. (The) | | | 16,257 | | | | 3,282,613 | |
| | |
Colgate-Palmolive Co. | | | 2,420,348 | | | | 206,963,957 | |
| | |
Energizer Holdings, Inc. | | | 10,496 | | | | 442,721 | |
| | |
Kimberly-Clark Corp. | | | 85,688 | | | | 11,553,313 | |
| | | | |
| | 20 | | See Notes to Financial Statements. |
Tax-Managed Growth Portfolio
December 31, 2020
Portfolio of Investments — continued
| | | | | | | | |
| Security | | Shares | | | Value | |
|
| Household Products (continued) | |
| | |
Procter & Gamble Co. (The) | | | 2,284,091 | | | $ | 317,808,422 | |
| | |
| | | | | | | $ | 556,591,797 | |
|
| Independent Power and Renewable Electricity Producers — 0.0%(3) | |
| | |
AES Corp. (The) | | | 1,730 | | | $ | 40,655 | |
| | |
| | | | | | | $ | 40,655 | |
|
| Industrial Conglomerates — 1.0% | |
| | |
3M Co. | | | 745,315 | | | $ | 130,273,609 | |
| | |
Carlisle Cos., Inc. | | | 71,809 | | | | 11,215,130 | |
| | |
General Electric Co. | | | 5,271,443 | | | | 56,931,584 | |
| | |
Honeywell International, Inc. | | | 392,550 | | | | 83,495,385 | |
| | |
Roper Technologies, Inc. | | | 20,455 | | | | 8,817,946 | |
| | |
| | | | | | | $ | 290,733,654 | |
|
| Insurance — 1.4% | |
| | |
Aegon NV ADR | | | 5 | | | $ | 20 | |
| | |
Aflac, Inc. | | | 788,242 | | | | 35,053,122 | |
| | |
Alleghany Corp. | | | 3,985 | | | | 2,405,705 | |
| | |
Allstate Corp. (The) | | | 20,970 | | | | 2,305,232 | |
| | |
American International Group, Inc. | | | 160,299 | | | | 6,068,920 | |
| | |
Aon PLC, Class A | | | 157,281 | | | | 33,228,757 | |
| | |
Arch Capital Group, Ltd.(2) | | | 241,964 | | | | 8,727,641 | |
| | |
Arthur J. Gallagher & Co. | | | 509,591 | | | | 63,041,503 | |
| | |
Assurant, Inc. | | | 13,599 | | | | 1,852,456 | |
| | |
Brighthouse Financial, Inc.(2) | | | 936 | | | | 33,888 | |
| | |
Brown & Brown, Inc. | | | 407 | | | | 19,296 | |
| | |
Chubb, Ltd. | | | 44,707 | | | | 6,881,301 | |
| | |
Cincinnati Financial Corp. | | | 35,947 | | | | 3,140,689 | |
| | |
Fidelity National Financial, Inc. | | | 57,654 | | | | 2,253,695 | |
| | |
First American Financial Corp. | | | 1,227 | | | | 63,350 | |
| | |
Globe Life, Inc. | | | 348,792 | | | | 33,121,288 | |
| | |
Hartford Financial Services Group, Inc. | | | 83,487 | | | | 4,089,193 | |
| | |
Lincoln National Corp. | | | 5,477 | | | | 275,548 | |
| | |
Markel Corp.(2) | | | 19,895 | | | | 20,557,503 | |
| | |
Marsh & McLennan Cos., Inc. | | | 226,689 | | | | 26,522,613 | |
| | |
MetLife, Inc. | | | 18,211 | | | | 855,006 | |
| | |
Progressive Corp. (The) | | | 1,110,345 | | | | 109,790,914 | |
| | |
Prudential Financial, Inc. | | | 20,261 | | | | 1,581,776 | |
| | |
Reinsurance Group of America, Inc. | | | 6,425 | | | | 744,657 | |
| | |
Travelers Cos., Inc. (The) | | | 146,715 | | | | 20,594,385 | |
| | |
Trisura Group, Ltd.(2) | | | 124 | | | | 8,648 | |
| | |
W.R. Berkley Corp. | | | 2,250 | | | | 149,445 | |
| | |
Willis Towers Watson PLC | | | 70 | | | | 14,748 | |
| | |
| | | | | | | $ | 383,381,299 | |
| | | | | | | | |
| Security | | Shares | | | Value | |
|
| Interactive Media & Services — 8.8% | |
| | |
Alphabet, Inc., Class A(2) | | | 313,841 | | | $ | 550,050,290 | |
| | |
Alphabet, Inc., Class C(2) | | | 400,182 | | | | 701,070,842 | |
| | |
Baidu, Inc. ADR(2) | | | 72,500 | | | | 15,677,400 | |
| | |
CarGurus, Inc.(2) | | | 37,803 | | | | 1,199,489 | |
| | |
Cars.com, Inc.(2) | | | 400 | | | | 4,520 | |
| | |
Facebook, Inc., Class A(2) | | | 3,396,333 | | | | 927,742,322 | |
| | |
IAC/InterActiveCorp.(2) | | | 6,680 | | | | 1,264,858 | |
| | |
Match Group, Inc.(2) | | | 123,667 | | | | 18,697,215 | |
| | |
Match Group, Inc.(1)(2) | | | 260,261 | | | | 39,321,316 | |
| | |
Pinterest, Inc., Class A(2) | | | 2,540,426 | | | | 167,414,074 | |
| | |
Snap, Inc., Class A(2) | | | 19,362 | | | | 969,455 | |
| | |
Twitter, Inc.(2) | | | 550,134 | | | | 29,789,756 | |
| | |
Yelp, Inc.(2) | | | 149,508 | | | | 4,884,426 | |
| | |
| | | | | | | $ | 2,458,085,963 | |
|
| Internet & Direct Marketing Retail — 5.5% | |
| | |
Alibaba Group Holding, Ltd. ADR(2) | | | 287,257 | | | $ | 66,853,322 | |
| | |
Altaba, Inc.(4) | | | 114,070 | | | | 1,665,422 | |
| | |
Amazon.com, Inc.(2) | | | 405,828 | | | | 1,321,753,388 | |
| | |
Booking Holdings, Inc.(2) | | | 52,136 | | | | 116,120,949 | |
| | |
eBay, Inc. | | | 255,728 | | | | 12,850,332 | |
| | |
Expedia Group, Inc. | | | 2,670 | | | | 353,508 | |
| | |
Qurate Retail, Inc., Series A | | | 99,802 | | | | 1,094,828 | |
| | |
Trip.com Group, Ltd. ADR(2) | | | 5,200 | | | | 175,396 | |
| | |
Wayfair, Inc., Class A(2) | | | 51,793 | | | | 11,695,377 | |
| | |
| | | | | | | $ | 1,532,562,522 | |
|
| IT Services — 5.2% | |
| | |
Accenture PLC, Class A | | | 963,901 | | | $ | 251,780,580 | |
| | |
Akamai Technologies, Inc.(2) | | | 239,108 | | | | 25,103,949 | |
| | |
Alliance Data Systems Corp. | | | 686 | | | | 50,833 | |
| | |
Amdocs, Ltd. | | | 43,944 | | | | 3,116,948 | |
| | |
Automatic Data Processing, Inc. | | | 268,307 | | | | 47,275,693 | |
| | |
Booz Allen Hamilton Holding Corp., Class A | | | 43,691 | | | | 3,808,981 | |
| | |
Broadridge Financial Solutions, Inc. | | | 91,705 | | | | 14,049,206 | |
| | |
CACI International, Inc., Class A(2) | | | 13,584 | | | | 3,386,899 | |
| | |
Cognizant Technology Solutions Corp., Class A | | | 24,598 | | | | 2,015,806 | |
| | |
Fidelity National Information Services, Inc. | | | 18,757 | | | | 2,653,365 | |
| | |
Fiserv, Inc.(2) | | | 606,600 | | | | 69,067,476 | |
| | |
Global Payments, Inc. | | | 31,828 | | | | 6,856,388 | |
| | |
International Business Machines Corp. | | | 647,631 | | | | 81,523,790 | |
| | |
Jack Henry & Associates, Inc. | | | 2,196 | | | | 355,730 | |
| | |
Mastercard, Inc., Class A | | | 195,157 | | | | 69,659,340 | |
| | |
Okta, Inc.(2) | | | 319,829 | | | | 81,319,721 | |
| | |
Paychex, Inc. | | | 14,638 | | | | 1,363,969 | |
| | | | |
| | 21 | | See Notes to Financial Statements. |
Tax-Managed Growth Portfolio
December 31, 2020
Portfolio of Investments — continued
| | | | | | | | |
| Security | | Shares | | | Value | |
|
| IT Services (continued) | |
| | |
PayPal Holdings, Inc.(2) | | | 1,089,057 | | | $ | 255,057,149 | |
| | |
Sabre Corp. | | | 157,290 | | | | 1,890,626 | |
| | |
Shopify, Inc., Class A(2) | | | 12,524 | | | | 14,176,542 | |
| | |
Square, Inc., Class A(2) | | | 381,727 | | | | 83,079,064 | |
| | |
Twilio, Inc., Class A(2) | | | 531,036 | | | | 179,755,686 | |
| | |
VeriSign, Inc.(2) | | | 5,654 | | | | 1,223,526 | |
| | |
Visa, Inc., Class A | | | 1,189,221 | | | | 260,118,309 | |
| | |
Western Union Co. (The) | | | 27,606 | | | | 605,676 | |
| | |
| | | | | | | $ | 1,459,295,252 | |
|
| Leisure Products — 0.0%(3) | |
| | |
Hasbro, Inc. | | | 1,383 | | | $ | 129,366 | |
| | |
Mattel, Inc.(2) | | | 3,941 | | | | 68,770 | |
| | |
Polaris, Inc. | | | 52,104 | | | | 4,964,469 | |
| | |
| | | | | | | $ | 5,162,605 | |
|
| Life Sciences Tools & Services — 0.6% | |
| | |
10X Genomics, Inc., Class A(2) | | | 145,021 | | | $ | 20,534,974 | |
| | |
Agilent Technologies, Inc. | | | 665,215 | | | | 78,821,325 | |
| | |
Avantor, Inc.(2) | | | 120,000 | | | | 3,378,000 | |
| | |
Illumina, Inc.(2) | | | 86,595 | | | | 32,040,150 | |
| | |
IQVIA Holdings, Inc.(2) | | | 57,124 | | | | 10,234,907 | |
| | |
Mettler-Toledo International, Inc.(2) | | | 1,000 | | | | 1,139,680 | |
| | |
NeoGenomics, Inc.(2) | | | 38,329 | | | | 2,063,633 | |
| | |
PerkinElmer, Inc. | | | 9,625 | | | | 1,381,187 | |
| | |
Thermo Fisher Scientific, Inc. | | | 56,834 | | | | 26,472,141 | |
| | |
Waters Corp.(2) | | | 730 | | | | 180,617 | |
| | |
| | | | | | | $ | 176,246,614 | |
|
| Machinery — 1.7% | |
| | |
Caterpillar, Inc. | | | 356,595 | | | $ | 64,907,422 | |
| | |
Cummins, Inc. | | | 1,178 | | | | 267,524 | |
| | |
Deere & Co. | | | 195,453 | | | | 52,586,630 | |
| | |
Donaldson Co., Inc. | | | 142,204 | | | | 7,946,360 | |
| | |
Dover Corp. | | | 369,407 | | | | 46,637,634 | |
| | |
Fortive Corp. | | | 30,511 | | | | 2,160,789 | |
| | |
Illinois Tool Works, Inc. | | | 1,069,855 | | | | 218,122,037 | |
| | |
Ingersoll Rand, Inc.(2) | | | 23,418 | | | | 1,066,924 | |
| | |
Lincoln Electric Holdings, Inc. | | | 53,660 | | | | 6,237,975 | |
| | |
Manitowoc Co., Inc. (The)(2) | | | 11,435 | | | | 152,200 | |
| | |
Middleby Corp.(2) | | | 2,000 | | | | 257,840 | |
| | |
Otis Worldwide Corp. | | | 430,984 | | | | 29,112,969 | |
| | |
PACCAR, Inc. | | | 186,094 | | | | 16,056,190 | |
| | |
Parker-Hannifin Corp. | | | 19,172 | | | | 5,222,645 | |
| | |
Pentair PLC | | | 4 | | | | 212 | |
| | | | | | | | |
| Security | | Shares | | | Value | |
|
| Machinery (continued) | |
| | |
Snap-on, Inc. | | | 29,674 | | | $ | 5,078,408 | |
| | |
Stanley Black & Decker, Inc. | | | 288 | | | | 51,425 | |
| | |
Trinity Industries, Inc. | | | 11,100 | | | | 292,929 | |
| | |
Welbilt, Inc.(2) | | | 45,741 | | | | 603,781 | |
| | |
Westinghouse Air Brake Technologies Corp. | | | 14,082 | | | | 1,030,802 | |
| | |
Xylem, Inc. | | | 100,031 | | | | 10,182,156 | |
| | |
| | | | | | | $ | 467,974,852 | |
|
| Media — 0.3% | |
| | |
Comcast Corp., Class A | | | 1,193,814 | | | $ | 62,555,854 | |
| | |
Discovery, Inc., Class A(2) | | | 19,462 | | | | 585,612 | |
| | |
Discovery, Inc., Class C(2) | | | 207 | | | | 5,421 | |
| | |
Fox Corp., Class A | | | 5,412 | | | | 157,597 | |
| | |
Interpublic Group of Cos., Inc. (The) | | | 726 | | | | 17,075 | |
| | |
Liberty Broadband Corp., Series A(2) | | | 3,091 | | | | 487,080 | |
| | |
Liberty Broadband Corp., Series C(2) | | | 6,183 | | | | 979,202 | |
| | |
Liberty SiriusXM Group, Series A(2) | | | 12,367 | | | | 534,131 | |
| | |
Liberty SiriusXM Group, Series C(2) | | | 24,734 | | | | 1,076,176 | |
| | |
News Corp., Class A | | | 24 | | | | 431 | |
| | |
Omnicom Group, Inc. | | | 31,882 | | | | 1,988,480 | |
| | |
Sirius XM Holdings, Inc. | | | 53,280 | | | | 339,394 | |
| | |
TEGNA, Inc. | | | 1,201 | | | | 16,754 | |
| | |
ViacomCBS, Inc., Class B | | | 613,777 | | | | 22,869,331 | |
| | |
| | | | | | | $ | 91,612,538 | |
|
| Metals & Mining — 0.1% | |
| | |
Alcoa Corp.(2) | | | 5,862 | | | $ | 135,119 | |
| | |
Arconic Corp.(2) | | | 1 | | | | 30 | |
| | |
Cleveland-Cliffs, Inc. | | | 527,743 | | | | 7,683,938 | |
| | |
Freeport-McMoRan, Inc. | | | 85,788 | | | | 2,232,204 | |
| | |
Glencore PLC(2) | | | 598,405 | | | | 1,900,411 | |
| | |
Newmont Corp. | | | 103 | | | | 6,168 | |
| | |
Nucor Corp. | | | 236,089 | | | | 12,557,574 | |
| | |
Southern Copper Corp. | | | 12,126 | | | | 789,645 | |
| | |
Steel Dynamics, Inc. | | | 232,124 | | | | 8,558,412 | |
| | |
| | | | | | | $ | 33,863,501 | |
|
| Multi-Utilities — 0.1% | |
| | |
Consolidated Edison, Inc. | | | 53,943 | | | $ | 3,898,461 | |
| | |
Dominion Energy, Inc. | | | 13,510 | | | | 1,015,952 | |
| | |
DTE Energy Co. | | | 77,124 | | | | 9,363,625 | |
| | |
NiSource, Inc. | | | 828 | | | | 18,994 | |
| | |
Sempra Energy | | | 66,344 | | | | 8,452,889 | |
| | |
WEC Energy Group, Inc. | | | 15,006 | | | | 1,381,002 | |
| | |
| | | | | | | $ | 24,130,923 | |
| | | | |
| | 22 | | See Notes to Financial Statements. |
Tax-Managed Growth Portfolio
December 31, 2020
Portfolio of Investments — continued
| | | | | | | | |
| Security | | Shares | | | Value | |
|
| Multiline Retail — 0.1% | |
| | |
Dollar General Corp. | | | 329 | | | $ | 69,189 | |
| | |
Dollar Tree, Inc.(2) | | | 146,190 | | | | 15,794,368 | |
| | |
Nordstrom, Inc. | | | 3,192 | | | | 99,622 | |
| | |
Target Corp. | | | 36,389 | | | | 6,423,750 | |
| | |
| | | | | | | $ | 22,386,929 | |
|
| Oil, Gas & Consumable Fuels — 1.3% | |
| | |
Antero Resources Corp.(2) | | | 1,341,986 | | | $ | 7,313,824 | |
| | |
Cheniere Energy, Inc.(2) | | | 723,716 | | | | 43,444,672 | |
| | |
Chesapeake Energy Corp.(2) | | | 1 | | | | 2 | |
| | |
Chevron Corp. | | | 985,901 | | | | 83,259,339 | |
| | |
Concho Resources, Inc. | | | 40,000 | | | | 2,334,000 | |
| | |
ConocoPhillips | | | 306,529 | | | | 12,258,095 | |
| | |
Devon Energy Corp. | | | 143,600 | | | | 2,270,316 | |
| | |
EOG Resources, Inc. | | | 472,114 | | | | 23,544,325 | |
| | |
EQT Corp. | | | 180,474 | | | | 2,293,825 | |
| | |
Equitrans Midstream Corp. | | | 144,379 | | | | 1,160,807 | |
| | |
Exxon Mobil Corp. | | | 3,106,785 | | | | 128,061,678 | |
| | |
Hess Corp. | | | 364,574 | | | | 19,245,861 | |
| | |
HollyFrontier Corp. | | | 8,000 | | | | 206,800 | |
| | |
Kinder Morgan, Inc. | | | 112,401 | | | | 1,536,522 | |
| | |
Marathon Oil Corp. | | | 123,481 | | | | 823,618 | |
| | |
Marathon Petroleum Corp. | | | 192,770 | | | | 7,972,967 | |
| | |
Murphy Oil Corp. | | | 145,312 | | | | 1,758,275 | |
| | |
Occidental Petroleum Corp. | | | 22,811 | | | | 394,858 | |
| | |
Phillips 66 | | | 193,043 | | | | 13,501,427 | |
| | |
Pioneer Natural Resources Co. | | | 22,520 | | | | 2,564,803 | |
| | |
Range Resources Corp. | | | 664,831 | | | | 4,454,368 | |
| | |
Southwestern Energy Co.(2) | | | 486 | | | | 1,448 | |
| | |
Valero Energy Corp. | | | 14,523 | | | | 821,566 | |
| | |
Williams Cos., Inc. (The) | | | 20,025 | | | | 401,501 | |
| | |
WPX Energy, Inc.(2) | | | 666 | | | | 5,428 | |
| | |
| | | | | | | $ | 359,630,325 | |
|
| Personal Products — 0.1% | |
| | |
Estee Lauder Cos., Inc. (The), Class A | | | 45,277 | | | $ | 12,052,285 | |
| | |
Unilever PLC ADR | | | 69,397 | | | | 4,188,803 | |
| | |
| | | | | | | $ | 16,241,088 | |
|
| Pharmaceuticals — 4.3% | |
| | |
AstraZeneca PLC ADR | | | 217,956 | | | $ | 10,895,620 | |
| | |
Bristol-Myers Squibb Co. | | | 2,353,836 | | | | 146,008,447 | |
| | |
Catalent, Inc.(2) | | | 45,943 | | | | 4,781,288 | |
| | |
Eli Lilly & Co. | | | 2,259,171 | | | | 381,438,432 | |
| | |
GlaxoSmithKline PLC ADR | | | 1,968 | | | | 72,422 | |
| | | | | | | | |
| Security | | Shares | | | Value | |
|
| Pharmaceuticals (continued) | |
| | |
Johnson & Johnson | | | 2,549,760 | | | $ | 401,281,229 | |
| | |
Mallinckrodt PLC(2) | | | 6 | | | | 1 | |
| | |
Merck & Co., Inc. | | | 1,761,529 | | | | 144,093,072 | |
| | |
Novartis AG ADR | | | 126,232 | | | | 11,920,088 | |
| | |
Novo Nordisk A/S ADR | | | 262,532 | | | | 18,337,860 | |
| | |
Pfizer, Inc. | | | 2,330,428 | | | | 85,783,055 | |
| | |
Reata Pharmaceuticals, Inc., Class A(2) | | | 4,694 | | | | 580,272 | |
| | |
Roche Holding AG ADR | | | 35,808 | | | | 1,569,823 | |
| | |
Sanofi ADR | | | 5,100 | | | | 247,809 | |
| | |
Takeda Pharmaceutical Co., Ltd. ADR | | | 31,905 | | | | 580,671 | |
| | |
Teva Pharmaceutical Industries, Ltd. ADR(2) | | | 5,106 | | | | 49,273 | |
| | |
Viatris, Inc.(2) | | | 287,502 | | | | 5,387,788 | |
| | |
Zoetis, Inc. | | | 1,198 | | | | 198,269 | |
| | |
| | | | | | | $ | 1,213,225,419 | |
|
| Professional Services — 0.2% | |
| | |
ASGN, Inc.(2) | | | 228,139 | | | $ | 19,056,451 | |
| | |
ASGN, Inc.(1)(2) | | | 17,000 | | | | 1,420,010 | |
| | |
Equifax, Inc. | | | 8,854 | | | | 1,707,405 | |
| | |
Nielsen Holdings PLC | | | 61,834 | | | | 1,290,475 | |
| | |
Thomson Reuters Corp. | | | 121,293 | | | | 9,932,684 | |
| | |
Verisk Analytics, Inc. | | | 109,263 | | | | 22,681,906 | |
| | |
| | | | | | | $ | 56,088,931 | |
|
| Road & Rail — 1.8% | |
| | |
Canadian National Railway Co. | | | 526,084 | | | $ | 57,790,327 | |
| | |
Canadian Pacific Railway, Ltd. | | | 192 | | | | 66,565 | |
| | |
CSX Corp. | | | 692,012 | | | | 62,800,089 | |
| | |
J.B. Hunt Transport Services, Inc. | | | 10,000 | | | | 1,366,500 | |
| | |
Kansas City Southern | | | 7,899 | | | | 1,612,423 | |
| | |
Lyft, Inc., Class A(2) | | | 112,436 | | | | 5,523,981 | |
| | |
Norfolk Southern Corp. | | | 261,802 | | | | 62,206,773 | |
| | |
Uber Technologies, Inc.(2) | | | 3,699,519 | | | | 188,675,469 | |
| | |
Union Pacific Corp. | | | 563,096 | | | | 117,247,849 | |
| | |
| | | | | | | $ | 497,289,976 | |
|
| Semiconductors & Semiconductor Equipment — 6.5% | |
| | |
Advanced Micro Devices, Inc.(2) | | | 2,697 | | | $ | 247,342 | |
| | |
Analog Devices, Inc. | | | 640,405 | | | | 94,607,031 | |
| | |
Applied Materials, Inc. | | | 200,009 | | | | 17,260,777 | |
| | |
ASML Holding NV - NY Shares | | | 12,459 | | | | 6,076,503 | |
| | |
Broadcom, Inc. | | | 101,674 | | | | 44,517,961 | |
| | |
Broadcom, Inc.(1) | | | 14,025 | | | | 6,137,162 | |
| | |
Cirrus Logic, Inc.(2) | | | 50,000 | | | | 4,110,000 | |
| | |
Intel Corp. | | | 7,368,078 | | | | 367,077,646 | |
| | | | |
| | 23 | | See Notes to Financial Statements. |
Tax-Managed Growth Portfolio
December 31, 2020
Portfolio of Investments — continued
| | | | | | | | |
| Security | | Shares | | | Value | |
|
| Semiconductors & Semiconductor Equipment (continued) | |
| | |
KLA Corp. | | | 225 | | | $ | 58,255 | |
| | |
Lam Research Corp. | | | 78,330 | | | | 36,992,909 | |
| | |
Marvell Technology Group, Ltd. | | | 95,391 | | | | 4,534,888 | |
| | |
Microchip Technology, Inc. | | | 581,017 | | | | 80,244,258 | |
| | |
Micron Technology, Inc.(2) | | | 299,972 | | | | 22,551,895 | |
| | |
NVIDIA Corp. | | | 623,066 | | | | 325,365,065 | |
| | |
NXP Semiconductors NV | | | 13,187 | | | | 2,096,865 | |
| | |
Qorvo, Inc.(2) | | | 13,586 | | | | 2,258,944 | |
| | |
QUALCOMM, Inc. | | | 4,089,697 | | | | 623,024,441 | |
| | |
Silicon Laboratories, Inc.(2) | | | 40,103 | | | | 5,106,716 | |
| | |
Skyworks Solutions, Inc. | | | 1,000 | | | | 152,880 | |
| | |
Teradyne, Inc. | | | 1,200 | | | | 143,868 | |
| | |
Texas Instruments, Inc. | | | 1,076,699 | | | | 176,718,607 | |
| | |
Xilinx, Inc. | | | 84,881 | | | | 12,033,579 | |
| | |
| | | | | | | $ | 1,831,317,592 | |
|
| Software — 9.8% | |
| | |
Adobe, Inc.(2) | | | 404,740 | | | $ | 202,418,569 | |
| | |
ANSYS, Inc.(2) | | | 150,106 | | | | 54,608,563 | |
| | |
Autodesk, Inc.(2) | | | 27,729 | | | | 8,466,773 | |
| | |
Box, Inc., Class A(2) | | | 176,143 | | | | 3,179,381 | |
| | |
Cadence Design Systems, Inc.(2) | | | 698,571 | | | | 95,306,042 | |
| | |
CDK Global, Inc. | | | 3 | | | | 156 | |
| | |
Check Point Software Technologies, Ltd.(2) | | | 151,951 | | | | 20,195,807 | |
| | |
Citrix Systems, Inc. | | | 11,798 | | | | 1,534,920 | |
| | |
Coupa Software, Inc.(2) | | | 54,504 | | | | 18,471,951 | |
| | |
Crowdstrike Holdings, Inc., Class A(2) | | | 400,567 | | | | 84,848,102 | |
| | |
DocuSign, Inc.(2) | | | 1,158,429 | | | | 257,518,767 | |
| | |
Dropbox, Inc., Class A(2) | | | 2,287,688 | | | | 50,763,797 | |
| | |
Envestnet, Inc.(2) | | | 41,786 | | | | 3,438,570 | |
| | |
FireEye, Inc.(2) | | | 91,308 | | | | 2,105,562 | |
| | |
Fortinet, Inc.(2) | | | 22,529 | | | | 3,346,232 | |
| | |
Guidewire Software, Inc.(2) | | | 67,562 | | | | 8,697,256 | |
| | |
Intuit, Inc. | | | 99,232 | | | | 37,693,275 | |
| | |
Manhattan Associates, Inc.(2) | | | 63,065 | | | | 6,633,177 | |
| | |
Microsoft Corp. | | | 4,240,689 | | | | 943,214,047 | |
| | |
NortonLifeLock, Inc. | | | 121,379 | | | | 2,522,256 | |
| | |
Nutanix, Inc., Class A(2) | | | 18,402 | | | | 586,472 | |
| | |
Oracle Corp. | | | 374,251 | | | | 24,210,297 | |
| | |
Palantir Technologies, Inc., Class A(2) | | | 39,250 | | | | 924,338 | |
| | |
Palo Alto Networks, Inc.(2) | | | 295,522 | | | | 105,025,564 | |
| | |
Paycom Software, Inc.(2) | | | 551,349 | | | | 249,347,585 | |
| | |
Proofpoint, Inc.(2) | | | 60,744 | | | | 8,286,089 | |
| | |
RingCentral, Inc., Class A(2) | | | 9,657 | | | | 3,659,713 | |
| | |
RingCentral, Inc., Class A(1)(2) | | | 9,178 | | | | 3,478,187 | |
| | |
salesforce.com, inc.(2) | | | 278,629 | | | | 62,003,311 | |
| | | | | | | | |
| Security | | Shares | | | Value | |
|
| Software (continued) | |
| | |
SAP SE ADR | | | 2,796 | | | $ | 364,570 | |
| | |
ServiceNow, Inc.(2) | | | 222,793 | | | | 122,631,951 | |
| | |
Slack Technologies, Inc., Class A(2) | | | 2,202,005 | | | | 93,012,691 | |
| | |
Smartsheet, Inc., Class A(2) | | | 227,811 | | | | 15,785,024 | |
| | |
Splunk, Inc.(2) | | | 412,415 | | | | 70,065,184 | |
| | |
Synopsys, Inc.(2) | | | 34,865 | | | | 9,038,403 | |
| | |
Teradata Corp.(2) | | | 318 | | | | 7,145 | |
| | |
Tyler Technologies, Inc.(2) | | | 232,333 | | | | 101,418,001 | |
| | |
Workday, Inc., Class A(2) | | | 217,876 | | | | 52,205,268 | |
| | |
Zscaler, Inc.(2) | | | 35,000 | | | | 6,989,850 | |
| | |
| | | | | | | $ | 2,734,002,846 | |
|
| Specialty Retail — 2.0% | |
| | |
Advance Auto Parts, Inc. | | | 16,346 | | | $ | 2,574,658 | |
| | |
AutoNation, Inc.(2) | | | 18,322 | | | | 1,278,692 | |
| | |
AutoZone, Inc.(2) | | | 2,475 | | | | 2,933,964 | |
| | |
Bed Bath & Beyond, Inc. | | | 22,000 | | | | 390,720 | |
| | |
Best Buy Co., Inc. | | | 311,979 | | | | 31,132,384 | |
| | |
Burlington Stores, Inc.(2) | | | 20,079 | | | | 5,251,662 | |
| | |
CarMax, Inc.(2) | | | 16,276 | | | | 1,537,431 | |
| | |
Dick’s Sporting Goods, Inc. | | | 72,500 | | | | 4,075,225 | |
| | |
Gap, Inc. (The) | | | 75,000 | | | | 1,514,250 | |
| | |
GNC Holdings, Inc., Class A(2)(4) | | | 900 | | | | 0 | |
| | |
Home Depot, Inc. (The) | | | 68,685 | | | | 18,244,110 | |
| | |
L Brands, Inc. | | | 265,335 | | | | 9,867,809 | |
| | |
Lowe’s Cos., Inc. | | | 1,023,552 | | | | 164,290,332 | |
| | |
O’Reilly Automotive, Inc.(2) | | | 157,561 | | | | 71,307,382 | |
| | |
Ross Stores, Inc. | | | 558,660 | | | | 68,609,035 | |
| | |
Signet Jewelers, Ltd. | | | 65,986 | | | | 1,799,438 | |
| | |
Tiffany & Co. | | | 13,285 | | | | 1,746,313 | |
| | |
TJX Cos., Inc. (The) | | | 1,692,189 | | | | 115,559,587 | |
| | |
Tractor Supply Co. | | | 247,452 | | | | 34,786,802 | |
| | |
Ulta Beauty, Inc.(2) | | | 96,955 | | | | 27,841,598 | |
| | |
| | | | | | | $ | 564,741,392 | |
|
| Technology Hardware, Storage & Peripherals — 4.7% | |
| | |
Apple, Inc. | | | 9,555,300 | | | $ | 1,267,892,757 | |
| | |
Dell Technologies, Inc., Class C(2) | | | 2,415 | | | | 176,996 | |
| | |
Hewlett Packard Enterprise Co. | | | 388,752 | | | | 4,606,711 | |
| | |
NCR Corp.(2) | | | 118 | | | | 4,433 | |
| | |
NetApp, Inc. | | | 78,200 | | | | 5,179,968 | |
| | |
Pure Storage, Inc., Class A(2) | | | 1,300,000 | | | | 29,393,000 | |
| | |
| | | | | | | $ | 1,307,253,865 | |
| | | | |
| | 24 | | See Notes to Financial Statements. |
Tax-Managed Growth Portfolio
December 31, 2020
Portfolio of Investments — continued
| | | | | | | | |
| Security | | Shares | | | Value | |
|
| Textiles, Apparel & Luxury Goods — 1.6% | |
| | |
Hanesbrands, Inc. | | | 221,909 | | | $ | 3,235,433 | |
| | |
Kontoor Brands, Inc.(2) | | | 37,542 | | | | 1,522,703 | |
| | |
Levi Strauss & Co., Class A | | | 168,000 | | | | 3,373,440 | |
| | |
Lululemon Athletica, Inc.(2) | | | 2,567 | | | | 893,393 | |
| | |
NIKE, Inc., Class B | | | 2,895,153 | | | | 409,577,295 | |
| | |
Skechers USA, Inc., Class A(2) | | | 100,000 | | | | 3,594,000 | |
| | |
Tapestry, Inc. | | | 522 | | | | 16,224 | |
| | |
VF Corp. | | | 304,553 | | | | 26,011,872 | |
| | |
| | | | | | | $ | 448,224,360 | |
|
| Thrifts & Mortgage Finance — 0.0%(3) | |
| | |
Essent Group, Ltd. | | | 96,312 | | | $ | 4,160,678 | |
| | |
| | | | | | | $ | 4,160,678 | |
|
| Tobacco — 0.5% | |
| | |
Altria Group, Inc. | | | 872,766 | | | $ | 35,783,406 | |
| | |
British American Tobacco PLC ADR | | | 3,399 | | | | 127,429 | |
| | |
Philip Morris International, Inc. | | | 1,106,966 | | | | 91,645,715 | |
| | |
| | | | | | | $ | 127,556,550 | |
|
| Trading Companies & Distributors — 0.3% | |
| | |
Fastenal Co. | | | 1,675,640 | | | $ | 81,821,501 | |
| | |
NOW, Inc.(2) | | | 944 | | | | 6,778 | |
| | |
United Rentals, Inc.(2) | | | 6,000 | | | | 1,391,460 | |
| | |
W.W. Grainger, Inc. | | | 9,210 | | | | 3,760,811 | |
| | |
| | | | | | | $ | 86,980,550 | |
|
| Water Utilities — 0.0%(3) | |
| | |
American Water Works Co., Inc. | | | 1,900 | | | $ | 291,593 | |
| | |
| | | | | | | $ | 291,593 | |
|
| Wireless Telecommunication Services — 0.0%(3) | |
| | |
America Movil SAB de CV, Series L ADR | | | 224,780 | | | $ | 3,268,301 | |
| | |
Rogers Communications, Inc., Class B | | | 750 | | | | 34,943 | |
| | |
Vodafone Group PLC ADR | | | 5 | | | | 82 | |
| | |
| | | | | | | $ | 3,303,326 | |
| |
Total Common Stocks
(identified cost $13,015,824,659) | | | $ | 27,754,454,240 | |
| | | | | | | | |
| Preferred Stocks — 0.0%(3) | |
| Security | | Shares | | | Value | |
|
| Internet & Direct Marketing Retail — 0.0%(3) | |
| | |
Qurate Retail, Inc., Series A, 8.00% | | | 2,994 | | | $ | 296,406 | |
| |
Total Preferred Stocks
(identified cost $168,592) | | | $ | 296,406 | |
|
| Rights — 0.0%(3) | |
| Security | | Shares | | | Value | |
|
| Pharmaceuticals — 0.0%(3) | |
| | |
Bristol-Myers Squibb Co. CVR, Exp. 3/31/21(2) | | | 237,107 | | | $ | 163,627 | |
| |
Total Rights
(identified cost $505,038) | | | $ | 163,627 | |
|
| Warrants — 0.0%(3) | |
| Security | | Shares | | | Value | |
|
| Oil, Gas & Consumable Fuels — 0.0%(3) | |
| | |
Occidental Petroleum Corp., Exp. 8/3/27(2) | | | 2,853 | | | $ | 19,429 | |
| |
Total Warrants
(identified cost $14,122) | | | $ | 19,429 | |
|
| Short-Term Investments — 0.7% | |
| Description | | Units | | | Value | |
| | |
Eaton Vance Cash Reserves Fund, LLC, 0.11%(5) | | | 202,615,051 | | | $ | 202,615,051 | |
| |
Total Short-Term Investments
(identified cost $202,615,051) | | | $ | 202,615,051 | |
| |
Total Investments — 99.9%
(identified cost $13,219,127,462) | | | $ | 27,957,548,753 | |
| |
Other Assets, Less Liabilities — 0.1% | | | $ | 29,165,371 | |
| |
Net Assets — 100.0% | | | $ | 27,986,714,124 | |
The percentage shown for each investment category in the Portfolio of Investments is based on net assets.
| (1) | Restricted security (see Note 5). |
| (2) | Non-income producing security. |
| (3) | Amount is less than 0.05%. |
| (4) | For fair value measurement disclosure purposes, security is categorized as Level 3 (see Note 8). |
| | | | |
| | 25 | | See Notes to Financial Statements. |
Tax-Managed Growth Portfolio
December 31, 2020
Portfolio of Investments — continued
| (5) | Affiliated investment company, available to Eaton Vance portfolios and funds, which invests in high quality, U.S. dollar denominated money market instruments. The rate shown is the annualized seven-day yield as of December 31, 2020. |
Abbreviations:
| | | | |
| | |
| ADR | | – | | American Depositary Receipt |
| | |
| CVR | | – | | Contingent Value Rights |
| | | | |
| | 26 | | See Notes to Financial Statements. |
Tax-Managed Growth Portfolio
December 31, 2020
Statement of Assets and Liabilities
| | | | |
| Assets | | December 31, 2020 | |
| |
Unaffiliated investments, at value (identified cost, $13,016,512,411) | | $ | 27,754,933,702 | |
| |
Affiliated investment, at value (identified cost, $202,615,051) | | | 202,615,051 | |
| |
Cash | | | 474,511 | |
| |
Foreign currency, at value (identified cost, $1,254) | | | 1,237 | |
| |
Dividends and interest receivable | | | 13,929,065 | |
| |
Dividends receivable from affiliated investment | | | 16,406 | |
| |
Receivable for investments sold | | | 24,068,905 | |
| |
Tax reclaims receivable | | | 2,368,866 | |
| |
Total assets | | $ | 27,998,407,743 | |
| |
| Liabilities | | | | |
| |
Payable to affiliates: | | | | |
| |
Investment adviser fee | | $ | 9,643,087 | |
| |
Trustees’ fees | | | 27,125 | |
| |
Accrued expenses | | | 2,023,407 | |
| |
Total liabilities | | $ | 11,693,619 | |
| |
Commitments and contingencies (Note 9) | | | | |
| |
Net Assets applicable to investors’ interest in Portfolio | | $ | 27,986,714,124 | |
| | | | |
| | 27 | | See Notes to Financial Statements. |
Tax-Managed Growth Portfolio
December 31, 2020
Statement of Operations
| | | | |
| Investment Income | | Year Ended
December 31, 2020 | |
| |
Dividends (net of foreign taxes, $3,158,559) | | $ | 341,124,008 | |
| |
Dividends from affiliated investment | | | 1,247,060 | |
| |
Total investment income | | $ | 342,371,068 | |
| |
| Expenses | | | | |
| |
Investment adviser fee | | $ | 95,887,876 | |
| |
Trustees’ fees and expenses | | | 108,500 | |
| |
Custodian fee | | | 3,049,238 | |
| |
Professional fees | | | 523,404 | |
| |
Miscellaneous | | | 791,003 | |
| |
Total expenses | | $ | 100,360,021 | |
| |
Net investment income | | $ | 242,011,047 | |
| |
| Realized and Unrealized Gain (Loss) | | | | |
|
Net realized gain (loss) — | |
| |
Investment transactions(1) | | $ | 582,816,933 | |
| |
Investment transactions — affiliated investment | | | 42,008 | |
| |
Foreign currency transactions | | | (5,790 | ) |
| |
Net realized gain | | $ | 582,853,151 | |
|
Change in unrealized appreciation (depreciation) — | |
| |
Investments | | $ | 4,456,226,123 | |
| |
Investments — affiliated investment | | | (10,545 | ) |
| |
Foreign currency | | | 80,059 | |
| |
Net change in unrealized appreciation (depreciation) | | $ | 4,456,295,637 | |
| |
Net realized and unrealized gain | | $ | 5,039,148,788 | |
| |
Net increase in net assets from operations | | $ | 5,281,159,835 | |
| (1) | Includes $572,823,358 of net realized gains from redemptions in-kind. |
| | | | |
| | 28 | | See Notes to Financial Statements. |
Tax-Managed Growth Portfolio
December 31, 2020
Statements of Changes in Net Assets
| | | | | | | | |
| | | Year Ended December 31, | |
| Increase (Decrease) in Net Assets | | 2020 | | | 2019 | |
|
From operations — | |
| | |
Net investment income | | $ | 242,011,047 | | | $ | 242,547,071 | |
| | |
Net realized gain | | | 582,853,151 | | | | 489,448,401 | |
| | |
Net change in unrealized appreciation (depreciation) | | | 4,456,295,637 | | | | 4,081,066,263 | |
| | |
Net increase in net assets from operations | | $ | 5,281,159,835 | | | $ | 4,813,061,735 | |
|
Capital transactions — | |
| | |
Contributions | | $ | 1,891,540,171 | | | $ | 2,251,431,385 | |
| | |
Withdrawals | | | (1,199,338,464 | ) | | | (1,067,186,292 | ) |
| | |
Net increase in net assets from capital transactions | | $ | 692,201,707 | | | $ | 1,184,245,093 | |
| | |
Net increase in net assets | | $ | 5,973,361,542 | | | $ | 5,997,306,828 | |
| | |
| Net Assets | | | | | | | | |
| | |
At beginning of year | | $ | 22,013,352,582 | | | $ | 16,016,045,754 | |
| | |
At end of year | | $ | 27,986,714,124 | | | $ | 22,013,352,582 | |
| | | | |
| | 29 | | See Notes to Financial Statements. |
Tax-Managed Growth Portfolio
December 31, 2020
Financial Highlights
| | | | | | | | | | | | | | | | | | | | |
| | | Year Ended December 31, | |
| Ratios/Supplemental Data | | 2020 | | | 2019 | | | 2018 | | | 2017 | | | 2016 | |
| | | | | |
Ratios (as a percentage of average daily net assets): | | | | | | | | | | | | | | | | | | | | |
| | | | | |
Expenses | | | 0.44 | % | | | 0.45 | % | | | 0.46 | % | | | 0.46 | % | | | 0.47 | % |
| | | | | |
Net investment income | | | 1.07 | % | | | 1.28 | % | | | 1.25 | % | | | 1.33 | % | | | 1.48 | % |
| | | | | |
Portfolio Turnover(1) | | | 1 | % | | | 1 | % | | | 1 | % | | | 0 | %(2) | | | 1 | % |
| | | | | |
Total Return | | | 23.42 | % | | | 29.87 | % | | | (5.02 | )% | | | 22.76 | % | | | 9.06 | % |
| | | | | |
Net assets, end of year (000’s omitted) | | $ | 27,986,714 | | | $ | 22,013,353 | | | $ | 16,016,046 | | | $ | 16,224,690 | | | $ | 12,577,024 | |
| (1) | Excludes the value of portfolio securities contributed or distributed as a result of in-kind shareholder transactions. The portfolio turnover of the Portfolio including in-kind contributions and distributions of securities was 6%, 6%, 6%, 5% and 6% for the years ended December 31, 2020, 2019, 2018, 2017 and 2016, respectively. |
| (2) | Amount is less than 0.5%. |
| | | | |
| | 30 | | See Notes to Financial Statements. |
Eaton Vance
Tax-Managed Growth Portfolio
December 31, 2020
Notes to Financial Statements
1 Significant Accounting Policies
Tax-Managed Growth Portfolio (the Portfolio) is a Massachusetts business trust registered under the Investment Company Act of 1940, as amended (the 1940 Act), as a diversified, open-end management investment company. The Portfolio’s investment objective is to achieve long-term, after-tax returns for interestholders through investing in a diversified portfolio of equity securities. The Declaration of Trust permits the Trustees to issue interests in the Portfolio. At December 31, 2020, Eaton Vance Tax-Managed Growth Fund 1.0, Eaton Vance Tax-Managed Growth Fund 1.1, Eaton Vance Tax-Managed Growth Fund 1.2 and Eaton Vance Tax-Managed Equity Asset Allocation Fund held an interest of 4.3%, 7.2%, 3.7%, and 0.8% respectively, in the Portfolio. In addition, an unregistered fund managed by the adviser to the Portfolio held an aggregate interest of 84.0% in the Portfolio.
The following is a summary of significant accounting policies of the Portfolio. The policies are in conformity with accounting principles generally accepted in the United States of America (U.S. GAAP). The Portfolio is an investment company and follows accounting and reporting guidance in the Financial Accounting Standards Board (FASB) Accounting Standards Codification Topic 946 “Financial Services — Investment Companies.”
A Investment Valuation — The following methodologies are used to determine the market value or fair value of investments.
Equity Securities. Equity securities listed on a U.S. securities exchange generally are valued at the last sale or closing price on the day of valuation or, if no sales took place on such date, at the mean between the closing bid and ask prices on the exchange where such securities are principally traded. Equity securities listed on the NASDAQ Global or Global Select Market generally are valued at the NASDAQ official closing price. Unlisted or listed securities for which closing sales prices or closing quotations are not available are valued at the mean between the latest available bid and ask prices.
Foreign Securities and Currencies. Foreign securities and currencies are valued in U.S. dollars, based on foreign currency exchange rate quotations supplied by a third party pricing service. The pricing service uses a proprietary model to determine the exchange rate. Inputs to the model include reported trades and implied bid/ask spreads. The daily valuation of exchange-traded foreign securities generally is determined as of the close of trading on the principal exchange on which such securities trade. Events occurring after the close of trading on foreign exchanges may result in adjustments to the valuation of foreign securities to more accurately reflect their fair value as of the close of regular trading on the New York Stock Exchange. When valuing foreign equity securities that meet certain criteria, the Portfolio’s Trustees have approved the use of a fair value service that values such securities to reflect market trading that occurs after the close of the applicable foreign markets of comparable securities or other instruments that have a strong correlation to the fair-valued securities.
Affiliated Fund. The Portfolio may invest in Eaton Vance Cash Reserves Fund, LLC (Cash Reserves Fund), an affiliated investment company managed by Eaton Vance Management (EVM). While Cash Reserves Fund is not a registered money market mutual fund, it conducts all of its investment activities in accordance with the requirements of Rule 2a-7 under the 1940 Act. Investments in Cash Reserves Fund are valued at the closing net asset value per unit on the valuation day. Cash Reserves Fund generally values its investment securities based on available market quotations provided by a third party pricing service.
Fair Valuation. Investments for which valuations or market quotations are not readily available or are deemed unreliable are valued at fair value using methods determined in good faith by or at the direction of the Trustees of the Portfolio in a manner that most fairly reflects the security’s “fair value”, which is the amount that the Portfolio might reasonably expect to receive for the security upon its current sale in the ordinary course. Each such determination is based on a consideration of relevant factors, which are likely to vary from one pricing context to another. These factors may include, but are not limited to, the type of security, the existence of any contractual restrictions on the security’s disposition, the price and extent of public trading in similar securities of the issuer or of comparable companies or entities, quotations or relevant information obtained from broker/dealers or other market participants, information obtained from the issuer, analysts, and/or the appropriate stock exchange (for exchange-traded securities), an analysis of the company’s or entity’s financial statements, and an evaluation of the forces that influence the issuer and the market(s) in which the security is purchased and sold.
B Investment Transactions — Investment transactions for financial statement purposes are accounted for on a trade date basis. Realized gains and losses on investments sold are determined on the basis of identified cost.
C Income — Dividend income is recorded on the ex-dividend date for dividends received in cash and/or securities. However, if the ex-dividend date has passed, certain dividends from foreign securities are recorded as the Portfolio is informed of the ex-dividend date. Withholding taxes on foreign dividends and capital gains have been provided for in accordance with the Portfolio’s understanding of the applicable countries’ tax rules and rates. In consideration of recent decisions rendered by European courts, the Portfolio has filed additional tax reclaims for previously withheld taxes on dividends earned in certain European Union countries. These filings are subject to various administrative and judicial proceedings within these countries. Due to the uncertainty as to the ultimate resolution of these proceedings, the likelihood of receipt of these reclaims, and the potential timing of payment, no amounts are reflected in the financial statements for such reclaims. Interest income is recorded on the basis of interest accrued, adjusted for amortization of premium or accretion of discount.
D Federal Taxes — The Portfolio has elected to be treated as a partnership for federal tax purposes. No provision is made by the Portfolio for federal or state taxes on any taxable income of the Portfolio because each investor in the Portfolio is ultimately responsible for the payment of any taxes on its share of taxable income. Since at least one of the Portfolio’s investors is a regulated investment company that invests all or substantially all of its assets in the Portfolio, the Portfolio normally must satisfy the applicable source of income and diversification requirements (under the Internal Revenue Code) in order for its investors to satisfy them. The Portfolio will allocate, at least annually among its investors, each investor’s distributive share of the Portfolio’s net investment income, net realized capital gains and losses and any other items of income, gain, loss, deduction or credit.
Eaton Vance
Tax-Managed Growth Portfolio
December 31, 2020
Notes to Financial Statements — continued
As of December 31, 2020, the Portfolio had no uncertain tax positions that would require financial statement recognition, de-recognition, or disclosure. The Portfolio files a U.S. federal income tax return annually after its fiscal year-end, which is subject to examination by the Internal Revenue Service for a period of three years from the date of filing.
E Foreign Currency Translation — Investment valuations, other assets, and liabilities initially expressed in foreign currencies are translated each business day into U.S. dollars based upon current exchange rates. Purchases and sales of foreign investment securities and income and expenses denominated in foreign currencies are translated into U.S. dollars based upon currency exchange rates in effect on the respective dates of such transactions. Recognized gains or losses on investment transactions attributable to changes in foreign currency exchange rates are recorded for financial statement purposes as net realized gains and losses on investments. That portion of unrealized gains and losses on investments that results from fluctuations in foreign currency exchange rates is not separately disclosed.
F Use of Estimates — The preparation of the financial statements in conformity with U.S. GAAP requires management to make estimates and assumptions that affect the reported amounts of assets and liabilities at the date of the financial statements and the reported amounts of income and expense during the reporting period. Actual results could differ from those estimates.
G Indemnifications — Under the Portfolio’s organizational documents, its officers and Trustees may be indemnified against certain liabilities and expenses arising out of the performance of their duties to the Portfolio. Under Massachusetts law, if certain conditions prevail, interestholders in the Portfolio could be deemed to have personal liability for the obligations of the Portfolio. However, the Portfolio’s Declaration of Trust contains an express disclaimer of liability on the part of Portfolio interestholders. Additionally, in the normal course of business, the Portfolio enters into agreements with service providers that may contain indemnification clauses. The Portfolio’s maximum exposure under these arrangements is unknown as this would involve future claims that may be made against the Portfolio that have not yet occurred.
2 Investment Adviser Fee and Other Transactions with Affiliates
The investment adviser fee is earned by Boston Management and Research (BMR), a subsidiary of EVM, as compensation for investment advisory services rendered to the Portfolio. EVM is a wholly-owned subsidiary of Eaton Vance Corp. Under the investment advisory agreement, BMR receives a monthly advisory fee at a rate of 0.625% annually of the Portfolio’s average daily net assets up to $500 million. The advisory fee on net assets of $500 million or more is reduced as follows:
| | | | |
| Average Daily Net Assets | | Annual Fee Rate
(for each level) | |
| |
$500 million but less than $1 billion | | | 0.5625 | % |
| |
$1 billion but less than $1.5 billion | | | 0.5000 | % |
| |
$1.5 billion but less than $7 billion | | | 0.4375 | % |
| |
$7 billion but less than $10 billion | | | 0.4250 | % |
| |
$10 billion but less than $15 billion | | | 0.4125 | % |
| |
$15 billion but less than $20 billion | | | 0.4000 | % |
| |
$20 billion but less than $25 billion | | | 0.3900 | % |
| |
$25 billion and over | | | 0.3800 | % |
The Portfolio invests its cash in Cash Reserves Fund. EVM does not currently receive a fee for advisory services provided to Cash Reserves Fund. For the year ended December 31, 2020, the Portfolio’s investment adviser fee amounted to $95,887,876 or 0.42% of the Portfolio’s average daily net assets.
Officers and Trustees of the Portfolio who are members of EVM’s or BMR’s organizations receive remuneration for their services to the Portfolio out of the investment adviser fee. Trustees of the Portfolio who are not affiliated with the investment adviser may elect to defer receipt of all or a percentage of their annual fees in accordance with the terms of the Trustees Deferred Compensation Plan. For the year ended December 31, 2020, no significant amounts have been deferred. Certain officers and Trustees of the Portfolio are officers of the above organizations.
3 Purchases and Sales of Investments
Purchases and sales of investments, other than short-term obligations, aggregated $600,386,056 and $321,554,470, respectively, for the year ended December 31, 2020. In addition, investors contributed securities with an aggregate market value of $1,840,132,133 and investments having an aggregate market value of $1,043,276,593 were distributed in payment for capital withdrawals during the year ended December 31, 2020.
Eaton Vance
Tax-Managed Growth Portfolio
December 31, 2020
Notes to Financial Statements — continued
4 Federal Income Tax Basis of Investments
The cost and unrealized appreciation (depreciation) of investments of the Portfolio at December 31, 2020, as determined on a federal income tax basis, were as follows:
| | | | |
| |
Aggregate cost | | $ | 3,702,977,623 | |
| |
Gross unrealized appreciation | | $ | 24,273,380,350 | |
| |
Gross unrealized depreciation | | | (18,809,220 | ) |
| |
Net unrealized appreciation | | $ | 24,254,571,130 | |
5 Restricted Securities
At December 31, 2020, the Portfolio owned the following securities (representing 0.7% of net assets) which were restricted as to public resale and not registered under the Securities Act of 1933. The Portfolio has various registration rights (exercisable under a variety of circumstances) with respect to these securities. The value of these securities is determined based on valuations provided by brokers when available, or if not available, they are valued at fair value using methods determined in good faith by or at the direction of the Trustees.
| | | | | | | | | | | | | | | | | | | | |
| Common Stocks | | Date of
Acquisition | | | Eligible for
Resale | | | Shares | | | Cost | | | Value | |
| | | | | |
Arista Networks, Inc. | | | 6/18/20 | | | | 6/18/21 | | | | 88,600 | | | $ | 20,060,404 | | | $ | 25,744,502 | |
| | | | | |
Arista Networks, Inc. | | | 12/17/20 | | | | 12/17/21 | | | | 105,064 | | | | 30,000,276 | | | | 30,510,129 | |
| | | | | |
ASGN, Inc. | | | 6/18/20 | | | | 6/18/21 | | | | 17,000 | | | | 1,085,308 | | | | 1,420,010 | |
| | | | | |
Broadcom, Inc. | | | 12/17/20 | | | | 12/17/21 | | | | 14,025 | | | | 5,955,945 | | | | 6,137,162 | |
| | | | | |
Church & Dwight Co., Inc. | | | 12/17/20 | | | | 12/17/21 | | | | 17,504 | | | | 1,516,161 | | | | 1,525,958 | |
| | | | | |
Cigna Corp. | | | 12/17/20 | | | | 12/17/21 | | | | 7,416 | | | | 1,500,098 | | | | 1,542,937 | |
| | | | | |
DexCom, Inc. | | | 9/17/20 | | | | 9/17/21 | | | | 30,000 | | | | 11,808,737 | | | | 11,087,441 | |
| | | | | |
Integra LifeSciences Holdings Corp. | | | 6/18/20 | | | | 6/18/21 | | | | 600,000 | | | | 29,144,044 | | | | 38,952,000 | |
| | | | | |
Integra LifeSciences Holdings Corp. | | | 9/17/20 | | | | 9/17/21 | | | | 200,000 | | | | 9,395,300 | | | | 12,980,754 | |
| | | | | |
Integra LifeSciences Holdings Corp. | | | 12/17/20 | | | | 12/17/21 | | | | 200,000 | | | | 12,154,703 | | | | 12,976,210 | |
| | | | | |
Linde PLC | | | 9/17/20 | | | | 9/17/21 | | | | 12,068 | | | | 3,000,148 | | | | 3,178,528 | |
| | | | | |
Match Group, Inc. | | | 12/17/20 | | | | 12/17/21 | | | | 260,261 | | | | 40,028,133 | | | | 39,321,316 | |
| | | | | |
Northrop Grumman Corp. | | | 9/17/20 | | | | 9/17/21 | | | | 2,913 | | | | 1,000,028 | | | | 887,427 | |
| | | | | |
RingCentral, Inc., Class A | | | 6/18/20 | | | | 6/18/21 | | | | 9,178 | | | | 2,500,146 | | | | 3,478,187 | |
| | | | | |
Total Restricted Securities | | | | | | | | | | | | | | $ | 169,149,431 | | | $ | 189,742,561 | |
6 Line of Credit
The Portfolio participates with other portfolios and funds managed by EVM and its affiliates in an $800 million unsecured line of credit agreement with a group of banks, which is in effect through October 26, 2021. Borrowings are made by the Portfolio solely for temporary purposes related to redemptions and other short-term cash needs. Interest is charged to the Portfolio based on its borrowings at an amount above either the Eurodollar rate or Federal Funds rate. In addition, a fee computed at an annual rate of 0.15% on the daily unused portion of the line of credit is allocated among the participating portfolios and funds at the end of each quarter. In connection with the renewal of the agreement in October 2020, an upfront fee and arrangement fee totaling $950,000 was incurred that was allocated to the participating portfolios and funds. Because the line of credit is not available exclusively to the Portfolio, it may be unable to borrow some or all of its requested amounts at any particular time. The Portfolio did not have any significant borrowings or allocated fees during the year ended December 31, 2020.
Eaton Vance
Tax-Managed Growth Portfolio
December 31, 2020
Notes to Financial Statements — continued
7 Investments in Affiliated Funds
At December 31, 2020, the value of the Portfolio’s investment in affiliated funds was $202,615,051, which represents 0.7% of the Portfolio’s net assets. Transactions in affiliated funds by the Portfolio for the year ended December 31, 2020 were as follows:
| | | | | | | | | | | | | | | | | | | | | | | | | | | | | | | | |
| Name of affiliated fund | | Value,
beginning
of period | | | Purchases | | | Sales proceeds | | | Net
realized
gain (loss) | | | Change in
unrealized
appreciation
(depreciation) | | | Value, end
of period | | | Dividend
income | | | Units, end
of period | |
|
Short-Term Investments | |
| | | | | | | | |
Eaton Vance Cash Reserves Fund, LLC | | $ | 346,625,190 | | | $ | 530,987,040 | | | $ | (675,028,642 | ) | | $ | 42,008 | | | $ | (10,545 | ) | | $ | 202,615,051 | | | $ | 1,247,060 | | | | 202,615,051 | |
8 Fair Value Measurements
Under generally accepted accounting principles for fair value measurements, a three-tier hierarchy to prioritize the assumptions, referred to as inputs, is used in valuation techniques to measure fair value. The three-tier hierarchy of inputs is summarized in the three broad levels listed below.
| • | | Level 1 – quoted prices in active markets for identical investments |
| • | | Level 2 – other significant observable inputs (including quoted prices for similar investments, interest rates, prepayment speeds, credit risk, etc.) |
| • | | Level 3 – significant unobservable inputs (including a fund’s own assumptions in determining the fair value of investments) |
In cases where the inputs used to measure fair value fall in different levels of the fair value hierarchy, the level disclosed is determined based on the lowest level input that is significant to the fair value measurement in its entirety. The inputs or methodology used for valuing securities are not necessarily an indication of the risk associated with investing in those securities.
At December 31, 2020, the hierarchy of inputs used in valuing the Portfolio’s investments, which are carried at value, were as follows:
| | | | | | | | | | | | | | | | |
| Asset Description | | Level 1 | | | Level 2 | | | Level 3* | | | Total | |
|
Common Stocks | |
| | | | |
Communication Services | | $ | 3,313,896,924 | | | $ | 39,321,316 | | | $ | — | | | $ | 3,353,218,240 | |
| | | | |
Consumer Discretionary | | | 3,805,491,045 | | | | — | | | | 1,665,422 | | | | 3,807,156,467 | |
| | | | |
Consumer Staples | | | 1,979,766,373 | | | | 133,727,291 | | | | — | | | | 2,113,493,664 | |
| | | | |
Energy | | | 391,665,784 | | | | — | | | | — | | | | 391,665,784 | |
| | | | |
Financials | | | 3,596,757,912 | | | | 9,581,055 | | | | — | | | | 3,606,338,967 | |
| | | | |
Health Care | | | 3,459,780,175 | | | | 38,587,342 | | | | — | | | | 3,498,367,517 | |
| | | | |
Industrials | | | 2,605,994,312 | | | | 887,427 | | | | — | | | | 2,606,881,739 | |
| | | | |
Information Technology | | | 7,840,514,845 | | | | 36,647,291 | | | | — | | | | 7,877,162,136 | |
| | | | |
Materials | | | 379,530,028 | | | | 5,078,939 | | | | — | | | | 384,608,967 | |
| | | | |
Real Estate | | | 27,248,891 | | | | — | | | | — | | | | 27,248,891 | |
| | | | |
Utilities | | | 88,311,868 | | | | — | | | | — | | | | 88,311,868 | |
| | | | |
Total Common Stocks | | $ | 27,488,958,157 | | | $ | 263,830,661 | ** | | $ | 1,665,422 | | | $ | 27,754,454,240 | |
| | | | |
Preferred Stocks | | $ | 296,406 | | | $ | — | | | $ | — | | | $ | 296,406 | |
| | | | |
Rights | | | 163,627 | | | | — | | | | — | | | | 163,627 | |
| | | | |
Warrants | | | 19,429 | | | | — | | | | — | | | | 19,429 | |
| | | | |
Short-Term Investments | | | — | | | | 202,615,051 | | | | — | | | | 202,615,051 | |
| | | | |
Total Investments | | $ | 27,489,437,619 | | | $ | 466,445,712 | | | $ | 1,665,422 | | | $ | 27,957,548,753 | |
| * | None of the unobservable inputs for Level 3 assets, individually or collectively, had a material impact on the Portfolio. |
| ** | Includes foreign equity securities whose values were adjusted to reflect market trading of comparable securities or other correlated instruments that occurred after the close of trading in their applicable foreign markets. |
Eaton Vance
Tax-Managed Growth Portfolio
December 31, 2020
Notes to Financial Statements — continued
Level 3 investments at the beginning and/or end of the period in relation to net assets were not significant and accordingly, a reconciliation of Level 3 assets for the year ended December 31, 2020 is not presented.
9 Legal Proceedings
In November 2010, the Portfolio was named as defendant and a putative member of the proposed defendant class of shareholders in the case entitled Official Committee of Unsecured Creditors (UCC) of the Tribune Company v. FitzSimons, et al. as a result of its ownership of shares in the Tribune Company (Tribune) in 2007 when Tribune effected a leveraged buyout transaction (LBO) and was converted to a privately held company. The UCC, which has been replaced by a Litigation Trustee pursuant to Tribune’s plan of reorganization, seeks to recover payments of the proceeds of the LBO. In June 2011, a group of Tribune creditors filed multiple actions against former Tribune shareholders involving state law constructive fraudulent conveyance claims arising out of the LBO (the “SLFC actions”). The Portfolio has been named as a defendant in one of the SLFC actions filed in United States District Court — District of Massachusetts by Deutsche Bank Trust Co. Americas seeking to recover the proceeds received in connection with the LBO from former shareholders. The FitzSimons action and the SLFC actions are now part of a multi-district litigation proceeding in the Southern District of New York. The value of the proceeds received by the Portfolio is approximately $48,237,000 (equal to 0.2% of net assets at December 31, 2020).
The Portfolio cannot predict the outcome of these proceedings or the effect, if any, on the Portfolio’s net asset value. The attorneys’ fees and costs related to these actions are expensed by the Portfolio as incurred.
10 Risks and Uncertainties
Pandemic Risk
An outbreak of respiratory disease caused by a novel coronavirus was first detected in China in December 2019 and subsequently spread internationally. This coronavirus has resulted in closing borders, enhanced health screenings, changes to healthcare service preparation and delivery, quarantines, cancellations, disruptions to supply chains and customer activity, as well as general concern and uncertainty. Health crises caused by outbreaks, such as the coronavirus outbreak, may exacerbate other pre-existing political, social and economic risks and disrupt normal market conditions and operations. The impact of this outbreak has negatively affected the worldwide economy, the economies of individual countries, individual companies, and the market in general, and may continue to do so in significant and unforeseen ways, as may other epidemics and pandemics that may arise in the future. Any such impact could adversely affect the Portfolio’s performance, or the performance of the securities in which the Portfolio invests.
11 Additional Information
On October 8, 2020, Morgan Stanley and Eaton Vance Corp. (“Eaton Vance”) announced that they had entered into a definitive agreement under which Morgan Stanley would acquire Eaton Vance. Under the Investment Company Act of 1940, as amended, consummation of this transaction may be deemed to result in the automatic termination of an Eaton Vance Fund’s investment advisory agreement, and, where applicable, any related sub-advisory agreement. On November 24, 2020, the Portfolio’s Board approved a new investment advisory agreement. The new investment advisory agreement was approved by Portfolio interest holders at a joint special meeting of interest holders on February 19, 2021, and would take effect upon consummation of the transaction.
Tax-Managed Growth Portfolio
December 31, 2020
Report of Independent Registered Public Accounting Firm
To the Trustees and Investors of Tax-Managed Growth Portfolio:
Opinion on the Financial Statements and Financial Highlights
We have audited the accompanying statement of assets and liabilities of Tax-Managed Growth Portfolio (the “Portfolio”), including the portfolio of investments, as of December 31, 2020, the related statement of operations for the year then ended, the statements of changes in net assets for each of the two years in the period then ended, the financial highlights for each of the five years in the period then ended, and the related notes. In our opinion, the financial statements and financial highlights present fairly, in all material respects, the financial position of the Portfolio as of December 31, 2020, and the results of its operations for the year then ended, the changes in its net assets for each of the two years in the period then ended, and the financial highlights for each of the five years in the period then ended in conformity with accounting principles generally accepted in the United States of America.
Basis for Opinion
These financial statements and financial highlights are the responsibility of the Portfolio’s management. Our responsibility is to express an opinion on the Portfolio’s financial statements and financial highlights based on our audits. We are a public accounting firm registered with the Public Company Accounting Oversight Board (United States) (PCAOB) and are required to be independent with respect to the Portfolio in accordance with the U.S. federal securities laws and the applicable rules and regulations of the Securities and Exchange Commission and the PCAOB.
We conducted our audits in accordance with the standards of the PCAOB. Those standards require that we plan and perform the audit to obtain reasonable assurance about whether the financial statements and financial highlights are free of material misstatement, whether due to error or fraud. The Portfolio is not required to have, nor were we engaged to perform, an audit of its internal control over financial reporting. As part of our audits we are required to obtain an understanding of internal control over financial reporting but not for the purpose of expressing an opinion on the effectiveness of the Portfolio’s internal control over financial reporting. Accordingly, we express no such opinion.
Our audits included performing procedures to assess the risks of material misstatement of the financial statements and financial highlights, whether due to error or fraud, and performing procedures that respond to those risks. Such procedures included examining, on a test basis, evidence regarding the amounts and disclosures in the financial statements and financial highlights. Our audits also included evaluating the accounting principles used and significant estimates made by management, as well as evaluating the overall presentation of the financial statements and financial highlights. Our procedures included confirmation of securities owned as of December 31, 2020, by correspondence with the custodian and brokers; when replies were not received from brokers, we performed other auditing procedures. We believe that our audits provide a reasonable basis for our opinion.
/s/ Deloitte & Touche LLP
Boston, Massachusetts
February 22, 2021
We have served as the auditor of one or more Eaton Vance investment companies since 1959.
Eaton Vance
Tax-Managed Growth Fund 1.0
December 31, 2020
Board of Trustees’ Contract Approval
Overview of the Contract Review Process
Even though the following description of the Board’s (as defined below) consideration of investment advisory and, as applicable, sub-advisory agreements covers multiple funds, for purposes of this shareholder report, the description is only relevant as to Eaton Vance Tax-Managed Growth Fund 1.0 and Tax-Managed Growth Portfolio. As defined below, Eaton Vance Tax-Managed Growth Fund 1.0 is a New IAA Series.
| | | | |
| Fund | | Investment Adviser | | Investment Sub-Adviser |
| | |
Eaton Vance Tax-Managed Growth Fund 1.0 | | Eaton Vance Management | | None |
| | |
Tax-Managed Growth Portfolio | | Boston Management and Research | | None |
At a meeting held on November 24, 2020 (the “November Meeting”), the Board of each Eaton Vance open-end Fund, including the portfolios (each, a “Portfolio”) in which each such Fund invests, as applicable (each, a “Fund” and, collectively, the “Funds”), which also includes each Fund organized as a feeder fund in a master-feeder structure that does not currently have an investment advisory agreement or, as applicable, an investment sub-advisory agreement in place (the “New IAA Series”), including a majority of the Board members (the “Independent Trustees”) who are not “interested persons” (as defined in the Investment Company Act of 1940 (the “1940 Act”)) of the Funds, Eaton Vance Management (“EVM”) or Boston Management and Research (“BMR” and, together with EVM, the “Advisers”), voted to approve a new investment advisory agreement between each Fund and either EVM or BMR (the “New Investment Advisory Agreements”) and, for certain Funds, a new investment sub-advisory agreement between an Adviser and the applicable Sub-Adviser (the “New Investment Sub-Advisory Agreements”(1) and, together with the New Investment Advisory Agreements, the “New Agreements”), each of which is intended to go into effect upon the completion of the Transaction (as defined below), as more fully described below. In voting its approval of the New Agreements at the November Meeting, the Board relied on an order issued by the Securities and Exchange Commission in response to the impacts of the COVID-19 pandemic that provided temporary relief from the in-person meeting requirements under Section 15 of the 1940 Act.
In voting its approval of the New Agreements, the Board of each Fund relied upon the recommendation of its Contract Review Committee, which is a committee comprised exclusively of Independent Trustees. Prior to and during meetings leading up to the November Meeting, the Contract Review Committee reviewed and discussed information furnished by the Advisers, the Sub-Advisers, and Morgan Stanley, as requested by the Independent Trustees, that the Contract Review Committee considered reasonably necessary to evaluate the terms of the New Agreements and to form its recommendation. Such information included, among other things, the terms and anticipated impacts of Morgan Stanley’s pending acquisition of Eaton Vance Corp. (the “Transaction”) on the Funds and their shareholders. In addition to considering information furnished specifically to evaluate the impact of the Transaction on the Funds and their respective shareholders, the Board and its Contract Review Committee also considered information furnished for prior meetings of the Board and its committees, including information provided in connection with the annual contract review process for the Funds, which most recently culminated in April 2020 (the “2020 Annual Approval Process”).
The Board of each Fund, including the Independent Trustees, concluded that the applicable New Investment Advisory Agreement and, as applicable, New Investment Sub-Advisory Agreement, including the fees payable thereunder, was fair and reasonable, and it voted to approve the New Investment Advisory Agreement and, as applicable, New Investment Sub-Advisory Agreement and to recommend that shareholders do so as well.
Shortly after the announcement of the Transaction, the Board, including all of the Independent Trustees, met with senior representatives from the Advisers and Morgan Stanley at its meeting held on October 13, 2020 to discuss certain aspects of the Transaction and the expected impacts of the Transaction on the Funds and their shareholders. As part of the Board’s evaluation process, counsel to the Independent Trustees, on behalf of the Contract Review Committee, requested additional information to assist the Independent Trustees in their evaluation of the New Agreements and the implications of the Transaction, as well as other contractual arrangements that may be affected by the Transaction. The Contract Review Committee considered information furnished by the Advisers and Morgan Stanley, their respective affiliates, and, as applicable, the Sub-Advisers during meetings on November 5, 2020, November 10, 2020, November 13, 2020, November 17, 2020 and November 24, 2020.
During its meetings on November 10, 2020 and November 17, 2020, the Contract Review Committee further discussed the approval of the New Agreements with senior representatives of the Advisers, the Affiliated Sub-Advisers, and Morgan Stanley. The representatives from the Advisers, the Affiliated Sub-Advisers, and Morgan Stanley each made presentations to, and responded to questions from, the Independent Trustees. The Contract Review Committee considered the Advisers’, the Affiliated Sub-Advisers’ and Morgan Stanley’s responses related to the Transaction and specifically to the Funds, as well as information received in connection with the 2020 Annual Approval Process, with respect to its evaluation of the New Agreements. Among other information, the Board considered:
| (1) | With respect to certain of the Funds, the applicable Adviser is currently a party to a sub-advisory agreement (collectively, the “Current Sub-Advisory Agreements”) with Atlanta Capital Management Company, LLC (“Atlanta Capital”), BMO Global Asset Management (Asia) Limited, Eaton Vance Advisers International Ltd. (“EVAIL”), Goldman Sachs Asset Management, L.P., Hexavest Inc. (“Hexavest”), Parametric Portfolio Associates LLC (“Parametric”) or Richard Bernstein Advisors LLC (collectively, the “Sub-Advisers” and, with respect to Atlanta Capital, EVAIL, Hexavest and Parametric, each an affiliate of the Advisers, the “Affiliated Sub-Advisers”). Accordingly, references to the “Sub-Advisers,” the “Affiliated Sub-Advisers” or the “New Sub-Advisory Agreements” are not applicable to all Funds. |
Eaton Vance
Tax-Managed Growth Fund 1.0
December 31, 2020
Board of Trustees’ Contract Approval — continued
Information about the Transaction and its Terms
| | • | | Information about the material terms and conditions, and expected impacts, of the Transaction that relate to the Funds, including the expected impacts on the businesses conducted by the Advisers, the Affiliated Sub-Advisers and Eaton Vance Distributors, Inc., as the distributor of Fund shares; |
| | • | | Information about the advantages of the Transaction as they relate to the Funds and their shareholders; |
| | • | | A commitment that the Funds would not bear any expenses, directly or indirectly, in connection with the Transaction; |
| | • | | A commitment that, for a period of three years after the Closing, at least 75% of each Fund’s Board members must not be “interested persons” (as defined in the 1940 Act) of the investment adviser (or predecessor investment adviser, if applicable) pursuant to Section 15(f)(1)(A) of the 1940 Act; |
| | • | | A commitment that Morgan Stanley would use its reasonable best efforts to ensure that it did not impose any “unfair burden” (as that term is used in section 15(f)(1)(B) of the 1940 Act) on the Funds as a result of the Transaction; |
| | • | | Information with respect to personnel and/or other resources of the Advisers and their affiliates, including the Affiliated Sub-Advisers, as a result of the Transaction, as well as any expected changes to compensation, including any retention-based compensation intended to incentivize key personnel at the Advisers and their affiliates, including the Affiliated Sub-Advisers; |
| | • | | Information regarding any changes that are expected with respect to the Funds’ slate of officers as a result of the Transaction; |
Information about Morgan Stanley
| | • | | Information about Morgan Stanley’s overall business, including information about the advisory, brokerage and related businesses that Morgan Stanley operates; |
| | • | | Information about Morgan Stanley’s financial condition, including its access to capital and other resources required to support the investment advisory businesses related to the Funds; |
| | • | | Information on how the Funds are expected to fit within Morgan Stanley’s overall business strategy, and any changes that Morgan Stanley contemplates implementing to the Funds in the short- or long-term following the closing of the Transaction (the “Closing”); |
| | • | | Information regarding risk management functions at Morgan Stanley and its affiliates, including how existing risk management protocols and procedures may impact the Funds and/or the businesses of the Advisers and their affiliates, including the Affiliated Sub-Advisers, as they relate to the Funds; |
| | • | | Information on the anticipated benefits of the Transaction to the Funds with respect to potential additional distribution capabilities and the ability to access new markets and customer segments through Morgan Stanley’s distribution network, including, in particular, its institutional client base; |
| | • | | Information regarding the financial condition and reputation of Morgan Stanley, its worldwide presence, experience as a fund sponsor and manager, commitment to maintain a high level of cooperation with, and support to, the Funds, strong client service capabilities, and relationships in the asset management industry; |
Information about the New Agreements for Funds other than the New IAA Series
| | • | | A representation that, after the Closing, all of the Funds will continue to be advised by their current Adviser and Sub-Adviser, as applicable; |
| | • | | Information regarding the terms of the New Agreements, including certain changes as compared to the current investment advisory agreement between each Fund and its Adviser (collectively, the “Current Advisory Agreements”) and, as applicable, the current investment sub-advisory agreement between a Fund and a Sub-Adviser (together with the Current Advisory Agreements, the “Current Agreements”); |
| | • | | Information confirming that the fee rates payable under the New Agreements are not changed as compared to the Current Agreements; |
| | • | | A representation that the New Agreements will not cause any diminution in the nature, extent and quality of services provided by the Advisers and the Sub-Advisers to the Funds and their respective shareholders, including with respect to compliance and other non-advisory services; |
Information about the New Agreements for the New IAA Series
| | • | | Information regarding the terms of the New Agreements; |
| | • | | Information confirming that no increase in management fees will result from the New Agreements because the Adviser will not charge a management fee with respect to New IAA Series assets invested in an underlying Portfolio or other investment company for which the Adviser or its affiliates serve as investment adviser and receive an advisory fee; |
| | • | | A representation that the New Agreements will not cause any diminution in the nature, extent and quality of services provided by the Advisers and the Sub-Advisers to the Funds and their respective shareholders, including with respect to compliance and other non-advisory services; |
Information about Fund Performance, Fees and Expenses
| | • | | A report from an independent data provider comparing the investment performance of each Fund (including, as relevant, total return data, income data, Sharpe ratios and information ratios) to the investment performance of comparable funds and, as applicable, benchmark indices, over various time periods as of the 2020 Annual Approval Process, as well as performance information as of a more recent date; |
| | • | | A report from an independent data provider comparing each Fund’s total expense ratio (and its components) to those of comparable funds as of the 2020 Annual Approval Process, as well as fee and expense information as of a more recent date; |
Eaton Vance
Tax-Managed Growth Fund 1.0
December 31, 2020
Board of Trustees’ Contract Approval — continued
| | • | | In certain instances, data regarding investment performance relative to customized groups of peer funds and blended indices identified by the Advisers in consultation with the Portfolio Management Committee of the Board as of the 2020 Annual Approval Process, as well as corresponding performance information as of a more recent date; |
| | • | | Comparative information concerning the fees charged and services provided by the Adviser and the Sub-Adviser to each Fund in managing other accounts (which may include other mutual funds, collective investment funds and institutional accounts) using investment strategies and techniques similar to those used in managing such Fund(s), if any; |
| | • | | Profitability analyses of the Advisers and the Affiliated Sub-Advisers, as applicable, with respect to each of the Funds as of the 2020 Annual Approval Process, as well as information regarding the impact of the Transaction on profitability; |
Information about Portfolio Management and Trading
| | • | | Descriptions of the investment management services currently provided and expected to be provided to each Fund after the Transaction, as well as each of the Funds’ investment strategies and policies; |
| | • | | The procedures and processes used to determine the fair value of Fund assets, when necessary, and actions taken to monitor and test the effectiveness of such procedures and processes; |
| | • | | Information about any changes to the policies and practices of the Advisers and, as applicable, each Fund’s Sub-Adviser with respect to trading, including their processes for seeking best execution of portfolio transactions; |
| | • | | Information regarding the impact on trading and access to capital markets associated with the Funds’ affiliations with Morgan Stanley and its affiliates, including potential restrictions with respect to the Funds’ ability to execute portfolio transactions with Morgan Stanley and its affiliates; |
Information about the Advisers and the Sub-Advisers
| | • | | Information about the financial results and condition of the Advisers and the Affiliated Sub-Advisers since the culmination of the 2020 Annual Approval Process and any material changes in financial condition that are reasonably expected to occur before and after the Closing; |
| | • | | Information regarding contemplated changes to the individual investment professionals whose responsibilities include portfolio management and investment research for the Funds, and, for portfolio managers and certain other investment professionals, information relating to their responsibilities with respect to managing other mutual funds and investment accounts, as applicable, post-Closing; |
| | • | | The Code of Ethics of the Advisers and their affiliates, including the Affiliated Sub-Advisers, together with information relating to compliance with, and the administration of, such codes; |
| | • | | Policies and procedures relating to proxy voting and the handling of corporate actions and class actions; |
| | • | | Information concerning the resources devoted to compliance efforts undertaken by the Advisers and their affiliates, including the Affiliated Sub-Advisers, including descriptions of their various compliance programs and their record of compliance; |
| | • | | Information concerning the business continuity and disaster recovery plans of the Advisers and their affiliates, including the Affiliated Sub-Advisers; |
| | • | | A description of the Advisers’ oversight of the Sub-Advisers, including with respect to regulatory and compliance issues, investment management and other matters; |
Other Relevant Information
| | • | | Information concerning the nature, cost and character of the administrative and other non-investment advisory services provided by the Advisers and their affiliates; |
| | • | | Information concerning oversight of the relationship with the custodian, subcustodians and fund accountants by EVM and/or administrator to each of the Funds; |
| | • | | Confirmation that the Advisers intend to continue to manage the Funds in a manner materially consistent with each Fund’s current investment objective(s) and principal investment strategies; |
| | • | | Information regarding Morgan Stanley’s commitment to maintaining competitive compensation arrangements to attract and retain highly qualified personnel; |
| | • | | Confirmation that the Advisers’ current senior management teams have indicated their strong support of the Transaction; and |
| | • | | Information regarding the fact that Morgan Stanley and Eaton Vance Corp. will each derive benefits from the Transaction and that, as a result, they have a financial interest in the matters that were being considered. |
As indicated above, the Board and its Contract Review Committee also considered information received at its regularly scheduled meetings throughout the year, which included information from portfolio managers and other investment professionals of the Advisers and the Sub-Advisers regarding investment and performance matters, and considered various investment and trading strategies used in pursuing the Funds’ investment objectives. The Board also received information regarding risk management techniques employed in connection with the management of the Funds. The Board and its committees evaluated issues pertaining to industry and regulatory developments, compliance procedures, fund governance and other issues with respect to the Funds, and received and participated in reports and presentations provided by the Advisers and their affiliates, including the Affiliated Sub-Advisers, with respect to such matters.
Eaton Vance
Tax-Managed Growth Fund 1.0
December 31, 2020
Board of Trustees’ Contract Approval — continued
The Contract Review Committee was advised throughout the evaluation process by Goodwin Procter LLP, independent legal counsel for the Independent Trustees. The members of the Contract Review Committee, with the advice of such counsel, exercised their own business judgment in determining the material factors to be considered in evaluating the New Agreements and the weight to be given to each such factor. The conclusions reached with respect to the New Agreements were based on a comprehensive evaluation of all the information provided and not any single factor. Moreover, each Independent Trustee may have placed varying emphasis on particular factors in reaching conclusions with respect to the New Agreements.
Nature, Extent and Quality of Services
In considering whether to approve the New Agreements, the Board evaluated the nature, extent and quality of services currently provided to each Fund by the Advisers and, as applicable, the Sub-Advisers under the Current Agreements (for the New IAA Series, the Board considered the nature, extent and quality of services provided to the respective Portfolios, as applicable). In evaluating the nature, extent and quality of services to be provided by the Advisers and the Sub-Advisers under the New Agreements, the Board considered, among other information, the expected impact, if any, of the Transaction on the operations, facilities, organization and personnel of the Advisers and the Sub-Advisers, and that Morgan Stanley and the Advisers have advised the Board that, following the Transaction, there is not expected to be any diminution in the nature, extent and quality of services provided by the Advisers and the Sub-Advisers, as applicable, to the Funds and their shareholders, including compliance and other non-advisory services, and that there are not expected to be any changes in portfolio management personnel as a result of the Transaction.
The Board also considered the financial resources of Morgan Stanley and the Advisers and the importance of having a Fund manager with, or with access to, significant organizational and financial resources. The Board considered the benefits to the Funds of being part of a larger combined organization with greater financial resources following the Transaction, particularly during periods of market disruptions and volatility. In this regard, the Board considered information provided by Morgan Stanley regarding its business and operating structure, scale of operation, leadership and reputation, distribution capabilities, and financial condition, as well as information on how the Funds are expected to fit within Morgan Stanley’s overall business strategy and any changes that Morgan Stanley contemplates in the short- or long-term following the Closing. The Board also noted Morgan Stanley’s and the Advisers’ commitment to keep the Board apprised of developments with respect to its long-term integration plans for the Advisers, the Affiliated Sub-Advisers, and existing Morgan Stanley affiliates and their respective personnel.
The Board considered the Advisers’ and the Sub-Advisers’ management capabilities and investment processes in light of the types of investments held by each Fund, including the education, experience and number of investment professionals and other personnel who provide portfolio management, investment research, and similar services to each Fund. In particular, the Board considered the abilities and experience of the Advisers’ and, as applicable, the Sub-Advisers’ investment professionals in implementing each Fund’s investment strategies. The Board also took into account the resources dedicated to portfolio management and other services, the compensation methods of the Advisers and other factors, including the reputation and resources of the Advisers to recruit and retain highly qualified research, advisory and supervisory investment professionals. With respect to the recruitment and retention of key personnel, the Board noted information from Morgan Stanley and the Advisers regarding the benefits of joining Morgan Stanley. In addition, the Board considered the time and attention devoted to the Funds by senior management, as well as the infrastructure, operational capabilities and support staff in place to assist in the portfolio management and operations of the Funds, including the provision of administrative services. With respect to the foregoing, the Board also considered information from the Advisers and Morgan Stanley regarding the anticipated impact of the Transaction on such matters. The Board also considered the business-related and other risks to which the Advisers or their affiliates may be subject in managing the Funds and in connection with the Transaction.
The Board considered the compliance programs of the Advisers and relevant affiliates thereof, including the Affiliated Sub-Advisers. The Board considered compliance and reporting matters regarding, among other things, personal trading by investment professionals, disclosure of portfolio holdings, late trading, frequent trading, portfolio valuation, business continuity and the allocation of investment opportunities. The Board also considered the responses of the Advisers and their affiliates to requests in recent years from regulatory authorities, such as the Securities and Exchange Commission and the Financial Industry Regulatory Authority. The Board also considered certain information relating to the compliance record of Morgan Stanley and its affiliates, including information requests in recent years from regulatory authorities. With respect to the foregoing, including the compliance programs of the Advisers and the Sub-Advisers, the Board noted information regarding the impacts of the Transaction, as well as the Advisers’ and Morgan Stanley’s commitment to keep the Board apprised of developments with respect to its long-term integration plans for the Advisers, the Affiliated Sub-Advisers and existing Morgan Stanley affiliates and their respective personnel.
The Board considered other administrative services provided and to be provided or overseen by the Advisers and their affiliates, including transfer agency and accounting services. The Board evaluated the benefits to shareholders of investing in a fund that is a part of a large fund complex offering exposure to a variety of asset classes and investment disciplines, as well as the ability, in many cases, to exchange an investment among different funds without incurring additional sales charges. The Board noted information that the Transaction was not expected to have any material impact on such matters in the near-term.
In evaluating the nature, extent and quality of the services to be provided under the New Agreements, the Board also considered investment performance information provided for each Fund in connection with the 2020 Annual Approval Process, as well as information provided as of a more recent date. In this regard, the Board compared each Fund’s investment performance to that of comparable funds identified by an independent data provider (the peer group), as well as appropriate benchmark indices and, for certain Funds, a custom peer group of similarly managed funds. The Board also considered, where applicable, Fund-specific performance explanations based on criteria established by the Board in connection with the 2020 Annual Approval Process and,
Eaton Vance
Tax-Managed Growth Fund 1.0
December 31, 2020
Board of Trustees’ Contract Approval — continued
where applicable, performance explanations as of a more recent date. In addition to the foregoing information, it was also noted that the Board has received and discussed with management information throughout the year at periodic intervals comparing each Fund’s performance against applicable benchmark indices and peer groups. In addition, the Board considered each Fund’s performance in light of overall financial market conditions. Where a Fund’s relative underperformance to its peers was significant during one or more specified periods, the Board noted the explanation from the applicable Adviser concerning the Fund’s relative performance versus its peer group.
After consideration of the foregoing factors, among others, and based on their review of the materials provided and the assurances received from, and recommendations of, the Advisers and Morgan Stanley, the Board determined that the Transaction was not expected to adversely affect the nature, extent and quality of services provided to the Funds by the Advisers and their affiliates, including the Affiliated Sub-Advisers, and that the Transaction was not expected to have an adverse effect on the ability of the Advisers and their affiliates, including the Affiliated Sub-Advisers, to provide those services. The Board concluded that the nature, extent and quality of services expected to be provided by the Advisers and the Sub-Advisers, taken as a whole, are appropriate and expected to be consistent with the terms of the New Agreements.
Management Fees and Expenses
The Board considered contractual fee rates payable by each Fund for advisory and administrative services (referred to collectively as “management fees”) in connection with the 2020 Annual Approval Process, as well as information provided as of a more recent date. As part of its review, the Board considered each Fund’s management fees and total expense ratio over various periods, as compared to those of comparable funds, before and after giving effect to any undertaking to waive fees or reimburse expenses. The Board also considered factors, and, where applicable, certain Fund-specific factors, that had an impact on a Fund’s total expense ratio relative to comparable funds, as identified by the Advisers in response to inquiries from the Contract Review Committee. The Board considered that the New Agreements do not change a Fund’s management fee rate or the computation method for calculating such fees, including any separately executed permanent contractual management fee reduction currently in place for the Fund. The Board also considered that, for the New IAA Series, no increase in management fees will result from the New Agreements because the Adviser will not charge a management fee with respect to New IAA Series assets invested in an underlying Portfolio or other investment company for which the Adviser or its affiliates serve as investment adviser and receive an advisory fee.
The Board also received and considered, where applicable, information about the services offered and the fee rates charged by the Advisers and the Sub-Advisers to other types of accounts with investment objectives and strategies that are substantially similar to and/or managed in a similar investment style as a Fund. In this regard, the Board received information about the differences in the nature and scope of services the Advisers and the Sub-Advisers, as applicable, provide to the Funds as compared to other types of accounts and the material differences in compliance, reporting and other legal burdens and risks to the Advisers and such Sub-Advisers as between each Fund and other types of accounts.
After considering the foregoing information, and in light of the nature, extent and quality of the services expected to be provided by the Advisers and the Sub-Advisers, the Board concluded that the management fees charged for advisory and related services are reasonable with respect to its approval of the New Agreements.
Profitability and “Fall-Out” Benefits
During the 2020 Annual Approval Process, the Board considered the level of profits realized by the Advisers and relevant affiliates thereof, including the Affiliated Sub-Advisers, in providing investment advisory and administrative services to the Funds and to all Eaton Vance funds as a group. The Board considered the level of profits realized without regard to marketing support or other payments by the Advisers and their affiliates to third parties in respect of distribution or other services. In light of the foregoing factors and the nature, extent and quality of the services rendered, the profits realized by the Advisers and their affiliates, including the Sub-Advisers, were not deemed to be excessive by the Board.
The Board noted that Morgan Stanley and the Advisers are expected to realize, over time, cost savings from the Transaction based on eliminating duplicate corporate overhead expenses. The Board considered, however, information from the Advisers and Morgan Stanley that such cost savings are not expected to be realized immediately upon the Closing and that, accordingly, there are currently no specific expected changes in the levels of profitability associated with the advisory and other services provided to the Funds that are contemplated as a result of the Transaction. The Board noted that it will continue to receive information regarding profitability during its annual contract review processes, including the extent to which cost savings and/or other efficiencies result in changes to profitability levels.
The Board also considered direct or indirect fall-out benefits received by the Advisers and their affiliates, including the Affiliated Sub-Advisers, in connection with their respective relationships with the Funds, including the benefits of research services that may be available to the Advisers and their affiliates as a result of securities transactions effected for the Funds and other investment advisory clients. In evaluating the fall-out benefits to be received by the Advisers and their affiliates under the New Agreements, the Board considered whether the Transaction would have an impact on the fall-out benefits currently realized by the Advisers and their affiliates in connection with services provided pursuant to the Current Advisory Agreements.
The Board of each Fund considered that Morgan Stanley may derive reputational and other benefits from its ability to use the names of the Advisers and their affiliates in connection with operating and marketing the Funds. The Board considered that the Transaction, if completed, would significantly increase Morgan Stanley’s assets under management and expand Morgan Stanley’s investment capabilities.
Eaton Vance
Tax-Managed Growth Fund 1.0
December 31, 2020
Board of Trustees’ Contract Approval — continued
Economies of Scale
The Board also considered the extent to which the Advisers and their affiliates, on the one hand, and the Funds, on the other hand, can expect to realize benefits from economies of scale as the assets of the Funds increase. The Board acknowledged the difficulty in accurately measuring the benefits resulting from economies of scale, if any, with respect to the management of any specific Fund or group of funds. As part of the 2020 Annual Approval Process, the Board reviewed data summarizing the increases and decreases in the assets of the Funds and of all Eaton Vance funds as a group over various time periods, and evaluated the extent to which the total expense ratio of each Fund and the profitability of the Advisers and their affiliates may have been affected by such increases or decreases.
The Board noted that Morgan Stanley and the Advisers are expected to benefit from possible growth of the Funds resulting from enhanced distribution capabilities, including with respect to the Funds’ potential access to Morgan Stanley’s institutional client base. Based upon the foregoing, the Board concluded that the Funds currently share in the benefits from economies of scale, if any, when they are realized by the Advisers, and that the Transaction is not expected to impede a Fund from continuing to benefit from any future economies of scale realized by its Adviser.
Conclusion
Based on its consideration of the foregoing, and such other information it deemed relevant, including the factors and conclusions described above, the Contract Review Committee recommended to the Board approval of the New Agreements. Based on the recommendation of the Contract Review Committee, the Board, including a majority of the Independent Trustees, unanimously voted to approve the New Agreements for the
Funds and recommended that shareholders approve the New Agreements.
Eaton Vance
Tax-Managed Growth Fund 1.0
December 31, 2020
Management and Organization
Fund Management. The Trustees of Eaton Vance Series Trust (the Trust) and Tax-Managed Growth Portfolio (the Portfolio) are responsible for the overall management and supervision of the Trust’s and Portfolio’s affairs. The Trustees and officers of the Trust and the Portfolio are listed below. Except as indicated, each individual has held the office shown or other offices in the same company for the last five years. Trustees and officers of the Trust and the Portfolio hold indefinite terms of office. The “noninterested Trustees” consist of those Trustees who are not “interested persons” of the Trust and the Portfolio, as that term is defined under the 1940 Act. The business address of each Trustee and officer is Two International Place, Boston, Massachusetts 02110. As used below, “EVC” refers to Eaton Vance Corp., “EV” refers to Eaton Vance, Inc., “EVM” refers to Eaton Vance Management, “BMR” refers to Boston Management and Research and “EVD” refers to Eaton Vance Distributors, Inc. EVC and EV are the corporate parent and trustee, respectively, of EVM and BMR. EVD is the Fund’s principal underwriter, the Portfolio’s placement agent and a wholly-owned subsidiary of EVC. Each officer affiliated with Eaton Vance may hold a position with other Eaton Vance affiliates that is comparable to his or her position with EVM listed below. Each Trustee oversees 144 portfolios (with the exception of Messrs. Faust and Wennerholm and Ms. Frost who oversee 143 portfolios) in the Eaton Vance Complex (including all master and feeder funds in a master feeder structure). Each officer serves as an officer of certain other Eaton Vance funds. Each Trustee and officer serves until his or her successor is elected.
| | | | | | |
| Name and Year of Birth | | Position(s) with the Trust and the Portfolio | | Trustee Since(1) | | Principal Occupation(s) and Directorships During Past Five Years and Other Relevant Experience |
|
| Interested Trustee |
| | | |
Thomas E. Faust Jr. 1958 | | Trustee | | 2007 | | Chairman, Chief Executive Officer and President of EVC, Director and President of EV, Chief Executive Officer and President of EVM and BMR, and Director of EVD. Trustee and/or officer of 143 registered investment companies. Mr. Faust is an interested person because of his positions with EVM, BMR, EVD, EVC and EV, which are affiliates of the Trust and the Portfolio. Directorships in the Last Five Years. Director of EVC and Hexavest Inc. (investment management firm). |
|
| Noninterested Trustees |
| | | |
Mark R. Fetting 1954 | | Trustee | | 2016 | | Private investor. Formerly held various positions at Legg Mason, Inc. (investment management firm) (2000-2012), including President, Chief Executive Officer, Director and Chairman (2008-2012), Senior Executive Vice President (2004-2008) and Executive Vice President (2001-2004). Formerly, President of Legg Mason family of funds (2001-2008). Formerly, Division President and Senior Officer of Prudential Financial Group, Inc. and related companies (investment management firm) (1991-2000). Other Directorships in the Last Five Years. None. |
| | | |
Cynthia E. Frost 1961 | | Trustee | | 2014 | | Private investor. Formerly, Chief Investment Officer of Brown University (university endowment) (2000-2012). Formerly, Portfolio Strategist for Duke Management Company (university endowment manager) (1995-2000). Formerly, Managing Director, Cambridge Associates (investment consulting company) (1989-1995). Formerly, Consultant, Bain and Company (management consulting firm) (1987-1989). Formerly, Senior Equity Analyst, BA Investment Management Company (1983-1985). Other Directorships in the Last Five Years. None. |
| | | |
George J. Gorman 1952 | | Trustee | | 2014 | | Principal at George J. Gorman LLC (consulting firm). Formerly, Senior Partner at Ernst & Young LLP (a registered public accounting firm) (1974-2009). Other Directorships in the Last Five Years. Formerly, Trustee of the BofA Funds Series Trust (11 funds) (2011-2014) and of the Ashmore Funds (9 funds) (2010-2014). |
| | | |
Valerie A. Mosley 1960 | | Trustee | | 2014 | | Chairwoman and Chief Executive Officer of Valmo Ventures (a consulting and investment firm). Formerly, Partner and Senior Vice President, Portfolio Manager and Investment Strategist at Wellington Management Company, LLP (investment management firm) (1992-2012). Formerly, Chief Investment Officer, PG Corbin Asset Management (1990-1992). Formerly worked in institutional corporate bond sales at Kidder Peabody (1986-1990). Other Directorships in the Last Five Years. Director of DraftKings, Inc. (digital sports entertainment and gaming company) (since September 2020). Director of Groupon, Inc. (e-commerce provider) (since April 2020). Director of Envestnet, Inc. (provider of intelligent systems for wealth management and financial wellness) (since 2018). Formerly, Director of Dynex Capital, Inc. (mortgage REIT) (2013-2020). |
Eaton Vance
Tax-Managed Growth Fund 1.0
December 31, 2020
Management and Organization — continued
| | | | | | |
| Name and Year of Birth | | Position(s) with the Trust and the Portfolio | | Trustee Since(1) | | Principal Occupation(s) and Directorships During Past Five Years and Other Relevant Experience |
|
| Noninterested Trustees (continued) |
| | | |
William H. Park 1947 | | Chairperson of the Board and Trustee | | 2016 (Chairperson) 2003 (Trustee) | | Private investor. Formerly, Consultant (management and transactional) (2012-2014). Formerly, Chief Financial Officer, Aveon Group L.P. (investment management firm) (2010-2011). Formerly, Vice Chairman, Commercial Industrial Finance Corp. (specialty finance company) (2006-2010). Formerly, President and Chief Executive Officer, Prizm Capital Management, LLC (investment management firm) (2002-2005). Formerly, Executive Vice President and Chief Financial Officer, United Asset Management Corporation (investment management firm) (1982-2001). Formerly, Senior Manager, Price Waterhouse (now PricewaterhouseCoopers) (a registered public accounting firm) (1972-1981). Other Directorships in the Last Five Years. None. |
| | | |
Helen Frame Peters 1948 | | Trustee | | 2008 | | Professor of Finance, Carroll School of Management, Boston College. Formerly, Dean, Carroll School of Management, Boston College (2000-2002). Formerly, Chief Investment Officer, Fixed Income, Scudder Kemper Investments (investment management firm) (1998-1999). Formerly, Chief Investment Officer, Equity and Fixed Income, Colonial Management Associates (investment management firm) (1991-1998). Other Directorships in the Last Five Years. None. |
| | | |
Keith Quinton 1958 | | Trustee | | 2018 | | Private investor, researcher and lecturer. Independent Investment Committee Member at New Hampshire Retirement System (since 2017). Formerly, Portfolio Manager and Senior Quantitative Analyst at Fidelity Investments (investment management firm) (2001-2014). Other Directorships in the Last Five Years. Director (since 2016) and Chairman (since 2019) of New Hampshire Municipal Bond Bank. |
| | | |
Marcus L. Smith 1966 | | Trustee | | 2018 | | Private investor. Member of Posse Boston Advisory Board (foundation) (since 2015). Formerly, Portfolio Manager at MFS Investment Management (investment management firm) (1994-2017). Other Directorships in the Last Five Years. Director of MSCI Inc. (global provider of investment decision support tools) (since 2017). Formerly, Director of DCT Industrial Trust Inc. (logistics real estate company) (2017-2018). |
| | | |
Susan J. Sutherland 1957 | | Trustee | | 2015 | | Private investor. Director of Ascot Group Limited and certain of its subsidiaries (insurance and reinsurance) (since 2017). Formerly, Director of Hagerty Holding Corp. (insurance and reinsurance) (2015-2018). Formerly, Associate, Counsel and Partner at Skadden, Arps, Slate, Meagher & Flom LLP (law firm) (1982-2013). Other Directorships in the Last Five Years. Director of Kairos Acquisition Corp. (insurance/InsurTech acquisition company) (since 2021). Formerly, Director of Montpelier Re Holdings Ltd. (global provider of customized insurance and reinsurance products) (2013-2015). |
| | | |
Scott E. Wennerholm 1959 | | Trustee | | 2016 | | Private Investor. Formerly, Trustee at Wheelock College (postsecondary institution) (2012-2018). Formerly, Consultant at GF Parish Group (executive recruiting firm) (2016-2017). Formerly, Chief Operating Officer and Executive Vice President at BNY Mellon Asset Management (investment management firm) (2005-2011). Formerly, Chief Operating Officer and Chief Financial Officer at Natixis Global Asset Management (investment management firm) (1997-2004). Formerly, Vice President at Fidelity Investments Institutional Services (investment management firm) (1994-1997). Other Directorships in the Last Five Years. None. |
| | | | | | |
| Name and Year of Birth | | Position(s) with the Trust and the Portfolio | | Officer Since(2) | | Principal Occupation(s) During Past Five Years |
| |
| Principal Officers who are not Trustees | | |
| | | |
Eric A. Stein 1980 | | President | | 2020 | | Vice President and Chief Investment Officer, Fixed Income of EVM and BMR. Prior to November 1, 2020, Mr. Stein was a co-Director of Eaton Vance’s Global Income Investments. Also Vice President of Calvert Research and Management (“CRM”). |
| | | |
Edward J. Perkin 1972 | | President of the Portfolio | | 2014 | | Chief Equity Investment Officer and Vice President of EVM and BMR since 2014. Also Vice President of CRM. |
Eaton Vance
Tax-Managed Growth Fund 1.0
December 31, 2020
Management and Organization — continued
| | | | | | |
| Name and Year of Birth | | Position(s) with the Trust and the Portfolio | | Officer Since(2) | | Principal Occupation(s) During Past Five Years |
| |
| Principal Officers who are not Trustees (continued) | | |
| | | |
Deidre E. Walsh 1971 | | Vice President | | 2009 | | Vice President of EVM and BMR. |
| | | |
Maureen A. Gemma 1960 | | Secretary and Chief Legal Officer | | 2005 | | Vice President of EVM and BMR. Also Vice President of CRM. |
| | | |
James F. Kirchner 1967 | | Treasurer | | 2007 | | Vice President of EVM and BMR. Also Vice President of CRM. |
| | | |
Richard F. Froio 1968 | | Chief Compliance Officer | | 2017 | | Vice President of EVM and BMR since 2017. Formerly Deputy Chief Compliance Officer (Adviser/Funds) and Chief Compliance Officer (Distribution) at PIMCO (2012-2017) and Managing Director at BlackRock/Barclays Global Investors (2009-2012). |
| (1) | Year first appointed to serve as Trustee for a fund in the Eaton Vance family of funds. Each Trustee has served continuously since appointment unless indicated otherwise. |
| (2) | Year first elected to serve as officer of a fund in the Eaton Vance family of funds when the officer has served continuously. Otherwise, year of most recent election as an officer of a fund in the Eaton Vance family of funds. Titles may have changed since initial election. |
Eaton Vance Funds
IMPORTANT NOTICES
Privacy. The Eaton Vance organization is committed to ensuring your financial privacy. Each entity listed below has adopted privacy policy and procedures (“Privacy Program”) Eaton Vance believes is reasonably designed to protect your personal information and to govern when and with whom Eaton Vance may share your personal information.
| • | | At the time of opening an account, Eaton Vance generally requires you to provide us with certain information such as name, address, social security number, tax status, account numbers, and account balances. This information is necessary for us to both open an account for you and to allow us to satisfy legal requirements such as applicable anti-money laundering reviews and know-your-customer requirements. |
| • | | On an ongoing basis, in the normal course of servicing your account, Eaton Vance may share your information with unaffiliated third parties that perform various services for Eaton Vance and/or your account. These third parties include transfer agents, custodians, broker/dealers and our professional advisers including auditors, accountants, and legal counsel. Eaton Vance may share your personal information with our affiliates. Eaton Vance may also share your information as required or permitted by applicable law. |
| • | | We have adopted a Privacy Program we believe is reasonably designed to protect the confidentiality of your personal information and to prevent unauthorized access to your information. |
| • | | We reserve the right to change our Privacy Program at any time upon proper notification to you. You may want to review our Privacy Program periodically for changes by accessing the link on our homepage: www.eatonvance.com. |
Our pledge of protecting your personal information applies to the following entities within the Eaton Vance organization: the Eaton Vance Family of Funds, Eaton Vance Management, Eaton Vance WaterOak Advisors, Eaton Vance Distributors, Inc., Eaton Vance Trust Company, Eaton Vance Management (International) Limited, Eaton Vance Advisers International Ltd., Eaton Vance Global Advisors Limited, Eaton Vance Management’s Real Estate Investment Group, Boston Management and Research, Calvert Research and Management, and Calvert Funds. This notice supersedes all previously issued privacy disclosures. For more information about Eaton Vance’s Privacy Program or about how your personal information may be used, please call 1-800-262-1122.
Delivery of Shareholder Documents. The Securities and Exchange Commission (SEC) permits funds to deliver only one copy of shareholder documents, including prospectuses, proxy statements and shareholder reports, to fund investors with multiple accounts at the same residential or post office box address. This practice is often called “householding” and it helps eliminate duplicate mailings to shareholders. Eaton Vance, or your financial intermediary, may household the mailing of your documents indefinitely unless you instruct Eaton Vance, or your financial intermediary, otherwise. If you would prefer that your Eaton Vance documents not be householded, please contact Eaton Vance at 1-800-262-1122, or contact your financial intermediary. Your instructions that householding not apply to delivery of your Eaton Vance documents will typically be effective within 30 days of receipt by Eaton Vance or your financial intermediary.
Portfolio Holdings. Each Eaton Vance Fund and its underlying Portfolio(s) (if applicable) files a schedule of portfolio holdings on Part F to Form N-PORT with the SEC. Certain information filed on Form N-PORT may be viewed on the Eaton Vance website at www.eatonvance.com, by calling Eaton Vance at 1-800-262-1122 or in the EDGAR database on the SEC’s website at www.sec.gov.
Proxy Voting. From time to time, funds are required to vote proxies related to the securities held by the funds. The Eaton Vance Funds or their underlying Portfolios (if applicable) vote proxies according to a set of policies and procedures approved by the Funds’ and Portfolios’ Boards. You may obtain a description of these policies and procedures and information on how the Funds or Portfolios voted proxies relating to portfolio securities during the most recent 12-month period ended June 30, without charge, upon request, by calling 1-800-262-1122 and by accessing the SEC’s website at www.sec.gov.
This Page Intentionally Left Blank
This Page Intentionally Left Blank
Investment Adviser of Tax-Managed Growth Portfolio
Boston Management and Research
Two International Place
Boston, MA 02110
Administrator of Eaton Vance Tax-Managed Growth Fund 1.0
Eaton Vance Management
Two International Place
Boston, MA 02110
Principal Underwriter*
Eaton Vance Distributors, Inc.
Two International Place
Boston, MA 02110
(617) 482-8260
Custodian
State Street Bank and Trust Company
State Street Financial Center, One Lincoln Street
Boston, MA 02111
Transfer Agent
BNY Mellon Investment Servicing (US) Inc.
Attn: Eaton Vance Funds
P.O. Box 9653
Providence, RI 02940-9653
(800) 262-1122
Independent Registered Public Accounting Firm
Deloitte & Touche LLP
200 Berkeley Street
Boston, MA 02116-5022
Fund Offices
Two International Place
Boston, MA 02110
| * | FINRA BrokerCheck. Investors may check the background of their Investment Professional by contacting the Financial Industry Regulatory Authority (FINRA). FINRA BrokerCheck is a free tool to help investors check the professional background of current and former FINRA-registered securities firms and brokers. FINRA BrokerCheck is available by calling 1-800-289-9999 and at www.FINRA.org. The FINRA BrokerCheck brochure describing this program is available to investors at www.FINRA.org. |

157 12.31.20
The registrant has adopted a code of ethics applicable to its Principal Executive Officer, Principal Financial Officer and Principal Accounting Officer. The registrant undertakes to provide a copy of such code of ethics to any person upon request, without charge, by calling 1-800-262-1122. The registrant has not amended the code of ethics as described in Form N-CSR during the period covered by this report. The registrant has not granted any waiver, including an implicit waiver, from a provision of the code of ethics as described in Form N-CSR during the period covered by this report.
| Item 3. | Audit Committee Financial Expert |
The registrant’s Board has designated George J. Gorman and William H. Park, each an independent trustee, as audit committee financial experts. Mr. Gorman is a certified public accountant who is the Principal at George J. Gorman LLC (a consulting firm). Previously, Mr. Gorman served in various capacities at Ernst & Young LLP (a registered public accounting firm), including as Senior Partner. Mr. Gorman also has experience serving as an independent trustee and audit committee financial expert of other mutual fund complexes. Mr. Park is a
certified public accountant who is a private investor. Previously, he served as a consultant, as the Chief Financial Officer of Aveon Group, L.P. (an investment management firm), as the Vice Chairman of Commercial Industrial Finance Corp. (specialty finance company), as President and Chief Executive Officer of Prizm Capital Management, LLC (investment management firm), as Executive Vice President and Chief Financial Officer of United Asset Management Corporation (an institutional investment management firm) and as a Senior Manager at Price Waterhouse (now PricewaterhouseCoopers) (a registered public accounting firm).
| Item 4. | Principal Accountant Fees and Services |
Eaton Vance Tax-Managed Growth Fund 1.0 (the “Fund”) is a series of Eaton Vance Series Trust (the “Trust”), a Massachusetts business trust, which, including the Funds, contains a total of 1 series (the “Series”). The Trust is registered under the Investment Company Act of 1940 as an open-end management investment company. This Form N-CSR relates to the Fund’s annual report
(a)-(d)
The following tables present the aggregate fees billed to the Fund for the Fund’s fiscal years ended December 31, 2019 and December 31, 2020 by the registrant’s principal accountant, Deloitte & Touche LLP (“D&T”), for professional services rendered for the audit of the Fund’s annual financial statements and fees billed for other services rendered by D&T during such periods.
Eaton Vance Tax-Managed Growth Fund 1.0
| | | | | | | | |
Fiscal Years Ended | | 12/31/19 | | | 12/31/20 | |
Audit Fees | | $ | 16,800 | | | $ | 16,800 | |
Audit-Related Fees(1) | | $ | 0 | | | $ | 0 | |
Tax Fees(2) | | $ | 6,912 | | | $ | 5,602 | |
All Other Fees(3) | | $ | 0 | | | $ | 0 | |
| | | | | | | | |
Total | | $ | 23,712 | | | $ | 22,402 | |
| | | | | | | | |
| (1) | Audit-related fees consist of the aggregate fees billed for assurance and related services that are reasonably related to the performance of the audit of the registrant’s financial statements and are not reported under the category of audit fees. |
| (2) | Tax fees consist of the aggregate fees billed for professional services rendered by the principal accountant relating to tax compliance, tax advice, and tax planning and specifically include fees for tax return preparation and other related tax compliance/planning matters. |
| (3) | All other fees consist of the aggregate fees billed for products and services provided by the principal accountant other than audit, audit-related, and tax services. |
(e)(1) The registrant’s audit committee has adopted policies and procedures relating to the pre-approval of services provided by the registrant’s principal accountant (the “Pre-Approval Policies”). The Pre-Approval Policies establish a framework intended to assist the audit committee in the proper discharge of its pre-approval responsibilities. As a general matter, the Pre-Approval Policies (i) specify certain types of audit, audit-related, tax, and other services determined to be pre-approved by the audit committee; and (ii) delineate specific procedures governing the mechanics of the pre-approval process, including the approval and monitoring of audit and non-audit service fees. Unless a service is specifically pre-approved under the Pre-Approval Policies, it must be separately pre-approved by the audit committee.
The Pre-Approval Policies and the types of audit and non-audit services pre-approved therein must be reviewed and ratified by the registrant’s audit committee at least annually. The registrant’s audit committee maintains full responsibility for the appointment, compensation, and oversight of the work of the registrant’s principal accountant.
(e)(2) No services described in paragraphs (b)-(d) above were approved by the registrant’s audit committee pursuant to the “de minimis exception” set forth in Rule 2-01 (c)(7)(i)(C) of Regulation S-X.
(f) Not applicable.
(g) The following table presents (i) the aggregate non-audit fees (i.e., fees for audit-related, tax, and other services) billed to the Fund (the only series of the Trust) by D&T for the last two fiscal years of the Fund; and (ii) the aggregate non-audit fees (i.e., fees for audit-related, tax, and other services) billed to the Eaton Vance organization by D&T for the last two fiscal years.
| | | | | | | | |
Fiscal Years Ended | | 12/31/19 | | | 12/31/20 | |
Registrant | | $ | 6,912 | | | $ | 5,602 | |
Eaton Vance(1) | | $ | 59,903 | | | $ | 150,300 | |
| (1) | The investment adviser to the Fund, as well as any of its affiliates that provide ongoing services to the Fund, are subsidiaries of Eaton Vance Corp. |
(h) The registrant’s audit committee has considered whether the provision by the registrant’s principal accountant of non-audit services to the registrant’s investment adviser and any entity controlling, controlled by, or under common control with the adviser that provides ongoing services to the registrant that were not pre-approved pursuant to Rule 2-01(c)(7)(ii) of Regulation S-X is compatible with maintaining the principal accountant’s independence.
| Item 5. | Audit Committee of Listed Registrants |
Not applicable.
| Item 6. | Schedule of Investments |
Please see schedule of investments contained in the Report to Stockholders included under Item 1 of this Form N-CSR.
| Item 7. | Disclosure of Proxy Voting Policies and Procedures for Closed-End Management Investment Companies |
Not applicable.
| Item 8. | Portfolio Managers of Closed-End Management Investment Companies |
Not applicable.
| Item 9. | Purchases of Equity Securities by Closed-End Management Investment Company and Affiliated Purchasers |
Not applicable.
| Item 10. | Submission of Matters to a Vote of Security Holders |
No material changes.
| Item 11. | Controls and Procedures |
(a) It is the conclusion of the registrant’s principal executive officer and principal financial officer that the effectiveness of the registrant’s current disclosure controls and procedures (such disclosure controls and procedures having been evaluated within 90 days of the date of this filing) provide reasonable assurance that the information required to be disclosed by the registrant has been recorded, processed, summarized and reported within the time period specified in the Commission’s rules and forms and that the information required to be disclosed by the registrant has been accumulated and communicated to the registrant’s principal executive officer and principal financial officer in order to allow timely decisions regarding required disclosure.
(b) There have been no changes in the registrant’s internal controls over financial reporting during the period covered by this report that has materially affected, or is reasonably likely to materially affect, the registrant’s internal control over financial reporting.
| Item 12. | Disclosure of Securities Lending Activities for Closed-End Management Investment Companies |
Not applicable.
Signatures
Pursuant to the requirements of the Securities Exchange Act of 1934 and the Investment Company Act of 1940, the registrant has duly caused this report to be signed on its behalf by the undersigned, thereunto duly authorized.
| | |
| Eaton Vance Series Trust |
| |
| By: | | /s/ Eric A. Stein |
| | Eric A. Stein |
| | President |
| |
| Date: | | February 24, 2021 |
Pursuant to the requirements of the Securities Exchange Act of 1934 and the Investment Company Act of 1940, this report has been signed below by the following persons on behalf of the registrant and in the capacities and on the dates indicated.
| | |
| By: | | /s/ James F. Kirchner |
| | James F. Kirchner |
| | Treasurer |
| |
| Date: | | February 24, 2021 |
| |
| By: | | /s/ Eric A. Stein |
| | Eric A. Stein |
| | President |
| |
| Date: | | February 24, 2021 |