Exhibit 1.3
Anooraq Resources Corporation
Management Discussion and Analysis of Financial Condition and Results of Operations for the period ended December 31, 2010
TABLE OF CONTENTS
1
Anooraq Resources Corporation
Management Discussion and Analysis of Financial Condition and Results of Operations for the period ended December 31, 2010
This Management’s Discussion and Analysis (“MD&A”) should be read in conjunction with the annual consolidated financial statements of Anooraq Resources Corporation (“Anooraq” or “the Company” or “the Group”) for the years ended December 31, 2010 and 2009, prepared in accordance with International Financial Reporting Standards (“IFRS”), as issued by the International Accounting Standards Board, which are publicly available on the System for Electronic Analysis and Retrieval (“SEDAR”) at www.sedar.com and on the U.S. Securities and Exchange Commission’s (“SEC”) Electronic Document Gathering and Retrieval System (“EDGAR”) at www.sec.gov.
Anooraq has prepared this MD&A with reference to National Instrument 51-102 “Continuous Disclosure Obligations” of the Canadian Securities Administrators. Under the U.S./Canada Multijurisdictional Disclosure System, Anooraq is permitted to prepare this MD&A in accordance with the disclosure requirements of Canada, which requirements are different from those of the United States.
Certain statements in this MD&A constitute forward-looking statements or forward-looking information within the meaning of applicable securities laws. Investors should carefully read the cautionary note in this MD&A regarding forward-looking statements and should not place undue reliance on any such forward-looking statements. See “Cautionary Note Regarding Forward-Looking Statements”.
As of January 1, 2009, Anooraq adopted International Financial Reporting Standards (“IFRS”) and the following disclosure, as well as its associated consolidated financial statements, has been prepared in accordance with IFRS as issued by the International Accounting Standards Board.
This MD&A is prepared as of March 23, 2011.
All dollar figures stated herein are expressed in Canadian dollars (“$”), unless otherwise specified.
Additional information about Anooraq, including Anooraq’s Annual Information Form for the fiscal year ended December 31, 2010 (“AIF”), which is included in Anooraq’s Annual Report on Form 40-F, can be found on SEDAR at www.sedar.com and on EDGAR at www.sec.gov.
Cautionary Note Regarding Forward-Looking Statements
This MD&A includes certain statements that may be deemed “forward-looking statements”. All statements in this MD&A, other than statements of historical facts, that address potential acquisitions, future production, reserve potential, exploration drilling, exploitation activities and events or developments that Anooraq expects, are forward-looking statements. These statements appear in a number of different places in this MD&A and can be identified by words such as “anticipates”, “estimates”, “projects”, “expects”, “intends”, “believes”, “plans”, “will”, “could”, “may”, or their negatives or other comparable words. Such forward-looking statements involve known and unknown risks, uncertainties and other factors that may cause Anooraq’s actual results, performance or achievements to be materially different from any future results, performance or achievements that may be expressed or implied by such forward-looking statements. Anooraq believes that such forward looking statements are based on material factors and reasonable assumptions, including assumptions: the Bokoni Mine will increase production levels from the previous years; the Ga-Phasha, Boikgantsho, Kwanda and Platreef Projects exploration results will continue to be positive; contracted parties provide goods and/or services on the agreed timeframes; equipment necessary for construction and development is available as scheduled and does not incur
2
Anooraq Resources Corporation
Management Discussion and Analysis of Financial Condition and Results of Operations for the period ended December 31, 2010
unforeseen breakdowns; no material labor slowdowns or strikes are incurred; plant and equipment functions as specified; geological or financial parameters do not necessitate future mine plan changes; and no geological or technical problems occur.
Forward-looking statements, however, are not guarantees of future performance and actual results or developments may differ materially from those projected in forward-looking statements. Factors that could cause actual results to differ materially from those in forward looking statements include fluctuations in market prices, the levels of exploitation and exploration successes, changes in and the effect of government policies with respect to mining and natural resource exploration and exploitation, continued availability of capital and financing, general economic, market or business conditions, failure of plant, equipment or processes to operate as anticipated, accidents, labor disputes, industrial unrest and strikes, political instability, insurrection or war, the effect of HIV/AIDS on labor force availability and turnover, and delays in obtaining government approvals. These factors and other risk factors that could cause actual results to differ materially from those in forward-looking statements are described in further detail under Item 6 “Risk Factors” in Anooraq’s AIF.
Anooraq advises investors that these cautionary remarks expressly qualify in their entirety all forward-looking statements attributable to Anooraq or persons acting on its behalf. Anooraq assumes no obligation to update its forward-looking statements to reflect actual results, changes in assumptions or changes in other factors affecting such statements, except as required by law. Investors should carefully review the cautionary statements and risk factors contained in this and other documents that Anooraq files from time to time with, or furnishes to, applicable Canadian securities regulators and the SEC.
Cautionary Note to Investors Concerning Estimates of Measured and Indicated Resources
This MD&A uses the terms “measured resources” and “indicated resources”. Anooraq advises investors that while those terms are recognized and required by Canadian regulations, the SEC does not recognize them. Investors are cautioned not to assume that any part or all of mineral deposits in these categories, not already classified as reserves, will ever be converted into reserves. In addition, requirements of Canadian National Instrument 43-101Standards of Disclosure for Mineral Projects (“NI 43-101”) for identification of “reserves” are not the same as those of the SEC, and reserves reported by us in compliance with NI 43-101 may not qualify as “reserves” under SEC standards. Under U.S. standards, mineralization may not be classified as a “reserve” unless the determination has been made that the mineralization could be economically and legally produced or extracted at the time the reserve determination is made. Investors should refer to the disclosure under the heading “Resource Category (Classification) Definitions” in Anooraq’s AIF.
Cautionary Note to Investors Concerning Estimates of Inferred Resources
This MD&A uses the term “inferred resources”. Anooraq advises investors that while this term is recognized and required by Canadian regulations, the SEC does not recognize it. “Inferred resources” have a great amount of uncertainty as to their existence, and as to their economic and legal feasibility. It cannot be assumed that all or any part of an inferred mineral resource will ever be upgraded to a higher category. Under Canadian rules, estimates of inferred mineral resources may not form the basis of economic studies, except in rare cases. Investors are cautioned not to assume that any part or all of an inferred resource exists, or is economically or legally mineable. Investors should refer to the disclosure under the heading “Resource Category (Classification) Definitions” in Anooraq’s AIF.
3
Anooraq Resources Corporation
Management Discussion and Analysis of Financial Condition and Results of Operations for the period ended December 31, 2010
Anooraq Resources Corporation is engaged in mining, exploration and development of Platinum Group Metals (“PGM”) mineral deposits located in the Bushveld Igneous Complex (“BIC”), South Africa. The BIC is the world’s largest platinum producing geological region, producing in excess of 75% of the annual primary platinum supply to international markets.
2009 represented the most important year in Anooraq’s history. With effect from July 1, 2009, the Company transformed from an exploration and development company into a PGM producer. Anooraq, through its wholly owned South African subsidiary Plateau Resources (Proprietary) Limited (“Plateau”), acquired an indirect 51% controlling interest and management control of Bokoni Platinum Mines (Proprietary) Limited (“Bokoni”) (formerly Lebowa Platinum Mine) and several PGM projects, including the advanced stage Ga-Phasha PGM Project (“Ga-Phasha Project”), the Boikgantsho PGM Project (“Boikgantsho Project”), and the early stage Kwanda PGM project (“Kwanda Project”), collectively, the “Anooraq Group”. These controlling interests were acquired through Plateau acquiring 51% of the shareholding of Bokoni Platinum Holdings (Proprietary) Limited (“Bokoni Holdco”), the holding company of Bokoni and the other project companies (“Bokoni Group”) on July 1, 2009, referred to as “the Bokoni Transaction”.
4
Anooraq Resources Corporation
Management Discussion and Analysis of Financial Condition and Results of Operations for the period ended December 31, 2010
Anooraq’s objective is to become a significant PGM group with a substantial and diversified PGM asset base, including producing and exploration assets. The acquisition of the controlling interest in Bokoni Holdco is the first stage of advancing the Group’s PGM production strategy and has resulted in the Group controlling a significant mineral resource base of approximately 200 million PGM ounces, the third largest PGM mineral resource base in South Africa. Of this, approximately 110 million PGM ounces is directly attributable to Anooraq. On implementation of the Bokoni Transaction, Anooraq assumed management control over the Bokoni Group operations. Anglo Platinum Limited (“Anglo Platinum”), a subsidiary of Anglo American plc, through its wholly owned subsidiary Rustenburg Platinum Mines Limited (“RPM”), retained a 49% non-controlling interest in Bokoni Holdco. The resultant Group corporate structure is depicted below:
Anooraq Resources Corporate Structure
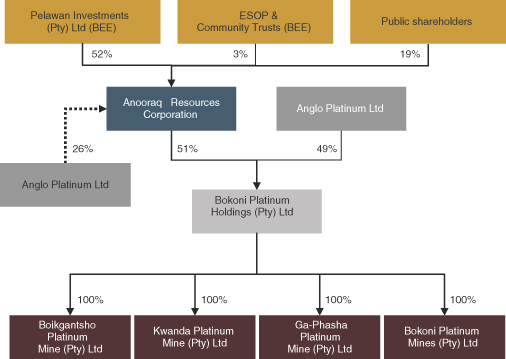
The above corporate structure is illustrated on a fully diluted share basis, post conversion of the B preference shares.
Plateau is an indirect wholly owned South African subsidiary of Anooraq. Plateau owns the 51% shareholding in Bokoni Holdco.
Black Economic Empowerment
Pelawan Investments (Pty) Ltd (“Pelawan”), the majority shareholder in Anooraq, is a broad based Black Economic Empowerment (“BEE”) entity. Through the Pelawan shareholding, Anooraq and the Bokoni Group remain compliant with the BEE equity requirements as contemplated by South African legislation and its associated charters regarding BEE equity holding requirements.
5
Anooraq Resources Corporation
Management Discussion and Analysis of Financial Condition and Results of Operations for the period ended December 31, 2010
Environmental Matters
The South African National Environmental Management Act 107 of 1998 (“NEMA”), which applies to all prospecting and mining operations, requires that these operations be carried out in accordance with generally accepted principles of sustainable development. It is a NEMA requirement that an applicant for a mining right must make prescribed financial provision for the rehabilitation or management of negative environmental impacts, which must be reviewed annually. The financial provisions deal with anticipated costs for:
| | • | | Planned decommissioning and closure |
| | • | | Post closure management of residual and latent environmental impacts |
In respect of Bokoni (discussed in section 1.2.1), an external assessment to determine the environmental closure liability was undertaken in July 2010. As at December 31, 2010, the total environmental rehabilitation liability for Bokoni, in current monetary terms (undiscounted), was estimated to be $13.7 million.
Annual contributions are made to a dedicated environmental trust fund to fund the estimated cost of rehabilitation during and at the end of the mine’s life.
As at December 31, 2010, the amount invested in the environmental trust fund was $2.8 million. The shortfall of $10.9 million between the funds invested in the environmental trust fund and the estimated rehabilitation cost is covered through a guarantee from Anglo Platinum.
Anooraq’s mining and exploration activities are subject to extensive environmental laws and regulations. These laws and regulations are continually changing and are generally becoming more restrictive. The Group has incurred, and expects to incur in future, expenditures to comply with such laws and regulations, but cannot predict the full amount of such future expenditures. Estimated future reclamation costs are based principally on current legal and regulatory requirements.
1.2.1 Bokoni Mine
Bokoni is an operating mine located on the north eastern limb of the BIC, to the north of and adjacent to the Ga-Phasha Project. The Bokoni property consists of two “new order” mining licenses covering an area of 15,459.78 hectares. The mining operation consists of a vertical shaft and three decline shaft systems to access underground mine development on the Merensky and UG2 Reef horizons. Bokoni has installed road, water and power infrastructure, as well as two processing concentrators, sufficient to meet its operational requirements up to completion of its first phase growth plans to 2014. Bokoni has an extensive shallow ore body, capable of supporting a life-of-mine plan in excess of 50 years. The December 31, 2009 life-of-mine plan was stated as being in excess of 100 years. The decrease in the life-of-mine plan is due to the improvement in the production statistics from roughly 250,000 tonnes per quarter when the Bokoni Mine was initially purchased in July 2009, to roughly 278,000 tonnes per quarter in the fourth quarter of 2010. The anticipated future increases in annual production have shortened the life-of-mine. Current mining operations are being conducted at shallow depths, on average 200m below surface. This benefits the Bokoni Mine’s operations as a result of the fact that there are no major refrigeration (and consequent power) requirements at shallower mining depths.
Bokoni is currently producing approximately 85,000 tonnes per month (“tpm”) of ore from its UG2 and Merensky reef horizons. UG2 production is mined exclusively from the Middelpunt Hill shaft (“MPH”) which
6
Anooraq Resources Corporation
Management Discussion and Analysis of Financial Condition and Results of Operations for the period ended December 31, 2010
consists of 4 adits and 2 underground levels. Merensky ore is produced from three shafts, namely: Vertical shaft, UM2 shaft and Brakfontein shaft. The Vertical shaft, which started in 1973, is the oldest of the three shafts and currently accounts for the bulk of the Merensky production. Production at Vertical shaft is expected to be maintained at 35,000 tpm for the medium term. Merensky production from the UM2 shaft is expected to increase from its current production levels of 10,000 tpm over the next two years. The new Brakfontein shaft is in a ramp up phase and is planned to increase from its current production levels of 20,000 tpm, to a steady state production level of 120,000 tpm by 2014. On completion of the initial ramp up phase to 2014, it is anticipated that Bokoni will produce 160,000 tpm of ore (240,000 PGM ounces per annum) consisting of 120,000 tpm from the Merensky reef and 40,000 tpm from the UG2 reef.
2010 has been the first complete year of mining operations at Bokoni since the Bokoni Transaction on July 1, 2009. Various operational challenges have been experienced during 2010 as well as a labor restructuring having been performed. Management remains confident that the objective of achieving a production rate of 160,000 tpm will be achieved by 2014.
Given the magnitude of Bokoni’s ore body, lying open at depth with its numerous attack points, management is of the view that Bokoni has the potential to be developed into a 375,000 tpm (570,000 PGM ounces per annum) steady state operation in the medium to longer term.
The older Vertical and UM2 shafts make use of conventional mining methods for narrow tabular ore bodies. Ore broken in stopes is transported laterally by means of track bound equipment and then hoisted through a vertical shaft system at Vertical shaft and an incline shaft system at UM2 shaft. Bokoni will invest in maintenance of infrastructure at Vertical shaft to sustain mining at current rates for the next four to five years. Additional opportunities, such as vamping, will be employed to supplement volumes from these shafts. Further opportunities to increase the life-of-mine of these shafts will also be investigated in the short to medium term.
The new Brakfontein shaft is being developed on a semi-mechanized basis, using a hybrid mining method, whereby ore broken in stopes is loaded directly onto a strike conveyor belt and taken out of the mine through a main decline conveyer belt system. This results in less human intervention in the hoisting process and a resultant lower unit operating cost of production. Development of haulages and crosscuts are effected by means of mechanized mining methods, and stoping is conducted using hand held electric drilling machines.
The MPH shaft is in the process of converting the transport of broken ore from its current mechanized hauling system to a conveyor belt transport system similar to that of Brakfontein shaft. Vamping opportunities in the older adit areas are being investigated to supplement underground mining production.
Bokoni, at the current metal prices and United States Dollar (“US$”) exchange rate against the South African Rand (“ZAR”), is slightly cash flow negative at an operational level (before depreciation and interest expense) largely as a result of the ramp up phase of the mine currently being experienced. Bokoni plans to become cash flow positive after capital expenditure towards the second half of 2011 if production levels increase and the current commodity prices for the PGM basket and US$ exchange rate against the ZAR continue at current levels.
Financing the Bokoni Transaction
The Company financed the Bokoni Transaction at the Plateau level through a combination of a senior term loan facility (the “Debt Facility”) provided by Standard Chartered Bank (“Standard Chartered”) and a vendor finance facility provided by Anglo Platinum, through its wholly owned subsidiary, RPM (the “Vendor Finance Facility”). In addition, the Company secured an agreement with RPM whereby RPM will provide Plateau with an operating
7
Anooraq Resources Corporation
Management Discussion and Analysis of Financial Condition and Results of Operations for the period ended December 31, 2010
cash flow shortfall facility (the “Plateau OCSF”) of up to a maximum of $110.3 million (ZAR 750 million) and access to RPM’s attributable share of the Bokoni Holdco cash flows (“the standby facility”) which, with the Company’s portion, will provide up to a maximum of 80% of all free cash flow generated from Bokoni to meet its repayment obligations in terms of the Debt Facility.
1. Debt Facility
Plateau secured the Debt Facility with Standard Chartered for an amount of up to $113.3 million (ZAR 750 million), including capitalized interest up to a maximum of three years or $37.8 million (ZAR 250 million). On July 1, 2009, Standard Chartered advanced $75.5 million (ZAR 500 million) to Plateau, and interest amounting to $17.9 million (ZAR 118.6 million) has been rolled up through December 31, 2010.
The Debt Facility is repayable in 12 semi-annual instalments, with the first payment due on January 31, 2013. Interest is calculated at a variable rate linked to the 3 month Johannesburg Inter Bank Agreed Rate (“JIBAR”) plus applicable margin and mandatory cost (11.735% at December 31, 2010).
The total amount of the interest payable on the notional amount of the Debt Facility of $75.5 million (ZAR 500 million) drawn down on July 1, 2009 is hedged with effect from July 1, 2009 until July 31, 2012.
The Debt Facility has a term of 108 months from July 1, 2009. Pursuant to the Bokoni Holdco Shareholders Agreement (as defined below), if Plateau’s cash flows derived from Bokoni Holdco are insufficient to meet its debt repayment obligations under the Debt Facility, RPM is obligated, pursuant to the standby loan facility, to provide Plateau a portion of its entitlement to the Bokoni Holdco cash flows such that Plateau can utilize up to 80% of all free cash flows generated from Bokoni Holdco for this purpose (see “Standby loan facility” below).
On December 11, 2009, 34% of the Debt Facility was syndicated to First Rand Bank Limited, acting through its Rand Merchant Bank division (“RMB”).
2. Vendor Finance Facility
RPM provided the Vendor Finance Facility to Plateau consisting of a cash component of $181.2 million (ZAR 1.2 billion) and a share settled component (the “Share-Settled Financing”) amounting to $166.1 million (ZAR 1.1 billion).
Cash component
In terms of the cash component of the Vendor Finance Facility, RPM subscribed for cumulative redeemable preference shares in the capital of Plateau (the “Plateau Preferred A Shares”) for an aggregate sum of $181.2 million (ZAR 1.2 billion). These shares are cumulative mandatory redeemable shares which attract a fixed annual cumulative dividend of 12%. The Group is obligated to redeem the outstanding amount, including undeclared dividends which should have been declared within six years (July 1, 2015) of issue, to the extent that the Group is in the position to redeem the shares. Any preference shares not redeemed in six years (at 2015) automatically roll over and must be finally redeemed nine years after issue (at July 1, 2018).
During the three year period prior to the initial maturity date (between July 1, 2012 and July 1, 2015), Plateau will be required to undertake a mandatory debt refinancing and use 100% of such external funding raised to settle the following amounts owing by Plateau to RPM at such time, in the following order: (i) any outstanding
8
Anooraq Resources Corporation
Management Discussion and Analysis of Financial Condition and Results of Operations for the period ended December 31, 2010
amounts owing to RPM in respect of the standby facility (ii) any outstanding amounts owing to RPM in respect of the Plateau OCSF and (iii) any amount owing to RPM in respect of the Plateau Preferred “A” Shares. Plateau is obliged to undertake the refinancing process but, if the debt is not re-financeable based upon the debt capital markets at that time (between July 1, 2012 and July 1, 2015), then there is no sanction on Plateau and all debt will automatically roll over until it is repayable in full by no later than July 1, 2018.
Share Settled Financing – The “B” preference shares
In terms of the Share Settled Financing component, Pelawan, the majority shareholder of Anooraq, established a wholly owned subsidiary (the “Pelawan SPV”) and transferred 56,691,303 Anooraq common shares to the Pelawan SPV. RPM subscribed for convertible preferred shares in the capital of the Pelawan SPV (the “SPV Preferred Shares”) for an aggregate sum of $162.9 million (ZAR 1.1 billion). Pelawan encumbered its shareholding in the Pelawan SPV in favour of RPM as security for the obligations of the Pelawan SPV pursuant to the SPV Preferred Shares.
The Pelawan SPV subscribed for two different classes of convertible “B” preferred shares in Plateau for $162.9 million (ZAR 1.1 billion), each such class being convertible into ordinary shares in the capital of Plateau (“Plateau Ordinary Shares”) and entitling the holder of the Plateau Ordinary Shares to a special dividend in cash, which, upon receipt, will immediately be used to subscribe for additional Plateau Ordinary Shares (“The “B” preference shares”). The “B” preference shares are zero coupon shares and carry no rights to preference dividends.
Pursuant to the agreement between the Pelawan SPV and Anooraq (the “Exchange Agreement”), upon Plateau issuing Plateau Ordinary Shares to the Pelawan SPV, Anooraq will take delivery of all Plateau Ordinary Shares held by the Pelawan SPV and, in consideration thereof, issue to the Pelawan SPV such number of Anooraq common shares that have a value equal to the value of such Plateau Ordinary Shares. The total number of Anooraq common shares to be issued on implementation of the Share-Settled Financing arrangement is 227.4 million common shares. Once all the “B” preference shares have been converted into Plateau Ordinary Shares and then into Anooraq common shares, the Company will have common shares outstanding equal to 425 million common shares of one class (not including any other Anooraq common shares that may hereafter be issued).
The SPV Preferred Shares are convertible in one or more tranches into ordinary shares in the capital of the Pelawan SPV (“SPV Ordinary Shares”) immediately upon demand by RPM, upon the earlier of (i) the date of receipt by the Pelawan SPV of a conversion notice from RPM and (ii) July 1, 2018. Upon such date, RPM will become entitled to a special dividend in cash, which will immediately be used to subscribe for SPV Ordinary Shares. Upon the Pelawan SPV converting the SPV Preferred Shares to SPV Ordinary Shares and RPM subscribing for additional SPV Ordinary Shares as a result of the special dividend, the Pelawan SPV will immediately undertake a share buyback of all SPV Ordinary Shares held by RPM and will settle the buyback consideration by delivering to RPM 115.8 million Anooraq common shares.
As and when RPM issues a conversion notice as described above, the Pelawan SPV will require Plateau to convert “B” preference shares in the capital of Plateau into Plateau Ordinary Shares. Immediately thereafter, Anooraq will take delivery of such Plateau Ordinary Shares and issue such number of Anooraq common shares to the Pelawan SPV pursuant to the Exchange Agreement as will enable the Pelawan SPV to buy back the SPV Ordinary Shares from RPM and result in Pelawan continuing to own a minimum 51% shareholding in Anooraq. The total number of Anooraq common shares issuable pursuant to the Exchange Agreement that will continue to
9
Anooraq Resources Corporation
Management Discussion and Analysis of Financial Condition and Results of Operations for the period ended December 31, 2010
be held by the Pelawan SPV is 111.6 million Anooraq shares. Such Anooraq common shares will be subject to a lock-in that will prevent the Pelawan SPV and Pelawan from disposing of such shareholding for so long as Pelawan is required to maintain a minimum 51% shareholding in Anooraq (at present the contractual lock-in provision for Pelawan on all of its shares held in Anooraq remains in place up to January 1, 2015).
The final result of the Share-Settled Financing is that: (i) RPM funded a payment of $162.9 million (ZAR 1.1 billion) to Plateau whereby RPM will ultimately receive a total of 115.8 million common shares in Anooraq; and (ii) Pelawan will receive an additional 111.6 million common shares in Anooraq.
RPM will be able to trade its 115.8 million Anooraq common shares on an unrestricted basis. RPM is not bound by any contractual lock-ins or restrictions in respect of any of the Group’s common shares which it will hold. It will, however, prior to disposing of any such common shares, engage in a consultative process with Anooraq, and endeavour to dispose of such common shares in Anooraq in a reasonable manner. Neither Pelawan nor any of the shareholders of Pelawan have any pre-emptive rights in respect of RPM’s common shares in Anooraq.
3. Operating Cash Flow Shortfall Facility (“OCSF”)
In order for Plateau to meet any required shareholder contributions in respect of operating or capital expenditure cash shortfalls at Bokoni during the initial three year ramp up phase at Bokoni, RPM provided Plateau with the Plateau OCSF which can be drawn up to a maximum of $113.3 million (ZAR 750 million) and is subject to certain annual draw down restrictions, in terms of quantum, during the first three years. The Plateau OCSF bears fixed interest at a rate of 15.84%, compounded quarterly in arrears. As at December 31, 2010, Plateau had drawn $57.2 million (ZAR 379 million) of the Plateau OCSF to meet its share of Bokoni’s funding requirements.
In addition, RPM has also made available to Bokoni $108.7 million (ZAR 720 million) (the “RPM OCSF”) subject to the same terms and conditions as the Plateau OCSF. As at December 31, 2010, Bokoni had drawn $54.8 million (ZAR 362.9 million) of the available $108.7 million (ZAR 720 million) of the RPM OCSF.
4. Standby loan facility
Anglo Platinum has made available to Plateau a standby loan facility of an amount equal to 29% of Bokoni cash flows, which Plateau may use to fund any cash flow shortfalls that may arise in Plateau funding any repayment obligations it may have under the Debt Facility during its term. The standby facility will bear interest at the prime rate of interest in South Africa (currently 9%). As at December 31, 2010 no draw down has been made on the standby facility. This standby loan facility will also be activated to the extent that free cash flow, after capital expenditure, at the Bokoni operations is generated during the anticipated interest roll up period between July 1, 2009 and July 1, 2012.
5. Security
The Debt Facility is secured through various security instruments, guarantees and undertakings provided by the Group against 51% of the cash flows generated by Bokoni, together with 51% of Bokoni’s asset base. The standby loan facility, Plateau OCSF and Plateau Preferred “A” shares rank behind the Debt Facility for security purposes.
Management of the Bokoni Operations
Plateau and RPM entered into a shareholders’ agreement (the “Bokoni Holdco Shareholders Agreement”) to govern the relationship between Plateau and RPM, as shareholders of Bokoni Holdco, and to provide management to Bokoni Holdco and its subsidiaries, including Bokoni.
10
Anooraq Resources Corporation
Management Discussion and Analysis of Financial Condition and Results of Operations for the period ended December 31, 2010
Plateau is entitled to nominate the majority of the directors of Bokoni Holdco and Bokoni, and has undertaken that the majority of such nominees will be Historically Disadvantaged Persons (“HDPs”) in South Africa. Anooraq has given certain undertakings to Anglo Platinum in relation to the maintenance of its status as an HDP controlled group pursuant to the Bokoni Holdco Shareholders Agreement.
Pursuant to the Bokoni Holdco Shareholders Agreement, the board of directors of Bokoni Holdco, which is controlled by Anooraq, has the right to call for shareholder contributions, either by way of a shareholder loan or equity. If a shareholder should default on an equity cash call, the other shareholder may increase its equity interest in Bokoni Holdco by funding the entire cash call, provided that, until the expiry of a period from the closing date of the Bokoni Transaction until the earlier of (i) the date on which the BEE credits attributable to the Anglo Platinum group and/or arising as a result of the Bokoni Transaction become legally secure, and (ii) the date on which 74% of the scheduled capital repayments due by Plateau to Standard Chartered pursuant to the Debt Facility are made in accordance with the debt repayment profile of the Debt Facility (the “Initial Period”), Plateau’s shareholding in Bokoni Holdco cannot be diluted for default in respect of equity contributions.
Pursuant to the terms of the shared services agreements, Anglo Platinum provides certain services to Bokoni at a cost that is no greater than the costs charged to any other Anglo American plc group company for the same or similar services. It is anticipated that, as Anooraq builds its internal capacity and transforms into a fully operational PGM producer, these services will be phased out and will be replaced either with internal or third party services. The Group, through Plateau, provides certain management services to Bokoni pursuant to service agreements entered into with effect from July 1, 2009.
Sale of Concentrate
Bokoni produces a metal-in-concentrate, all of which is sold to RPM in terms of a sale of concentrate agreement entered into between Plateau and RPM. This agreement has an initial five year term to July 1, 2014 and Plateau has the right to extend this agreement for a further five year term to July 1, 2019.
In terms of the sale of concentrate agreement, RPM receives metal-in-concentrate from Bokoni and pays for such metal based upon a formula equal to a percentage of the spot prices for the various metals contained in the concentrate delivered, including precious and base metals, less certain treatment charges and penalties (if applied).
In addition, the Bokoni Holdco shareholders agreement also governs the initial sale of concentrate from the Ga-Phasha Project upon commencement of production.
11
Anooraq Resources Corporation
Management Discussion and Analysis of Financial Condition and Results of Operations for the period ended December 31, 2010
1.2.2 Ga-Phasha Project
Management has commissioned ExplorMine Consultants (“ExplorMine”) to update the geological model for Ga-Phasha and compile a new Mineral Resource Estimate. The Mineral Resource Estimate has been updated with no material change from the previous estimate (“Technical Report on the Updated Resource Estimates on the Merensky Reef and UG2 Deposits, Ga-Phasha Platinum Group Metals Project, Eastern Limb, Bushveld Complex, Limpopo Province, Republic of South Africa” dated October 19, 2007, filed on SEDAR on October 30, 2007). The latest mineral resource estimate as of December 31, 2010 is tabled below:
| | | | | | | | | | | | | | | | | | | | | | | | | | | | | | | | | | | | | | | | | | | | | | | | | | | | | | |
Ga-Phasha <75 degrees rock temperature | | | Total | | | | | | | | | Attributable
to Anooraq | | | Pt
grade | | | Pd
grade | | | Rh
grade | | | Au
grade | | | Cu grade
% | | | Ni grade
% | |
| | | Reef
type | | | Mt | | | Grade
4E g/t | | | Containing
4E Moz | | | Attributable
% | | | Mt | | | Containing
4E Moz | | | (g/t) | | | (g/t) | | | (g/t) | | | (g/t) | | | |
Mineral Resources | | Measured | | | MR | | | | 20.1 | | | | 4.52 | | | | 2.9 | | | | 51 | | | | 10.3 | | | | 1.5 | | | | 2.73 | | | | 1.35 | | | | 0.15 | | | | 0.30 | | | | 0.08 | | | | 0.21 | |
| | Indicated | | | MR | | | | 37.7 | | | | 4.97 | | | | 6.0 | | | | 51 | | | | 19.2 | | | | 3.1 | | | | 3.04 | | | | 1.44 | | | | 0.18 | | | | 0.31 | | | | 0.08 | | | | 0.21 | |
| | Meas + Ind | | | MR | | | | 57.8 | | | | 4.82 | | | | 9.0 | | | | 51 | | | | 29.5 | | | | 4.6 | | | | 2.93 | | | | 1.41 | | | | 0.17 | | | | 0.31 | | | | 0.08 | | | | 0.21 | |
| | Measured | | | UG2 | | | | 40.4 | | | | 6.00 | | | | 7.8 | | | | 51 | | | | 20.6 | | | | 4.0 | | | | 2.53 | | | | 2.86 | | | | 0.51 | | | | 0.10 | | | | 0.03 | | | | 0.15 | |
| | Indicated | | | UG2 | | | | 60.8 | | | | 5.84 | | | | 11.4 | | | | 51 | | | | 31.0 | | | | 5.8 | | | | 2.46 | | | | 2.79 | | | | 0.50 | | | | 0.10 | | | | 0.03 | | | | 0.15 | |
| | Meas + Ind | | | UG2 | | | | 101.2 | | | | 5.90 | | | | 19.2 | | | | 51 | | | | 51.6 | | | | 9.8 | | | | 2.49 | | | | 2.82 | | | | 0.50 | | | | 0.10 | | | | 0.03 | | | | 0.15 | |
Notes:
| (1) | The qualified persons (“QPs”) responsible for the compilation of the mineral resource estimates are Andre Deiss, Garth Mitchell and Dr. W. Northrop. These QPs are independent consultants. |
| (2) | The mineral resources are inclusive of dilution and recovery factors. |
| (3) | A cut-off grade of 2.58 g/t for the Merensky Reef was applied. A cut-off grade of 3.23 g/t for the UG2 Reef was applied. |
| (4) | Metal price assumptions of US$1,500/oz platinum, US$478/oz palladium, US$2,000/oz rhodium and US$1,200/oz gold were used in the estimation of mineral resources. |
| (5) | 4E is the sum of platinum (Pt), palladium (Pd), rhodium (Rh) and gold (Au). |
1.2.3 Platreef Exploration Properties, Northern Limb
Anooraq holds interests in mineral rights (or “farms”) over 37,000 hectares that make up the Central Block, the Rietfontein Block, the Boikgantsho and Kwanda Projects (see below), collectively, known as the Platreef Properties.
Rietfontein Block
The Group has entered into a settlement agreement (the “Agreement”) effective December 11, 2009 with Ivanhoe Nickel & Platinum Ltd. (“Ivanplats”) to replace and supersede the 2001 agreement relating to the Rietfontein property located on the northern limb of the BIC. The Agreement settles the arbitration process relating to disagreements with respect to the exploration activities undertaken at the Rietfontein property. Salient terms of the new Agreement are as follows:
| | • | | Both parties abandon their respective claims under dispute forming the subject matter of arbitration. |
| | • | | The existing joint venture (“JV”) between the parties is amended such that the current Rietfontein JV is extended to incorporate a defined area of Ivanplats’ adjacent Turfspruit mineral property. Both parties retain their existing prospecting rights in respect of mineral properties in their own names but make these rights and technical information available to the extended JV (“the Extended JV”). |
12
Anooraq Resources Corporation
Management Discussion and Analysis of Financial Condition and Results of Operations for the period ended December 31, 2010
| | • | | Anooraq will be entitled to appoint a member to the Extended JV technical committee and all technical programmes going forward will be carried out with input from Anooraq. |
| | • | | Anooraq is awarded a 6% free carried interest in the Extended JV, provided that the Extended JV contemplates an open pit mining operation, incorporating the Rietfontein mineral property. Anooraq has no financial obligations under the Extended JV terms and Ivanplats is required to fund the entire exploration programme to feasibility study with no financial recourse to Anooraq. On delivery of the feasibility study, Anooraq may elect to either: |
| | • | | retain a participating interest of 6% in the Extended JV and finance its pro rata share of the project development going forward; or |
| | • | | relinquish its participating interest of 6% in the Extended JV in consideration for a 5% net smelter return royalty in respect of mineral products extracted from those areas of the Rietfontein mineral property forming part of the Extended JV mineral properties. |
Central Block
The Central Block consists of five farms or portions thereof, comprising a portion of Dorstland 768 LR, Hamburg 737 LR, Elandsfontein 766 LR, Molokongskop 780 LR and Noord Holland 775 LR.
The Group is currently evaluating its approach to properties on the Central Block, which may include potential joint venture relationships with third party exploration companies.
Kwanda Project
The Group intends to continue with its existing prospecting programs at the Kwanda mineral properties in 2011 at a cost of approximately $0.2 million.
1.2.4 Boikgantsho Project
Management has commenced a pre-feasibility study of the Boikgantsho project. The pre-feasibility will occur in phases, with phase 1 focusing on re-logging of a significant portion of the exploration drill holes. On completion of the re-logging exercise, management was informed that there was no correlation between the lithologies logged and the mineralized horizons. Furthermore, some lithologies were incorrectly identified. Management decided that a new geological model should be constructed and this necessitated that all the boreholes should be re-logged in order to develop a robust geological model that would include a correlation between lithology and mineralization.
The re-logging of all the boreholes has resulted in a change of scope of the project. The time schedule has increased by four months and Phase 2 is now expected to be completed by June 2011. The additional cost for the re-logging is approximately $0.2 million (ZAR1.1 million) resulting in the project cost for Phase 2 increasing to $1.7 million (ZAR11.3 million).
A preliminary geological model is expected to be completed by the end of January 2011. Early predictions are that the new geological model may result in alternative mining methods being considered, such as a higher grade underground massive stoping options as compared to a lower grade opencast mining method.
13
Anooraq Resources Corporation
Management Discussion and Analysis of Financial Condition and Results of Operations for the period ended December 31, 2010
1.2.5 Mineral reserves and resources
The annual Mineral Reserve and Resource Estimates for Bokoni, shown in tables 1 and 2 below, have been updated as of December 31, 2010. The QP responsible for the Reserve Estimate is Mr. B. Reddy (Anooraq executive non-independent). The QPs responsible for the Resource Estimate are Messer’s G. Mitchell, A. Deiss and Dr. W. Northrop of ExplorMine (Independent consultants).
There has been no material change from the reserve and resource estimates as of December 31, 2009.
Resources are inclusive of reserves.
Table 1: Ore Reserve Tabulation for the Bokoni Mine as at December 31, 2010
| | | | | | | | | | | | | | | | | | | | | | | | | | | | | | | | | | | | | | | | | | | | | | | | | | | | | | |
Bokoni Platinum Mine | | | Total | | | Attributable to Anooraq | | | Pt
grade
g/t | | | Pd
grade
g/t | | | Rh
grade
g/t | | | Au
grade
g/t | | | Cu
grade
% | | | Ni
grade
% | |
| | | Reef
type | | | Mt | | | Grade
4E g/t | | | Containing
4E Moz | | | Attributable
% | | | Mt | | | Grade
4E g/t | | | | | | | |
| | | | | | | | | | | | | | |
Ore Reserves | | Proved | | | MR | | | | 22.7 | | | | 4.26 | | | | 3.1 | | | | 51.0 | | | | 11.6 | | | | 4.26 | | | | 2.62 | | | | 1.25 | | | | 0.14 | | | | 0.25 | | | | 0.07 | | | | 0.18 | |
| | Probable | | | MR | | | | 8.5 | | | | 3.84 | | | | 1.0 | | | | 51.0 | | | | 4.3 | | | | 3.84 | | | | 2.36 | | | | 1.12 | | | | 0.13 | | | | 0.23 | | | | 0.06 | | | | 0.16 | |
| | Total Reserve | | | MR | | | | 31.2 | | | | 4.14 | | | | 4.2 | | | | 51.0 | | | | 15.9 | | | | 4.15 | | | | 2.55 | | | | 1.21 | | | | 0.14 | | | | 0.25 | | | | 0.07 | | | | 0.17 | |
| | | | | | | | |
Bokoni Platinum Mine | | | Total | | | Attributable to Anooraq | | | Pt
grade
g/t | | | Pd
grade
g/t | | | Rh
grade
g/t | | | Au
grade
g/t | | | Cu
grade
% | | | Ni
grade
% | |
| | | Reef
type | | | Mt | | | Grade
4E g/t | | | Containing
4E Moz | | | Attributable
% | | | Mt | | | Grade
4E g/t | | | | | | | |
| | | | | | | | | | | | | | |
Ore Reserves | | Proved | | | UG2 | | | | 18.3 | | | | 5.38 | | | | 3.2 | | | | 51.0 | | | | 9.3 | | | | 5.37 | | | | 2.21 | | | | 2.62 | | | | 0.44 | | | | 0.10 | | | | 0.05 | | | | 0.14 | |
| | Probable | | | UG2 | | | | 20.6 | | | | 5.14 | | | | 3.4 | | | | 51.0 | | | | 10.5 | | | | 5.14 | | | | 2.12 | | | | 2.51 | | | | 0.42 | | | | 0.09 | | | | 0.04 | | | | 0.14 | |
| | Total Reserve | | | UG2 | | | | 38.9 | | | | 5.25 | | | | 6.6 | | | | 51.0 | | | | 19.8 | | | | 5.24 | | | | 2.16 | | | | 2.56 | | | | 0.43 | | | | 0.09 | | | | 0.05 | | | | 0.14 | |
Notes:
| (1) | The QP responsible for the compilation of the mineral reserves is B. Reddy. |
| (2) | The mineral reserves are inclusive of dilution and recovery factors. |
| (3) | A cut-off grade of 2.58 g/t for the Merensky Reef was applied. |
| | A cut-off grade of 3.23 g/t for the UG2 Reef was applied. |
| (4) | Metal price assumptions of US$1,500/oz platinum, US$478/oz palladium, US$2,000/oz rhodium and US$1,200/oz gold were used in the estimation of mineral reserves. |
| (5) | 4E is the sum of platinum (Pt), palladium (Pd), rhodium (Rh) and gold (Au). |
14
Anooraq Resources Corporation
Management Discussion and Analysis of Financial Condition and Results of Operations for the period ended December 31, 2010
Table 2: Mineral Resources Tabulation for the Bokoni Mine as at December 31, 2010
| | | | | | | | | | | | | | | | | | | | | | | | | | | | | | | | | | | | | | | | | | | | | | | | | | | | | | |
Bokoni Platinum Mine | | | Total | | | Attributable to Anooraq | | | Pt
grade
g/t | | | Pd
grade
g/t | | | Rh
grade
g/t | | | Au
grade
g/t | | | Cu
grade
% | | | Ni
grade
% | |
| | | Reef
type | | | Mt | | | Grade
4E g/t | | | Containing
4E Moz | | | Attributable
% | | | Mt | | | Grade
4E g/t | | | | | | | |
| | | | | | | | | | | | | | |
Mineral Resources | | Measured | | | MR | | | | 43.9 | | | | 5.13 | | | | 7.2 | | | | 51.0 | | | | 22.4 | | | | 5.12 | | | | 3.15 | | | | 1.50 | | | | 0.17 | | | | 0.30 | | | | 0.08 | | | | 0.21 | |
| | Indicated | | | MR | | | | 53.8 | | | | 4.88 | | | | 8.4 | | | | 51.0 | | | | 27.4 | | | | 4.88 | | | | 2.99 | | | | 1.42 | | | | 0.18 | | | | 0.29 | | | | 0.08 | | | | 0.21 | |
| | Meas + Ind | | | MR | | | | 97.7 | | | | 4.99 | | | | 15.7 | | | | 51.0 | | | | 49.8 | | | | 4.98 | | | | 3.06 | | | | 1.45 | | | | 0.17 | | | | 0.30 | | | | 0.08 | | | | 0.21 | |
| | | | | | | | |
Bokoni Platinum Mine | | | Total | | | Attributable to Anooraq | | | Pt
grade
g/t | | | Pd
grade
g/t | | | Rh
grade
g/t | | | Au
grade
g/t | | | Cu
grade
% | | | Ni
grade
% | |
| | | Reef
type | | | Mt | | | Grade
4E g/t | | | Containing
4E Moz | | | Attributable
% | | | Mt | | | Grade
4E g/t | | | | | | | |
| | | | | | | | | | | | | | |
Mineral Resources | | Measured | | | UG2 | | | | 96.9 | | | | 6.49 | | | | 20.2 | | | | 51.0 | | | | 49.4 | | | | 6.49 | | | | 2.67 | | | | 3.17 | | | | 0.53 | | | | 0.12 | | | | 0.06 | | | | 0.17 | |
| | Indicated | | | UG2 | | | | 123.2 | | | | 6.30 | | | | 25.0 | | | | 51.0 | | | | 62.8 | | | | 6.30 | | | | 2.62 | | | | 3.04 | | | | 0.53 | | | | 0.11 | | | | 0.05 | | | | 0.17 | |
| | Meas + Ind | | | UG2 | | | | 220.1 | | | | 6.38 | | | | 45.2 | | | | 51.0 | | | | 112.3 | | | | 6.38 | | | | 2.64 | | | | 3.10 | | | | 0.53 | | | | 0.11 | | | | 0.05 | | | | 0.17 | |
Notes:
| (1) | The QPs responsible for the compilation of the mineral resources are G. Mitchell, A. Deiss and Dr. W. Northrop. |
| (2) | The mineral resources are inclusive of mineral reserves. |
| (3) | The mineral resources are inclusive of dilution and recovery factors. |
| (4) | A cut-off grade of 2.58 g/t for the Merensky Reef was applied. A cut-off grade of 3.23 g/t for the UG2 Reef was applied. |
| (5) | Metal price assumptions of US$1,500/oz platinum, US$478/oz palladium, US$2,000/oz rhodium and US$1,200/oz gold were used in the estimation of mineral resources. |
| (6) | 4E is the sum of platinum (Pt), palladium (Pd), rhodium (Rh) and gold (Au). |
Mineral reserves on the Merensky Reef increased by 0.7 million ounces (“Moz”) from 2009 to 2010 to a total of 4.2 Moz, whilst the UG2 Mineral Reserves decreased by 0.7 Moz. The changes in mineral reserves are due to the following:
| | • | | change in the new Mineral Resource estimate from the ExplorMine optimisation exercise; |
| | • | | change in block sizes from previous 400 m by 400 m to the current 100 m by 200 m resulted in a change in the dip. The Merensky mineral reserves increase due to the dip change from 22.83 ° to 20.79 ° is estimated at 1.1 Moz; and |
| | • | | Vertical shaft Merensky reserves were added as a result of winzes below the bottom level and addition of strike distance on the western side. |
There was an adjustment in the pillar design on the UG2 which resulted in a reduction of mineral reserves.
None of these changes are deemed material in the opinion of the QP.
15
Anooraq Resources Corporation
Management Discussion and Analysis of Financial Condition and Results of Operations for the period ended December 31, 2010
| 1.3 | Market Trends and Outlook |
Quarterly Trends
PGM metal prices (in US$) increased by 13% during the fourth quarter of 2010 when compared to the third quarter of 2010. In addition, the strength of the ZAR continued to weigh negatively on the ZAR PGM basket price during this period. The net effect of this was that the ZAR PGM basket price increased by 6% during the quarter. This continued ZAR strength is affecting operating margins negatively.
Annual Trends
The PGM basket price (in US$) for the year was 24% higher than the basket price achieved the previous year. The US$ platinum price was 34% higher in the current year compared to the previous year.
The average ZAR:US$ exchange rate demonstrated a strengthening of the ZAR of 13% compared to the average exchange rate of the 2009 year.
Outlook
The global outlook for PGM demand remains positive in the medium term, with the white metals (platinum and palladium) continuing to be viewed as late cycle recovery metals moving towards 2012 and onwards. This price recovery remains largely predicated upon expected renewed demand in vehicle sales and manufacturing in the U.S. and European economies, together with sustained auto sector growth in emerging market economies.
| 1.4 | Selected Annual Information and results of operations |
For the years ended December 31, 2010, 2009 and 2008, the consolidated financial statements have been prepared in accordance with IFRS as issued by the International Accounting Standards Board.
| | | | | | | | | | | | |
Consolidated statements of financial position | | As at
December 31,
2010 | | | As at
December 31,
2009 | | | As at
December 31,
2008 | |
Total assets | | $ | 1,092,106,255 | | | $ | 1,014,215,005 | | | $ | 12,898,793 | |
Non-current liabilities (including short-term portion of loans and borrowings) | | $ | 938,895,976 | | | $ | 777,605,509 | | | $ | 12,967,753 | |
| | | | | | | | | | | | |
| | | |
Consolidated statements of comprehensive income | | Year ended
December 31,
2010 | | | Year ended
December 31,
2009 | | | Year ended
December 31,
2008 | |
Revenue | | $ | 148,286,833 | | | $ | 62,627,868 | | | | — | |
Cost of sales | | $ | (173,151,188 | ) | | $ | (80,966,467 | ) | | | — | |
Gross loss | | $ | (24,864,355 | ) | | $ | (18,338,599 | ) | | | — | |
Loss for the year | | $ | (93,658,806 | ) | | $ | (51,780,529 | ) | | $ | (13,970,096 | ) |
Basic and diluted loss per share | | $ | 0.12 | | | $ | 0.12 | | | $ | 0.08 | |
Weighted average number of common shares outstanding | | | 424,665,314 | | | | 305,971,455 | | | | 185,775,361 | |
16
Anooraq Resources Corporation
Management Discussion and Analysis of Financial Condition and Results of Operations for the period ended December 31, 2010
With effect from July 1, 2009, Anooraq transformed from an exploration and development company into the manager of an operating mine. This transformation was achieved through the Bokoni Transaction. The Bokoni Transaction is discussed in detail in the “Overview” section (Section 1.2). As a result of the acquisition of Bokoni on July 1, 2009, the financial position and results of operations of the Group have changed significantly.
Statement of Financial Position
2010 compared to 2009
The increase in total assets is primarily due to additions to capital work-in-progress relating to mine development and infrastructure costs, capitalization of borrowing costs as well as increased trade receivables.
The increase in total non-current liabilities, including the short-term portion of the loans and borrowings, is primarily due to the increase in the loans and borrowings due to the interest accrued on the A Preference Shares, Senior Loan Facility and OCSF, as well as the drawdowns made on the OCSF during the 2010 financial year.
During the fourth quarter of 2010, an arbitration award was made against Anooraq in the arbitrations between the Company and North Corporate Finance Advisory Services Limited as well as QuestCo (Pty) Ltd relating to disputed fee payments associated with the Bokoni Transaction. The award was that the Company should make payment to North Corporate Finance Advisory Services Limited of an amount of $1.2 million or the ZAR equivalent as at the date of payment together with interest at 15.5% from July 1, 2009 to date of payment, as well as the costs of the arbitration. As against Questco (Pty) Ltd it was ordered that the Company make payment of the sum of $0.6 million (ZAR 4 million) plus VAT of $0.09 million (ZAR 0.6 million) and interest calculated at 15.5% from July 1, 2009 as well as costs. These amounts (total of $2.2 million) were discharged in full subsequent to December 31, 2010. The above was included as part of trade and other payables on the Company’s Statement of Financial Position.
2009 compared to 2008
The increase in total assets and non-current liabilities was primarily due to assets and liabilities acquired in the Bokoni Transaction. A summary of the assets acquired and liabilities assumed at the acquisition date are as follows:
| | | | |
| | | Fair Value | |
Property, plant and equipment | | | 725,226,891 | |
Capital work-in-progress | | | 216,194,965 | |
Cash deposits held in Platinum Producers Environmental Trust | | | 2,356,993 | |
Other non-current assets | | | 741 | |
Trade and other receivables | | | 22,477,941 | |
Cash and cash equivalents | | | 3,576,912 | |
Loans and borrowings (owing to RPM) | | | (493,666,666 | ) |
Deferred taxation | | | (231,040,913 | ) |
Provisions | | | (4,308,137 | ) |
Current tax payable | | | (123,034 | ) |
Trade and other payables | | | (30,845,374 | ) |
| | | | |
Total identifiable net assets at July 1, 2009 | | | 209,850,319 | |
| | | | |
17
Anooraq Resources Corporation
Management Discussion and Analysis of Financial Condition and Results of Operations for the period ended December 31, 2010
Goodwill and a non-controlling interest of $12.4 million and $102.8 million, respectively, were recognized on acquisition. Also refer to section 1.2.1 for a discussion on the financing of the Bokoni Transaction.
Statement of Comprehensive Income
2010 compared to 2009
The loss for the year ended December 31, 2010 increased from $51.8 million in the previous year to $93.7 million. The loss per share remained unchanged at 12 cents per share as at December 31, 2010. The primary reason for the increase is that the 2010 financial year includes the results of the Bokoni Mine as well as the interest expense resulting from the funding of the Bokoni Transaction for a 12 month period whereas it is only included from July 1, 2009 (six month period) for the 2009 financial year.
The major contributors to the increase in the loss to $93.7 million for the year ended December 31, 2010 were:
| | • | | A gross loss from mining activities of $24.9 million (2009 – $18.3 million). |
The main reason for the higher gross loss in 2010 compared to 2009 is that the 2009 results reflects a six month period of Bokoni Mine being under Anooraq control and the 2010 results reflect a 12 month period.
Although tons milled for the 12 months of 2010 increased by 10% compared to the 12 months of 2009, lower grades and recoveries led to ounces produced for the 12 months of 2010 being in line with the 12 months of 2009.
The PGM basket price for the 12 months of 2010 was 42% higher than the basket price achieved for the 12 months of 2009. The basket price for the 12 months of 2010 was US$1,257 / oz (ZAR 9,207 / oz) compared to US$882 / oz (ZAR 7,418 / oz) for the 12 months of 2009. The average platinum price of US$1,611 / oz for the 12 months of 2010 was 34% higher than the average platinum price of US$1,205 / oz for the 12 months of 2009.
The average ZAR/US$ exchange rate for the 12 months of 2010 was ZAR 7.32 / US$ compared to the average exchange rate of the 12 months of 2009 of ZAR 8.41 / US$ (a strengthening of the ZAR against the US$ of 13%).
Cost of sales, in absolute terms, increased from 2009 to 2010 mainly as a result of an increase in labour, contractor and utility costs.
On a per ton basis, production costs were US$135 (ZAR 989) per ton as compared to US$126 (ZAR 1,061) per ton in the previous year, a US$ increase of 7% (decrease of 7% in ZAR, which is the functional currency of the Bokoni Mine).
The ZAR per ton operating cost for the 12 months of 2010 of ZAR 989 is in line with the six months of 2009 under Anooraq control of ZAR 965.
18
Anooraq Resources Corporation
Management Discussion and Analysis of Financial Condition and Results of Operations for the period ended December 31, 2010
Bokoni Production Statistics
The production statistics below reflect year-on-year 2009 compared to 2010, although Bokoni Mine was only under the control of Anooraq from July 1, 2009, as well as the production statistics for the six months under Anooraq control.
| | | | | | | | | | | | | | | | | | |
| | | | | 2010 12 months | | | 2009 12 months | | | %
Change | | | 2009 6 months | |
4E oz produced | | Oz | | | 116,164 | | | | 116,586 | | | | — | | | | 61,347 | |
Tonnes milled | | T | | | 1,044,084 | | | | 943,403 | | | | 10 | | | | 503,398 | |
Built-up head grade | | g/t milled,4E | | | 4.12 | | | | 4.31 | | | | (4 | ) | | | 4.29 | |
UG2 mined to total output | | % | | | 32 | | | | 36 | | | | (11 | ) | | | 34 | |
Development meters | | M | | | 10,292 | | | | 11,326 | | | | (9 | ) | | | 4,922 | |
R/t operating cost/ton milled | | ZAR/t | | | 989 | | | | 1,061 | | | | 7 | | | | 965 | |
R/4E operating cost/4E oz | | ZAR/4E oz | | | 8,888 | | | | 8,582 | | | | (4 | ) | | | 7,918 | |
Total labor (mine operations) | | Number | | | 5,116 | | | | 4,402 | | | | 16 | | | | 4,402 | |
| | • | | Transaction costs of $1.8 million (2009 – $10.4 million) |
Transaction costs decreased as a result of the completion of the Bokoni Transaction. The 2010 costs primarily relate to the arbitration matter discussed in the “Statement of Financial Position” above.
| | • | | Finance expenses of $67.5 million (2009 – $20.3 million) |
The Bokoni Transaction was funded through a number of interest bearing loans, which only commenced accruing interest as from July 1, 2009. The loans accrued interest for the full 12 months in 2010, resulting in increased finance expenses for the year. Refer to note 19 of the annual consolidated financial statements (available on SEDAR) for details of the individual liabilities to which the finance expenses relate. In addition, interest capitalized decreased compared to the prior year as a result of lower capital work-in-progress during the year.
| | • | | Income tax (credit) of $17.3 million (2009 – $7.6 million) |
Due to the taxable losses and deductable expenditure incurred by the Group in 2010, a portion of the deferred tax liabilities was reversed to profit or loss. Refer to note 29 of the notes to the annual consolidated financial statements (available on SEDAR) for a reconciliation of the income tax for the periods. The primary reason for the difference between the statutory tax rate of 28.5% and the effective tax rate of 15.6% during 2010 is primarily due to non-deductible expenditure, including preference share dividends which are not tax deductible.
2009 compared to 2008
The loss for the year ended December 31, 2009 increased from $14 million in the previous year to $51.8 million primarily as a result of the Bokoni Transaction. The loss per share increased from 8 cents, for the year ended December 31, 2008, to 12 cents for the year ended December 31, 2009. The increase in the loss per share was not as significant as the increase in the loss for the year as a result of the effect of the change in the weighted number of common shares from 185.8 million, as at December 31, 2008, to 305.9 million as at December 31, 2009.
The major contributors to the increase in the loss to $51.8 million for the year ended December 31, 2009 were:
| | • | | A gross loss from mining activities of $18.3 million (2008 – nil) |
Due to the Bokoni Transaction in 2009, the Company had revenue and cost of sales for the first time and made a gross loss for the first six months of trading.
19
Anooraq Resources Corporation
Management Discussion and Analysis of Financial Condition and Results of Operations for the period ended December 31, 2010
| | • | | Transaction costs of $10.4 million (2008 – nil) |
These transaction costs included consulting and legal expenses relating to the Bokoni Transaction, which are discussed in detail in the “Overview” section (Section 1.2). During the year the Group adopted IFRS 3,Business Combinations (2008), which resulted in $1.6 million being expensed in the first quarter of 2009 relating to previously capitalised transaction costs.
| | • | | Finance expenses of $20.3 million (2008 – $1.8 million) |
The Bokoni Transaction was funded through a number of interest bearing loans, as discussed in Section 1.2, resulting in increased finance expenses for the year.
| | • | | Income tax (credit) of $7.6 million (2008 – nil) |
Due to the taxable losses and deductable expenditure incurred by the Group in 2009, a portion of the deferred tax liabilities acquired in the Bokoni Transaction was reversed to profit or loss. Refer to note 29 of the annual consolidated financial statements (available on SEDAR) for a reconciliation of the income tax for the periods.
Also refer to Section 1.9 for a discussion of the quarterly results.
At December 31, 2010, the Group had negative working capital, excluding restricted cash, of $64.1 million compared to available working capital of $28.4 million as at December 31, 2009.
The Group has the following long-term contractual obligations as at December 31, 2010:
| | | | | | | | | | | | | | | | | | | | |
| | | Payments due by period ($ million) | |
| | | Total | | | Less than
one year | | | 2 to 3
years | | | 4 to 5
years | | | More than
5 years | |
Capital commitments | | | 8.1 | | | | 8.1 | | | | — | | | | — | | | | — | |
Long-term debt (1) | | | 1,107.4 | | | | 94.4 | | | | 44 | | | | 890.4 | | | | 78.6 | |
Operating lease commitments (2) | | | 0.8 | | | | 0.4 | | | | 0.4 | | | | — | | | | — | |
Purchase obligations (3) | | | 27.3 | | | | 12.5 | | | | 8.7 | | | | 6.1 | | | | — | |
Derivative liability | | | 5 | | | | — | | | | 5 | | | | — | | | | — | |
Total | | | 1,148.6 | | | | 115.4 | | | | 58.1 | | | | 896.5 | | | | 78.6 | |
| (1) | The Company’s long-term debt obligations, which include scheduled interest payments, are denominated in ZAR. Payments and settlement on the obligation are denominated in ZAR. Long-term obligations have been presented at an exchange rate of $1 = ZAR 6.6225. |
| (2) | The Company has routine market-related leases on its office premises in Johannesburg, South Africa. |
| (3) | The term “purchase obligation” means an agreement to purchase goods or services that is enforceable and legally binding on the Company that specifies all significant terms, including: fixed or minimum quantities to be purchased; fixed, minimum or variable price provisions; and the approximate timing of the transaction. |
At December 31, 2010, the Group did not meet certain covenants specified in the Debt Facility agreements. As a result, the related obligation has been reflected as due in less than one year.
The lenders have subsequently waived their rights and entitlements arising from the failure of the Group to meet the specific covenants. Therefore, there is no legal or constructive obligation to settle the related debt within the next 12 months.
20
Anooraq Resources Corporation
Management Discussion and Analysis of Financial Condition and Results of Operations for the period ended December 31, 2010
The breach of the covenant resulted from not meeting certain production levels of concentrate (“production covenant”) during 2010, compared to the operating budget and mine plan approved by the lenders. In addition to waiving the breach at December 31, 2010, the lenders have also waived the measurement of the production covenant against the currently approved operating budget and mine plan for 2011.
As a result of the completion of the Bokoni Transaction, the Group secured additional financial resources and long-term funding (as discussed underFinancing the Bokoni Transaction – 1.2.1). The Group expects that the cash flows from the mining operations and the additional financing secured through the OCSF will be sufficient to meet its immediate ongoing operational and capital cash requirements of the Group.
The Group’s major cash commitments for the next year relate to its obligation to fund project expansion capital requirements at Bokoni.
Default on borrowings would occur if legal obligations according to loan agreements are not met. Defaults would include failure to make scheduled payments and violation of loan covenants.
The Group is currently pursuing various alternative funding structures to achieve a more affordable debt/equity level as management believes that the Group would not be able to service the repayments on the loans and borrowings once it becomes due in the medium to long term.
Anooraq’s sources of capital are primarily debt and equity.
The Group’s access to capital sources is dependent upon general commodity and financial market conditions. The Group has secured long-term funding to meet its operating and capital obligations through to the end of 2012. The Group’s cash balance as at December 31, 2010 was $25.8 million.
In addition to its cash resources, the Group has access to various committed debt facilities from senior bank lenders and Anglo Platinum. All of the Group’s debt facilities have been negotiated such that it is not obliged to commence with mandatory repayments of any loan capital amounts drawn and/or any refinancing of these loans during the holiday period while it has management control at Bokoni (July 1, 2009 – January 1, 2013). The reason for this capital repayment “holiday” period is that Bokoni is currently in a highly capital intensive project expansion growth phase until it reaches its phase 1 steady state of production of 160,000 tpm (240,000 PGM ounces per annum) expected in 2014. Thereafter, capital repayments will commence on the Debt Facility and the Group will be required to undertake a refinancing of the Anglo Platinum debt facilities as and when market conditions allow it to do so. As discussed in section 1.5, management has already started taking action to consider refinancing plans in the short-term.
21
Anooraq Resources Corporation
Management Discussion and Analysis of Financial Condition and Results of Operations for the period ended December 31, 2010
A summary of the Group’s debt facilities as at December 31, 2010 is as follows:
| | | | | | | | | | | | |
| | | Balance at December 31,
2010 | | | Total available
facility | | | Un-utilized portion
of facility | |
| | | $ million | |
Debt facility | | | 93.4 | | | | 113.3 | | | | 19.9 | |
OCSF | | | 111.2 | | | | 222.0 | | | | 110.8 | |
RPM funding loan | | | 89.4 | | | | 108.7 | | | | 19.3 | |
“A” preference share facility | | | 418.1 | | | | 418.1 | | | | — | |
Other | | | 4.8 | | | | 4.8 | | | | — | |
Total | | | 716.9 | | | | 866.9 | | | | 150 | |
In addition to the facilities above, Anglo Platinum made available to Plateau a standby facility for up to a maximum of 29% of Bokoni cash flows, which Plateau may use to fund any cash flow shortfalls that may arise in funding any accrued and capitalized interest and fund repayment obligations under the Debt Facility during its term.
See a discussion of these debt facilities in Section 1.2.1.
In addition, Anooraq’s ability to raise new equity in the equity capital markets is subject to the mandatory requirement that Pelawan, its majority BEE shareholder, retain a 51% fully diluted shareholding in the Company up until January 1, 2015, as required by covenants given by Pelawan and Anooraq in favour of the Department of Mineral Resources (“DMR”), the South African Reserve Bank and Anglo Platinum.
| 1.7 | Off-Balance Sheet Arrangements |
The Group has not entered into any off-balance sheet transactions.
| 1.8 | Transactions with Related Parties |
| (i) | At December 31, 2009, Hunter Dickinson Services Inc. (“HDSI”) was a related party as it was a private company owned equally by several public companies, one of which was the Company. HDSI and the Company also share a common director, Ronald Thiessen, who is a member of the key management personnel of HDSI. During the period, Hunter Dickinson Inc (a corporation incorporated under the laws of British Columbia) negotiated the repurchase of all the outstanding shares of HDSI from other HDSI shareholders, including the Company. The purchase price was $1. The shares were bought back pursuant to an HDSI restructuring transaction which management believes was at arm’s length. Due to the above mentioned transaction, as at December 31, 2010, HDSI is no longer considered to be a related party. |
| (ii) | RPM: The Group concluded a number of agreements with respect to services at Bokoni with RPM, a wholly owned subsidiary of Anglo Platinum and 49% shareholder in Bokoni Holdco, on March 28, 2008. These agreements were amended on May 13, 2009 and include a limited off-take agreement whereby Bokoni sells the concentrate produced at the mine to RPM at market related prices. |
Pursuant to the terms of various shared services agreements, the Anglo American plc group of companies will continue to provide certain operational services to Bokoni at a cost that is no greater than the costs charged to any other Anglo American plc group for the same or similar services. It is anticipated that, as Anooraq builds its internal capacity, and makes the transformation to a fully operational PGM producer, these services will be phased out and replaced either with internal services or third party services.
22
Anooraq Resources Corporation
Management Discussion and Analysis of Financial Condition and Results of Operations for the period ended December 31, 2010
Transactions with RPM during the twelve months ended December 31, 2010 are summarized below:
| | | | |
Concentrate sales | | $148.3 million | | (2009 – $62.6 million) |
Cost of sales* | | $19.6 million | | (2009 – $6.2 million) |
Administration expenses | | $3.6 million | | (2009 – $0.2 million) |
Finance expense | | $62.8 million | | (2009 – $28 million) |
|
| (before interest capitalised) |
| * -included in cost of sales are the following: |
| | |
Metal accounting services | | $0.5 million | | (2009 – $0.1 million) |
Supply chain services | | $11.9 million | | (2009 – $0.7 million) |
Treatment of Anglo ore | | ($1) million | | (2009 – ($0.8) million) |
Other | | $8.2 million | | (2009 – $6.2 million) |
| | $19.6 million | | (2009 – $6.2 million) |
|
| The following balances were outstanding to/from RPM at December 31, 2010: |
| | |
Loans and Borrowings | | $624.1 million | | (2009 – $484 million) |
Trade and other payables | | $2.5 million | | (2009 – $3.5 million) |
Trade and other receivables | | $33.3 million | | (2009 – $21.5 million) |
| 1.9 | Summary of Quarterly Results |
| | | | | | | | | | | | | | | | | | | | | | | | | | | | | | | | |
$ Million | | Dec 31,
2010 | | | Sep 30,
2010 | | | Jun 30,
2010 | | | Mar 31,
2010 | | | Dec 31,
2009 | | | Sep 30,
2009 | | | Jun 30,
2009 | | | Mar 31,
2009 | |
Revenue | | | 43.2 | | | | 34.5 | | | | 38.4 | | | | 32.2 | | | | 34.8 | | | | 27.8 | | | | — | | | | — | |
Cost of sales | | | (52 | ) | | | (44.5 | ) | | | (40.9 | ) | | | (35.6 | ) | | | (40.5 | ) | | | (40.5 | ) | | | — | | | | — | |
| | | | | | | | | | | | | | | | | | | | | | | | | | | | | | | | |
Gross loss | | | (8.8 | ) | | | (10.0 | ) | | | (2.5 | ) | | | (3.4 | ) | | | (5.7 | ) | | | (12.7 | ) | | | — | | | | — | |
| | | | | | | | | | | | | | | | | | | | | | | | | | | | | | | | |
Loss for the period | | | (32.4 | ) | | | (28.1 | ) | | | (19.9 | ) | | | (13.2 | ) | | | (18.6 | ) | | | (18.7 | ) | | | (10.8 | ) | | | (3.7 | ) |
Basic and diluted loss per share ($) | | | (0.04 | ) | | | (0.04 | ) | | | (0.03 | ) | | | (0.02 | ) | | | (0.03 | ) | | | (0.04 | ) | | | (0.06 | ) | | | (0.02 | ) |
Weighted number of common shares outstanding (million) | | | 425 | | | | 425 | | | | 425 | | | | 425 | | | | 305 | | | | 245 | | | | 186 | | | | 186 | |
Discussion of Last Eight Quarterly Results in General
During the first two quarters ended March 31, 2009 and June 30, 2009, the Group was regarded primarily as an exploration company. Therefore, the Group did not have any significant operating assets.
On July 1, 2009, the Group acquired 51% of the Bokoni Mine and also took management control. This was the first operating asset acquired by the Group that generated revenue. There was therefore a significant increase in the asset base of the Group as revenue generating assets were effectively acquired.
The Group had the following initiatives identified for Bokoni Mine to be achieved in the first 18 months, to establish the foundation for its future growth profile:
| | • | | Restructure the labor force to have 60% of labor in direct ore mining and 40% in support services. This was achieved at the end of the first quarter of 2010. |
23
Anooraq Resources Corporation
Management Discussion and Analysis of Financial Condition and Results of Operations for the period ended December 31, 2010
| | • | | To commence generating profits on an operational level. |
| | • | | Reduce the unit cost. The unit cost has reduced by 20% in the first 18 months. |
The Group is continuing its efforts to grow production (Phase 1 expansion program) in order to achieve the Group’s long-term goal of achieving a monthly production of 160,000 tonnes per month by 2014.
All of the above factors contributed to the increase in revenue from $0 for the quarter ended March 31, 2009 to $27.8 million for the quarter ended September 30, 2009, and ultimately to revenue of $43.2 million for the quarter ended December 31, 2010.
The continuing compounding of the interest on the loans and borrowings, relating to the Bokoni Transaction, of the Group have contributed to the increase in the quarterly loss which was $3.7 million for the quarter ended March 31, 2009, to $18.7 million for the quarter ended September 30, 2009, and ultimately steadily increasing to a loss of $32.4 million for the quarter ended December 31, 2010.
Q4 2010 Highlights
Production performance for the fourth quarter of 2010 was below management expectations. The operations faced a number of challenges in the quarter resulting in a drop in production as compared to the third quarter. Key production parameters were significantly down quarter on quarter. Square meters mined were 3.6% lower than the third quarter, while primary development was 18% lower than the previous quarter. Vamping (final removal of broken ore in panels and gullies where stoping (mining) operations have been completed) and backlog sweepings (removal of broken ore from panels that have been blasted longer than six month ago) decreased by 7% quarter on quarter.
A number of factors resulted in the poor production performance for the quarter. The main reasons for the poor performance include lost shifts as the Bokoni Mine was severely impacted by the fatal accident at MPH. The MPH operations were stopped for a week to rectify unsafe conditions. It was further impacted for another two weeks by a slow start up after the accident. A number of other shifts were lost at the various shafts due to stoppages by the DMR via the issuing of Section 54’s (a regulation in the Mineral and Petroleum Resources Development Act, 2002 (South Africa) (“Mineral Development Act”) that gives an inspector of the DMR the power to halt operations in event of dangerous conditions).
Management is continuing to address issues such as mining flexibility, trackless fleet availability and infrastructure changes at Brakfontein and MPH to increase production.
Bokoni Production Statistics:
| | | | | | | | |
| | | | | Q4 2010 | | Q3 2010 | | % Change |
4E oz produced | | Oz | | 30,776 | | 28,868 | | 7 |
Tonnes milled | | T | | 278,242 | | 252,861 | | 10 |
Built-up head grade | | g/t milled,4E | | 4.17 | | 4.01 | | 4 |
UG2 mined to total output | | % | | 24 | | 30 | | (20) |
Development meters | | M | | 2,308 | | 2,943 | | (22) |
R/t operating cost/ton milled | | ZAR/t | | 1,058 | | 1,012 | | 5 |
R/4E operating cost/4E oz | | ZAR/4E oz | | 9,566 | | 8,861 | | 8 |
Total labor (mine operations) | | Number | | 5,116 | | 4,674 | | 9 |
24
Anooraq Resources Corporation
Management Discussion and Analysis of Financial Condition and Results of Operations for the period ended December 31, 2010
Revenue
The mine concentrator milled 278,242 tonnes this quarter, which is 10% higher than the 252,861 tonnes milled in the third quarter. As a result of the higher tonnes milled, the mine produced 1,908 4E (includes platinum, palladium, rhodium and gold) ounces more than the third quarter.
| | • | | Revenue from the sale of concentrate was $43.2 million (ZAR 296.1 million) compared to the third quarter of $34.5 million (ZAR 242.3 million). The increase in revenue of $8.7 million is mainly due to the higher production as a result of the increased production efficiencies experienced at the concentrator. |
| | • | | The PGM basket price for the quarter was 13% higher than the basket price achieved the third quarter. The basket price for the current quarter was US$1,357 (ZAR 9,366) compared to US$1,201 (ZAR 8,804) for the third quarter. |
Cost of Sales
Cost of sales of $52 million was $7.5 million higher than the third quarter’s cost of sales of $44.5 million. The main reason was as follows:
| | • | | The stockpile adjustment during for the fourth quarter of 2010 of $3.8 million. |
| | • | | Labour costs increased by $1.4 million (13%) for the quarter. UMO and MDP heads remained relatively flat but labour costs relating to compulsory overtime shifts and Christmas working-in arrangements resulted in an increase in costs. At Middelpunt Hill, the labour hire costs increased from the third quarter of 2010 due to the appointment of Manniken, a contractor. Manniken were appointed to address the repair and maintenance of the trackless fleet that was intended to be filled by Fermel, a contractor. |
| | • | | Contractor costs increased by $0.7 million (30%) due to additional square meters being mined by contractors at UM2 and a 11% increase in the rate per cube at Brakfontein. |
| | • | | Store costs increased by $0.4 million (5%) in absolute terms for the fourth quarter of 2010 mainly as a result of the purchase of new brakes by Brakfontein, and the conversion of Load Haul Dumps (“LHDs”) to the new brake specifications, as well as increased mechanical costs on snatch blocks and jackpots by Brakfontein. |
| | • | | Utilities costs decreased by $0.7 million (24%) due to the application of summer electricity tariffs. |
| | • | | Increase in depreciation charge of $0.5 million. |
| | • | | Sundry costs remained unchanged between the third quarter of 2010 and the fourth quarter of 2010. |
| | • | | Exchange rate difference had a negative impact of $1.4 million. |
On a cost per ton basis, production cost was US$153 (ZAR 1,058) per ton as compared to US$141 (ZAR 1,034) per ton the third quarter, an increase of 8.5% in dollar and in ZAR terms.
Exchange rate
The average ZAR to Canadian dollar exchange rate for the quarter was ZAR 6.82, a decrease of 5.9% compared to the average exchange rate of the third quarter of ZAR 7.03.
25
Anooraq Resources Corporation
Management Discussion and Analysis of Financial Condition and Results of Operations for the period ended December 31, 2010
Finance expense
Finance expense for the quarter was $21 million compared to the previous quarter of $18.9 million. The reason for this increase was the increase in the OCSF draw downs and compounded interest on the funding loan facilities.
Safety
The Group’s Lost Time Injury Frequency Rate (“LTIFR”) increased to 1.4 in the fourth quarter from 1.3 in the third quarter of 2010. Management remains committed to safety at the operations. Active engagement with the South African Department of Mineral Resources on safety matters continues.
Capital
Total capital expenditure for the fourth quarter was $10.8 million (as opposed to $7.1 million for the third quarter), comprising 30% sustaining capital and 70% project expansion capital (as opposed to 2% sustaining capital and 98% project expansion capital for the third quarter).
Royalties: Implementation of the Mineral and Petroleum Resources Royalty Act, 2008 (Act no. 28 of 2008)
The Mineral and Petroleum Resources Royalty Act (the “Act”), imposes a royalty payable to the South African government based upon financial profits made through the transfer of mineral resources.
The royalty is based on a predetermined percentage applied to gross sales of unrefined metal produced. The predetermined percentage = 0.5 + [(EBIT (earnings before interest and tax) x 9)/gross sales]. The percentage cannot be less than 0.5%.
The royalty is accounted for on a monthly basis in the accounting records of Bokoni Platinum Mines (Pty) Ltd.
The payments in respect of the royalty are due in three intervals:
| | • | | Six months into the financial year (June 30) – calculation based on actual and estimated figures, and a first provisional payment based on this; |
| | • | | Twelve months into the financial year (December 31) – calculation based on actual and estimated figures, and a second provisional payment based on this; and |
| | • | | Six months after the financial year (June 30) – true up calculation done, and a final payment. |
The calculated royalty tax percentage for Bokoni for 2010 was the minimum percentage of 0.5%, and the resulting royalty expense amounted to $0.5 million for 2010.
Power Tariff Increases
The National Energy Regulator of South Africa released its decision on Eskom’s tariff increase applications during 2010. The effect of this decision is that power tariff increases in South Africa will be affected over a three year period as follows:
| | | | |
2010/2011 | | : | | 24.8% |
2011/2012 | | : | | 25.1% |
2012/2013 | | : | | 25.9% |
26
Anooraq Resources Corporation
Management Discussion and Analysis of Financial Condition and Results of Operations for the period ended December 31, 2010
The net effect of this decision is that current power input costs at mining operations in South Africa will increase by approximately 100% over the three year period from April 1, 2010. Bokoni operations are currently mining at relatively shallow depths with no major refrigeration requirements needed for the next 30 years of mining. Power costs currently comprise between 5% (summer tariffs) and 8% (winter tariffs) of total operating costs at the mine operations. Accordingly, the recently announced power rate increases will increase operating costs by between 5% and 8% over a three year period from April 1, 2010. Bokoni continues to focus efforts on power usage reduction as part of the efficiency improvement initiatives currently being implemented at the operations.
| 1.10 | Proposed Transactions |
At the current time, there are no reportable proposed transactions.
| 1.11 | Critical Accounting Estimates |
The Group’s accounting policies are presented in note 4 of the audited financial statements for the year ended December 31, 2010, which have been publicly filed on SEDAR atwww.sedar.com.
The preparation of the consolidated financial statements in accordance with IFRS requires management to make judgments, estimates and assumptions that affect the application of accounting policies and the reported amounts of assets, liabilities, income and expenses. Actual results may differ from these estimates.
Estimates and underlying assumptions are reviewed on an ongoing basis. Revisions to accounting estimates are recognized in the period in which the estimates are revised and in any future periods affected.
Information about critical judgments in applying accounting policies that have the most significant effect on the amounts recognized in the consolidated financial statements is included in the notes to the financial statements for the year ended December 31, 2010 where applicable.
These estimates include:
Taxation
The Group applies significant judgment in determining provisions for income taxes and deferred tax assets and liabilities.
Temporary differences arise between the carrying values of assets and liabilities for accounting purposes and the amounts used for tax purposes. These temporary differences result in tax liabilities being recognized and deferred tax assets being considered based on the probability of deferred tax assets being recoverable from future taxable income. A deferred tax asset is recognized to the extent that it is probable that future taxable profits will be available against which the deferred tax asset can be realized.
The Group provides deferred tax using enacted or substantively enacted tax rates at the reporting date on all temporary differences arising between the carrying values of assets and liabilities for accounting purposes and the amounts used for tax purposes, unless there is a temporary difference that is specifically excluded in accordance with IFRS. The carrying value of the Group’s net deferred tax assets assumes that the Group will be able to generate sufficient future taxable income in applicable tax jurisdictions, based on estimates and assumptions.
27
Anooraq Resources Corporation
Management Discussion and Analysis of Financial Condition and Results of Operations for the period ended December 31, 2010
Impairment of Mining Assets
The recoverable amount of mining assets, including goodwill relating to mining operations, is generally determined by utilizing discounted future cash flows. Factors such as the quality of the individual ore body and country risk are considered in determining the recoverable amount.
Key assumptions for the calculations of the mining assets’ recoverable amounts are the forward platinum group metal prices and the annual life-of-mine plans. In determining the commodity prices to be used, management assesses the long-term views of several reputable institutions on the commodity prices and, based on this, derives the forward platinum group metals prices. The life-of-mine plans are based on proven and probable reserves and have been approved by the Group.
During the 2010 fiscal year, the Group calculated the recoverable amounts based on updated life-of-mine plans using a discount rate that is based on the real post-tax weighted average cost of capital (“WACC”) of 9.67%. The WACC is based on the risk free rate as at December 31, 2010, a market risk premium, a Beta factor, an Alpha (Company specific risk premium), the post-tax cost of debt and the debt-equity ratio.
Refer to note 7 of the annual financial statements for details of key assumptions used in the 2010 impairment testing.
Cash flows used in the impairment calculations are based on life-of-mine plans which exceed five years. As per management assessment, no impairment was required for the year ended December 31, 2010. Management used consensus price and rate assumptions based on the forward views of several analysts as at December 31, 2010. Cash generating units are based on individual subsidiaries within the Anooraq group.
Should management’s estimate of the future not reflect actual events, impairments may be identified. Factors affecting the estimates include:
| | • | | changes to proven and probable ore reserves; |
| | • | | the grade of the ore reserves may vary significantly from time to time; |
| | • | | differences between actual commodity prices and commodity price assumptions; |
| | • | | unforeseen operational issues at the mine; and |
| | • | | changes in capital, operating, mining, processing and reclamation costs. |
Exposure and liabilities with regards to rehabilitation costs
Estimated environmental obligations, comprising pollution control, rehabilitation and mine closure, are based on the Group’s environmental management plans in compliance with current technological, environmental and regulatory requirements.
Management used a South African inflation rate of 5.2% over a period of 20 years in the calculation of the estimated net present value of the rehabilitation liability. The discount rate used for the calculation was 8.4% based on the future long-term view on government bonds.
28
Anooraq Resources Corporation
Management Discussion and Analysis of Financial Condition and Results of Operations for the period ended December 31, 2010
Fair value of share based payments
The fair values of options granted and share appreciation rights are determined using a Black-Scholes and binomial valuation models. The significant inputs into the models are: vesting period, risk free interest rate, volatility, price on date of grant and dividend yield. Refer to note 35 of the annual financial statements for the year ended December 31, 2010 for details on each of the share option and share appreciation schemes and assumptions used.
Inventory – Stockpiles
Stockpiles are measured by estimating the number of tonnes added and removed from the stockpile, the number of contained PGM ounces based on assay data and the estimated recovery percentage based on the expected processing method. Stockpile tonnages are verified by periodic surveys. There was no stockpile inventory at December 31, 2010.
Assessment of contingencies
Contingencies will only realize when one or more future events occur or fail to occur. The exercise of significant judgment and estimates of the outcome of future events are required during the assessment of the impact of such contingencies.
Mineral resources and reserves
Mineral reserves are estimates of the amount of ounces that can be economically and legally extracted from the Group’s properties. In order to calculate the mineral reserves, estimates and assumptions are required about a range of geological, technical and economic factors, including quantities, grades, production techniques, recovery rates, production costs, commodity prices and exchange rates.
Estimating the quantities and/or grade of the reserves requires the size, shape and depth of the ore bodies to be determined by analyzing geological data such as the logging and assaying of drill samples. This process may require complex and difficult geological judgments and calculations to interpret the data.
Because the economic assumptions used to estimate the mineral reserves change from year to year, and because additional geological data is generated during the course of operations, estimates of the mineral reserves may change from year to year. Changes in the proven and probable reserves may affect the Group’s financial results and financial position in a number of ways, including:
| | • | | asset carrying values may be affected due to changes in estimated cash flows; |
| | • | | depreciation and amortization charged to profit or loss may change as they are calculated on the units-of-production method; and |
| | • | | environmental provisions may change as the timing and/or cost of these activities may be affected by the change in mineral reserves. |
At the end of each financial year, the estimate of proven and probable mineral reserve is updated. Depreciation of mining assets is prospectively adjusted, based on these changes.
29
Anooraq Resources Corporation
Management Discussion and Analysis of Financial Condition and Results of Operations for the period ended December 31, 2010
| 1.12 | Changes in Accounting Policies including Initial Adoption |
Changes in accounting policies
The accounting policies applied by the Group in the consolidated financial statements for the year ended December 31, 2010 are the same as those applied by the Group in the consolidated financial statements as at and for the year ended December 31, 2009 (available on SEDAR and EDGAR). There have been no changes in accounting policies during the year ended December 31, 2010.
New standards not yet adopted
The following standards and interpretations are issued but not yet effective and applicable to the Group:
| | • | | IAS 24 (revised), Related Party Disclosures |
| | • | | Effective date January 1, 2011. |
| | • | | The revised IAS 24 Related Party Disclosures amends the definition of a related party and modifies certain related party disclosure requirements for government-related entities. |
| | • | | Amendments to IAS 32, Financial statements: Presentation: Classification of Rights Issues |
| | • | | Effective date February 1, 2010. |
| | • | | The IASB amended IAS 32 to allow rights, options or warrants to acquire a fixed number of the entity’s own equity instruments for a fixed amount of any currency to be classified as equity instruments provided the entity offers the rights, options or warrants pro rata to all of its existing owners of the same class of its own non-derivative equity instruments. |
| | • | | Amendments to IFRS 7, Disclosures – Transfers of Financial Assets |
| | • | | Effective date January 1, 2011. |
| | • | | The amendments add an explicit statement that qualitative disclosure should be made in the context of the quantitative disclosures to better enable users to evaluate an entity’s exposure to risks arising from financial instruments. In addition, the IASB amended and removed existing disclosure requirements. |
| | • | | IFRS 9, Financial instruments |
| | • | | Effective date January 1, 2013. |
| | • | | IFRS 9 (2009) is the first standard issued as part of a wider project to replace IAS 39. IFRS 9 (2009) retains but simplifies the mixed measurement model and establishes two primary measurement categories for financial assets: amortised cost and fair value. The basis of classification depends on the entity’s business model and the contractual cash flow characteristics of the financial asset. The guidance in IAS 39 on impairment of financial assets and hedge accounting continues to apply. Prior periods need not be restated if an entity adopts the standard for reporting periods beginning before January 1, 2012. |
| | • | | IFRS 9, Additions to IFRS 9 Financial instruments |
| | • | | Effective date January 1, 2013. |
| | • | | IFRS 9 (2010) adds the requirements related to the classification and measurement of financial liabilities, and derecognition of financial assets and liabilities to the version issued in November 2009. |
30
Anooraq Resources Corporation
Management Discussion and Analysis of Financial Condition and Results of Operations for the period ended December 31, 2010
| | It also includes those paragraphs of IAS 39 dealing with how to measure fair value and accounting for derivatives embedded in a contract that contains a host that is not a financial asset, as well as the requirements ofIFRIC 9 Reassessment of Embedded Derivatives. |
| | • | | IFRIC 19, Extinguishing Financial liabilities with Equity Instruments |
| | • | | Effective date July 1, 2010. |
| | • | | This interpretation provides guidance on the accounting for debt for equity swaps. |
| | • | | Various improvements to IFRS 2010 |
| | • | | Effective date July 1, 2010. |
| | • | | The IASB issued amendments to various standards with various effective dates. |
| 1.13 | Financial Instruments and Risk Management |
Financial instruments
The Group’s financial instruments consist primarily of the following financial assets: cash and cash equivalents, trade and other loans and receivables. The Group’s financial instruments consist primarily of the following financial liabilities: loans and borrowings, trade and other payables and certain derivative instruments. Financial instruments are initially measured at fair value when the Group becomes a party to their contractual arrangements. Transaction costs are included in the initial measurement of financial instruments, with the exception of financial instruments classified as at fair value through profit or loss.
Financial assets
The Group’s financial assets comprise primarily of cash and cash equivalents and trade and other receivables.
Loans and receivables are non-derivative financial assets with fixed or determinable payments that are not quoted in an active market. They arise when the Group provides money, goods or services directly to a debtor with no intention of trading the receivable. Loans and receivables are subsequently measured at amortized cost using the effective interest rate method. They are included in current assets, except for those with maturities greater than 12 months after the balance sheet date, which are classified as non-current assets. Loans and receivables include trade and other receivables (excluding VAT and prepayments) and restricted cash.
Cash and cash equivalents are defined as cash on hand, deposits held at call with banks and short-term highly liquid investments with original maturities of three months or less. Cash and cash equivalents exclude restricted cash (discussed below).
Restricted cash consists of cash held through investments in the Employee Share Option Plan Trust (“ESOP Trust”).
Trade and other receivables are recognized initially at fair value and subsequently measured at amortized cost using the effective interest method, less provision for impairment. A provision for impairment of receivables is established when there is objective evidence that the Group will not be able to collect all amounts due according to the original terms of receivables. Significant financial difficulties of the debtor, probability that the debtor will enter bankruptcy or financial reorganization, and default or delinquency in payments are considered indicators
31
Anooraq Resources Corporation
Management Discussion and Analysis of Financial Condition and Results of Operations for the period ended December 31, 2010
that the trade receivable is impaired. The amount of the provision is the difference between the asset’s carrying amount and the present value of estimated future cash flows, discounted at the effective interest rate. The carrying amount of the asset is reduced through the recognition of a provision for impairment (allowance account) and the amount of the loss is recognized in the income statement. When a trade receivable is uncollectible, it is written off against the allowance account for trade receivables. Subsequent recoveries of amounts previously written off are credited in the income statement.
Non-derivative financial liabilities
Loans and borrowings are initially recognized at fair value net of transaction costs incurred and subsequently measured at amortized cost, comprising original debt less principal payments and amortization, using the effective yield method. Loans and borrowings are classified as current liabilities unless the Group has an unconditional right to defer settlement of the liability for at least 12 months after the reporting date. Trade and other payables are recognized initially at fair value and subsequently measured at amortized cost using the effective interest rate method.
Derivative financial instruments
The Group holds derivative financial instruments to hedge its interest rate risk exposures. Embedded derivatives are separated from the host contract and accounted for separately if the economic characteristics and risks of the host contract and the embedded derivative are not closely related, a separate instrument with the same terms as the embedded derivative would meet the definition of a derivative, and the combined instrument is not measured at fair value through profit or loss.
On initial designation of the hedge, the Group formally documents the relationship between the hedging instrument(s) and hedged item(s), including the risk management objectives and strategy in undertaking the hedge transaction, together with the methods that will be used to assess the effectiveness of the hedging relationship. The Group makes an assessment, both at the inception of the hedge relationship as well as on an ongoing basis, whether the hedging instruments are expected to be “highly effective” in offsetting the changes in the fair value or cash flows of the respective hedged items during the period for which the hedge is designated, and whether the actual results of each hedge are within a range of 80-125 percent. For a cash flow hedge of a forecast transaction, the transaction should be highly probable to occur and should present an exposure to variations in cash flows that could ultimately affect reported net income.
Derivatives are recognized initially at fair value; attributable transaction costs are recognized in profit or loss as incurred.
Financial risk management activities
The Group’s financial instruments expose it to a variety of financial risks: credit risk, liquidity risk, interest rate risk, foreign currency risk and commodity price risk. The Group may use derivative financial instruments to hedge certain risk exposures.
The Board of Directors has overall responsibility for the establishment and oversight of the Group’s risk management framework.
32
Anooraq Resources Corporation
Management Discussion and Analysis of Financial Condition and Results of Operations for the period ended December 31, 2010
The Group’s risk management policies are established to identify and analyze the risks faced by the Group, to set appropriate risk limits and controls, and to monitor risks and adherence to limits. Risk management policies and systems are reviewed regularly to reflect changes in market conditions and the Group’s activities. The Group, through its training and management standards and procedures, aims to develop a disciplined and constructive control environment in which all employees understand their roles and obligations.
Credit risk
Credit risk is the risk of financial loss to the Group if a customer or counterparty to a financial instrument fails to meet its contractual obligations, and arises principally from the Group’s receivables from customers, and cash and equivalents. Management has evaluated treasury counterparty risk and does not expect any treasury counterparties to fail in meeting their obligations.
Trade receivables represents sale of concentrate to RPM in terms of a concentrate off-take agreement. The carrying value represents the maximum credit risk exposure. The Group has no collateral against these receivables.
Liquidity risk
Liquidity risk is the risk that the Group will not be able to meet its financial obligations as they fall due. The Group ensures that there is sufficient capital in order to meet short term business requirements, after taking into account cash flows from operations and the Group’s holdings of cash and cash equivalents. This is facilitated via the OCSF. The Group’s cash and cash equivalents are invested in business accounts which are available on demand.
The Group operates in South Africa and is subject to currency exchange controls administered by the South African Reserve Bank. A portion of the Group’s funding for its South African operations consists of loans advanced to its South African incorporated subsidiaries and it is possible the Group may not be able to acceptably repatriate such funds once those subsidiaries are able to repay the loans or repatriate other funds such as operating profits should any develop. The repatriation of cash held in South Africa is permitted upon the approval of the South African Reserve Bank.
Interest rate risk
The Bokoni Transaction was partially financed by a $110.3 million (ZAR 750 million) Debt Facility from Standard Chartered provided to Plateau, of which $73.6 million (ZAR 500 million) was drawn down on July 1, 2009. The remaining $36.8 million (ZAR 250 million) is available for interest roll-up during the next three years. The term of the senior Debt Facility is nine years with an interest and capital repayment holiday period. The senior Debt Facility bears interest equal to the JIBAR (5.965% at December 31, 2010) plus 4.5% applicable margin and 1.27% mandatory cost.
The Group has entered into an interest rate swap arrangement with Standard Chartered to fix the variable interest rate on $73.6 million (ZAR 500 million) of the principal amount of the loan at 14.695% which arrangement expires on July 31, 2012.
A 100 basis point change in the interest rate for the three months ended December 31, 2010 on the Standard Chartered loan and the RPM loan would have changed the loss for the year by approximately $1.3 million. This analysis assumes that all other variables remain constant.
33
Anooraq Resources Corporation
Management Discussion and Analysis of Financial Condition and Results of Operations for the period ended December 31, 2010
Foreign currency risk
The Group from time to time enters into transactions for the purchase of supplies and services denominated in foreign currency. As a result, the Group is subject to foreign exchange risk from fluctuations in foreign exchange rates. The Group has not entered into any derivative or other financial instruments to mitigate this foreign exchange risk.
Within the Group, certain loans between Group entities amounting to $49.3 million are exposed to foreign exchange fluctuations. A 10% change in the CDN/ZAR exchange rate at December 31, 2010 would have resulted in an increase/decrease of $4.9 million in equity. The Group has no significant external exposure to foreign exchange risk.
Commodity price risk
The value of the Group’s revenue and resource properties depends on the prices of PGM’s and their outlook. The Group currently operates Bokoni. The Group does not hedge its exposure to commodity price risk. PGM prices historically have fluctuated widely and are affected by numerous factors outside of the Group’s control, including, but not limited to, industrial and retail demand, forward sales by producers and speculators, levels of worldwide production, and short-term changes in supply and demand because of hedging activities.
Capital risk management
The primary objective of managing the Group’s capital is to ensure that there is sufficient capital available to support the funding and operating requirements of the Group in a way that optimizes the cost of capital, maximizes shareholders’ returns, matches the current strategic business plan and ensures that the Group remains in a sound financial position.
The Group manages and makes adjustments to the capital structure which consists of debt and equity as and when borrowings mature or when funding is required. This may take the form of raising equity, market or bank debt or borrowings from RPM or hybrids thereof. The Group may also adjust the amount of dividends paid, sell assets to reduce debt or schedule projects to manage the capital structure.
In addition, Anooraq’s ability to raise new equity in the equity capital markets is subject to the mandatory requirement that Pelawan, its majority BEE shareholder, retain a 51% fully diluted shareholding in the Company up until January 1, 2015, as required by covenants given by Pelawan and Anooraq in favour of the DMR, the South African Reserve Bank and Anglo Platinum.
There were no changes to the Group’s approach to capital management as at December 31, 2010.
Debt Arrangements
Refer to Section 1.2.1 for details of all debt arrangements.
| 1.14 | Other MD&A Requirements |
Additional information relating to the Group, including the Group’s Annual Information Form dated March 23, 2011, is available on SEDAR.
34
Anooraq Resources Corporation
Management Discussion and Analysis of Financial Condition and Results of Operations for the period ended December 31, 2010
| 1.15 | Internal Controls over Financial Reporting Procedures |
The Group’s management, including its Chief Executive Officer and Chief Financial Officer, is responsible for establishing and maintaining adequate internal control over financial reporting (as such term is defined in applicable securities regulations). The Group’s internal control system was designed to provide reasonable assurance to the Group’s management and the board of directors regarding reliability of financial reporting and the preparation of financial statements for external purposes in accordance with IFRS. Internal control over financial reporting includes those policies and procedures that:
| | • | | Pertain to the maintenance of records that in reasonable detail accurately and fairly reflect the transactions and dispositions of the assets of the Group. |
| | • | | Provide reasonable assurance that transactions are recorded as necessary to permit preparation of financial statements in accordance with IFRS, and that receipts and expenditures of the Group are being made only in accordance with authorizations of management and directors of the Group. |
| | • | | Provide reasonable assurance regarding prevention or timely detection of unauthorized acquisition, use or disposition of the Group’s assets that could have a material effect on the financial statements. |
All internal control systems, no matter how well designed, have inherent limitations and may not prevent or detect misstatements on a timely basis. Also, projections of any evaluation of effectiveness of internal control over financial reporting to future periods are subject to risk that controls may become inadequate because of changes in conditions, or that the degree of compliance with the policies or procedures may deteriorate. Therefore, even those systems determined effective can provide only reasonable assurance with respect to financial statement preparation and presentation.
The Group excluded Bokoni from its assessment of the effectiveness of the Group’s internal control over financial reporting as of December 31, 2009. During 2010, the Group designed and implemented internal control over financial reporting at Bokoni. This included:
| | • | | Documentation of controls; |
| | • | | Design and implementation of controls; and |
| | • | | Control measures to ensure standards and procedures are maintained. |
During the fourth quarter of 2010, the Group went live on its own SAP system. The Group previously used Anglo Platinum’s SAP system. All the necessary controls were designed and implemented for the new system, including the migration to the new system.
This included:
| | • | | Documentation of controls; |
| | • | | User acceptance testing; |
| | • | | Design and implementation of general information technology controls and application controls; |
35
Anooraq Resources Corporation
Management Discussion and Analysis of Financial Condition and Results of Operations for the period ended December 31, 2010
| | • | | Change management controls; and |
| | • | | Controls around data migration. |
Management assessed the effectiveness of the Group’s internal control over financial reporting as at December 31, 2010. In making this assessment, the Group’s management used the criteria, established inInternal Control-Integrated Framework issued by the Committee of Sponsoring Organizations of the Treadway Commission. This assessment included review of the documentation of controls, evaluation of the design effectiveness of controls, testing of the operating effectiveness of controls and a conclusion on this assessment. Based on this assessment, management has concluded that the Group’s internal control over financial reporting was effective as of December 31, 2010.
Disclosure Controls and Procedures
Disclosure controls and procedures are those controls and procedures that are designed to ensure that the information required to be disclosed in the filings under applicable securities regulations is recorded, processed, summarized and reported within the time periods specified in applicable securities regulations. As at December 31, 2010, under the supervision and with the participation of our management, including our Chief Executive Officer and Chief Financial Officer, we conducted an evaluation of the effectiveness of the Group’s disclosure controls and procedures. Based on this evaluation, the Chief Executive Officer and the Chief Financial Officer have concluded that, as of December 31, 2010, the Group’s disclosure controls and procedures were effective.
| 1.16 | Disclosure of Outstanding Share Data |
The Group has a share option plan approved by the shareholders that allows it to grant options, subject to regulatory terms and approval, to its directors, employees, officers, and consultants to acquire up to 32,600,000 common shares. As at February 28, 2011, 13,166,000 options were outstanding. During the 2010 year, the Group issued 1,240,000 share options with a weighted average exercise price of 1.30. Options outstanding and exercisable at February 28, 2011 were as follows:
| | | | | | | | | | | | | | | | |
Expiry date | | Option price | | | Number of
options
outstanding | | | Number of
options vested | | | Weighted
average life
(years) | |
October 15, 2012 | | $ | 1.29 | | | | 4,145,000 | | | | 4,145,000 | | | | 1.6 | |
June 25, 2013 | | $ | 1.29 | | | | 916,000 | | | | 916,000 | | | | 2.3 | |
June 30, 2013 | | $ | 1.29 | | | | 1,410,000 | | | | 1,410,000 | | | | 2.3 | |
June 25, 2014 | | $ | 0.96 | | | | 600,000 | | | | 600,000 | | | | 3.3 | |
November 30, 2016 | | $ | 0.84 | | | | 4,855,000 | | | | 1,583,415 | | | | 5.8 | |
May 1, 2017 | | $ | 1.68 | | | | 500,000 | | | | — | | | | 6.2 | |
July 1, 2017 | | $ | 1.05 | | | | 260,000 | | | | — | | | | 6.3 | |
August 1, 2017 | | $ | 1.11 | | | | 480,000 | | | | — | | | | 6.4 | |
| | | | | | | | | | | | | | | | |
Total | | | | | | | 13,166,000 | | | | 8,654,415 | | | | | |
| | | | | | | | | | | | | | | | |
Weighted average exercise price | | | | | | $ | 1.11 | | | $ | 1.19 | | | | | |
| | | | | | | | | | | | | | | | |
As at February 28, 2011, the issued share capital of the Group was 201,888,473 common shares.
36