UNITED STATES
SECURITIES AND EXCHANGE COMMISSION
Washington, D.C. 20549
Form 6-K
REPORT OF FOREIGN PRIVATE ISSUER
PURSUANT TO RULE 13a-16 OR 15d-16
OF THE SECURITIES EXCHANGE ACT OF 1934
For the month ofJune, 2013
Commission File Number001-31930
ATLATSA RESOURCES CORPORATION
(Translation of registrant’s name into English)
15th Floor, 1040 West Georgia Street,
Vancouver, British Columbia, Canada, V6E 4H8
(Address of principal executive offices)
Indicate by check mark whether the registrant files or will file annual reports under cover of Form 20-F or Form 40F:
Form 20-F x Form 40-F ¨
Indicate by check mark if the registrant is submitting the Form 6-K in paper as permitted by Regulation S-T Rule 101(b)(1): ¨
Note: Regulation S-T Rule 101(b)(1) only permits the submission in paper of a Form 6-K if submitted solely to provide an attached annual report to security holders.
Indicate by check mark if the registrant is submitting the Form 6-K in paper as permitted by Regulation S-T Rule 101(b)(7): ¨
Note: Regulation S-T Rule 101(b)(7) only permits the submission in paper of a Form 6-K if submitted to furnish a report or other document that the registrant foreign private issuer must furnish and make public under the laws of the jurisdiction in which the registrant is incorporated, domiciled or legally organized (the registrant’s “home country”), or under the rules of the home country exchange on which the registrant’s securities are traded, as long as the report or other document is not a press release, is not required to be and has not been distributed to the registrant’s security holders, and, if discussing a material event, has already been the subject of a Form 6-K submission or other Commission filing on EDGAR.
DOCUMENTS INCLUDED AS PART OF THIS REPORT
| | |
Document | | Description |
| |
1. | | Notice of Annual General Meeting and Management Information Circular |
| |
2. | | Form of Proxy – Annual General Meeting |
| |
3 | | Voting Instruction Form – Annual General Meeting |
| |
4 | | Notice of Special Meeting and Management Information Circular |
| |
5 | | Form of Proxy – Special Meeting |
| |
6 | | Voting Instruction Form – Special Meeting |
| |
7 | | Financial Statement Request Form |
Document 1
ATLATSA RESOURCES CORPORATION
(formerly: Anooraq Resources Corporation)

NOTICE OF
ANNUAL GENERAL MEETING
and
MANAGEMENT INFORMATION CIRCULAR
Meeting to be held on June 28, 2013
The TSX Venture Exchange has not in any way passed judgment upon the merits of the
matters described herein and any representation to the contrary is an offence.
This document is important and requires your immediate attention.
If you are in any doubt as to the action you should take, please consult your broker, intermediary, Central Securities Depositary Participant, banker, accountant, attorney or other independent professional adviser immediately.
Copies of this document, which is only available in English, may be obtained on SEDAR atwww.sedar.com, on the Company’s website at www.atlatsaresources.co.za or from the offices of Atlatsa Resources Corporation in South Africa – 4th Floor, 82 Grayston Drive, Sandton, Johannesburg 2146
ATLATSA RESOURCES CORPORATION
(formerly Anooraq Resources Corporation)
Registered office in Canada: Suite 1300 – 777 Dunsmuir Street
Vancouver, British Columbia V7Y 1K2
Telephone (604) 643-7100 Fax (604) 643-7900
Head office in South Africa: 4th Floor, 82 Grayston Drive, Sandton, Johannesburg 2146
Telephone +27 11 883 0831
May 28, 2013
To the Shareholders of Atlatsa Resources Corporation:
You are invited to attend the annual general meeting (the “Meeting”) of the holders (“Shareholders”) of common shares without par value (“Common Shares”) in the capital of Atlatsa Resources Corporation (formerly Anooraq Resources Corporation) (“Atlatsa” or the “Company”) to be held at 4th Floor, 82 Grayston Drive, Sandton, Johannesburg, South Africa on June 28, 2013 at 4:15 p.m. (Central African Time) (7:15 a.m. Pacific Time), with a simulcast live by video conference to Atlatsa’s registered offices in Canada at Suite 1300, 777 Dunsmuir Street, Vancouver, British Columbia.
The following business of the Company will be dealt with at the Meeting:
| (i) | receipt of the audited annual financial statements of the Company for its fiscal year ended December 31, 2012, together with the auditor’s report thereon; |
| (ii) | the election of the directors of the Company for the ensuing year; |
| (iii) | the appointment of an auditor of the Company for the ensuing year and authorization for the directors to fix the auditor’s remuneration; and |
| (iv) | to transact such further business as may properly come before the Meeting or any adjournment or adjournments thereof. |
A brief summary of biographical information for each director nominee proposed for re-election at the Meeting is provided on pages 11 through 14 of the accompanying management information circular of the Company (the “Information Circular”).
To be represented at the Meeting, Registered Shareholders (being Shareholders whose names appear on Atlatsa’s central security register as a registered holder of Common Shares as of May 28, 2013), other than South African Shareholders, must either attend the Meeting in person or sign, date and send the enclosed form of proxy (yellow) (the “Proxy”) so as to be deposited with Computershare Trust Company of Canada by fax (1-866-249-7775) or by mail or by hand to 100 University Avenue, 9th Floor, Toronto, Ontario, M5J 2Y1 prior to 10:15 a.m. (Eastern Time) (7:15 a.m. Pacific Time) on June 26, 2013 or, if the Meeting is adjourned, not less than 48 hours (excluding Saturdays, Sundays and statutory holidays in the cities of Vancouver, British Columbia and Johannesburg, South Africa) prior to the time set for the adjournment thereof. Beneficial Shareholders (being Shareholders who beneficially own and hold Common Shares through a broker or other intermediary and who do not hold Common Shares in their own names) should refer to the accompanying Information Circular for further instructions.
South African Shareholders whose names appear on the South African register, who hold either certificated Common Shares or dematerialised Common Shares in their own name, and who wish to be represented at the Meeting, must either attend the Meeting in person or complete, sign, date and send the enclosed South African form of proxy (yellow) (the “South African Proxy”) so as to be deposited at the offices of the Company’s transfer agent (by mail at Computershare Investor Services (Pty) Limited, PO Box 61051, Marshalltown, 2107 or by hand at Computershare Investor Services (Pty) Limited, Ground Floor, 70 Marshall Street, Johannesburg, 2001) 4:15 p.m. (Central African Time) on June 26, 2013 if the Meeting is adjourned, not less than 48 hours (excluding Saturdays, Sundays and statutory holidays in the cities of Vancouver, British Columbia and Johannesburg, South Africa) prior to the time set for the adjournment thereof.
South African Shareholders registered on the Company’s South African securities register who have dematerialised their Common Shares through a South African Central Securities Depositary Participant (“CSDP”), or broker and have not elected “own-name” registration or who hold certificated Common Shares through a nominee, and who wish to be represented at the Meeting, must instruct their CSDP, broker or nominee to issue the necessary letter of representation to attend, or must provide their CSDP, broker or nominee with their voting instructions in terms of the custody agreement entered into between the South African Shareholder and their CSDP, broker or nominee.
|
| Yours truly, |
|
| (signed)“Harold Motaung” |
| Chief Executive Officer |
ATLATSA RESOURCES CORPORATION
(formerly Anooraq Resources Corporation)
NOTICE OF ANNUAL GENERAL MEETING OF SHAREHOLDERS
NOTICE IS HEREBY GIVEN that an annual general meeting (the “Meeting”) of the holders (“Shareholders”) of common shares (“Common Shares”) in the capital of Atlatsa Resources Corporation (formerly Anooraq Resources Corporation) (“Atlatsa” or the “Company”) will be held at 4th Floor, 82 Grayston Drive, Sandton, Johannesburg, South Africa on June 28, 2013 at 4:15 p.m. (Central African Time) (7:15 a.m. Pacific Time), with a simulcast live by video conference to Atlatsa’s registered offices in Canada at Suite 1300, 777 Dunsmuir Street, Vancouver, British Columbia.
The following business of the Company will be dealt with at the Meeting:
��
| 1. | to receive the audited annual financial statements of the Company for its fiscal year ended December 31, 2012, together with the auditor’s report thereon; |
| 2. | to elect the directors for the ensuing year; |
| 3. | to appoint KPMG Inc. as the independent auditor of the Company for the ensuing year and to authorize the directors to fix the independent auditor’s remuneration; and |
| 4. | to transact such further business as may properly come before the Meeting or any adjournment or adjournments thereof. |
The audited annual financial statements of the Company for the fiscal year ended December 31, 2012, the Company’s annual report filed on Form 20-F for the year ended December 31, 2012 and the Company’s management discussion and analysis for the year ended December 31, 2012 are available on the System for Electronic Data Analysis and Retrieval at www.sedar.com.
The record date for the determination of Shareholders entitled to receive notice of and to vote at the Meeting is May 28, 2013 (the “Record Date”). Registered Shareholders of Atlatsa as of the close of business on the Record Date will be entitled to receive notice of and to vote at the Meeting.
Registered Shareholders other than South African Shareholders
A Registered Shareholder may attend the Meeting in person or may be represented by proxy. Registered Shareholders, other than South African Shareholders, who are unable to attend the Meeting or any adjournment thereof in person are requested to date, sign and return the accompanying form of proxy (yellow) (the “Proxy”) for use at the Meeting or any adjournment thereof. To be effective, the enclosed Proxy must be mailed so as to reach or be deposited with Computershare Trust Company of Canada by fax (1-866-249-7775) or by mail or by hand to 100 University Avenue, 9th Floor, Toronto, Ontario, M5J 2Y1 prior to 10:15 a.m. (Eastern Time) (7:15 a.m. Pacific Time) on June 26, 2013 or, if the Meeting is adjourned, not less than 48 hours (excluding Saturdays, Sundays and statutory holidays in the cities of Vancouver, British Columbia and Johannesburg, South Africa) before the commencement of the adjourned Meeting or may be deposited with the Chair of the Meeting prior to the commencement thereof.
Beneficial Shareholders (being Shareholders who beneficially own and hold Common Shares through a broker or other intermediary and who do not hold Common Shares in their own name) should refer to the accompanying management information circular of the Company for voting information.
South African Shareholders
South African Shareholders holding Common Share certificates in their own names and South African Shareholders who have dematerialised their Common Shares and have elected “own-name” registration in the sub-register through a Central Securities Depositary Participant (“CSDP”), may attend the Meeting in person or, if they are unable to attend the Meeting but wish to be represented thereat, must complete and return the attached South African form of proxy (yellow) (the “South African Proxy”), to the offices of the Company’s transfer agent (by mail at Computershare Investor Services (Pty) Limited, PO Box 61051, Marshalltown, 2107 or by hand at Computershare Investor Services (Pty) Limited, Ground Floor, 70 Marshall Street, Johannesburg, 2001 to be received prior to 4:15 p.m. (Central African Time) on June 26, 2013 or, if the Meeting is adjourned, not less than 48 hours (excluding Saturdays, Sundays and statutory holidays in the cities of Vancouver, British Columbia and Johannesburg, South Africa) before the commencement of the adjourned Meeting or may be deposited with the Chair of the Meeting prior to the commencement thereof.
South African Shareholders who have dematerialised their Common Shares through a CSDP or broker and who have not elected “own-name” registration in the sub-register maintained by a CSDP and South African Shareholders who hold certificated Common Shares through a nominee, who wish to attend the Meeting must instruct their CSDP, broker or nominee to issue them with the necessary letter of representation to attend, or, if they do not wish to attend the Meeting but wish to be represented thereat, they must provide their CSDP, broker or nominee with their voting instructions in terms of the custody agreement entered into between them and their CSDP, broker or nominee.
In respect of dematerialised Common Shares, it is important to ensure that the person or entity (such as a nominee) whose name has been entered into the relevant sub-register maintained by a CSDP completes the South African Proxy and appoints a proxy to vote at the Meeting.
If you are in any doubt as to the action you should take, please consult your broker or other intermediary through whom your Common Shares are held, CSDP, banker, accountant, attorney or other professional adviser immediately.
DATED at Vancouver, British Columbia this 28th day of May, 2013.
|
| BY ORDER OF THE BOARD OF DIRECTORS |
|
| (signed)“Harold Motaung” |
| Chief Executive Officer |
TABLE OF CONTENTS
MANAGEMENT INFORMATION CIRCULAR
ATLATSA RESOURCES CORPORATION
(formerly Anooraq Resources Corporation)
ANNUAL GENERAL MEETING OF SHAREHOLDERS
This management information circular (the “Information Circular”) is furnished in connection with the solicitation of proxies by the management of Atlatsa Resources Corporation (formerly Anooraq Resources Corporation) (the “Company” or “Atlatsa”) for use at the annual general meeting (the “Meeting”) of Shareholders of the Company to be held on June 28, 2013 at the time and place and for the purposes set forth in the accompanying notice of the Meeting.
No person has been authorized by the Company to give any information or make any representation in connection with any of the matters to be considered at the Meeting other than those contained in this Information Circular and, if given, any such information or representation must not be relied upon as having been authorized.
In this Information Circular, references to “the Company”, “Atlatsa”, “we” and “our” refer to Atlatsa Resources Corporation (formerly Anooraq Resources Corporation). All capitalized terms used herein but not otherwise defined have the meanings set out under “Glossary of Terms”. References in this Information Circular to dollar amounts are to Canadian dollars, unless otherwise indicated. Unless otherwise noted herein, all financial figures quoted in Canadian dollars in this Information Circular are converted at a rate of ZAR8.53 : $1. This represents the ZAR:$ exchange rate as of December 31, 2012, which such rate is used in the Company’s 2012 audited annual financial statements.
This Information Circular has been prepared in accordance with Form 51-102F5 –Information Circular of the Canadian securities administrators. In addition to the Company’s primary TSX-V listing, the Company has secondary listings on NYSE AMEX and the JSE and accordingly various additional disclosures have been included in this Information Circular in order to satisfy the JSE Listings Requirements. The Company has been conditionally approved for listing on the Toronto Stock Exchange (“TSX”). Migration to the TSX is conditional upon the completion of certain restructuring and refinancing transactions referred to in the Company’s News Release dated March 27, 2013,
The information given in this Information Circular is given as of May 28, 2013, unless otherwise indicated.
1
GLOSSARY OF TERMS
The following is a glossary of certain terms used in this Information Circular.
“affiliate” has the meaning ascribed thereto in theSecurities Act (British Columbia), as amended, except as otherwise provided herein;
“Alexander Forbes Retirement Fund” means a defined contribution provident and retirement fund for the directors, executive officers and full time employees at the Company’s head office managed by Alexander Forbes Equity Holdings and its subsidiaries;
“Anglo Platinum Group Provident Fund” means a defined contribution provident fund for Anglo Platinum employees and the Company’s employees;
“Anglo Platinum Mines Retirement Fund” means a defined contribution retirement fund for Anglo Platinum employees and the Company’s employees;
“Anglo Platinum” means Anglo American Platinum Limited, a public company incorporated under the laws of South Africa and whose common shares are listed on the JSE;
“Atlatsa” or the“Company” means Atlatsa Resources Corporation (formerly Anooraq Resources Corporation), a corporation incorporated under the laws of the Province of British Columbia and listed on the TSX-V, the JSE and the NYSE AMEX;
“associate” has the meaning ascribed thereto in theSecurities Act (British Columbia), as amended, except as otherwise provided herein;
“Atlatsa Holdings” means Atlatsa Holdings (Proprietary) Ltd. (formerly Pelawan Investments (Proprietary) Limited), a private company incorporated under the laws of South Africa, with 15 BEE shareholders including Tumelo Motsisi and Harold Motaung and the sole beneficiary of the Pelawan Trust;
“B2 Preference Shares” means cumulative convertible redeemable preference shares in the capital of Plateau;
“B3 Preference Shares” means cumulative convertible redeemable preference shares in the capital of Plateau;
“BEE” means broad based black economic empowerment, as envisaged pursuant to the MPRD Act and related legislation and guidelines, being a strategy aimed at substantially increasing participation by HDSAs at all levels in the economy of South Africa;
“Beneficial Shareholder” means a Shareholder who beneficially owns and holds Common Shares through a broker (or some other Intermediary) and who does not hold Common Shares in his, her or its own name;
“Board of Directors” or “Board” means the board of directors of Atlatsa;
“Bokoni” means Bokoni Platinum Mines (Proprietary) Limited, a private company incorporated under the laws of South Africa which holds the mineral title in respect of Bokoni Mine;
“Bokoni Mine” means Bokoni Platinum Mine, a PGM mine located on the Eastern Limb of the Bushveld Complex in South Africa (formerly referred to as the Lebowa Platinum Mine);
“Broadridge” means Broadridge Financial Solutions, Inc.;
“CAT” means Central African Time;
“CDS” means the Canadian Depository for Securities Inc.;
2
“Common Shares” means common shares without par value in the capital of the Company;
“CSA” means Canadian Securities Administrators;
“CSDP” means Central Securities Depository Participant in South Africa;
“DME” means the South African Department of Minerals and Energy;
“HDSA” means a “historically disadvantaged South African” as contemplated in the MPRD Act, being a person or group who has been discriminated against on the basis of race, gender and disability, and includes certain trusts and companies in which such persons have interests;
“Information Circular” means this management information circular dated May 28, 2013, together with all schedules hereto, distributed to Shareholders by Atlatsa in connection with the Meeting;
“Intermediaries” means brokers, investment firms, cleaning houses and similar entities that own and hold Common Shares on behalf of Beneficial Shareholders;
“JSE” means JSE Limited, a company incorporated in accordance with the laws of South Africa, licensed as an exchange under the South African Securities Services Act, 2004 which means operates the Johannesburg Stock Exchange;
“JSE Listings Requirements” means the JSE Listings Requirements as amended from time to time;
“KPMG” means KPMG Inc., registered auditors, the current auditors of the Company;
“Meeting” means the annual general and special meeting of the Shareholders to be held at 4:15 p.m. (CAT) (7:15 a.m. Pacific Time) on June 28, 2013 and any adjournment thereof;
“MPRD Act” means the South African Mineral and Petroleum Resources Development Act, No. 28 of 2002;
“NI 52-110” means National Instrument 52-110 - Audit Committees;
“NI 58-101” means National Instrument 58-101 - Disclosure of Corporate Governance Practices;
“NP 58-201” means National Policy 58-201 - Corporate Governance Guidelines;
“NYSE AMEX” means the NYSE AMEX Stock Exchange, the successor to the American Stock Exchange;
“Optionee” means any person who receives a grant of Options;
“Options” means the options to acquire Common Shares granted under and in accordance with the terms of the Stock Option Plan;
“Pelawan Trust” means the independent South African trust established in accordance with a trust deed dated September 2, 2004, the trustees of which are Andre Visser, Tumelo Motsisi (a director of the Company) and Harold Motaung (a director of the Company);
“PGM” means platinum group metals;
“Plateau” means Plateau Resources (Proprietary) Limited, a private company incorporated under the laws of South Africa, being an indirect wholly-owned subsidiary of Atlatsa;
“Plateau Preference Shares” means the B2 Preference Shares and the B3 Preference Shares;
3
“Proxy” means the form of proxy on yellow coloured paper which accompanies this Information Circular for use by Registered Shareholders other than South African Shareholders;
“Record Date” means May 28, 2013;
“Registered Shareholder” means a Shareholder whose name appears on the records of Atlatsa’s central security register as a registered holder of Common Shares as of the Record Date;
“SARs” means share appreciation rights;
“SEDAR” means the System for Electronic Document Analysis and Retrieval available on the Internet atwww.sedar.com;
“Shareholder” means a holder of Common Shares;
“South Africa” means the Republic of South Africa;
“South African Proxy” means the form of proxy printed on yellow coloured paper which accompanies this Information Circular and is to be completed by South African Shareholders;
“South African Shareholder” means a Shareholder whose Common Shares are registered on the Company’s South African register of Shareholders;
“Stock Option Plan” means the incentive stock option plan of the Company adopted on May 21, 2004, as amended on June 17, 2005 and as further amended as of June 15, 2009;
“TSX” means the Toronto Stock Exchange;
“TSX-V” means TSX Venture Exchange;
“ZAR” means the South African Rand, the currency of South Africa.
Words importing the singular, where the context requires, include the plural andvice versa and words importing any gender include all genders.
4
GENERAL PROXY INFORMATION
The following proxy information is applicable to all Shareholders,other than South African Shareholders who should refer to the section of this Information Circular entitled “Information for South African Shareholders” for proxy instructions.
Solicitation of Proxies
The solicitation of proxies is made by management on behalf of the Company, and will be primarily by mail, but proxies may be solicited personally or by telephone by directors, officers and employees of the Company. The Company will bear all costs of any solicitation. We have arranged for Intermediaries to forward the meeting materials to Beneficial Shareholders of record by those Intermediaries and we will reimburse the Intermediaries for their reasonable fees and disbursements in that regard. The cost of solicitation will be borne by the Company.
The following information respecting appointment of proxyholders and revocation of proxies is generally applicable only to Registered Shareholders. A significant number of Shareholders are Beneficial Shareholders. In almost all cases, a Beneficial Shareholder will not appear as the holder of record of such Common Shares on the Company’s central securities register of Shareholders. As Beneficial Shareholders do not have the same legal rights as Registered Shareholders in respect of shareholder meetings (including the rights described below to appoint a proxyholder and revoke a deposited proxy), Beneficial Shareholders are required to act indirectly through their Intermediary in order to vote their Common Shares or revoke a proxy, and Beneficial Shareholders should refer to the information set out under “General Proxy Information – Beneficial Shareholders” in this Information Circular.
Appointment of Proxyholders
A Shareholder may attend the Meeting in person or may be represented by a proxyholder. Registered Shareholders who are unable to attend the Meeting in person are asked to date, sign and return the accompanying yellow coloured Proxy, or other appropriate form of proxy, in accordance with the instructions set out in this Information Circular. If a Proxy is not dated, the proxyholder so appointed will date such Proxy as of the date on which it was mailed to such Registered Shareholder by the Company.A Proxy will not be valid unless it is deposited at the offices of Computershare Investor Services Inc., 100 University Avenue, 9th Floor, Toronto, Ontario, M5J 2Y1 prior to 10:15 a.m. (Eastern Time) (7:15 a.m. Pacific Time) on June 26, 2013 or, if the Meeting is adjourned, not less than 48 hours (excluding Saturdays, Sundays and holidays in the Cities of Vancouver, British Columbia and Johannesburg, South Africa) before the time of the Meeting. A person appointed as proxyholder need not be a Shareholder.
A Proxy must be signed by the Registered Shareholder or a duly appointed attorney authorized in writing or, if the Registered Shareholder is a corporation or other entity, by a duly authorized officer. A Proxy signed by a person acting as attorney or in some other representative capacity (including an officer or other duly appointed representative of a corporate Registered Shareholder) should clearly indicate that person’s capacity and should be accompanied by the original or a notarized copy of the instrument evidencing such qualification and authority to act, or such other documentation in support as is acceptable to the Chair of the Meeting.
The management designees named in the accompanying Proxy are senior officers and directors of Atlatsa.A Registered Shareholder has the right to appoint a person (who need not be a Shareholder), other than the management designees to represent such Registered Shareholder at the Meeting. To exercise this right, a Registered Shareholder should cross out the names of the management designees on the accompanying Proxy and insert the name of the other person in the blank space provided.
5
Voting by Proxyholders and Exercise of Discretion
The persons named in the Proxy will vote, or withhold from voting, the Common Shares represented thereby in accordance with your instructions on any ballot that may be called for. If you specify a choice with respect to any matter to be acted upon, your Common Shares will be voted accordingly. The Proxy confers discretionary authority on the persons named therein with respect to:
| | (a) | each matter or group of matters identified therein for which a choice is not specified; |
| | (b) | any amendment to or variation of any matter identified therein; and |
| | (c) | any other matter that properly comes before the Meeting. |
In respect of a matter for which a choice is not specified by the Registered Shareholder in the Proxy, the persons named in the Proxy will vote the Common Shares represented by the Proxy “FOR” the approval of such matter.
Registered Shareholders may wish to vote by Proxy whether or not they are able to attend the Meeting in person. Registered Shareholders electing to submit a Proxy may do so by:
| | (a) | completing, dating and signing the enclosed Proxy (yellow sheet) and returning it to the Company’s transfer agent, Computershare Investor Services Inc., by fax within North America at 1-866-249-7775, outside North America at 1-416-263-9524, or by mail or by hand to the 9th Floor, 100 University Avenue, Toronto, Ontario, M5J 2Y1; |
| | (b) | using a touch-tone phone to transmit voting choices to a toll free number. Registered Shareholders must follow the instructions of the voice response system and refer to the enclosed form of Proxy (yellow sheet) for the toll free number, the holder’s account number and the control number; or |
| | (c) | using the internet through the website of the Company’s transfer agent at www.investorvote.com, Registered Shareholders must follow the instructions that appear on the screen and refer to the enclosed Proxy (yellow sheet) for the holder’s account number and the control number; |
in all cases ensuring that the Proxy is received prior to 10:15 a.m. (Eastern Time) (7:15 a.m. Pacific Time) on June 26, 2013, or, if the Meeting is adjourned, then not less than 48 hours (excluding Saturdays, Sundays and holidays in the Cities of Vancouver, British Columbia and Johannesburg, South Africa) before the commencement of the adjourned Meeting at which the Proxy is to be used.
Revocation of Proxies
In addition to revocation in any other manner permitted by law, a Registered Shareholder who has given a Proxy may revoke it by:
| | (a) | executing a Proxy bearing a later date or by executing a valid notice of revocation, either of the foregoing to be executed by the Registered Shareholder or the Registered Shareholder’s authorized attorney in writing, or, if the Shareholder is a corporation, under its corporate seal by an officer or attorney duly authorized, and by delivering the Proxy bearing a later date to Computershare Investor Services Inc. at 100 University Avenue, 9th Floor, Toronto, Ontario M5J 2Y1 at any time up to and including the last business day that precedes the day of the Meeting or, if the Meeting is adjourned, the last business day that precedes any reconvening thereof, or to the Chair of the Meeting on the day of the Meeting or any reconvening thereof, or in any other manner provided by law; or |
| | (b) | personally attending the Meeting and voting the Registered Shareholder’s Common Shares. |
6
A revocation of a Proxy will not affect a matter on which a vote is taken before the revocation.
Beneficial Shareholders
The following information is of significant importance to many Shareholders, as a substantial number of Shareholders are Beneficial Shareholders who do not hold Common Shares in their own name. Beneficial Shareholders should note that only Proxies deposited by Registered Shareholders can be recognized and acted upon at the Meeting.
If Common Shares are listed in an account statement provided to a Shareholder by a broker or other Intermediary, then, in almost all cases, those Common Shares will not be registered in the Shareholder’s name on the records of the Company. Such Common Shares will more likely be registered under the names of the Shareholder’s broker or an agent of that broker. In the United States, the vast majority of such Common Shares are registered under the name of Cede & Co. as nominee for The Depository Trust Company (which acts as depositary for many U.S. brokerage firms and custodian banks), and in Canada, under the name of CDS & Co. (the registration name for CDS, which acts as nominee for many Canadian brokerage firms).
Common Shares held by brokers or their agents or nominees can only be voted (for or against resolutions) upon the instructions of Beneficial Shareholders. Without specific instructions, brokers and their agents and nominees are prohibited from voting shares for the broker’s clients.Therefore, Beneficial Shareholders should ensure that instructions respecting the voting of their Common Shares are communicated to the appropriate person in advance of the Meeting.Intermediaries are required to seek voting instructions from Beneficial Shareholders in advance of shareholders’ meetings. Every Intermediary has its own mailing procedures and provides its own return instructions to clients.If you are a Beneficial Shareholder, you should carefully follow the instructions of your Intermediary in order to ensure that your Common Shares are voted at the Meeting.
The voting instruction form supplied to you by your broker will be similar to the Proxy provided to Registered Shareholders by the Company. However, its purpose is limited to instructing the Intermediary on how to vote on your behalf. Most brokers now delegate responsibility for obtaining instructions from clients to Broadridge. Broadridge typically provides a computer readable voting instruction form to Beneficial Shareholders and asks Beneficial Shareholders to complete this form and return to Broadridge. The voting instruction form will name the same persons as the Proxy to represent you at the Meeting. You have the right to appoint a person (who need not be a Shareholder of the Company), other than the persons designated in the voting instruction form, to represent you at the Meeting. To exercise this right, you should insert the name of the desired representative in the blank space provided in the voting instruction form. The completed voting instruction form must then be returned to Broadridge by mail or facsimile or voting instructions given to Broadridge by phone or over the internet, in accordance with Broadridge’s instructions. Broadridge then tabulates the results of all instructions received and provides appropriate instructions respecting the voting of Common Shares to be represented at the Meeting.If you receive a voting instruction form from Broadridge, you cannot use it to vote Common Shares directly at the Meeting. The voting instruction form must be completed and returned to Broadridge, in accordance with its instructions, well in advance of the Meeting in order to have the Common Shares voted.
These securityholder materials are being sent to both Registered Shareholders and Beneficial Shareholders. If you are a Beneficial Shareholder and the Company or its agent has sent these materials directly to you, your name, address and information about your holding of securities have been obtained in accordance with applicable securities regulatory requirements from the Intermediary holding Common Shares on your behalf. By choosing to send these materials to you directly, the Company (not the Intermediary holding Common Shares on your behalf) has assumed responsibility for (i) delivering these materials to you, and (ii) executing your proper voting instructions. Please return your voting instructions as specified in the request for voting instructions.
Although as a Beneficial Shareholder you may not be recognized directly at the Meeting for the purposes of voting Common Shares registered in the name of your Intermediary, you, or a person designated by you, may attend at the Meeting as proxyholder for your Intermediary and vote your Common Shares in that capacity. If you wish to attend at the Meeting and indirectly vote your Common Shares as proxyholder for your Intermediary, or have a person designated by you do so, you should enter your own name, or the name of the person you wish to designate, in the blank space on the voting instruction form provided to you and return the same to your Intermediary in accordance with the instructions provided by such Intermediary, well in advance of the Meeting.
7
Atlatsa will send proxy-related materials directly to non-objecting Beneficial Shareholders in accordance with NI 54-101 –Communication with Beneficial Owners.
Electronic Participation
This year, the Company is excited to provide the opportunity for Registered Shareholders to participate electronically in the meeting from Vancouver, British Columbia. The Meeting will be held in Sandton, Johannesburg, South Africa at the Company’s head offices with a simulcast live by video conference to Atlatsa’s registered offices in Canada at Suite 1300, 777 Dunsmuir Street, Vancouver, British Columbia. If you attend the Meeting in Sandton, Johannesburg, South Africa or participate from the Company’s satellite location in Vancouver, British Columbia, you will be able to see and hear the individuals at the other location by way of large screens and will also be able to vote and ask questions at the relevant times during the Meeting. Although the Company’s goal is seamless electronic participation from Vancouver, British Columbia, if you are concerned with ensuring that any votes you wish to cast at the Meeting are counted and you are not able to attend the Meeting in person in Sandton, Johannesburg, South Africa, you should vote in advance by proxy.
INFORMATION FOR SOUTH AFRICAN SHAREHOLDERS
This Information Circular will be distributed to all Shareholders on the South Africa register who have elected to receive such documentation.
South African Proxy Instructions
Voting by Proxyholders
The persons named in the South African Proxy will vote or withhold from voting the Common Shares represented thereby in accordance with your instructions on any ballot that may be called for. If you specify a choice with respect to any matter to be acted upon, your Common Shares will be voted accordingly. The South African Proxy confers discretionary authority on the persons named therein with respect to:
| | (a) | each matter or group of matters identified therein for which a choice is not specified, |
| | (b) | any amendment to or variation of any matter identified therein, and |
| | (c) | any other matter that properly comes before the Meeting. |
In respect of a matter for which a choice is not specified in the South African Proxy, the persons named in the South African Proxy will vote the Common Shares represented by the South African Proxy for the approval of such matter.
Shareholders holding Common Share certificates in their own names and shareholders who have dematerialised their Common Shares and have elected “own-name” registration in the sub-register through a CSDP and who are unable to attend the Meeting but wish to be represented thereat may complete and return the attached form of South African Proxy (yellow), in accordance with the instructions contained therein, to be received by Computershare Investor Services (Pty) Limited by mail at PO Box 61051, Marshalltown, 2107 or by hand at Ground Floor, 70 Marshall Street, Johannesburg, 2001 prior to 4:15 p.m. (CAT) on June 26, 2013 or, if the Meeting is adjourned, not less than 48 hours (excluding Saturdays, Sundays and statutory holidays in the Cities of Vancouver, British Columbia and Johannesburg, South Africa) prior to the time set for the adjournment thereof.
Shareholders who have dematerialised their Common Shares through a CSDP or broker and who have not elected “own-name” registration in the sub-register maintained by a CSDP and Shareholders who hold certificated Common Shares through a nominee and who wish to attend the Meeting must instruct their CSDP, broker or nominee to issue them with the necessary letter of representation to attend. If such Shareholders do not wish to attend the general meeting but wish to be represented thereat, they must provide their CSDP, broker or nominee with their voting instructions in terms of the custody agreement entered into between them and their CSDP, broker or nominee.
8
Shareholders who hold dematerialised Common Shares must ensure that the person or entity (such as a nominee) whose name has been entered into the relevant sub-register maintained by a CSDP completes the form of South African Proxy and appoints a proxy to vote at the Meeting.
The Company does not take responsibility and will not be held liable for any failure on the part of a CSDP, nominee or broker of a Shareholder holding dematerialised Common Shares to notify such Shareholder of the Meeting or any business to be conducted thereat, or to validly authorize a Shareholder to attend or vote thereat.
Shareholders are advised to consult their professional adviser if they have any questions regarding the above.
The Company’s sponsor in South Africa is Macquarie First South Capital (Pty) Limited (tel: +27 11 583 2000).
INTEREST OF CERTAIN PERSONS OR COMPANIES IN MATTERS TO BE ACTED UPON
Tumelo Motsisi, a director and Executive Chair of the Company, and Harold Motaung, a director and Chief Executive Officer of the Company, hold a 14.1% and 9.8% interest, respectively, in the issued and outstanding share capital of Atlatsa Holdings, the indirect beneficial owner of 57.2% of the issued and outstanding Common Shares in the capital of the Company.
Except as described above, no director or executive officer of the Company, nor any person who has held such a position since the beginning of the last completed financial year of the Company, nor any nominee for election as a director of the Company, nor any associate or affiliate of the foregoing persons, has any material interest, direct or indirect, by way of beneficial ownership of securities or otherwise, in any matter to be acted on at the Meeting.
RECORD DATE, VOTING SECURITIES AND PRINCIPAL HOLDERS
OF VOTING SECURITIES
The Board of Directors has fixed May 28, 2013 as the Record Date for determination of persons entitled to receive notice of and to vote at the Meeting. Only Shareholders of record at the close of business on the Record Date who either attend the Meeting personally or complete, sign and deliver a form of proxy, in the manner and subject to the provisions described above or under the heading “General Proxy Information”, will be entitled to vote or to have their Common Shares voted at the Meeting. Quorum for the transaction of business at the Meeting is two persons present in person or by proxy, holding not less than 5% of the issued and outstanding Common Shares at the Record Date.
As of the Record Date, there were 201,888,473 Common Shares issued and outstanding, each such Common Share carrying the right to one vote. The Company is authorized to issue an unlimited number of Common Shares. As of the Record Date, there are 227,400 Plateau Preference Shares (comprised of 115,800 B2 Preference Shares and 111,600 B3 Preference Shares) issued in the capital of Plateau which when duly converted into Plateau common shares will, through a series of transactions, be exchanged for 227.4 million Common Shares in the Company. The Plateau Preference Shares have not been converted as of the Record Date and therefore the holders thereof are not entitled to vote at the Meeting. Refer to the Company’s news release dated March 27, 2013 for details of the proposed conversion of the Plateau Preference Shares.
9
To the knowledge of the directors and executive officers of the Company, the only persons or corporations that beneficially owned or exercised control or direction over, directly or indirectly, Common Shares carrying more than 10% of the voting rights attached to all issued and outstanding Common Shares of the Company as at the Record Date are:
| | | | | | | | |
Shareholder Name and Address | | Number of
Common Shares Held | | | Percentage
of
Issued
Common
Shares | |
The Pelawan Trust, as Trustee(1) Atlatsa Holdings, as Beneficiary 4th Floor, 82 Grayston Drive Sandton, 2196, South Africa | | | 115,496,438 | | | | 57.2 | % |
Mr. Tumelo M. Motsisi(2)(3) 4th Floor, 82 Grayston Drive Sandton, 2196, South Africa | | | 28,535,153 | | | | 14.1 | % |
| (1) | These Common Shares are registered in the name of Pelawan Trust, which holds such Common Shares in trust for Atlatsa pursuant to escrow arrangements described in Item 9.G. “Escrow Securities” of Atlatsa’s annual report prepared on Form 20-F available on the Company’s profile on SEDAR atwww.sedar.com. |
| (2) | Attributable indirect holdings based on 240 of the 1,000 ordinary shares in the issued and outstanding share capital of Atlatsa Holdings, multiplied by the number of Common Shares of the Company (115,496,438) held by the Pelawan Trust for a total attributable indirect holdings of 13.7% Common Shares. |
| (3) | Direct holding of 815,998 Common Shares in the Company. |
FINANCIAL STATEMENTS
The audited annual financial statements of the Company for the year ended December 31, 2012, and the auditors’ report thereon, together with the related management discussion and analysis, will be placed before the Meeting. These documents have been filed with the securities commissions or similar regulatory authorities in Alberta, British Columbia and Quebec.
Copies of the documents may be obtained by a Shareholder upon request and without charge from Investor Relations, Atlatsa Resources Corporation, 15th floor, 1040 West Georgia Street, Vancouver, British Columbia, V6E 4H1, telephone: 604-684-6365. These documents are also available through the Company’s profile on SEDAR available on the Internet at www.sedar.com and on the Company’s website at www.atlatsaresources.co.za.
VOTES NECESSARY TO PASS RESOLUTIONS
If there are more nominees for election as directors or appointment of the Company’s auditor than there are vacancies to fill as a consequence of additional nominations from the floor of the Meeting, those nominees receiving the greatest number of votes will be elected or appointed, as the case may be, until all such vacancies have been filled. If the number of nominees for election or appointment is equal to the number of vacancies to be filled, all such nominees will be declared elected or appointed by acclamation.
The Company has a majority voting policy, which provides that if the votes “for” the election of a director nominee at a meeting of Shareholders are fewer than the number voted “withheld”, the nominee is expected to submit his or her resignation promptly after the meeting for consideration by the Nomination and Governance Committee. The Nominating and Governance Committee will make a recommendation to the Board after reviewing the matter, and the Board will then decide whether to accept or reject the resignation. The Board’s decision to accept or reject the resignation will be disclosed to Shareholders. The nominee will not participate in any Nomination and Governance Committee deliberations whether to accept or reject the resignation. This policy does not apply in circumstances involved contested director elections.
10
ELECTION OF DIRECTORS
The Board is currently comprised of six (6) directors. It is proposed that six directors be elected until the next annual meeting of Shareholders or until their successors are elected or appointed. The following section sets out the names of the persons nominated for election as a director at the Meeting, all major offices and positions with the Company each now holds, the period of time during which each has been a director of the Company and the number of Common Shares beneficially owned by each, directly or indirectly, or over which each exercised control or direction, as at the Record Date. Unless reelected, the current directors of the Company will cease to hold office at the close of the Meeting. The persons named in the Proxy intend to vote “For” the resolution electing each of the following nominees, unless otherwise instructed by a Shareholder.
| | | | | | |
Name, position with the Company and province or
state and country of residence | | Period(s) as a Director of the
Company | | Common Shares
beneficially
owned, controlled
or directed(1)(2) | | B3 Preference
Shares(1)(3) |
Patrick COOKE(4)(5)(6) Non-Executive Director Gauteng, South Africa | | Since February 2012 | | 3,500 | | — |
Fikile Tebogo DE BUCK(4)(5)(7) Non-Executive Director Gauteng, South Africa | | November 2008 | | Nil | | — |
Anu DHIR(4)(6)(7)(8) Lead Independent Non-Executive Director Ontario, Canada | | Since July 2008 | | Nil | | — |
Harold MOTAUNG Director and Chief Executive Officer Gauteng, South Africa | | Director since September 2004 Chief Executive Officer since April 2011 | | 19,764,462(9) | | 18,972,000(9) |
Tumelo MOTSISI(8) Director and Executive Chair Gauteng, South Africa | | Since September 2004 | | 28,535,153(10) | | 26,784,000(10) |
Rizelle SAMPSON(7) Non-Executive Director Gauteng, South Africa | | Since September 2004 | | Nil | | — |
Notes:
| (1) | The information as to number of Common Shares beneficially owned controlled or directed is not within the knowledge of the management of the Company and has been furnished by the respective nominees as reported in their filings at www.sedi.ca. |
| (2) | Directors personally own or control a total of 48,303,115 Common Shares, which represent approximately 23.9% of the current outstanding Common Shares. The directors also hold 2,595,000 Options (see “Incentive Plan Awards – Option-based Awards). |
| (3) | Directors indirectly own or control a total of 45,756,000 B3 Preference Shares of the total 115,496,438 B3 Preference Shares, which represent approximately 22.1% of the current outstanding Common Shares on an as converted basis. |
| (4) | Member of the Audit Committee. |
| (5) | Member of Nominating and Governance Committee. |
| (6) | Member of Compensation Committee. |
| (7) | Member of the Sustainable Development and Health and Safety Committee. |
| (8) | Member of the Investment Committee. |
| (9) | Indirect holdings being 170 of the 1,000 ordinary shares in the issued and outstanding share capital of Atlatsa Holdings, multiplied by the number of Common Shares (115,496,438) held by the Pelawan Trust and direct holdings of 130,368 Common Shares. |
| (10) | Indirect holdings being 240 of the 1,000 ordinary shares in the issued and outstanding share capital of Atlatsa Holdings, multiplied by the number of Common Shares (115,496,438) held by the Pelawan Trust and direct holdings of 815,998 Common Shares. |
There have been no changes in the directors’ holdings of Common Shares as set out above between the Record Date and the date of this Information Circular. The following are biographies for the directors of Atlatsa nominated for election.
11
PATRICK COOKE, B.Com (Wits), CA(SA) – Director
Patrick Cooke has over 35 years’ professional experience as a chartered accountant and management consultant. Mr. Cooke was responsible for listing two companies on the main board of the JSE and was the financial director of a third JSE-listed company. His industry experience is wide, having been involved in mineral resources, information technology, wholesale fast moving consumer goods, financial services and professional services companies. He was appointed a non-executive director of Sallies Limited in October 2009 and, with effect from February 1, 2010, was appointed Financial Director, Chief Operating Officer and Acting Chief Executive Officer. He resigned from all positions at Sallies Limited with effect from January 2012.
Mr. Cooke is, or was within the past five years, an officer and/or director of the following public companies:
| | | | | | |
Company | | Positions Held | | From | | To |
| Atlatsa Resources Corporation | | Director | | February 2012 | | Current |
| Great Basin Gold Limited | | Director | | March 2006 | | Current |
| Sallies Limited | | Director | | August 2009 | | January 2012 |
| Pangea Diamondfields PLC | | Director | | January 2006 | | January 2009 |
FIKILE TEBOGO DE BUCK, BA, FCCA – Director
Fikile Tebogo De Buck is a Fellow of the Association of Chartered Certified Accountants FCCA (UK) and has extensive experience in business operations and financial affairs with companies in the mining sector. She holds a Bachelor of Arts degree in Economics and Accounting from the University of Swaziland. Ms. De Buck is currently a non-executive director and the lead independent director of Harmony Gold Mining Company Limited. (“Harmony”) and is a member of various board committees of Harmony including the audit committee. She is also a non-executive director of Clientele Limited. She has also served in various positions at the Council for Medical Schemes in South Africa.
Ms. De Buck is, or was within the past five years, an officer and/or director of the following public companies:
| | | | | | |
Company | | Positions Held | | From | | To |
| Atlatsa Resources Corporation | | Director | | November 2008 | | Present |
| Harmony Gold Mining Company Limited | | Director | | April 2006 | | Present |
| Clientele Limited | | Director | | November 2012 | | Present |
| Clientele Life | | Director | | November 2012 | | Present |
ANU DHIR, BA, JD - Director
Anu Dhir holds a Bachelor of Arts degree from the University of Toronto and a law degree (Juris Doctor) from Quinnipiac University, Connecticut, United States. Ms. Dhir has extensive experience in international business, operations and legal affairs in private equity and publicly-held companies in the mining, oil and gas and technology sectors. Ms. Dhir served as Vice President, Corporate Development and Company Secretary at Katanga Mining Limited, a TSX-listed company and is currently Managing Director of Miniqs Limited, a private group primarily interested in resource projects that have the capability to grow into major producing operations. Ms. Dhir is a non-executive director of Great Basin Gold Limited, a TSX-listed company engaged in gold mining and Frontier Rare Earths Limited, a TSX-listed company that is focused on rare earth elements.
12
Ms. Dhir is, or was within the past five years, an officer and/or director of the following public companies:
| | | | | | |
Company | | Positions Held | | From | | To |
| Atlatsa Resources Corporation | | Director | | July 2008 | | Present |
| Katanga Mining Limited | | Director | | March 2004 | | November 2004 |
| | Vice President, Corporate Development | | January 2006 | | October 2009 |
| Compass Asset Management | | Director | | June 2009 | | December 2012 |
| Miniqs Limited | | Director and Officer | | March 2010 | | Present |
| Frontier Rare Earths Limited | | Director | | November 2010 | | Present |
| Great Basin Gold Limited | | Director | | June 2011 | | Present |
A. H. C. (HAROLD) MOTAUNG, BSc, MBA – Chief Executive Officer and Director
Harold Motaung was previously employed at the Free State and Vaal River operations of Anglo American Corporation of South Africa Limited for six years as a mining engineer and as a production supervisor. Mr. Motaung then moved to the DME as a director within the Mine Inspectorate. As a Deputy Chief Inspector, he was responsible for implementing the Mine, Health and Safety Act. Subsequently he was appointed Chief Director within the Mine Inspectorate. His portfolio included the gold, platinum and coal regions of South Africa.
In Mr. Motaung’s capacity as a Chief Director of the Mine Inspectorate, he was appointed on numerous boards of government–associated institutions including the National Nuclear Reactor, the Deep Mining Board and the Mining Qualifications Authority. Mr. Motaung also chaired the Mines Research Board, which administered a mining safety fund. Mr. Motaung also represented the South African government in a number of international and bi-national engagements with foreign countries, and was a member of the DME executive team responsible for the briefs and presentations at the Parliamentary Portfolio Committee on the status of minerals and energy within the country, which culminated in the enactment of the Minerals & Petroleum Development Act. Mr. Motaung left the DME to establish a mining and geological consultancy, African Minerals Professionals (Pty) Limited. Mr. Motaung has been a director of Atlatsa since September 2004 and is not a director of any other public companies. Mr. Motaung is a founding member of Atlatsa Holdings, the controlling shareholder of Atlatsa. Recently, he was appointed and served on the board of Mintek as the non-executive Chair.
Mr. Motaung has been a director of the Company since September 2004, and the CEO of the Company since April 2011.
Mr. Motaung is, or was within the past five years, an officer and/or director of the following public company:
| | | | | | |
Company | | Positions Held | | From | | To |
| Atlatsa Resources Corporation | | Director | | September 2004 | | Present |
TUMELO M. MOTSISI, BA, LLM, MBA – Executive Chair and Director
Tumelo Motsisi is a prominent South African businessperson with experience in the South African financial services, mining and energy sectors. Between 1994 and 1998 he was employed first as a senior manager and then as a director within the Negotiated Benefits Consultants division of Alexander Forbes, a South African financial services company.
In 1998 he established Kopano Ke Matla Investment Company (“KKM”), the investment arm of South Africa’s largest trade union federation, the Congress of South African Trade Unions. He was subsequently appointed as the Chief Executive Officer of KKM. Mr. Motsisi also served as Executive Chair of Prosperity Holdings, a financial services company established between KKM, NBC Financial Services and Peregrine Holdings. Mr. Motsisi is a member and
13
director of several South African companies. Mr. Motsisi is a founding member of Atlatsa Holdings, the controlling shareholder of Atlatsa. Mr. Motsisi has been a director of Atlatsa since September 2004 and is not a director of any other public companies.
Mr. Motsisi is, or was within the past five years, an officer and/or director of the following public company:
| | | | | | |
Company | | Positions Held | | From | | To |
| Atlatsa Resources Corporation | | Director | | September 2004 | | Present |
RIZELLE M. SAMPSON, H. Dip Education – Director
Ms. Sampson is a South African citizen and holds a Certificate in Corporate Finance from the University of London (School of Economics), a Certificate in Telecommunications Policy, Regulation and Management from the University of Witwatersrand and a Higher Diploma in Education from the University of the Western Cape.
Following positions as a Portfolio Administrator (Institutional Clients) at Investec Asset Managers, Chief of Staff at the Ministry of Communications and Manager (Office of the CEO) at Sentech Ltd, she co-founded African Footprint Investment Holdings (Pty) Ltd (“AFIH”), an investment holding company that is mainly black woman owned and managed. Ms. Sampson represents AFIH on the board of Tellumat (Pty) Ltd. She is also a trustee of the Sentech Educational Fund Advisory Board and a non-executive director of IPSA Group Plc.
Ms. Sampson is, or was within the past five years, an officer and/or director of the following public companies:
| | | | | | |
Company | | Positions Held | | From | | To |
| Diesel Power Open Cast Mining (Pty) Ltd. | | Director | | June 2010 | | 2012 |
| Independent Power Southern Africa (IPSA) Group PLC | | Director | | January 2009 | | Present |
| Atlatsa Resources Corporation | | Director | | September 2004 | | Present |
Cease Trade Orders, Bankruptcies, Penalties and Sanctions
Corporate Cease Trade Orders
To the knowledge of the Board of Directors, no director or executive officer of the Company is, at the date hereof, or was within the ten years before the date hereof, a director, chief executive officer or chief financial officer of any company that: (i) was subject to a cease trade order or similar order, or an order that denied the relevant company access to any exemption under securities legislation, that was in effect for a period of more than 30 consecutive days, that was issued while that person was acting in the capacity as director, chief executive officer or chief financial officer; or (ii) was subject to a cease trade or similar order, or an order that denied the relevant company access to any exemption under securities legislation, that was in effect for a period of more than 30 consecutive days, that was issued after that person ceased to be a director, chief executive officer or chief financial officer and which resulted from an event that occurred while that person was acting in the capacity as director, chief executive officer or chief financial officer.
Bankruptcies
To the knowledge of the Board of Directors, no director or executive officer of the Company, or Shareholder holding a sufficient number of securities of the Company to effect materially the control of the Company: (i) is, at the date hereof, or has been within the ten years before the date hereof, a director or executive officer of any company that, while that person was acting in that capacity, or within a year of that person ceasing to act in that capacity, became bankrupt, made a proposal under any legislation relating to bankruptcy or insolvency or was subject to or instituted any proceedings,
14
arrangement or compromise with creditors or had a receiver, receiver manager or trustee appointed to hold its assets; or (ii) has, within the ten years before the date hereof, become bankrupt, made a proposal under any legislation relating to bankruptcy or insolvency, or became subject to or instituted any proceedings, arrangement or compromise with creditors or had a receiver, receiver manager or trustee appointed to hold such persons assets.
Penalties or Sanctions
To the knowledge of the Board of Directors, no director of executive officer of the Company, or a Shareholder holding a sufficient number of securities of the Company to affect materially the control of the Company has been subject to any penalties or sanctions imposed by a court relating to securities legislation or by a securities regulatory authority or has entered into a settlement agreement with a securities authority or any other penalties or sanctions imposed by a court or regulatory body that would likely be considered important to a reasonable shareholder in deciding whether to vote for a proposed director.
APPOINTMENT OF AUDITOR
The auditors of the Company are currently KPMG Inc., Registered Auditors, 85 Empire Road, Parktown, Johannesburg, South Africa (“KPMG”). KPMG will be nominated at the Meeting for reappointment as auditors of the Company at remuneration to be fixed by the Board of Directors. KPMG was first appointed auditor of the Company on May 21, 2004. The persons named in the Proxy intend to vote “For” the resolution reappointing KPMG as the auditor of the Company at remuneration to be fixed by the Board, unless otherwise instructed by a Shareholder.
STATEMENT OF EXECUTIVE COMPENSATION
COMPENSATION DISCUSSION AND ANALYSIS
In this section “Named Executive Officer” (or “NEO”) means each of the following individuals:
| | (c) | each of the three most highly compensated executive officers, or the three most highly compensated individuals acting in a similar capacity, other than the CEO and CFO, at the end of the most recently completed financial year whose total compensation was, individually, more than $150,000 for that financial year; and |
| | (d) | each individual who would be a NEO under paragraph (c) but for the fact that the individual was neither an executive officer of the company, nor acting in a similar capacity, at December 31, 2012. |
For the purposes of the executive compensation disclosure in this Circular, Bava Reddy (Business Development Officer), Joel Kesler (Chief Commercial Officer), Harold Motaung (Chief Executive Officer), Tumelo Motsisi (Executive Chair), and DeWet Schutte (Chief Financial Officer) are considered NEOs of Atlatsa.
Compensation Committee
The Company has a Compensation Committee to assist the Board of Directors in carrying out its responsibilities relating to executive and director compensation. The Compensation Committee has the following duties, responsibilities and authority:
| | (a) | to recommend to the Board of Directors the form and amount of compensation to be paid by the Company to the Directors, including compensation to be paid in consideration of a director acting on a committee of the Board of Directors; |
15
| | (b) | to review and approve corporate goals and objectives relating to the compensation of the Company’s executive officers, including the Executive Chair, CEO, CFO and other senior officers (collectively, the “Officers”) if applicable. The Compensation Committee evaluates the performance of the Officers in light of those goals and recommends to the Board the Officers’ annual compensation and incentive or equity plan participation levels and bases of participation. Recommendations of compensation include salary, bonus, and other incentive compensation; |
| | (c) | to review and recommend to the Board on an annual basis the evaluation process and compensation structure for the Company’s other employees; |
| | (d) | based upon input and recommendations from the Officers, to review the Company’s incentive compensation plans and recommend changes in such plans to the Board of Directors as needed and to review and submit to the Board of Directors recommendations concerning new incentive compensation plans; |
| | (e) | to administer the Company’s Stock Option Plan and other equity based compensation plans and determine the grants of Options and other equity based compensation; and |
| | (f) | to prepare and publish any annual executive compensation report in the Company’s annual information form or proxy statement. |
The Compensation Committee is composed of Anu Dhir (the Compensation Committee Chairperson) and Patrick Cooke (appointed May 3, 2012), both of whom are independent directors. Both Ms. Dhir and Mr. Cooke have experience participating in compensation committees of other publicly listed companies. During the 2012 financial year, the Compensation Committee met three times and the proceedings at such meetings were documented in the form of meeting minutes. Ms. Dhir and Mr. Cooke have relevant experience with respect to compensation matters on the basis of previous roles as directors of public companies and the compensation committees thereof. Additional information regarding the Compensation Committee is provided under “Corporate Governance - Board Committees – Compensation Committee”.
Report on Executive Compensation
The Board assumes responsibility for reviewing and monitoring the long-range compensation strategy for the senior management of the Company although the Compensation Committee guides it in this role. As part of its mandate, the Board determines the type and amount of compensation for the Company’s executive officers. In addition, the Board reviews the methodology utilized by the Company for setting salaries of employees throughout the organization.
The Company’s Compensation Committee receives competitive market information on compensation levels for executives. The Company’s compensation policies and programs are designed to be competitive with similar mining companies and to recognize and reward executive performance consistent with the success of the Company’s business.
Philosophy and Objectives
The Company’s reward philosophy is to consider the total reward package needed to meet the differing roles within the Company whilst ensuring external competitiveness and internal relativity. The purpose is to engage all employees to such a degree that they prefer to work for Atlatsa rather than another organization. To this end we regularly re-evaluate our reward programs, recognizing both where we are as an organization from a maturity life-cycle perspective as well relevant competitive factors that may affect achieving responsible delivery towards corporate objectives.
16
The compensation program for the senior management of the Company is designed to ensure that the level and form of compensation achieves certain objectives, including:
| | (a) | attracting and retaining talented, qualified and effective Officers; |
| | (b) | motivating the short and long-term performance of these Officers; and |
| | (c) | better aligning their interests with those of the Company’s Shareholders. |
In compensating its Officers, the Company has employed a combination of base salary, bonus compensation and equity participation through its Stock Option Plan. For the current year, no bonuses have been proposed or paid to any NEO.
Historically the Company has not had a formalized performance management system for the Officers. With effect from the commencement of the 2013 financial year, the Company is developing the Corporate Scorecard to enable the performance of the Officers to be evaluated on an annual basis.
The Corporate Scorecard
The Corporate Scorecard defines the Company’s primary success indicators and focus management effort. The Corporate Scorecard will be used to:
| | • | | pre-determine objectives and measurements which reflect critical success factors; |
| | • | | track critical performance variables over time and value; and |
| | • | | ring-fence deliverables and ascribe weightings of potential contribution to business success. |
| | | | |
Corporate Scorecard – Objectives 2013 | | Weighting | |
Safely Achieving Production Targets | | | 30 | |
Zero Harm to People, Property and the Environment | | | 25 | |
Sustaining the Company’s Social License to Operate | | | 15 | |
Maintaining a Reliable Information Management System | | | 10 | |
Financial Management | | | 10 | |
Positioning/Marketing | | | 10 | |
| | | | |
Total | | | 100 | |
| | | | |
The Officers will be evaluated against the Corporate Scorecard by the Compensation Committee with input from the Board of Directors. The actual evaluation will be used to quantify any annual base salary adjustment, bonus compensation and equity participation elements for each Officer.
Base Salary
In the Board’s view, paying base salaries that are competitive in the markets in which the Company operates is a first step to attracting and retaining talented, qualified and effective executives. The NEOs are paid a salary in order to ensure that the compensation package offered by the Company is in line with that offered by other companies in our industry, and as an immediate means of rewarding the NEO for efforts expended on behalf of the company.
17
The salary to be paid to a particular NEO is determined by gathering competitive salary information on comparable companies within the industry from a variety of sources, including surveys conducted by independent consultants and national and international sources of such listed information. Currently, the Company relies on Anglo Platinum to provide this information. Anglo Platinum uses PE Corporate Services (Pty) Ltd. and Global Remuneration Solutions (Pty) Ltd. to provide this information at no cost to the Company. Payment of a cash salary fits within the objective of the compensation program since it rewards the NEO for performance of his or her duties and responsibilities. Salaries of Officers are reviewed annually by the Board of Directors.
Bonus Compensation
No bonus arrangements with NEOs or directors have been agreed for the most recently completed financial year, although certain NEOs may be awarded bonus compensation in 2013 as discussed under the section entitled “The Corporate Scorecard” above.
Equity Participation
The Company’s Stock Option Plan is dated for reference May 21, 2004 and was amended on June 17, 2005 and June 15, 2009. The terms of the Stock Option Plan are described below under “Stock Option Plan”. The Stock Option Plan is designed to foster and promote the long-term financial success of the Company by strengthening the ability of the Company to attract and retain highly competent directors, employees and consultants, motivate performance through incentive compensation, promote greater alignment of interests between employees and Shareholders in creating long-term Shareholder value, and enable employees to participate in the long-term growth and financial success of the Company. Options are granted taking into account a number of factors, including the amount and term of Options previously granted, base salary, bonuses and competitive factors. The Compensation Committee administers the Stock Option Plan, generally granting Options annually to directors, management, employees and consultants and to individuals commencing employment with the Company. Previous grants are taken into account when considering new grants.
The Company also provides compensation to certain members of management through awards of SARs. See “Share Appreciation Rights” below.
General
Given the evolving nature of the Company’s business, the Board continues to review and redesign the overall compensation plan for NEOs so as to continue to address the objectives identified herein. The Board has not considered the implications of the risks associated with the Company’s current compensation program; however, the Company will review and consider the implications of any risks associated with the Company’s compensation program and design such compensation policies and practices in order to mitigate such risks.
There is no restriction on NEOs or directors regarding the purchase of financial instruments including prepaid variable forward contracts, equity swaps, collars, or units of exchange funds that are designed to hedge or offset a decrease in market value of equity securities granted as compensation or held, directly or indirectly, by an NEO or a director. For the year ended December 31, 2012, no NEO or director, directly or indirectly, employed a strategy to hedge or offset a decrease in market value of equity securities granted as compensation or held.
18
Performance Graph
The following graph compares the total cumulative Shareholder return for $100 invested in Common Shares on December 31, 2007 with the cumulative total return of the TSX Venture Composite Index and the Toronto Stock Exchange 300 Index, for the five most recently completed financial years.
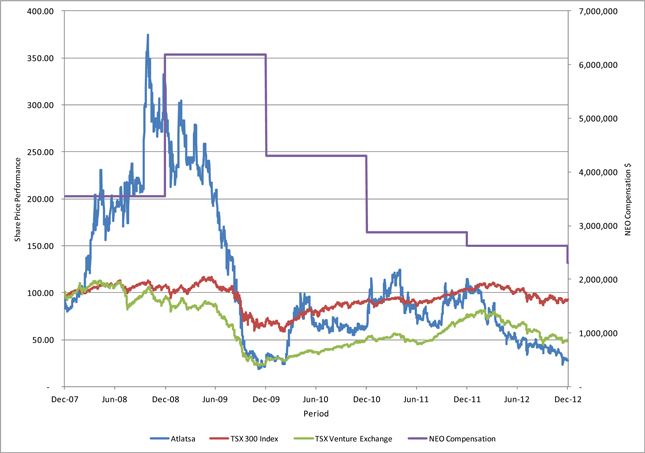
To evaluate the trend in the Company’s compensation levels in relation to the Company’s performance as measured in the graph above, the Company relied on total annual compensation awarded for 2008 through 2012 on the same basis as is currently disclosed in the “Summary Compensation Table” for the NEOs below. As at December 31, 2012 total annual compensation for NEOs had decreased approximately 35% compared to December 31, 2007. The Company’s share price performance from December 31, 2007 through to December 31, 2012 decreased by approximately 97%. The trend in compensation levels of NEOs for 2008 through 2012 each year generally tracked the Company’s share price performance.
19
SUMMARY COMPENSATION TABLE
The compensation provided to NEOs of the Company during the financial year ended December 31, 2012, for each of the Company’s three most recently completed financial years, is as follows:
| | | | | | | | | | | | | | | | | | | | | | | | | | | | | | | | |
| | | | | | | | | | | | Non-equity
incentive
plan
compensation | | | | | | | | | | |
Name | | Year | | | Salary
($) | | | Option
based
awards(1)
($) | | | Annual
incentive
plans
($) | | | Long-
term
incentive
plans
($) | | | Pension,
provident
and
medical
value
($) | | | All other
Compensation
($) | | | Total
Compensation
($) | |
Tumelo Motsisi(2) (3)
Director
Executive Chair | | | 2012 | | | | 428,297 | | | | Nil | | | | Nil | | | | Nil | | | | 97,315 | | | | 21,311 | | | | 546,923 | |
| | | 2011 | | | | 412,648 | | | | Nil | | | | Nil | | | | Nil | | | | 60,643 | | | | 24,025 | | | | 497,316 | |
| | | 2010 | | | | 373,384 | | | | Nil | | | | Nil | | | | Nil | | | | 55,233 | | | | 21,699 | | | | 450,316 | |
| | | | | | | | |
Harold Motaung(2) (3)(4)
Director
CEO | | | 2012 | | | | 436,526 | | | | Nil | | | | Nil | | | | Nil | | | | 101,527 | | | | 29,256 | | | | 567,309 | |
| | | 2011 | | | | 403,644 | | | | Nil | | | | Nil | | | | Nil | | | | 59,383 | | | | 37,979 | | | | 501,006 | |
| | | 2010 | | | | 294,023 | | | | Nil | | | | Nil | | | | Nil | | | | 44,122 | | | | 23,351 | | | | 361,496 | |
| | | | | | | | |
DeWet Schutte(2) (5)
CFO | | | 2012 | | | | 362,914 | | | | Nil | | | | Nil | | | | Nil | | | | 81,527 | | | | 3,587 | | | | 448,028 | |
| | | 2011 | | | | 350,716 | | | | Nil | | | | Nil | | | | Nil | | | | 49,103 | | | | 7,825 | | | | 407,644 | |
| | | 2010 | | | | 310,288 | | | | 610,491 | | | | Nil | | | | Nil | | | | 29,687 | | | | 689 | | | | 951,155 | |
| | | | | | | | |
Joel Kesler(2)
Corporate Finance and Business Development | | | 2012 | | | | 326,510 | | | | Nil | | | | Nil | | | | Nil | | | | 79,501 | | | | 36,721 | | | | 442,732 | |
| | | 2011 | | | | 291,135 | | | | Nil | | | | Nil | | | | Nil | | | | 43,632 | | | | 34,214 | | | | 368,981 | |
| | | 2010 | | | | 267,658 | | | | Nil | | | | Nil | | | | Nil | | | | 40,431 | | | | 26,429 | | | | 334,518 | |
| | | | | | | | |
Bava Reddy(6)
Executive: Mineral Strategy and Exploration | | | 2012 | | | | 219,589 | | | | Nil | | | | Nil | | | | Nil | | | | 58,081 | | | | 22,336 | | | | 300,006 | |
| | | 2011 | | | | 226,979 | | | | Nil | | | | Nil | | | | Nil | | | | 34,075 | | | | 25,711 | | | | 286,765 | |
| | | 2010 | | | | 214,732 | | | | Nil | | | | Nil | | | | Nil | | | | 32,429 | | | | 19,436 | | | | 266,597 | |
Notes:
| (1) | The Options granted in the 2010 financial years were granted pursuant to the Stock Option Plan (See “Stock Option Plan” below). For compensation purposes, the Black-Scholes option valuation model has been used to determine the fair value on the date of grant. The Black-Scholes option valuation is determined using the expected life of the Option, expected volatility of the Company’s Common Share price, expected dividend yield, and risk-free interest rate. |
| (2) | Compensation of certain of the Company’s South African executives is payable in Canadian dollars but is paid to each executive in ZAR at a month end exchange rate at the time. For the purpose of the annual amount the ZAR value for the year has been converted at 1 CAD = ZAR8.53. The amount above is the Canadian dollar denominated compensation. |
| (3) | The NEOs who are also directors do not receive any compensation in their capacity as directors of the Company. |
| (4) | Mr. Motaung was appointed as CEO in April 2011. |
| (5) | Mr. Schutte was appointed Acting CFO in December 2009 and was appointed as CFO with effect from May 1, 2010. |
| (6) | Salary is paid in ZAR. The amount above is the Canadian dollar equivalent translated at an average exchange rate of $1: ZAR8.20 during the fiscal year ended December 31, 2012. |
20
INCENTIVE PLAN AWARDS
The Company currently has a Stock Option Plan and a SARs scheme in place for certain employees. At the annual and extraordinary general meeting of the Shareholders of the Company held on June 15, 2009, all the then-outstanding Options were approved for repricing to $1.29. The following table sets out all Option-based awards outstanding as at December 31, 2012 for each NEO:
| | | | | | | | | | | | |
NAME | | Option-based Awards |
| | Number of
securities
underlying
unexercised
options
(#) | | | Option
exercise
price
($) | | | Option expiration
date | | Value of
unexercised
in-the-money
options(1)
($) |
Tumelo Motsisi | | | 525,000 | | | | 1.29 | | | June 30, 2013 | | Nil |
| | | 800,000 | | | | 0.84 | | | November 30, 2016 | | Nil |
Harold Motaung | | | 510,000 | | | | 0.84 | | | November 30, 2016 | | Nil |
De Wet Schutte | | | 500,000 | | | | 1.61 | | | May 1, 2017 | | Nil |
Joel Kesler | | | 525,000 | | | | 1.29 | | | June 30, 2013 | | Nil |
| | | 570,000 | | | | 0.84 | | | November 30, 2016 | | Nil |
Bava Reddy | | | 550,000 | | | | 0.96 | | | June 25, 2014 | | Nil |
| | | 570,000 | | | | 0.84 | | | November 30, 2016 | | Nil |
Note:
| (1) | The value at December 31, 2012 is calculated by determining the difference between the closing price of the Common Shares at December 31, 2012 ($0.14 per Common Share) underlying the Option on the TSX-V and the exercise price of the Options, multiplied by the number of Options outstanding as at December 31, 2012. |
Incentive Plan Awards – Value Vested or Earned During the Year
The following table sets out all incentive plans (value vested or earned) during the year ended December 31, 2012, for each NEO:
| | | | |
NAME | | Option based
awards - Value
vested during
the year(1) | | Non-equity
incentive plan
compensation – value earned
during year |
Tumelo Motsisi | | Nil | | Nil |
Harold Motaung | | Nil | | Nil |
De Wet Schutte | | Nil | | Nil |
Joel Kesler | | Nil | | Nil |
Bava Reddy | | Nil | | Nil |
Note:
| (1) | These amounts represent the aggregate dollar value that would have been realized if the Options under the Option-based award had been exercised on the vesting date. The value of each amount has been determined by taking the difference between the market price of the Option at date of vesting and the exercise or base price of the Option under the Option-based award on the vesting date. |
21
Securities Authorized for Issuance under Equity Compensation Plans
| | | | | | | | | | | | |
| | | Number of securities
to be issued upon
exercise of
outstanding options,
warrants and rights | | | Weighted-average
exercise price of
outstanding options,
warrants and rights | | | Number of securities
remaining available for
future issuance under
equity compensation plans
(excluding securities
reflected in column (a)) | |
Plan Category | | (a) | | | (b) | | | (c) | |
Equity compensation plans approved by securityholders | | | 7,933,000 | | | | 1.03 | | | | 24,667,000 | |
Equity compensation plans not approved by securityholders | | | — | | | | — | | | | — | |
| | | | | | | | | | | | |
Total | | | 7,933,000 | | | | 1.03 | | | | 24,667,000 | |
| | | | | | | | | | | | |
Stock Option Plan
The only equity compensation plan in which the directors or NEOs of the Company participate is the Stock Option Plan. Amendments to the Stock Option Plan were most recently approved by Shareholders at the annual and extraordinary general meeting of the Company held on June 15, 2009. The maximum number of Common Shares issuable under the Stock Option Plan is 32,600,000 Common Shares. In connection with the Company’s migration to the TSX, which was conditionally approved on April 24, 2013, the Company will adopt a new stock option plan that is compliant with TSX policies and standards.
7,933,000 Common Shares are issuable upon the exercise of all outstanding Options, which are exercisable at a weighted average exercise price of $1.29. As of the Record Date, 24,670,000 Options remain available for issuance under the Stock Option Plan.
Issue of New Options
The Company did not issue any Options during the fiscal year ended December 31, 2012.
The terms of the outstanding Options at December 31, 2012 are as follows:
| | | | | | | | | | | | | | | | |
Expiry date | | Option price | | | Number of
Options
Outstanding(2) | | | Number of
Options Vested | | | Weighted
Average Life
(years) | |
June 25, 2013 | | $ | 1.29 | (1) | | | 916,000 | | | | 916,000 | | | | 1.7 | |
June 30, 2013 | | $ | 1.29 | (1) | | | 1,410,000 | | | | 1,410,000 | | | | 1.8 | |
June 25, 2014 | | $ | 0.96 | | | | 600,000 | | | | 600,000 | | | | 2.7 | |
November 30, 2016 | | $ | 0.84 | | | | 4,705,000 | | | | 3,450,880 | | | | 5.2 | |
May 1, 2017 | | $ | 1.68 | | | | 500,000 | | | | 166,500 | | | | 5.6 | |
| | | | | | | | | | | | | | | | |
Total | | | | | | | 7,933,000 | | | | 7,766,000 | | | | | |
| | | | | | | | | | | | | | | | |
Weighted average exercise price | | | | | | $ | 1.03 | | | $ | 1.05 | | | | | |
| | | | | | | | | | | | | | | | |
Note:
| (1) | Options were re-priced to $1.29 on June 30, 2009. |
| (2) | Options with expiration dates of July 1, 2017 and August 2, 2017, as disclosed in the Company’s management information circular dated June 8, 2012, have been cancelled. |
The Stock Option Plan is administered by the Compensation Committee of the Board of Directors. The Stock Option Plan provides that Options will be issued to directors, officers, employees or consultants of the Company or a subsidiary of the Company. All Options typically expire five years after the date of grant of such Options.
22
Eligible Optionees
Under TSX-V policies, to be eligible for the issuance of an Option under the Stock Option Plan, an Optionee must either be an employee, director, officer, consultant or an employee of a company providing management or other services to the Company or its subsidiary at the time the Option is granted.
Options may be granted only to an individual or to a company that is wholly owned by individuals eligible for an Option grant. If the Option is granted to a company, the Company must provide the TSX-V with an undertaking that it will not permit any transfer of its shares, nor issue further shares, to any other individual or entity as long as the Option remains in effect without the consent of the TSX-V.
Material Terms of the Stock Option Plan
The following is a summary of the material terms of the Stock Option Plan:
| | (a) | all Options granted under the Stock Option Plan are non-assignable and non-transferable; |
| | (b) | for Options granted to employees or service providers (inclusive of management company employees), the Company is required to represent that the proposed Optionee is a bona fide employee or service provider (inclusive of a management company employee), as the case may be, of the Company or of any of its subsidiaries; |
| | (c) | Options have a maximum term of ten years; although to date Options have generally expired five years after the date of grant. Options terminate 30 days following the termination of the Optionee’s employment or other relationship with the Company, except in the case of retirement or death. In the case of retirement, Options terminate 30 to 90 days, at management’s discretion, following retirement. In the case of death, Options terminate at the earlier of one year after the event or the expiry of the Option. Vesting of Options is at the discretion of the Compensation Committee at the time the Options are granted; and |
| | (d) | the exercise price of an Option granted under the Stock Option Plan must not be less than the closing price for Common Shares of the Company as traded on the TSX-V on the last trading day before the date that the Option is granted less allowable discounts as permitted by TSX-V (depending on the price at the time of grant). |
Share Appreciation Rights (“SARs”)
Atlatsa currently has a scheme in place to award SARs to senior staff and certain members of management at Bokoni. The purpose of the SARs scheme is to recognize the contributions of senior staff to Atlatsa’s financial position and performance and to retain key employees. SARs are linked to the price of Common Shares on the JSE and are settled in cash on the exercise date. The SARs settle on the vesting date and then employees can exercise at any date between the vesting date and the expiration date. Directors and NEOs of the Company are not eligible to receive SARs.
23
One third of the SARs granted vest annually on the anniversary of the grant date, with an expiry date five years from the grant date. The base price of SARs equals the closing market price of the underlying Common Shares on the JSE on the trading date immediately preceding the date on which the SARs are granted.
| | | | | | | | | | | | |
| | | 2012 | | | 2011 | | | 2010 | |
| | | |
SARs granted | | | 17,324,869 | | | | 6,294,869 | | | | 3,737,103 | |
Vested already | | | 1,997,268 | | | | | | | | | |
Vesting year of unvested SARs: | | | | | | | | | | | | |
One year after the grant | | | 5,636,401 | | | | 2,396,801 | | | | 1,575,035 | |
Two years after the grant | | | 5,273,200 | | | | 2,025,134 | | | | 1,575,035 | |
Three years after the grant | | | 4,418,000 | | | | 1,872,934 | | | | 587,033 | |
Total number of SARs | | | 17,324,869 | | | | 6,294,869 | | | | 3,737,103 | |
The value of the SARs expensed in the year ended December 31, 2012 was calculated as $ Nil (2011: $437,152 and 2010: $947,176).
The assumptions used to estimate the fair value of the SARs granted during the year were:
| | | | | | |
South African risk-free rate | | 4.9% - 5.8% | | 6.4% | | 6.7% |
Volatility | | 82% - 106% | | 85.1% | | 82%-86% |
Forfeiture rate | | 0% | | 0% | | 0% |
Expected dividends | | Nil | | Nil | | Nil |
The only vesting conditions for the scheme are that the employees must be in the employment of Atlatsa or one of its subsidiaries at the time in which the SARs are exercised.
The volatility of the SARs were calculated with the equally weighted standard approach of calculating volatility by using available historical information on the Common Share price for Atlatsa on the JSE equal to the term to maturity of the scheme.
The risk-free rate for periods within the contractual term of the SARs is based on the South African Government Bonds in effect at the time.
PENSION PLAN BENEFITS
The full time employees of the Company at its corporate offices belong to the Alexander Forbes Retirement Fund (Provident and Retirement sections). The Company contributes 14% of the basic salaries of the employees on a monthly basis to the fund.
The employees of Bokoni belong to the following funds depending on their position:
| | • | | The Company contributes 14% of the basic salaries of certain employees to the Anglo Platinum Group Provident Fund. |
| | • | | The Company contributes 14% of the basic salaries of certain employees to the Anglo Platinum Mines Retirement Fund. |
24
Membership of these retirement funds is compulsory in all cases.
| | | | | | | | | | | | | | | | |
Provident Fund | | | | | | | | | | | | |
Name | | Accumulated value
at January 1, 2012
($) | | | Total growth
earned/interest
earned (employer
contribution) ($) | | | Net Employer
Contributions ($) | | | Accumulated
value at
December 31,
2012 ($) | |
Tumelo Motsisi | | | 175,846 | | | | 36,508 | | | | 50,751 | | | | 263,105 | |
Harold Motaung | | | 150,845 | | | | 32,013 | | | | 50,746 | | | | 233,604 | |
De Wet Schutte | | | 64,011 | | | | 15,274 | | | | 42,150 | | | | 121,435 | |
Joel Kesler | | | 127,492 | | | | 26,675 | | | | 41,788 | | | | 195,955 | |
Bava Reddy | | | 91,570 | | | | 19,090 | | | | 27,720 | | | | 138,380 | |
| | | | | | | | | | | | | | | | |
Retirement Fund | | | | | | | | | | | | |
Name | | Accumulated value
at January 1, 2012
($) | | | Total growth
earned/interest
earned (employer
contribution) ($) | | | Net Employer
Contributions ($) | | | Accumulated
value at
December 31,
2012 ($) | |
Tumelo Motsisi | | | 102,699 | | | | 21,313 | | | | 29,521 | | | | 153,534 | |
Harold Motaung | | | 88,111 | | | | 18,695 | | | | 29,604 | | | | 136,409 | |
De Wet Schutte | | | 37,427 | | | | 8,917 | | | | 24,442 | | | | 70,785 | |
Joel Kesler | | | 74,458 | | | | 15,559 | | | | 24,068 | | | | 114,086 | |
Bava Reddy | | | 53,464 | | | | 11,138 | | | | 16,062 | | | | 80,664 | |
Under the Anglo Platinum Mines Retirement Fund at least two-thirds of the final benefit must be paid as a pension for the rest of the pensioner’s life. Under the Anglo Platinum Group Provident Fund, the full amount of the benefit is available at retirement and may be taken as a lump sum cash payment, irrespective of whether the benefit is calculated on a defined benefit or a defined contribution basis.
TERMINATION AND CHANGE IN CONTROL BENEFITS
Written contracts are in place between the Company and Harold Motaung, Bava Reddy and De Wet Schutte. There are no written employment contracts in place between the Company and Tumelo Motsisi or Joel Kesler, respectively. The Company is currently in the process of compiling a remuneration policy, and as part of this process the written employment contracts between the Company and NEOs will also be reviewed or implemented, as applicable.
It is not expected that there will be any written contracts between the Company and any independent non-executive directors which are appointed to the Board.
There are no compensatory plans or arrangements with the NEOs that entitle a NEO to receive more than $50,000 from the Company as a result of the resignation, retirement or any other termination of employment of the NEOs’ employment, a change in control of the Company or its subsidiaries or a change of the NEOs’ responsibilities following a change in control.
Written employment contracts and other arrangements between the Company and the Company’s NEOs provide for compensation payable under certain circumstances following termination or a change in control, inclusive of the following:
| | • | | a 30 day notice period applies; |
| | • | | payment of annual holiday leave; and |
| | • | | in terms of the Stock Option Plan, all vested Options held by the NEO may be exercised within 90 days of termination. |
25
DIRECTOR COMPENSATION
Each director of the Company, who is not an executive officer, but an independent director, namely, Sipho Nkosi (resigned July 31, 2012), Wayne Kirk (resigned January 31, 2012), Fikile Tebogo De Buck, Rizelle Sampson, Anu Dhir and Patrick Cooke (appointed February 28, 2012) are paid an annual director’s fee of $45,000, plus an additional fee of $15,000 for the Audit Committee Chairperson and $11,000 for other committee Chairpersons. Members of the Audit Committee are paid an annual amount of $8,000 and members of other committees are paid $7,000 per annum. Special committees constituted by the Board are entitled to the compensation set by the Board, which for the special committee constituted in 2012, was $450 per hour. Executive officers do not receive additional compensation for serving as directors.
There is no written or oral contract between the Company or any of its subsidiaries and any non-executive director relating to remuneration or fees payable or restraint payments.
The compensation provided to the non-NEO directors for the Company’s most recently completed financial year of December 31, 2012 is:
| | | | | | | | | | | | | | |
Name of Director(1) | | Fees earned
($)(2) | | Share-based
awards ($) | | Option-
based
awards
($)(3) | | Pension
Value
($) | | Non-equity
incentive
plan
compensation | | All other
compensation
($) | | Total
($) |
Patrick Cooke(4) (5) | | 80,917 | | Nil | | Nil | | Nil | | Nil | | Nil | | 80,917 |
Fikile Tebogo De Buck(6) (7) | | 74,500 | | Nil | | Nil | | Nil | | Nil | | Nil | | 74,500 |
Anu Dhir(8) | | 89,083 | | Nil | | Nil | | Nil | | Nil | | Nil | | 89,083 |
Wayne Kirk(9) | | Nil | | Nil | | Nil | | Nil | | Nil | | Nil | | Nil |
Sipho Nkosi(10) | | 21,417 | | Nil | | Nil | | Nil | | Nil | | Nil | | 21,417 |
Rizelle Sampson(11) | | 56,000 | | Nil | | Nil | | Nil | | Nil | | Nil | | 56,000 |
Notes:
| (1) | Directors who are also NEOs and receive compensation for services as directors are included in the NEO summary compensation table. |
| (2) | Includes all fees awarded, earned, paid or payable in cash for services as a director, including annual retainer fees, committee, chair and meeting fees. |
| (3) | No Options were granted to directors in 2012. |
| (4) | Nominating and Governance Committee Chairperson. |
| (5) | Patrick Cooke joined the Company as a director on February 28, 2012. |
| (6) | Fikile De Buck joined the Company as a director in September 2008. |
| (7) | Audit Committee Chairperson. |
| (8) | Anu Dhir joined the Company as a director in July 2008, was appointed Lead Independent Director in 2012 and is the Chairperson of the Compensation Committee. |
| (9) | Wayne Kirk resigned in January 2012. |
| (10) | Sipho Nkosi resigned in July 2012. |
| (11) | Rizelle Sampson joined the Company as a director in September 2004 and is the Chairperson of the Sustainable Development and Health and Safety Committee. |
26
The following table sets out all Option-based awards and share-based awards outstanding as at December 31, 2012, for each non-NEO director:
| | | | | | | | |
NAME | | Option-based Awards |
| | Number of
securities
underlying
unexercised
Options
(#) | | Option
exercise
price
($) | | Option
expiration
date | | Value of
unexercised
in-the-money
Options(1)
($) |
Patrick Cooke | | Nil | | Nil | | Nil | | Nil |
Fikile De Buck | | 100,000 | | 0.84 | | November 30, 2016 | | Nil |
Anu Dhir | | 120,000
150,000 | | 1.29
0.84 | | June 25, 2013
November 30, 2016 | | Nil |
Rizelle Sampson | | 240,000
150,000 | | 1.29
0.84 | | October 15, 2012
November 30, 2016 | | Nil |
Wayne Kirk | | Nil | | Nil | | Nil | | Nil |
Sipho Nkosi | | Nil | | Nil | | Nil | | Nil |
Note:
| (1) | The value at December 31, 2012 is calculated by determining the difference between the closing price of the Company’s Common Shares on December 31, 2012 ($0.14) underlying the Option on the TSX-V and the exercise price. |
The following table sets out all incentive plans (value vested or earned) during the year ended December 31, 2012, for each non-NEO director:
| | | | |
NAME | | Option based
awards - Value
vested during the
year(1) | | Non-equity based
incentive
compensation –
Value earned
during year |
Patrick Cooke | | Nil | | Nil |
Fikile De Buck | | Nil | | Nil |
Anu Dhir | | Nil | | Nil |
Rizelle Sampson | | Nil | | Nil |
Wayne Kirk | | Nil | | Nil |
Sipho Nkosi | | Nil | | Nil |
Note:
| (1) | These amounts represent the aggregate dollar value that would have been realized if the Options under the Option-based award had been exercised on the vesting date. The value of each amount has been determined by taking the difference between the market price of the Option at date of exercise and the exercise or base price of the Option under the Option-based award on the vest date. |
27
CORPORATE GOVERNANCE
The Board believes that good corporate governance improves corporate performance and benefits all Shareholders. The CSA have adopted NP 58-201, which provides non-prescriptive guidelines on corporate governance practices for reporting issuers such as the Company. In addition, the CSA have implemented NI 58-101, which prescribes certain disclosure by the Company of its corporate governance practices. This section sets out the Company’s approach to corporate governance and addresses the Company’s compliance with NI 58-101.
NI 58-101 considers directors to be independent if they have no direct or indirect material relationship with the Company. A “material relationship” is a relationship which could, in the view of the Company’s Board of Directors, be reasonably expected to interfere with the exercise of a director’s independent judgment. Examples of such material relationships include employment relationships, officer positions and recent employment by the auditors and like matters. The majority of the directors of the Company are independent directors.
The Company’s Corporate Governance Policies and Procedures Manual, which governs and mandates the conduct of the Board of Directors and delineates director responsibilities and qualification standards, is available on the Company’s website atwww.atlatsaresources.co.za. The Company is in the process of updating this manual. Information on the Company’s website is not a part of this Management Information Circular.
The CSAs’ corporate governance guidance suggests that independent directors hold regularly scheduled meetings at which non-independent directors and members of management are not in attendance. The Board believes it is important that the Board of Directors regularly meet without management of the Company, but has also determined that open and candid discussion among independent directors is not necessarily inhibited by the presence of the non-independent directors and their exclusion from such meetings is not always warranted. No formal meeting of the independent directors was held during the year ended December 31, 2012.
The Board currently does not have an independent Chair. Anu Dhir is the Company’s lead independent director. The Board facilitates its independent supervision over management in several ways including the holding of regular board meetings and committee meetings, informal discussions among independent directors and management and by retaining independent consultants where it deems necessary. With the exception of the Investment Committee, each of the standing board committees is also solely comprised of independent directors. Independent supervision is also achieved by the formation of special committees of the independent directors to oversee any matters in which non-independent directors who are members of management may have an interest. In addition, the Board of Directors has direct access to the Company’s external auditors, legal counsel and to any of the Company’s officers.
The independent members of the Board of Directors of the Company for the year ended December 31, 2012 (“Fiscal 2012”) were Fikile De Buck, Anu Dhir, Wayne Kirk (resigned January 31, 2012), Sipho Nkosi (resigned July 2012), Rizelle Sampson and Patrick Cooke (appointed February 1, 2012).
The non-independent directors for Fiscal 2012 were Harold Motaung (President and CEO) and Tumelo Motsisi (Executive Chair of the Board).
28
The following table sets forth the record of attendance of board and committee meetings by directors for the year ended December 31, 2012:
| | | | | | | | | | |
Director | | Board Meetings | | Audit Committee | | Nominating and
Governance
Committee | | Compensation
Committee | | Sustainable
Development and
Health & Safety
Committee |
Patrick Cooke(1)(2) (3) (4) | | 6 of 6 | | 4 of 4 | | 3 of 3 | | 3 of 3 | | Not applicable |
Fikile De Buck(4)(5)(6)(7) | | 5 of 6 | | 4 of 4 | | 3 of 3 | | Not applicable | | 3 of 3 |
Anu Dhir(3)(4)(7) (8) (9)(10) | | 6 of 6 | | 4 of 4 | | Not applicable | | 3 of 3 | | 3 of 3 |
Harold Motaung | | 6 of 6 | | Not applicable | | Not applicable | | Not applicable | | Not applicable |
Tumelo Motsisi(11)(12) | | 6 of 6 | | Not applicable | | Not applicable | | Not applicable | | Not applicable |
Sipho Nkosi(3)(6)(13) | | 2 of 6 | | Not applicable | | 1 of 3 | | 1 of 3 | | Not applicable |
Rizelle Sampson(7)(14) | | 5 of 6 | | Not applicable | | Not applicable | | Not applicable | | 3 of 3 |
Notes:
| (1) | Appointed to the Board February 1, 2012. Mr. Cooke was appointed to the following Committees as follows: |
| | • | | Nominating and Governance Committee Chairperson on February 28, 2012 to fill the vacancy on the Nominating and Governance Committee following the resignation of Mr. Kirk; |
| | • | | Audit Committee on February 28, 2012 to fill the vacancy on the Audit Committee following the resignation of Mr. Kirk; and |
| | • | | Compensation Committee on May 3, 2012 to fill the vacancy created by the departure of Mr. Nkosi who did not make himself available for re-election at the 2012 Annual General Meeting. |
| (2) | Nominating and Governance Committee Chairperson. |
| (3) | Member of the Compensation Committee. |
| (4) | Member of the Audit Committee. |
| (5) | Audit Committee Chairperson. |
| (6) | Member of the Nominating and Governance Committee. |
| (7) | Member of the Sustainable Development and Health and Safety Committee. |
| (8) | Compensation Committee Chairperson. |
| (9) | Chairperson of the Investment Committee. |
| (10) | Lead independent Director. |
| (11) | Chairperson of the Atlatsa Board of Directors. |
| (12) | Member of the Investment Committee. |
| (13) | Resigned in July 2012. |
| (14) | Chairperson of the Sustainable Development and Health and Safety Committee. |
The Board has not adopted descriptions for the position of Executive Chair of the Board, the Chair of the committees of the Board, or the Chief Executive Officer. However, the Company’s Corporate Governance Policies and Procedures Manual, which is available on the Company’s website www.atlatsaresources.co.za, delineates the responsibilities and roles of the Board and each of the Board committees. In addition, the guidelines regarding the delegation of the Board’s authority to senior officers of the Company is annexed as Section D-2 to the Corporate Governance Policies and Procedures Manual.
| 3. | Orientation and Continuing Education |
The Company has traditionally retained experienced mining people as directors and hence the orientation needed is minimized. When new directors are appointed, they are acquainted with the Company’s mineral projects and the expectations of directors. Board meetings generally include presentations by the Company’s senior management and project staff in order to give the directors full insight into the Company’s operations. External consultants, including iThemba Governance and Statutory Solutions (Pty) Ltd. and KPMG Inc., also provide the Board with periodic legal updates.
29
| 4. | Ethical Business Conduct |
The Board has adopted a formal ethics policy (the “Code of Ethics”) that applies to all directors, officers and employees of the Company, included in Section B-3 to the Company’s Corporate Governance Policies and Procedures Manual, which is available on the Company’s website www.atlatsaresources.co.za. The Board also believes that the fiduciary duties placed on individual directors by the Company’s governing corporate legislation and the common law and the restrictions placed by applicable corporate legislation on an individual directors’ participation in decisions of the Board in which the director has an interest have been sufficient to ensure that the Board operates independently of management and in the best interests of the Company.
Compliance with the Code of Ethics is monitored by the Nomination and Governance Committee. No departures from the Code of Ethics were identified by the Nominating and Governance Committee during Fiscal 2012. The Board has a number of policies in place designed to ensure that directors exercise independent judgment in matters where a director or officer has a material interest. In those circumstances, the relevant director and officer must declare their interest and in the case of a director, refrain from voting and the Nominating and Governance Committee considers any interested party transactions in advance of their consideration by the Board.
| 5. | Nomination of Directors |
The Board considers its size each year when it considers the directors to recommend to the Shareholders for election at the annual meeting of Shareholders, taking into account the number required to carry out the Board’s duties effectively and to maintain a diversity of views and experience. The Board has a Nominating and Governance Committee, composed entirely of independent directors, though the full Board retains responsibility for the recommendation of directors to the Shareholders for election.
The Board recognizes the lack of mining experience of the Board and is currently, in conjunction with completing the refinancing exercise, searching for two suitable qualified and experienced persons to be appointed as directors.
The Company’s Compensation Committee, which is comprised entirely of independent directors, considers compensation for the directors and executive officers and submits its compensation recommendations to the Board for approval.
The Board has not adopted descriptions for the positions of Board Chair, and the Chair for each of the Board committees, but, as at the date of this Information Circular, the roles and responsibilities for the Board and for each of the Board committees has been described in the Company’s Corporate Governance Policies and Procedures Manual dated June 1, 2010, which is available on the Company’s website at www.atlatsaresources.co.za.
Audit Committee
See “Audit Committee and Relationship with Auditor” below.
Nominating and Governance Committee
Members: Patrick Cooke (Chair) and Fikile Tebogo De Buck. Sipho Nkosi resigned from being a member in July 2012. Wayne Kirk resigned from being a member of the Nominating and Governance Committee on January 31, 2012. Patrick Cooke was appointed to serve on the Nominating and Governance Committee as of February 28, 2012, and to act as Chair of this committee.
All of the members of the Nominating and Governance Committee, including the Chair, are independent members of the Board.
30
The Nominating and Governance Committee’s functions include reviewing and making recommendations to the Board on the Company’s general corporate governance framework, the composition and performance of the Board and its committees, appointment of directors and group executive committee members, legal compliance and the Company’s ethics policy and programs.
It is also within the mandate of the Nominating and Governance Committee to oversee the Company’s majority voting policy, which provides, in certain circumstances, that if the votes “for” the election of a director nominee at a meeting of Shareholders are fewer than the number voted “withhold”, the nominee is expected to submit his or her resignation promptly after the meeting for consideration by the Nominating and Governance Committee. The Nominating and Governance Committee will make a recommendation to the Board after reviewing the matter, and the Board will then decide whether to accept or reject the resignation.
Compensation Committee
Members: Anu Dhir (Chair) and Patrick Cooke and met three times in 2012.
Sipho Nkosi resigned from the Compensation Committee in July 2012. Patrick Cooke was appointed to the Compensation Committee effective July 17, 2012.
All the members of the Compensation Committee, including the Chair, are independent non-executive directors. The CEO and the Executive Chair attend the meetings of the Compensation Committee at the request of the Compensation Committee, but are requested to leave the meeting before any decisions are made.
The Compensation Committee evaluates and monitors Atlatsa’s remuneration philosophy and practices, ensures that they are consistent with sound governance principles and management systems and are aligned with the Company’s approach to risk management, in that inappropriate risk taking is not incentivized.
Other key terms of reference set out in the mandate of the Compensation Committee include:
| | • | | providing guidance on the evaluation of the performance of NEOs; |
| | • | | determining and recommending to the Board, the remuneration of NEOs and directors, whose remuneration is subject to shareholder approval; |
| | • | | reviewing and approving total guaranteed package values including the annual short term and long term incentives granted to executive management; |
| | • | | reviewing and approving proposals for annual salary adjustments and proposed changes to benefit fund rules across the Company; |
| | • | | approving the principles, formulae applied and Company performance targets as well as the achievement thereof on which short-term and long-term incentives are based; |
| | • | | reviewing and approving the terms and conditions of the executive directors’ service agreements; and |
| | • | | annually assessing the performance of the committee and the committee members. |
Sustainable Development and Health and Safety Committee
Members: Fikile De Buck, Anu Dhir and Rizelle Sampson (Chairperson).
31
The Sustainable Development and Health and Safety Committee meets at least four times a year, or more frequently as circumstances dictate.
The objective of the Sustainable Development and Health and Safety Committee is to assist the Board in ensuring that we are and remain a committed socially responsible corporate citizen. The committee’s primary role is to supplement, support, advise and provide guidance on the effectiveness or otherwise of management’s efforts in respect of sustainable development.
The committee considers the following sustainable development issues: occupational health, safety, HIV/Aids, social investment and environmental management.
Investment Committee
Members: Anu Dhir (Chairperson), Tumelo Motsisi.
The Investment Committee meets as and when investment opportunities are identified. During Fiscal 2012, no meetings were held.
The primary purpose of the Investment Committee is to consider projects, acquisitions and the disposal of assets in line with the Company’s overall strategy. This includes performing such other investment related functions as may be designated by the Board from time to time, considering the viability of the capital project and/or acquisition and/or disposal and the effect it may have on the Company’s cash flow, as well as whether these will fit the Company’s overall strategy. This committee’s remit includes ensuring that due diligence procedures are followed when acquiring or disposing of assets.
Special Committee
Members: Fikile De Buck, Patrick Cooke (Chairperson) and Anu Dhir
The primary purpose of the Special Committee is to evaluate unusual/special transactions that occur on an ad-hoc basis. The Special Committee came into effect to address the Company’s re-financing and re-structuring plan.
The Board has no committees other than the Audit Committee, Nominating and Governance Committee, Compensation Committee, Sustainable Development and Health and Safety Committee and Investment Committee and Special Committee.
The Board monitors the adequacy of information given to directors, communication between the Board and management, and the strategic direction and processes of the Board and its committees. The Board and its committees have initiated a self-assessment process.
The Board is satisfied with the overall project and corporate achievements of the Company and believes this reflects well on the Board and its practices.
32
AUDIT AND RISK COMMITTEE AND RELATIONSHIP WITH AUDITOR
The CSA have adopted NI 52-110, which requires the Company to disclose annually in its Information Circular certain information concerning the constitution of its Audit and Risk Committee (the “Audit Committee”) and its relationship with its independent auditor, as set forth in the following:
The Audit Committee’s Charter
The Audit Committee is an important element of the Board’s system of monitoring and control. The text of the Audit Committee’s charter is available as Section C-1 to the Company’s Corporate Governance Policies and Procedures Manual, which is available on the Company’s website at www.atlatsaresources.co.za. The Audit Committee meets at least four times a year.
Composition of the Audit Committee
The members of the Audit Committee in 2012 were Anu Dhir, Fikile De Buck and Patrick Cooke. All the members of the Audit Committee are independent non-executive directors, financially literate and have extensive Audit Committee experience. Wayne Kirk resigned from the Audit Committee on January 31, 2012. Patrick Cooke was appointed to serve on the Audit Committee as from February 28, 2012.
The Executive Chair of the Board, the CEO, CFO, the internal auditors (outsourced function) and external auditors attend Audit Committee meetings on invitation.
The Audit Committee has been established primarily to assist the Board in overseeing:
| | • | | the quality and integrity of the company’s financial statements (including group financial statements) and public disclosures in respect thereof; |
| | • | | the qualification and independence of the external auditors for Atlatsa; |
| | • | | the scope and effectiveness of the external audit function for Atlatsa; |
| | • | | the effectiveness of the Company’s internal controls; |
| | • | | compliance with legal and regulatory requirements to the extent that it might have an impact on financial statements; and |
In addition to the responsibilities above, the Board has appointed the Audit Committee to perform on behalf of all South African subsidiaries of Atlatsa, the functions listed in section 94(7) of the South African Companies Act.
The Board has delegated extensive powers in accordance with the South African Companies Act and US corporate governance requirements to the Audit Committee to perform the above functions. In line with these requirements, the Audit Committee has, among other things, determined which categories of non-audit services provided by the external auditors should be pre-approved by the Audit Committee.
The Audit Committee meets regularly with the Company’s external auditors and managers to consider risk assessment and management, to review the audit plans of the external auditors, and to review accounting, auditing, financial reporting, corporate governance and compliance matters. The Audit Committee approves the external auditors’ engagement letter on the terms, nature and scope of the audit function and the audit fee. Interim and annual results of the Company and trading statements of the Company are reviewed by the Audit Committee before publication. The Audit Committee usually makes recommendations and refers matters for information or approval to the Board.
33
Both the Audit Committee and the Board are satisfied that the independence of the external auditors is not in any way impaired or compromised.
Relevant Education and Experience
As a result of his or her education and experience, each member of the Audit Committee has familiarity with, an understanding of, or experience in:
| | • | | the accounting principles used by the Company to prepare its financial statements, and the ability to assess the general application of those principles in connection with estimates, accruals and reserves; |
| | • | | reviewing or evaluating financial statements that present a breadth and level of complexity of accounting issues that are generally comparable to the breadth and complexity of issues that can reasonably be expected to be raised by the Company’s financial statements, and |
| | • | | an understanding of internal controls and procedures for financial reporting. |
Ms. De Buck is a Fellow of the Association of Chartered Certified Accountants (FCCA (UK)). Ms. Dhir has extensive experience in international business, operations and legal affairs in private equity and publicly-held companies in the mining, oil and gas, and technology sectors. Mr. Cooke is a Chartered Accountant (CA (SA)). All of the Audit Committee members are “financially literate”, as that term is defined in NI 52-110.
Reliance on Certain Exemptions
The Company’s auditors, KPMG, have not provided any material non-audit services, except as noted in the table below. Both the Audit Committee and the Board are satisfied that the independence of its external auditors is not in any way impaired or compromised.
Pre-Approval Policies and Procedures
The Company has procedures for the review and pre-approval of any services performed by its auditors. The procedures require that all proposed engagements of its auditors for audit and non-audit services be submitted to the Audit Committee for approval prior to the beginning of any such services. The Audit Committee considers such requests and, if acceptable to a majority of the Audit Committee members, pre-approves such audit and non-audit services by a resolution authorizing management to engage the Company’s auditors for such audit and non-audit services, with set maximum monetary amounts for each itemized service. During such deliberations, the Audit Committee assesses, among other factors, whether the services requested would be considered “prohibited services” as contemplated by the regulations of the US Securities and Exchange Commission, and whether the services requested and the fees related to such services could impair the independence of the auditors.
External Auditor Service Fees
The Audit Committee has reviewed the nature and amount of the audit and non-audit services provided by KPMG to the Company to ensure auditor independence. Fees incurred with KPMG for audit and non-audit services in the last two fiscal years are outlined in the following table.
| | | | | | | | |
Nature of Services | | Fees paid to
auditor in
year ended
December 31,
2012 | | | Fees paid to
auditor in
year ended
December 31,
2011 | |
Audit Fees (1) | | $ | 514,905 | | | $ | 550,806 | |
Audit-Related Fees (2) | | $ | — | | | $ | 47,298 | |
Tax Fees(3) | | $ | 197,136 | | | $ | 70,330 | |
All Other Fees(4) | | $ | — | | | $ | 6,840 | |
| | | | | | | | |
Total | | $ | 712,041 | | | $ | 675,274 | |
| | | | | | | | |
34
Notes:
| (1) | “Audit Fees” consist of fees billed for the annual audit services engagement and other audit services, which are those services that only the Company’s external auditor reasonably can provide, and include audits, interim reviews, comfort letters and consents, other attest services related to the audit or regulatory filings, and services associated with the filing of documents with regulatory authorities. |
| (2) | “Audit-Related Fees” consist of fees billed for assurance and related services that are reasonably related to the performance of the audit or review of the Company’s financial statements or that are traditionally performed by the external auditor, and include consultations related to financial accounting and reporting matters and standards, and other periodic reports. |
| (3) | “Tax Fees” include fees for all tax services other than those included in “Audit Fees” and “Audit-Related Fees”. This category includes fees for tax compliance, tax planning and tax advice. Tax planning and tax advice includes assistance with tax audits and appeals, tax advice related to mergers and acquisitions, and requests for rulings or technical advice from tax authorities. |
| (4) | “All Other Fees” include all other non-audit services. |
Pursuant to JSE Listing Requirements, the Audit Committee has met with the executive financial director and is satisfied that Mr. De Wet Schutte, the Chief Financial Officer of the Company, meets all of the JSE Listing Requirements to fulfill the role of Chief Financial Officer of Atlatsa.
INDEBTEDNESS OF DIRECTORS AND EXECUTIVE OFFICERS
No directors, executive officers or their respective associates or affiliates, or other management of the Company were indebted to the Company as of the end of the most recently completed financial year or as at the date hereof.
INTEREST OF INFORMED PERSONS IN MATERIAL TRANSACTIONS
Other than as set out herein, none of the directors or officers of the Company, no director or officer of a body corporate that is itself an insider or a subsidiary of the Company, no person or company who beneficially owns, directly or indirectly, voting securities of the Company or who exercised control or direction over voting securities of the Company or a combination of both carrying more than 10% of the voting rights attached to any class of outstanding voting securities of the Company entitled to vote in connection with any matters being proposed for consideration at the Meeting, no proposed director or nominee for election as director of the Company and no associate or affiliate of any of the foregoing has or had any material interest, direct or indirect, in any transaction or proposed transaction during the fiscal year ended December 31, 2012 that has materially affected or would or could materially affect the Company or any of its subsidiaries.
MANAGEMENT CONTRACTS
There are no management functions of the Company which are to any substantial degree performed by a person or company other than the directors or executive officers of the Company.
OTHER MATTERS
The directors of the Company are not aware of any other matters which they anticipate will come before the Meeting as of the date of mailing of this Information Circular.
The contents of this Information Circular and its distribution to Shareholders have been approved by the Board of Directors.
35
The directors of the Company whose names are set out on page 11 of this Information Circular as at the date hereof collectively and individually accept full responsibility for the accuracy of the information given in this Information Circular and certify that, to the best of their knowledge and belief, there are no facts that have been omitted which would make any statement false or misleading, all reasonable enquiries to ascertain such facts have been made, and the circular contains all information required by the JSE Listings Requirements.
ADDITIONAL INFORMATION
Additional information relating to the Company is available on SEDAR atwww.sedar.com. Financial information is provided in the audited financial statements for the year ended December 31, 2012 and the accompanying auditor’s report thereon and related management’s discussion and analysis which were filed on SEDAR on March 28, 2013. Additional information may be obtained upon request from the Company at telephone number (604) 684-6365 or +27 11 883 0831 (South Africa) or fax number (604) 684-8092 or +27 11 883 0836 (South Africa).
DATED at Vancouver, British Columbia on the 28th day of May, 2013.
BY ORDER OF THE BOARD OF DIRECTORS
“Harold Motaung”
Harold Motaung
Chief Executive Officer of Atlatsa and duly
authorized signatory on behalf of the other directors
36
Document 2
| | |
ATLATSA RESOURCES CORPORATION | |  |
| | 9th Floor, 100 University Avenue |
| | Toronto, Ontario M5J 2Y1 |
| | www.computershare.com |
| | | | |
| | | | Security Class |
| | |
| | | | Holder Account Number |
Form of Proxy - Annual General Meeting to be held on June 28, 2013
This Form of Proxy is solicited by and on behalf of Management.
Notes to proxy
| | | | |
| 1. | | Every registered holder has the right to appoint some other person or company of their choice, who need not be a registered holder, to attend and act on their behalf at the meeting or any adjournment or postponement thereof. If you wish to appoint a person or company other than the persons whose names are printed herein, please insert the name of your chosen proxyholder in the space provided (see reverse). | | |
| | |
| 2. | | If the securities are registered in the name of more than one owner (for example, joint ownership, trustees, executors, etc.), then all those registered should sign this proxy. If you are voting on behalf of a corporation or another individual you must sign this proxy with signing capacity stated, and you may be required to provide documentation evidencing your power to sign this proxy. | | |
| | |
| 3. | | This proxy should be signed in the exact manner as the name(s) appear(s) on the proxy. | | |
| | |
| 4. | | If this proxy is not dated, it will be deemed to bear the date on which it is mailed by Management to the registered holder. | | |
| | |
| 5. | | The securities represented by this proxy will be voted as directed by the registered holder, however, if such a direction is not made in respect of any matter, this proxy will be voted as recommended by Management. | | |
| | |
| 6. | | The securities represented by this proxy will be voted in favour or withheld from voting or voted against each of the matters described herein, as applicable, in accordance with the instructions of the registered holder, on any ballot that may be called for and, if the registered holder has specified a choice with respect to any matter to be acted on, the securities will be voted accordingly. | | |
| | |
| 7. | | This proxy confers discretionary authority in respect of amendments or variations to matters identified in the Notice of Meeting or other matters that may properly come before the meeting or any adjournment or postponement thereof. | | Fold |
| | |
| 8. | | This proxy should be read in conjunction with the accompanying documentation provided by Management. | | |
Proxies submitted must be received by 4:15 PM (Central African Time), 10:15 AM (Eastern Time), 7:15 AM (Pacific Time), on June 26, 2013.
VOTE USING THE TELEPHONE OR INTERNET 24 HOURS A DAY 7 DAYS A WEEK!
| | | | | | | | | | |
 | | | |  |
| | | | | |
| • | | Call the number listed BELOW from a touch tone telephone. | | | | • Go to the following web site: www.investorvote.com | |  | | |
| | 1-866-732-VOTE (8683) Toll Free | | | | • Smartphone? Scan the QR code to vote now. | | | |
If you vote by telephone or the Internet, DO NOT mail back this proxy.
Voting by mailmay be the only method for securities held in the name of a corporation or securities being voted on behalf of another individual.
Voting by mail or by Internetare the only methods by which a holder may appoint a person as proxyholder other than the Management nominees named on the reverse of this proxy. Instead of mailing this proxy, you may choose one of the two voting methods outlined above to vote this proxy.
To vote by telephone or the Internet, you will need to provide your CONTROL NUMBER listed below.
CONTROL NUMBER
| | | | | | | | | | | | |
Appointment of Proxyholder | | | | | | | | | | | | |
| I/We, being holder(s) of Atlatsa Resources Corporation hereby appoint:Harold Motaung, or failing him, Tumelo Motsisi, | | | | OR | | | | Print the name of the person you are appointing if this person is someone other than the Chairman of the Meeting. | | | | |
as my/our proxyholder with full power of substitution and to attend, act and to vote for and on behalf of the shareholder in accordance with the following direction (or if no directions have been given, as the proxyholder sees fit) and all other matters that may properly come before the Annual General Meeting of shareholders of Atlatsa Resources Corporation to be held at 82 Grayston Drive, 4th Floor, Sandton, Johannesburg, South Africa, with a simulcast live by video conference to Atlatsa Resources Corporation’s registered offices in Canada at Suite 1300, 777 Dunsmuir Street, Vancouver, British Columbia, on June 28, 2013 at 4:15 PM (Central African Time), 10:15 AM (Eastern Time), 7:15 AM (Pacific Time), and at any adjournment or postponement thereof.
|
| VOTING RECOMMENDATIONS ARE INDICATED BYHIGHLIGHTED TEXT OVER THE BOXES. |
| | | | | | | | | | | | | | | | | | | | | | | | |
| 1. | | Election of Directors | | | | | | | | | | | | | | |
| | | | For | | Withhold | | | | | | For | | Withhold | | | | | | For | | Withhold | | |
01. | | Fikile Tebogo De Buck | | ¨ | | ¨ | | 02. | | Anu Dhir | | ¨ | | ¨ | | 03. | | Harold Motaung | | ¨ | | ¨ | | Fold |
04. | | Tumelo Motsisi | | ¨ | | ¨ | | 05. | | Rizelle Sampson | | ¨ | | ¨ | | 06. | | Patrick Cooke | | ¨ | | ¨ | |
| | | | | | | | | | | | |
| | | | | | | | | | | | | | | | | | | | | | | | |
| | | | | | | | | | | | | | | | | | | | For | | Withhold | | |
| | | | | |
| 2. | | Appointment of Auditors | | | | | | | | |
| Appointment of KPMG LLP as Auditors of the Corporation for the ensuing year and authorizing the Directors to fix their remuneration. | | ¨ | | ¨ | | |
| | | | | | | | |
Authorized Signature(s) - This section must be completed for your instructions to be executed. | | | | Signature(s) | | | | Date |
| I/We authorize you to act in accordance with my/our instructions set out above. I/We hereby revoke any proxy previously given with respect to the Meeting.If no voting instructions are indicated above, this Proxy will be voted as recommended by Management. | | | | | | | | DD / MM / YY |
| | | | | | |
Interim Financial Statements- Mark this box if you would like to receive Interim Financial Statements and accompanying Management’s Discussion and Analysis by mail. | | ¨ | | Annual Financial Statements- Mark this box if you would like to receive the Annual Financial Statements and accompanying Management’s Discussion and Analysis by mail. | | ¨ |
If you are not mailing back your proxy, you may register online to receive the above financial report(s) by mail at www.computershare.com/mailinglist. |
| | | | | | | | |
¢ | | 1 7 0 2 6 2 | | A R 1 | | A R Q Q | | + |
Document 3
| | |
ATLATSA RESOURCES CORPORATION | |  |
| | 9th Floor, 100 University Avenue |
| | Toronto, Ontario M5J 2Y1 |
| | www.computershare.com |
| | | | |
| | | | Security Class |
| | |
| | | | Holder Account Number |
Voting Instruction Form (“VIF”) - Annual General Meeting to be held on June 28, 2013
NON-REGISTERED (BENEFICIAL) SECURITYHOLDERS
| | | | |
| 1. | | We are sending to you the enclosed proxy-related materials that relate to a meeting of the holders of the series or class of securities that are held on your behalf by the intermediary identified above. Unless you, or a nominee appointed by you, attend the meeting and vote in person in accordance with the instructions contained herein, your securities can be voted only by management, as proxy holder of the registered holder, in accordance with your instructions. | | |
| | |
| 2. | | We are prohibited from voting these securities on any of the matters to be acted upon at the meeting without your specific voting instructions.In order for these securities to be voted at the meeting,it will be necessary for us to have your specific voting instructions.Please complete and return the information requested in this VIF to provide your voting instructions to us promptly. | | |
| | |
| 3. | | If you want to attend the meeting and vote in person, please write your name in the place provided for that purpose in this form. You can also write the name of someone else whom you wish to attend the meeting and vote on your behalf. Unless prohibited by law, the person whose name is written in the space provided will have full authority to present matters to the meeting and vote on all matters that are presented at the meeting, even if those matters are not set out in this form or the information circular. Consult a legal advisor if you wish to modify the authority of that person in any way. If you require help, please contact the Registered Representative who services your account. | | |
| | |
| 4. | | This VIF should be signed by you in the exact manner as your name appears on the VIF. If these voting instructions are given on behalf of a body corporate set out the full legal name of the body corporate, the name and position of the person giving voting instructions on behalf of the body corporate and the address for service of the body corporate. | | |
| | |
| 5. | | If this VIF is not dated, it will be deemed to bear the date on which it is mailed by management to you. | | |
| | |
| 6. | | When properly signed and delivered, securities represented by this VIF will be voted as directed by you, however, if such a direction is not made in respect of any matter, the VIF will direct the voting of the securities to be made as recommended in the documentation provided by Management for the meeting. | | |
| | |
| 7. | | This VIF confers discretionary authority on the appointee to vote as the appointee sees fit in respect of amendments or variations to matters identified in the notice of meeting or other matters as may properly come before the meeting or any adjournment thereof. | | |
| | |
| 8. | | Your voting instructions will be recorded on receipt of the VIF. | | |
| | |
| 9. | | By providing voting instructions as requested, you are acknowledging that you are the beneficial owner of, and are entitled to instruct us with respect to the voting of, these securities. | | |
| | |
| 10. | | If you have any questions regarding the enclosed documents, please contact the Registered Representative who services your account. | | Fold |
11. | | This VIF should be read in conjunction with the information circular and other proxy materials provided by Management. | |
VIFs submitted must be received by 4:15 PM (Central African Time), 10:15 AM (Eastern Time), 7:15 AM (Pacific Time), on June 26, 2013.
VOTE USING THE TELEPHONE OR INTERNET 24 HOURS A DAY 7 DAYS A WEEK!
| | | | | | | | | | |
 | | | |  |
| | | | | |
| • | | Call the number listed BELOW from a touch tone telephone. | | | | • Go to the following web site: www.investorvote.com | |  | | |
| | 1-866-734-VOTE (8683) Toll Free | | | | • Smartphone? Scan the QR code to vote now. | | | |
If you vote by telephone or the Internet, DO NOT mail back this VIF.
Voting by mailmay be the only method for securities held in the name of a corporation or securities being voted on behalf of another individual.
Voting by mail or by Internetare the only methods by which a holder may choose an appointee other than the Management appointees named on the reverse of this VIF. Instead of mailing this VIF, you may choose one of the two voting methods outlined above to vote this VIF.
To vote by telephone or the Internet, you will need to provide your CONTROL NUMBER listed below.
CONTROL NUMBER
| | | | | | | | | | | | |
Appointee(s) | | | | | | | | | | | | |
| Management Appointees are: Harold Motaung, or failing him, Tumelo Motsisi, | | | | OR | | | | If you wish to attend in person or appoint someone else to attend on your behalf, print your name or the name of your appointee in this space (see Note #3 on reverse). | | | | |
as my/our appointee to attend, act and to vote in accordance with the following direction (or if no directions have been given, as the appointee sees fit) and all other matters that may properly come before the Annual General Meeting of securityholders of Atlatsa Resources Corporation to be held at 82 Grayston Drive, 4th Floor, Sandton, Johannesburg, South Africa, with a simulcast live by video conference to Atlatsa Resources Corporation’s registered offices in Canada at Suite 1300, 777 Dunsmuir Street, Vancouver, British Columbia, on June 28, 2013 at 4:15 PM (Central African Time), 10:15 AM (Eastern Time), 7:15 AM (Pacific Time), and at any adjournment or postponement thereof.
|
| VOTING RECOMMENDATIONS ARE INDICATED BYHIGHLIGHTED TEXT OVER THE BOXES. |
| | | | | | | | | | | | | | | | | | | | | | | | |
| 1. | | Election of Directors | | | | | | | | | | | | | | |
| | | | For | | Withhold | | | | | | For | | Withhold | | | | | | For | | Withhold | | |
01. | | Fikile Tebogo De Buck | | ¨ | | ¨ | | 02. | | Anu Dhir | | ¨ | | ¨ | | 03. | | Harold Motaung | | ¨ | | ¨ | | Fold |
04. | | Tumelo Motsisi | | ¨ | | ¨ | | 05. | | Rizelle Sampson | | ¨ | | ¨ | | 06. | | Patrick Cooke | | ¨ | | ¨ | |
| | | | | | | | | | | | |
| | | | | | | | | | | | | | | | | | | | | | | | |
| | | | | | | | | | | | | | | | | | | | For | | Withhold | | |
| | | | | |
| 2. | | Appointment of Auditors | | | | | | | | |
| Appointment of KPMG LLP as Auditors of the Corporation for the ensuing year and authorizing the Directors to fix their remuneration. | | ¨ | | ¨ | | |
| | | | | | | | |
Authorized Signature(s) - This section must be completed for your instructions to be executed. | | | | Signature(s) | | | | Date |
| If you are voting on behalf of a corporation or another individual you may be required to provide documentation evidencing your power to sign this VIF with signing capacity stated. | | | | | | | | DD / MM / YY |
| | | | | | |
Interim Financial Statements - Mark this box if you would like to receive Interim Financial Statements and accompanying Management’s Discussion and Analysis by mail. | | ¨ | | Annual Financial Statements - Mark this box if you would like to receive the Annual Financial Statements and accompanying Management’s Discussion and Analysis by mail. | | ¨ |
If you are not mailing back your VIF, you may register online to receive the above financial report(s) by mail at www.computershare.com/mailinglist. |
| | | | | | | | |
¢ | | 1 7 0 2 5 7 | | A R 1 | | A R Q Q | �� | + |
Document 4
ATLATSA RESOURCES CORPORATION
(Previously Anooraq Resources Corporation)

NOTICE OF SPECIAL MEETING
and
MANAGEMENT INFORMATION CIRCULAR
Meeting to be held on June 28, 2013
The TSX Venture Exchange has not in any way passed upon the merits of the
matters described herein and any representation to the contrary is an offence.
This document is important and requires your immediate attention.
If you are in any doubt as to the action you should take, please consult your broker, intermediary, Central Securities Depository Participant, banker, accountant, attorney or other independent professional adviser immediately.
Copies of this document, which is only available in English, may be obtained on SEDAR atwww.sedar.com, on the Company’s website at www.atlatsaresources.co.za or from the offices of Atlatsa Resources Corporation in South Africa – 4th Floor, 82 Grayston Drive, Sandton, Johannesburg, 2146
(Incorporated in British Columbia, Canada)
(Registration Number 10022-2033)
TSXV/JSE share code: ATL
ISIN: CA03633E1088
2
ATLATSA RESOURCES CORPORATION
Registered office in Canada: Suite 1300 – 777 Dunsmuir Street
Vancouver, British Columbia V7Y 1K2
Telephone (604) 643-7100 Fax (604) 643-7900
Head office in South Africa: 4th Floor, 82 Grayston Drive, Sandton, Johannesburg, 2146
Telephone +27 11 883 0831
May 28, 2013
To the Shareholders of Atlatsa Resources Corporation:
You are invited to attend the special meeting (the “Meeting”) of the holders (“Shareholders”) of common shares without par value (“Common Shares”) in the capital of Atlatsa Resources Corporation (previously Anooraq Resources Corporation) and (together with its subsidiaries where the context requires, “Atlatsa” or the “Company”) to be held at 82 Grayston Drive, Sandton, Johannesburg on June 28, 2013 at 16:00 (Central African Time)(07:00 Pacific Time) with a live simulcast by video conference to Atlatsa’s registered offices in Canada at Suite 1300, 777 Dunsmuir Street, Vancouver, British Columbia.
All capitalized terms used herein but not otherwise defined have the meaning ascribed thereto in the accompanying information circular of the Company dated May 28, 2013.
SPECIAL BUSINESS
The following items of special business will be dealt with at the Meeting:
Atlatsa and its wholly-owned subsidiary, Plateau Resources Proprietary Limited (“Plateau”), have entered into certain agreements with Anglo American Platinum Limited (“Anglo American Platinum”) and Rustenburg Platinum Mines Limited (“RPM”), a wholly-owned subsidiary of Anglo American Platinum, pursuant to which the parties agreed to certain transactions (the “Restructuring Plan”) intended to refinance, restructure and recapitalize Atlatsa and its subsidiaries. The following Restructuring Plan will be submitted to Shareholders for approval at the Meeting:
| (i) | Approval of the Asset Sale |
Atlatsa has agreed to sell its interest in certain exploration projects, being the Eastern section of the Ga-Phasha Project, and the Boikgantsho Project to RPM for consideration of ZAR 1.7 billion (US$162.2 million) (the “Asset Sale”). The proceeds of the Asset Sale will be applied to reduce Atlatsa’s outstanding debt owed to RPM.
| (ii) | Approval of the Debt Refinancing Transactions |
Atlatsa and Anglo American Platinum have agreed to restructure Atlatsa’s existing debt facilities with RPM through a series of transactions to repay and consolidate all of Atlatsa’s previously outstanding debt facilities into a new senior debt facility and working capital facility with RPM (the “New Debt Facility”).
| (iii) | Approval of RPM Share Subscription |
As part of the Debt Refinancing Transactions referred to above, Atlatsa and Anglo American Platinum have agreed to the RPM Share Subscription to further reduce Atlatsa’s outstanding debt. Atlatsa will issue to RPM 125 million Common Shares at an issue price of ZAR 6.00 (US$0.57) per Common Share, for an aggregate subscription price of ZAR 750 million (US$71.6 million) to be paid in cash. Atlatsa will apply the cash proceeds to repay a portion of the outstanding debt under the New Debt Facility, reducing the outstanding amount owed to RPM to approximately ZAR 833 million (US$79.5 million).
Following completion of the Asset Sale, Debt Refinancing Transactions and the RPM Share Subscription, Atlatsa will have an amount of approximately ZAR 717 million (US$68.4 million) available to it under the New Debt Facility for Atlatsa’s share of the Bokoni Mine’s cash flow requirements and a working capital facility of ZAR 90 million (US$8.6 million) to fund Atlatsa’s corporate and administrative expenses through to the end of 2015.
The Restructuring Plan referred to above must be approved by the requisite threshold of applicable disinterested shareholders at the Meeting in order for the Restructuring Plan to be implemented. Notwithstanding that the Restructuring Plan may be approved by shareholders, the Board of Directors of Atlatsa will retain the authority not to implement the Restructuring Plan contemplated above, in their sole discretion, as they see fit. If any one or more of the matters referred to above is not approved by Shareholders, the Board of Directors will not implement any of the transactions comprising the Restructuring Plan described above, as the completion of each such transaction is conditional on the completion of all of the transactions comprising the Restructuring Plan.
The Board of Directors has determined that the Restructuring Plan described above is in the best interests of Atlatsa. The Board of Directors of Atlatsa unanimously recommends that Shareholders vote in favor of the resolutions approving the Restructuring Plan described above.
The accompanying Information Circular provides a detailed description of each of the transactions comprising the Restructuring Plan described above. Please give this material careful consideration. If you have any questions regarding the enclosed material, please feel free to contact Atlatsa Resources Corporation, 4th Floor, 82 Grayston Drive Sandton, Johannesburg, 2146, Attn: Joel Kesler, telephone (+27) 11 883 0831 or facsimile (+27) 11 883 0836.
Shareholders should refer to the accompanying Information Circular for detailed instructions regarding voting and being represented at the Meeting.
|
| Yours truly, |
|
| (signed)“Harold Motaung” |
| Chief Executive Officer |
ATLATSA RESOURCES CORPORATION
NOTICE OF SPECIAL MEETING OF SHAREHOLDERS
All capitalized terms used herein but not otherwise defined have the meaning ascribed thereto in the accompanying information circular of the Company dated May 28, 2013 (the “Information Circular”).
NOTICE IS HEREBY GIVEN that a special meeting (the “Meeting”) of the holders (“Shareholders”) of common shares (“Common Shares”) in the capital of Atlatsa Resources Corporation (previously Anooraq Resources Corporation) (“Atlatsa” or the “Company”) will be held at 82 Grayston Drive, Sandton, Johannesburg on June 28, 2013 at 16:00 (Central African Time)(07:00 Pacific Time), with a live simulcast by video conference to Atlatsa’s registered offices in Canada at Suite 1300, 777 Dunsmuir Street, Vancouver, British Columbia, for the following purposes:
| A. | SPECIAL MEETING MATTERS |
| 1. | Disinterested Shareholders will be asked to consider and, if thought fit, approve an ordinary resolution approving the Asset Sale and certain transactions ancillary thereto, as more particularly set out in the Information Circular; |
| 2. | Disinterested Shareholders will be asked to consider and, if thought fit, approve an ordinary resolution approving the Debt Refinancing Transactions and certain transactions ancillary thereto, as more particularly set out in the Information Circular; |
| 3. | Disinterested Shareholders will be asked to consider and, if thought fit, approve an ordinary resolution approving the RPM Share Subscription and certain transactions ancillary thereto, as more particularly set out in the Information Circular; and |
| 4. | To consider any amendment to, or variation of, any matter identified in this notice and to transact such further business as may properly come before the Meeting or any adjournment or adjournments thereof. |
The Board of Directors will retain the authority, in the event that the resolutions described in this Notice of Meeting are approved by Shareholders, not to implement the transactions contemplated in such resolutions as the Board of Directors, in their sole discretion, may see fit. In the event that one or more of the above resolutions is not approved by Shareholders, the Board of Directors will not implement any of the transactions relating to or contemplated by the resolutions. Completion of the transactions comprising the Restructuring Plan is inter-conditional on all such transactions being approved and completed.
The Record Date for the determination of Shareholders entitled to receive notice of and to vote at the Meeting is May 28, 2013.
The audited annual financial statements of the Company for the three fiscal years ended December 31, 2012, December 31, 2011 and December 31, 2010, the Company’s annual report filed on Form 20-F for the three years ended December 31, 2012, December 31, 2011 and December 31, 2010, and the Company’s management discussion and analysis for the three years ended December 31, 2012, December 31, 2011 and December 31, 2010 are available on the System for Electronic Data Analysis and Retrieval at www.sedar.com.
Registered Shareholders other than South African Shareholders
A Registered Shareholder may attend the Meeting in person or may be represented by proxy. Registered Shareholders who are unable to attend the Meeting or any adjournment thereof in person are requested to date, sign and return the accompanying Proxy (blue) for use at the Meeting or any adjournment thereof. To be effective, the enclosed Proxy must be mailed so as to reach or be deposited with Computershare Trust Company of Canada by fax (1-866-249-7775) or by mail or by hand to 100 University Avenue, 9th Floor, Toronto, Ontario, M5J 2Y1 prior to 07:00 (Vancouver time) 16:00CAT) on June 26, 2013 or, if the Meeting is adjourned, not less than 48 hours (excluding Saturdays, Sundays and statutory holidays in the City of Vancouver) before the commencement of the adjourned Meeting or may be deposited with the Chair of the Meeting prior to the commencement thereof.
Beneficial Shareholders (being Shareholders who beneficially own and hold Common Shares through an Intermediary and who do not hold Common Shares in their own name) should refer to the accompanying Information Circular for voting information.
South African Shareholders
South African Shareholders holding Common Share certificates in their own names and South African Shareholders who have dematerialized their Common Shares and have elected “own-name” registration in the sub-register through a Central Securities Depository Participant (“CSDP”), may attend the Meeting in person or, if they are unable to attend the Meeting but wish to be represented thereat, must complete and return the attached South African Proxy (blue), to the offices of the Company’s transfer agent (by mail at Computershare Investor Services (Pty) Limited, PO Box 61051, Marshalltown, 2107 or by hand at Computershare Investor Services (Pty) Limited, Ground Floor, 70 Marshall Street, Johannesburg, 2001 to be received prior to 07:00 (Vancouver time) (16:00 CAT) on June 26, 2013 or, if the Meeting is adjourned, not less than 48 hours (excluding Saturdays, Sundays and statutory holidays in the City of Vancouver) before the commencement of the adjourned Meeting or may be deposited with the Chair of the Meeting prior to the commencement thereof.
South African Shareholders who have dematerialized their Common Shares through a CSDP or broker and who have not elected “own-name” registration in the sub-register maintained by a CSDP and South African Shareholders who hold certificated Common Shares through a nominee, who wish to attend the Meeting must instruct their CSDP, broker or nominee to issue them with the necessary letter of representation to attend, or, if they do not wish to attend the Meeting but wish to be represented thereat, they must provide their CSDP, broker or nominee with their voting instructions in terms of the custody agreement entered into between them and their CSDP, broker or nominee.
In respect of dematerialized Common Shares, it is important to ensure that the person or entity (such as a nominee) whose name has been entered into the relevant sub-register maintained by a CSDP completes the South African Proxy and appoints a proxy to vote at the Meeting.
If you are in any doubt as to the action you should take, please consult your broker, intermediary, CSDP, banker, accountant, attorney or other professional adviser immediately.
DATED at Vancouver, British Columbia this 28th day of May, 2013.
|
| BY ORDER OF THE BOARD OF DIRECTORS |
|
| (signed)“Harold Motaung” |
| Chief Executive Officer |
TABLE OF CONTENTS
MANAGEMENT INFORMATION CIRCULAR
ATLATSA RESOURCES CORPORATION
SPECIAL GENERAL MEETING OF SHAREHOLDERS
All capitalized terms used herein but not otherwise defined have the meanings set out under “Glossary of Terms”. The information given in this Information Circular is given as of May 21, 2013, unless otherwise indicated.
This management information circular (the “Information Circular”) is furnished in connection with the solicitation of proxies by the management of Atlatsa Resources Corporation (previously Anooraq Resources Corporation) (the “Company” or “Atlatsa”) for use at the special meeting (the “Meeting”) of shareholders of the Company to be held on June 28, 2013 at the time and place and for the purposes set forth in the accompanying notice of the Meeting.
No person has been authorized by the Company to give any information or make any representation in connection with any of the matters to be considered at the Meeting other than those contained in this Information Circular and, if given, any such information or representation must not be relied upon as having been authorized.
In this Information Circular, references to “the Company”, “Atlatsa”, “we” and “our” refer to Atlatsa Resources Corporation. References in this Information Circular to dollar amounts are to Canadian dollars, unless otherwise indicated. All financial figures quoted in US dollars in this Information Circular are converted at a rate of ZAR 10.48: US$1 (as at May 21, 2013). All financial figures quoted in Canadian dollars in this Information Circular are converted at a rate of ZAR 10.74: $1 (as at May 21, 2013).
This Information Circular has been prepared in accordance with Form 51-102F5 –Information Circular of the Canadian securities administrators. In addition to the Company’s primary TSX-V listing, the Company has secondary listings on NYSE MKT and the Main Board of the JSE and accordingly various additional disclosures have been included in this Information Circular in order to satisfy the JSE Listings Requirements.
SOUTH AFRICAN EXCHANGE CONTROL REGULATIONS PERTAINING TO NON-RESIDENTS
In terms of the Exchange Control Regulations of the Republic of South Africa:
| | • | | Any share certificates that might be issued on the JSE to shareholders not resident in South Africa will be endorsed “Non-Resident”; |
| | • | | Any new share certificates, dividend and residual cash payments based on emigrants’ shares controlled in terms of the Exchange Control Regulations, will be forwarded to the Authorised Dealer in foreign exchange controlling their blocked assets. The election by emigrants for the above purpose must be made through the authorized dealer in foreign exchange controlling their blocked assets. Such share certificates will be endorsed “Non-Resident”; and |
| | • | | Dividend and residual cash payments due to non-residents are freely transferable from the Republic of South Africa |
CAUTIONARY NOTE REGARDING FORWARD-LOOKING STATEMENTS
This Information Circular includes certain statements that may be deemed “forward-looking statements”. All statements in this Information Circular, other than statements of historical facts, including statements that address the proposed Restructuring Plan (as defined below), Bokoni Mine (as defined below) production and expansion, future executive compensation policies and events or developments that Atlatsa expects, are forward-looking statements. These statements appear in a number of different places in this Information Circular and can be identified by words such as “anticipates”, “estimates”, “projects”, “expects”, “intends”, “believes”, “plans”, “will”, “could”, “may”, or their negatives or other comparable words. Such forward-looking statements involve known and unknown risks, uncertainties and other factors that may cause the Company’s actual results, performance or achievements to be materially different from any future results, performance or achievements that may be expressed or implied by such forward-looking
statements. The Company believes that such forward-looking statements are based on material factors and reasonable assumptions, including assumptions that the Restructuring Plan and the Bokoni Mine (as defined below) expansion projects will complete on favorable terms.
Forward-looking statements however, are not guarantees of future performance and actual results or developments may differ materially from those projected in forward-looking statements. Factors that could cause actual results to differ materially from those in forward-looking statements include the failure to implement the Restructuring Plan or the Bokoni Mine (as defined below) expansion projects on favorable terms, or at all, failure to implement executive compensation policies, fluctuations in market prices, the levels of exploitation and exploration successes, changes in and the effect of government policies with respect to mining and natural resource exploration and exploitation, continued availability of capital and financing, general economic, market or business conditions, failure of plant, equipment or processes to operate as anticipated, accidents, labor disputes, industrial unrest and strikes, political instability, insurrection or war, the effect of HIV/AIDS on labor force availability and turnover, and delays in obtaining government approvals.
Atlatsa advises investors that these cautionary remarks expressly qualify in their entirety all forward-looking statements attributable to Atlatsa or persons acting on its behalf. Atlatsa assumes no obligation to update its forward-looking statements to reflect actual results, changes in assumptions or changes in other factors affecting such statements, except as required by law. Investors should carefully review the cautionary statements and risk factors contained in this and other documents that Atlatsa files from time to time with, or furnishes to, applicable Canadian securities regulators available atwww.sedar.com and the United States Securities and Exchange Commission.
2
GENERAL PROXY INFORMATION
The following proxy information is applicable to all Shareholders, other than South African Shareholders who should refer to the section of this Information Circular entitled “Information for South African Shareholders” for proxy instructions.
Solicitation of Proxies
The solicitation of proxies is made by management on behalf of the Company, and will be primarily by mail, but proxies may be solicited personally or by telephone by directors, officers and employees of the Company. The Company will bear all costs of this solicitation. We have arranged for Intermediaries to forward the meeting materials to Beneficial Shareholders of record by those Intermediaries and we will reimburse the Intermediaries for their reasonable fees and disbursements in that regard. The cost of solicitation will be borne by the Company.
The following information respecting appointment of proxyholders and revocation of proxies is generally applicable only to Registered Shareholders. A significant number of Shareholders are Beneficial Shareholders. In almost all cases, a Beneficial Shareholder will not appear as the holder of record of such Common Shares on the Canadian register of Shareholders. As Beneficial Shareholders do not have the same legal rights as Registered Shareholders in respect of shareholder meetings (including the rights described below to appoint a proxyholder and revoke a deposited proxy), Beneficial Shareholders are required to act indirectly through their Intermediary in order to vote their Common Shares or revoke a proxy, and Beneficial Shareholders should refer to the information set out under “General Proxy Information – Beneficial Shareholders” in this Information Circular.
Appointment of Proxyholders
A Shareholder may attend the Meeting in person or may be represented by a proxyholder. Registered Shareholders who are unable to attend the Meeting in person are asked to date, sign and return the accompanying Proxy, or other appropriate form of proxy, in accordance with the instructions set out in this Information Circular.If a Proxy is not dated, the proxyholder so appointed will date such Proxy as of the date on which it was mailed to such Registered Shareholder by the Company.A Proxy will not be valid unless it is deposited at the offices of Computershare Investor Services Inc., 9th Floor, 7775 University Avenue, Toronto, ON M5J 2Y1, prior to 07:00 a.m. (Vancouver Time) on June 26, 2013, or, if the Meeting is adjourned, no later than 48 hours (excluding Saturdays, Sundays and holidays in the City of Vancouver, British Columbia and Johannesburg, South Africa) before the time of the Meeting. A person appointed as proxyholder need not be a Shareholder.
A Proxy must be signed by the Registered Shareholder or a duly appointed attorney authorized in writing or, if the Registered Shareholder is a corporation or other entity, by a duly authorized officer. A Proxy signed by a person acting as attorney or in some other representative capacity (including an officer or other duly appointed representative of a corporate Registered Shareholder) should clearly indicate that person’s capacity and should be accompanied by the original or a notarized copy of the instrument evidencing such qualification and authority to act, or such other documentation in support as is acceptable to the Chair of the Meeting.
The management designees named in the accompanying Proxy are senior officers and directors of Atlatsa.A Registered Shareholder has the right to appoint a person (who need not be a Shareholder), other than the management designees to represent such Registered Shareholder at the Meeting. To exercise this right, a Registered Shareholder should cross out the names of the management designees on the accompanying Proxy and insert the name of the other person in the blank space provided.
Voting by Proxyholders and Exercise of Discretion
The persons named in the Proxy will vote, or withhold from voting, the Common Shares represented thereby in accordance with your instructions on any ballot that may be called for. If you specify a choice with respect to any matter to be acted upon, your Common Shares will be voted accordingly. The Proxy confers discretionary authority on the persons named therein with respect to:
| | (a) | each matter or group of matters identified therein for which a choice is not specified; |
3
| | (b) | any amendment to or variation of any matter identified therein; and |
| | (c) | any other matter that properly comes before the Meeting. |
In respect of a matter for which a choice is not specified by the Registered Shareholder in the Proxy, the persons named in the Proxy will vote the Common Shares represented by the Proxy “FOR” the approval of such matter.
Registered Shareholders may wish to vote by Proxy whether or not they are able to attend the Meeting in person. Registered Shareholders electing to submit a Proxy may do so by:
| | (a) | completing, dating and signing the enclosed Proxy (blue sheet) and returning it to the Company’s transfer agent, Computershare Investor Services Inc., by fax within North America at 1-866-249-7775, outside North America at 1-416-263-9524, or by mail or by hand to the 9th Floor, 100 University Avenue, Toronto, Ontario, M5J 2Y1; |
| | (b) | using a touch-tone phone to transmit voting choices to a toll free number. Registered Shareholders must follow the instructions of the voice response system and refer to the enclosed form of Proxy (blue sheet) for the toll free number, the holder’s account number and the proxy access number; or |
| | (c) | using the internet through the website of the Company’s transfer agent at www.investorvote.com, Registered Shareholders must follow the instructions that appear on the screen and refer to the enclosed Proxy (blue sheet) for the holder’s account number and the proxy access number; |
in all cases ensuring that the Proxy is received prior to 07:00 (Vancouver time) on June 26, 2013, or, if the Meeting is adjourned, then not less than 48 hours (excluding Saturdays, Sundays and holidays in the City of Vancouver, British Columbia and Johannesburg, South Africa) before the commencement of the adjourned Meeting at which the Proxy is to be used.
Revocation of Proxies
In addition to revocation in any other manner permitted by law, a Registered Shareholder who has given a Proxy may revoke it by:
| | (a) | executing a Proxy bearing a later date or by executing a valid notice of revocation, either of the foregoing to be executed by the Registered Shareholder or the Registered Shareholder’s authorized attorney in writing, or, if the Shareholder is a corporation, under its corporate seal by an officer or attorney duly authorized, and by delivering the Proxy bearing a later date to Computershare Investor Services Inc. at 100 University Avenue, 9th Floor, Toronto, Ontario M5J 2Y1 at any time up to and including the last business day that precedes the day of the Meeting or, if the Meeting is adjourned, the last business day that precedes any reconvening thereof, or to the Chair of the Meeting on the day of the Meeting or any reconvening thereof, or in any other manner provided by law; or |
| | (b) | personally attending the Meeting and voting the Registered Shareholder’s Common Shares. |
A revocation of a Proxy will not affect a matter on which a vote is taken before the revocation.
Beneficial Shareholders
The following information is of significant importance to many Shareholders, as a substantial number of Shareholders are Beneficial Shareholders who do not hold Common Shares in their own name. Beneficial Shareholders should note that only Proxies deposited by Registered Shareholders can be recognized and acted upon at the Meeting.
4
If Common Shares are listed in an account statement provided to a Shareholder by a broker or other Intermediary, then, in almost all cases, those Common Shares will not be registered in the Shareholder’s name on the records of the Company. Such Common Shares will more likely be registered under the names of the Shareholder’s broker or an agent of that broker. In the United States, the vast majority of such Common Shares are registered under the name of Cede & Co. as nominee for The Depository Trust Company (which acts as depositary for many U.S. brokerage firms and custodian banks), and in Canada, under the name of CDS & Co. (the registration name for CDS, which acts as nominee for many Canadian brokerage firms).
Common Shares held by brokers or their agents or nominees can only be voted (for or against resolutions) upon the instructions of Beneficial Shareholders. Without specific instructions, brokers and their agents and nominees are prohibited from voting shares for the broker’s clients.Therefore, Beneficial Shareholders should ensure that instructions respecting the voting of their Common Shares are communicated to the appropriate person in advance of the Meeting. Intermediaries are required to seek voting instructions from Beneficial Shareholders in advance of shareholders’ meetings. Every intermediary has its own mailing procedures and provides its own return instructions to clients.If you are a Beneficial Shareholder, you should carefully follow the instructions of your Intermediary in order to ensure that your Common Shares are voted at the Meeting.
The form of proxy supplied to you by your broker will be similar to the Proxy provided to Registered Shareholders by the Company. However, its purpose is limited to instructing the Intermediary on how to vote on your behalf. Most brokers now delegate responsibility for obtaining instructions from clients to Broadridge. Broadridge typically provides a computer readable voting instruction form to Beneficial Shareholders and asks Beneficial Shareholders to complete this form and return to Broadridge. The voting instruction form will name the same persons as the Proxy to represent you at the Meeting. You have the right to appoint a person (who need not be a Shareholder of the Company), other than the persons designated in the voting instruction form, to represent you at the Meeting. To exercise this right, you should insert the name of the desired representative in the blank space provided in the voting instruction form. The completed voting instruction form must then be returned to Broadridge by mail or facsimile or voting instructions given to Broadridge by phone or over the internet, in accordance with Broadridge’s instructions. Broadridge then tabulates the results of all instructions received and provides appropriate instructions respecting the voting of Common Shares to be represented at the Meeting.If you receive a voting instruction form from Broadridge, you cannot use it to vote Common Shares directly at the Meeting. The voting instruction form must be completed and returned to Broadridge, in accordance with its instructions, well in advance of the Meeting in order to have the Common Shares voted.
These securityholder materials are being sent to both Registered Shareholders and Beneficial Shareholders. If you are a Beneficial Shareholder and the Company or its agent has sent these materials directly to you, your name, address and information about your holding of securities have been obtained in accordance with applicable securities regulatory requirements from the Intermediary holding Common Shares on your behalf. By choosing to send these materials to you directly, the Company (and not the Intermediary holding Common Shares on your behalf) has assumed responsibility for (i) delivering these materials to you, and (ii) executing your proper voting instructions. Please return your voting instructions as specified in the request for voting instructions.
Although as a Beneficial Shareholder you may not be recognized directly at the Meeting for the purposes of voting Common Shares registered in the name of your Intermediary, you, or a person designated by you, may attend at the Meeting as proxyholder for your Intermediary and vote your Common Shares in that capacity. If you wish to attend at the Meeting and indirectly vote your Common Shares as proxyholder for your Intermediary, or have a person designated by you do so, you should enter your own name, or the name of the person you wish to designate, in the blank space on the voting instruction form provided to you and return the same to your Intermediary in accordance with the instructions provided by such Intermediary, well in advance of the Meeting.
Atlatsa will send proxy-related materials directly to non-objecting beneficial owners in accordance with NI 54-101 – Communication with Beneficial Owners.
5
INFORMATION FOR SOUTH AFRICAN SHAREHOLDERS
This Information Circular will be distributed to all Shareholders on the South Africa register who have elected to receive such documentation.
South African Proxy Instructions
Voting by Proxyholders
The persons named in the South African Proxy will vote or withhold from voting the Common Shares represented thereby in accordance with the instructions on any ballot that may be called for. If you specify a choice with respect to any matter to be acted upon, your Common Shares will be voted accordingly. The South African Proxy confers discretionary authority on the persons named therein with respect to:
| | (a) | each matter or group of matters identified therein for which a choice is not specified, |
| | (b) | any amendment to or variation of any matter identified therein, and |
| | (c) | any other matter that properly comes before the Meeting. |
In respect of a matter for which a choice is not specified in the South African Proxy, the persons named in the South African Proxy will vote the Common Shares represented by the South African Proxy for the approval of such matter.
Shareholders holding Common Share certificates in their own names and shareholders who have dematerialized their Common Shares and have elected “own-name” registration in the sub-register through a CSDP and who are unable to attend the Meeting but wish to be represented thereat may complete and return the attached form of South African Proxy (blue), in accordance with the instructions contained therein, to be received by Computershare Investor Services (Pty) Limited by mail at PO Box 61051, Marshalltown, 2107 or by hand at Ground Floor, 70 Marshall Street, Johannesburg, 2001 prior to 07:00 (Vancouver time) (16:00 CAT) on June 26, 2013 or, if the Meeting is adjourned, not less than 48 hours (excluding Saturdays, Sundays and statutory holidays in the City of Vancouver, British Columbia and Johannesburg, South Africa) prior to the time set for the adjournment thereof.
Shareholders who have dematerialized their Common Shares through a CSDP or broker and who have not elected “own-name” registration in the sub-register maintained by a CSDP and Shareholders who hold certificated Common Shares through a nominee and who wish to attend the Meeting must instruct their CSDP, broker or nominee to issue them with the necessary letter of representation to attend. If such shareholders do not wish to attend the general meeting but wish to be represented thereat, they must provide their CSDP, broker or nominee with their voting instructions in terms of the custody agreement entered into between them and their CSDP, broker or nominee.
Shareholders who hold dematerialized Common Shares must ensure that the person or entity (such as a nominee) whose name has been entered into the relevant sub-register maintained by a CSDP completes the form of South African Proxy and appoints a proxy to vote at the Meeting.
The Company does not take responsibility and will not be held liable for any failure on the part of a CSDP, nominee or broker of a Shareholder holding dematerialized Common Shares to notify such Shareholder of the Meeting or any business to be conducted thereat, or to validly authorize a Shareholder to attend or vote thereat.
Shareholders are advised to consult their professional adviser if they have any questions regarding the above.
The Company’s sponsor in South Africa is Macquarie First South Capital (Pty) Limited (tel: +27 11 583 2000).
INTEREST OF CERTAIN PERSONS OR COMPANIES IN MATTERS TO BE ACTED UPON
Tumelo Motsisi, a director and Chairman of the Company, and Harold Motaung, a director and Chief Executive Officer of the Company, hold a 14.1% and 9.8% interest directly and indirectly, respectively, in the issued and outstanding share capital of the Company, in part through shareholdings in Atlatsa Holdings, the indirect beneficial owner of 57.2% of the issued and outstanding Common Shares in the capital of the Company.
Except as described above, no director or executive officer of the Company, nor any person who has held such a position since the beginning of the last completed financial year of the Company, nor any associate or affiliate of the foregoing persons, has any substantial or material interest, direct or indirect, by way of beneficial ownership of securities or otherwise, in any matter to be acted on at the Meeting.
6
RECORD DATE, VOTING SECURITIES AND PRINCIPAL HOLDERS
OF VOTING SECURITIES
The Board of Directors has fixed May 28, 2013 as the Record Date for determination of persons entitled to receive notice of and to vote at the Meeting. Only Shareholders of record at the close of business on the Record Date who either attend the Meeting personally or complete, sign and deliver a Proxy or South African Proxy, as the case may be, in the manner and subject to the provisions described above under the headings “General Proxy Information” and “Information for South African Shareholders”, will be entitled to vote or to have their Common Shares voted at the Meeting. Quorum for the transaction of business at the Meeting is two persons present in person or by proxy, holding not less than 5% of the issued and outstanding Common Shares at the Record Date.
As of the Record Date, there were 201,888,473 Common Shares issued and outstanding, each such Common Share carrying the right to one vote. The Company is authorized to issue an unlimited number of Common Shares. There are 227,400 Plateau Preference Shares (comprised of 115,800 B2 Preference Shares and 111,600 B3 Preference Shares) issued in the capital of Plateau which when duly converted into common shares in the capital of Plateau will, through a series of transactions, be exchanged for 227.4 million Common Shares in the Company. The Plateau Preference Shares have not been converted as of the Record Date and therefore the holder thereof is not entitled to vote at the Meeting.
To the knowledge of the directors and executive officers of the Company, the only persons or corporations that beneficially owned, directly or indirectly, or exercised control or direction over, Common Shares carrying more than 5% of the voting rights attached to all issued and outstanding Common Shares of the Company as at the Record Date are:
| | | | | | | | |
Shareholder Name and Address | | Number of
Common Shares Held | | | Percentage of
Issued Common Shares | |
The Pelawan Trust, as Trustee(1) Atlatsa Holdings, as Beneficiary and Pelawan SPV 4th Floor, 82 Grayston Drive Sandton, 2196, South Africa | | | 115,496,438 | | | | 57.2 | % |
Mr. Tumelo M. Motsisi(2) (4) 4th Floor, 82 Grayston Drive Sandton, South Africa | | | 28,535,153 | | | | 14.1 | % |
Mr. Harold Motaung(3) (5) 4th Floor, 82 Grayston Drive Sandton, South Africa | | | 19,764,462 | | | | 9.8 | % |
Notes:
| (1) | 58,805,135 Common Shares are registered in the name of Pelawan Trust, which holds such Common Shares in trust for Atlatsa Holdings pursuant to escrow arrangements described in Item 9.G. “Escrow Securities” of Atlatsa’s Form 20-F available on SEDAR atwww.sedar.com. The remaining 56,691,303 Common Shares are registered in the name of Pelawan SPV. |
| (2) | Indirect holdings being 240 of the 1,000 ordinary shares in the issued and outstanding share capital of Atlatsa Holdings, multiplied by the number of Common Shares of the Company (115,496,438) held by the Pelawan Trust and Pelawan SPV. |
| (3) | Indirect holdings being 170 of the 1,000 ordinary shares in the issued and outstanding share capital of Atlatsa Holdings, multiplied by the number of Common Shares of the Company (115,496,438) held by the Pelawan Trust and Pelawan SPV. |
| (4) | Direct holding of 815,998 Common Shares of the Company. |
| (5) | Direct holding of 130,068 Common Shares of the Company. |
VOTES NECESSARY TO PASS RESOLUTIONS
A simple majority of votes cast by the relevant Disinterested Shareholders is required to pass each of the resolutions described under “Restructuring Plan”, except for the RPM Share Subscription, which must be approved by a 75% majority of votes cast by Disinterested Shareholders pursuant to JSE requirements.
7
PARTICULARS OF MATTERS TO BE ACTED UPON
RESTRUCTURING PLAN
Background to the Restructuring Plan
In July 2009, Atlatsa and Anglo American Platinum completed the Bokoni Acquisition that resulted in the creation of the Bokoni Group by consolidating the Bokoni Mine, as well as the Ga-Phasha Project, Boikgantsho Project and Kwanda Project under one consolidated group structure. Atlatsa acquired 51% of the Bokoni Group, which acquisition involved Atlatsa vending its existing 50% share in the Ga-Phasha Project, Boikgantsho Project and Kwanda Project, and acquiring an additional effective 1% controlling interest in each of the projects with Anglo American Platinum, through its subsidiary RPM, retaining a 49% shareholding in the Bokoni Group. Atlatsa acquired its 51% interest in the Bokoni Group for consideration of ZAR 2.6 billion (US$248.1 million). The consideration was settled by way of a cash payment of ZAR 300 million (US$28.6 million), the subscription by RPM of ZAR 1.2 billion (US$114.5 million) A Preference Shares and the issue to RPM of the B1 Preference Shares with a value of ZAR 1.1 billion (US$104.9 million), which are, through a series of transactions convertible into 115.8 million Common Shares, representing 26% of Atlatsa’s fully diluted issued share capital based on the number of Common Shares issued and outstanding as of the date of this Information Circular, at any time prior to July 1, 2018.
The Bokoni Acquisition sought to transform Atlatsa into a significant and sustainable, HDSA controlled PGM producer. It comprised a cornerstone empowerment transaction for Anglo American Platinum in complying with the 2014 HDSA ownership requirements, as required by the Mining Charter for the conversion of its ‘old-order’ mining rights to ‘new-order’ mining rights in terms of the Mineral and Petroleum Resources Development Act of South Africa.
Rationale for the Restructuring Plan
In April 2011, Atlatsa and Anglo American Platinum initiated a detailed review of the technical assumptions and operational plan underlying the Bokoni Acquisition and its associated financing structure.
During 2012 the management team at Bokoni Mine, together with Atlatsa and Anglo American Platinum, undertook a detailed strategic review of all technical, operational and financing assumptions informing the existing mine extraction and financing strategy at Bokoni Mine, having regard to both macro and micro economic factors affecting both the Bokoni Mine, as well as the PGM industry and its outlook in general (the “2012 Strategic Review”).
Based on the results of the 2012 Strategic Review the parties undertook to implement the Restructuring Plan, comprising a lower-risk operating and financing plan for Atlatsa and the Bokoni Mine going forward.
On implementation of the Restructuring Plan (as outlined below), Atlatsa and the Bokoni Group will be well positioned to implement their business strategy on a more conservative, lower risk and sustainable basis.
Recapitalization and Refinancing
The net effect of the Restructuring Plan for Atlatsa, as set out in this Information Circular results in a significant reduction in the Company’s debt through a series of transactions, summarized as follows:
| | | | | | | | | | |
No | | Description | | ZAR billion | | | US$ million | |
| 1 | | Atlatsa debt balance as at December 31, 2012 | | | 3.283 | | | | 13.3 | |
| 2 | | Asset Sale Proceeds | | | (1.7 | ) | | | (162.2 | ) |
| 3 | | RPM Share Subscription Proceeds | | | (0.75 | ) | | | (71.6 | ) |
| 4 | | Atlatsa debt balance as at December 31, 2012, after giving effect to the Restructuring Plan | | | 0.833 | | | | 79.5 | |
8
The key benefits of the Restructuring Plan, together with the Interim Transactions, are as follows:
| | • | | a 75% reduction in Atlatsa’s overall debt from ZAR 3.28 billion (US$313.3 million) to approximately ZAR 833 million (US$79.5 million); |
| | • | | an equity capital injection into Atlatsa of ZAR 750 million (US$71.6 million) by Anglo American Platinum subscribing for 125 million new Common Shares in Atlatsa at ZAR 6.00 per share (US$0.57), the proceeds of which will be used to reduce Atlatsa’s outstanding debt as described above; |
| | • | | an increase in the existing debt facility of approximately ZAR 717 million (US$68.4 million) made available to Atlatsa by RPM to finance its 51% pro rata share of the planned expansion at Bokoni Mine through to 2020, with a maximum facility limit of ZAR 1.55 billion (US$147.9 million); |
| | • | | a reduction in Atlatsa’s estimated effective cost of borrowing from 13% to 2% over the term of the outstanding debt; |
| | • | | a simplification of Atlatsa’s capital structure through the elimination of the B1 Preference Shares and the Plateau Preference Shares; |
| | • | | an increase in Atlatsa’s BEE equity shareholding from 57% (53% fully diluted after taking into account the B Preference Shares) to 62% (fully diluted, after conversion of the B Preference Shares) to allow Atlatsa to undertake future equity financings and still maintain a 51% minimum BEE shareholding, if required. See Restructuring Plan-Ancillary Matters – Atlatsa Holdings Share Purchases; |
| | • | | the re-alignment of the Bokoni Group’s exploration and development assets to complement existing infrastructure; |
| | • | | RPM and Atlatsa will extend the existing Concentrate Agreement through to 2020. |
The new strategic plan for the Bokoni Group will result in the disposal of certain assets representing undeveloped estimated PGM mineral resources to RPM, recapitalization and refinancing of Atlatsa and the Bokoni Group, together with anticipated accelerated production growth at the Bokoni Mine.
The Restructuring Plan will also include a series of debt refinancing transactions described below, which will reduce Atlatsa’s overall outstanding debt, simplify Atlatsa’s capital structure, and provide Atlatsa with sufficient headroom in its outstanding capital structure to raise additional equity financing in the future without diluting its BEE shareholding below the minimum 51% threshold.
Several of the Restructuring Plan transactions constitute “related party transactions” (as defined in MI 61-101). Details regarding the related party aspects of the Restructuring Plan Transactions are set forth under “Related Party Aspects of the Restructuring Plan and the Ancillary Matters”.
New Bokoni Mine Operating Plan
The review conducted by Anglo American Platinum and Atlatsa has resulted in the decision to scale the Bokoni Mine as a 160,000 tpm operation in the near term, in line with its installed processing capacity. Accordingly, material capital expenditure associated with the proposed UG2 expansion plans at Bokoni, estimated at ZAR 2.3 billion (US$219.5 million) has been deferred, having regard to the near term outlook for PGM market fundamentals.
In an effort to reduce unit operating costs the review identified certain potential open cast project opportunities at the Bokoni Mine which, subject to final regulatory approvals, will be exploited into the future. This will allow the Bokoni Mine to fill its processing capacity in the near term, while its underground mining operations build up from 100,000 tpm (current) to 160,000 tpm in the medium term.
9
The new operating plan will result in Bokoni Mine becoming a predominantly Merensky Reef producer, accounting for approximately 75% of its total estimated production in the medium term.
The new operating plan at Bokoni Mine is considered a lower risk, less capital intensive and more conservative plan from both an operational and financing perspective.
Asset Sale
Atlatsa and Anglo American Platinum in the course of their strategic review determined that it would be beneficial to both parties to effect a strategic re-alignment of the Bokoni Group’s exploration and development mineral assets. Accordingly, Atlatsa and Anglo American Platinum have agreed to split the Ga-Phasha Project into an Eastern and Western section. The Eastern section, comprising the Paschaskraal and De Kamp mineral properties, will be sold to RPM and consolidated into RPM’s adjacent Twickenham operation, while the Western section, comprising the Klipfontein and Avoca mineral properties, will be consolidated into the adjacent Bokoni Mine operations. Atlatsa and Anglo American Platinum have identified the potential to access the Western section of the Ga-Phasha Project through existing shaft infrastructure established at Bokoni Mine’s Brakfontein Merensky property.
In addition, Atlatsa and Anglo American Platinum have determined that the Bokoni Group’s Boikgantsho Project has a strong strategic fit with RPM’s Mogalakwena operations and that this project should be sold to RPM.
To achieve this restructuring, RPM will, through a series of transactions, acquire the Boikgantsho Project assets and the Eastern section of the Ga-Phasha Project. On implementation of these transactions, the effective net consideration of ZAR 1.7 billion (US$162.2 million) received by Plateau will be applied to repay a portion of Plateau’s indebtedness to RPM.
The Asset Sale is discussed in more detail below under the heading “The Asset Sale”.
Debt Refinancing Transactions and the RPM Share Subscription
Atlatsa proposes to undertake the Debt Refinancing Transactions (as defined below), which, together with the RPM Share Subscription, are expected to result in the following primary benefits to Atlatsa:
| | (a) | a reduction in overall debt by 75% from ZAR 3.28 billion (US$313.3 million) to approximately ZAR 833 million (US$79.5 million); and |
| | (b) | a reduction in Atlatsa’s estimated cost of borrowing from 13% to 2% of overall debt over the period. |
Atlatsa and Anglo American Platinum have agreed that, in addition to the Asset Sale, it is beneficial for Atlatsa to refinance its existing outstanding debt, including repaying the OCSF, the A Preference Share Facility and the Senior Debt Facility and extending the New Debt Facility and the Working Capital Facility. The repayment of the OCSF and the redemption of the A Preference Share Facility through the proceeds of the increased Senior Debt Facility has been completed pursuant to the Interim Transactions. The extension of the New Debt Facility and the Working Capital Facility to repay and replace the Senior Debt Facility (the “Debt Refinancing Transactions”) are being submitted to Shareholders for approval at the Meeting.
The Debt Refinancing Transactions together with the RPM Share Subscription will assist in improving Atlatsa’s financial position by lowering Atlatsa’s debt and cost of borrowing to sustainable levels, simplifying Atlatsa’s capital structure and the Atlatsa Holdings Share Purchase will increase Atlatsa’s BEE shareholding to allow Atlatsa to undertake future equity financings. The aim of the Debt Refinancing Transactions and the RPM Share Subscription is to ensure that Atlatsa is funded on a sustainable basis.
Pursuant to the RPM Share Subscription, Atlatsa will issue to RPM 125 million Common Shares at an issue price of ZAR 6.00 (US$0.57) per Common Share, for an aggregate subscription price of ZAR 750 million (US$71.6 million) to be paid in cash. Atlatsa will apply the cash proceeds to repay a portion of the outstanding debt under the New Debt Facility, reducing the outstanding amount owed to RPM to approximately ZAR 833 million (US$79.5 million) as described above.
10
The Debt Refinancing Transactions, when taken together with the RPM Share Subscription and the Interim Transactions completed in September 2012, will, upon completion, consolidate all of Atlatsa’s previously outstanding debt facilities and reduce Atlatsa’s outstanding debt owed to RPM by approximately ZAR 2.45 billion (US$233.80 million) to an aggregate amount outstanding of approximately ZAR 833 million (US$79.5 million). Following completion of the Debt Refinancing Transactions and the RPM Share Subscription, Atlatsa will have a further amount of approximately ZAR 717 million (US$68.4 million) available to it under the New Debt Facility for Atlatsa’s share of the Bokoni Mine’s cash flow requirements and the Working Capital Facility of ZAR 90 million (US$8.6 million) to fund Atlatsa’s corporate and administrative expenses through to the end of 2015.
Atlatsa Holdings and Anglo American Platinum have agreed to a further transaction between them, pursuant to which Atlatsa Holdings has agreed to acquire 115.8 million Atlatsa Common Shares from Anglo American Platinum following the conversion of the B Preference shares held by RPM into Atlatsa Common Shares pursuant to the terms of the B Preference Shares, which will have the effect of increasing Atlatsa’s BEE shareholding to 62% and will allow Atlatsa to undertake future equity financing without reducing its BEE shareholding below the minimum 51%.
The Debt Refinancing Transactions are described in greater detail below under “The Debt Refinancing Transactions”. The RPM Share Subscription is described in greater detail below under “RPM Share Subscription”.
Bokoni Mine Production
Atlatsa and Anglo American Platinum have agreed that the Bokoni Mine operational plan is to grow underground production from its current level of 100,000 tpm to a steady state of 160,000 tpm in the medium term. In the near term certain potential open cast project opportunities have been identified and subject to final regulatory approvals, will be exploited from 2013. Bokoni currently operates at a production level of 100,000 tpm and will reach steady state production in 2016. This will result in current production increasing from 115,000 PGM ounces per annum to a minimum of 230,000 PGM ounces per annum by 2016. This growth profile includes the additional production ounces expected to be generated from the MPH UG2 project and completion of the Brakfontein Merensky project.
Revised Production, Cost and Capital Expenditure Estimates.
The shift from higher cost shaft operations to the new lower cost shaft and opencast operations at the Bokoni Mine, in the near and medium term, together with increased production volumes are expected to result in unit cost reductions at Bokoni Mine.
The capital cost estimate for the new development plan at the Bokoni Mine is ZAR 1.1 billion (US$104.9 million). This estimate includes capital required for the completion of the Brakfontein Merensky project and the development of the MPH UG2 project to 60,000 tpm.
Discretion of Board of Directors
The Board of Directors will retain the authority, in the event that the resolutions described in this Information Circular are approved by Shareholders, not to implement the transactions contemplated in such resolutions as the Board of Directors, in their sole discretion, may see fit. In the event that one or more of the above resolutions is not approved by Shareholders, the Board of Directors will not implement any of the transactions relating to or contemplated by the resolutions. Completion of the transactions comprising the Restructuring Plan is inter-conditional on all such transactions being approved and completed.
The Asset Sale
At the Meeting, Disinterested Shareholders, being all Shareholders other than Anglo American Platinum and RPM, will be asked to consider an ordinary resolution (the text of which is attached hereto as Schedule A) approving the Asset Sale, which must be approved by a majority of the votes cast by Disinterested Shareholders on this matter at the Meeting.
11
Overview
Atlatsa and Anglo American Platinum will, through Plateau and RPM, respectively, implement a series of transactions pursuant to which RPM will acquire the Eastern section of the Ga-Phasha Project and the Boikgantsho Project. On implementation of these transactions, the effective net consideration of ZAR 1.7 billion (US$162.2 million) received by Plateau will be applied to reduce its approximately ZAR 3.28 billion (US$313.3 million) debt owing to RPM (as discussed below in “The Debt Refinancing Transactions”).
The simplified corporate structure of Atlatsa and the Bokoni Group as constituted prior to the Asset Sale is as follows:
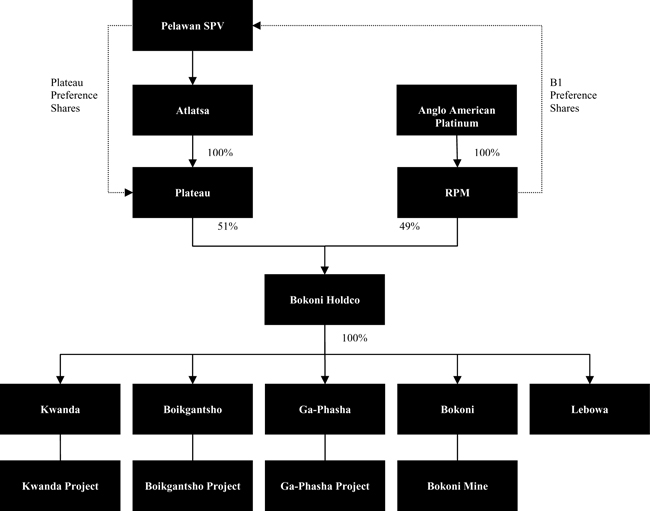
The Asset Sale will occur pursuant to the following steps:
| | • | | Ga-Phasha will transfer the Western section of the Ga-Phasha Project to Bokoni; |
| | • | | Ga-Phasha will sell and RPM will purchase the Ga-Phasha Sale Assets for consideration of ZAR 750 million (US$71.6 million); |
| | • | | Boikgantsho will sell and RPM will purchase the Boikgantsho Project Assets for consideration of ZAR 950 million (US$90.6 million); |
12
| | • | | Bokoni Holdco will retain a 100% interest in the Kwanda Project and a 100% interest in the Bokoni Mine (as enlarged by the Western section of the Ga-Phasha Project); |
| | • | | Bokoni will distribute the proceeds of the foregoing transactions to Plateau; and |
| | • | | On implementation of the Asset Sale, the effective net consideration of ZAR 1.7 billion (US$162.2 million) received by Plateau will be applied to reduce the amount owing to RPM. |
Ga-Phasha Asset Sale Agreement
The Ga-Phasha Asset Sale Agreement provides that Ga-Phasha will sell and RPM will purchase the Ga-Phasha Sale Assets for consideration of ZAR 750 million (US$71.6 million), subject to the terms and conditions discussed below.
Ga-Phasha and RPM have made the necessary filings to obtain the approval of the Minister to the abandonment of the relevant portion of the Ga-Phasha Mining Right by Ga-Phasha and the extension of the RPM Twickenham Mining Right to cover the Ga-Phasha Sale Assets or, if permitted, the transfer of the relevant portion of the Ga-Phasha Mining Right to RPM.
Ga-Phasha and RPM have also agreed that if such applications are refused by the Minister, that they will cooperate in good faith and take all reasonable legal or other actions as they may deem advisable, acting reasonably, in order to procure the extension of the RPM Twickenham Mining Right to incorporate the Ga-Phasha Sale Assets or to put in place alternative structures to place Ga-Phasha and RPM in substantially the same commercial position as if the RPM Twickenham Mining Right had been extended to incorporate the Ga-Phasha Sale Assets on a basis which will not unduly prejudice the rights or interests of either party.
In order to procure the ministerial approvals to the applications set out above, Ga-Phasha and RPM have filed amendments to their mining work programmes and social and labor plans, and have agreed to provide any necessary pecuniary provision for mine rehabilitation required under Section 41 of the MPRD Act and attend to all necessary consultations with parties interested and affected by such applications.
The closing of the Ga-Phasha Asset Sale Agreement is conditional upon the satisfaction (or waiver) of the following conditions precedent at or before July 26, 2013 (or such later date as Ga-Phasha and RPM may agree in writing):
| | (a) | the receipt of the written consent of the Minister pursuant to Section 102 of the MPRD Act to extend the RPM Twickenham Mining Right to incorporate the Ga-Phasha Sale Assets and to amend the Ga-Phasha Mining Right to exclude the Ga-Phasha Sale Assets or, alternatively, the receipt of the written consent of the Minister pursuant to Section 11 of the MPRD Act in relation to the cession and transfer of the Ga-Phasha Sale Assets to RPM and the notarial execution of the transfer; and |
| | (b) | the Implementation Agreement becoming unconditional in accordance with its terms except for any condition in the Implementation Agreement requiring the Ga-Phasha Asset Sale Agreement to become unconditional in accordance with its terms. |
The Ga-Phasha Asset Sale Agreement contains representations and warranties on the part of Ga-Phasha relating to the following matters, among others: authority to execute and deliver the Ga-Phasha Asset Sale Agreement and perform its obligations thereunder; validity, enforceability and the binding nature of the Ga-Phasha Asset Sale Agreement; no conflict or breach of constating documents or laws; due registration of the Ga-Phasha Mining Right; third party rights in, and encumbrances over, the Ga-Phasha Mining Right; disclosure; Ga-Phasha’s obligations under the MPRD Act; no breach notices from the DMR; environmental matters; and health and safety matters.
The Ga-Phasha Asset Sale Agreement contains representations and warranties on the part of RPM relating to the following matters, among others: authority to execute and deliver the Ga-Phasha Asset Sale Agreement and perform its obligations thereunder; validity, enforceability and the binding nature of the Ga-Phasha Asset Sale Agreement; and no conflict or breach of constating documents or other agreement or instrument to which it is bound.
13
Ga-Phasha and RPM have agreed to indemnify each other from and against any liability arising from any breach or misrepresentation of the representations and warranties set out above. This indemnity is to survive any cancellation or expiry of the Ga-Phasha Asset Sale Agreement. In addition, RPM has agreed to assume, from and as of the Closing Date, any and all liabilities of Ga-Phasha in relation to or arising out of the decommissioning and restoration of the Ga-Phasha Sale Assets from the Closing Date, as contemplated pursuant to the MPRD Act, upon the cessation of mining operations on the Ga-Phasha Sale Assets.
Boikgantsho Asset Sale Agreement
The Boikgantsho Asset Sale Agreement provides that Boikgantsho will sell and RPM will purchase the Boikgantsho Project Assets for consideration of ZAR 950 million (US$90.6 million), subject to the terms and conditions discussed below.
Each of Boikgantsho and RPM has agreed pursuant to the Boikgantsho Asset Sale Agreement that following the execution of the Boikgantsho Asset Sale Agreement they will make the necessary filings to obtain the approval of the Minister to the cession of the Boikgantsho Prospecting Rights by Boikgantsho and the extension of the RPM Mining Right to include the Boikgantsho Prospecting Rights.
Boikgantsho and RPM have also agreed, if the application above is refused by the Minister, to cooperate in good faith and take all reasonable legal or other actions as they may be advised (that are acceptable to them, acting reasonably) in order to procure the lawful and valid transfer of the Boikgantsho Prospecting Rights to RPM or negotiate in good faith to put in place alternative structures to place Boikgantsho and RPM in substantially the same commercial position as if the Boikgantsho Prospecting Rights have been transferred to RPM and the RPM Mining Right had been amended.
In order to procure the ministerial approvals to the applications set out above, Boikgantsho and RPM have agreed to file the necessary documents relating to ministerial approval in terms of section 11 of the MPRD Act and RPM has agreed to file an amendment to its mining work programme and social and labor plan and the environmental management plan attached to the RPM Mining Right, to attend to all necessary consultations with parties interested and affected by such applications and to raise any necessary pecuniary provisions for mine rehabilitation required under Section 41 of the MPRD Act to procure the grant of such applications.
The closing of the Boikgantsho Asset Sale Agreement is conditional upon the satisfaction (or waiver) of the following conditions precedent at or before July 26, 2013 (or such later date as Boikgantsho and RPM may agree in writing):
| | (a) | the receipt of the written consent of the Minister pursuant to Section 11 of the MPRD Act in relation to the cession and transfer of the Boikgantsho Prospecting Rights to RPM; |
| | (b) | the receipt of the notarial execution of the renewal of the Boikgantsho Prospecting Rights in accordance with the provisions of Section 18 of the MPRD Act; and |
| | (c) | the Implementation Agreement becoming unconditional in accordance with its terms except for any condition in the Implementation Agreement requiring the Boikgantsho Asset Sale Agreement to become unconditional in accordance with its terms. |
The purchase consideration payable under the Boikantsho Asset Sale Agreement is payable on closing, save for an amount of ZAR29,002,125 (US$2,767,378) in respect of the Boikantsho project information which is payable on the later of closing and the date of execution of the notarial deed of extension of the RPM Mining Right to include the Boikantsho Prospecting Rights.
The Boikgantsho Asset Sale Agreement contains representations and warranties on the part of Boikgantsho relating to the following matters, among others: authority to execute and deliver the Boikgantsho Asset Sale Agreement and perform its obligations thereunder; validity, enforceability and the binding nature of the Boikgantsho Asset Sale Agreement; no conflict or breach of constating documents or laws; due registration of the Boikgantsho Prospecting Rights; third party rights in, and encumbrances over, the Boikgantsho Prospecting Rights; disclosure; Boikgantsho’s obligations under the MPRD Act; no breach notices from the Minister; environmental matters; and health and safety matters. The parties will, in equal shares, remain liable for historical environmental claims.
14
The Boikgantsho Asset Sale Agreement contains representations and warranties on the part of RPM relating to the following matters, among others: authority to execute and deliver the Boikgantsho Asset Sale Agreement and perform its obligations thereunder; validity, enforceability and the binding nature of the Boikgantsho Asset Sale Agreement; and no conflict or breach of constating documents or laws.
Boikgantsho and RPM have agreed to indemnify each other from and against any liability arising from any breach or misrepresentation of the representations and warranties set out above. This indemnity is to survive any cancellation or expiry of the Boikgantsho Asset Sale Agreement. In addition, RPM has agreed to assume any and all of the liabilities of Boikgantsho in relation to or arising out of the decommissioning and restoration of the Boikgantsho Project from the Closing Date, as contemplated pursuant to the MPRD Act, upon the cessation of mining operations on the Boikgantsho Project.
Completion of Asset Sale
Pursuant to the Implementation Agreement, the closing of the Restructuring Plan, including the Asset Sale, is conditional upon the satisfaction (or waiver) of various conditions precedent, including:
| | (a) | the receipt of the approval of the South African Competition Authorities; |
| | (b) | the receipt of the approval of the Disinterested Shareholders of Atlatsa for each of the Related Party Transactions; |
| | (c) | the receipt of approvals of the TSX-V, JSE, NYSE MKT to the Asset Sale; |
| | (d) | the Asset Sale Agreements becoming unconditional, except insofar as they may be conditional on the Implementation Agreement becoming unconditional; |
| | (e) | the New Debt Facility Agreement becoming unconditional, except insofar as it may be conditional on the Implementation Agreement becoming unconditional; and |
| | (f) | RPM acquiring unconditional title to the Asset Sale Properties. |
As of the date of this Information Circular, all conditions remain to be satisfied or waived. Condition (b) will be completed upon Disinterested Shareholder approval of each of the Related Party Transactions described in this Information Circular. Atlatsa anticipates that the conditions listed above will be completed following the date of this Information Circular. The Asset Sale is currently expected to close in connection with, and conditional upon, completion of the Restructuring Plan on the Closing Date.
15
Following the Asset Sale, the simplified corporate structure of Atlatsa and the Bokoni Group will be as follows:
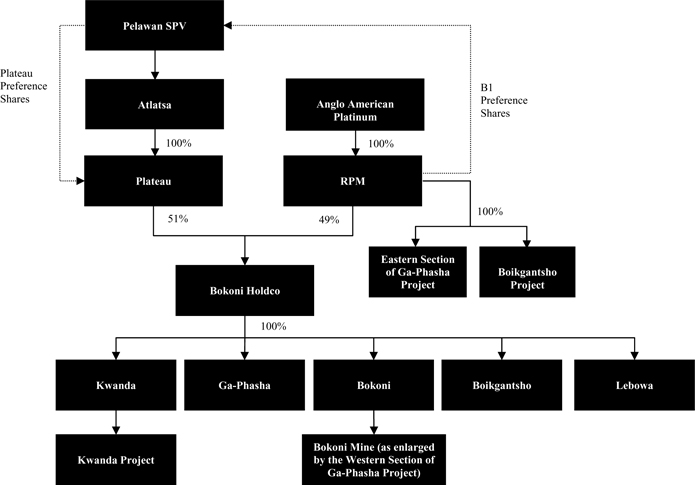
Debt Refinancing Transactions
Atlatsa and Anglo American Platinum have agreed to refinance, deleverage and recapitalize the Atlatsa and Bokoni Group balance sheets in order to ensure that both Atlatsa and the Bokoni Group are funded on a sustainable basis to finance Bokoni Mine’s growth plans through to 2020. Atlatsa and Anglo American Platinum have agreed to the Debt Refinancing Transactions to repay the 2009 Senior Debt Facility and enter into the New Debt Facility and Working Capital Facility.
Atlatsa proposes to undertake the Debt Refinancing Transactions, which, together with the RPM Share Subscription, are expected to result in the following primary benefits to Atlatsa:
| | (a) | a reduction in overall debt by 75% from ZAR 3.28 billion (US$313.3 million) to approximately ZAR 833 million (US$79.5 million); and |
| | (b) | a reduction in interest rates to reduce the estimated cost of borrowing from 13% to 2% of overall debt during the debt period. |
In addition, the sale by RPM to Atlatsa Holdings of 115.8 million Common Shares described below will result in Atlatsa’s BEE shareholding increasing from 57% (53% fully diluted after taking into account the B Preference Shares) to 62% (fully diluted, after conversion of the B Preference Shares) which will provide flexibility for Atlatsa to undertake equity financings in the future and maintain its 51% BEE shareholding.
16
At the Meeting, Disinterested Shareholders, being all Shareholders other than Anglo American Platinum and RPM, will be asked to consider an ordinary resolution (the text of which is attached hereto as Schedule B) approving the Debt Refinancing Transactions, which must be approved by a majority of votes cast by Disinterested Shareholders with respect to this matter at the Meeting.
Atlatsa’s Existing Debt
In June 2009, Atlatsa, through Plateau, entered into the Senior Debt Facility and borrowed ZAR 500 million (US$47.7 million) of acquisition debt from Standard Chartered Bank to finance the Bokoni Acquisition. In addition, Plateau obtained ZAR 832 million (US$79.4 million), including capitalized interest, under the OCSF from RPM to fund its operating and capital cash flow requirements at the Bokoni Mine between 2009 and 2012. With effect from April 28, 2011, Anglo American Platinum assumed from Standard Chartered Bank and its syndicate of lenders their rights and outstanding obligations under the Senior Debt Facility. As a result, Atlatsa’s statement of financial position was highly leveraged, which management considered to represent debt levels that were too high and could not be repaid from the attributed cash flows from Bokoni based on the 2009 mine plan. Based on the mine plan production level, Atlatsa’s debt levels were not reduced to affordable levels in the medium term.
Given the high level of leverage on July 1, 2011, Atlatsa and Anglo American Platinum entered into an interest standstill agreement whereby interest payments under the Senior Debt Facility and OCSF were frozen from July 1, 2011 until April 30, 2012. This translated into an interest saving of approximately ZAR 288 million (US$27.5 million) for Atlatsa over the standstill period.
Pursuant to the terms of the interest standstill agreement, as the Debt Refinancing Transactions and the Asset Sale were not completed by April 30, 2012, the outstanding debt balances owing to RPM under the Senior Debt Facility and OCSF attracted interest at the rates shown below from May 1, 2012 until December 31, 2012:
| | • | | First Tranche – up to ZAR 1 billion (US$95.4 million): 0%; |
| | • | | Second Tranche – ZAR 1 billion (US$95.4 million) to ZAR 2 billion (US$190.8 million): JIBAR minus 0.73%; and |
| | • | | Third Tranche – greater than ZAR 2 billion (US$190.8 million): JIBAR plus 9.27% |
Interim Transactions
Atlatsa and Anglo American Platinum have agreed to implement a number of debt refinancing transactions, the first of which, being the repayment of the OCSF and redemption of the A Preference Share Facility with proceeds from an increased Senior Debt Facility, were completed in September 2012 (the “Interim Transactions”).
On September 26, 2012, Atlatsa and RPM entered into the Interim Implementation Agreement, pursuant to which the total commitment under the Senior Debt Facility was increased by ZAR 2.580 billion (US$246.2 million) for the purpose of repaying in full Plateau’s OCSF and redemption of the A Preference Share Facility to RPM. The additional funds available under the Senior Debt Facility were used by Plateau, Bokoni Holdco and Bokoni, by way of equity subscriptions from Plateau to Bokoni Holdco and from Bokoni Holdco to Bokoni (the “Interim Share Subscriptions”), to redeem the outstanding A Preference Shares in the capital of each of Bokoni, Bokoni Holdco and Plateau, including accrued dividends thereon, and by Plateau to repay the OCSF. Under the increased Senior Debt Facility, if funds are requested by Bokoni (and authorized by Bokoni Holdco), RPM shall advance such funds directly to Bokoni. At December 31, 2012 ZAR 443.6 million (US$42.3 million) of the total available ZAR 2,156 million (US$205.7 million) was still available to be utilized under the increased Senior Debt Facility; over and above the fact that the debt was consolidated as described above.
Pursuant to the Interim Implementation Agreement, Atlatsa and RPM agreed, for the period from May 1, 2012 to September 28, 2012, to fix the amount of interest payable under the Senior Debt Facility at ZAR 81 million (US$7.7
17
million) and capitalize such accrued interest to the Senior Debt Facility, reducing the annual (cash flow) effective rate of 6.27% (linked to the 3-month current JIBAR of 5.13% at December 2012) from the prior to implementation annual effective rate of 12.31%. From September 28, 2012 until the closing of the Debt Refinancing Transactions, interest at the rates shown below will apply:
| | • | | First Tranche – up to ZAR 1 billion (US$95.4 million): 2012 and 2013: 0%; |
| | • | | Second Tranche – ZAR 1 billion (US$95.4 million) to ZAR 2 billion (US$190.8 million): 2012: JIBAR minus 0.73% and 2013: JIBAR minus 1.25%; and |
| | • | | Third Tranche – greater than ZAR 2 billion (US$190.8 million): 2012: JIBAR plus 9.27% and 2013: JIBAR plus 8.75%. |
On September 21, 2012, each of the Board of Directors, the Special Committee and the Audit Committee of the Board of Directors met to consider and approve the Interim Transactions.
Following careful consideration of the Interim Transactions and their benefit to Atlatsa’s financial position, the Special Committee and the Audit Committee determined that the Interim Transactions were in the best interests of Atlatsa and its shareholders and recommended to the Board of Directors that the Interim Transactions be approved. Based on careful consideration of the Interim Transactions and the recommendation of the Special Committee and Audit Committee, the Board of Directors unanimously approved the Interim Transactions on September 27, 2012 with Tumelo Motsisi and Harold Motaung abstaining by reason of their interest in the Pelawan Trust and the Pelawan Dividend Trust, who are parties to the Interim Implementation Agreement, though not involved as direct parties to the Interim Transactions.
See “Related Party Aspects of the Restructuring Plan and Ancillary Matters” for a discussion of the related party aspects of the Interim Transactions.
Repayment of Existing Debt
Pursuant to the Interim Transactions, Atlatsa increased the Senior Loan Debt Facility to ZAR 3.283 billion (US$313.3 million) as at December 31, 2012. Conditional upon the completion of the Asset Sale and RPM Share Subscription, Atlatsa will repay the approximately ZAR 2.45 billion (US$233.8 million) remaining owing to Anglo American Platinum under the Senior Debt Facility as follows:
| | • | | Plateau will enter into the New Debt Facility Agreement. |
| | • | | Plateau will receive the proceeds of the Asset Sale from Ga-Phasha and Boikgantsho. |
| | • | | Plateau will use the proceeds to the Asset Sale and a portion of the New Debt Facility to fully repay the Senior Debt Facility. |
| | • | | A portion of the outstanding New Debt Facility will be repaid with the proceeds of the RPM Share Subscription. |
Following completion of the above transactions, the amount owing under the Senior Debt Facility to RPM will be fully repaid and the only debt of Plateau outstanding to RPM will be the approximately ZAR 833 million (US$79.5 million) outstanding pursuant to the New Debt Facility.
New Debt Facility Agreement
Conditional on the completion of the Asset Sale and the RPM Share Subscription, RPM has agreed to make available the New Debt Facility in an amount up to ZAR 1,550 million (US$147.9 million), plus a Working Capital Facility in an amount up to ZAR 90 million (US$8.6 million) to be made available to Plateau. Following the completion of the Asset Sale, described above; ZAR 1.7 billion (US$162.2 million) will have been repaid under the Senior Debt Facility. Following completion of the RPM Share Subscription described below, a further ZAR 750 million (US$71.6 million)
18
will have been repaid under the New Debt Facility, resulting in approximately ZAR 833 million (US$79.5 million) remaining outstanding. This will be the opening balance of the New Debt Facility and an amount of approximately ZAR 717 million (US$68.4 million) will be available under the New Debt Facility.
It is intended that Atlatsa will utilize the remainder of the New Debt Facility to fund its attributable share of the Brakfontein Merensky and MPH UG2 projects. RPM will be responsible for funding its attributable share of the Brakfontein Merensky and MPH UG2 projects up to a maximum of ZAR 539 million (US$51 million).
For interest calculation purposes, the New Debt Facility will be split into two tranches with the first tranche being ZAR 1 billion (US$95.4 million) and the second tranche being ZAR 550 million (US$52.5 million), plus the ZAR 90 million (US$8.6 million) revolving facility. All capital drawdowns will be subject to annual capital drawdown limits agreed between Atlatsa and RPM as set out in the New Debt Facility.
The New Debt Facility will be available to Atlatsa for eight years terminating on December 31, 2020 and will attract a variable interest rate. The variable interest rate will be determined by adding a fixed margin to three-month JIBAR. The New Debt Facility will attract a reduced interest rate during the initial term (comprising the capital intensive phase of the growth operations at the Bokoni Mine through to 2016) and escalating to increased rates depending on the amount owing by Atlatsa under the New Debt Facility over the funding period. The table below sets out the variable interest rate profile payable by Atlatsa over the funding period term.
The interest rate and margin in relation to each tranche will be calculated on a sliding scale with reference to the total facility outstanding, in accordance with the following:
| | | | | | | | | | | | | | | | | | | | | | | | | | | | | | | | |
| Debt balance | | 2013
(%) | | | 2014
(%) | | | 2015
(%) | | | 2016
(%) | | | 2017
(%) | | | 2018
(%) | | | 2019
(%) | | | 2020
(%) | |
(up to ZAR1 billion) | |
| zero
interest |
| |
| zero
interest |
| |
| JIBAR
minus
5.14 |
| |
| JIBAR
minus
3.11 |
| |
| JIBAR
minus
0.96 |
| |
| JIBAR
plus
1.30 |
| |
| JIBAR
plus
6.19 |
| |
| JIBAR
plus
6.23 |
|
(ZAR1 billion to ZAR1.55 billion) | |
| JIBAR
minus
1.25 |
| |
| JIBAR
plus
3.02 |
| |
| JIBAR
plus
2.36 |
| |
| JIBAR
plus
4.39 |
| |
| JIBAR
plus
6.54 |
| |
| JIBAR
plus
6.30 |
| |
| JIBAR
plus
11.19 |
| |
| JIBAR
plus
11.23 |
|
The weighted average interest rate is calculated based on the projected opening balance of the New Debt Facility in each forecast year. While the weighted average interest rate under the New Debt Facility will depend on prevailing market interest rates (three-month JIBAR) from time to time, it is expected to substantially reduce Atlatsa’s current cost of debt to approximately 2% over the period of the loan.
There will be no fixed repayment term for the New Debt Facility during the peak funding years while the Brakfontein Merensky and MPH UG2 projects are still in their ramp-up phase through to 2016. Atlatsa will be required to fully repay the New Debt Facility to RPM by December 31, 2020. There will be no penalty for early repayment. Atlatsa will be required to reduce the New Debt Facility owing to RPM to an outstanding balance (including capitalized interest) of ZAR 1 billion (US$95.4 million) as at December 31, 2018, and ZAR 500 million (US$47.7 million) as at December 31, 2019.
Atlatsa will be obliged to utilize 90% of its attributable share of free cash flows generated from the Bokoni Mine operations to service the New Debt Facility and 10% of such free cash flow will be available to Atlatsa. Atlatsa will not be required to effect any mandatory refinancing of the New Debt Facility during the debt term through to 2020.
Following the completion of the Debt Refinancing Transactions and the Asset Sale, Anglo American Platinum will have the right under the terms of the New Debt Facility to refinance the New Debt Facility and Atlatsa will be obliged to co-operate in such process, provided that any such refinancing is undertaken on terms to be agreed by Atlatsa and Anglo American Platinum and that such terms are not more onerous to Atlatsa than the terms of the New Debt Facility.
19
Working Capital Facility
Conditional upon the completion of the Restructuring Plan, Atlatsa and RPM have agreed to enter into the Working Capital Facility whereby RPM will make a maximum of ZAR 30 million (US$2.8 million) per year available to Atlatsa during each of 2013, 2014 and 2015 for an aggregate facility of ZAR 90 million (US$8.6 million), including capitalized interest to fund Atlatsa’s corporate and administrative expenses through to 2015.
Pursuant to the terms of the Working Capital Facility, interest will be charged on the outstanding amounts of the Working Capital Facility at three-month JIBAR+4% per annum, including capitalized interest. The balance of the Working Capital Facility cannot exceed ZAR 90 million (US$8.6 million) at any time. Atlatsa cannot pay any dividends until the Working Capital Facility is fully repaid. The Working Capital Facility will be repayable in full by December 31, 2020.
See “Related Party Aspects of the Restructuring Plan and the Ancillary Matters” for details regarding the related party aspects of the Debt Refinancing Transactions.
RPM Share Subscription
At the Meeting, Disinterested Shareholders, being all Shareholders other than RPM and Anglo American Platinum, will be asked to consider a special resolution (the text of which is attached hereto as Schedule C) approving the RPM Share Subscription, which must be approved by a 75% majority of votes cast by Disinterested Shareholders with respect to this matter at the Meeting pursuant to JSE Listings Requirements.
Conditional upon the completion of the Restructuring Plan, Atlatsa and Anglo American Platinum have agreed to the RPM Share Subscription to further reduce Atlatsa’s outstanding debt. Atlatsa will issue 125 million Common Shares to RPM for an issue price of ZAR 6.00 (US$0.57) per Common Share, for an aggregate subscription price of ZAR 750 million (US$71.6 million) (the “Atlatsa Share Subscription Price”) to be paid in cash. Atlatsa will apply the Atlatsa Share Subscription Price to repay ZAR 750 million (US$71.6 million) of the outstanding debt under the New Debt Facility.
The intention of Atlatsa and Anglo American Platinum in proceeding with the RPM Share Subscription is to partially reduce Atlatsa’s outstanding debt obligations by a further ZAR 750 million (US$71.6 million) to approximately ZAR 833 million (US$79.5 million). As a result of the RPM Share Subscription, RPM will hold 125 million Atlatsa Common Shares representing 22.55% of the voting rights of Atlatsa’s outstanding Common Shares immediately following the RPM Share Subscription.
See “Related Party Aspects of Restructuring Plan and Ancillary Matters” for details regarding the related party aspects of the RPM Share Subscription.
Restructuring Plan – Ancillary Matters
Atlatsa Holdings Share Purchase
Anglo American Platinum through RPM, holds 115,800 B1 Preference Shares, which are convertible, through a series of transactions, into 115.8 million Atlatsa Common Shares at any time upon request of RPM and in any event by 2018. (See Atlatsa’s information circular dated May 15, 2009 for further details regarding the conversion features of the B1 Preference Shares). In connection with the Debt Refinancing Transactions, RPM has agreed to trigger the conversion of the B1 Preference Share structure, which will automatically trigger the conversion of the Plateau Preference Shares. As a result of the conversion of B1 Preference Shares and Plateau Preference Shares in accordance with their terms and the implementation of related forward sale transactions, all of which were approved by shareholders in 2009, RPM will hold 115.8 million Common Shares and Atlatsa Holdings will hold an additional 111.6 million Common Shares.
Shareholders are referred to the Company’s audited annual financial statements for the year ended December 31, 2012, which was filed on March 28, 2012. The audit opinion contained an emphasis of matter paragraph relating to the going concern of the Group. Should the Restructure Plan not be implemented, it will give rise to material uncertainty about the
20
ability of the Group to continue as a going concern. Conditional upon the Restructuring Plan, Anglo American Platinum has agreed to the RPM Share Subscription in order to further reduce the outstanding amount due to RPM under the New Debt Facility and to improve Atlatsa’s going concern status. However, the RPM Share Subscription has the effect of diluting Atlatsa Holdings’ shareholding in Atlatsa to 40,97%, below the 51% minimum threshold imposed by the South African Reserve Bank and below the 51% minimum black economic empowerment requirements of the DMR for prospecting and mining right holders under the existing Atlatsa structure. Atlatsa Holdings has therefore undertaken to purchase 115.8 million Atlatsa Common Shares from RPM for an aggregate subscription price of ZAR 463 million (US$44.3 million) (ZAR 4 per share (US$0.38 per share) representing a 140% premium to current market value of ZAR 1.67 per share (US$0.16 per share) as of May 21, 2013 (the “Atlatsa Holdings Share Purchase”), which purchase price shall be financed by a loan from RPM in the amount of the subscription price (the “Atlatsa Holdings Loan”).The Atlatsa Holdings Loan shall be repayable by Atlatsa Holdings to RPM as follows: (i) ZAR 232 (US$22.2 million) million plus accrued interest thereon by September 30, 2018; (ii) ZAR 116 million (US$11.1 million) plus accrued interest thereon by September 30, 2019, and (iii) the balance of the Atlatsa Holdings Loan by September 30, 2020. In addition, the first ZAR 5 million (US$0.48 million) of all dividends received by Atlatsa Holdings while the Atlatsa Holdings Loan is outstanding must be applied in reduction of the Atlatsa Holdings Loan as and when such dividends are received. The interest rates applicable to the Atlatsa Holdings Loan will mirror the interest charged to Atlatsa by RPM under the New Debt Facility. A penalty interest rate of the higher of (i) prime plus 2% and (ii) 5% higher than the prevailing interest rate under the New Debt Facility, will become applicable in the event of any payment default on the Atlatsa Holdings Loan. Atlatsa Holdings, ability to make repayment on the loan to RPM is directly related to the future profitability of Atlatsa.
Atlatsa Holdings is obliged to secure the Atlatsa Holdings’ Loan obligation to RPM by a cession and pledge of its entire holding of Common Shares (342.9 million Common Shares post completion of the Restructure Plan) to RPM. The implementation of the Atlatsa Holdings Share Purchase will have the effect of taking Atlatsa Holdings’ shareholding in Atlatsa from the current 57.2%, debt-free, to 61.9% with debt in excess of R463 million (US$44.3 million). In addition, Atlatsa Holdings has agreed to the extension of its Atlatsa share lock-up from December 31, 2018 to December 31, 2020.
Atlatsa Holdings has agreed to the Atlatsa Holdings Share Purchase and the Atlatsa Holdings Loan obligations for the purpose of assisting Atlatsa in (i) deleveraging its balance sheet through the Restructure Plan, to secure the long term sustainable going concern status of Atlatsa ; (ii) to secure the continued BEE shareholding of at least 51% as required by the South African Reserve Bank and the DMR under the existing Atlatsa structure to ensure continued mineral tenure by remaining in compliance with the Mining Charter as promulgated under the MPRDA; and (iii) to provide Atlatsa with sufficient headroom in its outstanding capital structure to raise additional equity financing from non-BEE investors without diluting its BEE shareholding below the minimum 51% threshold, independently of RPM.
Should Atlatsa Holdings be unable to repay the Atlatsa Holdings Loan when due, RPM shall have the right to realize its security over the Common Shares, which may cause Atlatsa’s BEE shareholding to decrease below the 51% minimum threshold. In order to avoid any potential adverse effects on Atlatsa’s BEE shareholding, Atlatsa Holdings and RPM have agreed amongst themselves to grant Atlatsa the discretionary right, but not the obligation, for a limited period of time, to satisfy any repayment obligations of Atlatsa Holdings under the Atlatsa Holdings Loan prior to RPM enforcing its security interests against the Common Shares held as collateral. The decision whether to exercise this discretionary right will be undertaken by Atlatsa at the relevant time by Atlatsa’s disinterested directors and, if such directors determine that Atlatsa exercise such discretionary right, will be subject to disinterested Shareholder approval at such time.
Amendment to the Concentrate Agreement
Conditional on the completion of the Restructuring Plan, Bokoni intend to extend its existing Concentrate Agreement with RPM on the same terms and conditions for a period of eight years, terminating on December 31, 2020. Thereafter, the Concentrate Agreement will be renewable every five years on mutually agreed terms.
The amendments to the Concentrate Agreement will also include a provision whereby during the extended period, the Concentrate Agreement can be amended at any time by mutual agreement.
21
Polokwane Smelter Option
Conditional on the completion of the Restructuring Plan, Atlatsa and Anglo American Platinum intend to amend the existing Polokwane smelter option agreement so as to exclude the Asset Sale Properties from Atlatsa’s existing option to acquire an ownership interest in RPM’s Polokwane smelter complex. The foregoing will be the only amendment made to the Polokwane Smelter Option.
Extension of Pelawan Lock-Up
As a result of the extension of the New Debt Facility to December 31, 2020, the lock-up undertakings of Atlatsa Holdings with respect to its Atlatsa shareholdings contained in the Pelawan Shareholders Agreement are extended until December 31, 2020.
Amendment and Restatement of Bokoni Holdco Shareholders Agreement
The Bokoni Holdco Shareholders Agreement was amended and restated to reflect the implementation of the Interim Transactions, to accommodate the Restructuring Plan and to eliminate provisions from the original Bokoni Holdco Shareholders Agreement to delete provisions which are no longer applicable. In addition, RPM has undertaken in the amended and restated Bokoni Holdco Shareholders Agreement to conclude an agreement with Atlatsa, once Plateau’s indebtedness to RPM is repaid in full and in the event that Atlatsa so desires, pursuant to which Atlatsa will be entitled to purchase from RPM, at market value, additional shares in Holdco as are equal in value, at the time of such transaction, to the number of estimated resource ounces sold to RPM under the Asset Sale Agreements.
Related Party Aspects of the Restructuring Plan and the Ancillary Matters
Each of the Asset Sale, the Debt Refinancing Transactions and the RPM Share Subscription constitutes a “related party transaction” (as such term is defined in MI 61-101), and the Asset Sale and the RPM Share Subscription also constitute a “related party transaction” pursuant to the JSE Listings Requirements, due to the fact that Anglo American Platinum and RPM are “related parties” (as such term is defined in MI 61-101 and the JSE Listings Requirements) of Atlatsa by virtue of Anglo American Platinum’s 26% indirect equity investment in Atlatsa and RPM being a wholly-owned subsidiary of Anglo American Platinum.
Pursuant to the provisions of MI 61-101, the approval of a majority of the votes cast by Disinterested Shareholders must be obtained in relation to the resolutions to approve each of the Related Party Transactions. Under MI 61-101, a formal valuation of the non-cash assets involved in certain types of “related party transactions” is required. In this case, pursuant to MI 61-101, a formal valuation is only required with respect to the Asset Sale and the Boikgantsho Valuation and the Ga-Phasha Valuation have been prepared by Minxcon, independent professional experts, and are attached hereto as Schedule G and Schedule H, respectively. The Fairness Opinion in respect of the Asset Sale that is required in accordance with JSE Listings Requirements has also been prepared by PSG and Minxcon and is attached hereto as Schedule I.
The Common Shares held by any “related party” (as defined pursuant to the JSE Listings Requirements and MI 61-101) and their associates will be taken into account in determining a quorum at the Meeting, but their votes will not be taken into account in determining the results of the voting at the Meeting in relation to any resolution to approve any of the Related Party Transactions.
Valuation
The following constitutes a summary only of each of the Boikgantsho Valuation and the Ga-Phasha Valuation and is qualified in its entirety by, and should be read in conjunction with, the full text of the Boikgantsho Valuation and the Ga-Phasha Valuation, which are attached to this Information Circular as Schedule G and Schedule H, respectively. The Boikgantsho Valuation and the Ga-Phasha Valuation each set out, among other things, the scope of Minxcon’s review and analyses, assumptions made, information reviewed and considered by Minxcon, as well as the limitations and qualifications relied upon.
22
The Boikgantsho Valuation and the Ga-Phasha Valuation have been prepared and provided solely for the use of the Special Committee and the Board of Directors and for inclusion in this Information Circular and may not be used or relied upon by any other person without the express prior written consent of Minxcon.
Shareholders are encouraged to read the Boikgantsho Valuation and the Ga-Phasha Valuation, which are attached to this Information Circular as Schedule G and Schedule H, respectively. The preparation of a valuation is a complex process and is not necessarily susceptible to partial analysis or summary description. Minxcon has based the Boikgantsho Valuation and the Ga-Phasha Valuation upon a variety of factors, and believes that its analysis must be considered as a whole and that selecting portions of the analysis or the factors considered by it, without considering all factors and analysis together, could create an incomplete view of the process underlying each of the Boikgantsho Valuation and the Ga-Phasha Valuation.
Engagement of Minxcon
Minxcon was first contacted regarding the Restructuring Plan on March 19, 2012. Minxcon was formally engaged to act as independent valuator, along with PSG, to the Special Committee pursuant to an agreement dated March 19, 2012. Pursuant to the terms of this agreement Atlatsa paid to Minxcon a fixed fee of ZAR 137,950 (US$13,163) plus VAT for its services. On October 10, 2012, Atlatsa engaged Minxcon to update the March 2012 valuation. Pursuant to the October 2012 agreement Atlatsa agreed to pay to Minxcon a fixed fee of ZAR 44,850 (US$4,278) plus VAT to update the March 2012 valuation to November 30, 2012.
None of the fees payable to Minxcon under its engagement agreement with Atlatsa were contingent upon the conclusion reached by Minxcon in either of the Boikgantsho Valuation or the Ga-Phasha Valuation, or upon completion of the Asset Sale or the Restructuring Plan.
None of Minxcon, its associates or affiliates: (i) is an issuer insider, associate, affiliate or affiliated entity (as those terms are defined in MI 61-101) of Atlatsa or Anglo American Platinum, or any of their respective associates or affiliates; (ii) is an advisor to any person or company other than the Special Committee with respect to the Restructuring Plan; (iii) is a manager or co-manager of a soliciting deal group formed in respect to the Restructuring Plan. Minxcon has not provided any financial advisory services to Atlatsa or Anglo American Platinum in the past five years. Atlatsa has determined that Minxcon is independent and qualified to provide the Boikgantsho Valuation and the Ga-Phasha Valuation.
Minxcon reports comply with acceptable international reporting standards in accordance with Minxcon’s membership/ fellowship with the following bodies:
| | • | | Engineering Council of South Africa (ECSA); |
| | • | | South African Council for Natural Scientific Professions (SACNASP); |
| | • | | Geological Society of South Africa (GSSA). |
The foregoing qualifications and experience enables Minxcon to report as an independent expert in accordance with local requirements in the following jurisdictions:
| | • | | Canada: National Instrument – NI 43-101 – Standards of Disclosure for Mineral Projects and the Canadian Institute for Mining, Metallurgy and Petroleum Valuation Standards (CIMVal); |
| | • | | Australia: Australian Code for the Reporting of Mineral Resources and Ore Reserves (the “JORC Code”) and Valuation Code (VALMIN). |
General Assumptions, Limitations and Reliance
In connection with the preparation of each of the Boikgantsho Valuation and the Ga-Phasha Valuation, Minxcon, among other things, reviewed information provided by Atlatsa, met with senior management of Atlatsa and conducted other investigative exercises as more specifically described in each of the Boikgantsho Valuation and the Ga-Phasha
23
Valuation. Minxcon has relied upon the accuracy, completeness and fair presentation of all data and information obtained by it from public sources, provided to it by or on behalf of Atlatsa, or otherwise obtained by Minxcon, including NI 43-101 compliant technical reports prepared in respect of each of the Boikgantsho Project and the Ga-Phasha Project, which are appended to and form part of the Boikgantsho Valuation and the Ga-Phasha Valuation, respectively.
The Boikgantsho Valuation and the Ga-Phasha Valuation have been prepared in accordance with MI 61-101 and the requirements of the TSX-V.
Boikgantsho Valuation
The valuation methodology employed by Minxcon requires the development of long-range financial projections, which reflect numerous assumptions including those related to the condition of securities markets, economic, financial and general business conditions as well as the assumption that all conditions required to implement the Asset Sale will be met. The Boikgantsho Valuation reflects the fair market value of the assets of Boikgantsho Project as at 27 February 2013, the effective date of the Boikgantsho Valuation. While Minxcon believes the assumptions used are appropriate in the circumstances, some or all of the assumptions may prove to be incorrect.
The result of the Asset Sale is that additional funding will be raised for capital to expand the Bokoni Mine operations to 160,000 tpm steady state mine. At these production levels the mine cost structure will reduce to lower levels that ensure the sustainability of the mine.
Minxcon based its economic analysis, in part, on Inferred Resources (as that term is defined in NI 43-101), which are considered too geologically speculative to have mining and economic considerations applied to them and to be categorized as Mineral Reserves (as that term is defined in NI 43-101). There is no certainty that certain of the resources on which Minxcon prepared the Boikgantsho Valuation will be realized.
In preparing the Boikgantsho Valuation, Minxcon performed a variety of financial and comparative analysis, including an analysis based on comparable recent transactions and discounted cash flows. High and low values were derived from and influenced by the modification of several important assumptions including: (i) future PGM prices; (ii) foreign exchange rate; (iii) capital costs; (iv) operating costs; (v) discount rates; (vi) stage of exploration; (vii) geology and mineralization; (viii) external factors including social, political and environmental, amongst other factors. In preparing the Boikgantsho Valuation, Minxcon made qualitative judgments as to the significance of each analysis and factor that it considered.
Minxcon is of the opinion that, as of 27 February 2013, the fair market value of the assets of the Boikgantsho Project is estimated to be between ZAR 902 million (US$86.1 million) and ZAR 960 million (US$91.6 million). The Boikgantsho Asset Sale Agreement provides that Boikgantsho will sell and RPM will purchase the assets of the Boikgantsho Project for ZAR 950 million (US$90.6 million), which is within the range of the fair market values of the Boikgantsho Project as set out in the Boikgantsho Valuation.
The conclusion of the Boikgantsho Valuation is subject to all of the conditions, limitations, qualifications, disclaimers and assumptions reflected in and underlying the Boikgantsho Valuation, a copy of which is attached to this Information Circular as Schedule G. Upon written request by a Shareholder to the Corporate Secretary at the offices of Atlatsa Resources Corporation in South Africa located at 4th Floor, 82 Grayston Drive, Sandton, Johannesburg 2146, Atlatsa will mail a copy of the Boikgantsho Valuation to such Shareholder without charge.
Ga-Phasha Valuation
The valuation methodology employed by Minxcon requires the development of long range financial projections, which reflect numerous assumptions including those related to the condition of securities markets, economic, financial and general business conditions as well as the assumption that all conditions required to implement the Asset Sale will be met. The valuation reflects the fair market value of the Ga-Phasha Sale Assets as 26 February 2013, the effective date of the Ga-Phasha Valuation. While Minxcon believes the assumptions used are appropriate in the circumstances, some or all of the assumptions may prove to be incorrect.
24
Minxcon based its economic analysis, in part, on Inferred Resources (as that term is defined in NI 43-101), which are considered too geologically speculative to have mining and economic considerations applied to them and to be categorized as Mineral Reserves (as that term is defined in NI 43-101). There is no certainty that certain of the resources on which Minxcon prepared the Ga-Phasha Valuation will be realized.
In preparing the Ga-Phasha Valuation, Minxcon performed a variety of financial and comparative analysis, including an analysis based on comparable recent transactions, discounted cash flows and historical cost. High and low values were derived from and influenced by the modification of several important assumptions including: (i) future PGM prices; (ii) foreign exchange rate; (iii) capital costs; (iv) operating costs; (v) discount rates; (vi) stage of exploration and/or development; (vii) geology and mineralization; (viii) the ability of RPM to integrate the Ga-Phasha Sale Assets with its existing mining properties; (ix) external factors including social, political and environmental, amongst other factors. In preparing the Ga-Phasha Valuation, Minxcon made qualitative judgments as to the significance of each analysis and factor that it considered.
Minxcon is of the opinion that, as of 26 February 2013, the fair market value of the Ga-Phasha Sale Assets is estimated to be between ZAR 740 million (US$70.6 million) and ZAR 950 million (US$90.6 million). The Ga-Phasha Asset Sale Agreement provides that Ga-Phasha will sell and RPM will purchase the Ga-Phasha Sale Assets for ZAR 750 million (US$71.6 million), which is within the range of the fair market values of the Ga-Phasha Sale Assets as set out in the Ga-Phasha Valuation.
The conclusion of the Ga-Phasha Valuation is subject to all of the conditions, limitations, qualifications, disclaimers and assumptions reflected in and underlying the Ga-Phasha Valuation, a copy of which is attached to this Information Circular as Schedule H. Upon written request by a Shareholder to the Corporate Secretary at the offices of Atlatsa Resources Corporation in South Africa located at 4th Floor, 82 Grayston Drive, Sandton, Johannesburg 2146, Atlatsa will mail a copy of the Ga-Phasha Valuation to such Shareholder without charge.
Prior Valuations
Atlatsa and its directors and officers do not know of any prior valuations (as defined in MI 61-101), after reasonable inquiry, of all or any part of the Boikgantsho Project or the Ga-Phasha Project made in the last 24 months.
Fairness Opinion
PSG, as the independent expert appointed by the Board pursuant to the JSE Listings Requirements to provide the Fairness Opinion, is of the opinion that, subject to the limiting conditions as set out in the Fairness Opinion (attached to this Information Circular as Schedule I), that the terms and conditions of the Restructuring Plan based on quantitative considerations are fair to Atlatsa shareholders.
Board Recommendation
The Board of Directors, based upon the recommendation of the Special Committee and the audit committee have determined that the Related Party Transactions are in the best interests of the Company and are fair, from a financial point of view, insofar as the Shareholders of Atlatsa (other than Anglo American Platinum and RPM and their respective associates) are concerned.
The following disclosure in this section is made pursuant to the “related party transaction” disclosure rules prescribed by MI 61-101.
Approval Process
The Board of Directors formed the Special Committee to act in an advisory capacity to the Board and to consider the Related Party Transactions.
The members of the Special Committee are Fikile Tebogo De Buck, Patrick Cooke and Anu Dhir.
25
The Special Committee’s mandate included:
| | (a) | considering whether, in the opinion of the members of the Special Committee, the Related Party Transactions are in the best interests of Atlatsa and its Shareholders, and providing such opinion and related recommendation to Shareholders; |
| | (b) | considering and evaluating the Related Party Transactions and the agreements and documents that are necessary or desirable to give effect to the Related Party Transactions; |
| | (c) | considering any assessments provided or required in connection with the Related Party Transactions; |
| | (d) | considering all applicable legal and regulatory requirements relating to the Related Party Transactions; |
| | (e) | supervising the preparation by counsel and advisors of any documents, expert reports and formal valuations which may be required of Atlatsa in connection with the Related Party Transactions by applicable laws, rules, regulations and policies; |
| | (f) | approving the Related Party Transactions and the agreements and other documents that are necessary or desirable to give effect to the Related Party Transactions; and |
| | (g) | providing a recommendation and report to the Board of Directors on the Related Party Transactions, agreements and other documents approved by the Special Committee. |
The Board, audit committee and Special Committee met on August 21, 2012, September 21, 2012, December 7, 2012, February 20, 2013 and March 12, 2013 and received an update from management on the status and proposed terms of the Restructuring Plan. On February 20, 2013 and March 13, 2013, the Board and Special Committee met and deliberated on the Related Party Transactions and the legal, financial and other advice and information it received, including the advice it received from the Company’s South African financial advisers and JSE Sponsor (Macquarie First South Capital (Pty) Limited), South African legal counsel (Cliffe Dekker Hofmeyr) and Canadian legal counsel (McCarthy Tétrault LLP), the Boikgantsho Valuation and the Ga-Phasha Valuation from Minxcon, the Fairness Opinion relating to the Asset Sale from PSG.
As a result of the deliberations described above, the Special Committee recommended that the Board of Directors approve the Related Party Transactions subject to the approval of Shareholders as described in this Information Circular.
The Board of Directors accordingly recommends that Disinterested Shareholders vote “FOR” the resolutions relating to the Asset Sale, the Debt Refinancing Transactions and the RPM Share Subscription attached hereto as Schedule A, Schedule B and Schedule C, respectively.
To the knowledge of the Company, after reasonable enquiry, Anglo American Platinum, RPM and their associates currently hold no Common Shares, and therefore will not be entitled to vote on any matter at the Meeting.
Related Party Nature of Interim Transactions
The amendment of the Senior Debt Facility pursuant to the Interim Implementation Agreement constituted a “related party transaction” (as such term is defined in MI 61-101) due to the fact that Anglo American Platinum and RPM are “related parties” (as such term is defined in MI 61-101) of Atlatsa by virtue of Anglo American Platinum’s 26% indirect equity investment in Atlatsa through RPM.
The Interim Share Subscriptions constituted a “related party transaction” (as such term is defined in MI 61-101) due to the fact that Bokoni Holdco is a “related party” (as such term is defined in MI 61-101) of Atlatsa by virtue of Atlatsa’s indirect 51% interest in Bokoni Holdco through Plateau.
Pursuant to the provisions of MI 61-101, minority shareholder approval would be required with respect to the amendment to the Senior Debt Facility and the Interim Share Subscriptions, and a formal valuation is required with respect to the Interim Share Subscriptions, unless an exemption from such shareholder approval and formal valuation requirements is available under MI 61-101 and relied upon.
26
Exemptions Relied Upon
As previously disclosed in the material change report dated September 27, 2012, with respect to the amendment to the Senior Debt Facility, Atlatsa relied on an exemption under MI 61-101 from the requirement to obtain minority shareholder approval. Atlatsa relied on the “loan to issuer” exemption from the minority shareholder approval requirement contained in subsection 5.7(1)(f) of MI 61-101, on the basis that: (i) the amendment to the Senior Debt Facility, as well as the Senior Debt Facility, are on commercially reasonable terms that are more advantageous to Atlatsa as compared to terms that may have been obtained from a person dealing at arm’s length from Atlatsa, and (ii) the advance under the amended Senior Debt Facility was not convertible, directly or indirectly, into equity or voting securities of Atlatsa, Plateau or any other subsidiary of Atlatsa, or otherwise participating in nature, nor was the advance repayable as to principal or interest, directly or indirectly, in equity or voting securities of Atlatsa, Plateau or any other subsidiary of Atlatsa.
With respect to the Interim Share Subscriptions, Atlatsa relied on an exemption from the requirement to obtain minority shareholder approval as well as the requirement to obtain a formal valuation with respect to the shares Plateau subscribed for in the capital of Bokoni Holdco. Atlatsa relied on thefinancial hardship exemption from the shareholder approval requirement and the formal valuation requirement contained in subsections 5.5(g) and 5.7(1)(f) of MI 61-101, on the basis that: (i) Atlatsa is in serious financial difficulty, (ii) the Interim Share Subscription, as an interim step of the Restructuring Plan, was designed to improve the financial position of Atlatsa, (iii) the Interim Share Subscription was not subject to court approval nor had a court ordered that the Interim Share Subscription be effected pursuant to bankruptcy, insolvency or other similar proceedings, (iv) Atlatsa has, in respect of the Interim Share Subscription, a Special Committee comprised of four independent directors being Anu Dhir, Patrick Cooke, Rizelle M. Sampson and Fikile Tebogo De Buck to consider whether the Interim Share Subscriptions were in the best interests of Shareholders, and (v) Atlatsa’s Board of Directors, acting in good faith, and the Special Committee, which represents greater than two thirds of the independent directors, unanimously determined that the foregoing considerations in (i) and (ii) apply and the terms of the Interim Share Subscription were, and are, reasonable in the circumstances of Atlatsa.
Shareholders are referred to the material change report of Atlatsa dated September 27, 2012 for more information regarding the Interim Transactions, including information regarding the review and approval process adopted by the Board of Directors, the Special Committee and the audit committee of the Board of Directors. The material change report is available on Atlatsa’s profile on SEDAR atwww.sedar.com and will be sent to any Shareholder, at no charge, upon written request to the Corporate Secretary of the Company.
Unaudited Pro Forma Financial Effects Relating to the Restructuring Plan
The disclosure in this section is made pursuant to the JSE Listing Requirements relating to the Restructuring Plan. The pro forma financial information is required to be published in respect of the most recent completed financial period, which for purposes of the JSE Listings Requirements includes the last annual financial period or the last interim (half year) financial period completed.
The table below sets out the unaudited and unreviewed pro forma financial information of the Restructuring Plan on Atlatsa’s earnings per share, headline earnings per share, diluted earnings per share, diluted headline earnings per share, net asset value per share and tangible net asset value per share.
The unaudited and unreviewed pro forma financial information, which is the responsibility of the directors of Atlatsa, has been prepared for illustrative purposes only and, because of its nature, may not present a fair reflection of Atlatsa’s financial position, changes in equity, results of operations or cash flows.
The unaudited and unreviewed pro forma financial information is merely intended to provide information on how the Restructuring Plan may have affected the statement of comprehensive income on January 1, 2012 and the statement of financial position on December 31, 2012.
27
The unaudited and unreviewed pro forma financial effects have been prepared using accounting policies that comply with International Financial Reporting Standards and that are consistent with those applied in the audited consolidated financial statements of Atlatsa for the year ended December 31, 2012.
The unaudited and unreviewed pro forma statement of financial position, the unaudited and unreviewed pro forma statement of comprehensive income and the related notes, including a reconciliation showing all of the unaudited pro forma adjustments to the share capital, reserves and other equity items relating to Atlatsa, (collectively “Pro forma Financial Information”) is set out in Schedule D-1 and the Reporting Accountants’ Report thereon is set out in Schedule D-2 to this Information Circular, respectively. The historical financial information of Boikgantsho and Ga-Phasha are set out in Schedule J and Schedule K to this Information Circular, respectively.
The independent reporting accountants’ reports on the historical financial information of Boikgantsho and Ga-Phasha are contained in Schedule L.
| | | | | | | | | | | | |
| | | Before the Restructuring
Plan(1) | | | After the Restructuring
Plan(1)(2) | | | Percentage change | |
Earnings per share (“EPS”) and headline earnings per share (“HEPS”) | | | (0.04 | ) | | | 0.40 | | | | >100 | % |
Diluted EPS (“FDEPS”) and diluted HEPS (“FDHEPS”) | | | (0.04 | ) | | | 0.39 | | | | >100 | % |
Net asset value (“NAV”) per share | | | (0.09 | ) | | | 0.51 | | | | >100 | % |
Tangible NAV (“NTAV”) per share | | | (0.15 | ) | | | 0.49 | | | | >100 | % |
Weighted average shares in issue for calculating EPS and HEPS | | | 424,791,411 | (3) | | | 549,791,411 | | | | 29.43 | % |
Weighted average fully diluted shares outstanding for calculating FDEPS and FDHEPS | | | 424,791,411 | (3) | | | 554,288,473 | | | | 30.48 | % |
Shares in issue for calculating NAV and NTAV | | | 201,888,473 | | | | 554,288,473 | | | | >100 | % |
Notes:
| (1) | Based on the published financial information of Atlatsa for the year ended December 31, 2012. All amounts in Canadian dollars, unless indicated otherwise. |
| (2) | Based on the assumption that the Restructuring Plan was effected on January 1, 2012 for statement of comprehensive income purposes and December 31, 2012 for statement of financial position purposes. |
| (3) | The difference between shares in issue and the weighted average shares is the convertible “B” Preference Shares (227,000,000) less shares held in the Bokoni Employees Share Option Trust (4,497,062). |
28
Major Shareholders and Controlling Shareholders of Atlatsa
The only persons or corporations that will beneficially own, directly or indirectly, or exercise control or direction over, Common Shares carrying more than 5% of the voting rights attached to all issued and outstanding Common Shares of the Company post implementation of the Restructuring Plan will be as follows:
| | | | | | | | |
Shareholder Name and Address | | Number of
Common Shares Held | | | Percentage of
Issued Common Shares | |
The Pelawan Trust, as Trustee(1) Atlatsa Holdings, as Beneficiary 4th Floor, 82 Grayston Drive Sandton, 2196, South Africa | | | 342,896,438 | | | | 61.9 | % |
Mr. Tumelo M. Motsisi(2) (4) 4th Floor, 82 Grayston Drive Sandton, South Africa | | | 83,132,153 | | | | 15.0 | % |
Mr. Harold Motaung(3)(5) 4th Floor, 82 Grayston Drive Sandton, South Africa | | | 58,437,762 | | | | 10.5 | % |
RPM 55 Marshall Street Marshalltown, Johannesburg 2001, South Africa | | | 125,000,000 | | | | 22.55 | % |
Notes:
| (1) | These Common Shares are registered in the name of Pelawan Trust, which holds such Common Shares in trust for Atlatsa Holdings pursuant to escrow arrangements described in Item 9.G. “Escrow Securities” of Atlatsa’s Form 20-F available on SEDAR atwww.sedar.com. |
| (2) | Indirect holdings being 240 of the 1,000 ordinary shares in the issued and outstanding share capital of Atlatsa Holdings, multiplied by the number of Common Shares of the Company (342,896,438) held by the Pelawan Trust. |
| (3) | Indirect holdings being 170 of the 1,000 ordinary shares in the issued and outstanding share capital of Atlatsa Holdings, multiplied by the number of Common Shares of the Company (342,896,438) held by the Pelawan Trust. |
| (4) | Direct holding is 815,998 of the Common Shares of the Company. |
| (5) | Direct holding is 130,068 of Common Shares of the Company. |
There have been no changes in controlling shareholders of the Company during the five years preceding this Information Circular.
Share capital
The Company’s authorised share capital consists of an unlimited number of Common Shares of no par value.
The table below sets out the market capitalization of Atlatsa based on the share price as at the Record Date prior to implementation of the Restructure Plan:
| | | | | | | | |
| | | ZAR | | | US$ | |
Issued | | | | | | | | |
201,888,473 Common Shares of no par value at a market value of ZAR 1.85 per share per the Record Date | | | 373,493,675 | | | | 38,171,193 | |
Less: Treasury shares – 4,497,062 Bokoni Platinum Mine ESOP Trust | | | (8,319,565 | ) | | | (850,263 | ) |
| | | | | | | | |
TOTAL | | | 365,174,110 | | | | 37,320,930 | |
| | | | | | | | |
The table below sets out the market capitalization of the pro forma share capital of Atlatsa based on the share price as at the Record Date as adjusted to give effect to the conversion of the B1 and B2 Preference Shares and the issue of the corresponding Common Shares:
| | | | | | | | |
| | | ZAR | | | US$ | |
Issued | | | | | | | | |
201,888,473 Common Shares of no par value at a market value of ZAR1.85 per share per the Record Date | | | 373,493,675 | | | | 38,171,193 | |
115,800,000 Common Shares – Anglo American platinum | | | 214,230,000 | | | | 21,894,386 | |
111,600,000 Common Shares conversion – Atlatsa Holdings | | | 206,460,000 | | | | 21,200,289 | |
Less: Treasury shares – 4,497,062 Bokoni Platinum Mine ESOP Trust | | | (8,319,565 | ) | | | (850,263 | ) |
| | | | | | | | |
429,288,473 Total Common Shares | | | 785,864,110 | | | | 80,315,605 | |
| | | | | | | | |
29
The table below sets out the market capitalization of the pro forma share capital of Atlatsa based on the share price as at the Record Date, as adjusted to give effect to the conversion of the B1 and B2 Preference Shares and the issue of the corresponding Common Shares and the RPM Share Subscription:
| | | | | | | | |
| | | ZAR | | | US$ | |
Issued | | | | | | | | |
429,288,473 Common Shares of no par value at a market value of ZAR1.85 per share per the Record Date | | | 785,864,110 | | | | 80,315,605 | |
125,000,000 Common shares | | | 231,250,000 | | | | 23,633,837 | |
| | | | | | | | |
554,288,473 Total Common Shares | | | 1,017,114,110 | | | | 103,949,442 | |
| | | | | | | | |
Trading History
The below table provides the average closing price and volume for the Common Shares for the last 30 days ended on May 22, 2013 on the TSX-V, NYSE MKT and JSE:
| | | | | | | | | | | | | | | | | | | | | | | | | | | | | | | | | | | | | | | | | | | | | | | | |
| | | TSX-V
ATL (previously ARQ) (in CAD) | | | NYSE MKT
ATL (previously ANO) (in USD) | | | JSE
ATL (previously ARQ) (in ZAR) | |
| | | High
($) | | | Low
($) | | | Avg
($) | | | Volume | | | High
($) | | | Low
($) | | | Avg
($) | | | Volume | | | High
(R) | | | Low
(R) | | | Avg
($) | | | Volume | |
21 May | | | 0.16 | | | | 0.16 | | | | 0.16 | | | | 6,000 | | | | 0.20 | | | | 0.20 | | | | 0.20 | | | | 152,500 | | | | 1.67 | | | | 1.67 | | | | 1.67 | | | | 112 | |
20 May | | | — | | | | — | | | | — | | | | — | | | | 0.21 | | | | 0.19 | | | | 0.20 | | | | 604,556 | | | | 1.65 | | | | 1.65 | | | | 1.65 | | | | 24,000 | |
17 May | | | 0.20 | | | | 0.19 | | | | 0.19 | | | | 2,400 | | | | 0.20 | | | | 0.20 | | | | 0.20 | | | | 356,250 | | | | 1.95 | | | | 1.95 | | | | — | | | | — | |
16 May | | | 0.19 | | | | 0.19 | | | | 0.19 | | | | 1,000 | | | | 0.20 | | | | 0.19 | | | | 0.19 | | | | 357,505 | | | | 2.00 | | | | 1.60 | | | | 1.81 | | | | 9,201 | |
15 May | | | 0.18 | | | | 0.18 | | | | 0.18 | | | | 5,330 | | | | 0.20 | | | | 0.19 | | | | 0.19 | | | | 51,700 | | | | 1.66 | | | | 1.60 | | | | 1.64 | | | | 17,400 | |
14 May | | | 0.18 | | | | 0.18 | | | | 0.18 | | | | 2,130 | | | | 0.20 | | | | 0.19 | | | | 0.20 | | | | 602,588 | | | | 1.84 | | | | 1.65 | | | | 1.71 | | | | 198,792 | |
13 May | | | — | | | | — | | | | — | | | | — | | | | 0.20 | | | | 0.19 | | | | 0.19 | | | | 7,500 | | | | 1.74 | | | | 1.50 | | | | 1.56 | | | | 50,620 | |
10 May | | | 0.19 | | | | 0.19 | | | | 0.19 | | | | 3,000 | | | | 0.20 | | | | 0.19 | | | | 0.19 | | | | 36,166 | | | | 1.84 | | | | 1.84 | | | | 1.84 | | | | 3,450 | |
09 May | | | — | | | | — | | | | — | | | | — | | | | 0.20 | | | | 0.19 | | | | 0.20 | | | | 19,484 | | | | 1.84 | | | | 1.60 | | | | 1.78 | | | | 1,052 | |
08 May | | | 0.20 | | | | 0.20 | | | | 0.20 | | | | 4,000 | | | | 0.22 | | | | 0.19 | | | | 0.20 | | | | 44,674 | | | | 2.00 | | | | 2.00 | | | | — | | | | — | |
07 May | | | — | | | | — | | | | — | | | | — | | | | 0.20 | | | | 0.19 | | | | 0.19 | | | | 21,845 | | | | 2.00 | | | | 2.00 | | | | 2.00 | | | | 100 | |
06 May | | | — | | | | — | | | | — | | | | — | | | | 0.20 | | | | 0.19 | | | | 0.20 | | | | 214,341 | | | | 1.80 | | | | 1.70 | | | | 1.77 | | | | 150,000 | |
03 May | | | 0.18 | | | | 0.18 | | | | 0.18 | | | | 5,000 | | | | 0.19 | | | | 0.19 | | | | 0.19 | | | | 58,875 | | | | 1.95 | | | | 1.80 | | | | 1.83 | | | | 8,314 | |
02 May | | | 0.20 | | | | 0.17 | | | | 0.18 | | | | 64,000 | | | | 0.22 | | | | 0.18 | | | | 0.19 | | | | 241,111 | | | | 2.00 | | | | 2.00 | | | | 2.00 | | | | 2,028 | |
01 May | | | — | | | | — | | | | — | | | | — | | | | 0.21 | | | | 0.20 | | | | 0.20 | | | | 23,175 | | | | — | | | | — | | | | | | | | — | |
30 Apr | | | — | | | | — | | | | — | | | | — | | | | 0.20 | | | | 0.20 | | | | 0.20 | | | | 46,612 | | | | 2.00 | | | | 1.80 | | | | 1.86 | | | | 3,376 | |
29 Apr | | | 0.20 | | | | 0.20 | | | | 0.20 | | | | 17,400 | | | | 0.20 | | | | 0.20 | | | | 0.20 | | | | 31,291 | | | | 1.85 | | | | 1.85 | | | | 1.85 | | | | 245 | |
26 Apr | | | 0.20 | | | | 0.20 | | | | 0.20 | | | | 19,000 | | | | 0.21 | | | | 0.20 | | | | 0.20 | | | | 66,589 | | | | 2.00 | | | | 1.81 | | | | 1.95 | | | | 10,150 | |
25 Apr | | | 0.20 | | | | 0.20 | | | | 0.20 | | | | 10,856 | | | | 0.20 | | | | 0.20 | | | | 0.20 | | | | 65,626 | | | | 1.80 | | | | 1.80 | | | | 1.80 | | | | — | |
24 Apr | | | 0.20 | | | | 0.19 | | | | 0.20 | | | | 26,900 | | | | 0.20 | | | | 0.19 | | | | 0.20 | | | | 61,050 | | | | 1.80 | | | | 1.80 | | | | 1.80 | | | | — | |
23 Apr | | | — | | | | — | | | | — | | | | — | | | | 0.20 | | | | 0.18 | | | | 0.19 | | | | 73,051 | | | | 1.87 | | | | 1.80 | | | | 1.82 | | | | 36,876 | |
22 Apr | | | — | | | | — | | | | — | | | | — | | | | 0.20 | | | | 0.19 | | | | 0.19 | | | | 5,100 | | | | 1.90 | | | | 1.85 | | | | 1.85 | | | | 2,700 | |
19 Apr | | | — | | | | — | | | | — | | | | — | | | | 0.21 | | | | 0.19 | | | | 0.20 | | | | 33,020 | | | | 1.85 | | | | 1.85 | | | | 1.85 | | | | — | |
18 Apr | | | 0.21 | | | | 0.21 | | | | 0.21 | | | | 1,600 | | | | 0.21 | | | | 0.18 | | | | 0.19 | | | | 137,600 | | | | 1.85 | | | | 1.80 | | | | 1.80 | | | | 40,001 | |
17 Apr | | | 0.21 | | | | 0.21 | | | | 0.21 | | | | 500 | | | | 0.20 | | | | 0.19 | | | | 0.19 | | | | 12,377 | | | | 1.90 | | | | 1.80 | | | | 1.80 | | | | 28,345 | |
16 Apr | | | — | | | | — | | | | — | | | | — | | | | 0.20 | | | | 0.18 | | | | 0.20 | | | | 66,945 | | | | 2.00 | | | | 2.00 | | | | 2.00 | | | | 922 | |
15 Apr | | | 0.20 | | | | 0.20 | | | | 0.20 | | | | 4,150 | | | | 0.22 | | | | 0.19 | | | | 0.20 | | | | 69,646 | | | | 1.86 | | | | 1.80 | | | | 1.82 | | | | 38,000 | |
12 Apr | | | 0.22 | | | | 0.21 | | | | 0.22 | | | | 62,534 | | | | 0.22 | | | | 0.20 | | | | 0.21 | | | | 41,145 | | | | 2.20 | | | | 2.20 | | | | 2.20 | | | | — | |
11 Apr | | | 0.22 | | | | 0.22 | | | | 0.22 | | | | 28,513 | | | | 0.23 | | | | 0.20 | | | | 0.21 | | | | 42,868 | | | | 2.20 | | | | 1.99 | | | | 2.02 | | | | 618 | |
10 Apr | | | 0.23 | | | | 0.22 | | | | 0.23 | | | | 6,350 | | | | 0.25 | | | | 0.22 | | | | 0.23 | | | | 82,899 | | | | 1.99 | | | | 1.80 | | | | 1.86 | | | | 33,353 | |
9 Apr | | | 0.23 | | | | 0.22 | | | | 0.23 | | | | 58,485 | | | | 0.23 | | | | 0.20 | | | | 0.22 | | | | 15,147 | | | | 1.80 | | | | 1.80 | | | | 1.80 | | | | 10,000 | |
8 Apr | | | — | | | | — | | | | — | | | | — | | | | 0.22 | | | | 0.21 | | | | 0.21 | | | | 5,067 | | | | 2.15 | | | | 2.15 | | | | 2.15 | | | | — | |
30
The below table provides the average closing price and volume for the Common Shares for the previous twelve months on the TSX-V, NYSE MKT and JSE:
| | | | | | | | | | | | | | | | | | | | | | | | | | | | | | | | | | | | | | | | | | | | | | | | |
| | | TSX-V
ATL (previously ARQ) (in CAD) | | | NYSE MKT
ATL (previously ANO) (in USD) | | | JSE
ATL (previously ARQ) (in ZAR ) | |
| | | High
($) | | | Low
($) | | | Avg
($) | | | Volume | | | High($) | | | Low
($) | | | Avg
($) | | | Volume | | | High
(R) | | | Low
(R) | | | Avg
(R) | | | Volume | |
Apr-13 | | | 0.23 | | | | 0.19 | | | | 0.20 | | | | 310,988 | | | | 0.25 | | | | 0.18 | | | | 0.20 | | | | 1,199,336 | | | | 2.60 | | | | 1.80 | | | | 1.86 | | | | 264,042 | |
Mar-13 | | | 0.24 | | | | 0.18 | | | | 0.23 | | | | 294,904 | | | | 0.24 | | | | 0.16 | | | | 0.23 | | | | 1,478,866 | | | | 2.60 | | | | 1.80 | | | | 2.15 | | | | 552,055 | |
Feb-13 | | | 0.27 | | | | 0.17 | | | | 0.19 | | | | 1,028,205 | | | | 0.23 | | | | 0.16 | | | | 0.19 | | | | 3,984,993 | | | | 2.15 | | | | 1.54 | | | | 2.00 | | | | 688,260 | |
Jan-13 | | | 0.19 | | | | 0.14 | | | | 0.16 | | | | 110,965 | | | | 0.20 | | | | 0.15 | | | | 0.18 | | | | 3,976,061 | | | | 2.10 | | | | 1.45 | | | | 1.61 | | | | 369,931 | |
Dec-12 | | | 0.20 | | | | 0.14 | | | | 0.14 | | | | 314,704 | | | | 0.19 | | | | 0.12 | | | | 0.15 | | | | 3,529,136 | | | | 1.70 | | | | 1.15 | | | | 1.32 | | | | 151,651 | |
Nov-12 | | | 0.19 | | | | 0.14 | | | | 0.15 | | | | 321,708 | | | | 0.20 | | | | 0.11 | | | | 0.16 | | | | 919,643 | | | | 1.60 | | | | 1.20 | | | | 1.27 | | | | 160,634 | |
Oct-12 | | | 0.24 | | | | 0.14 | | | | 0.15 | | | | 215,511 | | | | 0.24 | | | | 0.15 | | | | 0.16 | | | | 804,536 | | | | 1.79 | | | | 1.38 | | | | 1.41 | | | | 276,947 | |
Sept-12 | | | 0.24 | | | | 0.13 | | | | 0.20 | | | | 615,152 | | | | 0.27 | | | | 0.12 | | | | 0.22 | | | | 6,331,460 | | | | 1.70 | | | | 1.37 | | | | 1.52 | | | | 429,064 | |
Aug-12 | | | 0.18 | | | | 0.15 | | | | 0.15 | | | | 330,920 | | | | 0.21 | | | | 0.14 | | | | 0.16 | | | | 746,161 | | | | 1.70 | | | | 1.20 | | | | 1.62 | | | | 1,128,177 | |
Jul-12 | | | 0.18 | | | | 0.12 | | | | 0.17 | | | | 141,895 | | | | 0.21 | | | | 0.14 | | | | 0,17 | | | | 964,907 | | | | 2.05 | | | | 1.35 | | | | 1.38 | | | | 234,322 | |
Jun-12 | | | 0.25 | | | | 0.19 | | | | 0.20 | | | | 144,741 | | | | 0.29 | | | | 0.16 | | | | 0.18 | | | | 1,267,110 | | | | 2.70 | | | | 1.70 | | | | 1.70 | | | | 426,062 | |
May-12 | | | 0.33 | | | | 0.20 | | | | 0.20 | | | | 63,992 | | | | 0.38 | | | | 0.21 | | | | 0.24 | | | | 1,962,078 | | | | 2.90 | | | | 2.10 | | | | 2.17 | | | | 491,378 | |
Apr-12 | | | 0.40 | | | | 0.25 | | | | 0.29 | | | | 196,821 | | | | 0.44 | | | | 0.11 | | | | 0.29 | | | | 3,145,943 | | | | 3.68 | | | | 2.70 | | | | 2.81 | | | | 899,362 | |
Mar-12 | | | 0.50 | | | | 0.37 | | | | 0.42 | | | | 145,081 | | | | 0.52 | | | | 0.40 | | | | 0.41 | | | | 1,611,682 | | | | 4.00 | | | | 3.30 | | | | 3.31 | | | | 603,708 | |
Feb-12 | | | 0.66 | | | | 0.44 | | | | 0.50 | | | | 381,027 | | | | 0.63 | | | | 0.44 | | | | 0.51 | | | | 2,277,201 | | | | 4.73 | | | | 3.89 | | | | 3.99 | | | | 785,266 | |
The below table provides the average closing price and volume for the Common Shares quarterly for the previous two years on the TSX-V, NYSE MKT and JSE:
| | | | | | | | | | | | | | | | | | | | | | | | | | | | | | | | | | | | | | | | | | | | | | | | |
| | | TSX-V
ATL (PREVIOUSLY ARQ) (IN CAD) | | | NYSE MKT
ATL (PREVIOUSLY ANO) (IN USD) | | | JSE
ATL (PREVIOUSLY ARQ) (IN ZAR ) | |
| | | High
($) | | | Low
($) | | | Avg
($) | | | Volume | | | High($) | | | Low
($) | | | Avg
($) | | | Volume | | | High
(R) | | | Low
(R) | | | Avg
(R) | | | Volume | |
Calendar 2011 | | | | | | | | | | | | | | | | | | | | | | | | | | | | | | | | | | | | | | | | | | | | | | | | |
First Quarter | | | 1.58 | | | | 0.91 | | | | 1.09 | | | | 2,955,381 | | | | 1.66 | | | | 0.93 | | | | 1.13 | | | | 21,133,516 | | | | 11.50 | | | | 7.01 | | | | 7.87 | | | | 2,004,419 | |
Second Quarter | | | 1.25 | | | | 0.58 | | | | 0.65 | | | | 2,701,173 | | | | 1.35 | | | | 0.59 | | | | 0.68 | | | | 24,459,222 | | | | 8.68 | | | | 4.50 | | | | 4.64 | | | | 2,430,448 | |
Third Quarter | | | 0.73 | | | | 0.48 | | | | 0.62 | | | | 1,761,687 | | | | 0.78 | | | | 0.42 | | | | 0.59 | | | | 10,672,991 | | | | 5.70 | | | | 3.50 | | | | 4.42 | | | | 1,772,344 | |
Fourth Quarter | | | 0.63 | | | | 0.33 | | | | 0.39 | | | | 943,369 | | | | 0.67 | | | | 0.31 | | | | 0.39 | | | | 6,246,992 | | | | 5.00 | | | | 3.30 | | | | 3.72 | | | | 697,065 | |
Calendar 2010 | | | | | | | | | | | | | | | | | | | | | | | | | | | | | | | | | | | | | | | | | | | | | | | | |
First Quarter | | | 1.65 | | | | 0.92 | | | | 1.54 | | | | 5,054,515 | | | | 1.56 | | | | 0.83 | | | | 1.50 | | | | 28,192,280 | | | | 12.00 | | | | 6.25 | | | | 11.05 | | | | 1,087,172 | |
Second Quarter | | | 1.80 | | | | 1.07 | | | | 1.09 | | | | 4,030,067 | | | | 1.78 | | | | 1.00 | | | | 1.03 | | | | 28,920,366 | | | | 13.20 | | | | 8.00 | | | | 8.36 | | | | 1,542,686 | |
Third Quarter | | | 1.21 | | | | 0.88 | | | | 0.95 | | | | 2,578,830 | | | | 1.24 | | | | 0.82 | | | | 0.91 | | | | 15,987,136 | | | | 9.25 | | | | 6.00 | | | | 6.70 | | | | 2,405,711 | |
Fourth Quarter | | | 1.66 | | | | 0.95 | | | | 1.56 | | | | 6,511,171 | | | | 1.69 | | | | 0.92 | | | | 1.57 | | | | 38,419,610 | | | | 10.62 | | | | 6.71 | | | | 10.39 | | | | 2,501,929 | |
31
Dividend Policy
The Company has not declared or paid any dividends or distributions on its outstanding Common Shares since its incorporation and does not anticipate that it will do so in the foreseeable future. All funds of the Company are being retained for the exploration, development and expansion of its mineral projects and the repayment of debt.
Expenses of Transaction
| | | | |
Party | | ZAR | |
Tax Advisory – KPMG | | | 2,055,865 | |
Legal fees | | | | |
Cliffe Dekker Hofmeyr | | | 2,890,286 | |
Maboku Mangena | | | 7,500 | |
McCarthy Tétrault | | | 2,941,064 | |
Auditors and reporting accountant – KPMG | | | 510,900 | |
Independent technical advisers | | | | |
Minxcon | | | 968,554 | |
Kai Batla | | | 277,950 | |
AMD Consulting | | | 146,319 | |
Ezendalo | | | 96,900 | |
PSG | | | 115,800 | |
Advisory – Macquarie First South Capital | | | 6,500,000 | |
Transfer Agent | | | 279,456 | |
JSE Limited | | | | |
– listing fees | | | 108,918 | |
– documentation inspection fees and ruling request fees | | | 82,017 | |
Printing and Postage | | | 500,000 | |
Tax expenses – SARS | | | 3,000,000 | |
Share certificates – INCE | | | 14,248 | |
Press releases | | | | |
CNW Group | | | 119,983 | |
INCE | | | 298,706 | |
Other – Take Over Regulation Panel | | | 39,243 | |
| | | | |
Total | | | 20,953,709 | |
| | | | |
The expenses include the preliminary expenses incurred by the Company within the three years preceding the date of the Information Circular.
Tax Consequences
The Company does not anticipate that the Asset Sale, the Debt Refinancing Transactions or the RPM Share Subscription, will have any material adverse tax consequences for the Company or for Shareholders. The Asset Sale and Debt Refinancing Transactions will be completed pursuant to South African income tax laws and the principles enunciated therein, in as far as such principles are applicable and as such will bear the normal tax consequences for Atlatsa and its subsidiaries. Accordingly, the respective companies involved in the transaction will account for the normal tax consequences in accordance with these principles. The transaction does not involve any distributions/dividends declared to the Atlatsa shareholders, and as such there are not tax consequences to disinterested Shareholders.
32
Securities held by Directors, Officers, Insiders and associates and affiliates
The following table sets out the information with respect to the ownership of the Company’s securities by its directors and officers:
| | | | | | | | |
Name | | Office | | Common Shares | | Options | | B3 Preference
Shares |
Independent | | | | | | | | |
Fikile Tebogo De Buck | | Non-executive director | | Nil | | 100,000 | | Nil |
Anu Dhir | | Non-executive director | | Nil | | 270,000 | | Nil |
Patrick Cooke | | Non-executive director | | 3,500 | | Nil | | Nil |
Rizelle Sampson | | Independent non-executive director | | Nil | | 150,000 | | Nil |
Non-Independent | | | | | | | | |
Harold Motaung | | Director and Chief Executive Officer | | 19,764,462(1)(3) | | 510,000 | | 18,972,000(1) |
Tumelo Motsisi | | Director and Chair | | 28,535,143(2)(4) | | 1,625,000 | | 26,784,000(2) |
Executive officers | | | | | | | | |
Joel Kesler | | Chief Commercial Officer | | 959,361 | | 1,095,000 | | Nil |
Bava Reddy | | Officer: Mineral Strategy and Exploration | | Nil | | 1,120,000 | | Nil |
De Wet Schutte | | Chief Financial Officer | | Nil | | 500,000 | | Nil |
Notes:
| (1) | Indirect holdings being 170 of the 1,000 ordinary shares in the issued and outstanding share capital of Atlatsa Holdings, multiplied by the number of Common Shares (115,496,438) held by the Pelawan Trust. |
| (2) | Indirect holdings being 240 of the 1,000 ordinary shares in the issued and outstanding share capital of Atlatsa Holdings, multiplied by the number of Common Shares (115,496,438) held by the Pelawan Trust. |
| (3) | Direct holding is 815,998 of the Common Shares of the Company. |
| (4) | Direct holding is 130,068 of Common Shares of the Company. |
Please see “Record Date, Voting Securities and Principal Holdings of Voting Securities” for information in respect of the ownership of the Company’s securities by its 5% Shareholders.
Each of the directors and officers of the Company, and each of the insiders of the Company listed under the heading “Record Date, Voting Securities and Principal Holdings of Voting Securities” intends, to the extent that they are considered Disinterested Shareholders, to vote their Common Shares in favour of each of the resolutions described herein.
Other than as described in this Information Circular, to the knowledge of the Board of Directors, no (i) associate or affiliate of an insider of the Company, (ii) associate or affiliate of the Company, (iii) insider of the issuer or (iv) person acting jointly or in concert with the Company, beneficially owns, or exercises control or direction over, the Common Shares of the Company.
The information relating to the ownership of the Company’s securities by directors, officers and insiders in this Information Circular is based on the insider reports available atwww.sedi.ca as of the Record Date.
Directors’ Interests in Transactions
Tumelo Motsisi, a director and Chairman of the Company, and Harold Motaung, a director and Chief Executive Officer of the Company, hold a 14.1% and 9.8% interest, respectively, in the issued and outstanding share capital of Atlatsa Holdings, and are indirect beneficial owners of 57.2% of the issued and outstanding Common Shares in the capital of the Company.
33
Other than as described in this Information Circular, the members of the Board of Directors of Atlatsa, including any director who has resigned from Atlatsa in the previous 18 months, have no material beneficial interest, whether direct or indirect, in any transaction effected by Atlatsa during the current or immediately preceding financial year or in an earlier year and which remains outstanding or unperformed in any respect.
Commitments to Acquire Securities
Other than as described in this Information Circular, there are no agreements, commitments or understandings made by the Company, or by any (i) insider of the Company or associate or affiliate thereof, (ii) associate or affiliate of the Company or (iii) by any person acting jointly or in concert with the Company.
Prior Share Transactions and Distributions
There have been no transactions in the previous twelve months from the date of this Information Circular involving the purchase or sale by the Company of its securities. There have been no distributions of securities by the Company in the past five years.
Director and Senior Executive Officer Compensation
The following table sets out, for each person who was a director and/or a senior executive officer of the Company during the fiscal year ended December 31, 2012, the remuneration and benefits paid to each such director and/or officer, individually and in the aggregate.
Non-Equity incentive plan compensation
| | | | | | | | | | | | | | | | | | | | | | | | |
Director/Officer | | Salary or
fees
earned(1)(6)
($) | | | Option
based
awards(2)
($) | | | Non-Equity
incentive plan
compensation(10)
($) | | | Pension,
provident
and medical
value
($) | | | All Other
Compensation(3)
($) | | | Total
Compensation
($) | |
Directors | | | | | | | | | | | | | | | | | | | | | | | | |
Tumelo Motsisi(5) Director Executive Chairman | | | 428,297 | | | | | | | | | | | | 97,315 | | | | 21,311 | | | | 546,923 | |
Harold Motaung(4) (5) Director and CEO | | | 436,526 | | | | | | | | | | | | 101,527 | | | | 29,256 | | | | 567,309 | |
Anu Dhir | | | 89,083 | (6) | | | — | | | | — | | | | — | | | | — | | | | 89,083 | |
Fikile Tebogo De Buck | | | 74,500 | (6) | | | — | | | | — | | | | — | | | | — | | | | 74,500 | |
Wayne Kirk(7) | | | — | (6) | | | — | | | | — | | | | — | | | | — | | | | — | |
Sipho Nkosi(8) | | | 21,417 | (6) | | | — | | | | — | | | | — | | | | — | | | | 21,417 | |
Rizelle Sampson | | | 56,000 | (6) | | | — | | | | — | | | | — | | | | — | | | | 56,000 | |
Patrick Cooke(11) | |
| 80,917
| (6)
| | | | | | | | | | | | | | | | | | | 80,917 | |
Executive Officers | | | | | | | | | | | | | | | | | | | | | | | | |
Joel Kesler Chief Commercial Officer | | | 326,510 | | | | | | | | | | | | 79,501 | | | | 36,721 | | | | 442,732 | |
Bava Reddy Executive: Mineral Strategy and Exploration | | | 219,589 | | | | | | | | | | | | 58,081 | | | | 22,336 | | | | 300,006 | |
Directors | | | | | | | | | | | | | | | | | | | | | | | | |
DeWet Schutte (9) CFO | | | 362,914 | | | | | | | | | | | | 81,527 | | | | 3,587 | | | | 448,028 | |
| | | | | | | | | | | | | | | | | | | | | | | | |
Total: | | | 1,732,839 | | | | — | | | | — | | | | 336,424 | | | | 109,624 | | | | 2,178,887 | |
| | | | | | | | | | | | | | | | | | | | | | | | |
34
Notes:
| (1) | Compensation of certain of the Company’s South African executives and directors is payable in Canadian dollars but is paid to each executive in ZAR at an exchange rate of 1 CAD = ZAR8.20, being the average monthly rate in effect for the year ended December 31, 2012. |
| (2) | The Options were granted pursuant to the Stock Option Plan. For compensation purposes, the Black-Scholes option valuation model has been used to determine the fair value on the date of grant. The Black-Scholes option valuation is determined using the expected life of the stock option, expected volatility of the Company’s common share price, expected dividend yield, and risk-free interest rate. No Options were granted to directors in 2012. |
| (3) | This amount includes travel allowance, cell phone allowance, expense reimbursement and the Company’s contribution to medical aid and the unemployment insurance fund. |
| (4) | Mr. Motaung was appointed as CEO in April 2011. |
| (5) | The directors who are also executive officers do not receive any compensation in their capacity as directors of the Company. |
| (6) | Includes all fees awarded, earned, paid or payable in cash for services as a director, including annual retainer fees, committee, chair and meeting fees. |
| (7) | Mr. Kirk resigned as a director of the Company effective February 1, 2012. |
| (8) | Mr. Nkosi did not stand for re-election at the annual general meeting of the Company held July 17, 2012. |
| (9) | Mr. Schutte was appointed Acting CFO in December 2009 and was appointed as CFO with effect from May 1, 2010. |
| (10) | There were no non-equity incentive plan compensation or other bonus, performance related payments, commissions, gain or profit-sharing arrangements granted or made in 2012. |
| (11) | Mr. Cooke was appointed as a director in February 2012. |
Option-based Awards
The following table sets out all Option-based awards outstanding as at December 31, 2012 for each of the following directors and senior executive officers.
| | | | | | | | | | | | | | | | |
Director | | Number of securities
underlying unexercised
options (#) | | | Option exercise
price ($) | | | Option expiration
date | | | Value of
unexercised in-
the-money
options(1)
($) | |
Tumelo Motsisi | |
| 525,000
800,000 |
| |
| 1.29
0.84 |
| |
| June 30, 2013
November 30, 2016 |
| |
| Nil
Nil |
|
Harold Motaung | | | 510,000 | | | | 0.84 | | | | November 30, 2016 | | | | Nil | |
Sipho Nkosi(3) | | | — | | | | — | | | | — | | | | — | |
Rizelle Sampson | | | 150,000 | | | | 0.84 | | | | November 30, 2016 | | | | Nil | |
Anu Dhir | |
| 120,000
150,000 |
| |
| 1.29
0.84 |
| |
| June 25, 2013
November 30, 2016 |
| |
| Nil
Nil |
|
Fikile De Buck | | | 100,000 | | | | 0.84 | | | | November 30, 2016 | | | | Nil | |
Patrick Cooke | | | — | | | | — | | | | — | | | | — | |
Wayne Kirk(2) | | | — | | | | — | | | | — | | | | — | |
Joel Kesler | |
| 525,000
570,000 |
| |
| 1,29
0.84 |
| |
| June 30, 2013
November 30, 2016 |
| |
| Nil
Nil |
|
Bava Reddy | | | 550,000 | | | | 0.96 | | | | June 25, 2014 | | | | Nil | |
| | | 570,000 | | | | 0.84 | | | | November 30, 2016 | | | | Nil | |
DeWet Schutte | | | 500,000 | | | | 1.61 | | | | May 1,2017 | | | | Nil | |
35
Notes:
| (1) | The value at December 31, 2012 is calculated by determining the difference between the closing price of the Company’s common shares at December 31, 2012 ($0.14) underlying the option on the TSX-V and the exercise price of the options. |
| (2) | Mr. Kirk resigned as a director of the Company effective February 1, 2012. |
| (3) | Mr. Nkosi did not stand for re-election at the annual general meeting of the Company held on July 17, 2012. |
None of the remuneration receivable by any of the directors will be varied as a result of the transaction.
No Options have been exercised for the period commencing January 1, 2012 until the Record Date.
DIRECTORS, SENIOR MANAGEMENT AND EMPLOYEES
The disclosure in this section is given for purposes of the JSE Listing Requirements relating to the Restructure Plan.
Directors and Senior Management
Name and Occupation
The information as to the number of common shares beneficially owned, controlled or directed shown below is not within the knowledge of the management of the Company and has been furnished by the respective nominees as reported in their filings at http://www.sedar.com.
The following table states the name, province or state, and country of residence of each of the directors and executive officers of the Company as at March 28, 2013, the positions and offices presently held by them and the period or periods of time during which each has served as a directors of the Company. Each director’s terms of office expires at the next annual general meeting of the shareholders of the Company.
| | | | | | | | | | | | |
Name, position with the Company and province or
state and country of residence | | Period(s) as a Director or
Officer of the Company | | Common shares
beneficially owned,
controlled or
directed(1) (2) | | | B3 Preference
shares(1) (3) | | | Business address |
Fikile Tebogo De Buck(6) (7) (9) Non-Executive Director Gauteng | | Since November 2008 | | | Nil | | | | | | | 4th Floor, 82 Grayston Drive, Sandton, 2146, South Africa |
Anu Dhir(6) (8) (9) (10) Non-Executive Director Ontario, Canada | | Since July 2008 | | | Nil | | | | | | | 4th Floor, 82 Grayston Drive, Sandton, 2146, South Africa |
Harold Motaung Director, CEO Gauteng, South Africa | | Director since September 2004 Chief Executive Officer since April 2011 | | | 19,764,462 | (4) | | | 18,972,000 | (4) | | 4th Floor, 82 Grayston Drive, Sandton, 2146, South Africa |
Tumelo Motsisi (8) (10) Director and Chairman Gauteng, South Africa | | Since September 2004 | | | 28,535,143 | (5) | | | 26,784,000 | (5) | | 4th Floor, 82 Grayston Drive, Sandton, 2146, South Africa |
36
| | | | | | | | | | | | |
Name, position with the Company and province or
state and country of residence | | Period(s) as a Director or Officer of the Company | | Common shares
beneficially owned,
controlled or
directed(1) (2) | | | B3 Preference
shares(1) (3) | | | Business address |
Rizelle Sampson(9) Non-Executive Director Gauteng, South Africa | | Since September 2004 | | | Nil | | | | | | | 4th Floor, 82 Grayston Drive, Sandton, 2146, South Africa |
Patrick Cooke(6) Non-Executive Director Gauteng, South Africa | | Since Feb 2012 | | | Nil | | | | | | | 4th Floor, 82 Grayston Drive, Sandton, 2146, South Africa |
Joel Kesler Chief Commercial Officer Gauteng, South Africa | | Since March 2010 | | | 959,361 | | | | | | | 4th Floor, 82 Grayston Drive, Sandton, 2146, South Africa |
De Wet Schutte CFO Gauteng, South Africa | | Since May 2010 | | | Nil | | | | | | | 4th Floor, 82 Grayston Drive, Sandton, 2146, South Africa |
Lerato Matlosa Company Secretary | | 7 January 2013 | | | Nil | | | | Nil | | | 4th Floor, 82 Grayston Drive, Sandton, 2146, South Africa |
Bava Reddy Executive: Mineral Strategy and Exploration | | 1 October 2008 | | | Nil | | | | Nil | | | 4th Floor, 82 Grayston Drive, Sandton, 2146, South Africa |
Notes:
| (1) | The information as to number of common shares beneficially owned controlled or directed is not within the knowledge of the management of the Company and has been furnished by the respective nominees as reported in their filings atwww.sedi.ca. |
| (2) | Directors personally own or control a total of 49,258,966 common shares which represent approximately 24.4% of the current outstanding shares. The directors also hold 9,431,000 options (see “Incentive Plan Awards – Option-based Awards”). |
| (3) | Directors indirectly own or control a total of 45,756,000 of the total 111,600,000 B3 preference shares which represent approximately 22.7% of the current outstanding shares on a as converted basis. |
| (4) | Indirect holdings being 170 of the 1,000 ordinary shares in the issued and outstanding share capital of Atlatsa Holdings (Proprietary) Limited, multiplied by the number of common shares of Atlatsa (115,496,438) held by the Pelawan Trust and direct holdings of 130,068 shares. |
| (5) | Indirect holdings being 240 of the 1,000 ordinary shares in the issued and outstanding share capital of Atlatsa Holdings (Proprietary) Limited, multiplied by the number of common shares of Atlatsa (115,496,438) held by the Pelawan Trust and direct holdings of 815,998 shares. |
| (6) | Member of the Audit and Risk Committee. |
| (7) | Member of the Nominating and Governance Committee. |
| (8) | Member of the Compensation Committee. |
| (9) | Member of the Sustainable Development and Health and Safety Committee. |
| (10) | Member of the Investment Committee. |
| (11) | Member of the Special Committee. |
Additional details including the principal occupation for the past five years of the above directors are as follows:
FIKILE TEBOGO DE BUCK, BA, FCCA – Director
Ms. De Buck is a Fellow of the Association of Chartered Certified Accountants FCCA (UK) and has extensive experience in business operations and financial affairs with companies in the mining sector. She holds a Bachelor of Arts degree in Economics and Accounting from the University of Swaziland. Ms. De Buck is currently a non-executive director and the lead independent director of Harmony Gold Mining Company Ltd and is a member of various board committees of Harmony including the Audit Committee. She is also a non-executive director of Clientele Limited. She has also served in various positions at the Council for Medical Schemes in South Africa.
37
Ms. De Buck is, or was within the past 5 years, an officer and/or director of the following public companies:
| | | | | | |
Company | | Positions Held | | From | | To |
| Atlatsa Resources Corporation | | Director | | November 2008 | | Present |
| Harmony Gold Company Limited | | Director | | April 2006 | | Present |
| Clientele Limited | | Director | | November 2012 | | Present |
| Clientele Life | | Director | | November 2012 | | Present |
ANU DHIR, BA, JD – Director
Anu Dhir holds a Bachelor of Arts degree from the University of Toronto and a law degree (Juris Doctor) from Quinnipiac University, Connecticut, United States. Ms. Dhir has extensive experience in international business, operations and legal affairs in private equity and publicly-held companies in the mining, oil and gas and technology sectors. Ms. Dhir served as Vice President, Corporate Development and Company Secretary at Katanga Mining Limited, a TSX-listed company and is currently Managing Director of Miniqs Limited, a private group primarily interested in resource projects that have the capability to grow into major producing operations. Ms. Dhir is a non-executive director of Great Basin Gold Limited, a TSX-listed company engaged in gold mining and Frontier Rare Earths Limited, a TSX-listed company that is focused on rare earth elements.
During the past five years, Ms. Dhir is, or has been, a director of the following public companies:
| | | | | | |
Company | | Positions Held | | From | | To |
| Atlatsa Resources Corporation | | Director | | July 2008 | | Present |
| Katanga Mining Limited | | Director Vice President, Corporate Development | | March 2004 January 2006 | | November 2004 October 2009 |
| Compass Asset Management | | Director | | June 2009 | | December 2012 |
| Miniqs Limited | | Director and Officer | | March 2010 | | Present |
| Frontier Rare Earths Limited | | Director | | November 2010 | | Present |
| Great Basin Gold Limited | | Director | | May 2011 | | Present |
A. H. C. HAROLD MOTAUNG, BSc, MBA – CEO and Director
Harold Motaung was previously employed at the Free State and Vaal River operations of Anglo American Corporation of South
Africa Limited for six years as a mining engineer and as a production supervisor. Mr. Motaung then moved to the South African Government’s Department of Minerals and Energy (DME) as a director within the Mine Inspectorate. As a Deputy Chief Inspector, he was responsible for implementing the Mine, Health and Safety Act. Subsequently he was appointed Chief Director within the Mine Inspectorate. His portfolio included the gold, platinum and coal regions of South Africa.
In Mr. Motaung’s capacity as a Chief Director of the Mine Inspectorate, he was appointed on numerous boards of government–associated institutions including the National Nuclear Reactor, the Deep Mining Board and the Mining Qualifications Authority. Mr. Motaung also chaired the Mines Research Board, which administered a mining safety fund. Mr. Motaung also represented the South African government in a number of international and bi-national engagements with foreign countries, and was a member of the DME executive team responsible for the briefs and presentations at the Parliamentary Portfolio Committee on the status of minerals and energy within the country, which culminated in the enactment of the Minerals Development Act.
Mr. Motaung left the DME to establish a mining and geological consultancy, African Minerals Professionals (Pty) Limited. Mr. Motaung has been a director of Atlatsa since September 2004 and is not a director of any other public companies. Mr. Motaung is a founding member of Atlatsa Holdings, the controlling shareholder of Atlatsa. Recently he was appointed and served on the board of Mintek as the non-executive chairman.
Mr. Motaung has been a director of the Company since September 2004, and the CEO of the Company since April 2011.
38
During the past five years, Mr. Motaung is, or has been, a director of the following public companies:
| | | | | | |
Company | | Positions Held | | From | | To |
| Atlatsa Resources Corporation | | Director | | September 2008 | | Present |
TUMELO M. MOTSISI, BA, LLM, MBA – Executive Chairman and Director
Tumelo Motsisi is a prominent South African businessperson with experience in the South African financial services, mining and energy sectors. Between 1994 and 1998 he was employed first as a senior manager and then as a director within the Negotiated Benefits Consultants division of Alexander Forbes, a South African financial services company.
In 1998 he established Kopano Ke Matla Investment Company, the investment arm of South Africa’s largest trade union.
federation, the Congress of South African Trade Unions. He was subsequently appointed as the CEO of Kopano Ke Matla. Mr. Motsisi also served as Executive Chairperson of Prosperity Holdings, a financial services company established between Kopano Ke Matla, NBC Financial Services and Peregrine Holdings. Mr. Motsisi is a member and director of several South African companies. Mr. Motsisi is a founding member of Atlatsa Holdings, the controlling shareholder of Atlatsa. Mr. Motsisi has been a director of Atlatsa since September 2004 and is not a director of any other public companies.
During the past five years, Mr. Motsisi is, or has been, a director of the following public companies:
| | | | | | |
Company | | Positions Held | | From | | To |
| Atlatsa Resources Corporation | | Director | | September 2008 | | Present |
RIZELLE M. SAMPSON, H. Dip Education – Director
Ms. Sampson is a South African citizen and holds a Certificate in Corporate Finance from the University of London (School of Economics), a Certificate in Telecommunications Policy, Regulation and Management from the University of Witwatersrand and a Higher Diploma in Education from the University of the Western Cape.
Following positions as a Portfolio Administrator (Institutional Clients) at Investec Asset Managers, Chief of Staff at the Ministry of Communications and Manager (Office of the CEO) at Sentech Ltd, she co-founded African Footprint Investment Holdings (Pty) Ltd (“AFIH”), an investment holding company that is mainly black woman owned and managed. Ms. Sampson represents AFIH on the board of Tellumat (Pty) Ltd. She is also a trustee of the Sentech Educational Fund Advisory Board and a non-executive director of IPSA Group Plc.
During the past five years, Ms. Sampson is, or has been a director of the following public companies:
| | | | | | |
Company | | Positions Held | | From | | To |
| Atlatsa Resources Corporation | | Director | | September 2008 | | Present |
Independent Power Southern Africa (IPSA) Group PLC | | Director | | January 2009 | | Present |
| Diesel Power Open Cast Mining | | Director | | June 2010 | | Resigned in 2012 |
PATRICK COOKE, B.COM (WITS), CA (SA) – Director
Patrick Cooke has over 35 years’ professional experience as a chartered accountant and management consultant. Mr. Cooke was responsible for listing two companies on the main board of the JSE and was the financial director of a third JSE-listed company. His industry experience is wide, having been involved in mineral information technology, wholesale fast moving consumer goods, financial and professional services companies. He was appointed a non-executive director of Sallies Limited in October 2009 and, with effect from February 1, 2010, was appointed Financial Director, Chief Operating Officer and Acting Chief Executive Officer. He resigned from all positions at Sallies Limited with effect from January 2012.
39
During the past five years, Mr. Cooke is, or has been a director of the following public companies:
| | | | | | |
Company | | Positions Held | | From | | To |
| Atlatsa Resources Corporation | | Director | | February 2012 | | Present |
| Great Basin Gold Limited | | Director | | April 2006 | | Present |
| Sallies Limited | | Director | | August 2009 | | December 2011 |
| Pangea Diamondfields Limited | | Director | | January 2006 | | December 2008 |
JOEL KESLER, B.COM, LLB (CUM LAUDE) UCT – Chief Commercial Officer
Joel Kesler is a South African qualified lawyer with significant experience in mining finance business and corporate development. He currently serves on Atlatsa’s Chief Commercial Officer and is responsible for the Company’s corporate and business strategy, corporate finance and corporate communications. He also serves as corporate secretary to the Company. Mr. Kesler is not a director of any public companies.
DEWET SCHUTTE, B.COM (HONS), CA (SA) – CFO
De Wet Schutte is a chartered accountant with significant experience in mining, corporate finance and business development. Mr. Schutte previously held executive positions at Renova Investments, Harmony Gold Mining Ltd. and Mittal Steel, with responsibilities covering corporate transactions, project development and financial reporting in a listed environment. Mr. Schutte is not a director of any public companies.
BAVA REDDY, BSc. (Hons), GDE, Pr. Sci. Nat. – Executive: Mineral Strategy and Exploration
Bava Reddy is a geologist by training with more than 17 years experience in the South African Minerals Industry. Mr. Reddy held a number of positions in the Mineral Resources Management field at AngloGold and Harmony Gold Mining Limited. He was the General Manager at Harmony Gold’s Target Mine before joining Atlatsa Resources. He is responsible for all Technical and Mineral Resource Development aspects of Atlatsa’s Exploration and Mining Projects. Mr. Reddy is not a director of any public companies.
CORPORATE GOVERNANCE AND BOARD PRACTICES
The disclosure in this section is given for purposes of the JSE Listing Requirements relating to the Restructure Plan.
There are no written contracts between the Company and any independent non-executive directors which are appointed to the Board.
Directors are considered to be independent if they have no direct or indirect material relationship with the Company. A “material relationship” is a relationship which could, in the view of the Company’s Board of Directors, be reasonably expected to interfere with the exercise of a director’s independent judgment. Examples of such material relationships include employment relationships, officer positions, and recent employment by the auditors and like matters. The majority of the directors are independent directors. The Company’s Corporate Governance Policies and Procedures Manual, which governs the conduct of the Board of Directors, is available on the Company’s website at http://www.atlatsa.com. Information on the Company’s website is not a part of this Information Circular.
The Canadian Securities Administrators’ corporate governance guidance suggests that independent directors hold regularly scheduled meetings at which non-independent directors and members of management are not in attendance. The Board believes it is important that the Board of Directors regularly meet without management of the Company, but has also determined that open and candid discussion among independent directors is not necessarily inhibited by the presence of the non-independent directors and their exclusion from such meetings is not always warranted. No formal meeting of the independent directors were held during 2012.
The Board currently does not have an independent Chair, but has appointed a lead independent director. The Board facilitates its independent supervision over management in several ways including the holding of regular board meetings and committee meetings, informal discussions among independent directors and management and by retaining
40
independent consultants where it deems necessary. With the exception of the Investment Committee, each of the standing board committees is also solely comprised of independent directors. Independent supervision is also achieved by the formation of special committees of the independent directors to oversee any matters in which non-independent directors who are members of management may have an interest. In addition, the Board of Directors has direct access to the Company’s external auditors, legal counsel and to any of the Company’s officers.
The independent members of the Board of Directors of the Company for Fiscal 2012 were Fikile De Buck, Anu Dhir, Wayne Kirk (resigned January 31, 2012), Sipho Nkosi (resigned July 2012), Rizelle Sampson and Patrick Cooke (appointed February 1, 2012).
The non-independent directors for Fiscal 2012 were Harold Motaung (President and CEO) and Tumelo Motsisi (Chairman of the Board).
The following table sets forth the record of attendance of board and committee meetings by directors for the 12 months ended December 31, 2012.
| | | | | | | | | | |
Director | | Board
Meetings | | Audit
committee | | Nominating and
Governance
Committee | | Compensation
Committee | | Sustainable
Development
and Health and
Safety Committee |
| Anu Dhir (3)(4)(5)(10)(11)(13) | | 6 of 6 | | 4 of 4 | | Not Applicable | | 3 of 3 | | 3 of 3 |
| Fikile De Buck (1)(5)(6)(10)(11) | | 5 of 6 | | 4 of 4 | | 3 of 3 | | Not Applicable | | 3 of 3 |
| Harold Motaung | | 6 of 6 | | Not Applicable | | Not Applicable | | Not Applicable | | Not Applicable |
| Tumelo Motsisi(7) | | 6 of 6 | | Not Applicable | | Not Applicable | | Not Applicable | | Not Applicable |
| Sipho Nkosi(3) (6) | | 2 of 6 | | Not Applicable | | 1 of 3 | | 1 of 3 | | Not Applicable |
| Rizelle Sampson(8) | | 5 of 6 | | Not Applicable | | Not Applicable | | Not Applicable | | 3 of 3 |
| Partrick Cooke(2)(3)(5)(6)(9(12) | | 6 of 6 | | 4 of 4 | | 3 of 3 | | 3 of 3 | | Not Applicable |
Notes:
| (1) | Audit Committee Chairperson. |
| (2) | Nominating and Governance Committee Chairperson. |
| (3) | Member of the Compensation Committee. |
| (4) | Compensation Committee Chairperson. |
| (5) | Member of the Audit Committee. |
| (6) | Member of the Nominating and Governance Committee. |
| (7) | Chairperson of the Atlatsa Board of Directors. |
| (8) | Chairperson of the Sustainable Development and Health and Safety Committee. |
| (9) | Chairperson of the Special Committee. |
| (10) | Member of the Special Committee. |
| (11) | Member of the Sustainable Development and Health and Safety Committee. |
| (12) | Member of the Investment Committee. |
| (13) | Chairperson of the Investment Committee. |
| (14) | Lead independent Director. |
| 2. | Orientation and Continuing Education |
The Company has traditionally retained experienced mining people as directors and hence the orientation needed is minimized. When new directors are appointed, they are acquainted with the Company’s mineral projects and the expectations of directors. Board meetings generally include presentations by the Company’s senior management and project staff in order to give the directors full insight into the Company’s operations.
| 3. | Ethical Business Conduct |
The Board has adopted a formal ethics that applies to all directors, officers and employees of the Company, included in Section B-3 to the Company’s Corporate Governance Policies and Procedures Manual, which is available for download
41
from the Company’s website (www.atlatsa.com). Information on the Company’s website is not a part of this Information Circular. The Board also believes that the fiduciary duties placed on individual directors by the Company’s governing corporate legislation and the common law and the restrictions placed by applicable corporate legislation on an individual directors’ participation in decisions of the Board in which the director has an interest have been sufficient to ensure that the Board operates independently of management and in the best interests of the Company.
Compliance with the Code of Ethics is monitored by the Nomination and Governance Committee. No departures from the code were identified by the Nominating and Governance Committee during Fiscal 2012. The Board has a number of policies in place designed to ensure that directors exercise independent judgment in matters where a director or officer has a material interest. In those circumstances, the relevant director and officer must declare their interest and in the case of a director, refrain from voting, and the Nominating and Governance Committee considers any interested party transactions in advance of their consideration by the Board.
| 4. | Nomination of Directors |
The Board considers its size each year when it considers the directors to recommend to the Shareholders for election at the annual meeting of Shareholders, taking into account the number required to carry out the Board’s duties effectively and to maintain a diversity of views and experience. The Board has a Nominating and Governance Committee, though the full Board retains responsibility for the recommendation of directors to the Shareholders for election.
The Board recognises the lack of mining experience of the Board and is currently in conjunction with completing the refinancing exercise, searching for two suitable persons to be appointed as directors
The Compensation Committee considers compensation for the directors and senior executive officers and submits its compensation recommendations to the Board for approval.
Our Company Secretary is responsible for administering the proceedings and affairs of the directorate, the Company and, where appropriate, owners of securities in the Company, in accordance with the relevant laws. The Company Secretary is available to assist all our directors with advice on their responsibilities, their professional development and any other relevant assistance they may require. Our non-executive directors can, if necessary, obtain independent professional advice at the Company’s expense.
The Board has assessed the competence, qualifications and experience of the Company Secretary, as required in terms of Section 3.84 (i) of the JSE Listings Requirements and TSXV and has agreed that the Company Secretary is sufficiently qualified, competent and experienced to hold this position. The Board made their assessment during a closed session, which was based on the role and responsibilities the Company Secretary currently holds and executes within the organisation.
The Company Secretary fulfils no executive management function and is not a director. Therefore, the Board is satisfied that the Company Secretary maintains an arm’s length relationship with the executive team, the Board and individual directors in terms of Section 3.84(j) of the JSE Listings Requirements.
The Board has not adopted descriptions for the positions of Board chairman, and the chairman for each of the board committees, but, as at the date of this Information Circular, the roles and responsibilities for the board and for each of the board committees has been described in the Company’s Corporate Governance Policies and Procedures Manual dated June 1, 2010, which is available on the Company’s website at www.atlatsa.com.
42
Audit and Risk Committee
The Audit and Risk Committee is an important element of the Board’s system of monitoring and control. The Audit Committee meets at least four times a year. All the members of the Audit Committee are independent non-executive directors, financially literate and have extensive Audit Committee experience. Current members of the Audit Committee are Fikile Tebogo De Buck (chair), Anu Dhir and Patrick Cooke. Wayne Kirk resigned from being a member of the Audit Committee on January 31, 2012. Patrick Cooke was appointed to serve on the Audit Committee as from February 1, 2012.
The Chairman of the Board, the CEO, CFO, the internal auditors (outsourced function) and external auditors attend Audit Committee meetings on invitation.
The Audit Committee has been established primarily to assist the Board in overseeing:
| | • | | the quality and integrity of the Company’s financial statements (including group financial statements) and public disclosures in respect thereof; |
| | • | | the qualification and independence of the external auditors for Atlatsa; |
| | • | | the scope and effectiveness of the external audit function for Atlatsa; |
| | • | | the effectiveness of the Company’s internal controls; |
| | • | | compliance with legal and regulatory requirements to the extent that it might have an impact on financial |
In addition to the responsibilities above, the Atlatsa Board has appointed the Audit and Risk Committee to perform on behalf of all South African subsidiaries of Atlatsa, the functions listed in section 94(7) of the South African Companies Act.
The Board has delegated extensive powers in accordance with the South African Companies Act, King III and US corporate governance requirements to the Audit and Risk Committee to perform the above functions. In line with these requirements, the Audit and Risk Committee has, among other things, determined which categories of non-audit services provided by the external auditors should be pre-approved by the Audit Committee.
The Audit Committee meets regularly with the Company’s external auditors and managers to consider risk assessment and management, to review the audit plans of the external auditors, and to review accounting, auditing, financial reporting, corporate governance and compliance matters. The Audit Committee approves the external auditors’ engagement letter on the terms, nature and scope of the audit function and the audit fee. Interim and annual results of the Company and trading statements of the Company are reviewed by the audit committee before publication. The audit committee usually makes recommendations and refers matters for information or approval to the Board.
Both the Audit Committee and the Board are satisfied that the independence of the external auditors is not in any way impaired or compromised.
The Audit and Risk Committee has considered and satisfied itself with the appropriateness of the expertise and experience of the CFO and the adequacy of resources within the finance function and with the experience of the finance team within the Group.
The text of the audit committee’s charter is available on SEDAR at www.sedar.com.
43
Nominating and Governance Committee
Members: Patrick Cooke (Chair), Fikile Tebogo De Buck. Sipho Nkosi resigned from being a member in July 2012. Wayne Kirk resigned from being a member of the Nominating and Governance Committee on January 31, 2012. Patrick Cooke was appointed to serve on the Nominating and Governance Committee as from February 1, 2012, and to act as Chairperson of this committee.
The committee is currently comprised of two non-executive directors, all of whom are independent.
The Nomination and Governance Committee’s functions include reviewing and making recommendations to the Board on the Company’s general corporate governance framework, the composition and performance of the Board and its committees, appointment of directors and group executive committee members, legal compliance and the Company’s ethics policy and programs.
Compensation Committee
Members: Anu Dhir (Chair) and Patrick Cooke and met three times in 2012. Sipho Nkosi resigned from the committee in July 2012.
All the members of the committee, including the chair, are independent non-executive directors. In line with the recommendations of King III, the CEO attends the meetings of the committee at the request of the committee, but is requested to leave the meeting before any decisions are made.
The committee evaluates and monitors Atlatsa’s remuneration philosophy and practices, ensures that they are consistent with sound governance principles and management systems and are aligned with the Company’s approach to risk management, in that inappropriate risk taking is not incentivized.
Other key terms of reference set out in the mandate of the committee include:
| | • | | providing guidance on the evaluation of the performance of NEO’s; |
| | • | | determining and recommending to the Board, the remuneration of NEO’s and directors, whose remuneration is |
| | • | | subject to shareholder approval; |
| | • | | reviewing and approving total guaranteed package values including the annual short term and long term |
| | • | | incentives granted to executive management; |
| | • | | reviewing and approving proposals for annual salary adjustments and proposed changes to benefit fund rules |
| | • | | approving the principles, formulae applied and Company performance targets as well as the achievement thereof |
| | • | | on which short-term and long-term incentives are based; |
| | • | | reviewing and approving the terms and conditions of the executive directors’ service agreements; and |
| | • | | annually assessing the performance of the committee and the committee members. |
44
Sustainable Development and Health and Safety Committee
Members: Fikile De Buck, Anu Dhir and Rizelle Sampson (Chairperson).
The Sustainable Development Committee meets at least four times a year, or more frequently as circumstances dictate.
The objective of the Sustainable Development Committee is to assist the board in ensuring that we are and remain a committed socially responsible corporate citizen. The committee’s primary role is to supplement, support, advise and provide guidance on the effectiveness or otherwise of management’s efforts in respect of sustainable development.
The committee considers the following sustainable development issues: occupational health, safety, HIV/Aids, social investment and environmental management.
Investment Committee
Members: Anu Dhir (Chairperson), Tumelo Motsisi
The committee meets as and when investment opportunities are identified. During Fiscal 2012, no meetings were held.
The primary purpose of the Investment Committee is to consider projects, acquisitions and the disposal of assets in line with the Company’s overall strategy. This includes performing such other investment related functions as may be designated by the Board from time to time, considering the viability of the capital project and/or acquisition and/or disposal and the effect it may have on the Company’s cash flow, as well as whether these will fit the Company’s overall strategy. This committee’s remit includes ensuring that due diligence procedures are followed when acquiring or disposing of assets.
Special Committee
Members: Fikile De Buck, Patrick Cooke (Chairperson) and Anu Dhir
The primary purpose of the Special Committee is to evaluate unusual/special transactions that occur on an ad-hoc basis. The committee came into effect to address the Company’s re-financing and re-structuring plan.
The Board monitors the adequacy of information given to directors, communication between the Board and management, and the strategic direction and processes of the Board and committees. The Board and its committees have initiated a self assessment process.
The Board is satisfied with the overall project and corporate achievements of the Company and believes this reflects well on the Board and its practices.
DIRECTORS’ SERVICE CONTRACTS
Written contracts are in place between the Company and Harold Motaung, Bava Reddy and De Wet Schutte. There are no written employment contracts in place between the Company and Tumelo Motsisi and Joel Kesler. The Company is currently in the process of compiling a remuneration policy, and as part of this process the written employment contracts between the Company and the Named Executive Officers (“NEOs”) will also be reviewed or implemented, as applicable.
There are no written contracts between the Company and any independent non-executive directors which are appointed to the Board.
There are no compensatory plans or arrangements with the NEOs that entitle any NEO to receive more than $100,000 from the Company as a result of the resignation, retirement or any other termination of employment of the NEO’s employment, a change in control of the Company or its subsidiaries or a change of the NEO’s responsibilities following a change in control.
45
Written employment contracts between the Company and the NEOs provide for compensation payable under certain circumstances following termination or a change in control, inclusive of the following:
| | • | | a 30 day notice period applies; |
| | • | | payment of annual holiday leave; |
| | • | | In terms of the stock option plan, all vested stock options held by the employee may be exercised with 90 days. |
DIRECTORS OPINION AND RECOMMENDATION
In addition to the general recommendation of the Board, as stated above, that Shareholders vote FOR each of the resolutions to approve the Related Party Transactions, the following disclosure is made pursuant to the JSE Listings Requirements:
| | • | | The Board has evaluated the rationale for and the terms and conditions of the Restructuring Plan and has appointed PSG and Minxcon Proprietary Limited as Independent Experts. The Board draws Shareholders’ attention to the Independent Expert’s report in this regard which concludes that the terms of the Restructuring Plan are fair to Shareholders. |
| | • | | The fairness opinion of PSG and Minxcon dated May 21, 2013, a copy of which, is attached to this Information Circular as Schedule I. |
| | • | | The Board is of the opinion that the Restructuring Plan will enhance Shareholder value and that the Restructuring Plan will provide a platform for future access to investment fund raising to allow for the expansion of Atlatsa’s business. |
DIRECTORS RESPONSIBILITY STATEMENT
The directors, whose names are given on page 37 of this Information Circular, collectively and individually, accept full responsibility for the accuracy of the information given and certify that to the best of their knowledge and belief there are no other facts that have been omitted which would make any statement false or misleading, and all reasonable enquiries to ascertain such facts have been made and that the Information Circular, contains all information required by law and the JSE Listings Requirements.
The Board has unanimously approved the content of this Information Circular, and the delivery thereof to the Shareholders.
INDEBTEDNESS OF DIRECTORS AND EXECUTIVE OFFICERS
No directors, executive officers or their respective associates or affiliates, or other management of the Company were indebted to the Company as of the end of the most recently completed financial year or as at the date hereof.
INTEREST OF INFORMED PERSONS IN MATERIAL TRANSACTIONS
Other than as set out herein, none of the directors or officers of the Company, no director or officer of a body corporate that is itself an insider or a subsidiary of the Company, no person or company who beneficially owns, directly or indirectly, voting securities of the Company or who exercised control or direction over voting securities of the Company or a combination of both carrying more than 5% of the voting rights attached to any class of outstanding voting securities of the Company entitled to vote in connection with any matters being proposed for consideration at the Meeting, no proposed director or nominee for election as director of the Company and no associate or affiliate of any of the foregoing has or had any material interest, direct or indirect, in any transaction or proposed transaction since the commencement of the Company’s most recently completed fiscal year that has materially affected or would or could materially affect the Company or any of its subsidiaries.
46
MANAGEMENT CONTRACTS
There are no management functions of the Company which are to any substantial degree performed by a person or company other than the directors or senior officers of the Company.
NO MATERIAL CHANGE
Subsequent to the end of the year ended December 31, 2012, Atlatsa and Anglo American Platinum entered into discussions surrounding a potential transaction and completed the Interim Transactions. Refer to “Particulars of Matters to be Acted Upon” herein for more information.
No material assets were purchased or acquired by Atlatsa or any of its subsidiaries during the preceding three years.
LITIGATION AND LEGAL PROCEEDINGS
There is no material legal or arbitration proceedings, including any proceedings that are pending or threatened of which the Group is aware, that may have, or have had during the previous 12 months before the date of this Information Circular, a material effect on the financial position of the Group.
WORKING CAPITAL STATEMENT
The directors have considered the effects of the Restructuring Plan and are of the opinion that subsequent to the implementation of the Restructuring Plan:
| | • | | The Group will, in the ordinary course of business, be able to pay its debts for a period of at least 12 months; |
| | • | | the assets of the Group, fairly valued, will be in excess of its liabilities for a period of at least 12 months. For this purpose, the assets and liabilities are recognized and measured in accordance with the accounting policies applied in the latest audited consolidated financial statements; |
| | • | | the share capital and reserves of the Group will be adequate for business purposes for a period of at least 12 months; and |
| | • | | the working capital of the Group will be adequate for ordinary business purposes for a period of at least 12 months. |
Shareholders are referred to the Company’s audited annual financial statements for the year ended December 31, 2012, which was filed on March 28, 2012. The audit opinion contained an emphasis of matter paragraph relating to the going concern of the Group. Should the Restructure Plan not be implemented, it will give rise to material uncertainty about the ability of the Group to continue as a going concern.
PRELIMINARY EXPENSES AND ISSUE EXPENSES
The preliminary expenses are included on page 32 of this Information Circular.
AUDITOR
The auditors of the Company are currently KPMG Inc., Registered Auditors, 85 Empire Road, Parktown, Johannesburg, South Africa (“KPMG”). KPMG was first appointed auditor of the Company on May 21, 2004.
OTHER MATTERS
The directors of the Company are not aware of any other matters which they anticipate will come before the Meeting as of the date of mailing of this Information Circular.
47
The contents of this Information Circular and its distribution to Shareholders have been approved by the Board of Directors.
The directors of the Company, being Harold Motaung, Tumelo Motsisi, Patrick Cooke, Rizelle Sampson, Fikile Tebogo De Buck and Anu Dhir, as at the date hereof collectively and individually accept full responsibility for the accuracy of the information given in this Information Circular and certify that, to the best of their knowledge and belief, there are no facts that have been omitted which would make any statement false or misleading, all reasonable enquiries to ascertain such facts have been made, and the circular contains all information required by the JSE Listings Requirements.
EXPERT CONSENTS
KPMG, whose Independent Reporting Accountant’s Reasonable Assurance Report on the unaudited pro forma financial effects of the Restructuring Plan and Report of the Independent Reporting Account on the Historical Financial Information of Boikgantsho and Ga-Phasha are included in this Information Circular, has given and not withdrawn its consent to the issue of this Information Circular with the report in the form and context in which it is included.
G. Mitchell, Dr. W. Northrop, A. Deiss, B. Reddy, Pri.Sci.Nat. and D. Ferreira, Pri.Sci.Nat., whose CPR with respect to the Ga-Phasha Project and CPR with respect to the Boikgantsho Project are referred to and summaries of which are attached hereto as Schedule E and Schedule F, respectively, have given and not withdrawn their consent to the issue of this Information Circular with the extracts from their CPRs in the form and context in which they are included.
Minxcon, whose Boikgantsho Valuation with respect to the sale of Boikgantsho Project assets and Ga-Phasha Valuation with respect to the sale of the Eastern section of the Ga-Phasha Project, comprising the Paschaskraal and De Kamp farms, are referred to and attached hereto as Schedule G and Schedule H, respectively, has given and not withdrawn its consent to the issue of this Information Circular with extracts from the Boikgantsho Valuation and the Ga-Phasha Valuation in the form and context in which they are included.
PSG, whose Fairness Opinion on the fairness of the Restructuring Plan is referred to and attached hereto as Schedule I, has given and not withdrawn its consent to the issue of this Information Circular with the extracts from the Valuation and the Fairness Opinion in the form and context in which they are included.
ADDITIONAL INFORMATION
Additional information relating to the Company is available on SEDAR atwww.sedar.com. Financial information is provided in the audited annual financial statements for the year ended December 31, 2012 and the accompanying auditor’s report thereon and related management’s discussion and analysis which were filed on SEDAR on March 28, 2013. Additional information may be obtained upon request from the Company at telephone number (604) 684-6365 or +27 11 883 0831 (South Africa) or fax number (604) 684-8092 or +27 11 883 0836 (South Africa). Upon request, Shareholders will be sent, without charge, the most recent copy of the Company’s interim financial statements.
Shareholders may refer to the following documents, available on SEDAR at www.sedar.com, which documents do not form part of and are not, unless otherwise stated herein, incorporated by reference into this Information Circular:
| | (a) | details of the Company’s current share capital in the Company’s Annual Report on Form 20-F filed on SEDAR on March 28, 2013 and in the audited financial statements of the Company for the year ended December 31, 2012 as filed on SEDAR on March 28, 2013, details of which are attached as Schedule A to this Information Circular; |
| | (b) | details of material loans made to the Company and its subsidiaries in the audited financial statements for the year ended December 31, 2012 as filed on SEDAR on March 28, 2013, details of which are attached as Schedule N to this Information Circular; |
| | (c) | the historical market prices of Atlatsa securities listed in the Company’s Annual Report on Form 20-F filed on SEDAR on March 28, 2013 and on the TSX-V website (www.tsx.com) and on the JSE website (www.jse.co.za); |
48
| | (d) | a description of the current business of the Company in the Company’s Annual Report on Form 20-F filed on SEDAR on March 28, 2013; |
| | (e) | the prospects of the Company as described in the Company’s Annual Report in Form 20-F dated March 28, 2013 and in management’s discussion and analysis which accompanies the audited financial statements for the year ended December 31, 2012 as filed on SEDAR on March 28, 2013; |
| | (f) | the history of the change in controlling shareholders through the Insider Reports and Early Warning reporting released on SEDAR, details of which are attached as Schedule A to this Information Circular; |
| | (g) | all material contracts (i.e. any contract to which the Company or any of its subsidiaries is a party, other than a contract entered into in the ordinary course of business, that is material to the Company and was entered into within the last financial year, or before the last financial year but is still in effect, including any external management / administration agreements) in the Company’s Annual Report on Form 20-F which was filed on SEDAR on March 28, 2013, details of which are attached as Schedule O to this Information Circular; |
| | (h) | the historical auditors’ reports and audited financial statements of the Company for the fiscal years ended December 31, 2012, 2011 and 2010 as filed on SEDAR; |
| | (i) | all corporate records (articles of incorporation, central securities register etc.) at the registered and records office of the Company; and |
| | (j) | all National Instrument 43-101 compliant technical reports and all CPRs as filed on SEDAR. |
DOCUMENTS AVAILABLE FOR INSPECTION
Copies of the following documents will be available for inspection at the head office of Atlatsa and at the offices of Macquarie First South Capital (Pty) Limited at any time during normal business hours from 08:30 to 17:00 from the date of issue of this Information Circular up to and including the date of the Meeting convened in terms of the Notice of Special Meeting attached to this Information Circular:
| | • | | a certified copy of the articles of association for Atlatsa and its subsidiaries; |
| | • | | a copy of the signed Fairness Opinion; |
| | • | | the audited financial statements of Boikgantsho and Ga-Phasha for the financial years ended December 31 2012, 2011 and 2010; |
| | • | | the audited financial statements of Atlatsa Resources Corporation for the financial years ended December 31 2012, 2011 and 2010; |
| | • | | letter of consent of the reporting accountant’s to the reproduction of its report in the form and context in which its appears in the Information Circular; |
| | • | | letters of consent of the legal advisers, auditors and reporting accountants, banker, independent professional adviser, financial adviser and transaction sponsor, independent professional expert and transfer secretaries to act in the capacities stated and to their names appearing in the Information Circular; |
| | • | | the signed reporting accountants’ report on the historical financial information of Boikgantsho and the Ga-Phasha Project, as reproduced in Schedule J and Schedule K, respectively, of this Information Circular; |
49
| | • | | copies of the following signed agreements: |
| | • | | The Amended and Restated Global Intercreditor Agreement; |
| | • | | The Amended and Restated N2C Counter Indemnity; |
| | • | | The Amended and Restated N2C Resources Cession and Pledge in Security; |
| | • | | The Amended and Restated Opco Cession and Pledge in Security; |
| | • | | The Amended and Restated Opco Counter Indemnity Agreement; |
| | • | | The Amended and Restated Opco Security SPV Debt guarantee; |
| | • | | The Amended and Restated Plateau Cession and Pledge in Security; |
| | • | | The Amended and Restated Plateau Counter Indemnity Agreement ; |
| | • | | The Amended and Restated Plateau Security SPV Debt Guarantee ; |
| | • | | The Amended RPM Funding Common Terms Agreement; |
| | • | | Senior and Security Agent Fee Letter; |
| | • | | Cession and Pledge in Security; |
| | • | | Holdco Cession and Pledge in Security; |
| | • | | Senior Term Loan and Revolving Facilities Agreement; |
| | • | | Working Capital Facilities Agreement; |
| | • | | Second Plateau Holdco Subscription Agreement; |
| | • | | Second RPM Holdco Subscription Agreement; |
| | • | | Second Holdco Opco Subscription Agreement; |
| | • | | Sale of a Portion of a Mining Right Agreement (De Kamp and Paschaskraal); |
| | • | | Sale of Assets Agreement (Boikgantsho); |
| | • | | Amended and Restated Holdco Shareholders’ Agreement; |
| | • | | Implementation Agreement; |
| | • | | Sale and Purchase Agreement |
| | • | | Subscription Agreement; and |
| | • | | Transaction Framework Agreement. |
| | • | | the executive summary of the Competent Person’s Report on the Boikgantsho Project; |
50
| | • | | the executive summary of the Competent Person’s Report on the Ga-Phasha Project; |
| | • | | all material contracts of the Company and its subsidiaries as identified and set out in Schedule O to this Information Circular; and |
| | • | | a signed copy of this Information Circular. |
51
GLOSSARY OF TERMS
The following is a glossary of certain terms used in this Information Circular.
“A Preference Shares” means cumulative redeemable preference shares in the authorized capital of Plateau;
“A Preference Share Facility” means the A Preference Shares in the capital of Plateau subscribed for by RPM in the amount of ZAR 1.722 billion (US$164.4 million), together with accrued dividends thereon and the attributable amount of the equivalent A Preference Share facilities outstanding in the capital of Bokoni Holdco and Bokoni, which were fully repaid by Atlatsa, Bokoni Holdco and Bokoni pursuant to the Interim Transactions;
“affiliate” has the meaning ascribed thereto in theSecurities Act (British Columbia), as amended, except as otherwise provided herein;
“Amended RPM Funding Common Terms Agreement” means the amended and restated funding common terms agreement entered into between RPM, Plateau, Central Plaza Investments 78 Proprietary Limited, Atlatsa, N1C Resources Inc., N2C Resources Inc., The Pelawan Trust, Pelawan Investments Proprietary Limited, Micawber 634 Proprietary Limited and Micawber 603 Proprietary Limited on March 27, 2013 setting out certain common definitions and provisions which are applicable to certain of the Debt Refinancing Transactions;
“Anglo American Platinum” means Anglo American Platinum Limited, a public company incorporated under the laws of South Africa and whose common shares are listed on the JSE, and includes its subsidiaries where the context requires;
“Asset Sale” means the proposed sale of Atlatsa’s interest in the Asset Sale Properties to RPM pursuant to the Boikgantsho Asset Sale Agreement and the Ga-Phasha Asset Sale Agreement;
“Asset Sale Agreements” means, collectively, the Ga-Phasha Asset Sale Agreement and the Boikgantsho Asset Sale Agreement as entered into on March 27, 2013;
“Asset Sale Properties” means the properties that are to be transferred under the Asset Sale Agreements;
“associate” has the meaning ascribed thereto in theSecurities Act (British Columbia), as amended, except as otherwise provided herein;
“Atlatsa” or the “Company” or the “Group” means Atlatsa Resources Corporation (previously Anooraq Resources Corporation), a corporation incorporated under the laws of the Province of British Columbia and listed on the TSX-V, the JSE and the NYSE MKT, and includes its subsidiaries where the context requires;
“Atlatsa Holdings” means Atlatsa Holdings Proprietary Limited (formerly Pelawan Investments Proprietary Limited), a private company incorporated under the laws of South Africa, with 15 BEE shareholders including Tumelo Motsisi and Harold Motaung and the sole beneficiary of the Pelawan Trust;
“Atlatsa Holdings Loan” has the meaning set forth under the heading “Restructuring Plan – Atlatsa Holdings Loan”;
“Atlatsa Holdings Share Purchase” has the meaning set forth under the heading “Restructuring Plan – Ancillary Matters—Atlatsa Holdings Share Purchase”;
“Atlatsa Share Subscription Price” means ZAR 750 million (US$71.6 million);
“B Preference Shares” means the B1 Preference Shares, the B2 Preference Shares and the B3 Preference Shares;
“B1 Preference Shares” means 115,800 cumulative convertible preference shares in the authorized capital of Pelawan SPV;
“B2 Preference Shares” means 115,800 cumulative convertible redeemable preference shares in the capital of Plateau;
52
“B3 Preference Shares” means 111,600 cumulative convertible redeemable preference shares in the capital of Plateau;
“BEE” means broad based black economic empowerment, as envisaged pursuant to the MPRD Act and related legislation and guidelines, being a strategy aimed at substantially increasing participation by HDSAs at all levels in the economy of South Africa;
“Beneficial Shareholder” means a Shareholder who beneficially owns and holds Common Shares through a broker (or some other intermediary) and who does not hold Common Shares in his, her or its own name;
“Board of Directors” or “Board” means the board of directors of Atlatsa;
“Boikgantsho” means Boikgantsho Platinum Mine Proprietary Limited, a private company incorporated under the laws of South Africa which holds the mineral title in respect of the Boikgantsho Project;
“Boikgantsho Asset Sale Agreement” means the sale of assets agreement entered into on March 27, 2013 between RPM and Boikgantsho pursuant to which RPM will purchase and Boikgantsho will sell the Boikgantsho Project Assets as amended from time to time;
“Boikgantsho Project” means the Boikgantsho PGM project, located on the Northern Limb of Bushveld Complex in South Africa;
“Boikgantsho Project Assets” means the Boikgantsho Prospecting Rights, a portion of the mining right over the Overysel 815LR farm and certain project information related to the Boikgantsho Project;
“Boikgantsho Prospecting Rights” means the prospecting rights granted to Boikgantsho over portions of Drenthe 778LR and Witrivier 777LR farms;
“Boikgantsho Valuation” means the formal valuation of the Boikgantsho Project assets together with, and as presented in, the report prepared by Minxcon titled: “An Independent Qualified Persons’ Valuation Report on the Boikgantsho Project, in the Limpopo Province, South Africa” dated February 27, 2013, a copy of which is attached to this Information Circular as Schedule G;
“Bokoni” means Bokoni Platinum Mines Proprietary Limited, a private company incorporated under the laws of South Africa which holds the mineral title in respect of the Bokoni Mine;
“Bokoni Acquisition” means the transaction pursuant to which the Company acquired an effective 51% interest in the Bokoni Mine and an additional 1% interest in the Ga-Phasha Project, Boikgantsho Project and Kwanda Project effective July 1, 2009;
“Bokoni Group” means Bokoni Holdco and its subsidiaries;
“Bokoni Holdco” means Bokoni Platinum Holdings Proprietary Limited, a private company incorporated under the laws of South Africa;
“Bokoni Holdco Shareholders Agreement” means the shareholders agreement between Plateau, RPM and Bokoni Holdco dated May 6, 2009, as amended on March 27, 2013;
“Bokoni Mine” means Bokoni Platinum Mine, a PGM mine located on the Eastern Limb of the Bushveld Complex in South Africa (formerly referred to as the Lebowa Platinum Mine);
“Broadridge” means Broadridge Financial Solutions, Inc.;
“CAT” means Central African Time;
“CDS” means the Canadian Depository for Securities Inc.;
53
“Closing Date” means the date on which the Restructuring Plan is completed;
“Common Shares” means common shares without par value in the capital of the Company;
“Concentrate Agreement” means the sale of concentrate agreement entered into between RPM and Bokoni entered into on December 21, 2007 pursuant to which all of the metal-in-concentrate produced at the Bokoni Mine is sold by Bokoni to RPM;
“CPR” means a Competent Person’s Report prepared in compliance with the South African Code for Reporting of Exploration Results, Mineral Resources and Mineral Reserves and the South African Code for the Valuation of Mineral Assets;
“CSA” means Canadian Securities Administrators;
“CSDP” means Central Securities Depository Participant in South Africa;
“Debt Refinancing Transactions” has the meaning set forth under “Particulars of Matters to be Acted Upon – Restructuring Plan – The Debt Refinancing Transactions and RPM Share Subscription”;
“Disinterested Shareholders” means, in respect of any resolution, all Shareholders except those Shareholders that have an interest in that resolution and in the case of the resolutions to approve each of the Asset Sale, the Debt Refinancing Transactions and the RPM Share Subscription, excludes Anglo American Platinum and RPM, to the extent of their shareholdings in Atlatsa, which to Atlatsa’s knowledge as of the Record Date is zero Common Shares;
“DMR” means the South African Department of Mineral Resources;
“DMR Guarantee” means a guarantee provided in respect of environmental rehabilitation obligations arising out of mining activities and on the terms set out in regulation 53 of the MPRD Act regulations as required under sections 41(1), 11(2) and 23 of the MPRD Act;
“Fairness Opinion” means the fairness opinion of PSG and Minxcon (Pty) Ltd dated May 21, 2013, a copy of which is attached to this Information Circular as Schedule I;
“Form 20-F” means the annual report of the Company for the year ended December 31, 2012 filed with the United States Securities Exchange Commissions on Form 20-F;
“Ga-Phasha” means Ga-Phasha Platinum Mine Proprietary Limited, a private company incorporated under the laws of South Africa which holds the mineral title in respect of the Ga-Phasha Project;
“Ga-Phasha Asset Sale Agreement” means the sale of a portion of a mining right agreement entered into on March 27, 2013 between RPM and Ga-Phasha pursuant to which RPM will purchase and Ga-Phasha will sell the Eastern section of the Ga-Phasha Project, comprised of Paschaskraal and De Kamp farms;
“Ga-Phasha Mining Right” means the converted mining right granted to Ga-Phasha over the area comprising the farms Avoca, De Kamp, Klipfontein and Paschaskraal;
“Ga-Phasha Project” means the Ga-Phasha PGM Project, located on the Eastern Limb of the Bushveld Complex in South Africa;
“Ga-Phasha Sale Assets” means the portion of the Ga-Phasha Mining Right relating to the Eastern section of the Ga-Phasha Project, comprising the Paschaskraal and De Kamp farms;
“Ga-Phasha Valuation” means the formal valuation of the Ga-Phasha Sale Assets together with, and as presented in, the report prepared by Minxcon titled: “An Independent Qualified Persons’ Valuation Report on the Ga-Phasha East Project, in the Limpopo Province, South Africa” dated February 26, 2013, a copy of which is attached to this Information Circular as Schedule H;
54
“Global Intercreditor Agreement” means the amended and restated global intercreditor agreement entered into on March 27, 2013 between Atlatsa, Plateau, Micawber 634 Proprietary Limited, Micawber 603 Proprietary Limited, RPM, the Pelawan SPV and Tumelo Moatlhodi Motsisi and Asna Happy Chris Harold Motaung as trustees on behalf of the Pelawan Dividend Trust, pursuant to which the order of priority is established with respect to certain debts and liabilities of Atlatsa and Plateau;
“HDSA” means a “historically disadvantaged South African” as contemplated in the MPRD Act, being a person or group who has been discriminated against on the basis of race, gender and disability, and includes certain trusts and companies in which such persons have interests;
“Implementation Agreement” means the implementation agreement entered into between Atlatsa, N1C Resources Inc. N2C Resources Inc., RPM, Plateau, Bokoni Holdco and Bokoni on March 27, 2013 relating to the implementation of the closing of the Restructuring Plan, including all condition precedents thereto;
“Information Circular” means this management information circular dated May 28, 2013, together with all schedules hereto, distributed to Shareholders by Atlatsa in connection with the Meeting;
“Interim Implementation Agreement” means the amendment and interim implementation agreement entered into between Atlatsa, N2C Resources Inc., RPM, Plateau, Bokoni Holdco and Bokoni relating to the Interim Transactions;
“Interim Transactions” has the meaning set forth under the heading “Restructuring Plan – The Debt Refinancing Transactions, Interim Transactions”;
“Intermediaries” means brokers, investment firms, clearing houses and similar entities that own and hold Common Shares on behalf of Beneficial Shareholders;
“JIBAR” means Johannesburg Interbank Agreed Rate;
“JSE” means JSE Limited, a company incorporated in accordance with the laws of South Africa, licensed as an exchange under the South African Securities Services Act, 2004;
“JSE Listings Requirements” means the JSE Listings Requirements as amended from time to time;
“Kwanda” means Kwanda Platinum Mine Proprietary Limited, a private company under the laws of South Africa which holds the mineral title in respect of the Kwanda Project;
“Kwanda Project” means the Kwanda PGM project located on the Northern limb of the Bushveld Complex in South Africa on 12 farms;
“Lebowa” means Lebowa Platinum Mines Proprietary Limited, a private company incorporated under the laws of South Africa;
“Meeting” means the annual general and special meeting of the Shareholders to be held at 07:00 (Vancouver time) (16:00 Central African Time) on June 28, 2013 and any adjournment thereof;
“MI 61-101” means Multilateral Instrument 61-101 –Protection of Minority Shareholders In Special Transactions;
“Mining Charter” means the broad based socio-economic empowerment charter for the South African mining and minerals industry promulgated pursuant to section 100 of the MPRD Act on 13 August 2004, and thereafter amended by General Notice 838 of 20 September 2010;
“Minister” means the Minister of Mineral Resources;
55
“Minxcon” means Minxcon (Pty) Limited, a private company incorporated under the laws of South Africa;
“MPH” means Middlepunt Hill;
“MPTRO” means the Mineral and Petroleum Titles Registration Office;
“MPRD Act” means the South African Mineral and Petroleum Resources Development Act, No. 28 of 2002;
“N1C Resources Inc.” a wholly owned subsidiary of Atlatsa incorporated on December 2, 1999 under the laws of the Caymen Islands;
“N2C Resources Inc.” a wholly owned subsidiary of N1C Resources Inc and indirect wholly owned subsidiary of Atlatsa, incorporated on December 2, 1999 under the laws of the Caymen Islands;
“New Debt Facility” means the new senior term loan and revolving facility agreement dated March 27, 2013 between, among others, Atlatsa, Plateau and RPM, pursuant to which RPM will make available to Plateau a senior term loan and revolving facility in a total amount of up to ZAR 1,550 billion (US$147.9 million);
“NYSE MKT” means the NYSE MKT LLC stock exchange;
“OCSF” means the ZAR 750 million (US$83.9 million) operating cash-flow short fall facility provided by RPM to Plateau as part of the Bokoni Acquisition. On June 29, 2012, the OCSF facility was increased to $123.0 (ZAR1,100 million) which represents 51% of the total facility available to Bokoni Mine; the total facility was thus increased to $241.2 (ZAR 2,156 million); and the balance outstanding on September 28, 2012 was repaid pursuant to the Interim Transaction; and the remainder of the facility available to be drawn down upon under the Senior Debt Facility;
“Option” means the options to acquire Common Shares granted under and in accordance with the terms of the Stock Option Plan;
“Pelawan Dividend Trust” means independent South African trust established and registered under Master’s reference number IT8411/2004, the trustees of which are Tumelo Moatlhodi Motsisi (a director of the Company), Asna Happy Chris Harold Motaung (a director of the Company) and Adams & Adams;
“Pelawan Shareholders Agreement” means the shareholders agreement between Atlatsa, Plateau, the Pelawan Trust and Atlatsa Holdings dated June 12, 2009;
“Pelawan SPV” means the Pelawan Finance SPV Proprietary Limited, a private company incorporated under the laws of South Africa and a special purpose vehicle established by, and wholly-owned subsidiary of, Atlatsa Holdings;
“Pelawan Trust” means the independent South African trust established in accordance with a trust deed dated September 2, 2004, the trustees of which are Andre Visser, Tumelo Motsisi (a director of the Company) and Harold Motaung (a director of the Company);
“PGM” means platinum group metals;
“Plateau” means Plateau Resources Proprietary Limited, a private company incorporated under the laws of South Africa, being a wholly-owned subsidiary of N2C Resources Inc and an indirect wholly owned subsidiary of N1C Resources Inc. and Atlatsa;
“Plateau Preference Shares” means the B2 Preference Shares and the B3 Preference Shares;
“Proxy” means the form of proxy on blue coloured paper which accompanies this Information Circular for use by Registered Shareholders other than South African Shareholders;
“PSG” means PSG Capital Proprietary Limited, a private company incorporated under the laws of South Africa;
56
“Record Date” means May 28, 2013;
“Registered Shareholder” means a Shareholder whose name appears on Atlatsa’s central security register as a registered holder of Common Shares as of the Record Date;
“Related Party Transactions” means the Asset Sale, the Debt Refinancing Transactions and the RPM Share Subscription;
“Restructuring Plan” means the Asset Sale, the Debt Refinancing Transactions and the RPM Share Subscription;
“RPM” means Rustenburg Platinum Mines Limited, a public company incorporated under the laws of South Africa, being a wholly-owned subsidiary of Anglo American Platinum;
“RPM Mining Right” means the converted mining right to be held by RPM over the area including the farm Overysel in respect of the Boikgantsho Project;
“RPM Share Subscription” has the meaning set forth under the heading “Restructuring Plan – RPM Share Subscription”;
“RPM Twickenham Mining Right” means the converted mining right held by RPM over a mining area adjacent to the Ga-Phasha Sale Assets;
“SARs” means share appreciation rights;
“SEDAR” means the System for Electronic Document Analysis and Retrieval available on the Internet atwww.sedar.com;
“Senior Debt Facility” means the senior term loan facility provided by RPM to Plateau in connection with the Bokoni Acquisition in the principal amount of ZAR 500 million (US$47.7 million), as increased pursuant to the Interim Transactions;
“Shareholder” means a holder of Common Shares;
“South Africa” means the Republic of South Africa;
“South African Proxy” means the form of proxy printed on blue coloured paper which accompanies this Information Circular and is to be completed by South African Shareholders;
“South African Shareholder” means a Shareholder whose Common Shares are registered on the Company’s South African register of Shareholders;
“Special Committee” means the special committee of independent directors of Atlatsa, being Fikile Tebogo De Buck, Patrick Cooke and Anu Dhir formed on February 28, 2012 to consider and to provide recommendations to the Board of Directors with respect to the Related Party Transactions;
“Stock Option Plan” means the incentive stock option plan of the Company as adopted on June 41, 2004, as amended on June 17, 2005 and as further amended as of June 15, 2009;
“tpm” means tonnes per month;
“TSX-V” means TSX Venture Exchange;
“Working Capital Facility” means the working capital facility agreement dated March 27, 2013 between Atlatsa and RPM pursuant to which RPM will make an amount of ZAR 30 million (US$2.9 million) per year available to Atlatsa during each of 2013, 2014 and 2015 for a total facility of ZAR 90 million (US$8.6) including capitalized interest; and
57
“ZAR” means the South African Rand, the currency of South Africa.
Words importing the singular, where the context requires, include the plural andvice versa and words importing any gender include all genders.
58
DATED at Vancouver, British Columbia, May 28, 2013.
BY ORDER OF THE BOARD OF DIRECTORS
“Harold Motaung”
Harold Motaung
Chief Executive Officer of Atlatsa and duly
authorized signatory on behalf of the other directors
59
CONSENT OF KPMG
To: The Board of Directors of Atlatsa Resources Corporation
We have read the management information circular (the “Information Circular”) of Atlatsa Resources Corporation (the “Company”) dated on or about May 28, 2013. We do hereby consent to act in our capacity as stated in the Information Circular; to our name being stated in the Information Circular; and to the reference to ourselves in the form and context in which they appear in the Information Circular.
We also consent to the inclusion of our Independent Reporting Accountants’ Reports dated May 22, 2013 as set out in Schedules D-2 , L and M to the Information Circular.
(signed) “KPMG Inc.”
KPMG Inc.
Registered Auditors
May 28, 2013
60
CONSENT OF COMPETENT PERSONS
Each of the undersigned hereby confirms that he has read the scientific and technical disclosure in respect of the Ga-Phasha and Boikgantsho mineral properties contained in the management information circular of Atlatsa Resources Corporation dated on or about May 28, 2013 (the “Information Circular”), approves such disclosure and consents to being named as an independent Competent Person (within the meaning of the JSE Listings Requirements) who prepared the report or parts thereof titled: “Competent Persons Report: The Mineral Resource Estimate for the Merensky and UG2 reefs for the Ga-Phasha Project Area, Llimpopo Province, Republic of South Africa for Atlatsa Resources Corporation” dated February 26, 2013 (the “Ga-Phasha CPR”) and “Competent Persons Report:The Mineral Resource Estimation For The Platreef for the Boikgantsho Project Limpopo Province Republic of South Africafor Atlatsa Resources Corporation” dated February 27, 2013 (the “Boikgantsho CPR”) in respect of the Ga-Phasha and Boikgantsho mineral properties, respectively. Each of the undersigned hereby consents to being named in the Information Circular and to the use of the Ga-Phasha CPR and the Boikgantsho CPR for the purpose of the disclosure in the Information Circular and to the inclusion of the Ga-Phasha CPR and the Boikgantsho CPR in the Information Circular.
May 28, 2013
| | | | |
(signed) “A. Bisnath” | | | | (signed) “Dr. W. Northrop” |
A. Bisnath | | | | Dr. W. Northrop |
| | |
(signed) “S.Naicker” | | | | (signed) “G. Mitchell” |
S. Naicker | | | | G. Mitchell |
| | |
(signed) “D. Ferreira | | | | (signed) “A. Deiss” |
| D. Ferreira | | | | A. Deiss |
61
CONSENT OF PSG
To: The Board of Directors of Atlatsa Resources Corporation
We refer to the fair and reasonable opinion (the “Fairness Opinion”) of our firm dated May 21, 2013, which we prepared for the Special Committee of the Board of Directors of Atlatsa Resources Corporation (the “Company”) in connection with the Asset Sale, as that term is defined in the management information circular of the Company dated May 28, 2013 (the “Information Circular”), of certain assets of the Company to Anglo American Platinum Limited and to the inclusion of the foregoing in the Information Circular.
We consent to being named in the Information Circular and to the filing of the above-mentioned Fairness Opinion of our firm with the securities regulatory authority and the inclusions of the Fairness Opinion in the Information Circular. We have read the relevant disclosure in the Information Circular and have no reason to believe that there are any misrepresentations in the information contained in the Information Circular that are derived from or related to the foregoing.
(signed)“PSG Capital Proprietary Limited”
PSG Capital Proprietary Limited
May 28, 2013
62
CONSENT OF MINXCON
To: The Board of Directors of Atlatsa Resources Corporation
We refer to the Competent Person’s Reports (as that term is defined in the JSE Listings Requirements) titled “Competent Person’s report: The Mineral Resource Estimation For The Platreef for the Boikgantsho Project Limpopo Province Republic of South Africa for Atlatsa Resources Corporation” dated February 27, 2013 (the “Boikgantsho CPR”) and “Competent Persons Report: The Mineral Resource Estimate for the Merensky and UG2 reefs for the Ga-Phasha Project Area, Llimpopo Province, Republic of South Africa for Atlatsa Resources Corporation” dated February 26, 2013 (the “Ga-Phasha CPR”), and the formal valuation report titled: “An Independent Qualified Persons’ Valuation Report on the Boikgantsho Project, in the Limpopo Province, South Africa” (the “Boikgantsho Valuation”) of our firm dated February 27, 2013 and the formal valuation report titled: “An Independent Qualified Persons’ Valuation Report on the Ga-Phasha East Project, in the Limpopo Province, South Africa” (the “Ga-Phasha Valuation”) of our firm dated February 26, 2013, each of which we prepared for the Board of Directors of Atlatsa Resources Corporation (the “Company”) in connection with the Asset Sale, as that term is defined in the management information circular of the Company dated May 28, 2013 (the “Information Circular”), of certain assets of the Company to Anglo American Platinum Limited, and to the inclusion of the forgoing in the Information Circular.
We consent to being named in the Information Circular and to the filing of the above-mentioned Ga-Phasha CPR, Boikgantsho CPR, Boikgantsho Valuation and Ga-Phasha Valuation of our firm with the securities regulatory authority and to their inclusion in the Information Circular. We have read the relevant disclosure in the Information Circular and have no reason to believe that there are any misrepresentations in the information contained in the Information Circular that are derived from or related to the foregoing.
(signed)“Minxcon (Pty) Limited”
Minxcon (Pty) Limited
May 28, 2013
63
SCHEDULE A
ASSET SALE RESOLUTION
WHEREAS:
| A. | Atlatsa Resources Corporation (the “Company”), through its wholly-owned subsidiary Plateau Resources Proprietary Limited, has entered into agreements with Anglo American Platinum Limited and its subsidiaries (referred to collectively as “Anglo American Platinum”) to dispose of its interest in the Eastern section of the Ga-Phasha Project and the whole of its interest in the Boikgantsho Project to Anglo American Platinum (the “Asset Sale”). |
| B. | The Asset Sale is a “related party transaction” pursuant to Multilateral Instrument 61-101 –Protection of Minority Security holders in Special Transactions and the JSE Listings Requirements, as Anglo American Platinum and RPM are related parties of the Company. |
| C. | The Asset Sale is more fully described in the Company’s Information Circular dated as of May 28, 2013. |
BE IT RESOLVED AS ORDINARY RESOLUTIONS OF THE DISINTERESTED SHAREHOLDERS THAT:
| 1. | The Asset Sale is hereby approved and authorized. |
| 2. | Notwithstanding that this resolution has been duly approved by the shareholders of the Company, the directors of the Company, in their sole discretion and without the requirement to obtain any further approval from the shareholders of the Company, are hereby authorized and empowered to elect not to implement the transactions contemplated by this resolution at any time before it is acted upon without further approval from the shareholders. |
| 3. | Any one director or officer of the Company, acting alone, is authorized to do all such acts and things and to execute (whether under seal of the Company or otherwise) and deliver all such documents as in such director’s or officer’s opinion may be necessary or desirable to complete the Asset Sale hereby approved and authorized. |
A-1
SCHEDULE B
DEBT REFINANCING TRANSACTIONS RESOLUTION
WHEREAS:
| A. | Atlatsa Resources Corporation (the “Company” or “Atlatsa”), through its wholly-owned subsidiary Plateau Resources Proprietary Limited and Anglo American Platinum Limited and its subsidiaries (referred to collectively as “Anglo American Platinum”), subject to certain conditions, have agreed to restructure the Company’s existing debt facilities with Anglo American Platinum as follows: (i) the effective net consideration of the Asset Sale (ZAR 1.7 billion) (US$162.2 million) and a portion of a new senior term loan and revolving debt facility (the “New Debt Facility”) will be applied to amounts owing under existing debt facilities, (ii) Anglo American Platinum will make the New Debt Facility available to the Company and (iii) Anglo American Platinum will make available to Atlatsa a working capital facility of ZAR 30 million (US$2.9 million) per year available during each of 2013, 2014 and 2015 for a total of ZAR 90 million (US$ 8.6 million) to fund Atlatsa’s corporate and administrative expenses through to 2015. |
| B. | The Debt Refinancing Transactions are “related party transaction” pursuant to Multilateral Instrument 61-101 –Protection of Minority Security holders in Special Transactions as Anglo American Platinum and RPM are related parties of the Company. |
| C. | The Debt Refinancing Transactions are more fully described in the Company’s Information Circular dated as of May 28, 2013. |
BE IT RESOLVED AS ORDINARY RESOLUTIONS THAT:
| 1. | The Debt Refinancing Transactions are hereby approved and authorized. |
| 2. | Notwithstanding that this resolution has been duly approved by the shareholders of the Company, the directors of the Company, in their sole discretion and without the requirement to obtain any further approval from the shareholders of the Company, are hereby authorized and empowered to elect not to implement the transactions contemplated by this resolution at any time before it is acted upon without further approval from the shareholders. |
| 3. | Any one director or officer of the Company, acting alone, is authorized to do all such acts and things and to execute (whether under seal of the Company or otherwise) and deliver all such documents as in such director’s or officer’s opinion may be necessary or desirable to complete the Debt Refinancing Transactions hereby approved and authorized. |
B-1
SCHEDULE C
RPM SHARE SUBSCRIPTION RESOLUTION
WHEREAS:
| A. | Atlatsa Resources Corporation (the “Company”) has agreed to issue 125 million Atlatsa Common Shares to Anglo American Platinum Limited for cash consideration of ZAR 750 million (US$71.6 million), which proceeds will be used to partially repay the outstanding debt owed by Atlatsa to Anglo American Platinum Limited under the New Debt Facility (“RPM Share Subscription”) |
| B. | The RPM Share Subscription is a “related party transaction” pursuant to Multilateral Instrument 61-101 –Protection of Minority Security holders in Special Transactions and the JSE Listings Requirements as Atlatsa Holdings is a related party of the Company. |
| C. | The RPM Share Subscription is more fully described in the Company’s Information Circular dated as of May 28, 2013. |
BE IT RESOLVED AS A SPECIAL RESOLUTION OF THE DISINTERESTED SHAREHOLDERS THAT:
| 1. | The RPM Share Subscription is hereby approved and authorized. |
| 2. | Notwithstanding that this resolution has been duly approved by the shareholders of the Company, the directors of the Company, in their sole discretion and without the requirement to obtain any further approval from the shareholders of the Company, are hereby authorized and empowered to elect not to implement the transactions contemplated by this resolution at any time before it is acted upon without further approval from the shareholders. |
| 3. | Any one director or officer of the Company, acting alone, is authorized to do all such acts and things and to execute (whether under seal of the Company or otherwise) and deliver all such documents as in such director’s or officer’s opinion may be necessary or desirable to complete the RPM Share Subscription Resolution hereby approved and authorized. |
C-1
SCHEDULE D-1
INDEPENDENT REPORTING ACCOUNTANTS’ REASONABLE ASSURANCE REPORT ON THE
COMPILATION OF PRO FORMA FINANCIAL INFORMATION OF ATLATSA RESOURCES
CORPORATION
The Directors
Atlatsa Resources Corporation
4th Floor, 82 Grayston Drive
Sandton, 2146
May 22, 2013
Report on the Compilation of Pro Forma Financial Information relating to the disposal of certain assets by Atlatsa Resources Corporation (“Atlatsa”) and refinancing of its debt (“Transaction”).
We have completed our assurance engagement to report (“Report”) on the compilation of the unaudited and unreviewed pro forma earnings and diluted earnings, headline and diluted headline earnings, net asset value and net tangible asset value per share of Atlatsa or “the Company”, pro forma statement of financial position of Atlatsa, the pro forma statement of comprehensive income of Atlatsa and the related notes, including a reconciliation showing all of the pro forma adjustments to the share capital, reserves and other equity items relating to Atlatsa, (collectively “Pro forma Financial Information”). The Pro forma Financial Information is set out in Schedule D-2 of the Circular to be issued by the Company on or about May 28, 2013 (“Circular”).
The Pro forma Financial Information has been compiled by the directors of Atlatsa to illustrate the impact of the transaction as detailed in the Circular on the Company’s financial position and changes in equity as at December 31, 2012 and the Company’s financial performance for the year ended December 31, 2012.
As part of this process, the Company’s earnings, diluted earnings, headline earnings and diluted headline earnings per share, statement of comprehensive income and statement of financial position have been extracted by the directors from the Company’s annual financial statements for the year ended December 31, 2012 (“Published Financial Information”), on which an audit report has been published. In addition, the directors have calculated the net asset value and net tangible asset value per share as at December 31, 2012 based on financial information extracted from the Published Financial Information.
Directors’ Responsibility for the Pro forma Financial Information
The directors of Atlatsa are responsible for compiling the Pro forma Financial Information on the basis of the applicable criteria as detailed in paragraphs 8.15 to 8.33 of the Listings Requirements of the JSE Limited and the SAICA Guide on Pro forma Financial Information, revised and issued in September 2012 (“Applicable Criteria”).
D-1
Reporting Accountants’ responsibility
Our responsibility is to express an opinion about whether the Pro forma Financial Information has been compiled, in all material respects, by the directors on the basis of the Applicable Criteria, based on our procedures performed.
We conducted our engagement in accordance with International Standard on Assurance Engagements (ISAE) 3420, Assurance Engagements to Report on the Compilation of Pro Forma Financial Information Included in a Prospectus, issued by the International Auditing and Assurance Standards Board. This standard requires that the reporting accountants’ comply with ethical requirements and plan and perform procedures to obtain reasonable assurance about whether the directors have compiled, in all material respects, the Pro forma Financial Information on the basis of the Applicable Criteria.
For purposes of this engagement, we are not responsible for updating or reissuing any reports or opinions on any Published Financial Information used in compiling the Pro forma Financial Information, nor have we, in the course of this engagement, performed an audit or review of the Published Financial Information used in compiling the Pro forma Financial Information.
The purpose of Pro forma Financial Information included in the Circular is solely to illustrate the impact of the Transaction on the unadjusted Published Financial Information as if the Transaction had been undertaken on 1 January 2012 for purposes of the pro forma earnings, diluted earnings, headline and diluted headline earnings per share and the pro forma statement of comprehensive income and on December 31, 2012 for purposes of the net asset value and net tangible asset value per share and statement of financial position. Accordingly, we do not provide any assurance that the actual outcome of the Transaction, subsequent to its implementation, will be as presented in the Pro forma Financial Information.
A reasonable assurance engagement to report on whether the Pro forma Financial Information has been properly compiled, in all material respects, on the basis of the Applicable Criteria involves performing procedures to assess whether the Applicable Criteria used by the directors in the compilation of the Pro forma Financial Information provide a reasonable basis for presenting the significant effects directly attributable to the Transaction and to obtain sufficient appropriate evidence about whether:
| • | | The related pro forma adjustments give appropriate effect to the Applicable Criteria; and |
| • | | The Pro forma Financial Information reflects the proper application of those pro forma adjustments to the unadjusted Published Financial Information. |
The procedures selected depend on the reporting accountant’s judgment, having regard to the reporting accountant’s understanding of the nature of the Company, the Transaction in respect of which the Pro forma Financial Information has been compiled and other relevant engagement circumstances.
The engagement also involves evaluating the overall presentation of the Pro forma Financial Information.
We believe that the evidence we have obtained is sufficient and appropriate to provide a basis for our opinion.
D-2
Opinion
In our opinion, the Pro forma Financial Information has been compiled, in all material respects, on the basis of the Applicable Criteria.
Yours faithfully
KPMG Inc.
(Signed)“KPMG Inc”
Per Jacques Erasmus
Chartered Accountants (SA)
Director
May 22, 2013
D-3
SCHEDULE D-2
UNAUDITED PRO FORMA FINANCIAL INFORMATION
UNAUDITED PRO FORMA FINANCIAL INFORMATION
The unaudited and unreviewed pro forma financial information has been prepared by management and are the responsibility of the Board of Directors and has been prepared for illustrative purposes only, to provide information about how the disposal of certain assets of Atlatsa Resources Corporation (“Atlatsa”) (previously Anooraq Resources Corporation) (viz: the sale of the mineral property interest of Boikgantsho Platinum Mine Proprietary Limited (“Boikgantsho”) and two farms (Paschaskraal and De Kamp) of Ga-Phasha Platinum Mine Proprietary Limited (“Ga-Phasha”)) to Rustenburg Platinum Mines Limited (“RPM”), a subsidiary of Anglo American Platinum Limited (“Anglo American Platinum”) and the associated refinancing and restructuring of Atlatsa’s debt with Anglo American Platinum, more fully described in the Information Circular (“the Restructuring Plan”) might have affected the reported financial information had the Restructuring Plan been undertaken on January 1, 2012 for the statement of comprehensive income and on December 31, 2012 for the statement of financial position purposes.
Because of its nature, the pro forma financial information may not present a fair reflection of the financial position, changes in equity, results of operations or cash flows of Atlatsa, after the Restructuring Plan.
Capitalized terms used herein and not otherwise defined have the meaning ascribed thereto in the Information Circular. Unless otherwise indicated, all amounts are in Canadian dollars ($).
The unaudited and unreviewed pro forma financial information of Atlatsa has been prepared using the accounting policies that comply with IFRS and that are consistent with those applied in the preparation of the audited consolidated financial statements of Atlatsa for the year ended December 31, 2012. The financial statements for the year ended December 31, 2012 has been issued with a modified audit opinion i.e., emphasis of matter, in respect of going concern.
The unaudited and unreviewed pro forma financial information should be read in conjunction with the Independent Reporting Accountants’ reasonable assurance report as set out in Schedule G2 of this Information Circular.
D-4
PRO FORMA FINANCIAL STATEMENTS FOR THE YEAR ENDED DECEMBER 31, 2012
Pro forma statement of financial position
| | | | | | | | | | | | | | |
As at December 31, 2012 (Expressed in Canadian Dollars) | |
| | | Before the
Restructuring Plan1 | | | Pro forma
adjustments | | | Notes | | After the
Restructuring
Plan | |
ASSETS | | | | | | | | | | | | | | |
Non-current assets | | | | | | | | | | | | | | |
Property, plant and equipment | | | 748,456,905 | | | | — | | | | | | 748,456,905 | |
Capital work-in-progress | | | 20,027,764 | | | | — | | | | | | 20,027,764 | |
Intangible assets | | | 801,928 | | | | — | | | | | | 801,928 | |
Mineral property interests | | | 8,036,659 | | | | — | | | | | | 8,036,659 | |
Goodwill | | | 10,234,394 | | | | — | | | | | | 10,234,394 | |
Platinum Producers’ environmental trust (restricted cash) | | | 3,250,760 | | | | — | | | | | | 3,250,760 | |
Other non-current assets | | | 231,425 | | | | — | | | | | | 231,425 | |
| | | | | | | | | | | | | | |
Total non-current assets | | | 791,039,835 | | | | — | | | | | | 791,039,835 | |
Current assets | | | | | | | | | | | | | | |
Assets classified as held for sale | | | 3,867,259 | | | | (3,867,259 | ) | | 2(a) | | | — | |
Inventories | | | 769,447 | | | | — | | | | | | 769,447 | |
Trade and other receivables | | | 3,272,400 | | | | — | | | | | | 3,272,400 | |
Current tax receivable | | | — | | | | — | | | | | | — | |
Cash and cash equivalents | | | 14,580,886 | | | | (2,455,755 | ) | | 2(b) | | | 12,125,111 | |
Restricted cash | | | 535,502 | | | | — | | | | | | 535,502 | |
| | | | | | | | | | | | | | |
Total current assets | | | 23,025,494 | | | | (6,323,034 | ) | | | | | 16,702,460 | |
| | | | | | | | | | | | | | |
Total assets | | | 814,065,329 | | | | (6,323,034 | ) | | | | | 807,742,295 | |
| | | | | | | | | | | | | | |
EQUITY AND LIABILITIES | | | | | | | | | | | | | | |
Equity | | | | | | | | | | | | | | |
Share capital | | | 71,967,083 | | | | 250,810,000 | | | 2(c)(d) | | | 322,777,083 | |
Treasury shares | | | (4,991,726 | ) | | | — | | | | | | (4,991,726 | ) |
Convertible preference shares | | | 162,910,000 | | | | (162,910,000 | ) | | 2(d) | | | — | |
Foreign currency translation reserve | | | (9,797,657 | ) | | | — | | | | | | (9,797,657 | ) |
Share-based payment reserve | | | 25,285,851 | | | | — | | | | | | 25,285,851 | |
Accumulated loss | | | (264,166,155 | ) | | | 213,631,476 | | | 2(e) | | | (50,534,679 | ) |
| | | | | | | | | | | | | | |
Total equity attributable to equity holders of the Group | | | (18,792,604 | ) | | | 301,531,476 | | | | | | 282,738,872 | |
Non-controlling interest | | | 224,049,827 | | | | 90,935,204 | | | 2(e) | | | 314,985,031 | |
| | | | | | | | | | | | | | |
Total equity | | | 205,257,223 | | | | 392,466,680 | | | | | | 597,723,903 | |
Liabilities | | | | | | | | | | | | | | |
Non-current liabilities | | | | | | | | | | | | | | |
Loans and borrowings | | | 434,968,189 | | | | (368,299,768 | ) | | 2(f) | | | 66,668,421 | |
Deferred taxation | | | 142,341,072 | | | | (36,281,970 | ) | | 2(g) | | | 106,059,102 | |
Provisions | | | 9,786,479 | | | | — | | | | | | 9,786,479 | |
| | | | | | | | | | | | | | |
Total non-current liabilities | | | 587,095,740 | | | | (404,581,738 | ) | | | | | 182,514,002 | |
Current liabilities | | | | | | | | | | | | | | |
Trade and other payables | | | 20,888,635 | | | | 5,792,024 | | | 2(h) | | | 26,680,659 | |
Short-term portion of loans and borrowings | | | 823,731 | | | | — | | | | | | 823,731 | |
| | | | | | | | | | | | | | |
Total current liabilities | | | 21,712,366 | | | | 5,792,024 | | | | | | 27,504,390 | |
| | | | | | | | | | | | | | |
Total liabilities | | | 608,808,106 | | | | (398,789,714 | ) | | | | | 210,018,392 | |
| | | | | | | | | | | | | | |
Total equity and liabilities | | | 814,065,329 | | | | (7,969,260 | ) | | | | | 807,742,295 | |
| | | | | | | | | | | | | | |
NAV per share | | | (0.09 | ) | | | | | | | | | 0.51 | |
TNAV per share | | | (0.15 | ) | | | | | | | | | 0.49 | |
Number of shares in issue | | | 201,888,473 | | | | | | | | | | 554,288,473 | |
Notes and assumptions to the unaudited and unreviewed pro forma statement of financial position
| | 1. | The figures set out in the “Before the Restructuring Plan” column above have been extracted without adjustment from the published audited annual financial statements of Atlatsa for the year ended December 31, 2012. |
D-5
| | 2. | The following notes and assumptions are applicable to the pro-forma adjustments: |
| | (a) | Derecognition of the Boikgantsho and Ga-Phasha mineral property interests as a result of the disposals of mineral property interests to RPM. |
| | (b) | Payment of transaction costs of $2,455,775 (ZAR20,953,709) incurred as a result of the Restructuring Plan (“Transaction costs”). |
| | (c) | The issue of 125,000,000 shares to RPM at R6.00 per share (*US$0.57) (total proceeds US$71,564,809 (*ZAR750,000,000.) (*$71,564,886)) (*Exchange rate as at May 21, 2013.) |
| | (d) | All “B” preference shares were converted into Atlatsa Common Shares. |
| | (e) | The pro forma adjustments impacting, accumulated loss and non-controlling interest as a result of the Restructuring Plan: |
| | | | | | | | | | | | | | | | | | |
| | | | | Owners of the Company | | | Non-controlling interest | |
| | | | | ZAR | | | $ | | | ZAR | | | $ | |
(i) | | Capitalisation of loans between Holdco and RPM | | | — | | | | — | | | | 778,651,487 | | | | 91,257,954 | |
(ii) | | Gain/(loss) on sale of the two Ga-Phasha farms | | | 1,433,960,712 | | | | 168,060,195 | | | | (716,696,807 | ) | | | (83,996,866 | ) |
(iii) | | Gain on sale of Boikgantsho mineral property interest | | | 497,028,000 | | | | 58,251,683 | | | | 452,711,000 | | | | 53,057,730 | |
(iv) | | Capital gains tax on the disposal of the mineral property interests | | | (25,204,200 | ) | | | (2,953,932 | ) | | | (24,215,800 | ) | | | (2,838,092 | ) |
(v) | | Fair value adjustment to Phase One transaction at September 28, 2012 | | | (62,036,642 | ) | | | (7,270,695 | ) | | | — | | | | — | |
(vi) | | Deferred tax liability at 31 December 2012 reversed for fair value gain recognised on September 28, 2012 and subsequent adjustments for loan between RPM & Holdco | | | — | | | | — | | | | 285,447,762 | | | | 33,454,478 | |
(vii) | | Transaction costs | | | (20,953,709 | ) | | | (2,455,775 | ) | | | — | | | | — | |
| | | | | | | | | | | | | | | | | | |
| | | | | 1,822,794,161 | | | | 213,631,476 | | | | 775,897,642 | | | | 90,935,204 | |
| | | | | | | | | | | | | | | | | | |
| | (f) | The pro forma adjustments impacting loans and borrowings as a result of the Restructuring Plan: |
| | | | | | | | |
| | | ZAR | | | $ | |
| | |
Capitalisation of loans between Holdco and RPM | | | (778,651,487 | ) | | | (91,257,954 | ) |
| | |
Repayment of debt to RPM from proceeds on sale of mineral property interests | | | (1,700,000,000 | ) | | | (199,240,000 | ) |
| | |
Repayment of debt to RPM from proceeds on sale of 125,000,000 shares at R6 per share | | | (750,000,000 | ) | | | (87,900,000 | ) |
| | |
Loss on recognition of new debt facility between RPM and Plateau | | | 86,162,003 | | | | 10,098,186 | |
| | | | | | | | |
| | | (3,142,489,484 | ) | | | (368,299,768 | ) |
| | | | | | | | |
D-6
| | (g) | Reversal of the deferred tax liability of $33,454,478 (ZAR285,447,762) recognised as a result of Phase One due to the capitalisation of the loans between RPM and Holdco and deferred tax on the fair value gain adjustment between Plateau and RPM of $2,827,492 (ZAR24,125,361). |
| | (h) | Capital gains tax payable on the disposal of the mineral property interests of $5,792,024 (ZAR49,420,000). |
| | (i) | The exchange rate to translate the pro forma adjustments was the December 31, 2012 spot of $0.1172/ZAR. |
| | (j) | The Consolidated Debt Facility attracts a reduced interest rate (below market related interest rate) during the initial terms. Subsequent to initial recognition these financial liabilities are measured at amortised cost using the effective interest method. As a result, a fair value gain on the initial recognition of the new debt is recognized (difference between the fair value of the debt and its face value) on the assumption that a market related interest rate is 3 month JIBAR plus 8 %. |
Pro forma statement of comprehensive income
| | | | | | | | | | | | | | |
For the twelve months ended December 31, 2012 (Expressed in Canadian Dollars) | |
| | | Before the
Restructuring Plan3 | | | Pro forma
adjustments | | | Notes | | After the Restructuring
Plan | |
Revenues | | | 117,557,331 | | | | — | | | | | | 117,557,331 | |
Cost of sales | | | (195,387,551 | ) | | | — | | | | | | (195,387,551 | ) |
| | | | | | | | | | | | | | |
Gross loss | | | (77,830,220 | ) | | | — | | | | | | (77,830,220 | ) |
Administrative expenses | | | (14,589,526 | ) | | | — | | | | | | (14,589,526 | ) |
Transaction costs | | | (822,621 | ) | | | (2,556,352 | ) | | 5(a) | | | (3,378,973 | ) |
Other income | | | 105,177 | | | | — | | | | | | 105,177 | |
Fair value gain | | | 90,589,136 | | | | (53,101,769 | ) | | 5(b) | | | 37,487,367 | |
Gain on disposal of mineral property interests | | | — | | | | 203,374,354 | | | 5(c) | | | 203,374,354 | |
| | | | | | | | | | | | | | |
Operating (loss)/profit | | | (2,548,054 | ) | | | 147,716,233 | | | | | | 145,168,179 | |
Finance income | | | 382,262 | | | | — | | | | | | 382,262 | |
Finance expense | | | (82,837,200 | ) | | | 75,304,957 | | | 5(d) | | | (7,532,243 | ) |
| | | | | | | | | | | | | | |
Net finance expense | | | (82,454,938 | ) | | | 75,304,957 | | | | | | (7,149,981 | ) |
| | | | | | | | | | | | | | |
(Loss)/profit before income tax | | | (85,002,992 | ) | | | 223,021,190 | | | | | | 138,018,198 | |
Income tax | | | (10,563,878 | ) | | | 7,752,909 | | | 5(e) | | | (2,810,969 | ) |
| | | | | | | | | | | | | | |
(Loss)/profit for the year | | | (95,566,870 | ) | | | 230,774,099 | | | | | | 135,207,229 | |
| | | | | | | | | | | | | | |
| | | | |
Other comprehensive (loss)/income | | | | | | | | | | | | | | |
Foreign currency translation differences for foreign operations | | | 2,415,302 | | | | — | | | 5(f) | | | 2,415,302 | |
Effective portion of changes in fair value of cash flow hedges | | | — | | | | — | | | 5(f) | | | — | |
Reclassification to profit or loss on settlement of cash flow hedge | | | — | | | | — | | | 5(f) | | | — | |
| | | | | | | | | | | | | | |
| | | 2,415,302 | | | | — | | | | | | 2,415,302 | |
| | | | | | | | | | | | | | |
| | | (93,151,568 | ) | | | 230,774,099 | | | | | | 137,622,531 | |
| | | | | | | | | | | | | | |
| | | | |
(Loss)/profit attributable to: | | | | | | | | | | | | | | |
Owners of the Company | | | (18,717,839 | ) | | | 236,537,611 | | | 5(g) | | | 217,819,772 | |
Non-controlling interest | | | (76,849,031 | ) | | | (5,763,512 | ) | | 5(g) | | | (82,612,543 | ) |
| | | | | | | | | | | | | | |
Loss for the year | | | (95,566,870 | ) | | | 230,774,099 | | | | | | 135,207,229 | |
| | | | | | | | | | | | | | |
| | | | |
Total comprehensive (loss)/profit attributable to: | | | | | | | | | | | | | | |
Owners of the Company | | | (17,236,373 | ) | | | 236,537,611 | | | | | | 219,301,238 | |
Non-controlling interest | | | (75,915,195 | ) | | | (5,763,512 | ) | | | | | (81,678,707 | ) |
| | | | | | | | | | | | | | |
Total comprehensive (loss)/profit for the year | | | (93,151,568 | ) | | | 230,774,099 | | | | | | 137,622,531 | |
| | | | | | | | | | | | | | |
| | | | |
Basic earnings/(loss) per share | | | (0.04 | ) | | | 0.44 | | | | | | 0.40 | |
Weighted number of shares | | | 424,791,411 | | | | — | | | | | | 549,791,411 | |
Diluted earnings/(loss) per share | | | (0.04 | ) | | | 0.43 | | | | | | 0.39 | |
Weighted diluted number of shares | | | 424,791,411 | | | | — | | | | | | 554,288,473 | |
Headline earnings/(loss) per share | | | (0.04 | ) | | | 0.44 | | | | | | 0.40 | |
Diluted headline earnings/(loss) per share | | | (0.04 | ) | | | 0.43 | | | | | | 0.39 | |
D-7
Notes and assumptions to the unaudited and unreviewed pro forma statement of comprehensive income
| | 3. | The figures set out in the “Before the Restructuring Plan” column above have been extracted without adjustment from the published audited consolidated annual financial statements of Atlatsa for the year ended December 31, 2012. |
| | 4. | It has been assumed that for the actual draw downs between RPM and Holdco from January 1, 2012, equals the fair value of the draw downs and that the effective interest rate is 13.59% for the full year. |
| | 5. | The following notes and assumptions are applicable to the proforma adjustments: |
| | (a) | Payment of transaction costs of $2,556,352 (ZAR20,953,709) incurred as a result of the Restructuring Plan. |
| | (b) | Reversal of fair value gain for Phase One and subsequent adjustments as recorded in the December 31, 2012 financial statements and recognised as $98,416,084 (ZAR806,689,212) if the transaction had taken place on January 1, 2012. A new fair value gain of $45,314,315 (ZAR 371,428,809) resulting from the initial recognition of the Consolidated debt facility (second tranche), draw downs during 2012 (second tranche) and IAS 39 AG8 adjustments was recorded for pro forma purposes. |
The Consolidated Debt Facility (The amendment of the Senior Term Loan Facilities Agreement dated June 12, 2009 between Plateau as borrower, and RPM as lender to increase the total amount available to repay the Operating Cash Shortfall Facility and redeem the A Preference Share Facility that was outstanding in the capital of each of Plateau, Holdco and Bokoni Platinum Mines Proprietary Limited at September 28, 2012) attracts a below market related interest rate during the initial terms. Subsequent to initial recognition these financial liabilities are measured at amortised cost using the effective interest method. As a result, a fair value gain on the initial recognition of the new debt is recognized (difference between the fair value of the debt and its face value) on the assumption that a market related interest rate is 3 month JIBAR plus 8 %.
D-8
| | (c) | Gain on disposal of the two farms in Ga-Phasha (Paschaskraal and De Kamp) of $87,506,196 (ZAR717,263,905) and the gain on disposal of the Boikgantsho mineral property interest of $115,868,158 (ZAR949,739,000). |
| | (d) | The pro forma adjustments impacting finance expense result of the Restructuring Plan: |
| | | | | | | | |
| | | ZAR | | | $ | |
| | |
Reversal of interest from January 1, 2012 to December 31, 2012 between Plateau and RPM | | | 383,365,568 | | | | 46,770,599 | |
| | |
Reversal of interest from January 1, 2012 to September 30, 2012 between Holdco and RPM | | | 304,522,485 | | | | 37,151,743 | |
| | |
Previously capitalized commitment fees expensed | | | 3,118,105 | | | | 380,409 | |
| | |
Interest on starting debt and subsequent draw downs | | | (73,752,416 | ) | | | (8,997,794 | ) |
| | | | | | | | |
| | | 617,253,741 | | | | 75,304,957 | |
| * | The reduced finance expense is of a continuing nature. |
| | (e) | The following transactions impact income tax: |
| | | | | | | | |
| | | ZAR | | | $ | |
| | |
Capital gains tax on sale of the 2 farms in Ga-Phasha | | | (49,420,000 | ) | | | (6,029,240 | ) |
| | |
Deferred tax on gain on starting debt at January 1, 2012 between Plateau and RPM | | | (90,308,313 | ) | | | (11,017,614 | ) |
| | |
Reversal of deferred tax recognised on fair value gains at December 31, 2012 | | | 175,346,425 | | | | 21,392,264 | |
| | |
Deferred tax on interest expense January 1, 2012 to December 31, 2012 | | | 14,759,995 | | | | 1,800,719 | |
| | |
Deferred tax on fair value AG8 adjustments | | | 7,279,642 | | | | 888,116 | |
| | |
Deferred tax on interest expense January 1,2012 to December 31, 2012 | | | 5,890,681 | | | | 718,664 | |
| | | | | | | | |
| | | 63,548,430 | | | | 7,752,909 | |
| | | | | | | | |
| | (f) | It is assumed that there are no changes to items disclosed under other comprehensive (loss)/income as other comprehensive income does not impact basic or diluted earnings per share. |
��
| | (g) | The following transactions impact owners of the company and non-controlling interest |
D-9
| | | | | | | | | | | | | | | | |
| | | Owners of the Company | | | Non-controlling interest | |
| | | ZAR | | | $ | | | ZAR | | | $ | |
| | | | |
Gain/(loss) on sale of the two Ga-Phasha farms | | | 1,433,960,712 | | | | 174,943,207 | | | | (716,696,807 | ) | | | (87,437,010 | ) |
| | | | |
Gain on sale of Boikgantsho mineral property interest | | | 497,028,000 | | | | 60,637,416 | | | | 452,711,000 | | | | 55,230,742 | |
Capital gains tax on the disposal of the mineral property interests | | | (25,204,200 | ) | | | (3,074,912 | ) | | | (24,215,800 | ) | | | (2,954,328 | ) |
| | | | |
Reversal of interest and fair value adjustments recorded for the 2012 year between Plateau and RPM | | | (391,213,929 | ) | | | (47,728,099 | ) | | | — | | | | — | |
| | | | |
Reversal of interest and fair value adjustments recorded for the 2012 year between Holdco and RPM | | | — | | | | — | | | | 272,412,770 | | | | 33,234,358 | |
| | | | |
Gain on settlement of debt between Plateau and RPM if Phase One took place on January 1, 2012 | | | 74,897,842 | | | | 9,137,537 | | | | — | | | | — | |
| | | | |
Gain on fair value of starting debt and draw downs | | | 232,221,377 | | | | 28,331,008 | | | | — | | | | — | |
| | | | |
Reversal of deferred tax raised on fair value gains and interest at December 31, 2012 | | | 191,652,026 | | | | 23,381,547 | | | | (16,305,601 | ) | | | (1,989,283 | ) |
| | | | |
Interest expense from January 1, 2012 to December 31, 2012 | | | (37,954,274 | ) | | | (4,630,421 | ) | | | (15,147,466 | ) | | | (1,847,991 | ) |
| | | | |
Fair value AG8 adjustments | | | (18,719,081 | ) | | | (2,283,728 | ) | | | — | | | | — | |
| | | | |
Previously capitalized commitment fees expensed | | | 3,118,105 | | | | 380,409 | | | | — | | | | — | |
| | | | |
Transaction costs | | | (20,953,709 | ) | | | (2,556,352 | ) | | | — | | | | — | |
| | | | | | | | | | | | | | | | |
| | | 1,938,832,869 | | | | 236,537,612 | | | | (47,241,904 | ) | | | (5,763,512 | ) |
| | | | | | | | | | | | | | | | |
| | (h) | The exchange rate used to translate pro forma profit or loss adjustments was the 12 month average for 2012 of $0.122/ZAR. |
| | (i) | The fair value gain between RPM and Holdco does not impact the Statement of comprehensive income as it impacts non-controlling interest |
| | 6. | Effect on share capital |
As a result of the transaction, share capital increased by $250,810,000 to $322,777,083 as a result of the “B” Preference shares being redeemed and the issue of shares to RPM. See 2 (c) and (d) above. The shares issued increased by 125,000,000 from the issue of shares to RPM and 227,400,000 from the conversion of the “B” Preference shares into Atlatsa common shares.
D-10
SCHEDULE E
EXECUTIVE SUMMARY OF THE COMPETENT PERSON’S REPORT
ON THE GA-PHASHA PROJECT
ExplorMine Consultants was commissioned by Anooraq Resources Corporation (“Anooraq”) to complete a Competent Person’s Report (“CPR”) in accordance with Section 12 of the JSE disclosure and listing requirements and following the principles of the South African Code for the Reporting of Exploration Results, Mineral Resources and Mineral Reserves (“SAMREC Code”), 2007 edition. On February 2, 2012 Anooraq Resources and Anglo American Platinum Limited (“Amplats”) announced an agreement (“Transaction”) to refinance Anooraq, restructure and recapitalize the Bokoni Operations. A new strategic plan for Bokoni resulting in the disposal of undeveloped platinum group metals ounces to Amplats, recapitalisation and refinancing of Anooraq and Bokoni, together with accelerated production growth at Bokoni Platinum Mine.
Anooraq Resources is a platinum group metals mining, exploration and development company, controlling the third largest Platinum Group Minerals (“PGM”) resource base in South Africa. Anooraq controls and operates the Bokoni Platinum Mines (“Bokoni Mine”), located on the Eastern Limb of the Bushveld Complex, and maintains an interest in the Ga-Phasha Project, located adjacent to Bokoni Mine and Kwanda Projects.
The subject of the CPR is the Mineral Resource Estimate for the Merensky and UG2 Reefs for the Ga-Phasha Project area, Limpopo Province, Republic of South Africa. The Mineral Resource estimation is based on historic drill hole and mining (chip sampling) data collected since the 1960’s to present.
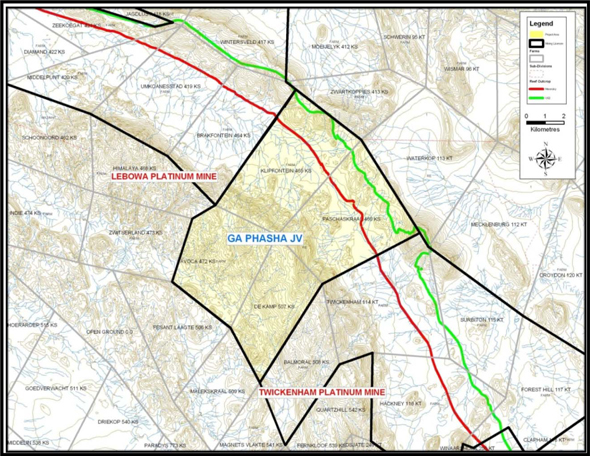
Figure A: Ga-Phasha Project area indicating the Western and Eastern Sections with topography,
Merensky and UG2 Reef outcrop positions are indicated.
E-1
This Report has been prepared based on technical reviews by ExplorMine Consultants since December 2009. The effective date of the CPR is the 26 February 2013. The Executive Summary is a true reflection of the full Competent Person’s Report.
| | 1.1 | History, Exploration and Mining |
The Ga-Phasha and adjacent Bokoni Platinum Mine has undergone several ownership and name changes since commissioning. The present day Bokoni Mine was commissioned as Atok Platinum Mine (Pty) Limited by Anglo Transvaal Consolidated Mines (“Anglovaal”) in 1969 and was subsequently acquired together with the Ga-Phasha Project area by Rustenburg Platinum Mines (“RPM”) Limited in 1977. RPM was a subsidiary of Johannesburg Consolidated Investments Limited (“JCI”), in which Anglo American Corporation (“AAC”) held a significant equity interest.
In the mid-1990s, JCI was ‘unbundled’ and its platinum interests were listed separately as Lebowa Platinum Mines Ltd (“LPM”), which was later merged with Anglo Platinum’s other mines to become a wholly owned subsidiary of Anglo Platinum Limited.
In 2008, Anooraq entered into a Transaction Framework Agreement with Anglo Platinum, whereby Anglo Platinum sold to Anooraq an effective 51% of Lebowa Platinum Mine and an additional 1% interest in each of the Ga-Phasha, Boikgantsho and Kwanda Joint Venture Projects, resulting in Anooraq holding a controlling interest in each of these projects, for a total cash consideration of ZAR3.6 billion (Lebowa Transaction). Lebowa Platinum Mine was renamed Bokoni Mine.
Anooraq is currently in possession of Converted Mining Rights in terms of item 7 of the Mineral and Petroleum Resources Development Act No. 28 of 2002. The original Mining Authorisations for the Ga-Phasha Project in terms of s.9(1) of the South African Minerals Act, 1991, were Old Order License No. 8/2004, comprising the farms Klipfontein 465 KS, Paschaskraal 466 KS Avoca 472 KS and De Kamp 507 KS.
The surface overlying the Ga-Phasha Project Property is owned by the State, and tenure of any future required areas would be held through various Surface Right Permits in terms of Section 90 of the Mining Rights Act of 1967, and lease agreements. As far as ExplorMine can ascertain Anooraq maintains the mineral tenure in good standing. Additional permits under the various sections of legislation, would also be required should mining proceed on the Property.
If the Ga-Phasha Project were to proceed there will be additional impact on the environment. The Ga-Phasha Project area is the subject of an Environmental Management Program approved as part of the conversion to a “New Order Mining Right” by all relevant interested and affected parties.
The Environmental Management Program includes a detailed ‘Environmental Closure Assessment’ detailing all areas of environmental liability. It is understood that Anooraq will ensure that the Rehabilitation Trust Fund is funded to cover the total environmental liability on closure of operations.
ExplorMine are not aware of any legal proceedings that may have an influence on the rights to prospect or mine for minerals.
Anglovaal drilled fifteen shallow Merensky Reef drill holes on the farm Klipfontein during the 1960’s. An extensive trenching programme along the UG2 Reef outcrop comprising 30 trenches was also conducted. The results of these programmes were obtained by RPM as part of the procurement of Anglovaal’s Atok interests.
The farm Paschaskraal had been the focus of Anglovaal’s drilling program in the 1960’s prior to the acquisition of the mineral rights by RPM and included drill holes to intersect the Merensky Reef. JCI/RPM had, however, secured significant mineral rights over properties held in trust by the State for various indigenous tribes on the Eastern Limb and exploration was progressed in order to determine the geological extent and characteristics of the Merensky and UG2 mineralisation. In the 1980’s JCI drilled additional drill holes to intersect the UG2 and Merensky Reefs.
E-2
Significant interest in the Eastern Limb was initiated in 1999 and was driven by the increasing demand (and robust forecast of demand) for PGMs. Since 2001 Anglo Platinum exploration activities have continued with a number major exploration drilling programmes and related activities after a strategic decision to increase total PGM production. The UG2 was identified as a major target in the Ga-Phasha Project area.
Recent exploration activities by Anglo Platinum (up to 2008) have included the upgrading of the geological Mineral Resources for the area and diamond drilling to improve the overall coverage.
Several sets of exploration and mining data and associated sampling and assay data have been acquired over time in the Ga-Phasha Project area by previous and current owners. The standards applicable to the collection and interpretation of these data have largely remained consistent. The exploration data includes the following:
| | • | | Underground drill holes (sourced from Bokoni Mine) |
| | • | | Underground channel sampling (sourced from Bokoni Mine) |
| | • | | Surface geological mapping |
| | • | | Underground geological mapping (sourced from Bokoni Mine) |
Diamond drilling represents by far the largest exploration datasets for the Ga-Phasha Project area.
The entire surface drilling in the Ga-Phasha Project area has been conducted by Anglo Platinum as the operator. Anglo Platinum employed contractors to conduct the drilling activity although diamond core logging and sampling was conducted by Anglo Platinum staff at the Driekop Exploration Base (located approximately 50 km southeast of Bokoni Mine). No single drilling contractor was used to complete the drilling and contracts were put out to tender at the beginning of each exploration phase.
The Bushveld Complex is situated in the northern half of South Africa and exists as an ellipse-shaped body consisting of five lobes. The Bushveld Complex is the world’s largest known ultramafic igneous intrusion, and extends approximately 450 km east to west and approximately 250 km north to south. It occupies parts of Limpopo Province, North-West Province, Gauteng Province and the Mpumalanga Province. It is estimated to have been formed approximately 2,000 million years ago. The Bushveld Complex is host to PGM mineralisation in addition to chrome, vanadium, nickel and copper.
The Ga-Phasha Project area is located on the northern extremity of the Eastern Limb of the Bushveld Complex. The platiniferous horizons of interest at the Ga-Phasha Project area are the Merensky and the UG2 reefs, located in lithologies of the Critical Zone of the Rustenburg Layered Suite. In the Eastern Limb, the Critical Zone is developed over about 150 km of strike length in three areas separated by regional faulted systems. The Merensky Reef and UG2 outcrop over about 130 km, but also occur in down-faulted blocks and erosional outliers. In the Eastern Limb, the Merensky Reef comprises a facies somewhat different when compared to the equivalent reef that is developed within the Western Limb. In common, however, is the fact that in both the Eastern and Western Limbs, the mineralisation is hosted within the pyroxenite and between relatively narrow (2 mm to 5 mm) chromitite layers. The chromitite forms useful mining contacts that visually define the position of the orebody.
Distinctive pegmatoidal pyroxenite, such as that which contains the bulk of the mineralisation of the Merensky Reef in the Western Limb is present beneath the lower chromitite stringer in the Eastern Limb and, whilst this unit does contain elevated PGE grades, the bulk of the continuous mineralisation is located within non-pegmatoidal (“porphyritic”) pyroxenite, but between two chromitite stringers.
Both the Merensky Reef and UG2 Reef horizons subcrop and in some instances outcrop in the area along a northwest-southeast trending strike length. The Bushveld Complex layering dips from northeast to southwest at approximately 14º to 18º. The general structural geology is characterised by north-northeast and west-east trending dykes and faults with associated conjugated joint sets.
E-3
Several structural and lithological features occur locally in the Ga-Phasha Project area which remove or result in the disruption of normal Merensky and UG2 Reef occurrence and mineralisation, these include:
| | • | | Potholes which occur in both the Merensky and UG2 Reefs |
| | • | | Bifurcation recorded only in the UG2 Reef horizon |
| | • | | Dykes including dolerite, diabase, lamprophyre and syenite dykes |
| | • | | Structural breaks including faults, shears and joints |
| | • | | Alteration features including veins and alteration zones |
| | • | | Pegmatiods and dunite replacement of the reefs |
The origin of the PGE’s in the Merensky and UG2 Chromitite remains contentious and several hypotheses explain some of the features observed.
The mining and exploration techniques employed at Bokoni Mine are well established within the Bushveld Complex style mineralisation. PGM mineralisation includes platinum (Pt), palladium (Pd), rhodium (Rh), and ruthenium (Ru), osmium (Os) and iridium (Ir).
The precious metals gold (Au) and silver (Ag) and the base metals chrome (Cr), iron (Fe,) cobalt (Co), nickel (Ni) and copper (Cu) are often associated with PGM metals.
A combination of desurveyed surface drill hole reef intercepts, previous structural interpretations, topography and an interpreted aeromagnetic survey was used by ExplorMine Consultants to complete a first principles structural interpretation. The top contacts, as determined during the reef coding process, of the Merensky and UG2 Reefs were wireframed as continuous surfaces honouring intersections.
Utilising boundary polygons and the reef intersections, wireframe surfaces were gridded. Mother surface drill holes were always used as the dominant indication of the surface as these intersections have downhole surveys. Where the mother drill hole intersection was not available the next sequential intersection was utilised.
A block modelling process was undertaken to allow estimation of the Merensky and UG2 Reefs in DatamineTM. Two types of block models were constructed to allow estimation. The first and main resource model type facilitated estimation of the main mineralised ‘interval’ for both the Merensky and UG2 Reefs. The secondary type of model facilitated the estimation of multiple 10 cm reef hangingwall and footwall layers. The top reef contact was used as a datum for the various block models.
The densities for each reef unit were estimated into the primary block models using the variography and values from the surface drilling sampling data. Parent cell ordinary kriging estimates were done for 4E mg/t, 4E g/t, Pt g/t, Pd g/t, Rh g/t, Au g/t, Cu %, Ni %, channel width (m) and relative density.
The Merensky Reef was split into two zones as defined by a study into the relationship between channel width and grade and metal content. Similarly the UG2 Reef was modelled in two zones.
In terms of the secondary block models for both the Merensky and UG2 Reefs, for each successive 10 cm reef hangingwall and footwall layer, three orthogonal block models were created initially on a zero elevation average plane, in the same dimensions as those constructed for the primary block model and constructed in the same geographical locations. Parent cell ordinary kriging estimates were done for 4E g/t, Pt g/t, Pd g/t, Rh g/t, Au g/t, Cu %, Ni % and relative density.
The top surface (zero elevation) of the primary block model was then used for a basis for ‘stacking’ the secondary hangingwall block model to create a multiple vertical cell block model above the reef composite. The basal contact of each composite was utilised as the zero point for stacking of the footwall 10 cm vertical cells. Composites were calculated from the stacked block models by the use of a process called MODTRA in DatamineTM to simulate a vertical single cell block model such that various iterations of Mineral Resource width could be generated.
E-4
The average local dip of the relevant reef wireframe was estimated into the block model and used to correct the volume (tonnage) increase required for a two-dimensional orthogonal block model to be represented on an inclined plane. Geological losses were applied to the Merensky and the UG2 Reef models. Losses include potholes, dykes, faults and IRUP’s (Iron Replacement Ultramafic Pegmatoids only applicable to the farm Brakfontein).
Geological losses related to the Merensky Reef potholes were estimated into 200 m (X direction) 100 m (Y direction) parent cells on the same model origin as the grade model estimate. A geostatistical study of the distribution of the size of potholes (area) and the distribution of potholes (number per unit area) was undertaken. Semi-variogram models were created and modelled from this data. The resultant of the Merensky Reef pothole estimate, the product of the number of potholes per block (200m by 100m) and the average area of those potholes was obtained. The total area of potholes versus the total area of the block could be calculated, thus providing a proxy for the potential geological loss related to potholes. Due to the small representative mined area, a low number of potholes population has been recorded in the UG2 at the Middlepunt Decline, hence a similar UG2 pothole estimation model could not be developed. A geological discount factor due to potholes of 9% was used for the UG2 Reef based on historical mining data.
A complete re-evaluation of the Mineral Resources has been performed based on a database that has been completely checked and corrected for entry errors. It is intended to perform an evaluation that will give a spatial expression of value distribution, so that the extraction of the PGM Mineral Resources can be planned efficiently. Hangingwall and footwall mineralisation was estimated in 10 cm layers, so mine management can decide what mining widths are most lucrative. In the central reef zone 4E plus the individual elements as well as channel widths, the cumulative 4E mg/t and relative density (RD) were estimated. Irrelevant hangingwall and footwall data was coded out (Zone Coding) of the data before initial composites were made for the purpose of experimental variograms. These limits were defined by obvious breaks in 4E mineralization.
Both the Merensky Reef and UG2 Reef exhibited outliers when the distributions were checked. Therefore top and bottom cutting of outliers was necessary during the generation of the semi-variograms. Top capping was applied where applicable for the estimation of the various parameters.
Ordinary kriging was used to estimate into a two-dimensional geological block model, which produced a two-dimensional spatial distribution of low and high grade in inclined reef structural blocks, which enables the design of single reef mining. Ordinary kriging was applied to Measured Resource, Indicated Resource and Inferred Mineral Resource categories. Ordinary kriging with a search equivalent to the range of the variogram model (with a minimum of 10 samples in the search radius) was done utilising variogram models from respective reef and facies. Each reef model estimate was inspected for conformity with the composite data used for the estimate. The estimation process as detailed resulted in a global non-depleted resource model. Adjustments to volumes were calculated for various geological and geotechnical factors.
E-5
| | | | | | | | | | | | | | | | | | | | | | | | | | | | | | | | | | | | | | | | | | | | |
| | | | | | Total 2012 | | | | | | | | | | | | | | | | | | | |
Mineral Resource Category | | Reef
Type | | | Tonnes
(million) | | | Grade
4E g/t | | | 4E
Kg’s
(‘000) | | | 4E
Moz | | | Pt
grade
g/t | | | Pd grade
g/t | | | Rh
grade
g/t | | | Au
grade
g/t | | | Cu
grade % | | | Ni
grade
% | |
Measured | | | MR | | | | 20.1 | | | | 4.52 | | | | 91.0 | | | | 2.9 | | | | 2.73 | | | | 1.35 | | | | 0.15 | | | | 0.30 | | | | 0.08 | | | | 0.21 | |
Indicated | | | MR | | | | 37.7 | | | | 4.97 | | | | 187.4 | | | | 6.0 | | | | 3.04 | | | | 1.44 | | | | 0.18 | | | | 0.31 | | | | 0.08 | | | | 0.21 | |
Meas + Ind | | | MR | | | | 57.8 | | | | 4.82 | | | | 278.4 | | | | 9.0 | | | | 2.93 | | | | 1.41 | | | | 0.17 | | | | 0.31 | | | | 0.08 | | | | 0.21 | |
Inferred | | | MR | | | | 177.8 | | | | 5.32 | | | | 946.0 | | | | 30.4 | | | | 3.25 | | | | 1.60 | | | | 0.18 | | | | 0.30 | | | | 0.09 | | | | 0.22 | |
| | | | | | | | | | | | | | | | | | | | | | | | | | | | | | | | | | | | | | | | | | | | |
| | | | | | Total 2012 | | | | | | | | | | | | | | | | | | | |
Mineral Resource Category | | Reef
type | | | Tonnes
(million) | | | Grade
4E g/t | | | 4E
Kg’s
(‘000) | | | 4E
Moz | | | Pt
grade
g/t | | | Pd grade
g/t | | | Rh
grade
g/t | | | Au
grade
g/t | | | Cu
grade
% | | | Ni
grade
% | |
Measured | | | UG2 | | | | 40.4 | | | | 6.00 | | | | 242.5 | | | | 7.8 | | | | 2.53 | | | | 2.86 | | | | 0.51 | | | | 0.10 | | | | 0.03 | | | | 0.15 | |
Indicated | | | UG2 | | | | 60.8 | | | | 5.84 | | | | 355.1 | | | | 11.4 | | | | 2.46 | | | | 2.79 | | | | 0.50 | | | | 0.10 | | | | 0.03 | | | | 0.15 | |
Meas + Ind | | | UG2 | | | | 101.2 | | | | 5.90 | | | | 597.6 | | | | 19.2 | | | | 2.49 | | | | 2.82 | | | | 0.50 | | | | 0.10 | | | | 0.03 | | | | 0.15 | |
Inferred | | | UG2 | | | | 123.0 | | | | 6.26 | | | | 769.8 | | | | 24.7 | | | | 2.61 | | | | 3.00 | | | | 0.54 | | | | 0.10 | | | | 0.04 | | | | 0.16 | |
| * | Oxidised Mineral Resources are included in the estimate as follows: |
Merensky Reef 7.98 Mt at 4.28 4E g/t and 1.10 Moz 4E
UG2 Reef 7.79 Mt at 5.98 4E g/t and 1.50 Moz 4E
| # | Mineralised Material not included in tabulation, above 75oC virgin rock temperature (greater than 2400 m below surface): |
Merensky Reef 0.45 Mt at 4.90 4E g/t and 0.07 Moz 4E
UG2 Reef 86.36 Mt at 6.24 4E g/t and 17.33 Moz 4E
Table i: Mineral Resource estimate for the Merensky Reef and UG2 Reefs for the Ga-Phasha Project area. A
4E paylimit of 245 cmg/t and 327 cmg/t for the Merensky and UG2 Reefs respectively has been applied.
(Tonnes and element kg’s have been rounded off to the appropriate level of accuracy).
Ga-Phasha – Western Section – 51% of which Attributable to Anooraq after Transaction
| | | | | | | | | | | | | | | | | | | | | | | | | | | | | | | | | | | | | | | | | | | | |
| | | | | | Farm – Klipfontein Total 2012 | | | | | | | | | | | | | | | | | | | |
Mineral Resource Category | | Reef
Type | | | Tonnes
(million) | | | Grade
4E g/t | | | 4E Kg’s
(‘000) | | | 4E
Moz | | | Pt
grade
g/t | | | Pd
grade
g/t | | | Rh
grade
g/t | | | Au
grade
g/t | | | Cu
grade
% | | | Ni
grade
% | |
Measured | | | MR | | | | 9.4 | | | | 4.28 | | | | 40.4 | | | | 1.3 | | | | 2.61 | | | | 1.24 | | | | 0.15 | | | | 0.28 | | | | 0.09 | | | | 0.20 | |
Indicated | | | MR | | | | 16.9 | | | | 4.48 | | | | 75.5 | | | | 2.4 | | | | 2.76 | | | | 1.28 | | | | 0.15 | | | | 0.29 | | | | 0.09 | | | | 0.21 | |
Meas + Ind | | | MR | | | | 26.3 | | | | 4.41 | | | | 115.9 | | | | 3.7 | | | | 2.70 | | | | 1.27 | | | | 0.15 | | | | 0.29 | | | | 0.09 | | | | 0.21 | |
Inferred | | | MR | | | | 31.8 | | | | 4.65 | | | | 147.8 | | | | 4.8 | | | | 2.85 | | | | 1.35 | | | | 0.17 | | | | 0.28 | | | | 0.08 | | | | 0.22 | |
| | | | | | | | | | | | | | | | | | | | | | | | | | | | | | | | | | | | | | | | | | | | |
| | | | | | Farm – Klipfontein Total 2012 | | | | | | | | | | | | | | | | | | | |
Mineral Resource Category | | Reef
type | | | Tonnes
(million) | | | Grade
4E g/t | | | 4E Kg’s
(‘000) | | | 4E
Moz | | | Pt
grade
g/t | | | Pd
grade
g/t | | | Rh
grade
g/t | | | Au
grade
g/t | | | Cu
grade
% | | | Ni
grade
% | |
Measured | | | UG2 | | | | 15.6 | | | | 5.75 | | | | 89.8 | | | | 2.9 | | | | 2.44 | | | | 2.72 | | | | 0.51 | | | | 0.10 | | | | 0.04 | | | | 0.16 | |
Indicated | | | UG2 | | | | 34.2 | | | | 5.74 | | | | 196.3 | | | | 6.3 | | | | 2.41 | | | | 2.73 | | | | 0.51 | | | | 0.09 | | | | 0.04 | | | | 0.15 | |
Meas + Ind | | | UG2 | | | | 49.8 | | | | 5.75 | | | | 286.1 | | | | 9.2 | | | | 2.42 | | | | 2.73 | | | | 0.51 | | | | 0.09 | | | | 0.04 | | | | 0.16 | |
Inferred | | | UG2 | | | | 37.1 | | | | 6.20 | | | | 229.9 | | | | 7.4 | | | | 2.58 | | | | 2.97 | | | | 0.55 | | | | 0.10 | | | | 0.04 | | | | 0.16 | |
E-6
| | | | | | | | | | | | | | | | | | | | | | | | | | | | | | | | | | | | | | | | | | | | |
| | | | | | Farm – Avoca Total 2012 | | | | | | | | | | | | | | | | | | | |
Mineral Resource Category | | Reef
Type | | | Tonnes
(million) | | | Grade
4E g/t | | | 4E Kg’s
(‘000) | | | 4E
Moz | | | Pt
grade
g/t | | | Pd
grade
g/t | | | Rh
grade
g/t | | | Au
grade
g/t | | | Cu
grade
% | | | Ni
grade
% | |
Measured | | | MR | | | | | | | | | | | | | | | | | | | | | | | | | | | | | | | | | | | | | | | | | |
Indicated | | | MR | | | | | | | | | | | | | | | | | | | | | | | | | | | | | | | | | | | | | | | | | |
Meas + Ind | | | MR | | | | | | | | | | | | | | | | | | | | | | | | | | | | | | | | | | | | | | | | | |
Inferred | | | MR | | | | 64.7 | | | | 5.13 | | | | 331.8 | | | | 10.7 | | | | 3.11 | | | | 1.56 | | | | 0.17 | | | | 0.28 | | | | 0.09 | | | | 0.21 | |
| | | | | | | | | | | | | | | | | | | | | | | | | | | | | | | | | | | | | | | | | | | | |
| | | | | | Farm – Avoca Total 2012 | | | | | | | | | | | | | | | | | | | |
Mineral Resource Category | | Reef
type | | | Tonnes
(million) | | | Grade
4E g/t | | | 4E Kg’s
(‘000) | | | 4E
Moz | | | Pt
grade
g/t | | | Pd
grade
g/t | | | Rh
grade
g/t | | | Au
grade
g/t | | | Cu
grade
% | | | Ni
grade
% | |
Measured | | | UG2 | | | | | | | | | | | | | | | | | | | | | | | | | | | | | | | | | | | | | | | | | |
Indicated | | | UG2 | | | | | | | | | | | | | | | | | | | | | | | | | | | | | | | | | | | | | | | | | |
Meas + Ind | | | UG2 | | | | | | | | | | | | | | | | | | | | | | | | | | | | | | | | | | | | | | | | | |
Inferred | | | UG2 | | | | 23.2 | | | | 6.50 | | | | 150.8 | | | | 4.8 | | | | 2.71 | | | | 3.12 | | | | 0.56 | | | | 0.10 | | | | 0.04 | | | | 0.16 | |
Table ii: Mineral Resource estimate for the Merensky Reef and UG2 Reefs for the Western Section of the Ga-Phasha
Project area. A 4E paylimit of 245 cmg/t and 327 cmg/t for the Merensky and UG2 Reefs respectively
has been applied. (Tonnes and element kg’s have been rounded off to the appropriate level of accuracy).
Ga-Phasha – Eastern Section of which 100% Attributable to Anglo Platinum after Transaction
| | | | | | | | | | | | | | | | | | | | | | | | | | | | | | | | | | | | | | | | | | | | |
| | | | | | Farm Paschaskraal Total 2012 | | | | | | | | | | | | | | | | | | | |
Mineral Resource Category | | Reef
Type | | | Tonnes
(million) | | | Grade
4E g/t | | | 4E
Kg’s
(‘000) | | | 4E
Moz | | | Pt
grade
g/t | | | Pd
grade
g/t | | | Rh
grade
g/t | | | Au
grade
g/t | | | Cu
grade
% | | | Ni
grade
% | |
Measured | | | MR | | | | 10.7 | | | | 4.74 | | | | 50.6 | | | | 1.6 | | | | 2.83 | | | | 1.45 | | | | 0.15 | | | | 0.31 | | | | 0.08 | | | | 0.21 | |
Indicated | | | MR | | | | 20.8 | | | | 5.37 | | | | 111.9 | | | | 3.6 | | | | 3.28 | | | | 1.58 | | | | 0.20 | | | | 0.33 | | | | 0.08 | | | | 0.22 | |
Meas + Ind | | | MR | | | | 31.5 | | | | 5.16 | | | | 162.5 | | | | 5.2 | | | | 3.12 | | | | 1.53 | | | | 0.18 | | | | 0.32 | | | | 0.08 | | | | 0.21 | |
Inferred | | | MR | | | | 23.2 | | | | 5.58 | | | | 129.1 | | | | 4.1 | | | | 3.37 | | | | 1.65 | | | | 0.19 | | | | 0.35 | | | | 0.07 | | | | 0.22 | |
| | | | | | | | | | | | | | | | | | | | | | | | | | | | | | | | | | | | | | | | | | | | |
| | | | | | Farm Paschaskraal Total 2012 | | | | | | | | | | | | | | | | | | | |
Mineral Resource Category | | Reef
type | | | Tonnes
(million) | | | Grade
4E g/t | | | 4E
Kg’s
(‘000) | | | 4E
Moz | | | Pt
grade
g/t | | | Pd
grade
g/t | | | Rh
grade
g/t | | | Au
grade
g/t | | | Cu
grade
% | | | Ni
grade
% | |
Measured | | | UG2 | | | | 24.8 | | | | 6.15 | | | | 152.7 | | | | 4.9 | | | | 2.59 | | | | 2.96 | | | | 0.51 | | | | 0.10 | | | | 0.03 | | | | 0.15 | |
Indicated | | | UG2 | | | | 26.6 | | | | 5.96 | | | | 158.8 | | | | 5.1 | | | | 2.51 | | | | 2.86 | | | | 0.49 | | | | 0.10 | | | | 0.03 | | | | 0.15 | |
Meas + Ind | | | UG2 | | | | 51.5 | | | | 6.05 | | | | 311.5 | | | | 10.0 | | | | 2.55 | | | | 2.91 | | | | 0.50 | | | | 0.10 | | | | 0.03 | | | | 0.15 | |
Inferred | | | UG2 | | | | 33.6 | | | | 6.09 | | | | 204.6 | | | | 6.6 | | | | 2.54 | | | | 2.94 | | | | 0.51 | | | | 0.10 | | | | 0.04 | | | | 0.16 | |
E-7
| | | | | | | | | | | | | | | | | | | | | | | | | | | | | | | | | | | | | | | | | | | | |
| | | | | | Farm Dekamp Total 2012 | | | | | | | | | | | | | | | | | | | |
Mineral Resource Category | | Reef
Type | | | Tonnes
(million) | | | Grade
4E g/t | | | 4E
Kg’s
(‘000) | | | 4E
Moz | | | Pt
grade
g/t | | | Pd
grade
g/t | | | Rh
grade
g/t | | | Au
grade
g/t | | | Cu
grade
% | | | Ni
grade
% | |
Measured | | | MR | | | | | | | | | | | | | | | | | | | | | | | | | | | | | | | | | | | | | | | | | |
Indicated | | | MR | | | | | | | | | | | | | | | | | | | | | | | | | | | | | | | | | | | | | | | | | |
Meas + Ind | | | MR | | | | | | | | | | | | | | | | | | | | | | | | | | | | | | | | | | | | | | | | | |
Inferred | | | MR | | | | 58.2 | | | | 5.80 | | | | 337.4 | | | | 10.8 | | | | 3.57 | | | | 1.75 | | | | 0.19 | | | | 0.30 | | | | 0.09 | | | | 0.22 | |
| | | | | | | | | | | | | | | | | | | | | | | | | | | | | | | | | | | | | | | | | | | | |
| | | | | | Farm Dekamp Total 2012 | | | | | | | | | | | | | | | | | | | |
Mineral Resource Category | | Reef
type | | | Tonnes
(million) | | | Grade
4E g/t | | | 4E
Kg’s
(‘000) | | | 4E
Moz | | | Pt
grade
g/t | | | Pd
grade
g/t | | | Rh
grade
g/t | | | Au
grade
g/t | | | Cu
grade
% | | | Ni
grade
% | |
Measured | | | UG2 | | | | | | | | | | | | | | | | | | | | | | | | | | | | | | | | | | | | | | | | | |
Indicated | | | UG2 | | | | | | | | | | | | | | | | | | | | | | | | | | | | | | | | | | | | | | | | | |
Meas + Ind | | | UG2 | | | | | | | | | | | | | | | | | | | | | | | | | | | | | | | | | | | | | | | | | |
Inferred | | | UG2 | | | | 29.1 | | | | 6.34 | | | | 184.5 | | | | 5.9 | | | | 2.68 | | | | 3.02 | | | | 0.53 | | | | 0.11 | | | | 0.03 | | | | 0.15 | |
Table iii: Mineral Resource estimate for the Merensky Reef and UG2 Reefs for the Eastern Section of the Ga-Phasha
Project area. A 4E paylimit of 245 cmg/t and 327 cmg/t for the Merensky and UG2 Reefs respectively
has been applied. (Tonnes and element kg’s have been rounded off to the appropriate level of accuracy).
| | 1.4 | Mineral Asset Valuation |
Minxcon (Pty) Ltd (“Minxcon”) has been retained by the Board of Directors of Anooraq to determine the mineral asset value of the Ga-Phasha Project which is to be used in the fair and reasonable opinion of the transaction between Anooraq and Anglo Platinum.
The values that were derived for Ga-Phasha East after applying three valuation methods to the Resources are set out in the table below:
| • | | Value Range for Ga-Phasha East Project |
| | |
Valuation Method | | Indicated Values for Ga-Phasha East |
Comparative (UG2) | | ZAR595 million to ZAR1,776 million |
Comparative (MR) | | ZAR222 million to ZAR771 million |
Historical Cost1 | | ZAR361 million to ZAR371 million |
Discounted Cash Flow (UG2)2 | | ZAR429 million to ZAR837 million |
Notes:
| | 1. | Includes Anglo Platinum and Atlatsa exploration costs. |
| | 2. | Includes the Anglo Platinum–Twickenham synergies. |
| | • | | Owing to the short strike length, access to the ore body is restricted to one decline. |
| | • | | Historical cost and comparative valuations were treated as if on a standalone basis. However, these values do not fully reflect the impact of synergy/non-synergy. Considering the shape of the lease area, the value of Ga-Phasha was further discounted and valued at the lower end of the comparative value range. |
E-8
| | • | | Considering the exploration history, Minxcon has lower confidence in the exploration expenditure provided. All the exploration expenditure could not be sourced. This includes the expenditure incurred by Anglovaal and Johannesburg Consolidated Investments Limited (“JCI”), albeit small in relation to Anglo Platinum and Atlatsa cost spent. |
| | • | | In the DCF calculation, mining in the first 30 years will be focused on the UG2; hence, the value impact of the Merensky Reef is limited owing to the time value of money. However, it is the opinion of the valuator that value should be considered for the Merensky Reef, albeit at the lower end of the valuation curve. |
| | • | | Mining at Twickenham is focused on the UG2 only. This should also be considered when valuing the Project as a standalone. Building a new plant for the Project will require significantly higher capital expenditure. |
| | • | | On a standalone basis, assuming the Ga-Phasha Area is bought by a third party, the DCF value reflects a significantly lower value. This takes into account a lower payability (assuming that concentrate metal content will be sold at approximately 85% of metal prices) and higher capital expenditure. |
A lower and upper valuation range for the UG2 was estimated at between ZAR520 million and ZAR700 million. Although Merensky Reef will not be mined in the near future due to plant capacity constraints, Minxcon is of the opinion that the Resource does have value in the hands of Anglo Platinum. A value at the lower end of the value range of ZAR220 million was placed on the Merensky Reef Resource. Minxcon is therefore of the opinion that a valuation of ZAR740 to ZAR950 million represents a total value for the Ga-Phasha mineral assets.
| | 1.5 | Conclusions and Recommendations |
This CPR is intended to fulfil two basic objectives:
| | • | | To compile a SAMREC compliant Mineral Resource Estimate for the Merensky and UG2 Reefs for the Ga-Phasha Project area. |
| | • | | To guide management in the identification of potential mining and exploration target areas, by providing a spatial expression of the estimated Mineral Resource. |
This CPR and the technical work on which it is based, provide a compliant Mineral Resource Estimate. An estimated block model has been constructed and can be used as a tool to guide future exploration and mining decision making.
ExplorMine Consultants and Anooraq geologists collectively have extensive experience in the geology of the Ga-Phasha Project area Bushveld Complex style of mineralisation and estimation thereof based on all available historic and recent exploration and mining data.
A combination of historic and recent desurveyed surface drill hole reef intercepts and an aeromagnetic survey completed by Anglo Platinum were used by ExplorMine Consultants in a complete first principles structural interpretation.
The Mineral Resource estimate presented in this Report for the Merensky and UG2 Reefs is based on several sets of data. This data was collected over an extended period of time from the 1960’s through to present. The data set includes surface diamond drill holes represented by electronic databases, geophysical data and underground channel sampling data from the adjacent Bokoni Platinum Mine.
ExplorMine Consultants has completed its own assessment and validations on primary data, and considers the validity and quality of the historic and recent data to be reasonable. The data complies with acceptable standards and norms and is considered of sufficient quality for use in Mineral Resource Estimates.
Geological modelling recognises two distinct geological zones in both the Merensky and UG2 Reefs. These zones have been used as a basis for geostatistical modelling.
E-9
ExplorMine Consultants has in preparation of this Report on the Mineral Resource estimate collated and compiled a single comprehensive composite database consisting of surface drill hole composites and chip sampling composites. All composite data has been corrected for dip and therefore true width has been accounted for. All of the composites were coded for project area, source type (drill holes and channel sampling), reef type (Merensky or UG2 Reef), facies and reef disturbance (pothole or bifurcation).
Although much of the drill hole data, historic and recent, is already stored in electronic format, database codes and protocols are not standardised. In addition the channel sampling database on-site does not have the capacity to store individual prill splits, only the 4E value is stored.
A block modelling process was undertaken to allow estimation of the Merensky and UG2 Reefs in DatamineTM. The resultant block models are designed to facilitate the use of mineral optimisation software.
Kriging was used to estimate into a geological block model, which produced a spatial distribution of low and high grade in reef structural blocks, which enables the design of single reef mining. Ordinary kriging was applied to Measured, Indicated and Inferred Mineral Resource categories. The mineral Resource estimation process has been audited and reconciled as presented in Sections 17 and 19.2.
As a consequence of the Mineral Resource Estimate and associated review of source data for the estimate as detailed in this report, ExplorMine Consultants recommend that Anooraq staff focus on several areas relating to the drill hole database and geological zone/facies definition.
In addition, ExplorMine Consultants also recommends that a study of the vertical mineralisation profile for the Merensky Reef versus the lithology or stratigraphic profile be initiated. It is clear from initial studies that the mineralisation profile relative to the lithology profile changes from one geographic area to another. This may have implications for the determinations of mining profiles or cuts.
No additional exploration is planned on the Ga-Phasha Project at this stage.
E-10
SCHEDULE F
EXECUTIVE SUMMARY OF THE COMPETENT PERSON’S REPORT
OF THE BOIKGANTSHO PROJECT
| | |
 | | Anooraq Resources Corporation |
| | Technical Report The Mineral Resource Estimation For The Platreef for the Boikgantsho Project Limpopo Province Republic of South Africa |
| |
| |
| |
| |
| |
| | Pursuant to SAMREC, SAMVAL and JSE Section 12 Listings Requirements |
| | Prepared for: |
| | Anooraq Resources Corporation. 4th Floor, 82 Grayston Drive Sandton South Africa |
| |
| |
| |
| | Prepared by: |
| | 
|
| | Kai Batla Minerals |
| | |
 | | 26 Republic Road, Kai Batla House |
| | |
| | Bordeaux |
| | South Africa |
| | Project Reference Number |
| | KB 1AQ01112011 |
| | February 27th, 2013 |
F-1
Technical Report
The Mineral Resource Estimation
For The
Platreef for the Boikgantsho Project
Limpopo Province
Republic of South Africa
Anooraq Resources Corporation
4th Floor, 82 Grayston Drive
Sandton, South Africa
2146
Kai Batla Minerals
26 Republic Road, Kai Batla House
Bordeaux, South Africa
2194
Tel: +27-11-326-0112 Fax: +27-86-545-2720
E-mail:geoconsult@kaibatla.co.za Web site:www.kaibatla.co.za
Kai Batla Project Number 1AQ01112011
Effective Date:
27 February 2013
Prepared by:
Dexter S. Ferreira
BSc. (Geology), BEng. (Mining), Pri.Sci.Nat.
Avinash Bisnath
PhD (Geology), MGSSA, Pr.Sci.Nat
F-2
| | |
| | The Directors Anooraq Resources Corporation 4th Floor, 82 Grayston Drive Sandton South Africa Dear Sirs, EXECUTIVE SUMMARY (SV T2.1) On February 2, 2012, Anooraq Resources Corporation (“Anooraq” or “the Company) and Anglo Platinum announced an agreement (the “Proposed Transaction”) to refinance Anooraq and restructure and recapitalize the Bokoni operations. The Proposed Transaction will include, among other things, the sale by Anooraq to Anglo Platinum of 100% of Anooraq’s interest in the Boikgantsho Project. Purpose and Project Outline |
| |
| 12.9(h)i & ii | | The directors of Anooraq requested that Kai Batla Mineral Industry Consultants (“Kai Batla”) prepare a Technical Report (“CPR”) compliant with the South African Mineral Resource Code (“SAMREC”), incorporating a valuation (“the Valuation”) compliant with the South African Code for the Reporting of Mineral Asset Valuation (“the SAMVAL Code”), and finally compliant with all the requirements of Section 12 Listings Requirements of the Johannesburg (“JSE”) Listings Requirements, for their Boikgantsho Project. Each section of the report is designated with the relevant SAMREC Code Table 1 reference number (SR T) and SAMVAL Code Table 2 reference number (SV T). This CPR incorporates the Valuation completed by Minxcon Pty Ltd (“Minxcon”) entitled: “Mineral Asset Valuation on the Boikgantsho project Area in Limpopo province, South Africa” by Mr. NJ Odendaal. |
| |
| | Anooraq is a platinum group metals mining, exploration and development company, controlling the third largest PGM resource base in South Africa. Anooraq controls and operates the Bokoni Platinum Mines, located on the eastern limb of the Bushveld Complex, and maintains a controlling interest in the Ga-Pasha Project, located adjacent to Bokoni, and the Boikgantsho and Kwanda Projects. |
| |
| | Property and Location |
| |
| 12.9(h)iii | | The 3 095 hectare Boikgantsho Project is situated in the Limpopo Province of the Republic of South Africa (“RSA” or “South Africa”), some 275km north-northeast of Johannesburg. Located at latitude 24° South and longitude 29° East, the project comprises all or portions of 20 farms (“claims”); see figure below. |
F-3
| | |
| | 
|
12.9(h)iv | | Legal Aspects The Project consists of two contiguous farms, Drenthe and Witrivier each with its own new order prospecting right. Boikgantsho Platinum Mines (Pty) Ltd has the option to acquire the northern portion of the Overysel from Anglo Platinum, on completion of a feasibility study. All mineral rights are currently held by Boikgantsho Platinum Mines (Pty) Ltd. Anooraq has a number of other exploration projects that are contiguous to the Boikgantsho property, which do not form part of this Technical Report. |
| | Project Tenement Details |
| | | | | | | | |
Mineral Rights Owner | | Year Acquired | | Farm Name | | Portion | | Area (hectares) |
DME | | 1999 | | Witrivier 777 LR | | 1 | | 767.42 |
| | 1999 | | Witrivier 777 LR | | Re | | 788.97 |
| | | | | | | | |
Total Area: | | | | | | | | 1556.39 |
| | | | | | | | |
LMT | | 1999 | | Drenthe 778 LR | | All | | 1,538.30 |
| | | | | | | | |
Total Area: | | | | | | | | 1,538.30 |
| | | | | | | | |
PRIVATE | | 2003 | | Overysel 815 LR | | % of All | | 637.57 |
| | | | | | | | |
Total Area: | | | | | | | | 637.57 |
| | | | | | | | |
Total Land Holdings (hectares) | | | | | | | | 3,732.26 |
| | | | | | | | |
| | |
| | In November 2003, Anooraq, and its wholly owned South African subsidiary Plateau Resources (Pty) Ltd. (together “Anooraq”), entered into a Joint Venture Agreement with Potgietersrust Platinums Ltd. (“PPRust”), a wholly owned subsidiary of Anglo American Platinum Corporation Limited (together “Anglo Platinum”) to explore and develop platinum group metals (“PGM”), gold and nickel mineralization on the Drenthe farm and the adjacent northern portion of the Overysel farm. Pursuant to the terms of the Joint Venture Agreement, Anooraq and Anglo Platinum will form an initial 50/50 Joint Venture (“the JV”) to explore Drenthe and the northern portion of the Overysel farm for a period of up |
F-4
| | |
| | to five years. During the period, Anooraq will operate exploration programs, and spend up to ZAR12.35 million (about US$1.76 million) on behalf of the JV. Anooraq will then have the option to proceed on a year-by-year basis and to take the project to a Bankable Feasibility Study (“BFS”). Once the BFS has been completed, either or both of the partners in the JV will have the option to proceed to exploitation. If both partners decide to proceed, then a joint management committee will be established to oversee development and operations. The ultimate Joint Venture interest allotted to Anooraq and PPRust will be determined according to the proportion of contained metal within the Drenthe deposit that lies on the ground contributed by each, as determined by the BFS. PPRust has the option to dilute to a minimum 12.5% non-contributory interest, adjusted depending to the final PGM royalty established under the Mineral and Petroleum Royalty Bill to a maximum of 15%. During development, the JV will be seeking a Black Economic Empowerment business partner to participate in the project, with the JV partners dividing the remaining interest. Anglo Platinum has undertaken to enter into a PGM Mineralization or Concentrate Purchase and Disposal Agreement at the exploitation phase, based on standard commercial terms, whereby PGM produced from the operation would potentially be treated at Anglo Platinum’s facilities. Anglo Platinum recently completed construction of a new PGM smelter at Polokwane, located about 80 kilometers east of Drenthe. Transaction between Anooraq and Anglo American Platinum On February 2, 2012, Anooraq and Anglo American Platinum Ltd (“Amplats”) announced that they have agreed to refinance Anooraq, structure and recapitalize the Bokoni Platinum group of companies. The related key highlights of this transaction for Anooraq include: • Disposal of Anooraq’s entire interest in the Boikgantsho deposit to Amplats and utilize these proceeds to partially reduce Anooraq’s debt to Amplats; • Providing Anooraq with a working capital facility to fund its corporate and administrative expenses through to 2015; and • Reducing Anooraq’s cost of borrowing. Under this financial restructuring transaction has allowed for Anooraq not being required to issue any new equity. Geology Setting Description |
| |
| 12.9(h)v | | The Bushveld Complex comprises an array of diverse igneous rocks ranging in composition from ultramafic to felsic. Different minerals were formed as the magma cooled. These minerals accumulated into sub–horizontal layers, building from the base of the chamber. Some low outcrops of Lower Critical Zone feldspathic pyroxenites are present in the northern part of the remaining extent of the farm Rooderand (immediately east of Anooraq’s Rooderand 46 JQ Portion 2), where chrome mining has taken place. The southern part of the farm is thought to be underlain by the upper Critical and Main Zones. It is believed that the Upper Zone underlies the southern parts of the farm Rooderand and the eastern parts of the farm Zandspruit and the farm Ruighoek. |
| |
| | In general, mineralization occurs as visible sulphide content which serves as a useful proxy for PGM concentration. Base metal sulphide (“BMS”) mineralization is characterized by cuspate to blebby, intercumulus sulphide phases of varying grain size. The main BMS in the Platreef are pyrrhotite and chalcopyrite, with pyrrhotite typically in excess of chalcopyrite, along with minor pentlandite and pyrite. Most of the Platreef rock package carries at least some PGM mineralization, so any description of the distribution of mineralization is dependent on a chosen cut-off grade, otherwise much of the total rock package could be considered ‘mineralized’. These ‘chemically defined’ zones usually lie subparallel to the general igneous stratigraphy, but are not necessarily confined to any specific layer or rock type within the heterogeneous rock package. Overall, higher concentrations of PGM are typically associated with olivine-bearing rocks, especially at their contacts with norite or gabbronorite. |
F-5
| | |
| 12.9(h)vi | | Exploration Program and Budget Exploration on the properties comprising Anooraq’s Platreef Project has been sporadic, even though a number of historic drillholes intersected PGM mineralization on the farm Drenthe 778LR. Since 2000, Anooraq has been exploring the Project, completing geological and drilling programs in 2000, 2002, 2004 and 2005. |
| |
| | In late 2003, the Boikgantsho Joint venture was established to explore the Drenthe, Witrivier and the northern part of Overysel farms. In 2004, Anooraq as operator completed 36,478 m of infill and step out drilling on the three farms, significantly increasing the size of the Drenthe deposit and identifying a second deposit on the northern part of Overysel farm. Drilling to September 2004 outlined total indicated resources in the two deposits of 176.6 million tonnes grading 1.35 g/t 3PGM and 0.13% nickel, and additional inferred resources in the two deposits of 104.1 million tonnes grading 1.23 g/t 3PGM and 0.14% nickel, both estimated at a $20 gross metal value per tonne (GMV/t) cut-off1. In June 2005, two exploration holes were drilled on the farm Swerwerskraal, for a total of 535.1 meters. Although Platreef-like rocks were intersected, only sporadic thin intervals of PGM mineralization were encountered in these drillholes. Key Environmental Issues |
| |
| 12.9(h)viii | | The current environmental management plan (“EMP”) in support of the prospecting right application for the Project and the Environmental Impact Assessment (“EIA”) was approved and is available at the Company’s Head Office, so that the reader of this Report can make a reasoned and balanced judgement regarding any potential liabilities, undertakings by the applicant and any additional requirements determined by the Department of Mineral Resources (“DMR”) and agreed to by the Applicant. |
| |
| | Mineral Resources Historical In late 2004, a Mineral Resource estimate was prepared by Geologix (Pty) Ltd. based on a geological model also prepared by Geologix; see table below. The Qualified Person responsible for the declaration of the Mineral Resource for Boikgantsho was D. van der Heever, Pri.Sci.Nat. Mineral Resource as Reported by Geologix – December 20042 |
| | | | | | | | | | | | | | | | | | | | | | | | | | |
AREA | | Category | | Tonnes | | | Pt
(g/t) | | | Pd
(g/t) | | | Au
(g/t) | | | Ni
(%) | | | Cu
(%) | |
Drenthe | | Indicated | | | 132,239,500 | | | | 0.53 | | | | 0.62 | | | | 0.09 | | | | 0.14 | | | | 0.09 | |
| | Inferred | | | 88,640,000 | | | | 0.49 | | | | 0.58 | | | | 0.09 | | | | 0.15 | | | | 0.09 | |
| | | | | | | |
Overysel North Segment 1 | | Indicated | | | 8,985,000 | | | | 0.71 | | | | 0.93 | | | | 0.10 | | | | 0.08 | | | | 0.05 | |
| | Inferred | | | 1,750,000 | | | | 0.59 | | | | 0.85 | | | | 0.09 | | | | 0.08 | | | | 0.05 | |
Overysel North Segment 2 | | Indicated | | | 35,436,500 | | | | 0.66 | | | | 0.85 | | | | 0.10 | | | | 0.10 | | | | 0.06 | |
| | Inferred | | | 13,693,500 | | | | 0.66 | | | | 0.88 | | | | 0.10 | | | | 0.11 | | | | 0.07 | |
| | | | | | | |
Totals | | Indicated | | | 176,661,000 | | | | 0.57 | | | | 0.69 | | | | 0.09 | | | | 0.13 | | | | 0.08 | |
| | | | | | | | | | | | | | | | | | | | | | | | | | |
| | Inferred | | | 104,084,000 | | | | 0.52 | | | | 0.63 | | | | 0.09 | | | | 0.14 | | | | 0.09 | |
| | | | | | | | | | | | | | | | | | | | | | | | | | |
| | |
| | Current |
| 12.9(h)ix | | Anooraq engaged the services of Kai Batla to complete compliant mineral resource estimates on their Boikgantsho deposit. Kai Batla relogged several drillholes and re-sampled several holes in order to verify the reliability of the existing assay database. The re-assaying results demonstrated that the current assay database could be duplicated and thus could be used in estimating a compliant mineral resource model. |
| 1 | Estimated in November 2004 by independent qualified person, GJ van der Heever, Pr.Sci.Nat. |
| 2 | Metal prices use were Pt – US$550/oz; Pd – US$250/oz, Au – US$375/oz, Ni – US$4/lb, Cu – US$1/lb. |
F-6
| | |
| | The re-logging was done under the guidance of Dr. Andrew Mitchell who initiated a new interpretation of the geology. A new geological model was then constructed and a new mineral resource was estimated into it. Ordinary kriging was affected into a three-dimensional geological block model, thereby producing a three-dimensional spatial distribution grades into blocks. Ordinary kriging was applied to Measured Resource, Indicated Resource and Inferred Mineral Resource categories. Ordinary kriging with a search equivalent to the range of the variogram model was done utilizing variogram models from respective rocktypes. In 2011 Anooraq approached TWP to complete some preliminary analysis of the economics of the deposit for open pit and resource planning. The analysis yielded a 0.5g/t Pt cut-off grade, and thus, the SAMREC compliant results are shown below at a Pt cut-off grade of 0.5g/t. Measured and Indicated Mineral Resources – 0.5g/t Pt Cut-off3 |
| | | | | | | | | | | | | | | | | | | | | | | | | | | | |
Category | | Tonnes | | | Pt
(g/t) | | | Pd
(g/t) | | | Au
(g/t) | | | PGMAU
(g/t) | | | Ni
(%) | | | Cu
(%) | |
Measured | | | 25,346,000 | | | | 0.70 | | | | 0.66 | | | | 0.07 | | | | 1.43 | | | | 0.15 | | | | 0.11 | |
Indicated | | | 61,751,000 | | | | 0.80 | | | | 0.84 | | | | 0.08 | | | | 1.72 | | | | 0.10 | | | | 0.07 | |
| | | | | | | | | | | | | | | | | | | | | | | | | | | | |
TOTAL | | | 87,097,000 | | | | 0.77 | | | | 0.79 | | | | 0.08 | | | | 1.63 | | | | 0.11 | | | | 0.09 | |
| | | | | | | | | | | | | | | | | | | | | | | | | | | | |
| | |
| | Inferred Mineral Resources – 0.5g/t Pt Cut-off |
| | | | | | | | | | | | | | | | | | | | | | | | | | | | |
Category | | Tonnes | | | Pt
(g/t) | | | Pd
(g/t) | | | Au
(g/t) | | | PGMAU
(g/t) | | | Ni
(%) | | | Cu
(%) | |
Inferred | | | 41,155,000 | | | | 0.76 | | | | 0.65 | | | | 0.06 | | | | 1.47 | | | | 0.10 | | | | 0.07 | |
| | |
| | Exploration Results In late 2003, the Boikgantsho Joint venture was established to explore the Drenthe, Witrivier and the northern part of Overysel farms. In 2004, Anooraq as operator completed 36,478 m of infill and step out drilling on the three farms, significantly increasing the size of the Drenthe deposit and identifying a second deposit on the northern part of Overysel farm. Drilling to September 2004 outlined total indicated resources in the two deposits of 176.6 million tonnes grading 1.35 g/t 3PGM and 0.13% nickel, and additional inferred resources in the two deposits of 104.1 million tonnes grading 1.23 g/t 3PGM and 0.14% nickel, both estimated at a $20 gross metal value per tonne (GMV/t) cut-off4. In June 2005, two exploration holes were drilled on the farm Swerwerskraal, for a total of 535.1 meters. Although Platreef-like rocks were intersected, only sporadic thin intervals of PGM mineralization were encountered in these drillholes. Mineral Reserves Not applicable to this report. Independent Valuation (SV T1.1) Minxcon (Pty) Ltd (“Minxcon”) has been retained by the Board of Directors of Anooraq Resources Corporation (“Anooraq”) to determine the mineral asset value of the Boikgantsho Project which is to be used in the fair and reasonable opinion of the transaction between Anooraq and Anglo Platinum. Concluding Opinion On 2 February 2012, Anooraq released the key terms of an agreement with Anglo Platinum in respect of a transaction to restructure, recapitalise and refinance Anooraq and the Bokoni group of companies. Amplats will, through a series of |
| 3 | The qualified person responsible for the Mineral Resource estimate is Mr D.S. Ferreira, Pri. Sci. Nat. |
| 4 | Estimated in November 2004 by independent qualified person, GJ van der Heever, Pr.Sci.Nat. |
F-7
| | |
| | related transactions, acquire the whole of the Boikgantsho Project and the Eastern section of the Ga-Phasha project. On implementation of these transactions, the effective net consideration of ZAR1.7 billion received by Anooraq will be applied to reduce it’s approximately ZAR3.0 billion debt owing to Amplats. Accordingly, the Parties have agreed to split the Ga-Phasha development project into an Eastern and Western section. The Eastern section, comprising the Paschaskraal and De Kamp mineral properties, will be consolidated into Amplats’ adjacent Twickenham operation, while the Western section, comprising the Klipfontein and Avoca mineral properties, will be accessed through the existing shaft infrastructure established at Bokoni’s Brakfontein property. In addition, the Parties have determined that the Bokoni group’s Northern Limb Boikgantsho Project has a strong strategic fit with Amplats’ flagship Mogalakwena North expansion plans and that this project should be consolidated into Amplats’ adjacent open cast Mogalakwena operations. Bokoni Mine is a 51%:49% joint venture between Anooraq Resources Corporation and Rustenburg Platinum Mines Limited. Minxcon has reached the following conclusions regarding the two projects: 1. This report considers the transaction values as stated in the agreement between Anooraq and Anglo Platinum and aims to provide an opinion on the fairness of the transaction; 2. The valuator considered the Market Approach and Historical Costs as suitable methodologies to determine a range of values; 3. Boikgantsho Project has a strong strategic fit with Amplats’ flagship Mogalakwena North expansion plans and that this project should be consolidated into Amplats’ adjacent open cast Mogalakwena operations; 4. A village is situated on the site of the open pit. Moving the village and re-settling the community on a nearby farm will result in significant upfront cost. Projected costs of moving the village is estimated between ZAR368 million and ZAR413 million within the next 5-7 years. A social cost discount was applied in determining the value, however not to the full amount; 5. There is currently no mining or processing infrastructure developed on the Boikgantsho Project nor does Anooraq currently hold any surface rights; 6. The resulting value from the two valuation methods applied is set out in the table: |
| | | | | | | | | | | | |
Valuation Method | | Low Value | | | Estimated Value | | | High Value | |
Comparative Method | | ZAR | 343.9 million | | | ZAR | 958.4 million | | | ZAR | 2,046.5 million | |
Historical Cost Method | | ZAR | 902 million | | | | | | | ZAR | 914.3 million | |
| | |
| | 7. The lower and upper valuation range for the Boikgantsho Project was established at between ZAR902 million and ZAR960 million. Statement |
| |
12.9(e) 12.9(h)xi | | All requirements of Section 12.9 of the JSE Listings Requirements, the SAMREC Code (including Table 1), and the SAMVAL Code (including Table 2) have been complied with in preparing this report. This executive summary is a true reflection of the full Competent Person’s Report presented herein. |
| | Capacity and Independence Kai Batla prepared the report and it is signed off according to SAMREC by Mr. Dexter S. Ferreira, a consultant to Kai Batla, and Dr. Avinash Bisnath, the managing director of Kai Batla. Details of their qualifications and experience are contained within Appendix 2 of this report. Scope of Work/Materiality/Limitations and Exclusions This CPR is based on 1) information supplied by Anooraq; 2) Kai Batla’s knowledge of the associated geology; 3) site visits and data gathering visits to the permits held by Anooraq. All data held by Anooraq was released to Kai |
F-8
| | |
| | Batla for review. Kai Batla reviewed source data where possible but has relied on the accuracy of data as reported by previous companies. All requests for information to the employees of Anooraq were addressed immediately where possible and a candid approach to all queries was in evidence throughout the review. Full legal verification of license documents was not undertaken. At no time during the course of preparation of the CPR did Kai Batla become aware of either withholding of information or of the changing of records to influence the conclusion of CPR. Kai Batla has endeavored to ensure that no error of fact is contained within the CPR. Any such error is not intentional and is not a deliberate effort to mislead. All opinions, findings and conclusions expressed in this report are those of Kai Batla (with the exception of the Valuation which is that of Minxcon) and are based on information provided by Anooraq. Where possible, Kai Batla has verified this information from independent sources in order to fully comply with the SAMREC Code SAMVAL requirements. Kai Batla and its directors accept no liability for any losses arising from reliance upon the information presented herein. Kai Batla has utilized information from the public domain, which, whilst it could not be verified, is considered to be from reliable sources. Kai Batla and its directors accept no liability for any losses arising from reliance upon the information presented in this report. Risks |
| |
| 12.9(h)x | | The business of mining and mineral exploration, development and production by their nature contain operational risks. The business depends upon, amongst other things, successful prospecting programs and competent management. Profitability and asset values can be affected by unforeseen changes in operating circumstances and technical issues. |
| |
| | Factors such as political and industrial disruption, currency fluctuation, commodity prices and interest rates could have an impact on the project’s future operations, and potential revenue streams can also be affected by these factors. The majority of these factors are, and will be, beyond the control of any operating entity. Copyright Copyright in all documents, drawings and records whether manually or electronically produced, which form part of the submission and any subsequent report or project document shall vest in Kai Batla. None of the documents, drawings or records may be used or applied in any manner, nor may they be reproduced or transmitted in any form or by any means whatsoever for or to any other person, without the prior written consent of Kai Batla. While all reasonable efforts were taken by Kai Batla to verify the information contained in this report, Kai Batla does not accept responsibility for any inaccuracies in this regard, nor any action which might arise as a consequence thereof. Yours faithfully, 
Dexter S. Ferreira Principal Geologist/Consultant BSc. (Geology), BEng. (Mining), Pr.Sci.Nat. |
F-9
| | |
| | 
Avinash Bisnath Director – Kai Batla Minerals Industry Consultants PhD (Geology), MGSSA, Pr.Sci.Nat 26 Republic Road, Kai Batla House Bordeaux, South Africa 2194 Tel: +27-11-7814-548 Fax: +27-86-545-2720 E-mail:geoconsult@kaibatla.co.za Web site:www.kaibatla.co.za |
F-10
SCHEDULE G
BOIKGANTSHO VALUATION
Attached.
G-1
| | |
| CIMVal Compliant Report on the Boikgantsho Project, Limpopo Province, South Africa | | G-3 |
TABLE OF CONTENTS
Prepared by Minxcon (Pty) Ltd
G-3
| | |
| CIMVal Compliant Report on the Boikgantsho Project, Limpopo Province, South Africa | | G-4 |
| | | | |
| FIGURES | |
| |
Figure 1: Current Ownership Structure | | | 11 | |
Figure 2: Proposed Ownership Structure | | | 12 | |
Figure 3: Location of the Boikgantsho Project Area | | | 15 | |
Figure 4: Boikgantsho Project Area - Farm Boundaries | | | 16 | |
Figure 5: Position of Village Relative to Proposed Open Pit | | | 21 | |
Figure 6: Water Reservoir | | | 22 | |
Figure 7: Primary School | | | 22 | |
Figure 8: Clinic | | | 22 | |
Figure 9: Housing Development on the Property | | | 22 | |
Figure 10: Typical House on the Property | | | 22 | |
Figure 11: Larger More Expensive Housing | | | 22 | |
Figure 12: Platinum Price Monthly Historic | | | 27 | |
Figure 13: Consensus Platinum Price Forecast (Nominal) | | | 28 | |
Figure 14: Palladium Price Monthly Historic | | | 30 | |
Figure 15: Consensus Palladium Price Forecast (Nominal) | | | 30 | |
Figure 16: Rhodium Price Monthly Historic | | | 32 | |
Figure 17: Platinum Valuation Curve | | | 33 | |
| |
| TABLES | | | | |
| |
Table 1: Measured and Indicated Mineral Resources - 0.5g/t Pt Cut-off | | | 17 | |
Table 2: Inferred Mineral Resources - 0.5g/t Pt Cut-off | | | 18 | |
Table 3: Preliminary Estimates for Moving the Village (Current Day Money Terms) | | | 23 | |
Table 4: Acceptable Methods of Mineral Project Valuation | | | 23 | |
Table 5: Platinum Supply and Demand | | | 26 | |
Table 6: Palladium Supply and Demand | | | 28 | |
Table 7: Rhodium Supply and Demand | | | 31 | |
Table 8: Economic Parameters Used in the Valuation Approach | | | 33 | |
Table 9: Valuation Risk Associated Parameter Matrix - Platinum Industry Standards | | | 34 | |
Table 10: Principal Risk - Boikgantsho Project | | | 35 | |
Table 11: Potential Moving Cost of Community in Specific Year | | | 36 | |
Table 12: Mineral Asset Valuation Based on Comparative Analysis (After Deduction of PV of Moving Cost) | | | 36 | |
Table 13: Typical Transactions in the Industry | | | 36 | |
Table 14: Historic Exploration Costs Associated with the Boikgantsho Project (ZAR) | | | 37 | |
Table 15: Cost Approach Valuation | | | 37 | |
| |
| APPENDICES | | | | |
| |
Appendix 1: Technical Reports | | | 44 | |
Prepared by Minxcon (Pty) Ltd
G-4
| | |
| CIMVal Compliant Report on the Boikgantsho Project, Limpopo Province, South Africa | | G-5 |
Purpose
Minxcon (Pty) Ltd (“Minxcon”) was commissioned by Atlatsa Resources Corporation, (previously Anooraq Resources Corporation) (“Atlatsa”) to compile a valuation report for the Boikgantsho platinum group metals project (“Boikgantsho Project”), located on the Northern Limb of the Bushveld Complex, Limpopo Province, South Africa (the “Valuation Report”), following the principles of the Canadian Institute of Mining, Metallurgy and Petroleum (“CIM”) Standards and Guidelines for the Valuation of Mineral Properties (“CIMVAL”).
Atlatsa is a platinum group metals mining, exploration and development company. Atlatsa controls and operates the Bokoni Platinum Mine (“Bokoni Mine”), located on the Eastern Limb of the Bushveld Complex, and maintains an interest in the Boikgantsho Project, located on the Northern Limb of the Bushveld Complex, adjacent to Anglo Platinum Limited’s (“Amplats”) Mogalakwena Mine.
The subject of the Valuation Report is the valuation of the Boikgantsho Project mineral assets.
This Valuation Report has been prepared based on technical reviews by Kai Batla Minerals - The Mineral Resource Estimation for the Platreef for the Boikgantsho Project, Limpopo Province, Republic of South Africa - Ref: KB 1AQ01112011; 31 January 2012 (the “Boikgantsho Technical Report”). The Boikganstsho Technical Report is appended to this Valuation Report.
Project Outline
The Boikgantsho Project area is readily accessible via the main N1 (toll) expressway from Johannesburg to the city of Mokopane (Potgietersrus), which is approximately 35km south of the Central Block. Access from Mokopane to the individual Blocks making up the project area, is via paved provincial highways. Individual farms, if not directly accessible from provincial highways, are well served by a comprehensive network of well-maintained dirt roads and farm tracks.
The 3,095 hectare Boikgantsho Project area is located on the Northern Limb of the Bushveld Complex, adjacent to Amplats Mogalakwena Mine, in the Limpopo Province of the Republic of South Africa (“RSA” or “South Africa”), some 275km north-northeast of Johannesburg. The Boikgantsho Project consists of two contiguous farms, Drenthe and Witrivier each with its own new order prospecting right. The platiniferous horizon target at the Boikgantsho Project area is the Platreef. The Bushveld Complex is a pear-shaped large igneous body, extending 450 km east to west and 250 km north to south and occurs partly in the Limpopo, North-West and Mpumalanga Provinces, of the Republic of South Africa.
Prepared by Minxcon (Pty) Ltd
G-5
| | |
| CIMVal Compliant Report on the Boikgantsho Project, Limpopo Province, South Africa | | G-6 |
Location of the Boikgantsho Project Area

Prepared by Minxcon (Pty) Ltd
G-6
| | |
| CIMVal Compliant Report on the Boikgantsho Project, Limpopo Province, South Africa | | G-7 |
Legal Aspects and Tenure
The Boikgantsho Project consists of two contiguous farms, Drenthe and Witrivier, each with its own new order prospecting right. Boikgantsho Platinum Mines (Proprietary) Limited (“Boikgantsho”) has the option to acquire the northern portion of the Overysel from Anglo Platinum, on completion of a feasibility study. All mineral rights are currently held by Boikgantsho. Atlatsa has a number of other exploration projects that are contiguous to the Boikgantsho Project, which do not form part of this Valuation Report.
Boikgantsho Project Area – Farm Boundaries
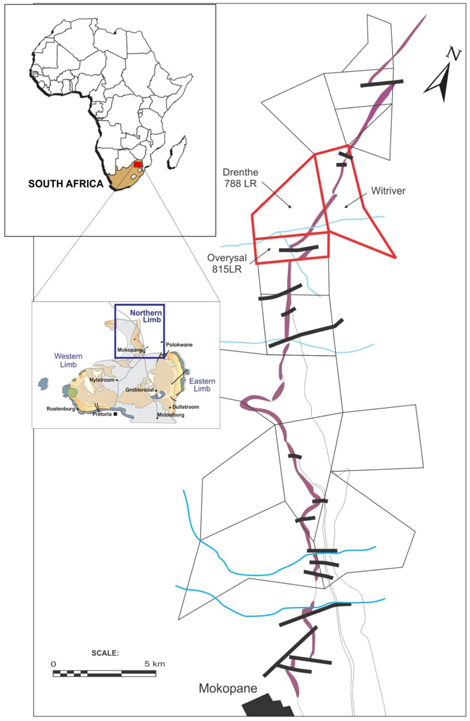
Prepared by Minxcon (Pty) Ltd
G-7
| | |
| CIMVal Compliant Report on the Boikgantsho Project, Limpopo Province, South Africa | | G-8 |
Geological Setting Description
The Bushveld Complex is situated in the northern half of South Africa and exists as an ellipse-shaped body consisting of five lobes. The Bushveld Complex is the world’s largest known ultramafic igneous intrusion, and extends approximately 450 km from east to west and approximately 250 km north to south. It occupies parts of Limpopo Province, North-West Province, Gauteng Province and the Mpumalanga Province. It is estimated to have been formed approximately 2,000 million years ago. The Bushveld Complex is host to Platinum Group Metal (“PGM”) mineralisation in addition to chrome, vanadium, nickel and copper.
The 3,095 hectare Boikgantsho Project area is located on the Northern Limb of the Bushveld Complex.
The Platreef at the Boikgantsho Project and surrounding properties strikes more or less north-south, and dips to the west at ~40°, although there is evidence of a steepening of the dip in some areas, e.g. in the far south of Boikgantsho, where the dip may approach 50 to 55°.
Exploration Programme and Budget
Exploration on the properties comprising the Boikgantsho Project has been sporadic, even though a number of historic drill holes intersected PGM mineralisation on the farm Drenthe 778LR. Since 2000, Atlatsa has been exploring the Boikgantsho Project, completing geological and drilling programmes in 2000, 2002, 2004 and 2005.
In late 2003, the Boikgantsho joint venture was established to explore the Drenthe, Witrivier and the northern part of Overysel farms. In 2004, Atlatsa as operator completed 36,478 m of infill and step out drilling on the three farms, significantly increasing the size of the Drenthe deposit and identifying a second deposit on the northern part of Overysel farm. Drilling to September 2004 outlined total indicated resources in the two deposits of 176.6 million tonnes grading 1.35 g/t 3PGM and 0.13% nickel, and additional inferred resources in the two deposits of 104.1 million tonnes grading 1.23 g/t 3PGM and 0.14% nickel.
In June 2005, two exploration holes were drilled on the farm Swerwerskraal, for a total of 535.1 m. Although Platreef-like rocks were intersected, only sporadic thin intervals of PGM mineralisation were encountered in these drill holes.
In 2010, Atlatsa approached Kai Batla Mineral Industry Consultants (“Kai Batla”) to update the 2005 mineral resource estimate. This program involved re-logging a number of drill holes under the guidance of Dr. Andrew Mitchell, and a number of re-assays in order to assess whether the data could be replicated and utilised to produce a compliant mineral resource model. No additional drilling was done throughout the aforementioned study.
Key Environmental Issues
The current environmental management plan (“EMP”) in support of the prospecting right application for the Project and the Environmental Impact Assessment (“EIA”) was approved and is available at the Company’s Head Office, so that the reader of this Valuation Report can make a reasoned and balanced judgement regarding any potential liabilities, undertakings by the applicant and any additional requirements determined by the Department of Mineral Resources (“DMR”) and agreed to by Atlatsa.
Prepared by Minxcon (Pty) Ltd
G-8
| | |
| CIMVal Compliant Report on the Boikgantsho Project, Limpopo Province, South Africa | | G-9 |
Environmental liability provisioning in the South African mining industry is a requirement of the Minerals and Petroleum Development Act No 28 of 2002 (the “MPRDA”) and must be agreed with the relevant regulatory authorities, mainly the DMR and Department of Water Affairs and Forestry (“the DWAF”). For existing mines such as the Bokoni Mine operations, monies are accrued based on the estimated environmental rehabilitation costs, should the mine have to close and over the operating life of a mine. Contributions are made to an environmental trust fund in this regard, which are approved by the South African Revenue Service.
The Boikgantsho Project area is the subject of an Environmental Management Program (“EMPR”) approved as part of the conversion to a “New Order Mining Right” by all relevant interested and affected parties.
The EMPR includes a detailed ‘Environmental Closure Assessment’ detailing all areas of environmental liability.
Mineral Resource and Mineral Reserve Statement
Atlatsa engaged the services of Kai Batla to complete the Boikgantsho Technical Report, a National Instrument 43-101 Standards of Disclosure for Minerals Projects (“NI 43-101”) compliant mineral resource estimates on the Boikgantsho Project. Kai Batla relogged several drill holes and re-sampled several holes in order to verify the reliability of the existing assay database. The re-assaying results demonstrated that the current assay database could be duplicated and thus could be used in estimating a compliant mineral resource model.
Measured and Indicated Mineral Resources – 0.5g/t Pt Cut-off5
| | | | | | | | | | | | | | | | | | | | | | | | | | | | |
Category | | Tonnes | | | Pt
(g/t) | | | Pd
(g/t) | | | Au
(g/t) | | | PGMAU
(g/t) | | | Ni
(%) | | | Cu
(%) | |
Measured | | | 25,346,000 | | | | 0.70 | | | | 0.66 | | | | 0.07 | | | | 1.43 | | | | 0.15 | | | | 0.11 | |
Indicated | | | 61,751,000 | | | | 0.80 | | | | 0.84 | | | | 0.08 | | | | 1.72 | | | | 0.10 | | | | 0.07 | |
| | | | | | | | | | | | | | | | | | | | | | | | | | | | |
Total | | | 87,097,000 | | | | 0.77 | | | | 0.79 | | | | 0.08 | | | | 1.63 | | | | 0.11 | | | | 0.09 | |
| | | | | | | | | | | | | | | | | | | | | | | | | | | | |
Source: Kai Batla
Inferred Mineral Resources – 0.5g/t Pt Cut-off
| | | | | | | | | | | | | | | | | | | | | | | | | | | | |
Category | | Tonnes | | | Pt
(g/t) | | | Pd
(g/t) | | | Au
(g/t) | | | PGMAU
(g/t) | | | Ni
(%) | | | Cu
(%) | |
Inferred | | | 41,155,000 | | | | 0.76 | | | | 0.65 | | | | 0.06 | | | | 1.47 | | | | 0.10 | | | | 0.07 | |
Source: Kai Batla
Summary Valuation
The economic analysis contained in this report is based, in part, on Inferred Resources, and is preliminary in nature. Inferred Resources are considered too geologically speculative to have mining and economic considerations applied to them and to be categorised as Mineral Reserves. There is no certainty that the resources on which this preliminary assessment is based will be realised.
Minxcon has reached the following conclusions regarding the Boikgantsho Project:-
| | 1. | The two valuation approaches applied were the cost and market approaches. |
| | 2. | The value range generated from the Cost Approach was calculated in a narrow range of between ZAR889. 89 million and ZAR914.34 million. |
| | 3. | Values generated from the market approach are much wider. The difficulty of this approach within the mining industry is that there are no true comparables, since each asset is unique with respect to key factors such as geology, mineralisation, costs, stage of exploration, infrastructure and peripheral issues, such as social, political and environmental aspects. After applying the risk factors pertaining to |
| 5 | The qualified person responsible for the Mineral Resource estimate is Mr D.S. Ferreira, Pri. Sci. Nat. |
Prepared by Minxcon (Pty) Ltd
G-9
| | |
| CIMVal Compliant Report on the Boikgantsho Project, Limpopo Province, South Africa | | G-10 |
| | the specific ore body, as described in the application above, Minxcon calculated a value range of ZAR343 million to ZAR2,046 million with a risk adjusted single estimated single value of ZAR958 million (adjusted for socio economic and project specific characteristics). |
| | 4. | The values that were derived after applying two valuation methods are set out in the table below: |
Value Ranges for the Boikganstsho Project
| | | | | | | | | | | | |
Approach | | Low Value | | | Estimated Value | | | High Value | |
| | | (ZAR‘000) | |
Market Approach | | | 343,980 | | | | 958,369 | | | | 2,046,462 | |
Cost Approach | | | 889,890 | | | | — | | | | 914,338 | |
| | 5. | After taking into consideration the estimated value of the market approach and the average of the costs approach, the valuation range for the Boikgantsho Project was established at between ZAR902 million and ZAR960 million. |
Prepared by Minxcon (Pty) Ltd
G-10
| | |
| CIMVal Compliant Report on the Boikgantsho Project, Limpopo Province, South Africa | | G-11 |
| 2. | INTRODUCTION AND TERMS OF REFERENCE |
Minxcon (Pty) Ltd (“Minxcon”) has been retained by the Board of Directors of Atlatsa Resources Corporation (previously Anooraq Resources Corporation) (“Atlatsa”), to determine the mineral asset value of the Boikgantsho Project which is to be used in the fair and reasonable opinion, and as required by Part 5 of the Multilateral Instrument 61-101 Protection of Minority Security Holders in Special Transaction (“MI 61-101”), with respect to the transaction between Atlatsa and Anglo Platinum Limited (“Amplats”).
On 2 February 2012, Atlatsa released the key terms of an agreement with Amplats in respect of a transaction to restructure, recapitalise and refinance Atlatsa and the Bokoni Platinum Holdings (Proprietary) Limited (“Bokoni Holdings”) group of companies (the “Bokoni group”). Amplats will, through a series of related transactions, acquire the whole of the Boikgantsho project and the Eastern section of the Ga-Phasha PGM project (the “Ga-Phasha Project”).
Atlatsa holds a 51% interest in the Boikgantsho Project through Bokoni Holdings. The Boikgantsho Project is currently in exploration stage.
The figure below illustrates the current ownership structure for Atlatsa:-
Figure 1: Current Ownership Structure
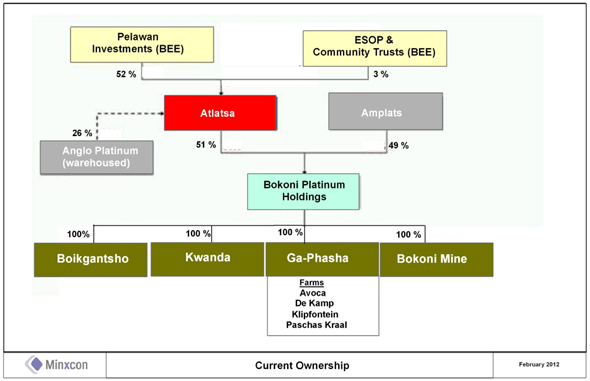
Prepared by Minxcon (Pty) Ltd
G-11
| | |
| CIMVal Compliant Report on the Boikgantsho Project, Limpopo Province, South Africa | | G-12 |
The figure below illustrates the proposed ownership structure for Atlatsa:-
Figure 2: Proposed Ownership Structure
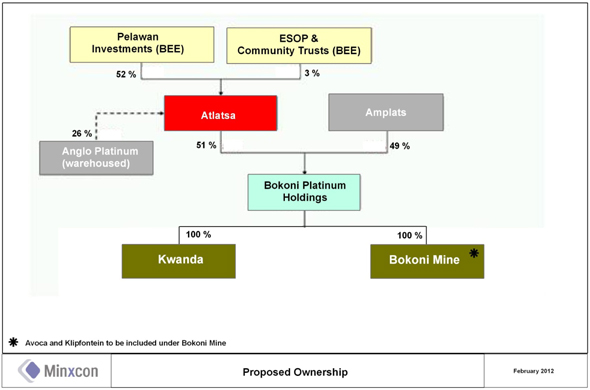
Accordingly, the Parties have determined that the Bokoni group’s Northern Limb Boikgantsho Project has a strong strategic fit with Amplats’ flagship Mogalakwena North expansion plans and that the Boikgantsho Project should be consolidated into Amplats’ adjacent opencast Mogalakwena operations.
In addition, the Parties have agreed to split the Ga-Phasha Project into an Eastern and Western section. The Eastern section, comprising the Paschaskraal and De Kamp mineral properties, will be consolidated into Amplats’ adjacent Twickenham operation, while the Western section, comprising the Klipfontein and Avoca mineral properties, will be accessed through the existing shaft infrastructure established at Bokoni Mine’s Brakfontein property.
Bokoni Mine is a 51:49% joint venture between Atlatsa and Rustenburg Platinum Mines Limited (“RPM”).
This Valuation Report has an effective date of 27 February 2013 and is dated 27 February 2013.
| 2.2.1 | Scope of Work Performed |
In order to satisfy the requirements of a fair and reasonable opinion and MI 61-101, Minxcon completed an independent valuation on the Boikgantsho Project. The technical information as provided to and taken in good faith by Minxcon has not been independently verified by means of re-calculation. Minxcon carried out the following scope of work for the Valuation Report:
| | • | | Visit to the Boikgantsho Project in the Limpopo Province of South Africa |
Prepared by Minxcon (Pty) Ltd
G-12
| | |
| CIMVal Compliant Report on the Boikgantsho Project, Limpopo Province, South Africa | | G-13 |
| | • | | Visit to the Atlatsa and Amplats offices in Johannesburg |
| | • | | Use of the technical report prepared by Kai Batla Minerals - The Mineral Resource Estimation for the Platreef for the Boikgantsho Project, Limpopo Province, Republic of South Africa – Ref: KB 1AQ01112011; dated 31 January 2012 (the “Boikgantsho Technical Report”), to calculate a mineral asset value from the resources declared. The Boikgantsho Technical Report is appended to this Valuation Report. |
| | • | | Review and where necessary, appropriate modification of exploration and social costs. |
| | • | | Minxcon has not sought an independent legal opinion on the shareholding, effective rights and obligations of Atlatsa. In addition, Minxcon did not perform a full-scale due diligence on the resources and relied on the information provided by the Qualified Person (as that term is defined in CIMVAL) of Kai Batla Minerals with respect to the Boikgantsho Project. Minxcon and its directors accept no liability for any losses arising from reliance upon the information presented from these sources. |
The author of this Valuation Report is a member in good standing of appropriate professional institutions. The qualifications and professional registrations of the Qualified Person and Qualified Valuator who contributed to this evaluation are provided at the end of this Valuation Report. The following person made contributions to this Valuation Report and is a Qualified Person and Qualified Valuator as defined in CIMVAL:-
Johan Odendaal (Director, Minxcon): B.Sc. (Geol.), B.Sc. (Hons) (Min. Econ.), M.Sc. (Min. Eng.), Pr. Sci. Nat. 400024/04, FSAIMM, MGSSA, MAusIMM.
Johan has 25 years’ experience in the mining and financial industry. This includes 8 years as an independent mining consultant specialising in the valuation of mining projects and 12 years as a mining analyst at two major stockbroking firms. During this time, he was rated one of the top platinum and gold mining analysts and became a globally recognised industry specialist.
The Qualified Person and Qualified Valuator made a personal inspection of the Boikgantsho Project on 4 April 2012. An inspection was made of the surface area and the village on the Boikgantsho Project area.
The effective date of the Valuation Report is 27 February 2013.
None of the directors of Minxcon has or had any direct or indirect interest, beneficial or non-beneficial, in the Boikgantsho Project. Minxcon is an independent advisory company. Its consultants have extensive experience in preparing technical and economic advisors’ and valuation reports for mining and exploration companies. Neither Minxcon nor its staff have any interest capable of affecting their ability to give an unbiased opinion, and will not receive any pecuniary or other benefits in connection with this assignment, other than normal consulting fees.
| 2.2.4 | Valuation Based on Inferred Resources |
The valuation contained in this Valuation Report is based, in part, on Inferred Resources, and is preliminary in nature. Inferred Resources are considered too geologically speculative to have mining and economic considerations applied to them and to be categorised as Mineral Reserves. There is no certainty that the resources on which this preliminary assessment is based will be realised. Value as used in this Valuation Report refers to value derived using the methodology specified in CIMVAL and as such is reported as the Fair Market Value (as that term is defined in CIMVAL).
Prepared by Minxcon (Pty) Ltd
G-13
| | |
| CIMVal Compliant Report on the Boikgantsho Project, Limpopo Province, South Africa | | G-14 |
| 2.2.5 | Forward-looking Statements |
Certain statements in this Valuation Report other than statements of historical fact contain forward-looking statements regarding Atlatsa’s operations, economic performance or financial condition, including, without limitation, those concerning the economic outlook for the mining and platinum industry, expectations regarding PGM prices, exchange rates, production, cash costs and other operating results, growth prospects and the outlook of operations, including the completion and commencement of commercial operations of specific production projects, its liquidity and capital resources and expenditure, and the outcome and consequences of any pending litigation or enforcement proceedings.
Although Minxcon believes that the expectations reflected in such forward-looking statements are reasonable, no assurance can be given that such expectations will prove to be correct. Accordingly, results may differ materially from those set out in the forward-looking statements as a result of, among other factors, changes in economic and market conditions, changes in the regulatory environment and other State actions, success of business and operating initiatives, fluctuations in commodity prices and exchange rates, and business and operational risk management.
| 2.3 | COMPLIANCEWITHTHE CIMVAL STANDARDS AND GUIDELINES |
Section 8.10 of CIMVAL states that a Valuation Report must contain a statement regarding the extent to which the Valuation is consistent with CIMVAL. Such statement must disclose and explain the reasons for any inconsistency or deviations from CIMVAL. If such a disclosure statement is absent from the Valuation Report, the Valuation does not comply with these standards. The Valuation Report and the valuation contained herein fully comply and are consistent with the standards set out in CIMVAL. Minxcon has relied on the NI 43-101 compliant Boikgantsho Technical Report prepared by Kai Batla Minerals. The Boikgantsho Technical Report is appended to this Valuation Report.
| 3 | PROPERTY LOCATION, ACCESS AND INFRASTRUCTURE |
Please refer to Chapters 4 and 5 of the Boikgantsho Technical Report, which is attached in the Appendix, from page 8 through to 12.
The Boikgantsho Project area is readily accessible via the main N1 (toll) expressway from Johannesburg to the city of Mokopane (Potgietersrus), which is approximately 35km south of the Central Block. Access from Mokopane to the individual Blocks making up the Boikgantsho Project area, is via paved provincial highways. Individual farms, if not directly accessible from provincial highways, are well served by a comprehensive network of well-maintained dirt roads and farm tracks.
The 3,095 hectare Boikgantsho Project area is located on the Northern Limb of the Bushveld Complex, adjacent to Anglo Platinum’s Mogalakwena Mine, in the Limpopo Province of the Republic of South Africa, some 275km north-northeast of Johannesburg. The Boikgantsho Project consists of two contiguous farms, Drenthe and Witrivier each with its own new order prospecting right. The platiniferous horizon target at the Boikgantsho Project area is the Platreef. The Bushveld Complex is a pear-shaped large igneous body, extending 450 km east to west and 250 km north to south and occurs partly in the Limpopo, North-West and Mpumalanga Provinces, of the Republic of South Africa.
Prepared by Minxcon (Pty) Ltd
G-14
| | |
| CIMVal Compliant Report on the Boikgantsho Project, Limpopo Province, South Africa | | G-15 |
Figure 3: Location of the Boikgantsho Project Area
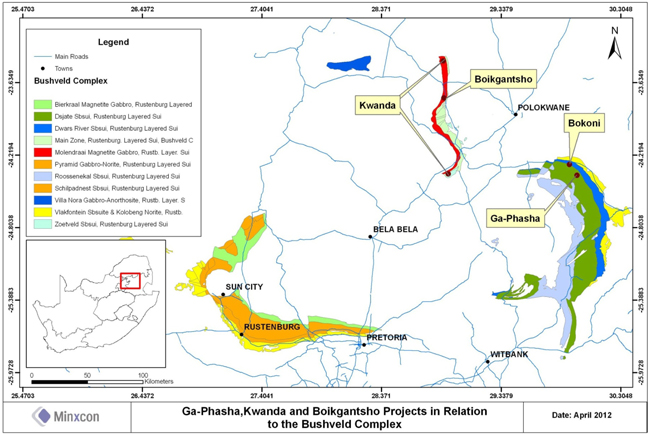
Prepared by Minxcon (Pty) Ltd
G-15
| | |
| CIMVal Compliant Report on the Boikgantsho Project, Limpopo Province, South Africa | | G-16 |
Legal Aspects and Tenure
The Boikgantsho Project consists of two contiguous farms, Drenthe and Witrivier, each with its own new order prospecting right. Boikgantsho has the option to acquire the northern portion of the Overysel from Anglo Platinum, on completion of a feasibility study. All mineral rights are currently held by Boikgantsho. Atlatsa has a number of other exploration projects that are contiguous to the Boikgantsho Project, which do not form part of this Valuation Report.
Figure 4: Boikgantsho Project Area – Farm Boundaries

Prepared by Minxcon (Pty) Ltd
G-16
| | |
| CIMVal Compliant Report on the Boikgantsho Project, Limpopo Province, South Africa | | G-17 |
| 3.1 | PROPERTY OWNERSHIP, STATUSAND AGREEMENTS |
Please refer to Chapter 4 of the Boikgantsho Technical Report which is attached as the Appendix, from page 8 through to 11.
| 4 | HISTORY OF EXPLORATION AND PRODUCTION |
Please refer to Chapter 6 of the Boikgantsho Technical Report which is attached as the Appendix, on page 12 and 13.
| 5 | GEOLOGY AND MINERALISATION |
Please refer to Chapter 7 of the Boikgantsho Technical Report which is attached as the Appendix, from page 14 to 19.
| 6 | EXPLORATION RESULTS AND POTENTIAL |
Please refer to Chapter 6 (pp. 12-13) and Chapter 9 (page 20) of the Boikgantsho Technical Report which is attached as the Appendix.
Please refer to Chapter 11 of the Boikgantsho Technical Report which is attached as the Appendix, from page 24 to 31.
| 8 | MINERAL RESOURCES AND MINERAL RESERVES |
Please refer to Chapter 14 and 15 of the Boikgantsho Technical Report which is attached as the Appendix, from page 40 to 56.
Atlatsa engaged the services of Kai Batla to complete the Boikgantsho Technical Report, a NI 43-101 compliant mineral resource estimate on the Boikgantsho Project. Kai Batla relogged several drill holes and re-sampled several holes in order to verify the reliability of the existing assay database. The re-assaying results demonstrated that the current assay database could be duplicated and thus could be used in estimating a compliant mineral resource model.
Table 1: Measured and Indicated Mineral Resources – 0.5g/t Pt Cut-off6
| | | | | | | | | | | | | | | | | | | | | | | | | | | | |
Category | | Tonnes | | | Pt
(g/t) | | | Pd
(g/t) | | | Au
(g/t) | | | PGMAU
(g/t) | | | Ni
(%) | | | Cu
(%) | |
Measured | | | 25,346,000 | | | | 0.70 | | | | 0.66 | | | | 0.07 | | | | 1.43 | | | | 0.15 | | | | 0.11 | |
Indicated | | | 61,751,000 | | | | 0.80 | | | | 0.84 | | | | 0.08 | | | | 1.72 | | | | 0.10 | | | | 0.07 | |
| | | | | | | | | | | | | | | | | | | | | | | | | | | | |
Total | | | 87,097,000 | | | | 0.77 | | | | 0.79 | | | | 0.08 | | | | 1.63 | | | | 0.11 | | | | 0.09 | |
| | | | | | | | | | | | | | | | | | | | | | | | | | | | |
Source: Kai Batla
Note: Resource stated at January 2012
| 6 | The qualified person responsible for the Mineral Resource estimate is Mr D.S. Ferreira, Pri. Sci. Nat. |
Prepared by Minxcon (Pty) Ltd
G-17
| | |
| CIMVal Compliant Report on the Boikgantsho Project, Limpopo Province, South Africa | | G-18 |
Table 2: Inferred Mineral Resources – 0.5g/t Pt Cut-off
| | | | | | | | | | | | | | | | | | | | | | | | | | | | |
Category | | Tonnes | | | Pt
(g/t) | | | Pd
(g/t) | | | Au
(g/t) | | | PGMAU
(g/t) | | | Ni
(%) | | | Cu
(%) | |
Inferred | | | 41,155,000 | | | | 0.76 | | | | 0.65 | | | | 0.06 | | | | 1.47 | | | | 0.10 | | | | 0.07 | |
Source: Kai Batla
Note: Resource stated at January 2012
No additional exploration or mining has taken place since 27 February 2013
Please refer to Chapter 13 of the Boikgantsho Technical Report which is attached as the Appendix from page 37 to 39.
| 10 | ENVIRONMENTAL CONSIDERATIONS |
Please refer to Chapter 20 of the Boikgantsho Technical Report which is attached as the Appendix, on page 57.
| 11 | MINING AND PROCESSING OPERATIONS |
Please refer to Chapters 15 through to 22 of the Boikgantsho Technical Report which is attached as the Appendix.
| 12 | KEY ASSUMPTIONS, RISKS AND LIMITATIONS |
| 12.1 | ASSUMPTIONSAND LIMITATIONS |
All opinions, findings and conclusions expressed in this report are those of Minxcon and are based on information provided by Atlatsa and the Boikgantsho Technical Report. These opinions, findings and conclusions reflect various techno-economic (commodity prices, currency exchange rates, consumer price indices and other) conditions prevailing as at the effective date, as well as interpretations based on limited data. These conditions and interpretations can change significantly over a relatively short period of time and with new information and, as such, the information and opinions contained in this Valuation Report may also be subject to change.
| 12.2 | RESOURCEAND RESERVEESTIMATES |
There is a risk that the mineral resources are incorrect. If those estimates are materially in excess of the recoverable mineral content of the tenements, the valuation would be adversely affected.
| 12.3 | RELIANCEON INFORMATIONFROM MANAGEMENT |
Minxcon has placed reliance on the management of Atlatsa that the following information is appropriate as at the effective date of this Valuation Report:
| | • | | The Boikgantsho Technical Report; and |
| | • | | Corporate structure and legal tenure |
Prepared by Minxcon (Pty) Ltd
G-18
| | |
| CIMVal Compliant Report on the Boikgantsho Project, Limpopo Province, South Africa | | G-19 |
The nature of exploration, mining and mineral processing involves hazards which could result in the Company incurring uninsured losses and liabilities to third parties, for example arising from pollution, environmental damage or other damage, injury or death. These could include rock falls, flooding, unfavourable ground conditions or seismic activity, ore grades being lower than expected and the physical or metallurgical characteristics of the ore being less amenable to mining or treatment than expected.
| 12.5 | BLACK ECONOMIC EMPOWERMENT |
Companies in South Africa must comply and remain compliant with certain black economic empowerment (“BEE”) requirements in order to retain their prospecting and mining rights. Any failure by a company, and its subsidiaries to satisfy and to continue to satisfy the BEE requirements could jeopardise the prospecting and mining rights in which the company will hold an interest. To satisfy the social development requirements of the MPRDA to obtain and retain prospecting rights and mining rights, Atlatsa must obtain approval of and provide financially for and comply with the prescribed social and labour plan. This will be a cost which may affect the Boikgantsho Project’s profitability should it derive revenue from the sale of platinum in the future.
| 12.6 | EXPLORINGAND MINING RISKS |
The future viability and profitability of the Boikgantsho Project will be affected by a number of factors, including, but not limited to the risks associated with:
| | • | | exploration or mining rights being adversely affected by political disputes; and |
| | • | | environmental management issues and the obligations to comply with requirements that may change over time and result in additional costs and delays. |
The Boikgantsho Project is subject to various environmental laws. Many of the activities and operations cannot be carried out without prior approval from and compliance with all relevant authorities. Resource activities can be environmentally sensitive and give rise to substantial costs for environmental rehabilitation, damage control and losses.
The South African government has implemented a variety of laws which seek to redress certain economic imbalances. These laws are aimed at uplifting the previously disadvantaged groups through equity ownership, corporate social responsibility programs and employment equity legislation. The new minerals and mining laws for example provide for BEE for the granting of mining rights.
One of the major legal risks is the conversion of its old order mineral rights into new order mining rights under the MPRDA. The MPRDA has placed all mineral rights under the ownership of the state. The regulatory environment could change in ways that substantially increase Atlatsa’s liabilities, tax liability or costs of compliance.
Atlatsa’s operations may be adversely affected by labour disputes or changes in South African labour laws. In South Africa a number of trade unions have close links to various political parties and have significant influences as vehicles for social and political reform and in the collective bargaining process. South Africa has enacted various labour laws that enhance the rights of employees which may impose costs on Atlatsa. Significant labour disputes, work stoppages, increased employee expenses as a result of collective bargaining and the cost of compliance with labour laws could disrupt operations and affect the profitability of the prospecting rights and any future mining and exploration activities undertaken.
Prepared by Minxcon (Pty) Ltd
G-19
| | |
| CIMVal Compliant Report on the Boikgantsho Project, Limpopo Province, South Africa | | G-20 |
| 12.10 | HIV/AIDSAND TUBERCULOSIS |
The HIV/AIDS pandemic remains a significant challenge to companies operating in South Africa. In addition, the occurrence of tuberculosis is increasing amongst the South African workforce. Any significant increase in the incidence of HIV/AIDS infection, HIV/AIDS-related diseases or tuberculosis in the workforce could adversely affect operations.
| 12.11 | FAILUREOF BASIC INFRASTRUCTURE |
Infrastructure in South Africa for utilities such as electricity and water supply is continually under strain. Project development depends on the reliable and continuous delivery of adequate power and water.
| 12.12 | COMMODITY PRICE VOLATILITYAND FOREIGN EXCHANGE RATE RISKS |
If the Boikgantsho Project is developed successfully leading to mineral production, the revenue it will derive through the sale of commodities exposes the potential income of Atlatsa to commodity price and exchange rate risks. Commodity prices fluctuate and are affected by many factors beyond the control of the owners. Such factors include supply and demand fluctuations for precious and base metals, technological advancements, forward selling activities and other macro-economic factors. Furthermore, international prices of various commodities are denominated in United States dollars, whereas the income and expenditure will be taken into account in South African currencies, exposing developers to the fluctuations and volatility of the rate of exchange between the United States dollar and the South African rand (“ZAR or Rand”)as determined in international markets.
| 12.13 | SOCIAL RESPONSIBILITY |
A village is situated on the proposed site of the open pit. Moving the village and re-settling the community on a nearby farm will result in significant upfront costs.
Prepared by Minxcon (Pty) Ltd
G-20
| | |
| CIMVal Compliant Report on the Boikgantsho Project, Limpopo Province, South Africa | | G-21 |
Figure 5: Position of Village Relative to Proposed Open Pit
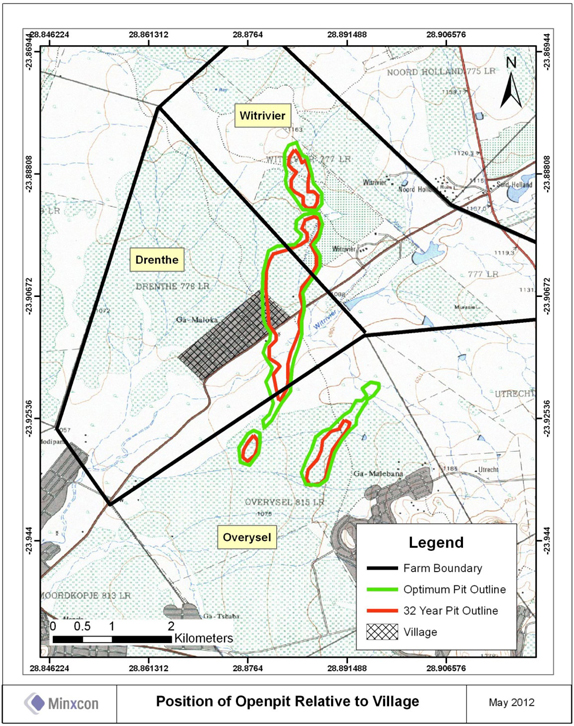
Prepared by Minxcon (Pty) Ltd
G-21
| | |
| CIMVal Compliant Report on the Boikgantsho Project, Limpopo Province, South Africa | | G-22 |
A preliminary estimate indicates that moving the village will cost at least ZAR270 million in current day money terms. This estimate cost includes the moving of 400 households, a primary school (418 pupils), a municipal clinic, acquisition of land, civil infrastructure, waste management and movement costs. If initial mining could start south of theWitrivier (see
Prepared by Minxcon (Pty) Ltd
G-22
| | |
| CIMVal Compliant Report on the Boikgantsho Project, Limpopo Province, South Africa | | G-23 |
Figure 5), then moving the village could happen in 5-7 years’ time. By escalating the value by 6% per annum, projected costs of moving the village are estimated at between ZAR368 million and ZAR413 million within the next 5 to 7 years.
Table 3: Preliminary Estimates for Moving the Village (Current Day Money Terms)
| | | | |
Items | | ZAR
(‘million) | |
Land | | | 11.000 | |
Building cost | | | 214.576 | |
Civil infrastructure | | | 14.117 | |
General fees/costs | | | 13.832 | |
Drying yards | | | 0.791 | |
Waste management | | | 0.723 | |
Movement cost | | | 2.000 | |
Lawnscaping | | | 10.000 | |
| | | | |
Total Cost | | | 267.040 | |
| | | | |
There is currently no mining or processing infrastructure developed on the Boikgantsho Project, nor does Atlatsa currently hold any surface rights.
| 13 | VALUATION APPROACHES AND METHODS |
| 13.1 | RECENT VALUATIONSOFTHE MINERAL PROPERTY |
Apart from the work completed by Minxcon as stated in this Valuation Report, Minxcon is not aware of any previous valuations completed during the past two years.
The following valuation approaches are three internationally accepted methods of valuing PGM projects, and are summarised below as well as illustrated in Table 4. Valuation methods are, in general, subsets of valuation approaches:
| | • | | Cost Approach: includes the Appraised Value method which is widely used and the Multiple of Exploration Expenditure which is used to value early stage exploration properties. The valuation is dependent on the historical and future exploration expenditure, as this approach is based on the principal of contribution to value; |
| | • | | Market Approach: used to value exploration and development properties, based on the relative comparisons of similar properties for which a transaction is available, in the public domain. The Comparable Transaction method approach, which is the most widely used, relies on the principle of “willing buyer, willing seller” and requires that the amount obtainable from the sale of the platinum asset is determined as if in an arm’s length transaction; and |
| | • | | Income Approach: the Discounted Cash Flow (DCF), Monte Carlo Analysis and Option Pricing are amongst the methods included under this category. The DCF is widely used and generally used to value development and production properties in the production phase. This method relies on the “value-in-use” principle and requires determination of the present value of future cash flows over the useful life of the mineral asset. |
Table 4: Acceptable Methods of Mineral Project Valuation
| | | | | | | | |
Valuation Approach | | Exploration Properties | | Mineral Resource
Properties | | Development Properties | | Production Properties |
| Income | | No | | In some cases | | Yes | | Yes |
| Market | | Yes | | Yes | | Yes | | Yes |
| Cost | | Yes | | In some cases | | No | | No |
Prepared by Minxcon (Pty) Ltd
G-23
| | |
| CIMVal Compliant Report on the Boikgantsho Project, Limpopo Province, South Africa | | G-24 |
The cost approach relies on expenditure on the property and involves estimation of the cost of reproducing or replacing the asset and improvements. Reproduction cost refers to the cost at a given point in time of reproducing a replica asset; whereas replacement cost refers to the cost of reproducing improvements of equal utility. In the case where insufficient confidence exists in the technical parameters of the mineral asset, valuation methods rely almost entirely on the principle of historical cost, implying that an asset’s value is correlated to the money spent on its acquisition, plus a multiple of expenditures.
A prospectivity enhancement multiplier (“PEM”) is a factor applied to the total cost of exploration, the magnitude of which is determined by the level of sophistication of the exploration for which positive exploration results have been obtained.
The market approach requires the comparison of the Boikgantsho Project with relatively recent transactions of Resource assets that have similar characteristics to those of the asset being valued. It is generally based upon a monetary value per unit of the in situ resource (where available), or per unit of defined tons (Measured, Indicated and Inferred).
This comparable method uses the transaction price of comparable assets to establish a value for the specific asset to be valued. The difficulty of this approach within the mining industry is that there are no true comparables, since each asset is unique with respect to key factors such as geology, mineralisation, costs, stage of exploration, infrastructure and peripheral issues, such as social, political and environmental aspects. The movement in the PGM price is also reflected in the range of values, at a grade comparable to the projected percentage of the resource in this Boikgantsho Project.
When transactions of PGM assets do occur, they rarely involve strictly cash, leaving the valuator the task of converting blocks of shares, royalties or option terms into present day monetary equivalents. In the first cases, the defined value of the share (inclusive of whether it is transacted at a premium or discount), at the time of the transaction, is applied to convert the share volume into a cash value. The same principle is applied to royalties and option terms to convert these transaction preferences into a cash basis.
An alternative market approach is to determine the monetary value per hectare (“MVH”) using relatively recent transactions of assets that have similar characteristics to those assets being valued. This is a function of obtaining the definition and interpretation of the hectare value for the resource asset.
The Income Approach is based on the principle of anticipation of benefits and includes all methods that are based on the income or cash flow generation potential of the Mineral Property. This approach relies on the ‘value-in-use’ principle and requires determination of the present value of future cash flows over the useful life of the mineral asset.
| 13.2.4 | Justification and limitations of the different approaches |
The different valuation approaches depend on the stage of exploration or development of the property as described in Table 4. Based upon review of technical data for the Boikgantsho Project, the Cost and Market Approaches were selected for the current valuation. This reflects the fact that:
| | 1. | reasonable records of exploration expenditures exist for the Boikgantsho Project and; |
| | 2. | mineral property transactions were available for review that reflect market conditions broadly similar to current market conditions. |
Prepared by Minxcon (Pty) Ltd
G-24
| | |
| CIMVal Compliant Report on the Boikgantsho Project, Limpopo Province, South Africa | | G-25 |
| 14.1 | CURRENT INVESTMENT CLIMATE FOR EXPLORATIONIN SOUTH AFRICA |
South Africa is currently experiencing a depressed investment climate for exploration projects for various reasons. Despite the distressed global economic and financial climate which led to low PGM prices and general caution to invest in new development projects, South Africa is also struggling with the regulatory issues associated with the MPRDA, which came into force in 2004.
In a recent article published in the international Journal of Energy & Natural Resources Law by Peter Leon a partner and Head of Africa Mining & Energy Projects at Webber Wentzel, Johannesburg, South Africa, Peter accurately sketched the current situation in the conversion of mineral rights.
Despite having some of the world’s largest mineral reserves, South Africa’s mineral production in the third quarter of 2011 contracted by 12 per cent which is in stark contrast with some of the country’s mining peers. South Africa’s policy potential, according to the 2011 Fraser Institute survey of the world’s major mining jurisdictions, ranked 67 out of 79 countries reviewed.
A significant cause of the industry’s decline lies in the regulatory uncertainty caused by the implementation of the MPRDA. A combination of an entirely new regulatory regime, combined with the MPRDA’s vague and ambiguous provisions, has led to critical licensing delays, well in excess of South Africa’s peers.
At the same time, the promotion of BEE has focused on narrow rather than broad-based black ownership of the mining industry. This, in turn, has become the catalyst behind calls from the African National Congress (ANC)’s youth league for the nationalisation of the industry itself.
While this has not been supported by the ANC-led government, the state itself has become more interventionist in the industry. This has led to the revival of the state-owned mining company and the opening of its first coal mine. An ANC research committee has investigated the feasibility of mine nationalisation, but its report is yet to be made public. A final decision on the issue is expected by December 2012, at the ANC’s quinquennial elective conference.
At the same time, the Minister of Mineral Resources has announced and/or implemented a number of regulatory initiatives to address the industry’s problems, including proposed amendments to the MPRDA itself.
| 14.2 | OUTLOOKFOR COMMODITY PRICES |
The platinum market swung into an oversupply of 430,000 oz in 2011. Supplies of platinum rose by 7% to 6.48 million ounces due to inventory releases from South Africa as well as higher output in North America and Zimbabwe. Recycling increased by 12% to 2.05 million ounces. Gross demand for platinum rose by 2% to 8.1 million ounces largely as a result of heavy purchasing by the glass and petrochemical industries. Demand for platinum for use in heavy duty diesel autocatalysts was strong but this was partly offset by lower use in light duty diesel emissions control and reduced buying by Japanese auto manufacturers. Autocatalyst demand grew by 1% to 3.11 million ounces. Purchasing last year by jewellery manufacturers was 2% higher than in 2010 at 2.48 million ounces. Investment demand declined by 30% year-on-year but remained positive at 460,000 oz.
Prepared by Minxcon (Pty) Ltd
G-25
| | |
| CIMVal Compliant Report on the Boikgantsho Project, Limpopo Province, South Africa | | G-26 |
Table 5: Platinum Supply and Demand
| | | | | | | | | | | | | | | | | | | | | | | | | | | | | | | | | | | | | | | | |
‘000 oz | | 2002 | | | 2003 | | | 2004 | | | 2005 | | | 2006 | | | 2007 | | | 2008 | | | 2009 | | | 2010 | | | 2011 | |
Supply | | | | | | | | | | | | | | | | | | | | | | | | | | | | | | | | | | | | | | | | |
South Africa | | | 4,450 | | | | 4,630 | | | | 5,010 | | | | 5,115 | | | | 5,295 | | | | 5,070 | | | | 4,515 | | | | 4,635 | | | | 4,635 | | | | 4,855 | |
Russia | | | 980 | | | | 1,050 | | | | 845 | | | | 890 | | | | 920 | | | | 915 | | | | 805 | | | | 785 | | | | 825 | | | | 835 | |
North America | | | 390 | | | | 295 | | | | 385 | | | | 365 | | | | 345 | | | | 325 | | | | 325 | | | | 260 | | | | 200 | | | | 350 | |
Zimbabwe | | | — | | | | — | | | | — | | | | 155 | | | | 165 | | | | 170 | | | | 180 | | | | 230 | | | | 280 | | | | 340 | |
Others | | | 150 | | | | 225 | | | | 250 | | | | 115 | | | | 105 | | | | 120 | | | | 115 | | | | 115 | | | | 110 | | | | 100 | |
| | | | | | | | | | | | | | | | | | | | | | | | | | | | | | | | | | | | | | | | |
Total Supply | | | 5,970 | | | | 6,200 | | | | 6,490 | | | | 6,640 | | | | 6,830 | | | | 6,600 | | | | 5,940 | | | | 6,025 | | | | 6,050 | | | | 6,480 | |
| | | | | | | | | | | | | | | | | | | | | | | | | | | | | | | | | | | | | | | | |
| | | | | | | | | | |
Demand by Application | | | | | | | | | | | | | | | | | | | | | | | | | | | | | | | | | | | | | | | | |
Autocatalyst | | | 2,590 | | | | 3,270 | | | | 3,490 | | | | 3,795 | | | | 3,905 | | | | 4,145 | | | | 3,655 | | | | 2,185 | | | | 3,075 | | | | 3,105 | |
Chemical | | | 325 | | | | 320 | | | | 325 | | | | 325 | | | | 395 | | | | 420 | | | | 400 | | | | 290 | | | | 440 | | | | 470 | |
Electrical | | | 315 | | | | 260 | | | | 300 | | | | 360 | | | | 360 | | | | 255 | | | | 230 | | | | 190 | | | | 230 | | | | 230 | |
Glass | | | 235 | | | | 210 | | | | 290 | | | | 360 | | | | 405 | | | | 470 | | | | 315 | | | | 10 | | | | 385 | | | | 555 | |
Investment | | | 80 | | | | 15 | | | | 45 | | | | 15 | | | | -40 | | | | 170 | | | | 555 | | | | 660 | | | | 655 | | | | 460 | |
Jewellery* | | | 2,820 | | | | 2,510 | | | | 2,160 | | | | 2,465 | | | | 2,195 | | | | 2,110 | | | | 2,060 | | | | 2,810 | | | | 2,420 | | | | 2,480 | |
Medical & Biomedical | | | — | | | | — | | | | — | | | | 250 | | | | 250 | | | | 230 | | | | 245 | | | | 250 | | | | 230 | | | | 230 | |
Petroleum | | | 130 | | | | 120 | | | | 150 | | | | 170 | | | | 180 | | | | 205 | | | | 240 | | | | 210 | | | | 170 | | | | 210 | |
Other | | | 540 | | | | 470 | | | | 470 | | | | 225 | | | | 240 | | | | 265 | | | | 290 | | | | 190 | | | | 300 | | | | 355 | |
| | | | | | | | | | | | | | | | | | | | | | | | | | | | | | | | | | | | | | | | |
Total Gross Demand | | | 7,035 | | | | 7,175 | | | | 7,230 | | | | 7,965 | | | | 7,890 | | | | 8,270 | | | | 7,990 | | | | 6,795 | | | | 7,905 | | | | 8,095 | |
| | | | | | | | | | | | | | | | | | | | | | | | | | | | | | | | | | | | | | | | |
| | | | | | | | | | |
Recycling | | | | | | | | | | | | | | | | | | | | | | | | | | | | | | | | | | | | | | | | |
Autocatalyst | | | -565 | | | | -645 | | | | -690 | | | | -770 | | | | -860 | | | | -935 | | | | -1,130 | | | | -830 | | | | -1,085 | | | | -1,225 | |
Electrical | | | — | | | | — | | | | — | | | | 0 | | | | 0 | | | | 0 | | | | -5 | | | | -10 | | | | -10 | | | | -10 | |
Jewellery | | | — | | | | — | | | | — | | | | -500 | | | | -555 | | | | -655 | | | | -695 | | | | -565 | | | | -735 | | | | -810 | |
| | | | | | | | | | | | | | | | | | | | | | | | | | | | | | | | | | | | | | | | |
Total Recycling | | | -565 | | | | -645 | | | | -690 | | | | -1,270 | | | | -1,415 | | | | -1,590 | | | | -1,830 | | | | -1,405 | | | | -1,830 | | | | -2,045 | |
| | | | | | | | | | | | | | | | | | | | | | | | | | | | | | | | | | | | | | | | |
Total Net Demand | | | 6,470 | | | | 6,530 | | | | 6,540 | | | | 6,695 | | | | 6,475 | | | | 6,680 | | | | 6,160 | | | | 5,390 | | | | 6,075 | | | | 6,050 | |
| | | | | | | | | | | | | | | | | | | | | | | | | | | | | | | | | | | | | | | | |
Movements in Stocks | | | -500 | | | | -330 | | | | -50 | | | | -55 | | | | 355 | | | | -80 | | | | -220 | | | | 635 | | | | -25 | | | | 430 | |
Source: Johnson Matthey
The platinum price drifted lower during the year on the back of slower demand and the uncertainty of the European economy, but showed a marked turnaround in early August following fresh violence and strike action in the South African mining industry. Labour unrest in the country, which holds a reported 80% of the known reserves of the metal, has raised concerns about internal security and supply.
Prepared by Minxcon (Pty) Ltd
G-26
| | |
| CIMVal Compliant Report on the Boikgantsho Project, Limpopo Province, South Africa | | G-27 |
Figure 12: Platinum Price Monthly Historic
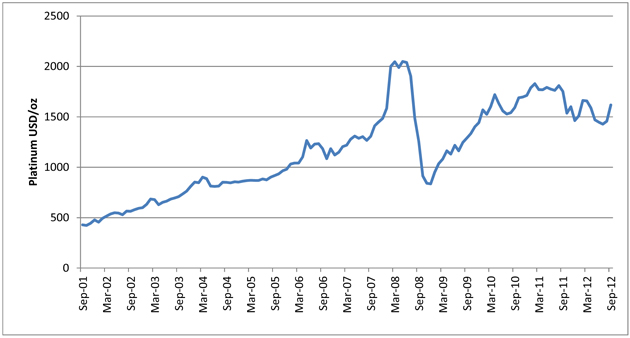
In addition, the announcement of a new round of monetary easing (QE3) helped to boost gold prices and PGM’s. Moreover, during September the ECB confirmed an unlimited bond-buying scheme to help reduce borrowing costs for struggling Eurozone countries, which led to euro strength (dollar weakness) and provided additional support for platinum prices.
Looking ahead, developments on the supply side will remain the key driver of platinum market sentiment and prices in the near term. Upside potential will be driven by the threat of further supply disruptions at South African platinum producers. In addition, higher production costs as a result of recent wage increases should help to sustain higher prices in the short term.
Nevertheless, platinum is unlikely to maintain upward momentum for the rest of the year. As labour tensions in South Africa eventually ease, a downward trend is likely to develop towards year-end and prices are expected to retreat. The metal’s overall underlying fundamentals remain challenging, given the economic conditions in Europe, prospects of autocatalyst demand remain bleak. In addition, net long speculative positions in Nymex platinum futures surged to a record high since mid-August, leaving the metal vulnerable to profit taking in the short term. New passenger car registrations in the EU continued to fall for an eleventh consecutive month, posting a year-on-year decline of 8.9% in August, while demand for commercial vehicles dropped by 12.4%. Longer term, the consensus prices for platinum is forecast to improve, albeit it a more steady increase.
Prepared by Minxcon (Pty) Ltd
G-27
| | |
| CIMVal Compliant Report on the Boikgantsho Project, Limpopo Province, South Africa | | G-28 |
Figure 13: Consensus Platinum Price Forecast (Nominal)
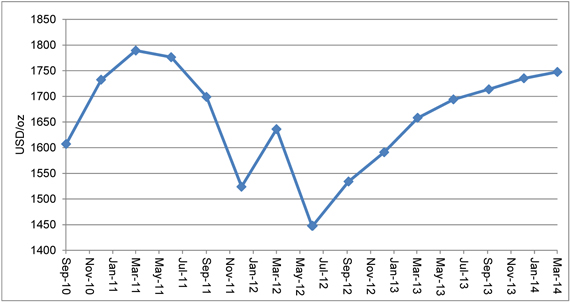
Data Source: Johnson Matthey/Consensus Economics Inc.
The palladium market was in surplus by 1.26 million ounces last year. Gross demand fell by 13% to 8.45 million ounces, mainly due to net selling by investors. Further Russian state stock sales and higher recycling also helped push the market into oversupply.
Table 6: Palladium Supply and Demand
| | | | | | | | | | | | | | | | | | | | | | | | | | | | | | | | | | | | | | | | |
‘000 oz | | 2002 | | | 2003 | | | 2004 | | | 2005 | | | 2006 | | | 2007 | | | 2008 | | | 2009 | | | 2010 | | | 2011 | |
| | | | | | | | | | |
Supply | | | | | | | | | | | | | | | | | | | | | | | | | | | | | | | | | | | | | | | | |
South Africa | | | 2,160 | | | | 2,320 | | | | 2,480 | | | | 2,605 | | | | 2,775 | | | | 2,765 | | | | 2,430 | | | | 2,370 | | | | 2,640 | | | | 2,560 | |
Russia | | | | | | | | | | | | | | | | | | | | | | | | | | | | | | | | | | | | | | | | |
Primary | | | 1,930 | | | | 2,950 | | | | 4,800 | | | | 3,135 | | | | 3,220 | | | | 3,050 | | | | 2,700 | | | | 2,675 | | | | 2,720 | | | | 2,705 | |
Stock Sales | | | — | | | | — | | | | — | | | | 1,485 | | | | 700 | | | | 1,490 | | | | 960 | | | | 960 | | | | 1,000 | | | | 775 | |
North America | | | 990 | | | | 935 | | | | 1,035 | | | | 910 | | | | 985 | | | | 990 | | | | 910 | | | | 755 | | | | 590 | | | | 900 | |
Zimbabwe | | | 0 | | | | 0 | | | | 0 | | | | 125 | | | | 135 | | | | 135 | | | | 140 | | | | 180 | | | | 220 | | | | 265 | |
Others | | | 170 | | | | 245 | | | | 265 | | | | 145 | | | | 135 | | | | 150 | | | | 170 | | | | 160 | | | | 185 | | | | 155 | |
| | | | | | | | | | | | | | | | | | | | | | | | | | | | | | | | | | | | | | | | |
Total Supply | | | 5,250 | | | | 6,450 | | | | 8,580 | | | | 8,405 | | | | 7,950 | | | | 8,580 | | | | 7,310 | | | | 7,100 | | | | 7,355 | | | | 7,360 | |
| | | | | | | | | | | | | | | | | | | | | | | | | | | | | | | | | | | | | | | | |
| | | | | | | | | | |
Demand by Application | | | | | | | | | | | | | | | | | | | | | | | | | | | | | | | | | | | | | | | | |
Autocatalyst | | | 3,050 | | | | 3,450 | | | | 3,790 | | | | 3,865 | | | | 4,015 | | | | 4,545 | | | | 4,465 | | | | 4,050 | | | | 5,580 | | | | 6,030 | |
Chemical | | | 255 | | | | 265 | | | | 310 | | | | 415 | | | | 440 | | | | 375 | | �� | | 350 | | | | 325 | | | | 370 | | | | 445 | |
Dental | | | 785 | | | | 825 | | | | 850 | | | | 815 | | | | 620 | | | | 630 | | | | 625 | | | | 635 | | | | 595 | | | | 550 | |
Electrical | | | 760 | | | | 900 | | | | 920 | | | | 1,275 | | | | 1,495 | | | | 1,550 | | | | 1,370 | | | | 1,270 | | | | 1,410 | | | | 1,380 | |
Investment | | | 0 | | | | 30 | | | | 200 | | | | 220 | | | | 50 | | | | 260 | | | | 420 | | | | 625 | | | | 1,095 | | | | -565 | |
Jewellery | | | 270 | | | | 260 | | | | 930 | | | | 1,490 | | | | 1,140 | | | | 950 | | | | 985 | | | | 775 | | | | 595 | | | | 505 | |
Other | | | 90 | | | | 110 | | | | 90 | | | | 265 | | | | 85 | | | | 85 | | | | 75 | | | | 70 | | | | 90 | | | | 105 | |
| | | | | | | | | | | | | | | | | | | | | | | | | | | | | | | | | | | | | | | | |
Total Gross Demand | | | 5,210 | | | | 5,840 | | | | 7,090 | | | | 8,345 | | | | 7,845 | | | | 8,395 | | | | 8,290 | | | | 7,750 | | | | 9,735 | | | | 8,450 | |
| | | | | | | | | | | | | | | | | | | | | | | | | | | | | | | | | | | | | | | | |
| | | | | | | | | | |
Recycling | | | | | | | | | | | | | | | | | | | | | | | | | | | | | | | | | | | | | | | | |
Autocatalyst | | | -370 | | | | -410 | | | | -530 | | | | -625 | | | | -805 | | | | -1,015 | | | | -1,140 | | | | -965 | | | | -1,310 | | | | -1,655 | |
Electrical | | | — | | | | — | | | | — | | | | -305 | | | | -290 | | | | -315 | | | | -345 | | | | -395 | | | | -440 | | | | -480 | |
Jewellery | | | — | | | | — | | | | — | | | | -60 | | | | -135 | | | | -235 | | | | -130 | | | | -70 | | | | -100 | | | | -210 | |
| | | | | | | | | | | | | | | | | | | | | | | | | | | | | | | | | | | | | | | | |
Total Recycling | | | -370 | | | | -410 | | | | -530 | | | | -990 | | | | -1,230 | | | | -1,565 | | | | -1,615 | | | | -1,430 | | | | -1,850 | | | | -2,345 | |
| | | | | | | | | | | | | | | | | | | | | | | | | | | | | | | | | | | | | | | | |
Total Net Demand | | | 4,840 | | | | 5,430 | | | | 6,560 | | | | 7,355 | | | | 6,615 | | | | 6,830 | | | | 6,675 | | | | 6,320 | | | | 7,885 | | | | 6,105 | |
| | | | | | | | | | | | | | | | | | | | | | | | | | | | | | | | | | | | | | | | |
Movements in stocks | | | 410 | | | | 1,020 | | | | 2,020 | | | | 1,050 | | | | 1,335 | | | | 1,750 | | | | 635 | | | | 780 | | | | -530 | | | | 1,255 | |
Prepared by Minxcon (Pty) Ltd
G-28
| | |
| CIMVal Compliant Report on the Boikgantsho Project, Limpopo Province, South Africa | | G-29 |
Source: Johnson Matthey
Supplies of palladium remained almost flat at 7.36 million ounces as rising output from North America and Zimbabwe was largely offset by lower sales from Russian state inventories.
Gross demand for palladium in autocatalysts reached a new high in 2011 of 6.03 million ounces, driven by growth in vehicle output in all regions apart from Japan, and greater use of palladium in light duty diesel after treatment systems. Industrial demand for the metal remained strong. Purchases of palladium by the jewellery industry fell last year, while investment demand for palladium turned sharply negative.
Like platinum, palladium values rallied in August 2012 as violence at several mines in South Africa cast doubt over output of the metal for the year. Uncertainties caused by production losses, inter-union tensions and lower profit margins could lead to cutbacks in investment, which threatens to drive prices higher during the recovery phase of the global business cycle. Weak demand from the European auto sector, which uses the metal in catalytic converters, and a slowdown in Asia may keep a lid on prices, though.
After hitting a 10 year high in March 2011, palladium started to slide lower, broadly following platinum’s trajectory. With regard to the forecast, the disruption of the South African mining industry will continue to dominate the metals’ market sentiment, albeit to a lower extent than platinum.
Looking ahead, current labour tensions in South Africa are expected to moderate eventually as we approach the end of the year. Nevertheless, palladium’s generally healthier underlying fundamentals should provide strong support for the metal in the near term. Indeed, the market remains in a gross deficit for the sixth consecutive year, while Russian stock sales continue to decline. Moreover, prospects of autocatalyst demand for palladium are far better than for its sister metal, given a far broader demand base. In addition, net long investor positions on Nymex remain far below record highs seen in the past, leaving scope for positions to rebuild. We are therefore looking for palladium to test $700 by the end of 2012, with a floor of some $630 likely to emerge.
Early October has seen further strength in palladium prices, as the metal is trading at over $660 at the moment, driven by recent developments on the supply side. Net investor long positions on Nymex surged in September, rising by nearly 50% to 1.4 Moz on the 25th of September, a level last seen in August 2011.
Prepared by Minxcon (Pty) Ltd
G-29
| | |
| CIMVal Compliant Report on the Boikgantsho Project, Limpopo Province, South Africa | | G-30 |
Figure 14: Palladium Price Monthly Historic
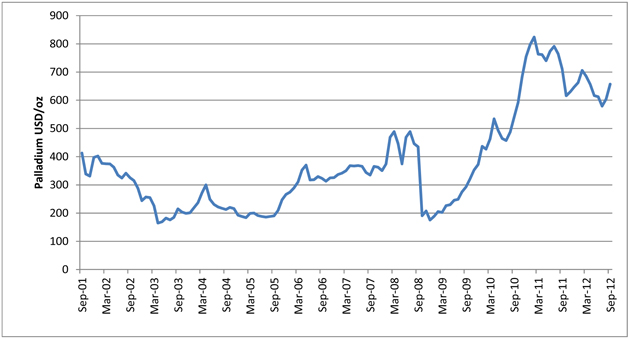
Seasonally adjusted US auto sales rose by 13% in September, to reach a four-year high of 14.9 million units.
Figure 15: Consensus Palladium Price Forecast (Nominal)
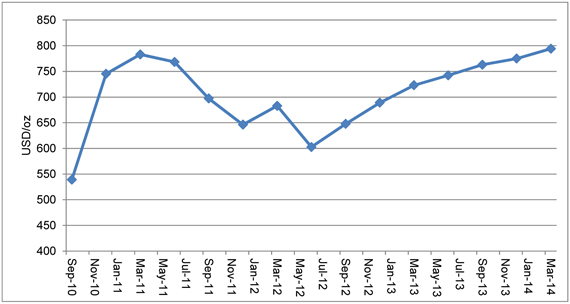
Data Source: Johnson Matthey/Consensus Economics Inc.
Despite growth in demand, the rhodium market remained in surplus last year by 139,000 oz as a result of higher supplies and recycling. Rhodium supplies rose by 4% to 765,000 oz due mainly to higher output from North America and Zimbabwe. Demand for rhodium increased by 2% to 906,000 oz as a result of capacity building in the glass industry and investment in a new rhodium ETF. Gross demand for rhodium in autocatalysts softened by 2% to 712,000 oz due to lower output by Japanese car manufacturers.
Prepared by Minxcon (Pty) Ltd
G-30
| | |
| CIMVal Compliant Report on the Boikgantsho Project, Limpopo Province, South Africa | | G-31 |
Table 7: Rhodium Supply and Demand
| | | | | | | | | | | | | | | | | | | | | | | | | | | | | | | | | | | | | | | | |
‘000 oz | | 2002 | | | 2003 | | | 2004 | | | 2005 | | | 2006 | | | 2007 | | | 2008 | | | 2009 | | | 2010 | | | 2011 | |
| | | | | | | | | | |
Supply | | | | | | | | | | | | | | | | | | | | | | | | | | | | | | | | | | | | | | | | |
South Africa | | | 490 | | | | 544 | | | | 587 | | | | 627 | | | | 666 | | | | 696 | | | | 574 | | | | 663 | | | | 632 | | | | 641 | |
Russia | | | 90 | | | | 140 | | | | 100 | | | | 90 | | | | 100 | | | | 90 | | | | 85 | | | | 70 | | | | 70 | | | | 72 | |
North America | | | 25 | | | | 26 | | | | 17 | | | | 20 | | | | 17 | | | | 20 | | | | 18 | | | | 15 | | | | 10 | | | | 20 | |
Zimbabwe | | | 0 | | | | 0 | | | | 0 | | | | 13 | | | | 14 | | | | 14 | | | | 15 | | | | 19 | | | | 19 | | | | 29 | |
Others | | | 10 | | | | 14 | | | | 16 | | | | 4 | | | | 5 | | | | 4 | | | | 3 | | | | 3 | | | | 3 | | | | 3 | |
| | | | | | | | | | | | | | | | | | | | | | | | | | | | | | | | | | | | | | | | |
Total Supply | | | 615 | | | | 724 | | | | 720 | | | | 754 | | | | 802 | | | | 824 | | | | 695 | | | | 770 | | | | 734 | | | | 765 | |
| | | | | | | | | | | | | | | | | | | | | | | | | | | | | | | | | | | | | | | | |
| | | | | | | | | | |
Demand by Application | | | | | | | | | | | | | | | | | | | | | | | | | | | | | | | | | | | | | | | | |
Autocatalyst | | | 599 | | | | 660 | | | | 758 | | | | 829 | | | | 863 | | | | 887 | | | | 768 | | | | 619 | | | | 727 | | | | 712 | |
Chemical | | | 39 | | | | 39 | | | | 43 | | | | 48 | | | | 49 | | | | 63 | | | | 68 | | | | 54 | | | | 67 | | | | 72 | |
Electrical | | | 6 | | | | 6 | | | | 8 | | | | 10 | | | | 9 | | | | 3 | | | | 3 | | | | 3 | | | | 4 | | | | 5 | |
Glass | | | 37 | | | | 26 | | | | 46 | | | | 57 | | | | 65 | | | | 59 | | | | 34 | | | | 19 | | | | 68 | | | | 78 | |
Other | | | 10 | | | | 13 | | | | 14 | | | | 20 | | | | 23 | | | | 24 | | | | 24 | | | | 21 | | | | 21 | | | | 39 | |
| | | | | | | | | | | | | | | | | | | | | | | | | | | | | | | | | | | | | | | | |
Total Gross Demand | | | 691 | | | | 744 | | | | 869 | | | | 964 | | | | 1,009 | | | | 1,036 | | | | 897 | | | | 716 | | | | 887 | | | | 906 | |
| | | | | | | | | | | | | | | | | | | | | | | | | | | | | | | | | | | | | | | | |
| | | | | | | | | | |
Recycling | | | | | | | | | | | | | | | | | | | | | | | | | | | | | | | | | | | | | | | | |
Autocatalyst | | | -99 | | | | -124 | | | | -140 | | | | -137 | | | | -171 | | | | -192 | | | | -227 | | | | -187 | | | | -241 | | | | -280 | |
| | | | | | | | | | | | | | | | | | | | | | | | | | | | | | | | | | | | | | | | |
Total Recycling | | | -99 | | | | -124 | | | | -140 | | | | -137 | | | | -171 | | | | -192 | | | | -227 | | | | -187 | | | | -241 | | | | -280 | |
| | | | | | | | | | | | | | | | | | | | | | | | | | | | | | | | | | | | | | | | |
Total Net Demand | | | 592 | | | | 620 | | | | 729 | | | | 827 | | | | 838 | | | | 844 | | | | 670 | | | | 529 | | | | 646 | | | | 626 | |
| | | | | | | | | | | | | | | | | | | | | | | | | | | | | | | | | | | | | | | | |
Movements in Stocks | | | 23 | | | | 104 | | | | -9 | | | | -73 | | | | -36 | | | | -20 | | | | 25 | | | | 241 | | | | 88 | | | | 139 | |
Rhodium prices showed little response to the discontent on the South African supply side for much of the first half of the month, remaining becalmed at the Johnson Matthey Base Price of $1,100. As speculators and industrial buyers moved to cover their rhodium requirements, mindful of the ongoing disruption to South African mining, the price gained $300 over three days, briefly spiking at a five month high of $1,400 on the 18th of September 2012. At this level, investors liquidated speculative holdings and the price dropped almost as quickly as it had risen, coming to rest at $1,100 once again.
Prepared by Minxcon (Pty) Ltd
G-31
| | |
| CIMVal Compliant Report on the Boikgantsho Project, Limpopo Province, South Africa | | G-32 |
Figure 16: Rhodium Price Monthly Historic

The valuator considered the market approach and historical cost approach as suitable methods to determine a range of values. Based upon review of technical data for the Boikgantsho Project, the Cost and Market Approaches were selected for the current valuation. This reflects the fact that:
| | 1. | reasonable records exist of exploration expenditures for the Boikgantsho Project, and; |
| | 2. | mineral property transactions were available for review that reflect market conditions broadly similar to current market conditions. |
14.6.1.1 Adjustment for Economic Parameters and Pricing
The transactions used to construct the valuation curve for this Valuation Report occurred at a specific point in time and, therefore, at a specific USD denominated PGM+Au price. In order to report historic transactions in today’s terms and compare all transactions on the same economic level, economic parameters were determined for each historic transaction at the time it took place. Historic transaction prices were then adjusted to current day terms by determining the difference in value from the time of these historic transactions to the current day parameters.
Subsequent to the normalisation of each transaction to a current cash value, Minxcon plotted the values of historical transactions, which took place on an arm’s length basis, in relation to their specific stage of Resource classification. This methodology, when applied to exploration and resource transactions, provides guidance in terms of a range of transaction values for the mineral asset or project being analysed and valuated.
Prepared by Minxcon (Pty) Ltd
G-32
| | |
| CIMVal Compliant Report on the Boikgantsho Project, Limpopo Province, South Africa | | G-33 |
Figure 17: Platinum Valuation Curve
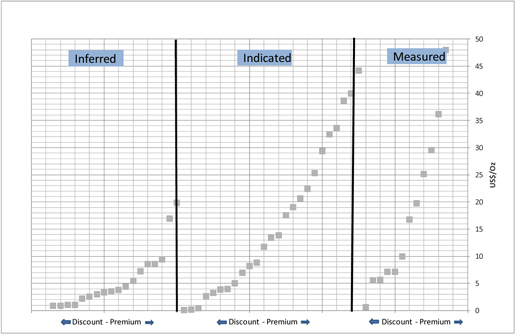
The normalisation of each transaction (USD/oz) to a current value was done by comparing the Rand denominated commodity prices at the historic transaction date with the average price for the three months preceding the effective date of this Valuation Report, together with the twelve-month forecast, to make a linear adjustment of the historic transaction price (USD/oz) and calculate an appropriate transaction price level (USD/oz) as at the base date of this Valuation Report.
Table 8: Economic Parameters Used in the Valuation Approach
| | | | | | | | | | | | | | | | |
| R/US$ | | Platinum | | | Palladium | | | Rhodium | | | Au | |
| 8.46 | | | 1600 | | | | 682 | | | | 1810 | | | | 1679 | |
This principle is used to reflect the current market expectation that is likely to drive the calculated market value. Although the Platreef has a higher nickel and copper content than both the Merensky Reef and UG2 Reef, the base metals have not been seen as principal drivers of project value in the past and hence have not been included.
14.6.1.2 Valuation Parameters
The valuation curve explained above shows a wide range of values. To determine the specific value for a project, a CIMVAL derived matrix is used for determining mining project risk, weighting different criteria such as depth, geology, mining process and legal tenure. Minxcon adopted this matrix, and modified classification and ratings to suit parameters that are sensitive to this commodity. Minxcon also incorporated an additional category, namely the social and environmental factor. Values applicable to the global platinum industry were applied and used to determine a project risk index that relates the value for Boikgantsho Project to that of the PGM industry. This is summarized in Table 9. These parameters were used to determine a risk associated index for a project relative to that of the platinum industry:-
Prepared by Minxcon (Pty) Ltd
G-33
| | |
| CIMVal Compliant Report on the Boikgantsho Project, Limpopo Province, South Africa | | G-34 |
Table 9: Valuation Risk Associated Parameter Matrix - Platinum Industry Standards
| | | | | | | | | | | | |
Principal Project Risk | | Premium | | Index | | Average | | Index | | Discount | | Index |
Depth | | <200 m | | 10 | | >200 to 1500 m | | 6 | | >1500 m | | 2 |
Scale of Project (Resource) | | >5 Moz. | | 10 | | >2 Moz. to 5 Moz. | | 6 | | <2 Moz. | | 2 |
Mining/ Process Method | | Open Pit | | 10 | | Mechanised | | 6 | | Underground | | 2 |
Infrastructure | | Mining and Plant | | 10 | | Mining | | 6 | | Nothing | | 2 |
Data Quality | | Well Understood | | 6 | | Neutral | | 4 | | Poorly understood | | 2 |
Title/Ownership | | Corporate Structure | | 6 | | Mining Right | | 4 | | Exploration Right | | 2 |
Geological Complexity | | Minor Faulting | | 6 | | Faulting | | 4 | | Major Faulting | | 2 |
Deposit Type | | Western Bushveld | | 6 | | Platreef | | 4 | | Eastern Bushveld/ Other | | 2 |
Stage of Development | | Operating | | 3 | | Feasibility | | 2 | | Pre-feasibility, Compliant Resource or < | | 1 |
Strategic | | Important - Premium | | 3 | | Neutral | | 2 | | Discount | | 1 |
Ability to Increase Resource | | High | | 3 | | Medium | | 2 | | Low | | 1 |
Social and Environmental | | Limited Social and Environmental Risk | | 3 | | Medium Social and Environmental Risk | | 2 | | Substantial Social and Environmental Risk | | 1 |
14.6.1.3 Methodology
The methodology was as follows:-
| | • | | The specific Boikgantsho Project criteria (Table 10) were measured against the risk associated parameters in |
Prepared by Minxcon (Pty) Ltd
G-34
| | |
| CIMVal Compliant Report on the Boikgantsho Project, Limpopo Province, South Africa | | G-35 |
| | Table 9, therefore allocating either a discount or a premium for each item line. The sum of all the item lines is then compared to the average index and this is then used to move the USD/oz for the project up or down in each Resource category. |
| | • | | The index was developed in such a way that a project that attracts a significant discount or premium will plot at either the lower or higher end of the value scale in each category. |
| | • | | Subsequently, an adjusted valuation curve was defined for the Boikgantsho Project. |
Table 10: Principal Risk - Boikgantsho Project
| | |
Modifying Factors | | Comment |
| Depth | | The Platreef at the Boikgantsho Project and surrounding properties strikes more or less north-south, with the ore body found close to surface dipping to the west at ~40°, although there is evidence of a steepening of the dip in some areas, e.g. in the far south of Boikgantsho Project, where the dip may approach 50 – 55°. This allows for open-pit operations with preliminary pit shell designs of 700 m wide and 300 m deep. |
| |
| Scale of Project (Resource) | | Medium-sized ore body with 1.16 Moz in Measured, 3.42 Moz in Indicated and 1.95 Moz in Inferred. |
| |
| Potential Mining Method | | The Project comprises the Drenthe, Witrivier and Overysel deposits. The deposits are typically low grade, with head grades to the plant averaging 1.8g/t Total PGM+Au and 0.11% Ni. As a result of the low head grades, the operation will have to be designed as a high throughput open-pit operation. |
| |
| Infrastructure | | Nearby highways, railways, high-capacity electrical transmission lines and the cities of Mokopane (Potgietersrus) and Polokwane (Pietersburg) provide the essential infrastructure for Anglo Platinum’s 12,000 tonnes per day Sandsloot PGM mine. This mine is located approximately 10 kilometres south of the Platreef property and the existing infrastructure has the capacity to support additional mine development. |
| |
| Data Quality | | Since the acquisition of the Platreef property by Plateau, and subsequently by Anooraq, drilling is well documented. The Boikgantsho Project is a Platreef exploration project and has been explored since 1999 by Anooraq, including drilling programmes in 2000, 2002, 2003, 2004 and 2005. Exploration included a compilation of published geological maps and drill-hole data and an aeromagnetic survey in order to establish the probable location of the prospective PGM-bearing Platreef rock package. As of 31 December 2004, 18,290 m in 91 holes had been completed on the Drenthe farm, 12,927 m in 66 holes had been completed on the Overysel farm and 5,261 m in 27 holes had been completed on the Witrivier farm. In 2005, Anooraq completed 24,418 m of infill and step-out drilling in 136 holes into the Drenthe deposit. Of these, 20,486 m were completed on Drenthe farm and 3,932 m were completed on Witrivier farm. |
| |
| Title/Ownership | | The Project consists of two contiguous farms, Drenthe and Witrivier, each with its own new order prospecting right. All mineral rights are currently held by Boikgantsho Platinum Mines (Pty) Ltd. Anooraq has a number of other exploration projects that are contiguous to the Boikgantsho Project, which do not form part of this report. |
| |
| Geological Complexity | | There is repeated intrusion of the various magma lineages from which the Platreef crystallized, complicating the relationships with one another and further exacerbated by the proximity of the floor contact. Floor rock xenoliths add to the difficulty of interpreting the stratigraphy. The Platreef and, to a lesser extent, the Main Zone are cut by thin granitic veins or dykelets. Although volumetrically insignificant, they are widespread throughout the sequence. |
| |
| Deposit type | | The mineralogy of the deposit is complex in comparison to typical Merensky and UG2 ores. The predominant PGM species in the reef is Pt-Pd Bismuth telluride (as opposed to Pt/Pd sulphides, which dominate in Merensky and UG2 ores) and is generally not associated with Base Metal Sulphides (BMS). In addition to this, PGM minerals occur at very fine grain sizes, which implies that the bulk of the material is slow floating, and potentially difficult to recover. |
| |
| Stage of development | | Exploration project. |
| |
| Strategic | | Not strategic. |
| |
| Ability to increase Mineral Resource | | Extensive exploration has delineated and defined the ore body and the ability to increase resources is therefore limited on Boikgantsho. |
| |
| Political, Social & Environmental | | A preliminary estimate indicates that relocating a village will cost at least ZAR270 million in current day money terms. This estimate cost includes the relocation of 400 households, a primary school (418 pupils), a municipal clinic, acquisition of land, civil infrastructure, waste management and movement costs. If initial mining could start south of the Witrivier, the relocation of the village could happen in 5-7 years’ time. By escalating the value by 6% per annum, projected costs of relocating the village are estimated at between ZAR368 million and ZAR413 million within the next 5-7 years. |
Prepared by Minxcon (Pty) Ltd
G-35
| | |
| CIMVal Compliant Report on the Boikgantsho Project, Limpopo Province, South Africa | | G-36 |
14.6.1.4 Value Based on the Market Approach
A sample of values of typical PGM transactions was taken from the larger population of historical transactions for the platinum industry. The lower 25% and upper 75% extreme values were eliminated to establish a value range for the properties within the 25th and 75th quarter percentiles. The unit values for the noted comparable PGM properties range between US$0.95/oz (Inferred) and US$51.88/oz (Measured). An upper and lower in situ value has been calculated using total Resource values of US$6.23/oz and US$37.09/oz respectively, as outlined in Table 48. The reason for the wide range is the unique key factors of each project. This includes geology, mineralisation, potential operating costs, stage of exploration, the availability of infrastructure and peripheral issues such as social, political and environmental aspects.
After applying the risk factor described above, an estimated value was calculated using the unit value. This value was adjusted with the PV of the cost to move the community as illustrated in Table 11. The final value illustrated in Table 12 illustrates the mineral asset value after the deduction of the PV of the potential movement of the village (assumed to be in year 5).
Table 11: Potential Moving Cost of Community in Specific Year
| | | | | | | | |
Cost Estimate at Specific Point in Time | | Inflation Adjustment | | | Cost in Specific Year | |
Current Day | | | | | | | 267,039,891 | |
31-Dec-12 | | | 6 | % | | | 275,116,934 | |
31-Dec-13 | | | 6 | % | | | 291,623,950 | |
31-Dec-14 | | | 6 | % | | | 309,121,387 | |
31-Dec-15 | | | 6 | % | | | 327,668,670 | |
31-Dec-16 | | | 6 | % | | | 347,382,653 | |
31-Dec-17 | | | 6 | % | | | 368,225,613 | |
31-Dec-18 | | | 6 | % | | | 390,319,149 | |
31-Dec-19 | | | 6 | % | | | 413,738,298 | |
Present value of cost: development - year 5 | | | | | | | 156,042,394 | |
Table 12: Mineral Asset Valuation Based on Comparative Analysis (After Deduction of PV of Moving Cost)
| | | | | | | | | | | | | | | | | | | | | | | | | | | | | | |
Category | | Reef | | Total | | | Lower
Price | | | Risk
Adjusted
Price | | | Upper
Price | | | Lower Value | | | Estimated
Value | | | Upper Value | |
| | | | | oz (‘000) | | | USD/oz | | | ZAR‘000 | |
Measured | | Platreef | | | 1,165 | | | $ | 10.77 | | | $ | 28.43 | | | $ | 51.88 | | | | 106,094 | | | | 280,087 | | | | 511,173 | |
Indicated | | Platreef | | | 3,415 | | | $ | 7.70 | | | $ | 19.80 | | | $ | 49.21 | | | | 222,336 | | | | 571,784 | | | | 1,420,825 | |
| | | | | | | | | | | | | | | | | | | | | | | | | | | | | | |
Sub-total | | | | | 4,580 | | | $ | 8.48 | | | $ | 22.00 | | | $ | 49.89 | | | | 328,429 | | | | 851,871 | | | | 1,931,998 | |
| | | | | | | | | | | | | | | | | | | | | | | | | | | | | | |
Inferred | | Platreef | | | 1,945 | | | $ | 0.95 | | | $ | 6.48 | | | $ | 6.96 | | | | 15,550 | | | | 106,498 | | | | 114,465 | |
| | | | | | | | | | | | | | | | | | | | | | | | | | | | | | |
Total | | | | | 6,525 | | | $ | 6.23 | | | $ | 17.37 | | | $ | 37.09 | | | | 343,980 | | | | 958,369 | | | | 2,046,462 | |
| | | | | | | | | | | | | | | | | | | | | | | | | | | | | | |
The table below illustrates properties which are comparable to the asset which is currently being valued and includes transactions on other areas of the Bushveld Complex for undeveloped properties. Of these properties, the Lonmin-AfriOre transaction shows the closest resemblance.
Table 13: Typical Transactions in the Industry
| | | | | | | | | | | | | | | | |
Buyer | | Seller | | Property | | Price
(USD million) | | | Attributable Moz | | | USD/oz | |
Implats | | Afplats | | Leeuwkop | | | 569.28 | | | | 39.25 | | | | 14.50 | |
Lonmin | | AfriOre/Other | | AfriOre | | | 410.06 | | | | 24.89 | | | | 16.47 | |
Mvela | | Khumama | | Booysendal Platinum | | | 335.19 | | | | 51.72 | | | | 6.48 | |
Imbani Platinum | | Ridge Mining | | Blue Ridge Mine | | | 43.09 | | | | 2.67 | | | | 16.14 | |
Prepared by Minxcon (Pty) Ltd
G-36
| | |
| CIMVal Compliant Report on the Boikgantsho Project, Limpopo Province, South Africa | | G-37 |
The historical cost or appraised method is based on costs to improve the value of the Boikgantsho Project. Exploration costs during the past two years averaged ZAR3 million per annum. Total capitalised pre-2010 exploration costs incurred by Atlatsa and Amplats are ZAR59.0 million. Prior to Atlatsa’s acquisition of the Boikgantsho Project, exploration was sporadic. It was not possible to establish during which years this was spent. Minxcon did not include any future expenditure as this is normally not accepted by certain stock exchanges.
Table 14: Historic Exploration Costs Associated with the Boikgantsho Project (ZAR)
| | | | | | | | | | | | | | | | |
| | | FY 2011 | | | FY 2010 | | | Pre-2010 | | | Total | |
Boikgantsho | | (Unaudited) | | | (Unaudited) | | | (Audited) | | |
Exploration cost as per income statement | | | 3,298,446 | | | | 3,089,642 | | | | — | | | | 6,388,088 | |
Exploration cost capitalised | | | — | | | | — | | | | 59,002,125 | | | | 59,002,125 | |
Inflation Adjusted | | | | | | | | | | | | | | | | |
Exploration cost as per income statement | | | 3,562,322 | | | | 3,603,758 | | | | | | | | 7,166,080 | |
Exploration cost capitalised | | | | | | | | | | | 74,325,685 | | | | 74,325,685 | |
| | | | | | | | | | | | | | | | |
Total | | | 3,562,322 | | | | 3,603,758 | | | | 74,325,685 | | | | 81,491,765 | |
| | | | | | | | | | | | | | | | |
Time value of money was taken into consideration by applying a cost inflation factor of 8%. Total cost in current money terms was calculated to be ZAR81.49 million (this figure is conservative because the pre-2010 exploration expenditure was inflated for three years only.
In order to calculate the value based on historical cost, a prospectivity enhancement multiplier (“PEM”) factor is applied to the total exploration cost, the magnitude of which is determined by the level of sophistication of the exploration for which positive exploration results have been obtained and the prospectivity of the Boikgantsho Project. It is normally accepted that an asset’s value is correlated to the money spent on its acquisition. However, potential prospectivity of the Boikgantsho Project is not necessarily positively correlated to the increased level of exploration. The level of prospectivity has to be considered in the equation. Minxcon calculates the PEM by first determining the phase of exploration (Minxcon developed this index from its experience in the exploration and consulting field). An index value specific to the phase of exploration is multiplied by the level of prospectivity. This prospectivity level is derived from the opinion of the company geologist who is interviewed and helps to formulise the estimation of the PEM factor.
Table 15: Cost Approach Valuation
| | | | | | | | | | | | | | | | | | | | |
Phase Description | | PEM (Low) | | | PEM (High) | | | Historical Cost
(ZAR‘000) | | | Low Value
(ZAR‘000) | | | High Value
(ZAR‘000) | |
Classification of Measured Resources | | | 10.92 | | | | 11.22 | | | | 81,492 | | | | 889,890 | | | | 914,338 | |
Minxcon has reached the following conclusions regarding the Boikgantsho Project:-
| | 1. | The two valuation approaches applied were the cost approach and market approach. |
| | 2. | The value range generated from the cost approach was calculated in a narrow range of between ZAR889. 89 million and ZAR914.34 million. |
| | 3. | Values generated from the market approach are much wider. The difficulty of this approach within the mining industry is that there are no true comparables, since each asset is unique with respect to key factors such as geology, mineralisation, costs, stage of exploration, infrastructure and peripheral issues, such as social, political and environmental aspects. After applying the risk factors pertaining to the specific ore body, as described in the application above, Minxcon calculated a value range of ZAR343 million to ZAR2,046 million with a risk adjusted single estimated single value of ZAR958 million (adjusted for socio economic and project specific characteristics). |
Prepared by Minxcon (Pty) Ltd
G-37
| | |
| CIMVal Compliant Report on the Boikgantsho Project, Limpopo Province, South Africa | | G-38 |
| | 4. | The values that were derived after applying two valuation methods are set out in the table below: |
| | | | | | | | | | | | |
Approach | | Low Value | | | Estimated Value | | | High Value | |
| | | (ZAR‘000) | |
Market Approach | | | 343,980 | | | | 958,369 | | | | 2,046,462 | |
Cost Approach | | | 889,890 | | | | — | | | | 914,338 | |
| | 5. | After taking into consideration the estimated value of the market approach and the average of the costs approach, the valuation range for the Boikgantsho Project was established at between ZAR902 million and ZAR960 million. |
In arriving at our calculation, amongst other things, Minxcon relied upon and considered the following sources of information:
| | 1. | Technical Report prepared by Kai Batla Minerals - The Mineral Resource Estimation for the Platreef for the Boikgantsho Project, Limpopo Province, Republic of South Africa - Ref: KB 1AQ01112011; 31 January 2012 |
| | 2. | Atlatsa financial reports; |
| | 3. | Various media publications; and |
| | 4. | JSE Sens announcements. |
| | 5. | Extract from an article published in the international Journal of Energy & Natural Resources Law by Peter Leon a partner and Head of Africa Mining & Energy Projects at Webber Wentzel, Johannesburg, South Africa. |
In addition to the above, the following documents were directly referenced:
Ferreira, D.S., and Bisnath, A. (2012). Competent Persons’ Report: Technical Report the Mineral Resource Estimation for the Platreef for the Boikgantsho Project, Limpopo Province, Republic of South Africa, 69pp.
| 17 | CERTIFICATE OF QUALIFICATIONS |
The author of this Valuation Report is a member in good standing of appropriate professional institutions. The qualifications and professional registrations of the Qualified Person and Qualified Valuators who contributed to this evaluation are provided at the end of this Valuation Report. The following person made contributions to this Valuation Report and is a Competent Person, as defined in SAMREC and SAMVAL, a Qualified Person and a Qualified Valuator as defined in CIMVAL, and a Qualified Person as defined in NI 43-101:-
Johan Odendaal (Director, Minxcon): B.Sc. (Geol.), B.Sc. (Hons) (Min. Econ.), M.Sc. (Min. Eng.), Pr. Sci. Nat. 400024/04, FSAIMM, MGSSA, MAusIMM:
Johan has 25 years’ experience in the mining and financial industry. This includes 8 years as an independent mining consultant specialising in the valuation of mining projects and 12 years as a mining analyst at two major stockbroking firms. During this time, he was rated one of the top platinum and gold mining analysts and became a globally recognised industry specialist.
Prepared by Minxcon (Pty) Ltd
G-38
| | |
| CIMVal Compliant Report on the Boikgantsho Project, Limpopo Province, South Africa | | G-39 |
CERTIFICATE of QUALIFIED VALUATOR AND QUALIFIED PERSON - NJ Odendaal
I, Johan Odendaal, do hereby certify that:-
| 1. | I am a director of Minxcon (Pty) Ltd |
Suite 5, Coldstream Office Park,
Cnr. Hendrik Potgieter and Van Staden Roads,
Little Falls, Johannesburg, South Africa
| 2. | I graduated with a B.Sc. (Geology) degree from the Rand Afrikaans University in 1985. In addition, I obtained a B.Sc. Hons (Mineral Economics) from the Rand Afrikaans University in 1986 and a M.Sc. Min. Eng. from the University of the Witwatersrand in 1992. |
| 3. | I am a member/fellow of the following professional associations, which meet all the attributes of a Professional Association or a Self-Regulatory Professional Association, as applicable (as those terms are defined in CIMVAL):- |
| | | | |
Class | | Professional Society | | Year of
Registration |
| Member | | Geological Society of South Africa (MGSSA No. 965119) | | 2003 |
| Fellow | | South African Institute of Mining and Metallurgy (FSAIMM Reg. No. 702615) | | 2003 |
| Member | | Australasian Institute of Mining and Metallurgy (MAusIMM Reg. No. 220813) | | 2003 |
| Member | | South African Council for Natural Scientific Professions (Pr. Sci. Nat. Reg. No. 400024/04) | | 2003 |
| 4. | I have worked as a Geoscientist for a total of 25 years since my graduation from university. As a former employee of Merrill Lynch, I was actively involved in advising mining companies and investment bankers on corporate related issues, analysing platinum and gold companies. I have completed a number of valuations on various commodities, including platinum, using the valuation approaches described by SAMVAL and CIMVAL. |
| 5. | I am a Qualified Valuator and a Qualified Person (as those terms are defined in CIMVAL) for the purposes of the valuation and the Valuation Report. |
| 6. | To the best of my knowledge, information and belief, this Valuation Report contains all scientific and technical information required to be disclosed to make the Valuation Report not misleading. |
| 7. | The facts presented in this Valuation Report are correct to the best of my knowledge. |
| 8. | The analyses and conclusions are limited only by the reported forecasts and conditions. |
| 9. | I have no present or prospective interest or involvement in the subject property or asset. |
| 10. | My compensation, employment or contractual relationship with the Commissioning Entity is not contingent on any aspect of this Valuation Report. |
| 11. | I have no bias with respect to the assets that are the subject of this report, or to the parties involved with the assignment. |
| 12. | I was responsible for this Valuation Report. |
| 13. | I have read this Valuation Report and CIMVAL and this Valuation Report has been prepared in compliance with CIMVAL. |
| 14. | I made a personal inspection of the properties on 4 April 2012. |
|
| Yours faithfully, |
|
 |
| NJ ODENDAAL |
| B.Sc. (Geol.), B.Sc. Hons. (Min. Econ.), M.Sc. (Min. Eng.) |
| Pr. Sci. Nat., FSAIMM, MGSSA, MAusIMM |
| DIRECTOR |
Prepared by Minxcon (Pty) Ltd
G-39
| | |
| CIMVal Compliant Report on the Boikgantsho Project, Limpopo Province, South Africa | | G-40 |
| | |
Term | | Definition |
| Amsl | | Above mean sea level |
| |
| Archaean | | A period of time between 4,000Ma and 2,500Ma. |
| |
| Assay | | Process to determine the proportions of metal in an ore. |
| |
| Assay laboratory | | A facility in which the proportions of metal in ores or concentrates are determined using analytical techniques. |
| |
| Bearing | | Strike |
| |
| Black Economic Empowerment (“BEE”) company | | The following recommendations have been made to the South African government by the Black Economic Empowerment Commission regarding the definitions of different levels of company ownership by Black people that qualify for BEE status: A ‘Black company’ is one that is 50.1% owned and managed by Black people; A ‘Black empowerment company’ is one that is at least 25.1% owned and managed by Black people; and A ‘Black influenced company’ is one that is 5% -25% owned and managed by Black people. |
| |
| Competent Person | | The SAMREC Code defines a Competent Person as a person who is registered with any one of SACNASP, ECSA, PLATO or any other statutory South African or international body that is recognized by SAMREC. A Competent Person should have a minimum of five years’ experience relevant to the style of mineralisation and type of deposit under consideration and to the activity, which that person is undertaking. |
| |
| Core | | A cylindrical shaped sample of ore, derived by drilling with a hollow cylinder for the purpose of obtaining geological information. |
| |
| Diamond drilling | | A drilling method, where the rock is cut with a diamond bit, usually to extract cores. |
| |
| Dilution | | Waste which is mixed with ore in the mining process. |
| |
| Dip | | The angle that a structural surface, i.e. a bedding or fault plane, makes with the horizontal measured perpendicular to the strike of the structure. |
| |
| Exchange Rate | | The rate at which one currency will be converted to another. |
| |
| Exploration | | Prospecting, sampling, mapping, diamond drilling and other work involved in the search for mineralisation. |
| |
| Facies | | The features that characterise a sediment as having been deposited in a particular depositional environment. |
| |
| Fault | | A fracture in earth materials, along which the opposite sides have been relatively displaced parallel to the plane of movement. |
| |
| Faulting | | The process of fracturing that produces a displacement. |
| |
| Grade | | The quantity of metal per unit mass of ore expressed as a percentage or, for gold, as grams per tonne of ore. |
| |
| Lithology | | The general compositional characteristics of sedimentary rocks. |
| |
| Logging | | Method of obtaining a continuous record of the lithology, stratigraphy and structure of the core obtained from a diamond drill hole. |
| |
| Measured Resource | | That part of a Mineral Resource for which tonnage, densities, shape, physical characteristics, grade and mineral content can be estimated with a high level of confidence. It is based on detailed and reliable exploration, sampling and testing information gathered through appropriate techniques from locations such as outcrops, trenches, pits, workings and drill holes. The locations are spaced closely enough to confirm geological and grade continuity (SAMREC definition). |
| |
| Mineable | | That portion of a Resource for which extraction is technically and economically feasible. |
| |
| Mineral Reserve | | The economically mineable material derived from a Measured and/or Indicated mineral Resource. It is inclusive of diluting materials and allows for losses that may occur when the material is mined. Appropriate assessments, which may include feasibility studies, have been carried out, including consideration of, and modification by, realistically assumed mining, metallurgical, economic, marketing, legal, environmental, social and governmental factors. These assessments demonstrate at the time of reporting that extraction is reasonably justified. Mineral Reserves are sub-divided in order of increasing confidence into Probable Mineral Reserves and Proved Mineral Reserves (SAMREC definition). |
| |
| Mineral Resource | | A concentration (or occurrence) of material of economic interest in or on the earth’s crust in such form, quality and quantity that there are reasonable and realistic prospects for eventual economic extraction. The location, quantity, grade, continuity and other geological characteristics of a mineral resource are known, estimated from specific geological evidence and knowledge, or interpreted from a well-constrained and portrayed geological model. Mineral Resources are subdivided, in order of increasing confidence in respect of geoscientific evidence, into Inferred, Indicated and Measured categories (SAMREC definition). |
| | and other geological characteristics of a mineral resource are known, estimated from specific geological evidence and knowledge, or interpreted from a well-constrained and portrayed geological model. Mineral Resources are subdivided, in order of increasing confidence in respect of geoscientific evidence, into Inferred, Indicated and Measured categories (SAMREC definition). |
Prepared by Minxcon (Pty) Ltd
G-40
| | |
| CIMVal Compliant Report on the Boikgantsho Project, Limpopo Province, South Africa | | G-41 |
| | |
Term | | Definition |
| Mineralisation | | The presence of a target mineral in a mass of host rock. |
| |
| Mineralised area | | Any mass of host rock in which minerals of potential commercial value occur. |
| |
| Outcrop | | The area over which a particular rock unit occurs at the Earth’s surface. |
| |
| Production | | The day-to-day activities directed to obtaining saleable product from the mineral resource on a commercial scale. It includes extraction and other processing prior to sale. |
| |
| Royalty | | A payment made for a concession of commercial value. |
| |
| Sampling | | Taking small pieces of rock at intervals along exposed mineralisation for assay (to determine the mineral content). |
| |
| Specific Gravity | | The ratio of the weight of a given volume of a substance to the weight of an equal volume of water. (Also referred to as relative density) |
| |
| Stratigraphic | | A term describing the chronological sequence in which bedded rocks occur that can usually be correlated between different localities. |
| |
| Strike | | The direction taken by a structural surface such as a fault or bedding plane as it intersects the horizontal. |
| |
| Subcrop | | A sub-surface outcrop. |
| |
| Tabular | | Having two dimensions much greater than the third. |
| |
| Tonnage | | Quantities where the tonne is an appropriate unit of measure. Typically used to measure reserves of gold-bearing material in situ or quantities of ore and waste material mined, transported or milled. |
| |
| Unconformity | | A surface within a package of sedimentary rocks which may be parallel to or at an angle with overlying or underlying rocks, and which represents a period of erosion or non-deposition, or both. |
Prepared by Minxcon (Pty) Ltd
G-41
| | |
| CIMVal Compliant Report on the Boikgantsho Project, Limpopo Province, South Africa | | G-42 |
| | |
Abbreviation | | Definition |
| ~ | | Approximately |
| 3E | | Pt + Pd + Rh |
| 3PGE+Au | | Pt + Pd + Rh + Au |
| 4E | | Pt + Pd + Rh + Au |
| 6E | | Pt + Pd + Rh + Os + Ir + Au |
| Amsl | | Above mean sea level |
| Au | | Gold |
| BEE | | Black Economic Empowerment |
| BIC | | Bushveld Igneous Complex |
| CAPM | | Capital Asset Pricing Model |
| CEO | | Chief Executive Officer |
| CFO | | Chief Financial Officer |
| COO | | Chief Operating Officer |
| CPIX | | Consumer Price Index excluding the effects of mortgage rate changes |
| CPR | | Competent Persons Report |
| DCF | | Discounted Cash Flow |
| DMR | | Department of Mineral Resources |
| GDP | | Gross Domestic Product |
| Ir | | Iridium |
| JSE | | Johannesburg Stock Exchange |
| MPRDA | | Mineral and Petroleum Resources Development Act |
| MR | | Merensky Reef |
| MR | | Mining Right |
| NPV | | Net Present Value |
| Os | | Osmium |
| Pd | | Palladium |
| PGE | | Platinum Group Elements |
| PR | | Prospecting Right |
| Pr. Sci. Nat | | Practicing Natural Scientist |
| Pt | | Platinum |
| Ptn | | Portion |
| PV | | Present Value |
| Re | | Ruthenium |
| Re | | Remaining Extent |
| RD | | Relative Density |
| Rh | | Rhodium |
| RLS | | Rustenburg Layered Suite |
| S&LP | | Social and Labour Plan |
| SAMREC | | The South African Code for the Reporting of Mineral Resources and Mineral Reserves |
| SAMVAL | | The South African Code for the Valuation of Mineral Assets |
| SHE | | Safety, Health and the Environment |
| VAT | | Value Added Tax |
Prepared by Minxcon (Pty) Ltd
G-42
| | |
| CIMVal Compliant Report on the Boikgantsho Project, Limpopo Province, South Africa | | G-43 |
| | |
Unit | | Definition |
| ° | | Degree |
| % | | Percentage |
| cm | | Centimeter |
| g | | Grams |
| g/t | | Grams per tonne |
| Ha | | Hectare |
| kg | | Kilogram |
| km | | kilometer |
| Ma | | One million years |
| M | | Million |
| m | | Meter |
| mbs | | Meters below surface |
| oz. | | ounce |
| t | | Tonne |
| USD | | United States Dollar |
| USD/oz. | | United States Dollar per ounce |
| USD/t | | United States Dollar per tonne |
| ZAR | | South African Rand |
| ZAR/t | | Rands per tonne |
Prepared by Minxcon (Pty) Ltd
G-43
Appendix 1: Technical Reports
Technical Report prepared by Kai Batla Minerals - The Mineral Resource Estimation for the Platreef for the Boikgantsho Project, Limpopo Province, Republic of South Africa - Ref: KB 1AQ01112011; 31 January 2012
G-44
SCHEDULE H
GA-PHASHA VALUATION
Attached.
Prepared by Minxcon (Pty) Ltd
| | |
| CIMVal Compliant Report on the Ga-Phasha East Project, South Africa | | H-2 |
TABLE OF CONTENTS
Prepared by Minxcon (Pty) Ltd
H-2
| | |
| CIMVal Compliant Report on the Ga-Phasha East Project, South Africa | | H-3 |
FIGURES
| | | | | | |
Figure 1: Current Ownership Structure | | | 12 | |
Figure 2: Proposed Ownership Structure | | | 13 | |
Figure 3: The Ga-Phasha Project in Relation to the Bushveld Complex | | | 16 | |
Figure 4: Location of Paschaskraal and De Kamp - Part of the Ga-Phasha Project | | | 17 | |
Figure 5: Aeromagnetic Survey Overlain on the LandSat TM Spacemap | | | 21 | |
Figure 6: Pothole Areas on the Merensky and UG2 Reefs | | | 22 | |
Figure 7: Ga-Phasha East Project Area Looking Southwest from the North-eastern Border of the Farm | | | 25 | |
Figure 8: Mining Layout | | | 26 | |
Figure 9: Annual Production - LOM | | | 27 | |
Figure 10: Capital Cash Flow | | | 28 | |
Figure 11: Platinum Price Monthly Historic | | | 36 | |
Figure 12: Consensus Platinum Price Forecast (Nominal) | | | 37 | |
Figure 13: Palladium Price Monthly Historic | | | 39 | |
Figure 14: Consensus Palladium Price Forecast (Nominal) | | | 39 | |
Figure 15: Rhodium Price Monthly Historic | | | 41 | |
Figure 16: Platinum Valuation Curve | | | 42 | |
Figure 17: Distribution of Drill Holes Drilled in the Ga-Phasha Project Area | | | 46 | |
Figure 18: Monte Carlo Simulation | | | 48 | |
Figure 19: Monte Carlo Analysis | | | 48 | |
Figure 20: Sensitivity Analysis | | | 49 | |
TABLES
| | | | | | |
Table 1: Mineral Resource Estimate for the Merensky Reef and UG2 Reefs for the Eastern Section of the Ga-Phasha East Project Area - Phaschaskraal (2012) | | | 22 | |
Table 2: Mineral Resource Estimate for the Merensky Reef and UG2 Reefs for the Eastern Section of the Ga-Phasha Project Area - De Kamp (2012) | | | 23 | |
Table 3: Plant Recovery Factors | | | 27 | |
Table 4: Prill Splits | | | 27 | |
Table 5: Preliminary Assessment Model Ratios | | | 28 | |
Table 6: Capital Expenditure | | | 28 | |
Table 7: Long-term Prices Used in Cash Flow (Constant Money Terms) | | | 29 | |
Table 8: Acceptable Methods of Mineral Project Valuation | | | 32 | |
Table 9: Platinum Supply and Demand | | | 35 | |
Table 10: Palladium Supply and Demand | | | 38 | |
Table 11: Rhodium Supply and Demand | | | 40 | |
Table 12: Economic Parameters Used in the Valuation Approach | | | 42 | |
Table 13: Valuation Risk Associated Parameter Matrix - Platinum Industry Standards | | | 43 | |
Table 14: Principal Risk - Ga-Phasha | | | 43 | |
Table 15: Mineral Asset Valuation for Ga-Phasha East Based on Comparative Analysis | | | 44 | |
Table 16: Transactions of Similar Nature | | | 44 | |
Prepared by Minxcon (Pty) Ltd
H-3
| | |
| CIMVal Compliant Report on the Ga-Phasha East Project, South Africa | | H-4 |
| | | | | | |
| |
Table 17: Historic Exploration Costs Associated with the Ga-Phasha Project (ZAR) | | | 45 | |
Table 18: Ga-Phasha Value Based on Historical Cost | | | 46 | |
Table 19: Discount Rate | | | 47 | |
Table 20: Monte Carlo Inputs | | | 47 | |
Table 21: Value Range for Ga-Phasha East Project | | | 49 | |
APPENDICES
| | | | | | |
APPENDIX 1: Ga-Phasha Discounted Cash Flow (Real Terms) | | | 56 | |
APPENDIX 2: Ga-Phasha Discounted Cash Flow (Nominal Terms) | | | 60 | |
APPENDIX 3: Technical Reports | | | 64 | |
Prepared by Minxcon (Pty) Ltd
H-4
| | |
| CIMVal Compliant Report on the Ga-Phasha East Project, South Africa | | H-5 |
Purpose
Minxcon (Pty) Ltd (“Minxcon”) was commissioned by Atlatsa Resources Corporation (previously Anooraq Resources Corporation) (“Atlatsa”) to compile a valuation report for the Ga-Phasha East platinum group metals project (“Ga-Phasha Project”), located on the Eastern Limb of the Bushveld Complex, Limpopo Province, South Africa (the “Valuation Report”), following the principles of the Canadian Institute of Mining, Metallurgy and Petroleum (“CIM”) Standards and Guidelines for the Valuation of Mineral Properties (“CIMVAL”).
Atlatsa is a platinum group metals mining, exploration and development company. Atlatsa controls and operates the Bokoni Platinum Mine (“Bokoni Mine”), located on the Eastern Limb of the Bushveld Complex, and maintains an interest in the Ga-Phasha Project, located on the Eastern Limb of the Bushveld Complex, adjacent to the Bokoni Mine.
The subject of the Valuation Report is the valuation for the Eastern Section of the Ga-Phasha Project area, comprised of De Kamp and Paschaskraal mineral properties (“Ga-Phasha East”). This Valuation Report has been prepared based on technical reviews by ExplorMine Consultants, including the Technical Report, The Mineral Resource Estimate for the Merensky and UG2 Reef for the Ga-Phasha Project Area, Limpopo Province, Republic of South Africa, 30 March 2012 (the “Ga-Phasha Technical Report”). The Ga-Phasha Technical Report is appended to this Valuation Report
Project Outline
The Ga-Phasha Project is located immediately southeast of Bokoni Mine, approximately 45 km northwest of Burgersfort (Figure 1). The entire area lies approximately 3 km to the west of the main tarred Polokwane - Steelpoort road.
The Ga-Phasha Project and adjacent Bokoni Mine are located on the north-eastern periphery of the Eastern Limb of the Bushveld Complex and have a combined northwest-southeast strike length of approximately 24.5 km (Figure 2). The platiniferous horizons mined at Bokoni Mine, and of economic interest at the Ga-Phasha Project, are the Merensky and the UG2 Reefs. The Bushveld Complex is a pear-shaped large igneous body, extending 450 km east to west and 250 km north to south and occurs partly in the Limpopo, North-West and Mpumalanga Provinces, of the Republic of South Africa.
The Eastern Limb of the Bushveld Complex is the site of numerous operating Platinum Group Element (“PGE”) and chrome mines and associated exploration projects and has a well-established history of PGE and chrome mining on the Merensky, UG2 Reefs and LG Reefs respectively.
Location Map and Area of Interest
The location of the Ga-Phasha Project area is illustrated on the map overleaf.
Prepared by Minxcon (Pty) Ltd
H-5
| | |
| CIMVal Compliant Report on the Ga-Phasha East Project, South Africa | | H-6 |
The Ga-Phasha Project in Relation to the Bushveld Complex

Prepared by Minxcon (Pty) Ltd
H-6
| | |
| CIMVal Compliant Report on the Ga-Phasha East Project, South Africa | | H-7 |
Legal Aspects and Tenure
The area which incorporates the mining and surface areas pertaining to the Ga-Phasha Project area is located in the magisterial district of Sekhukhuneland, in the Limpopo Province. The total surface area occupied by the Mining Rights in terms of the mining authorisation 8/2004 is approximately 9,670 hectares.
The surface overlying the Ga-Phasha Project is owned by the South African Government, and tenure of any future required areas would be held through various Surface Right Permits in terms of Section 90 of the Mining Rights Act of 1967, and lease agreements. There is currently no mining or processing infrastructure developed on the Ga-Phasha Project area. Whist the Klipfontein farm area could be reached via the Brakfontein shaft infrastructure, the extension to Pachaskraal farm does pose a problem. It is, however, accessible through the Amplats Twickenham operation.
Electrical and water supply infrastructure is well established in this portion of the Limpopo Province. Electrical supply would be provided through agreements with Eskom (parastatal electrical service provider).
As far as Minxcon could ascertain, all relevant surface right permits and any other permit related to the work conducted on the properties have been obtained and are valid. Minxcon is not aware of any legal proceedings that may have an influence on the rights to prospect or mine for minerals.
Geological Setting Description
The Bushveld Complex is situated in the northern half of South Africa and exists as an ellipse-shaped body consisting of five lobes. The Bushveld Complex is the world’s largest known ultramafic igneous intrusion, and extends approximately 450 km from east to west and approximately 250 km north to south. It occupies parts of Limpopo Province, North-West Province, Gauteng Province and the Mpumalanga Province. It is estimated to have been formed approximately 2,000 million years ago. The Bushveld Complex is host to PGM mineralisation in addition to chrome, vanadium, nickel and copper.
The Ga-Phasha Project area is located on the northern extremity of the Eastern Limb of the Bushveld Complex. The platiniferous horizons of interest at the Ga-Phasha Project area are the Merensky and the UG2 reefs, located in lithologies of the Critical Zone of the Rustenburg Layered Suite. In the Eastern Limb, the Critical Zone is developed over about 150 km of strike length in three areas separated by regional faulted systems. The Merensky Reef and UG2 outcrop over about 130 km, but also occur in down-faulted blocks and erosional outliers.
The Bushveld Complex layering dips from northeast to southwest at approximately 14º to 18º. The general structural geology is characterised by north-northeast and west-east trending dykes and faults with associated conjugated joint sets.
Exploration Programme and Budget
Recent exploration activities by Anglo Platinum Limited (“Amplats”) (up to 2008) have included the upgrading of the geological Mineral Resources for the area and diamond drilling to improve the overall coverage.
Several sets of exploration and mining data and associated sampling and assay data have been acquired over time in the Ga-Phasha Project area by previous and current owners. The standards applicable to the collection and interpretation of these data have largely remained consistent. The exploration data includes the following:
| | • | | underground drill holes (sourced from Bokoni Mine); |
Prepared by Minxcon (Pty) Ltd
H-7
| | |
| CIMVal Compliant Report on the Ga-Phasha East Project, South Africa | | H-8 |
| | • | | underground channel sampling (sourced from Bokoni Mine); |
| | • | | surface geological mapping; and |
| | • | | underground geological mapping (sourced from Bokoni Mine). |
Diamond drilling represents by far the largest exploration datasets for the Ga-Phasha Project area.
The entire surface drilling in the Ga-Phasha Project area has been conducted by Amplats as the operator. Amplats employed contractors to conduct the drilling activity although diamond core logging and sampling was conducted by Amplats staff at the Driekop Exploration Base (located approximately 50 km southeast of Bokoni Mine). No single drilling contractor was used to complete the drilling and contracts were put out to tender at the beginning of each exploration phase.
No additional exploration is planned on the Ga-Phasha Project at this stage.
Key Environmental Issues
Environmental liability provisioning in the South African mining industry is a requirement of the MPRDA and must be agreed with the relevant regulatory authorities (mainly the DMR and the DWAF). For existing mines, monies are accrued based on the estimated environmental rehabilitation costs, should the mine have to close and over the operating life of a mine. Contributions are made to an environmental trust fund in this regard, which are approved by the South African Revenue Service.
The mining infrastructure in the immediate area surrounding the Bokoni Mine is well established. However if the Ga-Phasha Project were to proceed there will be additional impact on the environment. The Ga-Phasha Project area is the subject of an Environmental Management Program (“EMPR”) approved as part of the conversion to a “New Order Mining Right” by all relevant interested and affected parties.
The EMPR includes a detailed ‘Environmental Closure Assessment’ detailing all areas of environmental liability. It is understood that Atlatsa will ensure that the Rehabilitation Trust Fund is funded to cover the total environmental liability on closure of operations.
Mineral Resource and Mineral Reserve Statement
ExplorMine Consultants was commissioned by Atlatsa to complete the Ga-Phasha Technical Report, a National Instrument 43-101 - Standards of Disclosure for Mineral Properties (“NI 43-101) compliant mineral resource estimate on the Ga-Phasha Project deposits.
Prepared by Minxcon (Pty) Ltd
H-8
| | |
| CIMVal Compliant Report on the Ga-Phasha East Project, South Africa | | H-9 |
Mineral Resource Estimate for the Merensky Reef and UG2 Reefs for the Eastern Section of the Ga-Phasha Project Area - Phaschaskraal (2012)
| | | | | | | | | | | | | | | | | | | | | | | | | | | | | | | | | | | | | | | | | | | | |
Mineral Resource Category | | Reef
Type | | | Tonnes
(million) | | | Grade
4E g/t | | | 4E Kg’s
(‘000) | | | 4E Moz | | | Pt
grade
g/t | | | Pd
grade
g/t | | | Rh
grade
g/t | | | Au
grade
g/t | | | Cu
grade
% | | | Ni
grade
% | |
Measured | | | MR | | | | 10.7 | | | | 4.74 | | | | 50.6 | | | | 1.6 | | | | 2.83 | | | | 1.45 | | | | 0.15 | | | | 0.31 | | | | 0.08 | | | | 0.21 | |
Indicated | | | MR | | | | 20.8 | | | | 5.37 | | | | 111.9 | | | | 3.6 | | | | 3.28 | | | | 1.58 | | | | 0.2 | | | | 0.33 | | | | 0.08 | | | | 0.22 | |
Meas + Ind | | | MR | | | | 31.5 | | | | 5.16 | | | | 162.5 | | | | 5.2 | | | | 3.12 | | | | 1.53 | | | | 0.18 | | | | 0.32 | | | | 0.08 | | | | 0.21 | |
Inferred | | | MR | | | | 23.2 | | | | 5.58 | | | | 129.1 | | | | 4.1 | | | | 3.37 | | | | 1.65 | | | | 0.19 | | | | 0.35 | | | | 0.07 | | | | 0.22 | |
| | | | | | | | | | | |
Mineral Resource Category | | Reef
type | | | Tonnes
(million) | | | Grade
4E g/t | | | 4E Kg’s
(‘000) | | | 4E Moz | | | Pt
grade
g/t | | | Pd
grade
g/t | | | Rh
grade
g/t | | | Au
grade
g/t | | | Cu
grade
% | | | Ni
grade
% | |
Measured | | | UG2 | | | | 24.8 | | | | 6.15 | | | | 152.7 | | | | 4.9 | | | | 2.59 | | | | 2.96 | | | | 0.51 | | | | 0.1 | | | | 0.03 | | | | 0.15 | |
Indicated | | | UG2 | | | | 26.6 | | | | 5.96 | | | | 158.8 | | | | 5.1 | | | | 2.51 | | | | 2.86 | | | | 0.49 | | | | 0.1 | | | | 0.03 | | | | 0.15 | |
Meas + Ind | | | UG2 | | | | 51.5 | | | | 6.05 | | | | 311.5 | | | | 10 | | | | 2.55 | | | | 2.91 | | | | 0.5 | | | | 0.1 | | | | 0.03 | | | | 0.15 | |
Inferred | | | UG2 | | | | 33.6 | | | | 6.09 | | | | 204.6 | | | | 6.6 | | | | 2.54 | | | | 2.94 | | | | 0.51 | | | | 0.1 | | | | 0.04 | | | | 0.16 | |
Mineral Resource Estimate for the Merensky Reef and UG2 Reefs for the Eastern Section of the Ga-Phasha Project Area - De Kamp (2012)
| | | | | | | | | | | | | | | | | | | | | | | | | | | | | | | | | | | | | | | | | | |
Mineral Resource Category | | Reef
Type | | Tonnes
(million) | | | Grade
4E g/t | | | 4E Kg’s
(‘000) | | | 4E Moz | | | Pt
Grade
g/t | | | Pd
Grade
g/t | | | Rh
Grade
g/t | | | Au
Grade
g/t | | | Cu
Grade
% | | | Ni
Grade
% | |
Measured | | MR | | | | | | | | | | | | | | | | | | | | | | | | | | | | | | | | | | | | | | | | |
Indicated | | MR | | | | | | | | | | | | | | | | | | | | | | | | | | | | | | | | | | | | | | | | |
Meas + Ind | | MR | | | | | | | | | | | | | | | | | | | | | | | | | | | | | | | | | | | | | | | | |
Inferred | | MR | | | 58.2 | | | | 5.8 | | | | 337.4 | | | | 10.8 | | | | 3.57 | | | | 1.75 | | | | 0.19 | | | | 0.3 | | | | 0.09 | | | | 0.22 | |
| | | | | | | | | | | |
Mineral Resource Category | | Reef
Type | | Tonnes
(million) | | | Grade
4E g/t | | | 4E Kg’s
(‘000) | | | 4E Moz | | | Pt
Grade
g/t | | | Pd
Grade
g/t | | | Rh
Grade
g/t | | | Au
Grade
g/t | | | Cu
Grade
% | | | Ni
Grade
% | |
Measured | | UG2 | | | | | | | | | | | | | | | | | | | | | | | | | | | | | | | | | | | | | | | | |
Indicated | | UG2 | | | | | | | | | | | | | | | | | | | | | | | | | | | | | | | | | | | | | | | | |
Meas + Ind | | UG2 | | | | | | | | | | | | | | | | | | | | | | | | | | | | | | | | | | | | | | | | |
Inferred2 | | UG2 | | | 64.7 | | | | 6.24 | | | | 403.8 | | | | 13 | | | | 2.63 | | | | 2.99 | | | | 0.53 | | | | 0.1 | | | | 0.03 | | | | 0.15 | |
Notes:
| 1. | A 4E pay limit of 245 cmg/t and 327 cmg/t for the Merensky and UG2 Reefs respectively has been applied (tonnes and element kg’s have been rounded off to the appropriate level of accuracy). |
Revised Inferred Resource - De Kamp UG2
| | | | | | | | | | | | | | | | | | | | | | | | | | | | | | | | | | | | | | | | | | |
Mineral Resource Category | | Reef
Type | | Tonnes
(million) | | | Grade
4E g/t | | | 4E Kg’s
(‘000) | | | 4E Moz | | | Pt
Grade
g/t | | | Pd
Grade
g/t | | | Rh
Grade
g/t | | | Au
Grade
g/t | | | Cu
Grade
% | | | Ni
Grade
% | |
Measured | | UG2 | | | | | | | | | | | | | | | | | | | | | | | | | | | | | | | | | | | | | | | | |
Indicated | | UG2 | | | | | | | | | | | | | | | | | | | | | | | | | | | | | | | | | | | | | | | | |
Meas + Ind | | UG2 | | | | | | | | | | | | | | | | | | | | | | | | | | | | | | | | | | | | | | | | |
Inferred | | UG2 | | | 29.1 | | | | 6.34 | | | | 184.5 | | | | 5.9 | | | | 2.68 | | | | 3.02 | | | | 0.53 | | | | 0.11 | | | | 0.03 | | | | 0.15 | |
Notes:
| 1. | Subsequent to the Ga-Phasha Technical Report, Inferred Resources have changed in a report submitted by ExplorMine to the JSE - Competent persons report the mineral resource estimate for the Merensky and UG2 reefs for the Ga-Phasha project area, Limpopo Province, Republic of South Africa - 31 March 2012. This Valuation Report and Valuation is based on the revised resource. |
No mining activity is currently taking place on the property. It is flanked by two operations, the Bokoni Mine Operation and Amplats’ Twickenham Operation. Amplats prepared a preliminary assessment on the
Prepared by Minxcon (Pty) Ltd
H-9
| | |
| CIMVal Compliant Report on the Ga-Phasha East Project, South Africa | | H-10 |
Paschaskraal and De Kamp farms. The case study adopted the same mine design as a Pre-Feasibility Study completed on the Ga-Phasha Project in 2007 which is a conventional tabular stoping operation with track-bound footwall access development and conveyors located in minor dip declines. Minxcon did not have access to the Pre-Feasibility Study.
This additional information was considered as a guideline in the valuation. Minxcon replicated the life of mine (“LoM”) plan in the Minxcon model to test the viability of the project and applied in-house prices. The LoM plan was based on the UG2 Resource with mining rates at 125,000 t/mth from a single decline system and a life of 30 years.
Summary Valuation
The values that were derived for Ga-Phasha East after applying three valuation methods to the Resource are set out in the table below:
Value Range for Ga-Phasha East Project
| | | | |
Valuation Method | | Indicated Values for Ga-Phasha East | |
Comparative (UG2) | | | ZAR595 million to ZAR1,776 million | |
Comparative (MR) | | | ZAR222 million to ZAR771 million | |
Historical Cost1 | | | ZAR361 million to ZAR371 million | |
Discounted Cash Flow (UG2)2 | | | ZAR429 million to ZAR837 million | |
Notes:
| 1. | Includes Amplats and Atlatsa exploration costs. |
| 2. | Includes the Amplats-Twickenham synergies. |
| | • | | Owing to the short strike length, access to the ore body is restricted to one decline. |
| | • | | Historical cost and comparative valuations were treated as if on a standalone basis. However, these values do not fully reflect the impact of synergy/non-synergy. Considering the shape of the lease area, the value of Ga-Phasha East was further discounted and valued at the lower end of comparative value range. |
| | • | | Considering the exploration history, Minxcon has lower confidence in the exploration expenditure provided. All the exploration expenditure could not be sourced. This includes the expenditure incurred by Anglovaal and JCI, albeit small in relation to Amplats and Atlatsa. |
| | • | | A pre-feasibility study was completed by Amplats in 2007, and the detailed Preliminary Assessment study is an update based on that pre-feasibility study. The CV believes that it is important to show the DCF because it illustrates the impact of high capital associated with a short strike length therefore extending payback and reducing NPV. |
| | • | | In the DCF calculation, mining in the first 30 years will be focused on the UG2; hence, the value impact of the Merensky Reef is limited due to the time value of money. However, it is the opinion of the valuator that value should be considered for the Merensky, albeit at the lower end of the valuation curve. |
| | • | | Mining at Twickenham is focused on the UG2 only. This should also be considered when valuing Ga-Phasha East as a standalone. Building a new plant for Ga-Phasha East will require significantly higher capital expenditure. An extension to the Twickenham UG2 plant was considered in the valuation |
| | • | | On a standalone basis, assuming Ga-Phasha East is bought by a third party, the discounted cash flow value reflects a significantly lower value. This takes into account a lower payability (assuming that concentrate metal content will be sold at approximately 85% of metal prices) and higher capital expenditure. |
A lower and upper valuation range for the UG2 reef was established at between ZAR520 million and ZAR700 million. Although Merensky Reef will not be mined in the near future due to plant capacity constraints,
Prepared by Minxcon (Pty) Ltd
H-10
| | |
| CIMVal Compliant Report on the Ga-Phasha East Project, South Africa | | H-11 |
Minxcon is of the opinion that the Resource does have value in the hands of Amplats. A value of ZAR220 million, which is at the lower end of the market approach for the Merensky Reef (the Merensky Reef will likely be mined much later - hence time value of money should be considered), was placed on the Merensky Reef Resource. Minxcon is therefore of the opinion that a valuation of ZAR740 to ZAR950 million represents a total value for the Ga-Phasha East mineral assets.
| 2 | INTRODUCTION AND TERMS OF REFERENCE |
Minxcon (Pty) Ltd (“Minxcon”) has been retained by the Board of Directors of Atlatsa Resources Corporation (previously Anooraq Resources Corporation) (“Atlatsa”), to determine the mineral asset value of the Eastern section of the Ga-Phasha East Project comprised of the De Kamp and Pashaskraal farms (“Ga-Phasha East”) which is to be used in the fair and reasonable opinion and as required by Part 5 of the Multilateral Instrument 61-101 Protection of Minority Security Holders in Special Transaction (“MI 61-101”), with respect to the transaction between Atlatsa and Anglo Platinum Limited (“Amplats”).
On 2 February 2012, Atlatsa released the key terms of an agreement with Amplats in respect of a transaction to restructure, recapitalise and refinance Atlatsa and the Bokoni Platinum Holdings (Proprietary) Limited (“Bokoni Holdings”) group of companies (the “Bokoni group”). Amplats will, through a series of related transactions, acquire the whole of the Boikgantsho PGM project (“the Boikgantsho Project”) and the Eastern section of the Ga-Phasha PGM project (the “Ga-Phasha Project”).
Prepared by Minxcon (Pty) Ltd
H-11
| | |
| CIMVal Compliant Report on the Ga-Phasha East Project, South Africa | | H-12 |
Atlatsa holds a 51% interest in the Ga-Phasha Project through Bokoni Holdings. The Ga-Phasha Project is currently in exploration stage. The figure below illustrates the current ownership structure of Atlatsa:-
Figure 1: Current Ownership Structure

Prepared by Minxcon (Pty) Ltd
H-12
| | |
| CIMVal Compliant Report on the Ga-Phasha East Project, South Africa | | H-13 |
The figure below illustrates the proposed ownership structure for Atlatsa:-
Figure 2: Proposed Ownership Structure
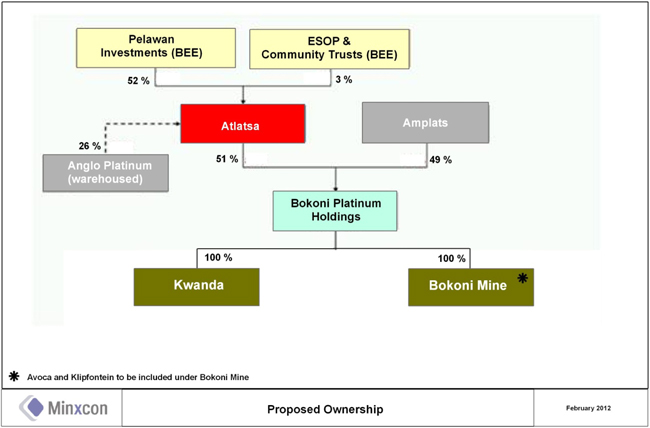
Accordingly, the Parties have agreed to split the Ga-Phasha Project into an Eastern and Western section. Ga-Phasha East, comprising the Paschaskraal and De Kamp mineral properties, will be consolidated into Amplats’ adjacent Twickenham operation, while the Western section, comprising the Klipfontein and Avoca mineral properties, will be accessed through the existing shaft infrastructure established at Bokoni Mine’s Brakfontein property.
In addition, the Parties have determined that the Bokoni group’s Northern Limb Boikgantsho Project has a strong strategic fit with Amplats’ flagship Mogalakwena North expansion plans and that this project should be consolidated into Amplats’ adjacent opencast Mogalakwena operations.
Bokoni Mine is a 51:49% joint venture between Atlatsa and Rustenburg Platinum Mines Limited (“RPM”).
This Valuation Report has an effective date of 26 February 2013 and is dated 26 February 2013.
| 2.2.1 | Scope of Work Performed |
In order to satisfy the requirements of a fair and reasonable opinion and MI 61-101, Minxcon completed an independent valuation on Ga-Phasha East. The technical information as provided to and taken in good faith by Minxcon has not been independently verified by means of re-calculation. Minxcon carried out the following scope of work for the Valuation Report:
| | • | | Visit to Ga-Phasha East in the Limpopo Province of South Africa |
| | • | | Visit to the Atlatsa and Amplats offices in Johannesburg |
Prepared by Minxcon (Pty) Ltd
H-13
| | |
| CIMVal Compliant Report on the Ga-Phasha East Project, South Africa | | H-14 |
| | • | | Use of the technical report prepared by ExplorMine Consultants- “Technical Report - The Mineral Resource Estimate For The Merensky And UG2 Reefs For The Ga-Phasha East Project Area, Limpopo Province, Republic Of South Africa; 31 March 2012” (the “Ga-Phasha Technical Report”). The Ga-Phasha Technical Report is appended to this Valuation Report. |
| | • | | Review and, where necessary, appropriate modification of exploration and social costs. |
| | • | | Minxcon has not sought an independent legal opinion on the shareholding, effective rights and obligations of Atlatsa. In addition, Minxcon did not perform a full-scale due diligence on the resources and relied on the information provided by the Qualified Person (as that term is defined in CIMVAL) of ExplorMine Consultants with respect to the Ga-Phasha Project. Minxcon and its directors accept no liability for any losses arising from reliance upon the information presented from these sources. |
The author of this Valuation Report is a member in good standing of appropriate professional institutions. The qualifications and professional registrations of the Qualified Person and Qualified Valuator who contributed to this evaluation are provided at the end of this Valuation Report. The following person made contributions to this Valuation Report and is a Qualified Person and Qualified Valuator as defined in CIMVAL:-
Johan Odendaal (Director, Minxcon): B.Sc. (Geol.), B.Sc. (Hons) (Min. Econ.), M.Sc. (Min. Eng.), Pr. Sci. Nat. 400024/04, FSAIMM, MGSSA, MAusIMM.
Johan has 25 years’ experience in the mining and financial industry. This includes 8 years as an independent mining consultant specialising in the valuation of mining projects and 12 years as a mining analyst at two major stockbroking firms. During this time, he was rated one of the top platinum and gold mining analysts and became a globally recognised industry specialist.
The Qualified Person and Qualified Valuator made a personal inspection of the Ga-Phasha Project on 4 April 2012. An inspection was made of the surface area and the village on the Ga-Phasha Project area.
The effective date of the Valuation Report is 26 February 2013.
None of the directors of Minxcon has or had any direct or indirect interest, beneficial or non-beneficial, in the Ga-Phasha Project. Minxcon is an independent advisory company. Its consultants have extensive experience in preparing technical and economic advisors’ and valuation reports for mining and exploration companies. Neither Minxcon nor its staff have any interest capable of affecting their ability to give an unbiased opinion, and will not receive any pecuniary or other benefits in connection with this assignment, other than normal consulting fees.
| 2.2.4 | Valuation based on Inferred Resources |
The valuation contained in this Valuation Report is based, in part, on Inferred Resources, and is preliminary in nature. Inferred Resources are considered too geologically speculative to have mining and economic considerations applied to them and to be categorised as Mineral Reserves. There is no certainty that the resources on which this preliminary assessment is based will be realised. Value as used in this Valuation Report refers to value derived using the methodology specified in CIMVAL and as such is reported as the Fair Market Value (as the term is defined in CIMVAL).
| 2.2.5 | Forward-looking Statements |
Certain statements in this Valuation Report other than statements of historical fact contain forward-looking statements regarding Atlatsa’s operations, economic performance or financial condition, including, without
Prepared by Minxcon (Pty) Ltd
H-14
| | |
| CIMVal Compliant Report on the Ga-Phasha East Project, South Africa | | H-15 |
limitation, those concerning the economic outlook for the mining and platinum industry, expectations regarding PGM prices, exchange rates, production, cash costs and other operating results, growth prospects and the outlook of operations, including the completion and commencement of commercial operations of specific production projects, its liquidity and capital resources and expenditure, and the outcome and consequences of any pending litigation or enforcement proceedings.
Although Minxcon believes that the expectations reflected in such forward-looking statements are reasonable, no assurance can be given that such expectations will prove to be correct. Accordingly, results may differ materially from those set out in the forward-looking statements as a result of, among other factors, changes in economic and market conditions, changes in the regulatory environment and other State actions, success of business and operating initiatives, fluctuations in commodity prices and exchange rates, and business and operational risk management.
| 2.3 | COMPLIANCEWITHTHE CIMVAL STANDARDSAND GUIDELINES |
Section 8.10 of CIMVAL states that a Valuation Report must contain a statement regarding the extent to which the Valuation is consistent with CIMVAL. Such statement must disclose and explain the reasons for any inconsistency or deviations from CIMVAL. If such a disclosure statement is absent from the Valuation Report, the Valuation does not comply with these standards. The Valuation Report and the valuation contained herein fully comply and are consistent with the standards as set out in CIMVAL. Minxcon has relied on the NI 43-101 compliant Ga-Phasha Technical Report prepared by ExplorMine Consultants. The Ga-Phasha Technical Report is appended to this Valuation Report.
| 3 | PROPERTY LOCATION, ACCESS AND INFRASTRUCTURE |
Ga-Phasha East is located immediately southeast of Bokoni Mine approximately 45 km northwest of Burgersfort (Figure 1). The entire area lies approximately 3 kilometres to the west of the main tarred Polokwane - Steelpoort road. The Ga-Phasha Project area lies parallel to the main paved R37 provincial Polokwane - Lydenburg road. A number of secondary (paved), gravel roads service the area, but there is only limited access to much of the area. The nearest railheads are at Burgersfort and Steelpoort 80 km and 100 km away respectively. All stores and equipment are likely to be delivered by road-truck to any mine developed on the Ga-Phasha Project area. The nearest commercial (domestic) airport is located at the provincial capital Polokwane.
The area which incorporates the mining and surface areas pertaining to the Ga-Phasha Project is located in the magisterial district of Sekhukhuneland, in the Limpopo Province. The total surface area occupied by the mining rights in terms of the mining authorisation 8/2004 is approximately 9,670 hectares.
The surface overlying Ga-Phasha East is owned by the South African government, and tenure of any future required areas would be held through various surface right permits in terms of Section 90 of the Mining Rights Act of 1967 and lease agreements. There is currently no mining or processing infrastructure developed on the Ga-Phasha East Project Area. Whist the Klipfontein farm area could be reached via the Brakfontein shaft infrastructure, the extension to Paschaskraal farm does pose a problem. It is, however, accessible through the Amplats Twickenham operation.
Electrical and water supply infrastructure is well established in this portion of the Limpopo Province. Electrical supply would be provided through agreements with Eskom (parastatal electrical service provider).
Prepared by Minxcon (Pty) Ltd
H-15
| | |
| CIMVal Compliant Report on the Ga-Phasha East Project, South Africa | | H-16 |
Figure 3: The Ga-Phasha Project in Relation to the Bushveld Complex
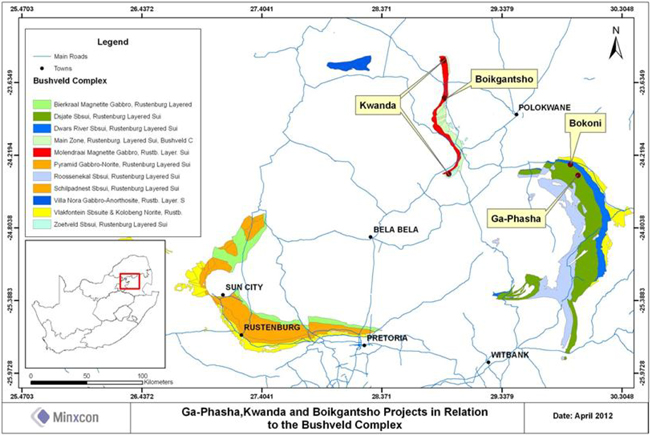
The general area is well developed in terms of access, and mining related infrastructure. Platinum and chrome mining and related activities have been conducted in the area for in excess of 50 years. The Ga-Phasha Project and adjacent Bokoni Mine are located on the north-eastern periphery of the Eastern Limb of the Bushveld Complex and have a combined northwest-southeast strike length of approximately 24.5 km (Figure 2). The platiniferous horizons mined at Bokoni Mine and of economic interest at the Ga-Phasha Project are the Merensky and the UG2 Reefs. The Bushveld Complex is a pear-shaped large igneous body, extending 450 km east to west and 250 km north to south and occurs partly in the Limpopo, North-West and Mpumalanga Provinces, of the Republic of South Africa.
| 3.1 | LEGAL ASPECTSAND TENURE |
Atlatsa is currently in possession of converted mining rights in terms of Item 7 of the Mineral and Petroleum Resources Development Act No. 28 of 2002 (“the MPRDA”). The original mining authorisation for the Ga-Phasha Project in terms of Section 9(1) of the South African Minerals Act, 1991, was Old Order Licence No. 8/2004, comprising the farms Klipfontein 465 KS, Paschaskraal 466 KS, Avoca 472 KS and De Kamp 507 KS. The mining right will continue to be in force for a period of up to 30 years.
Prepared by Minxcon (Pty) Ltd
H-16
| | |
| CIMVal Compliant Report on the Ga-Phasha East Project, South Africa | | H-17 |
Figure 4: Location of Paschaskraal and De Kamp - Part of the Ga-Phasha Project
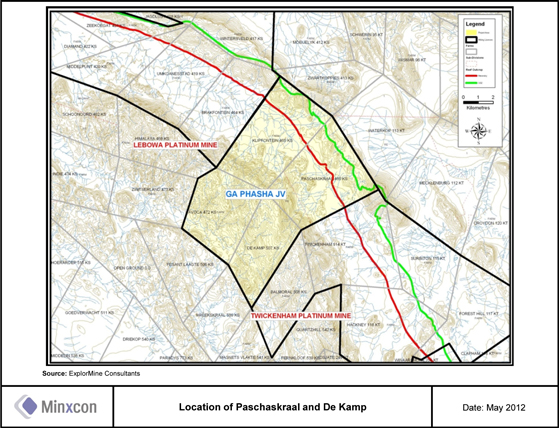
Future mining operations in Ga-Phasha East would have to be self-sufficient in the supply of industrial and potable water. The adjacent Bokoni Mine currently draws potable water from a well-field on the Jagdlust property adjacent to the Olifants River which bounds the Bokoni mining lease area on the north-west. This extraction is limited to 787,000 cubic metres per annum in accordance with the DWAF permit. The well-field has never run dry. However, permanent supply cannot be guaranteed and the existing water use permit is subject to review by the DWAF from time to time.
At the Bokoni Mine workings, there is ingress of groundwater into the underground workings, estimated at nearly 11,000 cubic metres per day. There is currently no shortage of available industrial water. This scenario is likely to occur at any future Ga-Phasha East mining operations.
| 3.2 | PROPERTY OWNERSHIP, STATUSAND AGREEMENTS |
Please refer to Chapter 4 of the Ga-Phasha Technical Report which is attached as the Appendix, from page 25 through to 32.
Prepared by Minxcon (Pty) Ltd
H-17
| | |
| CIMVal Compliant Report on the Ga-Phasha East Project, South Africa | | H-18 |
| 4 | HISTORY OF EXPLORATION AND PRODUCTION |
Platinum was first discovered in the Bushveld Complex in 1924 whilst panning in a dry river bed on the farm Maandagshoek, located west of the town of Burgersfort, and was traced to the dunite pipes of the Maandagshoek area. This led shortly afterwards to the discovery of the platiniferous horizon named the Merensky Reef on the farm Maandagshoek some 45 km south of the present day Bokoni Mine.
From 1925 to 1927, exploration was conducted by Northern Platinums Limited on both the platiniferous dunite pipes and the Merensky Reef in the Dwars and Olifants River areas resulting in some 700,000 tonnes of ore being mined from these early operations.
In the 1920s, trenching and numerous small adits were excavated on both the Merensky and the UG2 chrome horizons, notably where these cropped out in the hills on the eastern side of the area. In the 1960s, diamond drilling programmes were undertaken throughout the whole area to determine the basic characteristics of the ores. Geological comparisons with the Western Bushveld PGM deposits were unfavourable for the Eastern Bushveld and this, as well as market factors, contrived to reduce the level of exploration and development.
Anglovaal drilled fifteen shallow Merensky Reef drill holes on the farm Klipfontein during the 1960s. An extensive trenching programme along the UG2 Reef outcrop comprising 30 trenches was also conducted. The results of these programmes were obtained by RPM as part of the procurement of Anglovaal’s Atok interests. JCI/RPM had secured significant mineral rights over properties held in trust by the State for various indigenous tribes on the Eastern Limb and exploration was progressed in order to determine the geological extent and characteristics of the Merensky and UG2 mineralisation.
In 1981, JCI drilled an additional 9 drill holes (1,643 m) to intersect the UG2 on the farm Klipfontein. In 1987, a further three Merensky Reef and 4 UG2 Reef drill holes (a total of 1,259 m) were drilled on Klipfontein. Again in 1998 10 Merensky Reef drill holes totalling 3,600 m were drilled on Klipfontein by JCI.
The farm Paschaskraal had been the focus of Anglovaal’s drilling programme in the 1960s prior to the acquisition of the mineral rights by RPM and included 31 drill holes to intersect the Merensky Reef. In 1981, JCI drilled 6 additional drill holes to intersect the UG2, and in 1988, a further 8 drill holes were drilled. Three of these were directed at the UG2, five at the Merensky Reef. Five shallow UG2 exploration drill holes were drilled in 1999. During 2000, an additional 7 drill holes were drilled totalling approximately 6,000 m. Trenching, mapping and sampling of the exposed UG2 outcrops were also undertaken.
Significant interest in the Eastern Limb was initiated in 1999 and was driven by the increasing demand (and robust forecast of demand) for PGMs. Since 2001, Amplats has continued with a number of major exploration drilling programmes and related activities after a strategic decision to increase total PGM production. The UG2 was identified as the reef with the most significant economic interest in the Ga-Phasha Project area.
Recent exploration activities by Amplats (prior to 2008) have included the upgrading of the geological Mineral Resources for the area and diamond drilling to improve the overall coverage. No exploration has been conducted by Atlatsa (or its joint venture partner Amplats) since 2008.
Prior to the exploration work conducted by Amplats and Atlatsa, no historic CIMVAL or NI43-101 compliant Mineral Resource declarations existed for the Ga-Phasha Project area.
Prepared by Minxcon (Pty) Ltd
H-18
| | |
| CIMVal Compliant Report on the Ga-Phasha East Project, South Africa | | H-19 |
GEOLOGY AND MINERALISATION
The platiniferous horizons of interest in the Ga-Phasha Project area are the Merensky and the UG2 reefs located in lithologies of the Critical Zone of the Rustenburg Layered Suite.
In the Eastern Limb, the Critical Zone is developed over about 150 km of strike length in three areas separated by regional faulted systems. The Merensky Reef and UG2 outcrop over about 130 km, but also occur in down-faulted blocks and erosional outliers. In the Eastern Limb, the Merensky Reef comprises a facies somewhat different when compared to the equivalent reef that is developed within the Western Limb. In common, however, is the fact that in both the Eastern and Western Limbs, the mineralisation is hosted within the pyroxenites and between relatively narrow (2 mm to 5 mm) chromitite layers. The chromitite forms useful mining contacts that visually define the position of the ore body.
Distinctive pegmatoidal pyroxenite, such as that which contains the bulk of the mineralisation of the Merensky Reef in the Western Limb, is present beneath the lower chromitite stringer in the Eastern Limb and, whilst this unit does contain elevated PGE grades, the bulk of the continuous mineralisation is located within non-pegmatoidal (“porphyritic”) pyroxenite, but between two chromitite stringers.
The UG1 usually consists of a series of chromitite layers up to 1.2 m in thickness. In some cases, several layers or stringers of chromitite are “detached” from the bottom or top of the main layer. These appear to diverge into the footwall/hangingwall anorthosite, only to converge again and join the main layer. The lenses of anorthosite so formed are usually impregnated with numerous chromite grains. Below the main layer there is always a zone of anorthosite, up to 5 m in thickness, which contains elongated blebs and stringers of chromitite. These occur below the “detached” chromitite zone described above. Bifurcation of chromitite layers within the UG1 sequence is very common. The intimate association of chromitite and anorthosite is a characteristic of the UG1 chromitite unit throughout the Bushveld Complex. Layers of norite, leuconorite, anorthosite and pyroxenite approximately 80 m to 90 m thick, overlie the UG1 and are, in turn, overlain by the UG2 layer. The average thickness of the UG2 Reef assemblage is 70 cm. Thin pyroxenitic to leuconoritic lenses of limited lateral extent occur within the UG2 Reef.
The Merensky cyclic sequence consists of a dark pyroxenite at the base after which the overlying rocks become progressively lighter in density and colour. The basal pyroxenite is termed the Merensky pyroxenite and the mineralised portion of the pyroxenite that is called the Merensky Reef is invariably associated with two very thin chromitite stringers (usually 5 mm to 20 mm in thickness). The Merensky Reef is usually defined as that portion contained between these chromitite stringers. This sandwiched pyroxenite to pegmatoidal pyroxenite varies in thickness between 50 cm and 200 cm. The uppermost chromitite stringer is usually associated with the highest PGE grades. These chromitite stringers are not all present throughout the area, but at least one will be present.
A 40 cm to 70 cm thick poikilitic, plagioclase pyroxenite occurs above the upper chromitite stringer before grading into a norite. This norite contact is normally referred to as the top of the Merensky pyroxenite.
Prepared by Minxcon (Pty) Ltd
H-19
| | |
| CIMVal Compliant Report on the Ga-Phasha East Project, South Africa | | H-20 |
PGM mineralisation is specifically located within the UG2 and Merensky Reef horizons, which form part of the Upper Critical Zone of the Rustenburg Layered Suite. Both horizons subcrop and in some instances outcrop in the area along a northwest-southeast trending strike length.
The outcrop positions of the two economic horizons usually occur within the areas of low relief, and much of the outcrop is masked by fairly extensive development of black turf, as well as transported recent sediments. On the farms Paschaskraal and Klipfontein, however, the UG2 (and occasionally the Merensky Reef) outcrops in a series of rather elongate hills. Although frequently covered with scree material, much of this outcrop is marked by a series of trenches and pits, many of which date from the early pioneer prospecting.
The Merensky and UG2 are separated by approximately 400 m of mafic and ultramafic cumulate rocks. Economic PGM mineralisation occurs within the UG2 Reef horizon and Merensky Reef pyroxenite. The Bushveld Complex layering dips from northeast to southwest at approximately 14º to 18º. The broad tectonic setting is characterised by north-northeast and east-west trending dykes and faults or fractures.
Several structural and lithological features occur locally on the Bokoni Mine property which remove or result in the disruption of normal Merensky and UG2 Reef occurrence and mineralisation, which include:
| | • | | Potholes which occur in both the Merensky and UG2 Reefs; |
| | • | | Bifurcation recorded only in the UG2 Reef horizon; |
| | • | | Dykes including dolerite, diabase, lamprophyre and syenite dykes; |
| | • | | Structural breaks including faults, shears and joints; |
| | • | | Alteration features including veins and alteration zones; and |
| | • | | Pegmatiods and dunite replacement of the reefs. |
Thus far, mining at the Bokoni Mine has been remarkably uncomplicated insofar as faulting is concerned. Based on existing Merensky workings, minor faulting is expected to occur, consisting of dextral and sinistral strike-slip faults, normal and reverse dip-slip faults, as well as faults of both components. Displacements have generally been, and are expected to be, less than 1 m in the Ga-Phasha Project area.
Dykes in this area are composed of primarily dolerite, which are generally fine-grained and are of good competence, with associated areas of dense jointing and alteration. An airborne magnetic survey has successfully identified several swarms of northeast striking dolerite dykes. No serious problems were encountered during mining through these features, and no significant displacements were noted to be associated with them, at Bokoni Mine. The estimated geological loss associated with dykes across the property is 4%. The aeromagnetic response to these features exaggerates the actual width dimension as depicted in Figure 5. Not all dykes have magnetic responses and a few east-west orientated dykes are known to have no magnetic response.
Prepared by Minxcon (Pty) Ltd
H-20
| | |
| CIMVal Compliant Report on the Ga-Phasha East Project, South Africa | | H-21 |
Pothole intersections (Figure 6) are defined where the Merensky Reef or UG2 Reef has been completely destroyed and truncated by hangingwall lithologies. Edges of pothole intersections are those intersections that showed incomplete destruction of the Merensky Reef or UG2 Reef. In these instances, Cr-stringers (or Cromitite bands in the case of the UG2 Reef) can be present, but the reef thickness and grade behaviour is disturbed. The normal metal profile of the associated reef is disrupted. As a result, grades within potholes are highly erratic and, invariably, sub-economic and therefore constitute unmined areas.
A regional pothole has been discovered in the Klipfontein area which has been divided into two components, a ‘destructive pothole area’ where no recognisable Merensky Reef is preserved and a ‘non-destructive pothole area’ where the Merensky Reef is partially preserved. Potholes account historically for approximately 15% geological loss for both the Merensky Reef and UG2 Reef in the adjoining Bokoni mining operations.
The UG2 occasionally exceeds a thickness of 95 cm as a direct result of internal xenoliths comprising anorthosite, feldspathic pyroxenite and norite. Although the total chromitite thickness remains constant, the width between the upper and lower UG2 contacts can exceed 2 m in places. These features can cause mining difficulties, due to the changes in the UG2 elevation, deteriorating ground conditions and dilution. It has been noted that more than half of all UG2 intersections have some form of inclusion ‘waste’ layers which are commonly a felspathic pyroxenite.
The Bushveld Complex stratigraphy is occasionally replaced by late-stage pegmatite bodies. These pegmatite bodies have a range of compositions from highly ultramafic to felsic. These features have been recorded at Bokoni Mine and geological losses are estimated at less than 3%.
Figure 5: Aeromagnetic Survey Overlain on the LandSat TM Spacemap
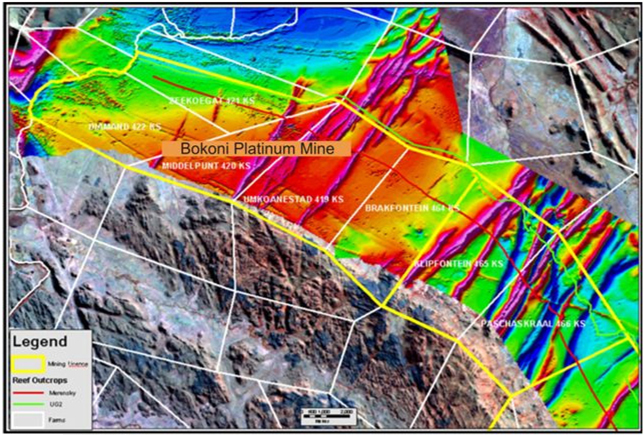
Source: ExplorMine Consultants
Prepared by Minxcon (Pty) Ltd
H-21
| | |
| CIMVal Compliant Report on the Ga-Phasha East Project, South Africa | | H-22 |
Figure 6: Pothole Areas on the Merensky and UG2 Reefs
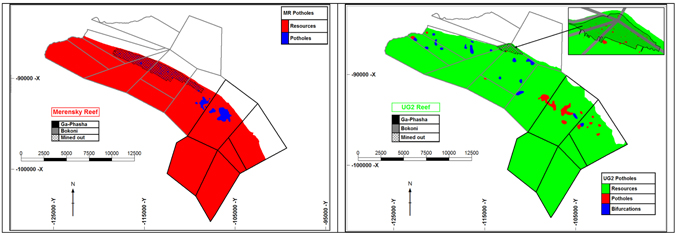
| 6 | EXPLORATION RESULTS AND POTENTIAL |
Please refer to sections 6.2 (page 37) and 9.0 (pages 51 to 52) of the attached Ga-Phasha Technical Report.
Please refer to section 11 (pages 57 to 64) of the attached Ga-Phasha Technical Report.
| 8 | MINERAL RESOURCES AND MINERAL RESERVES |
The most recent Mineral Resources attributable to the Ga-Phasha Project were estimated by Explormine Consultants in the Ga-Phasha Technical Report, dated as 30 March 2012. Please refer to Sections 14 (page 65) and 15 (page 103) of the attached Ga-Phasha Technical Report.
Table 1: Mineral Resource Estimate for the Merensky Reef and UG2 Reefs for the Eastern Section of the Ga-Phasha East Project Area - Phaschaskraal (2012)
| | | | | | | | | | | | | | | | | | | | | | | | | | | | | | | | | | | | | | | | | | |
Mineral Resource Category | | Reef
Type | | Tonnes
(million) | | | Grade
4E g/t | | | 4E Kg’s
(‘000) | | | 4E Moz | | | Pt
grade
g/t | | | Pd
grade
g/t | | | Rh
grade
g/t | | | Au
grade
g/t | | | Cu
grade
% | | | Ni
grade
% | |
Measured | | MR | | | 10.7 | | | | 4.74 | | | | 50.6 | | | | 1.6 | | | | 2.83 | | | | 1.45 | | | | 0.15 | | | | 0.31 | | | | 0.08 | | | | 0.21 | |
Indicated | | MR | | | 20.8 | | | | 5.37 | | | | 111.9 | | | | 3.6 | | | | 3.28 | | | | 1.58 | | | | 0.2 | | | | 0.33 | | | | 0.08 | | | | 0.22 | |
Meas + Ind | | MR | | | 31.5 | | | | 5.16 | | | | 162.5 | | | | 5.2 | | | | 3.12 | | | | 1.53 | | | | 0.18 | | | | 0.32 | | | | 0.08 | | | | 0.21 | |
Inferred | | MR | | | 23.2 | | | | 5.58 | | | | 129.1 | | | | 4.1 | | | | 3.37 | | | | 1.65 | | | | 0.19 | | | | 0.35 | | | | 0.07 | | | | 0.22 | |
| | | | | | | | | | | |
Mineral Resource Category | | Reef
type | | Tonnes
(million) | | | Grade
4E g/t | | | 4E Kg’s
(‘000) | | | 4E Moz | | | Pt
grade
g/t | | | Pd
grade
g/t | | | Rh
grade
g/t | | | Au
grade
g/t | | | Cu
grade
% | | | Ni
grade
% | |
Measured | | UG2 | | | 24.8 | | | | 6.15 | | | | 152.7 | | | | 4.9 | | | | 2.59 | | | | 2.96 | | | | 0.51 | | | | 0.1 | | | | 0.03 | | | | 0.15 | |
Indicated | | UG2 | | | 26.6 | | | | 5.96 | | | | 158.8 | | | | 5.1 | | | | 2.51 | | | | 2.86 | | | | 0.49 | | | | 0.1 | | | | 0.03 | | | | 0.15 | |
Meas + Ind | | UG2 | | | 51.5 | | | | 6.05 | | | | 311.5 | | | | 10 | | | | 2.55 | | | | 2.91 | | | | 0.5 | | | | 0.1 | | | | 0.03 | | | | 0.15 | |
Inferred | | UG2 | | | 33.6 | | | | 6.09 | | | | 204.6 | | | | 6.6 | | | | 2.54 | | | | 2.94 | | | | 0.51 | | | | 0.1 | | | | 0.04 | | | | 0.16 | |
Prepared by Minxcon (Pty) Ltd
H-22
| | |
| CIMVal Compliant Report on the Ga-Phasha East Project, South Africa | | H-23 |
Table 2: Mineral Resource Estimate for the Merensky Reef and UG2 Reefs for the Eastern Section of the Ga-Phasha Project Area - De Kamp (2012)
| | | | | | | | | | | | | | | | | | | | | | | | | | | | | | | | | | | | | | | | | | |
Mineral Resource Category | | Reef
Type | | Tonnes
(million) | | | Grade
4E g/t | | | 4E Kg’s
(‘000) | | | 4E Moz | | | Pt
Grade
g/t | | | Pd
Grade
g/t | | | Rh
Grade
g/t | | | Au
Grade
g/t | | | Cu
Grade
% | | | Ni
Grade
% | |
Measured | | MR | | | | | | | | | | | | | | | | | | | | | | | | | | | | | | | | | | | | | | | | |
Indicated | | MR | | | | | | | | | | | | | | | | | | | | | | | | | | | | | | | | | | | | | | | | |
Meas + Ind | | MR | | | | | | | | | | | | | | | | | | | | | | | | | | | | | | | | | | | | | | | | |
Inferred | | MR | | | 58.2 | | | | 5.8 | | | | 337.4 | | | | 10.8 | | | | 3.57 | | | | 1.75 | | | | 0.19 | | | | 0.3 | | | | 0.09 | | | | 0.22 | |
| | | | | | | | | | | |
Mineral Resource Category | | Reef
Type | | Tonnes
(million) | | | Grade
4E g/t | | | 4E Kg’s
(‘000) | | | 4E Moz | | | Pt
Grade
g/t | | | Pd
Grade
g/t | | | Rh
Grade
g/t | | | Au
Grade
g/t | | | Cu
Grade
% | | | Ni
Grade
% | |
Measured | | UG2 | | | | | | | | | | | | | | | | | | | | | | | | | | | | | | | | | | | | | | | | |
Indicated | | UG2 | | | | | | | | | | | | | | | | | | | | | | | | | | | | | | | | | | | | | | | | |
Meas + Ind | | UG2 | | | | | | | | | | | | | | | | | | | | | | | | | | | | | | | | | | | | | | | | |
Inferred2 | | UG2 | | | 64.7 | | | | 6.24 | | | | 403.8 | | | | 13 | | | | 2.63 | | | | 2.99 | | | | 0.53 | | | | 0.1 | | | | 0.03 | | | | 0.15 | |
Notes:
| 1. | A 4E pay limit of 245 cmg/t and 327 cmg/t for the Merensky and UG2 Reefs respectively has been applied (tonnes and element kg’s have been rounded off to the appropriate level of accuracy). |
Revised inferred resource - De Kamp
| | | | | | | | | | | | | | | | | | | | | | | | | | | | | | | | | | | | | | | | | | |
Mineral Resource Category | | Reef
Type | | Tonnes
(million) | | | Grade
4E g/t | | | 4E Kg’s
(‘000) | | | 4E Moz | | | Pt
Grade
g/t | | | Pd
Grade
g/t | | | Rh
Grade
g/t | | | Au
Grade
g/t | | | Cu
Grade
% | | | Ni
Grade
% | |
Measured | | UG2 | | | | | | | | | | | | | | | | | | | | | | | | | | | | | | | | | | | | | | | | |
Indicated | | UG2 | | | | | | | | | | | | | | | | | | | | | | | | | | | | | | | | | | | | | | | | |
Meas + Ind | | UG2 | | | | | | | | | | | | | | | | | | | | | | | | | | | | | | | | | | | | | | | | |
Inferred | | UG2 | | | 29.1 | | | | 6.34 | | | | 184.5 | | | | 5.9 | | | | 2.68 | | | | 3.02 | | | | 0.53 | | | | 0.11 | | | | 0.03 | | | | 0.15 | |
Notes:
| 1. | Inferred Resources have subsequently changed in a report submitted by ExplorMine to the JSE - Competent persons report the mineral resource estimate for the Merensky and UG2 reefs for the Ga-Phasha project area, Limpopo Province, republic of South Africa - 31 March 2012. Valuation is based on revised resource. |
No mining has taken place on the Ga-Phasha Project as of date of this Valuation Report. No exploration has been conducted by Atlatsa (or its joint venture partner Amplats) on the Ga-Phasha Project since 2008.
Please refer to section 13 (page 67) of the attached Ga-Phasha Technical Report.
| 10 | ENVIRONMENTAL CONSIDERATIONS |
Key environmental legislation, which is applicable to the South African mining industry, is as follows:
| | • | | National Environmental Management Act (107 of 1998) (“NEMA”), as regulated by the Department of Environmental Affairs and Tourism (“DEAT”) and relevant Provincial departments of environment. |
| | • | | MPRDA as regulated by the DMR. The MPRDA replaces the Minerals Act, 1991 and makes provision for equitable access to, and sustainable development of, South Africa’s mineral and petroleum resources. Regulations under the MPRDA set out the procedures for undertaking environmental impact assessments (“EIA”). |
| | • | | Minerals Act 1991 and the MPRDA make provision for transitional arrangements. A mine must convert “Old Order Mining Rights” to “New Order Mining Rights” by 30 April 2009. A key requirement for new mines or for the conversion process is the need for a social and labour plan (“SLP”), a mine works plan (“MWP”), proof of technical and financial competence as well as an approved Environmental Management Plan (“EMP”). |
| | • | | Mine Health and Safety Act (Act 29 of 1996), as regulated by the DMR. This Act deals with the protection of the health and safety of persons in the mining industry but also has implications for environmental issues related to environmental health monitoring within mines. |
Prepared by Minxcon (Pty) Ltd
H-23
| | |
| CIMVal Compliant Report on the Ga-Phasha East Project, South Africa | | H-24 |
Other relevant legislation includes the following:
| | • | | National Water Act (36 of 1998) (“NWA”) as regulated by the Department of Water Affairs and Forestry (“DWAF”). |
| | • | | Atmospheric Pollution Prevention Act (45 of 1965) (“APPA”) as regulated by DEAT. |
| | • | | Environment Conservation Act (73 of 1989) (“ECA”) as regulated by the DEAT, DWAF and relevant Provincial departments. |
| | • | | National Heritage Resources Act (25 of 1999) as regulated by South African Heritage Resource Agency (“SAHRA”) or relevant Provincial departments where established. |
| | • | | Hazardous Substances Act (15 of 1973) as regulated by the Department of Health. |
| | • | | ECA, Forest Act (84 of 1998), Provincial Nature Conservation Acts and other Ordinances as regulated by Provincial conservation authorities. |
| | • | | National Nuclear Regulator Act of 1999 as regulated by the National Nuclear Regulator (“NNR”). This legislation has been replaced by the Certificate of Registration (“COR”) system. |
Environmental liability provisioning in the South African mining industry is a requirement of the MPRDA and must be agreed with the relevant regulatory authorities (mainly the DMR and the DWAF). For existing mines such as the Bokoni Mine operations, monies are accrued based on the estimated environmental rehabilitation costs, should the mine have to close and over the operating life of a mine. Contributions are made to an environmental trust fund in this regard, which are approved by the South African Revenue Service.
If Ga-Phasha East were to proceed, there would be a greater impact on the environment. Ga-Phasha East is the subject of an Environmental Management Programme (“EMP”) approved as part of the conversion to a “New Order Mining Right” by all relevant interested and affected parties.
The EMP includes a detailed Environmental Closure Assessment detailing all areas of environmental liability. It is understood that Atlatsa will ensure that the Rehabilitation Trust Fund is funded to cover the total environmental liability upon closure of operations.
Prepared by Minxcon (Pty) Ltd
H-24
| | |
| CIMVal Compliant Report on the Ga-Phasha East Project, South Africa | | H-25 |
Figure 7: Ga-Phasha East Project Area Looking Southwest from the North-eastern Border of the Farm
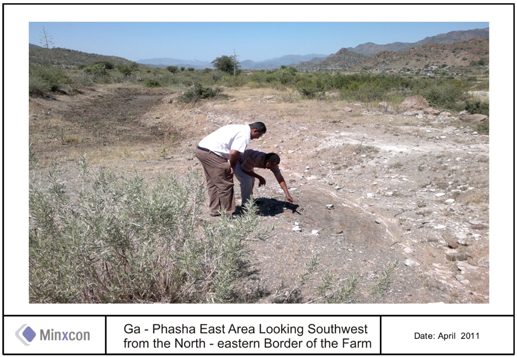
The land is currently barren and no major settlement of farming activity is taking place. Minxcon is not aware of any legal proceedings that may have an influence on the rights to prospect or mine for minerals.
| 11 | MINING AND PROCESSING OPERATIONS |
| 11.1 | PRELIMINARY ASSESSMENT MINE DESIGN |
No mining activity is currently taking place on the Ga-Phasha Project. It is flanked by two operations, the Bokoni Mine operation and Amplats’ Twickenham operation. Amplats prepared a preliminary assessment on the Paschaskraal and De Kamp farms. The case study adopted the same mine design as a Pre-Feasibility Study completed on Ga-Phasha Project in 2007 which is a conventional tabular stoping operation with track-bound footwall access development and conveyors located in minor dip declines. Minxcon did not have access to the Pre-Feasibility Study. Access is via a triple decline cluster system consisting of material, conveyor and chairlift declines as shown in modifying factors applied.
This additional information was considered as a guideline in the valuation. Minxcon replicated the life of mine (“LoM”) plan in the Minxcon model to test the viability of the project and applied in-house prices. The LoM plan was based on the UG2 Resource with mining rates at 125,000 t/mth from a single decline system and a life of 30 years.
Prepared by Minxcon (Pty) Ltd
H-25
| | |
| CIMVal Compliant Report on the Ga-Phasha East Project, South Africa | | H-26 |
Figure 8: Mining Layout
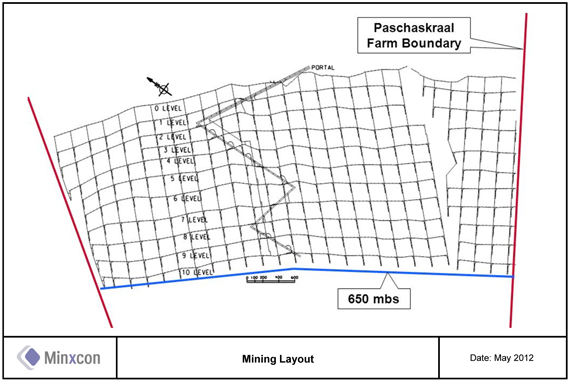
The UG2 Reef will be mined down to a depth of 650 mbs, or such depth not requiring a supply of refrigerated air. Subsequent phases would require vertical and sub-vertical shafts from the surface. This was not included in the study.
It is envisaged that primary off-reef development will consist of return airways (developed by trackless equipment) and track bound hydro-powered equipment for drilling and cleaning footwall haulages and crosscuts to reef.
Primary reef development consists of raises, advance strike gulleys and winch chambers. The raises are 2.5 m high and 1.5 m wide and will be developed with hydro-powered raise rigs and cleaned with scraper winches. The advance strike gulleys are 2.5 m high and 1.5 m wide and will be developed with hand held electric rock drills and cleaned with scraper winches. The inclination of the advance strike gulleys will be 15° above strike. The entire mine will use electric rock drills in the stopes, hydro-powered drill rigs in the raises and hydro-power drill rigs, hydro-power loaders and conventional trackbound tramming equipment in the horizontal footwall development. The declines, level accesses, main infrastructure on the levels (loco/hopper workshops, battery bay, tip loops, MTP, etc) and the return airway levels will be developed using trackless mechanised equipment.
| 11.2 | RECOVERIESAND PAYABILITY |
For Ga-Phasha East, it was assumed that the ore will be treated at the Twickenham concentrator plant with float recoveries as illustrated in Table 3 and then be sent to one of the Amplats smelter complexes and base and precious metal complexes. Although iridium, ruthenium and cobalt are produced, these metals were not included in the valuation. A payability of 100% was used for all metals, therefore valuing the assets in the hands of Amplats.
Prepared by Minxcon (Pty) Ltd
H-26
| | |
| CIMVal Compliant Report on the Ga-Phasha East Project, South Africa | | H-27 |
Table 3: Plant Recovery Factors
| | | | |
Commodity | | UG2 | |
Gold | | | 64 | % |
Platinum | | | 89 | % |
Palladium | | | 89 | % |
Rhodium | | | 82 | % |
Nickel | | | 61 | % |
Copper | | | 69 | % |
Plant recoveries similar to that achieved at Bokoni Mine were applied by Minxcon in the model. Operating costs used by Amplats are in line with operations at Bokoni Mine.
The following graph illustrates the UG2 production profile:
Figure 9: Annual Production - LOM
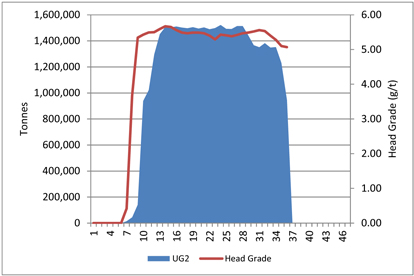
A prill split similar to that for Bokoni Mine was applied.
Table 4: Prill Splits
| | | | | | |
Commodity | | Unit | | UG2 Reef | |
Gold | | % | | | 2.6 | % |
Platinum | | % | | | 43.8 | % |
Palladium | | % | | | 44.7 | % |
Rhodium | | % | | | 8.90 | % |
Although iridium, ruthenium and cobalt are produced, income was not excluded from calculations.
Operating costs comprise on-mine costs related to direct stoping, and development, production services and supervision, underground transport, hoisting, pumping and ventilation, underground and surface engineering, plant operating costs and general overheads which includes central services. Other costs include general overheads, costs associated with Mine Health and Safety Regulations, Occupational Health, National skills Fund, cost to mitigate socio-economic conditions of directly affected persons, and environmental costs. Off-mine costs, which include smelting and refining, are included under other costs.
Prepared by Minxcon (Pty) Ltd
H-27
| | |
| CIMVal Compliant Report on the Ga-Phasha East Project, South Africa | | H-28 |
Table 5: Preliminary Assessment Model Ratios
| | | | | | |
| | | Units | | LOM | |
Net Turnover | | ZAR/Milled tonne | | | 1,817 | |
Mine Cost | | ZAR/Milled tonne | | | 672 | |
Plant Costs | | ZAR/Milled tonne | | | 132 | |
Cash Operating Costs | | ZAR/Milled tonne | | | 804 | |
Royalties | | ZAR/Milled tonne | | | 55 | |
Total Cash Costs | | ZAR/Milled tonne | | | 859 | |
Other Costs | | ZAR/Milled tonne | | | 238 | |
Total Production Costs | | ZAR/Milled tonne | | | 1,097 | |
EBITDA | | ZAR/Milled tonne | | | 720 | |
Capex | | ZAR/Milled tonne | | | 204 | |
Notional Cost | | ZAR/Milled tonne | | | 1301 | |
EBITDA Margin | | % | | | 40 | % |
NCE Margin | | % | | | 28.38 | % |
Total expenditure of ZAR7.732 billion was provided for in the cash flow. This includes ZAR4.079 billion for the decline system, plant capital of ZAR1.153 billion allocated to upgrade the Twickenham concentrator from 250 to 375 kt per month and ZAR283.6 million for housing and other infrastructure.
Table 6: Capital Expenditure
| | | | |
| | | ZAR’ million | |
Mining Decline Infrastructure | | | 4,079.2 | |
Twickenham Plant Extension | | | 1,153.3 | |
Other Infrastructure | | | 283.6 | |
Stay in business Capital (“SIB”) | | | 2,215.9 | |
| | | | |
Total Expenditure | | | 7,732.0 | |
| | | | |
Figure 10: Capital Cash Flow

Note: SIB will continue over the LOM.
Prepared by Minxcon (Pty) Ltd
H-28
| | |
| CIMVal Compliant Report on the Ga-Phasha East Project, South Africa | | H-29 |
| 11.6 | MACRO-ECONOMIC FORECASTS |
The following section includes the macro-economic and commodity price from consensus forecasts for the operation over the LoM. Forecast data is based on projections of the different commodity prices and the country-specific macro-economic parameters and is presented in calendar years.
The domestic annual inflation rate was applied to constant term Opex figures in the nominal cash flow model and as specific Capex inflation to inflate capital expenditure. Both the rand/dollar exchange rate and USD commodity prices are in constant money terms. These numbers were inflated in the DCF valuation using the US inflation rate for the commodity prices and purchasing power parity (“PPP”) for the rand devaluation.
The following prices were used in the cash flow:
Table 7: Long-term Prices Used in Cash Flow (Constant Money Terms)
| | | | | | |
Exchange rate | | ZAR /USD | | | 8.79 | |
ZAR Inflation Rate | | % | | | 6.00 | % |
US Inflation Rate | | % | | | 2.50 | % |
Gold | | USD/oz. | | | 1,117 | |
Platinum | | USD/oz. | | | 1,643 | |
Palladium | | USD/oz. | | | 741 | |
Rhodium | | USD/oz. | | | 1,706 | |
Nickel | | USD/tonne | | | 19,205 | |
Copper | | USD/tonne | | | 5,740 | |
1.1.1.1 Royalties
The Mineral and Petroleum Resources Royalty Act came into effect on 1 March 2010. Under the legislation, passed in 2008, companies will have to pay extra taxes proportional to their profitability after Capex. The law requires all companies extracting minerals in South Africa to pay royalties at a rate of between 0.5% and 7% based on gross sales, less their allowable deductions, depending on the refined condition of the Mineral Resources. Therefore, companies are taxed on either the refined or unrefined formula.
| | • | | Refined mineral formula = 0.5 + [EBIT/Gross sales x 12.5] x 100 |
| | • | | Unrefined mineral resource formula =0.5 + [EBIT/Gross sales x 9] x 100 |
The refined mineral formula was used.
1.1.1.2 Taxes
The normal company tax formula of 28% was applied. In addition to the normal provisions which apply to general companies, capital expenditure was allowed as a deduction from mining income. For all mines, capital expenditure incurred may be redeemed immediately against mining profits, and not at 20% over five years, as is the case with manufacturing concerns.
Historically, STC was levied at the rate of 10% on the net amount of dividends declared by the company. However, the Government proposed to phase out STC and replace it with a new tax on dividends from 1 April 2012. The formal legal liability for dividend tax will be moved from the company paying the dividend to the shareholder receiving it. The tax cost therefore shifts off the company’s income statement and becomes a cost to the shareholder. STC was therefore not considered in the calculation.
Prepared by Minxcon (Pty) Ltd
H-29
| | |
| CIMVal Compliant Report on the Ga-Phasha East Project, South Africa | | H-30 |
| 12 | KEY ASSUMPTIONS, RISKS AND LIMITATIONS |
| 12.1 | ASSUMPTIONSAND LIMITATIONS |
All opinions, findings and conclusions expressed in this report are those of Minxcon and are based on information provided by Atlatsa and the Ga-Phasha Technical Report. These opinions, findings and conclusions reflect various techno-economic (commodity prices, currency exchange rates, consumer price indices and other) conditions prevailing as at the effective date, as well as interpretations based on limited data. These conditions and interpretations can change significantly over a relatively short period of time and with new information and, as such, the information and opinions contained in this Valuation Report may also be subject to change.
| 12.2 | RESOURCEAND RESERVEESTIMATES |
There is a risk that the mineral resources are incorrect. If those estimates are materially in excess of the recoverable mineral content of the tenements, the valuation would be adversely affected.
| 12.3 | RELIANCEON INFORMATIONFROM MANAGEMENT |
Minxcon has placed reliance on the Management of Atlatsa that the following information is appropriate as at the effective date of this Valuation Report:
| | • | | The Ga-Phasha Technical Report; and |
| | • | | Corporate structure and legal tenure. |
The nature of exploration, mining and mineral processing involves hazards which could result in the Company incurring uninsured losses and liabilities to third parties, for example arising from pollution, environmental damage or other damage, injury or death. These could include rock falls, flooding, unfavourable ground conditions or seismic activity, ore grades being lower than expected and the physical or metallurgical characteristics of the ore being less amenable to mining or treatment than expected.
| 12.5 | BLACK ECONOMIC EMPOWERMENT |
Companies in South Africa must comply and remain compliant with certain black economic empowerment (“BEE”) requirements in order to retain their prospecting and mining rights. Any failure by a company, and its subsidiaries to satisfy and to continue to satisfy the BEE requirements could jeopardise the prospecting and mining rights in which the company will hold an interest. To satisfy the social development requirements of the MPRDA to obtain and retain prospecting rights and mining rights, the Atlatsa must obtain approval of and provide financially for and comply with the prescribed social and labour plan. This will be a cost which may affect Ga-Phasha East’s profitability should it derive revenue from the sale of platinum in the future.
| 12.6 | EXPLORINGAND MINING RISKS |
The future viability and profitability of Ga-Phasha East will be affected by a number of factors, including, but not limited to the risks associated with:
| | • | | exploration or mining rights being adversely affected by political disputes; and |
| | • | | environmental management issues and the obligations to comply with requirements that may change over time and result in additional costs and delays. |
Prepared by Minxcon (Pty) Ltd
H-30
| | |
| CIMVal Compliant Report on the Ga-Phasha East Project, South Africa | | H-31 |
Ga-Phasha East is subject to various environmental laws. Many of the activities and operations cannot be carried out without prior approval from and compliance with all relevant authorities. Resource activities can be environmentally sensitive and give rise to substantial costs for environmental rehabilitation, damage control and losses.
The South African government has implemented a variety of laws which seek to redress the economic imbalances. These laws are aimed at uplifting the previously disadvantaged groups through equity ownership, corporate social responsibility programs and employment equity legislation. The new minerals and mining laws for example provide for such BEE for the granting of mining rights.
One of the major legal risks is the conversion of its old order mineral rights into new order mining rights under the MPRDA. The MPRDA has placed all mineral rights under the ownership of the state. The regulatory environment could change in ways that substantially increase the Atlatsa’s liabilities, tax liability or costs of compliance.
Atlatsa’s operations may be adversely affected by labour disputes or changes in South African labour laws. In South Africa a number of trade unions have close links to various political parties and have significant influences as vehicles for social and political reform and in the collective bargaining process. South Africa has enacted various labour laws that enhance the rights of employees which may impose costs on the Atlatsa. Significant labour disputes, work stoppages, increased employee expenses as a result of collective bargaining and the cost of compliance with labour laws could disrupt operations and affect the profitability of the prospecting rights and any future mining and exploration activities undertaken.
| 12.10 | HIV/AIDSAND TUBERCULOSIS |
The HIV/AIDS pandemic remains a significant challenge to companies operating in South Africa. In addition, the occurrence of tuberculosis is increasing amongst the South African workforce. Any significant increase in the incidence of HIV/AIDS infection, HIV/AIDS-related diseases or tuberculosis in the workforce could adversely affect operations.
| 12.11 | FAILUREOF BASIC INFRASTRUCTURE |
Infrastructure in South Africa for utilities such as electricity and water supply is continually under strain. Project development depends on the reliable and continuous delivery of adequate power and water.
| 12.12 | COMMODITY PRICE VOLATILITYAND FOREIGN EXCHANGE RATE RISKS |
If Ga-Phasha East is developed successfully leading to mineral production, the revenue it will derive through the sale of commodities exposes the potential income of Atlatsa to commodity price and exchange rate risks. Commodity prices fluctuate and are affected by many factors beyond the control of the owners. Such factors include supply and demand fluctuations for precious and base metals, technological advancements, forward selling activities and other macro-economic factors. Furthermore, international prices of various commodities are denominated in United States dollars, whereas the income and expenditure will be taken into account in South African currencies, exposing developers to the fluctuations and volatility of the rate of exchange between the United States dollar and the South African rand (“ZAR” or “Rand”) as determined in international markets.
Prepared by Minxcon (Pty) Ltd
H-31
| | |
| CIMVal Compliant Report on the Ga-Phasha East Project, South Africa | | H-32 |
| 13 | VALUATION APPROACHES AND METHODS |
| 13.1 | RECENT VALUATIONSOFTHE MINERAL PROPERTY |
Apart from the work completed by Minxcon as stated in this Valuation Report, Minxcon is not aware of any previous valuations completed during the past two years.
The following valuation approaches are three internationally accepted methods of valuing PGM projects, and are summarised below as well as illustrated in Table 4. Valuation methods are, in general, subsets of valuation approaches:-
| | • | | Cost Approach: includes the Appraised Value method which is widely used and the Multiple of Exploration Expenditure which is used to value early stage exploration properties. The valuation is dependent on the historical and future exploration expenditure, as this approach is based on the principal of contribution to value; |
| | • | | Market Approach: used to value exploration and development properties, based on the relative comparisons of similar properties for which a transaction is available, in the public domain. The comparable transaction method approach, which is the most widely used, relies on the principle of “willing buyer, willing seller” and requires that the amount obtainable from the sale of the platinum asset is determined as if in an arm’s length transaction; and |
| | • | | Income Approach: the Discounted Cash Flow (DCF), Monte Carlo Analysis and Option Pricing are amongst the methods included under this category. The DCF is widely used and generally used to value development and production properties in the production phase. This method relies on the “value-in-use” principle and requires determination of the present value of future cash flows over the useful life of the mineral asset. |
Table 8: Acceptable Methods of Mineral Project Valuation
| | | | | | | | |
Valuation Approach | | Exploration Properties | | Mineral Resource Properties | | Development Properties | | Production Properties |
| Income | | No | | In some cases | | Yes | | Yes |
| Market | | Yes | | Yes | | Yes | | Yes |
| Cost | | Yes | | In some cases | | No | | No |
The cost approach relies on expenditure on the property and involves estimation of the cost of reproducing or replacing the asset and improvements. Reproduction cost refers to the cost at a given point in time of reproducing a replica asset; whereas replacement cost refers to the cost of reproducing improvements of equal utility. In the case where insufficient confidence exists in the technical parameters of the mineral asset, valuation methods rely almost entirely on the principle of historical cost, implying that an asset’s value is correlated to the money spent on its acquisition, plus a multiple of expenditures.
A prospectivity enhancement multiplier (“PEM”) is a factor applied to the total cost of exploration, the magnitude of which is determined by the level of sophistication of the exploration for which positive exploration results have been obtained.
Prepared by Minxcon (Pty) Ltd
H-32
| | |
| CIMVal Compliant Report on the Ga-Phasha East Project, South Africa | | H-33 |
The market approach requires the comparison of Ga-Phasha East with relatively recent transactions of Resource assets that have similar characteristics to those of the asset being valued. It is generally based upon a monetary value per unit of the in situ resource (where available), or per unit of defined tons (Measured, Indicated and Inferred).
This comparable method uses the transaction price of comparable assets to establish a value for the specific asset to be valued. The difficulty of this approach within the mining industry is that there are no true comparables, since each asset is unique with respect to key factors such as geology, mineralisation, costs, stage of exploration, infrastructure and peripheral issues, such as social, political and environmental aspects. The movement in the PGM price is also reflected in the range of values, at a grade comparable to the projected percentage of the resource in Ga-Phasha East.
When transactions of PGM assets do occur, they rarely involve strictly cash, leaving the valuator the task of converting blocks of shares, royalties or option terms into present day monetary equivalents. In the first cases, the defined value of the share (inclusive of whether it is transacted at a premium or discount), at the time of the transaction, is applied to convert the share volume into a cash value. The same principle is applied to royalties and option terms to convert these transaction preferences into a cash basis.
An alternative market approach is to determine the monetary value per hectare (“MVH”) using relatively recent transactions of assets that have similar characteristics to those assets being valued. This is a function of obtaining the definition and interpretation of the hectare value for the resource asset.
The Income Approach is based on the principle of anticipation of benefits and includes all methods that are based on the income or cash flow generation potential of the Mineral Property. This approach relies on the ‘value-in-use’ principle and requires determination of the present value of future cash flows over the useful life of the mineral asset.
| 13.2.4 | Justification and limitations of the different approaches |
The different valuation approaches depend on the stage of exploration or development of the property as described in Table 4. Based upon review of technical data for Ga-Phasha East, the Cost and Market Approaches were selected for the current valuation. This reflects the fact that:
| | 1. | reasonable records of exploration expenditures exist for the Ga-Phasha Project and; |
| | 2. | mineral property transactions were available for review that reflect market conditions broadly similar to those at the present time. |
In addition to above the valuator also considered a preliminary assessment completed by Amplats. Information was used to current market conditions. This preliminary assessment study on the Paschaskraal and De Kamp farms is based on the pre-feasibility study completed in 2007, hence modifying factors and assumptions that are normally applied has been factored in, in detail. The valuator deemed it necessary to consider this preliminary assessment in this Valuation Report due to the high barriers of entry of the industry (costs associated with the construction of a plant and payability), the limitation of strike length of this specific ore body relative to its down dip extension which is not always fully reflected in a market comparative.
Prepared by Minxcon (Pty) Ltd
H-33
| | |
| CIMVal Compliant Report on the Ga-Phasha East Project, South Africa | | H-34 |
| 14.1 | CURRENT INVESTMENT CLIMATE FOR EXPLORATIONIN SOUTH AFRICA |
South Africa is currently experiencing a depressed investment climate for exploration projects for various reasons. Despite the distressed Global economic and financial climate which led to low PGM prices and general caution to invest in new development projects, South Africa is also struggling with the regulatory issues associated with the MPRDA, which came into force in 2004.
In a recent article published in the international Journal of Energy & Natural Resources Law by Peter Leon a partner and Head of Africa Mining & Energy Projects at Webber Wentzel, Johannesburg, South Africa, Peter accurately sketched the current situation in the conversion of mineral rights.
Despite having some of the world’s largest mineral reserves, South Africa’s mineral production in the third quarter of 2011 contracted by 12 per cent which is in stark contrast with some of the country’s mining peers. South Africa’s policy potential, according to the 2011 Fraser Institute survey of the world’s major mining jurisdictions, ranked 67 out of 79 countries reviewed.
A significant cause of the industry’s decline lies in the regulatory uncertainty caused by the implementation of the MPRDA. A combination of an entirely new regulatory regime, combined with the MPRDA’s vague and ambiguous provisions, has led to critical licensing delays, well in excess of South Africa’s peers.
At the same time, the promotion of BEE has focused on narrow rather than broad-based black ownership of the mining industry. This, in turn, has become the catalyst behind calls from the African National Congress (ANC)’s youth league for the nationalisation of the industry itself.
While this has not been supported by the ANC-led government, the state itself has become more interventionist in the industry. This has led to the revival of the state-owned mining company and the opening of its first coal mine. An ANC research committee has investigated the feasibility of mine nationalisation, but its report is yet to be made public. A final decision on the issue is expected by December 2012, at the ANC’s quinquennial elective conference.
At the same time, the Minister of Mineral Resources has announced and/or implemented a number of regulatory initiatives to address the industry’s problems, including proposed amendments to the MPRDA itself.
| 14.2 | OUTLOOKFOR COMMODITY PRICES |
The platinum market swung into an oversupply of 430,000 oz in 2011. Supplies of platinum rose by 7% to 6.48 million ounces due to inventory releases from South Africa as well as higher output in North America and Zimbabwe. Recycling increased by 12% to 2.05 million ounces. Gross demand for platinum rose by 2% to 8.1 million ounces largely as a result of heavy purchasing by the glass and petrochemical industries. Demand for platinum for use in heavy duty diesel autocatalysts was strong but this was partly offset by lower use in light duty diesel emissions control and reduced buying by Japanese auto manufacturers. Autocatalyst demand grew by 1% to 3.11 million ounces. Purchasing last year by jewellery manufacturers was 2% higher than in 2010 at 2.48 million ounces. Investment demand declined by 30% year-on-year but remained positive at 460,000 oz.
Prepared by Minxcon (Pty) Ltd
H-34
| | |
| CIMVal Compliant Report on the Ga-Phasha East Project, South Africa | | H-35 |
Table 9: Platinum Supply and Demand
| | | | | | | | | | | | | | | | | | | | | | | | | | | | | | | | | | | | | | | | |
‘000 oz | | 2002 | | | 2003 | | | 2004 | | | 2005 | | | 2006 | | | 2007 | | | 2008 | | | 2009 | | | 2010 | | | 2011 | |
Supply | | | | | | | | | | | | | | | | | | | | | | | | | | | | | | | | | | | | | | | | |
South Africa | | | 4,450 | | | | 4,630 | | | | 5,010 | | | | 5,115 | | | | 5,295 | | | | 5,070 | | | | 4,515 | | | | 4,635 | | | | 4,635 | | | | 4,855 | |
Russia | | | 980 | | | | 1,050 | | | | 845 | | | | 890 | | | | 920 | | | | 915 | | | | 805 | | | | 785 | | | | 825 | | | | 835 | |
North America | | | 390 | | | | 295 | | | | 385 | | | | 365 | | | | 345 | | | | 325 | | | | 325 | | | | 260 | | | | 200 | | | | 350 | |
Zimbabwe | | | — | | | | — | | | | — | | | | 155 | | | | 165 | | | | 170 | | | | 180 | | | | 230 | | | | 280 | | | | 340 | |
Others | | | 150 | | | | 225 | | | | 250 | | | | 115 | | | | 105 | | | | 120 | | | | 115 | | | | 115 | | | | 110 | | | | 100 | |
| | | | | | | | | | | | | | | | | | | | | | | | | | | | | | | | | | | | | | | | |
Total Supply | | | 5,970 | | | | 6,200 | | | | 6,490 | | | | 6,640 | | | | 6,830 | | | | 6,600 | | | | 5,940 | | | | 6,025 | | | | 6,050 | | | | 6,480 | |
| | | | | | | | | | | | | | | | | | | | | | | | | | | | | | | | | | | | | | | | |
| | | | | | | | | | |
Demand by Application | | | | | | | | | | | | | | | | | | | | | | | | | | | | | | | | | | | | | | | | |
Autocatalyst | | | 2,590 | | | | 3,270 | | | | 3,490 | | | | 3,795 | | | | 3,905 | | | | 4,145 | | | | 3,655 | | | | 2,185 | | | | 3,075 | | | | 3,105 | |
Chemical | | | 325 | | | | 320 | | | | 325 | | | | 325 | | | | 395 | | | | 420 | | | | 400 | | | | 290 | | | | 440 | | | | 470 | |
Electrical | | | 315 | | | | 260 | | | | 300 | | | | 360 | | | | 360 | | | | 255 | | | | 230 | | | | 190 | | | | 230 | | | | 230 | |
Glass | | | 235 | | | | 210 | | | | 290 | | | | 360 | | | | 405 | | | | 470 | | | | 315 | | | | 10 | | | | 385 | | | | 555 | |
Investment | | | 80 | | | | 15 | | | | 45 | | | | 15 | | | | -40 | | | | 170 | | | | 555 | | | | 660 | | | | 655 | | | | 460 | |
Jewellery* | | | 2,820 | | | | 2,510 | | | | 2,160 | | | | 2,465 | | | | 2,195 | | | | 2,110 | | | | 2,060 | | | | 2,810 | | | | 2,420 | | | | 2,480 | |
Medical & Biomedical | | | — | | | | — | | | | — | | | | 250 | | | | 250 | | | | 230 | | | | 245 | | | | 250 | | | | 230 | | | | 230 | |
Petroleum | | | 130 | | | | 120 | | | | 150 | | | | 170 | | | | 180 | | | | 205 | | | | 240 | | | | 210 | | | | 170 | | | | 210 | |
Other | | | 540 | | | | 470 | | | | 470 | | | | 225 | | | | 240 | | | | 265 | | | | 290 | | | | 190 | | | | 300 | | | | 355 | |
| | | | | | | | | | | | | | | | | | | | | | | | | | | | | | | | | | | | | | | | |
Total Gross Demand | | | 7,035 | | | | 7,175 | | | | 7,230 | | | | 7,965 | | | | 7,890 | | | | 8,270 | | | | 7,990 | | | | 6,795 | | | | 7,905 | | | | 8,095 | |
| | | | | | | | | | | | | | | | | | | | | | | | | | | | | | | | | | | | | | | | |
| | | | | | | | | | |
Recycling | | | | | | | | | | | | | | | | | | | | | | | | | | | | | | | | | | | | | | | | |
Autocatalyst | | | -565 | | | | -645 | | | | -690 | | | | -770 | | | | -860 | | | | -935 | | | | -1,130 | | | | -830 | | | | -1,085 | | | | -1,225 | |
Electrical | | | — | | | | — | | | | — | | | | 0 | | | | 0 | | | | 0 | | | | -5 | | | | -10 | | | | -10 | | | | -10 | |
Jewellery | | | — | | | | — | | | | — | | | | -500 | | | | -555 | | | | -655 | | | | -695 | | | | -565 | | | | -735 | | | | -810 | |
| | | | | | | | | | | | | | | | | | | | | | | | | | | | | | | | | | | | | | | | |
Total Recycling | | | -565 | | | | -645 | | | | -690 | | | | -1,270 | | | | -1,415 | | | | -1,590 | | | | -1,830 | | | | -1,405 | | | | -1,830 | | | | -2,045 | |
| | | | | | | | | | | | | | | | | | | | | | | | | | | | | | | | | | | | | | | | |
Total Net Demand | | | 6,470 | | | | 6,530 | | | | 6,540 | | | | 6,695 | | | | 6,475 | | | | 6,680 | | | | 6,160 | | | | 5,390 | | | | 6,075 | | | | 6,050 | |
| | | | | | | | | | | | | | | | | | | | | | | | | | | | | | | | | | | | | | | | |
Movements in Stocks | | | -500 | | | | -330 | | | | -50 | | | | -55 | | | | 355 | | | | -80 | | | | -220 | | | | 635 | | | | -25 | | | | 430 | |
Source: Johnson Matthey
The platinum price drifted lower during the year on the back of slower demand and the uncertainty of the European economy, but showed a marked turnaround in early August following fresh violence and strike action in the South African mining industry. Labour unrest in the country, which holds a reported 80% of the known reserves of the metal, has raised concerns about internal security and supply.
Prepared by Minxcon (Pty) Ltd
H-35
| | |
| CIMVal Compliant Report on the Ga-Phasha East Project, South Africa | | H-36 |
Figure 11: Platinum Price Monthly Historic
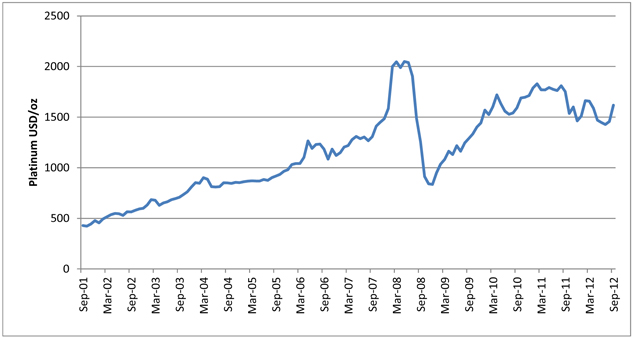
In addition, the announcement of a new round of monetary easing (QE3) helped to boost gold prices and PGM’s. Moreover, during September the ECB confirmed an unlimited bond-buying scheme to help reduce borrowing costs for struggling Eurozone countries, which led to euro strength (dollar weakness) and provided additional support for platinum prices.
Looking ahead, developments on the supply side will remain the key driver of platinum market sentiment and prices in the near term. Upside potential will be driven by the threat of further supply disruptions at South African platinum producers. In addition, higher production costs as a result of recent wage increases should help to sustain higher prices in the short term.
Nevertheless, platinum is unlikely to maintain upward momentum for the rest of the year. As labour tensions in South Africa eventually ease, a downward trend is likely to develop towards year-end and prices are expected to retreat. The metal’s overall underlying fundamentals remain challenging, given the economic conditions in Europe, prospects of autocatalyst demand remain bleak. In addition, net long speculative positions in Nymex platinum futures surged to a record high since mid-August, leaving the metal vulnerable to profit taking in the short term. New passenger car registrations in the EU continued to fall for an eleventh consecutive month, posting a year-on-year decline of 8.9% in August, while demand for commercial vehicles dropped by 12.4%. Longer term, the consensus prices for platinum is forecast to improve, albeit it a more steady increase.
Prepared by Minxcon (Pty) Ltd
H-36
| | |
| CIMVal Compliant Report on the Ga-Phasha East Project, South Africa | | H-37 |
Figure 12: Consensus Platinum Price Forecast (Nominal)
Data Source: Johnson Matthey/Consensus Economics Inc.
The palladium market was in surplus by 1.26 million ounces last year. Gross demand fell by 13% to 8.45 million ounces, mainly due to net selling by investors. Further Russian state stock sales and higher recycling also helped push the market into oversupply. Supplies of palladium remained almost flat at 7.36 million ounces as rising output from North America and Zimbabwe was largely offset by lower sales from Russian state inventories. Gross demand for palladium in autocatalysts reached a new high in 2011 of 6.03 million ounces, driven by growth in vehicle output in all regions apart from Japan, and greater use of palladium in light duty diesel after treatment systems. Industrial demand for the metal remained strong. Purchases of palladium by the jewellery industry fell last year, while investment demand for palladium turned sharply negative.
Prepared by Minxcon (Pty) Ltd
H-37
| | |
| CIMVal Compliant Report on the Ga-Phasha East Project, South Africa | | H-38 |
Table 10: Palladium Supply and Demand
| | | | | | | | | | | | | | | | | | | | | | | | | | | | | | | | | | | | | | | | |
‘000 oz | | 2002 | | | 2003 | | | 2004 | | | 2005 | | | 2006 | | | 2007 | | | 2008 | | | 2009 | | | 2010 | | | 2011 | |
| | | | | | | | | | |
Supply | | | | | | | | | | | | | | | | | | | | | | | | | | | | | | | | | | | | | | | | |
South Africa | | | 2,160 | | | | 2,320 | | | | 2,480 | | | | 2,605 | | | | 2,775 | | | | 2,765 | | | | 2,430 | | | | 2,370 | | | | 2,640 | | | | 2,560 | |
Russia | | | | | | | | | | | | | | | | | | | | | | | | | | | | | | | | | | | | | | | | |
Primary | | | 1,930 | | | | 2,950 | | | | 4,800 | | | | 3,135 | | | | 3,220 | | | | 3,050 | | | | 2,700 | | | | 2,675 | | | | 2,720 | | | | 2,705 | |
Stock Sales | | | — | | | | — | | | | — | | | | 1,485 | | | | 700 | | | | 1,490 | | | | 960 | | | | 960 | | | | 1,000 | | | | 775 | |
North America | | | 990 | | | | 935 | | | | 1,035 | | | | 910 | | | | 985 | | | | 990 | | | | 910 | | | | 755 | | | | 590 | | | | 900 | |
Zimbabwe | | | 0 | | | | 0 | | | | 0 | | | | 125 | | | | 135 | | | | 135 | | | | 140 | | | | 180 | | | | 220 | | | | 265 | |
Others | | | 170 | | | | 245 | | | | 265 | | | | 145 | | | | 135 | | | | 150 | | | | 170 | | | | 160 | | | | 185 | | | | 155 | |
| | | | | | | | | | | | | | | | | | | | | | | | | | | | | | | | | | | | | | | | |
Total Supply | | | 5,250 | | | | 6,450 | | | | 8,580 | | | | 8,405 | | | | 7,950 | | | | 8,580 | | | | 7,310 | | | | 7,100 | | | | 7,355 | | | | 7,360 | |
| | | | | | | | | | | | | | | | | | | | | | | | | | | | | | | | | | | | | | | | |
| | | | | | | | | | |
Demand by Application | | | | | | | | | | | | | | | | | | | | | | | | | | | | | | | | | | | | | | | | |
Autocatalyst | | | 3,050 | | | | 3,450 | | | | 3,790 | | | | 3,865 | | | | 4,015 | | | | 4,545 | | | | 4,465 | | | | 4,050 | | | | 5,580 | | | | 6,030 | |
Chemical | | | 255 | | | | 265 | | | | 310 | | | | 415 | | | | 440 | | | | 375 | | | | 350 | | | | 325 | | | | 370 | | | | 445 | |
Dental | | | 785 | | | | 825 | | | | 850 | | | | 815 | | | | 620 | | | | 630 | | | | 625 | | | | 635 | | | | 595 | | | | 550 | |
Electrical | | | 760 | | | | 900 | | | | 920 | | | | 1,275 | | | | 1,495 | | | | 1,550 | | | | 1,370 | | | | 1,270 | | | | 1,410 | | | | 1,380 | |
Investment | | | 0 | | | | 30 | | | | 200 | | | | 220 | | | | 50 | | | | 260 | | | | 420 | | | | 625 | | | | 1,095 | | | | -565 | |
Jewellery | | | 270 | | | | 260 | | | | 930 | | | | 1,490 | | | | 1,140 | | | | 950 | | | | 985 | | | | 775 | | | | 595 | | | | 505 | |
Other | | | 90 | | | | 110 | | | | 90 | | | | 265 | | | | 85 | | | | 85 | | | | 75 | | | | 70 | | | | 90 | | | | 105 | |
| | | | | | | | | | | | | | | | | | | | | | | | | | | | | | | | | | | | | | | | |
Total Gross Demand | | | 5,210 | | | | 5,840 | | | | 7,090 | | | | 8,345 | | | | 7,845 | | | | 8,395 | | | | 8,290 | | | | 7,750 | | | | 9,735 | | | | 8,450 | |
| | | | | | | | | | | | | | | | | | | | | | | | | | | | | | | | | | | | | | | | |
| | | | | | | | | | |
Recycling | | | | | | | | | | | | | | | | | | | | | | | | | | | | | | | | | | | | | | | | |
Autocatalyst | | | -370 | | | | -410 | | | | -530 | | | | -625 | | | | -805 | | | | -1,015 | | | | -1,140 | | | | -965 | | | | -1,310 | | | | -1,655 | |
Electrical | | | — | | | | — | | | | — | | | | -305 | | | | -290 | | | | -315 | | | | -345 | | | | -395 | | | | -440 | | | | -480 | |
Jewellery | | | — | | | | — | | | | — | | | | -60 | | | | -135 | | | | -235 | | | | -130 | | | | -70 | | | | -100 | | | | -210 | |
| | | | | | | | | | | | | | | | | | | | | | | | | | | | | | | | | | | | | | | | |
Total Recycling | | | -370 | | | | -410 | | | | -530 | | | | -990 | | | | -1,230 | | | | -1,565 | | | | -1,615 | | | | -1,430 | | | | -1,850 | | | | -2,345 | |
| | | | | | | | | | | | | | | | | | | | | | | | | | | | | | | | | | | | | | | | |
Total Net Demand | | | 4,840 | | | | 5,430 | | | | 6,560 | | | | 7,355 | | | | 6,615 | | | | 6,830 | | | | 6,675 | | | | 6,320 | | | | 7,885 | | | | 6,105 | |
| | | | | | | | | | | | | | | | | | | | | | | | | | | | | | | | | | | | | | | | |
Movements in stocks | | | 410 | | | | 1,020 | | | | 2,020 | | | | 1,050 | | | | 1,335 | | | | 1,750 | | | | 635 | | | | 780 | | | | -530 | | | | 1,255 | |
| | | | | | | | | | | | | | | | | | | | | | | | | | | | | | | | | | | | | | | | |
Source: Johnson Matthey
Like platinum, palladium values rallied in August 2012 as violence at several mines in South Africa cast doubt over output of the metal for the year. Uncertainties caused by production losses, inter-union tensions and lower profit margins could lead to cutbacks in investment, which threatens to drive prices higher during the recovery phase of the global business cycle. Weak demand from the European auto sector, which uses the metal in catalytic converters, and a slowdown in Asia may keep a lid on prices, though.
After hitting a 10 year high in March 2011, palladium started to slide lower, broadly following platinum’s trajectory. With regard to the forecast, the disruption of the South African mining industry will continue to dominate the metals’ market sentiment, albeit to a lower extent than platinum.
Looking ahead, current labour tensions in South Africa are expected to moderate eventually as we approach the end of the year. Nevertheless, palladium’s generally healthier underlying fundamentals should provide strong support for the metal in the near term. Indeed, the market remains in a gross deficit for the sixth consecutive year, while Russian stock sales continue to decline. Moreover, prospects of autocatalyst demand for palladium are far better than for its sister metal, given a far broader demand base. In addition, net long investor positions on Nymex remain far below record highs seen in the past, leaving scope for positions to rebuild. We are therefore looking for palladium to test $700 by the end of 2012, with a floor of some $630 likely to emerge.
Prepared by Minxcon (Pty) Ltd
H-38
| | |
| CIMVal Compliant Report on the Ga-Phasha East Project, South Africa | | H-39 |
Early October has seen further strength in palladium prices, as the metal is trading at over $660 at the moment, driven by recent developments on the supply side. Net investor long positions on Nymex surged in September, rising by nearly 50% to 1.4 Moz on the 25th of September, a level last seen in August 2011.
Figure 13: Palladium Price Monthly Historic
Seasonally adjusted US auto sales rose by 13% in September, to reach a four-year high of 14.9 million units.
Figure 14: Consensus Palladium Price Forecast (Nominal)
Data Source: Johnson Matthey/Consensus Economics Inc.
Prepared by Minxcon (Pty) Ltd
H-39
| | |
| CIMVal Compliant Report on the Ga-Phasha East Project, South Africa | | H-40 |
Despite growth in demand, the rhodium market remained in surplus last year by 139,000 oz as a result of higher supplies and recycling. Rhodium supplies rose by 4% to 765,000 oz due mainly to higher output from North America and Zimbabwe. Demand for rhodium increased by 2% to 906,000 oz as a result of capacity building in the glass industry and investment in a new rhodium ETF. Gross demand for rhodium in autocatalysts softened by 2% to 712,000 oz due to lower output by Japanese car manufacturers.
Table 11: Rhodium Supply and Demand
| | | | | | | | | | | | | | | | | | | | | | | | | | | | | | | | | | | | | | | | |
‘000 oz | | 2002 | | | 2003 | | | 2004 | | | 2005 | | | 2006 | | | 2007 | | | 2008 | | | 2009 | | | 2010 | | | 2011 | |
| | | | | | | | | | |
Supply | | | | | | | | | | | | | | | | | | | | | | | | | | | | | | | | | | | | | | | | |
South Africa | | | 490 | | | | 544 | | | | 587 | | | | 627 | | | | 666 | | | | 696 | | | | 574 | | | | 663 | | | | 632 | | | | 641 | |
Russia | | | 90 | | | | 140 | | | | 100 | | | | 90 | | | | 100 | | | | 90 | | | | 85 | | | | 70 | | | | 70 | | | | 72 | |
North America | | | 25 | | | | 26 | | | | 17 | | | | 20 | | | | 17 | | | | 20 | | | | 18 | | | | 15 | | | | 10 | | | | 20 | |
Zimbabwe | | | 0 | | | | 0 | | | | 0 | | | | 13 | | | | 14 | | | | 14 | | | | 15 | | | | 19 | | | | 19 | | | | 29 | |
Others | | | 10 | | | | 14 | | | | 16 | | | | 4 | | | | 5 | | | | 4 | | | | 3 | | | | 3 | | | | 3 | | | | 3 | |
| | | | | | | | | | | | | | | | | | | | | | | | | | | | | | | | | | | | | | | | |
Total Supply | | | 615 | | | | 724 | | | | 720 | | | | 754 | | | | 802 | | | | 824 | | | | 695 | | | | 770 | | | | 734 | | | | 765 | |
| | | | | | | | | | | | | | | | | | | | | | | | | | | | | | | | | | | | | | | | |
| | | | | | | | | | |
Demand by Application | | | | | | | | | | | | | | | | | | | | | | | | | | | | | | | | | | | | | | | | |
Autocatalyst | | | 599 | | | | 660 | | | | 758 | | | | 829 | | | | 863 | | | | 887 | | | | 768 | | | | 619 | | | | 727 | | | | 712 | |
Chemical | | | 39 | | | | 39 | | | | 43 | | | | 48 | | | | 49 | | | | 63 | | | | 68 | | | | 54 | | | | 67 | | | | 72 | |
Electrical | | | 6 | | | | 6 | | | | 8 | | | | 10 | | | | 9 | | | | 3 | | | | 3 | | | | 3 | | | | 4 | | | | 5 | |
Glass | | | 37 | | | | 26 | | | | 46 | | | | 57 | | | | 65 | | | | 59 | | | | 34 | | | | 19 | | | | 68 | | | | 78 | |
Other | | | 10 | | | | 13 | | | | 14 | | | | 20 | | | | 23 | | | | 24 | | | | 24 | | | | 21 | | | | 21 | | | | 39 | |
| | | | | | | | | | | | | | | | | | | | | | | | | | | | | | | | | | | | | | | | |
Total Gross Demand | | | 691 | | | | 744 | | | | 869 | | | | 964 | | | | 1,009 | | | | 1,036 | | | | 897 | | | | 716 | | | | 887 | | | | 906 | |
| | | | | | | | | | | | | | | | | | | | | | | | | | | | | | | | | | | | | | | | |
| | | | | | | | | | |
Recycling | | | | | | | | | | | | | | | | | | | | | | | | | | | | | | | | | | | | | | | | |
Autocatalyst | | | -99 | | | | -124 | | | | -140 | | | | -137 | | | | -171 | | | | -192 | | | | -227 | | | | -187 | | | | -241 | | | | -280 | |
| | | | | | | | | | | | | | | | | | | | | | | | | | | | | | | | | | | | | | | | |
Total Recycling | | | -99 | | | | -124 | | | | -140 | | | | -137 | | | | -171 | | | | -192 | | | | -227 | | | | -187 | | | | -241 | | | | -280 | |
| | | | | | | | | | | | | | | | | | | | | | | | | | | | | | | | | | | | | | | | |
Total Net Demand | | | 592 | | | | 620 | | | | 729 | | | | 827 | | | | 838 | | | | 844 | | | | 670 | | | | 529 | | | | 646 | | | | 626 | |
| | | | | | | | | | | | | | | | | | | | | | | | | | | | | | | | | | | | | | | | |
Movements in Stocks | | | 23 | | | | 104 | | | | -9 | | | | -73 | | | | -36 | | | | -20 | | | | 25 | | | | 241 | | | | 88 | | | | 139 | |
Rhodium prices showed little response to the discontent on the South African supply side for much of the first half of the month, remaining becalmed at the Johnson Matthey Base Price of $1,100. As speculators and industrial buyers moved to cover their rhodium requirements, mindful of the ongoing disruption to South African mining, the price gained $300 over three days, briefly spiking at a five month high of $1,400 on the 18th of September 2012. At this level, investors liquidated speculative holdings and the price dropped almost as quickly as it had risen, coming to rest at $1,100 once again.
Prepared by Minxcon (Pty) Ltd
H-40
| | |
| CIMVal Compliant Report on the Ga-Phasha East Project, South Africa | | H-41 |
Figure 15: Rhodium Price Monthly Historic
The valuation of Ga-Phasha East was determined considering the following:
The valuator considered the market approach and historical cost approach as suitable methods to determine a range of values but also considered a preliminary assessment completed by Amplats. Information was used to complete a Discounted Cash flow.
This study on the Paschaskraal and De Kamp farms based on the pre-feasibility study completed in 2007, hence modifying factors and assumptions that are normally applied has been factored in, in detail.
The valuator deemed it necessary to consider this preliminary assessment in this Valuation Report due to the high barriers of entry of the industry (costs associated with the construction of a plant and payability), the limitation of strike length of this specific ore body relative to its down dip extension which is not always fully reflected in a market comparative.
14.6.1.1 Adjustment for Economic Parameters and Pricing
The transactions used to construct the valuation curve for this Valuation Report occurred at a specific point in time and, therefore, at a specific USD denominated PGM+Au price. In order to report historic transactions in today’s terms and compare all transactions on the same economic level, economic parameters were determined for each historic transaction at the time it took place. Historic transaction prices were then adjusted to current day terms by determining the difference in value from the time of these historic transactions to the current day parameters.
Subsequent to the normalisation of each transaction to a current cash value, Minxcon plotted the values of historical transactions, which took place on an arm’s length basis, in relation to their specific stage of Resource classification. This methodology, when applied to exploration and Resource transactions, provides guidance in terms of a range of transaction values for the mineral asset or project being analysed and valuated.
Prepared by Minxcon (Pty) Ltd
H-41
| | |
| CIMVal Compliant Report on the Ga-Phasha East Project, South Africa | | H-42 |
Figure 16: Platinum Valuation Curve
The normalisation of each transaction (USD/oz) to a current value was done by comparing the rand denominated commodity prices at the historic transaction date with the average price for the three months preceding the effective date of this Valuation Report, together with the twelve-month forecast, to make a linear adjustment of the historic transaction price (USD/oz) and calculate an appropriate transaction price level (USD/oz) as at the base date of this Valuation Report.
Table 12 : Economic Parameters Used in the Valuation Approach
| | | | | | | | | | | | | | | | | | |
| ZAR/USD | | | Platinum | | | Palladium | | | Rhodium | | | Gold | |
| | 8.46 | | | | 1600 | | | | 682 | | | | 1810 | | | | 1679 | |
This principle is used to reflect the current market expectation that is likely to drive the calculated market value. Although the Platreef has a higher nickel and copper content than both the Merensky Reef and UG2 Reef, the base metals have not been seen as principal drivers of project value in the past and hence have not been included.
14.6.1.2 Valuation Parameters
The valuation curve explained above shows a wide range of values. To determine the specific value for a project, a CIMVAL derived matrix is used for determining mining project risk, weighting different criteria such as depth, geology, mining process and legal tenure. Minxcon adopted this matrix, and modified classification and ratings to suit parameters that are sensitive to this commodity. Minxcon also incorporated an additional category, namely the social and environmental factor. Values applicable to the global platinum industry were applied and used to determine a project risk index that relates the value for Ga-Phasha East to that of the PGM industry. These parameters were used to determine a risk associated index for a project relative to that of the platinum industry:-
Prepared by Minxcon (Pty) Ltd
H-42
| | |
| CIMVal Compliant Report on the Ga-Phasha East Project, South Africa | | H-43 |
Table 13: Valuation Risk Associated Parameter Matrix - Platinum Industry Standards
| | | | | | | | | | | | |
Principal Project Risk | | Description | | Index | | Description | | Index | | Description | | Index |
| Depth | | <200 m | | 10 | | >200 to 1,500 m | | 6 | | >1,500 m | | 2 |
| Scale of Project (Resource) | | >5 Moz. | | 10 | | >2 Moz. to 5 Moz. | | 6 | | <2 Moz. | | 2 |
| Mining/Process Method | | Open Pit | | 10 | | Mechanised | | 6 | | Underground | | 2 |
| Infrastructure | | Mining and Plant | | 10 | | Mining | | 6 | | Nothing | | 2 |
| Data Quality | | Well Understood | | 6 | | Neutral | | 4 | | Poorly understood | | 2 |
| Title/Ownership | | Corporate Structure | | 6 | | Mining Right | | 4 | | Exploration Right | | 2 |
| Geological Complexity | | Minor Faulting | | 6 | | Faulting | | 4 | | Major Faulting | | 2 |
| Deposit Type | | Western Bushveld | | 6 | | Eastern Bushveld/Platreef | | 4 | | Other | | 2 |
| Stage of Development | | Operating | | 3 | | Feasibility | | 2 | | Pre-feasibility, Compliant Resource or < | | 1 |
| Strategic | | Important - Premium | | 3 | | Neutral | | 2 | | Discount | | 1 |
| Ability to Increase Resource | | High | | 3 | | Medium | | 2 | | Low | | 1 |
| Social and Environmental | | Corporate with Social & Labour Plan | | 3 | | Social & Labour Plan | | 2 | | No Social & Labour Plan | | 1 |
14.6.1.3 Methodology
The methodology was as follows:-
| | • | | The specific Ga-Phasha East criteria (Table 14) were measured against the risk associated parameters in Table 13, therefore allocating either a discount or a premium for each item line. The sum of all the item lines is then compared to the average index and this is then used to move the USD/oz for the project up or down in each Resource category. |
| | • | | The index was developed in such a way that a project that attracts a significant discount or premium will plot at either the lower or higher end of the value scale in each category. |
| | • | | Subsequently, an adjusted valuation curve was defined for Ga-Phasha East. |
| 14.6.2 | Principal Risk Parameters |
Table 14: Principal Risk - Ga-Phasha
| | |
Modifying Factors | | Comment |
| Depth | | Both the Merensky and UG2 Reefs outcrop on the property and extend to below 2,400 m. Reef areas which occur below 2,400 m have been removed from the Mineral Resource classification as the virgin rock temperature at these depths is above 75°C. Ventilation and mining technology and related costs currently prevent mining operations at these temperatures. |
| |
| Scale of Project (Resource) | | Significant ounces (29.55 Moz of UG2 and 20.23 Moz of MR) exist on the property. |
| |
| Potential Mining Method | | The UG2 has limited exposure along the hills located along the north-eastern boundary of the Ga-Phasha East Project Area. Initial access to the ore body is through declines. The area has a strike length of approximately 7 km, limiting access to one decline, and an estimated build-up to 125,000 tpm. |
| |
| Infrastructure | | No infrastructure currently exists on the property, but power lines cross the property. |
| |
| Data Quality | | Extensive exploration (which includes surface drill holes, aeromagnetic surveys and surface geological mapping) was done. |
| |
| Title/Ownership | | Atlatsa is currently in possession of converted mining rights in terms of Item 7 of the Mineral and Petroleum Resources Development Act No. 28 of 2002. |
| |
| Geological Complexity | | Based on existing Merensky workings, minor faulting is expected to occur, consisting of dextral and sinistral strike-slip faults, normal and reverse dip-slip faults, as well as faults of both components. Displacements have generally been, and are expected to be, less than 1 m in the Ga-Phasha Project Area. |
Prepared by Minxcon (Pty) Ltd
H-43
| | |
| CIMVal Compliant Report on the Ga-Phasha East Project, South Africa | | H-44 |
| | |
Modifying Factors | | Comment |
| | Dykes in this area are composed of primarily dolerite, which are generally fine-grained and are of good competence, with associated areas of dense jointing and alteration. An airborne magnetic survey has successfully identified several swarms of northeast striking dolerite dykes. No serious problems were encountered during mining through these features, and no significant displacements were noted to be associated with them at Bokoni Mine. The estimated geological loss associated with dykes across the property is 4%. A regional pothole has been discovered in the Klipfontein area which has been divided into two components, a ‘destructive pothole area’ where no recognisable Merensky Reef is preserved and a ‘non-destructive pothole area’ where the Merensky Reef is partially preserved. Historically, potholes account for approximately 15% geological loss for both the Merensky Reef and UG2 Reef in the adjoining Bokoni mining operations. |
| |
| Deposit type | | The platiniferous horizons of interest in the Project Area are the Merensky and the UG2 Reefs located in lithologies of the Critical Zone of the Rustenburg Layered Suite with the main focus on the UG2. |
| |
| Stage of development | | Exploration project. |
| |
| Strategic | | Not strategic. |
| |
| Ability to increase Mineral Resource | | Extensive exploration has delineated and defined the ore body. |
| |
| Political, Social & Environmental | | Political stability – medium risk; social – minor risk; in mountainous area. |
14.6.2.1 Value Based on Market Approach
After applying the risk factor described above, an estimated value was calculated using the unit value. A sample of values of PGM transactions was taken from the larger population of historical transactions. The lower 25% and upper 75% extreme values were eliminated to establish a value range for the properties within the 25th and 75th quarter percentiles. The unit values for the noted comparable PGE properties range between US$2.26/oz and US$12.27/oz. An upper and lower in situ value has been calculated using total Resource values, as outlined in Table 15.
Table 15: Mineral Asset Valuation for Ga-Phasha East Based on Comparative Analysis
| | | | | | | | | | | | | | | | | | | | | | | | | | | | | | | | |
Area | | Category | | Reef | | Total
‘000oz | | | Lower
Price
USD/oz | | | Estimated
Value
USD/oz | | | Upper Price
USD/oz | | | Lower
Value USD
‘000 | | | Estimated
Value USD
‘000 | | | Upper
Value USD
‘000 | |
Paschaskraal | | Measured | | UG2 | | | 4,904 | | | $ | 7.65 | | | $ | 20.19 | | | $ | 36.84 | | | | 317,190 | | | | 836,992 | | | | 1,527,554 | |
Paschaskraal | | Indicated | | UG2 | | | 5,097 | | | $ | 5.24 | | | $ | 13.49 | | | $ | 33.51 | | | | 225,700 | | | | 581,348 | | | | 1,444,253 | |
Paschaskraal | | Inferred | | UG2 | | | 6,579 | | | $ | 0.63 | | | $ | 4.28 | | | $ | 4.61 | | | | 35,060 | | | | 238,295 | | | | 256,373 | |
De Kamp | | Inferred | | UG2 | | | 5,932 | | | $ | 0.35 | | | $ | 2.39 | | | $ | 2.57 | | | | 17,458 | | | | 119,918 | | | | 129,076 | |
| | | | | | | | | | | | | | | | | | | | | | | | | | | | | | | | |
Subtotal | | | | | | | 22,511 | | | $ | 3.13 | | | $ | 9.33 | | | $ | 17.64 | | | | 595,408 | | | | 1,776,552 | | | | 3,357,255 | |
| | | | | | | | | | | | | | | | | | | | | | | | | | | | | | | | |
Paschaskraal | | Measured | | MR | | | 1,631 | | | $ | 5.15 | | | $ | 14.36 | | | $ | 24.80 | | | | 70,998 | | | | 187,445 | | | | 341,970 | |
Paschaskraal | | Indicated | | MR | | | 3,591 | | | $ | 3.46 | | | $ | 9.33 | | | $ | 15.58 | | | | 105,151 | | | | 270,153 | | | | 473,042 | |
Paschaskraal | | Inferred | | MR | | | 4,162 | | | $ | 0.39 | | | $ | 2.50 | | | $ | 1.83 | | | | 13,778 | | | | 94,662 | | | | 64,299 | |
De Kamp | | Inferred | | MR | | | 10,853 | | | $ | 0.35 | | | $ | 2.39 | | | $ | 2.15 | | | | 32,361 | | | | 219,408 | | | | 197,402 | |
| | | | | | | | | | | | | | | | | | | | | | | | | | | | | | | | |
Subtotal | | | | | | | 20,237 | | | $ | 1.17 | | | $ | 4.05 | | | $ | 5.66 | | | | 222,288 | | | | 771,668 | | | | 1,076,713 | |
| | | | | | | | | | | | | | | | | | | | | | | | | | | | | | | | |
Total | | | | | | | 42,748 | | | $ | 2.26 | | | $ | 7.05 | | | $ | 12.27 | | | | 817,696 | | | | 2,548,220 | | | | 4,433,968 | |
| | | | | | | | | | | | | | | | | | | | | | | | | | | | | | | | |
The reason for the wide range is the unique key factors of each project. This includes geology, mineralisation, potential operating costs, stage of exploration, the availability of infrastructure and peripheral issues such as social, political and environmental aspects. A comparison of transactions in the region of the Eastern Limb was also done.
Table 16: Transactions of Similar Nature
| | | | | | | | | | | | | | | | |
Buyer | | Seller | | Company/Farm | | USD (million) | | | Target Ounces
Effective
Interest - Moz | | | USD/oz | |
Lonmin | | SouthPlats | | Messina | | USD | 190.00 | | | | 0.88 | | | | 13.90 | |
Mvela | | Amplats/Northam | | Booysendal Platinum | | USD | 223.46 | | | | 51.72 | | | | 4.32 | |
Prepared by Minxcon (Pty) Ltd
H-44
| | |
| CIMVal Compliant Report on the Ga-Phasha East Project, South Africa | | H-45 |
| | | | | | | | | | | | | | | | |
Buyer | | Seller | | Company/Farm | | USD (million) | | | Target Ounces
Effective
Interest - Moz | | | USD/oz | |
Mvela | | Khumama | | Booysendal Platinum | | USD | 335.20 | | | | 51.72 | | | | 6.48 | |
Atlatsa | | Amplats | | Lebowa Platinum Mines | | USD | 363.13 | | | | 48.95 | | | | 7.42 | |
Jubilee>Tjate Increase stake from 48.72 to 58.53% | | Tjate | | Increase stake from 48.72 to 58.53% | | USD | 6.17 | | | | 6.45 | | | | 0.96 | |
The historical cost or appraised method is based on costs to improve the value of the project. Exploration costs during 2011 were ZAR1.127 million. Total pre-2011 exploration costs are ZAR47.718 million.
Table 17: Historic Exploration Costs Associated with the Ga-Phasha Project (ZAR)
| | | | | | | | |
Ga-Phasha | | FY2011 | | | FY2008 and Older | |
Exploration cost as per income statement | | | 1,127,259 | | | | — | |
Historical exploration cost | | | — | | | | 47,718,934 | |
Note: Cost includes exploration done by Amplats and Atlatsa.
In order to calculate the value based on historical cost, a prospectivity enhancement multiplier (“PEM”) factor is applied to the total exploration cost, the magnitude of which is determined by the level of sophistication of the exploration for which positive exploration results have been obtained and the prospectivity of the project. It is normally accepted that an asset’s value is correlated to the money spent on its acquisition. However, potential prospectivity of the project is not necessarily positively correlated to the increased level of exploration. The level of prospectivity has to be considered in the equation. Minxcon calculates the PEM by first determining the phase of exploration (Minxcon developed this index from its experience in the exploration and consulting field). An index value specific to the phase of exploration is multiplied by the level of prospectivity. This prospectivity level is derived from the opinion of the company geologist who is interviewed and helps to formulise the estimation of the PEM factor.
Prepared by Minxcon (Pty) Ltd
H-45
| | |
| CIMVal Compliant Report on the Ga-Phasha East Project, South Africa | | H-46 |
Figure 17: Distribution of Drill Holes Drilled in the Ga-Phasha Project Area
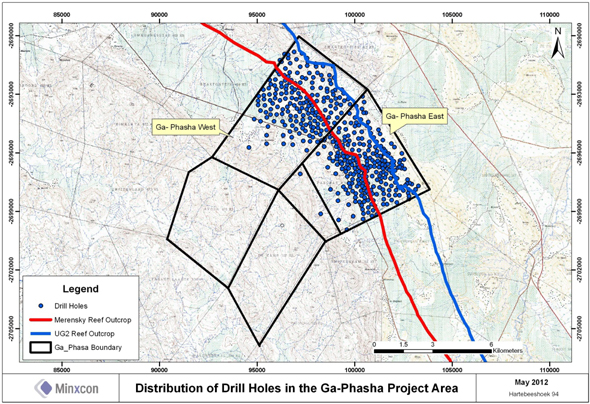
Total cost since inception in current day money terms was calculated at ZAR66.139 million after applying a cost inflation factor of 8%.
Table 18: Ga-Phasha Value Based on Historical Cost
| | | | | | | | | | | | | | | | | | | | |
Phase Description | | PEM
(Low) | | | PEM
(High) | | | Historical Cost
(ZAR ‘000) | | | Low Value
(ZAR‘000) | | | High Value
(ZAR‘000) | |
Classification of Measured Resources –TOTAL Ga-Phasha | | | 10.92 | | | | 11.22 | | | R | 66,139 | | | R | 722,233 | | | R | 742,074 | |
Classification of Measured Resources –Ga-Phasha EAST | | | 10.92 | | | | 11.22 | | | R | 33,069 | | | R | 361,111 | | | R | 371,032 | |
The historical costs supplied were for the total Ga-Phasha Project area. It was therefore necessary to proportionally (allocated -50%- according to ounces in Paschaskraal and De Kamp relative to the total Ga-Phasha Project area) allocate cost. This halved the value.
| 14.8 | PRELIMINARY ASSESSMENT DCF |
| 14.8.1 | Basis of Valuation of the Mining Assets |
In generating the financial model and deriving the valuations, the following was considered:
| | • | | This report details the optimised cash flow model with consensus economic input parameters. |
| | • | | A hurdle rate of 16.42% (in nominal terms) was assumed for the discount factor. |
| | • | | The impact of the Mineral Royalties Act using the formula for refined metals. |
| | • | | Sensitivity analyses were performed to ascertain the impact of discount factors, commodity prices, total working costs and capital expenditures. |
Prepared by Minxcon (Pty) Ltd
H-46
| | |
| CIMVal Compliant Report on the Ga-Phasha East Project, South Africa | | H-47 |
| | • | | No salvage value was included for plant and equipment on cessation of operations. |
| | • | | Valuation of the tax entity was performed on a stand-alone basis. |
| | • | | The full value of the operation was reported - no attributable value was calculated. |
| | • | | The study envisioned an underground mine based on UG2 very similar to that being developed on the neighbouring Twickenham farm, namely down dip semi-mechanised reef mining and access by twin shaft declines. Ore from Paschaskraal was to be treated at the neighbouring Twickenham concentrator. |
The capital asset pricing model (“CAPM”) was used to calculate the discount rate.
Table 19: Discount Rate
| | | | |
Cost of Equity | | | |
Risk-free rate | | | 8.39 | % |
Risk premium of market | | | 5.0 | % |
Base beta (Project Premium) | | | 1.61 | |
Cost of equity (CAPM) | | | 16.42 | % |
| 14.8.3 | Discounted Cash Flow Analysis |
Minxcon’s in-house DCF model was employed to illustrate the net present value (“NPV”) for the Project in real terms and nominal terms. The NPV was derived from post royalties and tax, pre-debt real cash flows, using the techno-economic parameters, commodity price and macro-economic projections. To accommodate taxation and unredeemed Capex, a nominal financial model was populated and the final free cash flow was de-escalated to real terms prior to discounting.
A Monte Carlo analysis was run on the DCF. The Monte Carlo analysis is a useful tool to estimate the impact of various parameters on the value of a project and to account for risk. Percentage variations for parameters, identified as sensitive to fluctuations, are simulated to provide a range of NPV values.
The Monte Carlo analysis is only useful if inputs and assumptions are reasonable, and the level of study is clearly defined. The outcome is helpful in the understanding the project value, profitability and its sensitivities. The inputs considered for the Monte Carlo simulation are:-
Table 20: Monte Carlo Inputs
| | | | | | | | | | |
| | | Model Parameters | | Min | | | Max | |
Commodity Price (Basket Price USD/oz Pt) | | 3,167 | | | 3,009 | | | | 3,326 | |
Exchange Rate (ZAR/USD) | | 8.58 | | | 8.15 | | | | 9.01 | |
Head Grade (g.t) | | 5.31 | | | 5.05 | | | | 5.58 | |
Variable Cost (ZAR R/t) | | 782 | | | 743 | | | | 822 | |
Mining Capex (ZARm) | | 3,922 | | | 3,727 | | | | 4,119 | |
Plant Capex (ZARm) | | 1,101 | | | 1,047 | | | | 1,157 | |
From the sensitivity analysis and the Monte Carlo Simulation it is evident that the NPV could fluctuate significantly with any changes in the economic parameters. The simulation below illustrates two scenarios, when there is a variance in either the technical inputs or economic inputs and final combined.
Prepared by Minxcon (Pty) Ltd
H-47
| | |
| CIMVal Compliant Report on the Ga-Phasha East Project, South Africa | | H-48 |
Figure 18: Monte Carlo Simulation
| | | | | | | | | | | | |
Quartiles | | Technical Variance | | | Economic Variance | | | Combined Variance | |
| | | ZAR (’000) | |
Min: | | | 337.83 | | | | - 314.72 | | | | - 440.87 | |
Q(0.25): | | | 530.09 | | | | 482.86 | | | | 429.05 | |
Median: | | | 641.86 | | | | 637.66 | | | | 635.89 | |
Q(0.75): | | | 749.83 | | | | 792.76 | | | | 837.52 | |
Max: | | | 945.14 | | | | 1,636.86 | | | | 1,856.42 | |
A range of values for the various parameters was compiled to establish a value range for the minimum and maximum. The lower 25 % and upper 25 % extreme values were eliminated, giving values within the 25th and 75th quarter percentiles selected of ZAR429 million to ZAR837 million.
Figure 19: Monte Carlo Analysis
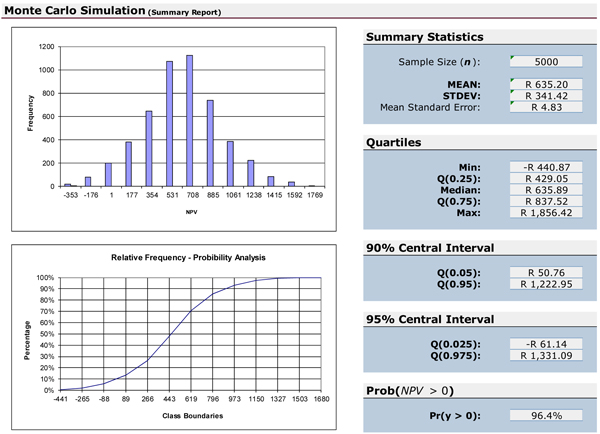
| 14.8.4 | Sensitivity Analysis |
Based on the real cash flows calculated in the financial model, Minxcon reported a DCF valuation and performed single-parameter sensitivity analyses to ascertain the impact on the NPV. The metal prices and exchange rates have the biggest impact. Albeit that there is a large capital expenditure amount upfront, the impact thereof over the LOM is insignificant with a minor impact on the NPV.
Prepared by Minxcon (Pty) Ltd
H-48
| | |
| CIMVal Compliant Report on the Ga-Phasha East Project, South Africa | | H-49 |
Figure 20: Sensitivity Analysis
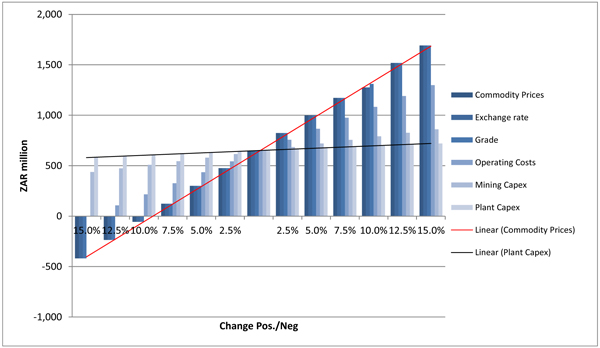
The values that were derived for Ga-Phasha East after applying three valuation methods to the Resource are set out in the table below:
Table 21: Value Range for Ga-Phasha East Project
| | | | |
Valuation Method | | Indicated Values for Ga-Phasha East | |
Comparative (UG2) | | | ZAR595 million to ZAR1,776 million | |
Comparative (MR) | | | ZAR222 million to ZAR771 million | |
Historical Cost1 | | | ZAR361million to ZAR371 million | |
Discounted Cash Flow (UG2)2 | | | ZAR429 million to ZAR837 million | |
Notes:
| 1. | Includes Amplats and Atlatsa exploration costs. |
| 2. | Includes the Amplats-Twickenham synergies. |
| | • | | Owing to the short strike length, access to the ore body is restricted to one decline. |
| | • | | Historical cost and comparative valuations were treated as if on a standalone basis. However, these values do not fully reflect the impact of synergy/non-synergy. Considering the shape of the lease area, the value of Ga-Phasha was further discounted and valued at the lower end of comparative value range. |
| | • | | Considering the exploration history, Minxcon has lower confidence in the exploration expenditure provided. All the exploration expenditure could not be sourced. This includes the expenditure incurred by Anglovaal and JCI, albeit small in relation to Amplats and Atlatsa. |
| | • | | A feasibility study was completed by Amplats in 2007, and the detailed Preliminary Assessment study is an update based on that pre-feasibility study. The valuator believes that it is important to show the DCF because it illustrates the impact of high capital associated with a short strike length therefore extending payback and reducing NPV. |
Prepared by Minxcon (Pty) Ltd
H-49
| | |
| CIMVal Compliant Report on the Ga-Phasha East Project, South Africa | | H-50 |
| | • | | In the DCF calculation, mining in the first 30 years will be focused on the UG2; hence, the value impact of the Merensky Reef is limited due to the time value of money. However, it is the opinion of the valuator that value should be considered for the Merensky, albeit at the lower end of the valuation curve. |
| | • | | Mining at Twickenham is focused on the UG2 only. This should also be considered when valuing the Project as a standalone. Building a new plant for Ga-Phasha East will require significantly higher capital expenditure. |
| | • | | On a standalone basis, assuming the Ga-Phasha Area is bought by a third party, the DCF value reflects a significantly lower value. This takes into account a lower payability (assuming that concentrate metal content will be sold at approximately 85% of metal prices) and higher capital expenditure. |
A lower and upper valuation range for the UG2 was established at between ZAR520 million and ZAR700 million. Although Merensky Reef will not be mined in the near future due to plant capacity constraints, Minxcon is of the opinion that the Resource does have value in the hands of Amplats. A value of ZAR220 million which is at the lower end of the market approach for the Merensky Reef (the Merensky Reef will likely be mined much later - hence time value of money should be considered), was placed on the Merensky Reef Resource. Minxcon is therefore of the opinion that a valuation of ZAR740 to ZAR950 million represents a total value for the Ga-Phasha East mineral assets.
In arriving at our calculation, amongst other things, Minxcon relied upon and considered the following sources of information:
| | 1. | Technical Report prepared by ExplorMine Consultants- Technical Report - The Mineral Resource Estimate For The Merensky And Ug2 Reefs For The Ga-Phasha Project Area, Limpopo Province, Republic Of South Africa; 30 March 2012 |
| | 2. | Competent Persons Report prepared by ExplorMine Consultants and submitted to the JSE- Technical Report - The Mineral Resource Estimate For The Merensky And Ug2 Reefs For The Ga-Phasha Project Area, Limpopo Province, Republic Of South Africa; 15 October 2012 |
| | 3. | Atlatsa financial reports; |
| | 4. | Various media publications; and |
| | 6. | Extract from an article published in the international Journal of Energy & Natural Resources Law by Peter Leon a partner and Head of Africa Mining & Energy Projects at Webber Wentzel, Johannesburg, South Africa. |
| | 7. | Amplats Preliminary Assessment Financial DCF models on Ga-Phasha (Paschaskraal and De Kamp farms). |
| 17 | CERTIFICATE OF QUALIFICATIONS |
The author of this Valuation Report is a member in good standing of appropriate professional institutions. The qualifications and professional registrations of the Qualified Person and Qualified Valuators who contributed to this evaluation are provided at the end of this Valuation Report. The following person made contributions to this Valuation Report and is a Competent Person, as defined in SAMREC and SAMVAL, a Qualified Person and a Qualified Valuator as defined in CIMVAL, and a Qualified Person as defined in NI 43-101:-
Johan Odendaal (Director, Minxcon): B.Sc. (Geol.), B.Sc. (Hons) (Min. Econ.), M.Sc. (Min. Eng.), Pr. Sci. Nat. 400024/04, FSAIMM, MGSSA, MAusIMM:
Johan has 25 years’ experience in the mining and financial industry. This includes 8 years as an independent mining consultant specialising in the valuation of mining projects and 12 years as a mining analyst at two major stockbroking firms. During this time, he was rated one of the top platinum and gold mining analysts and became a globally recognised industry specialist.
Prepared by Minxcon (Pty) Ltd
H-50
| | |
| CIMVal Compliant Report on the Ga-Phasha East Project, South Africa | | H-51 |
CERTIFICATE of QUALIFIED VALUATOR AND QUALIFIED PERSON - NJ Odendaal
I, Johan Odendaal, do hereby certify that:-
| | 1. | I am a director of Minxcon (Pty) Ltd |
Suite 5, Coldstream Office Park,
Cnr. Hendrik Potgieter and Van Staden Roads,
Little Falls, Johannesburg, South Africa
| | 2. | I graduated with a B.Sc. (Geology) degree from the Rand Afrikaans University in 1985. In addition, I obtained a B.Sc. Hons (Mineral Economics) from the Rand Afrikaans University in 1986 and a M.Sc. Min. Eng. from the University of the Witwatersrand in 1992. |
| | 3. | I am a member/fellow of the following professional associations, which meet all the attributes of a Professional Association or a Self-Regulatory Professional Association, as applicable (as those terms are defined in CIMVAL):- |
| | | | |
Class | | Professional Society | | Year of
Registration |
| Member | | Geological Society of South Africa (MGSSA No. 965119) | | 2003 |
| Fellow | | South African Institute of Mining and Metallurgy (FSAIMM Reg. No. 702615) | | 2003 |
| Member | | Australasian Institute of Mining and Metallurgy (MAusIMM Reg. No. 220813) | | 2003 |
| Member | | South African Council for Natural Scientific Professions (Pr. Sci. Nat. Reg. No. 400024/04) | | 2003 |
| | 4. | I have worked as a Geoscientist for a total of 25 years since my graduation from university. As a former employee of Merrill Lynch, I was actively involved in advising mining companies and investment bankers on corporate related issues, analysing platinum and gold companies. I have completed a number of valuations on various commodities, including platinum, using the valuation approaches described by SAMVAL and CIMVAL. |
| | 5. | I am a Qualified Valuator and a Qualified Person (as those terms are defined in CIMVAL) for the purposes of the valuation and the Valuation Report. |
| | 6. | To the best of my knowledge, information and belief, this Valuation Report contains all scientific and technical information required to be disclosed to make the Valuation Report not misleading. |
| | 7. | The facts presented in this Valuation Report are correct to the best of my knowledge. |
| | 8. | The analyses and conclusions are limited only by the reported forecasts and conditions. |
| | 9. | I have no present or prospective interest or involvement in the subject property or asset. |
| | 10. | My compensation, employment or contractual relationship with the Commissioning Entity is not contingent on any aspect of this Valuation Report. |
| | 11. | I have no bias with respect to the assets that are the subject of this report, or to the parties involved with the assignment. |
| | 12. | I was responsible for this Valuation Report. |
| | 13. | I have read this Valuation Report and CIMVAL and this Valuation Report has been prepared in compliance with CIMVAL. |
| | 14. | I made a personal inspection of the properties on 4 April 2012. |
|
| Yours faithfully, |
|

|
| NJ ODENDAAL |
| B.Sc. (Geol.), B.Sc. Hons. (Min. Econ.), M.Sc. (Min. Eng.) |
| Pr. Sci. Nat., FSAIMM, MGSSA, MAusIMM |
| DIRECTOR |
Prepared by Minxcon (Pty) Ltd
H-51
| | |
| CIMVal Compliant Report on the Ga-Phasha East Project, South Africa | | H-52 |
| | |
Term | | Definition |
| Amsl | | Above mean sea level |
| |
| Archaean | | A period of time between 4,000Ma and 2,500Ma. |
| |
| Assay | | Process to determine the proportions of metal in an ore. |
| |
| Assay laboratory | | A facility in which the proportions of metal in ores or concentrates are determined using analytical techniques. |
| |
| Bearing | | Strike |
| |
| Black Economic Empowerment (“BEE”) Company | | The following recommendations have been made to the South African government by the Black Economic Empowerment Commission regarding the definitions of different levels of company ownership by Black people that qualify for BEE status: A ‘Black company’ is one that is 50.1% owned and managed by Black people; A ‘Black empowerment company’ is one that is at least 25.1% owned and managed by Black people; and A ‘Black influenced company’ is one that is 5% -25% owned and managed by Black people. |
| |
| Competent Person | | The SAMREC Code defines a Competent Person as a person who is registered with any one of SACNASP, ECSA, PLATO or any other statutory South African or international body that is recognised by SAMREC. A Competent Person should have a minimum of five years’ experience relevant to the style of mineralisation and type of deposit under consideration and to the activity, which that person is undertaking. |
| |
| Core | | A cylindrical shaped sample of ore, derived by drilling with a hollow cylinder for the purpose of obtaining geological information. |
| |
| Diamond Drilling | | A drilling method, where the rock is cut with a diamond bit, usually to extract cores. |
| |
| Dilution | | Waste which is mixed with ore in the mining process. |
| |
| Dip | | The angle that a structural surface, i.e. a bedding or fault plane, makes with the horizontal measured perpendicular to the strike of the structure. |
| |
| Exchange Rate | | The rate at which one currency will be converted to another. |
| |
| Exploration | | Prospecting, sampling, mapping, diamond drilling and other work involved in the search for mineralisation. |
| |
| Facies | | The features that characterise a sediment as having been deposited in a particular depositional environment. |
| |
| Fault | | A fracture in earth materials, along which the opposite sides have been relatively displaced parallel to the plane of movement. |
| |
| Faulting | | The process of fracturing that produces a displacement. |
| |
| Grade | | The quantity of metal per unit mass of ore expressed as a percentage or, for gold, as grams per tonne of ore. |
| |
| Lithology | | The general compositional characteristics of sedimentary rocks. |
| |
| Logging | | Method of obtaining a continuous record of the lithology, stratigraphy and structure of the core obtained from a diamond-drill hole. |
| |
| Measured Resource | | That part of a Mineral Resource for which tonnage, densities, shape, physical characteristics, grade and mineral content can be estimated with a high level of confidence. It is based on detailed and reliable exploration, sampling and testing information gathered through appropriate techniques from locations such as outcrops, trenches, pits, workings and drill holes. The locations are spaced closely enough to confirm geological and grade continuity (SAMREC definition). |
| |
| Mineable | | That portion of a Resource for which extraction is technically and economically feasible. |
| |
| Mineral Reserve | | The economically mineable material derived from a Measured and/or Indicated mineral Resource. It is inclusive of diluting materials and allows for losses that may occur when the material is mined. Appropriate assessments, which may include feasibility studies, have been carried out, including consideration of, and modification by, realistically assumed mining, metallurgical, economic, marketing, legal, environmental, social and governmental factors. These assessments demonstrate at the time of reporting that extraction is reasonably justified. Mineral Reserves are sub-divided in order of increasing confidence into Probable Mineral Reserves and Proved Mineral Reserves (SAMREC definition). |
| |
| Mineral Resource | | A concentration (or occurrence) of material of economic interest in or on the earth’s crust in such form, quality and quantity that there are reasonable and realistic prospects for eventual economic extraction. The location, quantity, grade, continuity |
Prepared by Minxcon (Pty) Ltd
H-52
| | |
| CIMVal Compliant Report on the Ga-Phasha East Project, South Africa | | H-53 |
| | |
Term | | Definition |
| | and other geological characteristics of a mineral resource are known, estimated from specific geological evidence and knowledge, or interpreted from a well-constrained and portrayed geological model. Mineral Resources are subdivided, in order of increasing confidence in respect of geoscientific evidence, into Inferred, Indicated and Measured categories (SAMREC definition). |
| |
| Mineralisation | | The presence of a target mineral in a mass of host rock. |
| |
| Mineralised Area | | Any mass of host rock in which minerals of potential commercial value occur. |
| |
| Outcrop | | The area over which a particular rock unit occurs at the Earth’s surface. |
| |
| Production | | The day-to-day activities directed to obtaining saleable product from the mineral resource on a commercial scale. It includes extraction and other processing prior to sale. |
| |
| Royalty | | A payment made for a concession of commercial value. |
| |
| Sampling | | Taking small pieces of rock at intervals along exposed mineralisation for assay (to determine the mineral content). |
| |
| SAMREC Code | | The South African Code for the reporting of Exploration Results, Mineral Resources and Mineral Reserves. |
| |
| Specific Gravity | | The ratio of the weight of a given volume of a substance to the weight of an equal volume of water. (Also referred to as relative density) |
| |
| Stratigraphic | | A term describing the chronological sequence in which bedded rocks occur that can usually be correlated between different localities. |
| |
| Strike | | The direction taken by a structural surface such as a fault or bedding plane as it intersects the horizontal. |
| |
| Subcrop | | A sub-surface outcrop. |
| |
| Tabular | | Having two dimensions much greater than the third. |
| |
| Tonnage | | Quantities where the tonne is an appropriate unit of measure. Typically used to measure reserves of gold-bearing material in situ or quantities of ore and waste material mined, transported or milled. |
| |
| Unconformity | | A surface within a package of sedimentary rocks which may be parallel to or at an angle with overlying or underlying rocks, and which represents a period of erosion or non-deposition, or both. |
Prepared by Minxcon (Pty) Ltd
H-53
| | |
| CIMVal Compliant Report on the Ga-Phasha East Project, South Africa | | H-54 |
| | |
Abbreviation | | Definition |
| ~ | | Approximately |
| 3E | | Pt + Pd + Rh |
| 3PGE+Au | | Pt + Pd + Rh + Au |
| 4E | | Pt + Pd + Rh + Au |
| 6E | | Pt + Pd + Rh + Os + Ir + Au |
| Amsl | | Above mean sea level |
| Au | | Gold |
| BEE | | Black Economic Empowerment |
| BIC | | Bushveld Igneous Complex |
| BRQF | | Black Reef Quartzite Formation |
| CAPM | | Capital Asset Pricing Model |
| CEO | | Chief Executive Officer |
| CFO | | Chief Financial Officer |
| COO | | Chief Operating Officer |
| CPIX | | Consumer Price Index excluding the effects of mortgage rate changes |
| CPR | | Competent Persons Report |
| DCF | | Discounted Cash Flow |
| DMR | | Department of Mineral Resources |
| GDP | | Gross Domestic Product |
| Ir | | Iridium |
| JSE | | Johannesburg Stock Exchange |
| MPRDA | | Mineral and Petroleum Resources Development Act |
| MR | | Merensky Reef |
| MR | | Mining Right |
| NPV | | Net Present Value |
| Os | | Osmium |
| Pd | | Palladium |
| PGE | | Platinum Group Elements |
| PR | | Prospecting Right |
| Pr. Sci. Nat | | Practicing Natural Scientist |
| Pt | | Platinum |
| Ptn | | Portion |
| PV | | Present Value |
| RBR | | Royal Bafokeng Resources Platinum (Pty) Limited |
| Re | | Ruthenium |
| Re | | Remaining Extent |
| RD | | Relative Density |
| Rh | | Rhodium |
| RLS | | Rustenburg Layered Suite |
| S&LP | | Social and Labour Plan |
| SAMREC | | The South African Code for the Reporting of Mineral Resources and Mineral Reserves |
| SAMVAL | | The South African Code for the Valuation of Mineral Assets |
| SHE | | Safety, Health and the Environment |
| VAT | | Value Added Tax |
Prepared by Minxcon (Pty) Ltd
H-54
| | |
| CIMVal Compliant Report on the Ga-Phasha East Project, South Africa | | H-55 |
| | |
Unit | | Definition |
| ° | | Degree |
| % | | Percentage |
| cm | | Centimetre |
| g | | Grams |
| g/t | | Grams per tonne |
| Ha | | Hectare |
| kg | | Kilogram |
| km | | Kilometre |
| Ma | | One million years |
| M | | Million |
| m | | Metre |
| mbs | | Metres below surface |
| oz. | | ounce |
| t | | Tonne |
| USD | | United States Dollar |
| USD/oz. | | United States Dollar per ounce |
| USD/t | | United States Dollar per tonne |
| ZAR | | South African Rand |
| ZAR/t | | Rands per tonne |
Prepared by Minxcon (Pty) Ltd
H-55
| | |
| CIMVal Compliant Report on the Ga-Phasha East Project, South Africa | | H-56 |
APPENDIX 2: Ga-Phasha Discounted Cash Flow (Real Terms)

| | |
| Project Title: | | Ga-Pasha |
| Client: | | Anooraq Resource Corporation |
| Project Code: | | M12-007 |
| | | | | | | | | | | | | | | | | | |
Project Valuation Schedule | | | | | | | | | | | | | | | |
Project Valuation Date (Base Date) | | | 01-Jan-12 | | | | | Commodity Price | | | 100 | % | | Fixed Costs | | | 100 | % |
Financial Year End (month and year) | | | 31-Dec-12 | | | | | Exchange Rate | | | 100 | % | | Variable Cost | | | 100 | % |
First Year | | | 0 | | | | | Grade | | | 100 | % | | Mining Capex | | | 100 | % |
Days remaining | | | 365 | | | | | | | | | | | Plant Capex | | | 100 | % |
| | | | | | | | | | | | | | | | | | | | | | | | | | | | | | | | | | | | | | | | |
Project Duration | | | | Unit | | Totals | | | | | | | | | | | | | | | | | | | | | | | | | |
Calendar Years | | | | | | | | | | | 1 | | | | 2 | | | | 3 | | | | 4 | | | | 5 | | | | 6 | | | | 7 | | | | 8 | |
Financial Years | | | | years | | | 30 | | | | 0 | | | | 0 | | | | 0 | | | | 0 | | | | 0 | | | | 0 | | | | 1 | | | | 2 | |
12.6% | | | | | | | | | | | | | | | | | | | | | | | | | | | | | | | | | | | | | | | | |
Macro-Economic Factors (Real Terms) | | | | | | | | | | | | | | | | | | | | | | | | | | | | | | | | | | | | | | | | |
| | | | | | | | | | | |
Currency | | | | ZAR/USD | | | 8.79 | | | | | | | | 0.000 | | | | 0.000 | | | | 0.000 | | | | 0.000 | | | | 0.000 | | | | 8.794 | | | | 8.794 | |
Inflation | | ZAR Inflation Rate | | % | | | 6.00 | % | | | | | | | | | | | | | | | | | | | | | | | | | | | 6.00 | % | | | 6.00 | % |
Inflation | | US Inflation Rate | | % | | | 2.50 | % | | | | | | | | | | | | | | | | | | | | | | | | | | | 2.50 | % | | | 2.50 | % |
Inflation | | Cost Inflation | | % | | | 6.10 | % | | | | | | | | | | | | | | | | | | | | | | | | | | | 6.10 | % | | | 6.10 | % |
Inflation | | Capex inflation | | % | | | 6.10 | % | | | | | | | | | | | | | | | | | | | | | | | | | | | 6.10 | % | | | 6.10 | % |
Commodities | | | | | | | | | | | | | | | | | | | | | | | | | | | | | | | | | | | | | | | | |
Commodity prices | | Gold | | USD/oz. | | | 1,117 | | | | | | | | | | | | | | | | | | | | | | | | | | | | 1,117 | | | | 1,117 | |
Commodity prices | | Platinum | | USD/oz. | | | 1,643 | | | | | | | | | | | | | | | | | | | | | | | | | | | | 1,643 | | | | 1,643 | |
Commodity prices | | Palladium | | USD/oz. | | | 741 | | | | | | | | | | | | | | | | | | | | | | | | | | | | 741 | | | | 741 | |
Commodity prices | | Rhodium | | USD/oz. | | | 1,706 | | | | | | | | | | | | | | | | | | | | | | | | | | | | 1,706 | | | | 1,706 | |
Commodity prices | | Iridium | | USD/oz. | | | 425 | | | | | | | | | | | | | | | | | | | | | | | | | | | | 425 | | | | 425 | |
Commodity prices | | Ruthenium | | USD/oz. | | | 75 | | | | | | | | | | | | | | | | | | | | | | | | | | | | 75 | | | | 75 | |
Commodity prices | | Nickel | | USD/tonne | | | 19,205 | | | | | | | | | | | | | | | | | | | | | | | | | | | | 19,205 | | | | 19,205 | |
Commodity prices | | Copper | | USD/tonne | | | 5,740 | | | | | | | | | | | | | | | | | | | | | | | | | | | | 5,740 | | | | 5,740 | |
Operating Statistics | | | | | | | | | | | | | | | | | | | | | | | | | | | | | | | | | | | | | | | | |
Tonnes Produced | | | | | | | | | | | | | | | | | | | | | | | | | | | | | | | | | | | | | | | | |
ROM | | | | tonnes | | | 37,861,000 | | | | — | | | | — | | | | — | | | | — | | | | — | | | | — | | | | 14,000 | | | | 44,000 | |
ROM | | (Max) | | tonnes/mnth | | | 126,833 | | | | — | | | | — | | | | — | | | | — | | | | — | | | | — | | | | 1,167 | | | | 3,667 | |
Mill Head grade | | Precious metals | | 4Eg/t | | | 5.45 | | | | — | | | | — | | | | — | | | | — | | | | — | | | | — | | | | 0.42 | | | | 3.67 | |
Mill Head grade | | Nickel | | % | | | 0.14 | % | | | 0.00 | % | | | 0.00 | % | | | 0.00 | % | | | 0.00 | % | | | 0.00 | % | | | 0.00 | % | | | 0.14 | % | | | 0.14 | % |
Mill Head grade | | Copper | | % | | | 0.03 | % | | | 0.00 | % | | | 0.00 | % | | | 0.00 | % | | | 0.00 | % | | | 0.00 | % | | | 0.00 | % | | | 0.03 | % | | | 0.03 | % |
Tonnes to mill | | | | tonnes | | | 37,861,000 | | | | — | | | | — | | | | — | | | | — | | | | — | | | | — | | | | 14,000 | | | | 44,000 | |
Recovered Grade | | | | | | | | | | | | | | | | | | | | | | | | | | | | | | | | | | | | | | | | |
Recovered grade | | Precious Metals | | g/t | | | 4.78 | | | | 0.00 | | | | 0.00 | | | | 0.00 | | | | 0.00 | | | | 0.00 | | | | 0.00 | | | | 0.37 | | | | 3.22 | |
Recovered grade | | Nickel | | % | | | 0 | % | | | 0.00 | % | | | 0.00 | % | | | 0.00 | % | | | 0.00 | % | | | 0.00 | % | | | 0.00 | % | | | 0.09 | % | | | 0.09 | % |
Recovered grade | | Copper | | % | | | 0 | % | | | 0.00 | % | | | 0.00 | % | | | 0.00 | % | | | 0.00 | % | | | 0.00 | % | | | 0.00 | % | | | 0.02 | % | | | 0.02 | % |
Recovered grade | | Cobalt | | % | | | 0 | % | | | 0.00 | % | | | 0.00 | % | | | 0.00 | % | | | 0.00 | % | | | 0.00 | % | | | 0.00 | % | | | 0.00 | % | | | 0.00 | % |
| | | | | | | | | | | |
Metal recovered | | | | | | | | | | | | | | | | | | | | | | | | | | | | | | | | | | | | | | | | |
Metal recovered | | Gold | | kg | | | 3,420 | | | | — | | | | — | | | | — | | | | — | | | | — | | | | — | | | | 0 | | | | 3 | |
Metal recovered | | Platinum | | kg | | | 80,358 | | | | — | | | | — | | | | — | | | | — | | | | — | | | | — | | | | 2 | | | | 63 | |
Metal recovered | | Palladium | | kg | | | 82,245 | | | | — | | | | — | | | | — | | | | — | | | | — | | | | — | | | | 2 | | | | 64 | |
Metal recovered | | Rhodium | | kg | | | 15,095 | | | | — | | | | — | | | | — | | | | — | | | | — | | | | — | | | | 0 | | | | 12 | |
| | | | | | | | | | | |
Metal recovered | | Gold | | oz | | | 109,949 | | | | — | | | | — | | | | — | | | | — | | | | — | | | | — | | | | 3 | | | | 86 | |
Metal recovered | | Platinum | | oz | | | 2,583,586 | | | | — | | | | — | | | | — | | | | — | | | | — | | | | — | | | | 74 | | | | 2,022 | |
Metal recovered | | Palladium | | oz | | | 2,644,233 | | | | — | | | | — | | | | — | | | | — | | | | — | | | | — | | | | 75 | | | | 2,070 | |
Metal recovered | | Rhodium | | oz | | | 485,327 | | | | — | | | | — | | | | — | | | | — | | | | — | | | | — | | | | 14 | | | | 380 | |
Metal recovered | | Nickel | | tonnes | | | 32,464 | | | | — | | | | — | | | | — | | | | — | | | | — | | | | — | | | | 12 | | | | 38 | |
Metal recovered | | Copper | | tonnes | | | 7,860 | | | | — | | | | — | | | | — | | | | — | | | | — | | | | — | | | | 3 | | | | 9 | |
| | | | | | | | | | | |
Financial | | | | | | | | | | | | | | | | | | | | | | | | | | | | | | | | | | | | | | | | |
Revenue | | | | ZAR | | | 68,800,270,362 | | | | — | | | | — | | | | — | | | | — | | | | — | | | | — | | | | 3,967,310 | | | | 56,080,597 | |
Revenue | | Gold | | ZAR | | | 1,079,904,005 | | | | 0 | | | | 0 | | | | 0 | | | | 0 | | | | 0 | | | | 0 | | | | 30,778 | | | | 845,236 | |
Revenue | | Platinum | | ZAR | | | 37,323,725,916 | | | | 0 | | | | 0 | | | | 0 | | | | 0 | | | | 0 | | | | 0 | | | | 1,063,742 | | | | 29,213,116 | |
Revenue | | Palladium | | ZAR | | | 17,236,242,026 | | | | 0 | | | | 0 | | | | 0 | | | | 0 | | | | 0 | | | | 0 | | | | 491,240 | | | | 13,490,731 | |
Revenue | | Rhodium | | ZAR | | | 7,281,026,297 | | | | 0 | | | | 0 | | | | 0 | | | | 0 | | | | 0 | | | | 0 | | | | 207,512 | | | | 5,698,827 | |
Revenue | | Nickel | | ZAR | | | 5,482,673,786 | | | | 0 | | | | 0 | | | | 0 | | | | 0 | | | | 0 | | | | 0 | | | | 2,027,348 | | | | 6,371,666 | |
Revenue | | Copper | | ZAR | | | 396,698,332 | | | | 0 | | | | 0 | | | | 0 | | | | 0 | | | | 0 | | | | 0 | | | | 146,689 | | | | 461,021 | |
Mining cost | | | | | | | (25,436,446,090 | ) | | | 0 | | | | 0 | | | | 0 | | | | 0 | | | | 0 | | | | 0 | | | | (57,917,720 | ) | | | (98,014,840 | ) |
Variable Cost | | | | ZAR | | | (25,436,446,090 | ) | | | 0 | | | | 0 | | | | 0 | | | | 0 | | | | 0 | | | | 0 | | | | (57,917,720 | ) | | | (98,014,840 | ) |
Plant cost | | | | | | | (5,014,026,440 | ) | | | 0 | | | | 0 | | | | 0 | | | | 0 | | | | 0 | | | | 0 | | | | (1,716,120 | ) | | | (5,393,520 | ) |
Variable Cost | | | | ZAR | | | (5,014,026,440 | ) | | | 0 | | | | 0 | | | | 0 | | | | 0 | | | | 0 | | | | 0 | | | | (1,716,120 | ) | | | (5,393,520 | ) |
Cash Operating Costs | | | | ZAR | | | (30,450,472,530 | ) | | | 0 | | | | 0 | | | | 0 | | | | 0 | | | | 0 | | | | 0 | | | | (59,633,840 | ) | | | (103,408,360 | ) |
Royalty Act No 28 of 2008 | | | | ZAR | | | (2,071,809,190 | ) | | | 0 | | | | 0 | | | | 0 | | | | 0 | | | | 0 | | | | 0 | | | | (19,837 | ) | | | (280,403 | ) |
Total Cash Costs | | | | ZAR | | | (32,522,281,720 | ) | | | 0 | | | | 0 | | | | 0 | | | | 0 | | | | 0 | | | | 0 | | | | (59,653,677 | ) | | | (103,688,763 | ) |
Rehabilitation | | | | ZAR | | | (125,400,000 | ) | | | 0 | | | | 0 | | | | 0 | | | | 0 | | | | 0 | | | | 0 | | | | 0 | | | | (4,855,172 | ) |
Other Costs Variable | | | | ZAR | | | (8,894,799,850 | ) | | | 0 | | | | 0 | | | | 0 | | | | 0 | | | | 0 | | | | 0 | | | | (3,833,620 | ) | | | (13,220,240 | ) |
Total Production Costs | | | | ZAR | | | (41,542,481,570 | ) | | | 0 | | | | 0 | | | | 0 | | | | 0 | | | | 0 | | | | 0 | | | | (63,487,297 | ) | | | (121,764,175 | ) |
EBITDA | | | | ZAR | | | 27,257,788,792 | | | | 0 | | | | 0 | | | | 0 | | | | 0 | | | | 0 | | | | 0 | | | | (59,519,987 | ) | | | (65,683,578 | ) |
Capital expenditure | | | | ZAR | | | (7,732,000,000 | ) | | | 0 | | | | (5,000,000 | ) | | | (10,000,000 | ) | | | (15,200,000 | ) | | | (141,600,000 | ) | | | (322,700,000 | ) | | | (497,700,000 | ) | | | (987,700,000 | ) |
EBIT | | | | ZAR | | | 19,525,788,792 | | | | 0 | | | | (5,000,000 | ) | | | (10,000,000 | ) | | | (15,200,000 | ) | | | (141,600,000 | ) | | | (322,700,000 | ) | | | (557,219,987 | ) | | | (1,053,383,578 | ) |
Taxation | | | | ZAR | | | (5,341,444,037 | ) | | | 0 | | | | 0 | | | | 0 | | | | 0 | | | | 0 | | | | 0 | | | | 0 | | | | 0 | |
Income after tax | | | | ZAR | | | 14,184,344,755 | | | | 0 | | | | (5,000,000 | ) | | | (10,000,000 | ) | | | (15,200,000 | ) | | | (141,600,000 | ) | | | (322,700,000 | ) | | | (557,219,987 | ) | | | (1,053,383,578 | ) |
Working capital changes | | | | ZAR | | | 1 | | | | 0 | | | | 0 | | | | 0 | | | | 0 | | | | 0 | | | | 0 | | | | 4,531,735 | | | | (4,625,487 | ) |
| | | | | | | | | | | |
Cash Flow | | | | | | | | | | | | | | | | | | | | | | | | | | | | | | | | | | | | | | | | |
Net Cash Flow | | Annual cash flow | | ZAR | | | 14,184,344,755 | | | | 0 | | | | (5,000,000 | ) | | | (10,000,000 | ) | | | (15,200,000 | ) | | | (141,600,000 | ) | | | (322,700,000 | ) | | | (552,688,252 | ) | | | (1,058,009,066 | ) |
Cumulative Net Cash Flow | | Cumulative cash flow | | ZAR | | | | | | | 0 | | | | (5,000,000 | ) | | | (15,000,000 | ) | | | (30,200,000 | ) | | | (171,800,000 | ) | | | (494,500,000 | ) | | | (1,047,188,252 | ) | | | (2,105,197,317 | ) |
Prepared by Minxcon (Pty) Ltd
H-56
| | |
| CIMVal Compliant Report on the Ga-Phasha East Project, South Africa | | H-57 |
| | | | | | | | | | | | | | | | | | | | | | | | | | | | | | | | | | | | | | |
Project Duration | | | | | | | | | | | | | | | | | | | | | | | | | | | | | |
Calendar Years | | | 9 | | | | 10 | | | | 11 | | | 12 | | | 13 | | | | 14 | | | | 15 | | | | 16 | | | | 17 | | | | 18 | |
Financial Years | | | 3 | | | | 4 | | | | 5 | | | 6 | | | 7 | | | | 8 | | | | 9 | | | | 10 | | | | 11 | | | | 12 | |
12.6% | | | | | | | | | | | | | | | | | | | | | | | | | | | | | | | | | | | | | | |
Macro-Economic Factors (Real Terms) | | | | | | | | | | | | | | | | | | | | | | | | | | | | | | | | | | | | | | |
| | | | | | | | | | |
Currency | | | 8.794 | | | | 8.794 | | | | 8.794 | | | 8.794 | | | 8.794 | | | | 8.794 | | | | 8.794 | | | | 8.794 | | | | 8.794 | | | | 8.794 | |
Inflation | | | 6.00 | % | | | 6.00 | % | | | 6.00 | % | | 6.00% | | | 6.00 | % | | | 6.00 | % | | | 6.00 | % | | | 6.00 | % | | | 6.00 | % | | | 6.00 | % |
Inflation | | | 2.50 | % | | | 2.50 | % | | | 2.50 | % | | 2.50% | | | 2.50 | % | | | 2.50 | % | | | 2.50 | % | | | 2.50 | % | | | 2.50 | % | | | 2.50 | % |
Inflation | | | 6.10 | % | | | 6.10 | % | | | 6.10 | % | | 6.10% | | | 6.10 | % | | | 6.10 | % | | | 6.10 | % | | | 6.10 | % | | | 6.10 | % | | | 6.10 | % |
Inflation | | | 6.10 | % | | | 6.10 | % | | | 6.10 | % | | 6.10% | | | 6.10 | % | | | 6.10 | % | | | 6.10 | % | | | 6.10 | % | | | 6.10 | % | | | 6.10 | % |
Commodities | | | | | | | | | | | | | | | | | | | | | | | | | | | | | | | | | | | | | | |
Commodity prices | | | 1,117 | | | | 1,117 | | | | 1,117 | | | 1,117 | | | 1,117 | | | | 1,117 | | | | 1,117 | | | | 1,117 | | | | 1,117 | | | | 1,117 | |
Commodity prices | | | 1,643 | | | | 1,643 | | | | 1,643 | | | 1,643 | | | 1,643 | | | | 1,643 | | | | 1,643 | | | | 1,643 | | | | 1,643 | | | | 1,643 | |
Commodity prices | | | 741 | | | | 741 | | | | 741 | | | 741 | | | 741 | | | | 741 | | | | 741 | | | | 741 | | | | 741 | | | | 741 | |
Commodity prices | | | 1,706 | | | | 1,706 | | | | 1,706 | | | 1,706 | | | 1,706 | | | | 1,706 | | | | 1,706 | | | | 1,706 | | | | 1,706 | | | | 1,706 | |
Commodity prices | | | 425 | | | | 425 | | | | 425 | | | 425 | | | 425 | | | | 425 | | | | 425 | | | | 425 | | | | 425 | | | | 425 | |
Commodity prices | | | 75 | | | | 75 | | | | 75 | | | 75 | | | 75 | | | | 75 | | | | 75 | | | | 75 | | | | 75 | | | | 75 | |
Commodity prices | | | 19,205 | | | | 19,205 | | | | 19,205 | | | 19,205 | | | 19,205 | | | | 19,205 | | | | 19,205 | | | | 19,205 | | | | 19,205 | | | | 19,205 | |
Commodity prices | | | 5,740 | | | | 5,740 | | | | 5,740 | | | 5,740 | | | 5,740 | | | | 5,740 | | | | 5,740 | | | | 5,740 | | | | 5,740 | | | | 5,740 | |
Operating Statistics | | | | | | | | | | | | | | | | | | | | | | | | | | | | | | | | | | | | | | |
Tonnes Produced | | | | | | | | | | | | | | | | | | | | | | | | | | | | | | | | | | | | | | |
ROM | | | 140,000 | | | | 938,000 | | | | 1,022,000 | | | 1,296,000 | | | 1,451,000 | | | | 1,506,000 | | | | 1,504,000 | | | | 1,510,000 | | | | 1,502,000 | | | | 1,497,000 | |
ROM | | | 11,667 | | | | 78,167 | | | | 85,167 | | | 108,000 | | | 120,917 | | | | 125,500 | | | | 125,333 | | | | 125,833 | | | | 125,167 | | | | 124,750 | |
Mill Head grade | | | 5.34 | | | | 5.43 | | | | 5.49 | | | 5.50 | | | 5.59 | | | | 5.67 | | | | 5.65 | | | | 5.56 | | | | 5.49 | | | | 5.47 | |
Mill Head grade | | | 0.14 | % | | | 0.14 | % | | | 0.14 | % | | 0.14% | | | 0.14 | % | | | 0.14 | % | | | 0.14 | % | | | 0.14 | % | | | 0.14 | % | | | 0.14 | % |
Mill Head grade | | | 0.03 | % | | | 0.03 | % | | | 0.03 | % | | 0.03% | | | 0.03 | % | | | 0.03 | % | | | 0.03 | % | | | 0.03 | % | | | 0.03 | % | | | 0.03 | % |
Tonnes to mill | | | 140,000 | | | | 938,000 | | | | 1,022,000 | | | 1,296,000 | | | 1,451,000 | | | | 1,506,000 | | | | 1,504,000 | | | | 1,510,000 | | | | 1,502,000 | | | | 1,497,000 | |
Recovered Grade | | | | | | | | | | | | | | | | | | | | | | | | | | | | | | | | | | | | | | |
Recovered grade | | | 4.69 | | | | 4.77 | | | | 4.82 | | | 4.83 | | | 4.91 | | | | 4.98 | | | | 4.96 | | | | 4.88 | | | | 4.82 | | | | 4.80 | |
Recovered grade | | | 0.09 | % | | | 0.09 | % | | | 0.09 | % | | 0.09% | | | 0.09 | % | | | 0.09 | % | | | 0.09 | % | | | 0.09 | % | | | 0.09 | % | | | 0.09 | % |
Recovered grade | | | 0.02 | % | | | 0.02 | % | | | 0.02 | % | | 0.02% | | | 0.02 | % | | | 0.02 | % | | | 0.02 | % | | | 0.02 | % | | | 0.02 | % | | | 0.02 | % |
Recovered grade | | | 0.00 | % | | | 0.00 | % | | | 0.00 | % | | 0.00% | | | 0.00 | % | | | 0.00 | % | | | 0.00 | % | | | 0.00 | % | | | 0.00 | % | | | 0.00 | % |
| | | | | | | | | | |
Metal recovered | | | | | | | | | | | | | | | | | | | | | | | | | | | | | | | | | | | | | | |
Metal recovered | | | 12 | | | | 84 | | | | 93 | | | 118 | | | 134 | | | | 142 | | | | 141 | | | | 139 | | | | 137 | | | | 136 | |
Metal recovered | | | 291 | | | | 1,984 | | | | 2,187 | | | 2,776 | | | 3,159 | | | | 3,326 | | | | 3,310 | | | | 3,270 | | | | 3,212 | | | | 3,189 | |
Metal recovered | | | 298 | | | | 2,030 | | | | 2,238 | | | 2,842 | | | 3,233 | | | | 3,404 | | | | 3,387 | | | | 3,347 | | | | 3,287 | | | | 3,264 | |
Metal recovered | | | 55 | | | | 373 | | | | 411 | | | 522 | | | 593 | | | | 625 | | | | 622 | | | | 614 | | | | 603 | | | | 599 | |
| | | | | | | | | | |
Metal recovered | | | 398 | | | | 2,714 | | | | 2,992 | | | 3,799 | | | 4,323 | | | | 4,551 | | | | 4,529 | | | | 4,474 | | | | 4,394 | | | | 4,364 | |
Metal recovered | | | 9,362 | | | | 63,782 | | | | 70,309 | | | 89,262 | | | 101,573 | | | | 106,931 | | | | 106,413 | | | | 105,135 | | | | 103,262 | | | | 102,543 | |
Metal recovered | | | 9,582 | | | | 65,279 | | | | 71,960 | | | 91,357 | | | 103,957 | | | | 109,441 | | | | 108,911 | | | | 107,603 | | | | 105,686 | | | | 104,950 | |
Metal recovered | | | 1,759 | | | | 11,982 | | | | 13,208 | | | 16,768 | | | 19,080 | | | | 20,087 | | | | 19,990 | | | | 19,750 | | | | 19,398 | | | | 19,263 | |
Metal recovered | | | 120 | | | | 804 | | | | 876 | | | 1,111 | | | 1,244 | | | | 1,291 | | | | 1,290 | | | | 1,295 | | | | 1,288 | | | | 1,284 | |
Metal recovered | | | 29 | | | | 195 | | | | 212 | | | 269 | | | 301 | | | | 313 | | | | 312 | | | | 313 | | | | 312 | | | | 311 | |
| | | | | | | | | | |
Financial | | | | | | | | | | | | | | | | | | | | | | | | | | | | | | | | | | | | | | |
Revenue | | | 249,742,210 | | | | 1,699,019,086 | | | | 1,871,020,196 | | | 2,375,139,638 | | | 2,699,030,534 | | | | 2,838,080,794 | | | | 2,825,138,013 | | | | 2,794,961,947 | | | | 2,748,088,774 | | | | 2,729,809,623 | |
Revenue | | | 3,913,169 | | | | 26,660,112 | | | | 29,388,270 | | | 37,310,150 | | | 42,455,946 | | | | 44,695,863 | | | | 44,479,058 | | | | 43,945,159 | | | | 43,162,002 | | | | 42,861,605 | |
Revenue | | | 135,247,247 | | | | 921,428,855 | | | | 1,015,719,680 | | | 1,289,516,286 | | | 1,467,365,692 | | | | 1,544,781,896 | | | | 1,537,288,663 | | | | 1,518,835,989 | | | | 1,491,768,449 | | | | 1,481,386,106 | |
Revenue | | | 62,457,705 | | | | 425,519,435 | | | | 469,063,305 | | | 595,503,644 | | | 677,635,193 | | | | 713,386,297 | | | | 709,925,893 | | | | 701,404,376 | | | | 688,904,481 | | | | 684,109,875 | |
Revenue | | | 26,383,721 | | | | 179,750,214 | | | | 198,144,250 | | | 251,555,860 | | | 286,250,312 | | | | 301,352,486 | | | | 299,890,724 | | | | 296,291,019 | | | | 291,010,745 | | | | 288,985,382 | |
Revenue | | | 20,273,483 | | | | 135,832,334 | | | | 147,996,424 | | | 187,674,526 | | | 210,120,168 | | | | 218,084,750 | | | | 217,795,129 | | | | 218,663,992 | | | | 217,505,508 | | | | 216,781,455 | |
Revenue | | | 1,466,886 | | | | 9,828,135 | | | | 10,708,267 | | | 13,579,172 | | | 15,203,224 | | | | 15,779,501 | | | | 15,758,545 | | | | 15,821,412 | | | | 15,737,590 | | | | 15,685,201 | |
Mining cost | | | (158,989,600 | ) | | | (791,165,480 | ) | | | (747,082,000 | ) | | (889,081,920) | | | (946,458,280 | ) | | | (948,463,740 | ) | | | (947,204,160 | ) | | | (950,982,900 | ) | | | (945,944,580 | ) | | | (942,795,630 | ) |
Variable Cost | | | (158,989,600 | ) | | | (791,165,480 | ) | | | (747,082,000 | ) | | (889,081,920) | | | (946,458,280 | ) | | | (948,463,740 | ) | | | (947,204,160 | ) | | | (950,982,900 | ) | | | (945,944,580 | ) | | | (942,795,630 | ) |
Plant cost | | | (17,161,200 | ) | | | (693,210,140 | ) | | | (406,694,680 | ) | | (262,919,520) | | | (183,087,180 | ) | | | (190,027,080 | ) | | | (155,603,840 | ) | | | (156,224,600 | ) | | | (155,396,920 | ) | | | (154,879,620 | ) |
Variable Cost | | | (17,161,200 | ) | | | (693,210,140 | ) | | | (406,694,680 | ) | | (262,919,520) | | | (183,087,180 | ) | | | (190,027,080 | ) | | | (155,603,840 | ) | | | (156,224,600 | ) | | | (155,396,920 | ) | | | (154,879,620 | ) |
Cash Operating Costs | | | (176,150,800 | ) | | | (1,484,375,620 | ) | | | (1,153,776,680 | ) | | (1,152,001,440) | | | (1,129,545,460 | ) | | | (1,138,490,820 | ) | | | (1,102,808,000 | ) | | | (1,107,207,500 | ) | | | (1,101,341,500 | ) | | | (1,097,675,250 | ) |
Royalty Act No 28 of 2008 | | | (1,248,711 | ) | | | (8,495,095 | ) | | | (9,355,101 | ) | | (11,875,698) | | | (13,495,153 | ) | | | (14,190,404 | ) | | | (14,125,690 | ) | | | (77,273,730 | ) | | | (97,711,270 | ) | | | (96,592,143 | ) |
Total Cash Costs | | | (177,399,511 | ) | | | (1,492,870,715 | ) | | | (1,163,131,781 | ) | | (1,163,877,138) | | | (1,143,040,613 | ) | | | (1,152,681,224 | ) | | | (1,116,933,690 | ) | | | (1,184,481,230 | ) | | | (1,199,052,770 | ) | | | (1,194,267,393 | ) |
Rehabilitation | | | (4,817,241 | ) | | | (4,779,310 | ) | | | (4,741,379 | ) | | (4,703,448) | | | (4,665,517 | ) | | | (4,627,586 | ) | | | (4,589,655 | ) | | | (4,551,724 | ) | | | (4,513,793 | ) | | | (4,475,862 | ) |
Other Costs Variable | | | (42,387,800 | ) | | | (265,716,640 | ) | | | (273,047,740 | ) | | (336,065,760) | | | (364,302,570 | ) | | | (364,979,100 | ) | | | (364,494,400 | ) | | | (363,366,400 | ) | | | (359,098,160 | ) | | | (356,869,830 | ) |
Total Production Costs | | | (224,604,552 | ) | | | (1,763,366,666 | ) | | | (1,440,920,900 | ) | | (1,504,646,346) | | | (1,512,008,700 | ) | | | (1,522,287,910 | ) | | | (1,486,017,745 | ) | | | (1,552,399,354 | ) | | | (1,562,664,723 | ) | | | (1,555,613,085 | ) |
EBITDA | | | 25,137,658 | | | | (64,347,580 | ) | | | 430,099,296 | | | 870,493,292 | | | 1,187,021,834 | | | | 1,315,792,884 | | | | 1,339,120,267 | | | | 1,242,562,593 | | | | 1,185,424,052 | | | | 1,174,196,538 | |
Capital expenditure | | | (1,066,000,000 | ) | | | (832,400,000 | ) | | | (443,500,000 | ) | | (391,200,000) | | | (199,400,000 | ) | | | (210,900,000 | ) | | | (222,700,000 | ) | | | (233,800,000 | ) | | | (233,500,000 | ) | | | (234,000,000 | ) |
EBIT | | | (1,040,862,342 | ) | | | (896,747,580 | ) | | | (13,400,704 | ) | | 479,293,292 | | | 987,621,834 | | | | 1,104,892,884 | | | | 1,116,420,267 | | | | 1,008,762,593 | | | | 951,924,052 | | | | 940,196,538 | |
Taxation | | | 0 | | | | 0 | | | | 0 | | | 0 | | | 0 | | | | 0 | | | | 0 | | | | (53,668,645 | ) | | | (266,538,734 | ) | | | (263,255,031 | ) |
Income after tax | | | (1,040,862,342 | ) | | | (896,747,580 | ) | | | (13,400,704 | ) | | 479,293,292 | | | 987,621,834 | | | | 1,104,892,884 | | | | 1,116,420,267 | | | | 955,093,948 | | | | 685,385,317 | | | | 676,941,508 | |
Working capital changes | | | (25,050,361 | ) | | | (124,268,037 | ) | | | (56,257,822 | ) | | (81,978,744) | | | (55,429,319 | ) | | | (23,209,616 | ) | | | (738,713 | ) | | | 5,477,362 | | | | 7,257,487 | | | | 2,670,546 | |
| | | | | | | | | | |
Cash Flow | | | | | | | | | | | | | | | | | | | | | | | | | | | | | | | | | | | | | | |
Net Cash Flow | | | (1,065,912,703 | ) | | | (1,021,015,617 | ) | | | (69,658,526 | ) | | 397,314,548 | | | 932,192,515 | | | | 1,081,683,268 | | | | 1,115,681,554 | | | | 960,571,310 | | | | 692,642,804 | | | | 679,612,053 | |
Cumulative Net Cash Flow | | | (3,171,110,020 | ) | | | (4,192,125,637 | ) | | | (4,261,784,163 | ) | | (3,864,469,615) | | | (2,932,277,100 | ) | | | (1,850,593,832 | ) | | | (734,912,278 | ) | | | 225,659,032 | | | | 918,301,836 | | | | 1,597,913,889 | |
Prepared by Minxcon (Pty) Ltd
H-57
| | |
| CIMVal Compliant Report on the Ga-Phasha East Project, South Africa | | H-58 |
| | | | | | | | | | | | | | | | | | | | | | | | | | | | | | | | | | | | | | | | |
Project Duration | | | | | | | | | | | | | | | | | | | | | | | | | | | | | | |
Calendar Years | | | 19 | | | | 20 | | | | 21 | | | | 22 | | | | 23 | | | | 24 | | | | 25 | | | | 26 | | | | 27 | | | | 28 | |
Financial Years | | | 13 | | | | 14 | | | | 15 | | | | 16 | | | | 17 | | | | 18 | | | | 19 | | | | 20 | | | | 21 | | | | 22 | |
12.6% | | | | | | | | | | | | | | | | | | | | | | | | | | | | | | | | | | | | | | | | |
Macro-Economic Factors (Real Terms) | | | | | | | | | | | | | | | | | | | | | | | | | | | | | | | | | | | | | | | | |
| | | | | | | | | | |
Currency | | | 8.794 | | | | 8.794 | | | | 8.794 | | | | 8.794 | | | | 8.794 | | | | 8.794 | | | | 8.794 | | | | 8.794 | | | | 8.794 | | | | 8.794 | |
Inflation | | | 6.00 | % | | | 6.00 | % | | | 6.00 | % | | | 6.00 | % | | | 6.00 | % | | | 6.00 | % | | | 6.00 | % | | | 6.00 | % | | | 6.00 | % | | | 6.00 | % |
Inflation | | | 2.50 | % | | | 2.50 | % | | | 2.50 | % | | | 2.50 | % | | | 2.50 | % | | | 2.50 | % | | | 2.50 | % | | | 2.50 | % | | | 2.50 | % | | | 2.50 | % |
Inflation | | | 6.10 | % | | | 6.10 | % | | | 6.10 | % | | | 6.10 | % | | | 6.10 | % | | | 6.10 | % | | | 6.10 | % | | | 6.10 | % | | | 6.10 | % | | | 6.10 | % |
Inflation | | | 6.10 | % | | | 6.10 | % | | | 6.10 | % | | | 6.10 | % | | | 6.10 | % | | | 6.10 | % | | | 6.10 | % | | | 6.10 | % | | | 6.10 | % | | | 6.10 | % |
Commodities | | | | | | | | | | | | | | | | | | | | | | | | | | | | | | | | | | | | | | | | |
Commodity prices | | | 1,117 | | | | 1,117 | | | | 1,117 | | | | 1,117 | | | | 1,117 | | | | 1,117 | | | | 1,117 | | | | 1,117 | | | | 1,117 | | | | 1,117 | |
Commodity prices | | | 1,643 | | | | 1,643 | | | | 1,643 | | | | 1,643 | | | | 1,643 | | | | 1,643 | | | | 1,643 | | | | 1,643 | | | | 1,643 | | | | 1,643 | |
Commodity prices | | | 741 | | | | 741 | | | | 741 | | | | 741 | | | | 741 | | | | 741 | | | | 741 | | | | 741 | | | | 741 | | | | 741 | |
Commodity prices | | | 1,706 | | | | 1,706 | | | | 1,706 | | | | 1,706 | | | | 1,706 | | | | 1,706 | | | | 1,706 | | | | 1,706 | | | | 1,706 | | | | 1,706 | |
Commodity prices | | | 425 | | | | 425 | | | | 425 | | | | 425 | | | | 425 | | | | 425 | | | | 425 | | | | 425 | | | | 425 | | | | 425 | |
Commodity prices | | | 75 | | | | 75 | | | | 75 | | | | 75 | | | | 75 | | | | 75 | | | | 75 | | | | 75 | | | | 75 | | | | 75 | |
Commodity prices | | | 19,205 | | | | 19,205 | | | | 19,205 | | | | 19,205 | | | | 19,205 | | | | 19,205 | | | | 19,205 | | | | 19,205 | | | | 19,205 | | | | 19,205 | |
Commodity prices | | | 5,740 | | | | 5,740 | | | | 5,740 | | | | 5,740 | | | | 5,740 | | | | 5,740 | | | | 5,740 | | | | 5,740 | | | | 5,740 | | | | 5,740 | |
Operating Statistics | | | | | | | | | | | | | | | | | | | | | | | | | | | | | | | | | | | | | | | | |
Tonnes Produced | | | | | | | | | | | | | | | | | | | | | | | | | | | | | | | | | | | | | | | | |
ROM | | | 1,505,000 | | | | 1,494,000 | | | | 1,503,000 | | | | 1,489,000 | | | | 1,498,000 | | | | 1,522,000 | | | | 1,492,000 | | | | 1,491,000 | | | | 1,514,000 | | | | 1,514,000 | |
ROM | | | 125,417 | | | | 124,500 | | | | 125,250 | | | | 124,083 | | | | 124,833 | | | | 126,833 | | | | 124,333 | | | | 124,250 | | | | 126,167 | | | | 126,167 | |
Mill Head grade | | | 5.49 | | | | 5.49 | | | | 5.47 | | | | 5.40 | | | | 5.29 | | | | 5.43 | | | | 5.41 | | | | 5.38 | | | | 5.42 | | | | 5.47 | |
Mill Head grade | | | 0.14 | % | | | 0.14 | % | | | 0.14 | % | | | 0.14 | % | | | 0.14 | % | | | 0.14 | % | | | 0.14 | % | | | 0.14 | % | | | 0.14 | % | | | 0.14 | % |
Mill Head grade | | | 0.03 | % | | | 0.03 | % | | | 0.03 | % | | | 0.03 | % | | | 0.03 | % | | | 0.03 | % | | | 0.03 | % | | | 0.03 | % | | | 0.03 | % | | | 0.03 | % |
Tonnes to mill | | | 1,505,000 | | | | 1,494,000 | | | | 1,503,000 | | | | 1,489,000 | | | | 1,498,000 | | | | 1,522,000 | | | | 1,492,000 | | | | 1,491,000 | | | | 1,514,000 | | | | 1,514,000 | |
Recovered Grade | | | | | | | | | | | | | | | | | | | | | | | | | | | | | | | | | | | | | | | | |
Recovered grade | | | 4.82 | | | | 4.82 | | | | 4.80 | | | | 4.74 | | | | 4.64 | | | | 4.77 | | | | 4.75 | | | | 4.72 | | | | 4.76 | | | | 4.80 | |
Recovered grade | | | 0.09 | % | | | 0.09 | % | | | 0.09 | % | | | 0.09 | % | | | 0.09 | % | | | 0.09 | % | | | 0.09 | % | | | 0.09 | % | | | 0.09 | % | | | 0.09 | % |
Recovered grade | | | 0.02 | % | | | 0.02 | % | | | 0.02 | % | | | 0.02 | % | | | 0.02 | % | | | 0.02 | % | | | 0.02 | % | | | 0.02 | % | | | 0.02 | % | | | 0.02 | % |
Recovered grade | | | 0.00 | % | | | 0.00 | % | | | 0.00 | % | | | 0.00 | % | | | 0.00 | % | | | 0.00 | % | | | 0.00 | % | | | 0.00 | % | | | 0.00 | % | | | 0.00 | % |
| | | | | | | | | | |
Metal recovered | | | | | | | | | | | | | | | | | | | | | | | | | | | | | | | | | | | | | | | | |
Metal recovered | | | 137 | | | | 136 | | | | 136 | | | | 133 | | | | 131 | | | | 137 | | | | 134 | | | | 133 | | | | 136 | | | | 137 | |
Metal recovered | | | 3,218 | | | | 3,195 | | | | 3,202 | | | | 3,132 | | | | 3,087 | | | | 3,219 | | | | 3,144 | | | | 3,124 | | | | 3,196 | | | | 3,226 | |
Metal recovered | | | 3,294 | | | | 3,270 | | | | 3,277 | | | | 3,205 | | | | 3,159 | | | | 3,295 | | | | 3,218 | | | | 3,198 | | | | 3,271 | | | | 3,301 | |
Metal recovered | | | 605 | | | | 600 | | | | 602 | | | | 588 | | | | 580 | | | | 605 | | | | 591 | | | | 587 | | | | 600 | | | | 606 | |
| | | | | | | | | | |
Metal recovered | | | 4,403 | | | | 4,371 | | | | 4,381 | | | | 4,285 | | | | 4,223 | | | | 4,404 | | | | 4,302 | | | | 4,275 | | | | 4,373 | | | | 4,413 | |
Metal recovered | | | 103,468 | | | | 102,712 | | | | 102,954 | | | | 100,690 | | | | 99,235 | | | | 103,493 | | | | 101,080 | | | | 100,452 | | | | 102,760 | | | | 103,708 | |
Metal recovered | | | 105,897 | | | | 105,123 | | | | 105,371 | | | | 103,053 | | | | 101,564 | | | | 105,923 | | | | 103,452 | | | | 102,810 | | | | 105,172 | | | | 106,142 | |
Metal recovered | | | 19,436 | | | | 19,294 | | | | 19,340 | | | | 18,915 | | | | 18,641 | | | | 19,441 | | | | 18,988 | | | | 18,870 | | | | 19,303 | | | | 19,481 | |
Metal recovered | | | 1,290 | | | | 1,281 | | | | 1,289 | | | | 1,277 | | | | 1,284 | | | | 1,305 | | | | 1,279 | | | | 1,278 | | | | 1,298 | | | | 1,298 | |
Metal recovered | | | 312 | | | | 310 | | | | 312 | | | | 309 | | | | 311 | | | | 316 | | | | 310 | | | | 310 | | | | 314 | | | | 314 | |
| | | | | | | | | | |
Financial | | | | | | | | | | | | | | | | | | | | | | | | | | | | | | | | | | | | | | | | |
Revenue | | | 2,753,577,633 | | | | 2,733,451,817 | | | | 2,740,750,744 | | | | 2,683,433,565 | | | | 2,649,398,771 | | | | 2,756,830,542 | | | | 2,693,390,357 | | | | 2,677,943,453 | | | | 2,737,722,601 | | | | 2,760,809,465 | |
Revenue | | | 43,248,211 | | | | 42,932,111 | | | | 43,033,395 | | | | 42,086,979 | | | | 41,478,858 | | | | 43,258,732 | | | | 42,249,871 | | | | 41,987,423 | | | | 42,952,106 | | | | 43,348,343 | |
Revenue | | | 1,494,748,013 | | | | 1,483,822,944 | | | | 1,487,323,525 | | | | 1,454,613,446 | | | | 1,433,595,489 | | | | 1,495,111,639 | | | | 1,460,243,321 | | | | 1,451,172,565 | | | | 1,484,514,015 | | | | 1,498,208,794 | |
Revenue | | | 690,280,455 | | | | 685,235,216 | | | | 686,851,798 | | | | 671,746,156 | | | | 662,039,981 | | | | 690,448,379 | | | | 674,346,054 | | | | 670,157,144 | | | | 685,554,355 | | | | 691,878,657 | |
Revenue | | | 291,591,992 | | | | 289,460,755 | | | | 290,143,640 | | | | 283,762,633 | | | | 279,662,499 | | | | 291,662,927 | | | | 284,860,896 | | | | 283,091,394 | | | | 289,595,567 | | | | 292,267,113 | |
Revenue | | | 217,939,939 | | | | 216,347,023 | | | | 217,650,318 | | | | 215,622,970 | | | | 216,926,265 | | | | 220,401,720 | | | | 216,057,402 | | | | 215,912,591 | | | | 219,243,235 | | | | 219,243,235 | |
Revenue | | | 15,769,023 | | | | 15,653,768 | | | | 15,748,068 | | | | 15,601,379 | | | | 15,695,679 | | | | 15,947,145 | | | | 15,632,812 | | | | 15,622,335 | | | | 15,863,323 | | | | 15,863,323 | |
Mining cost | | | (947,833,950 | ) | | | (940,906,260 | ) | | | (946,574,370 | ) | | | (937,757,310 | ) | | | (943,425,420 | ) | | | (958,540,380 | ) | | | (939,646,680 | ) | | | (939,016,890 | ) | | | (953,502,060 | ) | | | (953,502,060 | ) |
Variable Cost | | | (947,833,950 | ) | | | (940,906,260 | ) | | | (946,574,370 | ) | | | (937,757,310 | ) | | | (943,425,420 | ) | | | (958,540,380 | ) | | | (939,646,680 | ) | | | (939,016,890 | ) | | | (953,502,060 | ) | | | (953,502,060 | ) |
Plant cost | | | (155,707,300 | ) | | | (154,569,240 | ) | | | (155,500,380 | ) | | | (154,051,940 | ) | | | (154,983,080 | ) | | | (157,466,120 | ) | | | (154,362,320 | ) | | | (154,258,860 | ) | | | (156,638,440 | ) | | | (156,638,440 | ) |
Variable Cost | | | (155,707,300 | ) | | | (154,569,240 | ) | | | (155,500,380 | ) | | | (154,051,940 | ) | | | (154,983,080 | ) | | | (157,466,120 | ) | | | (154,362,320 | ) | | | (154,258,860 | ) | | | (156,638,440 | ) | | | (156,638,440 | ) |
Cash Operating Costs | | | (1,103,541,250 | ) | | | (1,095,475,500 | ) | | | (1,102,074,750 | ) | | | (1,091,809,250 | ) | | | (1,098,408,500 | ) | | | (1,116,006,500 | ) | | | (1,094,009,000 | ) | | | (1,093,275,750 | ) | | | (1,110,140,500 | ) | | | (1,110,140,500 | ) |
Royalty Act No 28 of 2008 | | | (98,031,120 | ) | | | (108,190,841 | ) | | | (108,260,878 | ) | | | (106,740,623 | ) | | | (101,211,593 | ) | | | (108,315,705 | ) | | | (105,207,730 | ) | | | (103,971,127 | ) | | | (107,203,461 | ) | | | (109,375,789 | ) |
Total Cash Costs | | | (1,201,572,370 | ) | | | (1,203,666,341 | ) | | | (1,210,335,628 | ) | | | (1,198,549,873 | ) | | | (1,199,620,093 | ) | | | (1,224,322,205 | ) | | | (1,199,216,730 | ) | | | (1,197,246,877 | ) | | | (1,217,343,961 | ) | | | (1,219,516,289 | ) |
Rehabilitation | | | (4,437,931 | ) | | | (4,400,000 | ) | | | (4,362,069 | ) | | | (4,324,138 | ) | | | (4,286,207 | ) | | | (4,248,276 | ) | | | (4,210,345 | ) | | | (4,172,414 | ) | | | (4,134,483 | ) | | | (4,096,552 | ) |
Other Costs Variable | | | (359,108,050 | ) | | | (356,931,540 | ) | | | (358,149,870 | ) | | | (325,956,990 | ) | | | (350,846,580 | ) | | | (360,531,360 | ) | | | (354,111,280 | ) | | | (352,427,670 | ) | | | (358,712,020 | ) | | | (360,725,640 | ) |
Total Production Costs | | | (1,565,118,351 | ) | | | (1,564,997,881 | ) | | | (1,572,847,567 | ) | | | (1,528,831,001 | ) | | | (1,554,752,879 | ) | | | (1,589,101,841 | ) | | | (1,557,538,355 | ) | | | (1,553,846,961 | ) | | | (1,580,190,464 | ) | | | (1,584,338,481 | ) |
EBITDA | | | 1,188,459,282 | | | | 1,168,453,936 | | | | 1,167,903,177 | | | | 1,154,602,564 | | | | 1,094,645,891 | | | | 1,167,728,701 | | | | 1,135,852,002 | | | | 1,124,096,492 | | | | 1,157,532,138 | | | | 1,176,470,984 | |
Capital expenditure | | | (233,200,000 | ) | | | (95,100,000 | ) | | | (94,200,000 | ) | | | (94,800,000 | ) | | | (96,300,000 | ) | | | (94,400,000 | ) | | | (94,300,000 | ) | | | (95,800,000 | ) | | | (95,800,000 | ) | | | (91,200,000 | ) |
EBIT | | | 955,259,282 | | | | 1,073,353,936 | | | | 1,073,703,177 | | | | 1,059,802,564 | | | | 998,345,891 | | | | 1,073,328,701 | | | | 1,041,552,002 | | | | 1,028,296,492 | | | | 1,061,732,138 | | | | 1,085,270,984 | |
Taxation | | | (267,472,599 | ) | | | (300,539,102 | ) | | | (300,636,889 | ) | | | (296,744,718 | ) | | | (279,536,850 | ) | | | (300,532,036 | ) | | | (291,634,561 | ) | | | (287,923,018 | ) | | | (297,284,999 | ) | | | (303,875,876 | ) |
Income after tax | | | 687,786,683 | | | | 772,814,834 | | | | 773,066,287 | | | | 763,057,846 | | | | 718,809,042 | | | | 772,796,665 | | | | 749,917,441 | | | | 740,373,474 | | | | 764,447,139 | | | | 781,395,109 | |
Working capital changes | | | (3,436,323 | ) | | | 2,631,941 | | | | (617,274 | ) | | | 6,403,372 | | | | 8,462,622 | | | | (16,300,598 | ) | | | 8,614,258 | | | | 2,467,532 | | | | (8,415,379 | ) | | | (3,819,353 | ) |
| | | | | | | | | | |
Cash Flow | | | | | | | | | | | | | | | | | | | | | | | | | | | | | | | | | | | | | | | | |
Net Cash Flow | | | 684,350,360 | | | | 775,446,775 | | | | 772,449,013 | | | | 769,461,218 | | | | 727,271,664 | | | | 756,496,067 | | | | 758,531,700 | | | | 742,841,006 | | | | 756,031,760 | | | | 777,575,756 | |
Cumulative Net Cash Flow | | | 2,282,264,249 | | | | 3,057,711,024 | | | | 3,830,160,037 | | | | 4,599,621,255 | | | | 5,326,892,920 | | | | 6,083,388,987 | | | | 6,841,920,686 | | | | 7,584,761,692 | | | | 8,340,793,452 | | | | 9,118,369,208 | |
Prepared by Minxcon (Pty) Ltd
H-58
| | |
| CIMVal Compliant Report on the Ga-Phasha East Project, South Africa | | H-59 |
| | | | | | | | | | | | | | | | | | | | | | | | | | | | | | | | | | | | |
Project Duration | | | | | | | | | | | | | | | | | | | | | | | | | | | |
Calendar Years | | | 29 | | | | 30 | | | | 31 | | | | 32 | | | | 33 | | | | 34 | | | | 35 | | | | 36 | | | | 37 | |
Financial Years | | | 23 | | | | 24 | | | | 25 | | | | 26 | | | | 27 | | | | 28 | | | | 29 | | | | 30 | | | | 0 | |
12.6% | | | | | | | | | | | | | | | | | | | | | | | | | | | | | | | | | | | | |
Macro-Economic Factors (Real Terms) | | | | | | | | | | | | | | | | | | | | | | | | | | | | | | | | | | | | |
| | | | | | | | | |
Currency | | | 8.794 | | | | 8.794 | | | | 8.794 | | | | 8.794 | | | | 8.794 | | | | 8.794 | | | | 8.794 | | | | 8.794 | | | | 0.000 | |
Inflation | | | 6.00 | % | | | 6.00 | % | | | 6.00 | % | | | 6.00 | % | | | 6.00 | % | | | 6.00 | % | | | 6.00 | % | | | 6.00 | % | | | | |
Inflation | | | 2.50 | % | | | 2.50 | % | | | 2.50 | % | | | 2.50 | % | | | 2.50 | % | | | 2.50 | % | | | 2.50 | % | | | 2.50 | % | | | | |
Inflation | | | 6.10 | % | | | 6.10 | % | | | 6.10 | % | | | 6.10 | % | | | 6.10 | % | | | 6.10 | % | | | 6.10 | % | | | 6.10 | % | | | | |
Inflation | | | 6.10 | % | | | 6.10 | % | | | 6.10 | % | | | 6.10 | % | | | 6.10 | % | | | 6.10 | % | | | 6.10 | % | | | 6.10 | % | | | | |
Commodities | | | | | | | | | | | | | | | | | | | | | | | | | | | | | | | | | | | | |
Commodity prices | | | 1,117 | | | | 1,117 | | | | 1,117 | | | | 1,117 | | | | 1,117 | | | | 1,117 | | | | 1,117 | | | | 1,117 | | | | | |
Commodity prices | | | 1,643 | | | | 1,643 | | | | 1,643 | | | | 1,643 | | | | 1,643 | | | | 1,643 | | | | 1,643 | | | | 1,643 | | | | | |
Commodity prices | | | 741 | | | | 741 | | | | 741 | | | | 741 | | | | 741 | | | | 741 | | | | 741 | | | | 741 | | | | | |
Commodity prices | | | 1,706 | | | | 1,706 | | | | 1,706 | | | | 1,706 | | | | 1,706 | | | | 1,706 | | | | 1,706 | | | | 1,706 | | | | | |
Commodity prices | | | 425 | | | | 425 | | | | 425 | | | | 425 | | | | 425 | | | | 425 | | | | 425 | | | | 425 | | | | | |
Commodity prices | | | 75 | | | | 75 | | | | 75 | | | | 75 | | | | 75 | | | | 75 | | | | 75 | | | | 75 | | | | | |
Commodity prices | | | 19,205 | | | | 19,205 | | | | 19,205 | | | | 19,205 | | | | 19,205 | | | | 19,205 | | | | 19,205 | | | | 19,205 | | | | | |
Commodity prices | | | 5,740 | | | | 5,740 | | | | 5,740 | | | | 5,740 | | | | 5,740 | | | | 5,740 | | | | 5,740 | | | | 5,740 | | | | | |
Operating Statistics | | | | | | | | | | | | | | | | | | | | | | | | | | | | | | | | | | | | |
Tonnes Produced | | | | | | | | | | | | | | | | | | | | | | | | | | | | | | | | | | | | |
ROM | | | 1,442,000 | | | | 1,366,000 | | | | 1,351,000 | | | | 1,382,000 | | | | 1,348,000 | | | | 1,352,000 | | | | 1,230,000 | | | | 944,000 | | | | — | |
ROM | | | 120,167 | | | | 113,833 | | | | 112,583 | | | | 115,167 | | | | 112,333 | | | | 112,667 | | | | 102,500 | | | | 78,667 | | | | — | |
Mill Head grade | | | 5.49 | | | | 5.52 | | | | 5.56 | | | | 5.53 | | | | 5.40 | | | | 5.28 | | | | 5.10 | | | | 5.07 | | | | — | |
Mill Head grade | | | 0.14 | % | | | 0.14 | % | | | 0.14 | % | | | 0.14 | % | | | 0.14 | % | | | 0.14 | % | | | 0.14 | % | | | 0.14 | % | | | 0.00 | % |
Mill Head grade | | | 0.03 | % | | | 0.03 | % | | | 0.03 | % | | | 0.03 | % | | | 0.03 | % | | | 0.03 | % | | | 0.03 | % | | | 0.03 | % | | | 0.00 | % |
Tonnes to mill | | | 1,442,000 | | | | 1,366,000 | | | | 1,351,000 | | | | 1,382,000 | | | | 1,348,000 | | | | 1,352,000 | | | | 1,230,000 | | | | 944,000 | | | | — | |
Recovered Grade | | | | | | | | | | | | | | | | | | | | | | | | | | | | | | | | | | | | |
Recovered grade | | | 4.82 | | | | 4.85 | | | | 4.88 | | | | 4.85 | | | | 4.74 | | | | 4.64 | | | | 4.48 | | | | 4.45 | | | | 0.00 | |
Recovered grade | | | 0.09 | % | | | 0.09 | % | | | 0.09 | % | | | 0.09 | % | | | 0.09 | % | | | 0.09 | % | | | 0.09 | % | | | 0.09 | % | | | 0.00 | % |
Recovered grade | | | 0.02 | % | | | 0.02 | % | | | 0.02 | % | | | 0.02 | % | | | 0.02 | % | | | 0.02 | % | | | 0.02 | % | | | 0.02 | % | | | 0.00 | % |
Recovered grade | | | 0.00 | % | | | 0.00 | % | | | 0.00 | % | | | 0.00 | % | | | 0.00 | % | | | 0.00 | % | | | 0.00 | % | | | 0.00 | % | | | 0.00 | % |
| | | | | | | | | |
Metal recovered | | | | | | | | | | | | | | | | | | | | | | | | | | | | | | | | | | | | |
Metal recovered | | | 131 | | | | 125 | | | | 125 | | | | 127 | | | | 121 | | | | 118 | | | | 104 | | | | 79 | | | | — | |
Metal recovered | | | 3,083 | | | | 2,937 | | | | 2,926 | | | | 2,977 | | | | 2,835 | | | | 2,780 | | | | 2,443 | | | | 1,864 | | | | — | |
Metal recovered | | | 3,156 | | | | 3,006 | | | | 2,994 | | | | 3,047 | | | | 2,902 | | | | 2,846 | | | | 2,501 | | | | 1,908 | | | | — | |
Metal recovered | | | 579 | | | | 552 | | | | 550 | | | | 559 | | | | 533 | | | | 522 | | | | 459 | | | | 350 | | | | — | |
| | | | | | | | | |
Metal recovered | | | 4,219 | | | | 4,018 | | | | 4,003 | | | | 4,073 | | | | 3,879 | | | | 3,804 | | | | 3,343 | | | | 2,551 | | | | — | |
Metal recovered | | | 99,137 | | | | 94,425 | | | | 94,065 | | | | 95,704 | | | | 91,155 | | | | 89,394 | | | | 78,555 | | | | 59,935 | | | | — | |
Metal recovered | | | 101,464 | | | | 96,642 | | | | 96,273 | | | | 97,951 | | | | 93,295 | | | | 91,492 | | | | 80,399 | | | | 61,341 | | | | — | |
Metal recovered | | | 18,623 | | | | 17,738 | | | | 17,670 | | | | 17,978 | | | | 17,124 | | | | 16,793 | | | | 14,757 | | | | 11,259 | | | | — | |
Metal recovered | | | 1,236 | | | | 1,171 | | | | 1,158 | | | | 1,185 | | | | 1,156 | | | | 1,159 | | | | 1,055 | | | | 809 | | | | — | |
Metal recovered | | | 299 | | | | 284 | | | | 280 | | | | 287 | | | | 280 | | | | 281 | | | | 255 | | | | 196 | | | | — | |
| | | | | | | | | |
Financial | | | | | | | | | | | | | | | | | | | | | | | | | | | | | | | | | | | | |
Revenue | | | 2,638,311,593 | | | | 2,511,758,511 | | | | 2,500,658,007 | | | | 2,545,393,617 | | | | 2,429,327,364 | | | | 2,387,056,357 | | | | 2,104,134,087 | | | | 1,606,243,157 | | | | — | |
Revenue | | | 41,437,821 | | | | 39,468,360 | | | | 39,317,821 | | | | 40,002,992 | | | | 38,101,577 | | | | 37,365,424 | | | | 32,834,816 | | | | 25,051,818 | | | | 0 | |
Revenue | | | 1,432,177,166 | | | | 1,364,108,507 | | | | 1,358,905,577 | | | | 1,382,586,508 | | | | 1,316,869,661 | | | | 1,291,426,680 | | | | 1,134,839,458 | | | | 865,842,888 | | | | 0 | |
Revenue | | | 661,384,994 | | | | 629,950,623 | | | | 627,547,889 | | | | 638,483,836 | | | | 608,135,540 | | | | 596,385,872 | | | | 524,073,283 | | | | 399,849,619 | | | | 0 | |
Revenue | | | 279,385,816 | | | | 266,107,139 | | | | 265,092,163 | | | | 269,711,785 | | | | 256,891,894 | | | | 251,928,536 | | | | 221,381,862 | | | | 168,906,632 | | | | 0 | |
Revenue | | | 208,816,872 | | | | 197,811,267 | | | | 195,639,108 | | | | 200,128,237 | | | | 195,204,677 | | | | 195,783,919 | | | | 178,117,027 | | | | 136,701,198 | | | | 0 | |
Revenue | | | 15,108,925 | | | | 14,312,615 | | | | 14,155,449 | | | | 14,480,259 | | | | 14,124,016 | | | | 14,165,927 | | | | 12,887,640 | | | | 9,891,002 | | | | 0 | |
Mining cost | | | (908,157,180 | ) | | | (893,350,340 | ) | | | (1,009,386,140 | ) | | | (1,025,139,960 | ) | | | (1,002,682,840 | ) | | | (1,015,662,960 | ) | | | (982,548,600 | ) | | | (714,711,840 | ) | | | 0 | |
Variable Cost | | | (908,157,180 | ) | | | (893,350,340 | ) | | | (1,009,386,140 | ) | | | (1,025,139,960 | ) | | | (1,002,682,840 | ) | | | (1,015,662,960 | ) | | | (982,548,600 | ) | | | (714,711,840 | ) | | | 0 | |
Plant cost | | | (149,189,320 | ) | | | (141,326,360 | ) | | | (139,774,460 | ) | | | (142,981,720 | ) | | | (139,464,080 | ) | | | (139,877,920 | ) | | | (127,255,800 | ) | | | (97,666,240 | ) | | | 0 | |
Variable Cost | | | (149,189,320 | ) | | | (141,326,360 | ) | | | (139,774,460 | ) | | | (142,981,720 | ) | | | (139,464,080 | ) | | | (139,877,920 | ) | | | (127,255,800 | ) | | | (97,666,240 | ) | | | 0 | |
Cash Operating Costs | | | (1,057,346,500 | ) | | | (1,034,676,700 | ) | | | (1,149,160,600 | ) | | | (1,168,121,680 | ) | | | (1,142,146,920 | ) | | | (1,155,540,880 | ) | | | (1,109,804,400 | ) | | | (812,378,080 | ) | | | 0 | |
Royalty Act No 28 of 2008 | | | (104,603,431 | ) | | | (96,325,905 | ) | | | (86,462,788 | ) | | | (88,555,967 | ) | | | (82,515,618 | ) | | | (79,331,828 | ) | | | (63,988,579 | ) | | | (68,852,974 | ) | | | 0 | |
Total Cash Costs | | | (1,161,949,931 | ) | | | (1,131,002,605 | ) | | | (1,235,623,388 | ) | | | (1,256,677,647 | ) | | | (1,224,662,538 | ) | | | (1,234,872,708 | ) | | | (1,173,792,979 | ) | | | (881,231,054 | ) | | | 0 | |
Rehabilitation | | | (4,058,621 | ) | | | (4,020,690 | ) | | | (3,982,759 | ) | | | (3,944,828 | ) | | | (3,906,897 | ) | | | (3,868,966 | ) | | | (3,831,034 | ) | | | (3,793,103 | ) | | | 0 | |
Other Costs Variable | | | (345,258,060 | ) | | | (328,072,220 | ) | | | (324,820,930 | ) | | | (330,864,620 | ) | | | (319,961,280 | ) | | | (316,489,680 | ) | | | (284,449,800 | ) | | | 0 | | | | 0 | |
Total Production Costs | | | (1,511,266,612 | ) | | | (1,463,095,514 | ) | | | (1,564,427,076 | ) | | | (1,591,487,095 | ) | | | (1,548,530,715 | ) | | | (1,555,231,354 | ) | | | (1,462,073,813 | ) | | | (885,024,157 | ) | | | 0 | |
EBITDA | | | 1,127,044,981 | | | | 1,048,662,996 | | | | 936,230,931 | | | | 953,906,522 | | | | 880,796,649 | | | | 831,825,003 | | | | 642,060,273 | | | | 721,218,999 | | | | 0 | |
Capital expenditure | | | (89,000,000 | ) | | | (97,900,000 | ) | | | (98,200,000 | ) | | | (94,600,000 | ) | | | (83,700,000 | ) | | | (68,700,000 | ) | | | (37,700,000 | ) | | | (29,800,000 | ) | | | 0 | |
EBIT | | | 1,038,044,981 | | | | 950,762,996 | | | | 838,030,931 | | | | 859,306,522 | | | | 797,096,649 | | | | 763,125,003 | | | | 604,360,273 | | | | 691,418,999 | | | | 0 | |
Taxation | | | (290,652,595 | ) | | | (266,213,639 | ) | | | (234,648,661 | ) | | | (240,605,826 | ) | | | (223,187,062 | ) | | | (213,675,001 | ) | | | (169,220,877 | ) | | | (193,597,320 | ) | | | (0 | ) |
Income after tax | | | 747,392,387 | | | | 684,549,357 | | | | 603,382,270 | | | | 618,700,696 | | | | 573,909,588 | | | | 549,450,002 | | | | 435,139,397 | | | | 497,821,680 | | | | 0 | |
Working capital changes | | | 15,532,928 | | | | 18,567,603 | | | | 11,058,384 | | | | (5,666,302 | ) | | | 17,002,276 | | | | 8,111,628 | | | | 42,440,582 | | | | 38,111,904 | | | | 210,471,168 | |
| | | | | | | | | |
Cash Flow | | | | | | | | | | | | | | | | | | | | | | | | | | | | | | | | | | | | |
Net Cash Flow | | | 762,925,314 | | | | 703,116,960 | | | | 614,440,654 | | | | 613,034,394 | | | | 590,911,864 | | | | 557,561,631 | | | | 477,579,978 | | | | 535,933,584 | | | | 210,471,168 | |
Cumulative Net Cash Flow | | | 9,881,294,522 | | | | 10,584,411,482 | | | | 11,198,852,136 | | | | 11,811,886,530 | | | | 12,402,798,394 | | | | 12,960,360,024 | | | | 13,437,940,003 | | | | 13,973,873,586 | | | | 14,184,344,755 | |
Prepared by Minxcon (Pty) Ltd
H-59
| | |
| CIMVal Compliant Report on the Ga-Phasha East Project, South Africa | | H-60 |
APPENDIX 3: Ga-Phasha Discounted Cash Flow (Nominal Terms)
| | |
| Project Title: | | Ga-Pasha |
| Client: | | Anooraq Resource Corporation |
| Project Code: | | M12-007 |
| | | | | | | | | | | | | | | | | | |
Project Valuation Schedule | | | | | | | | | | | | | | | |
Project Valuation Date (Base Date) | | | 01-Jan-12 | | | | | Commodity Price | | | 100 | % | | Fixed Costs | | | 100 | % |
Financial Year End (month and year) | | | 31-Dec-12 | | | | | Exchange Rate | | | 100 | % | | Variable Cost | | | 100 | % |
First Year | | | 0 | | | | | Grade | | | 100 | % | | Mining Capex | | | 100 | % |
Days remaining | | | 365 | | | | | | | | | | | Plant Capex | | | 100 | % |
| | | | | | | | | | | | | | | | | | | | | | | | | | | | | | | | | | | | | | | | |
Project Duration | | | | Unit | | Totals | | | | | | | | | | | | | | | | | | | | | | | | | |
Calendar Years | | | | | | | | | | | 1 | | | | 2 | | | | 3 | | | | 4 | | | | 5 | | | | 6 | | | | 7 | | | | 8 | |
Financial Years | | | | years | | | 30 | | | | 0 | | | | 0 | | | | 0 | | | | 0 | | | | 0 | | | | 0 | | | | 1 | | | | 2 | |
12.6% | | | | | | | | | | | | | | | | | | | | | | | | | | | | | | | | | | | | | | | | |
Macro-Economic Factors (Real Terms) | | | | | | | | | | | | | | | | | | | | | | | | | | | | | | | | | | | | | | | | |
| | | | | | | | | | | |
Currency | | | | ZAR/USD | | | 17.32 | | | | 0.000 | | | | 0.000 | | | | 0.000 | | | | 0.000 | | | | 0.000 | | | | 0.000 | | | | 10.208 | | | | 10.556 | |
Inflation | | ZAR Inflation Rate | | % | | | 5.82 | % | | | 5.40 | % | | | 5.40 | % | | | 4.40 | % | | | 4.60 | % | | | 4.60 | % | | | 4.60 | % | | | 6.00 | % | | | 6.00 | % |
Inflation | | US Inflation Rate | | % | | | 2.46 | % | | | 1.98 | % | | | 1.94 | % | | | 2.40 | % | | | 2.40 | % | | | 2.40 | % | | | 2.50 | % | | | 2.50 | % | | | 2.50 | % |
Inflation | | Cost Inflation | | % | | | 6.04 | % | | | 5.00 | % | | | 5.50 | % | | | 5.50 | % | | | 6.00 | % | | | 6.10 | % | | | 6.10 | % | | | 6.10 | % | | | 6.10 | % |
Inflation | | Capex inflation | | % | | | 6.04 | % | | | 5.00 | % | | | 5.50 | % | | | 5.50 | % | | | 6.00 | % | | | 6.10 | % | | | 6.10 | % | | | 6.10 | % | | | 6.10 | % |
Commodities | | | | | | | | | | | | | | | | | | | | | | | | | | | | | | | | | | | | | | | | |
Commodity prices | | Gold | | USD/oz. | | | 1,880 | | | | 0 | | | | 0 | | | | 0 | | | | 0 | | | | 0 | | | | 0 | | | | 1,284 | | | | 1,317 | |
Commodity prices | | Platinum | | USD/oz. | | | 2,765 | | | | 0 | | | | 0 | | | | 0 | | | | 0 | | | | 0 | | | | 0 | | | | 1,889 | | | | 1,936 | |
Commodity prices | | Palladium | | USD/oz. | | | 1,247 | | | | 0 | | | | 0 | | | | 0 | | | | 0 | | | | 0 | | | | 0 | | | | 852 | | | | 874 | |
Commodity prices | | Rhodium | | USD/oz. | | | 2,871 | | | | 0 | | | | 0 | | | | 0 | | | | 0 | | | | 0 | | | | 0 | | | | 1,962 | | | | 2,011 | |
Commodity prices | | Iridium | | USD/oz. | | | 715 | | | | 0 | | | | 0 | | | | 0 | | | | 0 | | | | 0 | | | | 0 | | | | 489 | | | | 501 | |
Commodity prices | | Ruthenium | | USD/oz. | | | 126 | | | | 0 | | | | 0 | | | | 0 | | | | 0 | | | | 0 | | | | 0 | | | | 86 | | | | 88 | |
Commodity prices | | Nickel | | USD/tonne | | | 32,320 | | | | 0 | | | | 0 | | | | 0 | | | | 0 | | | | 0 | | | | 0 | | | | 22,085 | | | | 22,637 | |
Commodity prices | | Copper | | USD/tonne | | | 9,659 | | | | 0 | | | | 0 | | | | 0 | | | | 0 | | | | 0 | | | | 0 | | | | 6,600 | | | | 6,765 | |
Operating Statistics | | | | | | | | | | | | | | | | | | | | | | | | | | | | | | | | | | | | | | | | |
Tonnes Produced | | | | | | | | | | | | | | | | | | | | | | | | | | | | | | | | | | | | | | | | |
ROM | | | | tonnes | | | 37,861,000 | | | | — | | | | — | | | | — | | | | — | | | | — | | | | — | | | | 14,000 | | | | 44,000 | |
ROM | | (Max) | | tonnes/mnth | | | 126,833 | | | | — | | | | — | | | | — | | | | — | | | | — | | | | — | | | | 1,167 | | | | 3,667 | |
Mill Head grade | | Precious metals | | g/t | | | 5.45 | | | | — | | | | — | | | | — | | | | — | | | | — | | | | — | | | | 0.42 | | | | 3.67 | |
Mill Head grade | | Nickel | | % | | | 0.14 | % | | | 0.00 | % | | | 0.00 | % | | | 0.00 | % | | | 0.00 | % | | | 0.00 | % | | | 0.00 | % | | | 0.14 | % | | | 0.14 | % |
Mill Head grade | | Copper | | % | | | 0.03 | % | | | 0.00 | % | | | 0.00 | % | | | 0.00 | % | | | 0.00 | % | | | 0.00 | % | | | 0.00 | % | | | 0.03 | % | | | 0.03 | % |
Tonnes to mill | | | | tonnes | | | 37,861,000 | | | | — | | | | — | | | | — | | | | — | | | | — | | | | — | | �� | | 14,000 | | | | 44,000 | |
Recovered Grade | | | | | | | | | | | | | | | | | | | | | | | | | | | | | | | | | | | | | | | | |
Recovered grade | | Precious Metals | | g/t | | | 4.78 | | | | 0.00 | | | | 0.00 | | | | 0.00 | | | | 0.00 | | | | 0.00 | | | | 0.00 | | | | 0.37 | | | | 3.22 | |
Recovered grade | | Nickel | | % | | | 0 | % | | | 0.00 | % | | | 0.00 | % | | | 0.00 | % | | | 0.00 | % | | | 0.00 | % | | | 0.00 | % | | | 0.09 | % | | | 0.09 | % |
Recovered grade | | Copper | | % | | | 0 | % | | | 0.00 | % | | | 0.00 | % | | | 0.00 | % | | | 0.00 | % | | | 0.00 | % | | | 0.00 | % | | | 0.02 | % | | | 0.02 | % |
Recovered grade | | Cobalt | | % | | | 0 | % | | | 0.00 | % | | | 0.00 | % | | | 0.00 | % | | | 0.00 | % | | | 0.00 | % | | | 0.00 | % | | | 0.00 | % | | | 0.00 | % |
| | | | | | | | | | | 0.00 | | | | 0.00 | | | | 0.00 | | | | 0.00 | | | | 0.00 | | | | 0.00 | | | | 0.00 | | | | 0.00 | |
Metal recovered | | | | | | | | | | | | | | | | | | | | | | | | | | | | | | | | | | | | | | | | |
Metal recovered | | Gold | | kg | | | 3,420 | | | | — | | | | — | | | | — | | | | — | | | | — | | | | — | | | | 0 | | | | 3 | |
Metal recovered | | Platinum | | kg | | | 80,358 | | | | — | | | | — | | | | — | | | | — | | | | — | | | | — | | | | 2 | | | | 63 | |
Metal recovered | | Palladium | | kg | | | 82,245 | | | | — | | | | — | | | | — | | | | — | | | | — | | | | — | | | | 2 | | | | 64 | |
Metal recovered | | Rhodium | | kg | | | 15,095 | | | | — | | | | — | | | | — | | | | — | | | | — | | | | — | | | | 0 | | | | 12 | |
| | | | | | | | | | | |
Metal recovered | | Gold | | oz | | | 109,949 | | | | — | | | | — | | | | — | | | | — | | | | — | | | | — | | | | 3 | | | | 86 | |
Metal recovered | | Platinum | | oz | | | 2,583,586 | | | | — | | | | — | | | | — | | | | — | | | | — | | | | — | | | | 74 | | | | 2,022 | |
Metal recovered | | Palladium | | oz | | | 2,644,233 | | | | — | | | | — | | | | — | | | | — | | | | — | | | | — | | | | 75 | | | | 2,070 | |
Metal recovered | | Rhodium | | oz | | | 485,327 | | | | — | | | | — | | | | — | | | | — | | | | — | | | | — | | | | 14 | | | | 380 | |
Metal recovered | | Nickel | | tonnes | | | 32,464 | | | | — | | | | — | | | | — | | | | — | | | | — | | | | — | | | | 12 | | | | 38 | |
Metal recovered | | Copper | | tonnes | | | 7,860 | | | | — | | | | — | | | | — | | | | — | | | | — | | | | — | | | | 3 | | | | 9 | |
| | | | | | | | | | | |
Financial | | | | | | | | | | | | | | | | | | | | | | | | | | | | | | | | | | | | | | | | |
Revenue | | | | ZAR | | | 253,112,011,541 | | | | — | | | | — | | | | — | | | | — | | | | — | | | | — | | | | 5,295,880 | | | | 79,352,483 | |
Revenue | | Gold | | ZAR | | | 3,970,961,747 | | | | 0 | | | | 0 | | | | 0 | | | | 0 | | | | 0 | | | | 0 | | | | 41,085 | | | | 1,195,986 | |
Revenue | | Platinum | | ZAR | | | 137,244,687,596 | | | | 0 | | | | 0 | | | | 0 | | | | 0 | | | | 0 | | | | 0 | | | | 1,419,968 | | | | 41,335,746 | |
Revenue | | Palladium | | ZAR | | | 63,380,131,382 | | | | 0 | | | | 0 | | | | 0 | | | | 0 | | | | 0 | | | | 0 | | | | 655,747 | | | | 19,089,008 | |
Revenue | | Rhodium | | ZAR | | | 26,773,376,854 | | | | 0 | | | | 0 | | | | 0 | | | | 0 | | | | 0 | | | | 0 | | | | 277,004 | | | | 8,063,682 | |
Revenue | | Nickel | | ZAR | | | 20,275,800,384 | | | | 0 | | | | 0 | | | | 0 | | | | 0 | | | | 0 | | | | 0 | | | | 2,706,265 | | | | 9,015,730 | |
Revenue | | Copper | | ZAR | | | 1,467,053,576 | | | | 0 | | | | 0 | | | | 0 | | | | 0 | | | | 0 | | | | 0 | | | | 195,812 | | | | 652,332 | |
Mining cost | | | | | | | (95,327,433,146 | ) | | | 0 | | | | 0 | | | | 0 | | | | 0 | | | | 0 | | | | 0 | | | | (77,313,171 | ) | | | (138,688,269 | ) |
Variable Cost | | | | ZAR | | | (95,327,433,146 | ) | | | 0 | | | | 0 | | | | 0 | | | | 0 | | | | 0 | | | | 0 | | | | (77,313,171 | ) | | | (138,688,269 | ) |
Plant cost | | | | | | | (16,307,879,715 | ) | | | 0 | | | | 0 | | | | 0 | | | �� | 0 | | | | 0 | | | | 0 | | | | (2,290,813 | ) | | | (7,631,681 | ) |
Variable Cost | | | | ZAR | | | (16,307,879,715 | ) | | | 0 | | | | 0 | | | | 0 | | | | 0 | | | | 0 | | | | 0 | | | | (2,290,813 | ) | | | (7,631,681 | ) |
Cash Operating Costs | | | | ZAR | | | (111,635,312,861 | ) | | | 0 | | | | 0 | | | | 0 | | | | 0 | | | | 0 | | | | 0 | | | | (79,603,984 | ) | | | (146,319,950 | ) |
Royalty Act No 28 of 2008 | | | | ZAR | | | (8,634,444,526 | ) | | | 0 | | | | 0 | | | | 0 | | | | 0 | | | | 0 | | | | 0 | | | | (26,479 | ) | | | (396,762 | ) |
Total Cash Costs | | | | ZAR | | | (120,269,757,387 | ) | | | 0 | | | | 0 | | | | 0 | | | | 0 | | | | 0 | | | | 0 | | | | (79,630,463 | ) | | | (146,716,712 | ) |
Rehabilitation | | | | ZAR | | | (435,166,105 | ) | | | 0 | | | | 0 | | | | 0 | | | | 0 | | | | 0 | | | | 0 | | | | 0 | | | | (6,869,934 | ) |
Other Costs Variable | | | | ZAR | | | (31,792,092,631 | ) | | | 0 | | | | 0 | | | | 0 | | | | 0 | | | | 0 | | | | 0 | | | | (5,117,420 | ) | | | (18,706,271 | ) |
Total Production Costs | | | | ZAR | | | (152,497,016,123 | ) | | | 0 | | | | 0 | | | | 0 | | | | 0 | | | | 0 | | | | 0 | | | | (84,747,884 | ) | | | (172,292,918 | ) |
EBITDA | | | | ZAR | | | 100,614,995,418 | | | | 0 | | | | 0 | | | | 0 | | | | 0 | | | | 0 | | | | 0 | | | | (79,452,004 | ) | | | (92,940,434 | ) |
Capital expenditure | | | | ZAR | | | (11,155,444,441 | ) | | | 0 | | | | (5,270,000 | ) | | | (11,003,760 | ) | | | (17,495,098 | ) | | | (170,477,761 | ) | | | (406,382,622 | ) | | | (664,369,473 | ) | | | (1,393,999,237 | ) |
EBIT | | | | ZAR | | | 89,459,550,977 | | | | 0 | | | | (5,270,000 | ) | | | (11,003,760 | ) | | | (17,495,098 | ) | | | (170,477,761 | ) | | | (406,382,622 | ) | | | (743,821,477 | ) | | | (1,486,939,672 | ) |
Taxation | | | | ZAR | | | (23,198,863,703 | ) | | | 0 | | | | 0 | | | | 0 | | | | 0 | | | | 0 | | | | 0 | | | | 0 | | | | 0 | |
Income after tax | | | | ZAR | | | 66,260,687,275 | | | | 0 | | | | (5,270,000 | ) | | | (11,003,760 | ) | | | (17,495,098 | ) | | | (170,477,761 | ) | | | (406,382,622 | ) | | | (743,821,477 | ) | | | (1,486,939,672 | ) |
Working capital changes | | | | ZAR | | | 1 | | | | 0 | | | | 0 | | | | 0 | | | | 0 | | | | 0 | | | | 0 | | | | 6,049,320 | | | | (6,181,977 | ) |
| | | | | | | | | | | |
Cash Flow | | | | | | | | | | | | | | | | | | | | | | | | | | | | | | | | | | | | | | | | |
Net Cash Flow | | Annual cash flow | | ZAR | | | 66,260,687,275 | | | | 0 | | | | (5,270,000 | ) | | | (11,003,760 | ) | | | (17,495,098 | ) | | | (170,477,761 | ) | | | (406,382,622 | ) | | | (737,772,157 | ) | | | (1,493,121,648 | ) |
Cumulative Net Cash Flow | | Cumulative cash flow | | ZAR | | | | | | | 0 | | | | (5,270,000 | ) | | | (16,273,760 | ) | | | (33,768,858 | ) | | | (204,246,619 | ) | | | (610,629,241 | ) | | | (1,348,401,399 | ) | | | (2,841,523,047 | ) |
Prepared by Minxcon (Pty) Ltd
H-60
| | |
| CIMVal Compliant Report on the Ga-Phasha East Project, South Africa | | H-61 |
| | | | | | | | | | | | | | | | | | | | | | | | | | | | | | | | | | | | | | | | |
Project Duration | | | | | | | | | | | | | | | | | | | | | | | | | | | | | | |
Calendar Years | | | 9 | | | | 10 | | | | 11 | | | | 12 | | | | 13 | | | | 14 | | | | 15 | | | | 16 | | | | 17 | | | | 18 | |
Financial Years | | | 3 | | | | 4 | | | | 5 | | | | 6 | | | | 7 | | | | 8 | | | | 9 | | | | 10 | | | | 11 | | | | 12 | |
12.6% | | | | | | | | | | | | | | | | | | | | | | | | | | | | | | | | | | | | | | | | |
Macro-Economic Factors (Real Terms) | | | | | | | | | | | | | | | | | | | | | | | | | | | | | | | | | | | | | | | | |
| | | | | | | | | | |
Currency | | | 10.917 | | | | 11.290 | | | | 11.675 | | | | 12.074 | | | | 12.486 | | | | 12.912 | | | | 13.353 | | | | 13.809 | | | | 14.281 | | | | 14.768 | |
Inflation | | | 6.00 | % | | | 6.00 | % | | | 6.00 | % | | | 6.00 | % | | | 6.00 | % | | | 6.00 | % | | | 6.00 | % | | | 6.00 | % | | | 6.00 | % | | | 6.00 | % |
Inflation | | | 2.50 | % | | | 2.50 | % | | | 2.50 | % | | | 2.50 | % | | | 2.50 | % | | | 2.50 | % | | | 2.50 | % | | | 2.50 | % | | | 2.50 | % | | | 2.50 | % |
Inflation | | | 6.10 | % | | | 6.10 | % | | | 6.10 | % | | | 6.10 | % | | | 6.10 | % | | | 6.10 | % | | | 6.10 | % | | | 6.10 | % | | | 6.10 | % | | | 6.10 | % |
Inflation | | | 6.10 | % | | | 6.10 | % | | | 6.10 | % | | | 6.10 | % | | | 6.10 | % | | | 6.10 | % | | | 6.10 | % | | | 6.10 | % | | | 6.10 | % | | | 6.10 | % |
Commodities | | | | | | | | | | | | | | | | | | | | | | | | | | | | | | | | | | | | | | | | |
Commodity prices | | | 1,349 | | | | 1,383 | | | | 1,418 | | | | 1,453 | | | | 1,490 | | | | 1,527 | | | | 1,565 | | | | 1,604 | | | | 1,644 | | | | 1,685 | |
Commodity prices | | | 1,985 | | | | 2,034 | | | | 2,085 | | | | 2,137 | | | | 2,191 | | | | 2,246 | | | | 2,302 | | | | 2,359 | | | | 2,418 | | | | 2,479 | |
Commodity prices | | | 896 | | | | 918 | | | | 941 | | | | 964 | | | | 989 | | | | 1,013 | | | | 1,039 | | | | 1,065 | | | | 1,091 | | | | 1,118 | |
Commodity prices | | | 2,061 | | | | 2,113 | | | | 2,166 | | | | 2,220 | | | | 2,275 | | | | 2,332 | | | | 2,390 | | | | 2,450 | | | | 2,511 | | | | 2,574 | |
Commodity prices | | | 513 | | | | 526 | | | | 539 | | | | 553 | | | | 567 | | | | 581 | | | | 595 | | | | 610 | | | | 626 | | | | 641 | |
Commodity prices | | | 91 | | | | 93 | | | | 95 | | | | 98 | | | | 100 | | | | 103 | | | | 105 | | | | 108 | | | | 110 | | | | 113 | |
Commodity prices | | | 23,203 | | | | 23,783 | | | | 24,378 | | | | 24,987 | | | | 25,612 | | | | 26,252 | | | | 26,908 | | | | 27,581 | | | | 28,271 | | | | 28,977 | |
Commodity prices | | | 6,935 | | | | 7,108 | | | | 7,286 | | | | 7,468 | | | | 7,654 | | | | 7,846 | | | | 8,042 | | | | 8,243 | | | | 8,449 | | | | 8,660 | |
Operating Statistics | | | | | | | | | | | | | | | | | | | | | | | | | | | | | | | | | | | | | | | | |
Tonnes Produced | | | | | | | | | | | | | | | | | | | | | | | | | | | | | | | | | | | | | | | | |
ROM | | | 140,000 | | | | 938,000 | | | | 1,022,000 | | | | 1,296,000 | | | | 1,451,000 | | | | 1,506,000 | | | | 1,504,000 | | | | 1,510,000 | | | | 1,502,000 | | | | 1,497,000 | |
ROM | | | 11,667 | | | | 78,167 | | | | 85,167 | | | | 108,000 | | | | 120,917 | | | | 125,500 | | | | 125,333 | | | | 125,833 | | | | 125,167 | | | | 124,750 | |
Mill Head grade | | | 5.34 | | | | 5.43 | | | | 5.49 | | | | 5.50 | | | | 5.59 | | | | 5.67 | | | | 5.65 | | | | 5.56 | | | | 5.49 | | | | 5.47 | |
Mill Head grade | | | 0.14 | % | | | 0.14 | % | | | 0.14 | % | | | 0.14 | % | | | 0.14 | % | | | 0.14 | % | | | 0.14 | % | | | 0.14 | % | | | 0.14 | % | | | 0.14 | % |
Mill Head grade | | | 0.03 | % | | | 0.03 | % | | | 0.03 | % | | | 0.03 | % | | | 0.03 | % | | | 0.03 | % | | | 0.03 | % | | | 0.03 | % | | | 0.03 | % | | | 0.03 | % |
Tonnes to mill | | | 140,000 | | | | 938,000 | | | | 1,022,000 | | | | 1,296,000 | | | | 1,451,000 | | | | 1,506,000 | | | | 1,504,000 | | | | 1,510,000 | | | | 1,502,000 | | | | 1,497,000 | |
Recovered Grade | | | | | | | | | | | | | | | | | | | | | | | | | | | | | | | | | | | | | | | | |
Recovered grade | | | 4.69 | | | | 4.77 | | | | 4.82 | | | | 4.83 | | | | 4.91 | | | | 4.98 | | | | 4.96 | | | | 4.88 | | | | 4.82 | | | | 4.80 | |
Recovered grade | | | 0.09 | % | | | 0.09 | % | | | 0.09 | % | | | 0.09 | % | | | 0.09 | % | | | 0.09 | % | | | 0.09 | % | | | 0.09 | % | | | 0.09 | % | | | 0.09 | % |
Recovered grade | | | 0.02 | % | | | 0.02 | % | | | 0.02 | % | | | 0.02 | % | | | 0.02 | % | | | 0.02 | % | | | 0.02 | % | | | 0.02 | % | | | 0.02 | % | | | 0.02 | % |
Recovered grade | | | 0.00 | % | | | 0.00 | % | | | 0.00 | % | | | 0.00 | % | | | 0.00 | % | | | 0.00 | % | | | 0.00 | % | | | 0.00 | % | | | 0.00 | % | | | 0.00 | % |
| | | 0.00 | | | | 0.00 | | | | 0.00 | | | | 0.00 | | | | 0.00 | | | | 0.00 | | | | 0.00 | | | | 0.00 | | | | 0.00 | | | | 0.00 | |
Metal recovered | | | | | | | | | | | | | | | | | | | | | | | | | | | | | | | | | | | | | | | | |
Metal recovered | | | 12 | | | | 84 | | | | 93 | | | | 118 | | | | 134 | | | | 142 | | | | 141 | | | | 139 | | | | 137 | | | | 136 | |
Metal recovered | | | 291 | | | | 1,984 | | | | 2,187 | | | | 2,776 | | | | 3,159 | | | | 3,326 | | | | 3,310 | | | | 3,270 | | | | 3,212 | | | | 3,189 | |
Metal recovered | | | 298 | | | | 2,030 | | | | 2,238 | | | | 2,842 | | | | 3,233 | | | | 3,404 | | | | 3,387 | | | | 3,347 | | | | 3,287 | | | | 3,264 | |
Metal recovered | | | 55 | | | | 373 | | | | 411 | | | | 522 | | | | 593 | | | | 625 | | | | 622 | | | | 614 | | | | 603 | | | | 599 | |
| | | | | | | | | | |
Metal recovered | | | 398 | | | | 2,714 | | | | 2,992 | | | | 3,799 | | | | 4,323 | | | | 4,551 | | | | 4,529 | | | | 4,474 | | | | 4,394 | | | | 4,364 | |
Metal recovered | | | 9,362 | | | | 63,782 | | | | 70,309 | | | | 89,262 | | | | 101,573 | | | | 106,931 | | | | 106,413 | | | | 105,135 | | | | 103,262 | | | | 102,543 | |
Metal recovered | | | 9,582 | | | | 65,279 | | | | 71,960 | | | | 91,357 | | | | 103,957 | | | | 109,441 | | | | 108,911 | | | | 107,603 | | | | 105,686 | | | | 104,950 | |
Metal recovered | | | 1,759 | | | | 11,982 | | | | 13,208 | | | | 16,768 | | | | 19,080 | | | | 20,087 | | | | 19,990 | | | | 19,750 | | | | 19,398 | | | | 19,263 | |
Metal recovered | | | 120 | | | | 804 | | | | 876 | | | | 1,111 | | | | 1,244 | | | | 1,291 | | | | 1,290 | | | | 1,295 | | | | 1,288 | | | | 1,284 | |
Metal recovered | | | 29 | | | | 195 | | | | 212 | | | | 269 | | | | 301 | | | | 313 | | | | 312 | | | | 313 | | | | 312 | | | | 311 | |
| | | | | | | | | | |
Financial | | | | | | | | | | | | | | | | | | | | | | | | | | | | | | | | | | | | | | | | |
Revenue | | | 374,580,970 | | | | 2,701,207,094 | | | | 3,153,145,162 | | | | 4,242,877,590 | | | | 5,110,754,477 | | | | 5,696,496,567 | | | | 6,010,749,365 | | | | 6,303,339,736 | | | | 6,569,486,721 | | | | 6,917,336,561 | |
Revenue | | | 5,869,247 | | | | 42,385,918 | | | | 49,526,714 | | | | 66,649,723 | | | | 80,392,538 | | | | 89,711,975 | | | | 94,633,420 | | | | 99,107,348 | | | | 103,181,600 | | | | 108,611,290 | |
Revenue | | | 202,853,354 | | | | 1,464,945,380 | | | | 1,711,746,137 | | | | 2,303,552,879 | | | | 2,778,533,137 | | | | 3,100,632,225 | | | | 3,270,727,594 | | | | 3,425,355,844 | | | | 3,566,170,462 | | | | 3,753,831,837 | |
Revenue | | | 93,678,469 | | | | 676,517,483 | | | | 790,491,034 | | | | 1,063,789,693 | | | | 1,283,137,427 | | | | 1,431,884,040 | | | | 1,510,434,744 | | | | 1,581,842,673 | | | | 1,646,871,412 | | | | 1,733,534,166 | |
Revenue | | | 39,572,164 | | | | 285,778,163 | | | | 333,923,485 | | | | 449,371,778 | | | | 542,029,831 | | | | 604,864,177 | | | | 638,045,989 | | | | 668,210,511 | | | | 695,680,302 | | | | 732,288,850 | |
Revenue | | | 30,407,598 | | | | 215,954,764 | | | | 249,411,636 | | | | 335,256,095 | | | | 397,873,449 | | | | 437,732,087 | | | | 463,379,816 | | | | 493,142,110 | | | | 519,961,203 | | | | 549,324,125 | |
Revenue | | | 2,200,139 | | | | 15,625,386 | | | | 18,046,155 | | | | 24,257,422 | | | | 28,788,095 | | | | 31,672,063 | | | | 33,527,802 | | | | 35,681,250 | | | | 37,621,743 | | | | 39,746,294 | |
Mining cost | | | (238,463,808 | ) | | | (1,257,844,497 | ) | | | (1,259,023,285 | ) | | | (1,588,229,043 | ) | | | (1,792,167,903 | ) | | | (1,903,723,266 | ) | | | (2,015,266,786 | ) | | | (2,144,704,799 | ) | | | (2,261,342,652 | ) | | | (2,389,043,773 | ) |
Variable Cost | | | (238,463,808 | ) | | | (1,257,844,497 | ) | | | (1,259,023,285 | ) | | | (1,588,229,043 | ) | | | (1,792,167,903 | ) | | | (1,903,723,266 | ) | | | (2,015,266,786 | ) | | | (2,144,704,799 | ) | | | (2,261,342,652 | ) | | | (2,389,043,773 | ) |
Plant cost | | | (25,739,577 | ) | | | (1,102,108,954 | ) | | | (685,384,030 | ) | | | (469,671,476 | ) | | | (346,685,083 | ) | | | (381,415,713 | ) | | | (331,061,944 | ) | | | (352,325,630 | ) | | | (371,486,544 | ) | | | (392,464,899 | ) |
Variable Cost | | | (25,739,577 | ) | | | (1,102,108,954 | ) | | | (685,384,030 | ) | | | (469,671,476 | ) | | | (346,685,083 | ) | | | (381,415,713 | ) | | | (331,061,944 | ) | | | (352,325,630 | ) | | | (371,486,544 | ) | | | (392,464,899 | ) |
Cash Operating Costs | | | (264,203,386 | ) | | | (2,359,953,452 | ) | | | (1,944,407,315 | ) | | | (2,057,900,519 | ) | | | (2,138,852,986 | ) | | | (2,285,138,979 | ) | | | (2,346,328,730 | ) | | | (2,497,030,429 | ) | | | (2,632,829,196 | ) | | | (2,781,508,672 | ) |
Royalty Act No 28 of 2008 | | | (1,872,905 | ) | | | (13,506,035 | ) | | | (15,765,726 | ) | | | (21,214,388 | ) | | | (25,553,772 | ) | | | (28,482,483 | ) | | | (158,195,032 | ) | | | (227,459,428 | ) | | | (233,585,208 | ) | | | (244,764,453 | ) |
Total Cash Costs | | | (266,076,291 | ) | | | (2,373,459,487 | ) | | | (1,960,173,041 | ) | | | (2,079,114,907 | ) | | | (2,164,406,758 | ) | | | (2,313,621,462 | ) | | | (2,504,523,762 | ) | | | (2,724,489,857 | ) | | | (2,866,414,404 | ) | | | (3,026,273,125 | ) |
Rehabilitation | | | (7,225,238 | ) | | | (7,598,447 | ) | | | (7,990,431 | ) | | | (8,402,098 | ) | | | (8,834,399 | ) | | | (9,288,329 | ) | | | (9,764,927 | ) | | | (10,265,279 | ) | | | (10,790,519 | ) | | | (11,341,833 | ) |
Other Costs Variable | | | (63,576,210 | ) | | | (422,452,978 | ) | | | (460,154,926 | ) | | | (600,337,706 | ) | | | (689,825,835 | ) | | | (732,573,292 | ) | | | (775,496,444 | ) | | | (819,482,308 | ) | | | (858,447,739 | ) | | | (904,308,015 | ) |
Total Production Costs | | | (336,877,739 | ) | | | (2,803,510,913 | ) | | | (2,428,318,398 | ) | | | (2,687,854,711 | ) | | | (2,863,066,992 | ) | | | (3,055,483,083 | ) | | | (3,289,785,134 | ) | | | (3,554,237,444 | ) | | | (3,735,652,662 | ) | | | (3,941,922,973 | ) |
EBITDA | | | 37,703,231 | | | | (102,303,818 | ) | | | 724,826,764 | | | | 1,555,022,880 | | | | 2,247,687,485 | | | | 2,641,013,484 | | | | 2,720,964,231 | | | | 2,749,102,291 | | | | 2,833,834,059 | | | | 2,975,413,588 | |
Capital expenditure | | | (1,581,816,353 | ) | | | (1,304,408,144 | ) | | | (718,835,249 | ) | | | (658,565,713 | ) | | | (323,335,653 | ) | | | (350,593,792 | ) | | | (379,097,419 | ) | | | (407,903,265 | ) | | | (426,371,460 | ) | | | (446,765,748 | ) |
EBIT | | | (1,544,113,122 | ) | | | (1,406,711,962 | ) | | | 5,991,515 | | | | 896,457,166 | | | | 1,924,351,832 | | | | 2,290,419,692 | | | | 2,341,866,812 | | | | 2,341,199,027 | | | | 2,407,462,599 | | | | 2,528,647,840 | |
Taxation | | | 0 | | | | 0 | | | | 0 | | | | 0 | | | | 0 | | | | 0 | | | | (199,703,227 | ) | | | (622,110,913 | ) | | | (637,178,352 | ) | | | (667,088,149 | ) |
Income after tax | | | (1,544,113,122 | ) | | | (1,406,711,962 | ) | | | 5,991,515 | | | | 896,457,166 | | | | 1,924,351,832 | | | | 2,290,419,692 | | | | 2,142,163,585 | | | | 1,719,088,114 | | | | 1,770,284,247 | | | | 1,861,559,691 | |
Working capital changes | | | (37,580,256 | ) | | | (199,831,893 | ) | | | (109,061,435 | ) | | | (167,240,722 | ) | | | (135,789,112 | ) | | | (85,563,694 | ) | | | (45,683,669 | ) | | | (34,500,182 | ) | | | (31,573,518 | ) | | | (44,050,267 | ) |
| | | | | | | | | | |
Cash Flow | | | | | | | | | | | | | | | | | | | | | | | | | | | | | | | | | | | | | | | | |
Net Cash Flow | | | (1,581,693,378 | ) | | | (1,606,543,855 | ) | | | (103,069,920 | ) | | | 729,216,444 | | | | 1,788,562,720 | | | | 2,204,855,999 | | | | 2,096,479,916 | | | | 1,684,587,931 | | | | 1,738,710,728 | | | | 1,817,509,424 | |
Cumulative Net Cash Flow | | | (4,423,216,425 | ) | | | (6,029,760,279 | ) | | | (6,132,830,200 | ) | | | (5,403,613,755 | ) | | | (3,615,051,035 | ) | | | (1,410,195,037 | ) | | | 686,284,879 | | | | 2,370,872,811 | | | | 4,109,583,539 | | | | 5,927,092,963 | |
Prepared by Minxcon (Pty) Ltd
H-61
| | |
| CIMVal Compliant Report on the Ga-Phasha East Project, South Africa | | H-62 |
| | | | | | | | | | | | | | | | | | | | | | | | | | | | | | | | | | | | | | | | |
Project Duration | | | | | | | | | | | | | | | | | | | | | | | | | | | | | | |
Calendar Years | | | 19 | | | | 20 | | | | 21 | | | | 22 | | | | 23 | | | | 24 | | | | 25 | | | | 26 | | | | 27 | | | | 28 | |
Financial Years | | | 13 | | | | 14 | | | | 15 | | | | 16 | | | | 17 | | | | 18 | | | | 19 | | | | 20 | | | | 21 | | | | 22 | |
12.6% | | | | | | | | | | | | | | | | | | | | | | | | | | | | | | | | | | | | | | | | |
Macro-Economic Factors (Real Terms) | | | | | | | | | | | | | | | | | | | | | | | | | | | | | | | | | | | | | | | | |
| | | | | | | | | | |
Currency | | | 15.273 | | | | 15.794 | | | | 16.333 | | | | 16.891 | | | | 17.468 | | | | 18.064 | | | | 18.681 | | | | 19.319 | | | | 19.979 | | | | 20.661 | |
Inflation | | | 6.00 | % | | | 6.00 | % | | | 6.00 | % | | | 6.00 | % | | | 6.00 | % | | | 6.00 | % | | | 6.00 | % | | | 6.00 | % | | | 6.00 | % | | | 6.00 | % |
Inflation | | | 2.50 | % | | | 2.50 | % | | | 2.50 | % | | | 2.50 | % | | | 2.50 | % | | | 2.50 | % | | | 2.50 | % | | | 2.50 | % | | | 2.50 | % | | | 2.50 | % |
Inflation | | | 6.10 | % | | | 6.10 | % | | | 6.10 | % | | | 6.10 | % | | | 6.10 | % | | | 6.10 | % | | | 6.10 | % | | | 6.10 | % | | | 6.10 | % | | | 6.10 | % |
Inflation | | | 6.10 | % | | | 6.10 | % | | | 6.10 | % | | | 6.10 | % | | | 6.10 | % | | | 6.10 | % | | | 6.10 | % | | | 6.10 | % | | | 6.10 | % | | | 6.10 | % |
Commodities | | | | | | | | | | | | | | | | | | | | | | | | | | | | | | | | | | | | | | | | |
Commodity prices | | | 1,727 | | | | 1,771 | | | | 1,815 | | | | 1,860 | | | | 1,907 | | | | 1,954 | | | | 2,003 | | | | 2,053 | | | | 2,105 | | | | 2,157 | |
Commodity prices | | | 2,541 | | | | 2,604 | | | | 2,669 | | | | 2,736 | | | | 2,805 | | | | 2,875 | | | | 2,946 | | | | 3,020 | | | | 3,096 | | | | 3,173 | |
Commodity prices | | | 1,146 | | | | 1,175 | | | | 1,204 | | | | 1,235 | | | | 1,265 | | | | 1,297 | | | | 1,329 | | | | 1,363 | | | | 1,397 | | | | 1,432 | |
Commodity prices | | | 2,638 | | | | 2,704 | | | | 2,772 | | | | 2,841 | | | | 2,912 | | | | 2,985 | | | | 3,060 | | | | 3,136 | | | | 3,215 | | | | 3,295 | |
Commodity prices | | | 657 | | | | 674 | | | | 691 | | | | 708 | | | | 726 | | | | 744 | | | | 762 | | | | 781 | | | | 801 | | | | 821 | |
Commodity prices | | | 116 | | | | 119 | | | | 122 | | | | 125 | | | | 128 | | | | 131 | | | | 135 | | | | 138 | | | | 141 | | | | 145 | |
Commodity prices | | | 29,702 | | | | 30,444 | | | | 31,205 | | | | 31,986 | | | | 32,785 | | | | 33,605 | | | | 34,445 | | | | 35,306 | | | | 36,189 | | | | 37,094 | |
Commodity prices | | | 8,877 | | | | 9,099 | | | | 9,326 | | | | 9,559 | | | | 9,798 | | | | 10,043 | | | | 10,294 | | | | 10,552 | | | | 10,816 | | | | 11,086 | |
Operating Statistics | | | | | | | | | | | | | | | | | | | | | | | | | | | | | | | | | | | | | | | | |
Tonnes Produced | | | | | | | | | | | | | | | | | | | | | | | | | | | | | | | | | | | | | | | | |
ROM | | | 1,505,000 | | | | 1,494,000 | | | | 1,503,000 | | | | 1,489,000 | | | | 1,498,000 | | | | 1,522,000 | | | | 1,492,000 | | | | 1,491,000 | | | | 1,514,000 | | | | 1,514,000 | |
ROM | | | 125,417 | | | | 124,500 | | | | 125,250 | | | | 124,083 | | | | 124,833 | | | | 126,833 | | | | 124,333 | | | | 124,250 | | | | 126,167 | | | | 126,167 | |
Mill Head grade | | | 5.49 | | | | 5.49 | | | | 5.47 | | | | 5.40 | | | | 5.29 | | | | 5.43 | | | | 5.41 | | | | 5.38 | | | | 5.42 | | | | 5.47 | |
Mill Head grade | | | 0.14 | % | | | 0.14 | % | | | 0.14 | % | | | 0.14 | % | | | 0.14 | % | | | 0.14 | % | | | 0.14 | % | | | 0.14 | % | | | 0.14 | % | | | 0.14 | % |
Mill Head grade | | | 0.03 | % | | | 0.03 | % | | | 0.03 | % | | | 0.03 | % | | | 0.03 | % | | | 0.03 | % | | | 0.03 | % | | | 0.03 | % | | | 0.03 | % | | | 0.03 | % |
Tonnes to mill | | | 1,505,000 | | | | 1,494,000 | | | | 1,503,000 | | | | 1,489,000 | | | | 1,498,000 | | | | 1,522,000 | | | | 1,492,000 | | | | 1,491,000 | | | | 1,514,000 | | | | 1,514,000 | |
Recovered Grade | | | | | | | | | | | | | | | | | | | | | | | | | | | | | | | | | | | | | | | | |
Recovered grade | | | 4.82 | | | | 4.82 | | | | 4.80 | | | | 4.74 | | | | 4.64 | | | | 4.77 | | | | 4.75 | | | | 4.72 | | | | 4.76 | | | | 4.80 | |
Recovered grade | | | 0.09 | % | | | 0.09 | % | | | 0.09 | % | | | 0.09 | % | | | 0.09 | % | | | 0.09 | % | | | 0.09 | % | | | 0.09 | % | | | 0.09 | % | | | 0.09 | % |
Recovered grade | | | 0.02 | % | | | 0.02 | % | | | 0.02 | % | | | 0.02 | % | | | 0.02 | % | | | 0.02 | % | | | 0.02 | % | | | 0.02 | % | | | 0.02 | % | | | 0.02 | % |
Recovered grade | | | 0.00 | % | | | 0.00 | % | | | 0.00 | % | | | 0.00 | % | | | 0.00 | % | | | 0.00 | % | | | 0.00 | % | | | 0.00 | % | | | 0.00 | % | | | 0.00 | % |
| | | 0.00 | | | | 0.00 | | | | 0.00 | | | | 0.00 | | | | 0.00 | | | | 0.00 | | | | 0.00 | | | | 0.00 | | | | 0.00 | | | | 0.00 | |
Metal recovered | | | | | | | | | | | | | | | | | | | | | | | | | | | | | | | | | | | | | | | | |
Metal recovered | | | 137 | | | | 136 | | | | 136 | | | | 133 | | | | 131 | | | | 137 | | | | 134 | | | | 133 | | | | 136 | | | | 137 | |
Metal recovered | | | 3,218 | | | | 3,195 | | | | 3,202 | | | | 3,132 | | | | 3,087 | | | | 3,219 | | | | 3,144 | | | | 3,124 | | | | 3,196 | | | | 3,226 | |
Metal recovered | | | 3,294 | | | | 3,270 | | | | 3,277 | | | | 3,205 | | | | 3,159 | | | | 3,295 | | | | 3,218 | | | | 3,198 | | | | 3,271 | | | | 3,301 | |
Metal recovered | | | 605 | | | | 600 | | | | 602 | | | | 588 | | | | 580 | | | | 605 | | | | 591 | | | | 587 | | | | 600 | | | | 606 | |
| | | | | | | | | | |
Metal recovered | | | 4,403 | | | | 4,371 | | | | 4,381 | | | | 4,285 | | | | 4,223 | | | | 4,404 | | | | 4,302 | | | | 4,275 | | | | 4,373 | | | | 4,413 | |
Metal recovered | | | 103,468 | | | | 102,712 | | | | 102,954 | | | | 100,690 | | | | 99,235 | | | | 103,493 | | | | 101,080 | | | | 100,452 | | | | 102,760 | | | | 103,708 | |
Metal recovered | | | 105,897 | | | | 105,123 | | | | 105,371 | | | | 103,053 | | | | 101,564 | | | | 105,923 | | | | 103,452 | | | | 102,810 | | | | 105,172 | | | | 106,142 | |
Metal recovered | | | 19,436 | | | | 19,294 | | | | 19,340 | | | | 18,915 | | | | 18,641 | | | | 19,441 | | | | 18,988 | | | | 18,870 | | | | 19,303 | | | | 19,481 | |
Metal recovered | | | 1,290 | | | | 1,281 | | | | 1,289 | | | | 1,277 | | | | 1,284 | | | | 1,305 | | | | 1,279 | | | | 1,278 | | | | 1,298 | | | | 1,298 | |
Metal recovered | | | 312 | | | | 310 | | | | 312 | | | | 309 | | | | 311 | | | | 316 | | | | 310 | | | | 310 | | | | 314 | | | | 314 | |
| | | | | | | | | | |
Financial | | | | | | | | | | | | | | | | | | | | | | | | | | | | | | | | | | | | | | | | |
Revenue | | | 7,396,218,572 | | | | 7,782,689,422 | | | | 8,271,679,198 | | | | 8,584,615,637 | | | | 8,984,278,441 | | | | 9,909,501,538 | | | | 10,262,351,933 | | | | 10,815,705,930 | | | | 11,720,571,133 | | | | 12,528,573,760 | |
Revenue | | | 116,166,407 | | | | 122,236,391 | | | | 129,876,253 | | | | 134,641,136 | | | | 140,657,424 | | | | 155,494,675 | | | | 160,980,396 | | | | 169,579,241 | | | | 183,883,938 | | | | 196,715,101 | |
Revenue | | | 4,014,952,358 | | | | 4,224,743,623 | | | | 4,488,793,113 | | | | 4,653,477,359 | | | | 4,861,412,780 | | | | 5,374,219,003 | | | | 5,563,816,931 | | | | 5,861,010,884 | | | | 6,355,410,918 | | | | 6,798,882,580 | |
Revenue | | | 1,854,120,640 | | | | 1,951,003,063 | | | | 2,072,942,146 | | | | 2,148,993,973 | | | | 2,245,019,360 | | | | 2,481,835,271 | | | | 2,569,392,333 | | | | 2,706,637,658 | | | | 2,934,953,520 | | | | 3,139,750,461 | |
Revenue | | | 783,227,638 | | | | 824,153,234 | | | | 875,663,399 | | | | 907,789,622 | | | | 948,353,183 | | | | 1,048,390,238 | | | | 1,085,376,564 | | | | 1,143,352,474 | | | | 1,239,798,892 | | | | 1,326,310,320 | |
Revenue | | | 585,395,308 | | | | 615,983,672 | | | | 656,876,082 | | | | 689,802,924 | | | | 735,610,656 | | | | 792,239,909 | | | | 823,221,591 | | | | 872,030,024 | | | | 938,610,774 | | | | 994,927,420 | |
Revenue | | | 42,356,221 | | | | 44,569,439 | | | | 47,528,205 | | | | 49,910,624 | | | | 53,225,038 | | | | 57,322,442 | | | | 59,564,119 | | | | 63,095,648 | | | | 67,913,092 | | | | 71,987,877 | |
Mining cost | | | (2,545,919,527 | ) | | | (2,678,950,165 | ) | | | (2,856,793,725 | ) | | | (2,999,994,549 | ) | | | (3,199,215,141 | ) | | | (3,445,499,180 | ) | | | (3,580,240,383 | ) | | | (3,792,511,203 | ) | | | (4,082,074,902 | ) | | | (4,326,999,396 | ) |
Variable Cost | | | (2,545,919,527 | ) | | | (2,678,950,165 | ) | | | (2,856,793,725 | ) | | | (2,999,994,549 | ) | | | (3,199,215,141 | ) | | | (3,445,499,180 | ) | | | (3,580,240,383 | ) | | | (3,792,511,203 | ) | | | (4,082,074,902 | ) | | | (4,326,999,396 | ) |
Plant cost | | | (418,235,974 | ) | | | (440,089,846 | ) | | | (469,305,449 | ) | | | (492,830,048 | ) | | | (525,557,406 | ) | | | (566,016,204 | ) | | | (588,151,082 | ) | | | (623,022,292 | ) | | | (670,590,942 | ) | | | (710,826,399 | ) |
Variable Cost | | | (418,235,974 | ) | | | (440,089,846 | ) | | | (469,305,449 | ) | | | (492,830,048 | ) | | | (525,557,406 | ) | | | (566,016,204 | ) | | | (588,151,082 | ) | | | (623,022,292 | ) | | | (670,590,942 | ) | | | (710,826,399 | ) |
Cash Operating Costs | | | (2,964,155,501 | ) | | | (3,119,040,011 | ) | | | (3,326,099,174 | ) | | | (3,492,824,597 | ) | | | (3,724,772,546 | ) | | | (4,011,515,384 | ) | | | (4,168,391,465 | ) | | | (4,415,533,495) | | | | (4,752,665,844 | ) | | | (5,037,825,795 | ) |
Royalty Act No 28 of 2008 | | | (263,315,472 | ) | | | (308,041,177 | ) | | | (326,735,022 | ) | | | (341,475,649 | ) | | | (343,214,898 | ) | | | (389,343,716 | ) | | | (400,862,338 | ) | | | (419,919,671 | ) | | | (458,952,923 | ) | | | (496,348,140 | ) |
Total Cash Costs | | | (3,227,470,972 | ) | | | (3,427,081,189 | ) | | | (3,652,834,195 | ) | | | (3,834,300,247 | ) | | | (4,067,987,444 | ) | | | (4,400,859,099 | ) | | | (4,569,253,803 | ) | | | (4,835,453,165 | ) | | | (5,211,618,767 | )�� | | | (5,534,173,935 | ) |
Rehabilitation | | | (11,920,459 | ) | | | (12,527,689 | ) | | | (13,164,873 | ) | | | (13,833,419 | ) | | | (14,534,798 | ) | | | (15,270,542 | ) | | | (16,042,250 | ) | | | (16,851,588 | ) | | | (17,700,296 | ) | | | (18,590,182 | ) |
Other Costs Variable | | | (964,578,444 | ) | | | (1,016,256,187 | ) | | | (1,080,908,520 | ) | | | (1,042,774,269 | ) | | | (1,189,742,895 | ) | | | (1,295,939,671 | ) | | | (1,349,234,272 | ) | | | (1,423,388,547 | ) | | | (1,535,696,036 | ) | | | (1,636,975,621 | ) |
Total Production Costs | | | (4,203,969,875 | ) | | | (4,455,865,064 | ) | | | (4,746,907,588 | ) | | | (4,890,907,935 | ) | | | (5,272,265,138 | ) | | | (5,712,069,313 | ) | | | (5,934,530,325 | ) | | | (6,275,693,301) | | | | (6,765,015,099 | ) | | | (7,189,739,738 | ) |
EBITDA | | | 3,192,248,698 | | | | 3,326,824,358 | | | | 3,524,771,610 | | | | 3,693,707,702 | | | | 3,712,013,303 | | | | 4,197,432,225 | | | | 4,327,821,609 | | | | 4,540,012,629 | | | | 4,955,556,034 | | | | 5,338,834,022 | |
Capital expenditure | | | (467,053,693 | ) | | | (95,100,000 | ) | | | (94,200,000 | ) | | | (94,800,000 | ) | | | (96,300,000 | ) | | | (94,400,000 | ) | | | (94,300,000 | ) | | | (95,800,000 | ) | | | (95,800,000 | ) | | | (91,200,000 | ) |
EBIT | | | 2,725,195,005 | | | | 3,231,724,358 | | | | 3,430,571,610 | | | | 3,598,907,702 | | | | 3,615,713,303 | | | | 4,103,032,225 | | | | 4,233,521,609 | | | | 4,444,212,629 | | | | 4,859,756,034 | | | | 5,247,634,022 | |
Taxation | | | (718,441,993 | ) | | | (855,695,526 | ) | | | (907,332,383 | ) | | | (949,320,818 | ) | | | (947,927,099 | ) | | | (1,080,270,488 | ) | | | (1,111,185,569 | ) | | | (1,162,866,485 | ) | | | (1,272,718,416 | ) | | | (1,378,990,969 | ) |
Income after tax | | | 2,006,753,011 | | | | 2,376,028,832 | | | | 2,523,239,226 | | | | 2,649,586,884 | | | | 2,667,786,204 | | | | 3,022,761,737 | | | | 3,122,336,040 | | | | 3,281,346,144 | | | | 3,587,037,619 | | | | 3,868,643,053 | |
Working capital changes | | | (62,690,545 | ) | | | (49,728,208 | ) | | | (62,068,523 | ) | | | (43,444,549 | ) | | | (37,839,067 | ) | | | (127,399,635 | ) | | | (43,628,642 | ) | | | (69,102,500 | ) | | | (119,241,952 | ) | | | (107,701,314 | ) |
| | | | | | | | | | |
Cash Flow | | | | | | | | | | | | | | | | | | | | | | | | | | | | | | | | | | | | | | | | |
Net Cash Flow | | | 1,944,062,466 | | | | 2,326,300,624 | | | | 2,461,170,703 | | | | 2,606,142,335 | | | | 2,629,947,137 | | | | 2,895,362,103 | | | | 3,078,707,397 | | | | 3,212,243,643 | | | | 3,467,795,666 | | | | 3,760,941,739 | |
Cumulative Net Cash Flow | | | 7,871,155,429 | | | | 10,197,456,053 | | | | 12,658,626,756 | | | | 15,264,769,091 | | | | 17,894,716,228 | | | | 20,790,078,331 | | | | 23,868,785,728 | | | | 27,081,029,371 | | | | 30,548,825,037 | | | | 34,309,766,777 | |
Prepared by Minxcon (Pty) Ltd
H-62
| | |
| CIMVal Compliant Report on the Ga-Phasha East Project, South Africa | | H-63 |
| | | | | | | | | | | | | | | | | | | | | | | | | | | | | | | | | | | | |
Project Duration | | | | | | | | | | | | | | | | | | | | | | | | | | | |
Calendar Years | | | 29 | | | | 30 | | | | 31 | | | | 32 | | | | 33 | | | | 34 | | | | 35 | | | | 36 | | | | 37 | |
Financial Years | | | 23 | | | | 24 | | | | 25 | | | | 26 | | | | 27 | | | | 28 | | | | 29 | | | | 30 | | | | 0 | |
12.6% | | | | | | | | | | | | | | | | | | | | | | | | | | | | | | | | | | | | |
Macro-Economic Factors (Real Terms) | | | | | | | | | | | | | | | | | | | | | | | | | | | | | | | | | | | | |
| | | | | | | | | |
Currency | | | 21.366 | | | | 22.096 | | | | 22.851 | | | | 23.631 | | | | 24.438 | | | | 25.272 | | | | 26.135 | | | | 27.028 | | | | 0.000 | |
Inflation | | | 6.00 | % | | | 6.00 | % | | | 6.00 | % | | | 6.00 | % | | | 6.00 | % | | | 6.00 | % | | | 6.00 | % | | | 6.00 | % | | | 6.00 | % |
Inflation | | | 2.50 | % | | | 2.50 | % | | | 2.50 | % | | | 2.50 | % | | | 2.50 | % | | | 2.50 | % | | | 2.50 | % | | | 2.50 | % | | | 2.50 | % |
Inflation | | | 6.10 | % | | | 6.10 | % | | | 6.10 | % | | | 6.10 | % | | | 6.10 | % | | | 6.10 | % | | | 6.10 | % | | | 6.10 | % | | | 6.10 | % |
Inflation | | | 6.10 | % | | | 6.10 | % | | | 6.10 | % | | | 6.10 | % | | | 6.10 | % | | | 6.10 | % | | | 6.10 | % | | | 6.10 | % | | | 6.10 | % |
Commodities | | | | | | | | | | | | | | | | | | | | | | | | | | | | | | | | | | | | |
Commodity prices | | | 2,211 | | | | 2,267 | | | | 2,323 | | | | 2,381 | | | | 2,441 | | | | 2,502 | | | | 2,564 | | | | 2,628 | | | | 0 | |
Commodity prices | | | 3,252 | | | | 3,334 | | | | 3,417 | | | | 3,502 | | | | 3,590 | | | | 3,680 | | | | 3,772 | | | | 3,866 | | | | 0 | |
Commodity prices | | | 1,468 | | | | 1,504 | | | | 1,542 | | | | 1,580 | | | | 1,620 | | | | 1,660 | | | | 1,702 | | | | 1,744 | | | | 0 | |
Commodity prices | | | 3,378 | | | | 3,462 | | | | 3,548 | | | | 3,637 | | | | 3,728 | | | | 3,821 | | | | 3,917 | | | | 4,015 | | | | 0 | |
Commodity prices | | | 841 | | | | 862 | | | | 884 | | | | 906 | | | | 929 | | | | 952 | | | | 976 | | | | 1,000 | | | | 0 | |
Commodity prices | | | 148 | | | | 152 | | | | 156 | | | | 160 | | | | 164 | | | | 168 | | | | 172 | | | | 177 | | | | 0 | |
Commodity prices | | | 38,021 | | | | 38,971 | | | | 39,946 | | | | 40,944 | | | | 41,968 | | | | 43,017 | | | | 44,093 | | | | 45,195 | | | | 0 | |
Commodity prices | | | 11,363 | | | | 11,647 | | | | 11,938 | | | | 12,237 | | | | 12,543 | | | | 12,856 | | | | 13,178 | | | | 13,507 | | | | 0 | |
Operating Statistics | | | | | | | | | | | | | | | | | | | | | | | | | | | | | | | | | | | | |
Tonnes Produced | | | | | | | | | | | | | | | | | | | | | | | | | | | | | | | | | | | | |
ROM | | | 1,442,000 | | | | 1,366,000 | | | | 1,351,000 | | | | 1,382,000 | | | | 1,348,000 | | | | 1,352,000 | | | | 1,230,000 | | | | 944,000 | | | | — | |
ROM | | | 120,167 | | | | 113,833 | | | | 112,583 | | | | 115,167 | | | | 112,333 | | | | 112,667 | | | | 102,500 | | | | 78,667 | | | | — | |
Mill Head grade | | | 5.49 | | | | 5.52 | | | | 5.56 | | | | 5.53 | | | | 5.40 | | | | 5.28 | | | | 5.10 | | | | 5.07 | | | | — | |
Mill Head grade | | | 0.14 | % | | | 0.14 | % | | | 0.14 | % | | | 0.14 | % | | | 0.14 | % | | | 0.14 | % | | | 0.14 | % | | | 0.14 | % | | | 0.00 | % |
Mill Head grade | | | 0.03 | % | | | 0.03 | % | | | 0.03 | % | | | 0.03 | % | | | 0.03 | % | | | 0.03 | % | | | 0.03 | % | | | 0.03 | % | | | 0.00 | % |
Tonnes to mill | | | 1,442,000 | | | | 1,366,000 | | | | 1,351,000 | | | | 1,382,000 | | | | 1,348,000 | | | | 1,352,000 | | | | 1,230,000 | | | | 944,000 | | | | — | |
Recovered Grade | | | | | | | | | | | | | | | | | | | | | | | | | | | | | | | | | | | | |
Recovered grade | | | 4.82 | | | | 4.85 | | | | 4.88 | | | | 4.85 | | | | 4.74 | | | | 4.64 | | | | 4.48 | | | | 4.45 | | | | 0.00 | |
Recovered grade | | | 0.09 | % | | | 0.09 | % | | | 0.09 | % | | | 0.09 | % | | | 0.09 | % | | | 0.09 | % | | | 0.09 | % | | | 0.09 | % | | | 0.00 | % |
Recovered grade | | | 0.02 | % | | | 0.02 | % | | | 0.02 | % | | | 0.02 | % | | | 0.02 | % | | | 0.02 | % | | | 0.02 | % | | | 0.02 | % | | | 0.00 | % |
Recovered grade | | | 0.00 | % | | | 0.00 | % | | | 0.00 | % | | | 0.00 | % | | | 0.00 | % | | | 0.00 | % | | | 0.00 | % | | | 0.00 | % | | | 0.00 | % |
| | | 0.00 | | | | 0.00 | | �� | | 0.00 | | | | 0.00 | | | | 0.00 | | | | 0.00 | | | | 0.00 | | | | 0.00 | | | | 0.00 | |
Metal recovered | | | | | | | | | | | | | | | | | | | | | | | | | | | | | | | | | | | | |
Metal recovered | | | 131 | | | | 125 | | | | 125 | | | | 127 | | | | 121 | | | | 118 | | | | 104 | | | | 79 | | | | — | |
Metal recovered | | | 3,083 | | | | 2,937 | | | | 2,926 | | | | 2,977 | | | | 2,835 | | | | 2,780 | | | | 2,443 | | | | 1,864 | | | | — | |
Metal recovered | | | 3,156 | | | | 3,006 | | | | 2,994 | | | | 3,047 | | | | 2,902 | | | | 2,846 | | | | 2,501 | | | | 1,908 | | | | — | |
Metal recovered | | | 579 | | | | 552 | | | | 550 | | | | 559 | | | | 533 | | | | 522 | | | | 459 | | | | 350 | | | | — | |
| | | | | | | | | |
Metal recovered | | | 4,219 | | | | 4,018 | | | | 4,003 | | | | 4,073 | | | | 3,879 | | | | 3,804 | | | | 3,343 | | | | 2,551 | | | | — | |
Metal recovered | | | 99,137 | | | | 94,425 | | | | 94,065 | | | | 95,704 | | | | 91,155 | | | | 89,394 | | | | 78,555 | | | | 59,935 | | | | — | |
Metal recovered | | | 101,464 | | | | 96,642 | | | | 96,273 | | | | 97,951 | | | | 93,295 | | | | 91,492 | | | | 80,399 | | | | 61,341 | | | | — | |
Metal recovered | | | 18,623 | | | | 17,738 | | | | 17,670 | | | | 17,978 | | | | 17,124 | | | | 16,793 | | | | 14,757 | | | | 11,259 | | | | — | |
Metal recovered | | | 1,236 | | | | 1,171 | | | | 1,158 | | | | 1,185 | | | | 1,156 | | | | 1,159 | | | | 1,055 | | | | 809 | | | | — | |
Metal recovered | | | 299 | | | | 284 | | | | 280 | | | | 287 | | | | 280 | | | | 281 | | | | 255 | | | | 196 | | | | — | |
| | | | | | | | | |
Financial | | | | | | | | | | | | | | | | | | | | | | | | | | | | | | | | | | | | |
Revenue | | | 12,691,038,161 | | | | 12,807,218,294 | | | | 13,515,654,952 | | | | 14,582,890,363 | | | | 14,753,007,643 | | | | 15,366,079,054 | | | | 14,357,527,861 | | | | 11,617,787,042 | | | | — | |
Revenue | | | 199,327,844 | | | | 201,245,421 | | | | 212,506,509 | | | | 229,182,332 | | | | 231,386,213 | | | | 240,530,584 | | | | 224,047,883 | | | | 181,197,155 | | | | 0 | |
Revenue | | | 6,889,184,398 | | | | 6,955,459,832 | | | | 7,344,666,418 | | | | 7,921,017,534 | | | | 7,997,188,220 | | | | 8,313,236,677 | | | | 7,743,560,283 | | | | 6,262,550,126 | | | | 0 | |
Revenue | | | 3,181,452,192 | | | | 3,212,058,446 | | | | 3,391,795,564 | | | | 3,657,956,754 | | | | 3,693,132,674 | | | | 3,839,085,082 | | | | 3,576,006,305 | | | | 2,892,070,045 | | | | 0 | |
Revenue | | | 1,343,926,190 | | | | 1,356,855,049 | | | | 1,432,780,571 | | | | 1,545,213,817 | | | | 1,560,073,018 | | | | 1,621,727,021 | | | | 1,510,595,866 | | | | 1,221,683,823 | | | | 0 | |
Revenue | | | 1,004,469,260 | | | | 1,008,620,881 | | | | 1,057,397,964 | | | | 1,146,560,640 | | | | 1,185,454,101 | | | | 1,260,310,075 | | | | 1,215,378,902 | | | | 988,745,321 | | | | 0 | |
Revenue | | | 72,678,276 | | | | 72,978,666 | | | | 76,507,927 | | | | 82,959,284 | | | | 85,773,417 | | | | 91,189,614 | | | | 87,938,623 | | | | 71,540,572 | | | | 0 | |
Mining cost | | | (4,368,497,436 | ) | | | (4,555,108,610 | ) | | | (5,455,569,991 | ) | | | (5,873,159,870 | ) | | | (6,089,170,122 | ) | | | (6,538,076,610 | ) | | | (6,704,405,860 | ) | | | (5,169,435,225 | ) | | | 0 | |
Variable Cost | | | (4,368,497,436 | ) | | | (4,555,108,610 | ) | | | (5,455,569,991 | ) | | | (5,873,159,870 | ) | | | (6,089,170,122 | ) | | | (6,538,076,610 | ) | | | (6,704,405,860 | ) | | | (5,169,435,225 | ) | | | 0 | |
Plant cost | | | (717,643,571 | ) | | | (720,609,699 | ) | | | (755,458,510 | ) | | | (819,160,830 | ) | | | (846,948,282 | ) | | | (900,429,171 | ) | | | (868,328,072 | ) | | | (706,409,595 | ) | | | 0 | |
Variable Cost | | | (717,643,571 | ) | | | (720,609,699 | ) | | | (755,458,510 | ) | | | (819,160,830 | ) | | | (846,948,282 | ) | | | (900,429,171 | ) | | | (868,328,072 | ) | | | (706,409,595 | ) | | | 0 | |
Cash Operating Costs | | | (5,086,141,007 | ) | | | (5,275,718,308 | ) | | | (6,211,028,501 | ) | | | (6,692,320,699 | ) | | | (6,936,118,404 | ) | | | (7,438,505,780 | ) | | | (7,572,733,931 | ) | | | (5,875,844,820 | ) | | | 0 | |
Royalty Act No 28 of 2008 | | | (503,172,611 | ) | | | (491,156,647 | ) | | | (467,317,482 | ) | | | (507,348,629 | ) | | | (501,107,247 | ) | | | (510,678,829 | ) | | | (436,625,121 | ) | | | (498,006,284 | ) | | | 0 | |
Total Cash Costs | | | (5,589,313,618 | ) | | | (5,766,874,955 | ) | | | (6,678,345,983 | ) | | | (7,199,669,328 | ) | | | (7,437,225,651 | ) | | | (7,949,184,610 | ) | | | (8,009,359,052 | ) | | | (6,373,851,103 | ) | | | 0 | |
Rehabilitation | | | (19,523,134 | ) | | | (20,501,115 | ) | | | (21,526,171 | ) | | | (22,600,429 | ) | | | (23,726,104 | ) | | | (24,905,499 | ) | | | (26,141,007 | ) | | | (27,435,116 | ) | | | 0 | |
Other Costs Variable | | | (1,660,790,646 | ) | | | (1,672,809,118 | ) | | | (1,755,604,964 | ) | | | (1,895,566,346 | ) | | | (1,943,085,678 | ) | | | (2,037,323,261 | ) | | | (1,940,939,009 | ) | | | 0 | | | | 0 | |
Total Production Costs | | | (7,269,627,398 | ) | | | (7,460,185,188 | ) | | | (8,455,477,118 | ) | | | (9,117,836,104 | ) | | | (9,404,037,434 | ) | | | (10,011,413,370 | ) | | | (9,976,439,069 | ) | | | (6,401,286,220 | ) | | | 0 | |
EBITDA | | | 5,421,410,763 | | | | 5,347,033,107 | | | | 5,060,177,834 | | | | 5,465,054,259 | | | | 5,348,970,210 | | | | 5,354,665,684 | | | | 4,381,088,793 | | | | 5,216,500,822 | | | | 0 | |
Capital expenditure | | | (89,000,000 | ) | | | (97,900,000 | ) | | | (98,200,000 | ) | | | (94,600,000 | ) | | | (83,700,000 | ) | | | (68,700,000 | ) | | | (37,700,000 | ) | | | 0 | | | | 0 | |
EBIT | | | 5,332,410,763 | | | | 5,249,133,107 | | | | 4,961,977,834 | | | | 5,370,454,259 | | | | 5,265,270,210 | | | | 5,285,965,684 | | | | 4,343,388,793 | | | | 5,216,500,822 | | | | 0 | |
Taxation | | | (1,398,122,641 | ) | | | (1,357,398,083 | ) | | | (1,268,238,329 | ) | | | (1,378,462,003 | ) | | | (1,355,387,700 | ) | | | (1,375,479,446 | ) | | | (1,154,676,152 | ) | | | (1,400,268,960 | ) | | | (0 | ) |
Income after tax | | | 3,934,288,122 | | | | 3,891,735,023 | | | | 3,693,739,505 | | | | 3,991,992,256 | | | | 3,909,882,510 | | | | 3,910,486,237 | | | | 3,188,712,641 | | | | 3,816,231,862 | | | | 0 | |
Working capital changes | | | (22,113,288 | ) | | | (3,483,494 | ) | | | (38,598,160 | ) | | | (133,145,818 | ) | | | (5,418,843 | ) | | | (56,780,137 | ) | | | 177,189,156 | | | | 173,887,200 | | | | 1,522,315,723 | |
| | | | | | | | | |
Cash Flow | | | | | | | | | | | | | | | | | | | | | | | | | | | | | | | | | | | | |
Net Cash Flow | | | 3,912,174,834 | | | | 3,888,251,530 | | | | 3,655,141,346 | | | | 3,858,846,438 | | | | 3,904,463,667 | | | | 3,853,706,100 | | | | 3,365,901,797 | | | | 3,990,119,062 | | | | 1,522,315,723 | |
Cumulative Net Cash Flow | | | 38,221,941,611 | | | | 42,110,193,141 | | | | 45,765,334,486 | | | | 49,624,180,925 | | | | 53,528,644,592 | | | | 57,382,350,692 | | | | 60,748,252,489 | | | | 64,738,371,551 | | | | 66,260,687,275 | |
Prepared by Minxcon (Pty) Ltd
H-63
APPENDIX 4: Technical Reports
Technical Report prepared by ExplorMine Consultants- Technical Report - The Mineral Resource Estimate For The Merensky And UG2 Reefs For The Ga-Phasha Project Area, Limpopo Province, Republic Of South Africa; 30 March 2012
H-64
SCHEDULE I
FAIRNESS OPINION
21 May, 2013
The Directors
Atlatsa Resources Corporation
4th Floor
82 Grayston Drive
Sandton
2146
South Africa
Dear Sirs
REPORT OF THE INDEPENDENT PROFESSIONAL EXPERT IN RESPECT OF THE RESTRUCTURING PLAN
In an announcement dated 2 February 212, and subsequent announcements, the last of which was dated 27 March 2013, Atlatsa Resources Corporation (“Atlatsa”) announced that Atlatsa, Anglo Platinum Limited (“Anglo Platinum”) and Atlatsa Holdings (Proprietary) Limited (“Atlatsa Holdings”) have concluded binding definitive agreements for the revised restructuring, recapitalisation and refinancing of Atlatsa and the Bokoni group of companies (“the Restructuring Plan”). The key terms of the Restructuring Plan include:
| | i. | Atlatsa will dispose of its interest in the Boikgantsho Project and the Eastern section of the Ga-Phasha Project (collectively the “Sale Assets”) to Anglo Platinum for a net consideration of ZAR1.7 billion (“the Asset Sale”); |
| | ii. | the unwinding of the historical “B” preference share arrangement, such that Atlatsa will have one class of common shares (“Common Shares”) going forward; |
| | iii. | following the unwinding of the “B” preference shares, Atlatsa Holdings will acquire 115.8 million Common Shares from Anglo Platinum for a consideration of ZAR463 million on a vendor financed basis (“the Common Share Acquisition”); |
| | iv. | the current Anglo Platinum debt funding in Atlatsa will be refinanced (“the Debt Refinancing”); and |
| | v. | Atlatsa will issue to Anglo Platinum 125 million Common Shares for a consideration of ZAR 750 million to be paid in cash, which Atlatsa will be required to apply the cash proceeds to repay a portion of the outstanding Anglo Platinum debt. |
Shareholders are referred to the circular dated 21 May 2013, of which this opinion forms part, for detailed information regarding the terms of the Restructuring Plan. The terms of the Restructuring Plan are inter-conditional, and the Restructuring Plan in its entirety will not be implemented unless all of the terms of the Restructuring Plan to the extent applicable, becomes unconditional.
Anglo Platinum holds a 26% indirect equity investment in Atlatsa and is a related party to Atlatsa in terms of the JSE Limited (“JSE”) Listings Requirements. The Asset Sale is a related party transaction as defined in terms of section 10.1 (b)(i) of the JSE Listings Requirements.
I-1
The Atlatsa board of directors (“the Board”) is required, in terms of section 10.4 of the JSE Listings Requirements, to obtain a fairness opinion from an independent professional expert as to whether the terms of the Asset Sale are fair as far as the shareholders of Atlatsa (excluding any related parties) are concerned.
Due to the Asset Sale being conditional upon the approval of the Restructuring Plan, the terms of the Restructuring Plan in its entirety were considered to determine the fairness of the Asset Sale (“the Fairness Opinion”).
Compliance with the JSE Listings Requirements is the responsibility of the Board. Our responsibility is to report on the fairness of the terms and conditions of the Restructuring Plan as they relate to Atlatsa shareholders.
| 3. | Definition of the term “fairness” |
Fairness is primarily based on quantitative issues. The Restructuring Plan will generally be considered to be fair if the value received by Atlatsa as part of the Restructuring Plan is equal to or more than the value surrendered by Atlatsa.
In arriving at our opinion, amongst other things, we have relied upon and considered the following sources of information:
| | • | | The audited financial results of Atlatsa for the periods ended 31 December 2010, 2011 and 2012; |
| | • | | The signed transaction agreements dated 27 March 2013 and addendums thereto (“the Transaction Agreements”); |
| | • | | The draft Information circular to Atlatsa shareholders relating to the Restructuring Plan; |
| | • | | The following independent competent person’s reports (“the CPRs”) prepared in compliance with SAMREC and SAMVAL, forming part of this Fairness Opinion: |
| | • | | The Mineral Resource Estimate for the Merensky and UG2 Reefs for the Ga-Phasha Project Area, Limpopo Province, Republic of South Africa – 26 February 2013 prepared by ExplorMine Consultants which includes the valuation by Minxcon (Pty) Limited (“Minxcon”) dated 26 February 2013; |
| | • | | The Mineral Resource Estimation for the Platreef for the Boikgantsho Project, Limpopo Province, Republic of South Africa – 27 February 2013 prepared by Kai Batla Minerals Industry Consultants which includes the valuation by Minxcon dated 27 February 2013; and |
| | • | | An Independent Competent Persons’ Report on the Bokoni Platinum Mine, in the Limpopo Province of South Africa – 25 February 2013; |
| | • | | Discussions with Atlatsa directors and management regarding the financial information and rationale for the Restructuring Plan, as well as the inputs applied in the CPRs; |
| | • | | Management projections for Atlatsa for the years ended 31 December 2013 to 31 December 2020; |
I-2
| | • | | McGregor BFA for share trading history on Atlatsa and comparable company information; and |
| | • | | Publicly available information relating to Atlatsa, as well as the industry in which it operates, that we deemed to be relevant, including company announcements, analysts’ reports and media articles. |
We have arrived at our opinion based on the following assumptions:
| | • | | That all agreements that have been, and will be entered into, in terms of the Restructuring Plan will be legally enforceable; |
| | • | | That reliance can be placed on the audited financial statements of Atlatsa and information provided by management used for the preparation of the opinion; |
| | • | | Current economic, regulatory and market conditions will not change materially; |
| | • | | The existing operations of Atlatsa are assumed to be ongoing under the current mine plan; |
| | • | | Atlatsa and its subsidiaries (“Atlatsa Group”) are not involved in any material legal proceedings; |
| | • | | Reliance can be placed on the CPRs; |
| | • | | The Atlatsa Group has no outstanding disputes with any regulatory body, including the South African Revenue Service; |
| | • | | There are no undisclosed contingencies that could affect the value of any of the assets or operations within the Atlatsa Group; |
| | • | | The structure of the Transaction will not give rise to any undisclosed tax liabilities; and |
| | • | | The market transactions applied in the CPRs are comparable to the Asset Sale. |
| 6. | Appropriateness and reasonableness of underlying information and assumptions |
We satisfied ourselves as to the appropriateness and reasonableness of the information and assumptions employed in arriving at our opinion by:
| | • | | Placing reliance on representations made by Atlatsa management during the course of forming this opinion; |
| | • | | Placing reliance on input data applied in the CPRs; and |
| | • | | Determining the extent to which representations from management and other industry experts were confirmed by documentary evidence as well as our understanding of the Atlatsa Group and the economic environment in which it operates. |
I-3
In arriving at our opinion, we relied upon financial and other information, obtained from management, the CPRs together with industry-related and other information in the public domain. Our conclusion is dependent on such information being accurate in all material respects.
In arriving at our opinion we have,inter alia, undertaken the following procedures in evaluating the fairness of the Restructuring Plan:
| | • | | Reviewed the audited financial results of Atlatsa for the periods ended 31 December 2010, 2011 and 2012; |
| | • | | Reviewed the terms and conditions of the Transaction agreements and any addendums thereto; |
| | • | | Reviewed the reasonableness of the information made available by and from discussions held with management such as,inter alia: |
| | • | | the rationale for the Restructuring Plan; |
| | • | | the events leading up to the Restructuring Plan; |
| | • | | such other matters as we considered necessary; and |
| | • | | the current market conditions relating to the Atlatsa Group. |
| | • | | Prepared the CPRs, forming part of this Fairness Opinion, which included |
| | • | | Performing an independent valuation on the Ga-Phasha East Project forming part of the Sale Assets. A market comparable approach was applied as the primary valuation methodology. The cost approach and a discounted cash flow approach were applied as secondary valuations in determining the value of the asset. The valuation performed placed a value range of between ZAR 740 million to ZAR 950 million on the total interest (100%) of the Eastern Section of the Ga-Phasha mineral assets; |
| | • | | Performed an independent valuation on the Boikgantsho Project forming part of the Sale Assets. A market comparable approach was applied as the primary valuation methodology, adjusted with the estimated value of moving the village situated on the land forming part of the Boikgantsho where the main pit is currently planned. A cost approach was applied as a secondary valuation in determining the value. The lower and upper valuation range for 100% of the Boikgantsho Project was established at between ZAR902 million and ZAR960 million; and |
| | • | | Performed an independent valuation on the Bokoni Platinum Mine. The discounted cash flow (“DCF”) approach based on reserves plus a valuation on the balance of resources not included in the DCF was applied as a primary valuation. A market comparable approach was applied on the total resource as the secondary valuation methodology in determining the value of the asset. For the primary valuation a DCF valuation performed placed a value range of between ZAR 4.47 billion and ZAR 9.42 billion for 100% of the Bokoni Platinum Mine with the balance of resources not used in the DCF valued at between ZAR 15.30 billion to 21.81 billion. For the secondary valuation the market comparable valuation performed placed a value range of between ZAR 17.11 billion to ZAR 24.46 billion for 100% of the Bokoni Platinum Mine, The lower and upper valuation range for 100% of the Bokoni Platinum Mine were established at between ZAR 20.2 billion to ZAR 25.1 billion. |
| | • | | Evaluated the scope of benefits, including interest cost savings accruing to Atlatsa forming part of the Debt Refinancing; |
| | • | | Evaluated the relative risks associated with the Atlatsa Group and the industry in which it operates; |
I-4
| | • | | Where relevant, corroborated representations made by management to source documents; |
| | • | | Reviewed certain publicly available information relating to Atlatsa that we have deemed relevant, including announcements, analysts’ reports and media articles; |
| | • | | Conducted appropriate sensitivity analyses given a reasonable range of key assumptions; |
| | • | | Reviewed the financial implications of the Restructuring Plan on Atlatsa; |
| | • | | Obtained letters of representation from management asserting that we have been provided with all relevant information and that no material information was omitted and that all such information is accurate; |
| | • | | Broadly examined the “qualitative” aspects applicable to the Restructuring Plan; |
| | • | | Considered key external and internal value drivers. Key external value drivers identified were inflation rates, interest rates, future GDP growth rates, mineral prices and exchange rates. Key internal value drivers are growth in revenue, earnings margins, level of capital expenditure and working capital requirements. A sensitivity analysis was conducted where practical utilising existing and forecast key value drivers; and |
| | • | | Considered other relevant facts and information relevant to concluding this opinion. |
We have considered the terms and conditions of the Restructuring Plan as set out above and, based on the aforementioned, we are of the opinion, subject to the limiting conditions as set out below, that the terms and conditions of the Restructuring Plan based on quantitative considerations are fair to Atlatsa shareholders.
This opinion does not purport to cater for each individual shareholder’s circumstances and/or risk profile, but rather that of a general body of Atlatsa shareholders taken as a whole. Each shareholder’s decision will be influenced by such shareholder’s particular circumstances and, accordingly, a shareholder should consult with an independent adviser if the shareholder is in any doubt as to the merits or otherwise of the Restructuring Plan.
We relied upon the accuracy of the information used by us in deriving our opinion, albeit that, where practicable, we have corroborated the reasonableness of such information and assumptions through, amongst other things, reference to historic precedent and our knowledge and understanding. Whilst our work has involved an analysis of the annual financial statements, projections, and other information provided to us, our engagement does not constitute nor does it include an audit conducted in accordance with applicable auditing standards. Accordingly we assume no responsibility and make no representations with respect to the accuracy or completeness of any information provided to us in respect of the Restructuring Plan.
The opinion expressed is necessarily based upon information available to us, the financial, regulatory, securities market and other conditions and circumstances existing and disclosed to us as at the date hereof. We have furthermore assumed that all conditions precedent, including any material regulatory and other approvals required in connection with the Restructuring Plan have been or will be properly fulfilled. Subsequent developments may affect our opinion. However we are under no obligation to update, revise or re-affirm such.
I-5
We have been retained by the Board as an independent professional expert to advise the Board in connection with the Restructuring Plan. We confirm that we have no material interest, direct or indirect, beneficial or non-beneficial in Atlatsa and that we are independent arm’s length consultants to Atlatsa. Under the terms of the engagement, we will be paid a fee in connection with the engagement which is not contingent upon the success or failure of the Restructuring Plan, nor do we expect any other consideration for the preparation of this Fairness Opinion.
We hereby consent to the inclusion of this opinion and references thereto, in the form and context in which they appear to be included in the circular to be issued to the shareholders of Atlatsa shareholders in the form and context in which it appears.
Yours faithfully
| | | | |
| (signed)“PSG Capital Proprietary Limited” | | | | (signed)“Minxcon Proprietary Limited” |
| | |
| PSG CAPITAL (PTY) LIMITED | | | | MINXCON (PTY) LIMITED |
| RIAAN VAN HEERDEN | | | | JOHAN ODENDAAL |
I-6
SCHEDULE J
AUDITED HISTORICAL FINANCIAL INFORMATION OF
BOIKGANTSHO PLATINUM MINE PROPRIETARY LIMITED
REPORT ON THE HISTORICAL INFORMATION OF BOIKGANTSHO PLATINUM MINE PROPRIETARY LIMITED (“Boikgantsho”)
The definitions commencing on page 52 of the circular has been used in this report.
The historical financial information of Boikgantsho and the accounting policies and notes thereto, is the responsibility of the Directors.
HISTORY AND BACKGROUND
The Company’s principal business is the exploration of PGM.
The Company is an indirect subsidiary of Atlatsa (listed on the Canadian TSX Venture Exchange, the New York Stock Exchange and the JSE Limited) which complies with various corporate governance requirements including the Atlatsa Code of Ethics and Business Principles and therefore are subject to all governance processes of Atlatsa.
The Company is a wholly owned subsidiary of Bokoni Holdco.
BASIS OF PREPARATION
These statements of comprehensive income, statements of financial position, changes in equity, cash flows, related accounting policies and notes of Boikgantsho for the three years ended 31 December 2012, have been extracted, without adjustment, from the special purposes annual financial statements of Boikgantsho for the three years ended 31 December 2012, prepared in accordance with IFRS and the Companies Act. These special purpose financial statements have been prepared for JSE purposes only to illustrate the effect of the mineral properties sold.
KPMG Inc. is the auditor and has conducted the audit of the special purpose financial statements for the three years ended 31 December 2012 in accordance with International Standards of Auditing and reported on without qualification for the two years ended 31 December 2011.
The financial statements for 31 December 2012 have been issued with a modified opinion in respect of going concern i.e. an emphasis of matter.
GENERAL REVIEW OF OPERATIONS
The entities principal business is the exploration of PGM. Due to the entities nature of business no revenue is generated from the sale of PGM’s.
The significant profit in 2011 of R898,753,395 was as a result of a reversal of a mineral property impairment recognised prior to the 2010 financial year.
The Company acquired project information from Plateau Resources Proprietary Limited and Rustenburg Platinum Mines Limited (the shareholders of Bokoni Holdco) through Bokoni Holdco through a loan facility with Bokoni Holdco.
The loan is interest free, unsecured and repayable 12 months and 1 day after demanded by Bokoni Holdco. The holding company has indicated that it will not demand payment for this loan until the Company has the ability to pay its creditors in the normal course of business.
J-1
SUBSEQUENT EVENTS
There have been no material changes in the business of Boikgantsho since the end of the last financial period for which audited financial statements have been prepared.
Material Transaction
On 2 February 2012, Atlatsa announced a transaction to facilitate its refinancing and restructuring plan in conjunction with Anglo American Platinum. One of the key features of the transaction include the sale of the Boikgantsho mineral property interests to RPM (the 49% shareholder of Bokoni Holdco and a related party), for R950 million. The proceeds from the sale will then be declared as a dividend to the holding company.
On 27 March 2013, Phase Two and thus completion of the Restructuring Plan was announced. Phase Two includes finalisation of the sale of Boikgantsho.
The Restructuring Plan is conditional upon the satisfaction (or waiver) of various conditions precedent, including:
| | • | | the receipt of the approval of the South African Competition Authorities; |
| | • | | obtaining shareholder approval from Atlatsa shareholders; |
| | • | | the receipt of the approval of the Disinterested Shareholders of Atlatsa for each of the Related Party Transactions; |
| | • | | the receipt of approvals of the applicable regulatory authorities; |
| | • | | RPM acquiring unconditional title to the Asset Sale Properties. This would include obtaining Ministerial consent in respect of The Mineral and Petroleum Resources Royalty Act for transfer of the mineral rights to RPM; and |
| | • | | The Phase Two Restructuring Plan transaction agreements becoming unconditional through the satisfaction of all other conditions precedent (except to the extent that the completion of any one transaction is conditional upon the completion of the other transactions). |
MATERIAL LOANS RECEIVABLE
There were no major loans granted to directors for the periods under review.
SEGMENT INFORMATION
A segment report is not prepared as the Company has only one asset.
DIVIDENDS TO EQUITY HOLDERS
No dividends were paid or declared during the period under review (2011: R NIL and 2010: R NIL).
DIRECTORS EMOLUMENTS
No remuneration and benefits were paid to any of the directors of the company for the periods under review.
J-2
STATEMENT OF FINANCIAL POSITION AS AT 31 DECEMBER 2012, 2011 and 2010
| | | | | | | | | | | | | | |
| | | Note | | 31 DECEMBER
2012 | | | 31 DECEMBER
2011 | | | 31 DECEMBER
2010 | |
| | | | |
Assets | | | | | | | | | | | | | | |
| | | | |
Non-current assets | | | | | | | | | | | | | | |
| | | | |
Mineral property interests | | 3 | | | — | | | | — | | | | 26,100,000 | |
| | | | | | | | | | | | | | |
Total non-current assets | | | | | — | | | | — | | | | 26,100,000 | |
| | | | | | | | | | | | | | |
Current assets | | | | | | | | | | | | | | |
| | | | |
Assets classified as held for sale | | 3 | | | 924,853,395 | | | | 924,853,395 | | | | — | |
| | | | | | | | | | | | | | |
Total current assets | | | | | 924,853,395 | | | | 924,853,395 | | | | — | |
| | | | | | | | | | | | | | |
Total assets | | | | | 924,853,395 | | | | 924,853,395 | | | | 26,100,000 | |
| | | | | | | | | | | | | | |
Equity and Liabilities | | | | | | | | | | | | | | |
Equity | | | | | | | | | | | | | | |
Equity Reserve | | | | | 26,100,000 | | | | 26,100,000 | | | | 26,100,000 | |
Retained Earnings | | | | | 898,753,395 | | | | 898,753,395 | | | | — | |
| | | | | | | | | | | | | | |
Total equity | | | | | 924,853,395 | | | | 924,853,395 | | | | 26,100,000 | |
| | | | | | | | | | | | | | |
| | | | |
Net asset value | | | | | 924,853,395 | | | | 924,853,395 | | | | 26,100,000 | |
Net tangible asset value | | | | | 924,853,395 | | | | 924,853,395 | | | | 26,100,000 | |
Number of shares in issue | | | | | 198 | | | | 198 | | | | 198 | |
Net asset value per share | | | | | 4,670,977 | | | | 4,670,977 | | | | 131,818 | |
J-3
STATEMENT OF COMPREHENSIVE INCOME FOR THE YEARS ENDED 31 DECEMBER 2012, 2011 and 2010
| | | | | | | | | | | | | | |
| | | Note | | 31 DECEMBER
2012 | | | 31 DECEMBER
2011 | | | 31 DECEMBER
2010 | |
Revenue | | | | | — | | | | — | | | | — | |
Cost of sales | | | | | — | | | | — | | | | — | |
| | | | | | | | | | | | | | |
Gross profit | | | | | — | | | | — | | | | — | |
Administrative expenses | | | | | — | | | | — | | | | — | |
Mineral property impairment reversal | | 3 | | | — | | | | 898,753,395 | | | | — | |
| | | | | | | | | | | | | | |
Profit before income tax | | | | | — | | | | — | | | | — | |
Income tax | | | | | — | | | | — | | | | — | |
| | | | | | | | | | | | | | |
Profit and total comprehensive profit for the year | | | | | — | | | | 898,753,395 | | | | — | |
| | | | | | | | | | | | | | |
| | | | |
Earnings per shares | | | | | — | | | | 4,539,159 | | | | — | |
Headline earnings per share | | | | | — | | | | — | | | | — | |
Weighted average number of shares in issue | | | | | 198 | | | | 198 | | | | 198 | |
J-4
STATEMENT OF CHANGES IN EQUITY FOR THE YEARS ENDED 31 DECEMBER 2012, 2011 and 2010
| | | | | | | | | | | | |
| | | Equity
Reserve | | | Retained
Earnings | | | Total | |
| | | |
Balance at 1 January 2010 | | | 26,100,000 | | | | — | | | | 26,100,000 | |
Total comprehensive income for the year | | | | | | | | | | | | |
Profit for the year | | | — | | | | — | | | | — | |
| | | | | | | | | | | | |
Balance at 31 December 2010 | | | 26,100,000 | | | | — | | | | 26,100,000 | |
Total comprehensive income for the year | | | | | | | | | | | | |
Profit for the year | | | — | | | | 898,753,395 | | | | 898,753,395 | |
| | | | | | | | | | | | |
Balance at 31 December 2011 | | | 26,100,000 | | | | 898,753,395 | | | | 924,853,395 | |
Total comprehensive profit for the year | | | | | | | | | | | | |
Profit for the year | | | — | | | | — | | | | — | |
| | | | | | | | | | | | |
Balance at 31 December 2012 | | | 26,100,000 | | | | 898,753,395 | | | | 924,853,395 | |
| | | | | | | | | | | | |
J-5
NOTES TO THE FINANCIAL STATEMENTS FOR THE YEARS ENDED 31 DECEMBER 2012, 2011 and 2010
The statements of comprehensive income, statement of financial position, statement of changes in equity and statement of cash flows for the three years ended 31 December 2012 (“Historical Financial Information”) has been derived from the published audited financial results of Boikgantsho in accordance with International Financial Reporting Standards and the Companies Act. It is not Atlatsa’s policy to present notes in respect of condensed financial results other than those required in terms ofIAS34: Interim Financial Reporting.
KPMG Inc. is the auditor and has conducted the audit of the annual financial statements for the three years ended 31 December 2012 in accordance with International Standards of Auditing and reported on without qualification for the two years ended 31 December 2011. The financial statements for 31 December 2012 have been issued with a modified opinion in respect of going concern i.e. an emphasis of matter.
There has been no material change in the nature of the business during the past three years and there are no other materials facts or circumstances that have occurred between the latest financial year end and the last practicable date.
The directors are responsible for the preparation and fair presentation of the historical financial information of Boikgantsho, comprising the statement of financial position for the three years ended 31 December 2012, and the statements of comprehensive income, changes in equity and cash flows for the 3 years then ended, and the notes and relevant disclosures to the historical financial information, which include a summary of significant accounting policies and other explanatory notes, in accordance with International Financial Reporting Standards (“IFRS”), and the requirements of the Companies Act of South Africa.
1.1.Statement of compliance
The Historical Financial Information have been prepared in accordance with IFRS and in the manner required by the Companies Act 2008 (as amended) and Companies Regulations 2011.
1.2.Basis of measurement
The Historical Financial Information has been prepared on the historical cost basis as set out in the accounting policies below and is presented in Rands.
1.3.Use of estimates and judgements
The preparation of the Historical Financial Information in accordance with IFRS requires management to make judgements, estimates and assumptions that affect the application of accounting policies and the reported amounts of assets, liabilities, income and expenses. Actual results may differ from these estimates. Estimates and underlying assumptions are reviewed on an ongoing basis. Revisions to accounting estimates are recognized in the period in which the estimates are revised and in any future periods affected.
Information about critical judgements in applying accounting policies that have the most significant effect on the amounts recognized in the financial statements is included in the notes to the financial statements where applicable.
1.4.Impact of standards and interpretations not yet adopted
At the reporting date, the following accounting standards were in issue but not yet effective:
| | • | | Amendments to IAS 12, Deferred Tax: Recovery of Underlying assets (1 January 2012) |
| | • | | IAS 27, Separate Financial Statements (1 January 2013) |
| | • | | IFRS 9, Financial Instruments (1 January 2013) |
| | • | | IFRS 9, Additions to IFRS 9 Financial instruments (1 January 2013) |
| | • | | IFRS 13, Fair Value Measurement (1 January 2013) |
Standards and interpretations adopted in the current year by the Company:
| | • | | IAS 24 (revised),Related party disclosures |
| | • | | Amendments to IAS 32,Financial statements: Presentation: Classification of Rights Issue |
| | • | | Amendments to IFRS 7,Disclosures – Transfer of Financial Assets |
J-6
| | • | | IFRIC 19, Extinguishing Financial liabilities with Equity Instruments |
| | • | | Various improvements to IFRS 2010 |
There was no significant impact on these financial statements as a result of adopting these standards and interpretations.
Ordinary Shares
Ordinary shares are classified as equity. Incremental costs directly attributable to the issue of ordinary shares are recognized as a deduction from equity, net of any tax effects.
| | 2.2 | Exploration expenditure and mineral property interests |
The acquisition of mineral property interests are initially measured at cost. Mineral property acquisition costs and development expenditures incurred subsequent to the determination of the feasibility of mining operations and approval of development by the company are capitalized until the property to which they relate is placed into production, sold or allowed to lapse.
Exploration and evaluation costs incurred prior to determination of the feasibility of mining operations are expensed as incurred. Re-imbursement of previously expensed exploration and evaluation costs are recognized as other income in profit or loss.
Mineral property acquisition costs include the cash consideration and the fair market value of shares issued for mineral property interests pursuant to the terms of the relevant agreements. These costs will be amortized over the estimated life of the property following commencement of commercial production, or written off if the property is sold, allowed to lapse, or when an impairment of value has been determined to have occurred.
Non-financial assets
The carrying amounts of the company’s non-financial assets are reviewed at each reporting date to determine whether there is any indication of impairment. If any such indication exists, then the asset’s recoverable amount is estimated.
The recoverable amount of an asset or cash-generating unit is the greater of its value in use and its fair value less costs to sell. In assessing value in use, the estimated future cash flows are discounted to their present value using a pre-tax discount rate that reflects current market assessments of the time value of money and the risks specific to the asset. For the purpose of impairment testing, assets are grouped together into the smallest group of assets that generates cash inflows from continuing use that are largely independent of the cash inflows of other assets or groups of assets (the “cash-generating unit”).
An impairment loss is recognized if the carrying amount of an asset or its cash-generating units exceeds its estimated recoverable amount. Impairment losses are recognized in profit or loss. Impairment losses recognized in respect of cash- generating units are allocated to reduce the carrying amounts of the assets in the unit (group of units) on a pro rata basis.
Impairment losses recognized in prior years are assessed at each reporting date for any indications that the loss has decreased or no longer exists. An impairment loss is reversed if there has been a change in the estimates used to determine the recoverable amount. An impairment loss is reversed only to the extent that the asset’s carrying amount does not exceed the carrying amount that would have been determined, net of depreciation or amortisation, if no impairment loss had been recognized.
| | 2.4 | Non-derivative financial liabilities |
Non-derivative financial liabilities comprise other payables and loans from related parties.
J-7
Financial liabilities are recognized initially at fair value plus any directly attributable transaction costs. Subsequent to initial recognition these financial liabilities are measured at amortised cost using the effective interest method.
Income tax expense comprises current and deferred tax. Current tax and deferred tax are recognized in profit or loss except to the extent that it relates to a business combination, or items recognized directly in equity or in other comprehensive income. Current tax is the expected tax payable or receivable on the taxable income or loss for the year, using tax rates enacted or substantively enacted at the reporting date, and any adjustment to tax payable in respect of previous years.
Deferred tax is recognized in respect of temporary differences between the carrying amounts of assets and liabilities for financial reporting purposes and the amounts used for taxation purposes. Deferred tax is not recognized for the following temporary differences: the initial recognition of assets or liabilities in a transaction that is not a business combination and that affects neither accounting nor taxable profit or loss, and differences relating to investments in subsidiaries and jointly controlled entities to the extent that it is probable that they will not reverse in the foreseeable future. In addition, deferred tax is not recognized for taxable temporary differences arising on the initial recognition of goodwill.
Deferred tax is measured at the tax rates that are expected to be applied to temporary differences when they reverse, based on the laws that have been enacted or substantively enacted by the reporting date. Deferred tax assets and liabilities are offset if there is a legally enforceable right to offset current tax liabilities and assets, and they relate to income taxes levied by the same tax authority on the same taxable entity, or on different tax entities, but they intend to settle current tax liabilities and assets on a net basis or their tax assets and liabilities will be realised simultaneously.
A deferred tax asset is recognized for unused tax losses, tax credits and deductible temporary differences, to the extent that it is probable that future taxable profits will be available against which they can be utilized. Deferred tax assets are reviewed at each reporting date and are reduced to the extent that it is no longer probable that the related tax benefit will be realised.
| | 2.6 | Non-current assets held for sale or distribution |
Non-current assets, or disposal groups comprising assets and liabilities, that are expected to be recovered primarily through sale or distribution rather than through continuing use, are classified as held for sale or distribution. Immediately before classification as held for sale or distribution, the assets, or components of a disposal group are remeasured in accordance with the Group’s accounting policies. Thereafter generally the assets, or disposal group, are measured at the lower of their carrying amount and fair value less costs to sell. An impairment loss on a disposal group first is allocated to goodwill, and then to remaining assets and liabilities on a pro rata basis, except that no loss is allocated to inventories and deferred tax assets, which continue to be measured in accordance with the Group’s accounting policies.
Impairment losses on initial classification as held for sale or distribution and subsequent gains and losses on remeasurement are recognized in profit or loss. Gains are not recognized in excess of any cumulative impairment loss.
Once classified as held for sale or distribution, intangible assets and property, plant and equipment are no longer amortised or depreciated.
J-8
| 3. | MINERAL PROPERTY INTERESTS |
| | | | | | | | | | | | |
| | | 31 DECEMBER
2012 | | | 31 DECEMBER
2011 | | | 31 DECEMBER
2010 | |
Opening balance | | | 26,100,000 | | | | 26,100,000 | | | | 26,100,000 | |
Impairment reversal | | | 898,753,395 | | | | 898,753,395 | | | | — | |
| | | | | | | | | | | | |
| | | 924,853,395 | | | | 924,853,395 | | | | 26,100,000 | |
Assets classified as available for sale | | | (924,853,395 | ) | | | (924,853,395 | ) | | | — | |
| | | | | | | | | | | | |
Closing balance | | | — | | | | — | | | | 26,100,000 | |
| | | | | | | | | | | | |
The Boikgantsho mineral property interests consists of the Drenthe 778LR (“Drenthe”) and Witrivier 777LR (“Witrivier”) mineral properties and a portion of Mogalakwena’s adjacent Overysel 815LR farm. These mineral properties are located on the Northern Limb of the Bushveld Complex.
During 2011, the Company’s management committed to a plan to sell the assets relating to the Boikgantsho mineral property interests to RPM as part of the refinancing and restructuring plan of the Atlatsa Group. These mineral properties are expected to be sold during 2013.
As a result of the planned sale of the Boikgantsho mineral property interests, the previous impairment of R1,260,682,125 recognized in 2009 was partially reversed in the current year up to value of the anticipated selling price of R950 million.
There are no commitments or contingent liabilities on date of signature that the directors are aware of.
For the year ended 31 December 2012, the company had accumulated losses of R 368,655,274 Bokoni and, as of that date, the company’s total assets exceeded its total liabilities by R859,124,826. The company continues to incur losses.
The Group embarked on a restructuring and recapitalising plan during 2012 and on 28 September 2012 the first phase of the restructuring plan was completed. The funds available from a new facility are expected to meet the Group’s projected cash flow requirements until approximately June 2013. The Group is currently engaged in negotiations with Anglo American Platinum Limited (“Anglo”) to implement the second phase of the plan to reduce debt and for additional funds to be made available from Anglo to meet the Group’s projected cash flow requirements until approximately the end of 2015.
These financial statements are prepared on the basis of accounting policies applicable to a going concern. This basis presumes that debt restructuring and accompanying funding arrangements as described above are successfully negotiated and approved by the shareholders by June 2013, and that the holding company continues to provide financial support.
In the event that the negotiations are not successful, these conditions give rise to a material uncertainty which may cast significant doubt about the ability of the company to continue as a going concern and, therefore that it may be unable to realise its assets and discharge its liabilities in the normal course of business.
J-9
SCHEDULE K
AUDITED HISTORICAL FINANCIAL INFORMATION OF
GA-PHASHA PLATINUM MINE (PROPRIETARY) LIMITED
REPORT ON THE HISTORICAL INFORMATION OF GA-PHASHA PLATINUM MINE PROPRIETARY LIMITED (“Ga-Phasha”)
The definitions commencing on page 52 of the circular has been used in this report.
The historical financial information of Ga-Phasha and the accounting policies and notes thereto, is the responsibility of the Directors.
HISTORY AND BACKGROUND
The Company’s principal business is the exploration of PGM.
The Company is an indirect subsidiary of Atlatsa (listed on the Canadian TSX Venture Exchange, the New York Stock Exchange and the JSE Limited) which complies with various corporate governance requirements including the Atlatsa Code of Ethics and Business Principles and therefore are subject to all governance processes of Atlatsa.
The Company is a wholly owned subsidiary of Bokoni Holdco.
BASIS OF PREPARATION
The statements of comprehensive income, statements of financial position, changes in equity, cash flows, related accounting policies and notes of Ga-Phasha for the three years ended 31 December 2012, have been extracted, without adjustment, from the special purposes financial statements of Ga-Phasha for the three years ended 31 December 2012, prepared in accordance with IFRS and the Companies Act. These special purpose financial statements have been prepared for JSE purposes only, to illustrate the effect of the mineral properties sold.
KPMG Inc. is the auditor and has conducted the audit of the annual financial statements for the three years ended 31 December 2012 in accordance with International Standards of Auditing and reported on without qualification for the two years ended 31 December 2011. The financial statements for 31 December 2012 have been issued with a modified opinion in respect of going concern i.e. an emphasis of matter.
GENERAL REVIEW OF OPERATIONS
The entities principal business is the exploration of PGM. Due to the entities nature of business no revenue is generated from the sale of PGM’s.
The Company has a loan with Bokoni Holdco who acquired the loan from Plateau and RPM (the shareholders of Bokoni Holdco) on 1 July 2009 on acquisition of Ga-Phasha.
The loan is interest free, unsecured and repayable 12 months and 1 day after demanded by Bokoni Holdco. The holding company has indicated that it will not demand payment for this loan until the Company has the ability to pay its creditors in the normal course of business.
SUBSEQUENT EVENTS
There have been no material changes in the business of Ga-Phasha since the end of the last financial period for which special purposes financial statements have been prepared.
K-1
Material Transaction
On 2 February 2012, Atlatsa announced a transaction to facilitate its refinancing and restructuring plan in conjunction with Anglo American Platinum. One of the key features of the transaction include the sale of the two eastern farms, Paschaskraal and De Kamp, of Ga-Phasha to RPM (the 49% shareholder of Bokoni Holdco and a related party), for R750 million. The proceeds from the sale will then be declared as a dividend to the holding company.
On 27 March 2013, Phase Two and thus completion of the Restructuring Plan was announced. Phase Two includes finalisation of the sale of the Eastern section of Ga-Phasha.
The Restructuring Plan is conditional upon the satisfaction (or waiver) of various conditions precedent, including:
| | • | | the receipt of the approval of the South African Competition Authorities; |
| | • | | obtaining shareholder approval from Atlatsa shareholders; |
| | • | | the receipt of the approval of the Disinterested Shareholders of Atlatsa for each of the Related Party Transactions; |
| | • | | the receipt of approvals of the applicable regulatory authorities; |
| | • | | RPM acquiring unconditional title to the Asset Sale Properties. This would include obtaining Ministerial consent in respect of The Mineral and Petroleum Resources Royalty Act for transfer of the mineral rights to RPM; and |
| | • | | The Phase Two Restructuring Plan transaction agreements becoming unconditional through the satisfaction of all other conditions precedent (except to the extent that the completion of any one transaction is conditional upon the completion of the other transactions). |
MATERIAL LOANS RECEIVABLE
There were no major loans granted to directors for the periods under review.
SEGMENT INFORMATION
A segment report is not prepared as the Company has only one asset.
DIVIDENDS TO EQUITY HOLDERS
No dividends were paid or declared during the period under review (2011: R NIL and 2010: R NIL).
DIRECTORS EMOLUMENTS
No remuneration and benefits were paid to any of the directors of the company for the periods under review.
K-2
STATEMENT OF FINANCIAL POSITION AS AT 31 DECEMBER 2012, 2011 and 2010
| | | | | | | | | | | | | | |
| | | Note | | 31 DECEMBER
2012 | | | 31 DECEMBER
2011 | | | 31 DECEMBER
2010 | |
Assets | | | | | | | | | | | | | | |
Non-current assets | | | | | | | | | | | | | | |
Mineral property interests | | 3 | | | — | | | | — | | | | 24,921,259 | |
| | | | | | | | | | | | | | |
Total non-current assets | | | | | — | | | | — | | | | 24,921,259 | |
| | | | | | | | | | | | | | |
Current assets | | | | | | | | | | | | | | |
Assets classified as held for sale | | 3 | | | 24,921,259 | | | | 24,921,259 | | | | — | |
| | | | | | | | | | | | | | |
Total current assets | | | | | 24,921,259 | | | | 24,921,259 | | | | 24,921,259 | |
| | | | | | | | | | | | | | |
Total assets | | | | | 24,921,259 | | | | 24,921,259 | | | | 24,921,259 | |
| | | | | | | | | | | | | | |
Equity and Liabilities | | | | | | | | | | | | | | |
Equity | | | | | | | | | | | | | | |
Equity | | 5 | | | 25,642,242 | | | | 25,632,242 | | | | 25,043,258 | |
Accumulated loss | | | | | (718,983 | ) | | | (710,983 | ) | | | (121,999 | ) |
| | | | | | | | | | | | | | |
Total equity and liabilities | | | | | 24,921,259 | | | | 24,921,259 | | | | 24,921,259 | |
| | | | | | | | | | | | | | |
| | | | |
Net asset value | | | | | 24,921,259 | | | | 24,921,259 | | | | 24,921,259 | |
Net tangible asset value | | | | | 24,921,259 | | | | 24,921,259 | | | | 24,921,259 | |
Number of shares in issue | | | | | 100 | | | | 100 | | | | 100 | |
Net asset value per share | | | | | 249,213 | | | | 249,213 | | | | 249,213 | |
K-3
STATEMENT OF COMPREHENSIVE INCOME FOR THE YEARS ENDED 31 DECEMBER 2012, 2011 and 2010
| | | | | | | | | | | | | | | | |
| | | Note | | | 31 DECEMBER
2012 | | | 31 DECEMBER
2011 | | | 31 DECEMBER
2010 | |
Revenue | | | | | | | — | | | | — | | | | — | |
Cost of sales | | | | | | | — | | | | — | | | | — | |
| | | | | | | | | | | | | | | | |
Gross profit | | | | | | | — | | | | — | | | | — | |
Administrative expenses | | | | | | | (8,000 | ) | | | (588,984 | ) | | | (121,999 | ) |
| | | | | | | | | | | | | | | | |
Loss before income tax | | | 8 | | | | (8,000 | ) | | | (588,984 | ) | | | (121,999 | ) |
Income tax | | | 9 | | | | — | | | | — | | | | — | |
| | | | | | | | | | | | | | | | |
Loss and total comprehensive loss for the year | | | | | | | (8,000 | ) | | | (588,984 | ) | | | (121,999 | ) |
| | | | | | | | | | | | | | | | |
| | | |
Loss per share | | | | 80 | | | | 5,890 | | | | 1,220 | |
Headline loss per share | | | | 80 | | | | 5,890 | | | | 1,220 | |
Weighted average number of shares in issue | | | | 100 | | | | 100 | | | | 100 | |
K-4
STATEMENT OF CHANGES IN EQUITY FOR THE YEARS ENDED 31 DECEMBER 2012, 2011 and 2010
| | | | | | | | | | | | |
| | | Equity
Reserve | | | Accumulated loss | | | Total | |
Balance at 1 January 2010 | | | — | | | | — | | | | — | |
Loss for the year | | | — | | | | (121,999 | ) | | | (121,999 | ) |
Equity movement | | | 25,043,258 | | | | — | | | | 25,043,258 | |
| | | | | | | | | | | | |
Balance at 31 December 2010 | | | 25,043,258 | | | | (121,999 | ) | | | 24,921,259 | |
Loss for the year | | | — | | | | (588,984 | ) | | | (588,984 | ) |
Equity movement | | | 588,984 | | | | — | | | | 588,984 | |
| | | | | | | | | | | | |
Balance at 31 December 2011 | | | 25,632,242 | | | | (710,983 | ) | | | 24,921,259 | |
Total comprehensive loss for the year | | | | | | | | | | | | |
Loss for the year | | | 8,000 | | | | (8,000 | ) | | | — | |
| | | | | | | | | | | | |
Balance at 31 December 2011 | | | 25,642,242 | | | | (718,983 | ) | | | 24,921,259 | |
| | | | | | | | | | | | |
K-5
NOTES TO THE HISTORICAL FINANCIAL INFORMATION FOR THE YEARS ENDED 31 DECEMBER 2012, 2011 AND 2010
The statement s of comprehensive income, statement of financial position, statement of changes in equity and statement of cash flows for the three years ended 31 December 2012 (“Historical Financial Information”) has been derived from the published audited financial results of Ga-Phasha in accordance with International Financial Reporting Standards and the Companies Act. It is not Atlatsa’s policy to present notes in respect of condensed financial results other than those required in terms of IAS34: Interim Financial Reporting.
KPMG Inc. is the auditor and has conducted the audit of the annual financial statements for the three years ended 31 December 2012 in accordance with International Standards of Auditing and reported on without qualification for the two years ended 31 December 2011. The financial statements for 31 December 2012 have been issued with a modified opinion in respect of going concern i.e. an emphasis of matter.
There has been no material change in the nature of the business during the past three years and there are no other materials facts or circumstances that have occurred between the latest financial year end and the last practicable date.
The directors are responsible for the preparation and fair presentation of the historical financial information for Ga-Phasha Platinum Mine Proprietary Limited, comprising the statement of financial position for the three years ended 31 December 2012, and the statements of comprehensive income, changes in equity and cash flows for the 3 years then ended, and the notes and relevant disclosures to the historical financial information, which include a summary of significant accounting policies and other explanatory notes, in accordance with International Financial Reporting Standards (“IFRS”), and the requirements of the Companies Act of South Africa.
| 1.1 | Statement of compliance |
The financial statements have been prepared in accordance with IFRS and the requirements of the Companies Act 2008 (as amended) and Companies Regulations 2011.
The financial statements have been prepared on the historical cost basis as set out in the accounting policies below and are presented in Rands.
| 1.3 | Use of estimates and judgements |
The preparation of the financial statements in accordance with IFRS requires management to make judgements, estimates and assumptions that affect the application of accounting policies and the reported amounts of assets, liabilities, income and expenses. Actual results may differ from these estimates. Estimates and underlying assumptions are reviewed on an ongoing basis. Revisions to accounting estimates are recognized in the period in which the estimates are revised and in any future periods affected.
Information about critical judgements in applying accounting policies that have the most significant effect on the amounts recognized in the financial statements is included in the notes to the financial statements where applicable.
| 1.4 | Impact of standards and interpretations not yet adopted |
At the reporting date, the following accounting standards were in issue but not yet effective:
| | • | | Amendments to IAS 12, Deferred Tax: Recovery of Underlying assets (1 January 2012) |
| | • | | IAS 27, Separate Financial Statements (1 January 2013) |
K-6
| | • | | IFRS 9, Financial Instruments (1 January 2013) |
| | • | | IFRS 9, Additions to IFRS 9 Financial instruments (1 January 2013) |
| | • | | IFRS 13, Fair Value Measurement (1 January 2013) |
The company is currently evaluating the impact, if any, that these new standards will have on the financial statements.
Standards and interpretations adopted in the current year by the Company:
| | • | | IAS 24 (revised),Related party disclosures |
| | • | | Amendments to IAS 32,Financial statements: Presentation: Classification of Rights Issue |
| | • | | Amendments to IFRS 7,Disclosures – Transfer of Financial Assets |
| | • | | IFRIC 19, Extinguishing Financial liabilities with Equity Instruments |
| | • | | Various improvements to IFRS 2010 |
There was no significant impact on these financial statements as a result of adopting these standards and interpretations.
Ordinary Shares
Ordinary shares are classified as equity. Incremental costs directly attributable to the issue of ordinary shares are recognized as a deduction from equity, net of any tax effects.
| 2.2 | Exploration expenditure and mineral property interests |
The acquisition of mineral property interests are initially measured at cost. Mineral property acquisition costs and development expenditures incurred subsequent to the determination of the feasibility of mining operations and approval of development by the company are capitalized until the property to which they relate is placed into production, sold or allowed to lapse.
Exploration and evaluation costs incurred prior to determination of the feasibility of mining operations are expensed as incurred. Re-imbursement of previously expensed exploration and evaluation costs are recognized as other income in profit or loss.
Mineral property acquisition costs include the cash consideration and the fair market value of shares issued for mineral property interests pursuant to the terms of the relevant agreements. These costs will be amortized over the estimated life of the property following commencement of commercial production, or written off if the property is sold, allowed to lapse, or when an impairment of value has been determined to have occurred.
| 2.3.1 | Non-financial assets |
The carrying amounts of the company’s non-financial assets are reviewed at each reporting date to determine whether there is any indication of impairment. If any such indication exists, then the asset’s recoverable amount is estimated.
K-7
The recoverable amount of an asset or cash-generating unit is the greater of its value in use and its fair value less costs to sell. In assessing value in use, the estimated future cash flows are discounted to their present value using a pre-tax discount rate that reflects current market assessments of the time value of money and the risks specific to the asset. For the purpose of impairment testing, assets are grouped together into the smallest group of assets that generates cash inflows from continuing use that are largely independent of the cash inflows of other assets or groups of assets (the “cash-generating unit”).
An impairment loss is recognized if the carrying amount of an asset or its cash-generating units exceeds its estimated recoverable amount. Impairment losses are recognized in profit or loss. Impairment losses recognized in respect of cash- generating units are allocated to reduce the carrying amounts of the assets in the unit (group of units) on a pro rata basis.
Impairment losses recognized in prior years are assessed at each reporting date for any indications that the loss has decreased or no longer exists. An impairment loss is reversed if there has been a change in the estimates used to determine the recoverable amount. An impairment loss is reversed only to the extent that the asset’s carrying amount does not exceed the carrying amount that would have been determined, net of depreciation or amortisation, if no impairment loss had been recognized.
| 2.4 | Non-derivative financial liabilities |
Non-derivative financial liabilities comprise other payables and loans from related parties.
Financial liabilities are recognized initially at fair value plus any directly attributable transaction costs. Subsequent to initial recognition these financial liabilities are measured at amortised cost using the effective interest method.
Income tax expense comprises current and deferred tax. Current tax and deferred tax are recognized in profit or loss except to the extent that it relates to a business combination, or items recognized directly in equity or in other comprehensive income. Current tax is the expected tax payable or receivable on the taxable income or loss for the year, using tax rates enacted or substantively enacted at the reporting date, and any adjustment to tax payable in respect of previous years.
Deferred tax is recognized in respect of temporary differences between the carrying amounts of assets and liabilities for financial reporting purposes and the amounts used for taxation purposes. Deferred tax is not recognized for the following temporary differences: the initial recognition of assets or liabilities in a transaction that is not a business combination and that affects neither accounting nor taxable profit or loss, and differences relating to investments in subsidiaries and jointly controlled entities to the extent that it is probable that they will not reverse in the foreseeable future. In addition, deferred tax is not recognized for taxable temporary differences arising on the initial recognition of goodwill.
Deferred tax is measured at the tax rates that are expected to be applied to temporary differences when they reverse, based on the laws that have been enacted or substantively enacted by the reporting date. Deferred tax assets and liabilities are offset if there is a legally enforceable right to offset current tax liabilities and assets, and they relate to income taxes levied by the same tax authority on the same taxable entity, or on different tax entities, but they intend to settle current tax liabilities and assets on a net basis or their tax assets and liabilities will be realised simultaneously.
A deferred tax asset is recognized for unused tax losses, tax credits and deductible temporary differences, to the extent that it is probable that future taxable profits will be available against which they can be utilized. Deferred tax assets are reviewed at each reporting date and are reduced to the extent that it is no longer probable that the related tax benefit will be realised.
| 2.6 | Non-current assets held for sale or distribution |
Non-current assets, or disposal groups comprising assets and liabilities, that are expected to be recovered primarily through sale or distribution rather than through continuing use, are classified as held for sale or distribution. Immediately before classification as held for sale or distribution, the assets, or components of a disposal group are remeasured in
K-8
accordance with the Company’s accounting policies. Thereafter generally the assets, or disposal group, are measured at the lower of their carrying amount and fair value less costs to sell. An impairment loss on a disposal group first is allocated to goodwill, and then to remaining assets and liabilities on a pro rata basis, except that no loss is allocated to inventories and deferred tax assets, which continue to be measured in accordance with the Company’s accounting policies.
Impairment losses on initial classification as held for sale or distribution and subsequent gains and losses on remeasurement are recognized in profit or loss. Gains are not recognized in excess of any cumulative impairment loss.
Once classified as held for sale or distribution, intangible assets and property, plant and equipment are no longer amortised or depreciated.
| 3. | MINERAL PROPERTY INTERESTS |
| | | | | | | | | | | | |
| | | 31 DECEMBER
2012 | | | 31 DECEMBER
2011 | | | 31 DECEMBER
2010 | |
| | | |
Non-current assets | | | — | | | | — | | | | 24,921,259 | |
| | | |
Assets classified as held for sale | | | 24,921,258 | | | | 24,921,259 | | | | — | |
The Ga-Phasha mineral property interests consists of four mineral properties – Portion 1 of Paschaskraal 466KS, and the whole of mineral properties Klipfontein 465KS, De Kamp 507KS and Avoca 472KS – covering an area of approximately 9,700 hectares.
During 2011, the Company’s management committed to a plan to sell two (Paschaskraal and De Kamp) of the four mineral properties in Ga-Phasha to RPM, as part of a refinancing and restructuring plan of the Atlatsa group. These mineral properties are expected to be sold during 2013.
For the year ended 31 December 2012, the Company had accumulated losses of R-1,437,966 and, as of that date, the company’s total liabilities exceeded its total assets by R 1,437,866. The company continues to incur losses.
Bokoni Holdco, the company’s holding company has extended financial support to the company until its assets exceed its liabilities.
The Group embarked on a restructuring and recapitalising plan during 2012 and on 28 September 2012 the first phase of the restructuring plan was completed. The funds available from a new facility are expected to meet the Group’s projected cash flow requirements until approximately June 2013. The Group is currently engaged in negotiations with Anglo American Platinum Limited (“Anglo”) to implement the second phase of the plan to reduce debt and for additional funds to be made available from Anglo to meet the Group’s projected cash flow requirements until approximately the end of 2015.
These financial statements are prepared on the basis of accounting policies applicable to a going concern. This basis presumes that debt restructuring and accompanying funding arrangements as described above are successfully negotiated and approved by the shareholders by June 2013, and that the holding company continues to provide financial support.
In the event that the negotiations are not successful or that the holding company ceases to provide financial support, these conditions give rise to a material uncertainty which may cast significant doubt about the ability of the company to continue as a going concern and, therefore that it may be unable to realise its assets and discharge its liabilities in the normal course of business.
K-9
SCHEDULE L
REPORT OF THE INDEPENDENT REPORTING ACCOUNTANT ON THE HISTORICAL FINANCIAL
INFORMATION OF BOIKGANTSHO PLATINUM MINE PROPRIETARY LIMITED
The Directors
Atlatsa Resources Corporation
82 Grayston Drive
Sandton
2146
May 22, 2013
Dear Sirs
Independent reporting accountant’s report on the report of historical financial information of Boikgantsho Platinum Mine Proprietary Limited ( “Boikgantsho” and the “Company”)
The definitions commencing on page 52 of this circular apply mutatis mutandis to this report.
At your request, we present our Independent Reporting Accountant’s report on the Report of Historical Financial Information of Boikgantsho for the three years ended 31 December 2012 (“Historical Financial Information”) for the purposes of complying with the Listings Requirements and for inclusion in the circular dated on or about May 28, 2013. KPMG Inc. is the independent auditor of Boikgantsho.
Our independent reporting accountant’s report on the report of Historical Financial Information comprises an audit report in respect of the three years ended 31 December 2012.
Responsibility of the directors
The directors are responsible for the compilation, contents and preparation of the circular in accordance with the Listings Requirements and the Companies Act. The directors are also responsible for the preparation and fair presentation of the Historical Financial Information in accordance with the requirements of the Listing Requirements, as set out in the basis of preparation paragraph included in Schedule J. The directors are responsible for such internal control as is necessary to enable the preparation of the Historical Financial Information is free from material misstatement, whether due to fraud or error.
L-1
Responsibility of the Independent Reporting Accountant
Our responsibility is to express an audit opinion on the Historical Financial Information for the three years ended 31 December 2012 based on our audit.
Historical Financial Information for the three years ended 31 December 2012
Introduction
We have audited the Historical Financial Information for the three years ended 31 December 2012 attached as Schedule J to the circular and as set out in the basis of preparation paragraph included in Schedule J to the circular.
Responsibility of the independent reporting accountant for the audit
Our responsibility is to express an opinion on the Historical Financial Information for the three years ended 31 December 2012 based on our audit. We conducted our audit of the Historical Financial Information for the three years ended 31 December 2012 in accordance with International Standards on Auditing. Those standards require that we comply with ethical requirements and plan and perform the audit to obtain reasonable assurance about whether the Historical Financial Information is free from material misstatement.
An audit involves performing procedures to obtain audit evidence about the amounts and disclosures in the Historical Financial Information. The procedures selected depend on the auditor’s judgment, including the assessment of the risks of material misstatement of the Historical Financial Information, whether due to fraud or error. In making those risk assessments, the auditor considers internal control relevant to the entity’s preparation and fair presentation of the Historical Financial Information in order to design audit procedures that are appropriate in the circumstances, but not for the purpose of expressing an opinion on the effectiveness of the entity’s internal control. An audit also includes evaluating the appropriateness of accounting policies used and the reasonableness of accounting estimates made by management, as well as evaluating the overall presentation of the Historical Financial Information.
We believe that the audit evidence we have obtained is sufficient and appropriate to provide a basis for our audit opinion.
Opinion
In our opinion, the Historical Financial Information, included in the circular, presents fairly, in all material respects, the financial position of Boikgantsho for the three years ended 31 December 2012, and its financial performance and cash flows for the three years 31 December 2012 in accordance with JSE listings requirements, as set out in the basis of preparation paragraph included in Schedule J to the circular
Emphasis of Matter
We draw attention to the note 5 to the Historical financial information, which indicates that the company had accumulated losses of R368,655,274 as at 31 December 2012 and, as of that date, the company’s total assets exceeded its total liabilities by R859,124,826. Note 5 to the Historical financial information states that these conditions, along with other matters, indicate the existence of a material uncertainty, which may cast significant doubt on the ability of the company to continue as a going concern. Our opinion in not qualified in respect of this matter.
KPMG Inc.
(Signed)“KPMG Inc”
Per Jacque Erasmus
Chartered Accountant (SA)
Registered Auditor
Director
L-2
SCHEDULE M
REPORT OF THE INDEPENDENT REPORTING ACCOUNTANT ON THE HISTORICAL FINANCIAL
INFORMATION OF GA-PHASHA PLATINUM MINE PROPRIETARY LIMITED
The Directors
Atlatsa Resources Corporation
82 Grayston Drive
Sandton
2146
May 22, 2013
Dear Sirs
Independent reporting accountant’s report on the report of historical financial information of Ga-Phasha Platinum Mine Proprietary Limited (“Ga-Phasha” and the “Company”)
The definitions commencing on page 52 of this circular apply mutatis mutandis to this report.
At your request, we present our Independent Reporting Accountant’s report on the Report of Historical Financial Information of Ga-Phasha for the three years ended 31 December 2012 (“Historical Financial Information”) or the purposes of complying with the Listings Requirements and for inclusion in the circular dated on or about May 28, 2013. KPMG Inc. is the independent auditor of Ga-Phasha.
Our independent reporting accountant’s report on the report of Historical Financial Information comprises an audit report in respect of the three years ended 31 December 2012.
Responsibility of the directors
The directors are responsible for the compilation, contents and preparation of the circular in accordance with the Listings Requirements and the Companies Act. The directors are also responsible for the preparation and fair presentation of the Historical Financial Information in accordance with the requirements of the Listing Requirements, as set out in the basis of preparation paragraph included in Schedule K. The directors are responsible for such internal control as is necessary to enable the preparation of the Historical Financial Information is free from material misstatement, whether due to fraud or error.
M-1
Responsibility of the Independent Reporting Accountant
Our responsibility is to express an audit opinion on the Historical Financial Information for the three years ended 31 December 2012 based on our audit.
Historical Financial Information for the three years ended 31 December 2012
Introduction
We have audited the Historical Financial Information for the three years ended 31 December 2012 attached as Schedule K to the circular and as set out in the basis of preparation paragraph included in Schedule K to the circular.
Responsibility of the independent reporting accountant for the audit
Our responsibility is to express an opinion on the Historical Financial Information for the three years ended 31 December 2012 based on our audit. We conducted our audit of the Historical Financial Information for the three years ended 31 December 2012 in accordance with International Standards on Auditing. Those standards require that we comply with ethical requirements and plan and perform the audit to obtain reasonable assurance about whether the Historical Financial Information is free from material misstatement.
An audit involves performing procedures to obtain audit evidence about the amounts and disclosures in the Historical Financial Information. The procedures selected depend on the auditor’s judgment, including the assessment of the risks of material misstatement of the Historical Financial Information, whether due to fraud or error. In making those risk assessments, the auditor considers internal control relevant to the entity’s preparation and fair presentation of the Historical Financial Information in order to design audit procedures that are appropriate in the circumstances, but not for the purpose of expressing an opinion on the effectiveness of the entity’s internal control. An audit also includes evaluating the appropriateness of accounting policies used and the reasonableness of accounting estimates made by management, as well as evaluating the overall presentation of the Historical Financial Information.
We believe that the audit evidence we have obtained is sufficient and appropriate to provide a basis for our audit opinion.
Opinion
In our opinion, the Historical Financial Information, included in the circular, presents fairly, in all material respects, the financial position of Ga-Phasha for the three years ended 31 December 2012, and its financial performance and cash flows for the three years 31 December 2012 in accordance with JSE listings requirements, as set out in the basis of preparation paragraph included in Schedule K to the circular.
Emphasis of Matter
We draw attention to the note 4 to the Historical financial information, which indicates that the company had accumulated losses of R1,437,966 as at for the year ended 31 December 2012 and, as of that date, the company’s total liabilities exceeded its total assets by R1,437,866. Note 4 to the Historical financial information states that these conditions, along with other matters, indicate the existence of a material uncertainty, which may cast significant doubt on the ability of the company to continue as a going concern. Our opinion in not qualified in respect of this matter.
KPMG Inc.
(Signed)“KPMG Inc”
Per Jacque Erasmus
Chartered Accountant (SA)
Registered Auditor
Director
M-2
SCHEDULE N
MATERIAL BORROWINGS, COMMITMENTS AND CONTINGENT LIABILITIES
For the year ended 31 December 2012
| | | | | | | | |
| (Amounts in ZAR) | | 2012 | | | 2011 | |
Redeemable “A” preference shares (related party) | | | — | | | | 3,115,101,787 | |
RPM – Funding loans (related party) | | | — | | | | 1,371,328,697 | |
RPM – Consolidated facility (related party) | | | 3,673,811,519 | | | | — | |
RPM – OCSF (related party) | | | — | | | | 1,374,042,732 | |
RPM – Interest free loan (related party) | | | 28,911,041 | | | | 28,911,041 | |
RPM – commitment fees (related party) | | | — | | | | 10,316,640 | |
Other | | | 15,638,532 | | | | 22,084,027 | |
| | | | | | | | |
| | | 3,718,361,092 | | | | 5,921,784,925 | |
| | |
Short-term portion | | | | | | | | |
Other | | | (7,028,422 | ) | | | (8,707,188 | ) |
| | | | | | | | |
| | | (7,028,422 | ) | | | (8,707,188 | ) |
| | | | | | | | |
Non-current liabilities | | | 3,711,332,671 | | | | 5,913,077,936 | |
| | | | | | | | |
The carrying value of the Group’s loans and borrowings changed during the year as follows:
| | | | | | | | |
Balance at beginning of the year | | | 6,361,371,3348 | | | | 5,694,490,564 | |
Loan from RPM – OCSF | | | 621,775,947 | | | | 515,102,605 | |
Loan repaid – RPM | | | (949,722,824 | ) | | | — | |
Loans repaid – other | | | (8,944,053 | ) | | | (5,689,571 | ) |
Commitment fee capitalised | | | (703,558 | ) | | | (3,129,968 | ) |
Finance expenses accrued | | | 721,390,026 | | | | 704,116,839 | |
Funding loan raised – RPM (related party) | | | 2,692,936,954 | | | | 29,321,716 | |
Redemption of A Preference shares | | | (3,428,176,715 | ) | | | — | |
Capitalisation transaction costs written-off | | | — | | | | 30,455,743 | |
Commitment fee liability | | | 703,558 | | | | 3,129,968 | |
Interest rate swap adjustment | | | — | | | | 355,852 | |
De-recognition of OCSF and Senior funding loan | | | (5,822,233,848 | ) | | | — | |
Recognition of consolidated facility | | | 5,822,233,848 | | | | — | |
Fair value gain on recognition of consolidated facility and subsequent adjustments | | | (1,838,487,696 | ) | | | — | |
Other | | | — | | | | 690,532 | |
Effect of translation | | | (453,781,894 | ) | | | (1,049,529,968 | ) |
| | | | | | | | |
Balance at end of the year | | | 3,718,487,696 | | | | 5,921,784,925 | |
Short-term portion | | | | | | | | |
Other | | | (7,028,422 | ) | | | (8,707,188 | ) |
| | | | | | | | |
| | | (7,028,422 | ) | | | (8,707,188 | ) |
| | | | | | | | |
Non-current portion | | | 3,710,991,374 | | | | 5,913,077,736 | |
| | | | | | | | |
N-1
The fair value gain on recognition of consolidated facility and subsequent adjustments is made up of the following:
| | | | | | | | |
| | | 2012 | | | 2011 | |
Day 1 gain – owners of the company | | | (872,796,997 | ) | | | — | |
Day 1 gain – Non-controlling interest (refer note 24) | | | (1,090,564,019 | ) | | | — | |
Subsequent adjustments* (refer note 24) | | | 124,873,319 | | | | — | |
| | | | | | | | |
| | | (1,838,487,696 | ) | | | — | |
| | | | | | | | |
| * | The subsequent adjustments relate to changes in estimate due to cash flows used in the fair value calculation. |
The terms and conditions for the outstanding borrowings at 31 December 2012 are as follows:
Senior Term Loan Facility (now recognised as part of the “Consolidated facility”)
On 28 April 2011, the Senior Term Loan Facility with Standard Chartered Bank (“SCB”) and FirstRand Bank acting through its division, Rand Merchant Bank (“RMB”) was ceded to Anglo through its subsidiary, RPM. The outstanding interest rate swap was settled with funding obtained from RPM.
The debt ceded to RPM had similar terms as the Senior Term Loan Facility except for certain revisions. The revised terms of the loan was a reduction in the interest rate from a 3 month JIBAR plus applicable margin (4.5%) and mandatory cost (11.735% at 31 December 2010) to 3 month JIBAR plus 4% (9.575% at 31 December 2011). The total facility had also been increased from ZAR750 million to ZAR930 million. The commencement of re-payments was then deferred by one year from 31 January 2013 to 31 January 2014. RPM also waived the loan covenants on the debt as of 31 December 2011 and until 31 January 2013.
On 28 September 2012, Atlatsa entered into an Amendment and Interim Implementation Agreement pursuant to which Atlatsa implemented the first phase of the broader restructuring, recapitalization and refinancing transaction, which was first announced by Atlatsa in a news release dated 2 February 2012.
The first phase of the Restructuring Plan involved an amendment to the terms of the Senior Term Loan Facilities Agreement (now a consolidated facility) dated 12 June 2009 between Plateau, as borrower and RPM, as lender to increase the total loan facility available by approximately ZAR2.65 billion. The additional loan proceeds were used to repay the existing OCSF and fund share subscriptions by Plateau into Bokoni Holdco and by Bokoni Holdco into Bokoni Mine (the “Share Subscriptions”) for the purpose of repayment of certain existing loan facilities by Plateau, Bokoni Holdco and Bokoni Mine.
The interest rate payable on the debt owing will be reduced to an annual effective rate of 6.27% (linked to the 3-month JIBAR) from the current effective rate of 12.31%. Due to the significant change in the terms of the loan, the Senior Term Loan Facility was derecognised and a new loan recognised at fair value – the Consolidated facility.
RPM – Funding Loans (now recognised as part of the “Consolidated facility”)
This loan was between RPM and Bokoni Holdco and consisted of the retention of the original RPM loans for an amount of ZAR480.3 million.
As a result of the changes to the Senior Term Loan Facility, the commencement of the repayments of the ZAR480.3 million was also deferred by one year from 31 January 2013 to 31 January 2014 and is payable in semi-annual instalments. The unpaid principal balance would bear interest at the interest rate and on the same terms as the revised Senior Term Loan Facility ceded by SCB to Anglo. The total facility had also been increased from ZAR720 million to ZAR893 million.
N-2
On 28 September 2012, the loan was derecognised as a result of the significant change in the terms of the loan and a new loan was recognised at fair value – now called the Consolidated facility.
RPM – OCSF (now recognised as part of the “Consolidated facility”)
Under the Operating Cash flow Shortfall Facility (“OCSF”), if funds are requested by Bokoni (and authorised by Bokoni Holdco), RPM shall advance such funds directly to Bokoni. At 31 December 2012, ZAR1.71 billion of the available ZAR2.16 billion has been advanced by RPM. The remaining facility may be utilised only for the purposes of operating or capital expenditure cash shortfalls at Bokoni. In addition, RPM has extended the terms of the OCSF facility to fund cash shortfalls up to 31 January 2013.
The OCSF Loan was originally payable in semi-annual instalments starting 31 January 2013 to the extent cash is available after payment of the Senior Term Facility and the RPM funding loan. The unpaid principal balance on the OCSF will bear interest at a fixed rate of 15.84%, compounded quarterly in arrears. Based on the revised terms on the Senior Facility with RPM, repayment will also be deferred by one year from 31 January 2013 to 31 January 2014.
On 28 September 2012, the loan was derecognised as a result of the significant change in the terms of the loan and a new loan was recognised at fair value – now called the Consolidated facility
RPM – Standby Facility
The Group secured an agreement with RPM to access RPM’s attributable share of the Bokoni Holdco cash flows (“the Standby Facility”) up to a maximum of 29% of all free cash flow generated from the Bokoni Mine to meet its repayment obligations in terms of the Senior Term Loan Facility. This facility will bear interest at the prime rate of interest in South Africa (currently 9%). The standby facility has a final maturity date on 1 July 2018. As at 31 December 2012, no draw-down was made on the standby facility.
RPM – Interest-free loan
This loan is between RPM and Bokoni Holdco. The loan is interest-free and repayable 12 months and 1 day after requested by RPM.
Other
This loan is between Plateau and the Deloitte Mining Shared Service Centre (“DMSSC”) relating to the financing of the new SAP system. The loan bears interest at prime (8.5% at 31 December 2012) plus 2% and is payable in quarterly instalments starting 31 March 2011.
Security
The Senior Term Loan Facility (now recognised as part of the “Consolidated facility”) is secured through various security instruments, guarantees and undertakings provided by the Group against 51% of the cash flows generated by the Bokoni Mine, together with 51% of the Bokoni Mine asset base. The Standby Facility, OCSF and the “A” preference shares rank behind the Senior Term Loan Facility for security purposes.
The Group’s debt is denominated in ZAR.
N-3
SCHEDULE O
MATERIAL CONTRACTS
Except for contracts entered into in the ordinary course of business, the only material contracts entered into by Atlatsa in the two fiscal years immediately preceding this Information Circular are the following:
| (i) | Deloitte Mining Shared Service Centre Master Services Agreement between Plateau and Halonet Investments (Pty) Ltd (Trading as Deloitte Mining Shared Service Centre (Pty) Ltd) dated January 17, 2010 – This agreement relates to the services to be rendered surrounding the new SAP system and other IT related aspects to be supplied by the Deloitte Mining Shared Service Centre. |
| (ii) | Shareholder’s Agreement between Deloitte Consulting (Pty) Ltd and Plateau Resources (Pty) Ltd and Halonet Investments (Pty) Ltd dated October 29, 2010 – This agreement relates to the financing of the new SAP system. The agreement resulted in a loan of $3.4 million (ZAR23 million) from Deloitte Consulting (Pty) Ltd to Plateau, which bears interest at prime plus 2% and is payable in quarterly installments, which commenced March 31, 2011. |
O-1
Document 5
| | | | |
| ATLATSA RESOURCES CORPORATION | | 
9th Floor, 100 University Avenue Toronto, Ontario M5J 2Y1 www.computershare.com | | |
| | | | | | | | |
| | | | | | | | |
| | | | | | | | |
| | | | Security Class | | | | |
| | | | | | | | |
| | | | | | | | |
| | | | Holder Account Number | | | | |
| | | | | | | | |
| | | | | | | | |
| | | | | | | | |
| | | | | | | | |
Form of Proxy - Special Meeting to be held on June 28, 2013
This Form of Proxy is solicited by and on behalf of Management.
| | | | |
| Notes to proxy | | |
| | |
| 1. | | Every registered holder has the right to appoint some other person or company of their choice, who need not be a registered holder, to attend and act on their behalf at the meeting or any adjournment or postponement thereof. If you wish to appoint a person or company other than the persons whose names are printed herein, please insert the name of your chosen proxyholder in the space provided (see reverse). | | |
| | |
| 2. | | If the securities are registered in the name of more than one owner (for example, joint ownership, trustees, executors, etc.), then all those registered should sign this proxy. If you are voting on behalf of a corporation or another individual you must sign this proxy with signing capacity stated, and you may be required to provide documentation evidencing your power to sign this proxy. | | |
| | |
| 3. | | This proxy should be signed in the exact manner as the name(s) appear(s) on the proxy. | | |
| | |
| 4. | | If this proxy is not dated, it will be deemed to bear the date on which it is mailed by Management to the registered holder. | | |
| | |
| 5. | | The securities represented by this proxy will be voted as directed by the registered holder, however, if such a direction is not made in respect of any matter, this proxy will be voted as recommended by Management. | | |
| | |
| 6. | | The securities represented by this proxy will be voted in favour or withheld from voting or voted against each of the matters described herein, as applicable, in accordance with the instructions of the registered holder, on any ballot that may be called for and, if the registered holder has specified a choice with respect to any matter to be acted on, the securities will be voted accordingly. | | |
| | |
| 7. | | This proxy confers discretionary authority in respect of amendments or variations to matters identified in the Notice of Meeting or other matters that may properly come before the meeting or any adjournment or postponement thereof. | | Fold |
| | |
| 8. | | This proxy should be read in conjunction with the accompanying documentation provided by Management. | | |
Proxies submitted must be received by 4:00 PM (Central African Time), 10:00 AM (Eastern Time), 7:00 AM (Pacific Time) on June 26, 2013.
VOTE USING THE TELEPHONE OR INTERNET 24 HOURS A DAY 7 DAYS A WEEK!
| | | | | | | | |
 | |  | | | | |
• Call the number listed BELOW from a touch tone telephone. 1-866-732-VOTE (8683) Toll Free | | • Go to the following web site: www.investorvote.com • Smartphone? Scan the QR code to vote now. | |  | | | | |
If you vote by telephone or the Internet, DO NOT mail back this proxy.
Voting by mail may be the only method for securities held in the name of a corporation or securities being voted on behalf of another individual.
Voting by mail or by Internet are the only methods by which a holder may appoint a person as proxyholder other than the Management nominees named on the reverse of this proxy. Instead of mailing this proxy, you may choose one of the two voting methods outlined above to vote this proxy.
To vote by telephone or the Internet, you will need to provide your CONTROL NUMBER listed below.
CONTROL NUMBER
| | | | | | | | |
Appointment of Proxyholder |
| I/We, being holder(s) of Atlatsa Resources Corporation hereby appoint:Harold Motaung, or failing him, Tumelo Motsisi, | | OR | | Print the name of the person you are appointing if this person is someone other than the Chairman of the Meeting. | | | | |
| | | | | |
| | | | | |
| | | | | |
| | | | | |
as my/our proxyholder with full power of substitution and to attend, act and to vote for and on behalf of the shareholder in accordance with the following direction (or if no directions have been given, as the proxyholder sees fit) and all other matters that may properly come before the Special Meeting of shareholders of Atlatsa Resources Corporation to be held at 82 Grayston Drive, 4th Floor, Sandton, Johannesburg, South Africa, with a simulcast live by video conference to Atlatsa Resources Corporation’s registered offices in Canada at Suite 1300, 777 Dunsmuir Street, Vancouver, British Columbia, on June 28, 2013 at 4:00 PM (Central African Time), 10:00 AM (Eastern Time), 7:00 AM (Pacific Time) and at any adjournment or postponement thereof.
VOTING RECOMMENDATIONS ARE INDICATED BY HIGHLIGHTED TEXT OVER THE BOXES.
| | | | | | | | | | | | | | | | | | |
| | | | | | | | | | | | | | | For | | Against | | |
1.Asset Sale | | | | | | |
To approve the sale by Atlatsa Resources Corporation of certain assets, being its interest in the Eastern section of the Ga Phasha Project and the whole of its interest in the Boikgantsho Project, to Anglo American Platinum Limited, as set out in Schedule A to the accompanying Management Information Circular. | | ¨ | | ¨ | | |
| | For | | Against | | |
| | | | | | |
2. Debt Refinancing | | | | | | | | | | | | | | | | | | Fold |
To approve the execution, delivery and performance by Atlatsa Resources Corporation of certain agreements intended to refinance and restructure Atlatsa Resources Corporation’s existing debt facilities with Anglo American Platinum Limited, as set out in Schedule B to the accompanying Management Information Circular | | ¨ | | ¨ | | |
| | | | | | | | | | | | | | | For | | Against | | |
3.RPM Share Subscription | | | | | | |
To approve the issuance of 125,000,000 common shares in Atlatsa Resources Corporation to Anglo American Platinum Limited for cash consideration of ZAR 750 million (US$83.9 million), as set out in Schedule C to the accompanying Management Information Circular. | | ¨ | | ¨ | | |
| | | | | | |
| | | | | | Fold |
| | | | | | |
| Authorized Signature(s) - This section must be completed for your instructions to be executed. | | Signature(s) | | Date |
I/We authorize you to act in accordance with my/our instructions set out above. I/We hereby revoke any proxy previously given with respect to the Meeting.If no voting instructions are indicated above, this Proxy will be voted as recommended by Management. | | | | | | DD / MM / YY |
| | | | | | |
| | | | | | |
| | | | | | | | |
| ¢ | | 1 7 0 2 8 3 | | A R 0 | | A R Q Q | | + |
Document 6
| | | | |
| ATLATSA RESOURCES CORPORATION | |  | | |
| | 9th Floor, 100 University Avenue | | |
| | Toronto, Ontario M5J 2Y1 | | |
| | www.computershare.com | | |
| | | | | | | | |
| | | | | | | | |
| | | | | | | | |
| | | | Security Class | | | | |
| | | | | | | | |
| | | | | | | | |
| | | | Holder Account Number | | | | |
| | | | | | | | |
| | | | | | | | |
| | | | | | | | |
| | | | | | | | |
Voting Instruction Form (“VIF”) - Special Meeting to be held on June 28, 2013
NON-REGISTERED (BENEFICIAL) SECURITYHOLDERS
| | | | |
| | |
| 1. | | We are sending to you the enclosed proxy-related materials that relate to a meeting of the holders of the series or class of securities that are held on your behalf by the intermediary identified above. Unless you, or a nominee appointed by you, attend the meeting and vote in person in accordance with the instructions contained herein, your securities can be voted only by management, as proxy holder of the registered holder, in accordance with your instructions. | | |
| | |
| 2. | | We are prohibited from voting these securities on any of the matters to be acted upon at the meeting without your specific voting instructions.In order for these securities to be voted at the meeting,it will be necessary for us to have your specific voting instructions.Please complete and return the information requested in this VIF to provide your voting instructions to us promptly. | | |
| | |
| 3. | | If you want to attend the meeting and vote in person, please write your name in the place provided for that purpose in this form. You can also write the name of someone else whom you wish to attend the meeting and vote on your behalf. Unless prohibited by law, the person whose name is written in the space provided will have full authority to present matters to the meeting and vote on all matters that are presented at the meeting, even if those matters are not set out in this form or the information circular. Consult a legal advisor if you wish to modify the authority of that person in any way. If you require help, please contact the Registered Representative who services your account. | | |
| | |
| 4. | | This VIF should be signed by you in the exact manner as your name appears on the VIF. If these voting instructions are given on behalf of a body corporate set out the full legal name of the body corporate, the name and position of the person giving voting instructions on behalf of the body corporate and the address for service of the body corporate. | | |
| | |
| 5. | | If this VIF is not dated, it will be deemed to bear the date on which it is mailed by management to you. | | |
| | |
| 6. | | When properly signed and delivered, securities represented by this VIF will be voted as directed by you, however, if such a direction is not made in respect of any matter, the VIF will direct the voting of the securities to be made as recommended in the documentation provided by Management for the meeting. | | |
| | |
| 7. | | This VIF confers discretionary authority on the appointee to vote as the appointee sees fit in respect of amendments or variations to matters identified in the notice of meeting or other matters as may properly come before the meeting or any adjournment thereof. | | |
| | |
| 8. | | Your voting instructions will be recorded on receipt of the VIF. | | |
| | |
| 9. | | By providing voting instructions as requested, you are acknowledging that you are the beneficial owner of, and are entitled to instruct us with respect to the voting of, these securities. | | |
| | |
| 10. | | If you have any questions regarding the enclosed documents, please contact the Registered Representative who services your account. | | Fold |
| | |
| 11. | | This VIF should be read in conjunction with the information circular and other proxy materials provided by Management. | | |
VIFs submitted must be received by 4:00 PM (Central African Time), 10:00 AM (Eastern Time), 7:00 AM (Pacific Time) on June 26, 2013.
VOTE USING THE TELEPHONE OR INTERNET 24 HOURS A DAY 7 DAYS A WEEK!
| | | | | | | | |
 | |  | | | | |
• Call the number listed BELOW from a touch tone telephone. 1-866-734-VOTE (8683) Toll Free | | • Go to the following web site: www.investorvote.com • Smartphone? Scan the QR code to vote now. | |  | | | | |
If you vote by telephone or the Internet, DO NOT mail back this VIF.
Voting by mailmay be the only method for securities held in the name of a corporation or securities being voted on behalf of another individual.
Voting by mail or by Internetare the only methods by which a holder may choose an appointee other than the Management appointees named on the reverse of this VIF. Instead of mailing this VIF, you may choose one of the two voting methods outlined above to vote this VIF.
To vote by telephone or the Internet, you will need to provide your CONTROL NUMBER listed below.
CONTROL NUMBER
| | | | | | | | |
Appointee(s) |
| Management Appointees are:Harold Motaung, or failing him, Tumelo Motsisi, | | OR | | If you wish to attend in person or appoint someone else to attend on your behalf, print your name or the name of your appointee in this space (see Note #3 on reverse). | | | | |
| | | | | |
| | | | | |
| | | | | |
| | | | | |
as my/our appointee to attend, act and to vote in accordance with the following direction (or if no directions have been given, as the appointee sees fit) and all other matters that may properly come before the Special Meeting of securityholders of Atlatsa Resources Corporation to be held at 82 Grayston Drive, 4th Floor, Sandton, Johannesburg, South Africa, with a simulcast live by video conference to Atlatsa Resources Corporation’s registered offices in Canada at Suite 1300, 777 Dunsmuir Street, Vancouver, British Columbia, on June 28, 2013 at 4:00 PM (Central African Time), 10:00 AM (Eastern Time), 7:00 AM (Pacific Time) and at any adjournment or postponement thereof.
VOTING RECOMMENDATIONS ARE INDICATED BY HIGHLIGHTED TEXT OVER THE BOXES.
| | | | | | | | | | | | | | | | | | |
| | | | | | | | | | | | | | | For | | Against | | |
| | | |
| 1.Asset Sale | | | | | | |
To approve the sale by Atlatsa Resources Corporation of certain assets, being its interest in the Eastern section of the Ga Phasha Project and the whole of its interest in the Boikgantsho Project, to Anglo American Platinum Limited, as set out in Schedule A to the accompanying Management Information Circular. | | ¨ | | ¨ | | |
| | | | | | | | | | | | | | | For | | Against | | |
| | | | | | | | | | | | | | | | | | | |
| 2.Debt Refinancing | | | | | | Fold |
To approve the execution, delivery and performance by Atlatsa Resources Corporation of certain agreements intended to refinance and restructure Atlatsa Resources Corporation’s existing debt facilities with Anglo American Platinum Limited, as set out in Schedule B to the accompanying Management Information Circular. | | ¨ | | ¨ | | |
| | | For | | Against | | |
3.RPM Share Subscription | | | | | | |
To approve the issuance of 125,000,000 common shares in Atlatsa Resources Corporation to Anglo American Platinum Limited for cash consideration of ZAR 750 million (US$83.9 million), as set out in Schedule C to the accompanying Management Information Circular. | | ¨ | | ¨ | | |
| | | | | | |
| | | | | | | | | | | | | | | | | | Fold |
| | | | | | |
| Authorized Signature(s) - This section must be completed for your instructions to be executed. | | Signature(s) | | Date |
If you are voting on behalf of a corporation or another individual you may be required to provide documentation evidencing your power to sign this VIF with signing capacity stated. | | | | | | DD / MM / YY |
| | | | | | |
| | | | | | |
| | | | | | | | |
| ¢ | | 1 7 0 2 8 2 | | A R 0 | | A R Q Q | | + |
Document 7
| | | | | | |
| | ATLATSA RESOURCES CORPORATION | |  | | + |
| | | | Please return completed to: Computershare 9th Floor, 100 University Avenue | | |
| | | | Toronto, Ontario M5J 2Y1 | | |
| | | | | | |
| | | | | | | | |
| | Interim Financial Statements | | | | Annual Financial Statements | | |
| ¨ | | Mark this box if you would like to receive Interim Financial Statements by mail. | | ¨ | | Mark this box if you would like to receive the Annual Financial Statements by mail. | | |
Financial Statements Request Form
Under securities regulations, a reporting issuer must send annually a form to holders to request the Interim Financial Statements and MD&A and/or the Annual Financial Statements and MD&A. If you would like to receive the report(s) by mail, please make your selection and return to the address as noted or register online at www.computershare.com/mailinglist.
Alternatively, you may choose to access the report(s) online at www.sedar.com.
Computershare will use the information collected solely for the mailing of such financial statements. You may view Computershare’s Privacy Code at www.computershare.com/privacy or by requesting that we mail you a copy.
Please place my name on your financial statements mailing list.
| | | | | | |
| ¢ | | ARQQ | | 5 1 E T N N | | + |
| | | |
| | 51ETNN01 | | | | |
SIGNATURES
Pursuant to the requirements of the Securities Exchange Act of 1934, the registrant has duly caused this report to be signed on its behalf by the undersigned, thereunto duly authorized.
| | | | | | | | | | |
| | | | | | ATLATSA RESOURCES CORPORATION |
| | | | | | (Registrant) |
| | | | |
| Date: | | June 3, 2013 | | | | By: | | /s/ De Wet Schutte |
| | | | | | | | Name: | | De Wet Schutte |
| | | | | | | | Title: | | Chief Financial Officer |