Table of Contents
UNITED STATES
SECURITIES AND EXCHANGE COMMISSION
Washington, D.C. 20549
FORM N-CSR
CERTIFIED SHAREHOLDER REPORT OF REGISTERED MANAGEMENT
INVESTMENT COMPANIES
Investment Company Act file number 811-07989
Metropolitan West Funds
(Exact name of registrant as specified in charter)
515 South Flower Street
Los Angeles, CA 90071
(Address of principal executive offices) (Zip code)
Peter Davidson, Esq.
Vice President and Secretary
515 South Flower Street
Los Angeles, CA 90071
(Name and address of agent for service)
Registrant’s telephone number, including area code: (213) 244-0000
Date of fiscal year end: March 31
Date of reporting period: March 31, 2024
Form N-CSR is to be used by management investment companies to file reports with the Commission not later than 10 days after the transmission to stockholders of any report that is required to be transmitted to stockholders under Rule 30e-1 under the Investment Company Act of 1940 (17 CFR 270.30e-1). The Commission may use the information provided on Form N-CSR in its regulatory, disclosure review, inspection, and policymaking roles.
A registrant is required to disclose the information specified by Form N-CSR, and the Commission will make this information public. A registrant is not required to respond to the collection of information contained in Form N-CSR unless the Form displays a currently valid Office of Management and Budget (“OMB”) control number. Please direct comments concerning the accuracy of the information collection burden estimate and any suggestions for reducing the burden to Secretary, Securities and Exchange Commission, 100 F. Street, NE, Washington, DC 20549-1090. The OMB has reviewed this collection of information under the clearance requirements of 44 U.S.C. § 3507.
Table of Contents
Item 1. Reports to Stockholders.
| (a) | The Report to Shareholders is attached herewith. |
Table of Contents

MARCH 31 | ||
2024 | ||
ANNUAL REPORT | ||
METWEST FUNDS | ||
AlphaTrak 500 Fund
Corporate Bond Fund
Flexible Income Fund
Floating Rate Income Fund
High Yield Bond Fund
Intermediate Bond Fund
Investment Grade Credit Fund
Low Duration Bond Fund
Opportunistic High Income Credit Fund
Strategic Income Fund
Sustainable Securitized Fund
(formerly, ESG Securitized Fund)
Total Return Bond Fund
Ultra Short Bond Fund
Unconstrained Bond Fund
| ||
Table of Contents
[THIS PAGE INTENTIONALLY LEFT BLANK]
Table of Contents
| Metropolitan West Funds | ||
| Table of Contents | March 31, 2024 |
| 1 | ||||
| 15 | ||||
| 24 | ||||
| 27 | ||||
| 30 | ||||
| 30 | ||||
| 38 | ||||
| 45 | ||||
| 70 | ||||
| 84 | ||||
| 93 | ||||
| 110 | ||||
| 121 | ||||
| 136 | ||||
| 142 | ||||
| 158 | ||||
| 162 | ||||
| 209 | ||||
| 216 | ||||
| 243 | ||||
| 250 | ||||
| 256 | ||||
| 263 | ||||
| 296 | ||||
| 353 | ||||
| 355 | ||||
| 357 | ||||
Special Meeting of Shareholders - Voting Results (Unaudited) | 358 | |||
| 359 | ||||
| 360 | ||||
| 365 | ||||
Table of Contents
Dear Fellow Shareholder,
Thank you for your continued investment in the Metropolitan West Funds. We are pleased to provide the following Annual Report for the Funds for the period ended March 31, 2024. The past twelve months have notably included the final interest rate hike of the Federal Reserve’s (Fed) current tightening cycle in July, capping the Fed Fund’s rate increase at 525 basis points (bps), a dovish pivot late in the year, and a significant rate sell-off to start 2024 amid better-than-expected growth, price, and employment data that suggested no urgency to the Fed for a cut. This data did, however, help bolster positive investor sentiment that had been building throughout the period, resulting in outperformance of higher risk segments of the market. Against this backdrop, performance across MetWest Funds was generally positive, though behind benchmark results given overweight duration positions and bias towards higher quality issues. AUM (Assets Under Management) across the MetWest Funds complex ended the period at $58 billion. Looking forward, the return outlook should benefit from the higher yield profile of the Funds, the prospect for interest rate cuts (and thus rising price levels for fixed income assets), and the attendant volatility that will likely present opportunities for our teams to apply their hallmark discipline to find value for client assets across the Fund complex.
The March 31, 2024 Annual Report covers the following Metropolitan West Funds:
| Metropolitan West AlphaTrak 500 Fund | M-Class (MWATX) | |
| Metropolitan West Corporate Bond Fund | M-Class (MWCSX), I-Class (MWCBX) | |
| Metropolitan West Flexible Income Fund | M-Class (MWFSX), I-Class (MWFEX) | |
| Metropolitan West Floating Rate Income Fund | M-Class (MWFRX), I-Class (MWFLX), Plan-Class (MWFPX) | |
| Metropolitan West High Yield Bond Fund | M-Class (MWHYX), I-Class (MWHIX) | |
| Metropolitan West Intermediate Bond Fund | M-Class (MWIMX), I-Class (MWIIX) | |
| Metropolitan West Investment Grade Credit Fund | M-Class (MWISX), I-Class (MWIGX) | |
| Metropolitan West Low Duration Bond Fund | M-Class (MWLDX), I-Class (MWLIX), Administrative-Class (MWLNX) | |
| Metropolitan West Opportunistic High Income Credit Fund | M-Class (MWORX), I-Class (MWOPX) | |
| Metropolitan West Strategic Income Fund | M-Class (MWSTX), I-Class (MWSIX) | |
| Metropolitan West Sustainable Securitized Fund | M-Class (MWERX), I-Class (MWESX) | |
| Metropolitan West Total Return Bond Fund | M-Class (MWTRX), I-Class (MWTIX), I-2-Class (MWTTX), Administrative-Class (MWTNX), Plan-Class (MWTSX) | |
| Metropolitan West Ultra Short Bond Fund | M-Class (MWUSX), I-Class (MWUIX) | |
| Metropolitan West Unconstrained Bond Fund | M-Class (MWCRX), I-Class (MWCIX), Plan-Class (MWCPX) |
Economic Review and Market Environment
The rising rate environment that defined the trailing 12-month period was expected to come with adjacent volatility as higher rates weighed on the consumer, businesses, prices, and growth. However, the economic contraction and related typical fallout did not materialize. In fact, growth remained strong, employment robust, and inflation appeared to come under control with the year-over-year U.S. Core Consumer Price Index (ex. food and energy) falling from 5.6% at the start of the period to 3.8% by the end. Showing a commitment to containing price pressures, the Fed continued hiking in May and July, then paused in September, but left FOMC (Federal Open Market Committee) member predictions elevated versus current levels. Despite the lack of additional rate hikes for the remainder of the year, yields continued to move higher across the curve, peaking in October 2023 at levels more than 100-160 bps above early-year lows that accompanied the regional banking turmoil. However, almost immediately following the moment on October 19 when the entire U.S. Treasury curve breached 5% for the first time since the Global Financial Crisis (GFC), a very sharp rally ensued and lasted through year-end. Yields fell anywhere from 90 to 115 bps in the last two and a half months of 2023, while the December FOMC meeting came with a new “dot plot” that showed no additional hikes for the first time since March 2021, leaving little doubt that the Fed’s tightening cycle was over. Optimism that the Fed was done hiking and that a pivot to easing would happen sooner than later had market participants calling for a March start to rate cuts, but persistently strong data in the first quarter of 2024 caused markets to reassess expectations for the path of Fed policy, with projections of an initial cut moved to June from March and 150 bps of 2024 easing trimmed to 75 bps. The Fed, for its part, maintained its resolve and gave no indication it was inclined to ease prematurely on unsupportive indicators. This shift tempered the rally in rates, with every tenor of the U.S. Treasury curve moving higher, continuing the inversion and delivering a reality check on what was an exuberant end to last year, in terms of hopes for the elusive soft landing and market returns. All together, yields ended the trailing 12-month period 60-70 bps higher across maturities of 2-Years and longer.
1 / Annual Report March 2024
Table of Contents
Equity markets seemed unfazed by the potential postponement of a return to an accommodative Fed with the S&P 500 notching a 10%-plus gain for the first quarter of 2024, bringing the total return for the full period to over 30%. Though the bond market bore the brunt of rising rates through October, the 9.3% gain for the Bloomberg U.S. Aggregate Bond Index in late 2023 buoyed returns for the period, bringing the trailing 12-month return for the Index to 1.7%. Investment grade corporate bonds were up 4.4%, while yield premiums relative to U.S. Treasury issues declined to a cycle low, driving over 500 bps of positive relative performance. Financial sectors led, driven by solid returns among REITs (Real Estate Investment Trusts), life insurance companies, brokers, and banks, while tobacco, gaming, and home construction led among industrials. The shorter duration character of high yield corporates, combined with equity-like enthusiasm, brought positive total returns of 11.2%, more than eclipsing the impact of higher rates with +908 bps of outperformance versus duration-matched Treasuries. In the securitized markets, private label (non-agency) commercial mortgage-backed securities (CMBS) outperformed, gaining 6.2%, while non-agency residential MBS backed by legacy (pre-Global Financial Crisis) collateral gained more than 7.5% amid sustained demand and resilient home prices. Agency residential MBS gains were more modest at 1.4% as the sector has been one of the most impacted by rising rates and rate volatility. Finally, asset-backed securities (ABS) managed a 4.3% gain, with the sector benefitting from short durations and strong new-issue sponsorship on attractive yields.
The Economy and Market Ahead
Though the U.S. economy has seemingly defied all expectations throughout the course of this Fed hiking cycle, the impacts of 525 bps of Fed hikes and ongoing inversion of the yield curve cannot be fully discounted, even if they have thus far been held off. Indeed, the well-documented consumer spending of pandemic-era excess savings helped to blunt the initial impact, while 2023’s continuation of the consumer dissaving theme with increased short-term credit utilization, including “buy now, pay later” schemes, helped further propel economic growth from the consumer side. However, credit comes at a cost, and the growing balance on consumer credit cards and other financing options comes at a time where the interest on those balances are at extremely elevated levels. For lenders, this has translated to growing losses on unsecured consumer loans and commensurate tightening of lending standards, which will only serve to further slow the economy once it turns. On the corporate side, businesses are now multiple years into an elevated interest rate regime and have likely exhausted the primary means of protecting margins, including price reductions, hiring freezes, and a furloughing of employees to part-time work, with layoffs the final piece that loosens the labor market and pushes the economy into a recession. In this environment, the yield curve is expected to re-steepen sharply as the Fed steps in to support the economy, shore up markets, and inject liquidity into the system.
Data sources for the discussion above include Barclays, Bloomberg, JPMorgan and Merrill Lynch.
Fund Performance Commentary
The performance data presented below represents past performance and is no guarantee of future results. Total returns include reinvestment of dividends and distributions. Current performance may be lower or higher than the performance data presented. Performance data current to the most recent month-end is available on the Funds’ website at TCW.com. Investment returns and principal value will fluctuate with market conditions. The value of an investment in a Fund, when redeemed, may be worth more or less than its original purchase cost.
Metropolitan West AlphaTrak 500 Fund
M-Class (MWATX)
Against a largely risk-on backdrop, especially in the latter half of the year, the MetWest AlphaTrak 500 Fund –M Class (“Fund”) gained 29.17% (net of fees) for the 12-month period ending March 31, 2024, though this trailed the S&P 500 Index (“Index’) by 71 bps. While the use of S&P 500 Index futures allows the Fund to replicate Index returns, relative underperformance was attributable primarily to the Fund’s short duration fixed income portfolio that collateralizes the futures position. In particular, the positive duration position was the largest headwind given the increase in Treasury yields over the year. However, the allocation to fixed income spread products positively impacted relative returns as improved investor demand across sectors helped drive outperformance relative to U.S. Treasuries for nearly every major component of the market, with the position in securitized products providing the largest positive impact. Investors’ perception of risk associated with securitized products improved over the period alongside growing soft-landing optimism, helping securitized products finish ahead of risk-free assets. Contributions stemmed from the Fund’s ABS exposure, led by AAA-rated CLOs (Collateralized Loan Obligations) and issues backed by auto loans. This improved risk sentiment also benefitted the CMBS sector and resulted in a tailwind to Fund holdings, which were predominantly in high-quality private label deals with strong collateral. In the residential MBS sector, Fund performance benefitted from both legacy and newer issue holdings given steady cash flows and rising price levels over the year, while, away from securitized, corporate credit exposure also drove a positive performance impact. Fund holdings of banking, wireline, healthcare, and pharmaceutical names contributed from an issue selection standpoint, while the focus on the broad financials sector benefitted returns as it was the top-performing major sector among short duration corporates.
Annual Report March 2024 / 2
Table of Contents
Duration positioning remains somewhat longer than typical given our view that rates are restrictive and above fair value, especially in a slowing economy where inflation has generally been on a downward trend. Sector positioning currently emphasizes high-quality securitized product opportunities offering attractive risk-adjusted yields, with a focus on agency MBS. Though nominal spreads have come down from the peaks observed last May and October, they remain wide relative to historical averages and other high-quality fixed income products, creating compelling relative value that is further supported by the government guarantee and liquid nature of the sector. Non-agency MBS also offers good yields and solid fundamentals after years of amortization and housing price appreciation that has built up substantial equity in the underlying properties, incentivizing homeowners to remain current and insulating bondholders from potential losses. Meanwhile, CMBS represents a smaller and more targeted allocation with a focus on high-quality collateral and sponsors, while ABS exposure emphasizes AAA-rated CLOs and automobile collateral. Turning to corporate credit, current market valuations present an asymmetrical risk and reward profile; the likelihood of spreads compressing meaningfully from these levels is small, while the risk of significant widening as the sector reprices to a potentially slowing economy is high. As such, the Fund capitalized on market strength to reduce exposure and migrate higher up the quality spectrum, with remaining positions emphasizing defensive sectors like communications, non-cyclicals, and those not typically prone to cyclical volatility.
| Performance Through March 31, 2024 | ||||||||||||||||
| 6 Months (Cumulative) | 1 Year (Annualized) | 3 Year (Annualized) | 5 Year (Annualized) | 10 Year (Annualized) | Since Inception (Annualized) | |||||||||||
| MWATX (Inception: June 29, 1998) | 24.31% | 29.17% | 9.73% | 14.00% | 13.02% | 8.17% | ||||||||||
| S&P 500 Index | 23.48% | 29.88% | 11.48% | 15.03% | 12.95% | 8.10% | ||||||||||
Metropolitan West Corporate Bond Fund
M-Class (MWCSX), I-Class (MWCBX)
The MetWest Corporate Bond Fund – I Class (“Fund”) gained 3.52% (net of fees) for the 12-month period ending March 31, 2024, though this trailed the Bloomberg U.S. Corporate Index (“Index”) by 90 bps. Relative underperformance stemmed largely from the Fund’s duration position, which remained longer than the Index throughout the year while extending in a disciplined fashion alongside the rise in rates. Also weighing on relative returns was the underweight to corporate credit, which was expressed largely via an underweight to industrials, including energy, which was among the strongest performers for the period. The strong market tone and improved investor demand for corporate credit did, however, provide opportunity to trim exposure at favorable levels and shift to a more defensive posture, while select industries like banking remained a targeted overweight throughout the year. The focus on the broader financial sector helped to partially offset the drag from being underweight corporate exposure as it was the best-performing major sector, while favorable issue selection further supported performance, led by banking, midstream energy, and technology names. Finally, the very modest position in municipals and non-agency CMBS interest-only (IO) bonds contributed to performance as price levels on municipals improved and IOs benefitted from steady cash flows.
Given expectations for a normalization in both the level and term structure of interest rates, duration positioning remained longer than the Index, finishing the quarter approximately 0.7 years long with an emphasis on front-end yields. Turning to sector positioning, corporate credit represents an underweight given current market valuations and yield spread levels that, in our view, are overly optimistic. Such tight spreads also present an asymmetrical risk and reward profile; the likelihood of further meaningful compression from these levels is small, while the risk of significant widening as the sector reprices to a potentially slowing economy is high. As such, the Fund capitalized on this market strength to reduce exposure and migrate higher up the quality spectrum, with remaining positions emphasizing defensive sectors like communications, non-cyclicals, and those not typically prone to cyclical volatility. Finally, very small positions in interest-only (IO) CMBS bonds and agency MBS CMOs (Collateralized Mortgage Obligations) with stable duration profiles are maintained, while a modest position in municipal debt is also held.
| Performance Through March 31, 2024 | ||||||||||||||||||||||||
| 6 Months (Cumulative) | 1 Year (Annualized) | 3 Year (Annualized) | 5 Year (Annualized) | 10 Year (Annualized) | Since Inception (Annualized) | |||||||||||||||||||
| MWCSX (Inception: June 29, 2018) | 7.88% | 3.15% | -2.60% | 1.65% | — | 2.75% | ||||||||||||||||||
| Bloomberg U.S. Corporate Index | 8.07% | 4.43% | -1.87% | 1.52% | — | 2.35% | ||||||||||||||||||
| MWCBX (Inception: June 29, 2018) | 8.14% | 3.52% | -2.32% | 1.92% | — | 3.03% | ||||||||||||||||||
| Bloomberg U.S. Corporate Index | 8.07% | 4.43% | -1.87% | 1.52% | — | 2.35% | ||||||||||||||||||
3 / Annual Report March 2024
Table of Contents
Metropolitan West Flexible Income Fund
M-Class (MWFSX), I-Class (MWFEX)
The MetWest Flexible Income Fund – I Class (“Fund”) gained 5.77% (net of fees) for the 12-month period ended March 31, 2024, while the Bloomberg U.S. Aggregate Bond Index (“Index”) gained 1.70%. Outperformance for the period was due in part to the Fund’s shorter-than-Index duration position as Treasury yields marched higher across the curve, with the 10-Year touching 5% in the third quarter. Also significant to outperformance was the off-Index allocation to securitized sectors. Agency MBS was a headwind in the first half of the period given the historically cheap (and cheapening) levels but bounced back in the second half with strong returns in 4Q23 and March 2024. Non-agency MBS generally performed well over the period given improved investor optimism regarding the future trajectory of home prices and increased investor demand in the space. Additionally, their largely floating rate structures and minimal interest rate duration profiles have benefitted performance in the rising rate environment. Similarly, the Fund’s CLO position contributed for the period as their floating rate nature mitigated the impact of rising rates while falling yield premiums helped propel the sector to outperformance relative to duration-matched Treasuries. Finally, private label CMBS performance was also strong, while additional gains came from interest-only CMBS bonds which continued to benefit from strong cash flows. Turning to corporate credit, the rally over the period prompted disciplined trimming of the Fund’s position, with strong valuations across sectors providing opportunities to de-risk and crystalize gains on holdings that had moved above fair value. Industrials represented an underweight throughout the period, weighing on relative returns as the sector outpaced Treasuries by nearly 280 bps, though issue selection contributed, particularly consumer cyclicals and consumer non-cyclicals. The overweight to financials was trimmed late in the period, but the position contributed overall. Additionally, with European corporate markets outperforming robust U.S. corporate markets in the latter part of the period, the small allocation to Euro-denominated bonds contributed.
Duration positioning ended the quarter at approximately 3.8 years, with a continued emphasis on front-end yields given expectations for a reversal in Fed policy. Sector positioning emphasizes high-quality securitized product opportunities offering attractive risk-adjusted yields, particularly residential MBS. Non-agency MBS exhibits good yields and solid fundamentals given years of amortization and housing price appreciation that has built up substantial equity in the underlying properties, incentivizing homeowners to remain current and insulating bondholders from potential losses. Agency MBS also represents attractive relative value and represents a sizable position but remains slightly underweight versus the Index. Though nominal spreads for the sector have tightened from the wide levels observed in 2023, they remain cheap relative to both historical standards and other high-quality segments of the market, providing yield pickup without undertaking credit risk given the government guarantee. Meanwhile, CMBS represents a small and targeted allocation, focused on deals backed by trophy collateral and/or strong, experienced sponsors that can withstand any prospective volatility in the sector as it undergoes what is likely a slow-moving correction, while a small position in interest-only bonds is maintained given attractive upside potential. ABS positions similarly reflect targeted allocations given the challenges weaker structures or those backed by unsecured collateral are likely to face in a slowing economy, with CLOs comprising the bulk of the exposure, while smaller positions are maintained in a variety of non-traditional collateral types such as student loans, single family rentals, and shipping containers. Turning to corporate credit, current market valuations present an asymmetrical risk and reward profile; the likelihood of spreads compressing meaningfully from these levels is small, while the risk of significant widening as the sector reprices to a slowing economy is high. As such, the Fund capitalized on market strength to reduce exposure and migrate higher up the quality spectrum, with remaining positions emphasizing defensive sectors like communications, non-cyclicals, and those not typically prone to cyclical volatility.
| Performance Through March 31, 2024 | ||||||||||||||||||||||||
| 6 Months (Cumulative) | 1 Year (Annualized) | 3 Year (Annualized) | 5 Year (Annualized) | 10 Year (Annualized) | Since Inception (Annualized) | |||||||||||||||||||
| MWFSX (Inception: November 30, 2018) | 6.56% | 5.64% | 0.55 | % | 4.36 | % | — | 6.01% | ||||||||||||||||
| Bloomberg U.S. Aggregate Bond Index | 5.99% | 1.70% | -2.45 | % | 0.36 | % | — | 1.23% | ||||||||||||||||
| MWFEX (Inception: November 30, 2018) | 6.69% | 5.77% | 0.77 | % | 4.55 | % | — | 6.18% | ||||||||||||||||
| Bloomberg U.S. Aggregate Bond Index | 5.99% | 1.70% | -2.45 | % | 0.36 | % | — | 1.23% | ||||||||||||||||
Annual Report March 2024 / 4
Table of Contents
Metropolitan West Floating Rate Income Fund
M-Class (MWFRX), I-Class (MWFLX), Plan-Class (MWFPX)
Against a backdrop of higher rates and increased interest income, both the MetWest Floating Rate Income Fund – I Class (“Fund”) and Morningstar LSTA U.S. Leveraged Loan Index (“Index”) posted positive total returns for the 12-month period ending March 31, 2024, though the Fund’s return of 11.58% (net of fees) trailed the Index by 89 bps. Consistent with other segments of markets throughout the period in which riskier assets outperformed, the lowest-rated cohort of the loan universe led performance for the year, with CCC-rated loans gaining nearly 19%. As such, the Fund’s underweight to this cohort weighed on relative returns, while an increased underweight to B-rated loans also produced a drag as they similarly outperformed the broader loan Index, returning over 13%. From an allocation standpoint, underweights to top-performing software, services, consumer durables, and apparel also held back relative returns, though overweights to healthcare and transportation resulted in modestly positive effects. The largest contributions to Fund performance and relative returns, however, was favorable issue selection among loans in the communications, materials, and capital goods industries.
Though challenges certainly loom for borrowers and sponsors in this floating rate segment of the credit markets, the move higher in Treasury yields over the course of the Fed hiking cycle affords investors healthy current yields. After years of “easy money” in the form of low interest rates and covenant-lite loans, the current environment amplifies risks, yes, but is also ripe for disciplined active management. The team continues to emphasize bottom-up, fundamental credit research with the goal of earning compelling risk-adjusted returns, while seeking to avoid defaults and those borrowers with insufficient collateral or residual enterprise values in the event loan repayments stop. In addition, active management looks to capitalize on the value proposition brought forth by ratings-related dislocations in the market, most notably among otherwise-performing, discounted CCC loans that CLOs offload to stay within indenture exposure limits. While this dynamic is set to continue over the coming quarters given the propensity of ratings agencies to issue more downgrades than upgrades, the Fund still maintains an overall bias towards higher-quality loans while the prospective effects of an economy seemingly at an inflection point continue to unfold. Current exposure is focused on industries that traditionally withstand volatility and are less tied to cyclical market patterns, including communications and non-cyclicals (healthcare, pharmaceuticals), with an added focus on borrowers with strong cash flow positions and interest coverage ratios. Meanwhile, higher beta industries or those typically associated with consumer discretionary spending are underweights.
Performance Through March 31, 2024 | ||||||||||||||||||||||||
| 6 Months (Cumulative) | 1 Year (Annualized) | 3 Year (Annualized) | 5 Year (Annualized) | 10 Year (Annualized) | Since Inception (Annualized) | |||||||||||||||||||
| MWFRX (Inception: June 28, 2013) | 5.44% | 11.36% | 4.50% | 4.30% | 3.66% | 3.88% | ||||||||||||||||||
| Morningstar LSTA U.S. Leveraged Loan Index | 5.39% | 12.47% | 5.99% | 5.47% | 4.53% | 4.60% | ||||||||||||||||||
| MWFLX (Inception: June 28, 2013) | 5.54% | 11.58% | 4.71% | 4.51% | 3.86% | 4.09% | ||||||||||||||||||
| Morningstar LSTA U.S. Leveraged Loan Index | 5.39% | 12.47% | 5.99% | 5.47% | 4.53% | 4.60% | ||||||||||||||||||
| MWFPX (Inception: January 29, 2021) | 5.59% | 11.32% | 4.59% | — | — | 4.45% | ||||||||||||||||||
| Morningstar LSTA U.S. Leveraged Loan Index | 5.39% | 12.47% | 5.99% | — | — | 5.87% | ||||||||||||||||||
Metropolitan West High Yield Bond Fund
M-Class (MWHYX), I-Class (MWHIX)
The MetWest High Yield Bond Fund – I Class (“Fund”) gained 9.03% (net of fees) over the twelve-month period ending March 31, 2024, but trailed the Bloomberg U.S. Corporate High Yield 2% Issuer Capped Index (“Index”) by approximately 213 bps. Returns were strong across high yield credit sectors, with financials leading with excess returns of 1,169 bps versus duration-matched Treasuries, while industrials posted excess returns of 890 bps and utilities followed with 509 bps. As credit spreads tightened over the period, positions were trimmed across industrials and financials. Early in the period the overweight in industrials turned into an underweight that was extended throughout subsequent quarters and resulted in a sizable drag as the sector performed well. While trimming among financials reduced the overweight, relative positioning remained largely intact – overweight banks and insurance, underweight finance companies. This contributed to relative returns, particularly the overweight in banks and insurance, though the underweight to finance companies detracted. Utilities remained underweight relative to index positions, resulting in a small drag. Turning to issue selection, the higher quality emphasis across holdings in the Fund, particularly in the financial space, weighed on relative performance as lower-quality assets outperformed amid strong demand for risk assets and a relatively shorter duration profile vis-à-vis investment grade credit. Fund holdings lagged index holdings, especially among brokers, insurance, consumer cyclicals, and non-cyclicals. Finally, the allocation to bank loans generally benefitted relative returns as loans outperformed high yield over the past year in all but the third quarter of 2023.
5 / Annual Report March 2024
Table of Contents
The ongoing risk-on sentiment and resultant compression of credit spreads across high yield corporates saw the average OAS (option-adjusted spread) move below 300 bps in March, indicating extremely rich valuations and low margin for error across the high yield market in aggregate. These valuations present an asymmetrical risk and reward profile; the likelihood of further meaningful compression from these levels is small, while the risk of significant widening as the sector reprices to a potentially slowing economy is high. As such, the Fund has capitalized on market strength to opportunistically trim exposures, with remaining positions emphasizing higher-quality credits and defensive sectors like communications and non-cyclicals (especially healthcare and food & beverage), while avoiding cyclicals and sectors more closely tied to consumer spending and cyclical volatility. Financials represent a small overweight with an emphasis on insurance credits (notably healthcare given attractive long-term fundamentals) and large money center banks in the U.S. Finally, an allocation to high-quality leveraged loans is maintained as their more senior position in the capital structure relative to bonds provides downside protection, and their floating rate nature offers attractive income potential, though issue selection is particularly important. Looking forward, the potential for elevated volatility presents opportunities to add to the corporate basis at more compelling valuations, likely in the latter half of 2024, with the Fund well positioned to deploy capital given its enhanced liquidity profile and up-in-quality bias.
| Performance Through March 31, 2024 | ||||||||||||||||||
| 6 Months (Cumulative) | 1 Year (Annualized) | 3 Year (Annualized) | 5 Year (Annualized) | 10 Year (Annualized) | Since Inception (Annualized) | |||||||||||||
| MWHYX (Inception: September 30, 2002) | 7.59% | 8.64% | 0.90% | 3.93% | 3.40% | 7.10% | ||||||||||||
| Bloomberg U.S. Corporate High Yield Index 2% Issuer Cap | 8.73% | 11.15% | 2.19% | 4.19% | 4.44% | 7.74% | ||||||||||||
| MWHIX (Inception: March 31, 2003) | 7.84% | 8.91% | 1.15% | 4.22% | 3.66% | 6.66% | ||||||||||||
| Bloomberg U.S. Corporate High Yield Index 2% Issuer Cap | 8.73% | 11.15% | 2.19% | 4.19% | 4.44% | 7.25% | ||||||||||||
Metropolitan West Intermediate Bond Fund
M-Class (MWIMX), I-Class (MWIIX)
For the 12-month period ending March 31, 2024, the MetWest Intermediate Bond Fund – I Class (“Fund”) gained 2.12% (net of fees), though this trailed the Bloomberg Intermediate U.S. Government/Credit Index (“Index”) by 57 bps. Relative underperformance stemmed primarily from the Fund’s duration position, which remained longer than the Index throughout the year. Additionally, the Fund benefitted early in the period from an overweight position in corporate credit versus the Index as yield premiums fell, but the continued rally throughout the year prompted disciplined trimming of the Fund’s position, leading to a growing underweight that ultimately weighed on returns for the full-year period. However, this was more than offset by meaningful contributions from issue selection, particularly among banks, consumer non-cyclicals, communications, and REITs, while Euro-denominated issues added modestly later in the period as European corporate markets outpaced robust U.S. corporate markets. Meanwhile, the off-Index allocation to securitized products was a positive, led by residential MBS. Non-agency MBS generally performed well throughout the year as the sector benefitted from robust housing credit fundamentals and increased investor demand across the space, with both legacy (pre-GFC) and newer issued securities contributing, while the agency MBS exposure was a tailwind, driven largely by the strong performance over the fourth quarter of 2023. Finally, ABS and CMBS issues in the Fund performed well given rising prices across both sectors on sustained investor demand and falling yield premiums.
Given expectations for a steeper curve, duration positioning remains overweight relative to the Index, finishing the quarter approximately 0.7 years long with an emphasis on front-end yields. In terms of sector positioning, corporate credit represents an underweight given current market valuations and yield spread levels that, in our view, are overly optimistic. Such tight spreads also present an asymmetrical risk and reward profile; the likelihood of further meaningful compression from these levels is small, while the risk of significant widening as the sector reprices to a potentially slowing economy is high. As such, the Fund capitalized on this market strength to reduce exposure and migrate higher up the quality spectrum, with remaining positions emphasizing defensive sectors like communications, non-cyclicals, and those not typically prone to cyclical volatility. Offsetting the underweight to corporate credit are off-Index positions in high-quality securitized products offering risk-adjusted yields, with agency MBS the largest securitized exposure. Though nominal spreads for the sector have tightened from the wide levels observed in 2023, they remain cheap relative to both historical standards and other high-quality segments of the market, providing yield pickup without undertaking credit risk given the government guarantee. Non-agency MBS also exhibits good yields and solid fundamentals given years of amortization and housing price appreciation that has built up substantial equity in the underlying properties, incentivizing homeowners to remain current and insulating bondholders from potential losses. Meanwhile, CMBS represents a small and targeted allocation, focused on deals backed by trophy collateral and/or strong, experienced sponsors that
Annual Report March 2024 / 6
Table of Contents
can withstand any prospective volatility in the sector as it undergoes what is likely a slow-moving correction. ABS positions similarly reflect targeted allocations given the challenges weaker structures or those backed by unsecured collateral are likely to face in a slowing economy, with FFELP student loans and senior CLO tranches comprising the bulk of the exposure.
| Performance Through March 31, 2024 | ||||||||||||||||||||||||
| 6 Months (Cumulative) | 1 Year (Annualized) | 3 Year (Annualized) | 5 Year (Annualized) | 10 Year (Annualized) | Since Inception (Annualized) | |||||||||||||||||||
| MWIMX (Inception: June 30, 2003) | 4.58% | 1.80% | -1.76% | 0.87% | 1.30% | 3.35% | ||||||||||||||||||
| Bloomberg Intermediate U.S. Government/Credit Index | 4.40% | 2.69% | -1.06% | 1.09% | 1.60% | 2.78% | ||||||||||||||||||
| MWIIX (Inception: June 28, 2002) | 4.69% | 2.12% | -1.51% | 1.11% | 1.53% | 4.12% | ||||||||||||||||||
| Bloomberg Intermediate U.S. Government/Credit Index | 4.40% | 2.69% | -1.06% | 1.09% | 1.60% | 3.14% | ||||||||||||||||||
Metropolitan West Investment Grade Credit Fund
M-Class (MWISX), I-Class (MWIGX)
The MetWest Investment Grade Credit Fund –I Class (“Fund”) gained 4.23% (net of fees) for the 12-month period ended March 31, 2024, while the Bloomberg U.S. Intermediate Credit Index (“Index”) gained 4.56%. Underperformance for the period was partially due to the Fund’s duration position, which remained longer than the Index throughout the year after moving to an overweight position in 2022. The rally in corporate credit over the period prompted disciplined trimming of the Fund’s position, particularly among industrial and financial credit. The underweight to industrial credit was the biggest drag on relative returns for the period as the sector outpaced Treasuries by nearly 280 bps. However, issue selection contributed with the emphasis on communications boosting returns. Financials, meanwhile, had little impact over the period, as favorable issue selection was offset by a drag from the underweight position that resulted after trimming in the latter half of the period. Finally, the overweight to taxable municipal bonds benefitted returns as the sector finished ahead of similar duration Treasuries by nearly 530 bps for the period, while emerging market bonds held in the Fund modestly outpaced those in the Index. Turning to securitized sectors, the off-index allocation to agency MBS was a headwind in the first half of the period given the historically cheap (and cheapening) levels but bounced back in the second half with strong returns in 4Q23 and March 2024. Non-agency MBS generally performed well over the period given improved investor optimism regarding the future trajectory of home prices and increased investor demand in the space. Additionally, their largely floating rate structures and minimal interest rate duration profiles have benefitted performance in the rising rate environment. Similarly, the Fund’s CLO position contributed for the period as their floating rate nature mitigated the impact of rising rates while falling yield premiums helped propel the sector to outperformance relative to duration-matched Treasuries. Finally, private label CMBS performance was also strong, while additional gains came from interest-only CMBS bonds which continued to benefit from strong cash flows.
Given expectations for a steeper curve, duration positioning remains overweight relative to the Index, finishing the quarter approximately 0.8 years long with an emphasis on front-end yields. Turning to sector positioning, current corporate credit market valuations present an asymmetrical risk and reward profile; the likelihood of spreads compressing meaningfully from these levels is small, while the risk of significant widening as the sector reprices to a slowing economy is high. As such, the Fund remained underweight corporate credit, with allocations emphasizing defensive sectors like communications, non-cyclicals, and select financials, including large money center banks as well as insurance and REIT credits with attractive long-term fundamentals, while largely avoiding cyclicals and sectors more closely tied with consumer discretionary spending. The underweight to corporate credit is supplemented by an overweight to municipal debt and high-quality securitized product opportunities offering attractive risk-adjusted yields, where agency MBS represents a sizable position. Though nominal spreads for the sector have tightened from the wide levels observed in 2023, they remain cheap relative to both historical standards and other high-quality segments of the market, providing yield pickup without undertaking credit risk given the government guarantee. Non-agency MBS also exhibits good yields and solid fundamentals given years of amortization and housing price appreciation that has built up substantial equity in the underlying properties, incentivizing homeowners to remain current and insulating bondholders from potential losses. Meanwhile, CMBS represents a small and targeted allocation, focused on high-quality senior non-agency CMBS and interest-only bonds. ABS positions similarly reflect targeted allocations given the challenges weaker structures or those backed by unsecured collateral are likely to face in a slowing economy, with FFELP student loans and senior CLO tranches comprising the bulk of the exposure.
7 / Annual Report March 2024
Table of Contents
| Performance Through March 31, 2024 | ||||||||||||||||||||||||
| 6 Months (Cumulative) | 1 Year (Annualized) | 3 Year (Annualized) | 5 Year (Annualized) | 10 Year (Annualized) | Since Inception (Annualized) | |||||||||||||||||||
| MWISX (Inception: June 29, 2018) | 5.92% | 4.01% | -1.29% | 1.70% | — | 3.02% | ||||||||||||||||||
| Bloomberg U.S. Intermediate Credit Index | 5.81% | 4.56% | -0.52% | 1.77% | — | 2.41% | ||||||||||||||||||
| MWIGX (Inception: June 29, 2018) | 6.17% | 4.23% | -1.09% | 1.92% | — | 3.23% | ||||||||||||||||||
| Bloomberg U.S. Intermediate Credit Index | 5.81% | 4.56% | -0.52% | 1.77% | — | 2.41% | ||||||||||||||||||
Metropolitan West Low Duration Bond Fund
M-Class (MWLDX), I-Class (MWLIX), Administrative-Class (MWLNX)
For the twelve-month period ending March 31, 2024, the MetWest Low Duration Bond Fund – I Class (“Fund”) gained 4.03% (net of fees), outperforming the ICE BofA 1-3 Year U.S. Treasury Index (“Index”) by 106 bps. Relative outperformance was driven by the Fund’s exposure to fixed income credit and yield spread sectors, nearly all of which finished ahead of similar duration Treasuries given the risk-on macro backdrop. The position among securitized products created the largest benefit, led by residential MBS. Non-agency MBS generally performed well throughout the year as the sector benefitted from robust housing credit fundamentals and increased investor demand across the space, with both legacy (pre-GFC) and newer issued securities contributing, while the agency MBS exposure was a tailwind, driven largely by the strong performance over the fourth quarter of 2023. Meanwhile, CMBS issues in the Fund performed well as prices improved later in the period alongside increased investor optimism, while ABS holdings similarly contributed given sustained demand and robust new issue sponsorship by money managers. Turning to the position among short corporates, outright exposure maintained throughout the year rewarded returns, while the ongoing improvement in pricing and valuations across industries provided opportunity to trim exposure and capitalize on holdings that had moved above fair value. From an issue selection standpoint, contributions were led by banks, insurance, pharmaceuticals, healthcare, and select Euro-denominated bonds as European corporate markets outperformed robust U.S. corporate markets late in the period.
Given expectations for a steeper curve, duration positioning remains overweight relative to the Index, finishing the quarter approximately 0.9 years long with an emphasis on front-end yields. Turning to sector positioning, exposures currently emphasize high-quality securitized product opportunities offering attractive risk-adjusted yields, where agency MBS represents the largest outright position. Though nominal spreads for the sector have tightened from the wide levels observed in 2023, they remain cheap relative to both historical standards and other high-quality segments of the market, providing yield pickup without undertaking credit risk given the government guarantee. Non-agency MBS also exhibits good yields and solid fundamentals given years of amortization and housing price appreciation that has built up substantial equity in the underlying properties, incentivizing homeowners to remain current and insulating bondholders from potential losses. Meanwhile, CMBS represents a small and targeted allocation, focused on deals backed by trophy collateral and/or strong, experienced sponsors that can withstand any prospective volatility in the sector as it undergoes what is likely a slow-moving correction. ABS positions similarly reflect targeted allocations given the challenges weaker structures or those backed by unsecured collateral are likely to face in a slowing economy, with FFELP student loans and senior CLO tranches comprising the bulk of the exposure. Turning to corporate credit, current market valuations present an asymmetrical risk and reward profile; the likelihood of spreads compressing meaningfully from these levels is small, while the risk of significant widening as the sector reprices to a slowing economy is high. As such, the Fund capitalized on market strength to reduce exposure and migrate higher up the quality spectrum, with remaining positions emphasizing defensive sectors like communications, non-cyclicals, and those not typically prone to cyclical volatility.
| Performance Through March 31, 2024 | ||||||||||||||||||||||||
| 6 Months (Cumulative) | 1 Year (Annualized) | 3 Year (Annualized) | 5 Year (Annualized) | 10 Year (Annualized) | Since Inception (Annualized) | |||||||||||||||||||
| MWLDX (Inception: March 31, 1997) | 4.27% | 3.82% | 0.20% | 1.28% | 1.25% | 3.18% | ||||||||||||||||||
| ICE BofA 1-3 Year U.S. Treasury Index | 2.80% | 2.97% | 0.08% | 1.16% | 1.07% | 2.81% | ||||||||||||||||||
| MWLIX (Inception: March 31, 2000) | 4.37% | 4.03% | 0.40% | 1.49% | 1.46% | 2.90% | ||||||||||||||||||
| ICE BofA 1-3 Year U.S. Treasury Index | 2.80% | 2.97% | 0.08% | 1.16% | 1.07% | 2.44% | ||||||||||||||||||
| MWLNX (Inception: September 22, 2009) | 4.23% | 3.77% | 0.12% | 1.20% | 1.15% | 2.50% | ||||||||||||||||||
| ICE BofA 1-3 Year U.S. Treasury Index | 2.80% | 2.97% | 0.08% | 1.16% | 1.07% | 1.08% | ||||||||||||||||||
Annual Report March 2024 / 8
Table of Contents
Metropolitan West Opportunistic High Income Credit Fund
M-Class (MWORX), I-Class (MWOPX)
The MetWest Opportunistic High Income Credit Fund – I Class (“Fund”) gained 9.81% (net of fees) over the twelve-month period ending March 31, 2024, but trailed the Bloomberg U.S. Corporate High Yield 2% Issuer Capped Index (“Index”) by approximately 135 bps. A nearly 30% rise in equity markets benefitted the allocation to equities in the Fund, though the underweight to high yield credit in favor of investment grade positions and an off-index allocation to securitized credit resulted in a sizable drag as high yield led across fixed income sectors due to its relatively shorter duration profile and equity-like enthusiasm. The underweight to below investment grade industrials, particularly consumer cyclicals, was the biggest drag on performance, while exposure to utilities also remained underweight relative to index positions, resulting in a small drag. Financials led in both high yield and investment grade credit markets, rewarding the overweight (for most of the period) to the sector, though the underweight to finance companies detracted. As credit spreads compressed and valuations improved, positions were trimmed opportunistically, taking the overall allocation to financials to a relative underweight versus the Index late in the period. Issue selection across sectors further weighed on returns given the higher quality emphasis, with positions in brokerage, insurance, cyclical, non-cyclical, technology, and energy sectors trailing those in the benchmark. Finally, the small allocation to bank loans generally benefitted relative returns as loans outperformed high yield over the past year in all but the third quarter of 2023, and the position was trimmed late in the period.
The ongoing risk-on sentiment and resultant compression of credit spreads across high yield corporates saw the average OAS move below 300 bps in March, indicating extremely rich valuations and low margin for error across the high yield market in aggregate. These valuations present an asymmetrical risk and reward profile; the likelihood of further meaningful compression from these levels is small, while the risk of significant widening as the sector reprices to a potentially slowing economy is high. As such, the Fund has capitalized on market strength to opportunistically trim exposures, with remaining positions emphasizing higher-quality credits and defensive sectors like communications and non-cyclicals (especially healthcare and food & beverage), while avoiding cyclicals and sectors more closely tied to consumer spending and cyclical volatility. Financials represent a small underweight with an emphasis on insurance credits (notably healthcare given attractive long-term fundamentals) and large money center banks in the U.S. An allocation to high-quality leveraged loans is also maintained as their more senior position in the capital structure relative to bonds provides downside protection, and their floating rate nature offers attractive income potential, though issue selection is particularly important. Additionally, the small equity position will be maintained given upside potential. Looking forward, the potential for elevated volatility presents opportunities to add to the corporate basis at more compelling valuations, likely in the latter half of 2024, with the Fund well positioned to deploy capital given its enhanced liquidity profile and up-in-quality bias. Outside of corporate credit, the team is generally constructive on securitized credit, particularly non-agency MBS, which exhibits good yields and solid fundamentals given years of amortization and housing price appreciation that has built up substantial equity in the underlying properties, incentivizing homeowners to remain current and insulating bondholders from potential losses. Finally, CMBS represents a small and targeted allocation, focused on deals backed by trophy collateral and/or strong, experienced sponsors that can withstand any prospective volatility as the sector undergoes what is likely a slow-moving correction, as well as select IO issues where there is attractive upside potential.
| Performance Through March 31, 2024 | ||||||||||||||||||||||
| 6 Months (Cumulative) | 1 Year (Annualized) | 3 Year (Annualized) | 5 Year (Annualized) | 10 Year (Annualized) | Since Inception (Annualized) | |||||||||||||||||
| MWORX (Inception: August 2, 2021) | 8.60% | 9.55% | — | — | — | -0.39% | ||||||||||||||||
| Bloomberg U.S. Corporate High Yield Index 2% Issuer Cap | 8.73% | 11.15% | — | — | — | 1.43% | ||||||||||||||||
| MWOPX (Inception: August 2, 2021) | 8.74% | 9.66% | — | — | — | -0.20% | ||||||||||||||||
| Bloomberg U.S. Corporate High Yield Index 2% Issuer Cap | 8.73% | 11.15% | — | — | — | 1.43% | ||||||||||||||||
Metropolitan West Strategic Income Fund
M-Class (MWSTX), I-Class (MWSIX)
The MetWest Strategic Income Fund – I Class (“Fund”) returned 7.10% (net of fees) for the 12-month period ending March 31, 2024, finishing behind the ICE BofA U.S. 3-Month Treasury Bill Index + 200 bps (“Index”) by 24 bps. Given the increase in yields across the U.S. Treasury curve during the period, the Fund’s positive duration position was the largest detractor from relative performance. Despite the higher rate environment, investor sentiment remained positive and decidedly risk-on, especially later in the year, helping lead fixed income credit and yield spread sectors to outperformance relative to risk-free Treasuries. As
9 / Annual Report March 2024
Table of Contents
such, the Fund’s broad-based fixed income exposure across sectors benefitted relative returns, driven by allocations to securitized products. Non-agency MBS issues contributed the most as continued investor demand and strong fundamentals led to price appreciation, with legacy (pre-GFC) issues and credit risk transfer (CRT) deals in the Fund providing a boost. CMBS and ABS exposure was also additive, with each sector similarly benefitting from increased demand and broader risk-on macro backdrop, while agency MBS holdings had little impact for the full-year period. Turning to the position among corporates, outright exposure maintained throughout the year rewarded returns, while the ongoing improvement in pricing and valuations across industries provided opportunity to trim exposure and capitalize on holdings that had moved above fair value. From an issue selection standpoint, contributions were led by banks, communications, midstream energy, aerospace, and select Euro-denominated bonds as European corporate markets outperformed robust U.S. corporate markets late in the period.
Duration positioning remains longer than typical with an emphasis on the front end of the yield curve given our view that rates are restrictive and above fair value, especially in a slowing economy where inflation has generally been on a downward trend. Sector positioning currently emphasizes high-quality securitized product opportunities offering attractive risk-adjusted yields, where non-agency MBS represents the largest position given good yields and solid fundamentals after years of amortization and housing price appreciation that has built up substantial equity in the underlying properties, incentivizing homeowners to remain current on repayments and insulating bondholders from potential losses. Agency MBS also represents a sizable position, and while nominal spreads in the sector have come down from the peaks observed last May and October, they remain wide relative to historical averages and other high-quality fixed income products, creating compelling relative value that is further supported by the government guarantee and liquid nature of the sector. Meanwhile, CMBS represents a smaller and more targeted allocation, focused on select interest-only bonds and deals backed by trophy collateral and/or strong, experienced sponsors that can withstand any prospective volatility in the sector as it undergoes what is likely a slow-moving correction. ABS exposure similarly reflects targeted allocations given the challenges weaker structures or those backed by unsecured collateral are likely to face in a slowing economy, with single family rentals, AAA- and mezzanine CLOs, and FFELP student loans comprising the bulk of the exposure. Finally, market valuations throughout corporate credit present an asymmetrical risk and reward profile; the likelihood of spreads compressing meaningfully from current levels is small, while the risk of significant widening as the sector reprices to a potentially slowing economy is high. As such, the Fund capitalized on market strength to reduce exposure across investment grade and high yield corporates and migrate higher up the quality spectrum, with remaining positions emphasizing defensive sectors like communications, non-cyclicals, and those not typically prone to cyclical volatility.
| Performance Through March 31, 2024 | ||||||||||||||||||
| 6 Months (Cumulative) | 1 Year (Annualized) | 3 Year (Annualized) | 5 Year (Annualized) | 10 Year (Annualized) | Since Inception (Annualized) | |||||||||||||
| MWSTX (Inception: June 30, 2003) | 6.06% | 6.67% | 1.07% | 2.53% | 2.41% | 3.73% | ||||||||||||
| ICE BofA U.S. 3-Month Treasury Bill Index Plus 200 bps | 3.52% | 7.16% | 4.51% | 3.98% | 3.36% | 3.51% | ||||||||||||
| MWSIX (Inception: March 31, 2004) | 6.19% | 7.10% | 1.31% | 2.74% | 2.65% | 3.35% | ||||||||||||
| ICE BofA U.S. 3-Month Treasury Bill Index Plus 200 bps | 3.52% | 7.16% | 4.51% | 3.98% | 3.36% | 3.53% | ||||||||||||
Metropolitan West Sustainable Securitized Fund
M-Class (MWERX), I-Class (MWESX)
The MetWest Sustainable Securitized Fund – I Class (“Fund”) delivered a total return of 4.67% (net of fees) for the 12-month period ending March 31, 2024, outperforming the Bloomberg U.S. Mortgage-Backed Securities (MBS) Index (“Index”) by 328 bps. Given the increase in yields across the U.S. Treasury curve during the period, the Fund’s positive duration position detracted from relative performance. Despite the higher rate environment, investor sentiment remained positive and decidedly risk-on, especially later in the year, helping lead fixed income credit and yield spread sectors to outperformance relative to risk-free Treasuries. Agency MBS outperformed Treasuries by 100 basis points over the period, despite lagging in the first half of the period given the historically cheap (and cheapening) levels. As a result, the Fund’s structural underweight to this sector reflected a sizable drag on relative returns. However, this drag was sizably offset by the Fund’s exposure to securitized credit, with holdings across non-agency residential and commercial mortgages, and various ABS sectors. Non-agency CMBS holdings, which are concentrated in single asset, single borrower (SASB) properties with sustainable characteristics, represented the largest contributor to performance. Non-agency MBS also continued to provide attractive risk-adjusted returns given the strength of underlying collateral, underpinned by home price appreciation over recent years that has lowered loan-to-value ratios, increased homeowner equity, and effectively de-leveraged many non-agency MBS deals. Fund holdings of re-securitized legacy collateral provided a sizable boost to the Funds outperformance. Elsewhere in securitized, ABS performed well over the period adding to relative returns.
Annual Report March 2024 / 10
Table of Contents
Duration positioning remains longer than typical with an emphasis on the front end of the yield curve given our view that rates are restrictive and above fair value, especially in a slowing economy where inflation has generally been on a downward trend. Residential MBS represents the largest exposure, reflected in a market value allocation to agency MBS. This sector also presents the best opportunities to achieve important allocations to affordable housing. Meanwhile, non-agency MBS remains among the best values in fixed income with good yields and solid fundamentals, within select non-agency exposures that are aligned to social objectives, such as the legacy re-performing loans and manufactured housing. Finally, non-agency CMBS is a sector with both prospective volatility and opportunity, where many of the most compelling opportunities are trophy properties that have green attributes. These properties command rental premiums and have seen relatively ‘sticky’ tenant demand. Market liquidity and demand remain plentiful for these trophy properties, while deals backed by weaker collateral are likely to see principal losses and falling prices on continued materialization of commercial market stress, especially in more subordinated tranches.
Performance Through March 31, 2024 | ||||||||||||||||||||||||
| 6 Months (Cumulative) | 1 Year (Annualized) | 3 Year (Annualized) | 5 Year (Annualized) | 10 Year (Annualized) | Since (Annualized) | |||||||||||||||||||
| MWERX (Inception: October 1, 2021) | 9.15% | 4.33% | — | — | — | -3.51% | ||||||||||||||||||
| Bloomberg U.S. Mortgage-Backed Securities (MBS) Index | 6.36% | 1.39% | — | — | — | -3.56% | ||||||||||||||||||
| MWESX (Inception: October 1, 2021) | 9.25% | 4.67% | — | — | — | -3.45% | ||||||||||||||||||
| Bloomberg U.S. Mortgage-Backed Securities (MBS) Index | 6.36% | 1.39% | — | — | — | -3.56% | ||||||||||||||||||
Metropolitan West Total Return Bond Fund
M-Class (MWTRX), I-Class (MWTIX), I-2-Class (MWTTX), Administrative-Class (MWTNX),
Plan-Class (MWTSX)
The MetWest Total Return Bond Fund – I Class (“Fund”) gained 1.45% (net of fees) for the 12-month period ended March 31, 2024, while the Bloomberg U.S. Aggregate Bond Index (“Index”) gained 1.70%. Underperformance for the period was largely due to the Fund’s duration position, which remained longer than the Index throughout the year after moving to an overweight position in 2022. Additionally, the Fund benefitted early in the period from an overweight position in corporate credit versus the Index as yield premiums fell, but the continued rally throughout the year prompted disciplined trimming of the Fund’s position, leading to a growing underweight that weighed on returns. This was more than offset by meaningful contributions from issue selection, particularly among communications, consumer non-cyclicals, consumer cyclicals, and REITs, while Euro-denominated issues added modestly later in the period as European corporate markets outpaced robust U.S. corporate markets. Turning to securitized sectors, the overweight to agency MBS was a headwind in the first half of the period given the historically cheap (and cheapening) levels but bounced back in the second half with strong returns in 4Q23 and March 2024. During this period, overweight positioning was extended in a disciplined fashion. Away from agency-backed collateral, non-agency MBS generally performed well over the period given improved investor optimism regarding the future trajectory of home prices and increased investor demand in the space. Additionally, their largely floating rate structures and minimal interest rate duration profiles have benefitted performance in the rising rate environment. Similarly, the Fund’s CLO position contributed for the period as their floating rate nature mitigated the impact of rising rates while falling yield premiums helped propel the sector to outperformance relative to duration-matched Treasuries.
Given expectations for a steeper curve, duration positioning remains overweight relative to the Index, finishing the quarter approximately 0.8 years long with an emphasis on front-end yields. Turning to sector positioning, exposures currently emphasize high-quality securitized product opportunities offering attractive risk-adjusted yields, where agency MBS represents the largest outright and relative position. Though nominal spreads for the sector have tightened from the wide levels observed in 2023, they remain cheap relative to both historical standards and other high-quality segments of the market, providing yield pickup without undertaking credit risk given the government guarantee. Non-agency MBS also exhibits good yields and solid fundamentals given years of amortization and housing price appreciation that has built up substantial equity in the underlying properties, incentivizing homeowners to remain current and insulating bondholders from potential losses. Meanwhile, CMBS represents a small and targeted allocation, focused on deals backed by trophy collateral and/or strong, experienced sponsors that can withstand any prospective volatility in the sector as it undergoes what is likely a slow-moving correction. ABS positions similarly reflect targeted allocations given the challenges weaker structures or those backed by unsecured collateral are likely to face in a slowing economy, with FFELP student loans and senior CLO tranches comprising the bulk of the exposure. Turning to corporate credit,
11 / Annual Report March 2024
Table of Contents
current market valuations present an asymmetrical risk and reward profile; the likelihood of spreads compressing meaningfully from these levels is small, while the risk of significant widening as the sector reprices to a slowing economy is high. As such, the Fund capitalized on market strength to reduce exposure and migrate higher up the quality spectrum, with remaining positions emphasizing defensive sectors like communications, non-cyclicals, and those not typically prone to cyclical volatility.
| Performance Through March 31, 2024 | ||||||||||||||||||||||
| 6 Months (Cumulative) | 1 Year (Annualized) | 3 Year (Annualized) | 5 Year (Annualized) | 10 Year (Annualized) | Since Inception (Annualized) | |||||||||||||||||
| MWTRX (Inception: March 31, 1997) | 6.44% | 1.24% | -3.23% | 0.20% | 1.33% | 4.94% | ||||||||||||||||
| Bloomberg U.S. Aggregate Bond Index | 5.99% | 1.70% | -2.45% | 0.36% | 1.54% | 4.23% | ||||||||||||||||
| MWTIX (Inception: March 31, 2000) | 6.55% | 1.45% | -3.02% | 0.42% | 1.56% | 4.72% | ||||||||||||||||
| Bloomberg U.S. Aggregate Bond Index | 5.99% | 1.70% | -2.45% | 0.36% | 1.54% | 3.92% | ||||||||||||||||
| MWTTX (Inception: March 6, 2020) | 6.52% | 1.39% | -3.10% | — | — | -2.14% | ||||||||||||||||
| Bloomberg U.S. Aggregate Bond Index | 5.99% | 1.70% | -2.45% | — | — | -1.79% | ||||||||||||||||
| MWTNX (Inception: December 18, 2009) | 6.37% | 1.12% | -3.34% | 0.09% | 1.23% | 2.79% | ||||||||||||||||
| Bloomberg U.S. Aggregate Bond Index | 5.99% | 1.70% | -2.45% | 0.36% | 1.54% | 2.28% | ||||||||||||||||
| MWTSX (Inception: July 31, 2011) | 6.63% | 1.58% | -2.96% | 0.51% | 1.63% | 2.44% | ||||||||||||||||
| Bloomberg U.S. Aggregate Bond Index | 5.99% | 1.70% | -2.45% | 0.36% | 1.54% | 1.79% | ||||||||||||||||
Metropolitan West Ultra Short Bond Fund
M-Class (MWUSX), I-Class (MWUIX)
For the twelve-month period ending March 31, 2024, the MetWest Ultra Short Bond Fund –I Class (“Fund”) gained 4.31% (net of fees) to finish in line with the ICE BofA 1-Year U.S. Treasury Index (“Index”). With improved investor optimism over the period and accompanying risk-on sentiment resulting in outperformance relative to U.S. Treasuries for nearly every fixed income sector, the Fund’s broad-based exposures contributed favorably to relative returns. Securitized products provided the largest benefit, led by short duration non-agency MBS issues that provided steady cash flows and experienced an increase in prices over the year on heightened demand. Agency MBS holdings also contributed given a sizeable position in floating rate CMOs, which helped to offset some of the negative impacts arising from rate volatility. Similarly, ABS exposure benefitted Fund performance, led by CLOs and single-family rental collateral, while non-agency CMBS issues contributed given strong performance amid the broader risk-on backdrop. Meanwhile, the allocation to short investment grade corporates was beneficial as they bested short-duration Treasuries, with favorable issue selection among banking, REITs and packaging names providing an additional boost. Finally, the Fund’s duration position, which was longer than the Index throughout the period, weighed on relative performance given the increase in Treasury yields over the year.
Duration positioning remains longer than the Index with a focus on front-end yields given our view that rates are restrictive and above fair value, especially in a slowing economy where inflation has generally been on a downward trend. Sector positioning currently emphasizes high-quality securitized product opportunities offering attractive risk-adjusted yields, with a focus on agency MBS. Though nominal spreads have come down from the peaks observed last May and October, they remain wide relative to historical averages and other high-quality fixed income products, creating compelling relative value that is further supported by the government guarantee and liquid nature of the sector. Non-agency MBS also offers good yields and solid fundamentals after years of amortization and housing price appreciation that has built up substantial equity in the underlying properties, incentivizing homeowners to remain current and insulating bondholders from potential losses. Meanwhile, CMBS represents a smaller and more targeted allocation with a focus on high-quality collateral and sponsors, while ABS exposure emphasizes AAA-rated CLOs and automobile collateral. Turning to corporate credit, current market valuations present an asymmetrical risk and reward profile; the likelihood of spreads compressing meaningfully from these levels is small, while the risk of significant widening as the sector reprices to a potentially slowing economy is high. As such, the Fund capitalized on market strength to reduce exposure and migrate higher up the quality spectrum, with remaining positions emphasizing defensive sectors like communications, non-cyclicals, and those not typically prone to cyclical volatility.
Annual Report March 2024 / 12
Table of Contents
| Performance Through March 31, 2024 | ||||||||||||||||||||||
| 6 Months (Cumulative) | 1 Year (Annualized) | 3 Year (Annualized) | 5 Year (Annualized) | 10 Year (Annualized) | Since (Annualized) | |||||||||||||||||
| MWUSX (Inception: June 30, 2003) | 3.78% | 4.14% | 1.14% | 1.26% | 1.11% | 1.72% | ||||||||||||||||
| ICE BofA 1-Year U.S. Treasury Index | 2.63% | 4.30% | 1.44% | 1.66% | 1.25% | 1.63% | ||||||||||||||||
| MWUIX (Inception: July 31, 2004) | 3.86% | 4.31% | 1.31% | 1.42% | 1.27% | 1.63% | ||||||||||||||||
| ICE BofA 1-Year U.S. Treasury Index | 2.63% | 4.30% | 1.44% | 1.66% | 1.25% | 1.67% | ||||||||||||||||
Metropolitan West Unconstrained Bond Fund
M-Class (MWCRX), I-Class (MWCIX), Plan-Class (MWCPX)
The MetWest Unconstrained Bond Fund – I Class (“Fund”) gained 5.87% (net of fees) for the 12-month period ended March 31,
2024, while the Bloomberg U.S. Treasury Bills: 1-3 Months Index (“Index”) gained 5.37%. Despite Treasury yields moving higher from the low levels observed following last March’s U.S. banking sector struggles, fixed income spread products posted sizeable excess returns versus duration-matched Treasuries given growing optimism for a soft-landing and persistent risk-on sentiment that helped drive yield spreads tighter. As such, the Fund’s exposure to spread products, including corporate and securitized credit, benefitted relative returns and drove outperformance versus the Index. Broad-based corporate credit provided the largest contribution given a tightening of credit spreads by 48 and 156 bps for investment grade and high yield corporates, respectively, with favorable issue selection among banking, cable satellite, and media names also contributing. Meanwhile, the improved macro tone and risk-on backdrop drove spread compression across securitized products as well, leading to sizeable contributions to Fund performance from the non-agency MBS, ABS and CMBS sectors, with more subordinated tranches providing the largest benefit given outsized spread compression. Non-agency MBS generally performed well over the period given improved investor optimism regarding the future trajectory of home prices and increased investor demand in the space. Additionally, their largely floating rate structures and minimal interest rate duration profiles have benefitted performance in the rising rate environment. Similarly, the Fund’s CLO position contributed for the period as their floating rate nature mitigated the impact of rising rates while falling yield premiums helped propel the sector to outperformance relative to duration-matched Treasuries. Higher rates, however, did weigh on Fund performance given the positive duration position, which was extended modestly throughout the period to 3.2 years.
Duration positioning ended the quarter at approximately 3.2 years given our view that rates are restrictive and above fair value, especially in a slowing economy where inflation has generally been on a downward trend. Sector positioning currently emphasizes high-quality securitized product opportunities offering attractive risk-adjusted yields, where non-agency MBS represents the largest outright position given good yields and solid fundamentals after years of amortization and housing price appreciation that has built up substantial equity in the underlying properties, incentivizing homeowners to remain current and insulating bondholders from potential losses. Agency MBS also represents a sizable position, and while nominal spreads in the sector have come down from the peaks observed last May and October, they remain wide relative to historical averages and other high-quality fixed income products, creating compelling relative value that is further supported by the government guarantee and liquid nature of the sector. Meanwhile, CMBS represents a smaller and more targeted allocation, focused on deals backed by trophy collateral and/or strong, experienced sponsors that can withstand any prospective volatility in the sector as it undergoes what is likely a slow-moving correction. ABS positions similarly reflect targeted allocations given the challenges weaker structures or those backed by unsecured collateral are likely to face in a slowing economy, with FFELP student loans, single family rentals, and senior CLO tranches comprising the bulk of the exposure. Turning to corporate credit, current market valuations present an asymmetrical risk and reward profile; the likelihood of spreads compressing meaningfully from these levels is small, while the risk of significant widening as the sector reprices to a slowing economy is high. As such, the Fund capitalized on market strength to reduce exposure across investment grade and high yield corporates and migrate higher up the quality spectrum, with remaining positions emphasizing defensive sectors like communications, non-cyclicals, and those not typically prone to cyclical volatility.
13 / Annual Report March 2024
Table of Contents
| Performance Through March 31, 2024 | ||||||||||||||||||||||
| 6 Months (Cumulative) | 1 Year (Annualized) | 3 Year (Annualized) | 5 Year (Annualized) | 10 Year (Annualized) | Since Inception (Annualized) | |||||||||||||||||
| MWCRX (Inception: September 30, 2011) | 5.88% | 5.57% | 0.09% | 1.68% | 2.04% | 3.84% | ||||||||||||||||
| Bloomberg U.S. Treasury Bills: 1-3 Months Index | 2.72% | 5.37% | 2.65% | 2.02% | 1.36% | 1.10% | ||||||||||||||||
| MWCIX (Inception: September 30, 2011) | 6.03% | 5.87% | 0.37% | 1.97% | 2.33% | 4.12% | ||||||||||||||||
| Bloomberg U.S. Treasury Bills: 1-3 Months Index | 2.72% | 5.37% | 2.65% | 2.02% | 1.36% | 1.10% | ||||||||||||||||
| MWCPX (Inception: March 6, 2020) | 6.06% | 5.93% | 0.46% | — | — | 1.26% | ||||||||||||||||
| Bloomberg U.S. Treasury Bills: 1-3 Months Index | 2.72% | 5.37% | 2.65% | — | — | 2.02% | ||||||||||||||||
A Disciplined Value Philosophy
Difficult economic and market conditions, no doubt, test the patience of investors and the discipline of asset managers. The upside, if we can cite one, is that cheaper prices create opportunities for better entry points, and a tendency for excessive risk aversion, that is, panic selling, which amplifies mispricing. This remains especially true in fixed income, as the size, structure and segmentation of the market continue to be a place where active strategy and disciplined implementation can generate outperformance and moderate risk under a value-oriented approach. The Funds and its management are unwavering in that commitment and have been for more than 25 years.
Thank you again for your investment in the Metropolitan West Funds. Our entire team looks forward to continuing to assist you in the fulfillment of your financial goals.
Sincerely,
Megan McClellan
President and Principal Executive Officer of the Trust
Metropolitan West Funds
Portfolio composition is subject to change. The current and future portfolio holdings of the Funds are subject to investment risk.
Bond Funds have similar interest rate, issue, and credit risks as those risks associated with the underlying bonds in their portfolio, all of which could reduce a Fund’s value. As interest rates rise, the value of a Bond Fund can decline and an investor can lose principal. Additional risks to the Funds include derivatives risk, foreign securities risk, asset-backed securities investment risk, and prepayment risk. The High Yield Bond Fund purchases more speculative bonds, which are subject to greater risks than higher rated bonds, including leverage risk. The Strategic Income Fund engages in sophisticated investment strategies, and is subject to short sales and leverage risks. The AlphaTrak 500 trades futures and derivative contracts. These Funds may not be suitable for all investors.
Derivatives risk refers to the risk that changes in the value of a derivative may not correlate perfectly with the underlying asset. Foreign securities risk refers to the risk that the value of a Fund’s investments in foreign securities may decline based on changes to currency values, or political and economic environments in the countries where the Fund invests. Asset-backed securities investment risk refers to the risk that the impairment of the value of the collateral underlying the security in which a Fund invests, such as the non-payment of loans, will result in a reduction in the value of the security. Prepayment risk refers to the possibility that falling interest rates may cause the underlying loans to pay off at a faster than expected rate. This tends to reduce returns since the funds prepaid will have to be reinvested at the then lower prevailing rates. Short sale risk refers to the limited ability of a Fund to sell a debt or equity security short (without owning it) and to borrow the same security from a broker or other institution to complete the sale. If the value of the short sale increases, a Fund would lose money because it will need to replace the borrowed security by purchasing it at a higher price. Leverage risk refers to the limited ability of a Fund to borrow from broker-dealers or other institutions to leverage a transaction, provided that the borrowing is fully-collateralized. The Fund’s assets may change in value while the borrowing is outstanding, which could create interest expenses that can exceed the income from the assets retained.
The views and forecasts expressed here are as of May 2024, are subject to change without notice and may not come to pass. Investment strategies may not achieve the desired results due to implementation lag, other timing factors, portfolio management decision making, economic or market conditions or other unanticipated factors.
This report must be preceded or accompanied by a prospectus.
Annual Report March 2024 / 14
Table of Contents
Illustration of an Assumed Investment of $10,000
The graphs below illustrate the assumed investment of $10,000 for each of the Metropolitan West Funds. The performance data quoted represents past performance and does not guarantee future results. Current performance may be lower or higher than the performance data quoted. Performance data current to the most recent month-end may be obtained at www.tcw.com. Returns are due in part to market conditions which may not be repeated in the future. The investment return and principal value of an investment will fluctuate so that shares, when redeemed, may be worth more or less than their original cost.
The performance tables and graphs do not reflect the deduction of taxes that a shareholder would pay on fund distributions or redemption of fund shares. Unlike an index, the Fund’s total returns are reduced by transaction costs, taxes, management fees and other expenses.
Metropolitan West AlphaTrak 500 Fund
Total Return Performance
The graph below compares the increase in value of a $10,000 investment in the Metropolitan West AlphaTrak 500 Fund with the performance of the S&P 500 Index. The one year and average annual 10 year total returns for the Metropolitan West AlphaTrak 500 Fund were 29.17% and 13.02%, respectively. The graph assumes that distributions were reinvested.
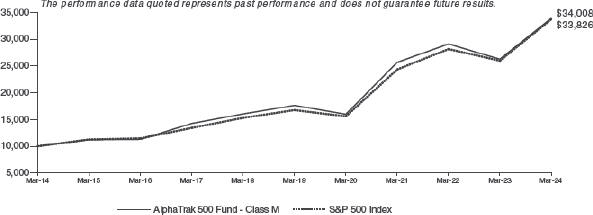
Metropolitan West Corporate Bond Fund – Class M
Total Return Performance
The graph below compares the increase in value of a $10,000 investment in the Metropolitan West Corporate Bond Fund Class M with the performance of the Bloomberg U.S. Corporate Index. The one year and average annual since inception total returns for the Metropolitan West Corporate Bond Fund Class M were 3.15% and 2.75%, respectively. The inception date for Class M was June 29, 2018. The graph assumes that distributions were reinvested.
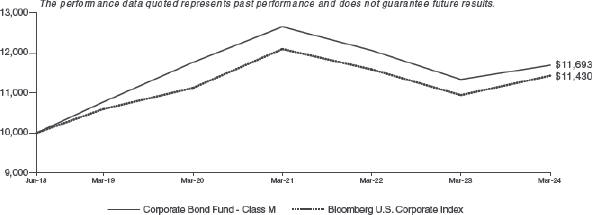
The inception date for the Metropolitan West Corporate Bond Fund Class I was June 29, 2018. The one year and average annual since inception total returns for the Metropolitan West Corporate Bond Fund Class I were 3.52% and 3.03%, respectively. At the end of the same period, a $10,000 investment in the Metropolitan West Corporate Bond Fund Class I shares would have been valued at $11,874.
15 / Annual Report March 2024
Table of Contents
Metropolitan West Flexible Income Fund – Class M
Total Return Performance
The graph below compares the increase in value of a $10,000 investment in the Metropolitan West Flexible Income Fund Class M with the performance of the Bloomberg U.S. Aggregate Bond Index. The one year and average annual since inception total returns for the Metropolitan West Flexible Income Fund Class M were 5.64% and 6.01%, respectively. The inception date for Class M was November 30, 2018. The graph assumes that distributions were reinvested.
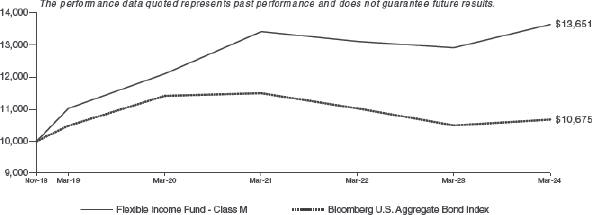
The inception date for the Metropolitan West Flexible Income Fund Class I was November 30, 2018. The one year and average annual since inception total returns for the Metropolitan West Flexible Income Fund Class I were 5.77% and 6.18%, respectively. At the end of the same period, a $10,000 investment in the Metropolitan West Flexible Income Fund Class I shares would have been valued at $13,768.
Metropolitan West Floating Rate Income Fund – Class M
Total Return Performance
The graph below compares the increase in value of a $10,000 investment in the Metropolitan West Floating Rate Income Fund Class M with the performance of the Morningstar LSTA U.S. Leveraged Loan Index. The one year and average annual 10 year total returns for the Metropolitan West Floating Rate Income Fund Class M were 11.36% and 3.66%, respectively. The graph assumes that distributions were reinvested.
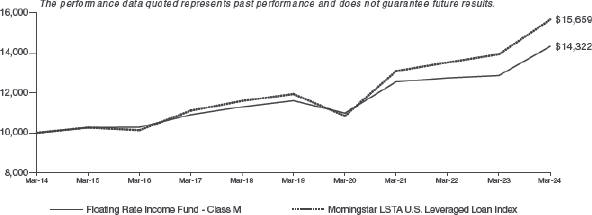
For the Metropolitan West Floating Rate Income Fund Class I, the one year and average 10 year total returns were 11.58% and 3.86%, respectively. At the end of the same period, a $10,000 investment in the Metropolitan West Floating Rate Income Fund Class I shares would have been valued at $14,611.
The inception date for the Metropolitan West Floating Rate Income Fund Plan Class was January 29, 2021. The one year and average annual since inception total returns for the Metropolitan West Floating Rate Income Fund Plan Class were 11.32% and 4.45%, respectively. At the end of the same period, a $10,000 investment in the Metropolitan West Floating Rate Income Fund Plan Class shares would have been valued at $11,477.
Annual Report March 2024 / 16
Table of Contents
Metropolitan West High Yield Bond Fund – Class M
Total Return Performance
The graph below compares the increase in value of a $10,000 investment in the Metropolitan West High Yield Bond Fund Class M with the performance of the Bloomberg U.S. Corporate High Yield Index 2% Issuer Cap. The one year and average annual 10 year total returns for the Metropolitan West High Yield Bond Fund Class M were 8.64% and 3.40%, respectively. The graph assumes that distributions were reinvested.
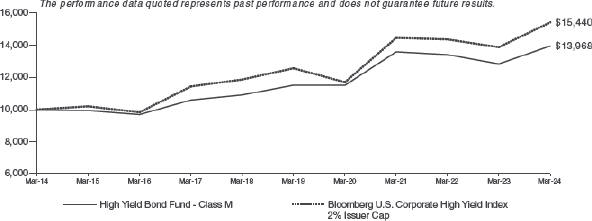
For the Metropolitan West High Yield Bond Fund Class I, the one year and average annual 10 year total returns were 8.91% and 3.66%, respectively. At the end of the same period, a $10,000 investment in the Metropolitan West High Yield Bond Fund Class I shares would have been valued at $14,321.
Metropolitan West Intermediate Bond Fund – Class M
Total Return Performance
The graph below compares the increase in value of a $10,000 investment in the Metropolitan West Intermediate Bond Fund Class M with the performance of the Bloomberg Intermediate U.S. Government/Credit Index. The one year and average annual 10 year total returns for the Metropolitan West Intermediate Bond Fund Class M were 1.80% and 1.30%, respectively. The graph assumes that distributions were reinvested.
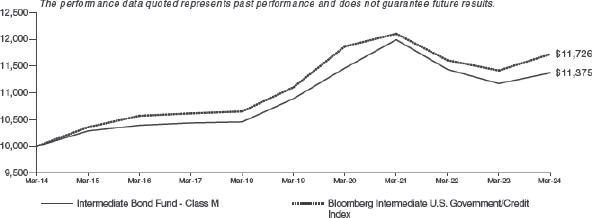
For the Metropolitan West Intermediate Bond Fund Class I, the one year and average annual 10 year total returns were 2.12% and 1.53%, respectively. At the end of the same period, a $10,000 investment in the Metropolitan West Intermediate Bond Fund Class I shares would have been valued at $11,635.
17 / Annual Report March 2024
Table of Contents
Metropolitan West Investment Grade Credit Fund – Class M
Total Return Performance
The graph below compares the increase in value of a $10,000 investment in the Metropolitan West Investment Grade Credit Fund Class M with the performance of the Bloomberg U.S. Intermediate Credit Index. The one year and average annual since inception total returns for the Metropolitan West Investment Grade Credit Fund Class M were 4.01% and 3.02%, respectively. The inception date for Class M was June 29, 2018. The graph assumes that distributions were reinvested.
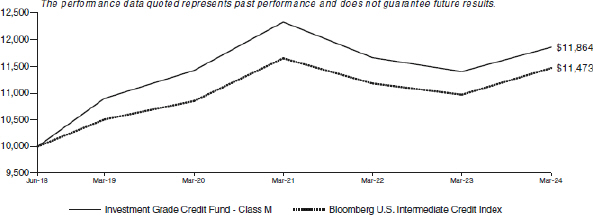
The inception date for the Metropolitan West Investment Grade Credit Fund Class I was June 29, 2018. The one year and average annual since inception total returns for the Metropolitan West Investment Grade Credit Fund Class I were 4.23% and 3.23%, respectively. At the end of the same period, a $10,000 investment in the Metropolitan West Investment Grade Credit Fund Class I shares would have been valued at $12,007.
Metropolitan West Low Duration Bond Fund – Class M
Total Return Performance
The graph below compares the increase in value of a $10,000 investment in the Metropolitan West Low Duration Bond Fund Class M with the performance of the ICE BofA 1-3 Year U.S. Treasury Index. The one year and average annual 10 year total returns for the Metropolitan West Low Duration Bond Fund Class M were 3.82% and 1.25%, respectively. The graph assumes that distributions were reinvested.
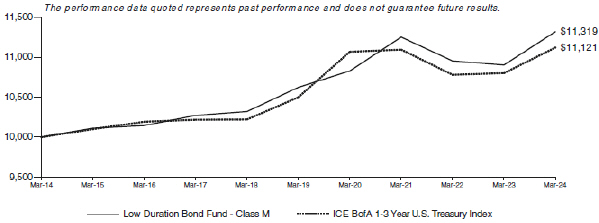
For the Metropolitan West Low Duration Bond Fund Class I, the one year and average annual 10 year total returns were 4.03% and 1.46%, respectively. At the end of the same period, a $10,000 investment in the Metropolitan West Low Duration Bond Fund Class I shares would have been valued at $11,560.
For the Metropolitan West Low Duration Bond Fund Administrative Class, the one year and average annual 10 year total returns were 3.77% and 1.15%, respectively. At the end of the same period, a $10,000 investment in the Metropolitan West Low Duration Bond Fund Administrative Class shares would have been valued at $11,210.
Annual Report March 2024 / 18
Table of Contents
Metropolitan West Opportunistic High Income Credit Fund – Class M
Total Return Performance
The graph below compares the increase in value of a $10,000 investment in the Metropolitan Opportunistic High Income Credit Fund Class M with the performance of the Bloomberg U.S. Corporate High Yield Index 2% Issuer Cap. The one year and average annual since inception total return for the Metropolitan Opportunistic High Income Credit Fund Class M were 9.55% and -0.39%, respectively. The inception date for Class M was August 2, 2021. The graph assumes that distributions were reinvested.
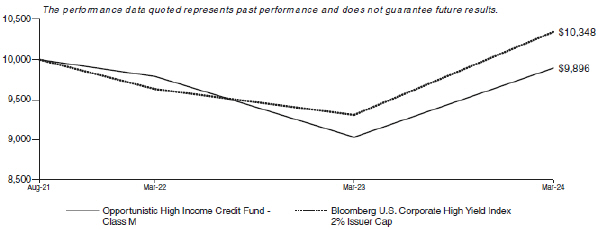
The inception date for the Metropolitan Opportunistic High Income Credit Fund Class I was August 2, 2021. The one year and average annual since inception total return for the Metropolitan Opportunistic High Income Credit Fund Class I were 9.66% and -0.20%, respectively. At the end of the same period, a $10,000 investment in the Metropolitan Opportunistic High Income Credit Fund Class I shares would have been valued at $9,946.
Metropolitan West Strategic Income Fund – Class M
Total Return Performance
The graph below compares the increase in value of a $10,000 investment in the Metropolitan West Strategic Income Fund Class M with the performance of the ICE BofA U.S. 3-Month Treasury Bill Index Plus 200 bps. The one year and average annual 10 year total returns for the Metropolitan West Strategic Income Fund Class M were 6.67% and 2.41%, respectively. The graph assumes that distributions were reinvested.
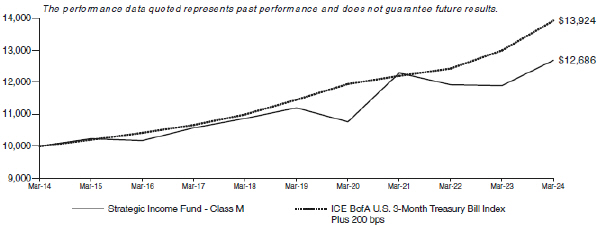
For the Metropolitan West Strategic Income Fund Class I, the one year and average annual 10 year total returns were 7.10% and 2.65%, respectively. At the end of the same period, a $10,000 investment in the Metropolitan West Strategic Income Fund Class I shares would have been valued at $12,988.
19 / Annual Report March 2024
Table of Contents
Metropolitan West Sustainable Securitized Fund – Class M
Total Return Performance
The graph below compares the increase in value of a $10,000 investment in the Metropolitan West Sustainable Securitized Fund Class M with the performance of the Bloomberg U.S. Mortgage-Backed Securities (MBS) Index. The one year and average annual since inception total return for the Metropolitan West Sustainable Securitized Fund Class M were 4.33% and -3.51%, respectively. The inception date for Class M was October 1, 2021. The graph assumes that distributions were reinvested.
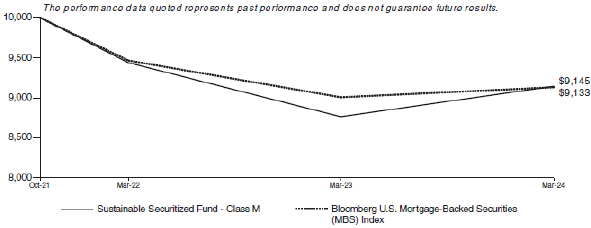
The inception date for the Metropolitan West Sustainable Securitized Fund Class I was October 1, 2021. The one year and average annual since inception total return for the Metropolitan West Sustainable Securitized Fund Class I were 4.67% and -3.45%, respectively. At the end of the same period, a $10,000 investment in the Metropolitan West Sustainable Securitized Fund Class I shares would have been valued at $9,160.
Annual Report March 2024 / 20
Table of Contents
Metropolitan West Total Return Bond Fund – Class M
Total Return Performance
The graph below compares the increase in value of a $10,000 investment in the Metropolitan West Total Return Bond Fund Class M with the performance of the Bloomberg U.S. Aggregate Bond Index. The one year and average annual 10 year total returns for the Metropolitan West Total Return Bond Fund Class M were 1.24% and 1.33%, respectively. The graph assumes that distributions were reinvested.
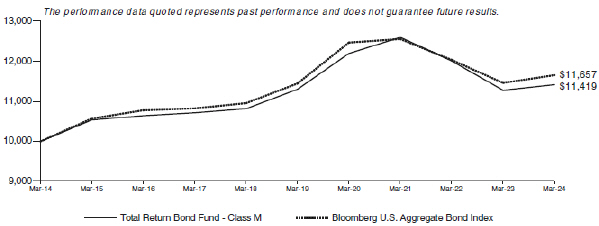
For the Metropolitan West Total Return Bond Fund Class I, the one year and average annual 10 year total returns were 1.45% and 1.56%, respectively. At the end of the same period, a $10,000 investment in the Metropolitan West Total Return Bond Fund Class I shares would have been valued at $11,678.
The inception date for the Metropolitan West Total Return Bond Fund Class I-2 was March 6, 2020. The one year and average annual since inception total returns for the Metropolitan West Total Return Bond Fund Class I-2 were 1.39% and -2.14%, respectively. At the end of the same period, a $10,000 investment in the Metropolitan West Total Return Bond Fund Class I-2 shares would have been valued at $9,156.
For the Metropolitan West Total Return Bond Fund Administrative Class, the one year and average annual 10 year total returns were 1.12% and 1.23%, respectively. At the end of the same period, a $10,000 investment in the Metropolitan West Total Return Bond Fund Administrative Class shares would have been valued at $11,299.
For the Metropolitan West Total Return Bond Fund Plan Class, the one year and average annual 10 year total returns were 1.58% and 1.63%, respectively. At the end of the same period, a $10,000 investment in the Metropolitan West Total Return Bond Fund Plan Class shares would have been valued at $11,760.
21 / Annual Report March 2024
Table of Contents
Metropolitan West Ultra Short Bond Fund – Class M
Total Return Performance
The graph below compares the increase in value of a $10,000 investment in the Metropolitan West Ultra Short Bond Fund Class M with the performance of the ICE BofA 1-Year U.S. Treasury Index. The one year and average annual 10 year total returns for the Metropolitan West Ultra Short Bond Fund Class M were 4.14% and 1.11%, respectively. The graph assumes that distributions were reinvested.

For the Metropolitan West Ultra Short Bond Fund Class I, the one year and average annual 10 year total returns were 4.31% and 1.27%, respectively. At the end of the same period, a $10,000 investment in the Metropolitan West Ultra Short Bond Fund Class I shares would have been valued at $11,346.
Annual Report March 2024 / 22
Table of Contents
Metropolitan West Unconstrained Bond Fund – Class M
Total Return Performance
The graph below compares the increase in value of a $10,000 investment in the Metropolitan West Unconstrained Bond Fund Class M with the performance of the Bloomberg U.S. Treasury Bills: 1-3 Months Index. The one year and average annual 10 year total returns for the Metropolitan West Unconstrained Bond Fund Class M were 5.57% and 2.04%, respectively. The graph assumes that distributions were reinvested.
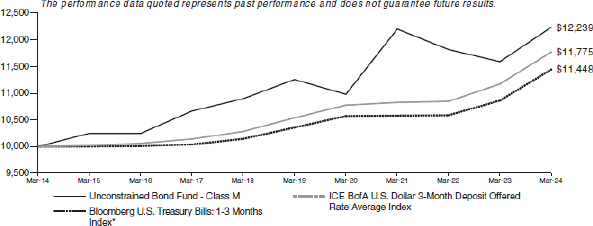
* Benchmark changed to Bloomberg U.S. Treasury Bills: 1-3 Months Index from ICE BofA U.S. Dollar 3-Month Deposit Offered Rate Average Index effective 7/29/2023, because the Bloomberg U.S. Treasury Bills: 1-3 Months Index is more representative of the fixed income securities market characteristics that the Fund seeks to replicate or exceed.
For the Metropolitan West Unconstrained Bond Fund Class I, the one year and average annual 10 year total returns were 5.87% and 2.33%, respectively. At the end of the same period, a $10,000 investment in the Metropolitan West Unconstrained Bond Fund Class I shares would have been valued at $12,591.
The inception date for the Metropolitan West Unconstrained Bond Fund Plan Class was March 6, 2020. The one year and average annual since inception total return for the Metropolitan West Unconstrained Bond Fund Plan Class were 5.93% and 1.26%, respectively. At the end of the same period, a $10,000 investment in the Metropolitan West Unconstrained Bond Fund Plan Class shares would have been valued at $10,522.
23 / Annual Report March 2024
Table of Contents
Disclosure of Fund Expenses (Unaudited)
For the Six Months Ended March 31, 2024
We believe it is important for you to understand the impact of fees regarding your investment. All mutual funds have operating expenses. As a shareholder of a mutual fund, you incur ongoing costs, which include costs for portfolio management, administrative services, and shareholder reports (like this one), among others. Operating expenses, which are deducted from a fund’s gross income, directly reduce the investment return of the fund. A fund’s expenses are expressed as a percentage of its average net assets. This figure is known as the expense ratio. The following examples are intended to help you understand the ongoing fees (in dollars) of investing in your Fund and to compare these costs with those of other mutual funds. The examples are based on an investment of $1,000 made at the beginning of the period shown and held for the entire period.
This table illustrates your Fund’s costs in two ways:
Actual Fund Return: This section helps you to estimate the actual expenses, after any applicable fee waivers, that you paid over the period. The “Ending Account Value” shown is derived from the Fund’s actual return for the past six-month period, the “Expense Ratio” column shows the period’s annualized expense ratio, and the “Expenses Paid During Period” column shows the dollar amount that would have been paid by an investor who started with $1,000 in the Fund at the beginning of the period.
You may use the information here, together with your account value, to estimate the expenses that you paid over the period. To do so, simply divide your account value by $1,000 (for example, an $8,600 account value divided by $1,000 = 8.6), then multiply the result by the number given for your Fund in the first line under the heading entitled “Expenses Paid During Period.”
Hypothetical 5% Return: This section is intended to help you compare your Fund’s costs with those of other mutual funds. It assumes that the Fund had an annual return of 5% before expenses, but that the expense ratio is unchanged. In this case, because the return used is not the Fund’s actual return, the results do not apply to your investment. This example is useful in making comparisons to other mutual funds because the Securities and Exchange Commission (SEC) requires all mutual funds to calculate expenses based on an assumed 5% annual return. You can assess your Fund’s costs by comparing this hypothetical example with the hypothetical examples that appear in shareholder reports of other funds.
Please note that the expenses shown in the table are meant to highlight and help you compare your ongoing costs only and do not reflect any transactional costs such as sales charges (loads), redemption fees, or exchange fees. The Metropolitan West Funds do not charge any sales loads or exchange fees, but these may be present in other funds to which you compare this data. Therefore, the hypothetical portions of the table are useful in comparing ongoing costs only, and will not help you determine the relative total costs of owning different funds.
| Beginning Account Value 10/01/23 | Ending Account Value | Expense Ratio1 | Expenses Paid During | |||||
| ALPHATRAK 500 FUND | ||||||||
Actual Fund Return | $1,000.00 | $1,243.14 | 0.45% | $2.52 | ||||
Hypothetical 5% Return | $1,000.00 | $1,022.75 | 0.45% | $2.28 | ||||
| CORPORATE BOND FUND | ||||||||
Actual Fund Return | ||||||||
Class M | $1,000.00 | $1,078.82 | 0.75% | $3.90 | ||||
Class I | $1,000.00 | $1,081.36 | 0.50% | $2.60 | ||||
Hypothetical 5% Return | ||||||||
Class M | $1,000.00 | $1,021.25 | 0.75% | $3.79 | ||||
Class I | $1,000.00 | $1,022.50 | 0.50% | $2.53 | ||||
| FLEXIBLE INCOME FUND | ||||||||
Actual Fund Return | ||||||||
Class M | $1,000.00 | $1,065.58 | 0.80% | $4.13 | ||||
Class I | $1,000.00 | $1,068.31 | 0.55% | $2.84 | ||||
Hypothetical 5% Return | ||||||||
Class M | $1,000.00 | $1,021.00 | 0.80% | $4.04 | ||||
Class I | $1,000.00 | $1,022.25 | 0.55% | $2.78 | ||||
| 1 | Annualized, based on the Fund’s most recent fiscal half-year expenses. |
| 2 | Expenses are equal to the Fund’s annualized expense ratio multiplied by the average account value over the period, multiplied by 183 days then divided by 366 (to reflect the one-half year period shown). |
Annual Report March 2024 / 24
Table of Contents
| Beginning Account Value 10/01/23 | Ending Account Value 03/31/24 | Expense Ratio1 | Expenses Paid During Period2 | |||||||||||||
| FLOATING RATE INCOME FUND | ||||||||||||||||
Actual Fund Return | ||||||||||||||||
Class M | $1,000.00 | $1,054.37 | 0.90% | $4.62 | ||||||||||||
Class I | $1,000.00 | $1,055.40 | 0.70% | $3.60 | ||||||||||||
Plan Class | $1,000.00 | $1,055.93 | 0.60% | $3.08 | ||||||||||||
Hypothetical 5% Return | ||||||||||||||||
Class M | $1,000.00 | $1,020.50 | 0.90% | $4.55 | ||||||||||||
Class I | $1,000.00 | $1,021.50 | 0.70% | $3.54 | ||||||||||||
Plan Class | $1,000.00 | $1,022.00 | 0.60% | $3.03 | ||||||||||||
| HIGH YIELD BOND FUND | ||||||||||||||||
Actual Fund Return | ||||||||||||||||
Class M | $1,000.00 | $1,075.85 | 0.85% | $4.41 | ||||||||||||
Class I | $1,000.00 | $1,078.38 | 0.60% | $3.12 | ||||||||||||
Hypothetical 5% Return | ||||||||||||||||
Class M | $1,000.00 | $1,020.75 | 0.85% | $4.29 | ||||||||||||
Class I | $1,000.00 | $1,022.00 | 0.60% | $3.03 | ||||||||||||
| INTERMEDIATE BOND FUND | ||||||||||||||||
Actual Fund Return | ||||||||||||||||
Class M | $1,000.00 | $1,045.79 | 0.70% | $3.58 | ||||||||||||
Class I | $1,000.00 | $1,046.90 | 0.48% | $2.46 | ||||||||||||
Hypothetical 5% Return | ||||||||||||||||
Class M | $1,000.00 | $1,021.50 | 0.70% | $3.54 | ||||||||||||
Class I | $1,000.00 | $1,022.60 | 0.48% | $2.43 | ||||||||||||
| INVESTMENT GRADE CREDIT FUND | ||||||||||||||||
Actual Fund Return | ||||||||||||||||
Class M | $1,000.00 | $1,059.17 | 0.70% | $3.60 | ||||||||||||
Class I | $1,000.00 | $1,061.69 | 0.49% | $2.53 | ||||||||||||
Hypothetical 5% Return | ||||||||||||||||
Class M | $1,000.00 | $1,021.50 | 0.70% | $3.54 | ||||||||||||
Class I | $1,000.00 | $1,022.55 | 0.49% | $2.48 | ||||||||||||
| LOW DURATION BOND FUND | ||||||||||||||||
Actual Fund Return | ||||||||||||||||
Class M | $1,000.00 | $1,042.70 | 0.61% | $3.12 | ||||||||||||
Class I | $1,000.00 | $1,043.72 | 0.41% | $2.09 | ||||||||||||
Administrative Class | $1,000.00 | $1,042.30 | 0.70% | $3.57 | ||||||||||||
Hypothetical 5% Return | ||||||||||||||||
Class M | $1,000.00 | $1,021.95 | 0.61% | $3.08 | ||||||||||||
Class I | $1,000.00 | $1,022.95 | 0.41% | $2.07 | ||||||||||||
Administrative Class | $1,000.00 | $1,021.50 | 0.70% | $3.54 | ||||||||||||
| OPPORTUNISTIC HIGH INCOME CREDIT FUND | ||||||||||||||||
Actual Fund Return | ||||||||||||||||
Class M | $1,000.00 | $1,086.03 | 0.85% | $4.43 | ||||||||||||
Class I | $1,000.00 | $1,087.42 | 0.60% | $3.13 | ||||||||||||
Hypothetical 5% Return | ||||||||||||||||
Class M | $1,000.00 | $1,020.75 | 0.85% | $4.29 | ||||||||||||
Class I | $1,000.00 | $1,022.00 | 0.60% | $3.03 | ||||||||||||
| 1 | Annualized, based on the Fund’s most recent fiscal half-year expenses. |
| 2 | Expenses are equal to the Fund’s annualized expense ratio multiplied by the average account value over the period, multiplied by 183 days then divided by 366 (to reflect the one-half year period shown). |
25 / Annual Report March 2024
Table of Contents
| Beginning Account Value 10/01/23 | Ending Account Value 03/31/24 | Expense Ratio1 | Expenses Paid During Period2 | |||||||||||||
| STRATEGIC INCOME FUND | ||||||||||||||||
Actual Fund Return | ||||||||||||||||
Class M | $1,000.00 | $1,060.61 | 1.03% | $5.31 | ||||||||||||
Class I | $1,000.00 | $1,061.90 | 0.80% | $4.12 | ||||||||||||
Hypothetical 5% Return | ||||||||||||||||
Class M | $1,000.00 | $1,019.85 | 1.03% | $5.20 | ||||||||||||
Class I | $1,000.00 | $1,021.00 | 0.80% | $4.04 | ||||||||||||
| SUSTAINABLE SECURITIZED FUND | ||||||||||||||||
Actual Fund Return | ||||||||||||||||
Class M | $1,000.00 | $1,091.46 | 0.70% | $3.66 | ||||||||||||
Class I | $1,000.00 | $1,092.51 | 0.49% | $2.56 | ||||||||||||
Hypothetical 5% Return | ||||||||||||||||
Class M | $1,000.00 | $1,021.50 | 0.70% | $3.54 | ||||||||||||
Class I | $1,000.00 | $1,022.55 | 0.49% | $2.48 | ||||||||||||
| TOTAL RETURN BOND FUND | ||||||||||||||||
Actual Fund Return | ||||||||||||||||
Class M | $1,000.00 | $1,064.44 | 0.64% | $3.30 | ||||||||||||
Class I | $1,000.00 | $1,065.50 | 0.44% | $2.27 | ||||||||||||
Class I-2 | $1,000.00 | $1,065.16 | 0.51% | $2.63 | ||||||||||||
Administrative Class | $1,000.00 | $1,063.68 | 0.77% | $3.97 | ||||||||||||
Plan Class | $1,000.00 | $1,066.30 | 0.36% | $1.86 | ||||||||||||
Hypothetical 5% Return | ||||||||||||||||
Class M | $1,000.00 | $1,021.80 | 0.64% | $3.23 | ||||||||||||
Class I | $1,000.00 | $1,022.80 | 0.44% | $2.23 | ||||||||||||
Class I-2 | $1,000.00 | $1,022.45 | 0.51% | $2.58 | ||||||||||||
Administrative Class | $1,000.00 | $1,021.15 | 0.77% | $3.89 | ||||||||||||
Plan Class | $1,000.00 | $1,023.20 | 0.36% | $1.82 | ||||||||||||
| ULTRA SHORT BOND FUND | ||||||||||||||||
Actual Fund Return | ||||||||||||||||
Class M | $1,000.00 | $1,037.78 | 0.50% | $2.55 | ||||||||||||
Class I | $1,000.00 | $1,038.58 | 0.34% | $1.73 | ||||||||||||
Hypothetical 5% Return | ||||||||||||||||
Class M | $1,000.00 | $1,022.50 | 0.50% | $2.53 | ||||||||||||
Class I | $1,000.00 | $1,023.30 | 0.34% | $1.72 | ||||||||||||
| UNCONSTRAINED BOND FUND | ||||||||||||||||
Actual Fund Return | ||||||||||||||||
Class M | $1,000.00 | $1,059.80 | 1.03% | $5.30 | ||||||||||||
Class I | $1,000.00 | $1,061.36 | 0.74% | $3.81 | ||||||||||||
Plan Class | $1,000.00 | $1,061.66 | 0.69% | $3.56 | ||||||||||||
Hypothetical 5% Return | ||||||||||||||||
Class M | $1,000.00 | $1,019.85 | 1.03% | $5.20 | ||||||||||||
Class I | $1,000.00 | $1,021.30 | 0.74% | $3.74 | ||||||||||||
Plan Class | $1,000.00 | $1,021.55 | 0.69% | $3.49 | ||||||||||||
| 1 | Annualized, based on the Fund’s most recent fiscal half-year expenses. |
| 2 | Expenses are equal to the Fund’s annualized expense ratio multiplied by the average account value over the period, multiplied by 183 days then divided by 366 (to reflect the one-half year period shown). |
Annual Report March 2024 / 26
Table of Contents
Summary of Portfolio Holdings (Unaudited)
March 31, 2024
These tables are provided to give you a quick reference to the composition of each Fund. The “Sector Diversification” table is a percentage of net assets. We hope that this information enhances your understanding of the different kinds of investments in the Funds.
ALPHATRAK 500 FUND
| ||||
| Sector Diversification | ||||
Corporate Bonds | 22.85% | |||
Mutual Funds | 15.14% | |||
U.S. Agency Mortgage-Backed | 14.47% | |||
Asset-Backed Securities | 14.07% | |||
U.S. Treasury Bills | 13.49% | |||
U.S. Treasury Securities | 10.57% | |||
Money Market Funds | 8.03% | |||
Non-Agency Mortgage-Backed | 5.74% | |||
Non-Agency Commercial Mortgage-Backed | 5.58% | |||
U.S. Agency Commercial Mortgage-Backed | 1.05% | |||
Municipal Bonds | 0.82% | |||
Common Stock | 0.07% | |||
Other* | (11.88)% | |||
Total | 100.00% | |||
| CORPORATE BOND FUND | ||||
| Sector Diversification | ||||
Corporate Bonds | 80.42% | |||
U.S. Treasury Securities | 13.87% | |||
Money Market Funds | 4.74% | |||
Municipal Bonds | 2.16% | |||
Asset-Backed Securities | 0.64% | |||
U.S. Agency Commercial Mortgage-Backed | 0.33% | |||
U.S. Agency Mortgage-Backed | 0.15% | |||
Non-Agency Commercial Mortgage-Backed | 0.04% | |||
Other* | (2.35)% | |||
Total | 100.00% | |||
| FLEXIBLE INCOME FUND | ||||
| Sector Diversification | ||||
Corporate Bonds | 24.22% | |||
U.S. Agency Mortgage-Backed | 22.07% | |||
Non-Agency Mortgage-Backed | 20.66% | |||
Asset-Backed Securities | 13.69% | |||
U.S. Treasury Bills | 12.70% | |||
Money Market Funds | 10.16% | |||
Non-Agency Commercial Mortgage-Backed | 6.28% | |||
U.S. Treasury Securities | 6.12% | |||
Bank Loans | 4.75% | |||
Foreign Government Obligations | 1.32% | |||
U.S. Agency Commercial Mortgage-Backed | 0.67% | |||
Municipal Bonds | 0.20% | |||
Common Stock | 0.15% | |||
Warrant | 0.00% | |||
Other* | (22.99)% | |||
Total | 100.00% | |||
| FLOATING RATE INCOME FUND
| ||||
| Sector Diversification | ||||
Bank Loans | 91.58% | |||
Money Market Funds | 6.73% | |||
Corporate Bonds | 2.58% | |||
U.S. Treasury Bills | 1.55% | |||
Asset-Backed Securities | 0.97% | |||
Preferred Stock | 0.16% | |||
Common Stock | 0.08% | |||
Warrant | 0.00% | |||
Other* | (3.65)% | |||
Total | 100.00% | |||
| HIGH YIELD BOND FUND | ||||
| Sector Diversification | ||||
Corporate Bonds | 74.22% | |||
Bank Loans | 15.41% | |||
U.S. Treasury Bills | 6.37% | |||
Money Market Funds | 2.20% | |||
Common Stock | 0.56% | |||
Warrant | 0.00% | |||
Other* | 1.24% | |||
Total | 100.00% | |||
| INTERMEDIATE BOND FUND | ||||
| Sector Diversification | ||||
U.S. Treasury Securities | 44.90% | |||
Corporate Bonds | 20.15% | |||
U.S. Agency Mortgage-Backed | 14.69% | |||
Money Market Funds | 11.20% | |||
U.S. Treasury Bills | 10.92% | |||
Non-Agency Mortgage-Backed | 6.59% | |||
Asset-Backed Securities | 5.97% | |||
Non-Agency Commercial Mortgage-Backed | 2.99% | |||
Bank Loans | 0.95% | |||
Municipal Bonds | 0.82% | |||
U.S. Agency Commercial Mortgage-Backed | 0.27% | |||
Common Stock | 0.04% | |||
Other* | (19.49)% | |||
Total | 100.00% | |||
27 / Annual Report March 2024
Table of Contents
| INVESTMENT GRADE CREDIT FUND | ||||
| Sector Diversification | ||||
Corporate Bonds | 45.04% | |||
U.S. Treasury Securities | 27.74% | |||
U.S. Agency Mortgage-Backed | 13.30% | |||
Money Market Funds | 9.25% | |||
Non-Agency Commercial Mortgage-Backed | 6.68% | |||
Non-Agency Mortgage-Backed | 5.67% | |||
Asset-Backed Securities | 4.94% | |||
Municipal Bonds | 1.50% | |||
U.S. Agency Commercial Mortgage-Backed | 0.09% | |||
Other* | (14.21)% | |||
Total | 100.00% | |||
| LOW DURATION BOND FUND | ||||
| Sector Diversification | ||||
U.S. Agency Mortgage-Backed | 28.04% | |||
U.S. Treasury Securities | 26.02% | |||
Corporate Bonds | 25.96% | |||
Non-Agency Mortgage-Backed | 15.99% | |||
Money Market Funds | 12.16% | |||
Non-Agency Commercial Mortgage-Backed | 10.37% | |||
Asset-Backed Securities | 7.82% | |||
U.S. Treasury Bills | 4.21% | |||
Bank Loans | 1.50% | |||
U.S. Agency Commercial Mortgage-Backed | 1.18% | |||
Municipal Bonds | 1.10% | |||
Common Stock | 0.00% | |||
Other* | (34.35)% | |||
Total | 100.00% | |||
| OPPORTUNISTIC HIGH INCOME CREDIT FUND | ||||
| Sector Diversification | ||||
Corporate Bonds | 39.69% | |||
Money Market Funds | 14.16% | |||
Common Stock | 12.40% | |||
U.S. Treasury Bills | 10.00% | |||
Non-Agency Mortgage-Backed | 7.75% | |||
U.S. Treasury Securities | 6.48% | |||
Bank Loans | 4.92% | |||
Non-Agency Commercial Mortgage-Backed | 3.34% | |||
Master Limited Partnerships | 3.00% | |||
U.S. Agency Commercial Mortgage-Backed | 0.12% | |||
Other* | (1.86)% | |||
Total | 100.00% | |||
| STRATEGIC INCOME FUND | ||||
| Sector Diversification | ||||
Non-Agency Mortgage-Backed | 27.68% | |||
Corporate Bonds | 24.67% | |||
U.S. Treasury Bills | 19.19% | |||
U.S. Agency Mortgage-Backed | 15.97% | |||
Asset-Backed Securities | 14.90% | |||
Money Market Funds | 5.20% | |||
Non-Agency Commercial Mortgage-Backed | 4.15% | |||
U.S. Treasury Securities | 3.23% | |||
U.S. Agency Commercial Mortgage-Backed | 0.46% | |||
Municipal Bonds | 0.13% | |||
Common Stock | 0.10% | |||
Other* | (15.68)% | |||
Total | 100.00% | |||
| SUSTAINABLE SECURITIZED FUND | ||||
| Sector Diversification | ||||
U.S. Agency Mortgage-Backed | 50.49% | |||
U.S. Treasury Securities | 21.95% | |||
Asset-Backed Securities | 15.57% | |||
Non-Agency Commercial Mortgage-Backed | 13.28% | |||
Money Market Funds | 12.28% | |||
Non-Agency Mortgage-Backed | 6.63% | |||
U.S. Agency Commercial Mortgage-Backed | 3.25% | |||
Other* | (23.45)% | |||
Total | 100.00% | |||
| TOTAL RETURN BOND FUND | ||||
| Sector Diversification | ||||
U.S. Agency Mortgage-Backed | 38.80% | |||
U.S. Treasury Securities | 32.80% | |||
Corporate Bonds | 19.18% | |||
Non-Agency Mortgage-Backed | 9.61% | |||
Money Market Funds | 9.35% | |||
Asset-Backed Securities | 5.07% | |||
Non-Agency Commercial Mortgage-Backed | 3.93% | |||
U.S. Agency Discount Notes | 3.44% | |||
Bank Loans | 1.39% | |||
Repurchase Agreements | 0.96% | |||
U.S. Treasury Bills | 0.92% | |||
U.S. Agency Commercial Mortgage-Backed | 0.76% | |||
Foreign Government Obligations | 0.61% | |||
Municipal Bonds | 0.33% | |||
Common Stock | 0.13% | |||
Other* | (27.28)% | |||
Total | 100.00% | |||
Annual Report March 2024 / 28
Table of Contents
| ULTRA SHORT BOND FUND | ||||
| Sector Diversification | ||||
U.S. Treasury Securities | 37.52% | |||
U.S. Agency Mortgage-Backed | 27.61% | |||
Corporate Bonds | 22.32% | |||
Money Market Funds | 12.73% | |||
U.S. Treasury Bills | 11.79% | |||
Non-Agency Mortgage-Backed | 10.53% | |||
Asset-Backed Securities | 3.52% | |||
U.S. Agency Commercial Mortgage-Backed | 3.35% | |||
Non-Agency Commercial Mortgage-Backed | 3.02% | |||
Municipal Bonds | 0.36% | |||
Other* | (32.75)% | |||
Total | 100.00% | |||
| UNCONSTRAINED BOND FUND | ||||
| Sector Diversification | ||||
Non-Agency Mortgage-Backed | 32.05% | |||
U.S. Agency Mortgage-Backed | 20.81% | |||
Corporate Bonds | 20.80% | |||
Asset-Backed Securities | 14.00% | |||
Non-Agency Commercial Mortgage-Backed | 9.32% | |||
U.S. Treasury Bills | 6.71% | |||
Money Market Funds | 3.87% | |||
Bank Loans | 3.20% | |||
Foreign Government Obligations | 1.84% | |||
U.S. Agency Commercial Mortgage-Backed | 1.03% | |||
U.S. Treasury Securities | 0.81% | |||
U.S. Agency Discount Notes | 0.77% | |||
Common Stock | 0.37% | |||
Municipal Bonds | 0.32% | |||
Other* | (15.90)% | |||
Total | 100.00% | |||
| * | Includes cash and equivalents, futures, foreign currency exchange contracts, swaps, pending trades, fund share transactions, interest and dividends receivable and accrued expenses payable. |
In addition to the annual and semi-annual reports, the Funds file a complete schedule of portfolio holdings with the SEC for the first and third quarters of each fiscal year on Form NPORT-P. Such filings occur no later than 60 days after the end of the Funds’ first and third quarters and are available on the SEC’s website at www.sec.gov.
29 / Annual Report March 2024
Table of Contents
Schedule of Portfolio Investments
March 31, 2024
| Issues | Maturity Date | Principal Amount | Value | |||||||||||
BONDS – 75.15% |
| |||||||||||||
ASSET-BACKED SECURITIES — 14.07%** |
| |||||||||||||
Access Group, Inc., |
| |||||||||||||
Series 2015-1, Class A |
| |||||||||||||
(SOFR30A plus 0.81%) |
| |||||||||||||
6.13% | 07/25/561,2 | $ | 7,087 | $ | 7,012 | |||||||||
Aimco CLO 11 Ltd., |
| |||||||||||||
Series 2020-11A, Class AR |
| |||||||||||||
(Cayman Islands) |
| |||||||||||||
(CME Term SOFR 3-Month plus 1.39%) |
| |||||||||||||
6.71% | 10/17/341,2,3 | 100,000 | 99,981 | |||||||||||
Apidos CLO XII, |
| |||||||||||||
Series 2013-12A, Class AR |
| |||||||||||||
(Cayman Islands) |
| |||||||||||||
(CME Term SOFR 3-Month plus 1.34%) |
| |||||||||||||
6.66% | 04/15/311,2,3 | 106,532 | 106,599 | |||||||||||
Apidos CLO XXII, |
| |||||||||||||
Series 2015-22A, Class A1R |
| |||||||||||||
(Cayman Islands) |
| |||||||||||||
(CME Term SOFR 3-Month plus 1.32%) |
| |||||||||||||
6.64% | 04/20/311,2,3 | 180,321 | 180,454 | |||||||||||
Barings CLO Ltd., |
| |||||||||||||
Series 2018-3A, Class A1 |
| |||||||||||||
(Cayman Islands) |
| |||||||||||||
(CME Term SOFR 3-Month plus 1.21%) |
| |||||||||||||
6.53% | 07/20/291,2,3 | 18,761 | 18,776 | |||||||||||
Barings CLO Ltd., |
| |||||||||||||
Series 2020-4A, Class A |
| |||||||||||||
(Cayman Islands) |
| |||||||||||||
(CME Term SOFR 3-Month plus 1.48%) |
| |||||||||||||
6.80% | 01/20/321,2,3 | 90,000 | 90,068 | |||||||||||
Carvana Auto Receivables Trust, |
| |||||||||||||
Series 2022-P3, Class A3 |
| |||||||||||||
4.61% | 11/10/27 | 165,000 | 163,324 | |||||||||||
Cedar Funding XII CLO Ltd., |
| |||||||||||||
Series 2020-12A, Class A1R |
| |||||||||||||
(Cayman Islands) |
| |||||||||||||
(CME Term SOFR 3-Month plus 1.39%) |
| |||||||||||||
6.72% | 10/25/341,2,3 | 100,000 | 100,055 | |||||||||||
Dryden 58 CLO Ltd., |
| |||||||||||||
Series 2018-58A, Class A1 |
| |||||||||||||
(Cayman Islands) |
| |||||||||||||
(CME Term SOFR 3-Month plus 1.26%) |
| |||||||||||||
6.58% | 07/17/311,2,3 | 143,753 | 143,800 | |||||||||||
Dryden XXVI Senior Loan Fund, |
| |||||||||||||
Series 2013-26A, Class AR |
| |||||||||||||
(Cayman Islands) |
| |||||||||||||
(CME Term SOFR 3-Month plus 1.16%) |
| |||||||||||||
6.48% | 04/15/291,2,3 | 34,120 | 34,098 | |||||||||||
Eaton Vance CLO Ltd., |
| |||||||||||||
Series 2020-1A, Class AR |
| |||||||||||||
(Cayman Islands) |
| |||||||||||||
(CME Term SOFR 3-Month plus 1.43%) |
| |||||||||||||
6.75% | 10/15/341,2,3 | 150,000 | 150,147 | |||||||||||
Exeter Automobile Receivables Trust, |
| |||||||||||||
Series 2021-1A, Class D |
| |||||||||||||
1.08% | 11/16/26 | 118,158 | 115,246 | |||||||||||
| Issues | Maturity Date | Principal Amount | Value | |||||||||||
ASSET-BACKED SECURITIES (continued) |
| |||||||||||||
Exeter Automobile Receivables Trust, |
| |||||||||||||
Series 2022-6A, Class C |
| |||||||||||||
6.32% | 05/15/28 | $ | 130,000 | $ | 130,830 | |||||||||
Flagship Credit Auto Trust, |
| |||||||||||||
Series 2021-1, Class C |
| |||||||||||||
0.91% | 03/15/272 | 116,542 | 113,790 | |||||||||||
GLS Auto Receivables Issuer Trust, |
| |||||||||||||
Series 2020-4A, Class D |
| |||||||||||||
1.64% | 10/15/262 | 128,530 | 126,216 | |||||||||||
GoldenTree Loan Management U.S. CLO 4 Ltd., |
| |||||||||||||
Series 2019-4A, Class ARR |
| |||||||||||||
(Cayman Islands) |
| |||||||||||||
(CME Term SOFR 3-Month plus 1.15%) |
| |||||||||||||
6.48% | 04/24/311,2,3 | 150,000 | 150,152 | |||||||||||
GoldenTree Loan Management U.S. CLO 8 Ltd., |
| |||||||||||||
Series 2020-8A, Class AR |
| |||||||||||||
(Cayman Islands) |
| |||||||||||||
(CME Term SOFR 3-Month plus 1.41%) |
| |||||||||||||
6.73% | 10/20/341,2,3 | 140,000 | 140,183 | |||||||||||
LCM 29 Ltd., |
| |||||||||||||
Series 29A, Class XR |
| |||||||||||||
(Cayman Islands) |
| |||||||||||||
(CME Term SOFR 3-Month plus 1.06%) |
| |||||||||||||
6.38% | 04/15/311,2,3 | 11,364 | 11,362 | |||||||||||
Madison Park Funding XVII Ltd., |
| |||||||||||||
Series 2015-17A, Class AR2 |
| |||||||||||||
(Cayman Islands) |
| |||||||||||||
(CME Term SOFR 3-Month plus 1.26%) |
| |||||||||||||
6.58% | 07/21/301,2,3 | 159,422 | 159,562 | |||||||||||
Navient Student Loan Trust, |
| |||||||||||||
Series 2014-1, Class A3 |
| |||||||||||||
(SOFR30A plus 0.62%) |
| |||||||||||||
5.94% | 06/25/311 | 52,246 | 51,576 | |||||||||||
Nelnet Student Loan Trust, |
| |||||||||||||
Series 2014-3A, Class A |
| |||||||||||||
(SOFR30A plus 0.69%) |
| |||||||||||||
6.01% | 06/25/411,2 | 7,401 | 7,303 | |||||||||||
NYACK Park CLO Ltd., |
| |||||||||||||
Series 2021-1A, Class X |
| |||||||||||||
(Cayman Islands) |
| |||||||||||||
(CME Term SOFR 3-Month plus 0.91%) |
| |||||||||||||
6.23% | 10/20/341,2,3 | 35,357 | 35,329 | |||||||||||
OCP CLO Ltd., |
| |||||||||||||
Series 2017-14A, Class A1A |
| |||||||||||||
(Cayman Islands) |
| |||||||||||||
(CME Term SOFR 3-Month plus 1.41%) |
| |||||||||||||
6.73% | 11/20/301,2,3 | 60,392 | 60,469 | |||||||||||
Octagon Investment Partners 35 Ltd., |
| |||||||||||||
Series 2018-1A, Class A1A |
| |||||||||||||
(Cayman Islands) |
| |||||||||||||
(CME Term SOFR 3-Month plus 1.32%) |
| |||||||||||||
6.64% | 01/20/311,2,3 | 137,199 | 137,323 | |||||||||||
OHA Credit Funding 7 Ltd., |
| |||||||||||||
Series 2020-7A, Class AR |
| |||||||||||||
(Cayman Islands) |
| |||||||||||||
(CME Term SOFR 3-Month plus 1.30%) |
| |||||||||||||
6.61% | 02/24/371,2,3 | 115,000 | 115,117 | |||||||||||
| See accompanying Notes to Financial Statements. |
| Annual Report March 2024 / 30 |
Table of Contents
AlphaTrak 500 Fund
Schedule of Portfolio Investments
March 31, 2024
| Issues | Maturity Date | Principal Amount | Value | |||||||||||
ASSET-BACKED SECURITIES (continued) |
| |||||||||||||
Palmer Square CLO Ltd., |
| |||||||||||||
Series 2014-1A, Class A1R2 |
| |||||||||||||
(Cayman Islands) |
| |||||||||||||
(CME Term SOFR 3-Month plus 1.39%) |
| |||||||||||||
6.71% | 01/17/311,2,3 | $ | 44,039 | $ | 44,071 | |||||||||
Palmer Square Loan Funding Ltd., |
| |||||||||||||
Series 2022-3A, Class A1BR |
| |||||||||||||
(Cayman Islands) |
| |||||||||||||
(CME Term SOFR 3-Month plus 1.40%) |
| |||||||||||||
6.72% | 04/15/311,2,3 | 150,000 | 150,074 | |||||||||||
Rockford Tower CLO Ltd., |
| |||||||||||||
Series 2017-3A, Class A |
| |||||||||||||
(Cayman Islands) |
| |||||||||||||
(CME Term SOFR 3-Month plus 1.45%) |
| |||||||||||||
6.77% | 10/20/301,2,3 | 98,142 | 98,383 | |||||||||||
Rockford Tower CLO Ltd., |
| |||||||||||||
Series 2018-2A, Class A |
| |||||||||||||
(Cayman Islands) |
| |||||||||||||
(CME Term SOFR 3-Month plus 1.42%) |
| |||||||||||||
6.74% | 10/20/311,2,3 | 140,906 | 141,109 | |||||||||||
Santander Drive Auto Receivables Trust, |
| |||||||||||||
Series 2022-2, Class C |
| |||||||||||||
3.76% | 07/16/29 | 160,000 | 155,290 | |||||||||||
Santander Drive Auto Receivables Trust, |
| |||||||||||||
Series 2022-4, Class C |
| |||||||||||||
5.00% | 11/15/29 | 160,000 | 158,142 | |||||||||||
SLM Student Loan Trust, |
| |||||||||||||
Series 2008-5, Class A4 |
| |||||||||||||
(SOFR90A plus 1.96%) |
| |||||||||||||
7.32% | 07/25/231 | 55,941 | 55,905 | |||||||||||
SLM Student Loan Trust, |
| |||||||||||||
Series 2008-6, Class A4 |
| |||||||||||||
(SOFR90A plus 1.36%) |
| |||||||||||||
6.72% | 07/25/231 | 91,915 | 91,272 | |||||||||||
SLM Student Loan Trust, |
| |||||||||||||
Series 2012-1, Class A3 |
| |||||||||||||
(SOFR30A plus 1.06%) |
| |||||||||||||
6.38% | 09/25/281 | 95,662 | 92,611 | |||||||||||
SLM Student Loan Trust, |
| |||||||||||||
Series 2012-2, Class A |
| |||||||||||||
(SOFR30A plus 0.81%) |
| |||||||||||||
6.13% | 01/25/291 | 57,033 | 55,646 | |||||||||||
Sofi Professional Loan Program Trust, |
| |||||||||||||
Series 2021-B, Class AFX |
| |||||||||||||
1.14% | 02/15/472 | 167,667 | 142,744 | |||||||||||
Sofi Professional Loan Program, LLC, |
| |||||||||||||
Series 2019-A, Class A2FX |
| |||||||||||||
3.69% | 06/15/482 | 98,097 | 94,960 | |||||||||||
Stratus CLO Ltd., |
| |||||||||||||
Series 2021-2A, Class A |
| |||||||||||||
(Cayman Islands) |
| |||||||||||||
(CME Term SOFR 3-Month plus 1.16%) |
| |||||||||||||
6.48% | 12/28/291,2,3 | 63,821 | 63,855 | |||||||||||
Westlake Automobile Receivables Trust, |
| |||||||||||||
Series 2022-2A, Class C |
| |||||||||||||
4.85% | 09/15/272 | 150,000 | 148,569 | |||||||||||
| Issues | Maturity Date | Principal Amount | Value | |||||||||
ASSET-BACKED SECURITIES (continued) |
| |||||||||||
Westlake Automobile Receivables Trust, |
| |||||||||||
Series 2023-1A, Class B |
| |||||||||||
5.41% | 01/18/282 | $ | 150,000 | $ | 149,328 | |||||||
World Omni Select Auto Trust, |
| |||||||||||
Series 2023-A, Class C |
| |||||||||||
6.00% | 01/16/29 | 150,000 | 150,351 | |||||||||
|
|
| ||||||||||
Total Asset-Backed Securities |
| |||||||||||
(Cost $4,246,939) |
| 4,241,082 | ||||||||||
|
|
| ||||||||||
CORPORATES — 22.85%* |
| |||||||||||
Banking — 7.38% |
| |||||||||||
Bank of America Corp. |
| |||||||||||
1.73% | 07/22/274 | 250,000 | 230,635 | |||||||||
Bank of America Corp. |
| |||||||||||
(MTN) |
| |||||||||||
2.55% | 02/04/284 | 235,000 | 218,476 | |||||||||
DNB Bank ASA |
| |||||||||||
(Norway) |
| |||||||||||
0.86% | 09/30/252,3,4 | 200,000 | 195,140 | |||||||||
HSBC Holdings PLC |
| |||||||||||
(United Kingdom) |
| |||||||||||
0.98% | 05/24/253,4 | 395,000 | 391,998 | |||||||||
ING Groep NV |
| |||||||||||
(Netherlands) |
| |||||||||||
3.87% | 03/28/263,4 | 200,000 | 196,435 | |||||||||
JPMorgan Chase & Co. |
| |||||||||||
0.82% | 06/01/254 | 110,000 | 109,064 | |||||||||
1.04% | 02/04/274 | 25,000 | 23,135 | |||||||||
1.05% | 11/19/264 | 25,000 | 23,340 | |||||||||
2.01% | 03/13/264 | 5,000 | 4,834 | |||||||||
Lloyds Banking Group PLC |
| |||||||||||
(United Kingdom) |
| |||||||||||
1.63% | 05/11/273,4 | 125,000 | 115,176 | |||||||||
3.57% | 11/07/283,4 | 30,000 | 28,146 | |||||||||
PNC Financial Services Group, Inc. (The) |
| |||||||||||
5.58% | 06/12/294 | 15,000 | 15,192 | |||||||||
6.62% | 10/20/274 | 95,000 | 97,839 | |||||||||
U.S. Bancorp |
| |||||||||||
6.79% | 10/26/274 | 135,000 | 139,892 | |||||||||
Wells Fargo & Co. |
| |||||||||||
(MTN) |
| |||||||||||
2.16% | 02/11/264 | 355,000 | 344,452 | |||||||||
2.39% | 06/02/284 | 100,000 | 91,558 | |||||||||
|
|
| ||||||||||
| 2,225,312 | ||||||||||||
|
|
| ||||||||||
| Communications — 1.14% |
| |||||||||||
AT&T, Inc. |
| |||||||||||
(CME Term SOFR 3-Month plus 1.44%) |
| |||||||||||
6.76% | 06/12/241 | 175,000 | 175,297 | |||||||||
Frontier Communications Holdings LLC |
| |||||||||||
8.63% | 03/15/312 | 22,000 | 22,484 | |||||||||
Qwest Corp. |
| |||||||||||
7.25% | 09/15/25 | 30,000 | 29,663 | |||||||||
| Sprint Spectrum Co. LLC/Sprint Spectrum Co. II LLC/Sprint |
| |||||||||||
Spectrum Co. III LLC |
| |||||||||||
5.15% | 03/20/282 | 40,000 | 39,917 | |||||||||
| See accompanying Notes to Financial Statements. |
| 31 / Annual Report March 2024 |
Table of Contents
AlphaTrak 500 Fund
Schedule of Portfolio Investments
March 31, 2024
| Issues | Maturity Date | Principal Amount | Value | |||||||||
CORPORATES (continued) |
| |||||||||||
Communications (continued) |
| |||||||||||
T-Mobile USA, Inc. |
| |||||||||||
2.63% | 04/15/26 | $ | 79,000 | $ | 75,074 | |||||||
|
|
| ||||||||||
| 342,435 | ||||||||||||
|
|
| ||||||||||
| Consumer Discretionary — 1.06% |
| |||||||||||
Bacardi Ltd. |
| |||||||||||
(Bermuda) |
| |||||||||||
4.45% | 05/15/252,3 | 100,000 | 98,643 | |||||||||
BAT Capital Corp. |
| |||||||||||
3.56% | 08/15/27 | 105,000 | 99,448 | |||||||||
Imperial Brands Finance PLC |
| |||||||||||
(United Kingdom) |
| |||||||||||
6.13% | 07/27/272,3 | 100,000 | 102,084 | |||||||||
Spectrum Brands, Inc. |
| |||||||||||
3.88% | 03/15/312 | 20,000 | 19,319 | |||||||||
|
|
| ||||||||||
| 319,494 | ||||||||||||
|
|
| ||||||||||
| Diversified REITs — 0.87% |
| |||||||||||
American Tower Corp. |
| |||||||||||
3.60% | 01/15/28 | 115,000 | 108,649 | |||||||||
GLP Capital LP/GLP Financing II, Inc. |
| |||||||||||
3.25% | 01/15/32 | 6,000 | 5,087 | |||||||||
5.75% | 06/01/28 | 95,000 | 95,145 | |||||||||
VICI Properties LP/VICI Note Co., Inc. |
| |||||||||||
4.63% | 06/15/252 | 55,000 | 54,244 | |||||||||
|
|
| ||||||||||
| 263,125 | ||||||||||||
|
|
| ||||||||||
| Electric — 0.76% |
| |||||||||||
Alliant Energy Finance LLC |
| |||||||||||
5.95% | 03/30/292 | 70,000 | 72,176 | |||||||||
FirstEnergy Pennsylvania Electric Co. |
| |||||||||||
4.15% | 04/15/252 | 50,000 | 49,158 | |||||||||
5.15% | 03/30/262 | 50,000 | 49,606 | |||||||||
FirstEnergy Transmission LLC |
| |||||||||||
2.87% | 09/15/282 | 63,000 | 57,484 | |||||||||
|
|
| ||||||||||
| 228,424 | ||||||||||||
|
|
| ||||||||||
| Energy — 1.32% |
| |||||||||||
Energy Transfer LP |
| |||||||||||
4.25% | 04/01/24 | 150,000 | 150,000 | |||||||||
5.50% | 06/01/27 | 12,000 | 12,078 | |||||||||
| Plains All American Pipeline LP/PAA Finance Corp. |
| |||||||||||
4.65% | 10/15/25 | 125,000 | 123,388 | |||||||||
Southern Co. Gas Capital Corp. |
| |||||||||||
3.88% | 11/15/25 | 100,000 | 97,500 | |||||||||
Venture Global LNG, Inc. |
| |||||||||||
9.50% | 02/01/292 | 15,000 | 16,182 | |||||||||
|
|
| ||||||||||
| 399,148 | ||||||||||||
|
|
| ||||||||||
| Finance — 3.77% |
| |||||||||||
American Express Co. |
| |||||||||||
6.34% | 10/30/264 | 155,000 | 157,115 | |||||||||
Avolon Holdings Funding Ltd. |
| |||||||||||
(Cayman Islands) |
| |||||||||||
2.53% | 11/18/272,3 | 5,000 | 4,450 | |||||||||
Citigroup, Inc. |
| |||||||||||
3.52% | 10/27/284 | 290,000 | 273,535 | |||||||||
| Issues | Maturity Date | Principal Amount | Value | |||||||||
CORPORATES (continued) |
| |||||||||||
Finance (continued) |
| |||||||||||
Goldman Sachs Group, Inc. (The) |
| |||||||||||
1.54% | 09/10/274 | $ | 40,000 | $ | 36,554 | |||||||
1.95% | 10/21/274 | 285,000 | 262,163 | |||||||||
Morgan Stanley |
| |||||||||||
(GMTN) |
| |||||||||||
1.51% | 07/20/274 | 320,000 | 293,802 | |||||||||
Nationwide Building Society |
| |||||||||||
(United Kingdom) |
| |||||||||||
2.97% | 02/16/282,3,4 | 115,000 | 107,327 | |||||||||
|
|
| ||||||||||
| 1,134,946 | ||||||||||||
|
|
| ||||||||||
| Food — 0.28% |
| |||||||||||
| JBS USA LUX SA/JBS USA Food Co./JBS USA Finance, Inc. |
| |||||||||||
(Canada) |
| |||||||||||
5.13% | 02/01/283 | 85,000 | 83,801 | |||||||||
|
|
| ||||||||||
| Health Care — 2.37% |
| |||||||||||
1375209 BC Ltd. |
| |||||||||||
(Canada) |
| |||||||||||
9.00% | 01/30/282,3 | 20,000 | 19,622 | |||||||||
Amgen, Inc. |
| |||||||||||
5.15% | 03/02/28 | 130,000 | 130,927 | |||||||||
Bayer U.S. Finance II LLC |
| |||||||||||
4.25% | 12/15/252 | 165,000 | 160,936 | |||||||||
Embecta Corp. |
| |||||||||||
5.00% | 02/15/302 | 45,000 | 36,770 | |||||||||
Grifols SA |
| |||||||||||
(Spain) |
| |||||||||||
4.75% | 10/15/282,3 | 20,000 | 16,563 | |||||||||
HCA, Inc. |
| |||||||||||
5.25% | 06/15/26 | 155,000 | 154,591 | |||||||||
Humana, Inc. |
| |||||||||||
5.70% | 03/13/26 | 70,000 | 69,960 | |||||||||
IQVIA, Inc. |
| |||||||||||
6.25% | 02/01/29 | 55,000 | 57,137 | |||||||||
Kedrion SpA |
| |||||||||||
(Italy) |
| |||||||||||
6.50% | 09/01/292,3 | 20,000 | 18,249 | |||||||||
ModivCare Escrow Issuer, Inc. |
| |||||||||||
5.00% | 10/01/292 | 15,000 | 10,895 | |||||||||
ModivCare, Inc. |
| |||||||||||
5.88% | 11/15/252 | 5,000 | 4,874 | |||||||||
Prestige Brands, Inc. |
| |||||||||||
3.75% | 04/01/312 | 40,000 | 34,862 | |||||||||
|
|
| ||||||||||
| 715,386 | ||||||||||||
|
|
| ||||||||||
| Health Care REITs — 0.31% |
| |||||||||||
Healthcare Reality Holdings LP |
| |||||||||||
3.50% | 08/01/26 | 45,000 | 42,946 | |||||||||
Healthcare Realty Holdings LP |
| |||||||||||
3.63% | 01/15/28 | 55,000 | 50,867 | |||||||||
|
|
| ||||||||||
| 93,813 | ||||||||||||
|
|
| ||||||||||
| See accompanying Notes to Financial Statements. |
| Annual Report March 2024 / 32 |
Table of Contents
AlphaTrak 500 Fund
Schedule of Portfolio Investments
March 31, 2024
| Issues | Maturity Date | Principal Amount | Value | |||||||||
CORPORATES (continued) |
| |||||||||||
Industrials — 0.33% |
| |||||||||||
General Electric Co. |
| |||||||||||
(MTN) |
| |||||||||||
(CME Term SOFR 3-Month plus 0.64%) |
| |||||||||||
5.91% | 05/05/261 | $ | 29,000 | $ | 29,085 | |||||||
(CME Term SOFR 3-Month plus 0.74%) |
| |||||||||||
6.05% | 08/15/361 | 75,000 | 69,661 | |||||||||
|
|
| ||||||||||
| 98,746 | ||||||||||||
|
|
| ||||||||||
| Information Technology — 0.60% |
| |||||||||||
Open Text Corp. |
| |||||||||||
(Canada) |
| |||||||||||
6.90% | 12/01/272,3 | 70,000 | 72,268 | |||||||||
VMware LLC, |
| |||||||||||
1.00% | 08/15/24 | 110,000 | 108,092 | |||||||||
|
|
| ||||||||||
| 180,360 | ||||||||||||
|
|
| ||||||||||
| Insurance — 1.50% |
| |||||||||||
Athene Global Funding |
| |||||||||||
(SOFR Index plus 0.70%) |
| |||||||||||
6.06% | 05/24/241,2 | 85,000 | 85,097 | |||||||||
Guardian Life Global Funding |
| |||||||||||
5.74% | 10/02/282 | 125,000 | 129,711 | |||||||||
Nationwide Mutual Insurance Co. |
| |||||||||||
7.88% | 12/15/242,4 | 90,000 | 90,008 | |||||||||
Willis North America, Inc. |
| |||||||||||
4.65% | 06/15/27 | 150,000 | 147,673 | |||||||||
|
|
| ||||||||||
| 452,489 | ||||||||||||
|
|
| ||||||||||
| Materials — 0.74% |
| |||||||||||
Georgia-Pacific LLC |
| |||||||||||
3.60% | 03/01/252 | 115,000 | 113,158 | |||||||||
International Flavors & Fragrances, Inc. |
| |||||||||||
1.83% | 10/15/272 | 60,000 | 53,254 | |||||||||
2.30% | 11/01/302 | 70,000 | 58,181 | |||||||||
|
|
| ||||||||||
| 224,593 | ||||||||||||
|
|
| ||||||||||
| Retail — 0.06% |
| |||||||||||
Michaels Cos., Inc. (The) |
| |||||||||||
5.25% | 05/01/282 | 20,000 | 17,060 | |||||||||
|
|
| ||||||||||
| Services — 0.04% |
| |||||||||||
Adtalem Global Education, Inc. |
| |||||||||||
5.50% | 03/01/282 | 5,000 | 4,793 | |||||||||
Waste Pro USA, Inc. |
| |||||||||||
5.50% | 02/15/262 | 8,000 | 7,886 | |||||||||
|
|
| ||||||||||
| 12,679 | ||||||||||||
|
|
| ||||||||||
| Specialized REITs — 0.32% |
| |||||||||||
Extra Space Storage LP |
| |||||||||||
2.20% | 10/15/30 | 110,000 | 91,253 | |||||||||
2.40% | 10/15/31 | 5,000 | 4,116 | |||||||||
|
|
| ||||||||||
| 95,369 | ||||||||||||
|
|
| ||||||||||
Total Corporates |
| |||||||||||
(Cost $6,875,850) |
| 6,887,180 | ||||||||||
|
|
| ||||||||||
| Issues | Maturity Date | Principal Amount | Value | |||||||||
MORTGAGE-BACKED — 26.84%** |
| |||||||||||
Non-Agency Commercial Mortgage-Backed — 5.58% |
| |||||||||||
| 1345 Avenue of the Americas & Park Avenue Plaza Trust, |
| |||||||||||
Series 2005-1, Class A3 |
| |||||||||||
5.28% | 08/10/352 | $ | 32,780 | $ | 31,258 | |||||||
ACAM Ltd., |
| |||||||||||
Series 2019-FL1, Class A |
| |||||||||||
(Cayman Islands) |
| |||||||||||
(CME Term SOFR 1-Month plus 1.51%) |
| |||||||||||
6.84% | 11/17/341,2,3 | 3,242 | 3,251 | |||||||||
BANK, |
| |||||||||||
Series 2018-BN14, Class A2 |
| |||||||||||
4.13% | 09/15/60 | 49,063 | 48,041 | |||||||||
Beast Mortgage Trust, |
| |||||||||||
Series 2021-SSCP, Class A |
| |||||||||||
(CME Term SOFR 1-Month plus 0.86%) |
| |||||||||||
6.19% | 04/15/361,2 | 241,043 | 239,363 | |||||||||
BX Commercial Mortgage Trust, |
| |||||||||||
Series 2021-CIP, Class A |
| |||||||||||
(CME Term SOFR 1-Month plus 1.04%) |
| |||||||||||
6.36% | 12/15/381,2 | 130,000 | 128,748 | |||||||||
BX Trust, |
| |||||||||||
Series 2021-SDMF, Class A |
| |||||||||||
(CME Term SOFR 1-Month plus 0.70%) |
| |||||||||||
6.03% | 09/15/341,2 | 116,070 | 114,808 | |||||||||
Citigroup Commercial Mortgage Trust, |
| |||||||||||
Series 2015-GC29, Class AAB |
| |||||||||||
2.98% | 04/10/48 | 8,696 | 8,643 | |||||||||
Citigroup Commercial Mortgage Trust, |
| |||||||||||
Series 2015-P1, Class AAB |
| |||||||||||
3.47% | 09/15/48 | 13,333 | 13,151 | |||||||||
Cold Storage Trust, |
| |||||||||||
Series 2020-ICE5, Class A |
| |||||||||||
(CME Term SOFR 1-Month plus 1.01%) |
| |||||||||||
6.33% | 11/15/371,2 | 108,129 | 107,955 | |||||||||
Commercial Mortgage Trust, |
| |||||||||||
Series 2012-CR4, Class XA (IO) |
| |||||||||||
1.14% | 10/15/454 | 65,302 | 7 | |||||||||
Commercial Mortgage Trust, |
| |||||||||||
Series 2015-PC1, Class A4 |
| |||||||||||
3.62% | 07/10/50 | 46,333 | 45,590 | |||||||||
Credit Suisse Mortgage Capital Certificates, |
| |||||||||||
Series 2019-ICE4, Class A |
| |||||||||||
(CME Term SOFR 1-Month plus 1.03%) |
| |||||||||||
6.35% | 05/15/361,2 | 244,392 | 244,331 | |||||||||
Great Wolf Trust, |
| |||||||||||
Series 2024-WOLF, Class A |
| |||||||||||
(CME Term SOFR 1-Month plus 1.54%) |
| |||||||||||
6.84% | 03/15/391,2 | 91,000 | 91,228 | |||||||||
GS Mortgage Securities Trust, |
| |||||||||||
Series 2010-C1, Class X (IO) |
| |||||||||||
0.44% | 08/10/432,4 | 1,500,217 | 1,294 | |||||||||
| JPMorgan Chase Commercial Mortgage Securities Trust, |
| |||||||||||
Series 2013-LC11, Class XA (IO) |
| |||||||||||
0.90% | 04/15/464 | 145,686 | 684 | |||||||||
| JPMorgan Chase Commercial Mortgage Securities Trust, |
| |||||||||||
Series 2015-JP1, Class XA (IO) |
| |||||||||||
0.88% | 01/15/494,5,6 | 593,207 | 8,785 | |||||||||
| See accompanying Notes to Financial Statements. |
| 33 / Annual Report March 2024 |
Table of Contents
AlphaTrak 500 Fund
Schedule of Portfolio Investments
March 31, 2024
| Issues | Maturity Date | Principal Amount | Value | |||||||||
MORTGAGE-BACKED (continued) |
| |||||||||||
Non-Agency Commercial Mortgage-Backed (continued) |
| |||||||||||
LB-UBS Commercial Mortgage Trust, |
| |||||||||||
Series 2006-C6, Class XCL (IO) |
| |||||||||||
0.43% | 09/15/392,4 | $ | 303,520 | $ | 1,240 | |||||||
MF1 Ltd., |
| |||||||||||
Series 2020-FL4, Class A |
| |||||||||||
(CME Term SOFR 1-Month plus 1.81%) |
| |||||||||||
7.14% | 11/15/351,2 | 97,933 | 98,187 | |||||||||
| Morgan Stanley Bank of America Merrill Lynch Trust, |
| |||||||||||
Series 2015-C26, Class ASB |
| |||||||||||
3.32% | 10/15/48 | 19,728 | 19,423 | |||||||||
One New York Plaza Trust, |
| |||||||||||
Series 2020-1NYP, Class A |
| |||||||||||
(CME Term SOFR 1-Month plus 1.06%) |
| |||||||||||
6.39% | 01/15/361,2 | 94,000 | 91,637 | |||||||||
Queens Center Mortgage Trust, |
| |||||||||||
Series 2013-QCA, Class B |
| |||||||||||
3.38% | 01/11/372 | 150,000 | 138,120 | |||||||||
SREIT Trust, |
| |||||||||||
Series 2021-MFP, Class A |
| |||||||||||
(CME Term SOFR 1-Month plus 0.85%) |
| |||||||||||
6.17% | 11/15/381,2 | 239,216 | 238,151 | |||||||||
TMSQ Mortgage Trust, |
| |||||||||||
Series 2014-1500, Class XA (IO) |
| |||||||||||
0.15% | 10/10/362,4 | 14,000,000 | 323 | |||||||||
UBS-Barclays Commercial Mortgage Trust, |
| |||||||||||
Series 2012-C3, Class XB (IO) |
| |||||||||||
0.01% | 08/10/492,4,5,6 | 198,658 | 35 | |||||||||
WF-RBS Commercial Mortgage Trust, |
| |||||||||||
Series 2014-C25, Class XA (IO) |
| |||||||||||
0.78% | 11/15/474 | 4,810,233 | 8,870 | |||||||||
|
|
| ||||||||||
| 1,683,123 | ||||||||||||
|
|
| ||||||||||
| Non-Agency Mortgage-Backed — 5.74% |
| |||||||||||
Alternative Loan Trust, |
| |||||||||||
Series 2007-22, Class 2A16 |
| |||||||||||
6.50% | 09/25/37 | 190,303 | 73,247 | |||||||||
Asset-Backed Funding Certificates, |
| |||||||||||
Series 2004-OPT4, Class M1 |
| |||||||||||
(CME Term SOFR 1-Month plus 1.01%) |
| |||||||||||
6.34% | 02/25/341 | 66,451 | 66,453 | |||||||||
Banc of America Funding Trust, |
| |||||||||||
Series 2015-R7, Class 1A1 |
| |||||||||||
| (Federal Reserve US 12-Month Cumulative Average plus 0.92%) |
| |||||||||||
3.32% | 09/26/461,2 | 7,084 | 7,108 | |||||||||
Centex Home Equity Loan Trust, |
| |||||||||||
Series 2005-B, Class M2 |
| |||||||||||
(CME Term SOFR 1-Month plus 0.76%) |
| |||||||||||
6.09% | 03/25/351 | 50,538 | 50,122 | |||||||||
CIM Trust, |
| |||||||||||
Series 2019-R1, Class A |
| |||||||||||
3.25% | 10/25/582,4 | 78,072 | 69,466 | |||||||||
CIM Trust, |
| |||||||||||
Series 2021-R3, Class A1A |
| |||||||||||
1.95% | 06/25/572,4 | 93,849 | 82,981 | |||||||||
| Issues | Maturity Date | Principal Amount | Value | |||||||||
MORTGAGE-BACKED (continued) |
| |||||||||||
Non-Agency Mortgage-Backed (continued) |
| |||||||||||
Citigroup Mortgage Loan Trust, Inc., |
| |||||||||||
Series 2005-HE4, Class M2 |
| |||||||||||
(CME Term SOFR 1-Month plus 0.79%) |
| |||||||||||
6.12% | 10/25/351 | $ | 106,638 | $ | 103,433 | |||||||
Citigroup Mortgage Loan Trust, Inc., |
| |||||||||||
Series 2007-WFH3, Class M1 |
| |||||||||||
(CME Term SOFR 1-Month plus 0.50%) |
| |||||||||||
5.83% | 06/25/371 | 72,720 | 72,084 | |||||||||
| Countrywide Asset-Backed Certificates Trust, |
| |||||||||||
Series 2007-13, Class 2A1 |
| |||||||||||
(CME Term SOFR 1-Month plus 1.01%) |
| |||||||||||
6.34% | 10/25/471 | 55,211 | 49,890 | |||||||||
| Countrywide Home Loan Mortgage Pass-Through Trust, |
| |||||||||||
Series 2005-9, Class 1A1 |
| |||||||||||
(CME Term SOFR 1-Month plus 0.71%) |
| |||||||||||
6.04% | 05/25/351 | 35,529 | 29,905 | |||||||||
| Credit-Based Asset Servicing and Securitization LLC, |
| |||||||||||
| Series 2003-CB1, Class AF (STEP-reset date 05/25/24) |
| |||||||||||
3.95% | 01/25/33 | 3,386 | 3,188 | |||||||||
DSLA Mortgage Loan Trust, |
| |||||||||||
Series 2004-AR3, Class 2A2A |
| |||||||||||
(CME Term SOFR 1-Month plus 0.85%) |
| |||||||||||
6.17% | 07/19/441 | 1,705 | 1,557 | |||||||||
First Franklin Mortgage Loan Trust, |
| |||||||||||
Series 2006-FF4, Class A3 |
| |||||||||||
(CME Term SOFR 1-Month plus 0.67%) |
| |||||||||||
5.02% | 03/25/361 | 10,905 | 10,816 | |||||||||
GMACM Mortgage Corp. Loan Trust, |
| |||||||||||
Series 2006-AR1, Class 1A1 |
| |||||||||||
3.64% | 04/19/364 | 59,325 | 46,443 | |||||||||
HarborView Mortgage Loan Trust, |
| |||||||||||
Series 2005-9, Class 2A1A |
| |||||||||||
(CME Term SOFR 1-Month plus 0.79%) |
| |||||||||||
6.12% | 06/20/351 | 95,452 | 88,001 | |||||||||
HSI Asset Securitization Corp. Trust, |
| |||||||||||
Series 2007-WF1, Class 1A1 |
| |||||||||||
(CME Term SOFR 1-Month plus 0.43%) |
| |||||||||||
5.76% | 05/25/371 | 12,132 | 12,114 | |||||||||
IndyMac Index Mortgage Loan Trust, |
| |||||||||||
Series 2004-AR5, Class 2A1A |
| |||||||||||
(CME Term SOFR 1-Month plus 0.97%) |
| |||||||||||
6.30% | 08/25/341 | 5,845 | 4,933 | |||||||||
IndyMac Index Mortgage Loan Trust, |
| |||||||||||
Series 2006-AR4, Class A1A |
| |||||||||||
(CME Term SOFR 1-Month plus 0.53%) |
| |||||||||||
5.86% | 05/25/461 | 64,910 | 58,537 | |||||||||
IndyMac Index Mortgage Loan Trust, |
| |||||||||||
Series 2007-AR1, Class 2A1 |
| |||||||||||
4.04% | 06/25/374 | 55,977 | 35,209 | |||||||||
JPMorgan Mortgage Acquisition Trust, |
| |||||||||||
Series 2005-WMC1, Class M3 |
| |||||||||||
(CME Term SOFR 1-Month plus 0.82%) |
| |||||||||||
6.15% | 09/25/351 | 113,870 | 111,109 | |||||||||
| See accompanying Notes to Financial Statements. |
| Annual Report March 2024 / 34 |
Table of Contents
AlphaTrak 500 Fund
Schedule of Portfolio Investments
March 31, 2024
| Issues | Maturity Date | Principal Amount | Value | |||||||||||
MORTGAGE-BACKED (continued) |
| |||||||||||||
Non-Agency Mortgage-Backed (continued) |
| |||||||||||||
Morgan Stanley ABS Capital I, Inc. Trust, |
| |||||||||||||
Series 2007-HE7, Class A2B |
| |||||||||||||
(CME Term SOFR 1-Month plus 1.11%) |
| |||||||||||||
6.44% | 07/25/371 | $ | 45,015 | $ | 43,942 | |||||||||
| Option One Mortgage Loan Trust 2005-4 Asset-Backed Certificates, |
| |||||||||||||
Series 2005-4, Class M2 |
| |||||||||||||
(CME Term SOFR 1-Month plus 0.80%) |
| |||||||||||||
6.13% | 11/25/351 | 64,658 | 60,425 | |||||||||||
PRPM LLC, |
| |||||||||||||
| Series 2021-3, Class A1 (STEP-reset date 04/25/24) |
| |||||||||||||
1.87% | 04/25/262 | 110,739 | 108,453 | |||||||||||
PRPM LLC, |
| |||||||||||||
| Series 2021-6, Class A1 (STEP-reset date 04/25/24) |
| |||||||||||||
1.79% | 07/25/262 | 53,122 | 51,711 | |||||||||||
Residential Asset Mortgage Products Trust, |
| |||||||||||||
Series 2004-SL1, Class A2 |
| |||||||||||||
8.50% | 11/25/31 | 4,078 | 1,351 | |||||||||||
Residential Asset Mortgage Products Trust, |
| |||||||||||||
Series 2006-NC3, Class M1 |
| |||||||||||||
(CME Term SOFR 1-Month plus 0.45%) |
| |||||||||||||
5.95% | 03/25/361 | 68,765 | 66,390 | |||||||||||
| Structured Asset Mortgage Investments II Trust, |
| |||||||||||||
Series 2006-AR1, Class 3A1 |
| |||||||||||||
(CME Term SOFR 1-Month plus 0.57%) |
| |||||||||||||
5.90% | 02/25/361 | 34,842 | 29,253 | |||||||||||
Terwin NIMs Trust, |
| |||||||||||||
Series 2004-13AL, Class 2PX (IO) |
| |||||||||||||
0.34% | 08/25/342,5,6 | 1,208,532 | 13,537 | |||||||||||
VOLT CIII LLC, |
| |||||||||||||
| Series 2021-CF1, Class A1 (STEP-reset date 04/25/24) |
| |||||||||||||
1.99% | 08/25/512 | 77,167 | 74,557 | |||||||||||
VOLT XCIX, LLC, |
| |||||||||||||
| Series 2021-NPL8, Class A1 (STEP-reset date 04/25/24) |
| |||||||||||||
5.12% | 04/25/512 | 125,547 | 122,461 | |||||||||||
WaMu Mortgage Pass-Through Certificates, |
| |||||||||||||
Series 2002-AR6, Class A |
| |||||||||||||
| (Federal Reserve US 12-Month Cumulative Average plus 1.40%) |
| |||||||||||||
6.49% | 06/25/421 | 976 | 893 | |||||||||||
WaMu Mortgage Pass-Through Certificates, |
| |||||||||||||
Series 2005-AR8, Class 2AB2 |
| |||||||||||||
(CME Term SOFR 1-Month plus 0.95%) |
| |||||||||||||
6.28% | 07/25/451 | 83,709 | 78,259 | |||||||||||
| Wells Fargo Home Equity Asset-Backed Securities Trust, |
| |||||||||||||
Series 2005-4, Class M3 |
| |||||||||||||
(CME Term SOFR 1-Month plus 0.86%) |
| |||||||||||||
6.19% | 12/25/351 | 97,287 | 95,767 | |||||||||||
Wells Fargo Mortgage-Backed Securities Trust, |
| |||||||||||||
Series 2003-I, Class A1 |
| |||||||||||||
6.17% | 09/25/334 | 5,193 | 5,117 | |||||||||||
|
|
| ||||||||||||
| 1,728,712 | ||||||||||||||
|
|
| ||||||||||||
| Issues | Maturity Date | Principal Amount | Value | |||||||||||
MORTGAGE-BACKED (continued) |
| |||||||||||||
U.S. Agency Commercial Mortgage-Backed — 1.05% |
| |||||||||||||
Freddie Mac Multifamily Structured Pass-Through |
| |||||||||||||
Certificates, | ||||||||||||||
Series K044, Class X1 (IO) |
| |||||||||||||
0.74% | 01/25/254 | $ | 1,079,410 | $ | 4,585 | |||||||||
Freddie Mac Multifamily Structured Pass-Through |
| |||||||||||||
Certificates, |
| |||||||||||||
Series K054, Class X1 (IO) |
| |||||||||||||
1.15% | 01/25/264 | 3,382,416 | 55,125 | |||||||||||
Freddie Mac Multifamily Structured Pass-Through |
| |||||||||||||
Certificates, |
| |||||||||||||
Series K732, Class X3 (IO) |
| |||||||||||||
2.17% | 05/25/464 | 250,000 | 6,389 | |||||||||||
Freddie Mac Multifamily Structured Pass-Through |
| |||||||||||||
Certificates, |
| |||||||||||||
Series KC05, Class X1 (IO) |
| |||||||||||||
1.23% | 06/25/274 | 911,403 | 18,779 | |||||||||||
Freddie Mac Multifamily Structured Pass-Through |
| |||||||||||||
Certificates, |
| |||||||||||||
Series KF88, Class AL |
| |||||||||||||
(SOFR30A plus 0.44%) |
| |||||||||||||
5.76% | 09/25/301 | 116,071 | 115,271 | |||||||||||
Freddie Mac Multifamily Structured Pass-Through |
| |||||||||||||
Certificates, |
| |||||||||||||
Series KS07, Class X (IO) |
| |||||||||||||
0.61% | 09/25/254 | 2,819,473 | 23,942 | |||||||||||
Ginnie Mae, |
| |||||||||||||
Series 2014-157, Class C |
| |||||||||||||
3.15% | 10/16/544 | 96,783 | 93,121 | |||||||||||
|
|
| ||||||||||||
| 317,212 | ||||||||||||||
|
|
| ||||||||||||
U.S. Agency Mortgage-Backed — 14.47% |
| |||||||||||||
Fannie Mae Pool AL0851 |
| |||||||||||||
6.00% | 10/01/40 | 1,497 | 1,564 | |||||||||||
Fannie Mae REMICS, |
| |||||||||||||
Series 2002-21, Class FB |
| |||||||||||||
(SOFR30A plus 1.01%) |
| |||||||||||||
6.33% | 04/25/321 | 10,664 | 10,708 | |||||||||||
Fannie Mae REMICS, |
| |||||||||||||
Series 2002-53, Class FY |
| |||||||||||||
(SOFR30A plus 0.61%) |
| |||||||||||||
5.93% | 08/25/321 | 53,668 | 53,553 | |||||||||||
Fannie Mae REMICS, |
| |||||||||||||
Series 2003-11, Class FA |
| |||||||||||||
(SOFR30A plus 1.11%) |
| |||||||||||||
6.43% | 09/25/321 | 2,695 | 2,725 | |||||||||||
Fannie Mae REMICS, |
| |||||||||||||
Series 2003-81, Class FE |
| |||||||||||||
(SOFR30A plus 0.61%) |
| |||||||||||||
5.93% | 09/25/331 | 20,109 | 19,997 | |||||||||||
Fannie Mae REMICS, |
| |||||||||||||
Series 2006-48, Class FL |
| |||||||||||||
(SOFR30A plus 0.51%) |
| |||||||||||||
5.83% | 06/25/361 | 26,509 | 26,288 | |||||||||||
| See accompanying Notes to Financial Statements. |
| 35 / Annual Report March 2024 |
Table of Contents
AlphaTrak 500 Fund
Schedule of Portfolio Investments
March 31, 2024
| Issues | Maturity Date | Principal Amount | Value | |||||||||
MORTGAGE-BACKED (continued) |
| |||||||||||
U.S. Agency Mortgage-Backed (continued) |
| |||||||||||
Fannie Mae REMICS, |
| |||||||||||
Series 2006-8, Class NF |
| |||||||||||
(SOFR30A plus 0.48%) |
| |||||||||||
5.80% | 03/25/361 | $ | 21,780 | $ | 21,521 | |||||||
Fannie Mae REMICS, |
| |||||||||||
Series 2008-12,Class FA |
| |||||||||||
(SOFR30A plus 0.78%) |
| |||||||||||
6.10% | 03/25/381 | 73,451 | 73,304 | |||||||||
Fannie Mae REMICS, |
| |||||||||||
Series 2010-109, Class PF |
| |||||||||||
(SOFR30A plus 0.51%) |
| |||||||||||
5.83% | 10/25/401 | 2,354 | 2,327 | |||||||||
Fannie Mae REMICS, |
| |||||||||||
Series 2010-74,Class AF |
| |||||||||||
(SOFR30A plus 0.65%) |
| |||||||||||
5.97% | 07/25/371 | 22,786 | 22,649 | |||||||||
Freddie Mac REMICS, |
| |||||||||||
Series 2684, Class F |
| |||||||||||
(SOFR30A plus 1.01%) |
| |||||||||||
6.33% | 01/15/331 | 2,427 | 2,448 | |||||||||
Freddie Mac REMICS, |
| |||||||||||
Series 3231, Class FB |
| |||||||||||
(SOFR30A plus 0.46%) |
| |||||||||||
5.78% | 10/15/361 | 43,351 | 42,753 | |||||||||
Freddie Mac Strips, |
| |||||||||||
Series 263, Class F5 |
| |||||||||||
(SOFR30A plus 0.61%) |
| |||||||||||
5.93% | 06/15/421 | 7,145 | 7,041 | |||||||||
Ginnie Mae (TBA) |
| |||||||||||
4.50% | 04/20/54 | 150,000 | 144,168 | |||||||||
5.00% | 04/20/54 | 350,000 | 344,042 | |||||||||
5.50% | 04/20/54 | 150,000 | 149,894 | |||||||||
Ginnie Mae, |
| |||||||||||
Series 2023-113, Class FD |
| |||||||||||
(SOFR30A plus 1.35%) |
| |||||||||||
6.50% | 08/20/531 | 143,830 | 144,131 | |||||||||
Ginnie Mae, |
| |||||||||||
Series 2023-116, Class FL |
| |||||||||||
(SOFR30A plus 1.15%) |
| |||||||||||
6.47% | 08/20/531 | 145,846 | 146,547 | |||||||||
Ginnie Mae, |
| |||||||||||
Series 2024-51,Class F |
| |||||||||||
(SOFR30A plus 1.00%) |
| |||||||||||
6.32% | 03/20/541 | 300,000 | 300,521 | |||||||||
Ginnie Mae, |
| |||||||||||
Series 2024-51,Class PF |
| |||||||||||
(SOFR30A plus 1.00%) |
| |||||||||||
6.32% | 03/20/541 | 150,000 | 150,239 | |||||||||
Ginnie Mae, |
| |||||||||||
Series 2024-51,Class TF |
| |||||||||||
(SOFR30A plus 1.00%) |
| |||||||||||
6.32% | 03/20/541 | 300,000 | 300,061 | |||||||||
UMBS (TBA) |
| |||||||||||
3.50% | 04/01/39 | 175,000 | 166,270 | |||||||||
4.00% | 04/01/39 | 275,000 | 266,331 | |||||||||
4.00% | 04/01/54 | 375,000 | 347,373 | |||||||||
| Issues | Maturity Date | Principal Amount | Value | |||||||||||||
MORTGAGE-BACKED (continued) |
| |||||||||||||||
U.S. Agency Mortgage-Backed (continued) |
| |||||||||||||||
4.50% |
| 04/01/39 | $ | 275,000 | $ | 270,777 | ||||||||||
4.50% |
| 04/01/54 | 425,000 | 404,829 | ||||||||||||
5.00% |
| 04/01/39 | 425,000 | 424,414 | ||||||||||||
5.00% |
| 04/01/54 | 350,000 | 341,537 | ||||||||||||
5.50% |
| 04/01/54 | 175,000 | 174,149 | ||||||||||||
|
|
| ||||||||||||||
| 4,362,161 | ||||||||||||||||
|
|
| ||||||||||||||
Total Mortgage-Backed |
| |||||||||||||||
(Cost $8,658,211) |
| 8,091,208 | ||||||||||||||
|
|
| ||||||||||||||
MUNICIPAL BONDS — 0.82%* |
| |||||||||||||||
Maryland — 0.18% |
| |||||||||||||||
| City of Baltimore General Obligation, School Improvements, |
| |||||||||||||||
Series C |
| |||||||||||||||
5.00% |
| 10/15/25 | 55,000 | 54,815 | ||||||||||||
|
|
| ||||||||||||||
Massachusetts — 0.16% |
| |||||||||||||||
| Commonwealth of Massachusetts Revenue Bonds, Series B |
| |||||||||||||||
4.11%07/15/31 |
| 49,457 | 48,337 | |||||||||||||
|
|
| ||||||||||||||
New York — 0.48% |
| |||||||||||||||
| New York City Transitional Finance Authority Future Tax |
| |||||||||||||||
| Secured Revenue Bonds, Public Improvements, Series A2 |
| |||||||||||||||
2.15% |
| 05/01/25 | 150,000 | 145,207 | ||||||||||||
|
|
| ||||||||||||||
Total Municipal Bonds |
| |||||||||||||||
(Cost $257,532) |
| 248,359 | ||||||||||||||
|
|
| ||||||||||||||
U.S. TREASURY SECURITIES — 10.57% |
| |||||||||||||||
U.S. Treasury Notes — 10.57% |
| |||||||||||||||
U.S. Treasury Notes |
| |||||||||||||||
4.25% |
| 03/15/27 | 1,385,000 | 1,378,886 | ||||||||||||
4.50% |
| 03/31/26 | 1,810,000 | 1,805,899 | ||||||||||||
|
|
| ||||||||||||||
Total U.S. Treasury Securities |
| |||||||||||||||
(Cost $3,190,061) |
| 3,184,785 | ||||||||||||||
|
|
| ||||||||||||||
Total Bonds — 75.15% |
| |||||||||||||||
(Cost $23,228,593) |
| 22,652,614 | ||||||||||||||
|
|
| ||||||||||||||
| Issues | Shares | Value | ||||||||||||||
COMMON STOCK — 0.07% |
| |||||||||||||||
Communications — 0.07% |
| |||||||||||||||
Intelsat Emergence SA3,5,6,7 |
| |||||||||||||||
(Luxembourg) |
| 773 | 20,774 | |||||||||||||
|
|
| ||||||||||||||
Total Common Stock |
| |||||||||||||||
(Cost $25,883) |
| |||||||||||||||
| Issues | Shares | Value | ||||||||||||||
MUTUAL FUNDS — 15.14% |
| |||||||||||||||
Mutual Funds — 15.14% |
| |||||||||||||||
iShares Core S&P 500 ETF |
| 8,679 | 4,562,811 | |||||||||||||
|
|
| ||||||||||||||
Total Mutual Funds |
| |||||||||||||||
(Cost $3,833,694) |
| |||||||||||||||
| See accompanying Notes to Financial Statements. |
| Annual Report March 2024 / 36 |
Table of Contents
AlphaTrak 500 Fund
Schedule of Portfolio Investments
March 31, 2024
| Issues | Maturity Date | Principal Amount/Shares | Value | |||||||||||
SHORT-TERM INVESTMENTS — 21.52% |
| |||||||||||||
Money Market Funds — 8.03% |
| |||||||||||||
| Dreyfus Government Cash Management Fund |
| |||||||||||||
5.20%8 |
| 1,000,000 | $ | 1,000,000 | ||||||||||
| Fidelity Investments Money Market Funds - Government Portfolio |
| |||||||||||||
5.21%8 |
| 20,760 | 20,760 | |||||||||||
| JPMorgan U.S. Government Money Market Fund |
| |||||||||||||
5.16%8 |
| 9,000 | 9,000 | |||||||||||
| Morgan Stanley Institutional Liquidity Funds - Government Portfolio |
| |||||||||||||
5.22%8 |
| 1,392,000 | 1,392,000 | |||||||||||
|
|
| ||||||||||||
| 2,421,760 | ||||||||||||||
|
|
| ||||||||||||
U.S. Treasury Bills — 13.49% |
| |||||||||||||
U.S. Treasury Bills (WI) |
| |||||||||||||
5.32%9 | 05/30/24 | $ | 1,500,000 | 1,486,418 | ||||||||||
5.29%9 | 07/09/24 | 500,000 | 492,653 | |||||||||||
5.34%9 | 05/16/24 | 2,100,000 | 2,085,384 | |||||||||||
|
|
| ||||||||||||
| 4,064,455 | ||||||||||||||
|
|
| ||||||||||||
Total Short-Term Investments |
| |||||||||||||
(Cost $6,488,068) |
| 6,486,215 | ||||||||||||
|
|
| ||||||||||||
Total Investments - 111.88% |
| |||||||||||||
(Cost $33,576,238) |
| 33,722,414 | ||||||||||||
|
|
| ||||||||||||
| Liabilities in Excess of Other Assets - (11.88)% |
| (3,580,743 | ) | |||||||||||
|
|
| ||||||||||||
Net Assets - 100.00% |
| $ | 30,141,671 | |||||||||||
|
|
| ||||||||||||
| 1 | Floating rate security. The rate disclosed was in effect at March 31, 2024. |
| 2 | Securities exempt from registration under Rule 144A of the Securities Act of 1933, as amended. The securities may be resold in transactions exempt from registration, normally to qualified institutional buyers. |
| 3 | Foreign denominated security issued by foreign domiciled entity. |
| 4 | Variable rate security. Interest rate disclosed is as of the most recent information available. Certain variable rate securities are not based on a published reference rate and spread but are determined by the issuer or agent and are based on current market conditions. |
| 5 | Security is valued using significant unobservable inputs and is classified as Level 3 in the fair value hierarchy. |
| 6 | Illiquid security as determined under procedures approved by the Board of Trustees. The aggregate value of illiquid securities is $43,131, which is 0.14% of total net assets. |
| 7 | Non-income producing security. |
| 8 | Represents the current yield as of March 31, 2024. |
| 9 | Represents annualized yield at date of purchase. |
| * | Securities with a call or reset feature will have an effective maturity date sooner than the stated maturity. |
| ** | Securities backed by mortgage or consumer loans where payment is periodically made will have an effective maturity date sooner than the stated maturity date. |
Note: For Fund compliance purposes, the Fund’s industry classifications refer to any one or more of the industry sub-classifications used by one or more widely recognized market indexes or ratings group indexes, and/or as defined by Fund management. This definition may not apply for purposes of this report, which may combine industry sub-classifications for more meaningful presentation for investors.
(CLO): Collateralized Loan Obligation
(ETF): Exchange-Traded Fund
(GMTN): Global Medium-Term Note
(IO): Interest Only
(MTN): Medium-Term Note
(REIT): Real Estate Investment Trust
(S&P): Standard & Poor’s
(SOFR): Secured Overnight Financing Rate
(STEP): Step Coupon Bond
(TBA): To-Be-Announced
(WI): When Issued
| Description | Number of Contracts | Expiration Date | Notional Amount | Value | Unrealized Appreciation | |||||||||||
| FUTURES CONTRACTS: LONG POSITIONS | ||||||||||||||||
S&P 500 E-mini Index | 96 | 06/21/24 | $ | 25,466,400 | $ | 541,043 | $ | 541,043 | ||||||||
|
|
|
|
|
| |||||||||||
See accompanying Notes to Financial Statements.
| 37 / Annual Report March 2024 |
Table of Contents
Schedule of Portfolio Investments
March 31, 2024
| Issues | Maturity Date | Principal Amount | Value | |||||||||||
BONDS – 97.61% |
| |||||||||||||
ASSET-BACKED SECURITIES — 0.64%** |
| |||||||||||||
Skyline Aircraft Finance LLC, |
| |||||||||||||
Series 2021-1, Class A |
| |||||||||||||
3.23% |
| 05/10/371,2,3 | $ | 37,109 | $ | 33,144 | ||||||||
|
|
| ||||||||||||
Total Asset-Backed Securities |
| |||||||||||||
(Cost $37,109) |
| |||||||||||||
CORPORATES — 80.42%* |
| |||||||||||||
Banking — 10.94% |
| |||||||||||||
Bank of America Corp. |
| |||||||||||||
2.69% |
| 04/22/323 | 20,000 | 16,916 | ||||||||||
Bank of America Corp. |
| |||||||||||||
(MTN) |
| |||||||||||||
1.92% |
| 10/24/313 | 20,000 | 16,335 | ||||||||||
2.09% |
| 06/14/293 | 125,000 | 110,524 | ||||||||||
Bank of America Corp., |
| |||||||||||||
Series N |
| |||||||||||||
1.66% |
| 03/11/273 | 53,000 | 49,408 | ||||||||||
HSBC Holdings PLC |
| |||||||||||||
(United Kingdom) |
| |||||||||||||
2.80% |
| 05/24/323,4 | 90,000 | 75,499 | ||||||||||
JPMorgan Chase & Co. |
| |||||||||||||
2.07% |
| 06/01/293 | 25,000 | 22,169 | ||||||||||
2.55% |
| 11/08/323 | 40,000 | 33,315 | ||||||||||
3.90% |
| 01/23/493 | 55,000 | 44,845 | ||||||||||
Lloyds Banking Group PLC |
| |||||||||||||
(United Kingdom) |
| |||||||||||||
1.63% |
| 05/11/273,4 | 10,000 | 9,214 | ||||||||||
3.57% |
| 11/07/283,4 | 35,000 | 32,837 | ||||||||||
PNC Financial Services Group, Inc. (The) |
| |||||||||||||
5.07% |
| 01/24/343 | 15,000 | 14,534 | ||||||||||
6.88% |
| 10/20/343 | 5,000 | 5,479 | ||||||||||
U.S. Bancorp |
| |||||||||||||
4.84% |
| 02/01/343 | 10,000 | 9,501 | ||||||||||
5.85% |
| 10/21/333 | 15,000 | 15,328 | ||||||||||
Wells Fargo & Co. |
| |||||||||||||
5.39% |
| 04/24/343 | 15,000 | 14,912 | ||||||||||
Wells Fargo & Co. |
| |||||||||||||
(MTN) |
| |||||||||||||
2.39% |
| 06/02/283 | 30,000 | 27,467 | ||||||||||
3.35% |
| 03/02/333 | 80,000 | 69,396 | ||||||||||
|
|
| ||||||||||||
| 567,679 | ||||||||||||||
|
|
| ||||||||||||
Communications — 6.86% |
| |||||||||||||
AT&T, Inc. |
| |||||||||||||
3.80% |
| 12/01/57 | 38,000 | 27,627 | ||||||||||
Charter Communications Operating LLC/Charter |
| |||||||||||||
Communications Operating Capital |
| |||||||||||||
2.30% |
| 02/01/32 | 20,000 | 15,450 | ||||||||||
3.90% |
| 06/01/52 | 5,000 | 3,194 | ||||||||||
5.38% |
| 05/01/47 | 37,000 | 29,916 | ||||||||||
Cisco Systems, Inc. |
| |||||||||||||
5.05% |
| 02/26/34 | 15,000 | 15,203 | ||||||||||
Comcast Corp. |
| |||||||||||||
4.00% |
| 11/01/49 | 15,000 | 12,150 | ||||||||||
Cox Communications, Inc. |
| |||||||||||||
2.60% |
| 06/15/315 | 25,000 | 20,761 | ||||||||||
| Issues | Maturity Date | Principal Amount | Value | |||||||||
CORPORATES (continued) |
| |||||||||||
Communications (continued) |
| |||||||||||
Fox Corp. |
| |||||||||||
6.50% | 10/13/33 | $ | 15,000 | $ | 15,890 | |||||||
Meta Platforms, Inc. |
| |||||||||||
5.60% | 05/15/53 | 15,000 | 15,872 | |||||||||
Qwest Corp. |
| |||||||||||
7.25% | 09/15/25 | 5,000 | 4,944 | |||||||||
SES GLOBAL Americas Holdings, Inc. |
| |||||||||||
5.30% | 03/25/445 | 25,000 | 19,146 | |||||||||
| Sprint Spectrum Co. LLC/Sprint Spectrum Co. II LLC/Sprint |
| |||||||||||
Spectrum Co. III LLC |
| |||||||||||
5.15% | 03/20/285 | 52,000 | 51,892 | |||||||||
Time Warner Cable LLC |
| |||||||||||
5.50% | 09/01/41 | 33,000 | 27,498 | |||||||||
T-Mobile USA, Inc. |
| |||||||||||
2.55% | 02/15/31 | 93,000 | 79,255 | |||||||||
Vodafone Group PLC |
| |||||||||||
(United Kingdom) |
| |||||||||||
4.25% | 09/17/504 | 21,000 | 16,982 | |||||||||
|
|
| ||||||||||
| 355,780 | ||||||||||||
|
|
| ||||||||||
Consumer Discretionary — 3.62% |
| |||||||||||
Altria Group, Inc. |
| |||||||||||
3.70% | 02/04/51 | 5,000 | 3,502 | |||||||||
3.88% | 09/16/46 | 11,000 | 8,196 | |||||||||
5.95% | 02/14/49 | 15,000 | 15,280 | |||||||||
Bacardi Ltd. |
| |||||||||||
(Bermuda) |
| |||||||||||
4.70% | 05/15/284,5 | 20,000 | 19,525 | |||||||||
BAT Capital Corp. |
| |||||||||||
4.39% | 08/15/37 | 35,000 | 29,439 | |||||||||
4.54% | 08/15/47 | 15,000 | 11,591 | |||||||||
Imperial Brands Finance PLC |
| |||||||||||
(United Kingdom) |
| |||||||||||
4.25% | 07/21/254,5 | 35,000 | 34,389 | |||||||||
JDE Peet’s NV |
| |||||||||||
(Netherlands) |
| |||||||||||
2.25% | 09/24/314,5 | 25,000 | 19,921 | |||||||||
WarnerMedia Holdings, Inc. |
| |||||||||||
5.14% | 03/15/52 | 55,000 | 45,720 | |||||||||
|
|
| ||||||||||
| 187,563 | ||||||||||||
|
|
| ||||||||||
Diversified REITs — 3.79% |
| |||||||||||
American Assets Trust LP |
| |||||||||||
3.38% | 02/01/31 | 30,000 | 24,529 | |||||||||
American Tower Corp. |
| |||||||||||
2.70% | 04/15/31 | 21,000 | 17,789 | |||||||||
5.55% | 07/15/33 | 20,000 | 20,170 | |||||||||
Crown Castle, Inc. |
| |||||||||||
3.30% | 07/01/30 | 50,000 | 44,470 | |||||||||
Digital Realty Trust LP |
| |||||||||||
3.60% | 07/01/29 | 5,000 | 4,610 | |||||||||
Equinix, Inc. |
| |||||||||||
2.50% | 05/15/31 | 45,000 | 37,549 | |||||||||
GLP Capital LP/GLP Financing II, Inc. |
| |||||||||||
3.25% | 01/15/32 | 2,000 | 1,695 | |||||||||
4.00% | 01/15/30 | 30,000 | 27,501 | |||||||||
See accompanying Notes to Financial Statements.
| Annual Report March 2024 / 38 |
Table of Contents
Corporate Bond Fund
Schedule of Portfolio Investments
March 31, 2024
| Issues | Maturity Date | Principal Amount | Value | |||||||||
CORPORATES (continued) |
| |||||||||||
Diversified REITs (continued) |
| |||||||||||
VICI Properties LP |
| |||||||||||
5.13% | 05/15/32 | $ | 10,000 | $ | 9,581 | |||||||
Weyerhaeuser Co. |
| |||||||||||
3.38% | 03/09/33 | 10,000 | 8,740 | |||||||||
|
|
| ||||||||||
| 196,634 | ||||||||||||
|
|
| ||||||||||
Electric — 9.17% |
| |||||||||||
AEP Transmission Co. LLC, |
| |||||||||||
Series M |
| |||||||||||
3.65% | 04/01/50 | 5,000 | 3,799 | |||||||||
AEP Transmission Co. LLC, |
| |||||||||||
Series N |
| |||||||||||
2.75% | 08/15/51 | 40,000 | 25,203 | |||||||||
Alabama Power Co. |
| |||||||||||
5.50% | 03/15/41 | 9,000 | 8,996 | |||||||||
Alliant Energy Finance LLC |
| |||||||||||
1.40% | 03/15/265 | 45,000 | 40,956 | |||||||||
Appalachian Power Co. |
| |||||||||||
4.45% | 06/01/45 | 10,000 | 8,302 | |||||||||
Arizona Public Service Co. |
| |||||||||||
3.35% | 05/15/50 | 10,000 | 6,886 | |||||||||
6.35% | 12/15/32 | 15,000 | 16,027 | |||||||||
Baltimore Gas and Electric Co. |
| |||||||||||
2.90% | 06/15/50 | 33,000 | 21,665 | |||||||||
Black Hills Corp. |
| |||||||||||
4.35% | 05/01/33 | 35,000 | 32,065 | |||||||||
Commonwealth Edison Co. |
| |||||||||||
6.45% | 01/15/38 | 10,000 | 11,012 | |||||||||
Consolidated Edison Co. of New York, Inc., |
| |||||||||||
Series 2017 |
| |||||||||||
3.88% | 06/15/47 | 5,000 | 3,964 | |||||||||
Duke Energy Carolinas LLC |
| |||||||||||
3.75% | 06/01/45 | 70,000 | 54,688 | |||||||||
3.88% | 03/15/46 | 10,000 | 7,934 | |||||||||
Evergy, Inc. |
| |||||||||||
2.45% | 09/15/24 | 5,000 | 4,923 | |||||||||
FirstEnergy Pennsylvania Electric Co. |
| |||||||||||
4.00% | 04/15/255 | 19,000 | 18,539 | |||||||||
4.15% | 04/15/255 | 50,000 | 49,158 | |||||||||
FirstEnergy Transmission LLC |
| |||||||||||
5.45% | 07/15/445 | 30,000 | 28,619 | |||||||||
Indianapolis Power & Light Co. |
| |||||||||||
5.70% | 04/01/545 | 10,000 | 10,042 | |||||||||
Interstate Power and Light Co. |
| |||||||||||
2.30% | 06/01/30 | 20,000 | 17,039 | |||||||||
Narragansett Electric Co. (The) |
| |||||||||||
3.40% | 04/09/305 | 10,000 | 9,136 | |||||||||
PacifiCorp. |
| |||||||||||
4.13% | 01/15/49 | 30,000 | 23,595 | |||||||||
Public Service Co. of New Mexico |
| |||||||||||
3.85% | 08/01/25 | 20,000 | 19,552 | |||||||||
Virginia Electric & Power Co., |
| |||||||||||
Series B |
| |||||||||||
3.80% | 09/15/47 | 10,000 | 7,750 | |||||||||
Virginia Electric and Power Co. |
| |||||||||||
2.45% | 12/15/50 | 12,000 | 7,067 | |||||||||
| Issues | Maturity Date | Principal Amount | Value | |||||||||
CORPORATES (continued) |
| |||||||||||
Electric (continued) |
| |||||||||||
Xcel Energy, Inc. |
| |||||||||||
4.80% | 09/15/41 | $ | 45,000 | $ | 38,900 | |||||||
|
|
| ||||||||||
| 475,817 | ||||||||||||
|
|
| ||||||||||
| Energy — 4.38% |
| |||||||||||
Aker BP ASA |
| |||||||||||
(Norway) |
| |||||||||||
3.10% | 07/15/314,5 | 30,000 | 25,678 | |||||||||
Boston Gas Co. |
| |||||||||||
3.76% | 03/16/325 | 10,000 | 8,819 | |||||||||
Energy Transfer LP |
| |||||||||||
5.00% | 05/15/50 | 15,000 | 13,170 | |||||||||
6.13% | 12/15/45 | 7,000 | 7,050 | |||||||||
KeySpan Gas East Corp. |
| |||||||||||
5.82% | 04/01/415 | 15,000 | 14,447 | |||||||||
Kinder Morgan Energy Partners LP |
| |||||||||||
(MTN) |
| |||||||||||
6.95% | 01/15/38 | 5,000 | 5,481 | |||||||||
Kinder Morgan, Inc. |
| |||||||||||
(GMTN) |
| |||||||||||
7.80% | 08/01/31 | 5,000 | 5,680 | |||||||||
NGPL Pipe Co. LLC |
| |||||||||||
3.25% | 07/15/315 | 20,000 | 17,127 | |||||||||
4.88% | 08/15/275 | 10,000 | 9,756 | |||||||||
| Plains All American Pipeline LP/PAA Finance Corp. |
| |||||||||||
4.50% | 12/15/26 | 13,000 | 12,771 | |||||||||
Rockies Express Pipeline LLC |
| |||||||||||
3.60% | 05/15/255 | 30,000 | 29,305 | |||||||||
Sabine Pass Liquefaction LLC |
| |||||||||||
4.20% | 03/15/28 | 3,000 | 2,906 | |||||||||
Southern Co. Gas Capital Corp. |
| |||||||||||
4.40% | 06/01/43 | 10,000 | 8,396 | |||||||||
5.88% | 03/15/41 | 15,000 | 15,167 | |||||||||
Southern Natural Gas Co. LLC |
| |||||||||||
4.80% | 03/15/475 | 15,000 | 12,392 | |||||||||
TransCanada PipeLines Ltd. |
| |||||||||||
(Canada) |
| |||||||||||
4.63% | 03/01/344 | 25,000 | 23,640 | |||||||||
5.00% | 10/16/434 | 5,000 | 4,556 | |||||||||
Williams Cos., Inc. (The) |
| |||||||||||
3.50% | 10/15/51 | 15,000 | 10,672 | |||||||||
|
|
| ||||||||||
| 227,013 | ||||||||||||
|
|
| ||||||||||
Finance — 9.28% |
| |||||||||||
| AerCap Ireland Capital DAC/AerCap Global Aviation Trust |
| |||||||||||
(Ireland) |
| |||||||||||
3.00% | 10/29/284 | 15,000 | 13,580 | |||||||||
3.30% | 01/30/324 | 28,000 | 24,002 | |||||||||
3.88% | 01/23/284 | 4,000 | 3,793 | |||||||||
Air Lease Corp. |
| |||||||||||
3.63% | 12/01/27 | 19,000 | 17,944 | |||||||||
4.25% | 09/15/24 | 10,000 | 9,930 | |||||||||
American Express Co. |
| |||||||||||
6.49% | 10/30/313 | 20,000 | 21,452 | |||||||||
See accompanying Notes to Financial Statements.
| 39 / Annual Report March 2024 |
Table of Contents
Corporate Bond Fund
Schedule of Portfolio Investments
March 31, 2024
| Issues | Maturity Date | Principal Amount | Value | |||||||||
CORPORATES (continued) |
| |||||||||||
Finance (continued) |
| |||||||||||
Avolon Holdings Funding Ltd. |
| |||||||||||
(Cayman Islands) |
| |||||||||||
2.53% | 11/18/274,5 | $ | 3,000 | $ | 2,670 | |||||||
2.75% | 02/21/284,5 | 10,000 | 8,953 | |||||||||
4.38% | 05/01/264,5 | 10,000 | 9,677 | |||||||||
Capital One Financial Corp. |
| |||||||||||
3.27% | 03/01/303 | 10,000 | 9,012 | |||||||||
Citigroup, Inc. |
| |||||||||||
2.52% | 11/03/323 | 40,000 | 32,865 | |||||||||
2.57% | 06/03/313 | 60,000 | 51,287 | |||||||||
2.98% | 11/05/303 | 1,000 | 889 | |||||||||
Discover Financial Services |
| |||||||||||
6.70% | 11/29/32 | 20,000 | 21,183 | |||||||||
Goldman Sachs Group, Inc. (The) |
| |||||||||||
1.99% | 01/27/323 | 25,000 | 20,256 | |||||||||
2.60% | 02/07/30 | 80,000 | 70,114 | |||||||||
LSEGA Financing PLC |
| |||||||||||
(United Kingdom) |
| |||||||||||
2.00% | 04/06/284,5 | 30,000 | 26,796 | |||||||||
Morgan Stanley |
| |||||||||||
1.59% | 05/04/273 | 30,000 | 27,755 | |||||||||
Morgan Stanley |
| |||||||||||
(GMTN) |
| |||||||||||
2.24% | 07/21/323 | 45,000 | 36,747 | |||||||||
3.77% | 01/24/293 | 20,000 | 19,025 | |||||||||
Morgan Stanley |
| |||||||||||
(MTN) |
| |||||||||||
1.93% | 04/28/323 | 25,000 | 20,072 | |||||||||
Pipeline Funding Co. LLC |
| |||||||||||
7.50% | 01/15/305 | 24,798 | 26,027 | |||||||||
Raymond James Financial, Inc. |
| |||||||||||
3.75% | 04/01/51 | 10,000 | 7,594 | |||||||||
|
|
| ||||||||||
| 481,623 | ||||||||||||
|
|
| ||||||||||
Food — 1.92% |
| |||||||||||
| JBS USA LUX SA/JBS USA Food Co./JBS USA Finance, Inc. |
| |||||||||||
(Canada) |
| |||||||||||
6.50% | 12/01/524 | 25,000 | 24,768 | |||||||||
Kraft Heinz Foods Co. |
| |||||||||||
4.63% | 10/01/39 | 10,000 | 9,117 | |||||||||
Pilgrim’s Pride Corp. |
| |||||||||||
3.50% | 03/01/32 | 45,000 | 38,197 | |||||||||
Smithfield Foods, Inc. |
| |||||||||||
2.63% | 09/13/315 | 35,000 | 27,428 | |||||||||
|
|
| ||||||||||
| 99,510 | ||||||||||||
|
|
| ||||||||||
Health Care — 10.63% |
| |||||||||||
Alcon Finance Corp. |
| |||||||||||
2.60% | 05/27/305 | 30,000 | 25,927 | |||||||||
Amgen, Inc. |
| |||||||||||
4.40% | 05/01/45 | 5,000 | 4,352 | |||||||||
4.88% | 03/01/53 | 10,000 | 9,115 | |||||||||
5.65% | 03/02/53 | 5,000 | 5,100 | |||||||||
5.75% | 03/02/63 | 10,000 | 10,210 | |||||||||
| Issues | Maturity Date | Principal Amount | Value | |||||||||
CORPORATES (continued) |
| |||||||||||
Health Care (continued) |
| |||||||||||
Barnabas Health, Inc., |
| |||||||||||
Series 2012 |
| |||||||||||
4.00% | 07/01/28 | $ | 5,000 | $ | 4,795 | |||||||
Baxter International, Inc. |
| |||||||||||
3.95% | 04/01/30 | 10,000 | 9,368 | |||||||||
Bayer U.S. Finance II LLC |
| |||||||||||
4.38% | 12/15/285 | 15,000 | 14,126 | |||||||||
4.88% | 06/25/485 | 17,000 | 13,674 | |||||||||
Bristol-Myers Squibb Co. |
| |||||||||||
5.20% | 02/22/34 | 30,000 | 30,491 | |||||||||
Centene Corp. |
| |||||||||||
3.00% | 10/15/30 | 11,000 | 9,441 | |||||||||
Children’s Hospital Medical Center |
| |||||||||||
2.82% | 11/15/50 | 20,000 | 13,374 | |||||||||
Cigna Group (The) |
| |||||||||||
5.40% | 03/15/33 | 5,000 | 5,093 | |||||||||
CommonSpirit Health |
| |||||||||||
2.78% | 10/01/30 | 5,000 | 4,342 | |||||||||
CVS Health Corp. |
| |||||||||||
5.05% | 03/25/48 | 18,000 | 16,363 | |||||||||
5.25% | 02/21/33 | 28,000 | 28,032 | |||||||||
Elanco Animal Health, Inc. |
| |||||||||||
6.65% | 08/28/28 | 5,000 | 5,083 | |||||||||
HCA, Inc. |
| |||||||||||
5.25% | 06/15/49 | 30,000 | 27,403 | |||||||||
Humana, Inc. |
| |||||||||||
5.38% | 04/15/31 | 25,000 | 25,030 | |||||||||
Illumina, Inc. |
| |||||||||||
2.55% | 03/23/31 | 20,000 | 16,556 | |||||||||
IQVIA, Inc. |
| |||||||||||
6.25% | 02/01/29 | 10,000 | 10,389 | |||||||||
Mass General Brigham, Inc., |
| |||||||||||
Series 2020 |
| |||||||||||
3.34% | 07/01/60 | 10,000 | 6,989 | |||||||||
Pfizer Investment Enterprises Pte Ltd. |
| |||||||||||
(Slovenia) |
| |||||||||||
4.75% | 05/19/334 | 5,000 | 4,928 | |||||||||
Revvity, Inc. |
| |||||||||||
2.55% | 03/15/31 | 25,000 | 21,104 | |||||||||
Roche Holdings, Inc. |
| |||||||||||
5.59% | 11/13/335 | 15,000 | 15,783 | |||||||||
Royalty Pharma PLC |
| |||||||||||
(United Kingdom) |
| |||||||||||
1.75% | 09/02/274 | 45,000 | 40,010 | |||||||||
Sharp HealthCare, |
| |||||||||||
Series 20B |
| |||||||||||
2.68% | 08/01/50 | 50,000 | 32,115 | |||||||||
Smith & Nephew PLC |
| |||||||||||
(United Kingdom) |
| |||||||||||
2.03% | 10/14/304 | 30,000 | 24,772 | |||||||||
STERIS Irish FinCo UnLtd Co. |
| |||||||||||
(Ireland) |
| |||||||||||
2.70% | 03/15/314 | 20,000 | 17,100 | |||||||||
Thermo Fisher Scientific, Inc. |
| |||||||||||
5.09% | 08/10/33 | 10,000 | 10,120 | |||||||||
See accompanying Notes to Financial Statements.
| Annual Report March 2024 / 40 |
Table of Contents
Corporate Bond Fund
Schedule of Portfolio Investments
March 31, 2024
| Issues | Maturity Date | Principal Amount | Value | |||||||||
CORPORATES (continued) |
| |||||||||||
Health Care (continued) |
| |||||||||||
UnitedHealth Group, Inc. |
| |||||||||||
3.70% | 08/15/49 | $ | 10,000 | $ | 7,854 | |||||||
4.25% | 04/15/47 | 15,000 | 13,005 | |||||||||
Universal Health Services, Inc. |
| |||||||||||
1.65% | 09/01/26 | 40,000 | 36,469 | |||||||||
| West Virginia United Health System Obligated Group, |
| |||||||||||
Series 2020 |
| |||||||||||
3.13% | 06/01/50 | 35,000 | 22,704 | |||||||||
Zoetis, Inc. |
| |||||||||||
5.60% | 11/16/32 | 10,000 | 10,386 | |||||||||
|
|
| ||||||||||
| 551,603 | ||||||||||||
|
|
| ||||||||||
Health Care REITs — 0.85% |
| |||||||||||
DOC DR LLC |
| |||||||||||
2.63% | 11/01/31 | 20,000 | 16,492 | |||||||||
Healthcare Realty Holdings LP |
| |||||||||||
3.63% | 01/15/28 | 30,000 | 27,746 | |||||||||
|
|
| ||||||||||
| 44,238 | ||||||||||||
|
|
| ||||||||||
Hotel & Resort REITs — 0.34% |
| |||||||||||
Host Hotels & Resorts LP, |
| |||||||||||
Series I |
| |||||||||||
3.50% | 09/15/30 | 20,000 | 17,797 | |||||||||
|
|
| ||||||||||
Industrial REITs — 1.11% |
| |||||||||||
LXP Industrial Trust |
| |||||||||||
2.38% | 10/01/31 | 5,000 | 4,006 | |||||||||
2.70% | 09/15/30 | 45,000 | 37,665 | |||||||||
Rexford Industrial Realty LP |
| |||||||||||
2.15% | 09/01/31 | 20,000 | 16,058 | |||||||||
|
|
| ||||||||||
| 57,729 | ||||||||||||
|
|
| ||||||||||
Industrials — 2.89% |
| |||||||||||
Amcor Finance USA, Inc. |
| |||||||||||
5.63% | 05/26/33 | 20,000 | 20,507 | |||||||||
Amcor Flexibles North America, Inc. |
| |||||||||||
2.63% | 06/19/30 | 5,000 | 4,310 | |||||||||
BAE Systems Holdings, Inc. |
| |||||||||||
3.85% | 12/15/255 | 20,000 | 19,527 | |||||||||
Berry Global, Inc. |
| |||||||||||
1.57% | 01/15/26 | 28,000 | 26,223 | |||||||||
Boeing Co. (The) |
| |||||||||||
5.81% | 05/01/50 | 10,000 | 9,470 | |||||||||
5.93% | 05/01/60 | 12,000 | 11,265 | |||||||||
CCL Industries, Inc. |
| |||||||||||
(Canada) |
| |||||||||||
3.05% | 06/01/304,5 | 25,000 | 21,704 | |||||||||
Northrop Grumman Corp. |
| |||||||||||
5.15% | 05/01/40 | 5,000 | 4,908 | |||||||||
Sealed Air Corp. |
| |||||||||||
1.57% | 10/15/265 | 20,000 | 18,086 | |||||||||
Sonoco Products Co. |
| |||||||||||
3.13% | 05/01/30 | 10,000 | 8,943 | |||||||||
| Issues | Maturity Date | Principal Amount | Value | |||||||||
CORPORATES (continued) |
| |||||||||||
Industrials (continued) |
| |||||||||||
Sydney Airport Finance Co. Pty Ltd. |
| |||||||||||
(Australia) |
| |||||||||||
3.63% | 04/28/264,5 | $ | 5,000 | $ | 4,820 | |||||||
|
|
| ||||||||||
| 149,763 | ||||||||||||
|
|
| ||||||||||
Information Technology — 3.55% |
| |||||||||||
Broadcom, Inc. |
| |||||||||||
2.60% | 02/15/335 | 25,000 | 20,307 | |||||||||
CDW LLC/CDW Finance Corp. |
| |||||||||||
3.28% | 12/01/28 | 25,000 | 22,833 | |||||||||
Constellation Software, Inc. |
| |||||||||||
(Canada) |
| |||||||||||
5.46% | 02/16/344,5 | 25,000 | 25,160 | |||||||||
Fiserv, Inc. |
| |||||||||||
2.65% | 06/01/30 | 15,000 | 13,072 | |||||||||
Intel Corp. |
| |||||||||||
3.25% | 11/15/49 | 5,000 | 3,531 | |||||||||
5.70% | 02/10/53 | 5,000 | 5,187 | |||||||||
Micron Technology, Inc. |
| |||||||||||
2.70% | 04/15/32 | 25,000 | 20,906 | |||||||||
Open Text Corp. |
| |||||||||||
(Canada) |
| |||||||||||
6.90% | 12/01/274,5 | 17,000 | 17,551 | |||||||||
Oracle Corp. |
| |||||||||||
3.60% | 04/01/50 | 45,000 | 32,537 | |||||||||
3.95% | 03/25/51 | 12,000 | 9,163 | |||||||||
Take-Two Interactive Software, Inc. |
| |||||||||||
4.00% | 04/14/32 | 15,000 | 13,864 | |||||||||
|
|
| ||||||||||
| 184,111 | ||||||||||||
|
|
| ||||||||||
Insurance — 5.00% |
| |||||||||||
Allstate Corp. (The) |
| |||||||||||
3.85% | 08/10/49 | 20,000 | 15,723 | |||||||||
Aon Corp./Aon Global Holdings PLC |
| |||||||||||
3.90% | 02/28/52 | 15,000 | 11,547 | |||||||||
Arthur J Gallagher & Co. |
| |||||||||||
3.05% | 03/09/52 | 10,000 | 6,401 | |||||||||
6.50% | 02/15/34 | 10,000 | 10,765 | |||||||||
Athene Global Funding |
| |||||||||||
1.61% | 06/29/265 | 15,000 | 13,770 | |||||||||
1.99% | 08/19/285 | 10,000 | 8,663 | |||||||||
Farmers Insurance Exchange |
| |||||||||||
4.75% | 11/01/573,5 | 35,000 | 25,984 | |||||||||
Guardian Life Insurance Co. of America (The) |
| |||||||||||
3.70% | 01/22/705 | 45,000 | 29,264 | |||||||||
MMI Capital Trust I, |
| |||||||||||
Series B |
| |||||||||||
7.63% | 12/15/27 | 25,000 | 26,384 | |||||||||
Nationwide Mutual Insurance Co. |
| |||||||||||
7.88% | 12/15/243,5 | 45,000 | 45,004 | |||||||||
New York Life Insurance Co. |
| |||||||||||
3.75% | 05/15/505 | 15,000 | 11,550 | |||||||||
| Teachers Insurance & Annuity Association of America |
| |||||||||||
4.38% | 09/15/543,5 | 35,000 | 34,443 | |||||||||
See accompanying Notes to Financial Statements.
| 41 / Annual Report March 2024 |
Table of Contents
Corporate Bond Fund
Schedule of Portfolio Investments
March 31, 2024
| Issues | Maturity Date | Principal Amount | Value | |||||||||
CORPORATES (continued) |
| |||||||||||
Insurance (continued) |
| |||||||||||
Willis North America, Inc. |
| |||||||||||
5.35% | 05/15/33 | $ | 20,000 | $ | 19,916 | |||||||
|
|
| ||||||||||
| 259,414 | ||||||||||||
|
|
| ||||||||||
Materials — 0.50% |
| |||||||||||
International Flavors & Fragrances, Inc. |
| |||||||||||
1.23% | 10/01/255 | 5,000 | 4,684 | |||||||||
5.00% | 09/26/48 | 25,000 | 21,397 | |||||||||
|
|
| ||||||||||
| 26,081 | ||||||||||||
|
|
| ||||||||||
Office REITs — 1.26% |
| |||||||||||
Boston Properties LP |
| |||||||||||
2.55% | 04/01/32 | 10,000 | 7,923 | |||||||||
3.40% | 06/21/29 | 5,000 | 4,490 | |||||||||
Hudson Pacific Properties LP |
| |||||||||||
3.95% | 11/01/27 | 10,000 | 8,868 | |||||||||
Kilroy Realty LP |
| |||||||||||
2.50% | 11/15/32 | 15,000 | 11,307 | |||||||||
Piedmont Operating Partnership LP |
| |||||||||||
2.75% | 04/01/32 | 45,000 | 32,564 | |||||||||
|
|
| ||||||||||
| 65,152 | ||||||||||||
|
|
| ||||||||||
Residential REITs — 0.70% |
| |||||||||||
American Homes 4 Rent LP |
| |||||||||||
2.38% | 07/15/31 | 15,000 | 12,200 | |||||||||
Essex Portfolio LP |
| |||||||||||
2.65% | 03/15/32 | 5,000 | 4,140 | |||||||||
5.50% | 04/01/34 | 15,000 | 15,015 | |||||||||
Invitation Homes Operating Partnership LP |
| |||||||||||
5.50% | 08/15/33 | 5,000 | 4,983 | |||||||||
|
|
| ||||||||||
| 36,338 | ||||||||||||
|
|
| ||||||||||
Retail — 0.18% |
| |||||||||||
Lowe’s Cos., Inc. |
| |||||||||||
5.75% | 07/01/53 | 5,000 | 5,167 | |||||||||
McDonald’s Corp. |
| |||||||||||
(MTN) |
| |||||||||||
4.20% | 04/01/50 | 5,000 | 4,185 | |||||||||
|
|
| ||||||||||
| 9,352 | ||||||||||||
|
|
| ||||||||||
Services — 0.84% |
| |||||||||||
Global Payments, Inc. |
| |||||||||||
4.45% | 06/01/28 | 30,000 | 28,975 | |||||||||
RELX Capital, Inc. |
| |||||||||||
4.00% | 03/18/29 | 15,000 | 14,400 | |||||||||
|
|
| ||||||||||
| 43,375 | ||||||||||||
|
|
| ||||||||||
Specialized REITs — 1.02% |
| |||||||||||
CubeSmart LP |
| |||||||||||
4.38% | 02/15/29 | 5,000 | 4,802 | |||||||||
Extra Space Storage LP |
| |||||||||||
2.20% | 10/15/30 | 40,000 | 33,183 | |||||||||
NNN REIT, Inc. |
| |||||||||||
5.60% | 10/15/33 | 15,000 | 15,202 | |||||||||
|
|
| ||||||||||
| 53,187 | ||||||||||||
|
|
| ||||||||||
| Issues | Maturity Date | Principal Amount | Value | |||||||||
CORPORATES (continued) |
| |||||||||||
Transportation — 1.59% |
| |||||||||||
Delta Air Lines Pass-Through Trust, |
| |||||||||||
Series 2020-1, Class AA |
| |||||||||||
2.00% | 06/10/28 | $ | 19,768 | $ | 17,878 | |||||||
JetBlue Airways Pass-Through Trust, |
| |||||||||||
Series 2019-1, Class AA |
| |||||||||||
2.75% | 05/15/32 | 12,257 | 10,516 | |||||||||
JetBlue Airways Pass-Through Trust, |
| |||||||||||
Series 2020-1, Class A |
| |||||||||||
4.00% | 11/15/32 | 24,111 | 22,284 | |||||||||
United Airlines Pass-Through Trust, |
| |||||||||||
Series 2016-2, Class AA |
| |||||||||||
2.88% | 10/07/28 | 6,879 | 6,220 | |||||||||
United Airlines Pass-Through Trust, |
| |||||||||||
Series 2023-1, Class A |
| |||||||||||
5.80% | 01/15/36 | 25,000 | 25,380 | |||||||||
|
|
| ||||||||||
| 82,278 | ||||||||||||
|
|
| ||||||||||
Total Corporates |
| |||||||||||
(Cost $4,750,928) |
| 4,172,037 | ||||||||||
|
|
| ||||||||||
MORTGAGE-BACKED — 0.52%** |
| |||||||||||
Non-Agency Commercial Mortgage-Backed — 0.04% |
| |||||||||||
Commercial Mortgage Trust, |
| |||||||||||
Series 2014-UBS5, Class XA (IO) |
| |||||||||||
0.78% | 09/10/471,2,3 | 497,519 | 492 | |||||||||
Commercial Mortgage Trust, |
| |||||||||||
Series 2014-UBS6, Class XA (IO) |
| |||||||||||
0.81% | 12/10/473 | 378,072 | 704 | |||||||||
GS Mortgage Securities Trust, |
| |||||||||||
Series 2010-C1, Class X (IO) |
| |||||||||||
0.44% | 08/10/433,5 | 1,230,734 | 1,061 | |||||||||
UBS-Barclays Commercial Mortgage Trust, |
| |||||||||||
Series 2012-C3, Class XB (IO) |
| |||||||||||
0.01% | 08/10/491,2,3,5 | 145,683 | 26 | |||||||||
|
|
| ||||||||||
| 2,283 | ||||||||||||
|
|
| ||||||||||
U.S. Agency Commercial Mortgage-Backed — 0.33% |
| |||||||||||
Ginnie Mae, |
| |||||||||||
Series 2009-111, Class IO (IO) |
| |||||||||||
0.19% | 09/16/513 | 495,285 | 16,032 | |||||||||
Ginnie Mae, |
| |||||||||||
Series 2012-144, Class IO (IO) |
| |||||||||||
0.33% | 01/16/533 | 136,434 | 943 | |||||||||
|
|
| ||||||||||
| 16,975 | ||||||||||||
|
|
| ||||||||||
U.S. Agency Mortgage-Backed — 0.15% |
| |||||||||||
Fannie Mae REMICS, |
| |||||||||||
Series 2011-116, Class SA (IO) |
| |||||||||||
(-1.00 X SOFR30A plus 5.89%, 6.00% Cap) |
| |||||||||||
0.57% | 11/25/416 | 17,929 | 1,365 | |||||||||
See accompanying Notes to Financial Statements.
| Annual Report March 2024 / 42 |
Table of Contents
Corporate Bond Fund
Schedule of Portfolio Investments
March 31, 2024
| Issues | Maturity Date | Principal Amount | Value | |||||||||
MORTGAGE-BACKED (continued) |
| |||||||||||
U.S. Agency Mortgage-Backed (continued) |
| |||||||||||
Fannie Mae REMICS, |
| |||||||||||
Series 2012-128, Class UA |
| |||||||||||
2.50% | 06/25/42 | $ | 6,926 | $ | 6,111 | |||||||
|
|
| ||||||||||
| 7,476 | ||||||||||||
|
|
| ||||||||||
Total Mortgage-Backed |
| |||||||||||
(Cost $133,828) |
| 26,734 | ||||||||||
|
|
| ||||||||||
MUNICIPAL BONDS — 2.16%* |
| |||||||||||
California — 0.84% |
| |||||||||||
| Los Angeles Department of Airports Revenue Bonds, Port, Airport and Marina Improvements, Series A |
| |||||||||||
3.89% | 05/15/38 | 15,000 | 13,657 | |||||||||
| San Francisco City & County Airport Commercial-San Francisco International Airport Revenue Bonds, Series C |
| |||||||||||
3.05% | 05/01/34 | 35,000 | 30,067 | |||||||||
|
|
| ||||||||||
| 43,724 | ||||||||||||
|
|
| ||||||||||
Florida — 0.27% |
| |||||||||||
| County of Miami-Dade Aviation Revenue Bonds, Airport and Marina Improvements, Series D |
| |||||||||||
3.50% | 10/01/31 | 15,000 | 13,749 | |||||||||
|
|
| ||||||||||
Massachusetts — 0.17% |
| |||||||||||
| Massachusetts School Building Authority Revenue Bonds, Series B |
| |||||||||||
2.97% | 10/15/32 | 10,000 | 8,866 | |||||||||
|
|
| ||||||||||
New York — 0.88% |
| |||||||||||
| New York City Transitional Finance Authority Future Tax Secured Revenue Bonds, Public Improvements |
| |||||||||||
3.73% | 08/01/29 | 5,000 | 4,801 | |||||||||
| New York City Transitional Finance Authority Future Tax Secured Revenue Bonds, Public Improvements, Series E |
| |||||||||||
1.97% | 02/01/33 | 20,000 | 15,903 | |||||||||
| New York State Urban Development Corp. Revenue Bonds, Transit Improvements, |
| |||||||||||
Series B |
| |||||||||||
2.54% | 03/15/34 | 10,000 | 8,389 | |||||||||
2.59% | 03/15/35 | 20,000 | 16,770 | |||||||||
|
|
| ||||||||||
| 45,863 | ||||||||||||
|
|
| ||||||||||
Total Municipal Bonds |
| |||||||||||
(Cost $129,186) |
| 112,202 | ||||||||||
|
|
| ||||||||||
U.S. TREASURY SECURITIES — 13.87% |
| |||||||||||
U.S. Treasury Bonds — 7.19% |
| |||||||||||
U.S. Treasury Bonds (WI) |
| |||||||||||
4.25% | 02/15/54 | 379,000 | 372,901 | |||||||||
|
|
| ||||||||||
U.S. Treasury Notes — 6.68% |
| |||||||||||
U.S. Treasury Notes (WI) |
| |||||||||||
4.00% | 02/15/34 | 221,000 | 217,426 | |||||||||
| Issues | Maturity Date | Principal Amount | Value | |||||||||||
U.S. TREASURY SECURITIES (continued) |
| |||||||||||||
U.S. Treasury Notes (continued) |
| |||||||||||||
4.25% | 03/31/29 | $ | 130,000 | $ | 129,483 | |||||||||
|
|
| ||||||||||||
| 346,909 | ||||||||||||||
|
|
| ||||||||||||
Total U.S. Treasury Securities |
| |||||||||||||
(Cost $714,680) |
| 719,810 | ||||||||||||
|
|
| ||||||||||||
Total Bonds — 97.61% |
| |||||||||||||
(Cost $5,765,731) |
| 5,063,927 | ||||||||||||
|
|
| ||||||||||||
| Issues | Maturity Date | Principal Amount/Shares | Value | |||||||||||
SHORT-TERM INVESTMENTS — 4.74% |
| |||||||||||||
Money Market Funds — 4.74% |
| |||||||||||||
| Fidelity Investments Money Market Funds - Government Portfolio |
| |||||||||||||
5.21%7 |
| 20,646 | 20,646 | |||||||||||
| Morgan Stanley Institutional Liquidity Funds - Government Portfolio |
| |||||||||||||
5.22%7 |
| 225,000 | 225,000 | |||||||||||
|
|
| ||||||||||||
Total Short-Term Investments |
| |||||||||||||
(Cost $245,646) |
| 245,646 | ||||||||||||
|
|
| ||||||||||||
Total Investments - 102.35% |
| |||||||||||||
(Cost $6,011,377) |
| 5,309,573 | ||||||||||||
|
|
| ||||||||||||
Liabilities in Excess of Other Assets - (2.35)% |
| (121,795) | ||||||||||||
|
|
| ||||||||||||
Net Assets - 100.00% |
| $ | 5,187,778 | |||||||||||
|
|
| ||||||||||||
| 1 | Security is valued using significant unobservable inputs and is classified as Level 3 in the fair value hierarchy. |
| 2 | Illiquid security as determined under procedures approved by the Board of Trustees. The aggregate value of illiquid securities is $33,662, which is 0.65% of total net assets. |
| 3 | Variable rate security. Interest rate disclosed is as of the most recent information available. Certain variable rate securities are not based on a published reference rate and spread but are determined by the issuer or agent and are based on current market conditions. |
| 4 | Foreign denominated security issued by foreign domiciled entity. |
| 5 | Securities exempt from registration under Rule 144A of the Securities Act of 1933, as amended. The securities may be resold in transactions exempt from registration, normally to qualified institutional buyers. |
| 6 | Floating rate security. The rate disclosed was in effect at March 31, 2024. |
| 7 | Represents the current yield as of March 31, 2024. |
| * | Securities with a call or reset feature will have an effective maturity date sooner than the stated maturity. |
| ** | Securities backed by mortgage or consumer loans where payment is periodically made will have an effective maturity date sooner than the stated maturity date. |
See accompanying Notes to Financial Statements.
| 43 / Annual Report March 2024 |
Table of Contents
Corporate Bond Fund
Schedule of Portfolio Investments
March 31, 2024
Note: For Fund compliance purposes, the Fund’s industry classifications refer to any one or more of the industry sub-classifications used by one or more widely recognized market indexes or ratings group indexes, and/or as defined by Fund management. This definition may not apply for purposes of this report, which may combine industry sub-classifications for more meaningful presentation for investors.
(GMTN): Global Medium-Term Note
(IO): Interest Only
(MTN): Medium-Term Note
(REIT): Real Estate Investment Trust
(SOFR): Secured Overnight Financing Rate
(WI): When Issued
| Description | Number of Contracts | Expiration Date | Notional Amount | Value | Unrealized (Depreciation) | |||||||||||||||
| FUTURES CONTRACTS: LONG POSITIONS |
| |||||||||||||||||||
U.S. Treasury Two-Year Note | 12 | 06/28/24 | $ | 2,453,813 | $ | (1,899) | $ | (1,899) | ||||||||||||
|
|
|
|
|
| |||||||||||||||
| FUTURES CONTRACTS: SHORT POSITIONS |
| |||||||||||||||||||
U.S. Treasury Ten-Year Ultra Bond | 2 | 06/18/24 | (229,219) | (1,311) | (1,311) | |||||||||||||||
U.S. Treasury Five-Year Note | 1 | 06/28/24 | (107,016) | (287) | (287) | |||||||||||||||
|
|
|
|
|
| |||||||||||||||
| (336,235) | (1,598) | (1,598) | ||||||||||||||||||
|
|
|
|
|
| |||||||||||||||
TOTAL FUTURES CONTRACTS | $ | 2,117,578 | $ | (3,497) | $ | (3,497) | ||||||||||||||
|
|
|
|
|
| |||||||||||||||
| Received by the Fund | Paid by the Fund | |||||||||||||||||||||||||||||||||
| Description | Maturity Date | Rate | Frequency | Rate | Frequency | Notional Amount (000’s) | Value | Premiums Paid | Unrealized Appreciation | |||||||||||||||||||||||||
| SWAPS: INTEREST RATE | ||||||||||||||||||||||||||||||||||
| USD-SOFR- | ||||||||||||||||||||||||||||||||||
| Interest Rate Swap1 | 12/20/53 | COMPOUND | Annual | 3.52% | Annual | $ | 77 | $ | 898 | $ | — | $ | 898 | |||||||||||||||||||||
|
|
|
|
|
|
|
| |||||||||||||||||||||||||||
| TOTAL SWAPS CONTRACTS |
| $ | 77 | $ | 898 | $ | — | $ | 898 | |||||||||||||||||||||||||
|
|
|
|
|
|
|
| |||||||||||||||||||||||||||
| 1 | Centrally cleared. |
See accompanying Notes to Financial Statements.
| Annual Report March 2024 / 44 |
Table of Contents
Schedule of Portfolio Investments
March 31, 2024
| Issues | Maturity Date | Principal Amount | Value | |||||||||
BONDS – 99.98% |
| |||||||||||
ASSET-BACKED SECURITIES — 13.69%** |
| |||||||||||
AGL CLO 13 Ltd., |
| |||||||||||
Series 2021-13A, Class B |
| |||||||||||
(Cayman Islands) |
| |||||||||||
(CME Term SOFR 3-Month plus 1.91%) |
| |||||||||||
7.23% | 10/20/341,2,3 | $ | 600,000 | $ | 600,328 | |||||||
Aimco CLO 11 Ltd., |
| |||||||||||
Series 2020-11A, Class AR |
| |||||||||||
(Cayman Islands) |
| |||||||||||
(CME Term SOFR 3-Month plus 1.39%) |
| |||||||||||
6.71% | 10/17/341,2,3 | 185,000 | 184,966 | |||||||||
Aimco CLO 14 Ltd., |
| |||||||||||
Series 2021-14A, Class SUB |
| |||||||||||
(Cayman Islands) |
| |||||||||||
0.00% | 04/20/341,2,4 | 700,000 | 545,809 | |||||||||
Allegro CLO XVI Ltd., |
| |||||||||||
Series 2024-1A, Class C |
| |||||||||||
(Cayman Islands) |
| |||||||||||
(CME Term SOFR 3-Month plus 2.70%) |
| |||||||||||
0.00% | 04/25/371,2,3 | 1,000,000 | 1,002,845 | |||||||||
AMSR Trust, |
| |||||||||||
Series 2020-SFR1, Class I |
| |||||||||||
8.19% | 04/17/371 | 605,000 | 601,196 | |||||||||
AMSR Trust, |
| |||||||||||
Series 2020-SFR3, Class H |
| |||||||||||
6.50% | 09/17/371 | 635,000 | 619,318 | |||||||||
AMSR Trust, |
| |||||||||||
Series 2021-SFR3, Class G |
| |||||||||||
3.80% | 10/17/381 | 600,000 | 534,690 | |||||||||
Barings CLO Ltd., |
| |||||||||||
Series 2022-2A, Class A |
| |||||||||||
(Cayman Islands) |
| |||||||||||
(CME Term SOFR 3-Month plus 1.80%) |
| |||||||||||
7.11% | 07/15/351,2,3 | 800,000 | 801,282 | |||||||||
BCRED CLO LLC, |
| |||||||||||
Series 2023-1A, Class A |
| |||||||||||
(CME Term SOFR 3-Month plus 2.30%) |
| |||||||||||
7.66% | 01/20/361,3 | 1,200,000 | 1,213,740 | |||||||||
BMO SBA COOF Trust, |
| |||||||||||
Series 2019-1, Class A (IO) |
| |||||||||||
1.40% | 10/25/451,4 | 2,398,542 | 78,907 | |||||||||
Carvana Auto Receivables Trust, |
| |||||||||||
Series 2020-P1, Class R |
| |||||||||||
0.00% | 09/08/271 | 1,300 | 114,052 | |||||||||
Carvana Auto Receivables Trust, |
| |||||||||||
Series 2021-N3, Class R |
| |||||||||||
0.00% | 06/12/281 | 1,500 | 158,389 | |||||||||
Carvana Auto Receivables Trust, |
| |||||||||||
Series 2022-P2, Class R |
| |||||||||||
1.00% | 05/10/291 | 3,050 | 426,542 | |||||||||
Carvana Auto Receivables Trust, |
| |||||||||||
Series 2023-N3, Class R |
| |||||||||||
0.00% | 09/10/301 | 2,200 | 562,623 | |||||||||
Carvana Auto Receivables Trust, |
| |||||||||||
Series 2023-N3, Class XS (IO) |
| |||||||||||
0.00% | 09/10/301 | 27,286,776 | 459,591 | |||||||||
| Issues | Maturity Date | Principal Amount | Value | |||||||||
ASSET-BACKED SECURITIES (continued) |
| |||||||||||
Carvana Auto Receivables Trust, |
| |||||||||||
Series 2023-P1, Class R |
| |||||||||||
0.00% | 03/11/301 | $ | 3,100 | $ | 434,632 | |||||||
Carvana Auto Receivables Trust, |
| |||||||||||
Series 2023-P2, Class R |
| |||||||||||
0.00% | 06/10/301 | 2,000 | 420,846 | |||||||||
Carvana Auto Receivables Trust, |
| |||||||||||
Series 2023-P3, Class R |
| |||||||||||
0.00% | 08/12/301 | 2,000 | 427,637 | |||||||||
CIFC Funding Ltd., |
| |||||||||||
Series 2017-4A, Class A2R |
| |||||||||||
(Cayman Islands) |
| |||||||||||
(CME Term SOFR 3-Month plus 1.81%) |
| |||||||||||
7.13% | 10/24/301,2,3 | 575,000 | 575,006 | |||||||||
CIFC Funding Ltd., |
| |||||||||||
Series 2018-1A, Class SUB |
| |||||||||||
(Cayman Islands) |
| |||||||||||
0.00% | 04/18/311,2,4 | 575,000 | 236,963 | |||||||||
CIFC Funding Ltd., |
| |||||||||||
Series 2022-2A, Class INCB |
| |||||||||||
(Cayman Islands) |
| |||||||||||
0.00% | 04/19/351,2,4 | 475,000 | 378,490 | |||||||||
CoreVest American Finance Trust, |
| |||||||||||
Series 2019-3, Class XA (IO) |
| |||||||||||
2.02% | 10/15/521,4 | 435,354 | 6,057 | |||||||||
CoreVest American Finance Trust, |
| |||||||||||
Series 2021-1, Class XB (IO) |
| |||||||||||
1.49% | 04/15/531,4 | 4,459,000 | 210,522 | |||||||||
Dryden 72 CLO Ltd., |
| |||||||||||
Series 2019-72A, Class BR |
| |||||||||||
(Cayman Islands) |
| |||||||||||
(CME Term SOFR 3-Month plus 1.91%) |
| |||||||||||
7.22% | 05/15/321,2,3 | 860,000 | 860,069 | |||||||||
Dryden XXVI Senior Loan Fund, |
| |||||||||||
Series 2013-26A, Class AR |
| |||||||||||
(Cayman Islands) |
| |||||||||||
(CME Term SOFR 3-Month plus 1.16%) |
| |||||||||||
6.48% | 04/15/291,2,3 | 43,673 | 43,645 | |||||||||
Elmwood CLO VI Ltd., |
| |||||||||||
Series 2020-3A, Class BR |
| |||||||||||
(Cayman Islands) |
| |||||||||||
(CME Term SOFR 3-Month plus 1.91%) |
| |||||||||||
7.23% | 10/20/341,2,3 | 440,000 | 440,661 | |||||||||
FirstKey Homes Trust, |
| |||||||||||
Series 2020-SFR1, Class F2 |
| |||||||||||
4.28% | 08/17/371 | 1,688,000 | 1,622,563 | |||||||||
FirstKey Homes Trust, |
| |||||||||||
Series 2021-SFR3, Class E1 |
| |||||||||||
2.99% | 12/17/381 | 944,000 | 858,431 | |||||||||
FirstKey Homes Trust, |
| |||||||||||
Series 2022-SFR1, Class D |
| |||||||||||
5.20% | 05/19/391 | 1,600,000 | 1,551,720 | |||||||||
Flatiron CLO 21 Ltd., |
| |||||||||||
Series 2021-1A, Class A1 |
| |||||||||||
(Cayman Islands) |
| |||||||||||
(CME Term SOFR 3-Month plus 1.37%) |
| |||||||||||
6.68% | 07/19/341,2,3 | 1,290,360 | 1,291,070 | |||||||||
See accompanying Notes to Financial Statements.
| 45 / Annual Report March 2024 |
Table of Contents
Flexible Income Fund
Schedule of Portfolio Investments
March 31, 2024
| Issues | Maturity Date | Principal Amount | Value | |||||||||
ASSET-BACKED SECURITIES (continued) |
| |||||||||||
FRTKL, |
| |||||||||||
Series 2021-SFR1, Class F |
| |||||||||||
3.17% | 09/17/381 | $ | 1,779,000 | $ | 1,586,066 | |||||||
Gilbert Park CLO Ltd., |
| |||||||||||
Series 2017-1A, Class A |
| |||||||||||
(Cayman Islands) |
| |||||||||||
(CME Term SOFR 3-Month plus 1.45%) |
| |||||||||||
6.77% | 10/15/301,2,3 | 224,735 | 224,945 | |||||||||
GLS Auto Receivables Issuer Trust, |
| |||||||||||
Series 2023-2A, Class D |
| |||||||||||
6.31% | 03/15/291 | 1,110,000 | 1,120,527 | |||||||||
GoldenTree Loan Management U.S. CLO 17 Ltd., |
| |||||||||||
Series 2023-17A, Class D |
| |||||||||||
(United Kingdom) |
| |||||||||||
(CME Term SOFR 3-Month plus 5.00%) |
| |||||||||||
10.32% | 07/20/361,2,3 | 850,000 | 864,314 | |||||||||
GoldenTree Loan Management U.S. CLO 8 Ltd., |
| |||||||||||
Series 2020-8A, Class AR |
| |||||||||||
(Cayman Islands) |
| |||||||||||
(CME Term SOFR 3-Month plus 1.41%) |
| |||||||||||
6.73% | 10/20/341,2,3 | 250,000 | 250,327 | |||||||||
Golub Capital Partners CLO 42M-R, |
| |||||||||||
Series 2019-42RA, Class A2R |
| |||||||||||
(CME Term SOFR 3-Month plus 2.75%) |
| |||||||||||
8.07% | 01/20/361,3 | 800,000 | 808,124 | |||||||||
Golub Capital Partners CLO 69M, |
| |||||||||||
Series 2023-69A, Class B1 |
| |||||||||||
(CME Term SOFR 3-Month plus 3.25%) |
| |||||||||||
8.66% | 11/09/361,3 | 1,200,000 | 1,213,128 | |||||||||
HOA Funding, LLC, |
| |||||||||||
Series 2021-1A, Class A2 |
| |||||||||||
4.72% | 08/20/511 | 819,000 | 639,654 | |||||||||
HPS Loan Management Ltd., |
| |||||||||||
Series 2023-18A, Class D |
| |||||||||||
(Cayman Islands) |
| |||||||||||
(CME Term SOFR 3-Month plus 5.75%) |
| |||||||||||
11.07% | 07/20/361,2,3 | 850,000 | 872,365 | |||||||||
HPS Loan Management Ltd., |
| |||||||||||
Series 2024-19A, Class C2 |
| |||||||||||
(Cayman Islands) |
| |||||||||||
(CME Term SOFR 3-Month plus 2.90%) |
| |||||||||||
0.00% | 04/15/371,2,3 | 1,000,000 | 1,002,679 | |||||||||
J.G. Wentworth XXX LLC, |
| |||||||||||
Series 2013-3A, Class A |
| |||||||||||
4.08% | 01/17/731 | 36,461 | 34,181 | |||||||||
J.G. Wentworth XXXII LLC, |
| |||||||||||
Series 2014-2A, Class A |
| |||||||||||
3.61% | 01/17/731 | 36,134 | 32,421 | |||||||||
Madison Park Funding XLVIII Ltd., |
| |||||||||||
Series 2021-48A, Class A |
| |||||||||||
(Cayman Islands) |
| |||||||||||
(CME Term SOFR 3-Month plus 1.41%) |
| |||||||||||
6.72% | 04/19/331,2,3 | 1,000,000 | 1,000,080 | |||||||||
Navient Student Loan Trust, |
| |||||||||||
Series 2018-4A, Class B |
| |||||||||||
(SOFR30A plus 1.41%) |
| |||||||||||
6.73% | 06/27/671,3 | 850,000 | 788,199 | |||||||||
| Issues | Maturity Date | Principal Amount | Value | |||||||||
ASSET-BACKED SECURITIES (continued) |
| |||||||||||
Neuberger Berman CLO XVI-S Ltd., |
| |||||||||||
Series 2017-16SA, Class AR |
| |||||||||||
(Cayman Islands) |
| |||||||||||
(CME Term SOFR 3-Month plus 1.30%) |
| |||||||||||
6.62% | 04/15/341,2,3 | $ | 1,200,000 | $ | 1,200,983 | |||||||
Neuberger Berman Loan Advisers CLO 40 Ltd., |
| |||||||||||
Series 2021-40A, Class SUB |
| |||||||||||
(Cayman Islands) |
| |||||||||||
0.00% | 04/16/331,2,4 | 275,000 | 156,849 | |||||||||
OCP CLO Ltd., |
| |||||||||||
Series 2017-14A, Class A1A |
| |||||||||||
(Cayman Islands) |
| |||||||||||
(CME Term SOFR 3-Month plus 1.41%) |
| |||||||||||
6.73% | 11/20/301,2,3 | 230,911 | 231,206 | |||||||||
OCP CLO Ltd., |
| |||||||||||
Series 2023-28A, Class D |
| |||||||||||
(United Kingdom) |
| |||||||||||
(CME Term SOFR 3-Month plus 5.35%) |
| |||||||||||
10.66% | 07/16/361,2,3 | 900,000 | 915,773 | |||||||||
Octagon Investment Partners 44 Ltd., |
| |||||||||||
Series 2019-1A, Class BR |
| |||||||||||
(Cayman Islands) |
| |||||||||||
(CME Term SOFR 3-Month plus 1.96%) |
| |||||||||||
7.28% | 10/15/341,2,3 | 700,000 | 700,667 | |||||||||
Palmer Square CLO Ltd., |
| |||||||||||
Series 2014-1A, Class A1R2 |
| |||||||||||
(Cayman Islands) |
| |||||||||||
(CME Term SOFR 3-Month plus 1.39%) |
| |||||||||||
6.71% | 01/17/311,2,3 | 284,959 | 285,165 | |||||||||
Palmer Square CLO Ltd., |
| |||||||||||
Series 2021-1A, Class SUB |
| |||||||||||
(Cayman Islands) |
| |||||||||||
0.00% | 04/20/341,2,4 | 625,000 | 390,450 | |||||||||
PHEAA Student Loan Trust, |
| |||||||||||
Series 2014-3A, Class A |
| |||||||||||
(SOFR30A plus 0.70%) |
| |||||||||||
6.02% | 08/25/401,3 | 20,678 | 20,472 | |||||||||
Progress Residential Trust, |
| |||||||||||
Series 2020-SFR1, Class G |
| |||||||||||
4.03% | 04/17/371 | 1,400,000 | 1,353,537 | |||||||||
Progress Residential Trust, |
| |||||||||||
Series 2021-SFR11, Class F |
| |||||||||||
4.42% | 01/17/391 | 1,250,000 | 1,104,716 | |||||||||
Progress Residential Trust, |
| |||||||||||
Series 2021-SFR2, Class H |
| |||||||||||
5.00% | 04/19/381 | 819,000 | 758,745 | |||||||||
Progress Residential Trust, |
| |||||||||||
Series 2021-SFR6, Class G |
| |||||||||||
4.00% | 07/17/381 | 1,250,000 | 1,125,347 | |||||||||
Progress Residential Trust, |
| |||||||||||
Series 2021-SFR8, Class G |
| |||||||||||
4.01% | 10/17/381 | 1,488,000 | 1,327,525 | |||||||||
Progress Residential Trust, |
| |||||||||||
Series 2021-SFR9, Class E1 |
| |||||||||||
2.81% | 11/17/401 | 1,531,000 | 1,305,246 | |||||||||
See accompanying Notes to Financial Statements.
| Annual Report March 2024 / 46 |
Table of Contents
Flexible Income Fund
Schedule of Portfolio Investments
March 31, 2024
| Issues | Maturity Date | Principal Amount | Value | |||||||||
ASSET-BACKED SECURITIES (continued) |
| |||||||||||
Progress Residential, |
| |||||||||||
Series 2021-SFR1, Class H |
| |||||||||||
5.00% | 04/17/381 | $ | 1,400,000 | $ | 1,274,642 | |||||||
Progress Residential, |
| |||||||||||
Series 2021-SFR3, Class G |
| |||||||||||
4.25% | 05/17/261 | 1,211,000 | 1,100,540 | |||||||||
Progress Residential, |
| |||||||||||
Series 2021-SFR4, Class F |
| |||||||||||
3.41% | 05/17/381 | 1,530,000 | 1,391,979 | |||||||||
Regata XII Funding Ltd., |
| |||||||||||
Series 2019-1A, Class BR |
| |||||||||||
(Cayman Islands) |
| |||||||||||
(CME Term SOFR 3-Month plus 1.86%) |
| |||||||||||
7.18% | 10/15/321,2,3 | 750,000 | 750,485 | |||||||||
Rockford Tower CLO Ltd., |
| |||||||||||
Series 2017-2A, Class AR |
| |||||||||||
(Cayman Islands) |
| |||||||||||
(CME Term SOFR 3-Month plus 1.28%) |
| |||||||||||
6.60% | 10/15/291,2,3 | 35,015 | 35,009 | |||||||||
Rockford Tower CLO Ltd., |
| |||||||||||
Series 2017-3A, Class A |
| |||||||||||
(Cayman Islands) |
| |||||||||||
(CME Term SOFR 3-Month plus 1.45%) |
| |||||||||||
6.77% | 10/20/301,2,3 | 611,499 | 613,004 | |||||||||
Rockford Tower CLO Ltd., |
| |||||||||||
Series 2023-1A, Class D |
| |||||||||||
(Cayman Islands) |
| |||||||||||
(CME Term SOFR 3-Month plus 5.32%) |
| |||||||||||
10.67% | 01/20/361,2,3 | 850,000 | 873,359 | |||||||||
Santander Consumer Auto Receivables Trust, |
| |||||||||||
Series 2020-BA, Class R |
| |||||||||||
0.00% | 08/15/281 | 2,000 | 401,531 | |||||||||
Santander Consumer Auto Receivables Trust, |
| |||||||||||
Series 2021-CA, Class R |
| |||||||||||
0.00% | 06/15/281 | 5,150 | 477,361 | |||||||||
Skyline Aircraft Finance LLC, |
| |||||||||||
Series 2021-1, Class A |
| |||||||||||
3.23% | 05/10/374,5,6 | 453,550 | 405,094 | |||||||||
SLM Student Loan Trust, |
| |||||||||||
Series 2004-1, Class B |
| |||||||||||
(SOFR90A plus 0.76%) |
| |||||||||||
6.12% | 07/25/393 | 132,718 | 124,876 | |||||||||
SLM Student Loan Trust, |
| |||||||||||
Series 2008-5, Class A4 |
| |||||||||||
(SOFR90A plus 1.96%) |
| |||||||||||
7.32% | 07/25/233 | 50,969 | 50,936 | |||||||||
SLM Student Loan Trust, |
| |||||||||||
Series 2008-7, Class A4 |
| |||||||||||
(SOFR90A plus 1.16%) |
| |||||||||||
6.52% | 07/25/233 | 10,617 | 10,464 | |||||||||
SLM Student Loan Trust, |
| |||||||||||
Series 2008-7, Class B |
| |||||||||||
(SOFR90A plus 2.11%) |
| |||||||||||
7.47% | 07/26/833 | 10,000 | 9,385 | |||||||||
| Issues | Maturity Date | Principal Amount | Value | |||||||||
ASSET-BACKED SECURITIES (continued) |
| |||||||||||
Stratus CLO Ltd., |
| |||||||||||
Series 2021-3A, Class SUB |
| |||||||||||
(Cayman Islands) |
| |||||||||||
0.00% | 12/29/291,2,4 | $ | 975,000 | $ | 634,374 | |||||||
Textainer Marine Containers VII Ltd., |
| |||||||||||
Series 2021-1A, Class B |
| |||||||||||
(Bermuda) |
| |||||||||||
2.52% | 02/20/461,2 | 578,042 | 500,407 | |||||||||
Tricon Residential Trust, |
| |||||||||||
Series 2021-SFR1, Class F |
| |||||||||||
3.69% | 07/17/381 | 900,000 | 823,456 | |||||||||
Voya CLO Ltd., |
| |||||||||||
Series 2018-4A, Class BR |
| |||||||||||
(Cayman Islands) |
| |||||||||||
(CME Term SOFR 3-Month plus 1.91%) |
| |||||||||||
7.23% | 01/15/321,2,3 | 800,000 | 799,648 | |||||||||
|
|
| ||||||||||
| Total Asset-Backed Securities |
| |||||||||||
(Cost $49,313,021) |
| 48,852,831 | ||||||||||
|
|
| ||||||||||
| BANK LOANS — 4.75%* |
| |||||||||||
| Automotive — 0.03% |
| |||||||||||
First Brands Group LLC, |
| |||||||||||
Term Loan B, 1st Lien |
| |||||||||||
(SOFR plus 5.26%) |
| |||||||||||
10.57% | 03/30/273 | 95,778 | 96,042 | |||||||||
|
|
| ||||||||||
| Communications — 0.33% |
| |||||||||||
CCI Buyer, Inc., |
| |||||||||||
Term Loan B, 1st Lien |
| |||||||||||
(SOFR plus 4.00%) |
| |||||||||||
9.30% | 12/17/273 | 158,611 | 157,888 | |||||||||
CSC Holdings LLC, |
| |||||||||||
Term Loan B5, 1st Lien |
| |||||||||||
(SOFR plus 2.50%) |
| |||||||||||
7.94% | 04/15/273 | 206,498 | 187,249 | |||||||||
Frontier Communications Holdings LLC, |
| |||||||||||
Term Loan B, 1st Lien |
| |||||||||||
(SOFR plus 3.86%) |
| |||||||||||
8.62% | 10/08/273 | 121,250 | 121,136 | |||||||||
New Insight Holdings, Inc., |
| |||||||||||
Term Loan B, 1st Lien |
| |||||||||||
(SOFR plus 5.76%) |
| |||||||||||
11.07% | 12/20/243 | 152,822 | 92,219 | |||||||||
SBA Senior Finance II LLC, |
| |||||||||||
Term Loan B, 1st Lien |
| |||||||||||
(SOFR plus 2.00%) |
| |||||||||||
7.34% | 01/25/313 | 482,491 | 483,924 | |||||||||
Virgin Media Bristol LLC, |
| |||||||||||
Term Loan Y, 1st Lien |
| |||||||||||
(SOFR plus 3.35%) |
| |||||||||||
8.79% | 03/31/313 | 150,000 | 147,979 | |||||||||
|
|
| ||||||||||
| 1,190,395 | ||||||||||||
|
|
| ||||||||||
See accompanying Notes to Financial Statements.
| 47 / Annual Report March 2024 |
Table of Contents
Flexible Income Fund
Schedule of Portfolio Investments
March 31, 2024
| Issues | Maturity Date | Principal Amount | Value | |||||||||
BANK LOANS (continued) |
| |||||||||||
| Consumer Discretionary — 0.31% |
| |||||||||||
City Brewing Co. LLC, |
| |||||||||||
Term Loan B, 1st Lien |
| |||||||||||
(SOFR plus 3.76%) |
| |||||||||||
8.32% | 04/05/283 | $ | 433,376 | $ | 340,317 | |||||||
Hanesbrands, Inc., |
| |||||||||||
Term Loan A, 1st Lien |
| |||||||||||
(SOFR plus 2.60%) |
| |||||||||||
7.93% | 11/19/263 | 196,312 | 193,613 | |||||||||
Naked Juice, LLC, |
| |||||||||||
Term Loan, 1st Lien (Luxembourg) |
| |||||||||||
(SOFR plus 3.35%) |
| |||||||||||
8.66% | 01/24/292,3 | 245,625 | 230,357 | |||||||||
Term Loan, 2nd Lien |
| |||||||||||
(SOFR plus 6.10%) |
| |||||||||||
11.00% | 01/24/303 | 252,357 | 206,853 | |||||||||
Triton Water Holdings, Inc., |
| |||||||||||
Term Loan B, 1st Lien |
| |||||||||||
(SOFR plus 3.51%) |
| |||||||||||
8.23% | 03/31/283 | 142,962 | 141,640 | |||||||||
|
|
| ||||||||||
| 1,112,780 | ||||||||||||
|
|
| ||||||||||
| Electric — 0.14% |
| |||||||||||
Calpine Corp., |
| |||||||||||
Term Loan B9, 1st Lien |
| |||||||||||
(SOFR plus 2.00%) |
| |||||||||||
7.33% | 01/31/313 | 500,000 | 497,760 | |||||||||
|
|
| ||||||||||
| Energy — 0.13% |
| |||||||||||
Buckeye Partners LP, |
| |||||||||||
Term Loan B1, 1st Lien |
| |||||||||||
(SOFR plus 2.00%) |
| |||||||||||
7.33% | 11/01/263 | 250,000 | 250,748 | |||||||||
NGL Energy Operating LLC, |
| |||||||||||
Term Loan B, 1st Lien |
| |||||||||||
(SOFR plus 4.50%) |
| |||||||||||
9.83% | 02/03/313 | 203,613 | 204,376 | |||||||||
|
|
| ||||||||||
| 455,124 | ||||||||||||
|
|
| ||||||||||
| Entertainment — 0.02% |
| |||||||||||
William Morris Endeavor Entertainment LLC, |
| |||||||||||
Term Loan B1, 1st Lien |
| |||||||||||
(SOFR plus 2.86%) |
| |||||||||||
8.19% | 05/16/253 | 72,485 | 72,524 | |||||||||
|
|
| ||||||||||
| Finance — 0.10% |
| |||||||||||
Avolon TLB Borrower 1 U.S. LLC, |
| |||||||||||
Term Loan B6, 1st Lien |
| |||||||||||
(SOFR plus 2.00%) |
| |||||||||||
7.33% | 06/22/283 | 58,771 | 58,854 | |||||||||
Deerfield Dakota Holding LLC, |
| |||||||||||
Term Loan B, 1st Lien |
| |||||||||||
(SOFR plus 3.75%) |
| |||||||||||
9.06% | 04/09/273 | 10,727 | 10,687 | |||||||||
| Issues | Maturity Date | Principal Amount | Value | |||||||||
BANK LOANS (continued) |
| |||||||||||
| Finance (continued) |
| |||||||||||
Jane Street Group LLC, |
| |||||||||||
Term Loan B, 1st Lien |
| |||||||||||
(SOFR plus 2.61%) |
| |||||||||||
7.94% | 01/26/283 | $ | 280,122 | $ | 280,577 | |||||||
|
|
| ||||||||||
| 350,118 | ||||||||||||
|
|
| ||||||||||
| Food — 0.04% |
| |||||||||||
8th Avenue Food & Provisions, Inc., |
| |||||||||||
Term Loan B, 1st Lien |
| |||||||||||
(SOFR plus 3.86%) |
| |||||||||||
9.19% | 10/01/253 | 63,672 | 62,708 | |||||||||
H-Food Holdings LLC, |
| |||||||||||
Term Loan, 1st Lien |
| |||||||||||
(SOFR plus 3.95%) |
| |||||||||||
9.29% | 05/23/253 | 126,777 | 92,786 | |||||||||
|
|
| ||||||||||
| 155,494 | ||||||||||||
|
|
| ||||||||||
| Gaming — 0.21% |
| |||||||||||
Caesars Entertainment, Inc., |
| |||||||||||
Term Loan B1, 1st Lien |
| |||||||||||
(SOFR plus 2.75%) |
| |||||||||||
8.04% | 02/06/313 | 344,784 | 345,484 | |||||||||
Fertitta Entertainment LLC, |
| |||||||||||
Term Loan B, 1st Lien |
| |||||||||||
(SOFR plus 4.00%) |
| |||||||||||
9.43% | 01/29/293 | 211,261 | 212,010 | |||||||||
Ontario Gaming Gta Ltd. Partnership, |
| |||||||||||
Term Loan B, 1st Lien (Canada) |
| |||||||||||
(SOFR plus 4.25%) |
| |||||||||||
9.57% | 08/01/302,3 | 177,588 | 178,413 | |||||||||
|
|
| ||||||||||
| 735,907 | ||||||||||||
|
|
| ||||||||||
| Health Care — 0.99% |
| |||||||||||
Bausch + Lomb Corp., |
| |||||||||||
Term Loan, 1st Lien (Canada) |
| |||||||||||
(SOFR plus 4.00%) |
| |||||||||||
9.33% | 09/29/282,3 | 341,866 | 342,295 | |||||||||
Carestream Dental Equipment, Inc., |
| |||||||||||
Term Loan, 1st Lien |
| |||||||||||
(LIBOR plus 3.25%) |
| |||||||||||
8.56% | 09/01/243 | 749,726 | 654,762 | |||||||||
Carestream Dental, Inc., |
| |||||||||||
Term Loan, 1st Lien |
| |||||||||||
(LIBOR plus 4.50%) |
| |||||||||||
9.94% | 09/01/243 | 189,296 | 165,239 | |||||||||
Certara Holdco, Inc., |
| |||||||||||
Term Loan B, 1st Lien (France) |
| |||||||||||
(SOFR plus 3.76%) |
| |||||||||||
9.10% | 08/15/262,3 | 267,438 | 268,106 | |||||||||
Genesee & Wyoming, Inc., |
| |||||||||||
Term Loan, 1st Lien |
| |||||||||||
(SOFR plus 2.10%) |
| |||||||||||
7.40% | 12/30/263 | 265,995 | 266,468 | |||||||||
Grifols Worldwide Operations USA, Inc., |
| |||||||||||
Term Loan B, 1st Lien |
| |||||||||||
(SOFR plus 2.15%) |
| |||||||||||
7.46% | 11/15/273 | 278,545 | 270,310 | |||||||||
See accompanying Notes to Financial Statements.
| Annual Report March 2024 / 48 |
Table of Contents
Flexible Income Fund
Schedule of Portfolio Investments
March 31, 2024
| Issues | Maturity Date | Principal Amount | Value | |||||||||
BANK LOANS (continued) |
| |||||||||||
| Health Care (continued) |
| |||||||||||
Jazz Financing Lux SARL, |
| |||||||||||
Term Loan B, 1st Lien (Luxembourg) |
| |||||||||||
(SOFR plus 3.11%) |
| |||||||||||
8.44% | 05/05/282,3 | $ | 628,639 | $ | 632,568 | |||||||
Organon & Co., |
| |||||||||||
Term Loan B, 1st Lien |
| |||||||||||
(SOFR plus 3.11%) |
| |||||||||||
7.75% | 06/02/283 | 400,000 | 401,918 | |||||||||
Pathway Vet Alliance LLC, |
| |||||||||||
Term Loan B, 1st Lien |
| |||||||||||
(SOFR plus 3.86%) |
| |||||||||||
9.19% | 03/31/273 | 96,507 | 84,957 | |||||||||
Peraton Corp., |
| |||||||||||
Term Loan B, 1st Lien |
| |||||||||||
(SOFR plus 3.85%) |
| |||||||||||
9.18% | 02/01/283 | 235,696 | 235,937 | |||||||||
Star Parent, Inc., |
| |||||||||||
Term Loan B, 1st Lien |
| |||||||||||
(SOFR plus 4.00%) |
| |||||||||||
9.31% | 09/27/303 | 192,291 | 191,342 | |||||||||
|
|
| ||||||||||
| 3,513,902 | ||||||||||||
|
|
| ||||||||||
| Health Care REITs — 0.07% |
| |||||||||||
Aveanna Healthcare LLC, |
| |||||||||||
Term Loan B, 1st Lien |
| |||||||||||
(SOFR plus 3.85%) |
| |||||||||||
9.19% | 07/17/283 | 262,462 | 253,041 | |||||||||
|
|
| ||||||||||
| Industrials — 0.52% |
| |||||||||||
Artera Services LLC, |
| |||||||||||
Term Loan, 1st Lien |
| |||||||||||
(SOFR plus 4.50%) |
| |||||||||||
9.81% | 02/15/313 | 197,114 | 198,099 | |||||||||
ASP Blade Holdings, Inc., |
| |||||||||||
Term Loan B, 1st Lien |
| |||||||||||
(SOFR plus 4.26%) |
| |||||||||||
9.56% | 10/16/283 | 197,625 | 179,246 | |||||||||
Berry Global, Inc., |
| |||||||||||
Term Loan AA, 1st Lien |
| |||||||||||
(SOFR plus 1.86%) |
| |||||||||||
7.18% | 07/01/293 | 228,295 | 228,460 | |||||||||
Filtration Group Corp., |
| |||||||||||
Term Loan, 1st Lien |
| |||||||||||
(SOFR plus 4.36%) |
| |||||||||||
9.69% | 10/21/283 | 109,530 | 110,003 | |||||||||
Michaels Cos., Inc. (The), |
| |||||||||||
Term Loan, 1st Lien |
| |||||||||||
(SOFR plus 4.51%) |
| |||||||||||
9.82% | 04/15/283 | 165,325 | 148,755 | |||||||||
Patriot Container Corp., |
| |||||||||||
Term Loan B, 1st Lien |
| |||||||||||
(SOFR plus 3.85%) |
| |||||||||||
9.18% | 03/20/253 | 65,262 | 63,444 | |||||||||
Term Loan, 2nd Lien |
| |||||||||||
(SOFR plus 7.75%) |
| |||||||||||
13.08% | 03/20/263 | 184,665 | 160,659 | |||||||||
| Issues | Maturity Date | Principal Amount | Value | |||||||||
BANK LOANS (continued) |
| |||||||||||
| Industrials (continued) |
| |||||||||||
ProAmpac PG Borrower LLC, |
| |||||||||||
Term Loan B, 1st Lien |
| |||||||||||
(SOFR plus 4.50%) |
| |||||||||||
9.80% - 9.82% | 09/15/283 | $ | 345,046 | $ | 346,081 | |||||||
Transdigm, Inc., |
| |||||||||||
Term Loan I, 1st Lien |
| |||||||||||
(SOFR plus 2.75%) |
| |||||||||||
8.08% | 08/24/283 | 432,604 | 434,566 | |||||||||
|
|
| ||||||||||
| 1,869,313 | ||||||||||||
|
|
| ||||||||||
| Information Technology — 0.96% |
| |||||||||||
Arches Buyer, Inc., |
| |||||||||||
Term Loan B, 1st Lien |
| |||||||||||
(SOFR plus 3.35%) |
| |||||||||||
8.68% | 12/06/273 | 123,721 | 120,122 | |||||||||
Athenahealth Group, Inc., |
| |||||||||||
Term Loan B, 1st Lien |
| |||||||||||
(SOFR plus 3.25%) |
| |||||||||||
8.25% | 02/15/293 | 230,810 | 229,205 | |||||||||
Buzz Merger Sub Ltd., |
| |||||||||||
Term Loan B, 1st Lien |
| |||||||||||
(SOFR plus 2.85%) |
| |||||||||||
8.18% | 01/29/273 | 118,290 | 118,697 | |||||||||
Central Parent LLC, |
| |||||||||||
Term Loan B, 1st Lien |
| |||||||||||
(SOFR plus 4.00%) |
| |||||||||||
9.31% | 07/06/293 | 171,975 | 172,682 | |||||||||
CT Technologies Intermediate Holdings, Inc., |
| |||||||||||
Term Loan, 1st Lien |
| |||||||||||
(SOFR plus 4.36%) |
| |||||||||||
9.69% | 12/16/253 | 72,750 | 72,705 | |||||||||
EagleView Technology Co., |
| |||||||||||
Term Loan B, 1st Lien |
| |||||||||||
(SOFR plus 3.76%) |
| |||||||||||
9.06% | 08/14/253 | 842,115 | 819,933 | |||||||||
Gainwell Acquisition Corp., |
| |||||||||||
Term Loan B, 1st Lien |
| |||||||||||
(SOFR plus 4.10%) |
| |||||||||||
8.72% - 8.99% | 10/01/273 | 242,481 | 232,388 | |||||||||
Magnite, Inc., |
| |||||||||||
Term Loan B, 1st Lien |
| |||||||||||
(SOFR plus 4.50%) |
| |||||||||||
9.60% - 9.82% | 02/06/313 | 79,000 | 79,231 | |||||||||
Match Group, Inc., |
| |||||||||||
Term Loan B, 1st Lien |
| |||||||||||
(SOFR plus 1.90%) |
| |||||||||||
7.23% | 02/13/273 | 57,653 | 57,653 | |||||||||
MH Sub I LLC, |
| |||||||||||
Term Loan B3, 1st Lien |
| |||||||||||
(SOFR plus 4.25%) |
| |||||||||||
9.58% | 05/03/283 | 32,380 | 32,225 | |||||||||
NortonLifeLock, Inc., |
| |||||||||||
Term Loan A2, 1st Lien |
| |||||||||||
(SOFR plus 1.85%) |
| |||||||||||
7.18% | 09/10/273 | 224,106 | 223,802 | |||||||||
See accompanying Notes to Financial Statements.
| 49 / Annual Report March 2024 |
Table of Contents
Flexible Income Fund
Schedule of Portfolio Investments
March 31, 2024
| Issues | Maturity Date | Principal Amount | Value | |||||||||
BANK LOANS (continued) |
| |||||||||||
| Information Technology (continued) |
| |||||||||||
Open Text Corp., |
| |||||||||||
Term Loan B, 1st Lien (Canada) |
| |||||||||||
(SOFR plus 1.85%) |
| |||||||||||
7.18% | 05/30/252,3 | $ | 26,980 | $ | 27,039 | |||||||
(SOFR plus 2.85%) |
| |||||||||||
8.18% | 01/31/302,3 | 49,614 | 49,755 | |||||||||
RealPage, Inc., |
| |||||||||||
Term Loan B, 1st Lien |
| |||||||||||
(SOFR plus 3.11%) |
| |||||||||||
8.44% | 04/24/283 | 248,724 | 242,316 | |||||||||
Renaissance Holding Corp., |
| |||||||||||
Term Loan, 1st Lien |
| |||||||||||
(SOFR plus 4.25%) |
| |||||||||||
9.58% | 04/05/303 | 172,462 | 173,001 | |||||||||
Spin Holdco, Inc., |
| |||||||||||
Term Loan B, 1st Lien |
| |||||||||||
(SOFR plus 4.26%) |
| |||||||||||
9.59% | 03/03/283 | 266,750 | 247,724 | |||||||||
SS&C Technologies Holdings, Inc., |
| |||||||||||
Term Loan B5, 1st Lien |
| |||||||||||
(SOFR plus 1.86%) |
| |||||||||||
7.19% | 04/16/253 | 194,218 | 194,458 | |||||||||
Xerox Corp., |
| |||||||||||
Term Loan B, 1st Lien |
| |||||||||||
(SOFR plus 4.00%) |
| |||||||||||
9.33% | 11/15/293 | 314,362 | 316,230 | |||||||||
|
|
| ||||||||||
| 3,409,166 | ||||||||||||
|
|
| ||||||||||
| Insurance — 0.24% |
| |||||||||||
Acrisure LLC, |
| |||||||||||
Term Loan B1, 1st Lien |
| |||||||||||
(SOFR plus 3.50%) |
| |||||||||||
8.94% | 02/15/273 | 244,275 | 244,427 | |||||||||
Term Loan B2, 1st Lien |
| |||||||||||
(SOFR plus 4.25%) |
| |||||||||||
9.07% | 02/15/273 | 191,980 | 192,400 | |||||||||
Asurion LLC, |
| |||||||||||
Term Loan B8, 1st Lien |
| |||||||||||
(SOFR plus 3.36%) |
| |||||||||||
8.69% | 12/23/263 | 425,709 | 418,106 | |||||||||
|
|
| ||||||||||
| 854,933 | ||||||||||||
|
|
| ||||||||||
| Materials — 0.08% |
| |||||||||||
Chemours Co. (The), |
| |||||||||||
Term Loan B3, 1st Lien |
| |||||||||||
(SOFR plus 3.50%) |
| |||||||||||
8.83% | 08/18/283 | 66,407 | 66,307 | |||||||||
Mativ Holdings, Inc., |
| |||||||||||
Delayed-Draw Term Loan, 1st Lien |
| |||||||||||
(SOFR plus 2.60%) |
| |||||||||||
7.93% | 05/06/273 | 85,260 | 83,981 | |||||||||
Schweitzer-Mauduit International, Inc., |
| |||||||||||
Term Loan B, 1st Lien |
| |||||||||||
(SOFR plus 3.86%) |
| |||||||||||
9.19% | 04/20/283 | 118,942 | 119,141 | |||||||||
|
|
| ||||||||||
| 269,429 | ||||||||||||
|
|
| ||||||||||
| Issues | Maturity Date | Principal Amount | Value | |||||||||
BANK LOANS (continued) |
| |||||||||||
| Retail — 0.26% |
| |||||||||||
1011778 BC Unlimited Liability Co., |
| |||||||||||
Term Loan B5, 1st Lien (Canada) |
| |||||||||||
(SOFR plus 2.25%) |
| |||||||||||
7.58% | 09/20/302,3 | $ | 209,673 | $ | 209,804 | |||||||
AmWINS Group, Inc., |
| |||||||||||
Term Loan B, 1st Lien |
| |||||||||||
(SOFR plus 2.36%) |
| |||||||||||
7.69% | 02/19/283 | 169,315 | 169,527 | |||||||||
U.S. Anesthesia Partners, Inc., |
| |||||||||||
Term Loan B, 1st Lien |
| |||||||||||
(SOFR plus 4.36%) |
| |||||||||||
9.69% | 10/01/283 | 463,125 | 443,894 | |||||||||
Whatabrands LLC, |
| |||||||||||
Term Loan B, 1st Lien |
| |||||||||||
(SOFR plus 3.36%) |
| |||||||||||
8.69% | 08/03/283 | 95,843 | 96,011 | |||||||||
|
|
| ||||||||||
| 919,236 | ||||||||||||
|
|
| ||||||||||
| Services — 0.22% |
| |||||||||||
| Amentum Government Services Holdings LLC, |
| |||||||||||
Term Loan B, 1st Lien |
| |||||||||||
(SOFR plus 4.11%) |
| |||||||||||
8.63% | 01/29/273 | 114,111 | 114,539 | |||||||||
Clean Harbors, Inc., |
| |||||||||||
Term Loan B, 1st Lien |
| |||||||||||
(SOFR plus 1.86%) |
| |||||||||||
7.19% | 10/08/283 | 335,847 | 336,896 | |||||||||
Pre-Paid Legal Services, Inc., |
| |||||||||||
Term Loan, 1st Lien |
| |||||||||||
(SOFR plus 3.86%) |
| |||||||||||
9.18% | 12/15/283 | 10,732 | 10,695 | |||||||||
Prime Security Services Borrower, LLC, |
| |||||||||||
Term Loan A, 1st Lien |
| |||||||||||
(SOFR plus 2.35%) |
| |||||||||||
7.50% | 03/14/283 | 155,949 | 155,429 | |||||||||
Trans Union LLC, |
| |||||||||||
Term Loan B, 1st Lien |
| |||||||||||
(SOFR plus 2.00%) |
| |||||||||||
7.33% | 12/01/283 | 171,732 | 171,850 | |||||||||
TruGreen LP, |
| |||||||||||
Term Loan B, 1st Lien |
| |||||||||||
(SOFR plus 4.10%) |
| |||||||||||
9.43% | 11/02/273 | 10,728 | 10,463 | |||||||||
|
|
| ||||||||||
| 799,872 | ||||||||||||
|
|
| ||||||||||
| Specialized REITs — 0.10% |
| |||||||||||
Greystar Real Estate Partners LLC, |
| |||||||||||
Term Loan B1, 1st Lien |
| |||||||||||
(SOFR plus 3.25%) |
| |||||||||||
8.58% | 08/21/303 | 371,893 | 372,822 | |||||||||
|
|
| ||||||||||
| Total Bank Loans |
| |||||||||||
(Cost $16,945,566) |
| 16,927,858 | ||||||||||
|
|
| ||||||||||
See accompanying Notes to Financial Statements.
| Annual Report March 2024 / 50 |
Table of Contents
Flexible Income Fund
Schedule of Portfolio Investments
March 31, 2024
| Issues | Maturity Date | Principal Amount | Value | |||||||||
CORPORATES — 24.22%* |
| |||||||||||
| Banking — 3.91% |
| |||||||||||
Bank of America Corp. |
| |||||||||||
2.30% | 07/21/324 | $ | 65,000 | $ | 53,244 | |||||||
2.59% | 04/29/314 | 270,000 | 232,674 | |||||||||
3.42% | 12/20/284 | 685,000 | 643,186 | |||||||||
Bank of America Corp. |
| |||||||||||
(MTN) |
| |||||||||||
1.32% | 06/19/264 | 165,000 | 156,843 | |||||||||
1.53% | 12/06/254 | 1,100,000 | 1,069,290 | |||||||||
1.92% | 10/24/314 | 385,000 | 314,453 | |||||||||
2.55% | 02/04/284 | 125,000 | 116,210 | |||||||||
2.97% | 02/04/334 | 1,090,000 | 927,295 | |||||||||
Bank of America Corp., |
| |||||||||||
Series N |
| |||||||||||
1.66% | 03/11/274 | 500,000 | 466,117 | |||||||||
Bank of America Corp., |
| |||||||||||
Series RR |
| |||||||||||
4.38%4,7 | 100,000 | 94,249 | ||||||||||
Discover Bank |
| |||||||||||
2.45% | 09/12/24 | 230,000 | 226,583 | |||||||||
DNB Bank ASA |
| |||||||||||
(Norway) |
| |||||||||||
0.86% | 09/30/251,2,4 | 220,000 | 214,654 | |||||||||
HSBC Holdings PLC |
| |||||||||||
(United Kingdom) |
| |||||||||||
1.59% | 05/24/272,4 | 510,000 | 469,402 | |||||||||
2.10% | 06/04/262,4 | 1,060,000 | 1,016,932 | |||||||||
2.36% | 08/18/312,4 | 60,000 | 50,026 | |||||||||
4.76% | 06/09/282,4 | 255,000 | 250,124 | |||||||||
JPMorgan Chase & Co. |
| |||||||||||
0.97% | 06/23/254 | 280,000 | 276,795 | |||||||||
1.04% | 02/04/274 | 25,000 | 23,135 | |||||||||
1.05% | 11/19/264 | 270,000 | 252,069 | |||||||||
1.56% | 12/10/254 | 710,000 | 690,398 | |||||||||
1.58% | 04/22/274 | 700,000 | 649,282 | |||||||||
2.07% | 06/01/294 | 120,000 | 106,409 | |||||||||
2.58% | 04/22/324 | 760,000 | 642,337 | |||||||||
4.01% | 04/23/294 | 255,000 | 244,493 | |||||||||
JPMorgan Chase & Co., |
| |||||||||||
Series KK |
| |||||||||||
3.65%4,7 | 115,000 | 109,507 | ||||||||||
Lloyds Banking Group PLC |
| |||||||||||
(United Kingdom) |
| |||||||||||
3.57% | 11/07/282,4 | 420,000 | 394,041 | |||||||||
PNC Financial Services Group, Inc. (The) |
| |||||||||||
5.58% | 06/12/294 | 120,000 | 121,534 | |||||||||
6.04% | 10/28/334 | 150,000 | 155,247 | |||||||||
6.88% | 10/20/344 | 495,000 | 542,421 | |||||||||
Santander UK Group Holdings PLC |
| |||||||||||
(United Kingdom) |
| |||||||||||
1.67% | 06/14/272,4 | 325,000 | 297,516 | |||||||||
U.S. Bancorp |
| |||||||||||
3.70%4,7 | 105,000 | 90,986 | ||||||||||
4.84% | 02/01/344 | 435,000 | 413,282 | |||||||||
5.68% | 01/23/354 | 170,000 | 171,800 | |||||||||
5.84% | 06/12/344 | 5,000 | 5,102 | |||||||||
5.85% | 10/21/334 | 195,000 | 199,273 | |||||||||
| Issues | Maturity Date | Principal Amount | Value | |||||||||
CORPORATES (continued) |
| |||||||||||
| Banking (continued) |
| |||||||||||
Wells Fargo & Co. |
| |||||||||||
5.39% | 04/24/344 | $ | 550,000 | $ | 546,776 | |||||||
Wells Fargo & Co. |
| |||||||||||
(MTN) |
| |||||||||||
2.39% | 06/02/284 | 560,000 | 512,722 | |||||||||
2.57% | 02/11/314 | 385,000 | 331,945 | |||||||||
3.35% | 03/02/334 | 535,000 | 464,083 | |||||||||
5.57% | 07/25/294 | 410,000 | 414,979 | |||||||||
|
|
| ||||||||||
| 13,957,414 | ||||||||||||
|
|
| ||||||||||
| Communications — 2.18% |
| |||||||||||
Cable One, Inc. |
| |||||||||||
4.00% | 11/15/301 | 60,000 | 46,950 | |||||||||
| Charter Communications Operating LLC/Charter |
| |||||||||||
Communications Operating Capital |
| |||||||||||
2.80% | 04/01/31 | 140,000 | 114,721 | |||||||||
3.70% | 04/01/51 | 530,000 | 329,167 | |||||||||
4.80% | 03/01/50 | 250,000 | 185,217 | |||||||||
5.38% | 05/01/47 | 141,000 | 114,004 | |||||||||
6.65% | 02/01/34 | 246,000 | 252,253 | |||||||||
| Charter Communications Operating, LLC/Charter |
| |||||||||||
Communications Operating Capital |
| |||||||||||
5.25% | 04/01/53 | 310,000 | 245,781 | |||||||||
CommScope, Inc. |
| |||||||||||
4.75% | 09/01/291 | 199,000 | 143,280 | |||||||||
CSC Holdings LLC |
| |||||||||||
4.63% | 12/01/301 | 300,000 | 152,250 | |||||||||
5.38% | 02/01/281 | 150,000 | 129,147 | |||||||||
6.50% | 02/01/291 | 12,000 | 10,178 | |||||||||
7.50% | 04/01/281 | 453,000 | 305,728 | |||||||||
11.25% | 05/15/281 | 315,000 | 312,568 | |||||||||
11.75% | 01/31/291 | 15,000 | 15,019 | |||||||||
| DIRECTV Financing LLC/DIRECTV Financing Co. Obligor, Inc. |
| |||||||||||
5.88% | 08/15/271 | 169,000 | 160,013 | |||||||||
Frontier Communications Holdings LLC |
| |||||||||||
6.75% | 05/01/291 | 775,000 | 691,521 | |||||||||
8.63% | 03/15/311 | 546,000 | 558,007 | |||||||||
Global Switch Finance BV |
| |||||||||||
(EMTN) |
| |||||||||||
(Netherlands) |
| |||||||||||
1.38% | 10/07/302 | 285,000 | 285,284 | |||||||||
Gray Television, Inc. |
| |||||||||||
7.00% | 05/15/271 | 400,000 | 372,708 | |||||||||
Intelsat Jackson Holdings SA |
| |||||||||||
(Luxembourg) |
| |||||||||||
6.50% | 03/15/301,2 | 115,000 | 107,241 | |||||||||
| Northwest Fiber LLC/Northwest Fiber Finance Sub, Inc. |
| |||||||||||
4.75% | 04/30/271 | 94,000 | 96,350 | |||||||||
6.00% | 02/15/281 | 250,000 | 257,500 | |||||||||
Scripps Escrow, Inc. |
| |||||||||||
5.88% | 07/15/271 | 400,000 | 336,000 | |||||||||
| Sprint Spectrum Co. LLC/Sprint Spectrum Co. II LLC/Sprint |
| |||||||||||
Spectrum Co. III LLC |
| |||||||||||
5.15% | 03/20/281 | 396,000 | 395,175 | |||||||||
See accompanying Notes to Financial Statements.
| 51 / Annual Report March 2024 |
Table of Contents
Flexible Income Fund
Schedule of Portfolio Investments
March 31, 2024
| Issues | Maturity Date | Principal Amount | Value | |||||||||
CORPORATES (continued) |
| |||||||||||
| Communications (continued) |
| |||||||||||
Tele Columbus AG, |
| |||||||||||
Series REGS |
| |||||||||||
(Georgia) |
| |||||||||||
10.00% | 03/19/292,8 | $ | 510,000 | $ | 384,458 | |||||||
Time Warner Cable LLC |
| |||||||||||
5.50% | 09/01/41 | 510,000 | 424,975 | |||||||||
VZ Secured Financing BV |
| |||||||||||
(Netherlands) |
| |||||||||||
5.00% | 01/15/321,2 | 1,400,000 | 1,203,095 | |||||||||
Zayo Group Holdings, Inc. |
| |||||||||||
4.00% | 03/01/271 | 185,000 | 152,445 | |||||||||
|
|
| ||||||||||
| 7,781,035 | ||||||||||||
|
|
| ||||||||||
| Consumer Discretionary — 1.21% |
| |||||||||||
BAT Capital Corp. |
| |||||||||||
3.56% | 08/15/27 | 44,000 | 41,674 | |||||||||
5.65% | 03/16/52 | 430,000 | 389,399 | |||||||||
BAT International Finance PLC |
| |||||||||||
(United Kingdom) |
| |||||||||||
1.67% | 03/25/262 | 83,000 | 77,304 | |||||||||
BAT International Finance PLC |
| |||||||||||
(EMTN) |
| |||||||||||
(United Kingdom) |
| |||||||||||
2.25% | 09/09/522 | 570,000 | 322,987 | |||||||||
Central Garden & Pet Co. |
| |||||||||||
4.13% | 10/15/30 | 375,000 | 336,758 | |||||||||
Everi Holdings, Inc. |
| |||||||||||
5.00% | 07/15/291 | 350,000 | 347,375 | |||||||||
Imperial Brands Finance PLC |
| |||||||||||
(United Kingdom) |
| |||||||||||
4.25% | 07/21/251,2 | 160,000 | 157,208 | |||||||||
6.13% | 07/27/271,2 | 195,000 | 199,063 | |||||||||
JDE Peet’s NV |
| |||||||||||
(Netherlands) |
| |||||||||||
2.25% | 09/24/311,2 | 750,000 | 597,623 | |||||||||
Reynolds American, Inc. |
| |||||||||||
5.85% | 08/15/45 | 95,000 | 88,463 | |||||||||
Spectrum Brands, Inc. |
| |||||||||||
5.50% | 07/15/301 | 425,000 | 416,500 | |||||||||
Triton Water Holdings, Inc. |
| |||||||||||
6.25% | 04/01/291 | 450,000 | 410,859 | |||||||||
WarnerMedia Holdings, Inc. |
| |||||||||||
4.28% | 03/15/32 | 190,000 | 169,918 | |||||||||
5.05% | 03/15/42 | 480,000 | 412,539 | |||||||||
5.14% | 03/15/52 | 425,000 | 353,289 | |||||||||
|
|
| ||||||||||
| 4,320,959 | ||||||||||||
|
|
| ||||||||||
| Diversified REITs — 0.80% |
| |||||||||||
American Assets Trust LP |
| |||||||||||
3.38% | 02/01/31 | 500,000 | 408,811 | |||||||||
American Tower Corp. |
| |||||||||||
2.10% | 06/15/30 | 550,000 | 457,712 | |||||||||
2.70% | 04/15/31 | 80,000 | 67,768 | |||||||||
| Issues | Maturity Date | Principal Amount | Value | |||||||||
CORPORATES (continued) |
| |||||||||||
| Diversified REITs (continued) |
| |||||||||||
CapitaLand Ascendas REIT |
| |||||||||||
(EMTN) |
| |||||||||||
(Slovenia) |
| |||||||||||
0.75% | 06/23/282 | $ | 100,000 | $ | 93,594 | |||||||
Digital Dutch Finco BV |
| |||||||||||
(Netherlands) |
| |||||||||||
1.00% | 01/15/322 | 150,000 | 128,778 | |||||||||
1.25% | 02/01/312 | 220,000 | 197,597 | |||||||||
Digital Intrepid Holding BV |
| |||||||||||
(Netherlands) |
| |||||||||||
0.63% | 07/15/312 | 100,000 | 84,688 | |||||||||
GLP Capital LP/GLP Financing II, Inc. |
| |||||||||||
3.25% | 01/15/32 | 247,000 | 209,390 | |||||||||
4.00% | 01/15/30 | 427,000 | 391,427 | |||||||||
4.00% | 01/15/31 | 73,000 | 65,297 | |||||||||
5.38% | 04/15/26 | 40,000 | 39,678 | |||||||||
5.75% | 06/01/28 | 10,000 | 10,015 | |||||||||
VICI Properties LP |
| |||||||||||
4.95% | 02/15/30 | 64,000 | 61,892 | |||||||||
5.13% | 05/15/32 | 311,000 | 297,972 | |||||||||
5.63% | 05/15/52 | 50,000 | 46,444 | |||||||||
VICI Properties LP/VICI Note Co., Inc. |
| |||||||||||
3.88% | 02/15/291 | 35,000 | 32,242 | |||||||||
4.50% | 01/15/281 | 13,000 | 12,488 | |||||||||
4.63% | 06/15/251 | 10,000 | 9,862 | |||||||||
5.75% | 02/01/271 | 65,000 | 64,987 | |||||||||
Vonovia SE |
| |||||||||||
(Georgia) |
| |||||||||||
1.00% | 06/16/332 | 100,000 | 81,703 | |||||||||
Vonovia SE |
| |||||||||||
(EMTN) |
| |||||||||||
(Georgia) |
| |||||||||||
0.75% | 09/01/322 | 100,000 | 82,045 | |||||||||
|
|
| ||||||||||
| 2,844,390 | ||||||||||||
|
|
| ||||||||||
| Electric — 1.01% |
| |||||||||||
Alliant Energy Finance LLC |
| |||||||||||
1.40% | 03/15/261 | 245,000 | 222,980 | |||||||||
Alliant Energy Finance, LLC |
| |||||||||||
3.60% | 03/01/321 | 155,000 | 137,355 | |||||||||
Arizona Public Service Co. |
| |||||||||||
6.35% | 12/15/32 | 675,000 | 721,210 | |||||||||
Duke Energy Carolinas LLC |
| |||||||||||
4.00% | 09/30/42 | 250,000 | 209,274 | |||||||||
5.35% | 01/15/53 | 195,000 | 192,899 | |||||||||
Duke Energy Corp. |
| |||||||||||
3.85% | 06/15/34 | 200,000 | 214,455 | |||||||||
FirstEnergy Pennsylvania Electric Co. |
| |||||||||||
4.15% | 04/15/251 | 555,000 | 545,654 | |||||||||
FirstEnergy Transmission LLC |
| |||||||||||
2.87% | 09/15/281 | 418,000 | 381,400 | |||||||||
Public Service Co. of New Mexico |
| |||||||||||
3.85% | 08/01/25 | 40,000 | 39,104 | |||||||||
See accompanying Notes to Financial Statements.
| Annual Report March 2024 / 52 |
Table of Contents
Flexible Income Fund
Schedule of Portfolio Investments
March 31, 2024
| Issues | Maturity Date | Principal Amount | Value | |||||||||
CORPORATES (continued) |
| |||||||||||
| Electric (continued) |
| |||||||||||
TenneT Holding BV |
| |||||||||||
(EMTN) |
| |||||||||||
(Netherlands) |
| |||||||||||
2.75% | 05/17/422 | $ | 215,000 | $ | 217,790 | |||||||
4.50% | 10/28/342 | 200,000 | 237,505 | |||||||||
4.75% | 10/28/422 | 140,000 | 173,958 | |||||||||
Tucson Electric Power Co. |
| |||||||||||
5.50% | 04/15/53 | 305,000 | 303,643 | |||||||||
|
|
| ||||||||||
| 3,597,227 | ||||||||||||
|
|
| ||||||||||
| Energy — 1.76% |
| |||||||||||
CenterPoint Energy Resources Corp. |
| |||||||||||
5.40% | 03/01/33 | 765,000 | 779,052 | |||||||||
Energy Transfer LP |
| |||||||||||
4.90% | 03/15/35 | 20,000 | 18,912 | |||||||||
5.00% | 05/15/50 | 445,000 | 390,700 | |||||||||
Energy Transfer LP, |
| |||||||||||
Series B |
| |||||||||||
6.63%4,7 | 733,000 | 687,299 | ||||||||||
Galaxy Pipeline Assets Bidco Ltd. |
| |||||||||||
(United Kingdom) |
| |||||||||||
2.16% | 03/31/341,2 | 169,888 | 146,444 | |||||||||
Global Partners LP/GLP Finance Corp. |
| |||||||||||
6.88% | 01/15/29 | 430,000 | 426,936 | |||||||||
8.25% | 01/15/321 | 250,000 | 259,832 | |||||||||
KazMunayGas National Co. JSC |
| |||||||||||
(Kazakhstan) |
| |||||||||||
3.50% | 04/14/331,2 | 200,000 | 166,780 | |||||||||
KeySpan Gas East Corp. |
| |||||||||||
5.99% | 03/06/331 | 385,000 | 390,951 | |||||||||
National Gas Transmission PLC, |
| |||||||||||
(EMTN) |
| |||||||||||
(United Kingdom) |
| |||||||||||
4.25% | 04/05/302 | 100,000 | 111,209 | |||||||||
NGL Energy Operating LLC/NGL Energy Finance Corp. |
| |||||||||||
8.38% | 02/15/321 | 275,000 | 282,232 | |||||||||
NGPL Pipe Co. LLC |
| |||||||||||
4.88% | 08/15/271 | 40,000 | 39,024 | |||||||||
Petroleos Mexicanos |
| |||||||||||
(Mexico) |
| |||||||||||
6.35% | 02/12/482 | 5,000 | 3,194 | |||||||||
Rockies Express Pipeline LLC |
| |||||||||||
4.80% | 05/15/301 | 234,000 | 217,386 | |||||||||
Southern Natural Gas Co. LLC |
| |||||||||||
4.80% | 03/15/471 | 65,000 | 53,700 | |||||||||
TMS Issuer SARL, |
| |||||||||||
Series REGS |
| |||||||||||
(Luxembourg) |
| |||||||||||
5.78% | 08/23/322 | 200,000 | 205,940 | |||||||||
TransMontaigne Partners LP/TLP Finance Corp. |
| |||||||||||
6.13% | 02/15/26 | 725,000 | 693,281 | |||||||||
| USA Compression Partners LP/USA Compression Finance Corp. |
| |||||||||||
7.13% | 03/15/291 | 375,000 | 379,437 | |||||||||
Venture Global Calcasieu Pass LLC |
| |||||||||||
4.13% | 08/15/311 | 580,000 | 516,925 | |||||||||
| Issues | Maturity Date | Principal Amount | Value | |||||||||
CORPORATES (continued) |
| |||||||||||
| Energy (continued) |
| |||||||||||
Venture Global LNG, Inc. |
| |||||||||||
9.50% | 02/01/291 | $ | 336,000 | $ | 362,469 | |||||||
9.88% | 02/01/321 | 150,000 | 161,813 | |||||||||
|
|
| ||||||||||
| 6,293,516 | ||||||||||||
|
|
| ||||||||||
| Entertainment — 0.10% |
| |||||||||||
Banijay Entertainment SASTerm Loan B, 1st Lien |
| |||||||||||
(France) |
| |||||||||||
8.13% | 05/01/291,2 | 350,000 | 361,267 | |||||||||
|
|
| ||||||||||
| Finance — 3.21% |
| |||||||||||
| AerCap Ireland Capital DAC/AerCap Global Aviation Trust |
| |||||||||||
(Ireland) |
| |||||||||||
2.45% | 10/29/262 | 123,000 | 114,311 | |||||||||
3.30% | 01/30/322 | 185,000 | 158,583 | |||||||||
3.88% | 01/23/282 | 5,000 | 4,741 | |||||||||
4.45% | 10/01/252 | 110,000 | 108,361 | |||||||||
Air Lease Corp. |
| |||||||||||
(MTN) |
| |||||||||||
2.88% | 01/15/26 | 380,000 | 363,593 | |||||||||
Avolon Holdings Funding Ltd. |
| |||||||||||
(Cayman Islands) |
| |||||||||||
2.53% | 11/18/271,2 | 583,000 | 518,820 | |||||||||
Charles Schwab Corp. (The) |
| |||||||||||
Series K |
| |||||||||||
5.00%4,7 | 200,000 | 191,712 | ||||||||||
Citigroup, Inc. |
| |||||||||||
0.98% | 05/01/254 | 695,000 | 691,972 | |||||||||
2.52% | 11/03/324 | 725,000 | 595,689 | |||||||||
2.98% | 11/05/304 | 145,000 | 128,855 | |||||||||
3.52% | 10/27/284 | 435,000 | 410,303 | |||||||||
Discover Financial Services |
| |||||||||||
3.95% | 11/06/24 | 105,000 | 103,880 | |||||||||
Gaci First Investment Co. |
| |||||||||||
(Cayman Islands) |
| |||||||||||
5.25% | 10/13/322 | 300,000 | 303,431 | |||||||||
GGAM Finance Ltd. |
| |||||||||||
(Cayman Islands) |
| |||||||||||
8.00% | 02/15/271,2 | 115,000 | 118,812 | |||||||||
8.00% | 06/15/281,2 | 520,000 | 542,750 | |||||||||
Goldman Sachs Group, Inc. (The) |
| |||||||||||
1.54% | 09/10/274 | 5,000 | 4,569 | |||||||||
1.95% | 10/21/274 | 325,000 | 298,958 | |||||||||
3.81% | 04/23/294 | 575,000 | 545,959 | |||||||||
(SOFR Rate plus 0.49%) |
| |||||||||||
5.84% | 10/21/243 | 130,000 | 130,088 | |||||||||
Goldman Sachs Group, Inc. (The), |
| |||||||||||
Series VAR |
| |||||||||||
1.09% | 12/09/264 | 2,910,000 | 2,702,747 | |||||||||
| Icahn Enterprises LP/Icahn Enterprises Finance Corp. |
| |||||||||||
4.38% | 02/01/29 | 184,000 | 157,285 | |||||||||
5.25% | 05/15/27 | 451,000 | 419,430 | |||||||||
9.75% | 01/15/291 | 285,000 | 297,462 | |||||||||
Jane Street Group/JSG Finance, Inc. |
| |||||||||||
4.50% | 11/15/291 | 575,000 | 533,489 | |||||||||
Morgan Stanley |
| |||||||||||
0.99% | 12/10/264 | 145,000 | 134,421 | |||||||||
See accompanying Notes to Financial Statements.
| 53 / Annual Report March 2024 |
Table of Contents
Flexible Income Fund
Schedule of Portfolio Investments
March 31, 2024
| Issues | Maturity Date | Principal Amount | Value | |||||||||
CORPORATES (continued) |
| |||||||||||
| Finance (continued) |
| |||||||||||
Morgan Stanley |
| |||||||||||
(GMTN) |
| |||||||||||
2.24% | 07/21/324 | $ | 425,000 | $ | 347,056 | |||||||
2.95% | 05/07/324 | 155,000 | 161,008 | |||||||||
Morgan Stanley |
| |||||||||||
(MTN) |
| |||||||||||
1.16% | 10/21/254 | 595,000 | 579,534 | |||||||||
1.93% | 04/28/324 | 575,000 | 461,650 | |||||||||
Nationwide Building Society |
| |||||||||||
(United Kingdom) |
| |||||||||||
2.97% | 02/16/281,2,4 | 200,000 | 186,656 | |||||||||
Pipeline Funding Co. LLC |
| |||||||||||
7.50% | 01/15/301 | 144,655 | 151,825 | |||||||||
|
|
| ||||||||||
| 11,467,950 | ||||||||||||
|
|
| ||||||||||
| Food — 0.73% |
| |||||||||||
B&G Foods, Inc. |
| |||||||||||
5.25% | 04/01/25 | 122,000 | 122,000 | |||||||||
ELO SACA |
| |||||||||||
(EMTN) |
| |||||||||||
(France) |
| |||||||||||
6.00% | 03/22/292 | 600,000 | 657,732 | |||||||||
| H-Food Holdings LLC/Hearthside Finance Co., Inc. |
| |||||||||||
8.50% | 06/01/261 | 932,000 | 69,900 | |||||||||
| JBS USA LUX SA/JBS USA Food Co./JBS Luxembourg Sarl |
| |||||||||||
(Canada) |
| |||||||||||
6.75% | 03/15/341,2 | 185,000 | 194,565 | |||||||||
| JBS USA LUX SA/JBS USA Food Co./JBS USA Finance, Inc. |
| |||||||||||
(Canada) |
| |||||||||||
3.75% | 12/01/312 | 385,000 | 333,840 | |||||||||
6.50% | 12/01/522 | 437,000 | 432,939 | |||||||||
Pilgrim’s Pride Corp. |
| |||||||||||
4.25% | 04/15/31 | 180,000 | 162,588 | |||||||||
| Simmons Foods, Inc./Simmons Prepared Foods, Inc./ Simmons Pet Food, Inc./Simmons Feed |
| |||||||||||
4.63% | 03/01/291 | 700,000 | 619,939 | |||||||||
Smithfield Foods, Inc. |
| |||||||||||
5.20% | 04/01/291 | 5,000 | 4,819 | |||||||||
|
|
| ||||||||||
| 2,598,322 | ||||||||||||
|
|
| ||||||||||
| Health Care — 1.88% |
| |||||||||||
1375209 BC Ltd. |
| |||||||||||
(Canada) |
| |||||||||||
9.00% | 01/30/281,2 | 1,000,000 | 981,088 | |||||||||
AbbVie, Inc. |
| |||||||||||
3.85% | 06/15/24 | 10,000 | 9,962 | |||||||||
Amgen, Inc. |
| |||||||||||
3.15% | 02/21/40 | 100,000 | 77,116 | |||||||||
Bayer U.S. Finance II LLC |
| |||||||||||
4.25% | 12/15/251 | 255,000 | 248,720 | |||||||||
4.38% | 12/15/281 | 210,000 | 197,766 | |||||||||
4.40% | 07/15/441 | 245,000 | 187,767 | |||||||||
4.88% | 06/25/481 | 80,000 | 64,349 | |||||||||
Bayer U.S. Finance LLC |
| |||||||||||
6.50% | 11/21/331 | 500,000 | 508,873 | |||||||||
| Issues | Maturity Date | Principal Amount | Value | |||||||||
CORPORATES (continued) |
| |||||||||||
| Health Care (continued) |
| |||||||||||
Becton Dickinson & Co. |
| |||||||||||
3.73% | 12/15/24 | $ | 3,000 | $ | 2,962 | |||||||
CAB SELAS, |
| |||||||||||
Series REGS |
| |||||||||||
(France) |
| |||||||||||
3.38% | 02/01/282 | 385,000 | 377,151 | |||||||||
Cano Health LLC |
| |||||||||||
6.25% | 10/01/281,5,6,9,10 | 118,000 | 103 | |||||||||
Catalent Pharma Solutions, Inc. |
| |||||||||||
3.13% | 02/15/291 | 475,000 | 454,351 | |||||||||
Centene Corp. |
| |||||||||||
3.00% | 10/15/30 | 323,000 | 277,227 | |||||||||
Embecta Corp. |
| |||||||||||
6.75% | 02/15/301 | 525,000 | 459,328 | |||||||||
Ephios Subco 3 SARL |
| |||||||||||
(Luxembourg) |
| |||||||||||
7.88% | 01/31/311,2 | 150,000 | 170,497 | |||||||||
Grifols SA |
| |||||||||||
(Spain) |
| |||||||||||
4.75% | 10/15/281,2 | 835,000 | 691,516 | |||||||||
HCA, Inc. |
| |||||||||||
5.38% | 09/01/26 | 10,000 | 9,994 | |||||||||
5.63% | 09/01/28 | 275,000 | 278,265 | |||||||||
Kedrion SpA |
| |||||||||||
(Italy) |
| |||||||||||
6.50% | 09/01/291,2 | 800,000 | 729,938 | |||||||||
ModivCare Escrow Issuer, Inc. |
| |||||||||||
5.00% | 10/01/291 | 709,000 | 514,992 | |||||||||
Prime Healthcare Services, Inc. |
| |||||||||||
7.25% | 11/01/251 | 450,000 | 451,125 | |||||||||
|
|
| ||||||||||
| 6,693,090 | ||||||||||||
|
|
| ||||||||||
| Health Care REITs — 0.16% |
| |||||||||||
Healthcare Reality Holdings LP |
| |||||||||||
2.00% | 03/15/31 | 65,000 | 51,728 | |||||||||
3.10% | 02/15/30 | 115,000 | 100,022 | |||||||||
Healthcare Realty Holdings LP |
| |||||||||||
2.05% | 03/15/31 | 37,000 | 28,713 | |||||||||
2.40% | 03/15/30 | 325,000 | 266,329 | |||||||||
3.63% | 01/15/28 | 150,000 | 138,728 | |||||||||
Healthpeak OP LLC, |
| |||||||||||
3.40% | 02/01/25 | 2,000 | 1,963 | |||||||||
|
|
| ||||||||||
| 587,483 | ||||||||||||
|
|
| ||||||||||
| Industrial REITs — 0.07% |
| |||||||||||
LXP Industrial Trust |
| |||||||||||
2.70% | 09/15/30 | 160,000 | 133,919 | |||||||||
Prologis Euro Finance LLC, |
| |||||||||||
(EMTN) |
| |||||||||||
4.25% | 01/31/43 | 100,000 | 109,035 | |||||||||
|
|
| ||||||||||
| 242,954 | ||||||||||||
|
|
| ||||||||||
| Industrials — 1.76% |
| |||||||||||
Advanced Drainage Systems, Inc. |
| |||||||||||
6.38% | 06/15/301 | 335,000 | 337,045 | |||||||||
See accompanying Notes to Financial Statements.
| Annual Report March 2024 / 54 |
Table of Contents
Flexible Income Fund
Schedule of Portfolio Investments
March 31, 2024
| Issues | Maturity Date | Principal Amount | Value | |||||||||
CORPORATES (continued) |
| |||||||||||
Industrials (continued) |
| |||||||||||
| Ardagh Packaging Finance PLC/Ardagh Holdings USA, Inc. |
| |||||||||||
(Canada) |
| |||||||||||
4.13% | 08/15/261,2 | $ | 1,107,000 | $ | 1,005,504 | |||||||
5.25% | 08/15/271,2 | 815,000 | 513,999 | |||||||||
BAE Systems Holdings, Inc. |
| |||||||||||
3.85% | 12/15/251 | 250,000 | 244,082 | |||||||||
Berry Global, Inc. |
| |||||||||||
1.65% | 01/15/27 | 40,000 | 36,337 | |||||||||
5.50% | 04/15/28 | 255,000 | 256,864 | |||||||||
5.65% | 01/15/341 | 150,000 | 149,355 | |||||||||
Boeing Co. (The) |
| |||||||||||
5.81% | 05/01/50 | 370,000 | 350,411 | |||||||||
Energizer Holdings, Inc. |
| |||||||||||
4.38% | 03/31/291 | 925,000 | 833,656 | |||||||||
General Electric Co. |
| |||||||||||
(MTN) |
| |||||||||||
(CME Term SOFR 3-Month plus 0.64%) |
| |||||||||||
5.91% | 05/05/263 | 57,000 | 57,168 | |||||||||
(CME Term SOFR 3-Month plus 0.74%) |
| |||||||||||
6.05% | 08/15/363 | 52,000 | 48,298 | |||||||||
Honeywell International, Inc. |
| |||||||||||
3.75% | 03/01/36 | 160,000 | 174,639 | |||||||||
OT Merger Corp. |
| |||||||||||
7.88% | 10/15/291 | 1,350,000 | 973,907 | |||||||||
TransDigm, Inc. |
| |||||||||||
6.75% | 08/15/281 | 1,115,000 | 1,132,210 | |||||||||
Trivium Packaging Finance BV |
| |||||||||||
(Netherlands) |
| |||||||||||
8.50% | 08/15/271,2 | 175,000 | 173,250 | |||||||||
|
|
| ||||||||||
| 6,286,725 | ||||||||||||
|
|
| ||||||||||
Information Technology — 0.64% |
| |||||||||||
Gen Digital, Inc. |
| |||||||||||
6.75% | 09/30/271 | 328,000 | 333,193 | |||||||||
NCR Voyix Corp. |
| |||||||||||
5.00% | 10/01/281 | 550,000 | 513,969 | |||||||||
Netflix, Inc. |
| |||||||||||
5.88% | 02/15/25 | 310,000 | 311,261 | |||||||||
Open Text Corp. |
| |||||||||||
(Canada) |
| |||||||||||
6.90% | 12/01/271,2 | 760,000 | 784,624 | |||||||||
RingCentral, Inc. |
| |||||||||||
8.50% | 08/15/301 | 325,000 | 338,190 | |||||||||
|
|
| ||||||||||
| 2,281,237 | ||||||||||||
|
|
| ||||||||||
Insurance — 0.51% |
| |||||||||||
Acrisure LLC/Acrisure Finance, Inc. |
| |||||||||||
4.25% | 02/15/291 | 175,000 | 158,201 | |||||||||
6.00% | 08/01/291 | 400,000 | 368,000 | |||||||||
Athene Global Funding |
| |||||||||||
1.99% | 08/19/281 | 370,000 | 320,530 | |||||||||
2.72% | 01/07/291 | 95,000 | 83,904 | |||||||||
3.21% | 03/08/271 | 130,000 | 121,553 | |||||||||
Farmers Exchange Capital II |
| |||||||||||
6.15% | 11/01/531,4 | 150,000 | 133,975 | |||||||||
| Issues | Maturity Date | Principal Amount | Value | |||||||||
CORPORATES (continued) |
| |||||||||||
Insurance (continued) |
| |||||||||||
Farmers Exchange Capital III |
| |||||||||||
5.45% | 10/15/541,4 | $ | 85,000 | $ | 70,364 | |||||||
Farmers Insurance Exchange |
| |||||||||||
4.75% | 11/01/571,4 | 135,000 | 100,225 | |||||||||
Metropolitan Life Global Funding I |
| |||||||||||
2.95% | 04/09/301 | 15,000 | 13,321 | |||||||||
Nationwide Mutual Insurance Co. |
| |||||||||||
7.88% | 12/15/241,4 | 375,000 | 375,035 | |||||||||
| Teachers Insurance & Annuity Association of America |
| |||||||||||
4.38% | 09/15/541,4 | 65,000 | 63,966 | |||||||||
|
|
| ||||||||||
| 1,809,074 | ||||||||||||
|
|
| ||||||||||
Materials — 1.01% |
| |||||||||||
ASP Unifrax Holdings, Inc. |
| |||||||||||
5.25% | 09/30/281 | 265,000 | 171,318 | |||||||||
Clearwater Paper Corp. |
| |||||||||||
4.75% | 08/15/281 | 600,000 | 558,619 | |||||||||
Corp. Nacional del Cobre de Chile, |
| |||||||||||
Series REGS |
| |||||||||||
(Chile) |
| |||||||||||
5.13% | 02/02/332 | 200,000 | 190,280 | |||||||||
Herens Holdco SARL |
| |||||||||||
(Luxembourg) |
| |||||||||||
4.75% | 05/15/281,2 | 450,000 | 393,980 | |||||||||
| Indonesia Asahan Aluminium PT/Mineral Industri Indonesia Persero PT, |
| |||||||||||
Series REGS |
| |||||||||||
(Indonesia) |
| |||||||||||
5.45% | 05/15/302 | 200,000 | 197,920 | |||||||||
International Flavors & Fragrances, Inc. |
| |||||||||||
1.83% | 10/15/271 | 405,000 | 359,466 | |||||||||
2.30% | 11/01/301 | 965,000 | 802,066 | |||||||||
3.27% | 11/15/401 | 55,000 | 39,195 | |||||||||
3.47% | 12/01/501 | 45,000 | 30,015 | |||||||||
4.38% | 06/01/47 | 115,000 | 89,164 | |||||||||
5.00% | 09/26/48 | 65,000 | 55,634 | |||||||||
SK Invictus Intermediate II SARL |
| |||||||||||
(Luxembourg) |
| |||||||||||
5.00% | 10/30/291,2 | 250,000 | 223,097 | |||||||||
Valvoline, Inc. |
| |||||||||||
3.63% | 06/15/311 | 550,000 | 474,584 | |||||||||
|
|
| ||||||||||
| 3,585,338 | ||||||||||||
|
|
| ||||||||||
Office REITs — 0.16% |
| |||||||||||
Boston Properties LP |
| |||||||||||
2.75% | 10/01/26 | 10,000 | 9,317 | |||||||||
Hudson Pacific Properties LP |
| |||||||||||
3.25% | 01/15/30 | 510,000 | 393,613 | |||||||||
3.95% | 11/01/27 | 123,000 | 109,080 | |||||||||
4.65% | 04/01/29 | 25,000 | 21,323 | |||||||||
Kilroy Realty LP |
| |||||||||||
2.50% | 11/15/32 | 50,000 | 37,690 | |||||||||
|
|
| ||||||||||
| 571,023 | ||||||||||||
|
|
| ||||||||||
Residential REITs — 0.25% |
| |||||||||||
American Homes 4 Rent LP |
| |||||||||||
3.38% | 07/15/51 | 675,000 | 450,571 | |||||||||
See accompanying Notes to Financial Statements.
| 55 / Annual Report March 2024 |
Table of Contents
Flexible Income Fund
Schedule of Portfolio Investments
March 31, 2024
| Issues | Maturity Date | Principal Amount | Value | |||||||||
CORPORATES (continued) |
| |||||||||||
Residential REITs (continued) |
| |||||||||||
Invitation Homes Operating Partnership LP |
| |||||||||||
2.00% | 08/15/31 | $ | 305,000 | $ | 242,740 | |||||||
2.70% | 01/15/34 | 190,000 | 150,643 | |||||||||
5.50% | 08/15/33 | 60,000 | 59,800 | |||||||||
|
|
| ||||||||||
| 903,754 | ||||||||||||
|
|
| ||||||||||
Retail — 0.91% |
| |||||||||||
| Bloomin’ Brands, Inc./OSI Restaurant Partners LLC |
| |||||||||||
5.13% | 04/15/291 | 743,000 | 692,848 | |||||||||
Ferrellgas LP/Ferrellgas Finance Corp. |
| |||||||||||
5.88% | 04/01/291 | 769,000 | 733,664 | |||||||||
| Fertitta Entertainment, LLC/Fertitta Entertainment Finance Co., Inc. |
| |||||||||||
6.75% | 01/15/301 | 53,000 | 47,832 | |||||||||
FirstCash, Inc. |
| |||||||||||
6.88% | 03/01/321 | 195,000 | 195,218 | |||||||||
LCM Investments Holdings II LLC |
| |||||||||||
8.25% | 08/01/311 | 480,000 | 501,600 | |||||||||
Lithia Motors, Inc. |
| |||||||||||
3.88% | 06/01/291 | 200,000 | 180,850 | |||||||||
Michaels Cos., Inc. (The) |
| |||||||||||
7.88% | 05/01/291 | 745,000 | 559,639 | |||||||||
Raising Cane’s Restaurants LLC |
| |||||||||||
9.38% | 05/01/291 | 320,000 | 346,401 | |||||||||
|
|
| ||||||||||
| 3,258,052 | ||||||||||||
|
|
| ||||||||||
Services — 0.98% |
| |||||||||||
Adtalem Global Education, Inc. |
| |||||||||||
5.50% | 03/01/281 | 992,000 | 950,964 | |||||||||
Global Payments, Inc. |
| |||||||||||
4.88% | 03/17/31 | 200,000 | 228,059 | |||||||||
Hertz Corp. (The) |
| |||||||||||
4.63% | 12/01/261 | 50,000 | 45,532 | |||||||||
5.00% | 12/01/291 | 380,000 | 294,500 | |||||||||
Upbound Group, Inc. |
| |||||||||||
6.38% | 02/15/291 | 300,000 | 291,750 | |||||||||
VT Topco, Inc. |
| |||||||||||
8.50% | 08/15/301 | 560,000 | 591,535 | |||||||||
WASH Multifamily Acquisition, Inc. |
| |||||||||||
5.75% | 04/15/261 | 140,000 | 136,905 | |||||||||
Waste Pro USA, Inc. |
| |||||||||||
5.50% | 02/15/261 | 680,000 | 670,302 | |||||||||
Worldline SA |
| |||||||||||
(France) |
| |||||||||||
0.00% | 07/30/262,11 | 2,800 | 273,963 | |||||||||
|
|
| ||||||||||
| 3,483,510 | ||||||||||||
|
|
| ||||||||||
Specialized REITs — 0.87% |
| |||||||||||
Add Hero Holdings Ltd., |
| |||||||||||
Series IAI |
| |||||||||||
(United Kingdom) |
| |||||||||||
8.50% | 09/30/292,12 | 30,944 | 869 | |||||||||
9.00% | 09/30/302,13 | 23,803 | 595 | |||||||||
9.80% | 09/30/312,14 | 30,944 | 700 | |||||||||
| Issues | Maturity Date | Principal Amount | Value | |||||||||
CORPORATES (continued) |
| |||||||||||
Specialized REITs (continued) |
| |||||||||||
Annington Funding PLC |
| |||||||||||
(EMTN) |
| |||||||||||
(United Kingdom) |
| |||||||||||
2.31% | 10/06/322 | $ | 100,000 | $ | 99,378 | |||||||
3.18% | 07/12/292 | 100,000 | 113,433 | |||||||||
Annington Funding PLC, |
| |||||||||||
(EMTN) |
| |||||||||||
(United Kingdom) |
| |||||||||||
3.69% | 07/12/342 | 100,000 | 107,733 | |||||||||
| Blackstone Property Partners Europe Holdings SARL |
| |||||||||||
(EMTN) |
| |||||||||||
(Luxembourg) |
| |||||||||||
1.00% | 05/04/282 | 195,000 | 182,192 | |||||||||
1.63% | 04/20/302 | 170,000 | 153,222 | |||||||||
1.75% | 03/12/292 | 200,000 | 188,407 | |||||||||
China Aoyuan Group Ltd., |
| |||||||||||
Series IAI |
| |||||||||||
(Cayman Islands) |
| |||||||||||
0.00% | 09/30/282,11 | 4,396 | 88 | |||||||||
5.50% | 09/30/312,8 | 18,038 | 274 | |||||||||
China Aoyuan Group Ltd., |
| |||||||||||
Series IAI (STEP-reset date 09/30/24) |
| |||||||||||
(Cayman Islands) |
| |||||||||||
0.00%2,7 | 49,185 | 984 | ||||||||||
Extra Space Storage LP |
| |||||||||||
2.35% | 03/15/32 | 360,000 | 288,263 | |||||||||
2.40% | 10/15/31 | 71,000 | 58,442 | |||||||||
Greystar Real Estate Partners LLC |
| |||||||||||
7.75% | 09/01/301 | 350,000 | 364,000 | |||||||||
Iron Mountain, Inc. |
| |||||||||||
5.63% | 07/15/321 | 1,240,000 | 1,173,970 | |||||||||
Realty Income Corp. |
| |||||||||||
5.13% | 07/06/34 | 285,000 | 336,303 | |||||||||
Sunac China Holdings Ltd. |
| |||||||||||
(Cayman Islands) |
| |||||||||||
1.00% | 09/30/321,2,5,6,8 | 22,940 | 1,491 | |||||||||
6.00% | 09/30/251,2,5,6,15 | 19,019 | 2,235 | |||||||||
6.25% | 09/30/261,2,5,6,16 | 19,042 | 1,990 | |||||||||
6.50% | 09/30/271,2,5,6,17 | 38,131 | 3,508 | |||||||||
6.75% | 09/30/281,2,5,6,18 | 57,267 | 4,696 | |||||||||
7.00% | 09/30/291,2,5,6,19 | 57,336 | 4,157 | |||||||||
7.25% | 09/30/301,2,5,6,20 | 26,970 | 1,739 | |||||||||
|
|
| ||||||||||
| 3,088,669 | ||||||||||||
|
|
| ||||||||||
Transportation — 0.03% |
| |||||||||||
Delta Air Lines Pass-Through Trust, |
| |||||||||||
Series 2020-1, Class AA |
| |||||||||||
2.00% | 06/10/28 | 19,768 | 17,878 | |||||||||
JetBlue Airways Pass-Through Trust, |
| |||||||||||
Series 2019-1, Class AA |
| |||||||||||
2.75% | 05/15/32 | 24,513 | 21,032 | |||||||||
JetBlue Airways Pass-Through Trust, |
| |||||||||||
Series 2020-1, Class A |
| |||||||||||
4.00% | 11/15/32 | 60,277 | 55,710 | |||||||||
See accompanying Notes to Financial Statements.
| Annual Report March 2024 / 56 |
Table of Contents
Flexible Income Fund
Schedule of Portfolio Investments
March 31, 2024
| Issues | Maturity Date | Principal Amount | Value | |||||||||
CORPORATES (continued) |
| |||||||||||
Transportation (continued) |
| |||||||||||
U.S. Airways Pass-Through Trust, |
| |||||||||||
Series 2012-1, Class A |
| |||||||||||
5.90% | 10/01/24 | $ | 10,196 | $ | 10,196 | |||||||
|
|
| ||||||||||
| 104,816 | ||||||||||||
|
|
| ||||||||||
Water — 0.08% |
| |||||||||||
Thames Water Utilities Finance PLC |
| |||||||||||
(EMTN) |
| |||||||||||
(United Kingdom) |
| |||||||||||
4.38% | 01/18/312 | 300,000 | 302,143 | |||||||||
|
|
| ||||||||||
Total Corporates |
| |||||||||||
(Cost $88,433,906) |
| 86,419,948 | ||||||||||
|
|
| ||||||||||
FOREIGN GOVERNMENT OBLIGATIONS — 1.32% |
| |||||||||||
Foreign Government Obligations — 1.32% |
| |||||||||||
Brazilian Government International Bond |
| |||||||||||
(Brazil) |
| |||||||||||
6.13% | 03/15/342 | 400,000 | 396,280 | |||||||||
Colombia Government International Bond |
| |||||||||||
(Colombia) |
| |||||||||||
8.00% | 04/20/332 | 400,000 | 423,440 | |||||||||
Costa Rica Government International Bond, |
| |||||||||||
Series REGS |
| |||||||||||
(Costa Rica) |
| |||||||||||
6.55% | 04/03/342 | 200,000 | 207,240 | |||||||||
Dominican Republic International Bond, |
| |||||||||||
Series REGS |
| |||||||||||
(Dominican Republic) |
| |||||||||||
4.50% | 01/30/302 | 200,000 | 182,500 | |||||||||
4.88% | 09/23/322 | 200,000 | 179,655 | |||||||||
Finance Department Government of Sharjah |
| |||||||||||
(United Arab Emirates) |
| |||||||||||
6.50% | 11/23/321,2 | 200,000 | 208,020 | |||||||||
Guatemala Government Bond, |
| |||||||||||
Series REGS |
| |||||||||||
(Guam) |
| |||||||||||
3.70% | 10/07/332 | 200,000 | 165,675 | |||||||||
5.25% | 08/10/292 | 300,000 | 291,054 | |||||||||
Hungary Government International Bond |
| |||||||||||
(Hungary) |
| |||||||||||
2.13% | 09/22/311,2 | 400,000 | 318,160 | |||||||||
Mexico Government International Bond |
| |||||||||||
(Mexico) |
| |||||||||||
6.35% | 02/09/352 | 600,000 | 619,860 | |||||||||
Oman Government International Bond, |
| |||||||||||
Series REGS |
| |||||||||||
(Oman) |
| |||||||||||
6.75% | 10/28/272 | 200,000 | 208,400 | |||||||||
Panama Government International Bond |
| |||||||||||
(Panama) |
| |||||||||||
2.25% | 09/29/322 | 200,000 | 143,290 | |||||||||
3.16% | 01/23/302 | 200,000 | 166,688 | |||||||||
Paraguay Government International Bond, |
| |||||||||||
Series REGS |
| |||||||||||
(Papua New Guinea) |
| |||||||||||
4.95% | 04/28/312 | 400,000 | 386,520 | |||||||||
| Issues | Maturity Date | Principal Amount | Value | |||||||||
FOREIGN GOVERNMENT OBLIGATIONS (continued) |
| |||||||||||
Foreign Government Obligations (continued) |
| |||||||||||
| Republic of South Africa Government International Bond |
| |||||||||||
(South Africa) |
| |||||||||||
5.88% | 04/20/322 | $ | 400,000 | $ | 361,024 | |||||||
Romanian Government International Bond |
| |||||||||||
(Romania) |
| |||||||||||
6.63% | 02/17/281,2 | 200,000 | 206,500 | |||||||||
Romanian Government International Bond, |
| |||||||||||
Series REGS |
| |||||||||||
(Romania) |
| |||||||||||
3.00% | 02/14/312 | 300,000 | 252,270 | |||||||||
|
| |||||||||||
Total Foreign Government Obligations |
| |||||||||||
(Cost $4,805,432) |
| 4,716,576 | ||||||||||
|
| |||||||||||
MORTGAGE-BACKED — 49.68%** |
| |||||||||||
Non-Agency Commercial Mortgage-Backed — 6.28% |
| |||||||||||
Banc of America Commercial Mortgage Trust, |
| |||||||||||
Series 2015-UBS7, Class XA (IO) |
| |||||||||||
0.74% | 09/15/484 | 5,697,141 | 42,566 | |||||||||
Banc of America Commercial Mortgage Trust, |
| |||||||||||
Series 2015-UBS7, Class XE (IO) |
| |||||||||||
1.25% | 09/15/481,4 | 500,000 | 6,856 | |||||||||
BB-UBS Trust, |
| |||||||||||
Series 2012-SHOW, Class XA (IO) |
| |||||||||||
0.60% | 11/05/361,4 | 3,109,000 | 6,706 | |||||||||
BB-UBS Trust, |
| |||||||||||
Series 2012-SHOW, Class XB (IO) |
| |||||||||||
0.14% | 11/05/361,4 | 1,395,000 | 957 | |||||||||
Benchmark Mortgage Trust, |
| |||||||||||
Series 2020-B18, Class AGNF |
| |||||||||||
4.14% | 07/15/531 | 529,000 | 481,707 | |||||||||
Blackstone Industrial Portfolio - Proj Foxtrot |
| |||||||||||
2.23% | 04/09/254,5,6 | 196,053 | 191,544 | |||||||||
BX Trust, |
| |||||||||||
Series 2024-BIO, Class D |
| |||||||||||
(CME Term SOFR 1-Month plus 3.64%) |
| |||||||||||
8.96% | 02/15/411,3 | 530,000 | 531,516 | |||||||||
BX, |
| |||||||||||
Series 2021-MFM1, Class B |
| |||||||||||
(CME Term SOFR 1-Month plus 1.06%) |
| |||||||||||
6.39% | 01/15/341,3 | 996,140 | 988,059 | |||||||||
CAMB Commercial Mortgage Trust, |
| |||||||||||
Series 2019-LIFE, Class B |
| |||||||||||
(CME Term SOFR 1-Month plus 1.55%) |
| |||||||||||
6.87% | 12/15/371,3 | 1,050,000 | 1,050,329 | |||||||||
CD Mortgage Trust, |
| |||||||||||
Series 2016-CD1, Class XA (IO) |
| |||||||||||
1.36% | 08/10/494 | 8,895,580 | 206,341 | |||||||||
Century Plaza Towers, |
| |||||||||||
Series 2019-CPT, Class F |
| |||||||||||
3.00% | 11/13/391,4 | 450,000 | 271,040 | |||||||||
Citigroup Commercial Mortgage Trust, |
| |||||||||||
Series 2014-GC25, Class XA (IO) |
| |||||||||||
0.94% | 10/10/474 | 13,428,335 | 34,935 | |||||||||
Citigroup Commercial Mortgage Trust, |
| |||||||||||
Series 2015-GC27, Class XA (IO) |
| |||||||||||
1.30% | 02/10/484 | 1,489,106 | 7,503 | |||||||||
See accompanying Notes to Financial Statements.
| 57 / Annual Report March 2024 |
Table of Contents
Flexible Income Fund
Schedule of Portfolio Investments
March 31, 2024
| Issues | Maturity Date | Principal Amount | Value | |||||||||
MORTGAGE-BACKED (continued) |
| |||||||||||
Non-Agency Commercial Mortgage-Backed (continued) |
| |||||||||||
Citigroup Commercial Mortgage Trust, |
| |||||||||||
Series 2016-GC36, Class XA (IO) |
| |||||||||||
1.21% | 02/10/494 | $ | 5,365,370 | $ | 88,605 | |||||||
Citigroup Commercial Mortgage Trust, |
| |||||||||||
Series 2017-B1, Class XF (IO) |
| |||||||||||
0.81% | 08/15/501,4 | 11,628,000 | 281,121 | |||||||||
Citigroup Commercial Mortgage Trust, |
| |||||||||||
Series 2020-555, Class A |
| |||||||||||
2.65% | 12/10/411 | 1,450,000 | 1,236,083 | |||||||||
| Commercial Mortgage Lease-Backed Certificates-1, |
| |||||||||||
Series 2001-CMLB, Class X (IO) |
| |||||||||||
1.57% | 06/20/311,4 | 517,277 | 1,841 | |||||||||
Commercial Mortgage Trust, |
| |||||||||||
Series 2012-CR4, Class XA (IO) |
| |||||||||||
1.14% | 10/15/454 | 160,043 | 17 | |||||||||
Commercial Mortgage Trust, |
| |||||||||||
Series 2012-LC4, Class XB (IO) |
| |||||||||||
0.44% | 12/10/441,4 | 1,404,407 | 50 | |||||||||
Commercial Mortgage Trust, |
| |||||||||||
Series 2014-CR19, Class XA (IO) |
| |||||||||||
0.79% | 08/10/474 | 700,782 | 959 | |||||||||
Commercial Mortgage Trust, |
| |||||||||||
Series 2014-CR19, Class XC (IO) |
| |||||||||||
0.75% | 08/10/471,4 | 1,200,000 | 3,097 | |||||||||
Commercial Mortgage Trust, |
| |||||||||||
Series 2014-UBS3, Class XA (IO) |
| |||||||||||
0.99% | 06/10/474 | 1,850,457 | 162 | |||||||||
Commercial Mortgage Trust, |
| |||||||||||
Series 2014-UBS5, Class XA (IO) |
| |||||||||||
0.78% | 09/10/474,5,6 | 25,625,157 | 25,320 | |||||||||
Commercial Mortgage Trust, |
| |||||||||||
Series 2014-UBS6, Class XA (IO) |
| |||||||||||
0.81% | 12/10/474 | 10,712,766 | 19,945 | |||||||||
Commercial Mortgage Trust, |
| |||||||||||
Series 2015-CR22, Class XA (IO) |
| |||||||||||
0.81% | 03/10/484 | 9,713,210 | 40,414 | |||||||||
Commercial Mortgage Trust, |
| |||||||||||
Series 2015-CR25, Class XA (IO) |
| |||||||||||
0.79% | 08/10/484 | 7,586,975 | 59,798 | |||||||||
Commercial Mortgage Trust, |
| |||||||||||
Series 2015-LC21, Class XE (IO) |
| |||||||||||
1.07% | 07/10/481,4 | 10,015,000 | 125,032 | |||||||||
Commercial Mortgage Trust, |
| |||||||||||
Series 2016-CR28, Class XA (IO) |
| |||||||||||
0.67% | 02/10/494 | 13,864,972 | 125,780 | |||||||||
Credit Suisse Mortgage Capital Trust, |
| |||||||||||
Series 2021-980M, Class A |
| |||||||||||
2.39% | 07/15/311 | 1,550,000 | 1,418,053 | |||||||||
CSAIL Commercial Mortgage Trust, |
| |||||||||||
Series 2015-C2, Class XA (IO) |
| |||||||||||
0.71% | 06/15/574 | 16,087,427 | 90,461 | |||||||||
CSAIL Commercial Mortgage Trust, |
| |||||||||||
Series 2019-C16, Class XA (IO) |
| |||||||||||
1.54% | 06/15/524 | 558,488 | 32,539 | |||||||||
| Issues | Maturity Date | Principal Amount | Value | |||||||||
MORTGAGE-BACKED (continued) |
| |||||||||||
Non-Agency Commercial Mortgage-Backed (continued) |
| |||||||||||
DBJPM 16-C1 Mortgage Trust, |
| |||||||||||
Series 2016-C1, Class XA (IO) |
| |||||||||||
1.36% | 05/10/494 | $ | 8,594,473 | $ | 163,709 | |||||||
DBUBS Mortgage Trust, |
| |||||||||||
Series 2017-BRBK, Class F |
| |||||||||||
3.53% | 10/10/341,4 | 380,000 | 296,217 | |||||||||
Extended Stay America Trust, |
| |||||||||||
Series 2021-ESH, Class F |
| |||||||||||
(CME Term SOFR 1-Month plus 3.81%) |
| |||||||||||
9.14% | 07/15/381,3 | 548,553 | 548,917 | |||||||||
Great Wolf Trust, |
| |||||||||||
Series 2019-WOLF, Class C |
| |||||||||||
(CME Term SOFR 1-Month plus 1.95%) |
| |||||||||||
7.27% | 12/15/361,3 | 675,529 | 672,857 | |||||||||
Great Wolf Trust, |
| |||||||||||
Series 2019-WOLF, Class E |
| |||||||||||
(CME Term SOFR 1-Month plus 3.05%) |
| |||||||||||
8.37% | 12/15/361,3 | 732,335 | 730,915 | |||||||||
GS Mortgage Securities Trust, |
| |||||||||||
Series 2010-C1, Class X (IO) |
| |||||||||||
0.44% | 08/10/431,4 | 5,178,802 | 4,466 | |||||||||
GS Mortgage Securities Trust, |
| |||||||||||
Series 2011-GC5, Class XA (IO) |
| |||||||||||
0.09% | 08/10/441,4 | 482,271 | 3 | |||||||||
GS Mortgage Securities Trust, |
| |||||||||||
Series 2015-GC32, Class XA (IO) |
| |||||||||||
0.68% | 07/10/484 | 30,446,717 | 198,717 | |||||||||
GS Mortgage Securities Trust, |
| |||||||||||
Series 2015-GC34, Class XA (IO) |
| |||||||||||
1.19% | 10/10/484 | 5,061,318 | 67,463 | |||||||||
GS Mortgage Securities Trust, |
| |||||||||||
Series 2015-GS1, Class XA (IO) |
| |||||||||||
0.75% | 11/10/484 | 9,017,204 | 86,113 | |||||||||
GS Mortgage Securities Trust, |
| |||||||||||
Series 2016-GS2, Class XA (IO) |
| |||||||||||
1.73% | 05/10/494 | 247,313 | 6,284 | |||||||||
GS Mortgage Securities Trust, |
| |||||||||||
Series 2016-GS4, Class XA (IO) |
| |||||||||||
0.56% | 11/10/494 | 14,552,956 | 166,062 | |||||||||
GSCG Trust, |
| |||||||||||
Series 2019-600C, Class G |
| |||||||||||
3.99% | 09/06/341,4 | 285,000 | 5,732 | |||||||||
JPMBB Commercial Mortgage Securities Trust, |
| |||||||||||
Series 2014-C19, Class XA (IO) |
| |||||||||||
0.47% | 04/15/474 | 2,425,836 | 630 | |||||||||
JPMBB Commercial Mortgage Securities Trust, |
| |||||||||||
Series 2015-C30, Class XA (IO) |
| |||||||||||
0.42% | 07/15/484 | 22,311,108 | 92,881 | |||||||||
JPMBB Commercial Mortgage Securities Trust, |
| |||||||||||
Series 2015-C30, Class XNR (IO) |
| |||||||||||
0.25% | 07/15/481,4 | 44,724,406 | 111,909 | |||||||||
JPMBB Commercial Mortgage Securities Trust, |
| |||||||||||
Series 2015-C31, Class XA (IO) |
| |||||||||||
0.80% | 08/15/484 | 5,933,609 | 49,779 | |||||||||
See accompanying Notes to Financial Statements.
| Annual Report March 2024 / 58 |
Table of Contents
Flexible Income Fund
Schedule of Portfolio Investments
March 31, 2024
| Issues | Maturity Date | Principal Amount | Value | |||||||||||
MORTGAGE-BACKED (continued) |
| |||||||||||||
Non-Agency Commercial Mortgage-Backed (continued) |
| |||||||||||||
JPMCC Commercial Mortgage Securities Trust, |
| |||||||||||||
Series 2017-JP5, Class XA (IO) |
| |||||||||||||
0.81% | 03/15/50 | 4 | $ | 4,149,528 | $ | 71,899 | ||||||||
JPMDB Commercial Mortgage Securities Trust, |
| |||||||||||||
Series 2016-C2, Class XA (IO) |
| |||||||||||||
1.48% | 06/15/49 | 4 | 240,083 | 5,224 | ||||||||||
| JPMorgan Chase Commercial Mortgage Securities Trust, |
| |||||||||||||
Series 2012-CBX, Class XB (IO) |
| |||||||||||||
0.46% | 06/15/45 | 1,4 | 52,057,999 | 958,487 | ||||||||||
| JPMorgan Chase Commercial Mortgage Securities Trust, |
| |||||||||||||
Series 2013-LC11, Class XA (IO) |
| |||||||||||||
0.90% | 04/15/46 | 4 | 122,144 | 574 | ||||||||||
| JPMorgan Chase Commercial Mortgage Securities Trust, |
| |||||||||||||
Series 2019-COR4, Class A3 |
| |||||||||||||
3.76% | 03/10/52 | 500,000 | 471,963 | |||||||||||
| JPMorgan Chase Commercial Mortgage Securities Trust, |
| |||||||||||||
Series 2020-ACE, Class XA (IO) |
| |||||||||||||
0.34% | 01/10/37 | 1,4 | 2,000,000 | 3,953 | ||||||||||
| JPMorgan Chase Commercial Mortgage Securities Trust, |
| |||||||||||||
Series 2020-LOOP, Class XB (IO) |
| |||||||||||||
0.25% | 12/05/38 | 1,4 | 2,010,000 | 12,517 | ||||||||||
| JPMorgan Chase Commercial Mortgage Securities Trust, |
| |||||||||||||
Series 2020-NNN, Class XAFX (IO) |
| |||||||||||||
1.88% | 01/16/37 | 1,4 | 450,000 | 4,782 | ||||||||||
| JPMorgan Chase Commercial Mortgage Securities Trust, |
| |||||||||||||
Series 2020-NNN, Class XBFX (IO) |
| |||||||||||||
0.57% | 01/16/37 | 1,4 | 1,450,000 | 11,788 | ||||||||||
Last Mile Logistics Pan Euro Finance DAC, |
| |||||||||||||
Series 1A, Class F |
| |||||||||||||
(Ireland) |
| |||||||||||||
(3-Month Euribor plus 3.65%) |
| |||||||||||||
7.57% | 08/17/33 | 1,2,3 | 490,928 | 503,520 | ||||||||||
Med Trust, |
| |||||||||||||
Series 2021-MDLN, Class G |
| |||||||||||||
(CME Term SOFR 1-Month plus 5.36%) |
| |||||||||||||
10.69% | 11/15/38 | 1,3 | 417,994 | 418,419 | ||||||||||
| Morgan Stanley Bank of America Merrill Lynch Trust, |
| |||||||||||||
Series 2012-C5, Class XC (IO) |
| |||||||||||||
0.06% | 08/15/45 | 1,4 | 24,069,383 | 100,219 | ||||||||||
| Morgan Stanley Bank of America Merrill Lynch Trust, |
| |||||||||||||
Series 2012-CKSV, Class XA (IO) |
| |||||||||||||
1.01% | 10/15/30 | 1,4 | 972,574 | 10,765 | ||||||||||
| Morgan Stanley Bank of America Merrill Lynch Trust, |
| |||||||||||||
Series 2013-C12, Class XC (IO) |
| |||||||||||||
2.34% | 10/15/46 | 1,4 | 19,087,479 | 34,941 | ||||||||||
| Morgan Stanley Bank of America Merrill Lynch Trust, |
| |||||||||||||
Series 2014-C18, Class XA (IO) |
| |||||||||||||
0.56% | 10/15/47 | 4 | 83,686 | 24 | ||||||||||
| Morgan Stanley Bank of America Merrill Lynch Trust, |
| |||||||||||||
Series 2015-C21, Class XA (IO) |
| |||||||||||||
0.83% | 03/15/48 | 4 | 3,032,943 | 10,407 | ||||||||||
| Morgan Stanley Bank of America Merrill Lynch Trust, |
| |||||||||||||
Series 2015-C22, Class XA (IO) |
| |||||||||||||
0.99% | 04/15/48 | 4 | 1,028,502 | 5,227 | ||||||||||
| Issues | Maturity Date | Principal Amount | Value | |||||||||||||
MORTGAGE-BACKED (continued) |
| |||||||||||||||
Non-Agency Commercial Mortgage-Backed (continued) |
| |||||||||||||||
| Morgan Stanley Bank of America Merrill Lynch Trust, |
| |||||||||||||||
Series 2015-C24, Class XA (IO) |
| |||||||||||||||
0.68% |
| 05/15/48 | 4 | $ | 6,696,656 | $ | 40,829 | |||||||||
Morgan Stanley Capital I Trust, |
| |||||||||||||||
Series 2011-C2, Class XB (IO) |
| |||||||||||||||
0.46% |
| 06/15/44 | 1,4 | 10,808,573 | 37,912 | |||||||||||
Natixis Commercial Mortgage Securities Trust, |
| |||||||||||||||
Series 2018-ALXA, Class E |
| |||||||||||||||
4.32% |
| 01/15/43 | 1,4 | 100,000 | 54,099 | |||||||||||
Natixis Commercial Mortgage Securities Trust, |
| |||||||||||||||
Series 2019-FAME, Class D |
| |||||||||||||||
4.40% |
| 08/15/36 | 1,4 | 665,000 | 407,312 | |||||||||||
Natixis Commercial Mortgage Securities Trust, |
| |||||||||||||||
Series 2019-FAME, Class E |
| |||||||||||||||
4.40% |
| 08/15/36 | 1,4 | 395,000 | 202,417 | |||||||||||
NRTH Mortgage Trust, |
| |||||||||||||||
Series 2024-PARK, Class A |
| |||||||||||||||
(CME Term SOFR 1-Month plus 1.64%) |
| |||||||||||||||
6.94% |
| 03/15/41 | 1,3 | 701,000 | 703,497 | |||||||||||
SFAVE Commercial Mortgage Securities Trust, |
| |||||||||||||||
Series 2015-5AVE, Class A2A |
| |||||||||||||||
3.66% |
| 01/05/43 | 1,4 | 400,000 | 291,971 | |||||||||||
SFAVE Commercial Mortgage Securities Trust, |
| |||||||||||||||
Series 2015-5AVE, Class A2B |
| |||||||||||||||
4.14% |
| 01/05/43 | 1,4 | 460,000 | 339,051 | |||||||||||
SFAVE Commercial Mortgage Securities Trust, |
| |||||||||||||||
Series 2015-5AVE, Class C |
| |||||||||||||||
4.39% |
| 01/05/43 | 1,4 | 925,000 | 536,904 | |||||||||||
SMRT, |
| |||||||||||||||
Series 2022-MINI, Class F |
| |||||||||||||||
(CME Term SOFR 1-Month plus 3.35%) |
| |||||||||||||||
8.68% |
| 01/15/39 | 1,3 | 570,000 | 544,192 | |||||||||||
SREIT Trust, |
| |||||||||||||||
Series 2021-MFP2, Class C |
| |||||||||||||||
(CME Term SOFR 1-Month plus 1.49%) |
| |||||||||||||||
6.81% |
| 11/15/36 | 1,3 | 1,060,000 | 1,052,325 | |||||||||||
Taurus UK DAC, |
| |||||||||||||||
Series 2021-UK1A, Class D |
| |||||||||||||||
(Ireland) | ||||||||||||||||
(SONIA plus 2.60%) |
| |||||||||||||||
7.82% |
| 05/17/31 | 1,2,3 | 471,537 | 586,112 | |||||||||||
TPGI Trust, |
| |||||||||||||||
Series 2021-DGWD, Class E |
| |||||||||||||||
(CME Term SOFR 1-Month plus 2.46%) |
| |||||||||||||||
7.79% |
| 06/15/26 | 1,3 | 1,056,000 | 1,054,713 | |||||||||||
UBS Commercial Mortgage Trust, |
| |||||||||||||||
Series 2017-C4, Class XA (IO) |
| |||||||||||||||
1.09% |
| 10/15/50 | 4 | 8,088,616 | 237,411 | |||||||||||
WB Commercial Mortgage Trust, |
| |||||||||||||||
Series 2024-HQ, Class B |
| |||||||||||||||
6.63% |
| 03/15/40 | 1,4 | 1,049,000 | 1,055,177 | |||||||||||
Wells Fargo Commercial Mortgage Trust, |
| |||||||||||||||
Series 2014-LC16, Class XA (IO) |
| |||||||||||||||
0.97% |
| 08/15/50 | 4 | 6,141,213 | 4,585 | |||||||||||
See accompanying Notes to Financial Statements.
| 59 / Annual Report March 2024 |
Table of Contents
Flexible Income Fund
Schedule of Portfolio Investments
March 31, 2024
| Issues | Maturity Date | Principal Amount | Value | |||||||||||||
MORTGAGE-BACKED (continued) |
| |||||||||||||||
Non-Agency Commercial Mortgage-Backed (continued) |
| |||||||||||||||
| Wells Fargo Commercial Mortgage Trust, |
| |||||||||||||||
| Series 2014-LC18, Class XA (IO) |
| |||||||||||||||
1.01% | 12/15/47 | 4 | $ | 1,244,424 | $ | 5,169 | ||||||||||
| Wells Fargo Commercial Mortgage Trust, |
| |||||||||||||||
| Series 2015-C27, Class XA (IO) |
| |||||||||||||||
0.81% | 02/15/48 | 4 | 15,586,935 | 61,194 | ||||||||||||
| Wells Fargo Commercial Mortgage Trust, |
| |||||||||||||||
| Series 2015-C31, Class XA (IO) |
| |||||||||||||||
0.95% | 11/15/48 | 4 | 16,807,349 | 179,825 | ||||||||||||
| Wells Fargo Commercial Mortgage Trust, |
| |||||||||||||||
| Series 2015-LC20, Class XF (IO) |
| |||||||||||||||
1.74% | 04/15/50 | 1,4 | 415,000 | 8,157 | ||||||||||||
| Wells Fargo Commercial Mortgage Trust, |
| |||||||||||||||
| Series 2015-NXS3, Class XA (IO) |
| |||||||||||||||
0.87% | 09/15/57 | 4 | 9,074,592 | 88,497 | ||||||||||||
| Wells Fargo Commercial Mortgage Trust, |
| |||||||||||||||
| Series 2016-C34, Class XA (IO) |
| |||||||||||||||
2.06% | 06/15/49 | 4 | 5,880,366 | 150,128 | ||||||||||||
| Wells Fargo Commercial Mortgage Trust, |
| |||||||||||||||
| Series 2018-C47, Class AS |
| |||||||||||||||
4.67% | 09/15/61 | 4 | 1,100,000 | 1,062,153 | ||||||||||||
| Westfield Galleria at Roseville |
| |||||||||||||||
8.40% | 03/29/25 | 5,6 | 495,000 | 494,505 | ||||||||||||
| WF-RBS Commercial Mortgage Trust, |
| |||||||||||||||
| Series 2012-C10, Class XB (IO) |
| |||||||||||||||
0.40% | 12/15/45 | 1,4 | 46,428,757 | 1,811 | ||||||||||||
| WF-RBS Commercial Mortgage Trust, |
| |||||||||||||||
| Series 2014-C20, Class XA (IO) |
| |||||||||||||||
0.78% | 05/15/47 | 4 | 4,730,175 | 2,653 | ||||||||||||
| WF-RBS Commercial Mortgage Trust, |
| |||||||||||||||
| Series 2014-C22, Class XA (IO) |
| |||||||||||||||
0.76% | 09/15/57 | 4 | 1,648,372 | 1,221 | ||||||||||||
| WF-RBS Commercial Mortgage Trust, |
| |||||||||||||||
| Series 2014-C24, Class XA (IO) |
| |||||||||||||||
0.83% | 11/15/47 | 4 | 5,917,326 | 11,135 | ||||||||||||
|
|
| ||||||||||||||
| 22,411,654 | ||||||||||||||||
|
|
| ||||||||||||||
| Non-Agency Mortgage-Backed — 20.66% |
| |||||||||||||||
| Alternative Loan Trust, |
| |||||||||||||||
| Series 2004-30CB, Class 1A6 |
| |||||||||||||||
5.50% | 02/25/35 | 943,927 | 881,763 | |||||||||||||
| Alternative Loan Trust, |
| |||||||||||||||
| Series 2005-10CB, Class 1A8 |
| |||||||||||||||
5.50% | 05/25/35 | 1,484,738 | 1,216,142 | |||||||||||||
| Alternative Loan Trust, |
| |||||||||||||||
| Series 2005-46CB, Class A3 |
| |||||||||||||||
5.50% | 10/25/35 | 242,113 | 174,486 | |||||||||||||
| Alternative Loan Trust, |
| |||||||||||||||
| Series 2005-46CB, Class A4 |
| |||||||||||||||
5.25% | 10/25/35 | 182,950 | 129,271 | |||||||||||||
| Alternative Loan Trust, |
| |||||||||||||||
| Series 2005-46CB, Class A7 |
| |||||||||||||||
5.50% | 10/25/35 | 516,089 | 371,935 | |||||||||||||
| Alternative Loan Trust, |
| |||||||||||||||
| Series 2005-55CB, Class 1A1 |
| |||||||||||||||
5.50% | 11/25/35 | 186,847 | 124,562 | |||||||||||||
| Issues | Maturity Date | Principal Amount | Value | |||||||||||||
MORTGAGE-BACKED (continued) |
| |||||||||||||||
Non-Agency Mortgage-Backed (continued) |
| |||||||||||||||
| Alternative Loan Trust, |
| |||||||||||||||
| Series 2005-64CB, Class 2A1 |
| |||||||||||||||
6.00% | 11/25/35 | $ | 2,988,508 | $ | 455,777 | |||||||||||
| Alternative Loan Trust, |
| |||||||||||||||
| Series 2005-65CB, Class 2A4 |
| |||||||||||||||
5.50% | 12/25/35 | 309,731 | 217,913 | |||||||||||||
| Alternative Loan Trust, |
| |||||||||||||||
| Series 2005-67CB, Class A1 |
| |||||||||||||||
5.50% | 01/25/36 | 60,280 | 46,413 | |||||||||||||
| Alternative Loan Trust, |
| |||||||||||||||
| Series 2005-74T1, Class A5 |
| |||||||||||||||
6.00% | 01/25/36 | 482,767 | 274,362 | |||||||||||||
| Alternative Loan Trust, |
| |||||||||||||||
| Series 2005-7CB, Class 2A2 (IO) |
| |||||||||||||||
| (-1.00 X CME Term SOFR 1-Month plus 4.94%, 5.05% Cap) |
| |||||||||||||||
0.20% | 03/01/38 | 3,5,6 | 1,304,773 | 43,858 | ||||||||||||
| Alternative Loan Trust, |
| |||||||||||||||
| Series 2005-86CB, Class A1 |
| |||||||||||||||
5.50% | 02/25/36 | 524,713 | 324,388 | |||||||||||||
| Alternative Loan Trust, |
| |||||||||||||||
| Series 2005-86CB, Class A8 |
| |||||||||||||||
5.50% | 02/25/36 | 239,869 | 148,292 | |||||||||||||
| Alternative Loan Trust, |
| |||||||||||||||
| Series 2006-19CB, Class A15 |
| |||||||||||||||
6.00% | 08/25/36 | 117,463 | 67,924 | |||||||||||||
| Alternative Loan Trust, |
| |||||||||||||||
| Series 2006-19CB, Class A17 |
| |||||||||||||||
| (CME Term SOFR 1-Month plus 0.51%) |
| |||||||||||||||
5.84% | 08/25/36 | 3 | 3,895,002 | 1,795,216 | ||||||||||||
| Alternative Loan Trust, |
| |||||||||||||||
| Series 2006-19CB, Class A18 (IO) |
| |||||||||||||||
| (-1.00 X CME Term SOFR 1-Month plus 5.49%, 5.60% Cap) |
| |||||||||||||||
0.16% | 08/25/36 | 3,5,6 | 3,759,972 | 342,271 | ||||||||||||
| Alternative Loan Trust, |
| |||||||||||||||
| Series 2006-32CB, Class A18 |
| |||||||||||||||
6.00% | 11/25/36 | 132,818 | 79,051 | |||||||||||||
| Alternative Loan Trust, |
| |||||||||||||||
| Series 2006-34, Class A5 |
| |||||||||||||||
6.25% | 11/25/46 | 1,254,330 | 613,792 | |||||||||||||
| Alternative Loan Trust, |
| |||||||||||||||
| Series 2006-J1, Class 1A11 |
| |||||||||||||||
5.50% | 02/25/36 | 187,174 | 129,079 | |||||||||||||
| Alternative Loan Trust, |
| |||||||||||||||
| Series 2007-13, Class A1 |
| |||||||||||||||
6.00% | 06/25/47 | 270,422 | 139,882 | |||||||||||||
| Alternative Loan Trust, |
| |||||||||||||||
| Series 2007-15CB, Class A6 |
| |||||||||||||||
5.75% | 07/25/37 | 538,121 | 314,057 | |||||||||||||
| Alternative Loan Trust, |
| |||||||||||||||
| Series 2007-15CB, Class A7 |
| |||||||||||||||
6.00% | 07/25/37 | 1,916,614 | 1,160,633 | |||||||||||||
| Alternative Loan Trust, |
| |||||||||||||||
| Series 2007-16CB, Class 1A7 |
| |||||||||||||||
6.00% | 08/25/37 | 6,728 | 5,113 | |||||||||||||
See accompanying Notes to Financial Statements.
| Annual Report March 2024 / 60 |
Table of Contents
Flexible Income Fund
Schedule of Portfolio Investments
March 31, 2024
| Issues | Maturity Date | Principal Amount | Value | |||||||||||||
MORTGAGE-BACKED (continued) |
| |||||||||||||||
Non-Agency Mortgage-Backed (continued) |
| |||||||||||||||
Alternative Loan Trust, |
| |||||||||||||||
Series 2007-18CB, Class 2A25 |
| |||||||||||||||
6.00% | 08/25/37 | $ | 311,014 | $ | 191,791 | |||||||||||
Alternative Loan Trust, |
| |||||||||||||||
Series 2007-22, Class 2A16 |
| |||||||||||||||
6.50% | 09/25/37 | 237,879 | 91,558 | |||||||||||||
Alternative Loan Trust, |
| |||||||||||||||
Series 2007-5CB, Class 1A3 |
| |||||||||||||||
6.00% | 04/25/37 | 175,186 | 95,408 | |||||||||||||
Alternative Loan Trust, |
| |||||||||||||||
Series 2007-5CB, Class 1A4 |
| |||||||||||||||
6.00% | 04/25/37 | 516,831 | 281,498 | |||||||||||||
American Home Mortgage Assets Trust, |
| |||||||||||||||
Series 2006-6, Class XP (IO) (PO) |
| |||||||||||||||
0.05% | 12/25/46 | 4,5,6 | 20,730,521 | 137,197 | ||||||||||||
American Home Mortgage Assets Trust, |
| |||||||||||||||
Series 2007-1, Class A1 |
| |||||||||||||||
| (Federal Reserve US 12-Month Cumulative Average plus 0.70%) |
| |||||||||||||||
5.79% | 02/25/47 | 3 | 2,237,178 | 869,300 | ||||||||||||
American Home Mortgage Assets Trust, |
| |||||||||||||||
Series 2007-5, Class XP (IO) (PO) |
| |||||||||||||||
0.07% | 06/25/47 | 4,5,6 | 12,543 | 127 | ||||||||||||
Banc of America Alternative Loan Trust, |
| |||||||||||||||
Series 2006-5, Class CB8 |
| |||||||||||||||
(CME Term SOFR 1-Month plus 0.42%) |
| |||||||||||||||
5.75% | 06/25/46 | 3 | 1,654,366 | 1,312,040 | ||||||||||||
Banc of America Alternative Loan Trust, |
| |||||||||||||||
Series 2006-5, Class CB9 (IO) |
| |||||||||||||||
| (-1.00 X CME Term SOFR 1-Month plus 6.58%, 6.69% Cap) |
| |||||||||||||||
1.25% | 06/25/46 | 3,5,6 | 1,654,376 | 129,319 | ||||||||||||
Banc of America Funding Trust, |
| |||||||||||||||
Series 2006-3, Class 5A3 |
| |||||||||||||||
5.50% | 03/25/36 | 4,667 | 4,065 | |||||||||||||
Banc of America Funding Trust, |
| |||||||||||||||
| Series 2006-7, Class T2A5 (STEP-reset date 05/25/24) |
| |||||||||||||||
6.54% | 10/25/36 | 677,172 | 574,355 | |||||||||||||
Banc of America Funding Trust, |
| |||||||||||||||
Series 2014-R5, Class 1A2 |
| |||||||||||||||
(TSFR6M plus 1.93%) |
| |||||||||||||||
3.99% | 09/26/45 | 1,3 | 1,100,496 | 793,313 | ||||||||||||
Banc of America Funding Trust, |
| |||||||||||||||
Series 2015-R4, Class 5A1 |
| |||||||||||||||
(CME Term SOFR 1-Month plus 0.26%) |
| |||||||||||||||
5.59% | 10/25/36 | 1,3 | 3,159 | 3,144 | ||||||||||||
BCAP LLC Trust, |
| |||||||||||||||
Series 2007-AA2, Class 2A12 |
| |||||||||||||||
5.50% | 04/25/37 | 2,431,642 | 1,073,280 | |||||||||||||
Bear Stearns ALT-A Trust, |
| |||||||||||||||
Series 2005-7, Class 22A1 |
| |||||||||||||||
4.87% | 09/25/35 | 4 | 132,721 | 78,734 | ||||||||||||
Bear Stearns ARM Trust, |
| |||||||||||||||
Series 2004-3, Class 2A |
| |||||||||||||||
4.23% | 07/25/34 | 4 | 5,423 | 5,095 | ||||||||||||
| Issues | Maturity Date | Principal Amount | Value | |||||||||||||
MORTGAGE-BACKED (continued) |
| |||||||||||||||
Non-Agency Mortgage-Backed (continued) |
| |||||||||||||||
| Bear Stearns ARM Trust, |
| |||||||||||||||
| Series 2005-10, Class A3 |
| |||||||||||||||
5.80% | 10/25/35 | 4 | $ | 115,241 | $ | 109,564 | ||||||||||
| Bombardier Capital Mortgage Securitization Corp., |
| |||||||||||||||
| Series 1999-B, Class A2 |
| |||||||||||||||
6.98% | 12/15/29 | 4 | 997,492 | 101,907 | ||||||||||||
| Bombardier Capital Mortgage Securitization Corp., |
| |||||||||||||||
| Series 2000-A, Class A3 |
| |||||||||||||||
7.83% | 06/15/30 | 4 | 1,658,345 | 169,287 | ||||||||||||
| Bombardier Capital Mortgage Securitization Corp., |
| |||||||||||||||
| Series 2000-A, Class A4 |
| |||||||||||||||
8.29% | 06/15/30 | 4 | 142,144 | 16,983 | ||||||||||||
| BRAVO Residential Funding Trust, |
| |||||||||||||||
| Series 2021-A, Class A1 (STEP-reset date 04/25/24) |
| |||||||||||||||
4.99% | 10/25/59 | 1 | 1,467,276 | 1,447,917 | ||||||||||||
| Cascade MH Asset Trust, |
| |||||||||||||||
| Series 2022-MH1, Class A (STEP-reset date 05/25/24) |
| |||||||||||||||
4.25% | 08/25/54 | 1 | 1,197,431 | 1,089,228 | ||||||||||||
| CHNGE Mortgage Trust, |
| |||||||||||||||
| Series 2023-1, Class M1 |
| |||||||||||||||
8.30% | 03/25/58 | 1,4 | 580,000 | 595,355 | ||||||||||||
| CIM Trust, |
| |||||||||||||||
| Series 2021-NR2, Class A1 (STEP-reset date 05/25/24) |
| |||||||||||||||
5.57% | 07/25/59 | 1 | 330,152 | 327,107 | ||||||||||||
| CIM Trust, |
| |||||||||||||||
| Series 2021-NR4, Class A1 (STEP-reset date 05/25/24) |
| |||||||||||||||
2.82% | 10/25/61 | 1 | 815,424 | 791,574 | ||||||||||||
| CIM Trust, |
| |||||||||||||||
| Series 2021-R5, Class A1B |
| |||||||||||||||
2.00% | 08/25/61 | 1,4 | 681,000 | 444,144 | ||||||||||||
| CIM Trust, |
| |||||||||||||||
| Series 2022-NR1, Class A1 (STEP-reset date 05/25/24) |
| |||||||||||||||
5.00% | 07/25/62 | 1 | 298,855 | 290,928 | ||||||||||||
| CIM Trust, |
| |||||||||||||||
| Series 2023-NR1, Class A1 (STEP-reset date 05/25/24) |
| |||||||||||||||
6.00% | 06/25/62 | 1 | 1,531,257 | 1,510,221 | ||||||||||||
| CIT Mortgage Loan Trust, |
| |||||||||||||||
| Series 2007-1, Class 1M2 |
| |||||||||||||||
| (CME Term SOFR 1-Month plus 1.86%) |
| |||||||||||||||
7.19% | 10/25/37 | 1,3 | 1,046,000 | 964,523 | ||||||||||||
| Citigroup Mortgage Loan Trust, |
| |||||||||||||||
| Series 2006-WF1, Class A2C (STEP-reset date 05/25/24) |
| |||||||||||||||
4.57% | 03/25/36 | 29,261 | 13,965 | |||||||||||||
| Citigroup Mortgage Loan Trust, |
| |||||||||||||||
| Series 2009-10, Class 2A2 |
| |||||||||||||||
7.00% | 12/25/35 | 1,4 | 516,029 | 359,748 | ||||||||||||
| Citigroup Mortgage Loan Trust, Inc., |
| |||||||||||||||
| Series 2005-WF2, Class AF6A (STEP-reset date 05/25/24) |
| |||||||||||||||
6.13% | 08/25/35 | 1,541,673 | 1,381,137 | |||||||||||||
| CitiMortgage Alternative Loan Trust, |
| |||||||||||||||
| Series 2005-A1, Class 1A5 |
| |||||||||||||||
5.50% | 07/25/35 | 1,501,622 | 1,353,074 | |||||||||||||
| CitiMortgage Alternative Loan Trust, |
| |||||||||||||||
| Series 2006-A1, Class 1A5 |
| |||||||||||||||
5.50% | 04/25/36 | 242,880 | 217,687 | |||||||||||||
See accompanying Notes to Financial Statements.
| 61 / Annual Report March 2024 |
Table of Contents
Flexible Income Fund
Schedule of Portfolio Investments
March 31, 2024
| Issues | Maturity Date | Principal Amount | Value | |||||||||||||
MORTGAGE-BACKED (continued) |
| |||||||||||||||
Non-Agency Mortgage-Backed (continued) |
| |||||||||||||||
| CitiMortgage Alternative Loan Trust, |
| |||||||||||||||
| Series 2007-A1, Class 1A1 |
| |||||||||||||||
6.00% | 01/25/37 | $ | 101,371 | $ | 88,857 | |||||||||||
| CitiMortgage Alternative Loan Trust, |
| |||||||||||||||
| Series 2007-A1, Class 1A5 |
| |||||||||||||||
6.00% | 01/25/37 | 193,500 | 169,613 | |||||||||||||
| CitiMortgage Alternative Loan Trust, |
| |||||||||||||||
| Series 2007-A2, Class 1A13 |
| |||||||||||||||
5.75% | 02/25/37 | 223,271 | 196,708 | |||||||||||||
| CitiMortgage Alternative Loan Trust, |
| |||||||||||||||
| Series 2007-A3, Class 1A7 |
| |||||||||||||||
5.75% | 03/25/37 | 190,684 | 165,813 | |||||||||||||
| CitiMortgage Alternative Loan Trust, |
| |||||||||||||||
| Series 2007-A5, Class 1A1 |
| |||||||||||||||
6.00% | 05/25/37 | 801,177 | 700,163 | |||||||||||||
| Conseco Finance Securitizations Corp., |
| |||||||||||||||
| Series 2000-1, Class A5 |
| |||||||||||||||
8.06% | 09/01/29 | 4 | 3,422,743 | 617,588 | ||||||||||||
| Conseco Finance Securitizations Corp., |
| |||||||||||||||
| Series 2000-4, Class A5 |
| |||||||||||||||
7.97% | 05/01/32 | 1,992,158 | 360,204 | |||||||||||||
| Countrywide Home Loan Mortgage Pass-Through Trust, |
| |||||||||||||||
| Series 2007-20, Class A1 |
| |||||||||||||||
6.50% | 01/25/38 | 203,518 | 100,777 | |||||||||||||
| Countrywide Home Loan Mortgage Pass-Through Trust, |
| |||||||||||||||
| Series 2007-7, Class A9 |
| |||||||||||||||
5.50% | 06/25/37 | 601,870 | 291,780 | |||||||||||||
| Credit Suisse Mortgage Capital Trust |
| |||||||||||||||
| Series 2022-RPL3, Class A1 |
| |||||||||||||||
3.78% | 03/25/61 | 1,4 | 1,354,332 | 1,344,262 | ||||||||||||
| Credit Suisse Mortgage Capital Trust, |
| |||||||||||||||
| Series 2020-RPL6, Class A1 |
| |||||||||||||||
3.40% | 03/25/59 | 1,4 | 1,344,055 | 1,335,166 | ||||||||||||
| Credit-Based Asset Servicing and Securitization LLC, |
| |||||||||||||||
| Series 2006-CB7, Class A4 |
| |||||||||||||||
| (CME Term SOFR 1-Month plus 0.43%) |
| |||||||||||||||
5.76% | 10/25/36 | 3 | 34,998 | 22,800 | ||||||||||||
| Credit-Based Asset Servicing and Securitization LLC, |
| |||||||||||||||
| Series 2006-MH1, Class B1 (STEP-reset date 05/25/24) |
| |||||||||||||||
6.75% | 10/25/36 | 1 | 36,645 | 36,782 | ||||||||||||
| Credit-Based Asset Servicing and Securitization LLC, |
| |||||||||||||||
| Series 2007-CB1, Class AF3 (STEP-reset date 05/25/24) |
| |||||||||||||||
3.19% | 01/25/37 | 966,352 | 287,576 | |||||||||||||
| Credit-Based Asset Servicing and Securitization LLC, |
| |||||||||||||||
| Series 2007-CB1, Class AF6 (STEP-reset date 05/25/24) |
| |||||||||||||||
3.19% | 01/25/37 | 1,706,018 | 524,715 | |||||||||||||
| Credit-Based Asset Servicing and Securitization LLC, |
| |||||||||||||||
| Mortgage Loan Trust, |
| |||||||||||||||
| Series 2007-CB2, Class A2B (STEP-reset date 05/25/24) |
| |||||||||||||||
3.57% | 02/25/37 | 875,365 | 530,546 | |||||||||||||
| CSMC Mortgage-Backed Trust, |
| |||||||||||||||
| Series 2006-7, Class 10A6 |
| |||||||||||||||
6.50% | 08/25/36 | 1,085,988 | 547,180 | |||||||||||||
| CSMC Mortgage-Backed Trust, |
| |||||||||||||||
| Series 2006-7, Class 8A11 |
| |||||||||||||||
6.50% | 08/25/36 | 404,675 | 173,765 | |||||||||||||
| Issues | Maturity Date | Principal Amount | Value | |||||||||||
MORTGAGE-BACKED (continued) |
| |||||||||||||
Non-Agency Mortgage-Backed (continued) |
| |||||||||||||
| CSMC Mortgage-Backed Trust, |
| |||||||||||||
| Series 2007-5, Class 1A9 |
| |||||||||||||
6.59% | 08/25/37 | 4 | $ | 724,308 | $ | 418,341 | ||||||||
| CSMC Trust, |
| |||||||||||||
| Series 2020-RPL5, Class A1 |
| |||||||||||||
4.68% | 08/25/60 | 1,4 | 172,965 | 174,495 | ||||||||||
| CSMC, |
| |||||||||||||
| Series 2014-8R, Class 3A2 |
| |||||||||||||
5.10% | 02/27/36 | 1,4 | 990,461 | 779,585 | ||||||||||
| Deutsche ALT-B Securities, Inc., Mortgage Loan Trust, |
| |||||||||||||
| Series 2006-AB2, Class A2 |
| |||||||||||||
4.79% | 06/25/36 | 4 | 209,055 | 184,108 | ||||||||||
| Deutsche Mortgage & Asset Receiving Corp., |
| |||||||||||||
| Series 2014-RS1, Class 1A2 |
| |||||||||||||
6.50% | 07/27/37 | 1,4 | 313,966 | 257,257 | ||||||||||
| Fannie Mae Connecticut Avenue Securities, |
| |||||||||||||
| Series 2019-R04, Class 2B1 |
| |||||||||||||
| (SOFR30A plus 5.36%) |
| |||||||||||||
10.68% | 06/25/39 | 1,3 | 853,460 | 905,984 | ||||||||||
| Fannie Mae Connecticut Avenue Securities, |
| |||||||||||||
| Series 2019-R06, Class 2B1 |
| |||||||||||||
| (SOFR30A plus 3.86%) |
| |||||||||||||
9.18% | 09/25/39 | 1,3 | 970,698 | 1,010,281 | ||||||||||
| Fannie Mae Connecticut Avenue Securities, |
| |||||||||||||
| Series 2019-R07, Class 1B1 |
| |||||||||||||
| (SOFR30A plus 3.51%) |
| |||||||||||||
8.83% | 10/25/39 | 1,3 | 982,007 | 1,011,458 | ||||||||||
| First Franklin Mortgage Loan Trust, |
| |||||||||||||
| Series 2006-FF13, Class A2C |
| |||||||||||||
| (CME Term SOFR 1-Month plus 0.43%) |
| |||||||||||||
5.76% | 10/25/36 | 3 | 359,949 | 231,538 | ||||||||||
| First Franklin Mortgage Loan Trust, |
| |||||||||||||
| Series 2007-FF2, Class A2D |
| |||||||||||||
| (CME Term SOFR 1-Month plus 0.55%) |
| |||||||||||||
5.88% | 03/25/37 | 3 | 672,426 | 330,519 | ||||||||||
| First Horizon Alternative Mortgage Securities Trust, |
| |||||||||||||
| Series 2006-FA6, Class 2A3 |
| |||||||||||||
6.25% | 11/25/36 | 693,037 | 205,186 | |||||||||||
| First Horizon Alternative Mortgage Securities Trust, |
| |||||||||||||
| Series 2007-FA1, Class A4 |
| |||||||||||||
6.25% | 03/25/37 | 555,329 | 217,387 | |||||||||||
| First Horizon Alternative Mortgage Securities Trust, |
| |||||||||||||
| Series 2007-FA2, Class 1A4 |
| |||||||||||||
5.75% | 04/25/37 | 705,792 | 237,299 | |||||||||||
| Freddie Mac Structured Agency Credit Risk Debt Notes, |
| |||||||||||||
| Series 2021-HQA1, Class M2 |
| |||||||||||||
| (SOFR30A plus 2.25%) |
| |||||||||||||
7.57% | 08/25/33 | 1,3 | 857,905 | 878,554 | ||||||||||
| Freddie Mac Structured Agency Credit Risk Debt Notes, |
| |||||||||||||
| Series 2021-HQA2, Class M2 |
| |||||||||||||
| (SOFR30A plus 2.05%) |
| |||||||||||||
7.37% | 12/25/33 | 1,3 | 810,266 | 821,602 | ||||||||||
| Freddie Mac Structured Agency Credit Risk Debt Notes, |
| |||||||||||||
| Series 2022-DNA1, Class M2 |
| |||||||||||||
| (SOFR30A plus 2.50%) |
| |||||||||||||
7.82% | 01/25/42 | 1,3 | 1,000,000 | 1,020,939 | ||||||||||
See accompanying Notes to Financial Statements.
| Annual Report March 2024 / 62 |
Table of Contents
Flexible Income Fund
Schedule of Portfolio Investments
March 31, 2024
| Issues | Maturity Date | Principal Amount | Value | |||||||||||||
MORTGAGE-BACKED (continued) |
| |||||||||||||||
Non-Agency Mortgage-Backed (continued) |
| |||||||||||||||
| GSAA Home Equity Trust, |
| |||||||||||||||
| Series 2007-5, Class 1F3B |
| |||||||||||||||
6.00% | 05/25/37 | 4 | $ | 4,300,000 | $ | 261,018 | ||||||||||
| GSAA Home Equity Trust, |
| |||||||||||||||
| Series 2007-5, Class 1F5B (STEP-reset date 05/25/24) |
| |||||||||||||||
6.44% | 05/25/37 | 1,987,261 | 132,816 | |||||||||||||
| GSAA Home Equity Trust, |
| |||||||||||||||
| Series 2007-5, Class 2A2A |
| |||||||||||||||
| (CME Term SOFR 1-Month plus 0.57%) |
| |||||||||||||||
5.90% | 04/25/47 | 3 | 785,457 | 361,805 | ||||||||||||
| GSAA Trust, |
| |||||||||||||||
| Series 2006-7, Class AF3 (STEP-reset date 05/25/24) |
| |||||||||||||||
6.72% | 03/25/46 | 2,856,648 | 1,086,414 | |||||||||||||
| GSAA Trust, |
| |||||||||||||||
| Series 2007-3, Class 2A1B |
| |||||||||||||||
| (CME Term SOFR 1-Month plus 0.31%) |
| |||||||||||||||
5.64% | 03/25/47 | 3 | 166,316 | 9,028 | ||||||||||||
| GSR Mortgage Loan Trust, |
| |||||||||||||||
| Series 2005-AR6, Class 2A1 |
| |||||||||||||||
5.06% | 09/25/35 | 4 | 3,198 | 2,982 | ||||||||||||
| HarborView Mortgage Loan Trust, |
| |||||||||||||||
| Series 2005-9, Class 2A1A |
| |||||||||||||||
| (CME Term SOFR 1-Month plus 0.79%) |
| |||||||||||||||
6.12% | 06/20/35 | 3 | 14,081 | 12,982 | ||||||||||||
| HarborView Mortgage Loan Trust, |
| |||||||||||||||
| Series 2005-9, Class 2X (IO) |
| |||||||||||||||
0.00% | 06/20/35 | 1,4,5,6 | 1,032,580 | 162 | ||||||||||||
| HarborView Mortgage Loan Trust, |
| |||||||||||||||
| Series 2006-4, Class 1A1A |
| |||||||||||||||
| (CME Term SOFR 1-Month plus 0.47%) |
| |||||||||||||||
5.80% | 05/19/46 | 3 | 2,418,922 | 1,278,913 | ||||||||||||
| HarborView Mortgage Loan Trust, |
| |||||||||||||||
| Series 2006-5, Class X2 (IO) |
| |||||||||||||||
0.07% | 07/19/46 | 4,5,6 | 2,598,376 | 26 | ||||||||||||
| HSI Asset Loan Obligation Trust, |
| |||||||||||||||
| Series 2007-WF1, Class A5 (STEP-reset date 05/25/24) |
| |||||||||||||||
4.49% | 12/25/36 | 248,932 | 83,750 | |||||||||||||
| IndyMac Index Mortgage Loan Trust, |
| |||||||||||||||
| Series 2006-AR3, Class 2A1A |
| |||||||||||||||
3.92% | 03/25/36 | 4 | 74,874 | 53,488 | ||||||||||||
| JPMorgan Alternative Loan Trust, |
| |||||||||||||||
| Series 2006-S1, Class 3A4 |
| |||||||||||||||
6.18% | 03/25/36 | 4 | 884,609 | 744,672 | ||||||||||||
| JPMorgan Mortgage Acquisition Trust, |
| |||||||||||||||
| Series 2006-CH2, Class AF3 (STEP-reset date 05/25/24) |
| |||||||||||||||
5.46% | 09/25/29 | 448,525 | 272,333 | |||||||||||||
| JPMorgan Mortgage Acquisition Trust, |
| |||||||||||||||
| Series 2006-CW2, Class AF4 (STEP-reset date 05/25/24) |
| |||||||||||||||
6.08% | 08/25/36 | 1,399,901 | 848,827 | |||||||||||||
| JPMorgan Mortgage Acquisition Trust, |
| |||||||||||||||
| Series 2006-CW2, Class AF5 (STEP-reset date 05/25/24) |
| |||||||||||||||
6.34% | 08/25/36 | 266,025 | 165,476 | |||||||||||||
| JPMorgan Mortgage Acquisition Trust, |
| |||||||||||||||
| Series 2006-WF1, Class A5 (STEP-reset date 05/25/24) |
| |||||||||||||||
6.91% | 07/25/36 | 1,650,649 | 448,222 | |||||||||||||
| Issues | Maturity Date | Principal Amount | Value | |||||||||||||
MORTGAGE-BACKED (continued) |
| |||||||||||||||
Non-Agency Mortgage-Backed (continued) |
| |||||||||||||||
| JPMorgan Mortgage Acquisition Trust, |
| |||||||||||||||
| Series 2007-CH1, Class AF6 (STEP-reset date 05/25/24) |
| |||||||||||||||
4.55% |
| 11/25/36 | $ | 2,298 | $ | 2,262 | ||||||||||
| JPMorgan Mortgage Acquisition Trust, |
| |||||||||||||||
| Series 2007-CH2, Class AF2 (STEP-reset date 05/25/24) |
| |||||||||||||||
4.46% |
| 01/25/37 | 392,465 | 203,307 | ||||||||||||
| JPMorgan Mortgage Acquisition Trust, |
| |||||||||||||||
| Series 2007-CH2, Class AF3 (STEP-reset date 05/25/24) |
| |||||||||||||||
4.46% |
| 10/25/30 | 602,537 | 314,240 | ||||||||||||
| JPMorgan Mortgage Trust, |
| |||||||||||||||
| Series 2007-S1, Class 2A11 |
| |||||||||||||||
6.00% |
| 03/25/37 | 356,526 | 144,492 | ||||||||||||
| Lehman ABS Manufactured Housing Contract Trust, |
| |||||||||||||||
| Series 2001-B, Class M1 |
| |||||||||||||||
6.63% |
| 04/15/40 | 4 | 488,268 | 489,826 | |||||||||||
| Lehman Mortgage Trust, |
| |||||||||||||||
| Series 2006-1, Class 1A5 |
| |||||||||||||||
5.50% |
| 02/25/36 | 131,733 | 64,062 | ||||||||||||
| Lehman Mortgage Trust, |
| |||||||||||||||
| Series 2006-7, Class 2A5 (IO) |
| |||||||||||||||
| (-1.00 X CME Term SOFR 1-Month plus 6.44%, 6.55% Cap) |
| |||||||||||||||
1.11% |
| 11/25/36 | 3,5,6 | 182,721 | 17,579 | |||||||||||
| Lehman Mortgage Trust, |
| |||||||||||||||
| Series 2006-9, Class 3A2 (IO) |
| |||||||||||||||
| (-1.00 X CME Term SOFR 1-Month plus 7.12%, 7.23% Cap) |
| |||||||||||||||
1.79% |
| 01/25/37 | 3,5,6 | 5,583,133 | 363,575 | |||||||||||
| Lehman Mortgage Trust, |
| |||||||||||||||
| Series 2007-5, Class 10A2 (IO) |
| |||||||||||||||
| (-1.00 X CME Term SOFR 1-Month plus 6.23%, 6.34% Cap) |
| |||||||||||||||
0.90% |
| 06/25/37 | 3,5,6 | 8,359,105 | 831,264 | |||||||||||
| Lehman Mortgage Trust, |
| |||||||||||||||
| Series 2007-5, Class 7A3 |
| |||||||||||||||
7.50% |
| 10/25/36 | 491,615 | 188,480 | ||||||||||||
| Lehman XS Trust, |
| |||||||||||||||
| Series 2005-1, Class 3A4 (STEP-reset date 05/25/24) |
| |||||||||||||||
5.37% |
| 07/25/35 | 31,728 | 31,728 | ||||||||||||
| Lehman XS Trust, |
| |||||||||||||||
| Series 2006-17, Class 1A3 |
| |||||||||||||||
| (CME Term SOFR 1-Month plus 0.61%) |
| |||||||||||||||
5.94% |
| 08/25/46 | 3 | 182,962 | 158,849 | |||||||||||
| Lehman XS Trust, |
| |||||||||||||||
| Series 2006-17, Class 1AIO (IO) |
| |||||||||||||||
0.60% |
| 08/25/46 | 5,6 | 7,368,951 | 146,261 | |||||||||||
| MASTR Alternative Loan Trust, |
| |||||||||||||||
| Series 2005-2, Class 4A3 |
| |||||||||||||||
| (CME Term SOFR 1-Month plus 0.51%) |
| |||||||||||||||
5.50% | 03/25/35 | 3 | 9,796 | 9,616 | ||||||||||||
| MASTR Asset-Backed Securities Trust, |
| |||||||||||||||
| Series 2006-NC2, Class A3 |
| |||||||||||||||
| (CME Term SOFR 1-Month plus 0.33%) |
| |||||||||||||||
5.66% | 08/25/36 | 3 | 697,032 | 271,295 | ||||||||||||
| Merrill Lynch Alternative Note Asset Trust, |
| |||||||||||||||
| Series 2007-A1, Class A3 |
| |||||||||||||||
| (CME Term SOFR 1-Month plus 0.43%) |
| |||||||||||||||
5.76% | 01/25/37 | 3 | 639,916 | 202,888 | ||||||||||||
See accompanying Notes to Financial Statements.
| 63 / Annual Report March 2024 |
Table of Contents
Flexible Income Fund
Schedule of Portfolio Investments
March 31, 2024
| Issues | Maturity Date | Principal Amount | Value | |||||||||||||
MORTGAGE-BACKED (continued) |
| |||||||||||||||
Non-Agency Mortgage-Backed (continued) |
| |||||||||||||||
| Merrill Lynch Alternative Note Asset Trust, |
| |||||||||||||||
| Series 2007-OAR2, Class A3 |
| |||||||||||||||
| (CME Term SOFR 1-Month plus 0.63%) |
| |||||||||||||||
5.96% | 04/25/37 | 3 | $ | 1,961,965 | $ | 211,373 | ||||||||||
| Merrill Lynch First Franklin Mortgage Loan Trust, |
| |||||||||||||||
| Series 2007-3, Class A2B |
| |||||||||||||||
| (CME Term SOFR 1-Month plus 0.37%) |
| |||||||||||||||
5.70% | 06/25/37 | 3 | 222,009 | 213,238 | ||||||||||||
| Merrill Lynch Mortgage Investors Trust, |
| |||||||||||||||
| Series 2004-B, Class A1 |
| |||||||||||||||
| (CME Term SOFR 1-Month plus 0.61%) |
| |||||||||||||||
5.94% | 05/25/29 | 3 | 3,920 | 3,801 | ||||||||||||
| Merrill Lynch Mortgage Investors Trust, |
| |||||||||||||||
| Series 2006-HE6, Class A2B |
| |||||||||||||||
| (CME Term SOFR 1-Month plus 0.41%) |
| |||||||||||||||
4.70% | 11/25/37 | 3 | 763,066 | 236,190 | ||||||||||||
| Merrill Lynch Mortgage Investors Trust, |
| |||||||||||||||
| Series 2006-RM2, Class A1A |
| |||||||||||||||
| (CME Term SOFR 1-Month plus 0.48%) |
| |||||||||||||||
5.81% | 05/25/37 | 3 | 3,477,251 | 943,281 | ||||||||||||
| Mid-State Capital Corp. Trust, |
| |||||||||||||||
| Series 2005-1, Class A |
| |||||||||||||||
5.75% | 01/15/40 | 3,277 | 3,226 | |||||||||||||
| Mid-State Capital Corp. Trust, |
| |||||||||||||||
| Series 2006-1, Class A |
| |||||||||||||||
5.79% | 10/15/40 | 1 | 30,016 | 29,488 | ||||||||||||
| Mid-State Trust XI, |
| |||||||||||||||
| Series 11, Class A1 |
| |||||||||||||||
4.86% | 07/15/38 | 1,618 | 1,586 | |||||||||||||
| Morgan Stanley Mortgage Loan Trust, |
| |||||||||||||||
| Series 2007-13, Class 6A1 |
| |||||||||||||||
6.00% | 10/25/37 | 174,001 | 95,328 | |||||||||||||
| Nationstar Home Equity Loan Trust, |
| |||||||||||||||
| Series 2007-C, Class 2AV4 |
| |||||||||||||||
| (CME Term SOFR 1-Month plus 0.36%) |
| |||||||||||||||
5.69% | 06/25/37 | 3 | 16,515 | 15,749 | ||||||||||||
| Oakwood Mortgage Investors, Inc., |
| |||||||||||||||
| Series 1999-C, Class A2 |
| |||||||||||||||
7.48% | 08/15/27 | 272,262 | 214,655 | |||||||||||||
| Park Place Securities, Inc., Asset-Backed Pass-Through Certificates, |
| |||||||||||||||
| Series 2005-WCH1, Class M4 |
| |||||||||||||||
| (CME Term SOFR 1-Month plus 1.36%) |
| |||||||||||||||
6.69% | 01/25/36 | 3 | 3,925 | 3,866 | ||||||||||||
| PRET LLC, |
| |||||||||||||||
| Series 2021-RN2, Class A1 (STEP-reset date 04/25/24) |
| |||||||||||||||
1.74% | 07/25/51 | 1 | 633,921 | 614,529 | ||||||||||||
| PRET LLC, |
| |||||||||||||||
| Series 2022-RN2, Class A1 (STEP-reset date 04/25/24) |
| |||||||||||||||
5.00% | 06/25/52 | 1 | 626,101 | 612,216 | ||||||||||||
| PRPM LLC, |
| |||||||||||||||
| Series 2021-11, Class A1 (STEP-reset date 04/25/24) |
| |||||||||||||||
2.49% | 11/25/26 | 1 | 294,690 | 289,515 | ||||||||||||
| PRPM LLC, |
| |||||||||||||||
| Series 2021-3, Class A1 (STEP-reset date 04/25/24) |
| |||||||||||||||
1.87% | 04/25/26 | 1 | 622,909 | 610,049 | ||||||||||||
| Issues | Maturity Date | Principal Amount | Value | |||||||||||||
MORTGAGE-BACKED (continued) |
| |||||||||||||||
Non-Agency Mortgage-Backed (continued) |
| |||||||||||||||
| PRPM LLC, |
| |||||||||||||||
| Series 2021-4, Class A1 (STEP-reset date 04/25/24) |
| |||||||||||||||
1.87% | 04/25/26 | 1 | $ | 1,879,600 | $ | 1,837,389 | ||||||||||
| PRPM LLC, |
| |||||||||||||||
| Series 2021-9, Class A1 (STEP-reset date 04/25/24) |
| |||||||||||||||
2.36% | 10/25/26 | 1 | 939,662 | 917,900 | ||||||||||||
| PRPM LLC, |
| |||||||||||||||
| Series 2022-1, Class A1 (STEP-reset date 04/25/24) |
| |||||||||||||||
3.72% | 02/25/27 | 1 | 993,798 | 967,881 | ||||||||||||
| PRPM LLC, |
| |||||||||||||||
| Series 2022-3, Class A1 (STEP-reset date 04/25/24) |
| |||||||||||||||
5.56% | 06/25/27 | 1 | 918,897 | 907,990 | ||||||||||||
| PRPM LLC, |
| |||||||||||||||
| Series 2022-4, Class A1 (STEP-reset date 04/25/24) |
| |||||||||||||||
5.00% | 08/25/27 | 1 | 238,241 | 233,286 | ||||||||||||
| PRPM, LLC, |
| |||||||||||||||
| Series 2021-10, Class A1 (STEP-reset date 04/25/24) |
| |||||||||||||||
2.49% | 10/25/26 | 1 | 354,584 | 349,455 | ||||||||||||
| PRPM, LLC, |
| |||||||||||||||
| Series 2021-8, Class A1 |
| |||||||||||||||
1.74% | 09/25/26 | 1,4 | 539,761 | 520,236 | ||||||||||||
| Residential Accredit Loans Trust, |
| |||||||||||||||
| Series 2005-QS14, Class 3A3 |
| |||||||||||||||
6.00% | 09/25/35 | 117,959 | 97,418 | |||||||||||||
| Residential Accredit Loans Trust, |
| |||||||||||||||
| Series 2005-QS16, Class A7 |
| |||||||||||||||
5.50% | 11/25/35 | 375,118 | 313,745 | |||||||||||||
| Residential Accredit Loans Trust, |
| |||||||||||||||
| Series 2006-QS15, Class A3 |
| |||||||||||||||
6.50% | 10/25/36 | 766,423 | 654,282 | |||||||||||||
| Residential Accredit Loans Trust, |
| |||||||||||||||
| Series 2006-QS18, Class 2A2 (IO) |
| |||||||||||||||
| (-1.00 X CME Term SOFR 1-Month plus 6.44%, 6.55% Cap) |
| |||||||||||||||
1.11% | 12/25/36 | 3,5,6 | 3,977,577 | 397,341 | ||||||||||||
| Residential Accredit Loans Trust, |
| |||||||||||||||
| Series 2006-QS4, Class A2 |
| |||||||||||||||
6.00% | 04/25/36 | 274,488 | 217,499 | |||||||||||||
| Residential Accredit Loans Trust, |
| |||||||||||||||
| Series 2006-QS4, Class A4 |
| |||||||||||||||
6.00% | 04/25/36 | 340,031 | 269,434 | |||||||||||||
| Residential Accredit Loans Trust, |
| |||||||||||||||
| Series 2006-QS6, Class 1A15 |
| |||||||||||||||
6.00% | 06/25/36 | 136,152 | 106,746 | |||||||||||||
| Residential Accredit Loans Trust, |
| |||||||||||||||
| Series 2006-QS6, Class 1A2 |
| |||||||||||||||
6.00% | 06/25/36 | 534,854 | 419,337 | |||||||||||||
| Residential Accredit Loans Trust, |
| |||||||||||||||
| Series 2006-QS6, Class 1A4 |
| |||||||||||||||
6.00% | 06/25/36 | 892,636 | 699,845 | |||||||||||||
| Residential Accredit Loans Trust, |
| |||||||||||||||
| Series 2007-QH9, Class X (IO) (PO) |
| |||||||||||||||
0.71% | 11/25/37 | 4,5,6 | 10,106,615 | 286,244 | ||||||||||||
| Residential Accredit Loans Trust, |
| |||||||||||||||
| Series 2007-QO2, Class A1 |
| |||||||||||||||
| (CME Term SOFR 1-Month plus 0.26%) |
| |||||||||||||||
5.59% | 02/25/47 | 3 | 511,708 | 177,614 | ||||||||||||
See accompanying Notes to Financial Statements.
| Annual Report March 2024 / 64 |
Table of Contents
Flexible Income Fund
Schedule of Portfolio Investments
March 31, 2024
| Issues | Maturity Date | Principal Amount | Value | |||||||||
MORTGAGE-BACKED (continued) |
| |||||||||||
Non-Agency Mortgage-Backed (continued) |
| |||||||||||
| Residential Accredit Loans Trust, |
| |||||||||||
| Series 2007-QS1, Class 1A4 |
| |||||||||||
6.00% | 01/25/37 | $ | 432,241 | $ | 330,833 | |||||||
| Residential Accredit Loans Trust, |
| |||||||||||
| Series 2007-QS1, Class 2A1 (IO) |
| |||||||||||
| (-1.00 X CME Term SOFR 1-Month plus 6.53%, 6.64% Cap) |
| |||||||||||
1.20% | 01/25/373,5,6 | 6,057,046 | 559,962 | |||||||||
| Residential Accredit Loans Trust, |
| |||||||||||
| Series 2007-QS3, Class A1 |
| |||||||||||
6.50% | 02/25/37 | 405,929 | 317,447 | |||||||||
| Residential Accredit Loans Trust, |
| |||||||||||
| Series 2007-QS7, Class 1A1 |
| |||||||||||
6.00% | 05/25/37 | 45,487 | 34,593 | |||||||||
| Residential Asset Mortgage Products Trust, |
| |||||||||||
| Series 2006-EFC2, Class A4 |
| |||||||||||
| (CME Term SOFR 1-Month plus 0.55%) |
| |||||||||||
5.88% | 12/25/363 | 26,418 | 25,871 | |||||||||
| Residential Asset Securitization Trust, |
| |||||||||||
| Series 2003-A15, Class 1A3 (IO) |
| |||||||||||
| (-1.00 X CME Term SOFR 1-Month plus 7.44%, 7.55% Cap) |
| |||||||||||
2.11% | 02/25/343,5,6 | 383,419 | 27,260 | |||||||||
| Residential Asset Securitization Trust, |
| |||||||||||
| Series 2005-A8CB, Class A9 |
| |||||||||||
5.38% | 07/25/35 | 230,189 | 132,564 | |||||||||
| Residential Asset Securitization Trust, |
| |||||||||||
| Series 2006-A12, Class A1 |
| |||||||||||
6.25% | 11/25/36 | 502,765 | 185,398 | |||||||||
| Residential Asset Securitization Trust, |
| |||||||||||
| Series 2006-A15, Class A2 |
| |||||||||||
6.25% | 01/25/37 | 506,394 | 180,776 | |||||||||
| Residential Asset Securitization Trust, |
| |||||||||||
| Series 2006-A16, Class 1A3 |
| |||||||||||
6.00% | 02/25/37 | 331,293 | 133,249 | |||||||||
| Residential Asset Securitization Trust, |
| |||||||||||
| Series 2006-A5CB, Class A4 |
| |||||||||||
6.00% | 06/25/36 | 208,339 | 81,847 | |||||||||
| Residential Asset Securitization Trust, |
| |||||||||||
| Series 2007-A1, Class A1 |
| |||||||||||
6.00% | 03/25/37 | 325,319 | 106,589 | |||||||||
| Residential Asset Securitization Trust, |
| |||||||||||
| Series 2007-A3, Class 1A4 |
| |||||||||||
5.75% | 04/25/37 | 472,279 | 217,437 | |||||||||
| Residential Asset Securitization Trust, |
| |||||||||||
| Series 2007-A6, Class 1A3 |
| |||||||||||
6.00% | 06/25/37 | 141,261 | 77,454 | |||||||||
| Residential Funding Mortgage Securities Trust, |
| |||||||||||
| Series 2006-S10, Class 1A1 |
| |||||||||||
6.00% | 10/25/36 | 672,926 | 505,707 | |||||||||
| Residential Funding Mortgage Securities Trust, |
| |||||||||||
Series 2006-S3, Class A7 |
| |||||||||||
5.50% | 03/25/36 | 435,156 | 349,186 | |||||||||
| Residential Funding Mortgage Securities Trust, |
| |||||||||||
| Series 2006-S6, Class A10 |
| |||||||||||
6.00% | 07/25/36 | 213,027 | 182,725 | |||||||||
| Issues | Maturity Date | Principal Amount | Value | |||||||||||
MORTGAGE-BACKED (continued) |
| |||||||||||||
Non-Agency Mortgage-Backed (continued) |
| |||||||||||||
| Residential Funding Mortgage Securities Trust, |
| |||||||||||||
| Series 2006-S6, Class A14 |
| |||||||||||||
6.00% | 07/25/36 | $ | 68,307 | $ | 56,937 | |||||||||
| Residential Funding Mortgage Securities Trust, |
| |||||||||||||
| Series 2007-S8, Class 1A1 |
| |||||||||||||
6.00% | 09/25/37 | 137,417 | 91,578 | |||||||||||
| Securitized Asset-Backed Receivables LLC Trust, |
| |||||||||||||
| Series 2006-CB1, Class AF4 (STEP-reset date 05/25/24) |
| |||||||||||||
2.84% | 01/25/36 | 243,481 | 197,619 | |||||||||||
| Securitized Asset-Backed Receivables LLC Trust, |
| |||||||||||||
Series 2007-NC1, Class A2B |
| |||||||||||||
| (CME Term SOFR 1-Month plus 0.41%) |
| |||||||||||||
5.74% | 12/25/36 | 3 | 868,051 | 420,260 | ||||||||||
Soundview Home Loan Trust, |
| |||||||||||||
Series 2007-OPT2, Class 2A4 |
| |||||||||||||
| (CME Term SOFR 1-Month plus 0.36%) |
| |||||||||||||
5.69% | 07/25/37 | 3 | 253,904 | 193,276 | ||||||||||
Soundview Home Loan Trust, |
| |||||||||||||
Series 2007-OPT4, Class 1A1 |
| |||||||||||||
| (CME Term SOFR 1-Month plus 1.11%) |
| |||||||||||||
6.44% | 09/25/37 | 3 | 378,244 | 260,104 | ||||||||||
| Structured Adjustable Rate Mortgage Loan Trust, |
| |||||||||||||
Series 2004-1, Class 4A1 |
| |||||||||||||
7.02% | 02/25/34 | 4 | 839 | 799 | ||||||||||
| Structured Asset Mortgage Investments II Trust, |
| |||||||||||||
Series 2006-AR2, Class A1 |
| |||||||||||||
| (CME Term SOFR 1-Month plus 0.57%) |
| |||||||||||||
5.90% | 02/25/36 | 3 | 9,009 | 8,009 | ||||||||||
VOLT CIII LLC, |
| |||||||||||||
| Series 2021-CF1, Class A1 (STEP-reset date 04/25/24) |
| |||||||||||||
1.99% | 08/25/51 | 1 | 651,031 | 629,013 | ||||||||||
VOLT XCII LLC, |
| |||||||||||||
| Series 2021-NPL1, Class A1 (STEP-reset date 04/25/24) |
| |||||||||||||
4.89% | 02/27/51 | 1 | 696,552 | 680,978 | ||||||||||
VOLT XCVI LLC, |
| |||||||||||||
| Series 2021-NPL5, Class A2 (STEP-reset date 04/25/24) |
| |||||||||||||
4.83% | 03/27/51 | 1 | 937,496 | 847,603 | ||||||||||
| WaMu Mortgage Pass-Through Certificates, |
| |||||||||||||
| Series 2006-2, Class 1A6 |
| |||||||||||||
6.00% | 03/25/36 | 20,125 | 18,686 | |||||||||||
| WaMu Mortgage Pass-Through Certificates, |
| |||||||||||||
| Series 2006-AR3, Class X3 (IO) |
| |||||||||||||
1.15% | 05/25/46 | 5,6 | 6,129,047 | 287,518 | ||||||||||
| Wells Fargo Alternative Loan Trust, |
| |||||||||||||
Series 2007-PA2, Class 1A1 |
| |||||||||||||
6.00% | 06/25/37 | 168,988 | 146,501 | |||||||||||
| Wells Fargo Alternative Loan Trust, |
| |||||||||||||
| Series 2007-PA5, Class 1A1 |
| |||||||||||||
6.25% | 11/25/37 | 296,528 | 253,232 | |||||||||||
| Wells Fargo Mortgage-Backed Securities Trust, |
| |||||||||||||
| Series 2006-AR14, Class 2A3 |
| |||||||||||||
6.37% | 10/25/36 | 4 | 28,609 | 26,890 | ||||||||||
| Wells Fargo Mortgage-Backed Securities Trust, |
| |||||||||||||
| Series 2006-AR4, Class 2A1 |
| |||||||||||||
6.18% | 04/25/36 | 4 | 6,073 | 5,766 | ||||||||||
See accompanying Notes to Financial Statements.
| 65 / Annual Report March 2024 |
Table of Contents
Flexible Income Fund
Schedule of Portfolio Investments
March 31, 2024
| Issues | Maturity Date | Principal Amount | Value | |||||||||||
MORTGAGE-BACKED (continued) |
| |||||||||||||
Non-Agency Mortgage-Backed (continued) |
| |||||||||||||
| Wells Fargo Mortgage-Backed Securities Trust, |
| |||||||||||||
Series 2007-7, Class A1 |
| |||||||||||||
6.00% | 06/25/37 | $ | 1,570,697 | $ | 1,400,245 | |||||||||
|
|
| ||||||||||||
| 73,707,863 | ||||||||||||||
|
|
| ||||||||||||
| U.S. Agency Commercial Mortgage-Backed — 0.67% |
| |||||||||||||
Fannie Mae Pool 462209 |
| |||||||||||||
| (US Treasury Yield Curve Rate T Note Constant Maturity 1-Year plus 2.18%) |
| |||||||||||||
6.94% | 04/01/36 | 3 | 44,842 | 44,339 | ||||||||||
Fannie Mae-Aces, |
| |||||||||||||
Series 2016-M11, Class X2 (IO) |
| |||||||||||||
3.05% | 07/25/39 | 4 | 244,933 | 3,593 | ||||||||||
Fannie Mae-Aces, |
| |||||||||||||
Series 2016-M2, Class X3 (IO) |
| |||||||||||||
2.04% | 04/25/36 | 4 | 64,139 | 570 | ||||||||||
Fannie Mae-Aces, |
| |||||||||||||
Series 2016-M4, Class X2 (IO) |
| |||||||||||||
2.68% | 01/25/39 | 4 | 496,268 | 2,690 | ||||||||||
| Freddie Mac Multifamily Structured Pass-Through Certificates, |
| |||||||||||||
Series K037, Class X3 (IO) |
| |||||||||||||
5.02% | 01/25/42 | 4 | 42,941 | 2 | ||||||||||
| Freddie Mac Multifamily Structured Pass-Through Certificates, |
| |||||||||||||
Series K043, Class X1 (IO) |
| |||||||||||||
0.50% | 12/25/24 | 4 | 22,346,371 | 58,173 | ||||||||||
| Freddie Mac Multifamily Structured Pass-Through Certificates, |
| |||||||||||||
Series K044, Class X3 (IO) |
| |||||||||||||
1.50% | 01/25/43 | 4 | 4,900,000 | 52,881 | ||||||||||
| Freddie Mac Multifamily Structured Pass-Through Certificates, |
| |||||||||||||
Series K045, Class X1 (IO) |
| |||||||||||||
0.41% | 01/25/25 | 4 | 26,140,397 | 57,185 | ||||||||||
| Freddie Mac Multifamily Structured Pass-Through Certificates, |
| |||||||||||||
Series K049, Class X1 (IO) |
| |||||||||||||
0.54% | 07/25/25 | 4 | 12,041,139 | 66,401 | ||||||||||
| Freddie Mac Multifamily Structured Pass-Through Certificates, |
| |||||||||||||
Series K049, Class X3 (IO) |
| |||||||||||||
1.55% | 10/25/43 | 4 | 2,925,000 | 54,667 | ||||||||||
| Freddie Mac Multifamily Structured Pass-Through Certificates, |
| |||||||||||||
Series K050, Class X1 (IO) |
| |||||||||||||
0.29% | 08/25/25 | 4 | 21,124,650 | 68,938 | ||||||||||
| Freddie Mac Multifamily Structured Pass-Through Certificates, |
| |||||||||||||
Series K056, Class X3 (IO) |
| |||||||||||||
2.12% | 06/25/44 | 4 | 6,243,936 | 262,395 | ||||||||||
| Freddie Mac Multifamily Structured Pass-Through Certificates, |
| |||||||||||||
Series K062, Class X3 (IO) |
| |||||||||||||
2.08% | 01/25/45 | 4 | 3,000,000 | 155,144 | ||||||||||
| Issues | Maturity Date | Principal Amount | Value | |||||||||||
MORTGAGE-BACKED (continued) |
| |||||||||||||
U.S. Agency Commercial Mortgage-Backed (continued) |
| |||||||||||||
| Freddie Mac Multifamily Structured Pass-Through Certificates, |
| |||||||||||||
| Series K106, Class X1 (IO) |
| |||||||||||||
1.32% | 01/25/30 | 4 | $ | 9,236,427 | $ | 586,870 | ||||||||
| Freddie Mac Multifamily Structured Pass-Through Certificates, |
| |||||||||||||
| Series K732, Class X3 (IO) |
| |||||||||||||
2.17% | 05/25/46 | 4 | 4,850,000 | 123,944 | ||||||||||
| Freddie Mac Multifamily Structured Pass-Through Certificates, |
| |||||||||||||
| Series K735, Class X3 (IO) |
| |||||||||||||
2.15% | 05/25/47 | 4 | 3,160,000 | 133,100 | ||||||||||
| Freddie Mac Multifamily Structured Pass-Through Certificates, |
| |||||||||||||
| Series K736, Class X3 (IO) |
| |||||||||||||
2.01% | 09/25/47 | 4 | 2,495,000 | 98,806 | ||||||||||
| Freddie Mac Multifamily Structured Pass-Through Certificates, |
| |||||||||||||
| Series KC05, Class X1 (IO) |
| |||||||||||||
1.23% | 06/25/27 | 4 | 637,982 | 13,145 | ||||||||||
| Freddie Mac Multifamily Structured Pass-Through Certificates, |
| |||||||||||||
| Series KLU1, Class X3 (IO) |
| |||||||||||||
4.11% | 01/25/31 | 4 | 253,606 | 23,334 | ||||||||||
| Freddie Mac Multifamily Structured Pass-Through Certificates, |
| |||||||||||||
| Series Q013, Class XPT1 (IO) |
| |||||||||||||
1.66% | 05/25/25 | 4 | 3,078,013 | 40,530 | ||||||||||
| Freddie Mac Multifamily Structured Pass-Through Certificates, |
| |||||||||||||
| Series Q013, Class XPT2 (IO) |
| |||||||||||||
1.81% | 05/25/27 | 4 | 3,606,785 | 95,245 | ||||||||||
| Ginnie Mae, |
| |||||||||||||
| Series 2009-111, Class IO (IO) |
| |||||||||||||
0.19% | 09/16/51 | 4 | 880,507 | 28,502 | ||||||||||
| Ginnie Mae, |
| |||||||||||||
| Series 2010-159, Class D |
| |||||||||||||
4.56% | 09/16/44 | 4 | 100,366 | 98,933 | ||||||||||
| Ginnie Mae, |
| |||||||||||||
| Series 2011-119, Class IO (IO) |
| |||||||||||||
0.18% | 08/16/51 | 4 | 1,102,322 | 1,787 | ||||||||||
| Ginnie Mae, |
| |||||||||||||
| Series 2011-86, Class C |
| |||||||||||||
3.64% | 09/16/51 | 4 | 203,917 | 193,838 | ||||||||||
| Ginnie Mae, |
| |||||||||||||
| Series 2012-123, Class IO (IO) |
| |||||||||||||
0.62% | 12/16/51 | 4 | 1,461,733 | 17,421 | ||||||||||
| Ginnie Mae, |
| |||||||||||||
| Series 2012-135, Class IO (IO) |
| |||||||||||||
0.34% | 01/16/53 | 4 | 256,784 | 2,412 | ||||||||||
| Ginnie Mae, |
| |||||||||||||
| Series 2013-33, Class IO (IO) |
| |||||||||||||
0.21% | 04/16/54 | 4 | 335,357 | 769 | ||||||||||
See accompanying Notes to Financial Statements.
| Annual Report March 2024 / 66 |
Table of Contents
Flexible Income Fund
Schedule of Portfolio Investments
March 31, 2024
| Issues | Maturity Date | Principal Amount | Value | |||||||||||
MORTGAGE-BACKED (continued) |
| |||||||||||||
U.S. Agency Commercial Mortgage-Backed (continued) |
| |||||||||||||
| Ginnie Mae, |
| |||||||||||||
| Series 2014-126, Class IO (IO) |
| |||||||||||||
0.71% | 02/16/55 | 4 | $ | 4,704,484 | $ | 104,878 | ||||||||
|
|
| ||||||||||||
| 2,390,492 | ||||||||||||||
|
|
| ||||||||||||
U.S. Agency Mortgage-Backed — 22.07% |
| |||||||||||||
| Fannie Mae Pool BV8515 |
| |||||||||||||
3.00% | 05/01/52 | 2,400,414 | 2,069,347 | |||||||||||
| Fannie Mae Pool FS6943 |
| |||||||||||||
3.00% | 06/01/52 | 3,894,149 | 3,354,810 | |||||||||||
| Fannie Mae REMICS, |
| |||||||||||||
| Series 2005-56, Class SP |
| |||||||||||||
| (-6.00 X SOFR30A plus 41.61%, 6.00% Cap) |
| |||||||||||||
6.00% | 08/25/33 | 3 | 1,477 | 1,467 | ||||||||||
| Fannie Mae REMICS, |
| |||||||||||||
| Series 2011-116, Class SA (IO) |
| |||||||||||||
| (-1.00 X SOFR30A plus 5.89%, 6.00% Cap) |
| |||||||||||||
0.57% | 11/25/41 | 3 | 53,786 | 4,095 | ||||||||||
| Fannie Mae REMICS, |
| |||||||||||||
| Series 2012-139, Class AI (IO) |
| |||||||||||||
3.00% | 12/25/27 | 109,589 | 4,034 | |||||||||||
| Freddie Mac Pool SD8199 |
| |||||||||||||
2.00% | 03/01/52 | 6,262,069 | 4,959,096 | |||||||||||
| Freddie Mac Pool SD8245 |
| |||||||||||||
4.50% | 09/01/52 | 2,759,104 | 2,628,378 | |||||||||||
| Freddie Mac Pool SD8275 |
| |||||||||||||
4.50% | 12/01/52 | 2,031,085 | 1,935,442 | |||||||||||
| Freddie Mac Strips, |
| |||||||||||||
| Series 240, Class IO (IO) |
| |||||||||||||
5.50% | 07/15/36 | 198,873 | 39,276 | |||||||||||
| Ginnie Mae (TBA) |
| |||||||||||||
4.50% | 04/20/54 | 4,725,000 | 4,541,298 | |||||||||||
5.00% | 04/20/54 | 4,050,000 | 3,981,050 | |||||||||||
5.50% | 05/20/54 | 2,575,000 | 2,571,777 | |||||||||||
| Ginnie Mae, |
| |||||||||||||
| Series 2003-110, Class S (IO) |
| |||||||||||||
| (-1.00 X CME Term SOFR 1-Month plus 6.49%, 6.60% Cap) |
| |||||||||||||
1.16% | 10/20/33 | 3 | 231,442 | 14,863 | ||||||||||
| Ginnie Mae, |
| |||||||||||||
| Series 2018-124, Class NW |
| |||||||||||||
3.50% | 09/20/48 | 24,305 | 21,719 | |||||||||||
| Ginnie Mae, |
| |||||||||||||
| Series 2018-154, Class BP |
| |||||||||||||
3.50% | 11/20/48 | 2,423 | 2,244 | |||||||||||
| Ginnie Mae, |
| |||||||||||||
| Series 2023-111, Class FN |
| |||||||||||||
| (SOFR30A plus 1.20%) |
| |||||||||||||
6.52% | 08/20/53 | 3 | 2,050,060 | 2,061,706 | ||||||||||
| UMBS (TBA) |
| |||||||||||||
2.00% | 04/01/54 | 7,825,000 | 6,198,059 | |||||||||||
2.50% | 04/01/54 | 12,650,000 | 10,466,117 | |||||||||||
3.00% | 04/01/54 | 5,200,000 | 4,477,360 | |||||||||||
4.00% | 04/01/54 | 14,275,000 | 13,223,333 | |||||||||||
4.50% | 04/01/54 | 7,325,000 | 6,977,349 | |||||||||||
5.00% | 04/01/54 | 6,425,000 | 6,269,640 | |||||||||||
| Issues | Maturity Date | Principal Amount | Value | |||||||||||
MORTGAGE-BACKED (continued) |
| |||||||||||||
U.S. Agency Mortgage-Backed (continued) |
| |||||||||||||
5.50% | 04/01/54 | $ | 2,925,000 | $ | 2,910,778 | |||||||||
|
|
| ||||||||||||
| 78,713,238 | ||||||||||||||
|
|
| ||||||||||||
| Total Mortgage-Backed |
| |||||||||||||
| (Cost $209,600,307) |
| 177,223,247 | ||||||||||||
|
|
| ||||||||||||
MUNICIPAL BONDS — 0.20%* |
| |||||||||||||
California — 0.03% |
| |||||||||||||
| Los Angeles Department of Airports Revenue Bonds, Port, Airport and Marina Improvements, Series A |
| |||||||||||||
3.89% | 05/15/38 | 100,000 | 91,047 | |||||||||||
|
|
| ||||||||||||
Florida — 0.02% |
| |||||||||||||
| County of Miami-Dade Aviation Revenue Bonds, Airport and Marina Improvements, Series B |
| |||||||||||||
2.61% | 10/01/32 | 100,000 | 84,648 | |||||||||||
|
|
| ||||||||||||
New York — 0.12% |
| |||||||||||||
| City of New York General Obligation Bonds, Public Improvements, Series F |
| |||||||||||||
3.62% | 04/01/31 | 155,000 | 145,578 | |||||||||||
| New York City Transitional Finance Authority Future Tax Secured Revenue Bonds, Public Improvements, Subseries B3 |
| |||||||||||||
1.85% | 08/01/32 | 75,000 | 60,144 | |||||||||||
| New York State Urban Development Corp. Revenue Bonds, Economic Improvements, Series F |
| |||||||||||||
2.00% | 03/15/33 | 100,000 | 80,615 | |||||||||||
| New York State Urban Development Corp. Revenue Bonds, Transit Improvements, Series B |
| |||||||||||||
2.54% | 03/15/34 | 175,000 | 146,132 | |||||||||||
|
|
| ||||||||||||
| 432,469 | ||||||||||||||
|
|
| ||||||||||||
Ohio — 0.03% |
| |||||||||||||
| Ohio, Taxable Revenue Bonds, Advanced Refunding, Cleveland Clinic |
| |||||||||||||
2.89% | 01/01/32 | 100,000 | 88,067 | |||||||||||
|
|
| ||||||||||||
Total Municipal Bonds |
| |||||||||||||
| (Cost $824,709) |
| 696,231 | ||||||||||||
|
|
| ||||||||||||
U.S. TREASURY SECURITIES — 6.12% |
| |||||||||||||
U.S. Treasury Bonds — 0.03% |
| |||||||||||||
| U.S. Treasury Bonds (WI) |
| |||||||||||||
4.25% | 02/15/54 | 105,000 | 103,310 | |||||||||||
|
|
| ||||||||||||
U.S. Treasury Notes — 6.09% |
| |||||||||||||
| U.S. Treasury Notes |
| |||||||||||||
4.25% | 03/15/27 | 11,900,000 | 11,847,473 | |||||||||||
4.50% | 03/31/26 | 3,540,000 | 3,531,978 | |||||||||||
| U.S. Treasury Notes (WI) |
| |||||||||||||
4.00% | 02/15/34 | 310,000 | 304,987 | |||||||||||
See accompanying Notes to Financial Statements.
| 67 / Annual Report March 2024 |
Table of Contents
Flexible Income Fund
Schedule of Portfolio Investments
March 31, 2024
| Issues | Maturity Date | Principal Amount | Value | |||||||||||||
U.S. TREASURY SECURITIES (continued) |
| |||||||||||||||
U.S. Treasury Notes (continued) |
| |||||||||||||||
4.25% |
| 03/31/29 | $ | 6,075,000 | $ | 6,050,850 | ||||||||||
|
|
| ||||||||||||||
| 21,735,288 | ||||||||||||||||
|
|
| ||||||||||||||
| Total U.S. Treasury Securities |
| |||||||||||||||
| (Cost $21,875,252) |
| 21,838,598 | ||||||||||||||
|
|
| ||||||||||||||
Total Bonds — 99.98% |
| |||||||||||||||
(Cost $391,798,193) |
| 356,675,289 | ||||||||||||||
|
|
| ||||||||||||||
| Issues | Shares | Value | ||||||||||||||
COMMON STOCK — 0.15% |
| |||||||||||||||
Communications — 0.08% |
| |||||||||||||||
| Intelsat Emergence SA2,5,6,9 |
| |||||||||||||||
| (Luxembourg) |
| 11,053 | 297,049 | |||||||||||||
|
|
| ||||||||||||||
Finance — 0.07% |
| |||||||||||||||
| AGNC Investment Corp. |
| 25,500 | 252,450 | |||||||||||||
|
|
| ||||||||||||||
Specialized REITs — 0.00% |
| |||||||||||||||
| Aoyuan New Shares2,9 |
| |||||||||||||||
| (Cayman Islands) |
| 30,741 | 621 | |||||||||||||
| China Aoyuan Group Ltd.2,9 |
| |||||||||||||||
(Cayman Islands) |
| 12,296 | 248 | |||||||||||||
|
|
| ||||||||||||||
| 869 | ||||||||||||||||
|
|
| ||||||||||||||
| Total Common Stock |
| |||||||||||||||
(Cost $683,385) |
| 550,368 | ||||||||||||||
|
|
| ||||||||||||||
WARRANT — 0.00% |
| |||||||||||||||
Entertainment — 0.00% |
| |||||||||||||||
| Cineworld Group PLC2,5,6,9 |
| |||||||||||||||
(United Kingdom) |
| 152,713 | — | |||||||||||||
|
|
| ||||||||||||||
Total Warrant |
| |||||||||||||||
| (Cost $–) |
| |||||||||||||||
| Issues | Maturity Date | Principal Amount/Shares | Value | |||||||||||||
SHORT-TERM INVESTMENTS — 22.86% |
| |||||||||||||||
Money Market Funds — 10.16% |
| |||||||||||||||
| Dreyfus Government Cash Management Fund |
| |||||||||||||||
5.20%21 |
| 15,526,000 | 15,526,000 | |||||||||||||
| Fidelity Investments Money Market Funds - Government Portfolio |
| |||||||||||||||
5.21%21 |
| 95,686 | 95,686 | |||||||||||||
| JPMorgan U.S. Government Money Market Fund |
| |||||||||||||||
5.16%21 |
| 3,212,000 | 3,212,000 | |||||||||||||
| Morgan Stanley Institutional Liquidity Funds - Government Portfolio |
| |||||||||||||||
5.22%21 |
| 17,407,000 | 17,407,000 | |||||||||||||
|
|
| ||||||||||||||
| 36,240,686 | ||||||||||||||||
|
|
| ||||||||||||||
U.S. Treasury Bills — 12.70% |
| |||||||||||||||
| U.S. Treasury Bills (WI) |
| |||||||||||||||
5.29%22 |
| 07/09/24 | 10,000,000 | 9,853,048 | ||||||||||||
5.30%22 |
| 05/16/24 | 14,000,000 | 13,902,560 | ||||||||||||
| Issues | Maturity Date | Principal Amount/Shares | Value | |||||||||||
SHORT-TERM INVESTMENTS (continued) |
| |||||||||||||
U.S. Treasury Bills (continued) |
| |||||||||||||
5.37%22 | 04/18/24 | $ | 10,000,000 | $ | 9,975,167 | |||||||||
5.46%22 | 04/04/24 | 11,592,500 | 11,582,359 | |||||||||||
|
|
| ||||||||||||
| 45,313,134 | ||||||||||||||
|
|
| ||||||||||||
Total Short-Term Investments |
| |||||||||||||
(Cost $81,569,758) |
| 81,553,820 | ||||||||||||
|
|
| ||||||||||||
Total Investments - 122.99% |
| |||||||||||||
(Cost $474,051,336) |
| 438,779,477 | ||||||||||||
|
|
| ||||||||||||
| Liabilities in Excess of Other Assets - (22.99)% |
| (82,024,008 | ) | |||||||||||
|
|
| ||||||||||||
Net Assets - 100.00% |
| $ | 356,755,469 | |||||||||||
|
|
| ||||||||||||
| 1 | Securities exempt from registration under Rule 144A of the Securities Act of 1933, as amended. The securities may be resold in transactions exempt from registration, normally to qualified institutional buyers. |
| 2 | Foreign denominated security issued by foreign domiciled entity. |
| 3 | Floating rate security. The rate disclosed was in effect at March 31, 2024. |
| 4 | Variable rate security. Interest rate disclosed is as of the most recent information available. Certain variable rate securities are not based on a published reference rate and spread but are determined by the issuer or agent and are based on current market conditions. |
| 5 | Security is valued using significant unobservable inputs and is classified as Level 3 in the fair value hierarchy. |
| 6 | Illiquid security as determined under procedures approved by the Board of Trustees. The aggregate value of illiquid securities is $5,003,395, which is 1.40% of total net assets. |
| 7 | Perpetual security with no stated maturity date. |
| 8 | Payment-in-kind (“PIK”) security. |
| 9 | Non-income producing security. |
| 10 | Security is currently in default with regard to scheduled interest or principal payments. |
| 11 | Zero coupon bond. The rate shown is the effective yield as of March 31, 2024. |
| 12 | Payment-in-kind (“PIK”) security. Income may be paid in additional securities or cash at the discretion of the issuer -7.50% cash or 8.50% payment-in-kind interest. |
| 13 | Payment-in-kind (“PIK”) security. Income may be paid in additional securities or cash at the discretion of the issuer -8.00% cash or 9.00% payment-in-kind interest. |
| 14 | Payment-in-kind (“PIK”) security. Income may be paid in additional securities or cash at the discretion of the issuer -8.80% cash or 9.80% payment-in-kind interest. |
| 15 | Payment-in-kind (“PIK”) security. Income may be paid in additional securities or cash at the discretion of the issuer -5.00% cash or 6.00% payment-in-kind interest. |
| 16 | Payment-in-kind (“PIK”) security. Income may be paid in additional securities or cash at the discretion of the issuer -5.25% cash or 6.25% payment-in-kind interest. |
| 17 | Payment-in-kind (“PIK”) security. Income may be paid in additional securities or cash at the discretion of the issuer -5.50% cash or 6.50% payment-in-kind interest. |
| 18 | Payment-in-kind (“PIK”) security. Income may be paid in additional securities or cash at the discretion of the issuer -5.75% cash or 6.75% payment-in-kind interest. |
| 19 | Payment-in-kind (“PIK”) security. Income may be paid in additional securities or cash at the discretion of the issuer -6.00% cash or 7.00% payment-in-kind interest. |
| 20 | Payment-in-kind (“PIK”) security. Income may be paid in additional securities or cash at the discretion of the issuer -6.25% cash or 7.25% payment-in-kind interest. |
| 21 | Represents the current yield as of March 31, 2024. |
| 22 | Represents annualized yield at date of purchase. |
| * | Securities with a call or reset feature will have an effective maturity date sooner than the stated maturity. |
| ** | Securities backed by mortgage or consumer loans where payment is periodically made will have an effective maturity date sooner than the stated maturity date. |
See accompanying Notes to Financial Statements.
| Annual Report March 2024 / 68 |
Table of Contents
Flexible Income Fund
Schedule of Portfolio Investments
March 31, 2024
Note: For Fund compliance purposes, the Fund’s industry classifications refer to any one or more of the industry sub-classifications used by one or more widely recognized market indexes or ratings group indexes, and/or as defined by Fund management. This definition may not apply for purposes of this report, which may combine industry sub-classifications for more meaningful presentation for investors.
(CLO): Collateralized Loan Obligation
(EMTN): Euro Medium-Term Note
(EUR): Euro
(EURIBOR): Euro InterBank Offer Rate
(GBP): British Pound
(GMTN): Global Medium-Term Note
(IO): Interest Only
(LIBOR): London InterBank Offer Rate
(MTN): Medium-Term Note
(PO): Principal Only
(REIT): Real Estate Investment Trust
(SOFR): Secured Overnight Financing Rate
(SONIA): Sterling Overnight Index Average
(STEP): Step Coupon Bond
(TBA): To-Be-Announced
(TSFR): Term Secured overnight financing rate
(WI): When Issued
Currency to be Purchased | Currency to be Sold | Counterparty | Settlement Date | Unrealized Appreciation (Depreciation) | ||||||||
FOREIGN CURRENCY EXCHANGE CONTRACT | ||||||||||||
| USD 8,116,160 | EUR 7,380,000 | Citibank N.A. | 04/12/24 | $ | 141,121 | |||||||
| USD 542,618 | EUR 501,000 | Bank of America N.A. | 04/12/24 | 1,223 | ||||||||
| USD 169,800 | EUR 154,000 | Citibank N.A. | 04/12/24 | 3,383 | ||||||||
| USD 11,942 | EUR 11,000 | Goldman Sachs International | 04/12/24 | 55 | ||||||||
| USD 1,236,875 | GBP 969,000 | Citibank N.A. | 04/12/24 | 12,688 | ||||||||
|
| |||||||||||
| 158,470 | ||||||||||||
|
| |||||||||||
| EUR 531,000 | USD 577,755 | Bank of America N.A. | 04/12/24 | (3,941) | ||||||||
| EUR 1,808,000 | USD 1,964,926 | Citibank N.A. | 04/12/24 | (11,149) | ||||||||
| EUR 174,000 | USD 189,036 | The Bank of New York Mellon | 04/12/24 | (1,007) | ||||||||
|
| |||||||||||
| (16,097) | ||||||||||||
|
| |||||||||||
NET UNREALIZED APPRECIATION | $ | 142,373 | ||||||||||
|
| |||||||||||
| Description | Number of Contracts | Expiration Date | Notional Amount | Value | Unrealized Appreciation (Depreciation) | |||||||||||||
FUTURES CONTRACTS: LONG POSITIONS |
| |||||||||||||||||
U.S. Treasury Five-Year Note | 1,292 | 06/28/24 | $ | 138,264,194 | $ | 125,829 | $ | 125,829 | ||||||||||
U.S. Treasury Two-Year Note | 171 | 06/28/24 | 34,966,828 | (25,635) | (25,635) | |||||||||||||
|
|
|
|
|
| |||||||||||||
| 173,231,022 | 100,194 | 100,194 | ||||||||||||||||
|
|
|
|
|
| |||||||||||||
FUTURES CONTRACTS: SHORT POSITIONS | ||||||||||||||||||
U.S. Treasury Ten-Year Ultra Bond | 276 | 06/18/24 | (31,632,189) | (197,832) | (197,832) | |||||||||||||
U.S. Treasury Ultra Bond | 91 | 06/18/24 | (11,739,000) | (104,682) | (104,682) | |||||||||||||
Euro-Bobl Future | 16 | 06/06/24 | (2,043,360) | (8,692) | (8,692) | |||||||||||||
Euro-Bund Future | 12 | 06/06/24 | (1,728,605) | (12,068) | (12,068) | |||||||||||||
Long Gilt Future | 4 | 06/26/24 | (504,997) | (12,941) | (12,941) | |||||||||||||
Euro-Buxl 30 Year | 3 | 06/06/24 | (439,992) | (8,881) | (8,881) | |||||||||||||
Euro-Schatz Future | 3 | 06/06/24 | (342,468) | (64) | (64) | |||||||||||||
|
|
|
|
|
| |||||||||||||
| (48,430,611) | (345,160) | (345,160) | ||||||||||||||||
|
|
|
|
|
| |||||||||||||
TOTAL FUTURES CONTRACTS | $ | 124,800,411 | $ | (244,966) | $ | (244,966) | ||||||||||||
|
|
|
|
|
| |||||||||||||
See accompanying Notes to Financial Statements.
| 69 / Annual Report March 2024 |
Table of Contents
Schedule of Portfolio Investments
March 31, 2024
Issues |
| Maturity Date | Principal Amount | Value | ||||||||
BONDS – 95.13% |
| |||||||||||
ASSET-BACKED SECURITIES — 0.97%** |
| |||||||||||
AMMC CLO 18 Ltd., |
| |||||||||||
Series 2016-18A, Class BR |
| |||||||||||
(Cayman Islands) |
| |||||||||||
(CME Term SOFR 3-Month plus 1.86%) |
| |||||||||||
7.19% | 05/26/311,2,3 | $ | 915,000 |
| $ | 915,911 |
| |||||
AMMC CLO 30 Ltd., |
| |||||||||||
Series 2024-30A, Class A1 |
| |||||||||||
(Cayman Islands) |
| |||||||||||
(CME Term SOFR 3-Month plus 1.68%) |
| |||||||||||
6.97% | 01/15/371,2,3 |
| 750,000 |
|
| 753,337 |
| |||||
CIFC Funding Ltd., |
| |||||||||||
Series 2022-2A, Class A1 |
| |||||||||||
(Cayman Islands) |
| |||||||||||
(CME Term SOFR 3-Month plus 1.32%) |
| |||||||||||
6.63% | 04/19/351,2,3 |
| 500,000 |
|
| 500,362 |
| |||||
Elmwood CLO 15 Ltd., |
| |||||||||||
Series 2022-2A, Class A1 |
| |||||||||||
(United Kingdom) |
| |||||||||||
(CME Term SOFR 3-Month plus 1.34%) |
| |||||||||||
6.66% | 04/22/351,2,3 |
| 250,000 |
|
| 250,148 |
| |||||
Golub Capital Partners CLO 69M, |
| |||||||||||
Series 2023-69A, Class B1 |
| |||||||||||
(CME Term SOFR 3-Month plus 3.25%) |
| |||||||||||
8.66% | 11/09/361,3 |
| 500,000 |
|
| 505,470 |
| |||||
|
|
| ||||||||||
Total Asset-Backed Securities |
| |||||||||||
(Cost $2,885,172) |
|
| 2,925,228 |
| ||||||||
|
|
| ||||||||||
BANK LOANS — 91.58%* |
| |||||||||||
Automotive — 0.77% |
| |||||||||||
Clarios Global LP, |
| |||||||||||
Term Loan B, 1st Lien (Canada) |
| |||||||||||
(SOFR plus 3.00%) |
| |||||||||||
8.33% | 05/06/302,3 |
| 1,000,000 |
|
| 1,003,750 |
| |||||
First Brands Group LLC, |
| |||||||||||
Term Loan B, 1st Lien |
| |||||||||||
(SOFR plus 5.26%) |
| |||||||||||
10.57% | 03/30/273 |
| 1,332,525 |
|
| 1,336,190 |
| |||||
|
|
| ||||||||||
| 2,339,940 |
| ||||||||||
|
|
| ||||||||||
Communications — 5.21% |
| |||||||||||
Altice Financing SA, |
| |||||||||||
Term Loan B, 1st Lien (Luxembourg) |
| |||||||||||
(SOFR plus 5.00%) |
| |||||||||||
9.56% | 10/28/272,3 |
| 1,430,090 |
|
| 1,347,417 |
| |||||
CCI Buyer, Inc., |
| |||||||||||
Term Loan B, 1st Lien |
| |||||||||||
(SOFR plus 4.00%) |
| |||||||||||
9.30% | 12/17/273 |
| 1,088,539 |
|
| 1,083,581 |
| |||||
Ciena Corp., |
| |||||||||||
Term Loan B, 1st Lien |
| |||||||||||
(SOFR plus 2.00%) |
| |||||||||||
7.33% | 10/24/303 |
| 1,240,641 |
|
| 1,244,908 |
| |||||
Consolidated Communications, Inc., |
| |||||||||||
Term Loan B1, 1st Lien |
| |||||||||||
(SOFR plus 3.61%) |
| |||||||||||
8.94% | 10/02/273 |
| 750,000 |
|
| 713,723 |
| |||||
Issues |
| Maturity Date | Principal Amount | Value | ||||||||
BANK LOANS (continued) |
| |||||||||||
Communications (continued) |
| |||||||||||
CSC Holdings LLC, |
| |||||||||||
Term Loan B5, 1st Lien |
| |||||||||||
(SOFR plus 2.50%) |
| |||||||||||
7.94% | 04/15/273 | $ | 1,670,675 |
| $ | 1,514,943 |
| |||||
Cyxtera DC Holdings, Inc., |
| |||||||||||
Term Loan B, 1st Lien |
| |||||||||||
(SOFR plus 3.00%) |
| |||||||||||
5.07% | 05/01/243 |
| 350,844 |
|
| 18,011 |
| |||||
Frontier Communications Holdings LLC, |
| |||||||||||
Term Loan B, 1st Lien |
| |||||||||||
(SOFR plus 3.86%) |
| |||||||||||
8.62% | 10/08/273 |
| 723,250 |
|
| 722,573 |
| |||||
GoTo Group, Inc., |
| |||||||||||
Term Loan, 1st Lien |
| |||||||||||
(SOFR plus 4.85%) |
| |||||||||||
10.17% | 04/28/283 |
| 168,066 |
|
| 129,495 |
| |||||
10.17% | 04/30/283 |
| 121,703 |
|
| 116,353 |
| |||||
NEP Group, Inc., |
| |||||||||||
Term Loan |
| |||||||||||
(SOFR plus 4.11%) |
| |||||||||||
10.94% | 08/19/263 |
| 502,610 |
|
| 481,249 |
| |||||
Term Loan B, 1st Lien |
| |||||||||||
(SOFR plus 3.36%) |
| |||||||||||
8.69% | 08/19/263,4 |
| 986,228 |
|
| 942,775 |
| |||||
NEP/NCP Holdco, Inc., |
| |||||||||||
Term Loan, 2nd Lien |
| |||||||||||
(SOFR plus 7.11%) |
| |||||||||||
12.44% | 10/19/263 |
| 440,000 |
|
| 359,058 |
| |||||
New Insight Holdings, Inc., |
| |||||||||||
Term Loan B, 1st Lien |
| |||||||||||
(SOFR plus 5.76%) |
| |||||||||||
11.07% | 12/20/243 |
| 1,620,678 |
|
| 977,982 |
| |||||
Numericable U.S. LLC, |
| |||||||||||
Term Loan B14, 1st Lien |
| |||||||||||
(SOFR plus 5.50%) |
| |||||||||||
10.81% | 08/16/283 |
| 1,488,750 |
|
| 1,191,469 |
| |||||
Planet U.S. Buyer LLC, |
| |||||||||||
Term Loan B, 1st Lien |
| |||||||||||
(SOFR plus 3.50%) |
| |||||||||||
8.81% | 02/07/313 |
| 368,421 |
|
| 370,057 |
| |||||
Radiate Holdco LLC, |
| |||||||||||
Term Loan B, 1st Lien |
| |||||||||||
(SOFR plus 3.36%) |
| |||||||||||
8.69% | 09/25/263 |
| 246,843 |
|
| 207,348 |
| |||||
Red Ventures LLC, |
| |||||||||||
Term Loan B4, 1st Lien |
| |||||||||||
(SOFR plus 3.00%) |
| |||||||||||
8.33% | 03/03/303 |
| 491,259 |
|
| 489,768 |
| |||||
United Talent Agency LLC, |
| |||||||||||
Term Loan B, 1st Lien |
| |||||||||||
(SOFR plus 4.11%) |
| |||||||||||
9.44% | 07/07/283 |
| 987,342 |
|
| 990,427 |
| |||||
Virgin Media Bristol LLC, |
| |||||||||||
Term Loan Y, 1st Lien |
| |||||||||||
(SOFR plus 3.35%) |
| |||||||||||
8.79% | 03/31/313 |
| 1,200,000 |
|
| 1,183,830 |
| |||||
See accompanying Notes to Financial Statements.
| Annual Report March 2024 / 70 |
Table of Contents
Floating Rate Income Fund
Schedule of Portfolio Investments
March 31, 2024
| Issues | Maturity Date | Principal Amount | Value | |||||||||
| BANK LOANS (continued) |
| |||||||||||
| Communications (continued) |
| |||||||||||
| Zayo Group Holdings, Inc., |
| |||||||||||
| Term Loan B, 1st Lien |
| |||||||||||
| (SOFR plus 3.11%) |
| |||||||||||
8.44% | 03/09/273 | $ | 1,385,276 | $ | 1,219,438 | |||||||
| (SOFR plus 4.33%) |
| |||||||||||
9.66% | 03/09/273 | 490,000 | 440,760 | |||||||||
|
|
| ||||||||||
| 15,745,165 | ||||||||||||
|
|
| ||||||||||
Consumer Discretionary — 3.98% |
| |||||||||||
| Arterra Wines Canada, Inc., |
| |||||||||||
| Term Loan B1, 1st Lien |
| |||||||||||
| (SOFR plus 3.76%) |
| |||||||||||
9.07% | 11/24/273 | 518,799 | 482,319 | |||||||||
| BRE/Everbright M6 Borrower LLC, |
| |||||||||||
| Term Loan B, 1st Lien |
| |||||||||||
| (SOFR plus 5.10%) |
| |||||||||||
10.42% | 09/09/263 | 1,000,000 | 1,000,420 | |||||||||
| City Brewing Co. LLC, |
| |||||||||||
| Term Loan B, 1st Lien |
| |||||||||||
| (SOFR plus 3.76%) |
| |||||||||||
8.32% | 04/05/283 | 1,967,332 | 1,544,887 | |||||||||
| Crocs, Inc., |
| |||||||||||
| Term Loan B, 1st Lien |
| |||||||||||
| (SOFR plus 2.25%) |
| |||||||||||
7.55% - 7.58% | 02/20/293 | 451,740 | 453,355 | |||||||||
| Hanesbrands, Inc., |
| |||||||||||
| Term Loan A, 1st Lien |
| |||||||||||
| (SOFR plus 2.60%) |
| |||||||||||
7.93% | 11/19/263 | 973,684 | 960,296 | |||||||||
| Naked Juice, LLC, |
| |||||||||||
| Term Loan, 1st Lien (Luxembourg) |
| |||||||||||
| (SOFR plus 3.35%) |
| |||||||||||
8.66% | 01/24/292,3 | 491,250 | 460,714 | |||||||||
| Term Loan, 2nd Lien |
| |||||||||||
| (SOFR plus 6.10%) |
| |||||||||||
11.00% | 01/24/303 | 2,100,000 | 1,721,338 | |||||||||
| Osmosis Buyer Ltd., |
| |||||||||||
| Term Loan B, 1st Lien |
| |||||||||||
| (SOFR plus 3.75%) |
| |||||||||||
9.07% | 07/31/283 | 1,866,920 | 1,872,372 | |||||||||
| (SOFR plus 4.25%) |
| |||||||||||
9.57% - 9.58% | 07/31/283,5 | 358,957 | 361,014 | |||||||||
| Pegasus Bidco BV, |
| |||||||||||
| Term Loan B, 1st Lien (Netherlands) |
| |||||||||||
| (SOFR plus 3.75%) |
| |||||||||||
9.06% | 07/12/292,3 | 1,360,645 | 1,362,918 | |||||||||
| Tecta America Corp., |
| |||||||||||
| Term Loan B, 1st Lien |
| |||||||||||
| (SOFR plus 4.36%) |
| |||||||||||
9.69% | 04/10/283 | 859,697 | 862,989 | |||||||||
| Triton Water Holdings, Inc., |
| |||||||||||
| Term Loan B, 1st Lien |
| |||||||||||
| (SOFR plus 3.51%) |
| |||||||||||
8.23% | 03/31/283 | 959,418 | 950,548 | |||||||||
|
|
| ||||||||||
| 12,033,170 | ||||||||||||
|
|
| ||||||||||
| Issues | Maturity Date | Principal Amount | Value | |||||||||
| BANK LOANS (continued) |
| |||||||||||
| Electric — 1.65% |
| |||||||||||
| Calpine Construction Finance Co. LP, |
| |||||||||||
| Term Loan B, 1st Lien |
| |||||||||||
| (SOFR plus 2.25%) |
| |||||||||||
7.58% | 07/31/303 | $ | 646,750 | $ | 646,792 | |||||||
| Calpine Corp., |
| |||||||||||
| Term Loan B10, 1st Lien |
| |||||||||||
| (SOFR plus 2.00%) |
| |||||||||||
7.33% | 01/31/313 | 185,504 | 184,585 | |||||||||
| Term Loan B5, 1st Lien |
| |||||||||||
| (SOFR plus 2.00%) |
| |||||||||||
7.33% | 12/16/273 | 714,286 | 714,429 | |||||||||
| CommScope, Inc., |
| |||||||||||
| Term Loan B2, 1st Lien (France) |
| |||||||||||
| (SOFR plus 3.36%) |
| |||||||||||
8.69% | 04/06/262,3 | 427,859 | 389,352 | |||||||||
| Edgewater Generation LLC, |
| |||||||||||
| Term Loan B, 1st Lien |
| |||||||||||
| (SOFR plus 3.86%) |
| |||||||||||
9.19% | 12/13/253 | 734,433 | 733,097 | |||||||||
| Generation Bridge Northeast LLC, |
| |||||||||||
| Term Loan B, 1st Lien |
| |||||||||||
| (SOFR plus 3.50%) |
| |||||||||||
8.83% | 08/22/293 | 524,983 | 525,967 | |||||||||
| Hamilton Projects Acquiror LLC, |
| |||||||||||
| Term Loan B, 1st Lien |
| |||||||||||
| (SOFR plus 4.61%) |
| |||||||||||
9.94% | 06/17/273 | 430,080 | 432,063 | |||||||||
| Lackawanna Energy Center LLC, |
| |||||||||||
| Term Loan B2, 1st Lien |
| |||||||||||
| (SOFR plus 5.00%) |
| |||||||||||
10.33% | 08/06/293 | 704,177 | 701,536 | |||||||||
| Term Loan C, 1st Lien |
| |||||||||||
| (SOFR plus 5.00%) |
| |||||||||||
10.33% | 07/20/293 | 153,102 | 152,528 | |||||||||
| Talen Energy Supply, LLC, |
| |||||||||||
| Term Loan TLB, 1st Lien |
| |||||||||||
| (SOFR plus 4.50%) |
| |||||||||||
9.83% | 05/17/303 | 274,119 | 275,466 | |||||||||
| Term Loan TLC, 1st Lien |
| |||||||||||
| (SOFR plus 4.50%) |
| |||||||||||
9.83% | 05/17/303 | 223,810 | 224,910 | |||||||||
|
|
| ||||||||||
| 4,980,725 | ||||||||||||
|
|
| ||||||||||
Energy — 1.70% |
| |||||||||||
| Apro LLC, |
| |||||||||||
| Term Loan B, 1st Lien |
| |||||||||||
| (SOFR plus 3.86%) |
| |||||||||||
9.19% | 11/14/263 | 1,057,831 | 1,061,269 | |||||||||
| Bip Pipeco Holdings LLC, |
| |||||||||||
| Term Loan B, 1st Lien |
| |||||||||||
| (SOFR plus 3.25%) |
| |||||||||||
8.58% | 12/05/303 | 580,000 | 581,633 | |||||||||
| ChampionX Corp., |
| |||||||||||
| Term Loan B2, 1st Lien |
| |||||||||||
| (SOFR plus 2.85%) |
| |||||||||||
8.18% | 06/07/293 | 497,500 | 500,423 | |||||||||
See accompanying Notes to Financial Statements.
| 71 / Annual Report March 2024 |
Table of Contents
Floating Rate Income Fund
Schedule of Portfolio Investments
March 31, 2024
| Issues | Maturity Date | Principal Amount | Value | |||||||||
| BANK LOANS (continued) |
| |||||||||||
| Energy (continued) |
| |||||||||||
| ITT Holdings LLC, |
| |||||||||||
| Term Loan B, 1st Lien |
| |||||||||||
| (SOFR plus 3.35%) |
| |||||||||||
8.68% | 10/05/303 | $ | 1,310,488 | $ | 1,313,928 | |||||||
| NGL Energy Operating LLC, |
| |||||||||||
| Term Loan B, 1st Lien |
| |||||||||||
| (SOFR plus 4.50%) |
| |||||||||||
9.83% | 02/03/313 | 750,000 | 752,812 | |||||||||
| Parkway Generation LLC, |
| |||||||||||
| Term Loan B, 1st Lien |
| |||||||||||
| (SOFR plus 5.01%) |
| |||||||||||
10.32% | 02/18/293 | 472,145 | 471,673 | |||||||||
| Term Loan C, 1st Lien |
| |||||||||||
| (SOFR plus 5.01%) |
| |||||||||||
10.32% | 02/18/293 | 62,722 | 62,659 | |||||||||
| TMS International Corp., |
| |||||||||||
| Term Loan B, 1st Lien (Luxembourg) |
| |||||||||||
| (SOFR plus 4.25%) |
| |||||||||||
9.58% - 9.59% | 03/02/302,3 | 397,000 | 399,731 | |||||||||
|
|
| ||||||||||
| 5,144,128 | ||||||||||||
|
|
| ||||||||||
| Entertainment — 2.31% |
| |||||||||||
| Banijay Group U.S. Holding, Inc., |
| |||||||||||
| Term Loan B, 1st Lien |
| |||||||||||
| (SOFR plus 3.25%) |
| |||||||||||
8.57% | 03/01/283 | 678,727 | 680,777 | |||||||||
| Formula One Management Ltd., |
| |||||||||||
| Term Loan B, 1st Lien (Luxembourg) |
| |||||||||||
| (SOFR plus 2.25%) |
| |||||||||||
7.56% | 01/15/302,3 | 2,211,392 | 2,216,367 | |||||||||
| NAI Entertainment Holdings LLC, |
| |||||||||||
| Term Loan B, 1st Lien |
| |||||||||||
| (SOFR plus 5.50%) |
| |||||||||||
10.83% | 05/08/253,6 | 713 | 710 | |||||||||
| SMG US Midco 2, Inc., |
| |||||||||||
| Term Loan, 1st Lien |
| |||||||||||
| (SOFR plus 2.76%) |
| |||||||||||
8.07% | 01/23/253 | 974,561 | 975,428 | |||||||||
| WildBrain Ltd., |
| |||||||||||
| Term Loan B, 1st Lien |
| |||||||||||
| (SOFR plus 4.25%) |
| |||||||||||
9.58% | 03/24/283 | 1,455,000 | 1,411,648 | |||||||||
| William Morris Endeavor Entertainment LLC, |
| |||||||||||
| Term Loan B1, 1st Lien |
| |||||||||||
| (SOFR plus 2.86%) |
| |||||||||||
8.19% | 05/16/253 | 1,696,817 | 1,697,725 | |||||||||
|
|
| ||||||||||
| 6,982,655 | ||||||||||||
|
|
| ||||||||||
| Finance — 2.84% |
| |||||||||||
| Auris Lux III SA, |
| |||||||||||
| Term Loan B2, 1st Lien (Luxembourg) |
| |||||||||||
| (SOFR plus 3.75%) |
| |||||||||||
9.62% | 02/27/262,3 | 1,187,509 | 1,191,594 | |||||||||
| Issues | Maturity Date | Principal Amount | Value | |||||||||
| BANK LOANS (continued) |
| |||||||||||
| Finance (continued) |
| |||||||||||
| Avolon TLB Borrower 1 U.S. LLC, |
| |||||||||||
| Term Loan B6, 1st Lien |
| |||||||||||
| (SOFR plus 2.00%) |
| |||||||||||
7.33% | 06/22/283 | $ | 997,500 | $ | 998,906 | |||||||
| Blackhawk Network Holdings, Inc., |
| |||||||||||
| Term Loan B1, 1st Lien |
| |||||||||||
| (SOFR plus 5.00%) |
| |||||||||||
10.33% | 02/27/293 | 750,000 | 752,153 | |||||||||
| Cushman & Wakefield U.S. Borrower LLC, |
| |||||||||||
| Term Loan B, 1st Lien |
| |||||||||||
| (SOFR plus 3.35%) |
| |||||||||||
8.15% | 01/31/303 | 422,232 | 421,573 | |||||||||
| DCG Acquisition Corp., |
| |||||||||||
| Term Loan, 1st Lien |
| |||||||||||
| (SOFR plus 4.60%) |
| |||||||||||
9.93% | 09/30/263 | 1,030,670 | 1,032,927 | |||||||||
| Deerfield Dakota Holding LLC, |
| |||||||||||
| Term Loan B, 1st Lien |
| |||||||||||
| (SOFR plus 3.75%) |
| |||||||||||
9.06% | 04/09/273 | 973,299 | 969,717 | |||||||||
| Term Loan B, 2nd Lien |
| |||||||||||
| (SOFR plus 7.01%) |
| |||||||||||
8.65% | 04/07/283 | 250,000 | 250,469 | |||||||||
| Finco I LLC, |
| |||||||||||
| Term Loan B, 1st Lien |
| |||||||||||
| (SOFR plus 3.00%) |
| |||||||||||
8.31% | 06/27/293 | 516,100 | 517,659 | |||||||||
| Guardian U.S. Holdco, |
| |||||||||||
| Term Loan B, 1st Lien |
| |||||||||||
| (SOFR plus 3.50%) |
| |||||||||||
8.81% | 01/31/303 | 389,083 | 390,590 | |||||||||
| Guggenheim Partners Investment Management Holdings LLC, |
| |||||||||||
| Term Loan B, 1st Lien |
| |||||||||||
| (SOFR plus 3.25%) |
| |||||||||||
8.55% | 12/12/293 | 740,625 | 744,484 | |||||||||
| Jane Street Group LLC, |
| |||||||||||
| Term Loan B, 1st Lien |
| |||||||||||
| (SOFR plus 2.61%) |
| |||||||||||
7.94% | 01/26/283 | 946,340 | 947,878 | |||||||||
| WEC U.S. Holdings Ltd., |
| |||||||||||
| Term Loan B, 1st Lien |
| |||||||||||
| (SOFR plus 2.75%) |
| |||||||||||
8.08% | 01/27/313 | 355,263 | 355,263 | |||||||||
|
|
| ||||||||||
| 8,573,213 | ||||||||||||
|
|
| ||||||||||
| Food — 3.34% |
| |||||||||||
| 8th Avenue Food & Provisions, Inc., |
| |||||||||||
| Term Loan B, 1st Lien |
| |||||||||||
| (SOFR plus 3.86%) |
| |||||||||||
9.19% | 10/01/253 | 487,016 | 479,643 | |||||||||
| (SOFR plus 4.86%) |
| |||||||||||
10.19% | 10/01/253 | 487,500 | 480,594 | |||||||||
| Term Loan, 2nd Lien |
| |||||||||||
| (SOFR plus 7.86%) |
| |||||||||||
13.19% | 10/01/263 | 870,000 | 796,050 | |||||||||
See accompanying Notes to Financial Statements.
| Annual Report March 2024 / 72 |
Table of Contents
Floating Rate Income Fund
Schedule of Portfolio Investments
March 31, 2024
| Issues | Maturity Date | Principal Amount | Value | |||||||||
| BANK LOANS (continued) |
| |||||||||||
| Food (continued) |
| |||||||||||
| Aramark Services, Inc., |
| |||||||||||
| Term Loan B7, 1st Lien |
| |||||||||||
| (SOFR plus 2.00%) |
| |||||||||||
7.33% | 04/06/283 | $ | 1,000,000 | $ | 1,001,565 | |||||||
| Chobani LLC, |
| |||||||||||
| Term Loan B, 1st Lien |
| |||||||||||
| (SOFR plus 3.61%) |
| |||||||||||
8.42% | 10/25/273 | 716,396 | 719,082 | |||||||||
| Dessert Holdings, Inc., |
| |||||||||||
| Term Loan, 1st Lien |
| |||||||||||
| (SOFR plus 4.11%) |
| |||||||||||
9.44% | 06/09/283 | 852,276 | 798,480 | |||||||||
| Fiesta Purchaser, Inc., |
| |||||||||||
| Term Loan B, 1st Lien |
| |||||||||||
| (SOFR plus 4.00%) |
| |||||||||||
9.33% | 02/12/313 | 845,610 | 848,016 | |||||||||
| Froneri U.S., Inc., |
| |||||||||||
| Term Loan B, 1st Lien |
| |||||||||||
| (SOFR plus 2.35%) |
| |||||||||||
7.68% | 01/29/273 | 639,132 | 640,196 | |||||||||
| H-Food Holdings LLC, |
| |||||||||||
| Term Loan, 1st Lien |
| |||||||||||
| (SOFR plus 3.95%) |
| |||||||||||
9.29% | 05/23/253 | 245,443 | 179,635 | |||||||||
| Matterhorn Merger Sub LLC, |
| |||||||||||
| Term Loan B2, 1st Lien |
| |||||||||||
| (SOFR plus 4.26%) |
| |||||||||||
9.60% | 05/23/253 | 1,446,974 | 1,059,011 | |||||||||
| Sigma Holdco BV, |
| |||||||||||
| Term Loan B7, 1st Lien |
| |||||||||||
| (SOFR plus 4.91%) |
| |||||||||||
10.31% | 01/02/283 | 515,037 | 513,348 | |||||||||
| Simply Good Foods USA, Inc., |
| |||||||||||
| Term Loan B, 1st Lien |
| |||||||||||
| (SOFR plus 2.60%) |
| |||||||||||
7.93% | 03/17/273 | 171,429 | 171,697 | |||||||||
| Snacking Investments Bidco, |
| |||||||||||
| Term Loan B, 1st Lien |
| |||||||||||
| (SOFR plus 4.00%) |
| |||||||||||
9.33% | 12/18/263 | 1,212,824 | 1,216,105 | |||||||||
| Solina Group Services, |
| |||||||||||
| Term Loan B, 1st Lien |
| |||||||||||
| (SOFR plus 3.75%) |
| |||||||||||
9.07% | 02/28/293 | 477,273 | 478,767 | |||||||||
| Utz Quality Foods LLC, |
| |||||||||||
| Term Loan B, 1st Lien |
| |||||||||||
| (SOFR plus 3.11%) |
| |||||||||||
7.92% | 01/20/283 | 696,896 | 699,011 | |||||||||
|
|
| ||||||||||
| 10,081,200 | ||||||||||||
|
|
| ||||||||||
| Gaming — 3.02% |
| |||||||||||
| Bally’s Corp., |
| |||||||||||
| Term Loan B, 1st Lien |
| |||||||||||
| (SOFR plus 3.51%) |
| |||||||||||
8.83% | 10/02/283 | 240,675 | 226,585 | |||||||||
| Issues | Maturity Date | Principal Amount | Value | |||||||||
| BANK LOANS (continued) |
| |||||||||||
| Gaming (continued) |
| |||||||||||
| Caesars Entertainment, Inc., |
| |||||||||||
| Term Loan B, 1st Lien |
| |||||||||||
| (SOFR plus 3.35%) |
| |||||||||||
8.15% | 02/06/303 | $ | 445,500 | $ | 447,326 | |||||||
| Term Loan B1, 1st Lien |
| |||||||||||
| (SOFR plus 2.75%) |
| |||||||||||
8.04% | 02/06/313 | 520,000 | 521,056 | |||||||||
| Entain PLC, |
| |||||||||||
| Term Loan B2, 1st Lien |
| |||||||||||
| (SOFR plus 3.60%) |
| |||||||||||
8.91% | 10/31/293 | 395,003 | 397,101 | |||||||||
| Flutter Entertainment PLC, |
| |||||||||||
| Term Loan B, 1st Lien (Ireland) |
| |||||||||||
| (SOFR plus 2.25%) |
| |||||||||||
7.56% | 11/25/302,3 | 1,267,170 | 1,269,996 | |||||||||
| GVC Holdings Gibraltar Ltd., |
| |||||||||||
| Term Loan B4, 1st Lien |
| |||||||||||
| (SOFR plus 2.60%) |
| |||||||||||
7.91% | 03/29/273 | 1,701,875 | 1,706,308 | |||||||||
| J&J Ventures Gaming LLC, |
| |||||||||||
| Delayed-Draw Term Loan B, 1st Lien |
| |||||||||||
| (SOFR plus 4.36%) |
| |||||||||||
9.69% | 04/26/283 | 500,000 | 496,250 | |||||||||
| Ontario Gaming Gta Ltd. Partnership, |
| |||||||||||
| Term Loan B, 1st Lien (Canada) |
| |||||||||||
| (SOFR plus 4.25%) |
| |||||||||||
9.57% | 08/01/302,3 | 1,018,003 | 1,022,731 | |||||||||
| PCI Gaming Authority, |
| |||||||||||
| Term Loan B, 1st Lien |
| |||||||||||
| (SOFR plus 2.61%) |
| |||||||||||
7.94% | 05/29/263 | 1,250,000 | 1,254,050 | |||||||||
| Penn National Gaming, Inc., |
| |||||||||||
| Term Loan B, 1st Lien |
| |||||||||||
| (SOFR plus 2.85%) |
| |||||||||||
7.66% | 05/03/293 | 982,500 | 984,652 | |||||||||
| Scientific Games International, Inc., |
| |||||||||||
| Term Loan B, 1st Lien |
| |||||||||||
| (SOFR plus 2.75%) |
| |||||||||||
8.08% | 04/14/293 | 783,559 | 786,223 | |||||||||
|
|
| ||||||||||
| 9,112,278 | ||||||||||||
|
|
| ||||||||||
| Health Care — 13.43% |
| |||||||||||
| Accent Care, |
| |||||||||||
| Term Loan |
| |||||||||||
| (SOFR plus 5.50%) |
| |||||||||||
10.69% | 06/20/283 | 616,653 | 626,288 | |||||||||
| ADMI Corp., |
| |||||||||||
| Term Loan B1, 1st Lien |
| |||||||||||
| (SOFR plus 5.75%) |
| |||||||||||
11.08% | 12/23/273 | 748,125 | 749,763 | |||||||||
| Bausch + Lomb Corp., |
| |||||||||||
| Term Loan B, 1st Lien (Canada) |
| |||||||||||
| (SOFR plus 3.35%) |
| |||||||||||
8.68% | 05/10/272,3 | 1,256,276 | 1,244,655 | |||||||||
See accompanying Notes to Financial Statements.
| 73 / Annual Report March 2024 |
Table of Contents
Floating Rate Income Fund
Schedule of Portfolio Investments
March 31, 2024
| Issues | Maturity Date | Principal Amount | Value | |||||||||
| BANK LOANS (continued) |
| |||||||||||
| Health Care (continued) |
| |||||||||||
| Term Loan, 1st Lien (Canada) |
| |||||||||||
| (SOFR plus 4.00%) |
| |||||||||||
9.33% | 09/29/282,3 | $ | 497,500 | $ | 498,125 | |||||||
| Bella Holding Co. LLC, |
| |||||||||||
| Term Loan, 1st Lien |
| |||||||||||
| (SOFR plus 3.85%) |
| |||||||||||
9.18% | 05/10/283 | 477,551 | 477,417 | |||||||||
| Carestream Dental Equipment, Inc., |
| |||||||||||
| Term Loan, 1st Lien |
| |||||||||||
| (LIBOR plus 3.25%) |
| |||||||||||
8.56% | 09/01/243 | 250,000 | 218,334 | |||||||||
| Carestream Dental, Inc., |
| |||||||||||
| Term Loan, 1st Lien |
| |||||||||||
| (LIBOR plus 4.50%) |
| |||||||||||
9.94% | 09/01/243 | 1,564,013 | 1,365,250 | |||||||||
| Catalent Pharma Solutions, Inc., |
| |||||||||||
| Term Loan B3, 1st Lien |
| |||||||||||
| (SOFR plus 2.11%) |
| |||||||||||
7.44% | 02/22/283 | 991,062 | 991,681 | |||||||||
| Term Loan B4, 1st Lien |
| |||||||||||
| (SOFR plus 3.00%) |
| |||||||||||
8.33% | 02/22/283 | 1,037,499 | 1,041,390 | |||||||||
| Certara Holdco, Inc., |
| |||||||||||
| Term Loan B, 1st Lien (France) |
| |||||||||||
| (SOFR plus 3.76%) |
| |||||||||||
9.10% | 08/15/262,3 | 1,945,000 | 1,949,862 | |||||||||
| Charlotte Buyer, Inc., |
| |||||||||||
| Term Loan B, 1st Lien |
| |||||||||||
| (SOFR plus 5.25%) |
| |||||||||||
10.57% | 02/11/283 | 1,567,064 | 1,574,101 | |||||||||
| Curia Global, Inc., |
| |||||||||||
| Term Loan B, 1st Lien |
| |||||||||||
| (SOFR plus 3.85%) |
| |||||||||||
9.16% | 08/30/263 | 1,102,577 | 1,053,132 | |||||||||
| Curium Bidco SARL, |
| |||||||||||
| Term Loan B, 1st Lien (Luxembourg) |
| |||||||||||
| (SOFR plus 4.50%) |
| |||||||||||
9.81% | 07/31/292,3 | 994,987 | 1,001,206 | |||||||||
| CVET Midco 2 LP, |
| |||||||||||
| Term Loan, 1st Lien |
| |||||||||||
| (SOFR plus 5.00%) |
| |||||||||||
10.31% | 10/13/293 | 542,639 | 543,958 | |||||||||
| eResearchTechnology, Inc., |
| |||||||||||
| Term Loan B, 1st Lien |
| |||||||||||
| (SOFR plus 4.61%) |
| |||||||||||
9.94% | 02/04/273 | 1,478,134 | 1,484,269 | |||||||||
| Financiere Mendel, |
| |||||||||||
| Term Loan B, 1st Lien (France) |
| |||||||||||
| (SOFR plus 4.25%) |
| |||||||||||
9.56% | 11/12/302,3 | 530,121 | 531,976 | |||||||||
| Genesee & Wyoming, Inc., |
| |||||||||||
| Term Loan, 1st Lien |
| |||||||||||
| (SOFR plus 2.10%) |
| |||||||||||
7.40% | 12/30/263 | 496,124 | 497,007 | |||||||||
| Issues | Maturity Date | Principal Amount | Value | |||||||||
| BANK LOANS (continued) |
| |||||||||||
| Health Care (continued) |
| |||||||||||
| Grifols Worldwide Operations USA, Inc., |
| |||||||||||
| Term Loan B, 1st Lien |
| |||||||||||
| (SOFR plus 2.15%) |
| |||||||||||
7.46% | 11/15/273 | $ | 498,698 | $ | 483,954 | |||||||
| Heartland Dental LLC, |
| |||||||||||
| Term Loan B, 1st Lien |
| |||||||||||
| (SOFR plus 5.00%) |
| |||||||||||
10.33% | 04/28/283 | 976,811 | 980,049 | |||||||||
| Inception Finco SARL, |
| |||||||||||
| Term Loan B, 1st Lien (Luxembourg) |
| |||||||||||
| (SOFR plus 4.50%) |
| |||||||||||
9.82% | 03/17/312,3 | 333,333 | 333,542 | |||||||||
| IVC Acquisition Ltd., |
| |||||||||||
| Term Loan B, 1st Lien (Canada) |
| |||||||||||
| (SOFR plus 5.50%) |
| |||||||||||
10.81% | 12/12/282,3 | 1,072,313 | 1,076,334 | |||||||||
| Jazz Financing Lux SARL, |
| |||||||||||
| Term Loan B, 1st Lien (Luxembourg) |
| |||||||||||
| (SOFR plus 3.11%) |
| |||||||||||
8.44% | 05/05/282,3 | 1,800,746 | 1,812,000 | |||||||||
| National Seating & Mobility, |
| |||||||||||
| Term Loan, 1st Lien |
| |||||||||||
| (SOFR plus 5.35%) |
| |||||||||||
10.66% | 11/16/263 | 1,431,005 | 1,423,406 | |||||||||
| NMN Holdings III Corp., |
| |||||||||||
| Term Loan, 1st Lien |
| |||||||||||
| (SOFR plus 3.61%) |
| |||||||||||
8.94% | 11/13/253 | 1,382,287 | 1,362,707 | |||||||||
| Option Care Health, Inc., |
| |||||||||||
| Term Loan B, 1st Lien |
| |||||||||||
| (SOFR plus 2.86%) |
| |||||||||||
8.19% | 10/27/283 | 1,955,000 | 1,963,308 | |||||||||
| Organon & Co., |
| |||||||||||
| Term Loan B, 1st Lien |
| |||||||||||
| (SOFR plus 3.11%) |
| |||||||||||
7.75% | 06/02/283 | 1,301,675 | 1,307,917 | |||||||||
| Pacific Dental Services LLC, |
| |||||||||||
| Term Loan B, 1st Lien |
| |||||||||||
| (SOFR plus 3.25%) |
| |||||||||||
8.57% | 03/17/313 | 975,000 | 976,423 | |||||||||
| Parexel International, Inc., |
| |||||||||||
| Term Loan, 1st Lien |
| |||||||||||
| (SOFR plus 3.36%) |
| |||||||||||
8.69% | 11/15/283 | 1,956,297 | 1,962,968 | |||||||||
| Peraton Corp., |
| |||||||||||
| Term Loan B, 1st Lien |
| |||||||||||
| (SOFR plus 3.85%) |
| |||||||||||
9.18% | 02/01/283 | 1,139,304 | 1,140,466 | |||||||||
| Perrigo Investments LLC, |
| |||||||||||
| Term Loan B, 1st Lien |
| |||||||||||
| (SOFR plus 2.35%) |
| |||||||||||
7.15% | 04/20/293 | 1,471,266 | 1,468,816 | |||||||||
| Pluto Acquisition I, Inc., |
| |||||||||||
| Term Loan B, 1st Lien |
| |||||||||||
| (SOFR plus 4.00%) |
| |||||||||||
9.32% | 09/20/283 | 1,225,653 | 1,078,575 | |||||||||
See accompanying Notes to Financial Statements.
| Annual Report March 2024 / 74 |
Table of Contents
Floating Rate Income Fund
Schedule of Portfolio Investments
March 31, 2024
| Issues | Maturity Date | Principal Amount | Value | |||||||||
| BANK LOANS (continued) |
| |||||||||||
| Health Care (continued) |
| |||||||||||
| Prestige Brands, Inc., |
| |||||||||||
| Term Loan B5, 1st Lien |
| |||||||||||
| (SOFR plus 2.11%) |
| |||||||||||
7.44% | 07/03/283 | $ | 536,932 | $ | 540,288 | |||||||
| Resonetics LLC, |
| |||||||||||
| Term Loan, 1st Lien |
| |||||||||||
| (SOFR plus 4.26%) |
| |||||||||||
9.60% | 04/28/283 | 1,707,472 | 1,713,568 | |||||||||
| RXB Holdings, Inc., |
| |||||||||||
| Term Loan B, 1st Lien |
| |||||||||||
| (SOFR plus 4.61%) |
| |||||||||||
9.94% | 12/20/273 | 496,173 | 498,654 | |||||||||
| (SOFR plus 5.25%) |
| |||||||||||
10.58% | 12/20/273 | 701,068 | 702,821 | |||||||||
| Sharp Services LLC, |
| |||||||||||
| Term Loan B, 1st Lien |
| |||||||||||
| (SOFR plus 4.10%) |
| |||||||||||
9.41% | 12/31/283 | 974,446 | 975,060 | |||||||||
| (SOFR plus 4.50%) |
| |||||||||||
9.81% | 12/31/283 | 250,000 | 250,470 | |||||||||
| Star Parent, Inc., |
| |||||||||||
| Term Loan B, 1st Lien |
| |||||||||||
| (SOFR plus 4.00%) |
| |||||||||||
9.31% | 09/27/303 | 1,514,644 | 1,507,169 | |||||||||
| Surgery Center Holdings, Inc., |
| |||||||||||
| Term Loan, 1st Lien |
| |||||||||||
| (SOFR plus 3.50%) |
| |||||||||||
8.83% | 12/19/303 | 500,000 | 502,952 | |||||||||
| U.S. Renal Care, Inc., |
| |||||||||||
| Term Loan, 1st Lien |
| |||||||||||
| (SOFR plus 5.11%) |
| |||||||||||
10.44% | 06/20/283 | 183,389 | 159,854 | |||||||||
| Vizient, Inc., |
| |||||||||||
| Term Loan B7, 1st Lien |
| |||||||||||
| (SOFR plus 2.35%) |
| |||||||||||
7.68% | 05/16/293 | 494,962 | 497,561 | |||||||||
|
|
| ||||||||||
| 40,567,276 | ||||||||||||
|
|
| ||||||||||
| Industrial REITs — 0.56% |
| |||||||||||
| Avison Second Out, |
| |||||||||||
| Term Loan |
| |||||||||||
| (SOFR plus 8.26%) |
| |||||||||||
13.58% | 03/12/293 | 465,771 | 372,617 | |||||||||
| Avison Third Out, |
| |||||||||||
| Term Loan |
| |||||||||||
| (SOFR plus 8.26%) |
| |||||||||||
13.58% | 03/12/293 | 156,390 | 93,443 | |||||||||
| Avison Young USA, Inc., |
| |||||||||||
| Term Loan, 1st Lien |
| |||||||||||
| (LIBOR plus 4.75%) |
| |||||||||||
4.75% | 05/17/283 | 1,242,139 | 1,229,332 | |||||||||
|
|
| ||||||||||
| 1,695,392 | ||||||||||||
|
|
| ||||||||||
| Issues | Maturity Date | Principal Amount | Value | |||||||||
| BANK LOANS (continued) |
| |||||||||||
| Industrials — 14.27% |
| |||||||||||
| Alliance Laundry Systems, LLC, |
| |||||||||||
| Term Loan B, 1st Lien |
| |||||||||||
| (SOFR plus 3.60%) |
| |||||||||||
8.93% | 10/08/273 | $ | 1,317,834 | $ | 1,323,685 | |||||||
| Arcline FM Holdings LLC, |
| |||||||||||
| Term Loan, 1st Lien |
| |||||||||||
| (SOFR plus 4.75%) |
| |||||||||||
10.33% | 06/23/283 | 748,082 | 749,485 | |||||||||
| Artera Services LLC, |
| |||||||||||
| Term Loan, 1st Lien |
| |||||||||||
| (SOFR plus 4.50%) |
| |||||||||||
9.81% | 02/15/313 | 1,218,750 | 1,224,844 | |||||||||
| AZZ, Inc., |
| |||||||||||
| Term Loan B, 1st Lien |
| |||||||||||
| (SOFR plus 3.25%) |
| |||||||||||
8.91% - 9.33% | 05/14/293 | 1,484,531 | 1,493,252 | |||||||||
| BCPE Empire Holdings, Inc., |
| |||||||||||
| Term Loan, 1st Lien |
| |||||||||||
| (SOFR plus 4.00%) |
| |||||||||||
9.33% | 12/11/283 | 1,286,209 | 1,289,103 | |||||||||
| Bleriot U.S. Bidco, Inc., |
| |||||||||||
| Term Loan B, 1st Lien |
| |||||||||||
| (SOFR plus 4.26%) |
| |||||||||||
9.57% | 10/31/283 | 964,193 | 969,014 | |||||||||
| Brown Group Holding LLC, |
| |||||||||||
| Term Loan B2, 1st Lien |
| |||||||||||
| (SOFR plus 3.00%) |
| |||||||||||
8.31% - 8.34% | 07/02/293 | 563,138 | 563,808 | |||||||||
| Coherent Corp., |
| |||||||||||
| Term Loan B, 1st Lien |
| |||||||||||
| (SOFR plus 2.50%) |
| |||||||||||
7.82% | 07/02/293 | 1,111,594 | 1,111,594 | |||||||||
| (SOFR plus 2.86%) |
| |||||||||||
7.38% - 7.67% | 07/02/293 | 434,933 | 436,347 | |||||||||
| Compass Power Generation LLC, |
| |||||||||||
| Term Loan B, 1st Lien |
| |||||||||||
| (SOFR plus 4.36%) |
| |||||||||||
9.69% | 04/14/293 | 779,843 | 785,582 | |||||||||
| Conserve Merger Sub, Inc., |
| |||||||||||
| Term Loan, 1st Lien (France) |
| |||||||||||
| (SOFR plus 3.60%) |
| |||||||||||
8.93% | 08/08/252,3 | 1,890,000 | 1,892,655 | |||||||||
| Convergint Technologies, |
| |||||||||||
| Term Loan, 1st Lien |
| |||||||||||
| (SOFR plus 3.86%) |
| |||||||||||
9.19% | 03/31/283 | 486,266 | 486,786 | |||||||||
| Dermatology Intermediate Holdings, Inc., |
| |||||||||||
| Term Loan, 1st Lien |
| |||||||||||
| (SOFR plus 4.25%) |
| |||||||||||
9.56% | 03/30/293 | 773,038 | 756,611 | |||||||||
| DG Investment Intermediate Holdings 2, Inc., |
| |||||||||||
| Term Loan, 2nd Lien |
| |||||||||||
| (SOFR plus 6.86%) |
| |||||||||||
12.19% | 03/30/293 | 250,000 | 234,688 | |||||||||
See accompanying Notes to Financial Statements.
| 75 / Annual Report March 2024 |
Table of Contents
Floating Rate Income Fund
Schedule of Portfolio Investments
March 31, 2024
| Issues | Maturity Date | Principal Amount | Value | |||||||||
| BANK LOANS (continued) |
| |||||||||||
| Industrials (continued) |
| |||||||||||
| DTI Holdco, Inc., |
| |||||||||||
| Term Loan B, 1st Lien |
| |||||||||||
| (SOFR plus 4.75%) |
| |||||||||||
10.06% | 04/26/293 | $ | 1,475,025 | $ | 1,476,869 | |||||||
| Eagle 4 Ltd., |
| |||||||||||
| Term Loan B, 1st Lien |
| |||||||||||
| (SOFR plus 4.01%) |
| |||||||||||
9.32% | 07/12/283 | 488,508 | 489,527 | |||||||||
| Filtration Group Corp., |
| |||||||||||
| Term Loan, 1st Lien |
| |||||||||||
| (SOFR plus 4.36%) |
| |||||||||||
9.69% | 10/21/283 | 1,008,614 | 1,012,966 | |||||||||
| Gates Global LLC, |
| |||||||||||
| Term Loan B4, 1st Lien |
| |||||||||||
| (SOFR plus 3.00%) |
| |||||||||||
8.33% | 11/16/293 | 492,500 | 494,699 | |||||||||
| Gopher Resource LLC, |
| |||||||||||
| Term Loan, 1st Lien |
| |||||||||||
| (LIBOR plus 3.25%) |
| |||||||||||
8.69% | 03/06/253 | 991,924 | 890,098 | |||||||||
| Graham Packaging Co., Inc., |
| |||||||||||
| Term Loan, 1st Lien |
| |||||||||||
| (SOFR plus 3.11%) |
| |||||||||||
8.44% | 08/04/273 | 500,000 | 500,470 | |||||||||
| Innio Group Holding GmbH, |
| |||||||||||
| Term Loan B, 1st Lien |
| |||||||||||
| (SOFR plus 4.25%) |
| |||||||||||
9.56% | 11/02/283 | 750,000 | 754,845 | |||||||||
| KAMC Holdings, Inc., |
| |||||||||||
| Term Loan, 1st Lien |
| |||||||||||
| (SOFR plus 4.26%) |
| |||||||||||
9.60% | 08/14/263,7,8 | 1,538,660 | 1,527,120 | |||||||||
| MI Windows and Doors LLC, |
| |||||||||||
| Term Loan B2, 1st Lien |
| |||||||||||
| (SOFR plus 3.50%) |
| |||||||||||
8.83% | 03/20/313 | 750,000 | 754,455 | |||||||||
| Michaels Cos., Inc. (The), |
| |||||||||||
| Term Loan, 1st Lien |
| |||||||||||
| (SOFR plus 4.51%) |
| |||||||||||
9.82% | 04/15/283 | 1,219,327 | 1,097,120 | |||||||||
| Minimax Viking GmbH - MX Holdings U.S., Inc., |
| |||||||||||
| Term Loan B, 1st Lien |
| |||||||||||
| (SOFR plus 2.86%) |
| |||||||||||
8.19% | 07/31/283 | 473,232 | 474,514 | |||||||||
| NMN Holdings III Corp., |
| |||||||||||
| Delayed-Draw Term Loan, 1st Lien |
| |||||||||||
| (SOFR plus 3.61%) |
| |||||||||||
8.94% | 11/13/253 | 296,657 | 292,455 | |||||||||
| Osmose Utilities Services, Inc., |
| |||||||||||
| Term Loan, 1st Lien |
| |||||||||||
| (SOFR plus 3.36%) |
| |||||||||||
7.88% | 06/23/283 | 115,123 | 113,756 | |||||||||
| Patriot Container Corp., |
| |||||||||||
| Term Loan B, 1st Lien |
| |||||||||||
| (SOFR plus 3.85%) |
| |||||||||||
9.18% | 03/20/253 | 1,977,897 | 1,922,792 | |||||||||
| Issues | Maturity Date | Principal Amount | Value | |||||||||
| BANK LOANS (continued) |
| |||||||||||
| Industrials (continued) |
| |||||||||||
| Term Loan, 2nd Lien |
| |||||||||||
| (SOFR plus 7.75%) |
| |||||||||||
13.08% | 03/20/263 | $ | 500,000 | $ | 435,000 | |||||||
| Peacock Merger Corp., |
| |||||||||||
| Term Loan, 1st Lien |
| |||||||||||
| (SOFR plus 4.51%) |
| |||||||||||
9.81% | 12/29/283 | 478,876 | 446,454 | |||||||||
| Plaze, Inc., |
| |||||||||||
| Term Loan B, 1st Lien |
| |||||||||||
| (SOFR plus 3.86%) |
| |||||||||||
9.19% | 08/03/263 | 483,750 | 477,703 | |||||||||
| Term Loan B, 1st Lien (Luxembourg) |
| |||||||||||
| (SOFR plus 3.61%) |
| |||||||||||
8.94% | 08/03/262,3 | 1,728,698 | 1,707,089 | |||||||||
| Pretium PKG Holdings, Inc., |
| |||||||||||
| Term Loan A, 1st Lien |
| |||||||||||
| (SOFR plus 7.50%) |
| |||||||||||
12.81% | 10/02/283,6 | 446,648 | 453,626 | |||||||||
| Term Loan A1, 1st Lien |
| |||||||||||
| (SOFR plus 4.60%) |
| |||||||||||
9.91% | 10/02/283,6 | 365,746 | 328,715 | |||||||||
| ProAmpac PG Borrower LLC, |
| |||||||||||
| Term Loan B, 1st Lien |
| |||||||||||
| (SOFR plus 4.50%) |
| |||||||||||
9.80% - 9.82% | 09/15/283 | 1,815,867 | 1,821,314 | |||||||||
| Protective Industrial Products, Inc., |
| |||||||||||
| Term Loan B, 1st Lien |
| |||||||||||
| (SOFR plus 4.11%) |
| |||||||||||
9.44% | 12/29/273 | 1,345,832 | 1,345,833 | |||||||||
| Rockwood Service Corp., |
| |||||||||||
| Term Loan B, 1st Lien |
| |||||||||||
| (SOFR plus 4.36%) |
| |||||||||||
9.69% | 01/23/273 | 177,649 | 178,538 | |||||||||
| SPX Flow, Inc., |
| |||||||||||
| Term Loan B, 1st Lien |
| |||||||||||
| (SOFR plus 4.60%) |
| |||||||||||
9.41% - 9.58% | 04/05/293 | 1,121,413 | 1,127,429 | |||||||||
| Standard Industries, Inc., |
| |||||||||||
| Term Loan B, 1st Lien |
| |||||||||||
| (SOFR plus 2.36%) |
| |||||||||||
7.69% | 09/22/283 | 485,227 | 485,996 | |||||||||
| Titan Acquisition, Ltd., |
| |||||||||||
| Term Loan B, 1st Lien |
| |||||||||||
| (SOFR plus 3.11%) |
| |||||||||||
8.44% | 03/28/253 | 497,355 | 497,561 | |||||||||
| TK Elevator Midco Gmbh, |
| |||||||||||
| Term Loan B, 1st Lien |
| |||||||||||
| (SOFR plus 3.50%) |
| |||||||||||
8.82% | 04/30/303 | 665,000 | 668,002 | |||||||||
| Transcendia Holdings, Inc., |
| |||||||||||
| Term Loan B, 1st Lien |
| |||||||||||
| (PRIME plus 2.50%) |
| |||||||||||
11.00% | 05/30/243 | 2,372,239 | 1,766,951 | |||||||||
See accompanying Notes to Financial Statements.
| Annual Report March 2024 / 76 |
Table of Contents
Floating Rate Income Fund
Schedule of Portfolio Investments
March 31, 2024
| Issues | Maturity Date | Principal Amount | Value | |||||||||
BANK LOANS (continued) |
| |||||||||||
| Industrials (continued) |
| |||||||||||
| Transdigm, Inc., |
| |||||||||||
| Term Loan I, 1st Lien |
| |||||||||||
| (SOFR plus 2.75%) |
| |||||||||||
8.08% | 08/24/283 | $ | 1,738,119 | $ | 1,746,001 | |||||||
| Vantage Elevator Solutions, |
| |||||||||||
| Term Loan, 1st Lien |
| |||||||||||
| (SOFR plus 4.01%) |
| |||||||||||
9.34% | 11/19/283 | 1,956,297 | 1,863,373 | |||||||||
| Verde Purchaser, LLC, |
| |||||||||||
| Term Loan B, 1st Lien |
| |||||||||||
| (SOFR plus 5.00%) |
| |||||||||||
10.31% | 11/30/303 | 450,000 | 448,034 | |||||||||
| Windsor Holdings III LLC, |
| |||||||||||
| Term Loan B, 1st Lien |
| |||||||||||
| (SOFR plus 4.00%) |
| |||||||||||
9.33% | 08/01/303 | 658,855 | 662,255 | |||||||||
| Wrench Group LLC, |
| |||||||||||
| Term Loan, 1st Lien |
| |||||||||||
| (SOFR plus 4.00%) |
| |||||||||||
9.44% | 04/30/263 | 1,504,835 | 1,511,893 | |||||||||
|
| |||||||||||
| 43,090,907 | ||||||||||||
|
| |||||||||||
| Information Technology — 16.50% |
| |||||||||||
| Applovin Corp., |
| |||||||||||
| Term Loan B, 1st Lien |
| |||||||||||
| (SOFR plus 2.50%) |
| |||||||||||
7.83% | 08/16/303 | 1,582,433 | 1,583,422 | |||||||||
| AQAAcquisition Holding, Inc., |
| |||||||||||
| Term Loan, 1st Lien |
| |||||||||||
| (SOFR plus 4.51%) |
| |||||||||||
9.82% | 03/03/283 | 684,481 | 685,771 | |||||||||
| Arches Buyer, Inc., |
| |||||||||||
| Term Loan B, 1st Lien |
| |||||||||||
| (SOFR plus 3.35%) |
| |||||||||||
8.68% | 12/06/273 | 588,276 | 571,160 | |||||||||
| Azalea Topco, Inc., |
| |||||||||||
| Term Loan B, 1st Lien |
| |||||||||||
| (SOFR plus 3.85%) |
| |||||||||||
9.18% | 07/24/263 | 490,000 | 488,162 | |||||||||
| BMC Software (Boxer/Bladelogic), |
| |||||||||||
| Term Loan B, 1st Lien |
| |||||||||||
| (SOFR plus 4.25%) |
| |||||||||||
9.58% | 12/29/283 | 997,500 | 1,005,086 | |||||||||
| Buzz Merger Sub Ltd., |
| |||||||||||
| Term Loan B, 1st Lien |
| |||||||||||
| (SOFR plus 2.85%) |
| |||||||||||
8.18% | 01/29/273 | 1,490,943 | 1,496,072 | |||||||||
| Castle U.S. Holding Corp., |
| |||||||||||
| Term Loan B, 1st Lien |
| |||||||||||
| (SOFR plus 4.01%) |
| |||||||||||
9.35% | 01/29/273 | 966,667 | 684,434 | |||||||||
| Central Parent LLC, |
| |||||||||||
| Term Loan B, 1st Lien |
| |||||||||||
| (SOFR plus 4.00%) |
| |||||||||||
9.31% | 07/06/293 | 1,637,625 | 1,644,356 | |||||||||
| Issues | Maturity Date | Principal Amount | Value | |||||||||
BANK LOANS (continued) |
| |||||||||||
| Information Technology (continued) |
| |||||||||||
| CT Technologies Intermediate Holdings, Inc., |
| |||||||||||
| Term Loan, 1st Lien |
| |||||||||||
| (SOFR plus 4.36%) |
| |||||||||||
9.69% | 12/16/253 | $ | 1,841,752 | $ | 1,840,601 | |||||||
| Delivery Hero SE, |
| |||||||||||
| Term Loan B, 1st Lien |
| |||||||||||
| (SOFR plus 5.00%) |
| |||||||||||
10.33% | 12/12/293 | 851,064 | 846,809 | |||||||||
| Dodge Data & Analytics, LLC, |
| |||||||||||
| Term Loan, 1st Lien |
| |||||||||||
| (SOFR plus 4.75%) |
| |||||||||||
9.78% | 02/23/293 | 486,288 | 402,403 | |||||||||
| EagleView Technology Co., |
| |||||||||||
| Term Loan B, 1st Lien |
| |||||||||||
| (SOFR plus 3.76%) |
| |||||||||||
9.06% | 08/14/253 | 2,645,461 | 2,575,779 | |||||||||
| ECI Macola/Max Holding LLC, |
| |||||||||||
| Term Loan B, 1st Lien |
| |||||||||||
| (SOFR plus 3.75%) |
| |||||||||||
9.08% | 05/28/303 | 1,000,000 | 1,004,400 | |||||||||
| Electron Bidco, Inc., |
| |||||||||||
| Term Loan, 1st Lien |
| |||||||||||
| (SOFR plus 3.11%) |
| |||||||||||
8.44% | 11/01/283 | 980,000 | 983,136 | |||||||||
| Emerald Topco, Inc., |
| |||||||||||
| Term Loan B, 1st Lien |
| |||||||||||
| (SOFR plus 3.61%) |
| |||||||||||
8.94% | 07/24/263 | 1,293,334 | 1,288,212 | |||||||||
| Epicor Software Corp., |
| |||||||||||
| Term Loan D, 1st Lien |
| |||||||||||
| (SOFR plus 3.75%) |
| |||||||||||
9.08% | 07/30/273 | 748,125 | 752,868 | |||||||||
| EQT Box Merger Sub, Inc., |
| |||||||||||
| Term Loan B, 1st Lien |
| |||||||||||
| (SOFR plus 3.50%) |
| |||||||||||
8.68% - 8.83% | 04/17/283 | 1,470,550 | 1,473,925 | |||||||||
| Evertec Group LLC, |
| |||||||||||
| Term Loan B, 1st Lien (Puerto Rico) |
| |||||||||||
| (SOFR plus 3.50%) |
| |||||||||||
8.83% | 10/30/302,3 | 353,571 | 354,897 | |||||||||
| Gainwell Acquisition Corp., |
| |||||||||||
| Term Loan B, 1st Lien |
| |||||||||||
| (SOFR plus 4.10%) |
| |||||||||||
8.72% - 8.99% | 10/01/273 | 1,454,887 | 1,394,328 | |||||||||
| Genesys Cloud Services Holdings II LLC, |
| |||||||||||
| Term Loan B, 1st Lien |
| |||||||||||
| (SOFR plus 3.86%) |
| |||||||||||
9.19% | 12/01/273 | 750,000 | 753,754 | |||||||||
| Go Daddy Operating Co., LLC, |
| |||||||||||
| Term Loan B6, 1st Lien |
| |||||||||||
| (SOFR plus 2.00%) |
| |||||||||||
7.33% | 11/09/293 | 746,250 | 746,642 | |||||||||
| Helios Software Holdings, Inc., |
| |||||||||||
| Term Loan B, 1st Lien |
| |||||||||||
| (SOFR plus 3.75%) |
| |||||||||||
9.07% | 07/18/303 | 1,154,207 | 1,146,278 | |||||||||
See accompanying Notes to Financial Statements.
| 77 / Annual Report March 2024 |
Table of Contents
Floating Rate Income Fund
Schedule of Portfolio Investments
March 31, 2024
| Issues | Maturity Date | Principal Amount | Value | |||||||||
BANK LOANS (continued) |
| |||||||||||
| Information Technology (continued) |
| |||||||||||
| Idemia America Corp., |
| |||||||||||
| Term Loan B, 1st Lien |
| |||||||||||
| (SOFR plus 4.25%) |
| |||||||||||
9.56% | 09/30/283 | $ | 441,997 | $ | 445,035 | |||||||
| Instructure Holdings, Inc., |
| |||||||||||
| Term Loan B, 1st Lien |
| |||||||||||
| (SOFR plus 3.01%) |
| |||||||||||
8.35% | 10/30/283 | 249,364 | 249,676 | |||||||||
| Iron Mountain Information Management LLC, |
| |||||||||||
| Term Loan B, 1st Lien |
| |||||||||||
| (SOFR plus 2.25%) |
| |||||||||||
7.58% | 01/31/313 | 766,372 | 761,900 | |||||||||
| Magenta Buyer LLC, |
| |||||||||||
| Term Loan, 1st Lien |
| |||||||||||
| (SOFR plus 5.26%) |
| |||||||||||
10.57% | 07/27/283 | 965,127 | 579,076 | |||||||||
| Term Loan, 2nd Lien |
| |||||||||||
| (SOFR plus 8.51%) |
| |||||||||||
13.82% | 07/27/293 | 446,493 | 134,691 | |||||||||
| Magnite, Inc., |
| |||||||||||
| Term Loan B, 1st Lien |
| |||||||||||
| (SOFR plus 4.50%) |
| |||||||||||
9.60% - 9.82% | 02/06/313 | 2,437,500 | 2,444,618 | |||||||||
| (SOFR plus 5.26%) |
| |||||||||||
10.33% | 04/28/283 | 488,550 | 489,160 | |||||||||
| Match Group, Inc., |
| |||||||||||
| Term Loan B, 1st Lien |
| |||||||||||
| (SOFR plus 1.90%) |
| |||||||||||
7.23% | 02/13/273 | 1,000,000 | 1,000,000 | |||||||||
| MH Sub I LLC, |
| |||||||||||
| Term Loan B3, 1st Lien |
| |||||||||||
| (SOFR plus 4.25%) |
| |||||||||||
9.58% | 05/03/283 | 1,295,149 | 1,288,965 | |||||||||
| Mitchell International, Inc., |
| |||||||||||
| Term Loan B, 1st Lien |
| |||||||||||
| (SOFR plus 3.86%) |
| |||||||||||
9.19% | 10/15/283 | 1,154,640 | 1,156,419 | |||||||||
| Term Loan, 2nd Lien |
| |||||||||||
| (SOFR plus 6.50%) |
| |||||||||||
11.82% | 10/15/293 | 500,000 | 500,312 | |||||||||
| Open Text Corp., |
| |||||||||||
| Term Loan B, 1st Lien (Canada) |
| |||||||||||
| (SOFR plus 2.85%) |
| |||||||||||
8.18% | 01/31/302,3 | 1,148,359 | 1,151,626 | |||||||||
| Pactiv Evergreen Group Holdings, Inc., |
| |||||||||||
| Term Loan B3, 1st Lien |
| |||||||||||
| (SOFR plus 3.36%) |
| |||||||||||
8.69% | 09/22/283 | 1,211,326 | 1,216,929 | |||||||||
| Peraton Corp., |
| |||||||||||
| Term Loan, 2nd Lien |
| |||||||||||
| (SOFR plus 7.85%) |
| |||||||||||
13.18% | 02/01/293 | 248,837 | 250,019 | |||||||||
| Playtika Holding Corp., |
| |||||||||||
| Term Loan B, 1st Lien |
| |||||||||||
| (SOFR plus 2.86%) |
| |||||||||||
8.19% | 03/13/283 | 1,477,291 | 1,480,630 | |||||||||
| Issues | Maturity Date | Principal Amount | Value | |||||||||
BANK LOANS (continued) |
| |||||||||||
| Information Technology (continued) |
| |||||||||||
| Plusgrade, Inc., |
| |||||||||||
| Term Loan B, 1st Lien (Canada) |
| |||||||||||
| (SOFR plus 4.50%) |
| |||||||||||
9.84% | 03/03/312,3 | $ | 914,634 | $ | 916,921 | |||||||
| Project Boost Purchaser, LLC, |
| |||||||||||
| Term Loan B, 1st Lien |
| |||||||||||
| (SOFR plus 3.61%) |
| |||||||||||
8.94% | 06/01/263 | 1,465,473 | 1,470,185 | |||||||||
| Project Ruby Ultimate Parent Corp., |
| |||||||||||
| Term Loan B1, 1st Lien |
| |||||||||||
| (SOFR plus 3.61%) |
| |||||||||||
8.94% | 03/10/283 | 500,000 | 501,250 | |||||||||
| Proofpoint, Inc., |
| |||||||||||
| Term Loan B, 1st Lien (Canada) |
| |||||||||||
| (SOFR plus 3.36%) |
| |||||||||||
8.69% | 08/31/282,3 | 925,650 | 927,164 | |||||||||
| Quartz AcquireCo LLC, |
| |||||||||||
| Term Loan B, 1st Lien |
| |||||||||||
| (SOFR plus 3.50%) |
| |||||||||||
8.81% | 06/28/303 | 906,697 | 910,949 | |||||||||
| Renaissance Holding Corp., |
| |||||||||||
| Term Loan, 1st Lien |
| |||||||||||
| (SOFR plus 4.25%) |
| |||||||||||
9.58% | 04/05/303 | 1,368,757 | 1,373,034 | |||||||||
| Severin Acquisition, LLC, |
| |||||||||||
| Term Loan, 1st Lien |
| |||||||||||
| (SOFR plus 3.25%) |
| |||||||||||
8.56% | 08/01/273 | 748,125 | 750,541 | |||||||||
| Sophia LP, |
| |||||||||||
| Term Loan B, 1st Lien |
| |||||||||||
| (SOFR plus 3.60%) |
| |||||||||||
8.93% | 10/07/293 | 1,085,463 | 1,091,433 | |||||||||
| Spin Holdco, Inc., |
| |||||||||||
| Term Loan B, 1st Lien |
| |||||||||||
| (SOFR plus 4.26%) |
| |||||||||||
9.59% | 03/03/283 | 446,407 | 414,567 | |||||||||
| StubHub Holdco Sub LLC, |
| |||||||||||
| Term Loan B, 1st Lien |
| |||||||||||
| (SOFR plus 4.75%) |
| |||||||||||
10.08% | 03/12/303 | 233,333 | 233,964 | |||||||||
| TIBCO Software, Inc., |
| |||||||||||
| Term Loan A, 1st Lien |
| |||||||||||
| (SOFR plus 4.50%) |
| |||||||||||
9.50% | 09/29/283 | 489,332 | 488,006 | |||||||||
| Ultra Clean Holdings, Inc., |
| |||||||||||
| Term Loan B, 1st Lien |
| |||||||||||
| (SOFR plus 3.75%) |
| |||||||||||
9.19% | 08/27/253 | 1,500,000 | 1,503,757 | |||||||||
| Waystar Technologies, Inc., |
| |||||||||||
| Term Loan B, 1st Lien |
| |||||||||||
| (SOFR plus 4.00%) |
| |||||||||||
9.33% | 10/22/293 | 507,962 | 509,867 | |||||||||
| Xerox Corp., |
| |||||||||||
| Term Loan B, 1st Lien |
| |||||||||||
| (SOFR plus 4.00%) |
| |||||||||||
9.33% | 11/15/293 | 1,209,688 | 1,216,873 | |||||||||
See accompanying Notes to Financial Statements.
| Annual Report March 2024 / 78 |
Table of Contents
Floating Rate Income Fund
Schedule of Portfolio Investments
March 31, 2024
| Issues | Maturity Date | Principal Amount | Value | |||||||||
BANK LOANS (continued) |
| |||||||||||
| Information Technology (continued) |
| |||||||||||
| Zoominfo LLC, |
| |||||||||||
| Term Loan B, 1st Lien |
| |||||||||||
| (SOFR plus 2.25%) |
| |||||||||||
7.58% | 02/28/303 | $ | 668,603 | $ | 669,439 | |||||||
|
| |||||||||||
| 49,849,501 | ||||||||||||
|
| |||||||||||
| Insurance — 2.12% |
| |||||||||||
| Acrisure LLC, |
| |||||||||||
| Term Loan B1, 1st Lien |
| |||||||||||
| (SOFR plus 3.50%) |
| |||||||||||
8.94% | 02/15/273 | 1,425,941 | 1,426,832 | |||||||||
| AmWINS Group, Inc., |
| |||||||||||
| Term Loan B, 1st Lien |
| |||||||||||
| (SOFR plus 2.86%) |
| |||||||||||
8.19% | 02/19/283 | 497,481 | 499,001 | |||||||||
| AssuredPartners, Inc., |
| |||||||||||
| Term Loan, 1st Lien |
| |||||||||||
| (SOFR plus 3.50%) |
| |||||||||||
8.83% | 02/12/273 | 1,854 | 1,858 | |||||||||
| Asurion LLC, |
| |||||||||||
| Term Loan B10, 1st Lien |
| |||||||||||
| (SOFR plus 4.10%) |
| |||||||||||
8.91% | 08/19/283 | 1,757,705 | 1,697,284 | |||||||||
| Term Loan B8, 1st Lien |
| |||||||||||
| (SOFR plus 3.36%) |
| |||||||||||
8.69% | 12/23/263 | 994,859 | 977,090 | |||||||||
| Term Loan B9, 1st Lien |
| |||||||||||
| (SOFR plus 3.36%) |
| |||||||||||
8.69% | 07/31/273 | 319,593 | 307,894 | |||||||||
| Truist Insurance Holdings LLC, |
| |||||||||||
| Term Loan B, 1st Lien |
| |||||||||||
| (SOFR plus 3.25%) |
| |||||||||||
8.57% | 03/24/313 | 1,500,000 | 1,499,370 | |||||||||
|
| |||||||||||
| 6,409,329 | ||||||||||||
|
| |||||||||||
| Materials — 3.87% |
| |||||||||||
| Archroma Finance Sarl, |
| |||||||||||
| Term Loan B, 1st Lien |
| |||||||||||
| (SOFR plus 5.50%) |
| |||||||||||
10.97% | 06/30/273 | 496,250 | 486,017 | |||||||||
| Arsenal Aic Parent LLC, |
| |||||||||||
| Term Loan B, 1st Lien |
| |||||||||||
| (SOFR plus 3.75%) |
| |||||||||||
9.08% | 08/19/303 | 801,272 | 804,978 | |||||||||
| Chariot Buyer LLC, |
| |||||||||||
| Term Loan B, 1st Lien |
| |||||||||||
| (SOFR plus 3.75%) |
| |||||||||||
9.08% | 11/03/283 | 548,780 | 550,611 | |||||||||
| Cyanco Intermediate 2 Corp., |
| |||||||||||
| Term Loan B, 1st Lien |
| |||||||||||
| (SOFR plus 4.75%) |
| |||||||||||
10.08% | 07/10/283 | 553,893 | 556,895 | |||||||||
| HB Fuller Co., |
| |||||||||||
| Term Loan B, 1st Lien |
| |||||||||||
| (SOFR plus 2.00%) |
| |||||||||||
7.33% | 02/15/303 | 788,186 | 790,944 | |||||||||
| Issues | Maturity Date | Principal Amount | Value | |||||||||
BANK LOANS (continued) |
| |||||||||||
| Materials (continued) |
| |||||||||||
| Herens U.S. Holdco Corp., |
| |||||||||||
| Term Loan B, 1st Lien |
| |||||||||||
| (SOFR plus 4.03%) |
| |||||||||||
9.33% | 07/03/283 | $ | 415,184 | $ | 391,923 | |||||||
| Loparex Midco BV, |
| |||||||||||
| Term Loan, 1st Lien (Netherlands) |
| |||||||||||
| (SOFR plus 6.00%) |
| |||||||||||
11.34% | 02/01/272,3 | 1,206,882 | 1,200,847 | |||||||||
| Loparex New Second Out, |
| |||||||||||
| Term Loan B, 1st Lien (Netherlands) |
| |||||||||||
| (SOFR plus 4.50%) |
| |||||||||||
10.74% | 02/01/272,3 | 82,901 | 72,331 | |||||||||
| LSF11 A5 HoldCo LLC, |
| |||||||||||
| Term Loan B, 1st Lien |
| |||||||||||
| (SOFR plus 3.61%) |
| |||||||||||
8.94% | 10/15/283 | 724,437 | 725,614 | |||||||||
| Lummus Technology Holdings V LLC, |
| |||||||||||
| Term Loan B, 1st Lien |
| |||||||||||
| (SOFR plus 3.61%) |
| |||||||||||
8.94% | 12/31/293 | 503,128 | 504,336 | |||||||||
| Mativ Holdings, Inc., |
| |||||||||||
| Delayed-Draw Term Loan, 1st Lien |
| |||||||||||
| (SOFR plus 2.60%) |
| |||||||||||
7.93% | 05/06/273 | 1,125,000 | 1,108,125 | |||||||||
| Nouryon Finance BV, |
| |||||||||||
| Term Loan B, 1st Lien |
| |||||||||||
| (SOFR plus 4.10%) |
| |||||||||||
9.42% | 04/03/283 | 1,116,563 | 1,121,448 | |||||||||
| Plaskolite PPC Intermediate II LLC, |
| |||||||||||
| Term Loan, 1st Lien |
| |||||||||||
| (SOFR plus 4.11%) |
| |||||||||||
9.44% | 12/15/253 | 1,439,161 | 1,415,774 | |||||||||
| Potters Borrower LP, |
| |||||||||||
| Term Loan, 1st Lien |
| |||||||||||
| (SOFR plus 4.10%) |
| |||||||||||
9.41% | 12/14/273 | 1,448,768 | 1,455,106 | |||||||||
| SCIH Salt Holdings, Inc., |
| |||||||||||
| Term Loan B, 1st Lien |
| |||||||||||
| (SOFR plus 4.00%) |
| |||||||||||
9.32% | 03/16/273 | 498,436 | 499,909 | |||||||||
|
| |||||||||||
| 11,684,858 | ||||||||||||
|
| |||||||||||
| Retail — 2.66% |
| |||||||||||
| BJ’s Wholesale Club, Inc., |
| |||||||||||
| Term Loan B, 1st Lien |
| |||||||||||
| (SOFR plus 2.00%) |
| |||||||||||
7.33% | 02/03/293 | 400,000 | 402,084 | |||||||||
| EG America LLC, |
| |||||||||||
| Term Loan BC, 1st Lien |
| |||||||||||
| (SOFR plus 5.50%) |
| |||||||||||
10.82% | 02/07/283 | 195,103 | 193,640 | |||||||||
| KFC Holding Co., |
| |||||||||||
| Term Loan B, 1st Lien |
| |||||||||||
| (SOFR plus 1.86%) |
| |||||||||||
7.19% | 03/15/283 | 1,230,306 | 1,231,130 | |||||||||
See accompanying Notes to Financial Statements.
| 79 / Annual Report March 2024 |
Table of Contents
Floating Rate Income Fund
Schedule of Portfolio Investments
March 31, 2024
| Issues | Maturity Date | Principal Amount | Value | |||||||||
BANK LOANS (continued) |
| |||||||||||
| Retail (continued) |
| |||||||||||
| MIC Glen LLC, |
| |||||||||||
| Term Loan B2, 1st Lien |
| |||||||||||
| (SOFR plus 3.25%) |
| |||||||||||
9.58% | 07/21/283 | $ | 500,000 | $ | 502,293 | |||||||
| Term Loan, 1st Lien |
| |||||||||||
| (SOFR plus 3.36%) |
| |||||||||||
8.69% | 07/21/283 | 710,958 | 710,901 | |||||||||
| Pacific Bells LLC, |
| |||||||||||
| Term Loan B, 1st Lien |
| |||||||||||
| (SOFR plus 4.76%) |
| |||||||||||
10.06% | 11/10/283 | 498,725 | 496,480 | |||||||||
| Peer Holding III BV, |
| |||||||||||
| Term Loan B4, 1st Lien (Netherlands) |
| |||||||||||
| (SOFR plus 3.25%) |
| |||||||||||
8.58% | 10/28/302,3 | 1,475,904 | 1,480,287 | |||||||||
| Tacala Investment Corp., |
| |||||||||||
| Term Loan, 1st Lien |
| |||||||||||
| (SOFR plus 4.00%) |
| |||||||||||
9.33% | 01/31/313 | 1,000,000 | 1,002,190 | |||||||||
| U.S. Anesthesia Partners, Inc., |
| |||||||||||
| Term Loan B, 1st Lien |
| |||||||||||
| (SOFR plus 4.36%) |
| |||||||||||
9.69% | 10/01/283 | 586,558 | 562,201 | |||||||||
| Whatabrands LLC, |
| |||||||||||
| Term Loan B, 1st Lien |
| |||||||||||
| (SOFR plus 3.36%) |
| |||||||||||
8.69% | 08/03/283 | 1,463,794 | 1,466,363 | |||||||||
|
| |||||||||||
| 8,047,569 | ||||||||||||
|
| |||||||||||
| Services — 12.05% |
| |||||||||||
| Action Environmental Group, Inc. (The), |
| |||||||||||
| Term Loan B, 1st Lien |
| |||||||||||
| (SOFR plus 4.50%) |
| |||||||||||
9.82% | 10/24/303,9 | 953,363 | 955,746 | |||||||||
| AlixPartners LLP, |
| |||||||||||
| Term Loan B, 1st Lien |
| |||||||||||
| (SOFR plus 2.50%) |
| |||||||||||
7.83% | 02/04/283 | 967,236 | 969,533 | |||||||||
| Allied Universal Holdco LLC, |
| |||||||||||
| Term Loan B, 1st Lien |
| |||||||||||
| (SOFR plus 4.75%) |
| |||||||||||
10.08% | 05/12/283 | 248,750 | 249,771 | |||||||||
| Alterra Mountain Co., |
| |||||||||||
| Term Loan B, 1st Lien |
| |||||||||||
| (SOFR plus 3.25%) |
| |||||||||||
8.58% | 08/17/283 | 250,000 | 251,355 | |||||||||
| (SOFR plus 3.85%) |
| |||||||||||
9.18% | 05/31/303 | 467,057 | 469,976 | |||||||||
| Amentum Government Services Holdings LLC, |
| |||||||||||
| Term Loan B, 1st Lien |
| |||||||||||
| (SOFR plus 4.00%) |
| |||||||||||
8.82% - 9.03% | 02/15/293 | 1,714,438 | 1,720,507 | |||||||||
| API Group DE, Inc., |
| |||||||||||
| Term Loan B, 1st Lien |
| |||||||||||
| (SOFR plus 2.61%) |
| |||||||||||
7.94% | 01/03/293 | 500,000 | 501,667 | |||||||||
| Issues | Maturity Date | Principal Amount | Value | |||||||||
BANK LOANS (continued) |
| |||||||||||
| Services (continued) |
| |||||||||||
| ArchKey Holdings, Inc., |
| |||||||||||
| Term Loan, 1st Lien |
| |||||||||||
| (SOFR plus 5.36%) |
| |||||||||||
10.69% | 06/29/283 | $ | 240,665 | $ | 240,965 | |||||||
| Arcis Golf LLC, |
| |||||||||||
| Term Loan B, 1st Lien |
| |||||||||||
| (SOFR plus 3.86%) |
| |||||||||||
9.19% | 11/24/283 | 982,538 | 987,450 | |||||||||
| Belron Finance U.S. LLC, |
| |||||||||||
| Term Loan B, 1st Lien (Luxembourg) |
| |||||||||||
| (SOFR plus 2.35%) |
| |||||||||||
7.66% | 04/18/292,3 | 1,000,000 | 1,002,085 | |||||||||
| Bifm CA Buyer, Inc., |
| |||||||||||
| Term Loan, 1st Lien (Canada) |
| |||||||||||
| (SOFR plus 4.50%) |
| |||||||||||
9.82% | 05/31/282,3 | 500,000 | 502,812 | |||||||||
| Camelot U.S. Acquisition I Co., |
| |||||||||||
| Term Loan B, 1st Lien |
| |||||||||||
| (SOFR plus 2.75%) |
| |||||||||||
8.08% | 01/31/313 | 1,263,929 | 1,264,877 | |||||||||
| CCRR Parent, Inc., |
| |||||||||||
| Term Loan B, 1st Lien |
| |||||||||||
| (SOFR plus 3.86%) |
| |||||||||||
9.19% | 03/06/283 | 493,639 | 447,153 | |||||||||
| CH Gunther PPC Parent LLC, |
| |||||||||||
| Term Loan B, 1st Lien |
| |||||||||||
| (SOFR plus 3.11%) |
| |||||||||||
8.44% | 12/08/283 | 979,869 | 982,319 | |||||||||
| Clean Harbors, Inc., |
| |||||||||||
| Term Loan B, 1st Lien |
| |||||||||||
| (SOFR plus 1.86%) |
| |||||||||||
7.19% | 10/08/283 | 498,724 | 500,283 | |||||||||
| Confluent Medical Technologies, Inc., |
| |||||||||||
| Term Loan B, 1st Lien |
| |||||||||||
| (SOFR plus 3.75%) |
| |||||||||||
9.06% | 02/16/293 | 733,163 | 733,163 | |||||||||
| Corp. Service Co., |
| |||||||||||
| Term Loan B, 1st Lien |
| |||||||||||
| (SOFR plus 2.75%) |
| |||||||||||
8.08% | 11/02/293 | 1,331,151 | 1,335,590 | |||||||||
| Covanta Holding Corp., |
| |||||||||||
| Term Loan B, 1st Lien |
| |||||||||||
| (SOFR plus 2.50%) |
| |||||||||||
7.83% | 11/30/283 | 449,402 | 448,982 | |||||||||
| (SOFR plus 2.75%) |
| |||||||||||
8.07% | 11/30/283 | 143,826 | 143,966 | |||||||||
| Term Loan C, 1st Lien |
| |||||||||||
| (SOFR plus 2.50%) |
| |||||||||||
7.83% | 11/30/283 | 34,350 | 34,318 | |||||||||
| (SOFR plus 2.75%) |
| |||||||||||
8.07% | 11/30/283 | 10,814 | 10,825 | |||||||||
| CRCI Longhorn Holdings, Inc., |
| |||||||||||
| Term Loan, 2nd Lien |
| |||||||||||
| (SOFR plus 7.35%) |
| |||||||||||
12.68% | 08/10/263 | 505,676 | 494,930 | |||||||||
See accompanying Notes to Financial Statements.
| Annual Report March 2024 / 80 |
Table of Contents
Floating Rate Income Fund
Schedule of Portfolio Investments
March 31, 2024
| Issues | Maturity Date | Principal Amount | Value | |||||||||
BANK LOANS (continued) |
| |||||||||||
| Services (continued) |
| |||||||||||
| Creative Artists Agency LLC, |
| |||||||||||
| Term Loan B, 1st Lien |
| |||||||||||
| (SOFR plus 3.50%) |
| |||||||||||
8.83% | 11/27/283 | $ | 956,984 | $ | 959,975 | |||||||
| Element Materials Technology Group U.S. Holdings, Inc., |
| |||||||||||
| Delayed-Draw Term Loan, 1st Lien |
| |||||||||||
| (SOFR plus 4.35%) |
| |||||||||||
9.66% | 07/06/293 | 576,908 | 578,111 | |||||||||
| Term Loan B, 1st Lien |
| |||||||||||
| (SOFR plus 4.35%) |
| |||||||||||
9.66% | 07/06/293 | 1,249,967 | 1,252,573 | |||||||||
| Ensemble RCM LLC, |
| |||||||||||
| Term Loan B, 1st Lien |
| |||||||||||
| (SOFR plus 3.00%) |
| |||||||||||
8.32% | 08/01/293 | 507,652 | 509,378 | |||||||||
| Garda World Security Corp., |
| |||||||||||
| Term Loan B, 1st Lien (Canada) |
| |||||||||||
| (SOFR plus 4.25%) |
| |||||||||||
9.58% | 02/01/292,3 | 750,000 | 752,347 | |||||||||
| GFL Environmental, Inc., |
| |||||||||||
| Term Loan B, 1st Lien (Canada) |
| |||||||||||
| (SOFR plus 2.50%) |
| |||||||||||
7.82% | 05/31/272,3 | 497,500 | 499,990 | |||||||||
| HomeServe USA Holding Corp., |
| |||||||||||
| Term Loan B, 1st Lien |
| |||||||||||
| (SOFR plus 3.00%) |
| |||||||||||
8.33% | 10/21/303 | 674,699 | 677,145 | |||||||||
| Kuehg Corp., |
| |||||||||||
| Term Loan, 1st Lien |
| |||||||||||
| (SOFR plus 5.00%) |
| |||||||||||
10.30% | 06/12/303 | 995,000 | 998,985 | |||||||||
| Lakeland Holdings LLC, |
| |||||||||||
| Term Loan, 1st Lien |
| |||||||||||
| (LIBOR plus 8.00%) |
| |||||||||||
8.00% | 09/25/273,6,7,8 | 677,334 | 372,534 | |||||||||
| Mavenir Systems, Inc., |
| |||||||||||
| Term Loan B, 1st Lien |
| |||||||||||
| (SOFR plus 5.01%) |
| |||||||||||
10.34% | 08/18/283 | 637,000 | 455,723 | |||||||||
| Neptune Bidco U.S., Inc., |
| |||||||||||
| Term Loan A, 1st Lien |
| |||||||||||
| (SOFR plus 4.85%) |
| |||||||||||
10.17% | 10/11/283 | 570,688 | 524,219 | |||||||||
| Nielsen Consumer, Inc., |
| |||||||||||
| Term Loan B, 1st Lien |
| |||||||||||
| (SOFR plus 6.25%) |
| |||||||||||
11.58% | 03/06/283 | 1,141,051 | 1,137,486 | |||||||||
| Omnia Partners, LLC, |
| |||||||||||
| Term Loan B, 1st Lien |
| |||||||||||
| (SOFR plus 3.75%) |
| |||||||||||
9.07% | 07/25/303 | 2,001,895 | 2,013,466 | |||||||||
| Pre-Paid Legal Services, Inc., |
| |||||||||||
| Term Loan, 1st Lien |
| |||||||||||
| (SOFR plus 3.86%) |
| |||||||||||
9.18% | 12/15/283 | 1,419,447 | 1,414,500 | |||||||||
| Issues | Maturity Date | Principal Amount | Value | |||||||||
BANK LOANS (continued) |
| |||||||||||
| Services (continued) |
| |||||||||||
| Prime Security Services Borrower, LLC, |
| |||||||||||
| Term Loan A, 1st Lien |
| |||||||||||
| (SOFR plus 2.35%) |
| |||||||||||
7.50% | 03/14/283 | $ | 1,496,876 | $ | 1,491,884 | |||||||
| Term Loan B1, 1st Lien |
| |||||||||||
| (SOFR plus 2.50%) |
| |||||||||||
7.83% | 10/11/303 | 169,312 | 169,611 | |||||||||
| Prometric Holdings, Inc., |
| |||||||||||
| Term Loan B, 1st Lien |
| |||||||||||
| (SOFR plus 5.36%) |
| |||||||||||
10.69% | 01/31/283 | 748,125 | 748,907 | |||||||||
| R1 RCM, Inc., |
| |||||||||||
| Term Loan B, 1st Lien |
| |||||||||||
| (SOFR plus 3.00%) |
| |||||||||||
8.33% | 06/21/293 | 1,000,000 | 1,004,065 | |||||||||
| Ryan LLC, |
| |||||||||||
| Term Loan, 1st Lien |
| |||||||||||
| (SOFR plus 4.50%) |
| |||||||||||
9.83% | 11/14/303,10 | 904,762 | 910,421 | |||||||||
| Sabert Corp., |
| |||||||||||
| Term Loan B, 1st Lien |
| |||||||||||
| (SOFR plus 3.86%) |
| |||||||||||
9.18% | 12/10/263 | 320,600 | 322,003 | |||||||||
| Signal Parent, Inc., |
| |||||||||||
| Term Loan B, 1st Lien |
| |||||||||||
| (SOFR plus 3.60%) |
| |||||||||||
8.93% | 04/03/283 | 494,911 | 470,165 | |||||||||
| Trans Union LLC, |
| |||||||||||
| Term Loan B, 1st Lien |
| |||||||||||
| (SOFR plus 2.00%) |
| |||||||||||
7.33% | 12/01/283 | 1,450,606 | 1,451,607 | |||||||||
| TruGreen LP, |
| |||||||||||
| Term Loan B, 1st Lien |
| |||||||||||
| (SOFR plus 4.10%) |
| |||||||||||
9.43% | 11/02/273 | 1,212,789 | 1,182,851 | |||||||||
| Term Loan B, 2nd Lien |
| |||||||||||
| (SOFR plus 8.76%) |
| |||||||||||
14.07% | 11/02/283 | 500,000 | 395,418 | |||||||||
| Verscend Holding Corp., |
| |||||||||||
| Term Loan B, 1st Lien |
| |||||||||||
| (SOFR plus 4.11%) |
| |||||||||||
9.44% | 08/27/253 | 972,417 | 973,632 | |||||||||
| VT Topco, Inc., |
| |||||||||||
| Term Loan B, 1st Lien |
| |||||||||||
| (SOFR plus 3.50%) |
| |||||||||||
8.82% | 08/12/303 | 147,243 | 147,822 | |||||||||
| (SOFR plus 4.25%) |
| |||||||||||
9.58% | 08/09/303 | 522,500 | 524,553 | |||||||||
| WW International, Inc., |
| |||||||||||
| Term Loan B, 1st Lien (France) |
| |||||||||||
| (SOFR plus 3.61%) |
| |||||||||||
8.94% | 04/13/282,3 | 445,000 | 198,581 | |||||||||
|
| |||||||||||
| 36,386,225 | ||||||||||||
|
| |||||||||||
See accompanying Notes to Financial Statements.
| 81 / Annual Report March 2024 |
Table of Contents
Floating Rate Income Fund
Schedule of Portfolio Investments
March 31, 2024
| Issues | Maturity Date | Principal Amount | Value | |||||||||
BANK LOANS (continued) |
| |||||||||||
| Specialized REITs — 0.45% |
| |||||||||||
| Greystar Real Estate Partners LLC, |
| |||||||||||
| Term Loan B1, 1st Lien |
| |||||||||||
| (SOFR plus 3.25%) |
| |||||||||||
8.58% | 08/21/303 | $ | 1,343,508 | $ | 1,346,867 | |||||||
|
| |||||||||||
| Transportation — 0.85% |
| |||||||||||
| Air Canada, |
| |||||||||||
| Term Loan B, 1st Lien (Canada) |
| |||||||||||
| (SOFR plus 2.50%) |
| |||||||||||
7.83% | 03/14/312,3 | 512,195 | 513,798 | |||||||||
| Kenan Advantage Group, Inc. (The), |
| |||||||||||
| Term Loan B3, 1st Lien |
| |||||||||||
| (SOFR plus 3.75%) |
| |||||||||||
9.08% | 01/25/293 | 744,246 | 745,875 | |||||||||
| United AirLines, Inc., |
| |||||||||||
| Term Loan B, 1st Lien |
| |||||||||||
| (SOFR plus 2.75%) |
| |||||||||||
8.08% | 02/24/313 | 1,292,818 | 1,296,451 | |||||||||
|
| |||||||||||
| 2,556,124 | ||||||||||||
|
| |||||||||||
Total Bank Loans |
| |||||||||||
(Cost $279,098,143) |
| 276,626,522 | ||||||||||
|
| |||||||||||
CORPORATES — 2.58%* |
| |||||||||||
Communications — 0.14% |
| |||||||||||
| Vmed O2 UK Financing I PLC |
| |||||||||||
| (United Kingdom) |
| |||||||||||
4.75% | 07/15/311,2 | 500,000 | 432,505 | |||||||||
|
| |||||||||||
| Consumer Discretionary — 0.15% |
| |||||||||||
| Spectrum Brands, Inc. |
| |||||||||||
3.88% | 03/15/311 | 460,000 | 444,345 | |||||||||
|
| |||||||||||
| Entertainment — 0.15% |
| |||||||||||
| WMGAcquisition Corp. |
| |||||||||||
3.88% | 07/15/301 | 500,000 | 444,375 | |||||||||
|
| |||||||||||
| Finance — 0.15% |
| |||||||||||
| Icahn Enterprises LP/Icahn Enterprises Finance Corp. |
| |||||||||||
5.25% | 05/15/27 | 500,000 | 465,000 | |||||||||
|
| |||||||||||
| Health Care — 1.00% |
| |||||||||||
| Bayer U.S. Finance LLC |
| |||||||||||
6.50% | 11/21/331 | 500,000 | 508,873 | |||||||||
| Bristol-Myers Squibb Co. |
| |||||||||||
5.20% | 02/22/34 | 500,000 | 508,184 | |||||||||
| Grifols SA |
| |||||||||||
| (Spain) |
| |||||||||||
4.75% | 10/15/281,2 | 50,000 | 41,408 | |||||||||
| Grifols SA, |
| |||||||||||
| Series REGS |
| |||||||||||
| (Spain) |
| |||||||||||
3.20% | 05/01/252 | 1,500,000 | 1,496,566 | |||||||||
| ModivCare Escrow Issuer, Inc. |
| |||||||||||
5.00% | 10/01/291 | 500,000 | 363,182 | |||||||||
| Prime Healthcare Services, Inc. |
| |||||||||||
7.25% | 11/01/251 | 100,000 | 100,250 | |||||||||
|
| |||||||||||
| 3,018,463 | ||||||||||||
|
| |||||||||||
| Issues | Maturity Date | Principal Amount | Value | |||||||||||
CORPORATES (continued) |
| |||||||||||||
| Industrials — 0.24% |
| |||||||||||||
| Berry Global, Inc. |
| |||||||||||||
5.65% | 01/15/341 | $ | 500,000 | $ | 497,849 | |||||||||
| OT Merger Corp. |
| |||||||||||||
7.88% | 10/15/291 | 250,000 | 180,353 | |||||||||||
| Titan Acquisition Ltd./Titan Co-Borrower LLC |
| |||||||||||||
| (Canada) |
| |||||||||||||
7.75% | 04/15/261,2 | 50,000 | 50,025 | |||||||||||
|
| |||||||||||||
| 728,227 | ||||||||||||||
|
| |||||||||||||
| Information Technology — 0.51% |
| |||||||||||||
| Constellation Software, Inc. |
| |||||||||||||
| (Canada) |
| |||||||||||||
5.46% | 02/16/341,2 | 1,000,000 | 1,006,380 | |||||||||||
| Open Text Corp. |
| |||||||||||||
| (Canada) |
| |||||||||||||
6.90% | 12/01/271,2 | 500,000 | 516,200 | |||||||||||
|
| |||||||||||||
| 1,522,580 | ||||||||||||||
|
| |||||||||||||
| Retail — 0.21% |
| |||||||||||||
| 1011778 BC Unlimited Liability Co./New Red Finance, Inc. |
| |||||||||||||
| (Canada) |
| |||||||||||||
3.50% | 02/15/291,2 | 500,000 | 457,500 | |||||||||||
| Michaels Cos., Inc. (The) |
| |||||||||||||
7.88% | 05/01/291 | 250,000 | 187,798 | |||||||||||
|
| |||||||||||||
| 645,298 | ||||||||||||||
|
| |||||||||||||
| Services — 0.03% |
| |||||||||||||
| Waste Pro USA, Inc. |
| |||||||||||||
5.50% | 02/15/261 | 75,000 | 73,930 | |||||||||||
|
| |||||||||||||
Total Corporates |
| |||||||||||||
(Cost $7,854,277) |
| 7,774,723 | ||||||||||||
|
| |||||||||||||
Total Bonds — 95.13% |
| |||||||||||||
(Cost $289,837,592) |
| 287,326,473 | ||||||||||||
|
| |||||||||||||
|
| |||||||||||||
| Issues | Shares | Value | ||||||||||||
COMMON STOCK — 0.08% |
| |||||||||||||
Communications — 0.08% |
| |||||||||||||
| Intelsat Emergence SA2,7,8,11 |
| |||||||||||||
(Luxembourg) | 9,683 | 260,230 | ||||||||||||
|
| |||||||||||||
Industrial REITs — 0.00% |
| |||||||||||||
| Avison Young2,7,8,11 |
| |||||||||||||
(Canada) | 370 | — | ||||||||||||
|
| |||||||||||||
Total Common Stock |
| |||||||||||||
(Cost $324,132) |
| 260,230 | ||||||||||||
|
| |||||||||||||
PREFERRED STOCK — 0.16% |
| |||||||||||||
Industrial REITs — 0.16% |
| |||||||||||||
Avison Young2,7,8,11 |
| |||||||||||||
(Canada) |
| 1,054,697 | 474,614 | |||||||||||
|
| |||||||||||||
Total Preferred Stock |
| |||||||||||||
(Cost $697,797) |
| |||||||||||||
See accompanying Notes to Financial Statements.
| Annual Report March 2024 / 82 |
Table of Contents
Floating Rate Income Fund
Schedule of Portfolio Investments
March 31, 2024
| Issues | Shares | Value | ||||||||||||||
WARRANT — 0.00% |
| |||||||||||||||
Entertainment — 0.00% |
| |||||||||||||||
Cineworld Group PLC2,7,8,11 |
| |||||||||||||||
(United Kingdom) |
| 229,579 | $ | — | ||||||||||||
|
| |||||||||||||||
Total Warrant |
| |||||||||||||||
(Cost $–) |
| |||||||||||||||
|
| |||||||||||||||
| Issues | Maturity Date | Principal Amount/Shares | Value | |||||||||||||
SHORT-TERM INVESTMENTS — 8.28% |
| |||||||||||||||
Money Market Funds — 6.73% |
| |||||||||||||||
| Dreyfus Government Cash Management Fund |
| |||||||||||||||
5.20%12 |
| 3,588,000 | 3,588,000 | |||||||||||||
| Fidelity Investments Money Market Funds - Government |
| |||||||||||||||
| Portfolio | ||||||||||||||||
5.21%12 |
| 2,072,056 | 2,072,056 | |||||||||||||
| Morgan Stanley Institutional Liquidity Funds - Government |
| |||||||||||||||
| Portfolio | ||||||||||||||||
5.22%12 |
| 14,670,000 | 14,670,000 | |||||||||||||
|
| |||||||||||||||
| 20,330,056 | ||||||||||||||||
|
| |||||||||||||||
U.S. Treasury Bills — 1.55% |
| |||||||||||||||
U.S. Treasury Bills (WI) |
| |||||||||||||||
5.28%13 |
| 05/02/24 | $ | 4,695,000 | 4,673,676 | |||||||||||
|
| |||||||||||||||
Total Short-Term Investments |
| |||||||||||||||
(Cost $25,004,005) |
| 25,003,732 | ||||||||||||||
|
| |||||||||||||||
| Total Investments - 103.65% |
| |||||||||||||||
(Cost $315,863,526) |
| 313,065,049 | ||||||||||||||
|
| |||||||||||||||
| Net unrealized appreciation on unfunded commitments - 0.00% |
| 1,817 | ||||||||||||||
| Liabilities in Excess of Other Assets - (3.65)% |
| (11,016,194 | ) | |||||||||||||
|
| |||||||||||||||
Net Assets - 100.00% |
| $ | 302,050,672 | |||||||||||||
|
| |||||||||||||||
| 1 | Securities exempt from registration under Rule 144A of the Securities Act of 1933, as amended. The securities may be resold in transactions exempt from registration, normally to qualified institutional buyers. |
| 2 | Foreign denominated security issued by foreign domiciled entity. |
| 3 | Floating rate security. The rate disclosed was in effect at March 31, 2024. |
| 4 | Payment-in-kind (“PIK”) security. Income may be paid in additional securities or cash at the discretion of the issuer - 7.19% cash or 1.50% payment-in-kind interest. |
| 5 | Excluded from the investment total above is an unfunded delayed draw term loan commitment in an amount not to exceed $41,278, at an interest rate of 9.58% and a maturity of July 31, 2028. The investment is not accruing an unused commitment fee. |
| 6 | Payment-in-kind (“PIK”) security. |
| 7 | Security is valued using significant unobservable inputs and is classified as Level 3 in the fair value hierarchy. |
| 8 | Illiquid security as determined under procedures approved by the Board of Trustees. The aggregate value of illiquid securities is $2,634,498, which is 0.87% of total net assets. |
| 9 | Excluded from the investment total above is an unfunded delayed draw term loan commitment in an amount not to exceed $102,855, at an interest rate of 9.83% and a maturity of October 24, 2030. The investment is accruing an unused commitment fee of 0.75% per annum. |
| 10 | Excluded from the investment total above is an unfunded delayed draw term loan commitment in an amount not to exceed $95,834, at an interest rate of 9.82% and a maturity of November 14, 2030. The investment is not accruing an unused commitment fee. |
| 11 | Non-income producing security. |
| 12 | Represents the current yield as of March 31, 2024. |
| 13 | Represents annualized yield at date of purchase. |
| * | Securities with a call or reset feature will have an effective maturity date sooner than the stated maturity. |
| ** | Securities backed by mortgage or consumer loans where payment is periodically made will have an effective maturity date sooner than the stated maturity date. |
Note: For Fund compliance purposes, the Fund’s industry classifications refer to any one or more of the industry sub-classifications used by one or more widely recognized market indexes or ratings group indexes, and/or as defined by Fund management. This definition may not apply for purposes of this report, which may combine industry sub-classifications for more meaningful presentation for investors.
(CLO): Collateralized Loan Obligation
(EUR): Euro
(LIBOR): London InterBank Offer Rate
(REIT): Real Estate Investment Trust
(SOFR): Secured Overnight Financing Rate
(WI): When Issued
Currency to be Purchased | Currency to be Sold | Counterparty | Settlement Date | Unrealized Appreciation | ||||||||
FOREIGN CURRENCY EXCHANGE CONTRACT | ||||||||||||
USD 767,196 | EUR 703,000 | Bank of America N.A. | 04/12/24 | $ | 7,514 | |||||||
USD 781,334 | EUR 716,000 | The Bank of New York Mellon | 04/12/24 | 7,603 | ||||||||
|
| |||||||||||
NET UNREALIZED APPRECIATION | $ | 15,117 | ||||||||||
|
| |||||||||||
| Description | Number of Contracts | Expiration Date | Notional Amount | Value | Unrealized (Depreciation) | |||||||||||
| FUTURES CONTRACTS: SHORT POSITIONS |
| |||||||||||||||
| Euro-Schatz Future | 4 | 06/06/24 | $ | (456,624) | $ | (350) | $ | (350) | ||||||||
|
|
|
|
|
| |||||||||||
See accompanying Notes to Financial Statements.
| 83 / Annual Report March 2024 |
Table of Contents
Schedule of Portfolio Investments
March 31, 2024
| Issues | Maturity Date | Principal Amount | Value | |||||||||
BONDS – 89.63% |
| |||||||||||
| BANK LOANS — 15.41%* |
| |||||||||||
| Automotive — 0.37% |
| |||||||||||
| First Brands Group LLC, |
| |||||||||||
| Term Loan B, 1st Lien |
| |||||||||||
| (SOFR plus 5.26%) |
| |||||||||||
10.57% | 03/30/271 | $ | 1,728,046 | $ | 1,732,798 | |||||||
|
|
| ||||||||||
| Communications — 1.34% |
| |||||||||||
| Cyxtera DC Holdings, Inc., |
| |||||||||||
| Term Loan B, 1st Lien |
| |||||||||||
| (SOFR plus 3.00%) |
| |||||||||||
5.07% | 05/01/241 | 355,886 | 18,270 | |||||||||
| NEP Group, Inc., |
| |||||||||||
| Term Loan B, 1st Lien |
| |||||||||||
| (SOFR plus 3.36%) |
| |||||||||||
8.69% | 08/19/261,2 | 1,008,639 | 964,198 | |||||||||
| NEP/NCP Holdco, Inc., |
| |||||||||||
| Term Loan, 2nd Lien |
| |||||||||||
| (SOFR plus 7.11%) |
| |||||||||||
12.44% | 10/19/261 | 875,000 | 714,035 | |||||||||
| New Insight Holdings, Inc., |
| |||||||||||
| Term Loan B, 1st Lien |
| |||||||||||
| (SOFR plus 5.76%) |
| |||||||||||
11.07% | 12/20/241 | 2,895,756 | 1,747,415 | |||||||||
| SBA Senior Finance II LLC, |
| |||||||||||
| Term Loan B, 1st Lien |
| |||||||||||
| (SOFR plus 2.00%) |
| |||||||||||
7.34% | 01/25/311 | 1,243,404 | 1,247,097 | |||||||||
| Zayo Group Holdings, Inc., |
| |||||||||||
| Term Loan B, 1st Lien |
| |||||||||||
| (SOFR plus 3.11%) |
| |||||||||||
8.44% | 03/09/271 | 1,800,000 | 1,584,513 | |||||||||
|
|
| ||||||||||
| 6,275,528 | ||||||||||||
|
|
| ||||||||||
| Consumer Discretionary — 1.29% |
| |||||||||||
| City Brewing Co. LLC, |
| |||||||||||
| Term Loan B, 1st Lien |
| |||||||||||
| (SOFR plus 3.76%) |
| |||||||||||
8.32% | 04/05/281 | 2,038,573 | 1,600,830 | |||||||||
| Naked Juice, LLC, |
| |||||||||||
| Term Loan, 2nd Lien |
| |||||||||||
| (SOFR plus 6.10%) |
| |||||||||||
11.00% | 01/24/301 | 2,891,000 | 2,369,709 | |||||||||
| Osmosis Buyer Ltd., |
| |||||||||||
| Term Loan B, 1st Lien |
| |||||||||||
| (SOFR plus 4.25%) |
| |||||||||||
9.57% -9.58% | 07/31/281,3 | 1,346,087 | 1,353,800 | |||||||||
| Pegasus Bidco BV, |
| |||||||||||
| Term Loan B, 1st Lien (Netherlands) |
| |||||||||||
| (SOFR plus 3.75%) |
| |||||||||||
9.06% | 07/12/291,4 | 725,681 | 726,893 | |||||||||
|
|
| ||||||||||
| 6,051,232 | ||||||||||||
|
|
| ||||||||||
| Issues | Maturity Date | Principal Amount | Value | |||||||||
BANK LOANS (continued) |
| |||||||||||
| Energy — 0.26% |
| |||||||||||
| NGL Energy Operating LLC, |
| |||||||||||
| Term Loan B, 1st Lien |
| |||||||||||
| (SOFR plus 4.50%) |
| |||||||||||
9.83% | 02/03/311 | $ | 1,212,500 | $ | 1,217,047 | |||||||
|
|
| ||||||||||
| Entertainment — 0.47% |
| |||||||||||
| Elanco Animal Health, Inc., |
| |||||||||||
| Term Loan B, 1st Lien |
| |||||||||||
| (SOFR plus 1.85%) |
| |||||||||||
7.18% | 08/01/271 | 2,204,805 | 2,199,469 | |||||||||
|
|
| ||||||||||
| Finance — 0.46% |
| |||||||||||
| Auris Lux III SA, |
| |||||||||||
| Term Loan B2, 1st Lien (Luxembourg) |
| |||||||||||
| (SOFR plus 3.75%) |
| |||||||||||
9.62% | 02/27/261,4 | 453,496 | 455,056 | |||||||||
| Jane Street Group LLC, |
| |||||||||||
| Term Loan B, 1st Lien |
| |||||||||||
| (SOFR plus 2.61%) |
| |||||||||||
7.94% | 01/26/281 | 1,693,125 | 1,695,877 | |||||||||
|
|
| ||||||||||
| 2,150,933 | ||||||||||||
|
|
| ||||||||||
| Food — 1.25% |
| |||||||||||
| 8th Avenue Food & Provisions, Inc., |
| |||||||||||
| Term Loan B, 1st Lien |
| |||||||||||
| (SOFR plus 3.86%) |
| |||||||||||
9.19% | 10/01/251 | 1,491,472 | 1,468,891 | |||||||||
| (SOFR plus 4.86%) |
| |||||||||||
10.19% | 10/01/251 | 742,386 | 731,870 | |||||||||
| Term Loan, 2nd Lien |
| |||||||||||
| (SOFR plus 7.86%) |
| |||||||||||
13.19% | 10/01/261 | 250,000 | 228,750 | |||||||||
| B&G Foods, Inc., |
| |||||||||||
| Term Loan B4, 1st Lien |
| |||||||||||
| (SOFR plus 2.50%) |
| |||||||||||
7.83% | 10/10/261 | 744,035 | 744,310 | |||||||||
| Chobani LLC, |
| |||||||||||
| Term Loan B, 1st Lien |
| |||||||||||
| (SOFR plus 3.75%) |
| |||||||||||
9.08% | 10/25/271 | 1,122,188 | 1,129,667 | |||||||||
| Fiesta Purchaser, Inc., |
| |||||||||||
| Term Loan B, 1st Lien |
| |||||||||||
| (SOFR plus 4.00%) |
| |||||||||||
9.33% | 02/12/311 | 1,192,500 | 1,195,893 | |||||||||
| H-Food Holdings LLC, |
| |||||||||||
| Term Loan, 1st Lien |
| |||||||||||
| (SOFR plus 3.95%) |
| |||||||||||
9.29% | 05/23/251 | 494,751 | 362,098 | |||||||||
|
|
| ||||||||||
| 5,861,479 | ||||||||||||
|
|
| ||||||||||
Gaming — 1.17% |
| |||||||||||
| Caesars Entertainment, Inc., |
| |||||||||||
| Term Loan B1, 1st Lien |
| |||||||||||
| (SOFR plus 2.75%) |
| |||||||||||
8.04% | 02/06/311 | 2,400,000 | 2,404,872 | |||||||||
See accompanying Notes to Financial Statements.
| Annual Report March 2024 / 84 |
Table of Contents
High Yield Bond Fund
Schedule of Portfolio Investments
March 31, 2024
| Issues | Maturity Date | Principal Amount | Value | |||||||||
BANK LOANS (continued) |
| |||||||||||
| Gaming (continued) |
| |||||||||||
| Ontario Gaming Gta Ltd. Partnership, |
| |||||||||||
| Term Loan B, 1st Lien (Canada) |
| |||||||||||
| (SOFR plus 4.25%) |
| |||||||||||
9.57% | 08/01/301,4 | $ | 1,837,395 | $ | 1,845,930 | |||||||
| Scientific Games International, Inc., |
| |||||||||||
| Term Loan B, 1st Lien |
| |||||||||||
| (SOFR plus 2.75%) |
| |||||||||||
8.08% | 04/14/291 | 1,212,500 | 1,216,622 | |||||||||
|
|
| ||||||||||
| 5,467,424 | ||||||||||||
|
|
| ||||||||||
Health Care — 1.25% |
| |||||||||||
| Auris Luxembourg III SARL, |
| |||||||||||
| Term Loan B, 1st Lien (Luxembourg) |
| |||||||||||
| (SOFR plus 4.25%) |
| |||||||||||
9.58% | 02/27/291,4 | 905,917 | 909,033 | |||||||||
| Carestream Dental Equipment, Inc., |
| |||||||||||
| Term Loan, 1st Lien |
| |||||||||||
| (LIBOR plus 3.25%) |
| |||||||||||
8.56% | 09/01/241 | 715,500 | 624,871 | |||||||||
| Carestream Dental, Inc., |
| |||||||||||
| Term Loan, 1st Lien |
| |||||||||||
| (LIBOR plus 4.50%) |
| |||||||||||
9.94% | 09/01/241 | 1,145,864 | 1,000,242 | |||||||||
| Catalent Pharma Solutions, Inc., |
| |||||||||||
| Term Loan B3, 1st Lien |
| |||||||||||
| (SOFR plus 2.11%) |
| |||||||||||
7.44% | 02/22/281 | 1,243,590 | 1,244,367 | |||||||||
| eResearchTechnology, Inc., |
| |||||||||||
| Term Loan B, 1st Lien |
| |||||||||||
| (SOFR plus 4.61%) |
| |||||||||||
9.94% | 02/04/271 | 841,583 | 845,075 | |||||||||
| Jazz Financing Lux SARL, |
| |||||||||||
| Term Loan B, 1st Lien (Luxembourg) |
| |||||||||||
| (SOFR plus 3.11%) |
| |||||||||||
8.44% | 05/05/281,4 | 1,209,048 | 1,216,605 | |||||||||
|
|
| ||||||||||
| 5,840,193 | ||||||||||||
|
|
| ||||||||||
Health Care REITs — 0.08% |
| |||||||||||
| Aveanna Healthcare LLC, |
| |||||||||||
| Term Loan B, 1st Lien |
| |||||||||||
| (SOFR plus 3.85%) |
| |||||||||||
9.19% | 07/17/281 | 385,904 | 372,052 | |||||||||
|
|
| ||||||||||
Industrials — 2.32% |
| |||||||||||
| Artera Services LLC, |
| |||||||||||
| Term Loan, 1st Lien |
| |||||||||||
| (SOFR plus 4.50%) |
| |||||||||||
9.81% | 02/15/311 | 1,192,500 | 1,198,463 | |||||||||
| Patriot Container Corp., |
| |||||||||||
| Term Loan B, 1st Lien |
| |||||||||||
| (SOFR plus 3.85%) |
| |||||||||||
9.18% | 03/20/251 | 1,724,998 | 1,676,939 | |||||||||
| Term Loan, 2nd Lien |
| |||||||||||
| (SOFR plus 7.75%) |
| |||||||||||
13.08% | 03/20/261 | 242,500 | 210,975 | |||||||||
| Issues | Maturity Date | Principal Amount | Value | |||||||||
BANK LOANS (continued) |
| |||||||||||
| Industrials (continued) |
| |||||||||||
| Plaze, Inc., |
| |||||||||||
| Term Loan B, 1st Lien |
| |||||||||||
| (SOFR plus 3.86%) |
| |||||||||||
9.19% | 08/03/261 | $ | 2,254,795 | $ | 2,226,610 | |||||||
| Pretium PKG Holdings, Inc., |
| |||||||||||
| Term Loan A, 1st Lien |
| |||||||||||
| (SOFR plus 7.50%) |
| |||||||||||
12.81% | 10/02/281,5 | 505,915 | 513,820 | |||||||||
| ProAmpac PG Borrower LLC, |
| |||||||||||
| Term Loan B, 1st Lien |
| |||||||||||
| (SOFR plus 4.50%) |
| |||||||||||
9.80% - 9.82% | 09/15/281 | 2,493,750 | 2,501,231 | |||||||||
| SPX Flow, Inc., |
| |||||||||||
| Term Loan B, 1st Lien |
| |||||||||||
| (SOFR plus 4.60%) |
| |||||||||||
9.41% - 9.58% | 04/05/291 | 429,171 | 431,474 | |||||||||
| Titan Acquisition, Ltd., |
| |||||||||||
| Term Loan B, 1st Lien |
| |||||||||||
| (SOFR plus 3.11%) |
| |||||||||||
8.44% | 03/28/251 | 894,555 | 894,926 | |||||||||
| Transcendia Holdings, Inc., |
| |||||||||||
| Term Loan B, 1st Lien |
| |||||||||||
| (PRIME plus 2.50%) |
| |||||||||||
11.00% | 05/30/241 | 1,577,248 | 1,174,805 | |||||||||
|
|
| ||||||||||
| 10,829,243 | ||||||||||||
|
|
| ||||||||||
Information Technology — 2.73% |
| |||||||||||
| CT Technologies Intermediate Holdings, Inc., |
| |||||||||||
| Term Loan, 1st Lien |
| |||||||||||
| (SOFR plus 4.36%) |
| |||||||||||
9.69% | 12/16/251 | 1,018,500 | 1,017,863 | |||||||||
| EagleView Technology Co., |
| |||||||||||
| Term Loan B, 1st Lien |
| |||||||||||
| (SOFR plus 3.76%) |
| |||||||||||
9.06% | 08/14/251 | 1,728,153 | 1,682,634 | |||||||||
| Magnite, Inc., |
| |||||||||||
| Term Loan B, 1st Lien |
| |||||||||||
| (SOFR plus 4.50%) |
| |||||||||||
9.60% - 9.82% | 02/06/311 | 3,395,000 | 3,404,913 | |||||||||
| MH Sub I LLC, |
| |||||||||||
| Term Loan B3, 1st Lien |
| |||||||||||
| (SOFR plus 4.25%) |
| |||||||||||
9.58% | 05/03/281 | 742,745 | 739,198 | |||||||||
| Open Text Corp., |
| |||||||||||
| Term Loan B, 1st Lien (Canada) |
| |||||||||||
| (SOFR plus 1.85%) |
| |||||||||||
7.18% | 05/30/251,4 | 2,486,772 | 2,492,219 | |||||||||
| Spin Holdco, Inc., |
| |||||||||||
| Term Loan B, 1st Lien |
| |||||||||||
| (SOFR plus 4.26%) |
| |||||||||||
9.59% | 03/03/281 | 636,048 | 590,682 | |||||||||
| SS&C Technologies Holdings, Inc., |
| |||||||||||
| Term Loan B5, 1st Lien |
| |||||||||||
| (SOFR plus 1.86%) |
| |||||||||||
7.19% | 04/16/251 | 1,339,142 | 1,340,803 | |||||||||
See accompanying Notes to Financial Statements.
| 85 / Annual Report March 2024 |
Table of Contents
High Yield Bond Fund
Schedule of Portfolio Investments
March 31, 2024
| Issues | Maturity Date | Principal Amount | Value | |||||||||
BANK LOANS (continued) |
| |||||||||||
| Information Technology (continued) |
| |||||||||||
| Xerox Corp., |
| |||||||||||
| Term Loan B, 1st Lien |
| |||||||||||
| (SOFR plus 4.00%) |
| |||||||||||
9.33% | 11/15/291 | $ | 1,481,250 | $ | 1,490,049 | |||||||
|
| |||||||||||
| 12,758,361 | ||||||||||||
|
| |||||||||||
Insurance — 0.74% |
| |||||||||||
| Acrisure LLC, |
| |||||||||||
| Term Loan B2, 1st Lien |
| |||||||||||
| (SOFR plus 4.25%) |
| |||||||||||
9.07% | 02/15/271 | 713,670 | 715,230 | |||||||||
| Asurion LLC, |
| |||||||||||
| Term Loan B4, 2nd Lien |
| |||||||||||
| (SOFR plus 5.25%) |
| |||||||||||
10.58% | 01/20/291 | 195,000 | 175,394 | |||||||||
| Term Loan B8, 1st Lien |
| |||||||||||
| (SOFR plus 3.36%) |
| |||||||||||
8.69% | 12/23/261 | 1,517,865 | 1,490,755 | |||||||||
| HUB International Ltd., |
| |||||||||||
| Term Loan B, 1st Lien |
| |||||||||||
| (SOFR plus 3.25%) |
| |||||||||||
8.57% | 06/20/301 | 1,060,514 | 1,062,100 | |||||||||
|
| |||||||||||
| 3,443,479 | ||||||||||||
|
| |||||||||||
Materials — 0.16% |
| |||||||||||
| Arsenal Aic Parent LLC, |
| |||||||||||
| Term Loan B, 1st Lien |
| |||||||||||
| (SOFR plus 3.75%) |
| |||||||||||
9.08% | 08/19/301 | 746,255 | 749,706 | |||||||||
| Chemours Co. (The), |
| |||||||||||
| Term Loan B3, 1st Lien |
| |||||||||||
| (SOFR plus 3.50%) |
| |||||||||||
8.83% | 08/18/281 | 17,955 | 17,928 | |||||||||
|
| |||||||||||
| 767,634 | ||||||||||||
|
| |||||||||||
Retail — 0.26% |
| |||||||||||
| Tacala Investment Corp., |
| |||||||||||
| Term Loan, 1st Lien |
| |||||||||||
| (SOFR plus 4.00%) |
| |||||||||||
9.33% | 01/31/311 | 1,212,500 | 1,215,155 | |||||||||
|
| |||||||||||
Services — 1.05% |
| |||||||||||
| Clean Harbors, Inc., |
| |||||||||||
| Term Loan B, 1st Lien |
| |||||||||||
| (SOFR plus 1.86%) |
| |||||||||||
7.19% | 10/08/281 | 1,243,639 | 1,247,525 | |||||||||
| Fugue Finance LLC, |
| |||||||||||
| Term Loan B, 1st Lien |
| |||||||||||
| (SOFR plus 3.75%) |
| |||||||||||
9.07% | 02/26/311 | 500,000 | 501,875 | |||||||||
| Neptune Bidco U.S., Inc., |
| |||||||||||
| Term Loan B, 1st Lien |
| |||||||||||
| (SOFR plus 5.10%) |
| |||||||||||
10.42% | 04/11/291 | 889,988 | 822,629 | |||||||||
| Issues | Maturity Date | Principal Amount | Value | |||||||||
BANK LOANS (continued) |
| |||||||||||
| Services (continued) |
| |||||||||||
| Nielsen Consumer, Inc., |
| |||||||||||
| Term Loan B, 1st Lien |
| |||||||||||
| (SOFR plus 6.25%) |
| |||||||||||
11.58% | 03/06/281 | $ | 748,116 | $ | 745,778 | |||||||
| Ryan LLC, |
| |||||||||||
| Term Loan, 1st Lien |
| |||||||||||
| (SOFR plus 4.50%) |
| |||||||||||
9.83% | 11/14/301,6 | 904,762 | 910,421 | |||||||||
| VT Topco, Inc., |
| |||||||||||
| Term Loan B, 1st Lien |
| |||||||||||
| (SOFR plus 4.25%) |
| |||||||||||
9.58% | 08/09/301 | 673,313 | 675,958 | |||||||||
|
| |||||||||||
| 4,904,186 | ||||||||||||
|
| |||||||||||
Specialized REITs — 0.21% |
| |||||||||||
| Greystar Real Estate Partners LLC, |
| |||||||||||
| Term Loan B1, 1st Lien |
| |||||||||||
| (SOFR plus 3.25%) |
| |||||||||||
8.58% | 08/21/301 | 995,006 | 997,494 | |||||||||
|
| |||||||||||
| Total Bank Loans |
| |||||||||||
(Cost $72,245,460) | 72,083,707 | |||||||||||
|
| |||||||||||
CORPORATES — 74.22%* |
| |||||||||||
Automobile Components — 0.18% |
| |||||||||||
| Allison Transmission, Inc. |
| |||||||||||
3.75% | 01/30/317 | 930,000 | 814,913 | |||||||||
|
| |||||||||||
Banking — 1.72% |
| |||||||||||
| Bank of America Corp., |
| |||||||||||
| Series RR |
| |||||||||||
4.38%8,9 | 2,040,000 | 1,922,689 | ||||||||||
| Bank of New York Mellon Corp. (The), |
| |||||||||||
| Series I |
| |||||||||||
3.75%8,9 | 2,515,000 | 2,316,944 | ||||||||||
| JPMorgan Chase & Co., |
| |||||||||||
| Series KK |
| |||||||||||
3.65%8,9 | 805,000 | 766,551 | ||||||||||
| U.S. Bancorp |
| |||||||||||
3.70%8,9 | 3,515,000 | 3,045,852 | ||||||||||
|
| |||||||||||
| 8,052,036 | ||||||||||||
|
| |||||||||||
Communications — 12.01% |
| |||||||||||
| Altice France Holding SA |
| |||||||||||
| (Luxembourg) |
| |||||||||||
10.50% | 05/15/274,7 | 1,562,000 | 595,513 | |||||||||
| Altice France SA |
| |||||||||||
| (France) |
| |||||||||||
5.13% | 01/15/294,7 | 1,628,000 | 1,131,460 | |||||||||
5.50% | 10/15/294,7 | 3,700,000 | 2,495,188 | |||||||||
8.13% | 02/01/274,7 | 1,537,000 | 1,210,387 | |||||||||
| Cable One, Inc. |
| |||||||||||
4.00% | 11/15/307 | 3,802,000 | 2,975,065 | |||||||||
| CCO Holdings LLC/CCO Holdings Capital Corp. |
| |||||||||||
5.13% | 05/01/277 | 3,025,000 | 2,890,478 | |||||||||
5.50% | 05/01/267 | 10,999,000 | 10,889,010 | |||||||||
See accompanying Notes to Financial Statements.
| Annual Report March 2024 / 86 |
Table of Contents
High Yield Bond Fund
Schedule of Portfolio Investments
March 31, 2024
| Issues | Maturity Date | Principal Amount | Value | |||||||||
CORPORATES (continued) |
| |||||||||||
| Communications (continued) |
| |||||||||||
| Cogent Communications Group, Inc. |
| |||||||||||
7.00% | 06/15/277 | $ | 790,000 | $ | 787,095 | |||||||
| CommScope, Inc. |
| |||||||||||
4.75% | 09/01/297 | 931,000 | 670,320 | |||||||||
| Consolidated Communications, Inc. |
| |||||||||||
6.50% | 10/01/287 | 850,000 | 744,618 | |||||||||
| CSC Holdings LLC |
| |||||||||||
6.50% | 02/01/297 | 6,958,000 | 5,901,467 | |||||||||
7.50% | 04/01/287 | 4,075,000 | 2,750,202 | |||||||||
11.75% | 01/31/297 | 23,000 | 23,029 | |||||||||
| DISH DBS Corp. |
| |||||||||||
5.25% | 12/01/267 | 2,790,000 | 2,202,101 | |||||||||
7.38% | 07/01/28 | 2,365,000 | 1,137,386 | |||||||||
| Frontier Communications Holdings LLC |
| |||||||||||
5.00% | 05/01/287 | 24,000 | 22,326 | |||||||||
6.75% | 05/01/297 | 1,922,000 | 1,714,972 | |||||||||
8.63% | 03/15/317 | 1,000,000 | 1,021,992 | |||||||||
| Global Switch Finance BV |
| |||||||||||
| (EMTN) |
| |||||||||||
| (Netherlands) |
| |||||||||||
1.38% | 10/07/304 | 975,000 | 975,973 | |||||||||
| Gray Television, Inc. |
| |||||||||||
5.38% | 11/15/317 | 1,055,000 | 693,157 | |||||||||
| Nexstar Media, Inc. |
| |||||||||||
4.75% | 11/01/287 | 450,000 | 410,651 | |||||||||
| Northwest Fiber LLC/Northwest Fiber Finance Sub, Inc. |
| |||||||||||
4.75% | 04/30/277 | 1,725,000 | 1,768,125 | |||||||||
6.00% | 02/15/287 | 1,770,000 | 1,823,100 | |||||||||
| Scripps Escrow, Inc. |
| |||||||||||
5.88% | 07/15/277 | 587,000 | 493,080 | |||||||||
| SES GLOBALAmericas Holdings, Inc. |
| |||||||||||
5.30% | 03/25/447 | 1,680,000 | 1,286,629 | |||||||||
| Sirius XM Radio, Inc. |
| |||||||||||
3.88% | 09/01/317 | 1,657,000 | 1,382,756 | |||||||||
| Tele Columbus AG, |
| |||||||||||
| Series REGS |
| |||||||||||
| (Georgia) |
| |||||||||||
10.00% | 03/19/294,5 | 1,500,000 | 1,130,760 | |||||||||
| VZ Secured Financing BV |
| |||||||||||
| (Netherlands) |
| |||||||||||
5.00% | 01/15/324,7 | 4,237,000 | 3,641,082 | |||||||||
| VZ Secured Financing BV, |
| |||||||||||
| Series REGS |
| |||||||||||
| (Netherlands) |
| |||||||||||
3.50% | 01/15/324 | 1,260,000 | 1,196,449 | |||||||||
| Zayo Group Holdings, Inc. |
| |||||||||||
4.00% | 03/01/277 | 2,683,000 | 2,210,867 | |||||||||
|
| |||||||||||
| 56,175,238 | ||||||||||||
|
| |||||||||||
Consumer Discretionary — 4.25% |
| |||||||||||
| BAT Capital Corp. |
| |||||||||||
5.28% | 04/02/50 | 1,517,000 | 1,304,412 | |||||||||
| Central Garden & Pet Co. |
| |||||||||||
4.13% | 04/30/317 | 1,015,000 | 895,596 | |||||||||
| Everi Holdings, Inc. |
| |||||||||||
5.00% | 07/15/297 | 1,833,000 | 1,819,252 | |||||||||
| Issues | Maturity Date | Principal Amount | Value | |||||||||
CORPORATES (continued) |
| |||||||||||
| Consumer Discretionary (continued) |
| |||||||||||
| Hilton Domestic Operating Co., Inc. |
| |||||||||||
3.63% | 02/15/327 | $ | 2,673,000 | $ | 2,304,051 | |||||||
| Imperial Brands Finance Netherlands BV |
| |||||||||||
| (EMTN) |
| |||||||||||
| (Netherlands) |
| |||||||||||
1.75% | 03/18/334 | 770,000 | 674,236 | |||||||||
| Primo Water Holdings, Inc. |
| |||||||||||
4.38% | 04/30/297 | 2,600,000 | 2,393,393 | |||||||||
| Spectrum Brands, Inc. |
| |||||||||||
3.88% | 03/15/317 | 2,105,000 | 2,033,361 | |||||||||
5.00% | 10/01/297 | 270,000 | 265,950 | |||||||||
| Triton Water Holdings, Inc. |
| |||||||||||
6.25% | 04/01/297 | 1,240,000 | 1,132,145 | |||||||||
| WarnerMedia Holdings, Inc. |
| |||||||||||
5.14% | 03/15/52 | 5,810,000 | 4,829,667 | |||||||||
| Wyndham Hotels & Resorts, Inc. |
| |||||||||||
4.38% | 08/15/287 | 2,399,000 | 2,231,428 | |||||||||
|
| |||||||||||
| 19,883,491 | ||||||||||||
|
| |||||||||||
Consumer Products — 1.14% |
| |||||||||||
| Newell Brands, Inc. |
| |||||||||||
4.88% | 06/01/25 | 3,921,000 | 3,871,987 | |||||||||
7.00% | 04/01/46 | 1,779,000 | 1,438,447 | |||||||||
|
| |||||||||||
| 5,310,434 | ||||||||||||
|
| |||||||||||
Diversified REITs — 3.83% |
| |||||||||||
| American Assets Trust LP |
| |||||||||||
3.38% | 02/01/31 | 3,170,000 | 2,591,860 | |||||||||
| GLP Capital LP/GLP Financing II, Inc. |
| |||||||||||
5.25% | 06/01/25 | 3,490,000 | 3,483,613 | |||||||||
5.75% | 06/01/28 | 1,820,000 | 1,822,783 | |||||||||
6.75% | 12/01/33 | 750,000 | 791,609 | |||||||||
| VICI Properties LP |
| |||||||||||
4.95% | 02/15/30 | 5,650,000 | 5,463,889 | |||||||||
| VICI Properties LP/VICI Note Co., Inc. |
| |||||||||||
4.63% | 06/15/257 | 3,820,000 | 3,767,506 | |||||||||
|
| |||||||||||
| 17,921,260 | ||||||||||||
|
| |||||||||||
Electric — 0.38% |
| |||||||||||
| Pike Corp. |
| |||||||||||
8.63% | 01/31/317 | 1,680,000 | 1,787,607 | |||||||||
|
| |||||||||||
Energy — 4.07% |
| |||||||||||
| Energy Transfer LP, |
| |||||||||||
| Series B |
| |||||||||||
6.63%8,9 | 2,457,000 | 2,303,811 | ||||||||||
| Global Partners LP/GLP Finance Corp. |
| |||||||||||
6.88% | 01/15/29 | 904,000 | 897,559 | |||||||||
| NGL Energy Operating LLC/NGL Energy Finance Corp. |
| |||||||||||
8.38% | 02/15/327 | 190,000 | 194,997 | |||||||||
| Petroleos Mexicanos |
| |||||||||||
| (Mexico) |
| |||||||||||
5.95% | 01/28/314 | 524,000 | 420,578 | |||||||||
| Rockies Express Pipeline LLC |
| |||||||||||
4.80% | 05/15/307 | 650,000 | 603,850 | |||||||||
6.88% | 04/15/407 | 1,043,000 | 1,028,659 | |||||||||
See accompanying Notes to Financial Statements.
| 87 / Annual Report March 2024 |
Table of Contents
High Yield Bond Fund
Schedule of Portfolio Investments
March 31, 2024
| Issues | Maturity Date | Principal Amount | Value | |||||||||
CORPORATES (continued) |
| |||||||||||
| Energy (continued) |
| |||||||||||
| TransMontaigne Partners LP/TLP Finance Corp. |
| |||||||||||
6.13% | 02/15/26 | $ | 3,139,000 | $ | 3,001,669 | |||||||
| Transocean Titan Financing Ltd. |
| |||||||||||
| (Cayman Islands) |
| |||||||||||
8.38% | 02/01/284,7 | 700,000 | 726,250 | |||||||||
| USACompression Partners LP/USACompression Finance |
| |||||||||||
| Corp. |
| |||||||||||
6.88% | 09/01/27 | 1,170,000 | 1,173,515 | |||||||||
7.13% | 03/15/297 | 1,785,000 | 1,806,120 | |||||||||
| Venture Global Calcasieu Pass LLC |
| |||||||||||
4.13% | 08/15/317 | 2,300,000 | 2,049,872 | |||||||||
6.25% | 01/15/307 | 395,000 | 397,469 | |||||||||
| Venture Global LNG, Inc. |
| |||||||||||
9.50% | 02/01/297 | 3,221,000 | 3,474,736 | |||||||||
9.88% | 02/01/327 | 900,000 | 970,882 | |||||||||
|
| |||||||||||
| 19,049,967 | ||||||||||||
|
| |||||||||||
Entertainment — 0.51% |
| |||||||||||
| Banijay Entertainment SASTerm Loan B, 1st Lien |
| |||||||||||
| (France) |
| |||||||||||
8.13% | 05/01/294,7 | 1,040,000 | 1,073,478 | |||||||||
| WMGAcquisition Corp. |
| |||||||||||
3.75% | 12/01/297 | 1,476,000 | 1,326,555 | |||||||||
|
| |||||||||||
| 2,400,033 | ||||||||||||
|
| |||||||||||
Finance — 6.53% |
| |||||||||||
| American Express Co., |
| |||||||||||
| Series D |
| |||||||||||
3.55%8,9 | 2,150,000 | 1,995,469 | ||||||||||
| Avolon Holdings Funding Ltd. |
| |||||||||||
| (Cayman Islands) |
| |||||||||||
2.53% | 11/18/274,7 | 2,083,000 | 1,853,693 | |||||||||
| Charles Schwab Corp. (The) |
| |||||||||||
| Series K |
| |||||||||||
5.00%8,9 | 2,430,000 | 2,329,301 | ||||||||||
| Citigroup, Inc. |
| |||||||||||
2.56% | 05/01/329 | 1,545,000 | 1,289,022 | |||||||||
| Cushman & Wakefield U.S. Borrower LLC |
| |||||||||||
8.88% | 09/01/317 | 1,622,000 | 1,721,282 | |||||||||
| Ford Motor Credit Co. LLC |
| |||||||||||
2.30% | 02/10/25 | 2,150,000 | 2,085,500 | |||||||||
3.66% | 09/08/24 | 6,634,000 | 6,585,572 | |||||||||
4.06% | 11/01/24 | 6,083,000 | 6,023,386 | |||||||||
| GGAM Finance Ltd. |
| |||||||||||
| (Cayman Islands) |
| |||||||||||
8.00% | 02/15/274,7 | 775,000 | 800,687 | |||||||||
8.00% | 06/15/284,7 | 352,000 | 367,400 | |||||||||
| Icahn Enterprises LP/Icahn Enterprises Finance Corp. |
| |||||||||||
4.38% | 02/01/29 | 2,145,000 | 1,833,568 | |||||||||
5.25% | 05/15/27 | 761,000 | 707,730 | |||||||||
9.75% | 01/15/297 | 970,000 | 1,012,413 | |||||||||
| Jane Street Group/JSG Finance, Inc. |
| |||||||||||
4.50% | 11/15/297 | 780,000 | 723,690 | |||||||||
| Issues | Maturity Date | Principal Amount | Value | |||||||||
CORPORATES (continued) |
| |||||||||||
| Finance (continued) |
| |||||||||||
| Macquarie Airfinance Holdings Ltd. |
| |||||||||||
| (United Kingdom) |
| |||||||||||
6.40% | 03/26/294,7 | $ | 1,200,000 | $ | 1,218,876 | |||||||
|
| |||||||||||
| 30,547,589 | ||||||||||||
|
| |||||||||||
Food — 4.12% |
| |||||||||||
| B&G Foods, Inc. |
| |||||||||||
5.25% | 04/01/25 | 668,000 | 668,000 | |||||||||
| Chobani LLC/Chobani Finance Corp, Inc. |
| |||||||||||
4.63% | 11/15/287 | 290,000 | 270,766 | |||||||||
| ELO SACA |
| |||||||||||
| (EMTN) |
| |||||||||||
| (France) |
| |||||||||||
6.00% | 03/22/294 | 1,500,000 | 1,644,329 | |||||||||
| H-Food Holdings LLC/Hearthside Finance Co., Inc. |
| |||||||||||
8.50% | 06/01/267 | 1,387,000 | 104,025 | |||||||||
| JBS USA LUX SA/JBS USA Food Co./JBS USA Finance, |
| |||||||||||
| Inc. |
| |||||||||||
| (Canada) |
| |||||||||||
5.75% | 04/01/334 | 3,728,000 | 3,677,353 | |||||||||
| Nathan’s Famous, Inc. |
| |||||||||||
6.63% | 11/01/257 | 278,000 | 279,043 | |||||||||
| Pilgrim’s Pride Corp. |
| |||||||||||
3.50% | 03/01/32 | 6,356,000 | 5,395,145 | |||||||||
6.25% | 07/01/33 | 700,000 | 717,214 | |||||||||
| Post Holdings, Inc. |
| |||||||||||
5.63% | 01/15/287 | 1,750,000 | 1,720,759 | |||||||||
6.25% | 02/15/327 | 2,400,000 | 2,419,387 | |||||||||
| Simmons Foods, Inc./Simmons Prepared Foods, Inc./ |
| |||||||||||
| Simmons Pet Food, Inc./Simmons Feed |
| |||||||||||
4.63% | 03/01/297 | 2,659,000 | 2,354,884 | |||||||||
|
| |||||||||||
| 19,250,905 | ||||||||||||
|
| |||||||||||
Gaming — 1.37% |
| |||||||||||
| Churchill Downs, Inc. |
| |||||||||||
5.75% | 04/01/307 | 1,700,000 | 1,642,177 | |||||||||
| Wynn Las Vegas LLC/Wynn Las Vegas Capital Corp. |
| |||||||||||
5.25% | 05/15/277 | 4,854,000 | 4,761,095 | |||||||||
|
| |||||||||||
| 6,403,272 | ||||||||||||
|
| |||||||||||
Health Care — 10.72% |
| |||||||||||
| 1375209 BC Ltd. |
| |||||||||||
| (Canada) |
| |||||||||||
9.00% | 01/30/284,7 | 3,504,000 | 3,437,731 | |||||||||
| Bausch Health Cos., Inc. |
| |||||||||||
| (Canada) |
| |||||||||||
14.00% | 10/15/304,7 | 192,000 | 111,416 | |||||||||
| CAB SELAS, |
| |||||||||||
| Series REGS |
| |||||||||||
| (France) |
| |||||||||||
3.38% | 02/01/284 | 800,000 | 783,691 | |||||||||
| Cano Health LLC |
| |||||||||||
6.25% | 10/01/287,10,11,12,13 | 1,563,000 | 1,360 | |||||||||
| Catalent Pharma Solutions, Inc. |
| |||||||||||
3.50% | 04/01/307 | 1,845,000 | 1,758,783 | |||||||||
See accompanying Notes to Financial Statements.
| Annual Report March 2024 / 88 |
Table of Contents
High Yield Bond Fund
Schedule of Portfolio Investments
March 31, 2024
| Issues | Maturity Date | Principal Amount | Value | |||||||||
CORPORATES (continued) |
| |||||||||||
| Health Care (continued) |
| |||||||||||
| Centene Corp. |
| |||||||||||
2.45% | 07/15/28 | $ | 2,404,000 | $ | 2,134,647 | |||||||
2.63% | 08/01/31 | 1,219,000 | 1,004,907 | |||||||||
3.00% | 10/15/30 | 865,000 | 742,418 | |||||||||
4.25% | 12/15/27 | 8,170,000 | 7,796,054 | |||||||||
| Embecta Corp. |
| |||||||||||
6.75% | 02/15/307 | 1,060,000 | 927,405 | |||||||||
| Ephios Subco 3 SARL |
| |||||||||||
| (Luxembourg) |
| |||||||||||
7.88% | 01/31/314,7 | 790,000 | 897,950 | |||||||||
| Grifols SA |
| |||||||||||
| (Spain) |
| |||||||||||
4.75% | 10/15/284,7 | 1,171,000 | 969,780 | |||||||||
| Grifols SA, |
| |||||||||||
| Series REGS |
| |||||||||||
| (Spain) |
| |||||||||||
3.20% | 05/01/254 | 1,575,000 | 1,571,394 | |||||||||
3.88% | 10/15/284 | 1,965,000 | 1,682,125 | |||||||||
| Heartland Dental LLC/Heartland Dental Finance Corp. |
| |||||||||||
10.50% | 04/30/287 | 791,000 | 841,290 | |||||||||
| Kedrion SpA |
| |||||||||||
| (Italy) |
| |||||||||||
6.50% | 09/01/294,7 | 2,470,000 | 2,253,685 | |||||||||
| ModivCare Escrow Issuer, Inc. |
| |||||||||||
5.00% | 10/01/297 | 3,795,000 | 2,756,549 | |||||||||
| ModivCare, Inc. |
| |||||||||||
5.88% | 11/15/257 | 1,415,000 | 1,379,309 | |||||||||
| Molina Healthcare, Inc. |
| |||||||||||
4.38% | 06/15/287 | 900,000 | 846,706 | |||||||||
| Option Care Health, Inc. |
| |||||||||||
4.38% | 10/31/297 | 1,000,000 | 919,334 | |||||||||
| Prestige Brands, Inc. |
| |||||||||||
3.75% | 04/01/317 | 1,847,000 | 1,609,757 | |||||||||
| Star Parent, Inc. |
| |||||||||||
9.00% | 10/01/307 | 700,000 | 742,332 | |||||||||
| Teleflex, Inc. |
| |||||||||||
4.25% | 06/01/287 | 1,729,000 | 1,623,851 | |||||||||
| Tenet Healthcare Corp. |
| |||||||||||
4.63% | 06/15/28 | 4,350,000 | 4,148,081 | |||||||||
5.13% | 11/01/27 | 7,993,000 | 7,824,210 | |||||||||
| Teva Pharmaceutical Finance Netherlands III BV |
| |||||||||||
| (Netherlands) |
| |||||||||||
8.13% | 09/15/314 | 1,257,000 | 1,378,550 | |||||||||
|
| |||||||||||
| 50,143,315 | ||||||||||||
|
| |||||||||||
Industrials — 7.07% |
| |||||||||||
| Ardagh Packaging Finance PLC/Ardagh Holdings USA, Inc. |
| |||||||||||
| (Canada) |
| |||||||||||
4.13% | 08/15/264,7 | 1,536,000 | 1,395,171 | |||||||||
5.25% | 08/15/274,7 | 2,447,000 | 1,543,015 | |||||||||
| Artera Services LLC |
| |||||||||||
8.50% | 02/15/317 | 1,145,000 | 1,174,739 | |||||||||
| Ball Corp. |
| |||||||||||
5.25% | 07/01/25 | 5,000,000 | 5,006,250 | |||||||||
| Berry Global, Inc. |
| |||||||||||
4.88% | 07/15/267 | 1,525,000 | 1,495,619 | |||||||||
| Issues | Maturity Date | Principal Amount | Value | |||||||||
CORPORATES (continued) |
| |||||||||||
| Industrials (continued) |
| |||||||||||
5.65% | 01/15/347 | $ | 1,205,000 | $ | 1,199,816 | |||||||
| Clydesdale Acquisition Holdings, Inc. |
| |||||||||||
6.63% | 04/15/297 | 150,000 | 150,033 | |||||||||
| Energizer Holdings, Inc. |
| |||||||||||
4.38% | 03/31/297 | 1,120,000 | 1,009,400 | |||||||||
| General Electric Co. |
| |||||||||||
| (MTN) |
| |||||||||||
| (CME Term SOFR 3-Month plus 0.74%) |
| |||||||||||
6.05% | 08/15/361 | 1,300,000 | 1,207,452 | |||||||||
| Graham Packaging Co., Inc. |
| |||||||||||
7.13% | 08/15/287 | 2,012,000 | 1,828,081 | |||||||||
| Graphic Packaging International LLC |
| |||||||||||
4.13% | 08/15/24 | 3,745,000 | 3,731,892 | |||||||||
| II-VI, Inc. |
| |||||||||||
5.00% | 12/15/297 | 566,000 | 533,555 | |||||||||
| Madison IAQ LLC |
| |||||||||||
4.13% | 06/30/287 | 1,000,000 | 927,500 | |||||||||
| OT Merger Corp. |
| |||||||||||
7.88% | 10/15/297 | 2,808,000 | 2,025,726 | |||||||||
| Paprec Holding SA |
| |||||||||||
| (France) |
| |||||||||||
7.25% | 11/17/294,7 | 900,000 | 1,038,874 | |||||||||
| Rolls-Royce PLC |
| |||||||||||
| (EMTN) |
| |||||||||||
| (United Kingdom) |
| |||||||||||
1.63% | 05/09/284 | 400,000 | 396,427 | |||||||||
| TransDigm, Inc. |
| |||||||||||
6.38% | 03/01/297 | 6,578,000 | 6,599,839 | |||||||||
| Trivium Packaging Finance BV |
| |||||||||||
| (Netherlands) |
| |||||||||||
5.50% | 08/15/264,7 | 506,000 | 499,352 | |||||||||
| Verde Purchaser LLC |
| |||||||||||
10.50% | 11/30/307 | 1,245,000 | 1,313,150 | |||||||||
|
| |||||||||||
| 33,075,891 | ||||||||||||
|
| |||||||||||
Information Technology — 4.40% |
| |||||||||||
| Booz Allen Hamilton, Inc. |
| |||||||||||
4.00% | 07/01/297 | 2,816,000 | 2,625,983 | |||||||||
| MSCI, Inc. |
| |||||||||||
3.63% | 09/01/307 | 2,270,000 | 2,016,431 | |||||||||
3.63% | 11/01/317 | 1,266,000 | 1,099,957 | |||||||||
| NCR Voyix Corp. |
| |||||||||||
5.25% | 10/01/307 | 3,875,000 | 3,509,795 | |||||||||
| Open Text Corp. |
| |||||||||||
| (Canada) |
| |||||||||||
6.90% | 12/01/274,7 | 752,000 | 776,365 | |||||||||
| RingCentral, Inc. |
| |||||||||||
8.50% | 08/15/307 | 1,516,000 | 1,577,525 | |||||||||
| Science Applications International Corp. |
| |||||||||||
4.88% | 04/01/287 | 2,023,000 | 1,933,570 | |||||||||
| Uber Technologies, Inc. |
| |||||||||||
7.50% | 09/15/277 | 4,600,000 | 4,715,323 | |||||||||
| ZoomInfo Technologies LLC/ZoomInfo Finance Corp. |
| |||||||||||
3.88% | 02/01/297 | 2,575,000 | 2,323,938 | |||||||||
|
| |||||||||||
| 20,578,887 | ||||||||||||
|
| |||||||||||
See accompanying Notes to Financial Statements.
| 89 / Annual Report March 2024 |
Table of Contents
High Yield Bond Fund
Schedule of Portfolio Investments
March 31, 2024
| Issues | Maturity Date | Principal Amount | Value | |||||||||
CORPORATES (continued) |
| |||||||||||
| Insurance — 0.72% |
| |||||||||||
| Acrisure LLC/Acrisure Finance, Inc. |
| |||||||||||
6.00% | 08/01/297 | $ | 3,678,000 | $ | 3,383,760 | |||||||
|
| |||||||||||
| Materials — 3.61% |
| |||||||||||
| ASP Unifrax Holdings, Inc. |
| |||||||||||
5.25% | 09/30/287 | 1,566,000 | 1,012,391 | |||||||||
| ATI, Inc. |
| |||||||||||
5.13% | 10/01/31 | 857,000 | 799,153 | |||||||||
7.25% | 08/15/30 | 550,000 | 570,790 | |||||||||
| Axalta Coating Systems, LLC |
| |||||||||||
3.38% | 02/15/297 | 3,523,000 | 3,158,964 | |||||||||
| Clearwater Paper Corp. |
| |||||||||||
4.75% | 08/15/287 | 3,233,000 | 3,010,025 | |||||||||
| Herens Holdco SARL |
| |||||||||||
| (Luxembourg) |
| |||||||||||
4.75% | 05/15/284,7 | 2,896,000 | 2,535,482 | |||||||||
| International Flavors & Fragrances, Inc. |
| |||||||||||
2.30% | 11/01/307 | 1,655,000 | 1,375,564 | |||||||||
5.00% | 09/26/48 | 230,000 | 196,857 | |||||||||
| SCIH Salt Holdings, Inc. |
| |||||||||||
4.88% | 05/01/287 | 272,000 | 254,660 | |||||||||
| SK Invictus Intermediate II SARL |
| |||||||||||
| (Luxembourg) |
| |||||||||||
5.00% | 10/30/294,7 | 1,168,000 | 1,042,311 | |||||||||
| Valvoline, Inc. |
| |||||||||||
3.63% | 06/15/317 | 2,112,000 | 1,822,402 | |||||||||
| WR Grace Holdings, LLC |
| |||||||||||
5.63% | 08/15/297 | 1,234,000 | 1,105,577 | |||||||||
|
| |||||||||||
| 16,884,176 | ||||||||||||
|
| |||||||||||
| Office REITs — 0.47% |
| |||||||||||
| Hudson Pacific Properties LP |
| |||||||||||
3.25% | 01/15/30 | 1,188,000 | 916,888 | |||||||||
4.65% | 04/01/29 | 1,160,000 | 989,382 | |||||||||
| Piedmont Operating Partnership LP |
| |||||||||||
2.75% | 04/01/32 | 418,000 | 302,480 | |||||||||
|
| |||||||||||
| 2,208,750 | ||||||||||||
|
| |||||||||||
| Retail — 2.74% |
| |||||||||||
| Bloomin’ Brands, Inc./OSI Restaurant Partners LLC |
| |||||||||||
5.13% | 04/15/297 | 267,000 | 248,977 | |||||||||
| Ferrellgas LP/Ferrellgas Finance Corp. |
| |||||||||||
5.88% | 04/01/297 | 3,552,000 | 3,388,786 | |||||||||
| Fertitta Entertainment, LLC/Fertitta Entertainment Finance |
| |||||||||||
| Co., Inc. |
| |||||||||||
6.75% | 01/15/307 | 1,641,000 | 1,481,002 | |||||||||
| FirstCash, Inc. |
| |||||||||||
5.63% | 01/01/307 | 2,071,000 | 1,972,188 | |||||||||
| LCM Investments Holdings II LLC |
| |||||||||||
8.25% | 08/01/317 | 1,500,000 | 1,567,500 | |||||||||
| Lithia Motors, Inc. |
| |||||||||||
3.88% | 06/01/297 | 875,000 | 791,219 | |||||||||
| Michaels Cos., Inc. (The) |
| |||||||||||
7.88% | 05/01/297 | 3,428,000 | 2,575,091 | |||||||||
| Issues | Maturity Date | Principal Amount | Value | |||||||||
CORPORATES (continued) |
| |||||||||||
| Retail (continued) |
| |||||||||||
| Papa John’s International, Inc. |
| |||||||||||
3.88% | 09/15/297 | $ | 900,000 | $ | 799,589 | |||||||
|
| |||||||||||
| 12,824,352 | ||||||||||||
|
| |||||||||||
| Services — 3.70% |
| |||||||||||
| Adtalem Global Education, Inc. |
| |||||||||||
5.50% | 03/01/287 | 2,036,000 | 1,951,776 | |||||||||
| Block, Inc. |
| |||||||||||
3.50% | 06/01/31 | 1,095,000 | 958,125 | |||||||||
| Carriage Services, Inc. |
| |||||||||||
4.25% | 05/15/297 | 1,400,000 | 1,244,088 | |||||||||
| HealthEquity, Inc. |
| |||||||||||
4.50% | 10/01/297 | 1,204,000 | 1,114,127 | |||||||||
| Hertz Corp. (The) |
| |||||||||||
5.00% | 12/01/297 | 987,000 | 764,925 | |||||||||
| Prime Security Services Borrower LLC/Prime Finance, Inc. |
| |||||||||||
3.38% | 08/31/277 | 300,000 | 276,043 | |||||||||
5.25% | 04/15/247 | 720,000 | 719,826 | |||||||||
5.75% | 04/15/267 | 2,460,000 | 2,454,509 | |||||||||
| Upbound Group, Inc. |
| |||||||||||
6.38% | 02/15/297 | 1,770,000 | 1,721,325 | |||||||||
| VT Topco, Inc. |
| |||||||||||
8.50% | 08/15/307 | 689,000 | 727,800 | |||||||||
| WASH Multifamily Acquisition, Inc. |
| |||||||||||
5.75% | 04/15/267 | 2,625,000 | 2,566,963 | |||||||||
| Waste Pro USA, Inc. |
| |||||||||||
5.50% | 02/15/267 | 2,455,000 | 2,419,988 | |||||||||
| Worldline SA |
| |||||||||||
| (France) |
| |||||||||||
0.00% | 07/30/254,14 | 150 | 17,928 | |||||||||
0.00% | 07/30/264,14 | 3,800 | 371,807 | |||||||||
|
| |||||||||||
| 17,309,230 | ||||||||||||
|
| |||||||||||
| Specialized REITs — 0.39% |
| |||||||||||
| Blackstone Property Partners Europe Holdings SARL |
| |||||||||||
| (EMTN) |
| |||||||||||
| (Luxembourg) |
| |||||||||||
1.75% | 03/12/294 | 635,000 | 598,192 | |||||||||
| Greystar Real Estate Partners LLC |
| |||||||||||
7.75% | 09/01/307 | 1,150,000 | 1,196,000 | |||||||||
|
| |||||||||||
| 1,794,192 | ||||||||||||
|
| |||||||||||
| Transportation — 0.23% |
| |||||||||||
| U.S. Airways Pass-Through Trust, |
| |||||||||||
| Series 2012-1, Class A |
| |||||||||||
5.90% | 10/01/24 | 1,087,561 | 1,087,561 | |||||||||
|
| |||||||||||
See accompanying Notes to Financial Statements.
| Annual Report March 2024 / 90 |
Table of Contents
High Yield Bond Fund
Schedule of Portfolio Investments
March 31, 2024
| Issues | Maturity Date | Principal Amount | Value | |||||||||
CORPORATES (continued) |
| |||||||||||
| Water — 0.06% |
| |||||||||||
| Thames Water Utilities Finance PLC |
| |||||||||||
| (EMTN) |
| |||||||||||
| (United Kingdom) |
| |||||||||||
4.38% | 01/18/314 | $ | 255,000 | $ | 256,821 | |||||||
|
| |||||||||||
| Total Corporates |
| |||||||||||
| (Cost $356,143,813) |
| 347,143,680 | ||||||||||
|
| |||||||||||
| Total Bonds — 89.63% |
| |||||||||||
| (Cost $428,389,273) |
| 419,227,387 | ||||||||||
|
| |||||||||||
| Issues | Shares | Value | ||||||||||
COMMON STOCK — 0.56% |
| |||||||||||
| Communications — 0.43% |
| |||||||||||
| Intelsat Emergence SA4,10,12,13 |
| |||||||||||
| (Luxembourg) | 75,716 | 2,034,867 | ||||||||||
|
| |||||||||||
| Electric — 0.00% |
| |||||||||||
| Homer City Holdings LLC10,12,13,15 | 502,908 | — | ||||||||||
|
| |||||||||||
| Services — 0.13% |
| |||||||||||
| Hertz Global Holdings, Inc.12 | 75,000 | 587,250 | ||||||||||
|
| |||||||||||
| Total Common Stock |
| |||||||||||
| (Cost $30,687,379) | 2,622,117 | |||||||||||
|
| |||||||||||
WARRANT — 0.00% |
| |||||||||||
| Communications — 0.00% |
| |||||||||||
| Intelsat Jackson Holdings SA,4,10,12,13 |
| |||||||||||
| (Luxembourg) | 16 | 16 | ||||||||||
|
| |||||||||||
| Entertainment — 0.00% |
| |||||||||||
| Cineworld Group PLC4,10,12,13 |
| |||||||||||
| (United Kingdom) | 288,340 | — | ||||||||||
|
| |||||||||||
| Total Warrant |
| |||||||||||
| (Cost $60) | 16 | |||||||||||
|
| |||||||||||
| Issues | Maturity Date | Principal Amount/Shares | Value | |||||||||
SHORT-TERM INVESTMENTS — 8.57% |
| |||||||||||
| Money Market Funds — 2.20% |
| |||||||||||
| Fidelity Investments Money Market Funds -Government Portfolio |
| |||||||||||
5.21%16 | 178,330 | 178,330 | ||||||||||
| Morgan Stanley Institutional Liquidity Funds - Government Portfolio |
| |||||||||||
5.22%16 | 10,100,000 | 10,100,000 | ||||||||||
|
| |||||||||||
| 10,278,330 | ||||||||||||
|
| |||||||||||
| U.S. Treasury Bills — 6.37% |
| |||||||||||
| U.S. Treasury Bills (WI) |
| |||||||||||
5.32%17 | 05/30/24 | 5,000,000 | 4,954,727 | |||||||||
5.35%17 | 05/16/24 | 15,000,000 | 14,895,600 | |||||||||
| Issues | Maturity Date | Principal Amount/Shares | Value | |||||||||
SHORT-TERM INVESTMENTS (continued) |
| |||||||||||
| U.S. Treasury Bills (continued) |
| |||||||||||
5.29%17 | 04/18/24 | $ | 10,000,000 | $ | 9,975,167 | |||||||
|
| |||||||||||
| 29,825,494 | ||||||||||||
|
| |||||||||||
| Total Short-Term Investments |
| |||||||||||
| (Cost $40,113,123) |
| 40,103,824 | ||||||||||
|
| |||||||||||
| Total Investments - 98.76% |
| |||||||||||
| (Cost $499,189,835) |
| 461,953,344 | ||||||||||
|
| |||||||||||
| Net unrealized appreciation on unfunded commitments - 0.00% |
| 1,478 | ||||||||||
| Cash and Other Assets, Less Liabilities - 1.24% |
| 5,755,248 | ||||||||||
|
| |||||||||||
| Net Assets - 100.00% |
| $ | 467,710,070 | |||||||||
|
| |||||||||||
| 1 | Floating rate security. The rate disclosed was in effect at March 31, 2024. |
| 2 | Payment-in-kind (“PIK”) security. Income may be paid in additional securities or cash at the discretion of the issuer -7.19% cash or 1.50% payment-in-kind interest. |
| 3 | Excluded from the investment total above is an unfunded delayed draw term loan commitment in an amount not to exceed $154,795, at an interest rate of 9.58% and a maturity of July 31, 2028. The investment is not accruing an unused commitment fee. |
| 4 | Foreign denominated security issued by foreign domiciled entity. |
| 5 | Payment-in-kind (“PIK”) security. |
| 6 | Excluded from the investment total above is an unfunded delayed draw term loan commitment in an amount not to exceed $95,834, at an interest rate of 9.82% and a maturity of November 14, 2030. The investment is not accruing an unused commitment fee. |
| 7 | Securities exempt from registration under Rule 144A of the Securities Act of 1933, as amended. The securities may be resold in transactions exempt from registration, normally to qualified institutional buyers. |
| 8 | Perpetual security with no stated maturity date. |
| 9 | Variable rate security. Interest rate disclosed is as of the most recent information available. Certain variable rate securities are not based on a published reference rate and spread but are determined by the issuer or agent and are based on current market conditions. |
| 10 | Security is valued using significant unobservable inputs and is classified as Level 3 in the fair value hierarchy. |
| 11 | Security is currently in default with regard to scheduled interest or principal payments. |
| 12 | Non-income producing security. |
| 13 | Illiquid security as determined under procedures approved by the Board of Trustees. The aggregate value of illiquid securities is $2,036,243, which is 0.44% of total net assets. |
| 14 | Zero coupon bond. The rate shown is the effective yield as of March 31, 2024. |
| 15 | Affiliated investment. |
| 16 | Represents the current yield as of March 31, 2024. |
| 17 | Represents annualized yield at date of purchase. |
| * | Securities with a call or reset feature will have an effective maturity date sooner than the stated maturity. |
Note: For Fund compliance purposes, the Fund’s industry classifications refer to any one or more of the industry sub-classifications used by one or more widely recognized market indexes or ratings group indexes, and/or as defined by Fund management. This definition may not apply for purposes of this report, which may combine industry sub-classifications for more meaningful presentation for investors.
(EMTN): Euro Medium-Term Note
(EUR): Euro
(LIBOR): London InterBank Offer Rate
(MTN): Medium-Term Note
(REIT): Real Estate Investment Trust
(SOFR): Secured Overnight Financing Rate
(WI): When Issued
See accompanying Notes to Financial Statements.
| 91 / Annual Report March 2024 |
Table of Contents
High Yield Bond Fund
Schedule of Portfolio Investments
March 31, 2024
| Currency to be Purchased | Currency to be Sold | Counterparty | Settlement Date | Unrealized Appreciation (Depreciation) | ||||||
FOREIGN CURRENCY EXCHANGE CONTRACT | ||||||||||
USD 1,659,442 | EUR 1,531,000 | Bank of America N.A. | 04/12/24 | $ | 5,000 | |||||
USD 12,008,807 | EUR 10,919,000 | Citibank N.A. | 04/12/24 | 209,423 | ||||||
USD 909,351 | EUR 836,000 | The Bank of New York Mellon | 04/12/24 | 5,945 | ||||||
|
| |||||||||
| 220,368 | ||||||||||
|
| |||||||||
EUR 671,000 | USD 725,882 | Citibank N.A. | 04/12/24 | (780) | ||||||
EUR 245,000 | USD 267,088 | Bank of America N.A. | 04/12/24 | (2,334) | ||||||
|
| |||||||||
| (3,114) | ||||||||||
|
| |||||||||
NET UNREALIZED APPRECIATION | $ | 217,254 | ||||||||
|
| |||||||||
| Description | Number of Contracts | Expiration Date | Notional Amount | Value | Unrealized Appreciation (Depreciation) | |||||||||||||
FUTURES CONTRACTS: LONG POSITIONS | ||||||||||||||||||
U.S. Treasury Five-Year Note | 626 | 06/28/24 | $ | 66,991,784 | $ | 54,027 | $ | 54,027 | ||||||||||
U.S. Treasury Two-Year Note | 204 | 06/28/24 | 41,714,813 | (46,364 | ) | (46,364 | ) | |||||||||||
|
|
|
|
|
| |||||||||||||
| 108,706,597 | 7,663 | 7,663 | ||||||||||||||||
|
|
|
|
|
| |||||||||||||
FUTURES CONTRACTS: SHORT POSITIONS | ||||||||||||||||||
Euro-Bobl Future | 51 | 06/06/24 | (6,513,210) | (29,254) | (29,254) | |||||||||||||
Euro-Schatz Future | 22 | 06/06/24 | (2,511,432) | (542) | (542) | |||||||||||||
U.S. Treasury Ten-Year Ultra Bond | 12 | 06/18/24 | (1,375,312) | (8,435) | (8,435) | |||||||||||||
Euro-Bund Future | 12 | 06/06/24 | (1,728,605) | (12,068) | (12,068) | |||||||||||||
|
|
|
|
|
| |||||||||||||
| (12,128,559) | (50,299) | (50,299) | ||||||||||||||||
|
|
|
|
|
| |||||||||||||
TOTAL FUTURES CONTRACTS | $ | 96,578,038 | $ | (42,636) | $ | (42,636) | ||||||||||||
|
|
|
|
|
| |||||||||||||
See accompanying Notes to Financial Statements.
| Annual Report March 2024 / 92 |
Table of Contents
Schedule of Portfolio Investments
March 31, 2024
| Issues | Maturity Date | Principal Amount | Value | |||||||||
BONDS – 97.33% |
| |||||||||||
| ASSET-BACKED SECURITIES — 5.97%** |
| |||||||||||
| Academic Loan Funding Trust, |
| |||||||||||
| Series 2012-1A, Class A2 |
| |||||||||||
| (SOFR30A plus 1.21%) |
| |||||||||||
6.53% | 12/27/441,2 | $ | 355,803 | $ | 351,558 | |||||||
| Allegro CLO VI Ltd., |
| |||||||||||
| Series 2017-2A, Class B |
| |||||||||||
| (Cayman Islands) |
| |||||||||||
| (CME Term SOFR 3-Month plus 1.76%) |
| |||||||||||
7.08% | 01/17/311,2,3 | 1,750,000 | 1,749,300 | |||||||||
| Allegro CLO VIII Ltd., |
| |||||||||||
| Series 2018-2A, Class A |
| |||||||||||
| (Cayman Islands) |
| |||||||||||
| (CME Term SOFR 3-Month plus 1.36%) |
| |||||||||||
6.68% | 07/15/311,2,3 | 2,241,664 | 2,243,121 | |||||||||
| AMMC CLO 30 Ltd., |
| |||||||||||
| Series 2024-30A, Class A1 |
| |||||||||||
| (Cayman Islands) |
| |||||||||||
| (CME Term SOFR 3-Month plus 1.68%) |
| |||||||||||
6.97% | 01/15/371,2,3 | 2,000,000 | 2,008,900 | |||||||||
| Apidos CLO Xxv, |
| |||||||||||
| Series 2016-25A, Class A1R2 |
| |||||||||||
| (Cayman Islands) |
| |||||||||||
| (CME Term SOFR 3-Month plus 1.15%) |
| |||||||||||
6.46% | 10/20/311,2,3 | 2,625,000 | 2,627,431 | |||||||||
| Cedar Funding XII CLO Ltd., |
| |||||||||||
| Series 2020-12A, Class A1R |
| |||||||||||
| (Cayman Islands) |
| |||||||||||
| (CME Term SOFR 3-Month plus 1.39%) |
| |||||||||||
6.72% | 10/25/341,2,3 | 2,000,000 | 2,001,100 | |||||||||
| CIT Education Loan Trust, |
| |||||||||||
| Series 2007-1, Class A |
| |||||||||||
| (SOFR90A plus 0.35%) |
| |||||||||||
5.70% | 03/25/421,2 | 122,220 | 116,598 | |||||||||
| Clover CLO Ltd., |
| |||||||||||
| Series 2019-2A, Class BR |
| |||||||||||
| (Cayman Islands) |
| |||||||||||
| (CME Term SOFR 3-Month plus 1.86%) |
| |||||||||||
7.19% | 10/25/331,2,3 | 2,100,000 | 2,100,210 | |||||||||
| Dryden XXVI Senior Loan Fund, |
| |||||||||||
| Series 2013-26A, Class AR |
| |||||||||||
| (Cayman Islands) |
| |||||||||||
| (CME Term SOFR 3-Month plus 1.16%) |
| |||||||||||
6.48% | 04/15/291,2,3 | 1,218,078 | 1,217,286 | |||||||||
| Global SC Finance II SRL, |
| |||||||||||
| Series 2014-1A, Class A2 |
| |||||||||||
| (Barbados) |
| |||||||||||
3.09% | 07/17/292,3 | 55,610 | 55,023 | |||||||||
| J.G. Wentworth XXX LLC, |
| |||||||||||
| Series 2013-3A, Class A |
| |||||||||||
4.08% | 01/17/732 | 305,364 | 286,264 | |||||||||
| J.G. Wentworth XXXII LLC, |
| |||||||||||
| Series 2014-2A, Class A |
| |||||||||||
3.61% | 01/17/732 | 554,061 | 497,122 | |||||||||
| Issues | Maturity Date | Principal Amount | Value | |||||||||
ASSET-BACKED SECURITIES (continued) |
| |||||||||||
| Madison Park Funding XXV Ltd., |
| |||||||||||
| Series 2017-25A, Class A1R |
| |||||||||||
| (Cayman Islands) |
| |||||||||||
| (CME Term SOFR 3-Month plus 1.23%) |
| |||||||||||
6.56% | 04/25/291,2,3 | $ | 1,787,061 | $ | 1,787,867 | |||||||
| Navient Student Loan Trust, |
| |||||||||||
| Series 2014-1, Class A3 |
| |||||||||||
| (SOFR30A plus 0.62%) |
| |||||||||||
5.94% | 06/25/311 | 348,306 | 343,839 | |||||||||
| Navient Student Loan Trust, |
| |||||||||||
| Series 2014-3, Class A |
| |||||||||||
| (SOFR30A plus 0.73%) |
| |||||||||||
6.05% | 03/25/831 | 1,092,682 | 1,092,495 | |||||||||
| Navient Student Loan Trust, |
| |||||||||||
| Series 2016-2A, Class A3 |
| |||||||||||
| (SOFR30A plus 1.61%) |
| |||||||||||
6.93% | 06/25/651,2 | 1,179,762 | 1,197,487 | |||||||||
| Nelnet Student Loan Trust, |
| |||||||||||
| Series 2014-4A, Class A2 |
| |||||||||||
| (SOFR30A plus 1.06%) |
| |||||||||||
6.38% | 11/25/481,2 | 1,115,083 | 1,112,034 | |||||||||
| Neuberger Berman CLO XX Ltd., |
| |||||||||||
| Series 2015-20A, Class ARR |
| |||||||||||
| (Cayman Islands) |
| |||||||||||
| (CME Term SOFR 3-Month plus 1.42%) |
| |||||||||||
6.74% | 07/15/341,2,3 | 1,915,000 | 1,916,653 | |||||||||
| OCP CLO Ltd., |
| |||||||||||
| Series 2020-19A, Class AR |
| |||||||||||
| (Cayman Islands) |
| |||||||||||
| (CME Term SOFR 3-Month plus 1.41%) |
| |||||||||||
6.73% | 10/20/341,2,3 | 1,750,000 | 1,751,074 | |||||||||
| Octagon Investment Partners 46 Ltd., |
| |||||||||||
| Series 2020-2A, Class AR |
| |||||||||||
| (Cayman Islands) |
| |||||||||||
| (CME Term SOFR 3-Month plus 1.42%) |
| |||||||||||
6.74% | 07/15/361,2,3 | 2,000,000 | 2,000,500 | |||||||||
| Palmer Square Loan Funding Ltd., |
| |||||||||||
| Series 2022-3A, Class A1BR |
| |||||||||||
| (Cayman Islands) |
| |||||||||||
| (CME Term SOFR 3-Month plus 1.40%) |
| |||||||||||
6.72% | 04/15/311,2,3 | 2,500,000 | 2,501,227 | |||||||||
| Progress Residential Trust, |
| |||||||||||
| Series 2021-SFR8, Class D |
| |||||||||||
2.08% | 10/17/382 | 1,150,000 | 1,043,736 | |||||||||
| Recette CLO Ltd., |
| |||||||||||
| Series 2015-1A, Class ARR |
| |||||||||||
| (Cayman Islands) |
| |||||||||||
| (CME Term SOFR 3-Month plus 1.34%) |
| |||||||||||
6.66% | 04/20/341,2,3 | 1,875,000 | 1,875,847 | |||||||||
| Regata XII Funding Ltd., |
| |||||||||||
| Series 2019-1A, Class BR |
| |||||||||||
| (Cayman Islands) |
| |||||||||||
| (CME Term SOFR 3-Month plus 1.86%) |
| |||||||||||
7.18% | 10/15/321,2,3 | 2,100,000 | 2,101,359 | |||||||||
See accompanying Notes to Financial Statements.
| 93 / Annual Report March 2024 |
Table of Contents
Intermediate Bond Fund
Schedule of Portfolio Investments
March 31, 2024
| Issues | Maturity Date | Principal Amount | Value | |||||||||
ASSET-BACKED SECURITIES (continued) |
| |||||||||||
| Rockford Tower CLO Ltd., |
| |||||||||||
| Series 2019-2A, Class AR |
| |||||||||||
| (Cayman Islands) |
| |||||||||||
| (CME Term SOFR 3-Month plus 1.36%) |
| |||||||||||
6.68% | 08/20/321,2,3 | $ | 2,000,000 | $ | 2,001,194 | |||||||
| SBNAAuto Receivables Trust, |
| |||||||||||
| Series 2024-A, Class A3 |
| |||||||||||
5.32% | 12/15/282 | 2,450,000 | 2,450,794 | |||||||||
| Skyline Aircraft Finance LLC, |
| |||||||||||
| Series 2021-1, Class A |
| |||||||||||
3.23% | 05/10/374,5,6 | 1,896,663 | 1,694,031 | |||||||||
| SLC Student Loan Trust, |
| |||||||||||
| Series 2004-1, Class B |
| |||||||||||
| (SOFR90A plus 0.55%) |
| |||||||||||
5.91% | 08/15/311 | 73,166 | 62,370 | |||||||||
| SLC Student Loan Trust, |
| |||||||||||
| Series 2008-1, Class A4A |
| |||||||||||
| (SOFR90A plus 1.86%) |
| |||||||||||
7.22% | 12/15/321 | 124,670 | 126,597 | |||||||||
| SLM Student Loan Trust, |
| |||||||||||
| Series 2004-2, Class B |
| |||||||||||
| (SOFR90A plus 0.73%) |
| |||||||||||
6.09% | 07/25/391 | 96,181 | 90,329 | |||||||||
| SLM Student Loan Trust, |
| |||||||||||
| Series 2006-8, Class A6 |
| |||||||||||
| (SOFR90A plus 0.42%) |
| |||||||||||
5.78% | 01/25/411 | 680,813 | 659,480 | |||||||||
| SLM Student Loan Trust, |
| |||||||||||
| Series 2008-2, Class B |
| |||||||||||
| (SOFR90A plus 1.46%) |
| |||||||||||
6.82% | 01/25/831 | 185,000 | 177,742 | |||||||||
| SLM Student Loan Trust, |
| |||||||||||
| Series 2008-3, Class B |
| |||||||||||
| (SOFR90A plus 1.46%) |
| |||||||||||
6.82% | 04/26/831 | 185,000 | 176,502 | |||||||||
| SLM Student Loan Trust, |
| |||||||||||
| Series 2008-4, Class B |
| |||||||||||
| (SOFR90A plus 2.11%) |
| |||||||||||
7.47% | 04/25/731 | 185,000 | 186,498 | |||||||||
| SLM Student Loan Trust, |
| |||||||||||
| Series 2008-5, Class B |
| |||||||||||
| (SOFR90A plus 2.11%) |
| |||||||||||
7.47% | 07/25/731 | 2,235,000 | 2,224,454 | |||||||||
| SLM Student Loan Trust, |
| |||||||||||
| Series 2008-6, Class A4 |
| |||||||||||
| (SOFR90A plus 1.36%) |
| |||||||||||
6.72% | 07/25/231 | 1,122,135 | 1,114,282 | |||||||||
| SLM Student Loan Trust, |
| |||||||||||
| Series 2008-6, Class B |
| |||||||||||
| (SOFR90A plus 2.11%) |
| |||||||||||
7.47% | 07/26/831 | 185,000 | 175,961 | |||||||||
| SLM Student Loan Trust, |
| |||||||||||
| Series 2008-7, Class B |
| |||||||||||
| (SOFR90A plus 2.11%) |
| |||||||||||
7.47% | 07/26/831 | 185,000 | 173,626 | |||||||||
| Issues | Maturity Date | Principal Amount | Value | |||||||||
| ASSET-BACKED SECURITIES (continued) | ||||||||||||
| SLM Student Loan Trust, |
| |||||||||||
| Series 2012-7, Class A3 |
| |||||||||||
| (SOFR30A plus 0.76%) |
| |||||||||||
6.08% | 05/26/261 | $ | 397,462 | $ | 385,254 | |||||||
| Stack Infrastructure Issuer LLC, |
| |||||||||||
| Series 2024-1A, Class A2 |
| |||||||||||
5.90% | 03/25/492 | 2,100,000 | 2,111,356 | |||||||||
| Structured Receivables Finance LLC, |
| |||||||||||
| Series 2010-A, Class B |
| |||||||||||
7.61% | 01/16/462 | 388,714 | 388,714 | |||||||||
| Student Loan Consolidation Center Student Loan Trust I, |
| |||||||||||
| Series 2002-2, Class B2 |
| |||||||||||
| (28 Day Auction Rate plus 0.00%) |
| |||||||||||
1.61% | 07/01/421,2 | 450,000 | 415,866 | |||||||||
| Taco Bell Funding LLC, |
| |||||||||||
| Series 2016-1A, Class A23 |
| |||||||||||
4.97% | 05/25/462 | 3,093,750 | 3,050,710 | |||||||||
| Vantage Data Centers Issuer LLC, |
| |||||||||||
| Series 2020-1A, Class A2 |
| |||||||||||
1.65% | 09/15/452 | 3,500,000 | 3,280,602 | |||||||||
| Velocity Commercial Capital Loan Trust, |
| |||||||||||
| Series 2019-1, Class A |
| |||||||||||
3.76% | 03/25/492,6 | 1,459,771 | 1,358,140 | |||||||||
| Voya CLO Ltd., |
| |||||||||||
| Series 2014-4A, Class A2RA |
| |||||||||||
| (Cayman Islands) |
| |||||||||||
| (CME Term SOFR 3-Month plus 1.86%) |
| |||||||||||
7.18% | 07/14/311,2,3 | 1,650,000 | 1,650,841 | |||||||||
|
| |||||||||||
| Total Asset-Backed Securities |
| |||||||||||
| (Cost $58,104,679) |
| 57,933,374 | ||||||||||
|
| |||||||||||
| BANK LOANS — 0.95%* |
| |||||||||||
| Automotive — 0.00% |
| |||||||||||
| First Brands Group LLC, |
| |||||||||||
| Term Loan B, 1st Lien |
| |||||||||||
| (SOFR plus 5.26%) |
| |||||||||||
10.57% | 03/30/271 | 37,129 | 37,231 | |||||||||
|
| |||||||||||
| Communications —0.11% |
| |||||||||||
| CCI Buyer, Inc., |
| |||||||||||
| Term Loan B, 1st Lien |
| |||||||||||
| (SOFR plus 4.00%) |
| |||||||||||
9.30% | 12/17/271 | 60,296 | 60,021 | |||||||||
| Charter Communications Operating LLC, |
| |||||||||||
| Term Loan B2, 1st Lien |
| |||||||||||
| (SOFR plus 1.75%) |
| |||||||||||
7.08% | 02/01/271 | 95,739 | 95,825 | |||||||||
| CSC Holdings LLC, |
| |||||||||||
| Term Loan B5, 1st Lien |
| |||||||||||
| (SOFR plus 2.50%) |
| |||||||||||
7.94% | 04/15/271 | 96,725 | 87,709 | |||||||||
| Frontier Communications Holdings LLC, |
| |||||||||||
| Term Loan B, 1st Lien |
| |||||||||||
| (SOFR plus 3.86%) |
| |||||||||||
8.62% | 10/08/271 | 46,167 | 46,123 | |||||||||
See accompanying Notes to Financial Statements.
| Annual Report March 2024 / 94 |
Table of Contents
Intermediate Bond Fund
Schedule of Portfolio Investments
March 31, 2024
| Issues | Maturity Date | Principal Amount | Value | |||||||||
| BANK LOANS (continued) |
| |||||||||||
Communications (continued) |
| |||||||||||
| New Insight Holdings, Inc., |
| |||||||||||
| Term Loan B, 1st Lien |
| |||||||||||
| (SOFR plus 5.76%) |
| |||||||||||
11.07% | 12/20/241 | $ | 58,230 | $ | 35,138 | |||||||
| SBA Senior Finance II LLC, |
| |||||||||||
| Term Loan B, 1st Lien |
| |||||||||||
| (SOFR plus 2.00%) |
| |||||||||||
7.34% | 01/25/311 | 184,618 | 185,166 | |||||||||
| Virgin Media Bristol LLC, |
| |||||||||||
| Term Loan Y, 1st Lien |
| |||||||||||
| (SOFR plus 3.35%) |
| |||||||||||
8.79% | 03/31/311 | 150,000 | 147,979 | |||||||||
| Zayo Group Holdings, Inc., |
| |||||||||||
| Term Loan B, 1st Lien |
| |||||||||||
| (SOFR plus 3.11%) |
| |||||||||||
8.44% | 03/09/271 | 400,395 | 352,461 | |||||||||
| (SOFR plus 4.33%) |
| |||||||||||
9.66% | 03/09/271 | 62,674 | 56,376 | |||||||||
|
| |||||||||||
| 1,066,798 | ||||||||||||
|
| |||||||||||
| Consumer Discretionary — 0.04% |
| |||||||||||
| City Brewing Co. LLC, |
| |||||||||||
| Term Loan B, 1st Lien |
| |||||||||||
| (SOFR plus 3.76%) |
| |||||||||||
8.32% | 04/05/281 | 105,915 | 83,172 | |||||||||
| Naked Juice, LLC, |
| |||||||||||
| Term Loan, 1st Lien (Luxembourg) |
| |||||||||||
| (SOFR plus 3.35%) |
| |||||||||||
8.66% | 01/24/291,3 | 187,041 | 175,414 | |||||||||
| Term Loan, 2nd Lien |
| |||||||||||
| (SOFR plus 6.10%) |
| |||||||||||
11.00% | 01/24/301 | 57,817 | 47,392 | |||||||||
| Osmosis Buyer Ltd., |
| |||||||||||
| Term Loan B, 1st Lien |
| |||||||||||
| (SOFR plus 3.75%) |
| |||||||||||
9.07% | 07/31/281 | 71,459 | 71,668 | |||||||||
|
| |||||||||||
| 377,646 | ||||||||||||
|
| |||||||||||
| Entertainment — 0.07% |
| |||||||||||
| Elanco Animal Health, Inc., |
| |||||||||||
| Term Loan B, 1st Lien |
| |||||||||||
| (SOFR plus 1.85%) |
| |||||||||||
7.18% | 08/01/271 | 612,925 | 611,442 | |||||||||
| William Morris Endeavor Entertainment LLC, |
| |||||||||||
| Term Loan B1, 1st Lien |
| |||||||||||
| (SOFR plus 2.86%) |
| |||||||||||
8.19% | 05/16/251 | 61,042 | 61,075 | |||||||||
|
| |||||||||||
| 672,517 | ||||||||||||
|
| |||||||||||
| Finance — 0.07% | ||||||||||||
| Avolon TLB Borrower 1 U.S. LLC, |
| |||||||||||
| Term Loan B6, 1st Lien |
| |||||||||||
| (SOFR plus 2.00%) |
| |||||||||||
7.33% | 06/22/281 | 173,578 | 173,823 | |||||||||
| Issues | Maturity Date | Principal Amount | Value | |||||||||
| BANK LOANS (continued) |
| |||||||||||
Finance (continued) |
| |||||||||||
| Deerfield Dakota Holding LLC, |
| |||||||||||
| Term Loan B, 1st Lien |
| |||||||||||
| (SOFR plus 3.75%) |
| |||||||||||
9.06% | 04/09/271 | $ | 128,523 | $ | 128,050 | |||||||
| Jane Street Group LLC, |
| |||||||||||
| Term Loan B, 1st Lien |
| |||||||||||
| (SOFR plus 2.61%) |
| |||||||||||
7.94% | 01/26/281 | 105,013 | 105,183 | |||||||||
| Setanta Aircraft Leasing DAC, |
| |||||||||||
| Term Loan B, 1st Lien |
| |||||||||||
| (SOFR plus 2.26%) |
| |||||||||||
7.56% | 11/06/281 | 275,000 | 275,878 | |||||||||
|
| |||||||||||
| 682,934 | ||||||||||||
|
| |||||||||||
| Food — 0.01% |
| |||||||||||
| 8th Avenue Food & Provisions, Inc., |
| |||||||||||
| Term Loan B, 1st Lien |
| |||||||||||
| (SOFR plus 3.86%) |
| |||||||||||
9.19% | 10/01/251 | 14,597 | 14,376 | |||||||||
| Froneri U.S., Inc., |
| |||||||||||
| Term Loan B, 1st Lien |
| |||||||||||
| (SOFR plus 2.35%) |
| |||||||||||
7.68% | 01/29/271 | 41,279 | 41,348 | |||||||||
| H-Food Holdings LLC, |
| |||||||||||
| Term Loan, 1st Lien |
| |||||||||||
| (SOFR plus 3.95%) |
| |||||||||||
9.29% | 05/23/251 | 38,693 | 28,318 | |||||||||
|
| |||||||||||
| 84,042 | ||||||||||||
|
| |||||||||||
| Gaming — 0.00% |
| |||||||||||
| Penn National Gaming, Inc., |
| |||||||||||
| Term Loan B, 1st Lien |
| |||||||||||
| (SOFR plus 2.85%) |
| |||||||||||
7.66% | 05/03/291 | 46,649 | 46,751 | |||||||||
|
| |||||||||||
| Health Care — 0.14% |
| |||||||||||
| Bausch + Lomb Corp., |
| |||||||||||
| Term Loan B, 1st Lien (Canada) |
| |||||||||||
| (SOFR plus 3.35%) |
| |||||||||||
8.68% | 05/10/271,3 | 57,477 | 56,945 | |||||||||
| Carestream Dental Equipment, Inc., |
| |||||||||||
| Term Loan, 1st Lien |
| |||||||||||
| (LIBOR plus 3.25%) |
| |||||||||||
8.56% | 09/01/241 | 104,376 | 91,155 | |||||||||
| Carestream Dental, Inc., |
| |||||||||||
| Term Loan, 1st Lien |
| |||||||||||
| (LIBOR plus 4.50%) |
| |||||||||||
9.94% | 09/01/241 | 31,664 | 27,640 | |||||||||
| Genesee & Wyoming, Inc., |
| |||||||||||
| Term Loan, 1st Lien |
| |||||||||||
| (SOFR plus 2.10%) |
| |||||||||||
7.40% | 12/30/261 | 26,166 | 26,212 | |||||||||
| Grifols Worldwide Operations USA, Inc., |
| |||||||||||
| Term Loan B, 1st Lien |
| |||||||||||
| (SOFR plus 2.15%) |
| |||||||||||
7.46% | 11/15/271 | 348,182 | 337,888 | |||||||||
See accompanying Notes to Financial Statements.
| 95 / Annual Report March 2024 |
Table of Contents
Intermediate Bond Fund
Schedule of Portfolio Investments
March 31, 2024
| Issues | Maturity Date | Principal Amount | Value | |||||||||
| BANK LOANS (continued) |
| |||||||||||
Health Care (continued) |
| |||||||||||
| Jazz Financing Lux SARL, |
| |||||||||||
| Term Loan B, 1st Lien (Luxembourg) |
| |||||||||||
| (SOFR plus 3.11%) |
| |||||||||||
8.44% | 05/05/281,3 | $ | 322,629 | $ | 324,645 | |||||||
| Medline Borrower LP, |
| |||||||||||
| Term Loan B, 1st Lien |
| |||||||||||
| (SOFR plus 2.86%) |
| |||||||||||
8.20% | 10/23/281 | 89,266 | 89,592 | |||||||||
| Organon & Co., |
| |||||||||||
| Term Loan B, 1st Lien |
| |||||||||||
| (SOFR plus 3.11%) |
| |||||||||||
7.75% | 06/02/281 | 200,000 | 200,959 | |||||||||
| Peraton Corp., |
| |||||||||||
| Term Loan B, 1st Lien |
| |||||||||||
| (SOFR plus 3.85%) |
| |||||||||||
9.18% | 02/01/281 | 182,271 | 182,457 | |||||||||
| Star Parent, Inc., |
| |||||||||||
| Term Loan B, 1st Lien |
| |||||||||||
| (SOFR plus 4.00%) |
| |||||||||||
9.31% | 09/27/301 | 47,650 | 47,415 | |||||||||
|
| |||||||||||
| 1,384,908 | ||||||||||||
|
| |||||||||||
Industrials — 0.11% |
| |||||||||||
| Artera Services LLC, |
| |||||||||||
| Term Loan, 1st Lien |
| |||||||||||
| (SOFR plus 4.50%) |
| |||||||||||
9.81% | 02/15/311 | 74,906 | 75,281 | |||||||||
| ASP Blade Holdings, Inc., |
| |||||||||||
| Term Loan B, 1st Lien |
| |||||||||||
| (SOFR plus 4.26%) |
| |||||||||||
9.56% | 10/16/281 | 49,406 | 44,811 | |||||||||
| Berry Global, Inc., |
| |||||||||||
| Term Loan AA, 1st Lien |
| |||||||||||
| (SOFR plus 1.86%) |
| |||||||||||
7.18% | 07/01/291 | 671,118 | 671,602 | |||||||||
| Coherent Corp., |
| |||||||||||
| Term Loan B, 1st Lien |
| |||||||||||
| (SOFR plus 2.86%) |
| |||||||||||
7.38% -7.67% | 07/02/291 | 31,030 | 31,131 | |||||||||
| Filtration Group Corp., |
| |||||||||||
| Term Loan, 1st Lien |
| |||||||||||
| (SOFR plus 4.36%) |
| |||||||||||
9.69% | 10/21/281 | 28,835 | 28,959 | |||||||||
| Patriot Container Corp., |
| |||||||||||
| Term Loan B, 1st Lien |
| |||||||||||
| (SOFR plus 3.85%) |
| |||||||||||
9.18% | 03/20/251 | 29,698 | 28,870 | |||||||||
| Transdigm, Inc., |
| |||||||||||
| Term Loan I, 1st Lien |
| |||||||||||
| (SOFR plus 2.75%) |
| |||||||||||
8.08% | 08/24/281 | 161,568 | 162,300 | |||||||||
|
| |||||||||||
| 1,042,954 | ||||||||||||
|
| |||||||||||
| Issues | Maturity Date | Principal Amount | Value | |||||||||
| BANK LOANS (continued) |
| |||||||||||
Information Technology — 0.23% |
| |||||||||||
| Arches Buyer, Inc., |
| |||||||||||
| Term Loan B, 1st Lien |
| |||||||||||
| (SOFR plus 3.35%) |
| |||||||||||
8.68% | 12/06/271 | $ | 51,675 | $ | 50,171 | |||||||
| Athenahealth Group, Inc., |
| |||||||||||
| Term Loan B, 1st Lien |
| |||||||||||
| (SOFR plus 3.25%) |
| |||||||||||
8.25% | 02/15/291 | 33,920 | 33,684 | |||||||||
| Buzz Merger Sub Ltd., |
| |||||||||||
| Term Loan B, 1st Lien |
| |||||||||||
| (SOFR plus 2.85%) |
| |||||||||||
8.18% | 01/29/271 | 54,323 | 54,510 | |||||||||
| Central Parent LLC, |
| |||||||||||
| Term Loan B, 1st Lien |
| |||||||||||
| (SOFR plus 4.00%) |
| |||||||||||
9.31% | 07/06/291 | 78,323 | 78,645 | |||||||||
| EagleView Technology Co., |
| |||||||||||
| Term Loan B, 1st Lien |
| |||||||||||
| (SOFR plus 3.76%) |
| |||||||||||
9.06% | 08/14/251 | 162,663 | 158,379 | |||||||||
| Gainwell Acquisition Corp., |
| |||||||||||
| Term Loan B, 1st Lien |
| |||||||||||
| (SOFR plus 4.10%) |
| |||||||||||
8.72% - 8.99% | 10/01/271 | 195,949 | 187,793 | |||||||||
| Magnite, Inc., |
| |||||||||||
| Term Loan B, 1st Lien |
| |||||||||||
| (SOFR plus 4.50%) |
| |||||||||||
9.60% - 9.82% | 02/06/311 | 30,154 | 30,242 | |||||||||
| MH Sub I LLC, |
| |||||||||||
| Term Loan B3, 1st Lien |
| |||||||||||
| (SOFR plus 4.25%) |
| |||||||||||
9.58% | 05/03/281 | 36,920 | 36,744 | |||||||||
| NortonLifeLock, Inc., |
| |||||||||||
| Term Loan A2, 1st Lien |
| |||||||||||
| (SOFR plus 1.85%) |
| |||||||||||
7.18% | 09/10/271 | 150,605 | 150,401 | |||||||||
| Open Text Corp., |
| |||||||||||
| Term Loan B, 1st Lien (Canada) |
| |||||||||||
| (SOFR plus 1.85%) |
| |||||||||||
7.18% | 05/30/251,3 | 72,893 | 73,053 | |||||||||
| (SOFR plus 2.85%) |
| |||||||||||
8.18% | 01/31/301,3 | 153,855 | 154,293 | |||||||||
| Oracle Corp., |
| |||||||||||
| Term Loan A1, 1st Lien |
| |||||||||||
| (SOFR plus 0.60%) |
| |||||||||||
6.46% | 08/16/271 | 556,429 | 557,124 | |||||||||
| Proofpoint, Inc., |
| |||||||||||
| Term Loan B, 1st Lien (Canada) |
| |||||||||||
| (SOFR plus 3.36%) |
| |||||||||||
8.69% | 08/31/281,3 | 22,074 | 22,110 | |||||||||
| Renaissance Holding Corp., |
| |||||||||||
| Term Loan, 1st Lien |
| |||||||||||
| (SOFR plus 4.25%) |
| |||||||||||
9.58% | 04/05/301 | 65,579 | 65,784 | |||||||||
See accompanying Notes to Financial Statements.
| Annual Report March 2024 / 96 |
Table of Contents
Intermediate Bond Fund
Schedule of Portfolio Investments
March 31, 2024
| Issues | Maturity Date | Principal Amount | Value | |||||||||
| BANK LOANS (continued) |
| |||||||||||
Information Technology (continued) |
| |||||||||||
| Spin Holdco, Inc., |
| |||||||||||
| Term Loan B, 1st Lien |
| |||||||||||
| (SOFR plus 4.26%) |
| |||||||||||
9.59% | 03/03/281 | $ | 225,906 | $ | 209,793 | |||||||
| SS&C Technologies Holdings, Inc., |
| |||||||||||
| Term Loan B5, 1st Lien |
| |||||||||||
| (SOFR plus 1.86%) |
| |||||||||||
7.19% | 04/16/251 | 362,941 | 363,391 | |||||||||
|
| |||||||||||
| 2,226,117 | ||||||||||||
|
| |||||||||||
Insurance — 0.04% |
| |||||||||||
| Acrisure LLC, |
| |||||||||||
| Term Loan B1, 1st Lien |
| |||||||||||
| (SOFR plus 3.50%) |
| |||||||||||
8.94% | 02/15/271 | 244,275 | 244,428 | |||||||||
| Asurion LLC, |
| |||||||||||
| Term Loan B8, 1st Lien |
| |||||||||||
| (SOFR plus 3.36%) |
| |||||||||||
8.69% | 12/23/261 | 159,629 | 156,778 | |||||||||
|
| |||||||||||
| 401,206 | ||||||||||||
|
| |||||||||||
Materials — 0.02% |
| |||||||||||
| Chemours Co. (The), |
| |||||||||||
| Term Loan B3, 1st Lien |
| |||||||||||
| (SOFR plus 3.50%) |
| |||||||||||
8.83% | 08/18/281 | 187,204 | 186,923 | |||||||||
|
| |||||||||||
Retail — 0.02% |
| |||||||||||
| 1011778 BC Unlimited Liability Co., |
| |||||||||||
| Term Loan B5, 1st Lien (Canada) |
| |||||||||||
| (SOFR plus 2.25%) |
| |||||||||||
7.58% | 09/20/301,3 | 95,312 | 95,372 | |||||||||
| KFC Holding Co., |
| |||||||||||
| Term Loan B, 1st Lien |
| |||||||||||
| (SOFR plus 1.86%) |
| |||||||||||
7.19% | 03/15/281 | 80,914 | 80,968 | |||||||||
|
| |||||||||||
| 176,340 | ||||||||||||
|
| |||||||||||
Services — 0.09% |
| |||||||||||
| Amentum Government Services Holdings LLC, |
| |||||||||||
| Term Loan B, 1st Lien |
| |||||||||||
| (SOFR plus 4.11%) |
| |||||||||||
8.63% | 01/29/271 | 281,810 | 282,867 | |||||||||
| Boost Newco Borrower LLC, |
| |||||||||||
| Term Loan B, 1st Lien |
| |||||||||||
| (SOFR plus 3.00%) |
| |||||||||||
8.31% | 01/31/311 | 145,743 | 146,442 | |||||||||
| Clean Harbors, Inc., |
| |||||||||||
| Term Loan B, 1st Lien |
| |||||||||||
| (SOFR plus 1.86%) |
| |||||||||||
7.19% | 10/08/281 | 62,790 | 62,987 | |||||||||
| Element Materials Technology Group U.S. Holdings, Inc., |
| |||||||||||
| Delayed-Draw Term Loan, 1st Lien |
| |||||||||||
| (SOFR plus 4.35%) |
| |||||||||||
9.66% | 07/06/291 | 19,442 | 19,482 | |||||||||
| Issues | Maturity Date | Principal Amount | Value | |||||||||
| BANK LOANS (continued) |
| |||||||||||
Services (continued) |
| |||||||||||
| Term Loan B, 1st Lien |
| |||||||||||
| (SOFR plus 4.35%) |
| |||||||||||
9.66% | 07/06/291 | $ | 42,123 | $ | 42,211 | |||||||
| Pre-Paid Legal Services, Inc., |
| |||||||||||
| Term Loan, 1st Lien |
| |||||||||||
| (SOFR plus 3.86%) |
| |||||||||||
9.18% | 12/15/281 | 62,048 | 61,832 | |||||||||
| Trans Union LLC, |
| |||||||||||
| Term Loan B, 1st Lien |
| |||||||||||
| (SOFR plus 2.00%) |
| |||||||||||
7.33% | 12/01/281 | 65,562 | 65,607 | |||||||||
| TruGreen LP, |
| |||||||||||
| Term Loan B, 1st Lien |
| |||||||||||
| (SOFR plus 4.10%) |
| |||||||||||
9.43% | 11/02/271 | 184,763 | 180,202 | |||||||||
|
| |||||||||||
| 861,630 | ||||||||||||
|
| |||||||||||
| Total Bank Loans |
| |||||||||||
| (Cost $9,228,896) |
| 9,247,997 | ||||||||||
|
| |||||||||||
CORPORATES — 20.15%* |
| |||||||||||
Banking — 4.07% |
| |||||||||||
| Bank of America Corp. |
| |||||||||||
2.69% | 04/22/326 | 990,000 | 837,368 | |||||||||
3.42% | 12/20/286 | 860,000 | 807,503 | |||||||||
| Bank of America Corp. |
| |||||||||||
| (MTN) |
| |||||||||||
1.92% | 10/24/316 | 1,135,000 | 927,024 | |||||||||
2.09% | 06/14/296 | 3,895,000 | 3,443,914 | |||||||||
2.55% | 02/04/286 | 160,000 | 148,749 | |||||||||
2.97% | 02/04/336 | 690,000 | 587,003 | |||||||||
3.09% | 10/01/256 | 93,000 | 91,783 | |||||||||
3.82% | 01/20/286 | 605,000 | 582,865 | |||||||||
| Bank of America Corp., |
| |||||||||||
| Series N |
| |||||||||||
1.66% | 03/11/276 | 3,725,000 | 3,472,574 | |||||||||
| HSBC Holdings PLC |
| |||||||||||
| (United Kingdom) |
| |||||||||||
1.59% | 05/24/273,6 | 1,730,000 | 1,592,284 | |||||||||
2.01% | 09/22/283,6 | 725,000 | 648,429 | |||||||||
2.21% | 08/17/293,6 | 60,000 | 52,617 | |||||||||
4.76% | 06/09/283,6 | 1,240,000 | 1,216,287 | |||||||||
| JPMorgan Chase & Co. |
| |||||||||||
0.97% | 06/23/256 | 755,000 | 746,357 | |||||||||
1.04% | 02/04/276 | 1,465,000 | 1,355,714 | |||||||||
1.56% | 12/10/256 | 2,280,000 | 2,217,054 | |||||||||
1.58% | 04/22/276 | 1,035,000 | 960,010 | |||||||||
1.95% | 02/04/326 | 615,000 | 501,291 | |||||||||
2.07% | 06/01/296 | 30,000 | 26,602 | |||||||||
2.58% | 04/22/326 | 630,000 | 532,463 | |||||||||
4.01% | 04/23/296 | 3,055,000 | 2,929,122 | |||||||||
| Lloyds Banking Group PLC |
| |||||||||||
| (United Kingdom) |
| |||||||||||
3.57% | 11/07/283,6 | 475,000 | 445,641 | |||||||||
4.72% | 08/11/263,6 | 1,036,000 | 1,023,595 | |||||||||
See accompanying Notes to Financial Statements.
| 97 / Annual Report March 2024 |
Table of Contents
Intermediate Bond Fund
Schedule of Portfolio Investments
March 31, 2024
| Issues | Maturity Date | Principal Amount | Value | |||||||||
| CORPORATES (continued) |
| |||||||||||
Banking (continued) |
| |||||||||||
| PNC Financial Services Group, Inc. (The) |
| |||||||||||
5.07% | 01/24/346 | $ | 105,000 | $ | 101,736 | |||||||
5.68% | 01/22/356 | 320,000 | 323,316 | |||||||||
6.88% | 10/20/346 | 2,010,000 | 2,202,558 | |||||||||
| Santander UK Group Holdings PLC |
| |||||||||||
| (United Kingdom) |
| |||||||||||
1.67% | 06/14/273,6 | 435,000 | 398,214 | |||||||||
2.47% | 01/11/283,6 | 1,245,000 | 1,144,213 | |||||||||
| U.S. Bancorp |
| |||||||||||
4.84% | 02/01/346 | 1,845,000 | 1,752,887 | |||||||||
5.68% | 01/23/356 | 485,000 | 490,137 | |||||||||
5.84% | 06/12/346 | 495,000 | 505,062 | |||||||||
| Wells Fargo & Co. |
| |||||||||||
5.39% | 04/24/346 | 335,000 | 333,036 | |||||||||
| Wells Fargo & Co. |
| |||||||||||
| (MTN) |
| |||||||||||
2.39% | 06/02/286 | 4,555,000 | 4,170,442 | |||||||||
2.57% | 02/11/316 | 495,000 | 426,786 | |||||||||
3.35% | 03/02/336 | 1,875,000 | 1,626,460 | |||||||||
5.57% | 07/25/296 | 895,000 | 905,870 | |||||||||
|
| |||||||||||
| 39,526,966 | ||||||||||||
|
| |||||||||||
| Communications —1.45% |
| |||||||||||
| Cable One, Inc. |
| |||||||||||
4.00% | 11/15/302 | 480,000 | 375,600 | |||||||||
| Charter Communications Operating LLC/Charter |
| |||||||||||
| Communications Operating Capital |
| |||||||||||
2.30% | 02/01/32 | 2,325,000 | 1,796,105 | |||||||||
2.80% | 04/01/31 | 1,825,000 | 1,495,466 | |||||||||
6.65% | 02/01/34 | 700,000 | 717,793 | |||||||||
| CSC Holdings LLC |
| |||||||||||
4.50% | 11/15/312 | 500,000 | 354,359 | |||||||||
5.38% | 02/01/282 | 275,000 | 236,770 | |||||||||
6.50% | 02/01/292 | 880,000 | 746,377 | |||||||||
7.50% | 04/01/282 | 90,000 | 60,741 | |||||||||
11.75% | 01/31/292 | 560,000 | 560,700 | |||||||||
| Frontier Communications Holdings LLC |
| |||||||||||
8.63% | 03/15/312 | 700,000 | 715,394 | |||||||||
| Global Switch Finance BV |
| |||||||||||
| (EMTN) |
| |||||||||||
| (Netherlands) |
| |||||||||||
1.38% | 10/07/303 | 925,000 | 925,923 | |||||||||
| Northwest Fiber LLC/Northwest Fiber Finance Sub, Inc. |
| |||||||||||
6.00% | 02/15/282 | 218,000 | 224,540 | |||||||||
| SES GLOBALAmericas Holdings, Inc. |
| |||||||||||
5.30% | 03/25/442 | 750,000 | 574,388 | |||||||||
| Sprint Spectrum Co. LLC/Sprint Spectrum Co. II LLC/Sprint |
| |||||||||||
| Spectrum Co. III LLC |
| |||||||||||
4.74% | 03/20/252 | 45,500 | 45,257 | |||||||||
5.15% | 03/20/282 | 1,428,000 | 1,425,025 | |||||||||
| TDC Net A/S, |
| |||||||||||
| (EMTN) |
| |||||||||||
| (Germany) |
| |||||||||||
6.50% | 06/01/313 | 200,000 | 233,287 | |||||||||
| T-Mobile USA, Inc. |
| |||||||||||
2.25% | 02/15/26 | 700,000 | 662,542 | |||||||||
| Issues | Maturity Date | Principal Amount | Value | |||||||||
| CORPORATES (continued) |
| |||||||||||
Communications (continued) |
| |||||||||||
3.75% | 04/15/27 | $ | 2,275,000 | $ | 2,191,588 | |||||||
| VZ Secured Financing BV |
| |||||||||||
| (Netherlands) |
| |||||||||||
5.00% | 01/15/322,3 | 300,000 | 257,806 | |||||||||
| VZ Secured Financing BV, |
| |||||||||||
| Series REGS |
| |||||||||||
| (Netherlands) |
| |||||||||||
3.50% | 01/15/323 | 500,000 | 474,782 | |||||||||
|
| |||||||||||
| 14,074,443 | ||||||||||||
|
| |||||||||||
| Consumer Discretionary — 1.11% |
| |||||||||||
| Bacardi Ltd. |
| |||||||||||
| (Bermuda) |
| |||||||||||
4.45% | 05/15/252,3 | 1,045,000 | 1,030,818 | |||||||||
| BAT Capital Corp. |
| |||||||||||
2.73% | 03/25/31 | 555,000 | 467,516 | |||||||||
3.46% | 09/06/29 | 1,570,000 | 1,434,179 | |||||||||
3.56% | 08/15/27 | 145,000 | 137,333 | |||||||||
| BAT International Finance PLC |
| |||||||||||
| (United Kingdom) |
| |||||||||||
1.67% | 03/25/263 | 330,000 | 307,354 | |||||||||
| Imperial Brands Finance PLC |
| |||||||||||
| (United Kingdom) |
| |||||||||||
3.13% | 07/26/242,3 | 1,000,000 | 991,452 | |||||||||
6.13% | 07/27/272,3 | 385,000 | 393,022 | |||||||||
| JDE Peet’s NV |
| |||||||||||
| (Netherlands) |
| |||||||||||
0.80% | 09/24/242,3 | 1,650,000 | 1,609,333 | |||||||||
| Philip Morris International, Inc. |
| |||||||||||
2.00% | 05/09/36 | 250,000 | 221,004 | |||||||||
| Spectrum Brands, Inc. |
| |||||||||||
3.88% | 03/15/312 | 310,000 | 299,450 | |||||||||
| WarnerMedia Holdings, Inc. |
| |||||||||||
4.28% | 03/15/32 | 4,320,000 | 3,863,399 | |||||||||
|
| |||||||||||
| 10,754,860 | ||||||||||||
|
| |||||||||||
| Diversified REITs — 0.93% |
| |||||||||||
| American Tower Corp. |
| |||||||||||
1.00% | 01/15/32 | 510,000 | 451,005 | |||||||||
2.30% | 09/15/31 | 745,000 | 608,481 | |||||||||
5.25% | 07/15/28 | 400,000 | 400,398 | |||||||||
| CapitaLand Ascendas REIT |
| |||||||||||
| (EMTN) |
| |||||||||||
| (Slovenia) |
| |||||||||||
0.75% | 06/23/283 | 375,000 | 350,979 | |||||||||
| Crown Castle, Inc. |
| |||||||||||
2.50% | 07/15/31 | 1,333,000 | 1,104,714 | |||||||||
| Digital Dutch Finco BV |
| |||||||||||
| (Netherlands) |
| |||||||||||
1.25% | 02/01/313 | 1,185,000 | 1,064,327 | |||||||||
| Digital Intrepid Holding BV |
| |||||||||||
| (Netherlands) |
| |||||||||||
0.63% | 07/15/313 | 245,000 | 207,486 | |||||||||
| GLP Capital LP/GLP Financing II, Inc. |
| |||||||||||
4.00% | 01/15/30 | 180,000 | 165,004 | |||||||||
4.00% | 01/15/31 | 505,000 | 451,713 | |||||||||
See accompanying Notes to Financial Statements.
| Annual Report March 2024 / 98 |
Table of Contents
Intermediate Bond Fund
Schedule of Portfolio Investments
March 31, 2024
| Issues | Maturity Date | Principal Amount | Value | |||||||||
| CORPORATES (continued) |
| |||||||||||
Diversified REITs (continued) |
| |||||||||||
5.38% | 04/15/26 | $ | 153,000 | $ | 151,769 | |||||||
5.75% | 06/01/28 | 1,465,000 | 1,467,240 | |||||||||
| VICI Properties LP |
| |||||||||||
4.95% | 02/15/30 | 165,000 | 159,565 | |||||||||
| VICI Properties LP/VICI Note Co., Inc. |
| |||||||||||
3.88% | 02/15/292 | 940,000 | 865,936 | |||||||||
4.13% | 08/15/302 | 20,000 | 18,196 | |||||||||
4.50% | 01/15/282 | 605,000 | 581,159 | |||||||||
5.75% | 02/01/272 | 540,000 | 539,890 | |||||||||
| Vonovia SE |
| |||||||||||
| (Georgia) |
| |||||||||||
1.00% | 06/16/333 | 300,000 | 245,108 | |||||||||
2.25% | 04/07/303 | 100,000 | 98,096 | |||||||||
| Vonovia SE, |
| |||||||||||
| (EMTN) |
| |||||||||||
| (Georgia) |
| |||||||||||
5.00% | 11/23/303 | 100,000 | 113,642 | |||||||||
|
| |||||||||||
| 9,044,708 | ||||||||||||
|
| |||||||||||
Electric — 1.31% |
| |||||||||||
| Alliant Energy Finance LLC |
| |||||||||||
5.95% | 03/30/292 | 1,085,000 | 1,118,737 | |||||||||
| Alliant Energy Finance, LLC |
| |||||||||||
3.60% | 03/01/322 | 1,625,000 | 1,440,014 | |||||||||
| Appalachian Power Co., |
| |||||||||||
| Series H |
| |||||||||||
5.95% | 05/15/33 | 350,000 | 359,506 | |||||||||
| Appalachian Power Co., |
| |||||||||||
| Series X |
| |||||||||||
3.30% | 06/01/27 | 410,000 | 387,485 | |||||||||
| Duke Energy Corp. |
| |||||||||||
2.65% | 09/01/26 | 30,000 | 28,336 | |||||||||
| Duke Energy Florida LLC |
| |||||||||||
5.88% | 11/15/33 | 245,000 | 259,345 | |||||||||
| Eversource Energy |
| |||||||||||
4.60% | 07/01/27 | 1,295,000 | 1,274,767 | |||||||||
| FirstEnergy Pennsylvania Electric Co. |
| |||||||||||
4.00% | 04/15/252 | 770,000 | 751,335 | |||||||||
4.30% | 01/15/292 | 550,000 | 531,896 | |||||||||
5.15% | 03/30/262 | 500,000 | 496,061 | |||||||||
| FirstEnergy Transmission LLC |
| |||||||||||
2.87% | 09/15/282 | 853,000 | 778,311 | |||||||||
| Jersey Central Power & Light Co. |
| |||||||||||
4.70% | 04/01/242 | 995,000 | 995,000 | |||||||||
| Public Service Co. of New Mexico |
| |||||||||||
3.85% | 08/01/25 | 1,405,000 | 1,373,542 | |||||||||
| Southwestern Electric Power Co. |
| |||||||||||
5.30% | 04/01/33 | 1,030,000 | 1,017,989 | |||||||||
| TenneT Holding BV |
| |||||||||||
| (EMTN) |
| |||||||||||
| (Netherlands) |
| |||||||||||
4.50% | 10/28/343 | 1,565,000 | 1,858,476 | |||||||||
|
| |||||||||||
| 12,670,800 | ||||||||||||
|
| |||||||||||
| Issues | Maturity Date | Principal Amount | Value | |||||||||
| CORPORATES (continued) |
| |||||||||||
Energy — 0.78% |
| |||||||||||
| Boston Gas Co. |
| |||||||||||
3.76% | 03/16/322 | $ | 2,400,000 | $ | 2,116,650 | |||||||
| East Ohio Gas Co. (The) |
| |||||||||||
2.00% | 06/15/302 | 1,020,000 | 840,403 | |||||||||
| Energy Transfer LP |
| |||||||||||
4.95% | 05/15/28 | 750,000 | 744,125 | |||||||||
| Energy Transfer Operating LP |
| |||||||||||
5.25% | 04/15/29 | 1,145,000 | 1,148,246 | |||||||||
| National Gas Transmission PLC, |
| |||||||||||
| (EMTN) |
| |||||||||||
| (United Kingdom) |
| |||||||||||
4.25% | 04/05/303 | 455,000 | 506,001 | |||||||||
| Petroleos Mexicanos |
| |||||||||||
| (Mexico) |
| |||||||||||
6.35% | 02/12/483 | 125,000 | 79,858 | |||||||||
| Southern Co. Gas Capital Corp. |
| |||||||||||
5.75% | 09/15/33 | 560,000 | 581,258 | |||||||||
| TransCanada PipeLines Ltd. |
| |||||||||||
| (Canada) |
| |||||||||||
2.50% | 10/12/313 | 445,000 | 370,340 | |||||||||
4.63% | 03/01/343 | 745,000 | 704,478 | |||||||||
| Venture Global LNG, Inc. |
| |||||||||||
9.50% | 02/01/292 | 484,000 | 522,128 | |||||||||
|
| |||||||||||
| 7,613,487 | ||||||||||||
|
| |||||||||||
Finance — 2.75% |
| |||||||||||
| AerCap Ireland Capital DAC/AerCap Global Aviation Trust |
| |||||||||||
| (Ireland) |
| |||||||||||
2.45% | 10/29/263 | 2,045,000 | 1,900,535 | |||||||||
3.00% | 10/29/283 | 421,000 | 381,152 | |||||||||
| Air Lease Corp. |
| |||||||||||
3.25% | 03/01/25 | 820,000 | 800,708 | |||||||||
3.25% | 10/01/29 | 525,000 | 475,881 | |||||||||
3.63% | 12/01/27 | 355,000 | 335,274 | |||||||||
| Avolon Holdings Funding Ltd. |
| |||||||||||
| (Cayman Islands) |
| |||||||||||
2.53% | 11/18/272,3 | 1,558,000 | 1,386,487 | |||||||||
2.88% | 02/15/252,3 | 1,160,000 | 1,129,316 | |||||||||
| Citigroup, Inc. |
| |||||||||||
2.52% | 11/03/326 | 2,610,000 | 2,144,481 | |||||||||
2.67% | 01/29/316 | 115,000 | 99,776 | |||||||||
2.98% | 11/05/306 | 290,000 | 257,710 | |||||||||
3.52% | 10/27/286 | 1,505,000 | 1,419,554 | |||||||||
| Durrah MSN 35603 |
| |||||||||||
| (Cayman Islands) |
| |||||||||||
1.68% | 01/22/253 | 580,145 | 568,493 | |||||||||
| EverBank Financial Corp. |
| |||||||||||
5.75% | 07/02/25 | 1,150,000 | 1,079,975 | |||||||||
| Goldman Sachs Group, Inc. (The) |
| |||||||||||
2.65% | 10/21/326 | 14,000 | 11,652 | |||||||||
3.75% | 02/25/26 | 20,000 | 19,536 | |||||||||
3.81% | 04/23/296 | 2,480,000 | 2,354,746 | |||||||||
| (SOFR Rate plus 0.49%) |
| |||||||||||
5.84% | 10/21/241 | 840,000 | 840,565 | |||||||||
| Icahn Enterprises LP/Icahn Enterprises Finance Corp. |
| |||||||||||
4.38% | 02/01/29 | 97,000 | 82,916 | |||||||||
See accompanying Notes to Financial Statements.
| 99 / Annual Report March 2024 |
Table of Contents
Intermediate Bond Fund
Schedule of Portfolio Investments
March 31, 2024
| Issues | Maturity Date | Principal Amount | Value | |||||||||
| CORPORATES (continued) |
| |||||||||||
Finance (continued) |
| |||||||||||
5.25% | 05/15/27 | $ | 486,000 | $ | 451,980 | |||||||
9.75% | 01/15/292 | 205,000 | 213,964 | |||||||||
| Morgan Stanley |
| |||||||||||
2.19% | 04/28/266 | 860,000 | 829,959 | |||||||||
| Morgan Stanley |
| |||||||||||
| (GMTN) |
| |||||||||||
2.95% | 05/07/326 | 415,000 | 431,087 | |||||||||
| Morgan Stanley |
| |||||||||||
| (MTN) |
| |||||||||||
1.16% | 10/21/256 | 4,790,000 | 4,665,489 | |||||||||
1.79% | 02/13/326 | 2,000,000 | 1,599,310 | |||||||||
1.93% | 04/28/326 | 765,000 | 614,196 | |||||||||
| Nationwide Building Society |
| |||||||||||
| (United Kingdom) |
| |||||||||||
2.97% | 02/16/282,3,6 | 2,250,000 | 2,099,880 | |||||||||
| Sandalwood 2013 LLC |
| |||||||||||
2.90% | 07/10/25 | 479,246 | 470,052 | |||||||||
|
| |||||||||||
| 26,664,674 | ||||||||||||
|
| |||||||||||
Food — 0.67% |
| |||||||||||
| ELO SACA |
| |||||||||||
| (EMTN) |
| |||||||||||
| (France) |
| |||||||||||
6.00% | 03/22/293 | 700,000 | 767,353 | |||||||||
| JBS USA LUX SA/JBS USA Food Co./JBS Luxembourg Sarl |
| |||||||||||
| (Canada) |
| |||||||||||
6.75% | 03/15/342,3 | 2,030,000 | 2,134,962 | |||||||||
| JBS USA LUX SA/JBS USA Food Co./JBS USA Finance, Inc. |
| |||||||||||
| (Canada) |
| |||||||||||
3.00% | 02/02/293 | 1,435,000 | 1,271,144 | |||||||||
3.00% | 05/15/323 | 1,185,000 | 963,407 | |||||||||
| Pilgrim’s Pride Corp. |
| |||||||||||
3.50% | 03/01/32 | 925,000 | 785,165 | |||||||||
6.25% | 07/01/33 | 580,000 | 594,263 | |||||||||
|
| |||||||||||
| 6,516,294 | ||||||||||||
|
| |||||||||||
Health Care — 2.67% |
| |||||||||||
| 1375209 BC Ltd. |
| |||||||||||
| (Canada) |
| |||||||||||
9.00% | 01/30/282,3 | 645,000 | 632,802 | |||||||||
| AbbVie, Inc. |
| |||||||||||
3.60% | 05/14/25 | 1,152,000 | 1,131,008 | |||||||||
3.85% | 06/15/24 | 1,342,000 | 1,336,872 | |||||||||
| Aetna, Inc. |
| |||||||||||
3.50% | 11/15/24 | 1,250,000 | 1,233,516 | |||||||||
| Alcon Finance Corp. |
| |||||||||||
2.75% | 09/23/262 | 2,300,000 | 2,171,810 | |||||||||
| Bayer U.S. Finance II LLC |
| |||||||||||
4.38% | 12/15/282 | 2,914,000 | 2,744,240 | |||||||||
5.50% | 08/15/252 | 1,100,000 | 1,091,867 | |||||||||
| Bayer U.S. Finance LLC |
| |||||||||||
3.38% | 10/08/242 | 1,020,000 | 1,006,236 | |||||||||
6.50% | 11/21/332 | 520,000 | 529,228 | |||||||||
| Baylor Scott & White Holdings |
| |||||||||||
2.65% | 11/15/26 | 1,530,000 | 1,428,197 | |||||||||
| Issues | Maturity Date | Principal Amount | Value | |||||||||
| CORPORATES (continued) |
| |||||||||||
Health Care (continued) |
| |||||||||||
| Becton Dickinson & Co. |
| |||||||||||
3.36% | 06/06/24 | $ | 589,000 | $ | 586,501 | |||||||
| Catalent Pharma Solutions, Inc., |
| |||||||||||
| Series REGS |
| |||||||||||
2.38% | 03/01/28 | 365,000 | 375,119 | |||||||||
| Centene Corp. |
| |||||||||||
3.00% | 10/15/30 | 1,710,000 | 1,467,670 | |||||||||
| Fresenius Finance Ireland PLC |
| |||||||||||
| (EMTN) |
| |||||||||||
| (Ireland) |
| |||||||||||
0.88% | 10/01/313 | 550,000 | 483,434 | |||||||||
| Grifols SA, |
| |||||||||||
| Series REGS |
| |||||||||||
| (Spain) |
| |||||||||||
3.20% | 05/01/253 | 100,000 | 99,771 | |||||||||
3.88% | 10/15/283 | 825,000 | 706,236 | |||||||||
| HCA, Inc. |
| |||||||||||
5.25% | 04/15/25 | 865,000 | 861,593 | |||||||||
5.88% | 02/15/26 | 2,530,000 | 2,540,762 | |||||||||
5.88% | 02/01/29 | 1,000,000 | 1,022,194 | |||||||||
7.05% | 12/01/27 | 80,000 | 84,361 | |||||||||
| Humana, Inc. |
| |||||||||||
3.85% | 10/01/24 | 860,000 | 851,890 | |||||||||
| IQVIA, Inc. |
| |||||||||||
5.70% | 05/15/28 | 1,725,000 | 1,751,080 | |||||||||
6.25% | 02/01/29 | 120,000 | 124,662 | |||||||||
| Kedrion SpA |
| |||||||||||
| (Italy) |
| |||||||||||
6.50% | 09/01/292,3 | 695,000 | 634,134 | |||||||||
| Medtronic Global Holdings SCA |
| |||||||||||
| (Luxembourg) |
| |||||||||||
3.38% | 10/15/343 | 300,000 | 324,923 | |||||||||
| ModivCare Escrow Issuer, Inc. |
| |||||||||||
5.00% | 10/01/292 | 775,000 | 562,932 | |||||||||
| ModivCare, Inc. |
| |||||||||||
5.88% | 11/15/252 | 95,000 | 92,604 | |||||||||
|
| |||||||||||
| 25,875,642 | ||||||||||||
|
| |||||||||||
Health Care REITs — 0.42% |
| |||||||||||
| DOC DR LLC |
| |||||||||||
3.95% | 01/15/28 | 1,223,000 | 1,169,224 | |||||||||
4.30% | 03/15/27 | 590,000 | 577,801 | |||||||||
| Healthcare Reality Holdings LP |
| |||||||||||
3.50% | 08/01/26 | 225,000 | 214,732 | |||||||||
| Healthcare Realty Holdings LP |
| |||||||||||
3.63% | 01/15/28 | 911,000 | 842,540 | |||||||||
3.88% | 05/01/25 | 1,255,000 | 1,227,609 | |||||||||
|
| |||||||||||
| 4,031,906 | ||||||||||||
|
| |||||||||||
Hotel & Resort REITs — 0.07% |
| |||||||||||
| Host Hotels & Resorts LP, |
| |||||||||||
| Series H |
| |||||||||||
3.38% | 12/15/29 | 758,000 | 675,872 | |||||||||
|
| |||||||||||
Industrial REITs — 0.12% |
| |||||||||||
| LXP Industrial Trust |
| |||||||||||
6.75% | 11/15/28 | 975,000 | 1,017,926 | |||||||||
See accompanying Notes to Financial Statements.
| Annual Report March 2024 / 100 |
Table of Contents
Intermediate Bond Fund
Schedule of Portfolio Investments
March 31, 2024
| Issues | Maturity Date | Principal Amount | Value | |||||||||
| CORPORATES (continued) |
| |||||||||||
Industrial REITs (continued) |
| |||||||||||
| Rexford Industrial Realty LP |
| |||||||||||
2.15% | 09/01/31 | $ | 135,000 | $ | 108,392 | |||||||
|
| |||||||||||
| 1,126,318 | ||||||||||||
|
| |||||||||||
Industrials — 0.61% |
| |||||||||||
| Amcor Finance USA, Inc. |
| |||||||||||
3.63% | 04/28/26 | 1,950,000 | 1,881,108 | |||||||||
| Ardagh Packaging Finance PLC/Ardagh Holdings USA, Inc., |
| |||||||||||
| Series REGS |
| |||||||||||
| (Canada) |
| |||||||||||
2.13% | 08/15/263 | 230,000 | 214,302 | |||||||||
| BAE Systems Holdings, Inc. |
| |||||||||||
3.80% | 10/07/242 | 630,000 | 623,768 | |||||||||
| Berry Global, Inc. |
| |||||||||||
1.65% | 01/15/27 | 95,000 | 86,301 | |||||||||
4.88% | 07/15/262 | 1,055,000 | 1,034,674 | |||||||||
5.65% | 01/15/342 | 25,000 | 24,893 | |||||||||
| General Electric Co. |
| |||||||||||
| (MTN) |
| |||||||||||
| (CME Term SOFR 3-Month plus 0.74%) |
| |||||||||||
6.05% | 08/15/361 | 1,115,000 | 1,035,622 | |||||||||
| Honeywell International, Inc. |
| |||||||||||
3.75% | 03/01/36 | 555,000 | 605,780 | |||||||||
| Sydney Airport Finance Co. Pty Ltd. |
| |||||||||||
| (Australia) |
| |||||||||||
3.38% | 04/30/252,3 | 410,000 | 400,195 | |||||||||
|
| |||||||||||
| 5,906,643 | ||||||||||||
|
| |||||||||||
Information Technology — 0.31% |
| |||||||||||
| Apple, Inc. |
| |||||||||||
3.25% | 02/23/26 | 20,000 | 19,449 | |||||||||
| Open Text Corp. |
| |||||||||||
| (Canada) |
| |||||||||||
6.90% | 12/01/272,3 | 2,130,000 | 2,199,012 | |||||||||
| VMware LLC, |
| |||||||||||
1.00% | 08/15/24 | 815,000 | 800,866 | |||||||||
|
| |||||||||||
| 3,019,327 | ||||||||||||
|
| |||||||||||
Insurance — 0.81% |
| |||||||||||
| Athene Global Funding |
| |||||||||||
1.99% | 08/19/282 | 2,555,000 | 2,213,389 | |||||||||
3.21% | 03/08/272 | 530,000 | 495,563 | |||||||||
| Equitable Financial Life Global Funding |
| |||||||||||
1.30% | 07/12/262 | 1,190,000 | 1,080,968 | |||||||||
| Metropolitan Life Global Funding I |
| |||||||||||
3.30% | 03/21/292 | 1,200,000 | 1,112,418 | |||||||||
| Nationwide Mutual Insurance Co. |
| |||||||||||
7.88% | 12/15/242,6 | 1,212,000 | 1,212,112 | |||||||||
| Trinity Acquisition PLC |
| |||||||||||
| (United Kingdom) |
| |||||||||||
4.40% | 03/15/263 | 1,385,000 | 1,359,165 | |||||||||
| Willis North America, Inc. |
| |||||||||||
2.95% | 09/15/29 | 395,000 | 354,198 | |||||||||
|
| |||||||||||
| 7,827,813 | ||||||||||||
|
| |||||||||||
| Issues | Maturity Date | Principal Amount | Value | |||||||||
| CORPORATES (continued) |
| |||||||||||
Materials — 0.30% |
| |||||||||||
| International Flavors & Fragrances, Inc. |
| |||||||||||
1.23% | 10/01/252 | $ | 950,000 | $ | 889,896 | |||||||
1.83% | 10/15/272 | 605,000 | 536,981 | |||||||||
2.30% | 11/01/302 | 1,805,000 | 1,500,238 | |||||||||
|
| |||||||||||
| 2,927,115 | ||||||||||||
|
| |||||||||||
Office REITs — 0.22% |
| |||||||||||
| Hudson Pacific Properties LP |
| |||||||||||
3.25% | 01/15/30 | 310,000 | 239,255 | |||||||||
3.95% | 11/01/27 | 108,000 | 95,778 | |||||||||
4.65% | 04/01/29 | 1,325,000 | 1,130,113 | |||||||||
| Kilroy Realty LP |
| |||||||||||
4.25% | 08/15/29 | 721,000 | 663,272 | |||||||||
|
| |||||||||||
| 2,128,418 | ||||||||||||
|
| |||||||||||
Residential REITs — 0.20% |
| |||||||||||
| American Homes 4 Rent LP |
| |||||||||||
3.63% | 04/15/32 | 650,000 | 572,261 | |||||||||
| Invitation Homes Operating Partnership LP |
| |||||||||||
2.00% | 08/15/31 | 975,000 | 775,971 | |||||||||
4.15% | 04/15/32 | 535,000 | 489,943 | |||||||||
5.50% | 08/15/33 | 149,000 | 148,505 | |||||||||
|
| |||||||||||
| 1,986,680 | ||||||||||||
|
| |||||||||||
Retail — 0.05% |
| |||||||||||
| Ferrellgas LP/Ferrellgas Finance Corp. |
| |||||||||||
5.88% | 04/01/292 | 180,000 | 171,729 | |||||||||
| Michaels Cos., Inc. (The) |
| |||||||||||
5.25% | 05/01/282 | 405,000 | 345,461 | |||||||||
|
| |||||||||||
| 517,190 | ||||||||||||
|
| |||||||||||
Services — 0.23% |
| |||||||||||
| Adtalem Global Education, Inc. |
| |||||||||||
5.50% | 03/01/282 | 215,000 | 206,106 | |||||||||
| Global Payments, Inc. |
| |||||||||||
4.88% | 03/17/31 | 200,000 | 228,059 | |||||||||
5.30% | 08/15/29 | 1,240,000 | 1,236,041 | |||||||||
| Worldline SA |
| |||||||||||
| (France) |
| |||||||||||
0.00% | 07/30/263,7 | 6,100 | 596,848 | |||||||||
|
| |||||||||||
| 2,267,054 | ||||||||||||
|
| |||||||||||
Specialized REITs — 0.77% |
| |||||||||||
| Annington Funding PLC |
| |||||||||||
| (EMTN) |
| |||||||||||
| (United Kingdom) |
| |||||||||||
2.31% | 10/06/323 | 560,000 | 556,515 | |||||||||
3.18% | 07/12/293 | 200,000 | 226,866 | |||||||||
| Blackstone Property Partners Europe Holdings SARL |
| |||||||||||
| (EMTN) |
| |||||||||||
| (Luxembourg) |
| |||||||||||
1.00% | 05/04/283 | 425,000 | 397,084 | |||||||||
1.63% | 04/20/303 | 455,000 | 410,096 | |||||||||
1.75% | 03/12/293 | 415,000 | 390,945 | |||||||||
| CubeSmart LP |
| |||||||||||
3.00% | 02/15/30 | 220,000 | 194,656 | |||||||||
4.38% | 02/15/29 | 673,000 | 646,328 | |||||||||
See accompanying Notes to Financial Statements.
| 101 / Annual Report March 2024 |
Table of Contents
Intermediate Bond Fund
Schedule of Portfolio Investments
March 31, 2024
| Issues | Maturity Date | Principal Amount | Value | |||||||||
| CORPORATES (continued) |
| |||||||||||
Specialized REITs (continued) |
| |||||||||||
| Extra Space Storage LP |
| |||||||||||
2.20% | 10/15/30 | $ | 1,149,000 | $ | 953,177 | |||||||
2.55% | 06/01/31 | 163,000 | 135,764 | |||||||||
3.88% | 12/15/27 | 915,000 | 869,680 | |||||||||
3.90% | 04/01/29 | 1,650,000 | 1,555,513 | |||||||||
| LEG Immobilien SE |
| |||||||||||
| (EMTN) |
| |||||||||||
| (Georgia) |
| |||||||||||
0.88% | 03/30/333 | 200,000 | 165,148 | |||||||||
| Realty Income Corp. |
| |||||||||||
5.13% | 07/06/34 | 820,000 | 967,608 | |||||||||
|
| |||||||||||
| 7,469,380 | ||||||||||||
|
| |||||||||||
Transportation — 0.25% |
| |||||||||||
| Canadian Pacific Railway Co. |
| |||||||||||
| (Canada) |
| |||||||||||
1.35% | 12/02/243 | 490,000 | 476,810 | |||||||||
| U.S. Airways Pass-Through Trust, |
| |||||||||||
| Series 2012-1, Class A |
| |||||||||||
5.90% | 10/01/24 | 212,414 | 212,414 | |||||||||
| U.S. Airways Pass-Through Trust, |
| |||||||||||
| Series 2012-2, Class A |
| |||||||||||
4.63% | 06/03/25 | 206,681 | 203,174 | |||||||||
| United Airlines Pass-Through Trust, |
| |||||||||||
| Series 2023-1, Class A |
| |||||||||||
5.80% | 01/15/36 | 1,500,000 | 1,522,822 | |||||||||
|
| |||||||||||
| 2,415,220 | ||||||||||||
|
| |||||||||||
Water — 0.05% |
| |||||||||||
| Thames Water Utilities Finance PLC |
| |||||||||||
| (EMTN) |
| |||||||||||
| (United Kingdom) |
| |||||||||||
4.38% | 01/18/313 | 490,000 | 493,500 | |||||||||
|
| |||||||||||
| Total Corporates |
| |||||||||||
| (Cost $198,259,501) |
| 195,534,310 | ||||||||||
|
| |||||||||||
MORTGAGE-BACKED — 24.54%** |
| |||||||||||
| Non-Agency Commercial Mortgage-Backed — 2.99% |
| |||||||||||
| Arbor Realty Commercial Real Estate Notes Ltd., |
| |||||||||||
| Series 2021-FL2, Class A |
| |||||||||||
| (Cayman Islands) |
| |||||||||||
| (CME Term SOFR 1-Month plus 1.21%) |
| |||||||||||
6.54% | 05/15/361,2,3 | 1,350,038 | 1,347,140 | |||||||||
| Banc of America Merrill Lynch Commercial Mortgage Trust, |
| |||||||||||
| Series 2018-PARK, Class A |
| |||||||||||
4.09% | 08/10/382,6 | 1,095,000 | 1,015,799 | |||||||||
| BX Trust, |
| |||||||||||
| Series 2019-OC11, Class A |
| |||||||||||
3.20% | 12/09/412 | 375,000 | 334,045 | |||||||||
| BXSC Commercial Mortgage Trust, |
| |||||||||||
| Series 2022-WSS, Class D |
| |||||||||||
| (CME Term SOFR 1-Month plus 3.19%) |
| |||||||||||
8.51% | 03/15/351,2 | 1,550,000 | 1,541,824 | |||||||||
| Century Plaza Towers, |
| |||||||||||
| Series 2019-CPT, Class A |
| |||||||||||
2.87% | 11/13/392 | 715,000 | 617,558 | |||||||||
| Issues | Maturity Date | Principal Amount | Value | |||||||||
| MORTGAGE-BACKED (continued) |
| |||||||||||
Non-Agency Commercial Mortgage-Backed (continued) |
| |||||||||||
| Citigroup Commercial Mortgage Trust, |
| |||||||||||
| Series 2016-GC36, Class A5 |
| |||||||||||
3.62% | 02/10/49 | $ | 3,250,000 | $ | 3,106,804 | |||||||
| Citigroup Commercial Mortgage Trust, |
| |||||||||||
| Series 2016-GC37, Class A4 |
| |||||||||||
3.31% | 04/10/49 | 1,000,000 | 953,049 | |||||||||
| Credit Suisse Mortgage Capital Trust, |
| |||||||||||
| Series 2019-ICE4, Class E |
| |||||||||||
| (CME Term SOFR 1-Month plus 2.20%) |
| |||||||||||
7.52% | 05/15/361,2 | 1,820,471 | 1,819,039 | |||||||||
| DC Office Trust, |
| |||||||||||
| Series 2019-MTC, Class A |
| |||||||||||
2.97% | 09/15/452 | 765,000 | 653,635 | |||||||||
| Frost CMBS DAC, |
| |||||||||||
| Series 2021-1X, Class EUA |
| |||||||||||
| (Ireland) |
| |||||||||||
| (3-Month Euribor plus 1.15%) |
| |||||||||||
5.08% | 11/20/331,3 | 1,327,667 | 1,385,999 | |||||||||
| GPMT Ltd., |
| |||||||||||
| Series 2021-FL4, Class AS |
| |||||||||||
| (Cayman Islands) |
| |||||||||||
| (CME Term SOFR 1-Month plus 1.81%) |
| |||||||||||
7.14% | 12/15/361,2,3 | 2,380,000 | 2,247,561 | |||||||||
| Houston Galleria Mall Trust, |
| |||||||||||
| Series 2015-HGLR, Class A1A2 |
| |||||||||||
3.09% | 03/05/372 | 3,000,000 | 2,907,584 | |||||||||
| Hudson Yards Mortgage Trust, |
| |||||||||||
| Series 2019-30HY, Class A |
| |||||||||||
3.23% | 07/10/392 | 760,000 | 681,215 | |||||||||
| Hudson Yards Mortgage Trust, |
| |||||||||||
| Series 2019-55HY, Class A |
| |||||||||||
2.94% | 12/10/412,6 | 765,000 | 671,425 | |||||||||
| JPMBB Commercial Mortgage Securities Trust, |
| |||||||||||
| Series 2015-C29, Class XA (IO) |
| |||||||||||
0.54% | 05/15/486 | 19,427,579 | 82,272 | |||||||||
| JPMorgan Chase Commercial Mortgage Securities Trust, |
| |||||||||||
| Series 2016-NINE, Class A |
| |||||||||||
2.85% | 09/06/382,6 | 2,280,000 | 2,134,427 | |||||||||
| JPMorgan Chase Commercial Mortgage Securities Trust, |
| |||||||||||
| Series 2019-OSB, Class A |
| |||||||||||
3.40% | 06/05/392 | 740,000 | 666,520 | |||||||||
| Last Mile Logistics Pan Euro Finance DAC, |
| |||||||||||
| Series 1A, Class A |
| |||||||||||
| (Ireland) |
| |||||||||||
| (3-Month Euribor plus 0.75%) |
| |||||||||||
4.67% | 08/17/331,2,3 | 2,338,773 | 2,486,814 | |||||||||
| Last Mile Securities PE 2021 DAC, |
| |||||||||||
| Series 2021-1A, Class A1 |
| |||||||||||
| (Ireland) |
| |||||||||||
| (3-Month Euribor plus 0.90%) |
| |||||||||||
4.82% | 08/17/311,2,3 | 2,172,553 | 2,322,824 | |||||||||
| MKT Mortgage Trust, |
| |||||||||||
| Series 2020-525M, Class A |
| |||||||||||
2.69% | 02/12/402 | 520,000 | 424,570 | |||||||||
See accompanying Notes to Financial Statements.
| Annual Report March 2024 / 102 |
Table of Contents
Intermediate Bond Fund
Schedule of Portfolio Investments
March 31, 2024
| Issues | Maturity Date | Principal Amount | Value | |||||||||
MORTGAGE-BACKED (continued) |
| |||||||||||
| Non-Agency Commercial Mortgage-Backed (continued) |
| |||||||||||
| One Bryant Park Trust, |
| |||||||||||
| Series 2019-OBP, Class A |
| |||||||||||
2.52% | 09/15/542 | $ | 960,000 | $ | 821,211 | |||||||
| SFAVE Commercial Mortgage Securities Trust, |
| |||||||||||
| Series 2015-5AVE, Class A2B |
| |||||||||||
4.14% | 01/05/432,6 | 45,000 | 33,168 | |||||||||
| Taurus UK DAC, |
| |||||||||||
| Series 2021-UK4X, Class D |
| |||||||||||
| (Ireland) |
| |||||||||||
| (SONIA plus 2.10%) |
| |||||||||||
7.32% | 08/17/311,3 | 447,596 | 564,494 | |||||||||
| Wells Fargo Commercial Mortgage Trust, |
| |||||||||||
| Series 2015-C26, Class XA (IO) |
| |||||||||||
1.15% | 02/15/486 | 27,082,734 | 156,387 | |||||||||
|
|
| ||||||||||
| 28,975,364 | ||||||||||||
|
|
| ||||||||||
| Non-Agency Mortgage-Backed — 6.59% |
| |||||||||||
| ACE Securities Corp. Home Equity Loan Trust, |
| |||||||||||
| Series 2005-HE2, Class M5 |
| |||||||||||
| (CME Term SOFR 1-Month plus 1.13%) |
| |||||||||||
6.46% | 04/25/351 | 1,723,479 | 1,685,836 | |||||||||
| Argent Securities, Inc., Asset-Backed Pass-Through |
| |||||||||||
| Certificates, |
| |||||||||||
| Series 2005-W3, Class M1 |
| |||||||||||
| (CME Term SOFR 1-Month plus 0.77%) |
| |||||||||||
6.10% | 11/25/351 | 3,985,717 | 3,838,885 | |||||||||
| Asset-Backed Securities Corp. Home Equity Loan Trust, |
| |||||||||||
| Series 2004-HE9, Class M1 |
| |||||||||||
| (CME Term SOFR 1-Month plus 1.09%) |
| |||||||||||
6.42% | 12/25/341 | 287,119 | 259,672 | |||||||||
| Banc of America Funding Trust, |
| |||||||||||
| Series 2003-2, Class 1A1 |
| |||||||||||
6.50% | 06/25/32 | 3,346 | 3,303 | |||||||||
| Banc of America Funding Trust, |
| |||||||||||
| Series 2014-R6, Class 2A11 |
| |||||||||||
5.70% | 07/26/362,6 | 1,700,000 | 1,377,800 | |||||||||
| Bear Stearns ALT-A Trust, |
| |||||||||||
| Series 2004-12, Class 1M1 |
| |||||||||||
| (CME Term SOFR 1-Month plus 1.04%) |
| |||||||||||
6.37% | 01/25/351 | 873,367 | 877,072 | |||||||||
| Chase Mortgage Finance Trust, |
| |||||||||||
| Series 2024-3, Class A4 |
| |||||||||||
6.00% | 02/25/552,6 | 4,900,000 | 4,891,450 | |||||||||
| Chevy Chase Mortgage Funding LLC, Mortgage-Backed |
| |||||||||||
| Certificates, |
| |||||||||||
| Series 2005-2A, Class A1 |
| |||||||||||
| (CME Term SOFR 1-Month plus 0.29%) |
| |||||||||||
5.62% | 05/25/361,2 | 32,514 | 29,097 | |||||||||
| CIM Trust, |
| |||||||||||
| Series 2021-R3, Class A1A |
| |||||||||||
1.95% | 06/25/572,6 | 1,975,768 | 1,746,974 | |||||||||
| Citigroup Mortgage Loan Trust, Inc., |
| |||||||||||
| Series 2005-OPT1, Class M1 |
| |||||||||||
| (CME Term SOFR 1-Month plus 0.74%) |
| |||||||||||
6.07% | 02/25/351 | 3,206,284 | 2,945,426 | |||||||||
| Issues | Maturity Date | Principal Amount | Value | |||||||||
MORTGAGE-BACKED (continued) |
| |||||||||||
| Non-Agency Mortgage-Backed (continued) |
| |||||||||||
| Citigroup Mortgage Loan Trust, Inc., |
| |||||||||||
| Series 2006-WFH1, Class M5 |
| |||||||||||
| (CME Term SOFR 1-Month plus 0.89%) |
| |||||||||||
6.22% | 01/25/361 | $ | 761,076 | $ | 757,567 | |||||||
| Countrywide Asset-Backed Certificates Trust, |
| |||||||||||
| Series 2005-7, Class MV5 |
| |||||||||||
| (CME Term SOFR 1-Month plus 1.24%) |
| |||||||||||
6.57% | 11/25/351 | 3,740,078 | 3,661,027 | |||||||||
| Countrywide Home Loan Mortgage Pass-Through Trust, |
| |||||||||||
| Series 2004-14, Class 4A1 |
| |||||||||||
5.36% | 08/25/346 | 49,080 | 43,982 | |||||||||
| Credit Suisse Mortgage Capital Trust |
| |||||||||||
| Series 2022-RPL3, Class A1 |
| |||||||||||
3.78% | 03/25/612,6 | 3,584,996 | 3,558,341 | |||||||||
| Credit Suisse Mortgage Capital Trust, |
| |||||||||||
| Series 2022-ATH2, Class A1 |
| |||||||||||
4.55% | 05/25/672,6 | 1,669,237 | 1,624,200 | |||||||||
| Credit-Based Asset Servicing and Securitization LLC, |
| |||||||||||
| Series 2003-CB3, Class AF1 (STEP-reset date 05/25/24) |
| |||||||||||
3.38% | 12/25/32 | 407,728 | 384,843 | |||||||||
| Credit-Based Asset Servicing and Securitization LLC, |
| |||||||||||
| Series 2006-CB2, Class AF4 (STEP-reset date 05/25/24) |
| |||||||||||
3.05% | 12/25/36 | 327,654 | 251,414 | |||||||||
| Credit-Based Asset Servicing and Securitization LLC, |
| |||||||||||
| Series 2007-CB5, Class A1 |
| |||||||||||
| (CME Term SOFR 1-Month plus 0.17%) |
| |||||||||||
3.39% | 04/25/371 | 93,154 | 57,100 | |||||||||
| Credit-Based Asset Servicing and Securitization LLC, |
| |||||||||||
| Series 2007-CB5, Class A3 |
| |||||||||||
| (CME Term SOFR 1-Month plus 0.36%) |
| |||||||||||
3.39% | 04/25/371 | 1,106,911 | 621,071 | |||||||||
| Fannie Mae Connecticut Avenue Securities, |
| |||||||||||
| Series 2022-R01, Class 1M1 |
| |||||||||||
| (SOFR30A plus 1.00%) |
| |||||||||||
6.32% | 12/25/411,2 | 781,285 | 780,349 | |||||||||
| Fannie Mae Connecticut Avenue Securities, |
| |||||||||||
| Series 2023-R08, Class 1M1 |
| |||||||||||
| (SOFR30A plus 1.50%) |
| |||||||||||
6.82% | 10/25/431,2 | 3,785,475 | 3,803,718 | |||||||||
| First Horizon Alternative Mortgage Securities Trust, |
| |||||||||||
| Series 2004-AA3, Class A1 |
| |||||||||||
5.82% | 09/25/346 | 24,369 | 23,983 | |||||||||
| Freddie Mac Structured Agency Credit Risk Debt Notes, |
| |||||||||||
| Series 2022-DNA1, Class M1A |
| |||||||||||
| (SOFR30A plus 1.00%) |
| |||||||||||
6.32% | 01/25/421,2 | 1,351,452 | 1,352,696 | |||||||||
| GCAT Trust, |
| |||||||||||
| Series 2021-NQM5, Class A1 |
| |||||||||||
1.26% | 07/25/662,6 | 3,779,569 | 3,031,307 | |||||||||
| GSAA Home Equity Trust, |
| |||||||||||
| Series 2005-9, Class M2 |
| |||||||||||
| (CME Term SOFR 1-Month plus 0.86%) |
| |||||||||||
6.19% | 08/25/351 | 1,727,087 | 1,710,053 | |||||||||
| GSR Mortgage Loan Trust, |
| |||||||||||
| Series 2004-9, Class 5A7 |
| |||||||||||
4.61% | 08/25/346 | 4,754 | 4,727 | |||||||||
See accompanying Notes to Financial Statements.
| 103 / Annual Report March 2024 |
Table of Contents
Intermediate Bond Fund
Schedule of Portfolio Investments
March 31, 2024
| Issues | Maturity Date | Principal Amount | Value | |||||||||
MORTGAGE-BACKED (continued) |
| |||||||||||
| Non-Agency Mortgage-Backed (continued) |
| |||||||||||
| HarborView Mortgage Loan Trust, |
| |||||||||||
| Series 2007-7, Class 2A1A |
| |||||||||||
| (CME Term SOFR 1-Month plus 2.11%) |
| |||||||||||
6.44% | 10/25/371 | $ | 1,347,290 | $ | 1,268,165 | |||||||
| HSI Asset Securitization Corp. Trust, |
| |||||||||||
| Series 2005-OPT1, Class M1 |
| |||||||||||
| (CME Term SOFR 1-Month plus 0.74%) |
| |||||||||||
6.07% | 11/25/351 | 72,534 | 71,205 | |||||||||
| IndyMac Index Mortgage Loan Trust, |
| |||||||||||
| Series 2004-AR7, Class A2 |
| |||||||||||
| (CME Term SOFR 1-Month plus 0.97%) |
| |||||||||||
6.30% | 09/25/341 | 6,482 | 5,578 | |||||||||
| IndyMac Index Mortgage Loan Trust, |
| |||||||||||
| Series 2004-AR8, Class 2A2A |
| |||||||||||
| (CME Term SOFR 1-Month plus 0.91%) |
| |||||||||||
6.24% | 11/25/341 | 18,680 | 16,497 | |||||||||
| IndyMac Index Mortgage Loan Trust, |
| |||||||||||
| Series 2007-AR11, Class 1A1 |
| |||||||||||
3.11% | 06/25/376 | 461,469 | 399,373 | |||||||||
| IndyMac Manufactured Housing Contract Pass-Through |
| |||||||||||
| Certificates, |
| |||||||||||
| Series 1997-1, Class A3 |
| |||||||||||
6.61% | 02/25/28 | 16,441 | 16,295 | |||||||||
| IndyMac Manufactured Housing Contract Pass-Through |
| |||||||||||
| Certificates, |
| |||||||||||
| Series 1997-1, Class A4 |
| |||||||||||
6.75% | 02/25/28 | 4,377 | 4,339 | |||||||||
| IndyMac Manufactured Housing Contract Pass-Through |
| |||||||||||
| Certificates, |
| |||||||||||
| Series 1998-1, Class A4 |
| |||||||||||
6.49% | 09/25/28 | 26,737 | 26,703 | |||||||||
| JPMorgan Mortgage Acquisition Trust, |
| |||||||||||
| Series 2006-CH1, Class M2 |
| |||||||||||
| (CME Term SOFR 1-Month plus 0.55%) |
| |||||||||||
5.88% | 07/25/361 | 55,589 | 55,517 | |||||||||
| JPMorgan Mortgage Trust, |
| |||||||||||
| Series 2007-A3, Class 3A2 |
| |||||||||||
4.43% | 05/25/376 | 84,857 | 73,923 | |||||||||
| MASTRAdjustable Rate Mortgages Trust, |
| |||||||||||
| Series 2003-6, Class 4A2 |
| |||||||||||
4.37% | 01/25/346 | 21,940 | 20,980 | |||||||||
| MASTRAdjustable Rate Mortgages Trust, |
| |||||||||||
| Series 2007-HF2, Class A1 |
| |||||||||||
| (CME Term SOFR 1-Month plus 0.73%) |
| |||||||||||
6.06% | 09/25/371 | 79,771 | 79,664 | |||||||||
| MASTR Seasoned Securitization Trust, |
| |||||||||||
| Series 2004-1, Class 4A1 |
| |||||||||||
6.22% | 10/25/326 | 3,948 | 3,811 | |||||||||
| MASTR Seasoned Securitization Trust, |
| |||||||||||
| Series 2005-1, Class 4A1 |
| |||||||||||
6.27% | 10/25/326 | 7,763 | 7,312 | |||||||||
| Merrill Lynch First Franklin Mortgage Loan Trust, |
| |||||||||||
| Series 2007-3, Class A2C |
| |||||||||||
| (CME Term SOFR 1-Month plus 0.47%) |
| |||||||||||
5.80% | 06/25/371 | 138,081 | 132,919 | |||||||||
| Issues | Maturity Date | Principal Amount | Value | |||||||||
MORTGAGE-BACKED (continued) |
| |||||||||||
| Non-Agency Mortgage-Backed (continued) |
| |||||||||||
| Merrill Lynch First Franklin Mortgage Loan Trust, |
| |||||||||||
| Series 2007-3, Class A2D |
| |||||||||||
| (CME Term SOFR 1-Month plus 0.61%) |
| |||||||||||
5.94% | 06/25/371 | $ | 255,170 | $ | 246,254 | |||||||
| Mid-State Trust XI, |
| |||||||||||
| Series 11, Class A1 |
| |||||||||||
4.86% | 07/15/38 | 222,858 | 218,428 | |||||||||
| Morgan Stanley ABS Capital I Trust, |
| |||||||||||
| Series 2004-NC7, Class M2 |
| |||||||||||
| (CME Term SOFR 1-Month plus 1.04%) |
| |||||||||||
6.37% | 07/25/341 | 105,498 | 105,509 | |||||||||
| Morgan Stanley ABS Capital I, Inc., Trust, |
| |||||||||||
| Series 2005-HE3, Class M5 |
| |||||||||||
| (CME Term SOFR 1-Month plus 1.15%) |
| |||||||||||
6.48% | 07/25/351 | 2,646,328 | 2,568,446 | |||||||||
| Nationstar Home Equity Loan Trust, |
| |||||||||||
| Series 2007-B, Class 1AV1 |
| |||||||||||
| (CME Term SOFR 1-Month plus 0.33%) |
| |||||||||||
5.66% | 04/25/371 | 452,842 | 450,450 | |||||||||
| New Century Home Equity Loan Trust, |
| |||||||||||
| Series 2005-1, Class M1 |
| |||||||||||
| (CME Term SOFR 1-Month plus 0.79%) |
| |||||||||||
6.12% | 03/25/351 | 685,269 | 691,953 | |||||||||
| New York Mortgage Trust, |
| |||||||||||
| Series 2005-3, Class A1 |
| |||||||||||
| (CME Term SOFR 1-Month plus 0.59%) |
| |||||||||||
5.92% | 02/25/361 | 222,209 | 217,841 | |||||||||
| PRPM LLC, |
| |||||||||||
| Series 2020-4, Class A1 (STEP-reset date 04/25/24) |
| |||||||||||
5.61% | 10/25/252 | 1,953,704 | 1,951,248 | |||||||||
| PRPM LLC, |
| |||||||||||
| Series 2021-11, Class A1 (STEP-reset date 04/25/24) |
| |||||||||||
2.49% | 11/25/262 | 1,127,591 | 1,107,789 | |||||||||
| PRPM LLC, |
| |||||||||||
| Series 2021-6, Class A1 (STEP-reset date 04/25/24) |
| |||||||||||
1.79% | 07/25/262 | 1,490,080 | 1,450,486 | |||||||||
| PRPM LLC, |
| |||||||||||
| Series 2022-3, Class A1 (STEP-reset date 04/25/24) |
| |||||||||||
5.56% | 06/25/272 | 1,914,369 | 1,891,646 | |||||||||
| RBSSP Resecuritization Trust, |
| |||||||||||
| Series 2009-12, Class 17A2 |
| |||||||||||
5.60% | 10/25/352,6 | 838,326 | 812,858 | |||||||||
| Residential Asset Mortgage Products Trust, |
| |||||||||||
| Series 2003-SL1, Class A41 |
| |||||||||||
8.00% | 04/25/31 | 15,201 | 12,361 | |||||||||
| Residential Asset Mortgage Products Trust, |
| |||||||||||
| Series 2004-SL1, Class A7 |
| |||||||||||
7.00% | 11/25/31 | 5,707 | 4,835 | |||||||||
| Residential Asset Securitization Trust, |
| |||||||||||
| Series 2004-IP2, Class 2A1 |
| |||||||||||
4.09% | 12/25/346 | 11,067 | 9,897 | |||||||||
| Saxon Asset Securities Trust, |
| |||||||||||
| Series 2007-1, Class A2D |
| |||||||||||
| (CME Term SOFR 1-Month plus 0.35%) |
| |||||||||||
5.68% | 01/25/471 | 3,955,019 | 3,668,576 | |||||||||
See accompanying Notes to Financial Statements.
| Annual Report March 2024 / 104 |
Table of Contents
Intermediate Bond Fund
Schedule of Portfolio Investments
March 31, 2024
| Issues | Maturity Date | Principal Amount | Value | |||||||||
MORTGAGE-BACKED (continued) |
| |||||||||||
| Non-Agency Mortgage-Backed (continued) |
| |||||||||||
| Soundview Home Loan Trust, |
| |||||||||||
| Series 2005-OPT4, Class M1 |
| |||||||||||
| (CME Term SOFR 1-Month plus 0.80%) |
| |||||||||||
6.13% | 12/25/351 | $ | 4,500,000 | $ | 3,911,962 | |||||||
| Structured Adjustable Rate Mortgage Loan Trust, |
| |||||||||||
| Series 2004-15, Class A |
| |||||||||||
5.58% | 10/25/346 | 503,126 | 482,370 | |||||||||
| Structured Asset Mortgage Investments II Trust, |
| |||||||||||
| Series 2005-AR1, Class A1 |
| |||||||||||
| (CME Term SOFR 1-Month plus 0.59%) |
| |||||||||||
5.92% | 04/19/351 | 250,865 | 235,642 | |||||||||
| Structured Asset Mortgage Investments II Trust, |
| |||||||||||
| Series 2005-AR8, Class A2 |
| |||||||||||
| (Federal Reserve US 12-Month Cumulative Average plus |
| |||||||||||
| 1.48%) |
| |||||||||||
6.54% | 02/25/361 | 203,413 | 169,632 | |||||||||
| Structured Asset Mortgage Investments II Trust, |
| |||||||||||
| Series 2006-AR3, Class 22A1 |
| |||||||||||
4.37% | 05/25/366 | 1,440,753 | 719,042 | |||||||||
| VOLT XCIX, LLC, |
| |||||||||||
| Series 2021-NPL8, Class A1 (STEP-reset date 04/25/24) |
| |||||||||||
5.12% | 04/25/512 | 818,221 | 798,111 | |||||||||
| VOLT XCVI LLC, |
| |||||||||||
| Series 2021-NPL5, Class A1 (STEP-reset date 04/25/24) |
| |||||||||||
5.12% | 03/27/512 | 425,138 | 416,798 | |||||||||
| WaMu Mortgage Pass-Through Certificates, |
| |||||||||||
| Series 2005-AR13, Class A1A3 |
| |||||||||||
| (CME Term SOFR 1-Month plus 1.67%) |
| |||||||||||
7.00% | 10/25/451 | 323,030 | 312,382 | |||||||||
|
|
| ||||||||||
| 63,958,690 | ||||||||||||
|
|
| ||||||||||
| U.S. Agency Commercial Mortgage-Backed — 0.27% |
| |||||||||||
| Fannie Mae Pool AN2786 |
| |||||||||||
2.76% | 09/01/36 | 46,080 | 38,129 | |||||||||
| Fannie Mae Pool BL6060 |
| |||||||||||
2.46% | 04/01/40 | 1,160,000 | 837,350 | |||||||||
| Freddie Mac Multifamily Structured Pass-Through |
| |||||||||||
| Certificates, |
| |||||||||||
| Series KJ42, Class A1 |
| |||||||||||
3.90% | 07/25/29 | 1,831,653 | 1,764,606 | |||||||||
|
|
| ||||||||||
| 2,640,085 | ||||||||||||
|
|
| ||||||||||
| U.S. Agency Mortgage-Backed — 14.69% |
| |||||||||||
| Fannie Mae Pool 253974 |
| |||||||||||
7.00% | 08/01/31 | 456 | 455 | |||||||||
| Fannie Mae Pool 527247 |
| |||||||||||
7.00% | 09/01/26 | 3 | 3 | |||||||||
| Fannie Mae Pool 545191 |
| |||||||||||
7.00% | 09/01/31 | 343 | 349 | |||||||||
| Fannie Mae Pool 545646 |
| |||||||||||
7.00% | 09/01/26 | 2 | 2 | |||||||||
| Fannie Mae Pool 549740 |
| |||||||||||
6.50% | 10/01/27 | 823 | 842 | |||||||||
| Fannie Mae Pool 630599 |
| |||||||||||
7.00% | 05/01/32 | 1,659 | 1,711 | |||||||||
| Issues | Maturity Date | Principal Amount | Value | |||||||||
MORTGAGE-BACKED (continued) |
| |||||||||||
| U.S. Agency Mortgage-Backed (continued) |
| |||||||||||
| Fannie Mae Pool 655928 |
| |||||||||||
7.00% | 08/01/32 | $ | 1,065 | $ | 1,103 | |||||||
| Fannie Mae Pool 735207 |
| |||||||||||
7.00% | 04/01/34 | 561 | 574 | |||||||||
| Fannie Mae Pool 735861 |
| |||||||||||
6.50% | 09/01/33 | 24,748 | 25,077 | |||||||||
| Fannie Mae Pool 764388 |
| |||||||||||
| (RFUCCT6M plus 1.38%) |
| |||||||||||
5.76% | 03/01/341 | 6,059 | 6,004 | |||||||||
| Fannie Mae Pool 776708 |
| |||||||||||
5.00% | 05/01/34 | 53,679 | 53,981 | |||||||||
| Fannie Mae Pool 844773 |
| |||||||||||
| (RFUCCT1Y plus 1.56%) |
| |||||||||||
5.81% | 12/01/351 | 2,543 | 2,536 | |||||||||
| Fannie Mae Pool 889184 |
| |||||||||||
5.50% | 09/01/36 | 41,201 | 42,072 | |||||||||
| Fannie Mae Pool 890221 |
| |||||||||||
5.50% | 12/01/33 | 57,037 | 58,016 | |||||||||
| Fannie Mae Pool 939419 |
| |||||||||||
| (RFUCCT1Y plus 1.27%) |
| |||||||||||
4.64% | 05/01/371 | 18,662 | 18,465 | |||||||||
| Fannie Mae Pool AL0209 |
| |||||||||||
4.50% | 05/01/41 | 169,217 | 165,715 | |||||||||
| Fannie Mae Pool CA1710 |
| |||||||||||
4.50% | 05/01/48 | 7,221 | 6,982 | |||||||||
| Fannie Mae Pool CA1711 |
| |||||||||||
4.50% | 05/01/48 | 495,994 | 479,552 | |||||||||
| Fannie Mae Pool CA2208 |
| |||||||||||
4.50% | 08/01/48 | 6,520 | 6,304 | |||||||||
| Fannie Mae Pool CB2430 |
| |||||||||||
3.00% | 12/01/51 | 2,246,308 | 1,933,841 | |||||||||
| Fannie Mae Pool FM2318 |
| |||||||||||
3.50% | 09/01/49 | 851,248 | 776,757 | |||||||||
| Fannie Mae Pool FS1598 |
| |||||||||||
2.00% | 04/01/52 | 2,958,945 | 2,343,266 | |||||||||
| Fannie Mae Pool FS2646 |
| |||||||||||
3.00% | 06/01/52 | 3,127,259 | 2,705,962 | |||||||||
| Fannie Mae Pool MA1527 |
| |||||||||||
3.00% | 08/01/33 | 10,893 | 10,221 | |||||||||
| Fannie Mae Pool MA1561 |
| |||||||||||
3.00% | 09/01/33 | 609,814 | 572,050 | |||||||||
| Fannie Mae Pool MA1608 |
| |||||||||||
3.50% | 10/01/33 | 525,863 | 503,320 | |||||||||
| Fannie Mae Pool MA3427 |
| |||||||||||
4.00% | 07/01/33 | 5,015 | 4,895 | |||||||||
| Fannie Mae Pool MA3537 |
| |||||||||||
4.50% | 12/01/48 | 448,615 | 433,779 | |||||||||
| Fannie Mae Pool MA3811 |
| |||||||||||
3.00% | 10/01/49 | 401,560 | 345,522 | |||||||||
| Fannie Mae Pool MA4333 |
| |||||||||||
2.00% | 05/01/41 | 618,978 | 519,494 | |||||||||
| Fannie Mae Pool MA4512 |
| |||||||||||
2.50% | 01/01/52 | 2,016,219 | 1,668,158 | |||||||||
| Fannie Mae Pool MA4548 |
| |||||||||||
2.50% | 02/01/52 | 2,456,148 | 2,035,250 | |||||||||
See accompanying Notes to Financial Statements.
| 105 / Annual Report March 2024 |
Table of Contents
Intermediate Bond Fund
Schedule of Portfolio Investments
March 31, 2024
| Issues | Maturity Date | Principal Amount | Value | |||||||||
MORTGAGE-BACKED (continued) |
| |||||||||||
U.S. Agency Mortgage-Backed (continued) |
| |||||||||||
| Fannie Mae Pool MA4733 |
| |||||||||||
4.50% | 09/01/52 | $ | 8,868,546 | $ | 8,450,928 | |||||||
| Fannie Mae Pool MA5008 |
| |||||||||||
4.50% | 05/01/53 | 1,092,900 | 1,041,115 | |||||||||
| Fannie Mae REMICS, |
| |||||||||||
| Series 2001-52, Class YZ |
| |||||||||||
6.50% | 10/25/31 | 60,410 | 61,560 | |||||||||
| Fannie Mae REMICS, |
| |||||||||||
| Series 2003-124, Class TS |
| |||||||||||
| (-14.00 X SOFR30A plus 99.20%, 9.80% Cap) |
| |||||||||||
9.80% | 01/25/341 | 1,844 | 1,847 | |||||||||
| Fannie Mae REMICS, |
| |||||||||||
| Series 2007-64, Class FA |
| |||||||||||
| (SOFR30A plus 0.58%) |
| |||||||||||
5.90% | 07/25/371 | 26,184 | 26,058 | |||||||||
| Fannie Mae REMICS, |
| |||||||||||
| Series 2008-50, Class SA (IO) |
| |||||||||||
| (-1.00 X SOFR30A plus 5.94%, 6.05% Cap) |
| |||||||||||
0.62% | 11/25/361 | 431,780 | 29,699 | |||||||||
| Fannie Mae REMICS, |
| |||||||||||
| Series 2018-38, Class PA |
| |||||||||||
3.50% | 06/25/47 | 2,748 | 2,590 | |||||||||
| Fannie Mae REMICS, |
| |||||||||||
| Series 2018-43, Class CT |
| |||||||||||
3.00% | 06/25/48 | 170,545 | 150,031 | |||||||||
| Fannie Mae REMICS, |
| |||||||||||
| Series 2018-86, Class JA |
| |||||||||||
4.00% | 05/25/47 | 117,333 | 113,931 | |||||||||
| Fannie Mae Trust, |
| |||||||||||
| Series 2003-W6, Class 5T (IO) |
| |||||||||||
| (-1.00 X SOFR30A plus 8.04%, 0.55% Cap) |
| |||||||||||
0.55% | 09/25/421 | 5,499,360 | 102,162 | |||||||||
| Freddie Mac Gold Pool A25162 |
| |||||||||||
5.50% | 05/01/34 | 45,940 | 46,955 | |||||||||
| Freddie Mac Gold Pool A33262 |
| |||||||||||
5.50% | 02/01/35 | 20,738 | 21,203 | |||||||||
| Freddie Mac Gold Pool A68781 |
| |||||||||||
5.50% | 10/01/37 | 2,735 | 2,797 | |||||||||
| Freddie Mac Gold Pool C03813 |
| |||||||||||
3.50% | 04/01/42 | 466,393 | 434,037 | |||||||||
| Freddie Mac Gold Pool G01548 |
| |||||||||||
7.50% | 07/01/32 | 132,537 | 139,211 | |||||||||
| Freddie Mac Gold Pool G01644 |
| |||||||||||
5.50% | 02/01/34 | 29,436 | 30,095 | |||||||||
| Freddie Mac Gold Pool G02366 |
| |||||||||||
6.50% | 10/01/36 | 23,209 | 24,431 | |||||||||
| Freddie Mac Gold Pool G08844 |
| |||||||||||
5.00% | 10/01/48 | 129,342 | 128,494 | |||||||||
| Freddie Mac Gold Pool G15897 |
| |||||||||||
2.50% | 09/01/31 | 14,199 | 13,348 | |||||||||
| Freddie Mac Gold Pool G16085 |
| |||||||||||
2.50% | 02/01/32 | 875,429 | 819,223 | |||||||||
| Freddie Mac Gold Pool G16524 |
| |||||||||||
3.50% | 05/01/33 | 31,925 | 30,744 | |||||||||
| Freddie Mac Gold Pool G16756 |
| |||||||||||
3.50% | 01/01/34 | 537,182 | 516,397 | |||||||||
| Issues | Maturity Date | Principal Amount | Value | |||||||||
MORTGAGE-BACKED (continued) |
| |||||||||||
U.S. Agency Mortgage-Backed (continued) |
| |||||||||||
| Freddie Mac Gold Pool G18581 |
| |||||||||||
2.50% | 01/01/31 | $ | 13,806 | $ | 12,960 | |||||||
| Freddie Mac Pool SD7503 |
| |||||||||||
3.50% | 08/01/49 | 2,279,676 | 2,077,941 | |||||||||
| Freddie Mac Pool SD8199 |
| |||||||||||
2.00% | 03/01/52 | 1,598,156 | 1,265,621 | |||||||||
| Freddie Mac Pool SD8347 |
| |||||||||||
4.50% | 08/01/53 | 2,558,089 | 2,436,669 | |||||||||
| Freddie Mac REMICS, |
| |||||||||||
| Series 2174, Class PN |
| |||||||||||
6.00% | 07/15/29 | 9,670 | 9,631 | |||||||||
| Freddie Mac REMICS, |
| |||||||||||
| Series 3460, Class SA (IO) |
| |||||||||||
| (-1.00 X SOFR30A plus 6.09%, 6.20% Cap) |
| |||||||||||
0.77% | 06/15/381 | 407,521 | 26,225 | |||||||||
| Freddie Mac REMICS, |
| |||||||||||
| Series 4030, Class HS (IO) |
| |||||||||||
| (-1.00 X SOFR30A plus 6.50%, 6.61% Cap) |
| |||||||||||
1.18% | 04/15/421 | 366,904 | 35,412 | |||||||||
| Ginnie Mae (TBA) |
| |||||||||||
2.50% | 04/20/54 | 3,900,000 | 3,324,141 | |||||||||
4.50% | 04/20/54 | 13,900,000 | 13,359,585 | |||||||||
5.00% | 04/20/54 | 11,875,000 | 11,672,833 | |||||||||
5.50% | 04/20/54 | 5,100,000 | 5,096,401 | |||||||||
| Ginnie Mae I Pool 782810 |
| |||||||||||
4.50% | 11/15/39 | 301,465 | 294,085 | |||||||||
| Ginnie Mae II Pool 80968 |
| |||||||||||
| (US Treasury Yield Curve Rate T Note Constant Maturity |
| |||||||||||
| 1-Year plus 1.50%) |
| |||||||||||
3.63% | 07/20/341 | 8,073 | 7,944 | |||||||||
| Ginnie Mae II Pool MA4454 |
| |||||||||||
5.00% | 05/20/47 | 11,821 | 11,900 | |||||||||
| Ginnie Mae II Pool MA4511 |
| |||||||||||
4.00% | 06/20/47 | 2,994 | 2,845 | |||||||||
| Ginnie Mae II Pool MA4588 |
| |||||||||||
4.50% | 07/20/47 | 104,341 | 102,100 | |||||||||
| Ginnie Mae II Pool MA4589 |
| |||||||||||
5.00% | 07/20/47 | 587,007 | 590,364 | |||||||||
| Ginnie Mae II Pool MA4838 |
| |||||||||||
4.00% | 11/20/47 | 272,213 | 258,297 | |||||||||
| Ginnie Mae II Pool MA4901 |
| |||||||||||
4.00% | 12/20/47 | 221,390 | 210,072 | |||||||||
| Ginnie Mae II Pool MA5399 |
| |||||||||||
4.50% | 08/20/48 | 270,573 | 263,464 | |||||||||
| Ginnie Mae II Pool MA5530 |
| |||||||||||
5.00% | 10/20/48 | 3,251 | 3,231 | |||||||||
| Ginnie Mae II Pool MA6030 |
| |||||||||||
3.50% | 07/20/49 | 37,306 | 33,439 | |||||||||
| Ginnie Mae II Pool MA6080 |
| |||||||||||
3.00% | 08/20/49 | 19,877 | 17,202 | |||||||||
| Ginnie Mae II Pool MA6209 |
| |||||||||||
3.00% | 10/20/49 | 350,154 | 303,028 | |||||||||
| Ginnie Mae, |
| |||||||||||
| Series 2023-134, Class F |
| |||||||||||
| (SOFR30A plus 1.00%) |
| |||||||||||
6.32% | 08/20/531 | 965,795 | 963,314 | |||||||||
See accompanying Notes to Financial Statements.
| Annual Report March 2024 / 106 |
Table of Contents
Intermediate Bond Fund
Schedule of Portfolio Investments
March 31, 2024
| Issues | Maturity Date | Principal Amount | Value | |||||||||
MORTGAGE-BACKED (continued) |
| |||||||||||
| U.S. Agency Mortgage-Backed (continued) |
| |||||||||||
| Ginnie Mae, |
| |||||||||||
| Series 2024-30, Class AF |
| |||||||||||
| (SOFR30A plus 1.25%) |
| |||||||||||
6.50% | 02/20/541 | $ | 652,640 | $ | 652,774 | |||||||
| Ginnie Mae, |
| |||||||||||
| Series 2024-30, Class CF |
| |||||||||||
| (SOFR30A plus 1.25%) |
| |||||||||||
6.50% | 02/20/541 | 1,591,229 | 1,593,603 | |||||||||
| UMBS (TBA) |
| |||||||||||
2.00% | 04/01/54 | 1,725,000 | 1,366,345 | |||||||||
2.50% | 04/01/54 | 5,975,000 | 4,943,482 | |||||||||
3.00% | 04/01/54 | 8,775,000 | 7,555,545 | |||||||||
3.50% | 04/01/54 | 4,500,000 | 4,029,874 | |||||||||
4.00% | 04/01/54 | 23,125,000 | 21,421,337 | |||||||||
4.50% | 04/01/54 | 15,625,000 | 14,883,423 | |||||||||
5.00% | 04/01/54 | 11,425,000 | 11,148,737 | |||||||||
5.50% | 04/01/54 | 5,725,000 | 5,697,164 | |||||||||
|
|
| ||||||||||
| 142,580,102 | ||||||||||||
|
|
| ||||||||||
| Total Mortgage-Backed |
| |||||||||||
| (Cost $245,600,907) |
| 238,154,241 | ||||||||||
|
|
| ||||||||||
MUNICIPAL BONDS — 0.82%* |
| |||||||||||
| California — 0.01% |
| |||||||||||
| Los Angeles Department of Water & Power Power System Revenue Bonds, Electric Light & Power Improvements, |
| |||||||||||
| Series C |
| |||||||||||
5.52% | 07/01/27 | 50,000 | 51,186 | |||||||||
|
|
| ||||||||||
| Florida — 0.05% |
| |||||||||||
| County of Miami-Dade Aviation Revenue Bonds, Airport and Marina Improvements, Series C |
| |||||||||||
4.06% | 10/01/31 | 280,000 | 268,046 | |||||||||
| County of Miami-Dade Aviation Revenue Bonds, Airport and Marina Improvements, Series D |
| |||||||||||
3.50% | 10/01/31 | 245,000 | 224,561 | |||||||||
|
|
| ||||||||||
| 492,607 | ||||||||||||
|
|
| ||||||||||
| Massachusetts — 0.15% |
| |||||||||||
| Commonwealth of Massachusetts Revenue Bonds, Series B |
| |||||||||||
4.11% | 07/15/31 | 1,513,386 | 1,479,116 | |||||||||
|
|
| ||||||||||
| Michigan — 0.07% |
| |||||||||||
| University of Michigan Revenue Bonds, Series C |
| |||||||||||
3.48% | 04/01/33 | 750,000 | 697,128 | |||||||||
|
|
| ||||||||||
| New York — 0.53% |
| |||||||||||
| City of New York General Obligation, Public Improvements, Series 2 |
| |||||||||||
1.70% | 03/01/29 | 250,000 | 218,815 | |||||||||
| New York City Transitional Finance Authority Future Tax Secured Revenue Bonds, School Improvements, Series G-3 | ||||||||||||
5.27% | 05/01/27 | 1,465,000 | 1,481,527 | |||||||||
| New York City Transitional Finance Authority Future Tax Secured Revenue Bonds, Series F, Subseries F-3 |
| |||||||||||
5.13% | 02/01/35 | 718,000 | 732,080 | |||||||||
5.15% | 02/01/36 | 718,000 | 730,667 | |||||||||
| Issues | Maturity Date | Principal Amount | Value | |||||||||
MUNICIPAL BONDS (continued) |
| |||||||||||
| New York (continued) |
| |||||||||||
| New York State Dormitory Authority Revenue Bonds, Series C |
| |||||||||||
1.95% | 03/15/29 | $ | 590,000 | $ | 519,807 | |||||||
| New York State Dormitory Authority Revenue Bonds, University & College Improvements, Series D |
| |||||||||||
5.50% | 03/15/30 | 70,000 | 70,618 | |||||||||
| New York State Urban Development Corp. Revenue Bonds, Transit Improvements, Series B |
| |||||||||||
2.01% | 03/15/30 | 1,630,000 | 1,409,160 | |||||||||
|
|
| ||||||||||
| 5,162,674 | ||||||||||||
|
|
| ||||||||||
| Pennsylvania — 0.01% |
| |||||||||||
| Pennsylvania Economic Development Financing Authority Revenue Bonds, University of Pittsburgh Medical Center, |
| |||||||||||
| Series B |
| |||||||||||
3.20% | 11/15/27 | 40,000 | 37,873 | |||||||||
|
|
| ||||||||||
| Total Municipal Bonds |
| |||||||||||
| (Cost $8,193,159) |
| 7,920,584 | ||||||||||
|
|
| ||||||||||
U.S. TREASURY SECURITIES — 44.90% |
| |||||||||||
| U.S. Treasury Notes — 44.90% |
| |||||||||||
| U.S. Treasury Notes |
| |||||||||||
4.25% | 03/15/27 | 47,990,000 | 47,778,169 | |||||||||
4.50% | 03/31/26 | 9,160,000 | 9,139,244 | |||||||||
| U.S. Treasury Notes (WI) |
| |||||||||||
4.00% | 02/15/34 | 79,331,000 | 78,048,035 | |||||||||
4.25% | 02/28/29 | 95,063,000 | 95,226,390 | |||||||||
4.25% | 03/31/29 | 206,285,000 | 205,464,951 | |||||||||
|
|
| ||||||||||
| Total U.S. Treasury Securities |
| |||||||||||
| (Cost $435,374,392) |
| 435,656,789 | ||||||||||
|
|
| ||||||||||
| Total Bonds — 97.33% |
| |||||||||||
| (Cost $954,761,534) |
| 944,447,295 | ||||||||||
|
|
| ||||||||||
| Issues | Shares | Value | ||||||||||
COMMON STOCK — 0.04% |
| |||||||||||
| Communications — 0.04% |
| |||||||||||
| Intelsat Emergence SA3,4,5,8 |
| |||||||||||
| (Luxembourg) | 15,282 | 410,704 | ||||||||||
|
|
| ||||||||||
| Electric — 0.00% |
| |||||||||||
| Homer City Holdings LLC4,5,8 | 8,014 | — | ||||||||||
|
|
| ||||||||||
| Total Common Stock |
| |||||||||||
| (Cost $968,945) |
| 410,704 | ||||||||||
|
|
| ||||||||||
| Issues | Maturity Date | Principal Amount/Shares | Value | |||||||||
SHORT-TERM INVESTMENTS — 22.12% |
| |||||||||||
| Money Market Funds — 11.20% |
| |||||||||||
| Dreyfus Government Cash Management Fund |
| |||||||||||
5.20%9 | 41,065,000 | 41,065,000 | ||||||||||
| Fidelity Investments Money Market Funds - Government Portfolio |
| |||||||||||
5.21%9,10 | 61,917 | 61,917 | ||||||||||
See accompanying Notes to Financial Statements.
| 107 / Annual Report March 2024 |
Table of Contents
Intermediate Bond Fund
Schedule of Portfolio Investments
March 31, 2024
| Issues | Maturity Date | Principal Amount/Shares | Value | |||||||||
| SHORT-TERM INVESTMENTS (continued) |
| |||||||||||
| Money Market Funds (continued) |
| |||||||||||
| JPMorgan U.S. Government Money Market Fund |
| |||||||||||
5.16%9 | 19,913,000 | $ | 19,913,000 | |||||||||
| Morgan Stanley Institutional Liquidity Funds - Government Portfolio |
| |||||||||||
5.22%9 | 47,633,000 | 47,633,000 | ||||||||||
|
| |||||||||||
| 108,672,917 | ||||||||||||
|
| |||||||||||
| U.S. Treasury Bills — 10.92% |
| |||||||||||
| U.S. Treasury Bills |
| |||||||||||
5.49%11 | 04/11/24 | $ | 15,000,000 | 14,978,191 | ||||||||
|
| |||||||||||
| U.S. Treasury Bills (WI) |
| |||||||||||
5.32%11 | 05/30/24 | 40,000,000 | 39,637,816 | |||||||||
5.31%11 | 04/16/24 | 50,000,000 | 49,868,500 | |||||||||
5.33%11 | 04/04/24 | 1,500,000 | 1,498,688 | |||||||||
|
| |||||||||||
| 105,983,195 | ||||||||||||
|
| |||||||||||
| Total Short-Term Investments |
| |||||||||||
(Cost $214,697,359) |
| 214,656,112 | ||||||||||
|
| |||||||||||
| Total Investments - 119.49% |
| |||||||||||
(Cost $1,170,427,838) |
| 1,159,514,111 | ||||||||||
|
| |||||||||||
| Liabilities in Excess of Other Assets - (19.49)% |
| (189,145,616 | ) | |||||||||
|
| |||||||||||
| Net Assets - 100.00% |
| $ | 970,368,495 | |||||||||
|
| |||||||||||
| 1 | Floating rate security. The rate disclosed was in effect at March 31, 2024. |
| 2 | Securities exempt from registration under Rule 144A of the Securities Act of 1933, as amended. The securities may be resold in transactions exempt from registration, normally to qualified institutional buyers. |
| 3 | Foreign denominated security issued by foreign domiciled entity. |
| 4 | Security is valued using significant unobservable inputs and is classified as Level 3 in the fair value hierarchy. |
| 5 | Illiquid security as determined under procedures approved by the Board of Trustees. The aggregate value of illiquid securities is $2,104,735, which is 0.22% of total net assets. |
| 6 | Variable rate security. Interest rate disclosed is as of the most recent information available. Certain variable rate securities are not based on a published reference rate and spread but are determined by the issuer or agent and are based on current market conditions. |
| 7 | Zero coupon bond. The rate shown is the effective yield as of March 31, 2024. |
| 8 | Non-income producing security. |
| 9 | Represents the current yield as of March 31, 2024. |
| 10 | Securities, or a portion thereof, pledged as collateral for swaps. The total market value of collateral pledged is $3,381. |
| 11 | Represents annualized yield at date of purchase. |
| * | Securities with a call or reset feature will have an effective maturity date sooner than the stated maturity. |
| ** | Securities backed by mortgage or consumer loans where payment is periodically made will have an effective maturity date sooner than the stated maturity date. |
Note: For Fund compliance purposes, the Fund’s industry classifications refer to any one or more of the industry sub-classifications used by one or more widely recognized market indexes or ratings group indexes, and/or as defined by Fund management. This definition may not apply for purposes of this report, which may combine industry sub-classifications for more meaningful presentation for investors.
(CLO): Collateralized Loan Obligation
(EMTN): Euro Medium-Term Note
(EUR): Euro
(EURIBOR): Euro InterBank Offer Rate
(GBP): British Pound
(GMTN): Global Medium-Term Note
(IO): Interest Only
(LIBOR): London InterBank Offer Rate
(MTN): Medium-Term Note
(REIT): Real Estate Investment Trust
(RFUCCT): Refinitiv USD IBOR Consumer Cash Fallback
(SOFR): Secured Overnight Financing Rate
(SONIA): Sterling Overnight Index Average
(STEP): Step Coupon Bond
(TBA): To-Be-Announced
(WI): When Issued
Currency to be Purchased | Currency to be Sold | Counterparty | Settlement Date | Unrealized Appreciation (Depreciation) | ||||||||||||
FOREIGN CURRENCY EXCHANGE CONTRACT |
| |||||||||||||||
USD 24,719,435 | EUR 22,484,000 | Citibank N.A. | 04/12/24 | $ | 422,580 | |||||||||||
USD 486,683 | EUR 448,000 | The Bank of New York Mellon | 04/12/24 | 2,562 | ||||||||||||
USD 1,586,621 | GBP 1,243,000 | Citibank N.A. | 04/12/24 | 16,275 | ||||||||||||
|
| |||||||||||||||
| 441,417 | ||||||||||||||||
|
| |||||||||||||||
EUR 1,567,000 | USD 1,703,959 | Bank of America N.A. | 04/12/24 | (10,614) | ||||||||||||
EUR 577,000 | USD 624,664 | The Bank of New York Mellon | 04/12/24 | (1,141) | ||||||||||||
EUR 1,984,000 | USD 2,158,147 | Citibank N.A. | 04/12/24 | (14,180) | ||||||||||||
EUR 193,000 | USD 208,744 | Goldman Sachs International | 04/12/24 | (183) | ||||||||||||
GBP 200,000 | USD 252,949 | Citibank N.A. | 04/12/24 | (278) | ||||||||||||
USD 222,410 | EUR 206,000 | Bank of America N.A. | 04/12/24 | (199) | ||||||||||||
|
| |||||||||||||||
| (26,595) | ||||||||||||||||
|
| |||||||||||||||
| NET UNREALIZED APPRECIATION | $ | 414,822 | ||||||||||||||
|
| |||||||||||||||
See accompanying Notes to Financial Statements.
| Annual Report March 2024 / 108 |
Table of Contents
Intermediate Bond Fund
Schedule of Portfolio Investments
March 31, 2024
| Description | Number of Contracts | Expiration Date | Notional Amount | Value | Unrealized Appreciation (Depreciation) | |||||||||||||||
| FUTURES CONTRACTS: LONG POSITIONS | ||||||||||||||||||||
U.S. Treasury Two-Year Note | 1,468 | 06/28/24 | $ | 300,183,064 | $ | (230,540) | $ | (230,540) | ||||||||||||
U.S. Treasury Five-Year Note | 257 | 06/28/24 | 27,503,017 | 26,322 | 26,322 | |||||||||||||||
U.S. Treasury Ten-Year Ultra Bond | 170 | 06/18/24 | 19,483,595 | 112,600 | 112,600 | |||||||||||||||
Euro-Schatz Future | 3 | 06/06/24 | 342,468 | 547 | 547 | |||||||||||||||
|
|
|
|
|
| |||||||||||||||
| 347,512,144 | (91,071) | (91,071) | ||||||||||||||||||
|
|
|
|
|
| |||||||||||||||
| FUTURES CONTRACTS: SHORT POSITIONS | ||||||||||||||||||||
U.S. Treasury Ultra Bond | 97 | 06/18/24 | (12,513,000) | (124,524) | (124,524) | |||||||||||||||
Euro-Bund Future | 56 | 06/06/24 | (8,066,823) | (56,318) | (56,318) | |||||||||||||||
Euro-Bobl Future | 48 | 06/06/24 | (6,130,080) | (27,533) | (27,533) | |||||||||||||||
U.S. Treasury Ten-Year Note | 15 | 06/18/24 | (1,661,953) | 11,597 | 11,597 | |||||||||||||||
|
|
|
|
|
| |||||||||||||||
| (28,371,856) | (196,778) | (196,778) | ||||||||||||||||||
|
|
|
|
|
| |||||||||||||||
TOTAL FUTURES CONTRACTS | $ | 319,140,288 | $ | (287,849) | $ | (287,849) | ||||||||||||||
|
|
|
|
|
| |||||||||||||||
See accompanying Notes to Financial Statements.
| 109 / Annual Report March 2024 |
Table of Contents
Schedule of Portfolio Investments
March 31, 2024
| Issues | Maturity Date | Principal Amount | Value | |||||||
| BONDS – 104.96% | ||||||||||
| ASSET-BACKED SECURITIES — 4.94%** | ||||||||||
Aimco CLO, |
| |||||||||
Series 2015-AA, Class BR2 |
| |||||||||
(Cayman Islands) |
| |||||||||
(CME Term SOFR 3-Month plus 1.86%) |
| |||||||||
7.18% | 10/17/341,2,3 | $ | 70,000 | $ | 70,038 | |||||
Allegro CLO VIII Ltd., |
| |||||||||
Series 2018-2A, Class A |
| |||||||||
(Cayman Islands) |
| |||||||||
(CME Term SOFR 3-Month plus 1.36%) |
| |||||||||
6.68% | 07/15/311,2,3 | 26,900 | 26,917 | |||||||
AMMC CLO 30 Ltd., |
| |||||||||
Series 2024-30A, Class A1 |
| |||||||||
(Cayman Islands) |
| |||||||||
(CME Term SOFR 3-Month plus 1.68%) |
| |||||||||
6.97% | 01/15/371,2,3 | 70,000 | 70,312 | |||||||
Barings CLO Ltd., |
| |||||||||
Series 2018-2A, Class A1B |
| |||||||||
(Cayman Islands) |
| |||||||||
(CME Term SOFR 3-Month plus 1.48%) |
| |||||||||
6.80% | 04/15/301,2,3 | 110,000 | 109,979 | |||||||
Barings CLO Ltd., |
| |||||||||
Series 2018-3A, Class A1 |
| |||||||||
(Cayman Islands) |
| |||||||||
(CME Term SOFR 3-Month plus 1.21%) |
| |||||||||
6.53% | 07/20/291,2,3 | 71,734 | 71,789 | |||||||
FirstKey Homes Trust, |
| |||||||||
Series 2021-SFR2, Class E2 |
| |||||||||
2.36% | 09/17/383 | 100,000 | 90,057 | |||||||
FirstKey Homes Trust, |
| |||||||||
Series 2022-SFR1, Class D |
| |||||||||
5.20% | 05/19/393 | 70,000 | 67,888 | |||||||
GoldenTree Loan Management U.S. CLO 4 Ltd., |
| |||||||||
Series 2019-4A, Class ARR |
| |||||||||
(Cayman Islands) |
| |||||||||
(CME Term SOFR 3-Month plus 1.15%) |
| |||||||||
6.48% | 04/24/311,2,3 | 100,000 | 100,101 | |||||||
J.G. Wentworth XXX LLC, |
| |||||||||
Series 2013-3A, Class A |
| |||||||||
4.08% | 01/17/733 | 27,346 | 25,636 | |||||||
Madison Park Funding XXXIX Ltd., |
| |||||||||
Series 2021-39A, Class B |
| |||||||||
(Cayman Islands) |
| |||||||||
(CME Term SOFR 3-Month plus 1.91%) |
| |||||||||
7.23% | 10/22/341,2,3 | 70,000 | 70,069 | |||||||
Octagon Investment Partners 46 Ltd., |
| |||||||||
Series 2020-2A, Class AR |
| |||||||||
(Cayman Islands) |
| |||||||||
(CME Term SOFR 3-Month plus 1.42%) |
| |||||||||
6.74% | 07/15/361,2,3 | 70,000 | 70,018 | |||||||
Palmer Square Loan Funding Ltd., |
| |||||||||
Series 2022-3A, Class A1BR |
| |||||||||
(Cayman Islands) |
| |||||||||
(CME Term SOFR 3-Month plus 1.40%) |
| |||||||||
6.72% | 04/15/311,2,3 | 115,000 | 115,056 | |||||||
| Issues | Maturity Date | Principal Amount | Value | |||||||
| ASSET-BACKED SECURITIES (continued) | ||||||||||
Progress Residential Trust, |
| |||||||||
Series 2021-SFR11, Class E2 |
| |||||||||
3.53% | 01/17/393 | $ | 80,000 | $ | 69,817 | |||||
Skyline Aircraft Finance LLC, |
| |||||||||
Series 2021-1, Class A |
| |||||||||
3.23% | 05/10/374,5,6 | 32,985 | 29,461 | |||||||
SLM Student Loan Trust, |
| |||||||||
Series 2008-2, Class B |
| |||||||||
(SOFR90A plus 1.46%) |
| |||||||||
6.82% | 01/25/832 | 20,000 | 19,215 | |||||||
SLM Student Loan Trust, |
| |||||||||
Series 2008-3, Class B |
| |||||||||
(SOFR90A plus 1.46%) |
| |||||||||
6.82% | 04/26/832 | 20,000 | 19,081 | |||||||
SLM Student Loan Trust, |
| |||||||||
Series 2008-5, Class B |
| |||||||||
(SOFR90A plus 2.11%) |
| |||||||||
7.47% | 07/25/732 | 35,000 | 34,835 | |||||||
SLM Student Loan Trust, |
| |||||||||
Series 2008-6, Class A4 |
| |||||||||
(SOFR90A plus 1.36%) |
| |||||||||
6.72% | 07/25/232 | 19,149 | 19,015 | |||||||
SLM Student Loan Trust, |
| |||||||||
Series 2008-6, Class B |
| |||||||||
(SOFR90A plus 2.11%) |
| |||||||||
7.47% | 07/26/832 | 20,000 | 19,023 | |||||||
SLM Student Loan Trust, |
| |||||||||
Series 2008-7, Class B |
| |||||||||
(SOFR90A plus 2.11%) |
| |||||||||
7.47% | 07/26/832 | 20,000 | 18,770 | |||||||
Stack Infrastructure Issuer LLC, |
| |||||||||
Series 2023-2A, Class A2 |
| |||||||||
5.90% | 07/25/483 | 100,000 | 99,777 | |||||||
Vantage Data Centers Issuer LLC, |
| |||||||||
Series 2020-1A, Class A2 |
| |||||||||
1.65% | 09/15/453 | 85,000 | 79,672 | |||||||
Wachovia Student Loan Trust, |
| |||||||||
Series 2006-1, Class A6 |
| |||||||||
(SOFR90A plus 0.43%) |
| |||||||||
5.79% | 04/25/402,3 | 19,697 | 19,233 | |||||||
|
| |||||||||
Total Asset-Backed Securities |
| |||||||||
(Cost $1,317,769) |
| 1,315,759 | ||||||||
|
| |||||||||
CORPORATES — 45.04%* |
| |||||||||
Banking — 8.03% |
| |||||||||
Bank of America Corp. |
| |||||||||
2.30% | 07/21/325 | 407,000 | 333,390 | |||||||
2.59% | 04/29/315 | 210,000 | 180,969 | |||||||
Bank of America Corp., |
| |||||||||
Series N |
| |||||||||
1.66% | 03/11/275 | 40,000 | 37,289 | |||||||
Bank of New York Mellon Corp. (The) |
| |||||||||
(MTN) |
| |||||||||
5.83% | 10/25/335 | 170,000 | 177,598 | |||||||
HSBC Holdings PLC |
| |||||||||
(United Kingdom) |
| |||||||||
2.80% | 05/24/321,5 | 155,000 | 130,026 | |||||||
See accompanying Notes to Financial Statements.
| Annual Report March 2024 / 110 |
Table of Contents
Investment Grade Credit Fund
Schedule of Portfolio Investments
March 31, 2024
| Issues | Maturity Date | Principal Amount | Value | |||||||||
| CORPORATES (continued) | ||||||||||||
| Banking (continued) | ||||||||||||
JPMorgan Chase & Co. |
| |||||||||||
1.58% | 04/22/275 | $ | 205,000 | $ | 190,147 | |||||||
1.95% | 02/04/325 | 365,000 | 297,514 | |||||||||
2.96% | 01/25/335 | 65,000 | 55,555 | |||||||||
PNC Financial Services Group, Inc. (The) |
| |||||||||||
5.07% | 01/24/345 | 170,000 | 164,715 | |||||||||
5.68% | 01/22/355 | 5,000 | 5,052 | |||||||||
6.04% | 10/28/335 | 10,000 | 10,350 | |||||||||
6.88% | 10/20/345 | 15,000 | 16,437 | |||||||||
Santander UK Group Holdings PLC |
| |||||||||||
(United Kingdom) |
| |||||||||||
2.47% | 01/11/281,5 | 40,000 | 36,762 | |||||||||
U.S. Bancorp |
| |||||||||||
4.84% | 02/01/345 | 190,000 | 180,514 | |||||||||
5.68% | 01/23/355 | 5,000 | 5,053 | |||||||||
Wells Fargo & Co. |
| |||||||||||
(MTN) |
| |||||||||||
2.57% | 02/11/315 | 80,000 | 68,975 | |||||||||
3.35% | 03/02/335 | 285,000 | 247,222 | |||||||||
|
| |||||||||||
| 2,137,568 | ||||||||||||
|
| |||||||||||
Communications — 2.88% |
| |||||||||||
Charter Communications Operating LLC/Charter |
| |||||||||||
Communications Operating Capital |
| |||||||||||
2.30% | 02/01/32 | 270,000 | 208,580 | |||||||||
Cisco Systems, Inc. |
| |||||||||||
5.05% | 02/26/34 | 60,000 | 60,812 | |||||||||
Comcast Corp. |
| |||||||||||
1.95% | 01/15/31 | 10,000 | 8,311 | |||||||||
Discovery Communications LLC |
| |||||||||||
3.63% | 05/15/30 | 35,000 | 31,350 | |||||||||
Fox Corp. |
| |||||||||||
6.50% | 10/13/33 | 65,000 | 68,857 | |||||||||
Sprint Capital Corp. |
| |||||||||||
8.75% | 03/15/32 | 85,000 | 103,127 | |||||||||
Sprint Spectrum Co. LLC/Sprint Spectrum Co. II LLC/Sprint |
| |||||||||||
Spectrum Co. III LLC |
| |||||||||||
4.74% | 03/20/253 | 18,750 | 18,650 | |||||||||
5.15% | 03/20/283 | 100,000 | 99,791 | |||||||||
T-Mobile USA, Inc. |
| |||||||||||
2.55% | 02/15/31 | 154,000 | 131,239 | |||||||||
5.05% | 07/15/33 | 35,000 | 34,649 | |||||||||
|
| |||||||||||
| 765,366 | ||||||||||||
|
| |||||||||||
Consumer Discretionary — 2.54% |
| |||||||||||
Bacardi Ltd. |
| |||||||||||
(Bermuda) |
| |||||||||||
4.70% | 05/15/281,3 | 90,000 | 87,862 | |||||||||
BAT Capital Corp. |
| |||||||||||
4.39% | 08/15/37 | 95,000 | 79,905 | |||||||||
Church & Dwight Co., Inc. |
| |||||||||||
5.60% | 11/15/32 | 20,000 | 20,946 | |||||||||
Constellation Brands, Inc. |
| |||||||||||
2.88% | 05/01/30 | 30,000 | 26,556 | |||||||||
Hyatt Hotels Corp. |
| |||||||||||
1.80% | 10/01/24 | 35,000 | 34,291 | |||||||||
| Issues | Maturity Date | Principal Amount | Value | |||||||||
| CORPORATES (continued) | ||||||||||||
| Consumer Discretionary (continued) | ||||||||||||
Imperial Brands Finance PLC |
| |||||||||||
(United Kingdom) |
| |||||||||||
4.25% | 07/21/251,3 | $ | 30,000 | $ | 29,476 | |||||||
JDE Peet’s NV |
| |||||||||||
(Netherlands) |
| |||||||||||
2.25% | 09/24/311,3 | 120,000 | 95,620 | |||||||||
Kenvue, Inc. |
| |||||||||||
4.90% | 03/22/33 | 15,000 | 15,008 | |||||||||
Philip Morris International, Inc. |
| |||||||||||
5.75% | 11/17/32 | 60,000 | 61,986 | |||||||||
Reynolds American, Inc. |
| |||||||||||
5.70% | 08/15/35 | 50,000 | 48,754 | |||||||||
WarnerMedia Holdings, Inc. |
| |||||||||||
4.28% | 03/15/32 | 195,000 | 174,389 | |||||||||
|
| |||||||||||
| 674,793 | ||||||||||||
|
| |||||||||||
Diversified REITs — 1.80% |
| |||||||||||
American Assets Trust LP |
| |||||||||||
3.38% | 02/01/31 | 25,000 | 20,440 | |||||||||
American Tower Corp. |
| |||||||||||
2.30% | 09/15/31 | 148,000 | 120,879 | |||||||||
2.90% | 01/15/30 | 15,000 | 13,224 | |||||||||
5.65% | 03/15/33 | 15,000 | 15,257 | |||||||||
Crown Castle, Inc. |
| |||||||||||
2.25% | 01/15/31 | 120,000 | 98,723 | |||||||||
3.30% | 07/01/30 | 25,000 | 22,235 | |||||||||
Digital Realty Trust LP |
| |||||||||||
3.60% | 07/01/29 | 10,000 | 9,220 | |||||||||
Equinix, Inc. |
| |||||||||||
2.50% | 05/15/31 | 35,000 | 29,205 | |||||||||
GLP Capital LP/GLP Financing II, Inc. |
| |||||||||||
3.25% | 01/15/32 | 14,000 | 11,868 | |||||||||
4.00% | 01/15/30 | 35,000 | 32,084 | |||||||||
5.30% | 01/15/29 | 20,000 | 19,760 | |||||||||
VICI Properties LP |
| |||||||||||
5.13% | 05/15/32 | 62,000 | 59,403 | |||||||||
VICI Properties LP/VICI Note Co., Inc. |
| |||||||||||
4.63% | 06/15/253 | 15,000 | 14,794 | |||||||||
Weyerhaeuser Co. |
| |||||||||||
3.38% | 03/09/33 | 15,000 | 13,110 | |||||||||
|
| |||||||||||
| 480,202 | ||||||||||||
|
| |||||||||||
Electric — 4.14% |
| |||||||||||
Alliant Energy Finance LLC |
| |||||||||||
1.40% | 03/15/263 | 90,000 | 81,911 | |||||||||
5.95% | 03/30/293 | 35,000 | 36,088 | |||||||||
Ameren Corp. |
| |||||||||||
3.50% | 01/15/31 | 50,000 | 45,203 | |||||||||
Appalachian Power Co., |
| |||||||||||
Series X |
| |||||||||||
3.30% | 06/01/27 | 20,000 | 18,902 | |||||||||
Arizona Public Service Co. |
| |||||||||||
6.35% | 12/15/32 | 125,000 | 133,557 | |||||||||
Berkshire Hathaway Energy Co. |
| |||||||||||
1.65% | 05/15/31 | 25,000 | 20,039 | |||||||||
See accompanying Notes to Financial Statements.
| 111 / Annual Report March 2024 |
Table of Contents
Investment Grade Credit Fund
Schedule of Portfolio Investments
March 31, 2024
| Issues | Maturity Date | Principal Amount | Value | |||||||
| CORPORATES (continued) |
| |||||||||
Electric (continued) |
| |||||||||
Black Hills Corp. |
| |||||||||
4.35% | 05/01/33 | $ | 36,000 | $ | 32,981 | |||||
Commonwealth Edison Co. |
| |||||||||
6.45% | 01/15/38 | 20,000 | 22,023 | |||||||
Duke Energy Corp. |
| |||||||||
2.55% | 06/15/31 | 35,000 | 29,521 | |||||||
Duke Energy Florida LLC |
| |||||||||
5.88% | 11/15/33 | 110,000 | 116,441 | |||||||
Eversource Energy |
| |||||||||
4.60% | 07/01/27 | 30,000 | 29,531 | |||||||
5.13% | 05/15/33 | 70,000 | 68,677 | |||||||
Exelon Corp. |
| |||||||||
5.30% | 03/15/33 | 35,000 | 35,124 | |||||||
FirstEnergy Pennsylvania Electric Co. |
| |||||||||
4.00% | 04/15/253 | 75,000 | 73,182 | |||||||
ITC Holdings Corp. |
| |||||||||
4.95% | 09/22/273 | 20,000 | 19,889 | |||||||
Jersey Central Power & Light Co. |
| |||||||||
2.75% | 03/01/323 | 90,000 | 75,225 | |||||||
Narragansett Electric Co. (The) |
| |||||||||
3.40% | 04/09/303 | 35,000 | 31,975 | |||||||
Oklahoma Gas and Electric Co. |
| |||||||||
5.40% | 01/15/33 | 15,000 | 15,336 | |||||||
Public Service Co. of New Mexico |
| |||||||||
3.85% | 08/01/25 | 40,000 | 39,104 | |||||||
Southwestern Electric Power Co. |
| |||||||||
5.30% | 04/01/33 | 155,000 | 153,193 | |||||||
Southwestern Electric Power Co., |
| |||||||||
Series M |
| |||||||||
4.10% | 09/15/28 | 15,000 | 14,392 | |||||||
Xcel Energy, Inc. |
| |||||||||
3.40% | 06/01/30 | 10,000 | 8,943 | |||||||
|
| |||||||||
| 1,101,237 | ||||||||||
|
| |||||||||
Energy — 2.68% |
| |||||||||
Aker BP ASA |
| |||||||||
(Norway) |
| |||||||||
3.10% | 07/15/311,3 | 67,000 | 57,348 | |||||||
Boston Gas Co. |
| |||||||||
3.76% | 03/16/323 | 25,000 | 22,049 | |||||||
CenterPoint Energy Resources Corp. |
| |||||||||
5.40% | 03/01/33 | 115,000 | 117,112 | |||||||
East Ohio Gas Co. (The) |
| |||||||||
2.00% | 06/15/303 | 15,000 | 12,359 | |||||||
KeySpan Gas East Corp. |
| |||||||||
5.99% | 03/06/333 | 85,000 | 86,314 | |||||||
NiSource, Inc. |
| |||||||||
5.40% | 06/30/33 | 75,000 | 75,726 | |||||||
Piedmont Natural Gas Co., Inc. |
| |||||||||
2.50% | 03/15/31 | 10,000 | 8,453 | |||||||
5.40% | 06/15/33 | 65,000 | 65,715 | |||||||
Plains All American Pipeline LP/PAA Finance Corp. |
| |||||||||
4.65% | 10/15/25 | 30,000 | 29,613 | |||||||
Rockies Express Pipeline LLC |
| |||||||||
3.60% | 05/15/253 | 20,000 | 19,537 | |||||||
4.95% | 07/15/293 | 5,000 | 4,683 | |||||||
| Issues | Maturity Date | Principal Amount | Value | |||||||
| CORPORATES (continued) |
| |||||||||
Energy (continued) |
| |||||||||
Southern Co. Gas Capital Corp. |
| |||||||||
5.15% | 09/15/32 | $ | 20,000 | $ | 20,109 | |||||
5.75% | 09/15/33 | 102,000 | 105,872 | |||||||
Southern Natural Gas Co. LLC |
| |||||||||
4.80% | 03/15/473 | 30,000 | 24,785 | |||||||
TransCanada PipeLines Ltd. |
| |||||||||
(Canada) |
| |||||||||
4.63% | 03/01/341 | 30,000 | 28,368 | |||||||
5.60% | 03/31/341 | 35,000 | 35,508 | |||||||
|
| |||||||||
| 713,551 | ||||||||||
|
| |||||||||
Finance — 4.82% |
| |||||||||
AerCap Ireland Capital DAC/AerCap Global Aviation Trust |
| |||||||||
(Ireland) |
| |||||||||
3.00% | 10/29/281 | 80,000 | 72,428 | |||||||
3.30% | 01/30/321 | 60,000 | 51,432 | |||||||
3.88% | 01/23/281 | 16,000 | 15,172 | |||||||
Air Lease Corp. |
| |||||||||
3.63% | 12/01/27 | 26,000 | 24,556 | |||||||
4.63% | 10/01/28 | 15,000 | 14,606 | |||||||
American Express Co. |
| |||||||||
6.49% | 10/30/315 | 100,000 | 107,261 | |||||||
Avolon Holdings Funding Ltd. |
| |||||||||
(Cayman Islands) |
| |||||||||
2.53% | 11/18/271,3 | 46,000 | 40,936 | |||||||
2.75% | 02/21/281,3 | 10,000 | 8,953 | |||||||
4.38% | 05/01/261,3 | 5,000 | 4,838 | |||||||
Citigroup, Inc. |
| |||||||||
2.52% | 11/03/325 | 200,000 | 164,328 | |||||||
2.56% | 05/01/325 | 70,000 | 58,403 | |||||||
3.06% | 01/25/335 | 32,000 | 27,203 | |||||||
Discover Financial Services |
| |||||||||
6.70% | 11/29/32 | 25,000 | 26,479 | |||||||
Goldman Sachs Group, Inc. (The) |
| |||||||||
1.95% | 10/21/275 | 50,000 | 45,994 | |||||||
2.65% | 10/21/325 | 212,000 | 176,454 | |||||||
Intercontinental Exchange, Inc. |
| |||||||||
1.85% | 09/15/32 | 50,000 | 39,145 | |||||||
Morgan Stanley |
| |||||||||
(MTN) |
| |||||||||
1.79% | 02/13/325 | 240,000 | 191,917 | |||||||
1.93% | 04/28/325 | 215,000 | 172,617 | |||||||
Nationwide Building Society |
| |||||||||
(United Kingdom) |
| |||||||||
1.50% | 10/13/261,3 | 25,000 | 22,821 | |||||||
Pipeline Funding Co. LLC |
| |||||||||
7.50% | 01/15/303 | 16,532 | 17,351 | |||||||
|
| |||||||||
| 1,282,894 | ||||||||||
|
| |||||||||
Food — 1.05% |
| |||||||||
General Mills, Inc. |
| |||||||||
4.95% | 03/29/33 | 50,000 | 49,517 | |||||||
JBS USA LUX SA/JBS USA Food Co./JBS Luxembourg Sarl |
| |||||||||
(Canada) |
| |||||||||
6.75% | 03/15/341,3 | 85,000 | 89,395 | |||||||
See accompanying Notes to Financial Statements.
| Annual Report March 2024 / 112 |
Table of Contents
Investment Grade Credit Fund
Schedule of Portfolio Investments
March 31, 2024
| Issues | Maturity Date | Principal Amount | Value | |||||||
| CORPORATES (continued) |
| |||||||||
Food (continued) |
| |||||||||
JBS USA LUX SA/JBS USA Food Co./JBS USA Finance, Inc. |
| |||||||||
(Canada) |
| |||||||||
3.75% | 12/01/311 | $ | 32,000 | $ | 27,748 | |||||
Kellanova |
| |||||||||
5.25% | 03/01/33 | 30,000 | 30,087 | |||||||
Pilgrim’s Pride Corp. |
| |||||||||
3.50% | 03/01/32 | 60,000 | 50,930 | |||||||
Smithfield Foods, Inc. |
| |||||||||
2.63% | 09/13/313 | 40,000 | 31,346 | |||||||
|
| |||||||||
| 279,023 | ||||||||||
|
| |||||||||
| Health Care — 6.55% |
| |||||||||
Alcon Finance Corp. |
| |||||||||
2.75% | 09/23/263 | 40,000 | 37,771 | |||||||
Amgen, Inc. |
| |||||||||
5.25% | 03/02/33 | 165,000 | 166,467 | |||||||
Ascension Health, |
| |||||||||
Series B |
| |||||||||
2.53% | 11/15/29 | 20,000 | 17,844 | |||||||
Barnabas Health, Inc., |
| |||||||||
Series 2012 |
| |||||||||
4.00% | 07/01/28 | 15,000 | 14,386 | |||||||
Baxter International, Inc. |
| |||||||||
3.95% | 04/01/30 | 10,000 | 9,368 | |||||||
Bayer U.S. Finance II LLC |
| |||||||||
4.38% | 12/15/283 | 45,000 | 42,379 | |||||||
Bayer U.S. Finance LLC |
| |||||||||
6.50% | 11/21/333 | 95,000 | 96,686 | |||||||
Becton Dickinson & Co. |
| |||||||||
3.70% | 06/06/27 | 20,000 | 19,220 | |||||||
Bristol-Myers Squibb Co. |
| |||||||||
5.20% | 02/22/34 | 135,000 | 137,210 | |||||||
Centene Corp. |
| |||||||||
3.00% | 10/15/30 | 85,000 | 72,954 | |||||||
Cigna Group (The) |
| |||||||||
2.40% | 03/15/30 | 105,000 | 90,725 | |||||||
CVS Health Corp. |
| |||||||||
3.25% | 08/15/29 | 40,000 | 36,706 | |||||||
5.25% | 02/21/33 | 150,000 | 150,171 | |||||||
DENTSPLY SIRONA, Inc. |
| |||||||||
3.25% | 06/01/30 | 35,000 | 31,036 | |||||||
Elanco Animal Health, Inc. |
| |||||||||
6.65% | 08/28/28 | 15,000 | 15,247 | |||||||
Elevance Health, Inc. |
| |||||||||
5.50% | 10/15/32 | 45,000 | 46,168 | |||||||
Fresenius Medical Care U.S. Finance III, Inc. |
| |||||||||
1.88% | 12/01/263 | 20,000 | 18,107 | |||||||
HCA, Inc. |
| |||||||||
3.63% | 03/15/32 | 75,000 | 66,425 | |||||||
4.13% | 06/15/29 | 65,000 | 61,557 | |||||||
Humana, Inc. |
| |||||||||
3.70% | 03/23/29 | 10,000 | 9,418 | |||||||
5.38% | 04/15/31 | 150,000 | 150,182 | |||||||
Illumina, Inc. |
| |||||||||
2.55% | 03/23/31 | 25,000 | 20,695 | |||||||
| Issues | Maturity Date | Principal Amount | Value | |||||||
| CORPORATES (continued) |
| |||||||||
Health Care (continued) |
| |||||||||
5.75% | 12/13/27 | $ | 15,000 | $ | 15,191 | |||||
IQVIA, Inc. |
| |||||||||
6.25% | 02/01/29 | 35,000 | 36,360 | |||||||
Medtronic Global Holdings SCA |
| |||||||||
(Luxembourg) |
| |||||||||
4.50% | 03/30/331 | 20,000 | 19,424 | |||||||
Pfizer Investment Enterprises Pte Ltd. |
| |||||||||
(Slovenia) |
| |||||||||
4.75% | 05/19/331 | 35,000 | 34,498 | |||||||
Premier Health Partners, |
| |||||||||
Series G |
| |||||||||
2.91% | 11/15/26 | 15,000 | 13,793 | |||||||
Providence St. Joseph Health Obligated Group, |
| |||||||||
Series H |
| |||||||||
2.75% | 10/01/26 | 20,000 | 18,738 | |||||||
Regeneron Pharmaceuticals, Inc. |
| |||||||||
1.75% | 09/15/30 | 20,000 | 16,378 | |||||||
Revvity, Inc. |
| |||||||||
2.55% | 03/15/31 | 35,000 | 29,545 | |||||||
Roche Holdings, Inc. |
| |||||||||
5.59% | 11/13/333 | 85,000 | 89,439 | |||||||
Royalty Pharma PLC |
| |||||||||
(United Kingdom) |
| |||||||||
1.75% | 09/02/271 | 25,000 | 22,228 | |||||||
Smith & Nephew PLC |
| |||||||||
(United Kingdom) |
| |||||||||
2.03% | 10/14/301 | 30,000 | 24,772 | |||||||
STERIS Irish FinCo UnLtd Co. |
| |||||||||
(Ireland) |
| |||||||||
2.70% | 03/15/311 | 30,000 | 25,651 | |||||||
Thermo Fisher Scientific, Inc. |
| |||||||||
5.09% | 08/10/33 | 34,000 | 34,406 | |||||||
Universal Health Services, Inc. |
| |||||||||
1.65% | 09/01/26 | 35,000 | 31,910 | |||||||
Zoetis, Inc. |
| |||||||||
5.60% | 11/16/32 | 20,000 | 20,772 | |||||||
|
| |||||||||
| 1,743,827 | ||||||||||
|
| |||||||||
| Health Care REITs — 0.30% |
| |||||||||
DOC DR LLC |
| |||||||||
2.63% | 11/01/31 | 5,000 | 4,123 | |||||||
4.30% | 03/15/27 | 26,000 | 25,462 | |||||||
Healthcare Reality Holdings LP |
| |||||||||
2.00% | 03/15/31 | 30,000 | 23,874 | |||||||
3.10% | 02/15/30 | 15,000 | 13,047 | |||||||
Healthcare Realty Holdings LP |
| |||||||||
3.88% | 05/01/25 | 4,000 | 3,913 | |||||||
Ventas Realty LP |
| |||||||||
4.13% | 01/15/26 | 10,000 | 9,773 | |||||||
|
| |||||||||
| 80,192 | ||||||||||
|
| |||||||||
| Hotel & Resort REITs — 0.10% |
| |||||||||
Host Hotels & Resorts LP, |
| |||||||||
Series I |
| |||||||||
3.50% | 09/15/30 | 30,000 | 26,695 | |||||||
|
| |||||||||
See accompanying Notes to Financial Statements.
| 113 / Annual Report March 2024 |
Table of Contents
Investment Grade Credit Fund
Schedule of Portfolio Investments
March 31, 2024
| Issues | Maturity Date | Principal Amount | Value | |||||||
| CORPORATES (continued) |
| |||||||||
Industrial REITs — 0.26% |
| |||||||||
LXP Industrial Trust |
| |||||||||
2.38% | 10/01/31 | $ | 25,000 | $ | 20,033 | |||||
2.70% | 09/15/30 | 25,000 | 20,925 | |||||||
Rexford Industrial Realty LP |
| |||||||||
2.13% | 12/01/30 | 5,000 | 4,088 | |||||||
2.15% | 09/01/31 | 30,000 | 24,087 | |||||||
|
| |||||||||
| 69,133 | ||||||||||
|
| |||||||||
| Industrials — 1.78% |
| |||||||||
Amcor Finance USA, Inc. |
| |||||||||
3.63% | 04/28/26 | 25,000 | 24,117 | |||||||
5.63% | 05/26/33 | 15,000 | 15,380 | |||||||
BAE Systems Holdings, Inc. |
| |||||||||
3.80% | 10/07/243 | 15,000 | 14,852 | |||||||
3.85% | 12/15/253 | 10,000 | 9,763 | |||||||
Berry Global, Inc. |
| |||||||||
1.57% | 01/15/26 | 20,000 | 18,730 | |||||||
1.65% | 01/15/27 | 20,000 | 18,169 | |||||||
5.65% | 01/15/343 | 85,000 | 84,634 | |||||||
Boeing Co. (The) |
| |||||||||
4.88% | 05/01/25 | 15,000 | 14,836 | |||||||
General Electric Co. |
| |||||||||
(MTN) |
| |||||||||
(CME Term SOFR 3-Month plus 0.64%) |
| |||||||||
5.91% | 05/05/262 | 10,000 | 10,029 | |||||||
Sealed Air Corp. |
| |||||||||
1.57% | 10/15/263 | 30,000 | 27,129 | |||||||
Smurfit Kappa Treasury ULC |
| |||||||||
(Ireland) |
| |||||||||
5.44% | 04/03/341,3 | 200,000 | 200,401 | |||||||
Sonoco Products Co. |
| |||||||||
3.13% | 05/01/30 | 25,000 | 22,358 | |||||||
Sydney Airport Finance Co. Pty Ltd. |
| |||||||||
(Australia) |
| |||||||||
3.63% | 04/28/261,3 | 15,000 | 14,460 | |||||||
|
| |||||||||
| 474,858 | ||||||||||
|
| |||||||||
| Information Technology — 1.92% |
| |||||||||
Broadcom, Inc. |
| |||||||||
2.60% | 02/15/333 | 50,000 | 40,614 | |||||||
3.42% | 04/15/333 | 20,000 | 17,333 | |||||||
Constellation Software, Inc. |
| |||||||||
(Canada) |
| |||||||||
5.46% | 02/16/341,3 | 100,000 | 100,638 | |||||||
Fiserv, Inc. |
| |||||||||
2.65% | 06/01/30 | 20,000 | 17,429 | |||||||
5.63% | 08/21/33 | 20,000 | 20,448 | |||||||
Micron Technology, Inc. |
| |||||||||
2.70% | 04/15/32 | 15,000 | 12,544 | |||||||
Netflix, Inc. |
| |||||||||
3.63% | 06/15/253 | 20,000 | 19,583 | |||||||
Open Text Corp. |
| |||||||||
(Canada) |
| |||||||||
6.90% | 12/01/271,3 | 72,000 | 74,333 | |||||||
Oracle Corp. |
| |||||||||
2.88% | 03/25/31 | 70,000 | 60,911 | |||||||
| Issues | Maturity Date | Principal Amount | Value | |||||||
| CORPORATES (continued) |
| |||||||||
Information Technology (continued) |
| |||||||||
6.25% | 11/09/32 | $ | 90,000 | $ | 96,375 | |||||
Take-Two Interactive Software, Inc. |
| |||||||||
4.00% | 04/14/32 | 55,000 | 50,833 | |||||||
|
| |||||||||
| 511,041 | ||||||||||
|
| |||||||||
| Insurance — 3.24% |
| |||||||||
Aon Corp. |
| |||||||||
2.80% | 05/15/30 | 40,000 | 35,291 | |||||||
Aon Corp./Aon Global Holdings PLC |
| |||||||||
2.60% | 12/02/31 | 60,000 | 50,594 | |||||||
Athene Global Funding |
| |||||||||
1.61% | 06/29/263 | 5,000 | 4,590 | |||||||
(SOFR Index plus 0.70%) |
| |||||||||
6.06% | 05/24/242,3 | 30,000 | 30,034 | |||||||
Brown & Brown, Inc. |
| |||||||||
4.20% | 03/17/32 | 30,000 | 27,755 | |||||||
Equitable Financial Life Global Funding |
| |||||||||
1.30% | 07/12/263 | 25,000 | 22,709 | |||||||
Farmers Exchange Capital |
| |||||||||
7.05% | 07/15/283 | 5,000 | 5,054 | |||||||
Farmers Insurance Exchange |
| |||||||||
4.75% | 11/01/573,5 | 65,000 | 48,257 | |||||||
Marsh & McLennan Cos., Inc. |
| |||||||||
2.25% | 11/15/30 | 30,000 | 25,530 | |||||||
Metropolitan Life Global Funding I |
| |||||||||
2.95% | 04/09/303 | 220,000 | 195,375 | |||||||
MMI Capital Trust I, |
| |||||||||
Series B |
| |||||||||
7.63% | 12/15/27 | 50,000 | 52,768 | |||||||
Nationwide Mutual Insurance Co. |
| |||||||||
7.88% | 12/15/243,5 | 50,000 | 50,005 | |||||||
New York Life Global Funding |
| |||||||||
5.00% | 01/09/343 | 160,000 | 158,377 | |||||||
New York Life Insurance Co. |
| |||||||||
5.88% | 05/15/333 | 65,000 | 67,683 | |||||||
Progressive Corp. (The) |
| |||||||||
3.20% | 03/26/30 | 10,000 | 9,142 | |||||||
Teachers Insurance & Annuity Association of America |
| |||||||||
4.38% | 09/15/543,5 | 55,000 | 54,125 | |||||||
Willis North America, Inc. |
| |||||||||
5.35% | 05/15/33 | 25,000 | 24,896 | |||||||
|
| |||||||||
| 862,185 | ||||||||||
|
| |||||||||
| Materials — 0.48% |
| |||||||||
Georgia-Pacific LLC |
| |||||||||
2.30% | 04/30/303 | 20,000 | 17,209 | |||||||
International Flavors & Fragrances, Inc. |
| |||||||||
1.83% | 10/15/273 | 20,000 | 17,751 | |||||||
2.30% | 11/01/303 | 95,000 | 78,960 | |||||||
3.27% | 11/15/403 | 20,000 | 14,253 | |||||||
|
| |||||||||
| 128,173 | ||||||||||
|
| |||||||||
| Office REITs — 0.31% |
| |||||||||
Hudson Pacific Properties LP |
| |||||||||
3.95% | 11/01/27 | 25,000 | 22,171 | |||||||
Kilroy Realty LP |
| |||||||||
2.50% | 11/15/32 | 40,000 | 30,152 | |||||||
See accompanying Notes to Financial Statements.
| Annual Report March 2024 / 114 |
Table of Contents
Investment Grade Credit Fund
Schedule of Portfolio Investments
March 31, 2024
| Issues | Maturity Date | Principal Amount | Value | |||||||
| CORPORATES (continued) |
| |||||||||
Office REITs (continued) |
| |||||||||
3.05% | 02/15/30 | $ | 5,000 | $ | 4,260 | |||||
Piedmont Operating Partnership LP |
| |||||||||
2.75% | 04/01/32 | 35,000 | 25,327 | |||||||
|
| |||||||||
| 81,910 | ||||||||||
|
| |||||||||
| Residential REITs — 0.74% |
| |||||||||
American Homes 4 Rent LP |
| |||||||||
2.38% | 07/15/31 | 30,000 | 24,399 | |||||||
Essex Portfolio LP |
| |||||||||
2.65% | 03/15/32 | 10,000 | 8,279 | |||||||
5.50% | 04/01/34 | 70,000 | 70,072 | |||||||
Invitation Homes Operating Partnership LP |
| |||||||||
5.50% | 08/15/33 | 70,000 | 69,768 | |||||||
Mid-America Apartments LP |
| |||||||||
1.70% | 02/15/31 | 20,000 | 16,140 | |||||||
UDR, Inc. |
| |||||||||
(MTN) |
| |||||||||
4.40% | 01/26/29 | 10,000 | 9,658 | |||||||
|
| |||||||||
| 198,316 | ||||||||||
|
| |||||||||
| Retail — 0.07% |
| |||||||||
Starbucks Corp. |
| |||||||||
2.55% | 11/15/30 | 20,000 | 17,359 | |||||||
|
| |||||||||
| Services — 0.55% |
| |||||||||
Global Payments, Inc. |
| |||||||||
5.30% | 08/15/29 | 60,000 | 59,809 | |||||||
5.95% | 08/15/52 | 10,000 | 10,000 | |||||||
Moody’s Corp. |
| |||||||||
4.25% | 08/08/32 | 20,000 | 19,046 | |||||||
Northwestern University |
| |||||||||
3.69% | 12/01/38 | 20,000 | 17,910 | |||||||
RELX Capital, Inc. |
| |||||||||
3.00% | 05/22/30 | 20,000 | 17,978 | |||||||
Republic Services, Inc. |
| |||||||||
2.90% | 07/01/26 | 5,000 | 4,793 | |||||||
S&P Global, Inc. |
| |||||||||
2.90% | 03/01/32 | 10,000 | 8,717 | |||||||
Worldline SA |
| |||||||||
(France) |
| |||||||||
0.00% | 07/30/251,7 | 75 | 8,964 | |||||||
|
| |||||||||
| 147,217 | ||||||||||
|
| |||||||||
| Specialized REITs — 0.33% |
| |||||||||
CubeSmart LP |
| |||||||||
4.38% | 02/15/29 | 15,000 | 14,405 | |||||||
Extra Space Storage LP |
| |||||||||
2.20% | 10/15/30 | 40,000 | 33,183 | |||||||
NNN REIT, Inc. |
| |||||||||
5.60% | 10/15/33 | 40,000 | 40,541 | |||||||
|
| |||||||||
| 88,129 | ||||||||||
|
| |||||||||
| Transportation — 0.47% |
| |||||||||
Delta Air Lines Pass-Through Trust, |
| |||||||||
Series 2020-1, Class AA |
| |||||||||
2.00% | 06/10/28 | 19,768 | 17,878 | |||||||
| Issues | Maturity Date | Principal Amount | Value | |||||||
| CORPORATES (continued) |
| |||||||||
Transportation (continued) |
| |||||||||
JetBlue Airways Pass-Through Trust, |
| |||||||||
Series 2019-1, Class AA |
| |||||||||
2.75% | 05/15/32 | $ | 26,965 | $ | 23,136 | |||||
Norfolk Southern Corp. |
| |||||||||
3.00% | 03/15/32 | 15,000 | 13,046 | |||||||
Union Pacific Corp. |
| |||||||||
2.89% | 04/06/36 | 20,000 | 16,322 | |||||||
United Airlines Pass-Through Trust, |
| |||||||||
Series 2023-1, Class A |
| |||||||||
5.80% | 01/15/36 | 55,000 | 55,837 | |||||||
|
| |||||||||
| 126,219 | ||||||||||
|
| |||||||||
| Total Corporates |
| |||||||||
(Cost $12,301,468) |
| 11,989,888 | ||||||||
|
| |||||||||
| MORTGAGE-BACKED — 25.74%** |
| |||||||||
| Non-Agency Commercial Mortgage-Backed — 6.68% |
| |||||||||
1211 Avenue of the Americas Trust, |
| |||||||||
Series 2015-1211, Class A1A2 |
| |||||||||
3.90% | 08/10/353 | 36,000 | 34,704 | |||||||
BPR Trust, |
| |||||||||
Series 2022-OANA, Class A |
| |||||||||
(CME Term SOFR 1-Month plus 1.90%) |
| |||||||||
7.22% | 04/15/372,3 | 50,000 | 50,241 | |||||||
BX Trust, |
| |||||||||
Series 2019-OC11, Class C |
| |||||||||
3.86% | 12/09/413 | 79,000 | 70,301 | |||||||
BX Trust, |
| |||||||||
Series 2021-LBA, Class DV |
| |||||||||
(CME Term SOFR 1-Month plus 1.71%) |
| |||||||||
7.04% | 02/15/362,3 | 33,214 | 32,739 | |||||||
BX Trust, |
| |||||||||
Series 2021- VIEW, Class A |
| |||||||||
(CME Term SOFR 1-Month plus 1.39%) |
| |||||||||
6.72% | 06/15/362,3 | 50,000 | 48,593 | |||||||
BX Trust, |
| |||||||||
Series 2023-DELC, Class B |
| |||||||||
(CME Term SOFR 1-Month plus 3.34%) |
| |||||||||
8.66% | 05/15/382,3 | 32,000 | 32,298 | |||||||
CAMB Commercial Mortgage Trust, |
| |||||||||
Series 2019- LIFE, Class B |
| |||||||||
(CME Term SOFR 1-Month plus 1.55%) |
| |||||||||
6.87% | 12/15/372,3 | 67,000 | 67,021 | |||||||
CAMB Commercial Mortgage Trust, |
| |||||||||
Series 2019- LIFE, Class D |
| |||||||||
(CME Term SOFR 1-Month plus 2.05%) |
| |||||||||
7.37% | 12/15/372,3 | 33,000 | 33,046 | |||||||
Citigroup Commercial Mortgage Trust, |
| |||||||||
Series 2014-GC25, Class XA (IO) |
| |||||||||
0.94% | 10/10/475 | 542,371 | 1,411 | |||||||
Citigroup Commercial Mortgage Trust, |
| |||||||||
Series 2020-555, Class A |
| |||||||||
2.65% | 12/10/413 | 100,000 | 85,247 | |||||||
Commercial Mortgage Trust, |
| |||||||||
Series 2014-CR19, Class XA (IO) |
| |||||||||
0.79% | 08/10/475 | 442,972 | 606 | |||||||
See accompanying Notes to Financial Statements.
| 115 / Annual Report March 2024 |
Table of Contents
Investment Grade Credit Fund
Schedule of Portfolio Investments
March 31, 2024
| Issues | Maturity Date | Principal Amount | Value | |||||||
| MORTGAGE-BACKED (continued) |
| |||||||||
Non-Agency Commercial Mortgage-Backed (continued) |
| |||||||||
Commercial Mortgage Trust, |
| |||||||||
Series 2014-UBS3, Class XA (IO) |
| |||||||||
0.99% | 06/10/475 | $ | 1,047,015 | $ | 92 | |||||
Commercial Mortgage Trust, |
| |||||||||
Series 2014-UBS5, Class XA (IO) |
| |||||||||
0.78% | 09/10/474,5,6 | 1,714,977 | 1,695 | |||||||
Commercial Mortgage Trust, |
| |||||||||
Series 2016-787S, Class A |
| |||||||||
3.55% | 02/10/363 | 35,000 | 33,074 | |||||||
Credit Suisse Mortgage Capital Trust, |
| |||||||||
Series 2021-B33, Class A2 |
| |||||||||
3.17% | 10/10/433 | 100,000 | 84,339 | |||||||
CSAIL Commercial Mortgage Trust, |
| |||||||||
Series 2015-C4, Class AS |
| |||||||||
4.17% | 11/15/485 | 50,000 | 48,192 | |||||||
CSAIL Commercial Mortgage Trust, |
| |||||||||
Series 2019-C18, Class A2 |
| |||||||||
2.84% | 12/15/52 | 39,467 | 38,575 | |||||||
Great Wolf Trust, |
| |||||||||
Series 2019-WOLF, Class C |
| |||||||||
(CME Term SOFR 1-Month plus 1.95%) |
| |||||||||
7.27% | 12/15/362,3 | 76,765 | 76,461 | |||||||
GS Mortgage Securities Corp. Trust, |
| |||||||||
Series 2020-UPTN, Class XA (IO) |
| |||||||||
0.35% | 02/10/373,5 | 375,000 | 727 | |||||||
GS Mortgage Securities Corp. Trust, |
| |||||||||
Series 2023-FUN, Class B |
| |||||||||
(CME Term SOFR 1-Month plus 2.79%) |
| |||||||||
8.12% | 03/15/282,3 | 100,000 | 100,509 | |||||||
GS Mortgage Securities Trust, |
| |||||||||
Series 2010-C1, Class X (IO) |
| |||||||||
0.44% | 08/10/433,5 | 2,381,297 | 2,054 | |||||||
GS Mortgage Securities Trust, |
| |||||||||
Series 2011-GC5, Class XA (IO) |
| |||||||||
0.09% | 08/10/443,5 | 175,125 | 1 | |||||||
GS Mortgage Securities Trust, |
| |||||||||
Series 2014-GC20, Class XA (IO) |
| |||||||||
0.79% | 04/10/475 | 89,395 | 48 | |||||||
Houston Galleria Mall Trust, |
| |||||||||
Series 2015-HGLR, Class A1A2 |
| |||||||||
3.09% | 03/05/373 | 50,000 | 48,460 | |||||||
JPMBB Commercial Mortgage Securities Trust, |
| |||||||||
Series 2014-C22, Class XA (IO) |
| |||||||||
0.77% | 09/15/475 | 1,480,248 | 4,250 | |||||||
JPMBB Commercial Mortgage Securities Trust, |
| |||||||||
Series 2014-C25, Class XA (IO) |
| |||||||||
0.79% | 11/15/475 | 1,345,043 | 2,542 | |||||||
JPMorgan Chase Commercial Mortgage Securities Trust, |
| |||||||||
Series 2010-C2, Class XB (IO) |
| |||||||||
1.30% | 11/15/433,5 | 425,656 | 2,726 | |||||||
JPMorgan Chase Commercial Mortgage Securities Trust, |
| |||||||||
Series 2016-NINE, Class A |
| |||||||||
2.85% | 09/06/383,5 | 70,000 | 65,531 | |||||||
| Issues | Maturity Date | Principal Amount | Value | |||||||
| MORTGAGE-BACKED (continued) |
| |||||||||
Non-Agency Commercial Mortgage-Backed (continued) |
| |||||||||
JPMorgan Chase Commercial Mortgage Securities Trust, |
| |||||||||
Series 2022-ACB, Class A |
| |||||||||
(SOFR30A plus 1.40%) |
| |||||||||
6.72% | 03/15/392,3 | $ | 100,000 | $ | 99,361 | |||||
Manhattan West Mortgage Trust, |
| |||||||||
Series 2020-1MW, Class B |
| |||||||||
2.33% | 09/10/393,5 | 100,000 | 88,236 | |||||||
Med Trust, |
| |||||||||
Series 2021-MDLN, Class D |
| |||||||||
(CME Term SOFR 1-Month plus 2.11%) |
| |||||||||
7.44% | 11/15/382,3 | 84,594 | 84,390 | |||||||
MHC Commercial Mortgage Trust, |
| |||||||||
Series 2021-MHC, Class B |
| |||||||||
(CME Term SOFR 1-Month plus 1.22%) |
| |||||||||
6.54% | 04/15/382,3 | 37,749 | 37,526 | |||||||
Morgan Stanley Bank of America Merrill Lynch Trust, |
| |||||||||
Series 2014-C19, Class XA (IO) |
| |||||||||
0.95% | 12/15/475 | 1,558,332 | 2,410 | |||||||
Morgan Stanley Bank of America Merrill Lynch Trust, |
| |||||||||
Series 2015-C22, Class XA (IO) |
| |||||||||
0.99% | 04/15/485 | 628,093 | 3,192 | |||||||
SCOTT Trust, |
| |||||||||
Series 2023-SFS, Class A |
| |||||||||
5.91% | 03/15/403 | 110,000 | 110,766 | |||||||
SMRT, |
| |||||||||
Series 2022-MINI, Class B |
| |||||||||
(CME Term SOFR 1-Month plus 1.35%) |
| |||||||||
6.68% | 01/15/392,3 | 33,000 | 32,547 | |||||||
SREIT Trust, |
| |||||||||
Series 2021-MFP, Class B |
| |||||||||
(CME Term SOFR 1-Month plus 1.19%) |
| |||||||||
6.52% | 11/15/382,3 | 47,843 | 47,548 | |||||||
SREIT Trust, |
| |||||||||
Series 2021-MFP2, Class C |
| |||||||||
(CME Term SOFR 1-Month plus 1.49%) |
| |||||||||
6.81% | 11/15/362,3 | 100,000 | 99,276 | |||||||
SREIT Trust, |
| |||||||||
Series 2021-PALM, Class C |
| |||||||||
(CME Term SOFR 1-Month plus 1.07%) |
| |||||||||
6.40% | 10/15/342,3 | 50,000 | 49,138 | |||||||
UBS-Barclays Commercial Mortgage Trust, |
| |||||||||
Series 2012-C3, Class XB (IO) |
| |||||||||
0.01% | 08/10/493,4,5,6 | 245,012 | 43 | |||||||
Wells Fargo Commercial Mortgage Trust, |
| |||||||||
Series 2014-LC16, Class XA (IO) |
| |||||||||
0.97% | 08/15/505 | 118,100 | 88 | |||||||
Wells Fargo Commercial Mortgage Trust, |
| |||||||||
Series 2014-LC18, Class XA (IO) |
| |||||||||
1.01% | 12/15/475 | 4,002,689 | 16,624 | |||||||
Wells Fargo Commercial Mortgage Trust, |
| |||||||||
Series 2015-NXS2, Class XA (IO) |
| |||||||||
0.58% | 07/15/585 | 1,988,007 | 11,161 | |||||||
Wells Fargo Commercial Mortgage Trust, |
| |||||||||
Series 2016-LC25, Class AS |
| |||||||||
3.86% | 12/15/595 | 52,000 | 49,421 | |||||||
See accompanying Notes to Financial Statements.
| Annual Report March 2024 / 116 |
Table of Contents
Investment Grade Credit Fund
Schedule of Portfolio Investments
March 31, 2024
| Issues | Maturity Date | Principal Amount | Value | |||||||||
| MORTGAGE-BACKED (continued) |
| |||||||||||
| Non-Agency Commercial Mortgage-Backed (continued) |
| |||||||||||
WMRK Commercial Mortgage Trust, |
| |||||||||||
Series 2022-WMRK, Class A |
| |||||||||||
(CME Term SOFR 1-Month plus 2.79%) |
| |||||||||||
8.11% | 11/15/272,3 | $ | 80,000 | $ | 80,363 | |||||||
|
| |||||||||||
| 1,777,573 | ||||||||||||
|
| |||||||||||
| Non-Agency Mortgage-Backed — 5.67% |
| |||||||||||
| Ameriquest Mortgage Securities, Inc., Asset-Backed Pass-Through Certificates, |
| |||||||||||
Series 2005-R11, Class M3 |
| |||||||||||
(CME Term SOFR 1-Month plus 0.86%) |
| |||||||||||
6.19% | 01/25/362 | 95,736 | 92,754 | |||||||||
Asset-Backed Funding Certificates, |
| |||||||||||
Series 2006-OPT1, Class A3D |
| |||||||||||
(CME Term SOFR 1-Month plus 0.59%) |
| |||||||||||
5.92% | 09/25/362 | 55,000 | 53,413 | |||||||||
Banc of America Funding Trust, |
| |||||||||||
Series 2014-R7, Class 2A1 |
| |||||||||||
(CME Term SOFR 1-Month plus 0.25%) |
| |||||||||||
5.58% | 09/26/362,3 | 1,810 | 1,813 | |||||||||
Bear Stearns ARM Trust, |
| |||||||||||
Series 2004-1, Class 12A5 |
| |||||||||||
5.01% | 04/25/345 | 5,471 | 4,786 | |||||||||
Bombardier Capital Mortgage Securitization Corp., |
| |||||||||||
Series 2000-A, Class A2 |
| |||||||||||
7.58% | 06/15/305 | 19,426 | 2,114 | |||||||||
Carrington Mortgage Loan Trust, |
| |||||||||||
Series 2006-FRE1, Class A3 |
| |||||||||||
(CME Term SOFR 1-Month plus 0.26%) |
| |||||||||||
5.59% | 04/25/362 | 74,671 | 72,299 | |||||||||
Carrington Mortgage Loan Trust, |
| |||||||||||
Series 2007-HE1, Class A4 |
| |||||||||||
(CME Term SOFR 1-Month plus 0.40%) |
| |||||||||||
5.73% | 06/25/372 | 85,000 | 79,002 | |||||||||
CIM Trust, |
| |||||||||||
Series 2021-R4, Class A1A |
| |||||||||||
2.00% | 05/01/613,5 | 55,928 | 48,983 | |||||||||
Citigroup Mortgage Loan Trust, Inc., |
| |||||||||||
Series 2005-OPT1, Class M1 |
| |||||||||||
(CME Term SOFR 1-Month plus 0.74%) |
| |||||||||||
6.07% | 02/25/352 | 34,501 | 31,694 | |||||||||
Countrywide Asset-Backed Certificates Trust, |
| |||||||||||
Series 2007-13, Class 2A1 |
| |||||||||||
(CME Term SOFR 1-Month plus 1.01%) |
| |||||||||||
6.34% | 10/25/472 | 17,108 | 15,459 | |||||||||
Fannie Mae Connecticut Avenue Securities, |
| |||||||||||
Series 2022-R01, Class 1M2 |
| |||||||||||
(SOFR30A plus 1.90%) |
| |||||||||||
7.22% | 12/25/412,3 | 50,000 | 50,410 | |||||||||
Fannie Mae Connecticut Avenue Securities, |
| |||||||||||
Series 2024-R01, Class 1M2 |
| |||||||||||
(SOFR30A plus 1.80%) |
| |||||||||||
7.12% | 01/25/442,3 | 50,000 | 50,276 | |||||||||
| Issues | Maturity Date | Principal Amount | Value | |||||||
| MORTGAGE-BACKED (continued) |
| |||||||||
| Non-Agency Mortgage-Backed (continued) |
| |||||||||
Freddie Mac Structured Agency Credit Risk Debt Notes, |
| |||||||||
Series 2021-DNA6, Class M2 |
| |||||||||
(SOFR30A plus 1.50%) |
| |||||||||
6.82% | 10/25/412,3 | $ | 50,000 | $ | 50,113 | |||||
GCAT Trust, |
| |||||||||
Series 2023-INV1, Class A7 |
| |||||||||
6.00% | 08/25/533,5 | 91,987 | 91,963 | |||||||
GSR Mortgage Loan Trust, |
| |||||||||
Series 2005-AR6, Class 2A1 |
| |||||||||
5.06% | 09/25/355 | 7,994 | 7,455 | |||||||
Home Equity Asset Trust, |
| |||||||||
Series 2005-4, Class M6 |
| |||||||||
(CME Term SOFR 1-Month plus 1.19%) |
| |||||||||
4.95% | 10/25/352 | 80,000 | 80,272 | |||||||
HSI Asset Securitization Corp. Trust, |
| |||||||||
Series 2007-WF1, Class 1A1 |
| |||||||||
(CME Term SOFR 1-Month plus 0.43%) |
| |||||||||
5.76% | 05/25/372 | 2,855 | 2,850 | |||||||
Impac CMB Trust, |
| |||||||||
Series 2007-A, Class A |
| |||||||||
(CME Term SOFR 1-Month plus 0.61%) |
| |||||||||
5.94% | 05/25/372,3 | 74,424 | 72,199 | |||||||
IndyMac Index Mortgage Loan Trust, |
| |||||||||
Series 2007-FLX3, Class A1 |
| |||||||||
(CME Term SOFR 1-Month plus 0.59%) |
| |||||||||
5.92% | 06/25/372 | 117,674 | 103,834 | |||||||
Long Beach Mortgage Loan Trust, |
| |||||||||
Series 2006-1, Class 1A |
| |||||||||
(CME Term SOFR 1-Month plus 0.55%) |
| |||||||||
5.88% | 02/25/362 | 2,985 | 2,904 | |||||||
MFATrust, |
| |||||||||
Series 2021-INV1, Class A3 |
| |||||||||
1.26% | 01/25/563,5 | 94,881 | 88,103 | |||||||
Morgan Stanley Mortgage Loan Trust, |
| |||||||||
Series 2004-5AR, Class 3A1 |
| |||||||||
5.57% | 07/25/345 | 8,456 | 8,256 | |||||||
New Residential Mortgage Loan Trust, |
| |||||||||
Series 2022-NQM4, Class A1 (STEP-reset date 05/25/24) |
| |||||||||
5.00% | 06/25/623 | 86,077 | 86,923 | |||||||
OBX Trust, |
| |||||||||
Series 2024-HYB1, Class A1 |
| |||||||||
3.53% | 03/25/533,5 | 83,194 | 79,066 | |||||||
Saxon Asset Securities Trust, |
| |||||||||
Series 2007-2, Class A2A |
| |||||||||
(CME Term SOFR 1-Month plus 0.21%) |
| |||||||||
5.54% | 05/25/472 | 61,028 | 42,116 | |||||||
Structured Asset Mortgage Investments II Trust, |
| |||||||||
Series 2004-AR1, Class 1A2 |
| |||||||||
(CME Term SOFR 1-Month plus 0.81%) |
| |||||||||
6.14% | 03/19/342 | 1,107 | 1,046 | |||||||
Structured Asset Securities Corp. Mortgage Loan Trust, |
| |||||||||
Series 2006-BC6, Class A1 |
| |||||||||
(CME Term SOFR 1-Month plus 0.27%) |
| |||||||||
5.60% | 01/25/372 | 112,292 | 105,675 | |||||||
See accompanying Notes to Financial Statements.
| 117 / Annual Report March 2024 |
Table of Contents
Investment Grade Credit Fund
Schedule of Portfolio Investments
March 31, 2024
| Issues | Maturity Date | Principal Amount | Value | |||||||||
| MORTGAGE-BACKED (continued) |
| |||||||||||
| Non-Agency Mortgage-Backed (continued) |
| |||||||||||
Structured Asset Securities Corp., |
| |||||||||||
Series 2005-WF1, Class M4 |
| |||||||||||
(CME Term SOFR 1-Month plus 1.24%) |
| |||||||||||
6.57% | 02/25/352 | $ | 66,010 | $ | 64,813 | |||||||
Verus Securitization Trust, |
| |||||||||||
Series 2023-4, Class A1 (STEP-reset date 05/25/24) |
| |||||||||||
5.81% | 05/25/683 | 108,331 | 107,695 | |||||||||
| Wells Fargo Home Equity Trust Mortgage Pass-Through Certificates, |
| |||||||||||
Series 2004-1, Class 2A1 |
| |||||||||||
(CME Term SOFR 1-Month plus 0.71%) |
| |||||||||||
6.04% | 04/25/342 | 9,712 | 9,404 | |||||||||
|
| |||||||||||
| 1,507,690 | ||||||||||||
|
| |||||||||||
| U.S. Agency Commercial Mortgage-Backed — 0.09% |
| |||||||||||
Fannie Mae-Aces, |
| |||||||||||
Series 2016-M2, Class X3 (IO) |
| |||||||||||
2.04% | 04/25/365 | 42,760 | 380 | |||||||||
Fannie Mae-Aces, |
| |||||||||||
Series 2016-M4, Class X2 (IO) |
| |||||||||||
2.68% | 01/25/395 | 281,455 | 1,526 | |||||||||
Freddie Mac Multifamily Structured Pass-Through |
| |||||||||||
Certificates, |
| |||||||||||
Series K049, Class X3 (IO) |
| |||||||||||
1.55% | 10/25/435 | 250,000 | 4,673 | |||||||||
Ginnie Mae, |
| |||||||||||
Series 2012-112, Class IO (IO) |
| |||||||||||
0.11% | 02/16/535 | 1,704,599 | 3,359 | |||||||||
Ginnie Mae, |
| |||||||||||
Series 2013-1, Class IO (IO) |
| |||||||||||
0.58% | 02/16/545 | 457,085 | 5,223 | |||||||||
Ginnie Mae, |
| |||||||||||
Series 2013-125, Class IO (IO) |
| |||||||||||
0.23% | 10/16/545 | 658,528 | 8,733 | |||||||||
|
| |||||||||||
| 23,894 | ||||||||||||
|
| |||||||||||
| U.S. Agency Mortgage-Backed — 13.30% |
| |||||||||||
Fannie Mae Pool BW9897 |
| |||||||||||
4.50% | 10/01/52 | 22,839 | 21,764 | |||||||||
Fannie Mae REMICS, |
| |||||||||||
Series 2011-116, Class SA (IO) |
| |||||||||||
(-1.00 X SOFR30A plus 5.89%, 6.00% Cap) |
| |||||||||||
0.57% | 11/25/412 | 44,822 | 3,412 | |||||||||
Fannie Mae REMICS, |
| |||||||||||
Series 2012-128, Class UA |
| |||||||||||
2.50% | 06/25/42 | 18,228 | 16,082 | |||||||||
Fannie Mae REMICS, |
| |||||||||||
Series 2013-5, Class GF |
| |||||||||||
(SOFR30A plus 1.21%) |
| |||||||||||
5.00% | 10/25/422 | 27,673 | 26,738 | |||||||||
Freddie Mac Pool SD8189 |
| |||||||||||
2.50% | 01/01/52 | 43,104 | 35,692 | |||||||||
Freddie Mac Pool SD8199 |
| |||||||||||
2.00% | 03/01/52 | 45,018 | 35,651 | |||||||||
| Issues | Maturity Date | Principal Amount | Value | |||||||||
| MORTGAGE-BACKED (continued) |
| |||||||||||
| U.S. Agency Mortgage-Backed (continued) |
| |||||||||||
Freddie Mac REMICS, |
| |||||||||||
Series 4064, Class TB |
| |||||||||||
3.50% | 06/15/42 | $ | 98,618 | $ | 91,579 | |||||||
Freddie Mac Strips, |
| |||||||||||
Series 240, Class IO (IO) |
| |||||||||||
5.50% | 07/15/36 | 124,296 | 24,547 | |||||||||
Ginnie Mae (TBA) |
| |||||||||||
4.50% | 04/20/54 | 375,000 | 360,421 | |||||||||
5.00% | 04/20/54 | 300,000 | 294,893 | |||||||||
5.50% | 04/20/54 | 100,000 | 99,929 | |||||||||
Ginnie Mae, |
| |||||||||||
Series 2003-110, Class S (IO) |
| |||||||||||
(-1.00 X CME Term SOFR 1-Month plus 6.49%, 6.60% Cap) |
| |||||||||||
1.16% | 10/20/332 | 148,784 | 9,555 | |||||||||
Ginnie Mae, |
| |||||||||||
Series 2018-124, Class NW |
| |||||||||||
3.50% | 09/20/48 | 20,254 | 18,099 | |||||||||
Ginnie Mae, |
| |||||||||||
Series 2018-154, Class BP |
| |||||||||||
3.50% | 11/20/48 | 2,100 | 1,944 | |||||||||
Ginnie Mae, |
| |||||||||||
Series 2019-15, Class GT |
| |||||||||||
3.50% | 02/20/49 | 17,319 | 15,695 | |||||||||
Ginnie Mae, |
| |||||||||||
Series 2023-113, Class FD |
| |||||||||||
(SOFR30A plus 1.35%) |
| |||||||||||
6.50% | 08/20/532 | 47,943 | 48,044 | |||||||||
Ginnie Mae, |
| |||||||||||
Series 2023-116, Class FL |
| |||||||||||
(SOFR30A plus 1.15%) |
| |||||||||||
6.47% | 08/20/532 | 48,615 | 48,849 | |||||||||
UMBS (TBA) |
| |||||||||||
2.00% | 04/01/54 | 225,000 | 178,219 | |||||||||
2.50% | 04/01/54 | 250,000 | 206,840 | |||||||||
3.00% | 04/01/54 | 300,000 | 258,309 | |||||||||
3.50% | 04/01/54 | 275,000 | 246,270 | |||||||||
4.00% | 04/01/54 | 500,000 | 463,164 | |||||||||
4.50% | 04/01/54 | 700,000 | 666,778 | |||||||||
5.00% | 04/01/54 | 250,000 | 243,955 | |||||||||
5.50% | 04/01/54 | 125,000 | 124,392 | |||||||||
|
| |||||||||||
| 3,540,821 | ||||||||||||
|
| |||||||||||
| Total Mortgage-Backed |
| |||||||||||
(Cost $7,807,957) |
| 6,849,978 | ||||||||||
|
| |||||||||||
| MUNICIPAL BONDS — 1.50%* |
| |||||||||||
| California — 0.13% |
| |||||||||||
| San Francisco City & County Airport Commercial-San Francisco International Airport Revenue Bonds, Series C |
| |||||||||||
3.05% | 05/01/34 | 20,000 | 17,181 | |||||||||
| Santa Monica Community College District General Obligation Bonds |
| |||||||||||
2.05% | 08/01/33 | 20,000 | 16,237 | |||||||||
|
| |||||||||||
| 33,418 | ||||||||||||
|
| |||||||||||
See accompanying Notes to Financial Statements.
| Annual Report March 2024 / 118 |
Table of Contents
Investment Grade Credit Fund
Schedule of Portfolio Investments
March 31, 2024
| Issues | Maturity Date | Principal Amount | Value | |||||||||
| MUNICIPAL BONDS (continued) |
| |||||||||||
Florida — 0.05% |
| |||||||||||
| County of Miami-Dade Aviation Revenue Bonds, Airport and Marina Improvements, Series D |
| |||||||||||
3.50% | 10/01/31 | $ | 15,000 | $ | 13,749 | |||||||
|
| |||||||||||
Maryland — 0.04% |
| |||||||||||
| City of Baltimore Revenue Bonds, Series B |
| |||||||||||
2.13% | 07/01/33 | 15,000 | 11,955 | |||||||||
|
| |||||||||||
Massachusetts — 0.11% |
| |||||||||||
| Commonwealth of Massachusetts Revenue Bonds, Series B |
| |||||||||||
4.11% | 07/15/31 | 16,486 | 16,112 | |||||||||
| Massachusetts School Building Authority Revenue Bonds, Series B |
| |||||||||||
2.97% | 10/15/32 | 15,000 | 13,299 | |||||||||
|
| |||||||||||
| 29,411 | ||||||||||||
|
| |||||||||||
Michigan — 0.09% |
| |||||||||||
| University of Michigan Revenue Bonds, Series C |
| |||||||||||
3.44% | 04/01/31 | 25,000 | 23,665 | |||||||||
|
| |||||||||||
New York — 1.08% |
| |||||||||||
| New York City Transitional Finance Authority Future Tax Secured Revenue Bonds, Public Improvements |
| |||||||||||
3.73% | 08/01/29 | 5,000 | 4,801 | |||||||||
| New York City Transitional Finance Authority Future Tax Secured Revenue Bonds, Public Improvements, Series D |
| |||||||||||
2.50% | 11/01/33 | 50,000 | 41,127 | |||||||||
| New York City Transitional Finance Authority Future Tax Secured Revenue Bonds, Public Improvements, Series E |
| |||||||||||
1.97% | 02/01/33 | 100,000 | 79,514 | |||||||||
| New York State Dormitory Authority Revenue Bonds, Series C |
| |||||||||||
1.95% | 03/15/29 | 75,000 | 66,077 | |||||||||
| New York State Dormitory Authority Revenue Bonds, University & College Improvements |
| |||||||||||
5.29% | 03/15/33 | 50,000 | 50,343 | |||||||||
| New York State Urban Development Corp. Revenue Bonds, Economic Improvements, Series B |
| |||||||||||
2.97% | 03/15/34 | 15,000 | 12,986 | |||||||||
| New York State Urban Development Corp. Revenue Bonds, Economic Improvements, Series F |
| |||||||||||
2.00% | 03/15/33 | 15,000 | 12,092 | |||||||||
| New York State Urban Development Corp. Revenue Bonds, Transit Improvements, Series B |
| |||||||||||
2.59% | 03/15/35 | 25,000 | 20,963 | |||||||||
|
| |||||||||||
| 287,903 | ||||||||||||
|
| |||||||||||
| Total Municipal Bonds |
| |||||||||||
(Cost $472,019) |
| 400,101 | ||||||||||
|
| |||||||||||
| U.S. TREASURY SECURITIES — 27.74% |
| |||||||||||
U.S. Treasury Notes — 27.74% |
| |||||||||||
| U.S. Treasury Notes |
| |||||||||||
4.25% | 03/15/27 | 485,000 | 482,859 | |||||||||
4.50% | 03/31/26 | 3,160,000 | 3,152,840 | |||||||||
| U.S. Treasury Notes (WI) |
| |||||||||||
4.00% | 02/15/34 | 300,000 | 295,148 | |||||||||
| Issues | Maturity Date | Principal Amount | Value | |||||||||
| U.S. TREASURY SECURITIES (continued) |
| |||||||||||
| U.S. Treasury Notes (continued) |
| |||||||||||
4.25% | 02/28/29 | $ | 927,000 | $ | 928,593 | |||||||
4.25% | 03/31/29 | 2,535,000 | 2,524,923 | |||||||||
|
| |||||||||||
| Total U.S. Treasury Securities |
| |||||||||||
(Cost $7,385,584) |
| 7,384,363 | ||||||||||
|
| |||||||||||
| Total Bonds — 104.96% |
| |||||||||||
(Cost $29,284,797) |
| 27,940,089 | ||||||||||
|
| |||||||||||
| Issues | Maturity Date | Principal Amount/Shares | Value | |||||||||
| SHORT-TERM INVESTMENTS — 9.25% |
| |||||||||||
| Money Market Funds — 9.25% |
| |||||||||||
| Dreyfus Government Cash Management Fund |
| |||||||||||
5.20%8 | 700,000 | 700,000 | ||||||||||
| Fidelity Investments Money Market Funds - Government Portfolio |
| |||||||||||
5.21%8 | 19,979 | 19,979 | ||||||||||
| JPMorgan U.S. Government Money Market Fund |
| |||||||||||
5.16%8 | 991,000 | 991,000 | ||||||||||
| Morgan Stanley Institutional Liquidity Funds - Government Portfolio |
| |||||||||||
5.22%8 | 751,000 | 751,000 | ||||||||||
|
| |||||||||||
| Total Short-Term Investments |
| |||||||||||
(Cost $2,461,979) |
| 2,461,979 | ||||||||||
|
| |||||||||||
| Total Investments - 114.21% |
| |||||||||||
(Cost $31,746,776) |
| 30,402,068 | ||||||||||
|
| |||||||||||
| Liabilities in Excess of Other Assets - (14.21)% |
| (3,783,247 | ) | |||||||||
|
| |||||||||||
| Net Assets - 100.00% |
| $ | 26,618,821 | |||||||||
|
| |||||||||||
| 1 | Foreign denominated security issued by foreign domiciled entity. |
| 2 | Floating rate security. The rate disclosed was in effect at March 31, 2024. |
| 3 | Securities exempt from registration under Rule 144A of the Securities Act of 1933, as amended. The securities may be resold in transactions exempt from registration, normally to qualified institutional buyers. |
| 4 | Security is valued using significant unobservable inputs and is classified as Level 3 in the fair value hierarchy. |
| 5 | Variable rate security. Interest rate disclosed is as of the most recent information available. Certain variable rate securities are not based on a published reference rate and spread but are determined by the issuer or agent and are based on current market conditions. |
| 6 | Illiquid security as determined under procedures approved by the Board of Trustees. The aggregate value of illiquid securities is $31,199, which is 0.12% of total net assets. |
| 7 | Zero coupon bond. The rate shown is the effective yield as of March 31, 2024. |
| 8 | Represents the current yield as of March 31, 2024. |
| * | Securities with a call or reset feature will have an effective maturity date sooner than the stated maturity. |
| ** | Securities backed by mortgage or consumer loans where payment is periodically made will have an effective maturity date sooner than the stated maturity date. |
See accompanying Notes to Financial Statements.
| 119 / Annual Report March 2024 |
Table of Contents
Investment Grade Credit Fund
Schedule of Portfolio Investments
March 31, 2024
Note: For Fund compliance purposes, the Fund’s industry classifications refer to any one or more of the industry sub-classifications used by one or more widely recognized market indexes or ratings group indexes, and/or as defined by Fund management. This definition may not apply for purposes of this report, which may combine industry sub-classifications for more meaningful presentation for investors.
(CLO): Collateralized Loan Obligation
(EUR): Euro
(IO): Interest Only
(MTN): Medium-Term Note
(REIT): Real Estate Investment Trust
(S&P): Standard & Poor’s
(SOFR): Secured Overnight Financing Rate
(STEP): Step Coupon Bond
(TBA): To-Be-Announced
(WI): When Issued
Currency to be Purchased | Currency to be Sold | Counterparty | Settlement Date | Unrealized Appreciation | ||||||||
FOREIGN CURRENCY EXCHANGE CONTRACT | ||||||||||||
USD 8,803 | EUR 8,000 | Bank of America N.A. | 04/12/24 | $ | 158 | |||||||
|
| |||||||||||
| Description | Number of Contracts | Expiration Date | Notional Amount | Value | Unrealized Appreciation (Depreciation) | |||||||||||||||
FUTURES CONTRACTS: LONG POSITIONS |
| |||||||||||||||||||
U.S. Treasury Two-Year Note | 33 | 06/28/24 | $ | 6,747,984 | $ | (4,773) | $ | (4,773) | ||||||||||||
U.S. Treasury Five-Year Note | 24 | 06/28/24 | 2,568,375 | 2,265 | 2,265 | |||||||||||||||
|
|
|
|
|
| |||||||||||||||
| 9,316,359 | (2,508) | (2,508) | ||||||||||||||||||
|
|
|
|
|
| |||||||||||||||
FUTURES CONTRACTS: SHORT POSITIONS |
| |||||||||||||||||||
U.S. Treasury Ten-Year Ultra Bond | 17 | 06/18/24 | (1,948,359) | (8,048) | (8,048) | |||||||||||||||
U.S. Treasury Ultra Bond | 2 | 06/18/24 | (258,000) | (4,308) | (4,308) | |||||||||||||||
|
|
|
|
|
| |||||||||||||||
| (2,206,359) | (12,356) | (12,356) | ||||||||||||||||||
|
|
|
|
|
| |||||||||||||||
TOTAL FUTURES CONTRACTS | $ | 7,110,000 | $ | (14,864) | $ | (14,864) | ||||||||||||||
|
|
|
|
|
| |||||||||||||||
| Received by the Fund | Paid by the Fund | |||||||||||||||||||||||||||||
| Description | Maturity Date | Rate | Frequency | Rate | Frequency | Notional Amount (000’s) | Value | Premiums Paid | Unrealized Appreciation | |||||||||||||||||||||
SWAPS: INTEREST RATE | ||||||||||||||||||||||||||||||
| Interest Rate Swap1 | 12/20/53 | USD-SOFR- COMPOUND | Annual | 3.52% | Annual | $ | 69 | $ | 805 | $ | — | $ | 805 | |||||||||||||||||
|
|
|
|
|
|
|
| |||||||||||||||||||||||
TOTAL SWAPS CONTRACTS | $ | 69 | $ | 805 | $ | — | $ | 805 | ||||||||||||||||||||||
|
|
|
|
|
|
|
| |||||||||||||||||||||||
| 1 | Centrally cleared. |
See accompanying Notes to Financial Statements.
| Annual Report March 2024 / 120 |
Table of Contents
Schedule of Portfolio Investments
March 31, 2024
| Issues | Maturity Date | Principal Amount | Value | |||||||
| BONDS – 117.98% |
| |||||||||
ASSET-BACKED SECURITIES — 7.82%** |
| |||||||||
Access Group, Inc., |
| |||||||||
Series 2015-1, Class A |
| |||||||||
(SOFR30A plus 0.81%) |
| |||||||||
6.13% | 07/25/561,2 | $ | 738,799 | $ | 730,964 | |||||
AmeriCredit Automobile Receivables Trust, |
| |||||||||
Series 2020-1, Class D |
| |||||||||
1.80% | 12/18/25 | 6,065,000 | 5,995,905 | |||||||
AmeriCredit Automobile Receivables Trust, |
| |||||||||
Series 2020-3, Class D |
| |||||||||
1.49% | 09/18/26 | 2,587,000 | 2,476,860 | |||||||
Barings CLO Ltd., |
| |||||||||
Series 2018-3A, Class A1 |
| |||||||||
(Cayman Islands) |
| |||||||||
(CME Term SOFR 3-Month plus 1.21%) |
| |||||||||
6.53% | 07/20/291,2,3 | 855,731 | 856,390 | |||||||
Bayview Commercial Asset Trust, |
| |||||||||
Series 2005-1A, Class A1 |
| |||||||||
(CME Term SOFR 1-Month plus 0.56%) |
| |||||||||
5.89% | 04/25/351,2 | 78,622 | 75,112 | |||||||
Carvana Auto Receivables Trust, |
| |||||||||
Series 2021-N2, Class D |
| |||||||||
1.27% | 03/10/28 | 1,112,823 | 1,046,826 | |||||||
Domino’s Pizza Master Issuer LLC, |
| |||||||||
Series 2015-1A, Class A2II |
| |||||||||
4.47% | 10/25/452 | 3,617,250 | 3,551,841 | |||||||
Flagship Credit Auto Trust, |
| |||||||||
Series 2019-4, Class D |
| |||||||||
3.12% | 01/15/262 | 2,111,449 | 2,085,900 | |||||||
GLS Auto Receivables Issuer Trust, |
| |||||||||
Series 2020-3A, Class D |
| |||||||||
2.27% | 05/15/262 | 1,631,298 | 1,617,906 | |||||||
Goal Capital Funding Trust, |
| |||||||||
Series 2006-1, Class B |
| |||||||||
(LIBOR USD3-Month plus 0.45%) |
| |||||||||
6.04% | 08/25/421 | 1,094,368 | 1,030,785 | |||||||
J.G. Wentworth XXX LLC, |
| |||||||||
Series 2013-3A, Class A |
| |||||||||
4.08% | 01/17/732 | 2,586,481 | 2,424,695 | |||||||
JPMorgan Chase Bank N.A. - CACLN, |
| |||||||||
Series 2021-1, Class C |
| |||||||||
1.02% | 09/25/282 | 142,273 | 140,780 | |||||||
LCM XXIV Ltd., |
| |||||||||
Series 24A, Class AR |
| |||||||||
(Cayman Islands) |
| |||||||||
(CME Term SOFR 3-Month plus 1.24%) |
| |||||||||
6.56% | 03/20/301,2,3 | 2,609,513 | 2,611,418 | |||||||
Madison Park Funding XVII Ltd., |
| |||||||||
Series 2015-17A, Class AR2 |
| |||||||||
(Cayman Islands) |
| |||||||||
(CME Term SOFR 3-Month plus 1.26%) |
| |||||||||
6.58% | 07/21/301,2,3 | 10,062,342 | 10,071,197 | |||||||
Navient Private Education Refi Loan Trust, |
| |||||||||
Series 2021-CA, Class A |
| |||||||||
1.06% | 10/15/692 | 812,139 | 714,393 | |||||||
| Issues | Maturity Date | Principal Amount | Value | |||||||
| ASSET-BACKED SECURITIES (continued) |
| |||||||||
Navient Private Education Refi Loan Trust, |
| |||||||||
Series 2021-FA, Class A |
| |||||||||
1.11%02/18/702 | $ | 2,606,632 | $ | 2,232,255 | ||||||
Nelnet Student Loan Trust, |
| |||||||||
Series 2013-1A, Class A |
| |||||||||
(SOFR30A plus 0.71%) |
| |||||||||
6.03% | 06/25/411,2 | 1,041,322 | 1,024,326 | |||||||
NYACK Park CLO Ltd., |
| |||||||||
Series 2021-1A, Class X |
| |||||||||
(Cayman Islands) |
| |||||||||
(CME Term SOFR 3-Month plus 0.91%) |
| |||||||||
6.23% | 10/20/341,2,3 | 920,759 | 920,014 | |||||||
OCP CLO Ltd., |
| |||||||||
Series 2017-14A, Class A1A |
| |||||||||
(Cayman Islands) |
| |||||||||
(CME Term SOFR 3-Month plus 1.41%) |
| |||||||||
6.73% | 11/20/301,2,3 | 1,420,990 | 1,422,809 | |||||||
Octagon Investment Partners XVII Ltd., |
| |||||||||
Series 2013-1A, Class BR2 |
| |||||||||
(Cayman Islands) |
| |||||||||
(CME Term SOFR 3-Month plus 1.66%) |
| |||||||||
6.99% | 01/25/311,2,3 | 1,310,000 | 1,311,237 | |||||||
Palmer Square Loan Funding Ltd., |
| |||||||||
Series 2021-2A, Class A1 |
| |||||||||
(Cayman Islands) |
| |||||||||
(CME Term SOFR 3-Month plus 1.06%) |
| |||||||||
6.38% | 05/20/291,2,3 | 534,773 | 535,057 | |||||||
Palmer Square Loan Funding Ltd., |
| |||||||||
Series 2022-3A, Class A1BR |
| |||||||||
(Cayman Islands) |
| |||||||||
(CME Term SOFR 3-Month plus 1.40%) |
| |||||||||
6.72% | 04/15/311,2,3 | 6,060,000 | 6,062,975 | |||||||
Progress Residential Trust, |
| |||||||||
Series 2020-SFR3, Class F |
| |||||||||
2.80% | 10/17/272 | 6,980,000 | 6,555,516 | |||||||
ReadyCap Commercial Mortgage Trust, |
| |||||||||
Series 2019-6, Class A |
| |||||||||
2.83% | 10/25/522 | 2,084,001 | 2,013,767 | |||||||
Reese Park CLO Ltd., |
| |||||||||
Series 2020-1A, Class XR |
| |||||||||
(Cayman Islands) |
| |||||||||
(CME Term SOFR 3-Month plus 1.16%) |
| |||||||||
6.48% | 10/15/341,2,3 | 1,108,333 | 1,107,479 | |||||||
Rockford Tower CLO Ltd., |
| |||||||||
Series 2017-3A, Class A |
| |||||||||
(Cayman Islands) |
| |||||||||
(CME Term SOFR 3-Month plus 1.45%) |
| |||||||||
6.77% | 10/20/301,2,3 | 1,321,141 | 1,324,391 | |||||||
Rockford Tower CLO Ltd., |
| |||||||||
Series 2018-1A, Class A |
| |||||||||
(Cayman Islands) |
| |||||||||
(CME Term SOFR 3-Month plus 1.36%) |
| |||||||||
6.68% | 05/20/311,2,3 | 1,062,141 | 1,062,561 | |||||||
Santander Bank Auto Credit-Linked Notes, |
| |||||||||
Series 2022-B, Class E |
| |||||||||
8.68% | 08/16/322 | 1,397,547 | 1,388,045 | |||||||
See accompanying Notes to Financial Statements.
| 121 / Annual Report March 2024 |
Table of Contents
Low Duration Bond Fund
Schedule of Portfolio Investments
March 31, 2024
| Issues | Maturity Date | Principal Amount | Value | |||||||
ASSET-BACKED SECURITIES (continued) |
| |||||||||
Santander Drive Auto Receivables Trust, |
| |||||||||
Series 2021-3, Class C |
| |||||||||
0.95% | 09/15/27 | $ | 313,589 | $ | 312,367 | |||||
Santander Drive Auto Receivables Trust, |
| |||||||||
Series 2021-3, Class D |
| |||||||||
1.33% | 09/15/27 | 6,260,000 | 6,030,211 | |||||||
Skyline Aircraft Finance LLC, |
| |||||||||
Series 2021-1, Class A |
| |||||||||
3.23% | 05/10/374,5,6 | 5,607,527 | 5,008,441 | |||||||
SLC Student Loan Trust, |
| |||||||||
Series 2007-1, Class A4 |
| |||||||||
(SOFR90A plus 0.32%) |
| |||||||||
5.68% | 05/15/291 | 882,284 | 880,016 | |||||||
SLM Student Loan Trust, |
| |||||||||
Series 2008-4, Class A4 |
| |||||||||
(SOFR90A plus 1.91%) |
| |||||||||
7.27% | 07/25/221 | 2,086,348 | 2,108,680 | |||||||
SLM Student Loan Trust, |
| |||||||||
Series 2008-6, Class A4 |
| |||||||||
(SOFR90A plus 1.36%) |
| |||||||||
6.72% | 07/25/231 | 1,597,032 | 1,585,855 | |||||||
SLM Student Loan Trust, |
| |||||||||
Series 2012-2, Class A |
| |||||||||
(SOFR30A plus 0.81%) |
| |||||||||
6.13% | 01/25/291 | 1,467,657 | 1,431,951 | |||||||
SLM Student Loan Trust, |
| |||||||||
Series 2014-1, Class A3 |
| |||||||||
(SOFR30A plus 0.71%) |
| |||||||||
6.03% | 02/26/291 | 2,711,194 | 2,611,470 | |||||||
Student Loan Consolidation Center Student Loan Trust I, |
| |||||||||
Series 2002-2, Class B2 |
| |||||||||
(28 Day Auction Rate plus 0.00%) |
| |||||||||
1.61% | 07/01/421,2 | 2,800,000 | 2,587,612 | |||||||
Vantage Data Centers Issuer LLC, |
| |||||||||
Series 2019-1A, Class A2 |
| |||||||||
3.19% | 07/15/442 | 3,646,943 | 3,613,328 | |||||||
Voya CLO, |
| |||||||||
Series 2017-2A, Class A1R |
| |||||||||
(Cayman Islands) |
| |||||||||
(CME Term SOFR 3-Month plus 1.24%) |
| |||||||||
6.56% | 06/07/301,2,3 | 5,275,743 | 5,279,594 | |||||||
World Omni Auto Receivables Trust, |
| |||||||||
Series 2021-D, Class B |
| |||||||||
1.52% | 11/15/27 | 5,325,000 | 4,987,966 | |||||||
|
| |||||||||
Total Asset-Backed Securities |
| |||||||||
(Cost $99,819,397) |
| 98,828,895 | ||||||||
|
| |||||||||
| BANK LOANS — 1.50%* |
| |||||||||
Automotive — 0.00% |
| |||||||||
First Brands Group LLC, |
| |||||||||
Term Loan B, 1st Lien |
| |||||||||
(SOFR plus 5.26%) |
| |||||||||
10.57% | 03/30/271 | 43,761 | 43,881 | |||||||
|
| |||||||||
| Issues | Maturity Date | Principal Amount | Value | |||||||||
| BANK LOANS (continued) |
| |||||||||||
Communications — 0.25% |
| |||||||||||
CCI Buyer, Inc., | ||||||||||||
Term Loan B, 1st Lien |
| |||||||||||
(SOFR plus 4.00%) |
| |||||||||||
9.30% | 12/17/271 | $ | 67,230 | $ | 66,923 | |||||||
Charter Communications Operating LLC, |
| |||||||||||
Term Loan B2, 1st Lien |
| |||||||||||
(SOFR plus 1.75%) |
| |||||||||||
7.08% | 02/01/271 | 2,234,126 | 2,236,115 | |||||||||
Frontier Communications Holdings LLC, |
| |||||||||||
Term Loan B, 1st Lien |
| |||||||||||
(SOFR plus 3.86%) |
| |||||||||||
8.62% | 10/08/271 | 109,317 | 109,215 | |||||||||
New Insight Holdings, Inc., |
| |||||||||||
Term Loan B, 1st Lien |
| |||||||||||
(SOFR plus 5.76%) |
| |||||||||||
11.07% | 12/20/241 | 65,893 | 39,763 | |||||||||
Zayo Group Holdings, Inc., |
| |||||||||||
Term Loan B, 1st Lien |
| |||||||||||
(SOFR plus 3.11%) |
| |||||||||||
8.44% | 03/09/271 | 836,172 | 736,069 | |||||||||
|
| |||||||||||
| 3,188,085 | ||||||||||||
|
| |||||||||||
| Consumer Discretionary — 0.08% |
| |||||||||||
City Brewing Co. LLC, |
| |||||||||||
Term Loan B, 1st Lien |
| |||||||||||
(SOFR plus 3.76%) |
| |||||||||||
8.32% | 04/05/281 | 147,127 | 115,534 | |||||||||
Naked Juice, LLC, |
| |||||||||||
Term Loan, 1st Lien (Luxembourg) |
| |||||||||||
(SOFR plus 3.35%) |
| |||||||||||
8.66% | 01/24/291,3 | 687,588 | 644,848 | |||||||||
Term Loan, 2nd Lien |
| |||||||||||
(SOFR plus 6.10%) |
| |||||||||||
11.00% | 01/24/301 | 136,414 | 111,816 | |||||||||
Osmosis Buyer Ltd., |
| |||||||||||
Term Loan B, 1st Lien |
| |||||||||||
(SOFR plus 3.75%) |
| |||||||||||
9.07% | 07/31/281 | 80,041 | 80,275 | |||||||||
|
| |||||||||||
| 952,473 | ||||||||||||
|
| |||||||||||
| Entertainment — 0.06% |
| |||||||||||
Elanco Animal Health, Inc., |
| |||||||||||
Term Loan B, 1st Lien |
| |||||||||||
(SOFR plus 1.85%) |
| |||||||||||
7.18% | 08/01/271 | 504,313 | 503,093 | |||||||||
William Morris Endeavor Entertainment LLC, |
| |||||||||||
Term Loan B1, 1st Lien |
| |||||||||||
(SOFR plus 2.86%) |
| |||||||||||
8.19% | 05/16/251 | 305,379 | 305,542 | |||||||||
|
| |||||||||||
| 808,635 | ||||||||||||
|
| |||||||||||
| Finance — 0.08% |
| |||||||||||
Avolon TLB Borrower 1 U.S. LLC, |
| |||||||||||
Term Loan B6, 1st Lien |
| |||||||||||
(SOFR plus 2.00%) |
| |||||||||||
7.33% | 06/22/281 | 235,695 | 236,027 | |||||||||
See accompanying Notes to Financial Statements.
| Annual Report March 2024 / 122 |
Table of Contents
Low Duration Bond Fund
Schedule of Portfolio Investments
March 31, 2024
| Issues | Maturity Date | Principal Amount | Value | |||||||
| BANK LOANS (continued) |
| |||||||||
Finance (continued) |
| |||||||||
Deerfield Dakota Holding LLC, |
| |||||||||
Term Loan B, 1st Lien |
| |||||||||
(SOFR plus 3.75%) |
| |||||||||
9.06% | 04/09/271 | $ | 172,968 | $ | 172,331 | |||||
Jane Street Group LLC, |
| |||||||||
Term Loan B, 1st Lien |
| |||||||||
(SOFR plus 2.61%) |
| |||||||||
7.94% | 01/26/281 | 115,842 | 116,031 | |||||||
Setanta Aircraft Leasing DAC, |
| |||||||||
Term Loan B, 1st Lien |
| |||||||||
(SOFR plus 2.26%) |
| |||||||||
7.56% | 11/06/281 | 515,000 | 516,645 | |||||||
|
| |||||||||
| 1,041,034 | ||||||||||
|
| |||||||||
| Food — 0.01% |
| |||||||||
8th Avenue Food & Provisions, Inc., |
| |||||||||
Term Loan B, 1st Lien |
| |||||||||
(SOFR plus 3.86%) |
| |||||||||
9.19% | 10/01/251 | 24,146 | 23,780 | |||||||
H-Food Holdings LLC, |
| |||||||||
Term Loan, 1st Lien |
| |||||||||
(SOFR plus 3.95%) |
| |||||||||
9.29% | 05/23/251 | 45,231 | 33,104 | |||||||
|
| |||||||||
| 56,884 | ||||||||||
|
| |||||||||
| Health Care — 0.17% |
| |||||||||
Carestream Dental Equipment, Inc., |
| |||||||||
Term Loan, 1st Lien |
| |||||||||
(LIBOR plus 3.25%) |
| |||||||||
8.56% | 09/01/241 | 117,441 | 102,566 | |||||||
Carestream Dental, Inc., |
| |||||||||
Term Loan, 1st Lien |
| |||||||||
(LIBOR plus 4.50%) |
| |||||||||
9.94% | 09/01/241 | 35,849 | 31,293 | |||||||
Genesee & Wyoming, Inc., |
| |||||||||
Term Loan, 1st Lien |
| |||||||||
(SOFR plus 2.10%) |
| |||||||||
7.40% | 12/30/261 | 190,717 | 191,057 | |||||||
Grifols Worldwide Operations USA, Inc., |
| |||||||||
Term Loan B, 1st Lien |
| |||||||||
(SOFR plus 2.15%) |
| |||||||||
7.46% | 11/15/271 | 504,042 | 489,140 | |||||||
Jazz Financing Lux SARL, |
| |||||||||
Term Loan B, 1st Lien (Luxembourg) |
| |||||||||
(SOFR plus 3.11%) |
| |||||||||
8.44% | 05/05/281,3 | 386,453 | 388,869 | |||||||
Medline Borrower LP, |
| |||||||||
Term Loan B, 1st Lien |
| |||||||||
(SOFR plus 2.86%) |
| |||||||||
8.20% | 10/23/281 | 260,372 | 261,321 | |||||||
Peraton Corp., |
| |||||||||
Term Loan B, 1st Lien |
| |||||||||
(SOFR plus 3.85%) |
| |||||||||
9.18% | 02/01/281 | 119,326 | 119,447 | |||||||
| Issues | Maturity Date | Principal Amount | Value | |||||||
| BANK LOANS (continued) |
| |||||||||
Health Care (continued) |
| |||||||||
Perrigo Investments LLC, |
| |||||||||
Term Loan B, 1st Lien |
| |||||||||
(SOFR plus 2.35%) |
| |||||||||
7.15% | 04/20/291 | $ | 492,500 | $ | 491,680 | |||||
Star Parent, Inc., |
| |||||||||
Term Loan B, 1st Lien |
| |||||||||
(SOFR plus 4.00%) |
| |||||||||
9.31% | 09/27/301 | 96,700 | 96,222 | |||||||
|
| |||||||||
| 2,171,595 | ||||||||||
|
| |||||||||
| Industrials — 0.13% |
| |||||||||
Artera Services LLC, |
| |||||||||
Term Loan, 1st Lien |
| |||||||||
(SOFR plus 4.50%) |
| |||||||||
9.81% | 02/15/311 | 83,481 | 83,898 | |||||||
Berry Global, Inc., |
| |||||||||
Term Loan AA, 1st Lien |
| |||||||||
(SOFR plus 1.86%) |
| |||||||||
7.18% | 07/01/291 | 1,143,030 | 1,143,853 | |||||||
Coherent Corp., |
| |||||||||
Term Loan B, 1st Lien |
| |||||||||
(SOFR plus 2.86%) |
| |||||||||
7.38% -7.67% | 07/02/291 | 130,085 | 130,508 | |||||||
Filtration Group Corp., |
| |||||||||
Term Loan, 1st Lien |
| |||||||||
(SOFR plus 4.36%) |
| |||||||||
9.69% | 10/21/281 | 79,043 | 79,384 | |||||||
Patriot Container Corp., |
| |||||||||
Term Loan B, 1st Lien |
| |||||||||
(SOFR plus 3.85%) |
| |||||||||
9.18% | 03/20/251 | 38,950 | 37,865 | |||||||
Transdigm, Inc., |
| |||||||||
Term Loan I, 1st Lien |
| |||||||||
(SOFR plus 2.75%) |
| |||||||||
8.08% | 08/24/281 | 178,495 | 179,304 | |||||||
|
| |||||||||
| 1,654,812 | ||||||||||
|
| |||||||||
| Information Technology — 0.25% |
| |||||||||
Arches Buyer, Inc., |
| |||||||||
Term Loan B, 1st Lien |
| |||||||||
(SOFR plus 3.35%) |
| |||||||||
8.68% | 12/06/271 | 124,376 | 120,758 | |||||||
Athenahealth Group, Inc., |
| |||||||||
Term Loan B, 1st Lien |
| |||||||||
(SOFR plus 3.25%) |
| |||||||||
8.25% | 02/15/291 | 241,713 | 240,034 | |||||||
Buzz Merger Sub Ltd., |
| |||||||||
Term Loan B, 1st Lien |
| |||||||||
(SOFR plus 2.85%) |
| |||||||||
8.18% | 01/29/271 | 69,742 | 69,982 | |||||||
Central Parent LLC, |
| |||||||||
Term Loan B, 1st Lien |
| |||||||||
(SOFR plus 4.00%) |
| |||||||||
9.31% | 07/06/291 | 100,706 | 101,120 | |||||||
See accompanying Notes to Financial Statements.
| 123 / Annual Report March 2024 |
Table of Contents
Low Duration Bond Fund
Schedule of Portfolio Investments
March 31, 2024
| Issues | Maturity Date | Principal Amount | Value | |||||||||
| BANK LOANS (continued) |
| |||||||||||
Information Technology (continued) |
| |||||||||||
EagleView Technology Co., |
| |||||||||||
Term Loan B, 1st Lien |
| |||||||||||
(SOFR plus 3.76%) |
| |||||||||||
9.06% | 08/14/251 | $ | 189,412 | $ | 184,423 | |||||||
Gainwell Acquisition Corp., |
| |||||||||||
Term Loan B, 1st Lien |
| |||||||||||
(SOFR plus 4.10%) |
| |||||||||||
8.72% -8.99% | 10/01/271 | 636,835 | 610,327 | |||||||||
Magnite, Inc., |
| |||||||||||
Term Loan B, 1st Lien |
| |||||||||||
(SOFR plus 4.50%) |
| |||||||||||
9.60% -9.82% | 02/06/311 | 34,455 | 34,555 | |||||||||
MH Sub I LLC, |
| |||||||||||
Term Loan B3, 1st Lien |
| |||||||||||
(SOFR plus 4.25%) |
| |||||||||||
9.58% | 05/03/281 | 44,697 | 44,484 | |||||||||
Open Text Corp., |
| |||||||||||
Term Loan B, 1st Lien (Canada) |
| |||||||||||
(SOFR plus 1.85%) |
| |||||||||||
7.18% | 05/30/251,3 | 134,414 | 134,708 | |||||||||
(SOFR plus 2.85%) |
| |||||||||||
8.18% | 01/31/301,3 | 221,016 | 221,645 | |||||||||
Oracle Corp., |
| |||||||||||
Term Loan A1, 1st Lien |
| |||||||||||
(SOFR plus 0.60%) |
| |||||||||||
6.46% | 08/16/271 | 913,972 | 915,114 | |||||||||
Renaissance Holding Corp., |
| |||||||||||
Term Loan, 1st Lien |
| |||||||||||
(SOFR plus 4.25%) |
| |||||||||||
9.58% | 04/05/301 | 74,451 | 74,684 | |||||||||
Spin Holdco, Inc., |
| |||||||||||
Term Loan B, 1st Lien |
| |||||||||||
(SOFR plus 4.26%) |
| |||||||||||
9.59% | 03/03/281 | 166,377 | 154,511 | |||||||||
SS&C Technologies Holdings, Inc., |
| |||||||||||
Term Loan B5, 1st Lien |
| |||||||||||
(SOFR plus 1.86%) |
| |||||||||||
7.19% | 04/16/251 | 192,270 | 192,509 | |||||||||
|
| |||||||||||
| 3,098,854 | ||||||||||||
|
| |||||||||||
| Insurance — 0.08% |
| |||||||||||
Acrisure LLC, |
| |||||||||||
Term Loan B1, 1st Lien |
| |||||||||||
(SOFR plus 3.50%) |
| |||||||||||
8.94% | 02/15/271 | 454,717 | 455,002 | |||||||||
Asurion LLC, | ||||||||||||
Term Loan B10, 1st Lien |
| |||||||||||
(SOFR plus 4.10%) |
| |||||||||||
8.91% | 08/19/281 | 492,500 | 475,570 | |||||||||
Term Loan B8, 1st Lien |
| |||||||||||
(SOFR plus 3.36%) |
| |||||||||||
8.69% | 12/23/261 | 124,678 | 122,451 | |||||||||
|
| |||||||||||
| 1,053,023 | ||||||||||||
|
| |||||||||||
| Issues | Maturity Date | Principal Amount | Value | |||||||
| BANK LOANS (continued) |
| |||||||||
Materials — 0.02% |
| |||||||||
Chemours Co. (The), |
| |||||||||
Term Loan B3, 1st Lien |
| |||||||||
(SOFR plus 3.50%) |
| |||||||||
8.83% | 08/18/281 | $ | 262,467 | $ | 262,073 | |||||
Mativ Holdings, Inc., |
| |||||||||
Delayed-Draw Term Loan, 1st Lien |
| |||||||||
(SOFR plus 2.60%) |
| |||||||||
7.93% | 05/06/271 | 38,921 | 38,337 | |||||||
|
|
| ||||||||
| 300,410 | ||||||||||
|
|
| ||||||||
| Residential REITs — 0.20% |
| |||||||||
Invitation Homes Operating Partnership LP, |
| |||||||||
Term Loan A, 1st Lien |
| |||||||||
(SOFR plus 1.00%) |
| |||||||||
6.42% | 01/31/251 | 2,500,000 | 2,484,375 | |||||||
|
|
| ||||||||
| Retail — 0.05% |
| |||||||||
1011778 BC Unlimited Liability Co., |
| |||||||||
Term Loan B5, 1st Lien (Canada) |
| |||||||||
(SOFR plus 2.25%) |
| |||||||||
7.58% | 09/20/301,3 | 188,533 | 188,651 | |||||||
AmWINS Group, Inc., |
| |||||||||
Term Loan B, 1st Lien |
| |||||||||
(SOFR plus 2.36%) |
| |||||||||
7.69% | 02/19/281 | 192,082 | 192,322 | |||||||
KFC Holding Co., |
| |||||||||
Term Loan B, 1st Lien |
| |||||||||
(SOFR plus 1.86%) |
| |||||||||
7.19% | 03/15/281 | 194,752 | 194,883 | |||||||
|
|
| ||||||||
| 575,856 | ||||||||||
|
|
| ||||||||
| Services — 0.12% |
| |||||||||
Amentum Government Services Holdings LLC, |
| |||||||||
Term Loan B, 1st Lien |
| |||||||||
(SOFR plus 4.11%) |
| |||||||||
8.63% | 01/29/271 | 154,251 | 154,829 | |||||||
Boost Newco Borrower LLC, |
| |||||||||
Term Loan B, 1st Lien |
| |||||||||
(SOFR plus 3.00%) |
| |||||||||
8.31% | 01/31/311 | 187,111 | 188,008 | |||||||
Clean Harbors, Inc., |
| |||||||||
Term Loan B, 1st Lien |
| |||||||||
(SOFR plus 1.86%) |
| |||||||||
7.19% | 10/08/281 | 69,846 | 70,064 | |||||||
Element Materials Technology Group U.S. Holdings, Inc., |
| |||||||||
Delayed-Draw Term Loan, 1st Lien |
| |||||||||
(SOFR plus 4.35%) |
| |||||||||
9.66% | 07/06/291 | 263,935 | 264,485 | |||||||
Term Loan B, 1st Lien |
| |||||||||
(SOFR plus 4.35%) |
| |||||||||
9.66% | 07/06/291 | 571,858 | 573,050 | |||||||
Pre-Paid Legal Services, Inc., |
| |||||||||
Term Loan, 1st Lien |
| |||||||||
(SOFR plus 3.86%) |
| |||||||||
9.18% | 12/15/281 | 80,334 | 80,054 | |||||||
See accompanying Notes to Financial Statements.
| Annual Report March 2024 / 124 |
Table of Contents
Low Duration Bond Fund
Schedule of Portfolio Investments
March 31, 2024
| Issues | Maturity Date | Principal Amount | Value | |||||||||
| BANK LOANS (continued) |
| |||||||||||
Services (continued) |
| |||||||||||
TruGreen LP, |
| |||||||||||
Term Loan B, 1st Lien |
| |||||||||||
(SOFR plus 4.10%) |
| |||||||||||
9.43% | 11/02/271 | $ | 167,806 | $ | 163,664 | |||||||
|
|
| ||||||||||
| 1,494,154 | ||||||||||||
|
|
| ||||||||||
Total Bank Loans |
| |||||||||||
(Cost $18,839,270) |
| 18,924,071 | ||||||||||
|
|
| ||||||||||
CORPORATES — 25.96%* |
| |||||||||||
Banking — 6.72% |
| |||||||||||
Bank of America Corp. |
| |||||||||||
3.71% | 04/24/286 | 944,000 | 903,808 | |||||||||
Bank of America Corp. |
| |||||||||||
(MTN) |
| |||||||||||
0.98% | 09/25/256 | 4,891,000 | 4,780,065 | |||||||||
1.32% | 06/19/266 | 7,263,000 | 6,903,926 | |||||||||
2.09% | 06/14/296 | 4,535,000 | 4,009,794 | |||||||||
2.55% | 02/04/286 | 4,275,000 | 3,974,402 | |||||||||
HSBC Holdings PLC |
| |||||||||||
(United Kingdom) |
| |||||||||||
2.01% | 09/22/283,6 | 13,695,000 | 12,248,603 | |||||||||
ING Groep NV |
| |||||||||||
(Netherlands) |
| |||||||||||
3.87% | 03/28/263,6 | 645,000 | 633,504 | |||||||||
JPMorgan Chase & Co. |
| |||||||||||
0.82% | 06/01/256 | 185,000 | 183,427 | |||||||||
0.97% | 06/23/256 | 16,520,000 | 16,330,879 | |||||||||
1.04% | 02/04/276 | 4,710,000 | 4,358,642 | |||||||||
2.18% | 06/01/286 | 879,000 | 804,314 | |||||||||
Lloyds Banking Group PLC |
| |||||||||||
(United Kingdom) |
| |||||||||||
1.63% | 05/11/273,6 | 2,175,000 | 2,004,058 | |||||||||
3.57% | 11/07/283,6 | 175,000 | 164,183 | |||||||||
PNC Financial Services Group, Inc. (The) |
| |||||||||||
5.58% | 06/12/296 | 830,000 | 840,613 | |||||||||
Santander UK Group Holdings PLC |
| |||||||||||
(United Kingdom) |
| |||||||||||
1.67% | 06/14/273,6 | 3,007,000 | 2,752,713 | |||||||||
U.S. Bancorp | ||||||||||||
4.65% | 02/01/296 | 5,365,000 | 5,258,953 | |||||||||
Wells Fargo & Co. |
| |||||||||||
(MTN) |
| |||||||||||
2.39% | 06/02/286 | 1,275,000 | 1,167,358 | |||||||||
5.57% | 07/25/296 | 17,460,000 | 17,672,048 | |||||||||
|
|
| ||||||||||
| 84,991,290 | ||||||||||||
|
|
| ||||||||||
Communications — 1.06% |
| |||||||||||
Charter Communications Operating LLC/Charter |
| |||||||||||
Communications Operating Capital |
| |||||||||||
4.91% | 07/23/25 | 1,720,000 | 1,700,132 | |||||||||
Cox Communications, Inc. |
| |||||||||||
3.15% | 08/15/242 | 1,199,000 | 1,186,544 | |||||||||
7.63% | 06/15/25 | 900,000 | 916,683 | |||||||||
CSC Holdings LLC |
| |||||||||||
6.50% | 02/01/292 | 84,000 | 71,245 | |||||||||
| Issues | Maturity Date | Principal Amount | Value | |||||||||
| CORPORATES (continued) |
| |||||||||||
| Communications (continued) |
| |||||||||||
11.75% | 01/31/292 | $ | 930,000 | $ | 931,163 | |||||||
Frontier Communications Holdings LLC |
| |||||||||||
8.63% | 03/15/312 | 12,000 | 12,264 | |||||||||
Northwest Fiber LLC/Northwest Fiber Finance Sub, Inc. |
| |||||||||||
6.00% | 02/15/282 | 341,000 | 351,230 | |||||||||
Qwest Corp. | ||||||||||||
7.25% | 09/15/25 | 4,590,000 | 4,538,362 | |||||||||
Sprint Spectrum Co. LLC/Sprint Spectrum Co. II LLC/Sprint |
| |||||||||||
Spectrum Co. III LLC |
| |||||||||||
5.15% | 03/20/282 | 828,000 | 826,275 | |||||||||
T-Mobile USA, Inc. |
| |||||||||||
3.75% | 04/15/27 | 3,015,000 | 2,904,456 | |||||||||
|
|
| ||||||||||
| 13,438,354 | ||||||||||||
|
|
| ||||||||||
Consumer Discretionary — 1.33% |
| |||||||||||
BAT Capital Corp. |
| |||||||||||
3.56% | 08/15/27 | 2,440,000 | 2,310,987 | |||||||||
Everi Holdings, Inc. |
| |||||||||||
5.00% | 07/15/292 | 250,000 | 248,125 | |||||||||
Imperial Brands Finance PLC |
| |||||||||||
(United Kingdom) |
| |||||||||||
3.50% | 07/26/262,3 | 5,205,000 | 4,969,517 | |||||||||
JDE Peet’s NV |
| |||||||||||
(Netherlands) |
| |||||||||||
0.80% | 09/24/242,3 | 935,000 | 911,955 | |||||||||
Spectrum Brands, Inc. |
| |||||||||||
3.88% | 03/15/312 | 410,000 | 396,046 | |||||||||
WarnerMedia Holdings, Inc. |
| |||||||||||
3.76% | 03/15/27 | 8,400,000 | 8,016,599 | |||||||||
|
|
| ||||||||||
| 16,853,229 | ||||||||||||
|
|
| ||||||||||
Diversified REITs — 1.61% |
| |||||||||||
American Tower Corp. |
| |||||||||||
5.25% | 07/15/28 | 4,445,000 | 4,449,420 | |||||||||
Digital Euro Finco LLC |
| |||||||||||
2.63% | 04/15/24 | 7,715,000 | 8,327,131 | |||||||||
GLP Capital LP/GLP Financing II, Inc. |
| |||||||||||
3.35% | 09/01/24 | 1,197,000 | 1,189,100 | |||||||||
4.00% | 01/15/30 | 1,750,000 | 1,604,208 | |||||||||
5.30% | 01/15/29 | 2,179,000 | 2,152,830 | |||||||||
VICI Properties LP |
| |||||||||||
4.95% | 02/15/30 | 40,000 | 38,682 | |||||||||
VICI Properties LP/VICI Note Co., Inc. |
| |||||||||||
5.75% | 02/01/272 | 2,590,000 | 2,589,473 | |||||||||
|
|
| ||||||||||
| 20,350,844 | ||||||||||||
|
|
| ||||||||||
Electric — 2.19% |
| |||||||||||
Alliant Energy Finance LLC |
| |||||||||||
1.40% | 03/15/262 | 6,540,000 | 5,952,213 | |||||||||
5.95% | 03/30/292 | 805,000 | 830,031 | |||||||||
Duke Energy Corp. |
| |||||||||||
4.30% | 03/15/28 | 1,835,000 | 1,793,561 | |||||||||
Eversource Energy |
| |||||||||||
2.90% | 03/01/27 | 5,425,000 | 5,105,473 | |||||||||
FirstEnergy Pennsylvania Electric Co. |
| |||||||||||
4.00% | 04/15/252 | 1,467,000 | 1,431,439 | |||||||||
4.15% | 04/15/252 | 500,000 | 491,580 | |||||||||
See accompanying Notes to Financial Statements.
| 125 / Annual Report March 2024 |
Table of Contents
Low Duration Bond Fund
Schedule of Portfolio Investments
March 31, 2024
| Issues | Maturity Date | Principal Amount | Value | |||||||||
| CORPORATES (continued) |
| |||||||||||
| Electric (continued) | ||||||||||||
ITC Holdings Corp. |
| |||||||||||
4.95% | 09/22/272 | $ | 4,960,000 | $ | 4,932,348 | |||||||
Jersey Central Power & Light Co. |
| |||||||||||
4.30% | 01/15/262 | 1,868,000 | 1,826,531 | |||||||||
4.70% | 04/01/242 | 5,348,000 | 5,348,000 | |||||||||
|
|
| ||||||||||
| 27,711,176 | ||||||||||||
|
|
| ||||||||||
Energy — 0.24% |
| |||||||||||
Energy Transfer LP |
| |||||||||||
4.95% | 05/15/28 | 1,150,000 | 1,140,992 | |||||||||
Southern Co. Gas Capital Corp. |
| |||||||||||
3.88% | 11/15/25 | 1,950,000 | 1,901,250 | |||||||||
|
|
| ||||||||||
| 3,042,242 | ||||||||||||
|
|
| ||||||||||
Finance — 3.73% |
| |||||||||||
AerCap Ireland Capital DAC/AerCap Global Aviation Trust |
| |||||||||||
(Ireland) | ||||||||||||
2.45% | 10/29/263 | 500,000 | 464,678 | |||||||||
Air Lease Corp. | ||||||||||||
3.63% | 04/01/27 | 4,835,000 | 4,609,038 | |||||||||
Avolon Holdings Funding Ltd. |
| |||||||||||
(Cayman Islands) |
| |||||||||||
2.53% | 11/18/272,3 | 5,905,000 | 5,254,948 | |||||||||
2.75% | 02/21/282,3 | 1,350,000 | 1,208,620 | |||||||||
Capital One Financial Corp. |
| |||||||||||
2.64% | 03/03/266 | 2,685,000 | 2,609,738 | |||||||||
Citigroup, Inc. | ||||||||||||
1.46% | 06/09/276 | 5,000,000 | 4,592,181 | |||||||||
3.52% | 10/27/286 | 4,987,000 | 4,703,864 | |||||||||
6.04% | 10/30/246 | 3,023,000 | 3,027,320 | |||||||||
Goldman Sachs Group, Inc. (The) |
| |||||||||||
1.95% | 10/21/276 | 10,000,000 | 9,198,700 | |||||||||
Icahn Enterprises LP/Icahn Enterprises Finance Corp. |
| |||||||||||
4.38% | 02/01/29 | 76,000 | 64,966 | |||||||||
4.75% | 09/15/24 | 750,000 | 746,844 | |||||||||
9.75% | 01/15/292 | 540,000 | 563,611 | |||||||||
Morgan Stanley | ||||||||||||
0.99% | 12/10/266 | 5,000,000 | 4,635,207 | |||||||||
1.59% | 05/04/276 | 5,855,000 | 5,416,832 | |||||||||
|
|
| ||||||||||
| 47,096,547 | ||||||||||||
|
|
| ||||||||||
Food — 0.56% |
| |||||||||||
JBS USA LUX SA/JBS USA Food Co./JBS USA Finance, Inc. |
| |||||||||||
(Canada) | ||||||||||||
3.00% | 02/02/293 | 5,590,000 | 4,951,704 | |||||||||
5.13% | 02/01/283 | 2,205,000 | 2,173,909 | |||||||||
|
|
| ||||||||||
| 7,125,613 | ||||||||||||
|
|
| ||||||||||
Health Care — 2.15% |
| |||||||||||
1375209 BC Ltd. |
| |||||||||||
(Canada) | ||||||||||||
9.00% | 01/30/282,3 | 850,000 | 833,925 | |||||||||
Amgen, Inc. | ||||||||||||
5.15% | 03/02/28 | 4,405,000 | 4,436,421 | |||||||||
Bayer U.S. Finance II LLC |
| |||||||||||
2.85% | 04/15/252 | 385,000 | 372,053 | |||||||||
| Issues | Maturity Date | Principal Amount | Value | |||||||||
| CORPORATES (continued) |
| |||||||||||
| Health Care (continued) |
| |||||||||||
Bayer U.S. Finance LLC |
| |||||||||||
6.25% | 01/21/292 | $ | 6,230,000 | $ | 6,338,433 | |||||||
Grifols SA | ||||||||||||
(Spain) | ||||||||||||
4.75% | 10/15/282,3 | 445,000 | 368,533 | |||||||||
Grifols SA, | ||||||||||||
Series REGS | ||||||||||||
(Spain) | ||||||||||||
3.20% | 05/01/253 | 200,000 | 199,542 | |||||||||
3.88% | 10/15/283 | 300,000 | 256,813 | |||||||||
HCA, Inc. | ||||||||||||
3.13% | 03/15/27 | 2,510,000 | 2,374,482 | |||||||||
5.38% | 09/01/26 | 2,520,000 | 2,518,617 | |||||||||
5.88% | 02/15/26 | 1,980,000 | 1,988,422 | |||||||||
HCA, Inc. | ||||||||||||
(MTN) | ||||||||||||
7.58% | 09/15/25 | 1,100,000 | 1,129,852 | |||||||||
Illumina, Inc. | ||||||||||||
5.75% | 12/13/27 | 2,275,000 | 2,304,029 | |||||||||
Kedrion SpA | ||||||||||||
(Italy) | ||||||||||||
6.50% | 09/01/292,3 | 920,000 | 839,429 | |||||||||
Premier Health Partners, |
| |||||||||||
Series G | ||||||||||||
2.91% | 11/15/26 | 3,500,000 | 3,218,359 | |||||||||
|
|
| ||||||||||
| 27,178,910 | ||||||||||||
|
|
| ||||||||||
Health Care REITs — 0.66% |
| |||||||||||
DOC DR LLC | ||||||||||||
4.30% | 03/15/27 | 3,995,000 | 3,912,400 | |||||||||
Healthcare Reality Holdings LP |
| |||||||||||
3.50% | 08/01/26 | 1,451,000 | 1,384,780 | |||||||||
Healthcare Realty Holdings LP |
| |||||||||||
3.63% | 01/15/28 | 3,255,000 | 3,010,395 | |||||||||
|
|
| ||||||||||
| 8,307,575 | ||||||||||||
|
|
| ||||||||||
Industrial REITs — 0.27% |
| |||||||||||
LXP Industrial Trust |
| |||||||||||
6.75% | 11/15/28 | 3,325,000 | 3,471,391 | |||||||||
|
|
| ||||||||||
Industrials — 0.93% |
| |||||||||||
Amcor Flexibles North America, Inc. |
| |||||||||||
4.00% | 05/17/25 | 4,125,000 | 4,051,352 | |||||||||
Ardagh Packaging Finance PLC/Ardagh Holdings USA, Inc., |
| |||||||||||
Series REGS | ||||||||||||
(Canada) | ||||||||||||
2.13% | 08/15/263 | 300,000 | 279,524 | |||||||||
Berry Global, Inc. |
| |||||||||||
1.65% | 01/15/27 | 2,000,000 | 1,816,869 | |||||||||
4.88% | 07/15/262 | 1,365,000 | 1,338,702 | |||||||||
General Electric Co. |
| |||||||||||
(MTN) | ||||||||||||
(CME Term SOFR 3-Month plus 0.64%) |
| |||||||||||
5.91% | 05/05/261 | 2,235,000 | 2,241,568 | |||||||||
See accompanying Notes to Financial Statements.
| Annual Report March 2024 / 126 |
Table of Contents
Low Duration Bond Fund
Schedule of Portfolio Investments
March 31, 2024
| Issues | Maturity Date | Principal Amount | Value | |||||||||
| CORPORATES (continued) |
| |||||||||||
| Industrials (continued) |
| |||||||||||
(CME Term SOFR 3-Month plus 0.74%) |
| |||||||||||
6.05% | 08/15/361 | $ | 2,182,000 | $ | 2,026,661 | |||||||
|
|
| ||||||||||
| 11,754,676 | ||||||||||||
|
|
| ||||||||||
Information Technology — 0.48% |
| |||||||||||
Netflix, Inc. | ||||||||||||
3.63% | 06/15/252 | 3,207,000 | 3,140,142 | |||||||||
Open Text Corp. |
| |||||||||||
(Canada) | ||||||||||||
6.90% | 12/01/272,3 | 2,635,000 | 2,720,374 | |||||||||
Uber Technologies, Inc. |
| |||||||||||
7.50% | 09/15/272 | 155,000 | 158,886 | |||||||||
|
|
| ||||||||||
| 6,019,402 | ||||||||||||
|
|
| ||||||||||
Insurance — 2.06% |
| |||||||||||
Aon Corp. | ||||||||||||
4.50% | 12/15/28 | 1,442,000 | 1,416,829 | |||||||||
Athene Global Funding |
| |||||||||||
(SOFR Index plus 0.70%) |
| |||||||||||
6.06% | 05/24/241,2 | 5,005,000 | 5,010,733 | |||||||||
Farmers Insurance Exchange |
| |||||||||||
8.63% | 05/01/242 | 5,000,000 | 5,005,410 | |||||||||
MMI Capital Trust I, |
| |||||||||||
Series B | ||||||||||||
7.63% | 12/15/27 | 2,000,000 | 2,110,722 | |||||||||
Nationwide Mutual Insurance Co. |
| |||||||||||
7.88% | 12/15/242,6 | 5,550,000 | 5,550,515 | |||||||||
Teachers Insurance & Annuity Association of America |
| |||||||||||
4.38% | 09/15/542,6 | 2,800,000 | 2,755,455 | |||||||||
Willis North America, Inc. |
| |||||||||||
2.95% | 09/15/29 | 35,000 | 31,384 | |||||||||
4.65% | 06/15/27 | 4,202,000 | 4,136,811 | |||||||||
|
|
| ||||||||||
| 26,017,859 | ||||||||||||
|
|
| ||||||||||
Materials — 0.40% |
| |||||||||||
International Flavors & Fragrances, Inc. |
| |||||||||||
1.83% | 10/15/272 | 4,970,000 | 4,411,227 | |||||||||
2.30% | 11/01/302 | 745,000 | 619,212 | |||||||||
|
|
| ||||||||||
| 5,030,439 | ||||||||||||
|
|
| ||||||||||
Office REITs — 0.15% |
| |||||||||||
Hudson Pacific Properties LP |
| |||||||||||
3.25% | 01/15/30 | 614,000 | 473,880 | |||||||||
4.65% | 04/01/29 | 1,715,000 | 1,462,750 | |||||||||
|
|
| ||||||||||
| 1,936,630 | ||||||||||||
|
|
| ||||||||||
Retail REITs — 0.15% |
| |||||||||||
Federal Realty OP LP |
| |||||||||||
7.48% | 08/15/26 | 1,850,000 | 1,908,439 | |||||||||
|
|
| ||||||||||
Services — 0.55% |
| |||||||||||
Adtalem Global Education, Inc. |
| |||||||||||
5.50% | 03/01/282 | 280,000 | 268,417 | |||||||||
Global Payments, Inc. |
| |||||||||||
2.15% | 01/15/27 | 7,201,000 | 6,646,075 | |||||||||
|
|
| ||||||||||
| 6,914,492 | ||||||||||||
|
|
| ||||||||||
| Issues | Maturity Date | Principal Amount | Value | |||||||||
| CORPORATES (continued) |
| |||||||||||
| Specialized REITs — 0.63% |
| |||||||||||
Blackstone Property Partners Europe Holdings SARL |
| |||||||||||
(EMTN) | ||||||||||||
(Luxembourg) | ||||||||||||
1.00% | 05/04/283 | $ | 1,700,000 | $ | 1,588,338 | |||||||
Extra Space Storage LP |
| |||||||||||
3.88% | 12/15/27 | 6,745,000 | 6,410,919 | |||||||||
|
|
| ||||||||||
| 7,999,257 | ||||||||||||
|
|
| ||||||||||
Transportation — 0.09% |
| |||||||||||
Delta Air Lines Pass-Through Trust, |
| |||||||||||
Series 2020-1, Class AA |
| |||||||||||
2.00% | 06/10/28 | 1,241,432 | 1,122,736 | |||||||||
|
|
| ||||||||||
Total Corporates |
| |||||||||||
| (Cost $329,964,080) | 328,271,101 | |||||||||||
|
|
| ||||||||||
MORTGAGE-BACKED — 55.58%** |
| |||||||||||
Non-Agency Commercial Mortgage-Backed — 10.37% |
| |||||||||||
Arbor Realty Commercial Real Estate Notes Ltd., |
| |||||||||||
Series 2021-FL3, Class A |
| |||||||||||
(Cayman Islands) |
| |||||||||||
(CME Term SOFR 1-Month plus 1.18%) |
| |||||||||||
6.51% | 08/15/341,2,3 | 5,000,000 | 4,959,158 | |||||||||
Ashford Hospitality Trust, |
| |||||||||||
Series 2018-KEYS, Class A |
| |||||||||||
(CME Term SOFR 1-Month plus 1.17%) |
| |||||||||||
6.50% | 06/15/351,2 | 602,965 | 598,404 | |||||||||
BANK, | ||||||||||||
Series 2018-BN14, Class A2 |
| |||||||||||
4.13% | 09/15/60 | 3,736,622 | 3,658,832 | |||||||||
Benchmark Mortgage Trust, |
| |||||||||||
Series 2020-B17, Class A2 |
| |||||||||||
2.21% | 03/15/53 | 7,590,000 | 7,197,171 | |||||||||
BX Commercial Mortgage Trust, |
| |||||||||||
Series 2020-VKNG, Class A |
| |||||||||||
(CME Term SOFR 1-Month plus 1.04%) |
| |||||||||||
6.37% | 10/15/371,2 | 4,627,225 | 4,618,426 | |||||||||
BX Commercial Mortgage Trust, |
| |||||||||||
Series 2021-CIP, Class A |
| |||||||||||
(CME Term SOFR 1-Month plus 1.04%) |
| |||||||||||
6.36% | 12/15/381,2 | 4,245,000 | 4,204,124 | |||||||||
BX Commercial Mortgage Trust, |
| |||||||||||
Series 2021-VINO, Class A |
| |||||||||||
(CME Term SOFR 1-Month plus 0.77%) |
| |||||||||||
6.09% | 05/15/381,2 | 4,046,705 | 4,017,007 | |||||||||
BX, | ||||||||||||
Series 2021-MFM1, Class B |
| |||||||||||
(CME Term SOFR 1-Month plus 1.06%) |
| |||||||||||
6.39% | 01/15/341,2 | 1,482,717 | 1,470,687 | |||||||||
CAMB Commercial Mortgage Trust, |
| |||||||||||
Series 2019-LIFE, Class B |
| |||||||||||
(CME Term SOFR 1-Month plus 1.55%) |
| |||||||||||
6.87% | 12/15/371,2 | 3,128,000 | 3,128,981 | |||||||||
CFCRE Commercial Mortgage Trust, |
| |||||||||||
Series 2016-C4, Class ASB |
| |||||||||||
3.09% | 05/10/58 | 859,564 | 842,031 | |||||||||
See accompanying Notes to Financial Statements.
| 127 / Annual Report March 2024 |
Table of Contents
Low Duration Bond Fund
Schedule of Portfolio Investments
March 31, 2024
| Issues | Maturity Date | Principal Amount | Value | |||||||
| MORTGAGE-BACKED (continued) |
| |||||||||
| Non-Agency Commercial Mortgage-Backed (continued) |
| |||||||||
Cold Storage Trust, |
| |||||||||
Series 2020-ICE5, Class A | ||||||||||
(CME Term SOFR 1-Month plus 1.01%) |
| |||||||||
6.33% | 11/15/371,2 | $ | 8,456,667 | $ | 8,443,075 | |||||
Commercial Mortgage Trust, | ||||||||||
Series 2015-PC1, Class A4 |
| |||||||||
3.62% | 07/10/50 | 2,621,647 | 2,579,662 | |||||||
Commercial Mortgage Trust, | ||||||||||
Series 2016-DC2, Class ASB |
| |||||||||
3.55% | 02/10/49 | 83,872 | 82,539 | |||||||
Credit Suisse Mortgage Capital Certificates, |
| |||||||||
Series 2019-ICE4, Class A |
| |||||||||
(CME Term SOFR 1-Month plus 1.03%) |
| |||||||||
6.35% | 05/15/361,2 | 11,067,266 | 11,064,489 | |||||||
DBGS Mortgage Trust, |
| |||||||||
Series 2018-BIOD, Class A |
| |||||||||
(CME Term SOFR 1-Month plus 1.10%) |
| |||||||||
6.42% | 05/15/351,2 | 9,082,801 | 9,061,846 | |||||||
Extended Stay America Trust, |
| |||||||||
Series 2021-ESH, Class A | ||||||||||
(CME Term SOFR 1-Month plus 1.19%) |
| |||||||||
6.52% | 07/15/381,2 | 2,038,790 | 2,039,414 | |||||||
Great Wolf Trust, |
| |||||||||
Series 2019-WOLF, Class A |
| |||||||||
(CME Term SOFR 1-Month plus 1.35%) |
| |||||||||
6.67% | 12/15/361,2 | 2,819,427 | 2,819,224 | |||||||
Great Wolf Trust, |
| |||||||||
Series 2019-WOLF, Class C |
| |||||||||
(CME Term SOFR 1-Month plus 1.95%) |
| |||||||||
7.27% | 12/15/361,2 | 2,874,838 | 2,863,465 | |||||||
Great Wolf Trust, |
| |||||||||
Series 2019-WOLF, Class F |
| |||||||||
(CME Term SOFR 1-Month plus 3.45%) |
| |||||||||
8.77% | 12/15/361,2 | 3,293,206 | 3,267,907 | |||||||
GS Mortgage Securities Trust, |
| |||||||||
Series 2011-GC5, Class AS |
| |||||||||
5.15% | 08/10/442,6 | 2,335,096 | 2,263,272 | |||||||
GS Mortgage Securities Trust, |
| |||||||||
Series 2014-GC20, Class AS |
| |||||||||
4.26% | 04/10/47 | 1,117,838 | 1,113,523 | |||||||
Houston Galleria Mall Trust, |
| |||||||||
Series 2015-HGLR, Class A1A1 |
| |||||||||
3.09% | 03/05/372 | 3,750,000 | 3,633,411 | |||||||
Houston Galleria Mall Trust, |
| |||||||||
Series 2015-HGLR, Class A1A2 |
| |||||||||
3.09% | 03/05/372 | 5,050,000 | 4,894,434 | |||||||
Independence Plaza Trust, |
| |||||||||
Series 2018-INDP, Class A |
| |||||||||
3.76% | 07/10/352 | 3,294,364 | 3,154,662 | |||||||
Independence Plaza Trust, |
| |||||||||
Series 2018-INDP, Class B |
| |||||||||
3.91% | 07/10/352 | 10,000,000 | 9,514,498 | |||||||
| JPMorgan Chase Commercial Mortgage Securities Trust, |
| |||||||||
Series 2013-LC11, Class XA (IO) |
| |||||||||
0.90% | 04/15/466 | 1,352,676 | 6,353 | |||||||
| Issues | Maturity Date | Principal Amount | Value | |||||||||
| MORTGAGE-BACKED (continued) |
| |||||||||||
| Non-Agency Commercial Mortgage-Backed (continued) |
| |||||||||||
JPMorgan Chase Commercial Mortgage Securities Trust, |
| |||||||||||
Series 2021-MHC, Class A |
| |||||||||||
(CME Term SOFR 1-Month plus 0.91%) |
| |||||||||||
6.24% | 04/15/381,2 | $ | 4,932,362 | $ | 4,926,904 | |||||||
MF1 Ltd., | ||||||||||||
Series 2020-FL4, Class A |
| |||||||||||
(CME Term SOFR 1-Month plus 1.81%) |
| |||||||||||
7.14% | 11/15/351,2 | 5,185,106 | 5,198,567 | |||||||||
Morgan Stanley Bank of America Merrill Lynch Trust, |
| |||||||||||
Series 2015-C21, Class XA (IO) |
| |||||||||||
0.83% | 03/15/486 | 30,490,263 | 104,623 | |||||||||
One New York Plaza Trust, |
| |||||||||||
Series 2020-1NYP, Class A |
| |||||||||||
(CME Term SOFR 1-Month plus 1.06%) |
| |||||||||||
6.39% | 01/15/361,2 | 2,000,000 | 1,949,715 | |||||||||
Shelter Growth CRE Issuer Ltd., |
| |||||||||||
Series 2021-FL3, Class A |
| |||||||||||
(Cayman Islands) |
| |||||||||||
(CME Term SOFR 1-Month plus 1.19%) |
| |||||||||||
6.52% | 09/15/361,2,3 | 1,987,493 | 1,984,313 | |||||||||
SMRT, | ||||||||||||
Series 2022-MINI, Class A |
| |||||||||||
(CME Term SOFR 1-Month plus 1.00%) |
| |||||||||||
6.33% | 01/15/391,2 | 2,885,000 | 2,876,295 | |||||||||
SREIT Trust, |
| |||||||||||
Series 2021-MFP2, Class A |
| |||||||||||
(CME Term SOFR 1-Month plus 0.94%) |
| |||||||||||
6.26% | 11/15/361,2 | 3,640,000 | 3,621,227 | |||||||||
SREIT Trust, |
| |||||||||||
Series 2021-PALM, Class E |
| |||||||||||
(CME Term SOFR 1-Month plus 2.02%) |
| |||||||||||
7.35% | 10/15/341,2 | 2,500,000 | 2,453,978 | |||||||||
UBS Commercial Mortgage Trust, |
| |||||||||||
Series 2018-C12, Class A2 |
| |||||||||||
4.15% | 08/15/51 | 979,370 | 964,530 | |||||||||
Wells Fargo Commercial Mortgage Trust, |
| |||||||||||
Series 2017-SMP, Class A |
| |||||||||||
(CME Term SOFR 1-Month plus 0.92%) |
| |||||||||||
6.25% | 12/15/341,2 | 3,000,000 | 2,844,420 | |||||||||
Westfield Galleria at Roseville |
| |||||||||||
8.40% | 03/29/254,5 | 2,700,000 | 2,697,300 | |||||||||
|
|
| ||||||||||
| 131,118,467 | ||||||||||||
|
|
| ||||||||||
Non-Agency Mortgage-Backed — 15.99% |
| |||||||||||
ACE Securities Corp. Home Equity Loan Trust, |
| |||||||||||
Series 2006-OP1, Class A2D |
| |||||||||||
(CME Term SOFR 1-Month plus 0.59%) |
| |||||||||||
5.92% | 04/25/361 | 6,142,351 | 5,429,420 | |||||||||
| Ameriquest Mortgage Securities, Inc., Asset-Backed Pass-Through Certificates, |
| |||||||||||
Series 2005-R9, Class M1 |
| |||||||||||
(CME Term SOFR 1-Month plus 0.82%) |
| |||||||||||
5.91% | 11/25/351 | 5,609,861 | 5,463,196 | |||||||||
See accompanying Notes to Financial Statements.
| Annual Report March 2024 / 128 |
Table of Contents
Low Duration Bond Fund
Schedule of Portfolio Investments
March 31, 2024
| Issues | Maturity Date | Principal Amount | Value | |||||||
| MORTGAGE-BACKED (continued) |
| |||||||||
Non-Agency Mortgage-Backed (continued) |
| |||||||||
| Argent Securities, Inc., Asset-Backed Pass-Through Certificates, |
| |||||||||
Series 2005-W2, Class M1 |
| |||||||||
(CME Term SOFR 1-Month plus 0.85%) |
| |||||||||
6.18% | 10/25/351 | $ | 3,533,232 | $ | 3,450,571 | |||||
| Asset-Backed Securities Corp. Home Equity Loan Trust, |
| |||||||||
Series 2006-HE3, Class A5 |
| |||||||||
(CME Term SOFR 1-Month plus 0.65%) |
| |||||||||
2.89% | 03/25/361 | 2,033,740 | 1,960,699 | |||||||
Banc of America Alternative Loan Trust, |
| |||||||||
Series 2003-8, Class 1CB1 |
| |||||||||
5.50% | 10/25/33 | 2,765,494 | 2,672,776 | |||||||
Bear Stearns ALT-A Trust, |
| |||||||||
Series 2004-10, Class M1 |
| |||||||||
(CME Term SOFR 1-Month plus 1.01%) |
| |||||||||
6.34% | 09/25/341 | 608,733 | 609,247 | |||||||
Bear Stearns ARM Trust, |
| |||||||||
Series 2004-3, Class 4A |
| |||||||||
5.09% | 07/25/346 | 186,305 | 176,810 | |||||||
BNC Mortgage Loan Trust, |
| |||||||||
Series 2007-1, Class A4 |
| |||||||||
(CME Term SOFR 1-Month plus 0.27%) |
| |||||||||
5.60% | 03/25/371 | 3,817,059 | 3,564,044 | |||||||
Chase Funding Trust, |
| |||||||||
Series 2002-2, Class 2A1 |
| |||||||||
(CME Term SOFR 1-Month plus 0.61%) |
| |||||||||
5.94% | 05/25/321 | 962,726 | 951,935 | |||||||
Chase Mortgage Finance Trust, |
| |||||||||
Series 2007-A1, Class 8A1 |
| |||||||||
5.81% | 02/25/376 | 2,152,377 | 2,068,870 | |||||||
Chase Mortgage Finance Trust, |
| |||||||||
Series 2007-A2, Class 2A3 |
| |||||||||
5.81% | 06/25/356 | 417,947 | 408,893 | |||||||
Chevy Chase Mortgage Funding LLC, Mortgage-Backed Certificates, |
| |||||||||
Series 2005-2A, Class A1 |
| |||||||||
(CME Term SOFR 1-Month plus 0.29%) |
| |||||||||
5.62% | 05/25/361,2 | 322,185 | 288,331 | |||||||
CIM Trust, |
| |||||||||
Series 2021-R3, Class A1A |
| |||||||||
1.95% | 06/25/572,6 | 6,119,941 | 5,411,251 | |||||||
CIM Trust, |
| |||||||||
Series 2022-I1, Class A1 |
| |||||||||
4.35% | 02/25/672,6 | 4,830,071 | 4,700,501 | |||||||
Citigroup Mortgage Loan Trust, |
| |||||||||
Series 2006-AMC1, Class A1 |
| |||||||||
(CME Term SOFR 1-Month plus 0.40%) |
| |||||||||
5.73% | 09/25/361,2 | 5,644,500 | 5,405,138 | |||||||
Countrywide Asset-Backed Certificates Trust, |
| |||||||||
Series 2006-14, Class 2A3 |
| |||||||||
(CME Term SOFR 1-Month plus 0.59%) |
| |||||||||
5.92% | 02/25/371 | 2,161,485 | 2,069,422 | |||||||
Countrywide Asset-Backed Certificates Trust, |
| |||||||||
Series 2006-4, Class M1 |
| |||||||||
(CME Term SOFR 1-Month plus 0.64%) |
| |||||||||
5.97% | 07/25/361 | 2,670,891 | 2,622,194 | |||||||
| Issues | Maturity Date | Principal Amount | Value | |||||||
| MORTGAGE-BACKED (continued) |
| |||||||||
Non-Agency Mortgage-Backed (continued) |
| |||||||||
| Countrywide Asset-Backed Certificates Trust, |
| |||||||||
Series 2007-7, Class 1A |
| |||||||||
(CME Term SOFR 1-Month plus 0.31%) |
| |||||||||
5.64% | 10/25/471 | $ | 6,991,707 | $ | 6,520,017 | |||||
| Countrywide Home Loan Mortgage Pass-Through Trust, |
| |||||||||
Series 2004-14, Class 4A1 |
| |||||||||
5.36% | 08/25/346 | 6,722 | 6,024 | |||||||
| Credit Suisse First Boston Mortgage Securities Corp., |
| |||||||||
Series 2004-AR1, Class 5A1 |
| |||||||||
5.80% | 02/25/346 | 76,934 | 75,174 | |||||||
| Credit Suisse Mortgage Capital Trust |
| |||||||||
Series 2022-RPL3, Class A1 |
| |||||||||
3.78% | 03/25/612,6 | 7,169,991 | 7,116,681 | |||||||
| Credit-Based Asset Servicing and Securitization LLC, |
| |||||||||
Series 2007-CB4, Class A1A |
| |||||||||
(CME Term SOFR 1-Month plus 0.20%) |
| |||||||||
3.17% | 04/25/371 | 354,238 | 348,506 | |||||||
| Credit-Based Asset Servicing and Securitization LLC, |
| |||||||||
Series 2007-CB5, Class A1 |
| |||||||||
(CME Term SOFR 1-Month plus 0.17%) |
| |||||||||
3.39% | 04/25/371 | 1,867,978 | 1,145,000 | |||||||
| DSLA Mortgage Loan Trust, |
| |||||||||
Series 2005-AR2, Class 2A1A |
| |||||||||
(CME Term SOFR 1-Month plus 0.53%) |
| |||||||||
5.86% | 03/19/451 | 217,889 | 204,235 | |||||||
| Fannie Mae Connecticut Avenue Securities, |
| |||||||||
Series 2022-R03, Class 1M1 |
| |||||||||
(SOFR30A plus 2.10%) |
| |||||||||
7.42% | 03/25/421,2 | 4,057,940 | 4,120,456 | |||||||
| Fannie Mae Connecticut Avenue Securities, |
| |||||||||
Series 2023-R01, Class 1M1 |
| |||||||||
(SOFR30A plus 2.40%) |
| |||||||||
7.72% | 12/25/421,2 | 2,737,734 | 2,813,092 | |||||||
| First Franklin Mortgage Loan Trust, |
| |||||||||
Series 2004-FF5, Class A3C |
| |||||||||
(CME Term SOFR 1-Month plus 1.11%) |
| |||||||||
6.44% | 08/25/341 | 332,108 | 298,556 | |||||||
| First Franklin Mortgage Loan Trust, |
| |||||||||
Series 2005-FF8, Class M2 |
| |||||||||
(CME Term SOFR 1-Month plus 0.89%) |
| |||||||||
6.22% | 09/25/351 | 1,151,903 | 1,146,138 | |||||||
First Horizon Alternative Mortgage Securities Trust, |
| |||||||||
Series 2004-AA3, Class A1 |
| |||||||||
5.82% | 09/25/346 | 899 | 885 | |||||||
Freddie Mac Structured Agency Credit Risk Debt Notes, |
| |||||||||
Series 2022-DNA6, Class M1A |
| |||||||||
(SOFR30A plus 2.15%) |
| |||||||||
7.47% | 09/25/421,2 | 1,437,454 | 1,458,243 | |||||||
Fremont Home Loan Trust, |
| |||||||||
Series 2005-E, Class 2A4 |
| |||||||||
(CME Term SOFR 1-Month plus 0.77%) |
| |||||||||
6.10% | 01/25/361 | 5,256,861 | 4,976,845 | |||||||
GMACM Home Equity Loan Trust, |
| |||||||||
Series 2000-HE2, Class A1 |
| |||||||||
(CME Term SOFR 1-Month plus 0.55%) |
| |||||||||
4.64% | 06/25/301 | 51,079 | 46,962 | |||||||
See accompanying Notes to Financial Statements.
| 129 / Annual Report March 2024 |
Table of Contents
Low Duration Bond Fund
Schedule of Portfolio Investments
March 31, 2024
| Issues | Maturity Date | Principal Amount | Value | |||||||
| MORTGAGE-BACKED (continued) |
| |||||||||
Non-Agency Mortgage-Backed (continued) |
| |||||||||
GSAMP Trust, |
| |||||||||
Series 2005-HE4, Class M3 |
| |||||||||
(CME Term SOFR 1-Month plus 0.89%) |
| |||||||||
6.22% | 07/25/451 | $ | 1,196,249 | $ | 1,161,421 | |||||
GSAMP Trust, |
| |||||||||
Series 2006-HE2, Class M1 |
| |||||||||
(CME Term SOFR 1-Month plus 0.59%) |
| |||||||||
5.92% | 03/25/461 | 2,784,411 | 2,707,801 | |||||||
| GSR Mortgage Loan Trust, |
| |||||||||
Series 2005-AR7, Class 2A1 |
| |||||||||
4.70% | 11/25/356 | 63,687 | 57,401 | |||||||
Impac CMB Trust, |
| |||||||||
Series 2005-5, Class A1 |
| |||||||||
(CME Term SOFR 1-Month plus 0.43%) |
| |||||||||
6.08% | 08/25/351 | 832,816 | 775,596 | |||||||
IndyMac Index Mortgage Loan Trust, |
| |||||||||
Series 2004-AR8, Class 2A2A |
| |||||||||
(CME Term SOFR 1-Month plus 0.91%) |
| |||||||||
6.24% | 11/25/341 | 416,794 | 368,082 | |||||||
| IndyMac Manufactured Housing Contract Pass-Through Certificates, |
| |||||||||
Series 1998-1, Class A4 |
| |||||||||
6.49% | 09/25/28 | 121,800 | 121,646 | |||||||
JPMorgan Mortgage Acquisition Trust, |
| |||||||||
Series 2005-FRE1, Class M1 |
| |||||||||
(CME Term SOFR 1-Month plus 0.73%) |
| |||||||||
3.18% | 10/25/351 | 2,949,802 | 2,854,987 | |||||||
JPMorgan Mortgage Acquisition Trust, |
| |||||||||
Series 2006-NC1, Class M1 |
| |||||||||
(CME Term SOFR 1-Month plus 0.59%) |
| |||||||||
5.92% | 04/25/361 | 3,926,679 | 3,767,739 | |||||||
JPMorgan Mortgage Acquisition Trust, |
| |||||||||
Series 2007-CH4, Class M1 |
| |||||||||
(CME Term SOFR 1-Month plus 0.34%) |
| |||||||||
5.67% | 05/25/371 | 7,750,000 | 7,443,854 | |||||||
JPMorgan Mortgage Acquisition Trust, |
| |||||||||
Series 2007-CH5, Class A1 |
| |||||||||
(CME Term SOFR 1-Month plus 0.27%) |
| |||||||||
5.60% | 06/25/371 | 7,965,447 | 7,886,640 | |||||||
JPMorgan Mortgage Trust, |
| |||||||||
Series 2007-A1, Class 1A1 |
| |||||||||
5.66% | 07/25/356 | 156,858 | 155,761 | |||||||
JPMorgan Mortgage Trust, |
| |||||||||
Series 2007-A1, Class 5A2 |
| |||||||||
5.52% | 07/25/356 | 63,529 | 61,993 | |||||||
Lehman ABS Manufactured Housing Contract Trust, |
| |||||||||
Series 2001-B, Class AIOC (IO) |
| |||||||||
0.55% | 04/15/404,5,6 | 42,478,871 | 478,117 | |||||||
Long Beach Mortgage Loan Trust, |
| |||||||||
Series 2005-WL3, Class M1 |
| |||||||||
(CME Term SOFR 1-Month plus 0.76%) |
| |||||||||
6.09% | 11/25/351 | 150,112 | 149,931 | |||||||
MASTR Adjustable Rate Mortgages Trust, |
| |||||||||
Series 2003-6, Class 4A2 |
| |||||||||
4.37% | 01/25/346 | 1,927 | 1,843 | |||||||
| Issues | Maturity Date | Principal Amount | Value | |||||||
| MORTGAGE-BACKED (continued) |
| |||||||||
Non-Agency Mortgage-Backed (continued) |
| |||||||||
MASTRAdjustable Rate Mortgages Trust, |
| |||||||||
Series 2004-13, Class 3A1 |
| |||||||||
5.37% | 11/21/346 | $ | 277,150 | $ | 260,250 | |||||
MASTRAdjustable Rate Mortgages Trust, |
| |||||||||
Series 2004-3, Class 3A3 |
| |||||||||
5.19% | 04/25/346 | 37,418 | 34,261 | |||||||
MASTRAlternative Loan Trust, |
| |||||||||
Series 2003-1, Class 1A1 |
| |||||||||
6.25% | 12/25/32 | 581,580 | 577,680 | |||||||
MASTRAlternative Loan Trust, |
| |||||||||
Series 2003-5, Class 4A1 |
| |||||||||
5.50% | 07/25/33 | 1,388,817 | 1,360,338 | |||||||
MASTRAlternative Loan Trust, |
| |||||||||
Series 2003-9, Class 4A1 |
| |||||||||
5.25% | 11/25/33 | 1,536,653 | 1,481,242 | |||||||
MASTRAlternative Loan Trust, |
| |||||||||
Series 2004-7, Class 1A1 |
| |||||||||
5.50% | 07/25/34 | 1,341,724 | 1,293,330 | |||||||
MASTR Asset-Backed Securities Trust, |
| |||||||||
Series 2006-HE1, Class M1 |
| |||||||||
(CME Term SOFR 1-Month plus 0.67%) |
| |||||||||
6.00% | 01/25/361 | 4,651,026 | 4,488,155 | |||||||
MASTR Seasoned Securitization Trust, |
| |||||||||
Series 2004-1, Class 4A1 |
| |||||||||
6.22% | 10/25/326 | 78,199 | 75,491 | |||||||
Merrill Lynch First Franklin Mortgage Loan Trust, |
| |||||||||
Series 2007-3, Class A2C |
| |||||||||
(CME Term SOFR 1-Month plus 0.47%) |
| |||||||||
5.80% | 06/25/371 | 3,241,889 | 3,120,686 | |||||||
Merrill Lynch Mortgage Investors Trust, |
| |||||||||
Series 2004- A4, Class A1 |
| |||||||||
4.92% | 08/25/346 | 396,847 | 375,107 | |||||||
Mid-State Capital Corp. Trust, |
| |||||||||
Series 2006-1, Class A |
| |||||||||
5.79% | 10/15/402 | 2,247,127 | 2,207,616 | |||||||
Mid-State Trust, |
| |||||||||
Series 10W, Class A2 |
| |||||||||
5.82% | 02/15/36 | 210,374 | 205,438 | |||||||
Morgan Stanley ABS Capital I Trust, |
| |||||||||
Series 2004-NC7, Class M2 |
| |||||||||
(CME Term SOFR 1-Month plus 1.04%) |
| |||||||||
6.37% | 07/25/341 | 685,734 | 685,810 | |||||||
MortgageIT Trust, |
| |||||||||
Series 2005-3, Class A1 |
| |||||||||
(CME Term SOFR 1-Month plus 0.71%) |
| |||||||||
6.04% | 08/25/351 | 80,629 | 76,420 | |||||||
MortgageIT Trust, |
| |||||||||
Series 2005-4, Class A1 |
| |||||||||
(CME Term SOFR 1-Month plus 0.67%) |
| |||||||||
6.00% | 10/25/351 | 1,831,688 | 1,823,588 | |||||||
Nationstar Home Equity Loan Trust, |
| |||||||||
Series 2007-B, Class 1AV1 |
| |||||||||
(CME Term SOFR 1-Month plus 0.33%) |
| |||||||||
5.66% | 04/25/371 | 1,309,077 | 1,302,161 | |||||||
See accompanying Notes to Financial Statements.
| Annual Report March 2024 / 130 |
Table of Contents
Low Duration Bond Fund
Schedule of Portfolio Investments
March 31, 2024
| Issues | Maturity Date | Principal Amount | Value | |||||||
| MORTGAGE-BACKED (continued) |
| |||||||||
Non-Agency Mortgage-Backed (continued) |
| |||||||||
New Century Home Equity Loan Trust, |
| |||||||||
Series 2005-D, Class M1 |
| |||||||||
(CME Term SOFR 1-Month plus 0.79%) |
| |||||||||
6.12% | 02/25/361 | $ | 4,304,219 | $ | 4,102,415 | |||||
NLT Trust, |
| |||||||||
Series 2021-INV2, Class A1 |
| |||||||||
1.16% | 08/25/562,6 | 5,663,873 | 4,660,991 | |||||||
Opteum Mortgage Acceptance Corp. Asset-Backed |
| |||||||||
Pass-Through Certificates, |
| |||||||||
Series 2005-5, Class 1APT |
| |||||||||
(CME Term SOFR 1-Month plus 0.67%) |
| |||||||||
6.00% | 12/25/351 | 2,583,198 | 2,504,422 | |||||||
Park Place Securities, Inc., Asset-Backed Pass- Through Certificates, |
| |||||||||
Series 2005-WCW3, Class M2 |
| |||||||||
(CME Term SOFR 1-Month plus 0.85%) |
| |||||||||
6.18% | 08/25/351 | 1,829,191 | 1,764,395 | |||||||
PHH Alternative Mortgage Trust, |
| |||||||||
Series 2007-3, Class A3 |
| |||||||||
(CME Term SOFR 1-Month plus 0.71%) |
| |||||||||
6.04% | 07/25/371 | 4,102,695 | 3,955,363 | |||||||
PRPM LLC, |
| |||||||||
Series 2020-4, Class A1 (STEP-reset date 04/25/24) |
| |||||||||
5.61% | 10/25/252 | 5,469,793 | 5,462,915 | |||||||
PRPM LLC, |
| |||||||||
Series 2021-3, Class A1 (STEP-reset date 04/25/24) |
| |||||||||
1.87% | 04/25/262 | 6,524,400 | 6,389,701 | |||||||
PRPM LLC, |
| |||||||||
Series 2022-3, Class A1 (STEP-reset date 04/25/24) |
| |||||||||
5.56% | 06/25/272 | 9,188,970 | 9,079,902 | |||||||
PRPM, LLC, |
| |||||||||
Series 2021-10, Class A1 (STEP-reset date 04/25/24) |
| |||||||||
2.49% | 10/25/262 | 4,837,169 | 4,767,195 | |||||||
PRPM, LLC, |
| |||||||||
Series 2021-7, Class A1 (STEP-reset date 04/25/24) |
| |||||||||
1.87% | 08/25/262 | 9,240,248 | 8,964,620 | |||||||
Residential Accredit Loans Trust, |
| |||||||||
Series 2005-QA3, Class NB1 |
| |||||||||
3.63% | 03/25/356 | 861,242 | 458,720 | |||||||
Residential Asset Mortgage Products Trust, |
| |||||||||
Series 2005-EFC1, Class M5 |
| |||||||||
(CME Term SOFR 1-Month plus 0.76%) |
| |||||||||
6.42% | 05/25/351 | 1,479,949 | 1,466,200 | |||||||
Residential Asset Securities Corp., |
| |||||||||
Series 2005-KS11, Class M2 |
| |||||||||
(CME Term SOFR 1-Month plus 0.74%) |
| |||||||||
6.07% | 12/25/351 | 882,631 | 879,558 | |||||||
Saxon Asset Securities Trust, |
| |||||||||
Series 2006-2, Class M1 |
| |||||||||
(CME Term SOFR 1-Month plus 0.55%) |
| |||||||||
5.88% | 09/25/361 | 11,000,000 | 10,383,367 | |||||||
Securitized Asset-Backed Receivables LLC Trust, |
| |||||||||
Series 2006-CB1, Class AF2 (STEP-reset date 05/25/24) |
| |||||||||
2.84% | 01/25/36 | 1,367,026 | 1,109,738 | |||||||
| Issues | Maturity Date | Principal Amount | Value | |||||||||
| MORTGAGE-BACKED (continued) |
| |||||||||||
Non-Agency Mortgage-Backed (continued) |
| |||||||||||
Soundview Home Loan Trust, |
| |||||||||||
Series 2006-OPT4, Class 2A4 |
| |||||||||||
(CME Term SOFR 1-Month plus 0.57%) |
| |||||||||||
5.90% | 06/25/361 | $ | 3,160,639 | $ | 3,002,960 | |||||||
Specialty Underwriting & Residential Finance Trust, |
| |||||||||||
Series 2005-BC2, Class M3 |
| |||||||||||
(CME Term SOFR 1-Month plus 1.09%) |
| |||||||||||
6.42% | 12/25/351 | 997,475 | 991,876 | |||||||||
Structured Asset Securities Corp. Mortgage Loan |
| |||||||||||
Trust, Series 2006-BC6, Class A4 |
| |||||||||||
(CME Term SOFR 1-Month plus 0.28%) |
| |||||||||||
5.61% | 01/25/371 | 859,704 | 844,381 | |||||||||
Structured Asset Securities Corp. Mortgage Pass- |
| |||||||||||
Through Certificates, |
| |||||||||||
Series 2003-26A, Class 3A5 |
| |||||||||||
6.51% | 09/25/336 | 169,304 | 162,313 | |||||||||
Terwin Mortgage Trust, |
| |||||||||||
Series 2004-7HE, Class A1 |
| |||||||||||
(CME Term SOFR 1-Month plus 1.21%) |
| |||||||||||
6.54% | 07/25/341,2 | 59,991 | 56,732 | |||||||||
VOLT XCIV LLC, |
| |||||||||||
Series 2021-NPL3, Class A1 (STEP-reset date 04/25/24) |
| |||||||||||
5.24% | 02/27/512 | 4,825,491 | 4,725,312 | |||||||||
WaMu Mortgage Pass-Through Certificates, |
| |||||||||||
Series 2004-AR14, Class A1 |
| |||||||||||
5.31% | 01/25/356 | 252,862 | 240,042 | |||||||||
WaMu Mortgage Pass-Through Certificates, |
| |||||||||||
Series 2004-CB2, Class 2A |
| |||||||||||
5.50% | 07/25/34 | 471,275 | 448,271 | |||||||||
WaMu Mortgage Pass-Through Certificates, |
| |||||||||||
Series 2005-AR13, Class A1A1 |
| |||||||||||
(CME Term SOFR 1-Month plus 0.69%) |
| |||||||||||
6.02% | 10/25/451 | 750,410 | 719,133 | |||||||||
WaMu Mortgage Pass-Through Certificates, |
| |||||||||||
Series 2005-AR2, Class 2A21 |
| |||||||||||
(CME Term SOFR 1-Month plus 0.77%) |
| |||||||||||
6.10% | 01/25/451 | 104,332 | 101,929 | |||||||||
|
| |||||||||||
| 202,132,948 | ||||||||||||
|
| |||||||||||
U.S. Agency Commercial Mortgage-Backed — 1.18% |
| |||||||||||
Fannie Mae-Aces, |
| |||||||||||
Series 2021-M1, Class A1 |
| |||||||||||
0.87% | 11/25/30 | 1,813,510 | 1,618,833 | |||||||||
Freddie Mac Multifamily Structured Pass-Through |
| |||||||||||
Certificates, |
| |||||||||||
Series KJ34, Class A1 |
| |||||||||||
0.68% | 06/25/26 | 1,459,944 | 1,397,972 | |||||||||
Freddie Mac Multifamily Structured Pass-Through |
| |||||||||||
Certificates, |
| |||||||||||
Series KJ37, Class A1 |
| |||||||||||
1.68% | 12/25/27 | 10,864,967 | 9,975,712 | |||||||||
See accompanying Notes to Financial Statements.
| 131 / Annual Report March 2024 |
Table of Contents
Low Duration Bond Fund
Schedule of Portfolio Investments
March 31, 2024
| Issues | Maturity Date | Principal Amount | Value | |||||||||
| MORTGAGE-BACKED (continued) |
| |||||||||||
U.S. Agency Commercial Mortgage-Backed (continued) |
| |||||||||||
Freddie Mac Multifamily Structured Pass-Through Certificates, |
| |||||||||||
Series Q004, Class AFL |
| |||||||||||
(Federal Reserve US 12-Month Cumulative Average plus 0.74%) |
| |||||||||||
5.83% | 05/25/441 | $ | 993,724 | $ | 987,929 | |||||||
Ginnie Mae, |
| |||||||||||
Series 2008-92, Class E |
| |||||||||||
5.56% | 03/16/446 | 1,010,532 | 1,003,999 | |||||||||
|
|
| ||||||||||
| 14,984,445 | ||||||||||||
|
|
| ||||||||||
U.S. Agency Mortgage-Backed — 28.04% |
| |||||||||||
Fannie Mae Pool 735861 |
| |||||||||||
6.50% | 09/01/33 | 4,269 | 4,326 | |||||||||
Fannie Mae Pool 770900 |
| |||||||||||
(RFUCCT1Y plus 1.56%) |
| |||||||||||
4.94% | 04/01/341 | 66,955 | 66,977 | |||||||||
Fannie Mae Pool AD0538 |
| |||||||||||
6.00% | 05/01/24 | 1,312 | 1,308 | |||||||||
Fannie Mae Pool AE0083 |
| |||||||||||
6.00% | 01/01/40 | 389,731 | 403,920 | |||||||||
Fannie Mae Pool AL0851 |
| |||||||||||
6.00% | 10/01/40 | 478,143 | 499,793 | |||||||||
Fannie Mae REMICS, |
| |||||||||||
Series 1997-76, Class FS |
| |||||||||||
(SOFR30A plus 0.56%) |
| |||||||||||
5.88% | 09/17/271 | 2,836 | 2,801 | |||||||||
Fannie Mae REMICS, |
| |||||||||||
Series 2001-60, Class OF |
| |||||||||||
(SOFR30A plus 1.06%) |
| |||||||||||
6.38% | 10/25/311 | 249,332 | 251,957 | |||||||||
Fannie Mae REMICS, |
| |||||||||||
Series 2007-64, Class FA |
| |||||||||||
(SOFR30A plus 0.58%) |
| |||||||||||
5.90% | 07/25/371 | 137,785 | 137,126 | |||||||||
Fannie Mae REMICS, |
| |||||||||||
Series 2009-85, Class LF |
| |||||||||||
(SOFR30A plus 1.31%) |
| |||||||||||
6.63% | 10/25/491 | 1,430,574 | 1,450,078 | |||||||||
Fannie Mae REMICS, |
| |||||||||||
Series 2009-96, Class FA |
| |||||||||||
(SOFR30A plus 1.01%) |
| |||||||||||
6.33% | 11/25/491 | 862,468 | 869,624 | |||||||||
Fannie Mae REMICS, |
| |||||||||||
Series 2010-109, Class PF |
| |||||||||||
(SOFR30A plus 0.51%) |
| |||||||||||
5.83% | 10/25/401 | 453,346 | 448,225 | |||||||||
Fannie Mae REMICS, |
| |||||||||||
Series 2010-26, Class S (IO) |
| |||||||||||
(-1.00 X SOFR30A plus 6.12%, 6.23% Cap) |
| |||||||||||
0.80% | 11/25/361 | 2,970,004 | 266,602 | |||||||||
Fannie Mae REMICS, |
| |||||||||||
Series 2010-43, Class DP |
| |||||||||||
5.00% | 05/25/40 | 356,536 | 354,152 | |||||||||
| Issues | Maturity Date | Principal Amount | Value | |||||||
| MORTGAGE-BACKED (continued) |
| |||||||||
U.S. Agency Mortgage-Backed (continued) |
| |||||||||
Fannie Mae REMICS, |
| |||||||||
Series 2010-6, Class BF |
| |||||||||
(SOFR30A plus 0.87%) |
| |||||||||
6.19% | 02/25/401 | $ | 790,101 | $ | 790,930 | |||||
Fannie Mae REMICS, |
| |||||||||
Series 2010-95, Class S (IO) |
| |||||||||
(-1.00 X SOFR30A plus 6.49%, 6.60% Cap) |
| |||||||||
1.17% | 09/25/401 | 2,404,027 | 242,767 | |||||||
Fannie Mae REMICS, |
| |||||||||
Series 2019-79, Class FA |
| |||||||||
(SOFR30A plus 0.61%) |
| |||||||||
5.93% | 01/25/501 | 2,809,032 | 2,772,258 | |||||||
Fannie Mae REMICS, |
| |||||||||
Series 2020-10, Class FA |
| |||||||||
(SOFR30A plus 0.61%) |
| |||||||||
5.93% | 03/25/501 | 5,020,790 | 4,888,139 | |||||||
Freddie Mac Gold Pool A45796 |
| |||||||||
7.00% | 01/01/33 | 743 | 767 | |||||||
Freddie Mac Gold Pool C46104 |
| |||||||||
6.50% | 09/01/29 | 1,844 | 1,893 | |||||||
Freddie Mac REMICS, |
| |||||||||
Series 2174, Class PN |
| |||||||||
6.00% | 07/15/29 | 134,188 | 133,659 | |||||||
Freddie Mac REMICS, |
| |||||||||
Series 2454, Class FQ |
| |||||||||
(SOFR30A plus 1.11%) |
| |||||||||
6.43% | 06/15/311 | 2,180 | 2,199 | |||||||
Freddie Mac REMICS, |
| |||||||||
Series 2733, Class FB |
| |||||||||
(SOFR30A plus 0.71%) |
| |||||||||
6.03% | 10/15/331 | 1,026,326 | 1,019,300 | |||||||
Freddie Mac REMICS, |
| |||||||||
Series 3071, Class TF |
| |||||||||
(SOFR30A plus 0.41%) |
| |||||||||
5.73% | 04/15/351 | 269,179 | 268,873 | |||||||
Freddie Mac REMICS, |
| |||||||||
Series 3294, Class CB |
| |||||||||
5.50% | 03/15/37 | 145,285 | 147,823 | |||||||
Freddie Mac REMICS, |
| |||||||||
Series 3300, Class FA |
| |||||||||
(SOFR30A plus 0.41%) |
| |||||||||
5.73% | 08/15/351 | 291,043 | 286,673 | |||||||
Freddie Mac REMICS, |
| |||||||||
Series 3325, Class NF |
| |||||||||
(SOFR30A plus 0.41%) |
| |||||||||
5.73% | 08/15/351 | 750,555 | 739,286 | |||||||
Freddie Mac REMICS, |
| |||||||||
Series 3524, Class FC |
| |||||||||
(SOFR30A plus 1.05%) |
| |||||||||
6.37% | 06/15/381 | 181,837 | 182,330 | |||||||
Freddie Mac REMICS, |
| |||||||||
Series 3531, Class FM |
| |||||||||
(SOFR30A plus 1.01%) |
| |||||||||
6.33% | 05/15/391 | 102,377 | 102,445 | |||||||
See accompanying Notes to Financial Statements.
| Annual Report March 2024 / 132 |
Table of Contents
Low Duration Bond Fund
Schedule of Portfolio Investments
March 31, 2024
| Issues | Maturity Date | Principal Amount | Value | |||||||
| MORTGAGE-BACKED (continued) |
| |||||||||
| U.S. Agency Mortgage-Backed (continued) |
| |||||||||
Freddie Mac REMICS, |
| |||||||||
Series 4959, Class JF |
| |||||||||
(SOFR30A plus 0.56%) |
| |||||||||
5.88% | 03/25/501 | $ | 4,551,459 | $ | 4,477,077 | |||||
Freddie Mac Strips, |
| |||||||||
Series 240, Class F30 |
| |||||||||
(SOFR30A plus 0.41%) |
| |||||||||
5.73% | 07/15/361 | 870,071 | 858,961 | |||||||
Freddie Mac Strips, |
| |||||||||
Series 263, Class F5 |
| |||||||||
(SOFR30A plus 0.61%) |
| |||||||||
5.93% | 06/15/421 | 1,005,028 | 990,323 | |||||||
Freddie Mac Strips, |
| |||||||||
Series 319, Class F2 |
| |||||||||
(SOFR30A plus 0.61%) |
| |||||||||
5.93% | 11/15/431 | 4,587,987 | 4,491,843 | |||||||
Ginnie Mae (TBA) |
| |||||||||
4.50% | 04/20/54 | 19,300,000 | 18,549,639 | |||||||
5.00% | 04/20/54 | 17,850,000 | 17,546,112 | |||||||
5.50% | 04/20/54 | 7,125,000 | 7,119,972 | |||||||
Ginnie Mae II Pool 2020 |
| |||||||||
8.50% | 06/20/25 | 56 | 56 | |||||||
Ginnie Mae II Pool 2286 |
| |||||||||
8.50% | 09/20/26 | 23 | 23 | |||||||
Ginnie Mae II Pool 2487 |
| |||||||||
8.50% | 09/20/27 | 692 | 693 | |||||||
Ginnie Mae II Pool 80059 |
| |||||||||
| (US Treasury Yield Curve Rate T Note Constant Maturity 1-Year plus 1.50%) |
| |||||||||
3.88% | 04/20/271 | 3,889 | 3,841 | |||||||
Ginnie Mae II Pool 80589 |
| |||||||||
(US Treasury Yield Curve Rate T Note Constant Maturity 1-Year plus 1.50%) |
| |||||||||
3.63% | 03/20/321 | 7,689 | 7,455 | |||||||
Ginnie Mae II Pool 80610 |
| |||||||||
| (US Treasury Yield Curve Rate T Note Constant Maturity 1-Year plus 1.50%) |
| |||||||||
3.88% | 06/20/321 | 3,996 | 3,971 | |||||||
Ginnie Mae II Pool 80968 |
| |||||||||
| (US Treasury Yield Curve Rate T Note Constant Maturity 1-Year plus 1.50%) |
| |||||||||
3.63% | 07/20/341 | 113,146 | 111,348 | |||||||
Ginnie Mae II Pool 81201 |
| |||||||||
| (US Treasury Yield Curve Rate T Note Constant Maturity 1-Year plus 2.00%) |
| |||||||||
4.13% | 01/20/351 | 3,400 | 3,331 | |||||||
Ginnie Mae II Pool 8599 |
| |||||||||
| (US Treasury Yield Curve Rate T Note Constant Maturity 1-Year plus 1.50%) |
| |||||||||
4.00% | 02/20/251 | 1,112 | 1,099 | |||||||
Ginnie Mae, |
| |||||||||
Series 2009-106, Class XI (IO) |
| |||||||||
| (-1.00 X CME Term SOFR 1-Month plus 6.69%, 6.80% Cap) |
| |||||||||
1.36% | 05/20/371 | 1,913,219 | 81,751 | |||||||
| Issues | Maturity Date | Principal Amount | Value | |||||||||
| MORTGAGE-BACKED (continued) |
| |||||||||||
| U.S. Agency Mortgage-Backed (continued) |
| |||||||||||
Ginnie Mae, |
| |||||||||||
Series 2013-53, Class AD |
| |||||||||||
1.50% | 12/20/26 | $ | 203,056 | $ | 196,943 | |||||||
Ginnie Mae, |
| |||||||||||
Series 2023-111, Class FN |
| |||||||||||
(SOFR30A plus 1.20%) |
| |||||||||||
6.52% | 08/20/531 | 8,369,069 | 8,416,611 | |||||||||
Ginnie Mae, |
| |||||||||||
Series 2023-113, Class FD |
| |||||||||||
(SOFR30A plus 1.35%) |
| |||||||||||
6.50% | 08/20/531 | 7,455,203 | 7,470,796 | |||||||||
Ginnie Mae, |
| |||||||||||
Series 2023-116, Class FL |
| |||||||||||
(SOFR30A plus 1.15%) |
| |||||||||||
6.47% | 08/20/531 | 7,389,510 | 7,425,058 | |||||||||
Ginnie Mae, |
| |||||||||||
Series 2024-51, Class F |
| |||||||||||
(SOFR30A plus 1.00%) |
| |||||||||||
6.32% | 03/20/541 | 16,350,000 | 16,378,385 | |||||||||
Ginnie Mae, |
| |||||||||||
Series 2024-51, Class PF |
| |||||||||||
(SOFR30A plus 1.00%) |
| |||||||||||
6.32% | 03/20/541 | 15,525,000 | 15,549,744 | |||||||||
Ginnie Mae, |
| |||||||||||
Series 2024-51, Class TF |
| |||||||||||
(SOFR30A plus 1.00%) |
| |||||||||||
6.32% | 03/20/541 | 12,575,000 | 12,577,575 | |||||||||
UMBS (TBA) |
| |||||||||||
3.50% | 04/01/39 | 17,550,000 | 16,674,557 | |||||||||
4.00% | 04/01/39 | 31,075,000 | 30,095,410 | |||||||||
4.00% | 04/01/54 | 21,125,000 | 19,568,681 | |||||||||
4.50% | 04/01/39 | 50,200,000 | 49,429,093 | |||||||||
4.50% | 04/01/54 | 25,900,000 | 24,670,763 | |||||||||
5.00% | 04/01/39 | 50,900,000 | 50,829,782 | |||||||||
5.00% | 04/01/54 | 17,125,000 | 16,710,908 | |||||||||
5.50% | 04/01/54 | 8,075,000 | 8,035,738 | |||||||||
|
|
| ||||||||||
| 354,613,770 | ||||||||||||
|
|
| ||||||||||
| Total Mortgage-Backed |
| |||||||||||
(Cost $715,561,162) |
| 702,849,630 | ||||||||||
|
|
| ||||||||||
| MUNICIPAL BONDS — 1.10%* |
| |||||||||||
| California — 0.26% |
| |||||||||||
| Campbell Union School District General Obligation, School Improvements, Series B |
| |||||||||||
5.41% | 08/01/27 | 3,295,000 | 3,316,799 | |||||||||
|
|
| ||||||||||
| Florida — 0.10% |
| |||||||||||
| County of Miami-Dade Aviation Revenue Bonds, Airport and Marina Improvements, Series B |
| |||||||||||
2.14% | 10/01/28 | 445,000 | 398,937 | |||||||||
2.29% | 10/01/29 | 985,000 | 869,959 | |||||||||
|
|
| ||||||||||
| 1,268,896 | ||||||||||||
|
|
| ||||||||||
See accompanying Notes to Financial Statements.
| 133 / Annual Report March 2024 |
Table of Contents
Low Duration Bond Fund
Schedule of Portfolio Investments
March 31, 2024
| Issues | Maturity Date | Principal Amount | Value | |||||||||
| MUNICIPAL BONDS (continued) |
| |||||||||||
| Maryland — 0.08% |
| |||||||||||
| City of Baltimore General Obligation, School Improvements, Series C |
| |||||||||||
5.00% | 10/15/25 | $ | 1,035,000 | $ | 1,031,514 | |||||||
|
|
| ||||||||||
| Massachusetts — 0.27% |
| |||||||||||
| Commonwealth of Massachusetts Revenue Bonds, Series B |
| |||||||||||
4.11% | 07/15/31 | 3,452,103 | 3,373,930 | |||||||||
|
|
| ||||||||||
| New York — 0.39% |
| |||||||||||
| New York City Transitional Finance Authority Future Tax |
| |||||||||||
| Secured Revenue Bonds, Public Improvements |
| |||||||||||
3.19% | 08/01/25 | 1,110,000 | 1,083,761 | |||||||||
| New York City Transitional Finance Authority Future Tax |
| |||||||||||
| Secured Revenue Bonds, Public Improvements, Subseries B2 |
| |||||||||||
2.31% | 11/01/26 | 4, 060,000 | 3,825,186 | |||||||||
|
|
| ||||||||||
| 4,908,947 | ||||||||||||
|
|
| ||||||||||
| Total Municipal Bonds |
| |||||||||||
(Cost $14,714,171) |
| 13,900,086 | ||||||||||
|
|
| ||||||||||
| U.S. TREASURY SECURITIES — 26.02% |
| |||||||||||
| U.S. Treasury Notes — 26.02% |
| |||||||||||
| U.S. Treasury Notes |
| |||||||||||
4.25% | 03/15/27 | 67,450,000 | 67,152,272 | |||||||||
4.50% | 03/31/26 | 190,510,000 | 190,078,304 | |||||||||
| U.S. Treasury Notes (WI) |
| |||||||||||
4.25% | 03/31/29 | 72,045,000 | 71,758,598 | |||||||||
|
|
| ||||||||||
| Total U.S. Treasury Securities |
| |||||||||||
(Cost $329,311,123) |
| 328,989,174 | ||||||||||
|
|
| ||||||||||
| Total Bonds — 117.98% |
| |||||||||||
(Cost $1,508,209,203) |
| 1,491,762,957 | ||||||||||
|
|
| ||||||||||
| Issues | Shares | Value | ||||||||||
COMMON STOCK — 0.00% |
| |||||||||||
| Electric — 0.00% |
| |||||||||||
| Homer City Holdings LLC4,5,7 |
| 106,501 | — | |||||||||
|
|
| ||||||||||
| Total Common Stock |
| |||||||||||
(Cost $6,078,660) |
| |||||||||||
| Issues | Maturity Date | Principal Amount/Shares | Value | |||||||||
SHORT-TERM INVESTMENTS — 16.37% |
| |||||||||||
| Money Market Funds — 12.16% |
| |||||||||||
| Dreyfus Government Cash Management Fund |
| |||||||||||
5.20%8 | 51,769,000 | 51,769,000 | ||||||||||
| Fidelity Investments Money Market Funds - Government Portfolio |
| |||||||||||
5.21%8,9 | 96,800 | 96,800 | ||||||||||
| JPMorgan U.S. Government Money Market Fund |
| |||||||||||
5.16%8 | 39,421,000 | 39,421,000 | ||||||||||
| Issues | Maturity Date | Principal Amount/Shares | Value | |||||||||
| SHORT-TERM INVESTMENTS (continued) |
| |||||||||||
| Money Market Funds (continued) |
| |||||||||||
| Morgan Stanley Institutional Liquidity Funds - Government Portfolio |
| |||||||||||
5.22%8 |
| 62,531,000 | $ | 62,531,000 | ||||||||
|
|
| ||||||||||
| 153,817,800 | ||||||||||||
|
|
| ||||||||||
U.S. Treasury Bills — 4.21% |
| |||||||||||
| U.S. Treasury Bills (WI) |
| |||||||||||
5.32%10 | 05/30/24 | $ | 30,000,000 | 29,728,362 | ||||||||
5.33%10 | 05/16/24 | 23,620,000 | 23,455,605 | |||||||||
|
|
| ||||||||||
| 53,183,967 | ||||||||||||
|
|
| ||||||||||
| Total Short-Term Investments |
| |||||||||||
(Cost $207,026,719) |
| 207,001,767 | ||||||||||
|
|
| ||||||||||
| Total Investments - 134.35% |
| |||||||||||
(Cost $1,721,314,582) |
| 1,698,764,724 | ||||||||||
|
|
| ||||||||||
| Liabilities in Excess of Other Assets - (34.35)% |
| (434,288,976 | ) | |||||||||
|
|
| ||||||||||
| Net Assets - 100.00% |
| $ | 1,264,475,748 | |||||||||
|
|
| ||||||||||
| 1 | Floating rate security. The rate disclosed was in effect at March 31, 2024. |
| 2 | Securities exempt from registration under Rule 144A of the Securities Act of 1933, as amended. The securities may be resold in transactions exempt from registration, normally to qualified institutional buyers. |
| 3 | Foreign denominated security issued by foreign domiciled entity. |
| 4 | Security is valued using significant unobservable inputs and is classified as Level 3 in the fair value hierarchy. |
| 5 | Illiquid security as determined under procedures approved by the Board of Trustees. The aggregate value of illiquid securities is $8,183,858, which is 0.65% of total net assets. |
| 6 | Variable rate security. Interest rate disclosed is as of the most recent information available. Certain variable rate securities are not based on a published reference rate and spread but are determined by the issuer or agent and are based on current market conditions. |
| 7 | Non-income producing security. |
| 8 | Represents the current yield as of March 31, 2024. |
| 9 | Securities, or a portion thereof, pledged as collateral for swaps. The total market value of collateral pledged is $3,929. |
| 10 | Represents annualized yield at date of purchase. |
| * | Securities with a call or reset feature will have an effective maturity date sooner than the stated maturity. |
| ** | Securities backed by mortgage or consumer loans where payment is periodically made will have an effective maturity date sooner than the stated maturity date. |
See accompanying Notes to Financial Statements.
| Annual Report March 2024 / 134 |
Table of Contents
Low Duration Bond Fund
Schedule of Portfolio Investments
March 31, 2024
Note: For Fund compliance purposes, the Fund’s industry classifications refer to any one or more of the industry sub-classifications used by one or more widely recognized market indexes or ratings group indexes, and/or as defined by Fund management. This definition may not apply for purposes of this report, which may combine industry sub-classifications for more meaningful presentation for investors.
(CLO): Collateralized Loan Obligation
(EMTN): Euro Medium-Term Note
(EUR): Euro
(GBP): British Pound
(IO): Interest Only
(LIBOR): London InterBank Offer Rate
(MTN): Medium-Term Note
(REIT): Real Estate Investment Trust
(RFUCCT): Refinitiv USD IBOR Consumer Cash Fallback
(SOFR): Secured Overnight Financing Rate
(STEP): Step Coupon Bond
(TBA): To-Be-Announced
(USD): U.S. Dollar
(WI): When Issued
Currency to be Purchased | Currency to be Sold | Counterparty | Settlement Date | Unrealized Appreciation (Depreciation) | ||||||||||||
| FOREIGN CURRENCY EXCHANGE CONTRACT |
| |||||||||||||||
GBP 3,283,000 | USD 4,132,629 | Citibank N.A. | 04/12/24 | $ | 14,954 | |||||||||||
USD 736,132 | EUR 678,000 | The Bank of New York Mellon | 04/12/24 | 3,466 | ||||||||||||
USD 13,863,792 | EUR 12,595,000 | Citibank N.A. | 04/12/24 | 253,275 | ||||||||||||
USD 4,190,569 | GBP 3,283,000 | Citibank N.A. | 04/12/24 | 42,986 | ||||||||||||
|
| |||||||||||||||
| 314,681 | ||||||||||||||||
|
| |||||||||||||||
EUR 3,278,000 | USD 3,567,169 | Bank of America N.A. | 04/12/24 | (24,869) | ||||||||||||
|
| |||||||||||||||
NET UNREALIZED APPRECIATION |
| $ | 289,812 | |||||||||||||
|
| |||||||||||||||
| Description | Number of Contracts | Expiration Date | Notional Amount | Value | Unrealized Appreciation (Depreciation) | |||||||||||||||
| FUTURES CONTRACTS: LONG POSITIONS |
| |||||||||||||||||||
| U.S. Treasury Two-Year Note | 4,997 | 06/28/24 | $ | 1,021,808,427 | $ | (879,951) | $ | (879,951) | ||||||||||||
| Euro-Schatz Future | 11 | 06/06/24 | 1,255,716 | 283 | 283 | |||||||||||||||
| Euro-Bobl Future | 7 | 06/06/24 | 893,970 | 3,394 | 3,394 | |||||||||||||||
|
|
|
|
|
| |||||||||||||||
| 1,023,958,113 | (876,274) | (876,274) | ||||||||||||||||||
|
|
|
|
|
| |||||||||||||||
| FUTURES CONTRACTS: SHORT POSITIONS |
| |||||||||||||||||||
| U.S. Treasury Five-Year Note | 2,624 | 06/28/24 | (280,809,013) | (754,033) | (754,033) | |||||||||||||||
| U.S. Treasury Ten-Year Ultra Bond | 446 | 06/18/24 | (51,115,784) | (324,406) | (324,406) | |||||||||||||||
| U.S. Treasury Ultra Bond | 67 | 06/18/24 | (8,643,000) | (85,396) | (85,396) | |||||||||||||||
| Euro-Schatz Future | 45 | 06/06/24 | (5,137,020) | (952) | (952) | |||||||||||||||
| Euro-Bobl Future | 10 | 06/06/24 | (1,277,100) | (5,736) | (5,736) | |||||||||||||||
|
|
|
|
|
| |||||||||||||||
| (346,981,917) | (1,170,523) | (1,170,523) | ||||||||||||||||||
|
|
|
|
|
| |||||||||||||||
TOTAL FUTURES CONTRACTS | $ | 676,976,196 | $ | (2,046,797) | $ | (2,046,797) | ||||||||||||||
|
|
|
|
|
| |||||||||||||||
See accompanying Notes to Financial Statements.
| 135 / Annual Report March 2024 |
Table of Contents
Opportunistic High Income Credit Fund
Schedule of Portfolio Investments
March 31, 2024
| Issues | Maturity Date | Principal Amount | Value | |||||||||
| BONDS – 62.30% |
| |||||||||||
| BANK LOANS — 4.92%* |
| |||||||||||
| Consumer Discretionary — 1.31% |
| |||||||||||
| City Brewing Co. LLC, |
| |||||||||||
| Term Loan B, 1st Lien |
| |||||||||||
| (SOFR plus 3.76%) |
| |||||||||||
8.32% | 04/05/281 | $ | 12,354 | $ | 9,702 | |||||||
| Naked Juice, LLC, |
| |||||||||||
| Term Loan, 2nd Lien |
| |||||||||||
| (SOFR plus 6.10%) |
| |||||||||||
11.00% | 01/24/301 | 12,000 | 9,836 | |||||||||
|
|
| ||||||||||
| 19,538 | ||||||||||||
|
|
| ||||||||||
| Industrials — 2.41% |
| |||||||||||
| Patriot Container Corp., |
| |||||||||||
| Term Loan B, 1st Lien |
| |||||||||||
| (SOFR plus 3.85%) |
| |||||||||||
9.18% | 03/20/251 | 4,441 | 4,317 | |||||||||
| Protective Industrial Products, Inc., |
| |||||||||||
| Term Loan B, 1st Lien |
| |||||||||||
| (SOFR plus 4.11%) |
| |||||||||||
9.44% | 12/29/271 | 12,674 | 12,674 | |||||||||
| SPX Flow, Inc., |
| |||||||||||
| Term Loan B, 1st Lien |
| |||||||||||
| (SOFR plus 4.60%) |
| |||||||||||
9.41% -9.58% | 04/05/291 | 6,536 | 6,571 | |||||||||
| Transcendia Holdings, Inc., |
| |||||||||||
| Term Loan B, 1st Lien |
| |||||||||||
| (PRIME plus 2.50%) |
| |||||||||||
11.00% | 05/30/241 | 16,558 | 12,333 | |||||||||
|
|
| ||||||||||
| 35,895 | ||||||||||||
|
|
| ||||||||||
| Information Technology — 0.71% |
| |||||||||||
| Magenta Buyer LLC, |
| |||||||||||
| Term Loan, 1st Lien |
| |||||||||||
| (SOFR plus 5.26%) |
| |||||||||||
10.57% | 07/27/281 | 12,708 | 7,624 | |||||||||
| MH Sub I LLC, |
| |||||||||||
| Term Loan B3, 1st Lien |
| |||||||||||
| (SOFR plus 4.25%) |
| |||||||||||
9.58% | 05/03/281 | 3,059 | 3,045 | |||||||||
|
|
| ||||||||||
| 10,669 | ||||||||||||
|
|
| ||||||||||
| Services — 0.49% |
| |||||||||||
| Neptune Bidco U.S., Inc., |
| |||||||||||
| Term Loan B, 1st Lien |
| |||||||||||
| (SOFR plus 5.10%) |
| |||||||||||
10.42% | 04/11/291 | 7,940 | 7,339 | |||||||||
|
|
| ||||||||||
Total Bank Loans (Cost $ 80,673) |
| 73,441 | ||||||||||
|
|
| ||||||||||
| CORPORATES — 39.69%* |
| |||||||||||
| Banking — 1.52% |
| |||||||||||
| Bank of America Corp., |
| |||||||||||
| Series RR |
| |||||||||||
4.38%2,3 | 5,000 | 4,713 | ||||||||||
| Issues | Maturity Date | Principal Amount | Value | |||||||||
| CORPORATES (continued) |
| |||||||||||
| Banking (continued) |
| |||||||||||
| Bank of New York Mellon Corp. (The), |
| |||||||||||
| Series I |
| |||||||||||
3.75%2,3 | $ | 5,000 | $ | 4,606 | ||||||||
| JPMorgan Chase & Co., |
| |||||||||||
Series KK | ||||||||||||
3.65%2,3 | 5,000 | 4,761 | ||||||||||
U.S. Bancorp | ||||||||||||
3.70%2,3 | 10,000 | 8,665 | ||||||||||
|
|
| ||||||||||
| 22,745 | ||||||||||||
|
|
| ||||||||||
| Communications — 7.28% |
| |||||||||||
| Altice France Holding SA |
| |||||||||||
| (Luxembourg) |
| |||||||||||
10.50% | 05/15/274,5 | 4,000 | 1,525 | |||||||||
| Altice France SA |
| |||||||||||
| (France) |
| |||||||||||
5.13% | 01/15/294,5 | 5,000 | 3,475 | |||||||||
5.50% | 10/15/294,5 | 11,000 | 7,418 | |||||||||
| Cable One, Inc. |
| |||||||||||
4.00% | 11/15/304 | 10,000 | 7,825 | |||||||||
| CommScope, Inc. |
| |||||||||||
4.75% | 09/01/294 | 3,000 | 2,160 | |||||||||
| Consolidated Communications, Inc. |
| |||||||||||
6.50% | 10/01/284 | 3,000 | 2,628 | |||||||||
| CSC Holdings LLC |
| |||||||||||
6.50% | 02/01/294 | 17,000 | 14,418 | |||||||||
7.50% | 04/01/284 | 12,000 | 8,099 | |||||||||
11.75% | 01/31/294 | 3,000 | 3,004 | |||||||||
| DISH DBS Corp. |
| |||||||||||
5.13% | 06/01/29 | 7,000 | 2,923 | |||||||||
5.25% | 12/01/264 | 8,000 | 6,314 | |||||||||
| Frontier Communications Holdings LLC |
| |||||||||||
6.75% | 05/01/294 | 4,000 | 3,569 | |||||||||
8.63% | 03/15/314 | 4,000 | 4,088 | |||||||||
| Gray Television, Inc. |
| |||||||||||
5.38% | 11/15/314 | 5,000 | 3,285 | |||||||||
| Northwest Fiber LLC/Northwest Fiber Finance Sub, Inc. |
| |||||||||||
4.75% | 04/30/274 | 5,000 | 5,125 | |||||||||
6.00% | 02/15/284 | 5,000 | 5,150 | |||||||||
| Scripps Escrow, Inc. |
| |||||||||||
5.88% | 07/15/274 | 3,000 | 2,520 | |||||||||
| Sirius XM Radio, Inc. |
| |||||||||||
3.88% | 09/01/314 | 9,000 | 7,511 | |||||||||
| VZ Secured Financing BV |
| |||||||||||
| (Netherlands) |
| |||||||||||
5.00% | 01/15/324,5 | 9,000 | 7,734 | |||||||||
| Zayo Group Holdings, Inc. |
| |||||||||||
4.00% | 03/01/274 | 12,000 | 9,888 | |||||||||
|
|
| ||||||||||
| 108,659 | ||||||||||||
|
|
| ||||||||||
| Consumer Discretionary — 2.74% |
| |||||||||||
| Everi Holdings, Inc. |
| |||||||||||
5.00% | 07/15/294 | 8,000 | 7,940 | |||||||||
| Spectrum Brands, Inc. |
| |||||||||||
3.88% | 03/15/314 | 8,000 | 7,728 | |||||||||
See accompanying Notes to Financial Statements.
| Annual Report March 2024 / 136 |
Table of Contents
Opportunistic High Income Credit Fund
Schedule of Portfolio Investments
March 31, 2024
| Issues | Maturity Date | Principal Amount | Value | |||||||||
| CORPORATES (continued) |
| |||||||||||
| Consumer Discretionary (continued) |
| |||||||||||
Triton Water Holdings, Inc. |
| |||||||||||
6.25% | 04/01/294 | $ | 5,000 | $ | 4,565 | |||||||
WarnerMedia Holdings, Inc. |
| |||||||||||
5.14% | 03/15/52 | 17,000 | 14,131 | |||||||||
Wyndham Hotels & Resorts, Inc. |
| |||||||||||
4.38% | 08/15/284 | 7,000 | 6,511 | |||||||||
|
|
| ||||||||||
| 40,875 | ||||||||||||
|
|
| ||||||||||
| Consumer Products — 0.32% |
| |||||||||||
Newell Brands, Inc. |
| |||||||||||
7.00% | 04/01/46 | 6,000 | 4,851 | |||||||||
|
|
| ||||||||||
| Electric — 0.13% |
| |||||||||||
Pike Corp. |
| |||||||||||
5.50% | 09/01/284 | 2,000 | 1,916 | |||||||||
|
|
| ||||||||||
| Energy — 3.52% |
| |||||||||||
Energy Transfer LP, |
| |||||||||||
Series B |
| |||||||||||
6.63%2,3 | 14,000 | 13,127 | ||||||||||
Global Partners LP/GLP Finance Corp. |
| |||||||||||
6.88% | 01/15/29 | 10,000 | 9,929 | |||||||||
SM Energy Co. |
| |||||||||||
6.50% | 07/15/28 | 7,000 | 7,036 | |||||||||
TransMontaigne Partners LP/TLP Finance Corp. |
| |||||||||||
6.13% | 02/15/26 | 8,000 | 7,650 | |||||||||
| USA Compression Partners LP/USA Compression Finance Corp. |
| |||||||||||
7.13% | 03/15/294 | 5,000 | 5,059 | |||||||||
Venture Global LNG, Inc. |
| |||||||||||
9.50% | 02/01/294 | 8,000 | 8,630 | |||||||||
9.88% | 02/01/324 | 1,000 | 1,079 | |||||||||
|
|
| ||||||||||
| 52,510 | ||||||||||||
|
|
| ||||||||||
| Finance — 5.07% |
| |||||||||||
American Express Co., |
| |||||||||||
Series D |
| |||||||||||
3.55%2,3 | 5,000 | 4,641 | ||||||||||
Charles Schwab Corp. (The) |
| |||||||||||
Series K |
| |||||||||||
5.00%2,3 | 5,000 | 4,793 | ||||||||||
Cushman & Wakefield U.S. Borrower LLC |
| |||||||||||
8.88% | 09/01/314 | 6,000 | 6,367 | |||||||||
Ford Motor Credit Co. LLC |
| |||||||||||
4.06% | 11/01/24 | 35,000 | 34,657 | |||||||||
GGAM Finance Ltd. |
| |||||||||||
(Cayman Islands) |
| |||||||||||
8.00% | 02/15/274,5 | 3,000 | 3,099 | |||||||||
Icahn Enterprises LP/Icahn Enterprises Finance Corp. |
| |||||||||||
4.38% | 02/01/29 | 9,000 | 7,693 | |||||||||
5.25% | 05/15/27 | 2,000 | 1,860 | |||||||||
Jane Street Group/JSG Finance, Inc. |
| |||||||||||
4.50% | 11/15/294 | 8,000 | 7,423 | |||||||||
| Issues | Maturity Date | Principal Amount | Value | |||||||||
| CORPORATES (continued) |
| |||||||||||
| Finance (continued) |
| |||||||||||
Macquarie Airfinance Holdings Ltd. |
| |||||||||||
(United Kingdom) |
| |||||||||||
6.40% | 03/26/294,5 | $ | 5,000 | $ | 5,079 | |||||||
|
|
| ||||||||||
| 75,612 | ||||||||||||
|
|
| ||||||||||
| Food — 3.04% |
| |||||||||||
B&G Foods, Inc. |
| |||||||||||
5.25% | 04/01/25 | 3,000 | 3,000 | |||||||||
H-Food Holdings LLC/Hearthside Finance Co., Inc. |
| |||||||||||
8.50% | 06/01/264 | 6,000 | 450 | |||||||||
JBS USA LUX SA/JBS USA Food Co./JBS USA Finance, Inc. |
| |||||||||||
(Canada) |
| |||||||||||
3.75% | 12/01/315 | 14,000 | 12,140 | |||||||||
5.75% | 04/01/335 | 5,000 | 4,932 | |||||||||
Pilgrim’s Pride Corp. |
| |||||||||||
3.50% | 03/01/32 | 9,000 | 7,640 | |||||||||
6.25% | 07/01/33 | 9,000 | 9,221 | |||||||||
| Simmons Foods, Inc./Simmons Prepared Foods, Inc./ Simmons Pet Food, Inc./Simmons Feed |
| |||||||||||
4.63% | 03/01/294 | 9,000 | 7,970 | |||||||||
|
|
| ||||||||||
| 45,353 | ||||||||||||
|
|
| ||||||||||
| Gaming — 1.31% |
| |||||||||||
Churchill Downs, Inc. |
| |||||||||||
5.75% | 04/01/304 | 7,000 | 6,762 | |||||||||
Wynn Las Vegas LLC/Wynn Las Vegas Capital Corp. |
| |||||||||||
5.25% | 05/15/274 | 13,000 | 12,751 | |||||||||
|
|
| ||||||||||
| 19,513 | ||||||||||||
|
|
| ||||||||||
| Health Care — 3.72% |
| |||||||||||
1375209 BC Ltd. |
| |||||||||||
(Canada) |
| |||||||||||
9.00% | 01/30/284,5 | 10,000 | 9,811 | |||||||||
Bausch Health Cos., Inc. |
| |||||||||||
(Canada) |
| |||||||||||
14.00% | 10/15/304,5 | 1,000 | 580 | |||||||||
Cano Health LLC |
| |||||||||||
6.25% | 10/01/284,6,7,8,9 | 4,000 | 4 | |||||||||
Centene Corp. |
| |||||||||||
2.63% | 08/01/31 | 4,000 | 3,298 | |||||||||
3.00% | 10/15/30 | 5,000 | 4,291 | |||||||||
Grifols SA |
| |||||||||||
(Spain) |
| |||||||||||
4.75% | 10/15/284,5 | 8,000 | 6,625 | |||||||||
Heartland Dental LLC/Heartland Dental Finance Corp. |
| |||||||||||
10.50% | 04/30/284 | 2,000 | 2,127 | |||||||||
Kedrion SpA |
| |||||||||||
(Italy) |
| |||||||||||
6.50% | 09/01/294,5 | 9,000 | 8,212 | |||||||||
ModivCare Escrow Issuer, Inc. |
| |||||||||||
5.00% | 10/01/294 | 13,000 | 9,443 | |||||||||
ModivCare, Inc. |
| |||||||||||
5.88% | 11/15/254 | 5,000 | 4,874 | |||||||||
Option Care Health, Inc. |
| |||||||||||
4.38% | 10/31/294 | 1,000 | 919 | |||||||||
See accompanying Notes to Financial Statements.
| 137 / Annual Report March 2024 |
Table of Contents
Opportunistic High Income Credit Fund
Schedule of Portfolio Investments
March 31, 2024
| Issues | Maturity Date | Principal Amount | Value | |||||||||
| CORPORATES (continued) |
| |||||||||||
| Health Care (continued) |
| |||||||||||
Star Parent, Inc. |
| |||||||||||
9.00% | 10/01/304 | $ | 5,000 | $ | 5,302 | |||||||
|
|
| ||||||||||
| 55,486 | ||||||||||||
|
|
| ||||||||||
| Industrials — 2.21% |
| |||||||||||
Ardagh Packaging Finance PLC/Ardagh Holdings USA, Inc. |
| |||||||||||
(Canada) |
| |||||||||||
5.25% | 08/15/274,5 | 9,000 | 5,680 | |||||||||
Artera Services LLC |
| |||||||||||
8.50% | 02/15/314 | 7,000 | 7,182 | |||||||||
Graham Packaging Co., Inc. |
| |||||||||||
7.13% | 08/15/284 | 5,000 | 4,543 | |||||||||
OT Merger Corp. |
| |||||||||||
7.88% | 10/15/294 | 9,000 | 6,493 | |||||||||
Titan Acquisition Ltd./Titan Co-Borrower LLC |
| |||||||||||
(Canada) |
| |||||||||||
7.75% | 04/15/264,5 | 3,000 | 3,001 | |||||||||
Trivium Packaging Finance BV |
| |||||||||||
(Netherlands) |
| |||||||||||
5.50% | 08/15/264,5 | 3,000 | 2,961 | |||||||||
Verde Purchaser LLC |
| |||||||||||
10.50% | 11/30/304 | 3,000 | 3,164 | |||||||||
|
|
| ||||||||||
| 33,024 | ||||||||||||
|
|
| ||||||||||
| Information Technology — 2.61% |
| |||||||||||
MSCI, Inc. |
| |||||||||||
3.63%11/01/314 | 25,000 | 21,721 | ||||||||||
NCR Voyix Corp. |
| |||||||||||
5.25% | 10/01/304 | 4,000 | 3,623 | |||||||||
Open Text Corp. |
| |||||||||||
(Canada) |
| |||||||||||
6.90% | 12/01/274,5 | 3,000 | 3,097 | |||||||||
RingCentral, Inc. |
| |||||||||||
8.50% | 08/15/304 | 4,000 | 4,162 | |||||||||
ZoomInfo Technologies LLC/ZoomInfo Finance Corp. |
| |||||||||||
3.88% | 02/01/294 | 7,000 | 6,318 | |||||||||
|
|
| ||||||||||
| 38,921 | ||||||||||||
|
|
| ||||||||||
| Insurance — 0.25% |
| |||||||||||
Acrisure LLC/Acrisure Finance, Inc. |
| |||||||||||
6.00% | 08/01/294 | 4,000 | 3,680 | |||||||||
| Materials — 1.88% |
| |||||||||||
Clearwater Paper Corp. |
| |||||||||||
4.75% | 08/15/284 | 8,000 | 7,448 | |||||||||
Herens Holdco SARL |
| |||||||||||
(Luxembourg) |
| |||||||||||
4.75% | 05/15/284,5 | 9,000 | 7,880 | |||||||||
International Flavors & Fragrances, Inc. |
| |||||||||||
2.30% | 11/01/304 | 9,000 | 7,481 | |||||||||
Valvoline, Inc. |
| |||||||||||
3.63% | 06/15/314 | 6,000 | 5,177 | |||||||||
|
|
| ||||||||||
| 27,986 | ||||||||||||
|
|
| ||||||||||
| Office REITs — 0.37% |
| |||||||||||
Hudson Pacific Properties LP |
| |||||||||||
3.25% | 01/15/30 | 2,000 | 1,544 | |||||||||
| Issues | Maturity Date | Principal Amount | Value | |||||||||
| CORPORATES (continued) |
| |||||||||||
| Office REITs (continued) |
| |||||||||||
4.65% | 04/01/29 | $ | 3,000 | $ | 2,559 | |||||||
Piedmont Operating Partnership LP |
| |||||||||||
2.75% | 04/01/32 | 2,000 | 1,447 | |||||||||
|
| |||||||||||
| 5,550 | ||||||||||||
|
| |||||||||||
| Retail — 1.92% |
| |||||||||||
Ferrellgas LP/Ferrellgas Finance Corp. |
| |||||||||||
5.88% | 04/01/294 | 11,000 | 10,495 | |||||||||
| Fertitta Entertainment, LLC/Fertitta Entertainment Finance Co., Inc. |
| |||||||||||
6.75% | 01/15/304 | 6,000 | 5,415 | |||||||||
LCM Investments Holdings II LLC |
| |||||||||||
8.25% | 08/01/314 | 3,000 | 3,135 | |||||||||
Michaels Cos., Inc. (The) |
| |||||||||||
7.88% | 05/01/294 | 10,000 | 7,512 | |||||||||
Raising Cane’s Restaurants LLC |
| |||||||||||
9.38% | 05/01/294 | 2,000 | 2,165 | |||||||||
|
| |||||||||||
| 28,722 | ||||||||||||
|
| |||||||||||
| Services — 1.66% |
| |||||||||||
Adtalem Global Education, Inc. |
| |||||||||||
5.50% | 03/01/284 | 2,000 | 1,917 | |||||||||
HealthEquity, Inc. |
| |||||||||||
4.50% | 10/01/294 | 3,000 | 2,776 | |||||||||
Upbound Group, Inc. |
| |||||||||||
6.38% | 02/15/294 | 2,000 | 1,945 | |||||||||
VT Topco, Inc. |
| |||||||||||
8.50% | 08/15/304 | 5,000 | 5,282 | |||||||||
WASH Multifamily Acquisition, Inc. |
| |||||||||||
5.75% | 04/15/264 | 5,000 | 4,889 | |||||||||
Waste Pro USA, Inc. |
| |||||||||||
5.50% | 02/15/264 | 8,000 | 7,886 | |||||||||
|
| |||||||||||
| 24,695 | ||||||||||||
|
| |||||||||||
| Specialized REITs — 0.14% |
| |||||||||||
Greystar Real Estate Partners LLC |
| |||||||||||
7.75% | 09/01/304 | 2,000 | 2,080 | |||||||||
|
| |||||||||||
Total Corporates (Cost $608,517) |
| 592,178 | ||||||||||
|
| |||||||||||
| MORTGAGE-BACKED — 11.21%** |
| |||||||||||
| Non-Agency Commercial Mortgage-Backed — 3.34% |
| |||||||||||
| Bear Stearns Commercial Mortgage Securities Trust, Series 2004-PWR6, Class X1 (IO) |
| |||||||||||
0.87% | 11/11/413,4 | 1,304,577 | 2,940 | |||||||||
| Commercial Mortgage Trust, Series 2004-LB2A,Class X1 (IO) |
| |||||||||||
1.75% | 03/10/393,4 | 218,516 | 2,686 | |||||||||
| Credit Suisse Mortgage Capital Trust, Series 2006-C4, Class AX (IO) |
| |||||||||||
0.86% | 09/15/393,4 | 438,588 | 2,113 | |||||||||
| Impact Funding Affordable Multifamily Housing Mortgage Loan Trust, Series 2010-1, Class A1 |
| |||||||||||
5.31% | 01/25/514 | 2,785 | 2,745 | |||||||||
See accompanying Notes to Financial Statements.
| Annual Report March 2024 / 138 |
Table of Contents
Opportunistic High Income Credit Fund
Schedule of Portfolio Investments
March 31, 2024
| Issues | Maturity Date | Principal Amount | Value | |||||||||
| MORTGAGE-BACKED (continued) |
| |||||||||||
Non-Agency Commercial Mortgage-Backed (continued) |
| |||||||||||
JPMBB Commercial Mortgage Securities Trust, |
| |||||||||||
Series 2014-C25, Class XA (IO) |
| |||||||||||
0.79% | 11/15/473 | $ | 145,768 | $ | 276 | |||||||
MKT Mortgage Trust, |
| |||||||||||
Series 2020-525M, Class D |
| |||||||||||
2.94% | 02/12/403,4 | 25,000 | 15,939 | |||||||||
Queens Center Mortgage Trust, |
| |||||||||||
Series 2013-QCA, Class B |
| |||||||||||
3.38% | 01/11/374 | 25,000 | 23,020 | |||||||||
WF-RBS Commercial Mortgage Trust, |
| |||||||||||
Series 2013-C14, Class XA (IO) |
| |||||||||||
0.35% | 06/15/463 | 33,291 | 66 | |||||||||
|
|
| ||||||||||
| 49,785 | ||||||||||||
|
|
| ||||||||||
| Non-Agency Mortgage-Backed — 7.75% |
| |||||||||||
American Home Mortgage Assets Trust, |
| |||||||||||
Series 2007-1, Class A1 |
| |||||||||||
| (Federal Reserve US 12-Month Cumulative Average plus 0.70%) |
| |||||||||||
5.79% | 02/25/471 | 24,642 | 9,575 | |||||||||
CIM Trust, |
| |||||||||||
Series 2022-NR1, Class A1 (STEP-reset date 05/25/24) |
| |||||||||||
5.00% | 07/25/624 | 27,395 | 26,668 | |||||||||
IndyMac Index Mortgage Loan Trust, |
| |||||||||||
Series 2007-AR7, Class 1A1 |
| |||||||||||
3.50% | 11/25/373 | 8,134 | 6,645 | |||||||||
JPMorgan Mortgage Trust, |
| |||||||||||
Series 2006-A4, Class 1A1 |
| |||||||||||
4.64% | 06/25/363 | 18,966 | 13,741 | |||||||||
MASTR Adjustable Rate Mortgages Trust, |
| |||||||||||
Series 2004-13, Class 3A1 |
| |||||||||||
5.37% | 11/21/343 | 30,487 | 28,628 | |||||||||
MASTR Alternative Loan Trust, |
| |||||||||||
Series 2006-2, Class 2A2 (IO) |
| |||||||||||
(-1.00 X CME Term SOFR 1-Month plus 6.99%, |
| |||||||||||
1.66% | 03/25/361,6,9 | 218,152 | 12,869 | |||||||||
WaMu Asset-Backed Certificates, |
| |||||||||||
Series 2007-HE2, Class 2A2 |
| |||||||||||
(CME Term SOFR 1-Month plus 0.30%) |
| |||||||||||
5.63% | 04/25/371 | 46,017 | 17,541 | |||||||||
|
|
| ||||||||||
| 115,667 | ||||||||||||
|
|
| ||||||||||
| U.S. Agency Commercial Mortgage-Backed — 0.12% |
| |||||||||||
Ginnie Mae, |
| |||||||||||
Series 2012-27, Class IO (IO) |
| |||||||||||
0.23% | 04/16/533 | 235,779 | 505 | |||||||||
Ginnie Mae, |
| |||||||||||
Series 2013-163, Class IO (IO) |
| |||||||||||
1.01% | 02/16/463 | 101,916 | 1,197 | |||||||||
|
|
| ||||||||||
| 1,702 | ||||||||||||
|
|
| ||||||||||
Total Mortgage-Backed (Cost $220,466) |
| 167,154 | ||||||||||
|
|
| ||||||||||
| Issues | Maturity Date | Principal Amount | Value | |||||||||
| U.S. TREASURY SECURITIES — 6.48% |
| |||||||||||
| U.S. Treasury Notes — 6.48% |
| |||||||||||
U.S. Treasury Notes (WI) |
| |||||||||||
4.00% | 02/15/34 | $ | 73,000 | $ | 71,819 | |||||||
4.25% | 03/31/29 | 25,000 | 24,901 | |||||||||
|
|
| ||||||||||
Total U.S. Treasury Securities (Cost $96,330) |
| 96,720 | ||||||||||
|
|
| ||||||||||
Total Bonds — 62.30% (Cost $1,005,986) |
| 929,493 | ||||||||||
|
|
| ||||||||||
| Issues | Shares | Value | ||||||||||
| COMMON STOCK — 12.40% |
| |||||||||||
| Banking — 0.79% |
| |||||||||||
Wells Fargo & Co. |
| 203 | 11,766 | |||||||||
|
|
| ||||||||||
| Communications — 2.85% |
| |||||||||||
Altice USA, Inc., Class A8 |
| 1,736 | 4,531 | |||||||||
AT&T, Inc. |
| 372 | 6,547 | |||||||||
| CommScope Holding Co., Inc.8 |
| 818 | 1,072 | |||||||||
| Nexstar Media Group, Inc., Class A |
| 48 | 8,270 | |||||||||
T-Mobile U.S., Inc. |
| 117 | 19,097 | |||||||||
Warner Bros. Discovery, Inc.8 |
| 340 | 2,968 | |||||||||
|
|
| ||||||||||
| 42,485 | ||||||||||||
|
|
| ||||||||||
| Consumer Discretionary — 0.66% |
| |||||||||||
Qurate Retail, Inc.8 |
| 3,324 | 4,088 | |||||||||
| Spectrum Brands Holdings, Inc. |
| 64 | 5,697 | |||||||||
|
|
| ||||||||||
| 9,785 | ||||||||||||
|
|
| ||||||||||
| Consumer Products — 0.22% |
| |||||||||||
Newell Brands, Inc. |
| 416 | 3,341 | |||||||||
|
|
| ||||||||||
| Diversified REITs — 0.94% |
| |||||||||||
| Gaming and Leisure Properties, Inc. |
| 306 | 14,098 | |||||||||
|
|
| ||||||||||
| Electric — 0.33% |
| |||||||||||
FirstEnergy Corp. |
| 127 | 4,905 | |||||||||
|
|
| ||||||||||
| Gaming — 0.37% |
| |||||||||||
Penn Entertainment, Inc.8 |
| 300 | 5,463 | |||||||||
|
|
| ||||||||||
| Health Care —1.74% |
| |||||||||||
| Bausch + Lomb Escrow Corp.5,8 (Canada) |
| 365 | 6,315 | |||||||||
| Bausch Health Cos., Inc.5,8 (Canada) |
| 940 | 9,973 | |||||||||
Centene Corp.8 |
| 123 | 9,653 | |||||||||
|
|
| ||||||||||
| 25,941 | ||||||||||||
|
|
| ||||||||||
| Industrials — 0.82% |
| |||||||||||
TransDigm Group, Inc. |
| 10 | 12,316 | |||||||||
|
|
| ||||||||||
| Information Technology — 0.51% |
| |||||||||||
NCR Voyix Corp.8 |
| 239 | 3,018 | |||||||||
| SS&C Technologies Holdings, Inc. |
| 72 | 4,635 | |||||||||
|
|
| ||||||||||
| 7,653 | ||||||||||||
|
|
| ||||||||||
| Office REITs — 0.21% |
| |||||||||||
Hudson Pacific Properties, Inc. |
| 492 | 3,173 | |||||||||
|
|
| ||||||||||
See accompanying Notes to Financial Statements.
| 139 / Annual Report March 2024 |
Table of Contents
Opportunistic High Income Credit Fund
Schedule of Portfolio Investments
March 31, 2024
| Issues | Shares | Value | ||||||||
| COMMON STOCK — 12.40% (continued) |
| |||||||||
| Retail — 1.37% |
| |||||||||
FirstCash Holdings, Inc. | 160 | $ | 20,406 | |||||||
|
|
| ||||||||
| Services —1.59% |
| |||||||||
Hertz Global Holdings, Inc.8 | 844 | 6,608 | ||||||||
Upbound Group, Inc. | 485 | 17,077 | ||||||||
|
|
| ||||||||
| 23,685 | ||||||||||
|
|
| ||||||||
Total Common Stock (Cost $289,986) |
| 185,017 | ||||||||
|
|
| ||||||||
| MASTER LIMITED PARTNERSHIPS — 3.00% |
| |||||||||
| Energy — 3.00% |
| |||||||||
Enterprise Products Partners LP | 531 | 15,495 | ||||||||
| NGL Energy Partners LP8 | 2,525 | 14,544 | ||||||||
| Sunoco LP | 128 | 7,717 | ||||||||
| USACompression Partners LP | 260 | 6,934 | ||||||||
|
|
| ||||||||
| 44,690 | ||||||||||
|
|
| ||||||||
Total Master Limited Partnerships (Cost $19,138) |
| 44,690 | ||||||||
|
|
| ||||||||
| Issues | Maturity Date | Principal Amount/Shares | Value | |||||||
| SHORT-TERM INVESTMENTS — 24.16% |
| |||||||||
| Money Market Funds —14.16% |
| |||||||||
| Fidelity Investments Money Market Funds - Government Portfolio |
| |||||||||
5.21%10 | 147,191 | 147,191 | ||||||||
| Morgan Stanley Institutional Liquidity Funds -Government Portfolio |
| |||||||||
5.22%10 | 64,000 | 64,000 | ||||||||
|
|
| ||||||||
| 211,191 | ||||||||||
|
|
| ||||||||
| U.S. Treasury Bills — 10.00% |
| |||||||||
| U.S. Treasury Bills (WI) |
| |||||||||
5.28%11 | 05/02/24 | $ | 50,000 | 49,773 | ||||||
5.31%11 | 04/16/24 | 50,000 | 49,868 | |||||||
5.32%11 | 05/16/24 | 50,000 | 49,652 | |||||||
|
|
| ||||||||
| 149,293 | ||||||||||
|
|
| ||||||||
Total Short-Term Investments (Cost $360,534) |
| 360,484 | ||||||||
|
|
| ||||||||
Total Investments - 101.86% (Cost $1,675,644) |
| 1,519,684 | ||||||||
|
|
| ||||||||
| Liabilities in Excess of Other Assets - (1.86)% |
| (27,796 | ) | |||||||
|
|
| ||||||||
| Net Assets - 100.00% |
| $ | 1,491,888 | |||||||
|
|
| ||||||||
| 1 | Floating rate security. The rate disclosed was in effect at March 31, 2024. |
| 2 | Perpetual security with no stated maturity date. |
| 3 | Variable rate security. Interest rate disclosed is as of the most recent information available. Certain variable rate securities are not based on a published reference rate and spread but are determined by the issuer or agent and are based on current market conditions. |
| 4 | Securities exempt from registration under Rule 144A of the Securities Act of 1933, as amended. The securities may be resold in transactions exempt from registration, normally to qualified institutional buyers. |
| 5 | Foreign denominated security issued by foreign domiciled entity. |
| 6 | Security is valued using significant unobservable inputs and is Classified as Level 3 in the fair value hierarchy. |
| 7 | Security is currently in default with regard to scheduled interest or principal payments. |
| 8 | Non-income producing security. |
| 9 | Illiquid security as determined under procedures approved by the Board of Trustees.The aggregate value of illiquid securities is $12,873, which is 0.86% of total net assets. |
| 10 | Represents the current yield as of March 31, 2024. |
| 11 | Represents annualized yield at date of purchase. |
| * | Securities with a call or reset feature will have an effective maturity date sooner than the stated maturity. |
| ** | Securities backed by mortgage or consumer loans where payment is periodically made will have an effective maturity date sooner than the stated maturity date. |
Note: For Fund compliance purposes, the Fund’s industry classifications refer to any one or more of the industry sub-classifications used by one or more widely recognized market indexes or ratings group indexes, and/or as defined by Fund management. This definition may not apply for purposes of this report, which may combine industry sub-classifications for more meaningful presentation for investors.
(IO): Interest Only
(REIT): Real Estate Investment Trust
(SOFR): Secured Overnight Financing Rate
(STEP): Step Coupon Bond
(WI): When Issued
See accompanying Notes to Financial Statements.
| Annual Report March 2024 / 140 |
Table of Contents
Opportunistic High Income Credit Fund
Schedule of Portfolio Investments
March 31, 2024
| Description | Number of Contracts | Expiration Date | Notional Amount | Value | Unrealized (Depreciation) | |||||||||||||||
FUTURES CONTRACTS: LONG POSITIONS |
| |||||||||||||||||||
U.S. Treasury Five-Year Note | 3 | 06/28/24 | $ | 321,047 | $ | 208 | $ | 208 | ||||||||||||
U.S. Treasury Two-Year Note | 3 | 06/28/24 | 613,453 | (381) | (381) | |||||||||||||||
|
|
|
|
|
| |||||||||||||||
| 934,500 | (173) | (173) | ||||||||||||||||||
|
|
|
|
|
| |||||||||||||||
FUTURES CONTRACTS: SHORT POSITIONS |
| |||||||||||||||||||
U.S. Treasury Ten-Year Ultra Bond | 1 | 06/18/24 | (114,609) | (533) | (533) | |||||||||||||||
|
|
|
|
|
| |||||||||||||||
TOTAL FUTURES CONTRACTS | $ | 819,891 | $ | (706) | $ | (706) | ||||||||||||||
|
|
|
|
|
| |||||||||||||||
See accompanying Notes to Financial Statements.
| 141 / Annual Report March 2024 |
Table of Contents
Schedule of Portfolio Investments
March 31, 2024
| Issues | Maturity Date | Principal Amount | Value | |||||||||||
BONDS – 91.19% |
| |||||||||||||
ASSET-BACKED SECURITIES — 14.90%** |
| |||||||||||||
AGL CLO 12 Ltd., |
| |||||||||||||
Series 2021-12A, Class B |
| |||||||||||||
(Cayman Islands) |
| |||||||||||||
(CME Term SOFR 3-Month plus 1.86%) |
| |||||||||||||
7.18% | 07/20/341,2,3 | $ | 125,000 | $ | 125,067 | |||||||||
Aimco CLO, |
| |||||||||||||
Series 2015-AA, Class BR2 |
| |||||||||||||
(Cayman Islands) |
| |||||||||||||
(CME Term SOFR 3-Month plus 1.86%) |
| |||||||||||||
7.18% | 10/17/341,2,3 | 70,000 | 70,038 | |||||||||||
Allegro CLO XII Ltd., |
| |||||||||||||
Series 2020-1A, Class B |
| |||||||||||||
(Cayman Islands) |
| |||||||||||||
(CME Term SOFR 3-Month plus 1.96%) |
| |||||||||||||
7.28% | 01/21/321,2,3 | 45,000 | 45,025 | |||||||||||
AMSR Trust, |
| |||||||||||||
Series 2020-SFR1, Class H |
| |||||||||||||
5.30% | 04/17/373 | 200,000 | 194,065 | |||||||||||
AMSR Trust, |
| |||||||||||||
Series 2020-SFR1, Class I |
| |||||||||||||
8.19% | 04/17/373 | 100,000 | 99,371 | |||||||||||
BCRED CLO LLC, |
| |||||||||||||
Series 2023-1A, Class A |
| |||||||||||||
(CME Term SOFR 3-Month plus 2.30%) |
| |||||||||||||
7.66% | 01/20/361,3 | 250,000 | 252,863 | |||||||||||
Carvana Auto Receivables Trust, |
| |||||||||||||
Series 2022-P3, Class R |
| |||||||||||||
0.00% | 09/10/293 | 1,750 | 224,870 | |||||||||||
Cedar Funding II CLO Ltd., |
| |||||||||||||
Series 2013-1A, Class BRR |
| |||||||||||||
(Cayman Islands) |
| |||||||||||||
(CME Term SOFR 3-Month plus 1.61%) |
| |||||||||||||
6.93% | 04/20/341,2,3 | 75,000 | 74,026 | |||||||||||
Cedar Funding XII CLO Ltd., |
| |||||||||||||
Series 2020-12A, Class A1R |
| |||||||||||||
(Cayman Islands) |
| |||||||||||||
(CME Term SOFR 3-Month plus 1.39%) |
| |||||||||||||
6.72% | 10/25/341,2,3 | 180,000 | 180,099 | |||||||||||
CoreVest American Finance Trust, |
| |||||||||||||
Series 2020-1, Class A2 |
| |||||||||||||
2.30% | 03/15/503 | 140,000 | 127,833 | |||||||||||
Crystal River CDO, |
| |||||||||||||
Series 2005-1A, Class A |
| |||||||||||||
(Cayman Islands) |
| |||||||||||||
(CME Term SOFR 3-Month plus 0.62%) |
| |||||||||||||
5.96% | 03/02/46 | 1,2,3,4,5 | 419,900 | 42,831 | ||||||||||
Diamond Infrastructure Funding LLC, |
| |||||||||||||
Series 2021-1A, Class C |
| |||||||||||||
3.48% | 04/15/49 | 3 | 215,000 | 192,818 | ||||||||||
Dryden 85 CLO Ltd., |
| |||||||||||||
Series 2020-85A, Class AR |
| |||||||||||||
(Cayman Islands) |
| |||||||||||||
(CME Term SOFR 3-Month plus 1.41%) |
| |||||||||||||
6.73% | 10/15/35 | 1,2,3 | 150,000 | 150,063 | ||||||||||
| Issues | Maturity Date | Principal Amount | Value | |||||||||
ASSET-BACKED SECURITIES (continued) |
| |||||||||||
Eaton Vance CLO Ltd., |
| |||||||||||
Series 2020-1A, Class AR |
| |||||||||||
(Cayman Islands) |
| |||||||||||
(CME Term SOFR 3-Month plus 1.43%) |
| |||||||||||
6.75% | 10/15/341,2,3 | $ | 90,000 | $ | 90,088 | |||||||
FirstKey Homes Trust, |
| |||||||||||
Series 2020-SFR1, Class F2 |
| |||||||||||
4.28% | 08/17/373 | 162,000 | 155,720 | |||||||||
FirstKey Homes Trust, |
| |||||||||||
Series 2020-SFR1, Class G |
| |||||||||||
4.78% | 08/17/373 | 265,000 | 254,158 | |||||||||
FirstKey Homes Trust, |
| |||||||||||
Series 2021-SFR2, Class C |
| |||||||||||
1.71% | 09/17/383 | 250,000 | 225,665 | |||||||||
FirstKey Homes Trust, |
| |||||||||||
Series 2022-SFR1, Class D |
| |||||||||||
5.20% | 05/19/393 | 350,000 | 339,439 | |||||||||
Flatiron RR CLO 22 LLC, |
| |||||||||||
Series 2021-2A, Class B |
| |||||||||||
(CME Term SOFR 3-Month plus 1.86%) |
| |||||||||||
7.18% | 10/15/341,3 | 250,000 | 250,221 | |||||||||
FRTKL, |
| |||||||||||
Series 2021-SFR1, Class G |
| |||||||||||
4.11% | 09/17/383 | 300,000 | 266,887 | |||||||||
Global SC Finance II SRL, |
| |||||||||||
Series 2014-1A, Class A2 |
| |||||||||||
(Barbados) |
| |||||||||||
3.09% | 07/17/292,3 | 10,126 | 10,019 | |||||||||
GLS Auto Receivables Issuer Trust, |
| |||||||||||
Series 2023-2A, Class D |
| |||||||||||
6.31% | 03/15/293 | 220,000 | 222,086 | |||||||||
GoldenTree Loan Management U.S. CLO 1 Ltd., |
| |||||||||||
Series 2021-9A, Class B |
| |||||||||||
(Cayman Islands) |
| |||||||||||
(CME Term SOFR 3-Month plus 1.76%) |
| |||||||||||
7.08% | 01/20/331,2,3 | 325,000 | 324,522 | |||||||||
GoldenTree Loan Management U.S. CLO 17 Ltd., |
| |||||||||||
Series 2023-17A, Class D |
| |||||||||||
(United Kingdom) |
| |||||||||||
(CME Term SOFR 3-Month plus 5.00%) |
| |||||||||||
10.32% | 07/20/361,2,3 | 175,000 | 177,947 | |||||||||
Golub Capital Partners CLO 42M-R, |
| |||||||||||
Series 2019-42RA, Class A2R |
| |||||||||||
(CME Term SOFR 3-Month plus 2.75%) |
| |||||||||||
8.07% | 01/20/361,3 | 175,000 | 176,777 | |||||||||
Golub Capital Partners CLO 54M L.P, |
| |||||||||||
Series 2021-54A, Class A |
| |||||||||||
(Cayman Islands) |
| |||||||||||
(CME Term SOFR 3-Month plus 1.79%) |
| |||||||||||
7.06% | 08/05/331,2,3 | 90,000 | 89,955 | |||||||||
Golub Capital Partners CLO 66B Ltd., |
| |||||||||||
Series 2023-66A, Class A |
| |||||||||||
(United Kingdom) |
| |||||||||||
(CME Term SOFR 3-Month plus 1.95%) |
| |||||||||||
7.27% | 04/25/361,2,3 | 250,000 | 251,512 | |||||||||
See accompanying Notes to Financial Statements.
| Annual Report March 2024 / 142 |
Table of Contents
Strategic Income Fund
Schedule of Portfolio Investments
March 31, 2024
| Issues | Maturity Date | Principal Amount | Value | |||||||||
ASSET-BACKED SECURITIES (continued) |
| |||||||||||
Golub Capital Partners CLO 69M, |
| |||||||||||
Series 2023-69A, Class B1 |
| |||||||||||
(CME Term SOFR 3-Month plus 3.25%) |
| |||||||||||
8.66% | 11/09/361,3 | $ | 250,000 | $ | 252,735 | |||||||
Harvest Commercial Capital Loan Trust, |
| |||||||||||
Series 2019-1, Class A |
| |||||||||||
3.29% | 09/25/463,6 | 13,968 | 13,605 | |||||||||
HPS Loan Management Ltd. |
| |||||||||||
Series 10A-16, Class A1RR |
| |||||||||||
(Cayman Islands) |
| |||||||||||
(CME Term SOFR 3-Month plus 1.40%) |
| |||||||||||
6.72% | 04/20/341,2,3 | 85,000 | 85,022 | |||||||||
HPS Loan Management Ltd., |
| |||||||||||
Series 2023-18A, Class D |
| |||||||||||
(Cayman Islands) |
| |||||||||||
(CME Term SOFR 3-Month plus 5.75%) |
| |||||||||||
11.07% | 07/20/361,2,3 | 175,000 | 179,605 | |||||||||
HPS Loan Management Ltd., |
| |||||||||||
Series 2024-19A, Class C2 |
| |||||||||||
(Cayman Islands) |
| |||||||||||
(CME Term SOFR 3-Month plus 2.90%) |
| |||||||||||
0.00% | 04/15/371,2,3 | 250,000 | 250,670 | |||||||||
KGS-Alpha SBA COOF Trust, |
| |||||||||||
Series 2015-1, Class A (IO) |
| |||||||||||
1.57% | 10/25/353,6 | 726,592 | 25,452 | |||||||||
Neuberger Berman Loan Advisers CLO 43 Ltd., |
| |||||||||||
Series 2021-43A, Class A |
| |||||||||||
(Cayman Islands) |
| |||||||||||
(CME Term SOFR 3-Month plus 1.39%) |
| |||||||||||
6.71% | 07/17/351,2,3 | 85,000 | 85,083 | |||||||||
OCP CLO Ltd., |
| |||||||||||
Series 2021-21A, Class B |
| |||||||||||
(Cayman Islands) |
| |||||||||||
(CME Term SOFR 3-Month plus 1.96%) |
| |||||||||||
7.28% | 07/20/341,2,3 | 50,000 | 50,004 | |||||||||
OCP CLO Ltd., |
| |||||||||||
Series 2023-28A, Class D |
| |||||||||||
(United Kingdom) |
| |||||||||||
(CME Term SOFR 3-Month plus 5.35%) |
| |||||||||||
10.66% | 07/16/361,2,3 | 250,000 | 254,382 | |||||||||
Octagon Investment Partners 46 Ltd., |
| |||||||||||
Series 2020-2A, Class BR |
| |||||||||||
(Cayman Islands) |
| |||||||||||
(CME Term SOFR 3-Month plus 1.91%) |
| |||||||||||
7.23% | 07/15/361,2,3 | 125,000 | 124,881 | |||||||||
OHA Credit Funding 7 Ltd., |
| |||||||||||
Series 2020-7A, Class AR |
| |||||||||||
(Cayman Islands) |
| |||||||||||
(CME Term SOFR 3-Month plus 1.30%) |
| |||||||||||
6.61% | 02/24/371,2,3 | 150,000 | 150,153 | |||||||||
Park Avenue Institutional Advisers CLO Ltd., |
| |||||||||||
Series 2021-1A, Class A2 |
| |||||||||||
(Cayman Islands) |
| |||||||||||
(CME Term SOFR 3-Month plus 2.01%) |
| |||||||||||
7.33% | 01/20/341,2,3 | 40,000 | 40,004 | |||||||||
| Issues | Maturity Date | Principal Amount | Value | |||||||||
ASSET-BACKED SECURITIES (continued) |
| |||||||||||
Progress Residential Trust, |
| |||||||||||
Series 2020-SFR3, Class G |
| |||||||||||
4.11% | 10/17/273 | $ | 280,000 | $ | 265,991 | |||||||
Progress Residential Trust, |
| |||||||||||
Series 2021-SFR6, Class G |
| |||||||||||
4.00% | 07/17/383 | 250,000 | 225,069 | |||||||||
Progress Residential Trust, |
| |||||||||||
Series 2021-SFR7, Class F |
| |||||||||||
3.83% | 08/17/403 | 220,000 | 190,253 | |||||||||
Progress Residential, |
| |||||||||||
Series 2021-SFR1, Class F |
| |||||||||||
2.76% | 04/17/383 | 292,000 | 265,152 | |||||||||
Progress Residential, |
| |||||||||||
Series 2021-SFR3, Class E1 |
| |||||||||||
2.54% | 05/17/263 | 225,000 | 206,448 | |||||||||
Progress Residential, |
| |||||||||||
Series 2021-SFR3, Class F |
| |||||||||||
3.44% | 05/17/263 | 200,000 | 183,308 | |||||||||
Progress Residential, |
| |||||||||||
Series 2021-SFR4, Class F |
| |||||||||||
3.41% | 05/17/383 | 320,000 | 291,133 | |||||||||
Rad CLO 22 Ltd., |
| |||||||||||
Series 2023-22A, Class D |
| |||||||||||
(Cayman Islands) |
| |||||||||||
(CME Term SOFR 3-Month plus 5.00%) |
| |||||||||||
10.37% | 01/20/371,2,3 | 100,000 | 102,003 | |||||||||
Rockford Tower CLO Ltd., |
| |||||||||||
Series 2017-3A, Class A |
| |||||||||||
(Cayman Islands) |
| |||||||||||
(CME Term SOFR 3-Month plus 1.45%) |
| |||||||||||
6.77% | 10/20/301,2,3 | 90,593 | 90,815 | |||||||||
Rockford Tower CLO Ltd., |
| |||||||||||
Series 2021-1A, Class B |
| |||||||||||
(Cayman Islands) |
| |||||||||||
(CME Term SOFR 3-Month plus 1.91%) |
| |||||||||||
7.23% | 07/20/341,2,3 | 75,000 | 74,965 | |||||||||
Skyline Aircraft Finance LLC, |
| |||||||||||
Series 2021-1, Class A |
| |||||||||||
3.23% | 05/10/374,5,6 | 61,848 | 55,240 | |||||||||
SLC Student Loan Trust, |
| |||||||||||
Series 2004-1, Class B |
| |||||||||||
(SOFR90A plus 0.55%) |
| |||||||||||
5.91% | 08/15/311 | 83,735 | 71,380 | |||||||||
SLM Student Loan Trust, |
| |||||||||||
Series 2007-7, Class B |
| |||||||||||
(SOFR90A plus 1.01%) |
| |||||||||||
6.37% | 10/27/701 | 215,000 | 199,555 | |||||||||
SLM Student Loan Trust, |
| |||||||||||
Series 2008-2, Class B |
| |||||||||||
(SOFR90A plus 1.46%) |
| |||||||||||
6.82% | 01/25/831 | 340,000 | 326,661 | |||||||||
SLM Student Loan Trust, |
| |||||||||||
Series 2008-3, Class B |
| |||||||||||
(SOFR90A plus 1.46%) |
| |||||||||||
6.82% | 04/26/831 | 340,000 | 324,382 | |||||||||
See accompanying Notes to Financial Statements.
| 143 / Annual Report March 2024 |
Table of Contents
Strategic Income Fund
Schedule of Portfolio Investments
March 31, 2024
| Issues | Maturity Date | Principal Amount | Value | |||||||||||
ASSET-BACKED SECURITIES (continued) |
| |||||||||||||
SLM Student Loan Trust, |
| |||||||||||||
Series 2008-4, Class B |
| |||||||||||||
(SOFR90A plus 2.11%) |
| |||||||||||||
7.47% | 04/25/731 | $ | 340,000 | $ | 342,753 | |||||||||
SLM Student Loan Trust, |
| |||||||||||||
Series 2008-5, Class B |
| |||||||||||||
(SOFR90A plus 2.11%) |
| |||||||||||||
7.47% | 07/25/731 | 235,000 | 233,891 | |||||||||||
Stratus CLO Ltd., |
| |||||||||||||
Series 2021-3A, Class SUB |
| |||||||||||||
(Cayman Islands) |
| |||||||||||||
0.00% | 12/29/292,3,6 | 250,000 | 162,660 | |||||||||||
Structured Receivables Finance LLC, |
| |||||||||||||
Series 2010-A, Class B |
| |||||||||||||
7.61% | 01/16/463 | 233,229 | 233,229 | |||||||||||
Structured Receivables Finance LLC, |
| |||||||||||||
Series 2010-B, Class B |
| |||||||||||||
7.97% | 08/15/363 | 267,210 | 273,853 | |||||||||||
Textainer Marine Containers VII Ltd., |
| |||||||||||||
Series 2021-2A, Class A |
| |||||||||||||
(Bermuda) |
| |||||||||||||
2.23% | 04/20/462,3 | 191,667 | 172,028 | |||||||||||
TIF Funding II LLC, |
| |||||||||||||
Series 2021-1A, Class A |
| |||||||||||||
1.65% | 02/20/463 | 400,581 | 348,484 | |||||||||||
Trestles CLO V Ltd., |
| |||||||||||||
Series 2021-5A, Class A1 |
| |||||||||||||
(Cayman Islands) |
| |||||||||||||
(CME Term SOFR 3-Month plus 1.43%) |
| |||||||||||||
6.75% | 10/20/341,2,3 | 90,000 | 90,039 | |||||||||||
Tricon American Homes, |
| |||||||||||||
Series 2020-SFR1, Class D |
| |||||||||||||
2.55% | 07/17/383 | 133,000 | 123,639 | |||||||||||
Tricon American Homes, |
| |||||||||||||
Series 2020-SFR1, Class F |
| |||||||||||||
4.88% | 07/17/383 | 244,000 | 236,001 | |||||||||||
|
|
| ||||||||||||
Total Asset-Backed Securities |
| |||||||||||||
(Cost $11,402,336) |
| 11,214,493 | ||||||||||||
|
|
| ||||||||||||
| CORPORATES — 24.67%* |
| |||||||||||||
Banking — 4.33% |
| |||||||||||||
Bank of America Corp. |
| |||||||||||||
3.42% | 12/20/28 | 6 | 35,000 | 32,864 | ||||||||||
Bank of America Corp. |
| |||||||||||||
(MTN) |
| |||||||||||||
1.32% | 06/19/26 | 6 | 100,000 | 95,056 | ||||||||||
1.53% | 12/06/25 | 6 | 165,000 | 160,394 | ||||||||||
1.92% | 10/24/31 | 6 | 585,000 | 477,805 | ||||||||||
3.82% | 01/20/28 | 6 | 110,000 | 105,975 | ||||||||||
Bank of America Corp., |
| |||||||||||||
Series N |
| |||||||||||||
1.66% | 03/11/27 | 6 | 80,000 | 74,579 | ||||||||||
Bank of America Corp., |
| |||||||||||||
Series RR |
| |||||||||||||
4.38%6,7 |
| 15,000 | 14,137 | |||||||||||
| Issues | Maturity Date | Principal Amount | Value | |||||||||
CORPORATES (continued) |
| |||||||||||
Banking (continued) |
| |||||||||||
HSBC Holdings PLC |
| |||||||||||
(United Kingdom) |
| |||||||||||
0.98% | 05/24/252,6 | $ | 10,000 | $ | 9,924 | |||||||
1.59% | 05/24/272,6 | 25,000 | 23,010 | |||||||||
2.10% | 06/04/262,6 | 330,000 | 316,592 | |||||||||
2.36% | 08/18/312,6 | 50,000 | 41,689 | |||||||||
JPMorgan Chase & Co. |
| |||||||||||
1.04% | 02/04/276 | 175,000 | 161,945 | |||||||||
1.56% | 12/10/256 | 505,000 | 491,058 | |||||||||
1.58% | 04/22/276 | 55,000 | 51,015 | |||||||||
2.07% | 06/01/296 | 25,000 | 22,169 | |||||||||
2.58% | 04/22/326 | 180,000 | 152,132 | |||||||||
PNC Financial Services Group, Inc. (The) |
| |||||||||||
6.04% | 10/28/336 | 10,000 | 10,350 | |||||||||
6.88% | 10/20/346 | 140,000 | 153,412 | |||||||||
Santander UK Group Holdings PLC |
| |||||||||||
(United Kingdom) |
| |||||||||||
1.67% | 06/14/272,6 | 50,000 | 45,772 | |||||||||
U.S. Bancorp |
| |||||||||||
3.70%6,7 | 15,000 | 12,998 | ||||||||||
4.84% | 02/01/346 | 100,000 | 95,007 | |||||||||
5.84% | 06/12/346 | 40,000 | 40,813 | |||||||||
5.85% | 10/21/336 | 35,000 | 35,767 | |||||||||
Wells Fargo & Co. |
| |||||||||||
(MTN) |
| |||||||||||
2.16% | 02/11/266 | 240,000 | 232,869 | |||||||||
2.39% | 06/02/286 | 45,000 | 41,201 | |||||||||
2.57% | 02/11/316 | 95,000 | 81,908 | |||||||||
3.35% | 03/02/336 | 275,000 | 238,548 | |||||||||
5.57% | 07/25/296 | 40,000 | 40,486 | |||||||||
|
|
| ||||||||||
| 3,259,475 | ||||||||||||
|
|
| ||||||||||
Communications — 2.69% |
| |||||||||||
Cable One, Inc. |
| |||||||||||
4.00% | 11/15/303 | 115,000 | 89,988 | |||||||||
CCO Holdings, LLC/CCO Holdings Capital Corp. |
| |||||||||||
4.50% | 06/01/333 | 75,000 | 58,860 | |||||||||
Charter Communications Operating LLC/Charter |
| |||||||||||
Communications Operating Capital |
| |||||||||||
3.70% | 04/01/51 | 54,000 | 33,538 | |||||||||
3.90% | 06/01/52 | 60,000 | 38,326 | |||||||||
4.80% | 03/01/50 | 50,000 | 37,043 | |||||||||
6.65% | 02/01/34 | 50,000 | 51,271 | |||||||||
Charter Communications Operating, LLC/Charter |
| |||||||||||
Communications Operating Capital |
| |||||||||||
5.25% | 04/01/53 | 75,000 | 59,463 | |||||||||
Cogent Communications Group, Inc. |
| |||||||||||
7.00% | 06/15/273 | 38,000 | 37,860 | |||||||||
CommScope, Inc. |
| |||||||||||
4.75% | 09/01/293 | 44,000 | 31,680 | |||||||||
CSC Holdings LLC |
| |||||||||||
6.50% | 02/01/293 | 97,000 | 82,271 | |||||||||
7.50% | 04/01/283 | 48,000 | 32,395 | |||||||||
11.75% | 01/31/293 | 69,000 | 69,086 | |||||||||
See accompanying Notes to Financial Statements.
| Annual Report March 2024 / 144 |
Table of Contents
Strategic Income Fund
Schedule of Portfolio Investments
March 31, 2024
| Issues | Maturity Date | Principal Amount | Value | |||||||||
CORPORATES (continued) |
| |||||||||||
Communications (continued) |
| |||||||||||
| DIRECTV Financing LLC/DIRECTV Financing Co. Obligor, Inc. |
| |||||||||||
5.88% | 08/15/273 | $ | 30,000 | $ | 28,405 | |||||||
Frontier Communications Holdings LLC |
| |||||||||||
6.75% | 05/01/293 | 50,000 | 44,614 | |||||||||
8.63% | 03/15/313 | 111,000 | 113,441 | |||||||||
Intelsat Jackson Holdings SA |
| |||||||||||
(Luxembourg) |
| |||||||||||
6.50% | 03/15/302,3 | 28,000 | 26,111 | |||||||||
| Northwest Fiber LLC/Northwest Fiber Finance Sub, Inc. |
| |||||||||||
4.75% | 04/30/273 | 39,000 | 39,975 | |||||||||
6.00% | 02/15/283 | 15,000 | 15,450 | |||||||||
Qwest Corp. |
| |||||||||||
7.25% | 09/15/25 | 70,000 | 69,213 | |||||||||
Scripps Escrow, Inc. |
| |||||||||||
5.88% | 07/15/273 | 66,000 | 55,440 | |||||||||
SES GLOBAL Americas Holdings, Inc. |
| |||||||||||
5.30% | 03/25/443 | 200,000 | 153,170 | |||||||||
Sirius XM Radio, Inc. |
| |||||||||||
3.88% | 09/01/313 | 55,000 | 45,897 | |||||||||
| Sprint Spectrum Co. LLC/Sprint Spectrum Co. II LLC/Sprint Spectrum Co. III LLC |
| |||||||||||
4.74% | 03/20/253 | 45,000 | 44,760 | |||||||||
5.15% | 03/20/283 | 420,000 | 419,125 | |||||||||
Time Warner Cable LLC |
| |||||||||||
5.50% | 09/01/41 | 154,000 | 128,326 | |||||||||
5.88% | 11/15/40 | 10,000 | 8,739 | |||||||||
T-Mobile USA, Inc. |
| |||||||||||
2.25% | 02/15/26 | 66,000 | 62,468 | |||||||||
VZ Secured Financing BV |
| |||||||||||
(Netherlands) |
| |||||||||||
5.00% | 01/15/322,3 | 175,000 | 150,387 | |||||||||
|
|
| ||||||||||
| 2,027,302 | ||||||||||||
|
|
| ||||||||||
Consumer Discretionary — 1.45% |
| |||||||||||
BAT Capital Corp. |
| |||||||||||
2.73% | 03/25/31 | 25,000 | 21,059 | |||||||||
4.54% | 08/15/47 | 175,000 | 135,235 | |||||||||
5.65% | 03/16/52 | 125,000 | 113,197 | |||||||||
Central Garden & Pet Co. |
| |||||||||||
4.13% | 10/15/30 | 40,000 | 35,921 | |||||||||
Edgewell Personal Care Co. |
| |||||||||||
5.50% | 06/01/283 | 32,000 | 31,448 | |||||||||
Everi Holdings, Inc. |
| |||||||||||
5.00% | 07/15/293 | 73,000 | 72,452 | |||||||||
Imperial Brands Finance PLC |
| |||||||||||
(United Kingdom) |
| |||||||||||
3.13% | 07/26/242,3 | 25,000 | 24,786 | |||||||||
6.13% | 07/27/272,3 | 70,000 | 71,459 | |||||||||
JDE Peet’s NV |
| |||||||||||
(Netherlands) |
| |||||||||||
2.25% | 09/24/312,3 | 200,000 | 159,366 | |||||||||
Spectrum Brands, Inc. |
| |||||||||||
3.88% | 03/15/313 | 35,000 | 33,809 | |||||||||
5.50% | 07/15/303 | 10,000 | 9,800 | |||||||||
| Issues | Maturity Date | Principal Amount | Value | |||||||||
CORPORATES (continued) |
| |||||||||||
Consumer Discretionary (continued) |
| |||||||||||
Triton Water Holdings, Inc. |
| |||||||||||
6.25% | 04/01/293 | $ | 39,000 | $ | 35,608 | |||||||
WarnerMedia Holdings, Inc. |
| |||||||||||
4.28% | 03/15/32 | 40,000 | 35,772 | |||||||||
5.05% | 03/15/42 | 70,000 | 60,162 | |||||||||
5.14% | 03/15/52 | 300,000 | 249,381 | |||||||||
|
|
| ||||||||||
| 1,089,455 | ||||||||||||
|
|
| ||||||||||
Consumer Products — 0.12% |
| |||||||||||
Newell Brands, Inc. |
| |||||||||||
7.00% | 04/01/46 | 112,000 | 90,560 | |||||||||
|
|
| ||||||||||
Diversified REITs — 0.84% |
| |||||||||||
American Assets Trust LP |
| |||||||||||
3.38% | 02/01/31 | 30,000 | 24,529 | |||||||||
American Tower Corp. |
| |||||||||||
1.00% | 01/15/32 | 100,000 | 88,432 | |||||||||
Crown Castle, Inc. |
| |||||||||||
3.80% | 02/15/28 | 160,000 | 151,683 | |||||||||
Digital Intrepid Holding BV |
| |||||||||||
(Netherlands) |
| |||||||||||
0.63% | 07/15/312 | 100,000 | 84,688 | |||||||||
GLP Capital LP/GLP Financing II, Inc. |
| |||||||||||
3.25% | 01/15/32 | 64,000 | 54,255 | |||||||||
4.00% | 01/15/30 | 10,000 | 9,167 | |||||||||
4.00% | 01/15/31 | 50,000 | 44,724 | |||||||||
5.38% | 04/15/26 | 25,000 | 24,799 | |||||||||
5.75% | 06/01/28 | 25,000 | 25,038 | |||||||||
VICI Properties LP |
| |||||||||||
4.95% | 02/15/30 | 10,000 | 9,671 | |||||||||
5.13% | 05/15/32 | 96,000 | 91,978 | |||||||||
VICI Properties LP/VICI Note Co., Inc. |
| |||||||||||
4.13% | 08/15/303 | 12,000 | 10,918 | |||||||||
4.50% | 01/15/283 | 9,000 | 8,645 | |||||||||
|
|
| ||||||||||
| 628,527 | ||||||||||||
|
|
| ||||||||||
Electric — 1.61% |
| |||||||||||
Alliant Energy Finance, LLC |
| |||||||||||
3.60% | 03/01/323 | 55,000 | 48,739 | |||||||||
American Electric Power Co., Inc. |
| |||||||||||
5.63% | 03/01/33 | 60,000 | 61,032 | |||||||||
Arizona Public Service Co. |
| |||||||||||
6.35% | 12/15/32 | 245,000 | 261,772 | |||||||||
Commonwealth Edison Co. |
| |||||||||||
5.30% | 02/01/53 | 130,000 | 127,219 | |||||||||
Duke Energy Carolinas LLC |
| |||||||||||
5.35% | 01/15/53 | 30,000 | 29,677 | |||||||||
Duke Energy Corp. |
| |||||||||||
3.85% | 06/15/34 | 100,000 | 107,227 | |||||||||
Entergy Texas, Inc. |
| |||||||||||
3.45% | 12/01/27 | 150,000 | 141,102 | |||||||||
FirstEnergy Pennsylvania Electric Co. |
| |||||||||||
4.00% | 04/15/253 | 75,000 | 73,182 | |||||||||
FirstEnergy Transmission LLC |
| |||||||||||
2.87% | 09/15/283 | 39,000 | 35,585 | |||||||||
Jersey Central Power & Light Co. |
| |||||||||||
4.30% | 01/15/263 | 100,000 | 97,780 | |||||||||
See accompanying Notes to Financial Statements.
| 145 / Annual Report March 2024 |
Table of Contents
Strategic Income Fund
Schedule of Portfolio Investments
March 31, 2024
| Issues | Maturity Date | Principal Amount | Value | |||||||||
CORPORATES (continued) |
| |||||||||||
Electric (continued) |
| |||||||||||
4.70% | 04/01/243 | $ | 55,000 | $ | 55,000 | |||||||
TenneT Holding BV |
| |||||||||||
(EMTN) |
| |||||||||||
(Netherlands) |
| |||||||||||
2.75% | 05/17/422 | 105,000 | 106,363 | |||||||||
Tucson Electric Power Co. |
| |||||||||||
5.50% | 04/15/53 | 65,000 | 64,711 | |||||||||
|
|
| ||||||||||
| 1,209,389 | ||||||||||||
|
|
| ||||||||||
Energy — 1.10% |
| |||||||||||
Energy Transfer LP |
| |||||||||||
5.00% | 05/15/50 | 65,000 | 57,068 | |||||||||
5.40% | 10/01/47 | 49,000 | 45,299 | |||||||||
5.50% | 06/01/27 | 3,000 | 3,020 | |||||||||
Global Partners LP/GLP Finance Corp. |
| |||||||||||
6.88% | 01/15/29 | 41,000 | 40,708 | |||||||||
8.25% | 01/15/323 | 75,000 | 77,949 | |||||||||
KeySpan Gas East Corp. |
| |||||||||||
5.99% | 03/06/333 | 65,000 | 66,005 | |||||||||
Kinder Morgan Energy Partners LP |
| |||||||||||
5.00% | 08/15/42 | 45,000 | 40,144 | |||||||||
| NGL Energy Operating LLC/NGL Energy Finance Corp. |
| |||||||||||
8.38% | 02/15/323 | 30,000 | 30,789 | |||||||||
Petroleos Mexicanos |
| |||||||||||
(Mexico) |
| |||||||||||
6.35% | 02/12/482 | 5,000 | 3,194 | |||||||||
Rockies Express Pipeline LLC |
| |||||||||||
4.80% | 05/15/303 | 100,000 | 92,900 | |||||||||
Southern Co. Gas Capital Corp. |
| |||||||||||
3.88% | 11/15/25 | 70,000 | 68,250 | |||||||||
Sunoco LP/Sunoco Finance Corp. |
| |||||||||||
4.50% | 05/15/29 | 56,000 | 52,150 | |||||||||
4.50% | 04/30/30 | 9,000 | 8,250 | |||||||||
TransCanada PipeLines Ltd. |
| |||||||||||
(Canada) |
| |||||||||||
4.63% | 03/01/342 | 5,000 | 4,728 | |||||||||
| TransMontaigne Partners LP/TLP Finance Corp. |
| |||||||||||
6.13% | 02/15/26 | 73,000 | 69,806 | |||||||||
| USA Compression Partners LP/USA Compression Finance Corp. |
| |||||||||||
7.13% | 03/15/293 | 40,000 | 40,473 | |||||||||
Venture Global Calcasieu Pass LLC |
| |||||||||||
3.88% | 08/15/293 | 60,000 | 54,099 | |||||||||
Venture Global LNG, Inc. |
| |||||||||||
9.50% | 02/01/293 | 35,000 | 37,757 | |||||||||
9.88% | 02/01/323 | 35,000 | 37,757 | |||||||||
|
|
| ||||||||||
| 830,346 | ||||||||||||
|
|
| ||||||||||
Finance — 3.51% |
| |||||||||||
AerCap Ireland Capital DAC/AerCap Global Aviation Trust (Ireland) |
| |||||||||||
2.45% | 10/29/262 | 75,000 | 69,702 | |||||||||
3.30% | 01/30/322 | 125,000 | 107,150 | |||||||||
Air Lease Corp. |
| |||||||||||
(MTN) |
| |||||||||||
2.30% | 02/01/25 | 75,000 | 72,856 | |||||||||
| Issues | Maturity Date | Principal Amount | Value | |||||||||
CORPORATES (continued) |
| |||||||||||
Finance (continued) |
| |||||||||||
American Express Co., |
| |||||||||||
Series D |
| |||||||||||
3.55%6,7 | $ | 15,000 | $ | 13,922 | ||||||||
Avolon Holdings Funding Ltd. |
| |||||||||||
(Cayman Islands) |
| |||||||||||
2.53% | 11/18/272,3 | 185,000 | 164,634 | |||||||||
3.25% | 02/15/272,3 | 15,000 | 13,967 | |||||||||
Charles Schwab Corp. (The) |
| |||||||||||
Series K |
| |||||||||||
5.00%6,7 | 15,000 | 14,378 | ||||||||||
Citigroup, Inc. |
| |||||||||||
0.98% | 05/01/256 | 305,000 | 303,671 | |||||||||
2.52% | 11/03/326 | 185,000 | 152,004 | |||||||||
2.98% | 11/05/306 | 20,000 | 17,773 | |||||||||
3.52% | 10/27/286 | 5,000 | 4,716 | |||||||||
GGAM Finance Ltd. |
| |||||||||||
(Cayman Islands) |
| |||||||||||
8.00% | 02/15/272,3 | 35,000 | 36,160 | |||||||||
8.00% | 06/15/282,3 | 68,000 | 70,975 | |||||||||
Goldman Sachs Group, Inc. (The) |
| |||||||||||
1.54% | 09/10/276 | 235,000 | 214,758 | |||||||||
1.95% | 10/21/276 | 10,000 | 9,199 | |||||||||
(SOFR Rate plus 0.49%) |
| |||||||||||
5.84% | 10/21/241 | 30,000 | 30,020 | |||||||||
Goldman Sachs Group, Inc. (The), |
| |||||||||||
Series VAR |
| |||||||||||
1.09% | 12/09/266 | 625,000 | 580,487 | |||||||||
| Icahn Enterprises LP/Icahn Enterprises Finance Corp. |
| |||||||||||
4.38% | 02/01/29 | 38,000 | 32,483 | |||||||||
5.25% | 05/15/27 | 67,000 | 62,310 | |||||||||
9.75% | 01/15/293 | 15,000 | 15,656 | |||||||||
Jane Street Group/JSG Finance, Inc. |
| |||||||||||
4.50% | 11/15/293 | 74,000 | 68,658 | |||||||||
Morgan Stanley |
| |||||||||||
0.79% | 05/30/256 | 120,000 | 118,893 | |||||||||
2.19% | 04/28/266 | 180,000 | 173,712 | |||||||||
Morgan Stanley |
| |||||||||||
(GMTN) |
| |||||||||||
2.24% | 07/21/326 | 90,000 | 73,494 | |||||||||
Morgan Stanley |
| |||||||||||
(MTN) |
| |||||||||||
1.16% | 10/21/256 | 65,000 | 63,310 | |||||||||
1.93% | 04/28/326 | 135,000 | 108,388 | |||||||||
Nationwide Building Society |
| |||||||||||
(United Kingdom) |
| |||||||||||
2.97% | 02/16/282,3,6 | 50,000 | 46,664 | |||||||||
|
|
| ||||||||||
| 2,639,940 | ||||||||||||
|
|
| ||||||||||
Food — 0.86% |
| |||||||||||
B&G Foods, Inc. |
| |||||||||||
5.25% | 04/01/25 | 11,000 | 11,000 | |||||||||
ELO SACA |
| |||||||||||
(EMTN) |
| |||||||||||
(France) |
| |||||||||||
6.00% | 03/22/292 | 100,000 | 109,622 | |||||||||
See accompanying Notes to Financial Statements.
| Annual Report March 2024 / 146 |
Table of Contents
Strategic Income Fund
Schedule of Portfolio Investments
March 31, 2024
| Issues | Maturity Date | Principal Amount | Value | |||||||||||
CORPORATES (continued) |
| |||||||||||||
Food (continued) |
| |||||||||||||
| H-Food Holdings LLC/Hearthside Finance Co., Inc. |
| |||||||||||||
8.50% | 06/01/263 | $ | 66,000 | $ | 4,950 | |||||||||
| JBS USA LUX SA/JBS USA Food Co./JBS Luxembourg Sarl |
| |||||||||||||
(Canada) |
| |||||||||||||
6.75% | 03/15/342,3 | 135,000 | 141,980 | |||||||||||
| JBS USA LUX SA/JBS USA Food Co./JBS USA Finance, Inc. |
| |||||||||||||
(Canada) |
| |||||||||||||
3.75% | 12/01/312 | 52,000 | 45,090 | |||||||||||
5.50% | 01/15/302 | 25,000 | 24,654 | |||||||||||
6.50% | 12/01/522 | 10,000 | 9,907 | |||||||||||
Pilgrim’s Pride Corp. |
| |||||||||||||
3.50% | 03/01/32 | 36,000 | 30,558 | |||||||||||
4.25% | 04/15/31 | 25,000 | 22,581 | |||||||||||
6.25% | 07/01/33 | 135,000 | 138,320 | |||||||||||
| Simmons Foods, Inc./Simmons Prepared Foods, Inc./ Simmons Pet Food, Inc./Simmons Feed |
| |||||||||||||
4.63% | 03/01/293 | 85,000 | 75,278 | |||||||||||
Smithfield Foods, Inc. |
| |||||||||||||
2.63% | 09/13/313 | 45,000 | 35,265 | |||||||||||
|
|
| ||||||||||||
| 649,205 | ||||||||||||||
|
|
| ||||||||||||
Gaming — 0.14% |
| |||||||||||||
Penn Entertainment, Inc. |
| |||||||||||||
4.13% | 07/01/293 | 79,000 | 68,533 | |||||||||||
5.63% | 01/15/273 | 36,000 | 34,765 | |||||||||||
|
|
| ||||||||||||
| 103,298 | ||||||||||||||
|
|
| ||||||||||||
Health Care — 1.93% |
| |||||||||||||
1375209 BC Ltd. |
| |||||||||||||
(Canada) |
| |||||||||||||
9.00% | 01/30/282,3 | 69,000 | 67,695 | |||||||||||
AbbVie, Inc. |
| |||||||||||||
3.60% | 05/14/25 | 50,000 | 49,089 | |||||||||||
Amgen, Inc. |
| |||||||||||||
4.20% | 02/22/52 | 25,000 | 20,597 | |||||||||||
Bayer U.S. Finance II LLC |
| |||||||||||||
2.85% | 04/15/253 | 20,000 | 19,327 | |||||||||||
4.63% | 06/25/383 | 156,000 | 129,960 | |||||||||||
4.88% | 06/25/483 | 50,000 | 40,218 | |||||||||||
Bayer U.S. Finance LLC |
| |||||||||||||
6.88% | 11/21/533 | 70,000 | 71,946 | |||||||||||
Cano Health LLC |
| |||||||||||||
6.25% | 10/01/283,4,5,8,9 | 26,000 | 23 | |||||||||||
Catalent Pharma Solutions, Inc. |
| |||||||||||||
3.13% | 02/15/293 | 115,000 | 110,001 | |||||||||||
Centene Corp. |
| |||||||||||||
3.00% | 10/15/30 | 129,000 | 110,719 | |||||||||||
CommonSpirit Health |
| |||||||||||||
2.78% | 10/01/30 | 40,000 | 34,738 | |||||||||||
DENTSPLY SIRONA, Inc. |
| |||||||||||||
3.25% | 06/01/30 | 45,000 | 39,904 | |||||||||||
Embecta Corp. |
| |||||||||||||
5.00% | 02/15/303 | 28,000 | 22,880 | |||||||||||
6.75% | 02/15/303 | 53,000 | 46,370 | |||||||||||
| Issues | Maturity Date | Principal Amount | Value | |||||||||
CORPORATES (continued) |
| |||||||||||
Health Care (continued) |
| |||||||||||
Encompass Health Corp. |
| |||||||||||
4.50% | 02/01/28 | $ | 20,000 | $ | 19,145 | |||||||
Fortrea Holdings, Inc. |
| |||||||||||
7.50% | 07/01/303 | 35,000 | 36,186 | |||||||||
Fresenius Medical Care U.S. Finance III, Inc. |
| |||||||||||
1.88% | 12/01/263 | 30,000 | 27,160 | |||||||||
Grifols SA |
| |||||||||||
(Spain) |
| |||||||||||
4.75% | 10/15/282,3 | 124,000 | 102,692 | |||||||||
HCA, Inc. |
| |||||||||||
5.25% | 04/15/25 | 12,000 | 11,953 | |||||||||
5.63% | 09/01/28 | 14,000 | 14,166 | |||||||||
Kedrion SpA |
| |||||||||||
(Italy) |
| |||||||||||
6.50% | 09/01/292,3 | 105,000 | 95,804 | |||||||||
ModivCare Escrow Issuer, Inc. |
| |||||||||||
5.00% | 10/01/293 | 149,000 | 108,228 | |||||||||
Option Care Health, Inc. |
| |||||||||||
4.38% | 10/31/293 | 72,000 | 66,192 | |||||||||
Prestige Brands, Inc. |
| |||||||||||
3.75% | 04/01/313 | 116,000 | 101,100 | |||||||||
Prime Healthcare Services, Inc. |
| |||||||||||
7.25% | 11/01/253 | 90,000 | 90,225 | |||||||||
Universal Health Services, Inc. |
| |||||||||||
1.65% | 09/01/26 | 15,000 | 13,676 | |||||||||
|
|
| ||||||||||
| 1,449,994 | ||||||||||||
|
|
| ||||||||||
Health Care REITs — 0.16% |
| |||||||||||
Healthcare Reality Holdings LP |
| |||||||||||
2.00% | 03/15/31 | 25,000 | 19,895 | |||||||||
3.10% | 02/15/30 | 30,000 | 26,093 | |||||||||
Healthcare Realty Holdings LP |
| |||||||||||
2.05% | 03/15/31 | 10,000 | 7,760 | |||||||||
3.63% | 01/15/28 | 70,000 | 64,740 | |||||||||
|
|
| ||||||||||
| 118,488 | ||||||||||||
|
|
| ||||||||||
Industrial REITs — 0.10% |
| |||||||||||
LXP Industrial Trust |
| |||||||||||
2.38% | 10/01/31 | 55,000 | 44,074 | |||||||||
2.70% | 09/15/30 | 35,000 | 29,295 | |||||||||
Rexford Industrial Realty LP |
| |||||||||||
2.15% | 09/01/31 | 5,000 | 4,014 | |||||||||
|
|
| ||||||||||
| 77,383 | ||||||||||||
|
|
| ||||||||||
Industrials — 1.36% |
| |||||||||||
Advanced Drainage Systems, Inc. |
| |||||||||||
6.38% | 06/15/303 | 14,000 | 14,085 | |||||||||
| Ardagh Packaging Finance PLC/Ardagh Holdings USA, Inc. |
| |||||||||||
(Canada) |
| |||||||||||
4.13% | 08/15/262,3 | 25,000 | 22,708 | |||||||||
5.25% | 08/15/272,3 | 90,000 | 56,792 | |||||||||
Artera Services LLC |
| |||||||||||
8.50% | 02/15/313 | 45,000 | 46,169 | |||||||||
Ball Corp. |
| |||||||||||
6.88% | 03/15/28 | 91,000 | 93,566 | |||||||||
Berry Global, Inc. |
| |||||||||||
1.65% | 01/15/27 | 5,000 | 4,542 | |||||||||
See accompanying Notes to Financial Statements.
| 147 / Annual Report March 2024 |
Table of Contents
Strategic Income Fund
Schedule of Portfolio Investments
March 31, 2024
| Issues | Maturity Date | Principal Amount | Value | |||||||||
CORPORATES (continued) |
| |||||||||||
Industrials (continued) |
| |||||||||||
4.88% | 07/15/263 | $ | 50,000 | $ | 49,037 | |||||||
5.50% | 04/15/28 | 115,000 | 115,841 | |||||||||
5.65% | 01/15/343 | 20,000 | 19,914 | |||||||||
Boeing Co. (The) |
| |||||||||||
4.88% | 05/01/25 | 10,000 | 9,891 | |||||||||
5.81% | 05/01/50 | 80,000 | 75,764 | |||||||||
General Electric Co. |
| |||||||||||
(MTN) |
| |||||||||||
(CME Term SOFR 3-Month plus 0.74%) |
| |||||||||||
6.05% | 08/15/361 | 325,000 | 301,863 | |||||||||
OT Merger Corp. |
| |||||||||||
7.88% | 10/15/293 | 123,000 | 88,734 | |||||||||
TransDigm, Inc. |
| |||||||||||
6.75% | 08/15/283 | 97,000 | 98,497 | |||||||||
Trivium Packaging Finance BV |
| |||||||||||
(Netherlands) |
| |||||||||||
5.50% | 08/15/262,3 | 30,000 | 29,606 | |||||||||
|
|
| ||||||||||
| 1,027,009 | ||||||||||||
|
|
| ||||||||||
Information Technology — 0.67% |
| |||||||||||
Gen Digital, Inc. |
| |||||||||||
6.75% | 09/30/273 | 65,000 | 66,029 | |||||||||
NCR Voyix Corp. |
| |||||||||||
5.13% | 04/15/293 | 42,000 | 38,987 | |||||||||
Netflix, Inc. |
| |||||||||||
5.88% | 02/15/25 | 50,000 | 50,203 | |||||||||
Open Text Corp. |
| |||||||||||
(Canada) |
| |||||||||||
6.90% | 12/01/272,3 | 178,000 | 183,767 | |||||||||
Oracle Corp. |
| |||||||||||
3.95% | 03/25/51 | 68,000 | 51,922 | |||||||||
6.50% | 04/15/38 | 70,000 | 76,142 | |||||||||
RingCentral, Inc. |
| |||||||||||
8.50% | 08/15/303 | 35,000 | 36,421 | |||||||||
|
|
| ||||||||||
| 503,471 | ||||||||||||
|
|
| ||||||||||
Insurance — 0.91% |
| |||||||||||
Acrisure LLC/Acrisure Finance, Inc. |
| |||||||||||
6.00% | 08/01/293 | 77,000 | 70,840 | |||||||||
Alliant Holdings Intermediate LLC/Alliant Holdings |
| |||||||||||
Co.-Issuer |
| |||||||||||
6.75% | 10/15/273 | 66,000 | 65,175 | |||||||||
Aon Corp./Aon Global Holdings PLC |
| |||||||||||
3.90% | 02/28/52 | 55,000 | 42,338 | |||||||||
Athene Global Funding |
| |||||||||||
1.61% | 06/29/263 | 30,000 | 27,540 | |||||||||
1.99% | 08/19/283 | 100,000 | 86,630 | |||||||||
3.21% | 03/08/273 | 25,000 | 23,375 | |||||||||
(SOFR Index plus 0.70%) |
| |||||||||||
6.06% | 05/24/241,3 | 30,000 | 30,035 | |||||||||
Farmers Exchange Capital II |
| |||||||||||
6.15% | 11/01/533,6 | 50,000 | 44,658 | |||||||||
Farmers Insurance Exchange |
| |||||||||||
4.75% | 11/01/573,6 | 25,000 | 18,560 | |||||||||
Metropolitan Life Global Funding I |
| |||||||||||
4.30% | 08/25/293 | 150,000 | 144,691 | |||||||||
| Issues | Maturity Date | Principal Amount | Value | |||||||||
CORPORATES (continued) |
| |||||||||||
Insurance (continued) |
| |||||||||||
Nationwide Mutual Insurance Co. |
| |||||||||||
7.88% | 12/15/243,6 | $ | 75,000 | $ | 75,007 | |||||||
| Teachers Insurance & Annuity Association of America |
| |||||||||||
4.27% | 05/15/473 | 65,000 | 54,032 | |||||||||
|
|
| ||||||||||
| 682,881 | ||||||||||||
|
|
| ||||||||||
Materials — 0.80% |
| |||||||||||
ASP Unifrax Holdings, Inc. |
| |||||||||||
5.25% | 09/30/283 | 30,000 | 19,394 | |||||||||
ATI, Inc. |
| |||||||||||
7.25% | 08/15/30 | 35,000 | 36,323 | |||||||||
Axalta Coating Systems, LLC |
| |||||||||||
3.38% | 02/15/293 | 76,000 | 68,147 | |||||||||
Clearwater Paper Corp. |
| |||||||||||
4.75% | 08/15/283 | 112,000 | 104,276 | |||||||||
International Flavors & Fragrances, Inc. |
| |||||||||||
1.83% | 10/15/273 | 110,000 | 97,633 | |||||||||
2.30% | 11/01/303 | 201,000 | 167,063 | |||||||||
3.27% | 11/15/403 | 5,000 | 3,563 | |||||||||
3.47% | 12/01/503 | 15,000 | 10,005 | |||||||||
4.38% | 06/01/47 | 20,000 | 15,507 | |||||||||
5.00% | 09/26/48 | 15,000 | 12,838 | |||||||||
Valvoline, Inc. |
| |||||||||||
3.63% | 06/15/313 | 80,000 | 69,030 | |||||||||
|
|
| ||||||||||
| 603,779 | ||||||||||||
|
|
| ||||||||||
Office REITs — 0.15% |
| |||||||||||
Hudson Pacific Properties LP |
| |||||||||||
3.25% | 01/15/30 | 105,000 | 81,038 | |||||||||
3.95% | 11/01/27 | 10,000 | 8,868 | |||||||||
4.65% | 04/01/29 | 25,000 | 21,323 | |||||||||
|
|
| ||||||||||
| 111,229 | ||||||||||||
|
|
| ||||||||||
Residential REITs — 0.32% |
| |||||||||||
American Homes 4 Rent LP |
| |||||||||||
3.38% | 07/15/51 | 40,000 | 26,700 | |||||||||
4.30% | 04/15/52 | 50,000 | 39,460 | |||||||||
Invitation Homes Operating Partnership LP |
| |||||||||||
2.00% | 08/15/31 | 170,000 | 135,298 | |||||||||
5.50% | 08/15/33 | 40,000 | 39,867 | |||||||||
|
|
| ||||||||||
| 241,325 | ||||||||||||
|
|
| ||||||||||
Retail — 0.38% |
| |||||||||||
Ferrellgas LP/Ferrellgas Finance Corp. |
| |||||||||||
5.88% | 04/01/293 | 80,000 | 76,324 | |||||||||
| Fertitta Entertainment, LLC/Fertitta Entertainment Finance |
| |||||||||||
Co., Inc. |
| |||||||||||
6.75% | 01/15/303 | 26,000 | 23,465 | |||||||||
FirstCash, Inc. |
| |||||||||||
6.88% | 03/01/323 | 40,000 | 40,045 | |||||||||
LCM Investments Holdings II LLC |
| |||||||||||
8.25% | 08/01/313 | 35,000 | 36,575 | |||||||||
Michaels Cos., Inc. (The) |
| |||||||||||
7.88% | 05/01/293 | 93,000 | 69,861 | |||||||||
See accompanying Notes to Financial Statements.
| Annual Report March 2024 / 148 |
Table of Contents
Strategic Income Fund
Schedule of Portfolio Investments
March 31, 2024
| Issues | Maturity Date | Principal Amount | Value | |||||||||
CORPORATES (continued) |
| |||||||||||
Retail (continued) |
| |||||||||||
Raising Cane’s Restaurants LLC |
| |||||||||||
9.38% | 05/01/293 | $ | 35,000 | $ | 37,887 | |||||||
|
|
| ||||||||||
| 284,157 | ||||||||||||
|
|
| ||||||||||
Services — 0.54% |
| |||||||||||
Adtalem Global Education, Inc. |
| |||||||||||
5.50% | 03/01/283 | 76,000 | 72,856 | |||||||||
HealthEquity, Inc. |
| |||||||||||
4.50% | 10/01/293 | 75,000 | 69,402 | |||||||||
Hertz Corp. (The) |
| |||||||||||
4.63% | 12/01/263 | 3,000 | 2,732 | |||||||||
5.00% | 12/01/293 | 89,000 | 68,975 | |||||||||
VT Topco, Inc. |
| |||||||||||
8.50% | 08/15/303 | 70,000 | 73,942 | |||||||||
WASH Multifamily Acquisition, Inc. |
| |||||||||||
5.75% | 04/15/263 | 30,000 | 29,337 | |||||||||
Waste Pro USA, Inc. |
| |||||||||||
5.50% | 02/15/263 | 17,000 | 16,757 | |||||||||
Worldline SA |
| |||||||||||
(France) |
| |||||||||||
0.00% | 07/30/252,10 | 300 | 35,857 | |||||||||
0.00% | 07/30/262,10 | 400 | 39,137 | |||||||||
|
|
| ||||||||||
| 408,995 | ||||||||||||
|
|
| ||||||||||
Specialized REITs — 0.42% |
| |||||||||||
Blackstone Property Partners Europe Holdings SARL |
| |||||||||||
(EMTN) |
| |||||||||||
(Luxembourg) |
| |||||||||||
1.63% | 04/20/302 | 100,000 | 90,131 | |||||||||
Extra Space Storage LP |
| |||||||||||
2.35% | 03/15/32 | 25,000 | 20,018 | |||||||||
2.40% | 10/15/31 | 50,000 | 41,157 | |||||||||
2.55% | 06/01/31 | 15,000 | 12,494 | |||||||||
Greystar Real Estate Partners LLC |
| |||||||||||
7.75% | 09/01/303 | 35,000 | 36,400 | |||||||||
Realty Income Corp. |
| |||||||||||
4.88% | 07/06/30 | 100,000 | 114,537 | |||||||||
|
|
| ||||||||||
| 314,737 | ||||||||||||
|
|
| ||||||||||
Transportation — 0.28% |
| |||||||||||
JetBlue Airways Pass-Through Trust, |
| |||||||||||
Series 2020-1, Class A |
| |||||||||||
4.00% | 11/15/32 | 80,369 | 74,280 | |||||||||
United Airlines Pass-Through Trust, |
| |||||||||||
Series 2023-1, Class A |
| |||||||||||
5.80% | 01/15/36 | 135,000 | 137,054 | |||||||||
|
|
| ||||||||||
| 211,334 | ||||||||||||
|
|
| ||||||||||
Total Corporates |
| |||||||||||
(Cost $18,767,479) |
| 18,562,279 | ||||||||||
|
|
| ||||||||||
MORTGAGE-BACKED — 48.26%** |
| |||||||||||
Non-Agency Commercial Mortgage-Backed — 4.15% |
| |||||||||||
1211 Avenue of the Americas Trust, |
| |||||||||||
Series 2015-1211, Class B |
| |||||||||||
4.09% | 08/10/353,6 | 150,000 | 143,146 | |||||||||
| Issues | Maturity Date | Principal Amount | Value | |||||||||
MORTGAGE-BACKED (continued) |
| |||||||||||
Non-Agency Commercial Mortgage-Backed (continued) |
| |||||||||||
Banc of America Commercial Mortgage Trust, |
| |||||||||||
Series 2015-UBS7, Class XE (IO) |
| |||||||||||
1.25% | 09/15/483,6 | $ | 1,500,000 | $ | 20,569 | |||||||
Banc of America Merrill Lynch Commercial Mortgage Trust, |
| |||||||||||
Series 2019-BPR, Class AMP |
| |||||||||||
3.29% | 11/05/323 | 100,000 | 96,914 | |||||||||
BX Commercial Mortgage Trust, |
| |||||||||||
Series 2021-VOLT, Class F |
| |||||||||||
(CME Term SOFR 1-Month plus 2.51%) |
| |||||||||||
7.84% | 09/15/361,3 | 100,000 | 99,159 | |||||||||
BXHPP Trust, |
| |||||||||||
Series 2021-FILM, Class C |
| |||||||||||
(CME Term SOFR 1-Month plus 1.21%) |
| |||||||||||
6.54% | 08/15/361,3 | 120,000 | 112,434 | |||||||||
BXHPP Trust, |
| |||||||||||
Series 2021-FILM, Class D |
| |||||||||||
(CME Term SOFR 1-Month plus 1.61%) |
| |||||||||||
6.94% | 08/15/361,3 | 100,000 | 92,809 | |||||||||
Citigroup Commercial Mortgage Trust, |
| |||||||||||
Series 2014-GC25, Class XA (IO) |
| |||||||||||
0.94% | 10/10/476 | 3,843,862 | 10,000 | |||||||||
Citigroup Commercial Mortgage Trust, |
| |||||||||||
Series 2016-P4, Class XA (IO) |
| |||||||||||
1.88% | 07/10/496 | 1,932,397 | 59,272 | |||||||||
Citigroup Commercial Mortgage Trust, |
| |||||||||||
Series 2020-555, Class G |
| |||||||||||
3.50% | 12/10/413,6 | 200,000 | 139,299 | |||||||||
COBALT CMBS Commercial Mortgage Trust, |
| |||||||||||
Series 2007-C2, Class X (IO) |
| |||||||||||
0.45% | 04/15/473,6 | 1,007,857 | 4,510 | |||||||||
Commercial Mortgage Trust, |
| |||||||||||
Series 2013-CR12, Class XA (IO) |
| |||||||||||
0.56% | 10/10/466 | 178,210 | 12 | |||||||||
Commercial Mortgage Trust, |
| |||||||||||
Series 2020-CBM, Class XCP (IO) |
| |||||||||||
0.60% | 02/10/373,6 | 1,667,987 | 5,374 | |||||||||
Credit Suisse Mortgage Capital Trust, |
| |||||||||||
Series 2014-USA, Class X1 (IO) |
| |||||||||||
0.54% | 09/15/373,6 | 9,783,817 | 46,599 | |||||||||
CSAIL Commercial Mortgage Trust, |
| |||||||||||
Series 2015-C1, Class XA (IO) |
| |||||||||||
0.80% | 04/15/506 | 1,601,880 | 4,213 | |||||||||
DROP Mortgage Trust, |
| |||||||||||
Series 2021-FILE, Class D |
| |||||||||||
(CME Term SOFR 1-Month plus 2.86%) |
| |||||||||||
8.19% | 10/15/431,3 | 150,000 | 116,616 | |||||||||
FREMF Mortgage Trust, |
| |||||||||||
Series 2017-K66, Class X2A (IO) |
| |||||||||||
0.10% | 06/25/273 | 42,283,457 | 100,402 | |||||||||
FREMF Mortgage Trust, |
| |||||||||||
Series 2017-K726, Class X2B (IO) |
| |||||||||||
0.10% | 07/25/493 | 25,000,000 | 320 | |||||||||
See accompanying Notes to Financial Statements.
| 149 / Annual Report March 2024 |
Table of Contents
Strategic Income Fund
Schedule of Portfolio Investments
March 31, 2024
| Issues | Maturity Date | Principal Amount | Value | |||||||||
MORTGAGE-BACKED (continued) |
| |||||||||||
Non-Agency Commercial Mortgage-Backed (continued) |
| |||||||||||
Frost CMBS DAC, |
| |||||||||||
Series 2021-1X, Class EUA |
| |||||||||||
(Ireland) |
| |||||||||||
(3-Month Euribor plus 1.15%) |
| |||||||||||
5.08% | 11/20/331,2 | $ | 98,346 | $ | 102,667 | |||||||
GS Mortgage Securities Corp. Trust, |
| |||||||||||
Series 2020-UPTN, Class XA (IO) |
| |||||||||||
0.35% | 02/10/373,6 | 940,000 | 1,822 | |||||||||
GS Mortgage Securities Corp. Trust, |
| |||||||||||
Series 2021-STAR, Class B |
| |||||||||||
(CME Term SOFR 1-Month plus 1.51%) |
| |||||||||||
6.84% | 12/15/361,3 | 150,000 | 148,813 | |||||||||
GS Mortgage Securities Trust, |
| |||||||||||
Series 2014-GC24, Class XA (IO) |
| |||||||||||
0.67% | 09/10/476 | 2,362,591 | 1,483 | |||||||||
GS Mortgage Securities Trust, |
| |||||||||||
Series 2015-GC32, Class XA (IO) |
| |||||||||||
0.68% | 07/10/486 | 4,360,269 | 28,458 | |||||||||
Impact Funding Affordable Multifamily Housing Mortgage |
| |||||||||||
Loan Trust, |
| |||||||||||
Series 2010-1, Class A1 |
| |||||||||||
5.31% | 01/25/513 | 27,657 | 27,254 | |||||||||
JPMBB Commercial Mortgage Securities Trust, |
| |||||||||||
Series 2014-C22, Class XA (IO) |
| |||||||||||
0.77% | 09/15/476 | 6,111,484 | 17,547 | |||||||||
JPMBB Commercial Mortgage Securities Trust, |
| |||||||||||
Series 2014-C25, Class XA (IO) |
| |||||||||||
0.79% | 11/15/476 | 4,341,904 | 8,207 | |||||||||
JPMBB Commercial Mortgage Securities Trust, |
| |||||||||||
Series 2014-C26, Class XA (IO) |
| |||||||||||
0.91% | 01/15/486 | 2,366,926 | 5,025 | |||||||||
JPMDB Commercial Mortgage Securities Trust, |
| |||||||||||
Series 2018-C8, Class XEF (IO) |
| |||||||||||
1.76% | 06/15/513,6 | 1,157,000 | 69,516 | |||||||||
JPMorgan Chase Commercial Mortgage Securities Trust, |
| |||||||||||
Series 2016-NINE, Class A |
| |||||||||||
2.85% | 09/06/383,6 | 225,000 | 210,634 | |||||||||
JPMorgan Chase Commercial Mortgage Securities Trust, |
| |||||||||||
Series 2019-ICON, Class C |
| |||||||||||
4.54% | 01/05/343 | 72,000 | 68,596 | |||||||||
Ladder Capital Commercial Mortgage Trust, |
| |||||||||||
Series 2013-GCP, Class XA (IO) |
| |||||||||||
1.15% | 02/15/363,6 | 1,382,176 | 49,603 | |||||||||
Med Trust, |
| |||||||||||
Series 2021-MDLN, Class G |
| |||||||||||
(CME Term SOFR 1-Month plus 5.36%) |
| |||||||||||
10.69% | 11/15/381,3 | 99,522 | 99,624 | |||||||||
MKT Mortgage Trust, |
| |||||||||||
Series 2020-525M, Class D |
| |||||||||||
2.94% | 02/12/403,6 | 286,000 | 182,345 | |||||||||
Morgan Stanley Bank of America Merrill Lynch Trust, |
| |||||||||||
Series 2013-C9, Class XB (IO) |
| |||||||||||
0.10% | 05/15/463,6 | 8,987,355 | 5,378 | |||||||||
Morgan Stanley Bank of America Merrill Lynch Trust, |
| |||||||||||
Series 2014-C19, Class XA (IO) |
| |||||||||||
0.95% | 12/15/476 | 2,358,016 | 3,647 | |||||||||
| Issues | Maturity Date | Principal Amount | Value | |||||||||
MORTGAGE-BACKED (continued) |
| |||||||||||
Non-Agency Commercial Mortgage-Backed (continued) |
| |||||||||||
Natixis Commercial Mortgage Securities Trust, |
| |||||||||||
Series 2018-ALXA, Class E |
| |||||||||||
4.32% | 01/15/433,6 | $ | 180,000 | $ | 97,378 | |||||||
SFAVE Commercial Mortgage Securities Trust, |
| |||||||||||
Series 2015-5AVE, Class A1 |
| |||||||||||
3.87% | 01/05/433,6 | 220,000 | 166,401 | |||||||||
SFAVE Commercial Mortgage Securities Trust, |
| |||||||||||
Series 2015-5AVE, Class D |
| |||||||||||
4.39% | 01/05/433,6 | 200,000 | 94,602 | |||||||||
SMRT, |
| |||||||||||
Series 2022-MINI, Class E |
| |||||||||||
(CME Term SOFR 1-Month plus 2.70%) |
| |||||||||||
8.03% | 01/15/391,3 | 100,000 | 97,117 | |||||||||
SREIT Trust, |
| |||||||||||
Series 2021-PALM, Class C |
| |||||||||||
(CME Term SOFR 1-Month plus 1.07%) |
| |||||||||||
6.40% | 10/15/341,3 | 230,000 | 226,036 | |||||||||
VASA Trust, |
| |||||||||||
Series 2021-VASA, Class B |
| |||||||||||
(CME Term SOFR 1-Month plus 1.36%) |
| |||||||||||
6.69% | 07/15/391,3 | 300,000 | 252,090 | |||||||||
Wells Fargo Commercial Mortgage Trust, |
| |||||||||||
Series 2015-NXS2, Class XA (IO) |
| |||||||||||
0.58% | 07/15/586 | 3,007,480 | 16,885 | |||||||||
Wells Fargo Commercial Mortgage Trust, |
| |||||||||||
Series 2016-NXS6, Class XA (IO) |
| |||||||||||
1.59% | 11/15/496 | 3,229,425 | 84,837 | |||||||||
WF-RBS Commercial Mortgage Trust, |
| |||||||||||
Series 2013-C14, Class XA (IO) |
| |||||||||||
0.35% | 06/15/466 | 77,678 | 155 | |||||||||
WF-RBS Commercial Mortgage Trust, |
| |||||||||||
Series 2014-C21, Class XA (IO) |
| |||||||||||
0.97% | 08/15/476 | 2,809,845 | 2,927 | |||||||||
|
|
| ||||||||||
| 3,120,695 | ||||||||||||
|
|
| ||||||||||
Non-Agency Mortgage-Backed — 27.68% |
| |||||||||||
ACE Securities Corp. Home Equity Loan Trust, |
| |||||||||||
Series 2007-ASP1, Class A2D |
| |||||||||||
(CME Term SOFR 1-Month plus 0.87%) |
| |||||||||||
6.20% | 03/25/371 | 365,587 | 143,021 | |||||||||
ACE Securities Corp. Home Equity Loan Trust, |
| |||||||||||
Series 2007-HE1, Class A1 |
| |||||||||||
(CME Term SOFR 1-Month plus 0.41%) |
| |||||||||||
5.74% | 01/25/371 | 570,457 | 306,664 | |||||||||
Ajax Mortgage Loan Trust, |
| |||||||||||
Series 2021-C, Class A (STEP-reset date 04/25/24) |
| |||||||||||
2.12% | 01/25/613 | 262,547 | 255,341 | |||||||||
Alternative Loan Trust, |
| |||||||||||
Series 2005-10CB, Class 1A8 |
| |||||||||||
5.50% | 05/25/35 | 302,447 | 247,733 | |||||||||
Alternative Loan Trust, |
| |||||||||||
Series 2005-59, Class 1A1 |
| |||||||||||
(CME Term SOFR 1-Month plus 0.77%) |
| |||||||||||
6.10% | 11/20/351 | 314,129 | 285,772 | |||||||||
See accompanying Notes to Financial Statements.
| Annual Report March 2024 / 150 |
Table of Contents
Strategic Income Fund
Schedule of Portfolio Investments
March 31, 2024
| Issues | Maturity Date | Principal Amount | Value | |||||||||
MORTGAGE-BACKED (continued) |
| |||||||||||
Non-Agency Mortgage-Backed (continued) |
| |||||||||||
Alternative Loan Trust, |
| |||||||||||
Series 2007-15CB, Class A7 |
| |||||||||||
6.00% | 07/25/37 | $ | 462,322 | $ | 279,966 | |||||||
American Home Mortgage Assets Trust, |
| |||||||||||
Series 2007-1, Class A1 |
| |||||||||||
(Federal Reserve US 12-Month Cumulative Average plus |
| |||||||||||
0.70%) |
| |||||||||||
5.79% | 02/25/471 | 702,308 | 272,896 | |||||||||
APS Resecuritization Trust, |
| |||||||||||
Series 2016-3, Class 3MZ |
| |||||||||||
1.12% | 09/27/463,6 | 391,281 | 209,978 | |||||||||
Banc of America Funding Trust, |
| |||||||||||
Series 2006-7, Class T2A3 |
| |||||||||||
5.69% | 10/25/366 | 214,762 | 182,209 | |||||||||
Banc of America Funding Trust, |
| |||||||||||
Series 2014-R5, Class 1A2 |
| |||||||||||
(TSFR6M plus 1.93%) |
| |||||||||||
3.99% | 09/26/451,3 | 244,555 | 176,292 | |||||||||
Banc of America Funding Trust, |
| |||||||||||
Series 2015-R3, Class 1A2 |
| |||||||||||
1.29% | 03/27/363,6 | 379,537 | 298,693 | |||||||||
BRAVO Residential Funding Trust, |
| |||||||||||
Series 2021-A, Class A1 (STEP-reset date 04/25/24) |
| |||||||||||
4.99% | 10/25/593 | 261,430 | 257,981 | |||||||||
Carrington Mortgage Loan Trust, |
| |||||||||||
Series 2006-NC4, Class A4 |
| |||||||||||
(CME Term SOFR 1-Month plus 0.35%) |
| |||||||||||
5.68% | 10/25/361 | 175,000 | 156,778 | |||||||||
Carrington Mortgage Loan Trust, |
| |||||||||||
Series 2007-RFC1, Class A3 |
| |||||||||||
(CME Term SOFR 1-Month plus 0.25%) |
| |||||||||||
5.58% | 12/25/361 | 94,051 | 90,941 | |||||||||
CIM Trust, |
| |||||||||||
Series 2020-R6, Class A1 |
| |||||||||||
2.25% | 12/25/603,6 | 302,985 | 259,345 | |||||||||
CIM Trust, |
| |||||||||||
Series 2021-NR1, Class A1 (STEP-reset date 05/25/24) |
| |||||||||||
5.57% | 07/25/553 | 150,170 | 148,759 | |||||||||
CIM Trust, |
| |||||||||||
Series 2021-NR2, Class A1 (STEP-reset date 05/25/24) |
| |||||||||||
5.57% | 07/25/593 | 89,335 | 88,511 | |||||||||
CIM Trust, |
| |||||||||||
Series 2021-R1, Class A2 |
| |||||||||||
2.40% | 08/25/563,6 | 338,628 | 297,197 | |||||||||
CIM Trust, |
| |||||||||||
Series 2021-R3, Class A1A |
| |||||||||||
1.95% | 06/25/573,6 | 59,273 | 52,409 | |||||||||
CIM Trust, |
| |||||||||||
Series 2021-R5, Class A1B |
| |||||||||||
2.00% | 08/25/613,6 | 115,000 | 75,002 | |||||||||
CIM Trust, |
| |||||||||||
Series 2022-NR1, Class A1 (STEP-reset date 05/25/24) |
| |||||||||||
5.00% | 07/25/623 | 83,015 | 80,813 | |||||||||
CIM Trust, |
| |||||||||||
Series 2023-NR1, Class A1 (STEP-reset date 05/25/24) |
| |||||||||||
6.00% | 06/25/623 | 260,094 | 256,521 | |||||||||
| Issues | Maturity Date | Principal Amount | Value | |||||||||
MORTGAGE-BACKED (continued) |
| |||||||||||
Non-Agency Mortgage-Backed (continued) |
| |||||||||||
CIM Trust, |
| |||||||||||
Series 2023-NR2, Class A1 (STEP-reset date 05/25/24) |
| |||||||||||
6.00% | 06/25/623 | $ | 294,387 | $ | 289,336 | |||||||
CIM Trust, |
| |||||||||||
Series 2023-R3, Class A1A |
| |||||||||||
4.50% | 01/25/633,6 | 234,085 | 216,317 | |||||||||
CIT Mortgage Loan Trust, |
| |||||||||||
Series 2007-1, Class 1M2 |
| |||||||||||
(CME Term SOFR 1-Month plus 1.86%) |
| |||||||||||
7.19% | 10/25/371,3 | 240,000 | 221,305 | |||||||||
Citigroup Mortgage Loan Trust, Inc., |
| |||||||||||
Series 2005-WF2, Class AF6A (STEP-reset date 05/25/24) |
| |||||||||||
6.13% | 08/25/35 | 308,335 | 276,227 | |||||||||
COLT Mortgage Loan Trust, |
| |||||||||||
Series 2021-2, Class A1 |
| |||||||||||
0.92% | 08/25/663,6 | 99,505 | 80,563 | |||||||||
COLT Mortgage Loan Trust, |
| |||||||||||
Series 2021-HX1, Class A1 |
| |||||||||||
1.11% | 10/25/663,6 | 315,117 | 260,436 | |||||||||
Conseco Finance Corp., |
| |||||||||||
Series 1999-5, Class A5 |
| |||||||||||
7.86% | 03/01/306 | 70,482 | 23,478 | |||||||||
Credit Suisse Mortgage Capital Trust, |
| |||||||||||
Series 2015-12R, Class 2A2 |
| |||||||||||
3.29% | 11/30/373,6 | 88,660 | 78,639 | |||||||||
Credit Suisse Mortgage Capital Trust, |
| |||||||||||
Series 2021-RPL4, Class A1 |
| |||||||||||
1.80% | 12/27/603,6 | 202,397 | 195,588 | |||||||||
Credit-Based Asset Servicing and Securitization LLC, |
| |||||||||||
Mortgage Loan Trust, |
| |||||||||||
Series 2007-CB2, Class A2C (STEP-reset date 05/25/24) |
| |||||||||||
3.57% | 02/25/37 | 218,854 | 131,513 | |||||||||
Credit-Based Asset Servicing and Securitization LLC, |
| |||||||||||
Mortgage Loan Trust, |
| |||||||||||
Series 2007-CB3, Class A3 (STEP-reset date 05/25/24) |
| |||||||||||
3.32% | 03/25/37 | 799,953 | 290,972 | |||||||||
CSMC Mortgage-Backed Trust, |
| |||||||||||
Series 2007-5, Class 1A9 |
| |||||||||||
6.59% | 08/25/376 | 427,156 | 246,714 | |||||||||
CSMC Trust, |
| |||||||||||
Series 2021-RPL7, Class A1 |
| |||||||||||
1.93% | 07/27/613,6 | 331,430 | 318,462 | |||||||||
Deutsche ALT-A Securities Mortgage Loan Trust, |
| |||||||||||
Series 2007-AR3, Class 2A5 |
| |||||||||||
(CME Term SOFR 1-Month plus 0.51%) |
| |||||||||||
5.84% | 06/25/371 | 289,019 | 248,821 | |||||||||
Ellington Financial Mortgage Trust, |
| |||||||||||
Series 2021-3, Class A1 |
| |||||||||||
1.24% | 09/25/663,6 | 81,559 | 65,286 | |||||||||
Fannie Mae Connecticut Avenue Securities, |
| |||||||||||
Series 2019-R04, Class 2B1 |
| |||||||||||
(SOFR30A plus 5.36%) |
| |||||||||||
10.68% | 06/25/391,3 | 166,981 | 177,258 | |||||||||
See accompanying Notes to Financial Statements.
| 151 / Annual Report March 2024 |
Table of Contents
Strategic Income Fund
Schedule of Portfolio Investments
March 31, 2024
| Issues | Maturity Date | Principal Amount | Value | |||||||||
MORTGAGE-BACKED (continued) |
| |||||||||||
Non-Agency Mortgage-Backed (continued) |
| |||||||||||
Fannie Mae Connecticut Avenue Securities, |
| |||||||||||
Series 2019-R06, Class 2B1 |
| |||||||||||
(SOFR30A plus 3.86%) |
| |||||||||||
9.18% | 09/25/391,3 | $ | 66,184 | $ | 68,883 | |||||||
Fannie Mae Connecticut Avenue Securities, |
| |||||||||||
Series 2021-R03, Class 1B1 |
| |||||||||||
(SOFR30A plus 2.75%) |
| |||||||||||
8.07% | 12/25/411,3 | 150,000 | 153,946 | |||||||||
First Franklin Mortgage Loan Trust, |
| |||||||||||
Series 2006-FF18, Class A2B |
| |||||||||||
(CME Term SOFR 1-Month plus 0.33%) |
| |||||||||||
5.66% | 12/25/371 | 265,715 | 236,814 | |||||||||
First Franklin Mortgage Loan Trust, |
| |||||||||||
Series 2007-FF1, Class A2D |
| |||||||||||
(CME Term SOFR 1-Month plus 0.55%) |
| |||||||||||
5.88% | 01/25/381 | 716,766 | 375,261 | |||||||||
First Franklin Mortgage Loan Trust, |
| |||||||||||
Series 2007-FF2, Class A2B |
| |||||||||||
(CME Term SOFR 1-Month plus 0.31%) |
| |||||||||||
5.64% | 03/25/371 | 515,226 | 251,706 | |||||||||
Freddie Mac Structured Agency Credit Risk Debt Notes, |
| |||||||||||
Series 2021-HQA2, Class M2 |
| |||||||||||
(SOFR30A plus 2.05%) |
| |||||||||||
7.37% | 12/25/331,3 | 119,303 | 120,972 | |||||||||
Freddie Mac Structured Agency Credit Risk Debt Notes, |
| |||||||||||
Series 2022-DNA1, Class M1B |
| |||||||||||
(SOFR30A plus 1.85%) |
| |||||||||||
7.17% | 01/25/421,3 | 150,000 | 151,057 | |||||||||
Freddie Mac Structured Agency Credit Risk Debt Notes, |
| |||||||||||
Series 2022-DNA1, Class M2 |
| |||||||||||
(SOFR30A plus 2.50%) |
| |||||||||||
7.82% | 01/25/421,3 | 200,000 | 204,188 | |||||||||
Fremont Home Loan Trust, |
| |||||||||||
Series 2005-A, Class M4 |
| |||||||||||
(CME Term SOFR 1-Month plus 1.13%) |
| |||||||||||
6.46% | 01/25/351 | 286,455 | 246,967 | |||||||||
GMACM Mortgage Corp. Loan Trust, |
| |||||||||||
Series 2006-AR1, Class 1A1 |
| |||||||||||
3.64% | 04/19/366 | 178,566 | 139,790 | |||||||||
GreenPoint Mortgage Funding Trust, |
| |||||||||||
Series 2005-AR1, Class A2 |
| |||||||||||
(CME Term SOFR 1-Month plus 0.55%) |
| |||||||||||
5.88% | 06/25/451 | 58,702 | 52,784 | |||||||||
GSAA Home Equity Trust, |
| |||||||||||
Series 2006-1, Class A3 |
| |||||||||||
(CME Term SOFR 1-Month plus 0.77%) |
| |||||||||||
6.10% | 01/25/361 | 677,563 | 286,359 | |||||||||
GSAA Home Equity Trust, |
| |||||||||||
Series 2006-10, Class AF3 |
| |||||||||||
5.98% | 06/25/366 | 573,054 | 141,311 | |||||||||
GSAA Home Equity Trust, |
| |||||||||||
Series 2006-6, Class AF3 |
| |||||||||||
5.73% | 03/25/366 | 526,829 | 150,719 | |||||||||
| Issues | Maturity Date | Principal Amount | Value | |||||||||
MORTGAGE-BACKED (continued) |
| |||||||||||
Non-Agency Mortgage-Backed (continued) |
| |||||||||||
GSAA Home Equity Trust, |
| |||||||||||
Series 2007-4, Class A2 |
| |||||||||||
(CME Term SOFR 1-Month plus 0.51%) |
| |||||||||||
5.84% | 03/25/371 | $ | 1,016,661 | $ | 277,822 | |||||||
GSAA Home Equity Trust, |
| |||||||||||
| Series 2007-5, Class 1AF6 (STEP-reset date 05/25/24) |
| |||||||||||
5.91% | 05/25/37 | 679,830 | 234,877 | |||||||||
GSAA Home Equity Trust, |
| |||||||||||
Series 2007-5, Class 2A1B |
| |||||||||||
(CME Term SOFR 1-Month plus 0.39%) |
| |||||||||||
5.72% | 04/25/471 | 1,739,354 | 329,360 | |||||||||
GSAA Trust, |
| |||||||||||
| Series 2006-7, Class AF3 (STEP-reset date 05/25/24) |
| |||||||||||
6.72% | 03/25/46 | 680,154 | 258,670 | |||||||||
GSAMP Trust, |
| |||||||||||
Series 2007-NC1, Class A2C |
| |||||||||||
(CME Term SOFR 1-Month plus 0.26%) |
| |||||||||||
5.59% | 12/25/461 | 246,790 | 120,790 | |||||||||
HarborView Mortgage Loan Trust, |
| |||||||||||
Series 2005-3, Class 1A |
| |||||||||||
(CME Term SOFR 1-Month plus 0.63%) |
| |||||||||||
5.96% | 06/19/351 | 294,578 | 163,989 | |||||||||
HarborView Mortgage Loan Trust, |
| |||||||||||
Series 2006-4, Class 1A1A |
| |||||||||||
(CME Term SOFR 1-Month plus 0.47%) |
| |||||||||||
5.80% | 05/19/461 | 590,208 | 312,050 | |||||||||
HarborView Mortgage Loan Trust, |
| |||||||||||
Series 2006-5, Class 1A1A |
| |||||||||||
| (Federal Reserve US 12-Month Cumulative Average plus 0.91%) |
| |||||||||||
6.00% | 07/19/471 | 309,395 | 116,991 | |||||||||
HSI Asset Loan Obligation Trust, |
| |||||||||||
Series 2007-2, Class 2A12 |
| |||||||||||
6.00% | 09/25/37 | 211,567 | 160,181 | |||||||||
HSI Asset Securitization Corp. Trust, |
| |||||||||||
Series 2007-OPT1, Class 1A |
| |||||||||||
(CME Term SOFR 1-Month plus 0.25%) |
| |||||||||||
5.58% | 12/25/361 | 195,097 | 164,418 | |||||||||
Impac CMB Trust, |
| |||||||||||
Series 2004-4, Class 1A2 |
| |||||||||||
(CME Term SOFR 1-Month plus 0.73%) |
| |||||||||||
6.06% | 09/25/341 | 33,223 | 33,181 | |||||||||
Impac CMB Trust, |
| |||||||||||
Series 2004-6, Class 1A2 |
| |||||||||||
(CME Term SOFR 1-Month plus 0.89%) |
| |||||||||||
6.22% | 10/25/341 | 59,188 | 58,600 | |||||||||
IndyMac Index Mortgage Loan Trust, |
| |||||||||||
Series 2005-AR25, Class 2A1 |
| |||||||||||
3.68% | 12/25/356 | 206,819 | 167,945 | |||||||||
IndyMac Index Mortgage Loan Trust, |
| |||||||||||
Series 2007-AR5, Class 2A1 |
| |||||||||||
3.37% | 05/25/376 | 196,622 | 152,837 | |||||||||
| IndyMac Manufactured Housing Contract Pass-Through Certificates, |
| |||||||||||
Series 1997-1, Class A3 |
| |||||||||||
6.61% | 02/25/28 | 21,906 | 21,712 | |||||||||
See accompanying Notes to Financial Statements.
| Annual Report March 2024 / 152 |
Table of Contents
Strategic Income Fund
Schedule of Portfolio Investments
March 31, 2024
| Issues | Maturity Date | Principal Amount | Value | |||||||||
MORTGAGE-BACKED (continued) |
| |||||||||||
Non-Agency Mortgage-Backed (continued) |
| |||||||||||
| IndyMac Manufactured Housing Contract Pass-Through Certificates, |
| |||||||||||
Series 1997-1, Class A4 |
| |||||||||||
6.75% | 02/25/28 | $ | 9,222 | $ | 9,142 | |||||||
IndyMac Manufactured Housing Contract Pass-Through |
| |||||||||||
Certificates, |
| |||||||||||
Series 1998-1, Class A4 |
| |||||||||||
6.49% | 09/25/28 | 20,799 | 20,772 | |||||||||
IndyMac Manufactured Housing Contract Pass-Through |
| |||||||||||
Certificates, |
| |||||||||||
Series 1998-1, Class A5 |
| |||||||||||
6.96% | 09/25/286 | 50,132 | 49,843 | |||||||||
JPMorgan Mortgage Acquisition Trust, |
| |||||||||||
Series 2007-HE1, Class AF6 (STEP-reset date 05/25/24) |
| |||||||||||
4.29% | 03/25/47 | 586,944 | 379,310 | |||||||||
Long Beach Mortgage Loan Trust, |
| |||||||||||
Series 2006-9, Class 2A3 |
| |||||||||||
(CME Term SOFR 1-Month plus 0.43%) |
| |||||||||||
5.76% | 10/25/361 | 388,813 | 120,508 | |||||||||
Luminent Mortgage Trust, |
| |||||||||||
Series 2006-5, Class A1A |
| |||||||||||
(CME Term SOFR 1-Month plus 0.49%) |
| |||||||||||
5.82% | 07/25/361 | 255,860 | 163,280 | |||||||||
MASTR Adjustable Rate Mortgages Trust, |
| |||||||||||
Series 2007-1, Class I1A |
| |||||||||||
(CME Term SOFR 1-Month plus 0.50%) |
| |||||||||||
5.83% | 01/25/471 | 431,220 | 181,501 | |||||||||
MASTR Adjustable Rate Mortgages Trust, |
| |||||||||||
Series 2007-2, Class A1 |
| |||||||||||
(CME Term SOFR 1-Month plus 0.41%) |
| |||||||||||
5.74% | 03/25/471 | 217,717 | 199,481 | |||||||||
MASTR Alternative Loan Trust, |
| |||||||||||
Series 2006-2, Class 2A1 |
| |||||||||||
(CME Term SOFR 1-Month plus 0.51%) |
| |||||||||||
5.84% | 03/25/361,4,5 | 2,399,670 | 256,801 | |||||||||
MASTR Asset-Backed Securities Trust, |
| |||||||||||
Series 2007-HE1, Class A3 |
| |||||||||||
(CME Term SOFR 1-Month plus 0.32%) |
| |||||||||||
5.65% | 05/25/371 | 119,155 | 113,690 | |||||||||
MASTR Asset-Backed Securities Trust, |
| |||||||||||
Series 2007-HE1, Class A4 |
| |||||||||||
(CME Term SOFR 1-Month plus 0.39%) |
| |||||||||||
5.72% | 05/25/371 | 300,000 | 236,380 | |||||||||
Merrill Lynch Alternative Note Asset Trust, |
| |||||||||||
Series 2007-A3, Class A2D |
| |||||||||||
(CME Term SOFR 1-Month plus 0.77%) |
| |||||||||||
6.10% | 04/25/371,4,5 | 1,696,107 | 78,853 | |||||||||
Merrill Lynch First Franklin Mortgage Loan Trust, |
| |||||||||||
Series 2007-2, Class A2B |
| |||||||||||
(CME Term SOFR 1-Month plus 0.45%) |
| |||||||||||
5.78% | 05/25/371 | 352,298 | 247,456 | |||||||||
Merrill Lynch Mortgage Investors Trust, |
| |||||||||||
Series 2006-RM2, Class A1A |
| |||||||||||
(CME Term SOFR 1-Month plus 0.48%) |
| |||||||||||
5.81% | 05/25/371 | 434,656 | 117,910 | |||||||||
| Issues | Maturity Date | Principal Amount | Value | |||||||||
MORTGAGE-BACKED (continued) |
| |||||||||||
Non-Agency Mortgage-Backed (continued) |
| |||||||||||
Mid-State Capital Corp. Trust, |
| |||||||||||
Series 2005-1, Class A |
| |||||||||||
5.75% | 01/15/40 | $ | 49,153 | $ | 48,383 | |||||||
Mid-State Trust XI, |
| |||||||||||
Series 11, Class B |
| |||||||||||
8.22% | 07/15/38 | 2,993 | 3,002 | |||||||||
Morgan Stanley ABS Capital I, Inc., Trust, |
| |||||||||||
Series 2006-HE4, Class A3 |
| |||||||||||
(CME Term SOFR 1-Month plus 0.41%) |
| |||||||||||
5.74% | 06/25/361 | 597,912 | 313,860 | |||||||||
Morgan Stanley Home Equity Loan Trust, |
| |||||||||||
Series 2007-1, Class A3 |
| |||||||||||
(CME Term SOFR 1-Month plus 0.25%) |
| |||||||||||
5.58% | 12/25/361 | 594,898 | 290,924 | |||||||||
Morgan Stanley Mortgage Loan Trust, |
| |||||||||||
Series 2004-7AR, Class 2A4 |
| |||||||||||
5.39% | 09/25/346 | 72,776 | 70,194 | |||||||||
Morgan Stanley Mortgage Loan Trust, |
| |||||||||||
Series 2006-15XS, Class A4A (STEP-reset date 05/25/24) |
| |||||||||||
6.70% | 11/25/36 | 418,862 | 95,776 | |||||||||
Morgan Stanley Mortgage Loan Trust, |
| |||||||||||
Series 2006-7, Class 5A2 |
| |||||||||||
5.96% | 06/25/366 | 887,797 | 251,333 | |||||||||
Morgan Stanley Mortgage Loan Trust, |
| |||||||||||
Series 2007-11AR, Class 2A3 |
| |||||||||||
2.86% | 06/25/376 | 295,876 | 157,135 | |||||||||
New Residential Mortgage Loan Trust, |
| |||||||||||
Series 2022-NQM2, Class A2 |
| |||||||||||
3.70% | 03/27/623,6 | 250,000 | 193,224 | |||||||||
Nomura Resecuritization Trust, |
| |||||||||||
Series 2015-4R, Class 2A2 |
| |||||||||||
(CME Term SOFR 1-Month plus 0.42%) |
| |||||||||||
3.44% | 10/26/361,3 | 326,746 | 283,451 | |||||||||
OBX Trust, |
| |||||||||||
Series 2022-NQM1, Class A1 |
| |||||||||||
2.31% | 11/25/613,6 | 233,714 | 201,037 | |||||||||
Option One Mortgage Loan Trust, |
| |||||||||||
Series 2006-3, Class 1A1 |
| |||||||||||
(CME Term SOFR 1-Month plus 0.25%) |
| |||||||||||
5.58% | 02/25/371 | 179,388 | 111,869 | |||||||||
PRET LLC, |
| |||||||||||
Series 2022-RN2, Class A2 (STEP-reset date 04/25/24) |
| |||||||||||
6.50% | 06/25/523 | 197,000 | 186,713 | |||||||||
PRPM LLC, |
| |||||||||||
Series 2020-4, Class A1 (STEP-reset date 04/25/24) |
| |||||||||||
5.61% | 10/25/253 | 64,351 | 64,270 | |||||||||
PRPM LLC, |
| |||||||||||
Series 2021-4, Class A1 (STEP-reset date 04/25/24) |
| |||||||||||
1.87% | 04/25/263 | 171,429 | 167,579 | |||||||||
PRPM LLC, |
| |||||||||||
Series 2021-5, Class A1 (STEP-reset date 04/25/24) |
| |||||||||||
1.79% | 06/25/263 | 82,850 | 81,182 | |||||||||
PRPM LLC, |
| |||||||||||
Series 2021-9, Class A1 (STEP-reset date 04/25/24) |
| |||||||||||
2.36% | 10/25/263 | 112,287 | 109,686 | |||||||||
See accompanying Notes to Financial Statements.
| 153 / Annual Report March 2024 |
Table of Contents
Strategic Income Fund
Schedule of Portfolio Investments
March 31, 2024
| Issues | Maturity Date | Principal Amount | Value | |||||||||
MORTGAGE-BACKED (continued) |
| |||||||||||
Non-Agency Mortgage-Backed (continued) |
| |||||||||||
PRPM LLC, |
| |||||||||||
Series 2022-1, Class A1 (STEP-reset date 04/25/24) |
| |||||||||||
3.72% | 02/25/273 | $ | 169,314 | $ | 164,898 | |||||||
PRPM LLC, |
| |||||||||||
Series 2022-4, Class A2 (STEP-reset date 04/25/24) |
| |||||||||||
5.00% | 08/25/273 | 170,000 | 162,455 | |||||||||
PRPM, LLC, |
| |||||||||||
Series 2021-8, Class A1 |
| |||||||||||
1.74% | 09/25/263,6 | 69,005 | 66,509 | |||||||||
Residential Accredit Loans Trust, |
| |||||||||||
Series 2005-QA3, Class NB1 |
| |||||||||||
3.63% | 03/25/356 | 110,453 | 58,830 | |||||||||
Residential Accredit Loans Trust, |
| |||||||||||
Series 2006-QS5, Class A6 |
| |||||||||||
6.00% | 05/25/36 | 250,427 | 206,018 | |||||||||
Residential Accredit Loans Trust, |
| |||||||||||
Series 2007-QS1, Class 1A5 |
| |||||||||||
(CME Term SOFR 1-Month plus 0.66%) |
| |||||||||||
5.99% | 01/25/371 | 295,734 | 210,142 | |||||||||
Residential Asset Securities Corp., |
| |||||||||||
Series 2005-KS11, Class M3 |
| |||||||||||
(CME Term SOFR 1-Month plus 0.77%) |
| |||||||||||
6.10% | 12/25/351 | 164,736 | 160,144 | |||||||||
Residential Asset Securitization Trust, |
| |||||||||||
Series 2005-A5, Class A8 |
| |||||||||||
5.50% | 05/25/35 | 362,680 | 261,055 | |||||||||
SG Mortgage Securities Trust, |
| |||||||||||
Series 2006-OPT2, Class A3D |
| |||||||||||
(CME Term SOFR 1-Month plus 0.32%) |
| |||||||||||
5.65% | 10/25/361 | 250,000 | 187,222 | |||||||||
Starwood Mortgage Residential Trust, |
| |||||||||||
Series 2021-6, Class A1 |
| |||||||||||
1.92% | 11/25/663,6 | 193,847 | 162,806 | |||||||||
Structured Adjustable Rate Mortgage Loan Trust, |
| |||||||||||
Series 2004-12, Class 2A |
| |||||||||||
5.59% | 09/25/346 | 69,685 | 67,061 | |||||||||
Structured Asset Mortgage Investments II Trust, |
| |||||||||||
Series 2005-AR8, Class A1B |
| |||||||||||
(CME Term SOFR 1-Month plus 0.28%) |
| |||||||||||
5.61% | 02/25/361 | 298,111 | 258,671 | |||||||||
Structured Asset Mortgage Investments II Trust, |
| |||||||||||
Series 2006-AR7, Class A1A |
| |||||||||||
(CME Term SOFR 1-Month plus 0.53%) |
| |||||||||||
5.86% | 08/25/361 | 362,772 | 286,825 | |||||||||
Terwin Mortgage Trust, |
| |||||||||||
Series 2004-7HE, Class A1 |
| |||||||||||
(CME Term SOFR 1-Month plus 1.21%) |
| |||||||||||
6.54% | 07/25/341,3 | 51,421 | 48,628 | |||||||||
Towd Point Mortgage Trust, |
| |||||||||||
Series 2017-4, Class A2 |
| |||||||||||
3.00% | 06/25/573,6 | 350,000 | 318,577 | |||||||||
Towd Point Mortgage Trust, |
| |||||||||||
Series 2019-HY2, Class M2 |
| |||||||||||
(CME Term SOFR 1-Month plus 2.01%) |
| |||||||||||
7.34% | 05/25/581,3 | 210,000 | 221,170 | |||||||||
| Issues | Maturity Date | Principal Amount | Value | |||||||||
MORTGAGE-BACKED (continued) |
| |||||||||||
Non-Agency Mortgage-Backed (continued) |
| |||||||||||
TRK Trust, |
| |||||||||||
Series 2021-INV2, Class A1 |
| |||||||||||
1.97% | 11/25/563,6 | $ | 241,190 | $ | 197,939 | |||||||
VOLT XCIV LLC, |
| |||||||||||
| Series 2021-NPL3, Class A1 (STEP-reset date 04/25/24) |
| |||||||||||
5.24% | 02/27/513 | 63,655 | 62,334 | |||||||||
WaMu Asset-Backed Certificates, |
| |||||||||||
Series 2007-HE1, Class 2A4 |
| |||||||||||
(CME Term SOFR 1-Month plus 0.34%) |
| |||||||||||
5.67% | 01/25/371 | 518,377 | 224,367 | |||||||||
|
|
| ||||||||||
| 20,828,113 | ||||||||||||
|
|
| ||||||||||
U.S. Agency Commercial Mortgage-Backed — 0.46% |
| |||||||||||
Fannie Mae-Aces, |
| |||||||||||
Series 2016-M11, Class X2 (IO) |
| |||||||||||
3.05% | 07/25/396 | 244,933 | 3,593 | |||||||||
Freddie Mac Multifamily PC REMIC Trust, |
| |||||||||||
Series 2019-P002, Class X (IO) |
| |||||||||||
0.89% | 07/25/336 | 535,000 | 39,888 | |||||||||
Freddie Mac Multifamily Structured Pass-Through |
| |||||||||||
Certificates, |
| |||||||||||
Series K040, Class X3 (IO) |
| |||||||||||
2.03% | 11/25/426 | 1,100,000 | 9,576 | |||||||||
Freddie Mac Multifamily Structured Pass-Through |
| |||||||||||
Certificates, |
| |||||||||||
Series K047, Class X3 (IO) |
| |||||||||||
1.49% | 06/25/436 | 1,676,868 | 25,891 | |||||||||
Freddie Mac Multifamily Structured Pass-Through |
| |||||||||||
Certificates, |
| |||||||||||
Series KC04, Class X1 (IO) |
| |||||||||||
1.25% | 12/25/266 | 2,219,980 | 34,033 | |||||||||
Freddie Mac Multifamily Structured Pass-Through |
| |||||||||||
Certificates, |
| |||||||||||
Series KC05, Class X1 (IO) |
| |||||||||||
1.23% | 06/25/276 | 1,822,805 | 37,557 | |||||||||
Freddie Mac Multifamily Structured Pass-Through |
| |||||||||||
Certificates, |
| |||||||||||
Series Q010, Class XPT2 (IO) |
| |||||||||||
0.36% | 08/25/24 | 595,429 | 662 | |||||||||
Ginnie Mae, |
| |||||||||||
Series 2009-114, Class IO (IO) |
| |||||||||||
0.00% | 10/16/496 | 4,074,773 | 62 | |||||||||
Ginnie Mae, |
| |||||||||||
Series 2010-148, Class IO (IO) |
| |||||||||||
0.30% | 09/16/506 | 1,347,599 | 13,623 | |||||||||
Ginnie Mae, |
| |||||||||||
Series 2012-123, Class IO (IO) |
| |||||||||||
0.62% | 12/16/516 | 1,996,064 | 23,789 | |||||||||
Ginnie Mae, |
| |||||||||||
Series 2012-125, Class IO (IO) |
| |||||||||||
0.17% | 02/16/536 | 6,329,207 | 28,159 | |||||||||
Ginnie Mae, |
| |||||||||||
Series 2012-27, Class IO (IO) |
| |||||||||||
0.23% | 04/16/536 | 2,609,829 | 5,589 | |||||||||
See accompanying Notes to Financial Statements.
| Annual Report March 2024 / 154 |
Table of Contents
Strategic Income Fund
Schedule of Portfolio Investments
March 31, 2024
| Issues | Maturity Date | Principal Amount | Value | |||||||||
MORTGAGE-BACKED (continued) |
| |||||||||||
U.S. Agency Commercial Mortgage-Backed (continued) |
| |||||||||||
Ginnie Mae, |
| |||||||||||
Series 2013-156, Class IO (IO) |
| |||||||||||
0.24% | 06/16/556 | $ | 3,462,969 | $ | 15,526 | |||||||
Ginnie Mae, |
| |||||||||||
Series 2013-163, Class IO (IO) |
| |||||||||||
1.01% | 02/16/466 | 1,139,989 | 13,385 | |||||||||
Ginnie Mae, |
| |||||||||||
Series 2013-63, Class IO (IO) |
| |||||||||||
0.78% | 09/16/516 | 3,529,334 | 68,054 | |||||||||
Ginnie Mae, |
| |||||||||||
Series 2013-74, Class IO (IO) |
| |||||||||||
0.51% | 12/16/536 | 620,113 | 4,694 | |||||||||
Ginnie Mae, |
| |||||||||||
Series 2014-103, Class IO (IO) |
| |||||||||||
0.19% | 05/16/556 | 844,754 | 5,303 | |||||||||
Ginnie Mae, |
| |||||||||||
Series 2014-125, Class IO (IO) |
| |||||||||||
0.90% | 11/16/546 | 497,098 | 10,489 | |||||||||
Ginnie Mae, |
| |||||||||||
Series 2015-47, Class IO (IO) |
| |||||||||||
0.37% | 10/16/566 | 520,045 | 6,628 | |||||||||
|
|
| ||||||||||
| 346,501 | ||||||||||||
|
|
| ||||||||||
U.S. Agency Mortgage-Backed — 15.97% |
| |||||||||||
Fannie Mae REMICS, |
| |||||||||||
Series 2000-45, Class SA (IO) |
| |||||||||||
(-1.00 X SOFR30A plus 7.84%, 7.95% Cap) |
| |||||||||||
2.52% | 12/18/301 | 10,745 | 436 | |||||||||
Fannie Mae REMICS, |
| |||||||||||
Series 2001-42, Class SB |
| |||||||||||
(-16.00 X SOFR30A plus 126.17%, 8.50% Cap) |
| |||||||||||
8.50% | 09/25/311 | 182 | 180 | |||||||||
Fannie Mae REMICS, |
| |||||||||||
Series 2003-124, Class TS |
| |||||||||||
(-14.00 X SOFR30A plus 99.20%, 9.80% Cap) |
| |||||||||||
9.80% | 01/25/341 | 2,049 | 2,053 | |||||||||
Fannie Mae REMICS, |
| |||||||||||
Series 2005-92, Class US (IO) |
| |||||||||||
(-1.00 X SOFR30A plus 5.99%, 6.10% Cap) |
| |||||||||||
0.67% | 10/25/251 | 24,887 | 67 | |||||||||
Fannie Mae REMICS, |
| |||||||||||
Series 2006-125, Class SM (IO) |
| |||||||||||
(-1.00 X SOFR30A plus 7.09%, 7.20% Cap) |
| |||||||||||
1.77% | 01/25/371 | 393,688 | 35,102 | |||||||||
Fannie Mae REMICS, |
| |||||||||||
Series 2008-50, Class SA (IO) |
| |||||||||||
(-1.00 X SOFR30A plus 5.94%, 6.05% Cap) |
| |||||||||||
0.62% | 11/25/361 | 444,117 | 30,547 | |||||||||
Fannie Mae REMICS, |
| |||||||||||
Series 2010-43, Class KS (IO) |
| |||||||||||
(-1.00 X SOFR30A plus 6.31%, 6.42% Cap) |
| |||||||||||
0.99% | 05/25/401 | 442,754 | 41,071 | |||||||||
Freddie Mac Pool SD8245 |
| |||||||||||
4.50% | 09/01/52 | 593,847 | 565,711 | |||||||||
Freddie Mac Pool SD8275 |
| |||||||||||
4.50% | 12/01/52 | 933,832 | 889,858 | |||||||||
| Issues | Maturity Date | Principal Amount | Value | |||||||||
MORTGAGE-BACKED (continued) |
| |||||||||||
U.S. Agency Mortgage-Backed (continued) |
| |||||||||||
Freddie Mac REMICS, |
| |||||||||||
Series 3247, Class SI (IO) |
| |||||||||||
(-1.00 X SOFR30A plus 6.54%, 0.15% Cap) |
| |||||||||||
0.15% | 08/15/361 | $ | 5,760,065 | $ | 24,932 | |||||||
Freddie Mac REMICS, |
| |||||||||||
Series 3289, Class SD (IO) |
| |||||||||||
(-1.00 X SOFR30A plus 6.01%, 6.12% Cap) |
| |||||||||||
0.69% | 03/15/371 | 455,309 | 26,348 | |||||||||
Ginnie Mae (TBA) |
| |||||||||||
4.50% | 04/20/54 | 1,050,000 | 1,009,177 | |||||||||
5.00% | 04/20/54 | 850,000 | 835,529 | |||||||||
5.50% | 04/20/54 | 375,000 | 374,736 | |||||||||
Ginnie Mae, |
| |||||||||||
Series 2013-25, Class SA (IO) |
| |||||||||||
(-1.00 X CME Term SOFR 1-Month plus 6.09%, 6.20% Cap) | ||||||||||||
0.76% | 02/20/431 | 1,156,109 | 117,022 | |||||||||
UMBS (TBA) |
| |||||||||||
2.00% | 04/01/54 | 1,425,000 | 1,128,720 | |||||||||
2.50% | 04/01/54 | 800,000 | 661,889 | |||||||||
3.00% | 04/01/54 | 1,000,000 | 861,031 | |||||||||
4.00% | 04/01/54 | 2,900,000 | 2,686,351 | |||||||||
4.50% | 04/01/54 | 1,575,000 | 1,500,249 | |||||||||
5.00% | 04/01/54 | 825,000 | 805,051 | |||||||||
5.50% | 04/01/54 | 425,000 | 422,934 | |||||||||
|
|
| ||||||||||
| 12,018,994 | ||||||||||||
|
|
| ||||||||||
Total Mortgage-Backed |
| |||||||||||
(Cost $42,663,338) |
| 36,314,303 | ||||||||||
|
|
| ||||||||||
MUNICIPAL BONDS — 0.13%* |
| |||||||||||
California — 0.03% |
| |||||||||||
| California Health Facilities Financing Authority Revenue Bonds, Series A |
| |||||||||||
3.00% | 08/15/51 | 20,000 | 15,998 | |||||||||
| California State University Revenue Bonds, University & College Improvements, Series B |
| |||||||||||
2.37% | 11/01/35 | 10,000 | 7,960 | |||||||||
|
|
| ||||||||||
| 23,958 | ||||||||||||
|
|
| ||||||||||
Florida — 0.02% |
| |||||||||||
| County of Miami-Dade Aviation Revenue Bonds, Airport and Marina Improvements, Series B |
| |||||||||||
2.86% | 10/01/35 | 15,000 | 12,241 | |||||||||
|
|
| ||||||||||
New York — 0.08% |
| |||||||||||
| New York City Transitional Finance Authority Future Tax Secured Revenue Bonds, Public Improvements, Subseries B3 |
| |||||||||||
1.85% | 08/01/32 | 75,000 | 60,144 | |||||||||
|
|
| ||||||||||
Total Municipal Bonds |
| |||||||||||
(Cost $114,754) |
| 96,343 | ||||||||||
|
|
| ||||||||||
See accompanying Notes to Financial Statements.
| 155 / Annual Report March 2024 |
Table of Contents
Strategic Income Fund
Schedule of Portfolio Investments
March 31, 2024
| Issues | Maturity Date | Principal Amount | Value | |||||||||
U.S. TREASURY SECURITIES — 3.23% |
| |||||||||||
U.S. Treasury Notes — 3.23% |
| |||||||||||
U.S. Treasury Notes |
| |||||||||||
4.25% | 03/15/27 | $ | 2,440,000 | $ | 2,429,230 | |||||||
|
|
| ||||||||||
Total U.S. Treasury Securities |
| |||||||||||
(Cost $2,438,444) |
| |||||||||||
Total Bonds — 91.19% |
| |||||||||||
(Cost $75,386,351) |
| 68,616,648 | ||||||||||
|
|
| ||||||||||
| Issues | Shares | Value | ||||||||||
COMMON STOCK — 0.10% |
| |||||||||||
Communications — 0.04% |
| |||||||||||
Intelsat Emergence SA2,4,5,8 |
| |||||||||||
(Luxembourg) | 1,042 | 28,004 | ||||||||||
|
|
| ||||||||||
Finance — 0.06% |
| |||||||||||
AGNC Investment Corp. | 4,500 | 44,550 | ||||||||||
|
|
| ||||||||||
Total Common Stock |
| |||||||||||
(Cost $90,045) |
| 72,554 | ||||||||||
|
|
| ||||||||||
| Issues | Maturity Date | Principal Amount/Shares | Value | |||||||||
SHORT-TERM INVESTMENTS — 24.39% |
| |||||||||||
Money Market Funds — 5.20% |
| |||||||||||
| Dreyfus Government Cash Management Fund |
| |||||||||||
5.20%11 | 439,000 | 439,000 | ||||||||||
| Fidelity Investments Money Market Funds - Government Portfolio |
| |||||||||||
5.21%11 | 24,346 | 24,346 | ||||||||||
| Morgan Stanley Institutional Liquidity Funds - Government Portfolio |
| |||||||||||
5.22%11 | 3,451,000 | 3,451,000 | ||||||||||
|
|
| ||||||||||
| 3,914,346 | ||||||||||||
|
|
| ||||||||||
U.S. Treasury Bills — 19.19% |
| |||||||||||
U.S. Treasury Bills |
| |||||||||||
5.49%12 | 04/11/24 | 10,000,000 | 9,985,461 | |||||||||
U.S. Treasury Bills (WI) |
| |||||||||||
5.38%12 | 04/25/24 | 1,000,000 | 996,499 | |||||||||
5.29%12 | 07/09/24 | 3,000,000 | 2,955,914 | |||||||||
5.46%12 | 04/04/24 | 500,000 | 499,563 | |||||||||
|
|
| ||||||||||
| 14,437,437 | ||||||||||||
|
|
| ||||||||||
Total Short-Term Investments |
| |||||||||||
(Cost $18,352,899) |
| 18,351,783 | ||||||||||
|
|
| ||||||||||
Total Investments - 115.68% |
| |||||||||||
(Cost $93,829,295) |
| 87,040,985 | ||||||||||
|
|
| ||||||||||
| Liabilities in Excess of Other Assets - (15.68)% |
| (11,798,994 | ) | |||||||||
|
|
| ||||||||||
Net Assets - 100.00% |
| $ | 75,241,991 | |||||||||
|
|
| ||||||||||
| 1 | Floating rate security. The rate disclosed was in effect at March 31, 2024. |
| 2 | Foreign denominated security issued by foreign domiciled entity. |
| 3 | Securities exempt from registration under Rule 144A of the Securities Act of 1933, as amended. The securities may be resold in transactions exempt from registration, normally to qualified institutional buyers. |
| 4 | Security is valued using significant unobservable inputs and is classified as Level 3 in the fair value hierarchy. |
| 5 | Illiquid security as determined under procedures approved by the Board of Trustees. The aggregate value of illiquid securities is $461,752, which is 0.61% of total net assets. |
| 6 | Variable rate security. Interest rate disclosed is as of the most recent information available. Certain variable rate securities are not based on a published reference rate and spread but are determined by the issuer or agent and are based on current market conditions. |
| 7 | Perpetual security with no stated maturity date. |
| 8 | Non-income producing security. |
| 9 | Security is currently in default with regard to scheduled interest or principal payments. |
| 10 | Zero coupon bond. The rate shown is the effective yield as of March 31, 2024. |
| 11 | Represents the current yield as of March 31, 2024. |
| 12 | Represents annualized yield at date of purchase. |
| * | Securities with a call or reset feature will have an effective maturity date sooner than the stated maturity. |
| ** | Securities backed by mortgage or consumer loans where payment is periodically made will have an effective maturity date sooner than the stated maturity date. |
Note: For Fund compliance purposes, the Fund’s industry classifications refer to any one or more of the industry sub-classifications used by one or more widely recognized market indexes or ratings group indexes, and/or as defined by Fund management. This definition may not apply for purposes of this report, which may combine industry sub-classifications for more meaningful presentation for investors.
(CDO): Collateralized Debt Obligation
(CLO): Collateralized Loan Obligation
(EMTN): Euro Medium-Term Note
(EUR): Euro
(EURIBOR): Euro InterBank Offer Rate
(GMTN): Global Medium-Term Note
(IO): Interest Only
(MTN): Medium-Term Note
(REIT): Real Estate Investment Trust
(SOFR): Secured Overnight Financing Rate
(STEP): Step Coupon Bond
(TBA): To-Be-Announced
(TSFR): Term Secured overnight financing rate
(WI): When Issued
See accompanying Notes to Financial Statements.
| Annual Report March 2024 / 156 |
Table of Contents
Strategic Income Fund
Schedule of Portfolio Investments
March 31, 2024
Currency to be Purchased | Currency to be Sold | Counterparty | Settlement Date | Unrealized Appreciation (Depreciation) | ||||||||||||||||
FOREIGN CURRENCY EXCHANGE CONTRACT |
| |||||||||||||||||||
USD 895,929 | EUR 814,000 | Citibank N.A. | 04/12/24 | $ | 16,298 | |||||||||||||||
USD 187,151 | EUR 172,000 | Bank of America N.A. | 04/12/24 | 1,284 | ||||||||||||||||
USD 87,105 | EUR 79,000 | Citibank N.A. | 04/12/24 | 1,735 | ||||||||||||||||
|
| |||||||||||||||||||
| 19,317 | ||||||||||||||||||||
|
| |||||||||||||||||||
EUR 75,000 | USD 81,616 | Bank of America N.A. | 04/12/24 | (569) | ||||||||||||||||
EUR 177,000 | USD 191,609 | Citibank N.A. | 04/12/24 | (338) | ||||||||||||||||
|
| |||||||||||||||||||
| (907) | ||||||||||||||||||||
|
| |||||||||||||||||||
NET UNREALIZED APPRECIATION |
| $ | 18,410 | |||||||||||||||||
|
| |||||||||||||||||||
| ||||||||||||||||||||
| Description | Number of Contracts | Expiration Date | Notional Amount | Value | Unrealized Appreciation (Depreciation) | |||||||||||||||
FUTURES CONTRACTS: LONG POSITIONS |
| |||||||||||||||||||
U.S. Treasury Five-Year Note | 133 | 06/28/24 | $ | 14,233,079 | $ | 19,105 | $ | 19,105 | ||||||||||||
U.S. Treasury Two-Year Note | 58 | 06/28/24 | 11,860,094 | (9,122) | (9,122) | |||||||||||||||
|
|
|
|
|
| |||||||||||||||
| 26,093,173 | 9,983 | 9,983 | ||||||||||||||||||
|
|
|
|
|
| |||||||||||||||
FUTURES CONTRACTS: SHORT POSITIONS |
| |||||||||||||||||||
U.S. Treasury Ten-Year Ultra Bond | 20 | 06/18/24 | (2,292,188) | (14,484) | (14,484) | |||||||||||||||
U.S. Treasury Ultra Bond | 14 | 06/18/24 | (1,806,000) | (17,844) | (17,844) | |||||||||||||||
Euro-Bund Future | 4 | 06/06/24 | (576,202) | (3,180) | (3,180) | |||||||||||||||
Euro-Bobl Future | 2 | 06/06/24 | (255,420) | (1,147) | (1,147) | |||||||||||||||
|
|
|
|
|
| |||||||||||||||
| (4,929,810) | (36,655) | (36,655) | ||||||||||||||||||
|
|
|
|
|
| |||||||||||||||
TOTAL FUTURES CONTRACTS | $ | 21,163,363 | $ | (26,672) | $ | (26,672) | ||||||||||||||
|
|
|
|
|
| |||||||||||||||
| Received by the Fund | Paid by the Fund | |||||||||||||||||||||||||||||||||
| Description | Maturity Date | Rate | Frequency | Rate | Frequency | Notional Amount (000’s) | Value | Premiums Paid | Unrealized Appreciation (Depreciation) | |||||||||||||||||||||||||
| SWAPS: INTEREST RATE | ||||||||||||||||||||||||||||||||||
Interest Rate Swap1 | 12/20/53 | | USD-SOFR- COMPOUND |
| Annual | 3.52% | Annual | $ | 157 | $ | 1,830 | $ | — | $ | 1,830 | |||||||||||||||||||
|
|
|
|
|
|
|
| |||||||||||||||||||||||||||
| TOTAL SWAPS CONTRACTS |
| $ | 157 | $ | 1,830 | $ | — | $ | 1,830 | |||||||||||||||||||||||||
|
|
|
|
|
|
|
| |||||||||||||||||||||||||||
| 1 | Centrally cleared. |
See accompanying Notes to Financial Statements.
| 157 / Annual Report March 2024 |
Table of Contents
Schedule of Portfolio Investments
March 31, 2024
| Issues | Maturity Date | Principal Amount | Value | |||||||||||
BONDS – 111.17% |
| |||||||||||||
ASSET-BACKED SECURITIES — 15.57%** |
| |||||||||||||
Aligned Data Centers Issuer LLC, |
| |||||||||||||
Series 2021-1A, Class A2 |
| |||||||||||||
1.94% | 08/15/461 | $ | 150,000 | $ | 136,522 | |||||||||
Cedar Funding VIII CLO Ltd., |
| |||||||||||||
Series 2017-8A, Class BR |
| |||||||||||||
(Cayman Islands) |
| |||||||||||||
(CME Term SOFR 3-Month plus 1.91%) |
| |||||||||||||
7.23% | 10/17/341,2,3 | 50,000 | 49,879 | |||||||||||
CIFC Funding Ltd., |
| |||||||||||||
Series 2018-1A, Class B |
| |||||||||||||
(Cayman Islands) |
| |||||||||||||
(CME Term SOFR 3-Month plus 1.66%) |
| |||||||||||||
6.96% | 04/18/311,2,3 | 50,000 | 49,972 | |||||||||||
CIFC Funding Ltd., |
| |||||||||||||
Series 2022-1A, Class A |
| |||||||||||||
(Cayman Islands) |
| |||||||||||||
(CME Term SOFR 3-Month plus 1.32%) |
| |||||||||||||
6.64% | 04/17/351,2,3 | 50,000 | 50,024 | |||||||||||
GoodLeap Sustainable Home Solutions Trust, |
| |||||||||||||
Series 2022-1GS, Class A |
| |||||||||||||
2.70% | 01/20/491 | 75,904 | 62,985 | |||||||||||
GoodLeap Sustainable Home Solutions Trust, |
| |||||||||||||
Series 2023-1GS, Class A |
| |||||||||||||
5.52% | 02/22/551 | 90,023 | 87,249 | |||||||||||
GoodLeap Sustainable Home Solutions Trust, |
| |||||||||||||
Series 2023-2GS, Class A |
| |||||||||||||
5.70% | 05/20/551 | 47,511 | 47,084 | |||||||||||
Loanpal Solar Loan Ltd., |
| |||||||||||||
Series 2021-1GS, Class A |
| |||||||||||||
2.29% | 01/20/481 | 146,813 | 117,365 | |||||||||||
Madison Park Funding XVII Ltd., |
| |||||||||||||
Series 2015-17A, Class AR2 |
| |||||||||||||
(Cayman Islands) |
| |||||||||||||
(CME Term SOFR 3-Month plus 1.26%) |
| |||||||||||||
6.58% | 07/21/301,2,3 | 51,578 | 51,623 | |||||||||||
Madison Park Funding XXV Ltd., |
| |||||||||||||
Series 2017-25A, Class A1R |
| |||||||||||||
(Cayman Islands) |
| |||||||||||||
(CME Term SOFR 3-Month plus 1.23%) |
| |||||||||||||
6.56% | 04/25/291,2,3 | 50,534 | 50,557 | |||||||||||
Madison Park Funding XXVII Ltd., |
| |||||||||||||
Series 2018-27A, Class A2 |
| |||||||||||||
(Cayman Islands) |
| |||||||||||||
(CME Term SOFR 3-Month plus 1.61%) |
| |||||||||||||
6.93% | 04/20/301,2,3 | 50,000 | 49,895 | |||||||||||
Magnetite Xxix Ltd., |
| |||||||||||||
Series 2021-29A, Class A |
| |||||||||||||
(Cayman Islands) |
| |||||||||||||
(CME Term SOFR 3-Month plus 1.25%) |
| |||||||||||||
6.57% | 01/15/341,2,3 | 50,000 | 50,027 | |||||||||||
OCP CLO Ltd., |
| |||||||||||||
Series 2017-13A, Class A2R |
| |||||||||||||
(Cayman Islands) |
| |||||||||||||
(CME Term SOFR 3-Month plus 1.81%) |
| |||||||||||||
7.13% | 07/15/301,2,3 | 50,000 | 50,025 | |||||||||||
| Issues | Maturity Date | Principal Amount | Value | |||||||||
ASSET-BACKED SECURITIES (continued) |
| |||||||||||
OSD CLO Ltd., |
| |||||||||||
Series 2021-23A, Class A |
| |||||||||||
(Cayman Islands) |
| |||||||||||
(CME Term SOFR 3-Month plus 1.13%) |
| |||||||||||
6.45% | 04/17/311,2,3 | $ | 41,007 | $ | 41,009 | |||||||
SLM Student Loan Trust, |
| |||||||||||
Series 2012-2, Class A |
| |||||||||||
(SOFR30A plus 0.81%) |
| |||||||||||
6.13% | 01/25/292 | 34,220 | 33,387 | |||||||||
Sofi Professional Loan Program Trust, |
| |||||||||||
Series 2021-B, Class AFX |
| |||||||||||
1.14% | 02/15/471 | 37,259 | 31,721 | |||||||||
Sunnova Helios VII Issuer LLC, |
| |||||||||||
Series 2021-C, Class A |
| |||||||||||
2.03% | 10/20/481 | 169,696 | 148,677 | |||||||||
Symphony CLO XIX Ltd., |
| |||||||||||
Series 2018-19A, Class B |
| |||||||||||
(Cayman Islands) |
| |||||||||||
(CME Term SOFR 3-Month plus 1.61%) |
| |||||||||||
6.93% | 04/16/311,2,3 | 50,000 | 49,957 | |||||||||
Voya CLO Ltd., |
| |||||||||||
Series 2014-4A, Class A2RA |
| |||||||||||
(Cayman Islands) |
| |||||||||||
(CME Term SOFR 3-Month plus 1.86%) |
| |||||||||||
7.18% | 07/14/311,2,3 | 50,000 | 50,026 | |||||||||
|
|
| ||||||||||
Total Asset-Backed Securities |
| |||||||||||
(Cost $1,251,788) |
| 1,207,984 | ||||||||||
|
|
| ||||||||||
MORTGAGE-BACKED — 73.65%** |
| |||||||||||
Non-Agency Commercial Mortgage-Backed — 13.28% |
| |||||||||||
BXHPP Trust, |
| |||||||||||
Series 2021-FILM, Class C |
| |||||||||||
(CME Term SOFR 1-Month plus 1.21%) |
| |||||||||||
6.54% | 08/15/361,2 | 30,000 | 28,108 | |||||||||
Commercial Mortgage Trust, |
| |||||||||||
Series 2017-PANW, Class E |
| |||||||||||
3.81% | 10/10/291,4 | 130,000 | 113,535 | |||||||||
DBUBS Mortgage Trust, |
| |||||||||||
Series 2017-BRBK, Class F |
| |||||||||||
3.53% | 10/10/341,4 | 150,000 | 116,928 | |||||||||
Hudson Yards Mortgage Trust, |
| |||||||||||
Series 2019-55HY, Class F |
| |||||||||||
2.94% | 12/10/411,4 | 100,000 | 73,441 | |||||||||
JPMorgan Chase Commercial Mortgage Securities Trust, |
| |||||||||||
Series 2019-ICON, Class XB (IO) |
| |||||||||||
0.62% | 01/05/341,4 | 29,539,000 | 19,370 | |||||||||
KREST Commercial Mortgage Securities Trust, |
| |||||||||||
Series 2021-CHIP, Class C |
| |||||||||||
2.93% | 11/05/441,4 | 125,000 | 82,847 | |||||||||
Life Mortgage Trust, |
| |||||||||||
Series 2021-BMR, Class C |
| |||||||||||
(CME Term SOFR 1-Month plus 1.21%) |
| |||||||||||
6.54% | 03/15/381,2 | 98,297 | 96,878 | |||||||||
MFT Mortgage Trust, |
| |||||||||||
Series 2020-B6, Class B |
| |||||||||||
3.28% | 08/10/401,4 | 150,000 | 93,185 | |||||||||
See accompanying Notes to Financial Statements.
| Annual Report March 2024 / 158 |
Table of Contents
Sustainable Securitized Fund
Schedule of Portfolio Investments
March 31, 2024
| Issues | Maturity Date | Principal Amount | Value | |||||||||
MORTGAGE-BACKED (continued) |
| |||||||||||
Non-Agency Commercial Mortgage-Backed (continued) |
| |||||||||||
NYC Commercial Mortgage Trust, |
| |||||||||||
Series 2021-909, Class A |
| |||||||||||
2.94% | 04/10/431 | $ | 100,000 | $ | 76,377 | |||||||
One New York Plaza Trust, |
| |||||||||||
Series 2020-1NYP, Class AJ |
| |||||||||||
(CME Term SOFR 1-Month plus 1.36%) |
| |||||||||||
6.69% | 01/15/361,2 | 150,000 | 142,921 | |||||||||
VASA Trust, |
| |||||||||||
Series 2021-VASA, Class B |
| |||||||||||
(CME Term SOFR 1-Month plus 1.36%) |
| |||||||||||
6.69% | 07/15/391,2 | 145,000 | 121,844 | |||||||||
VASA Trust, |
| |||||||||||
Series 2021-VASA, Class D |
| |||||||||||
(CME Term SOFR 1-Month plus 2.21%) |
| |||||||||||
7.54% | 07/15/391,2 | 100,000 | 65,153 | |||||||||
|
|
| ||||||||||
| 1,030,587 | ||||||||||||
|
|
| ||||||||||
Non-Agency Mortgage-Backed — 6.63% |
| |||||||||||
BINOM Securitization Trust, |
| |||||||||||
Series 2022-RPL1, Class M1 |
| |||||||||||
3.00% | 02/25/611,4 | 50,000 | 39,332 | |||||||||
Cascade MH Asset Trust, |
| |||||||||||
Series 2021-MH1, Class A1 |
| |||||||||||
1.75% | 02/25/461 | 65,705 | 56,819 | |||||||||
Cascade MH Asset Trust, |
| |||||||||||
Series 2022-MH1, Class A (STEP-reset date 05/25/24) |
| |||||||||||
4.25% | 08/25/541 | 92,110 | 83,787 | |||||||||
Credit Suisse Mortgage Capital Trust, |
| |||||||||||
Series 2021-RPL3, Class M3 |
| |||||||||||
3.96% | 01/25/601,4 | 90,000 | 72,990 | |||||||||
Merrill Lynch First Franklin Mortgage Loan Trust, |
| |||||||||||
Series 2007-2, Class A2B |
| |||||||||||
(CME Term SOFR 1-Month plus 0.45%) |
| |||||||||||
5.78% | 05/25/372 | 22,144 | 15,554 | |||||||||
Merrill Lynch First Franklin Mortgage Loan Trust, |
| |||||||||||
Series 2007-3, Class A2D |
| |||||||||||
(CME Term SOFR 1-Month plus 0.61%) |
| |||||||||||
5.94% | 06/25/372 | 51,034 | 49,251 | |||||||||
Soundview Home Loan Trust, |
| |||||||||||
Series 2007-OPT2, Class 2A4 |
| |||||||||||
(CME Term SOFR 1-Month plus 0.36%) |
| |||||||||||
5.69% | 07/25/372 | 144,325 | 109,862 | |||||||||
Towd Point Mortgage Trust, |
| |||||||||||
Series 2019-2, Class M1 |
| |||||||||||
3.75% | 12/25/581,4 | 100,000 | 87,091 | |||||||||
|
|
| ||||||||||
| 514,686 | ||||||||||||
|
|
| ||||||||||
U.S. Agency Commercial Mortgage-Backed — 3.25% |
| |||||||||||
Freddie Mac Multifamily ML Certificates, |
| |||||||||||
Series 2021-ML12, Class XUS (IO) |
| |||||||||||
1.22% | 07/25/414 | 1,075,034 | 100,507 | |||||||||
Ginnie Mae, |
| |||||||||||
Series 2021-17, Class IO (IO) |
| |||||||||||
1.05% | 01/16/614 | 711,211 | 53,109 | |||||||||
| Issues | Maturity Date | Principal Amount | Value | |||||||||
MORTGAGE-BACKED (continued) |
| |||||||||||
U.S. Agency Commercial Mortgage-Backed (continued) |
| |||||||||||
Ginnie Mae, |
| |||||||||||
Series 2021-36, Class IO (IO) |
| |||||||||||
1.29% | 03/16/634 | $ | 615,518 | $ | 50,217 | |||||||
Ginnie Mae, |
| |||||||||||
Series 2023-127, Class IO (IO) |
| |||||||||||
0.42% | 07/16/574 | 2,847,771 | 48,186 | |||||||||
|
|
| ||||||||||
| 252,019 | ||||||||||||
|
|
| ||||||||||
U.S. Agency Mortgage-Backed — 50.49% |
| |||||||||||
Fannie Mae Pool AL9266 |
| |||||||||||
3.00% | 10/01/46 | 116,763 | 103,127 | |||||||||
Fannie Mae Pool BQ1226 |
| |||||||||||
2.00% | 09/01/50 | 124,902 | 99,722 | |||||||||
Fannie Mae Pool BV9977 |
| |||||||||||
3.50% | 06/01/52 | 91,738 | 82,178 | |||||||||
Fannie Mae Pool BW0000 |
| |||||||||||
4.00% | 07/01/52 | 90,753 | 84,188 | |||||||||
Fannie Mae Pool CB2074 |
| |||||||||||
2.50% | 11/01/51 | 150,585 | 125,555 | |||||||||
Fannie Mae Pool CB4211 |
| |||||||||||
4.50% | 07/01/52 | 117,293 | 111,901 | |||||||||
Fannie Mae Pool FM5254 |
| |||||||||||
2.00% | 12/01/50 | 149,244 | 118,728 | |||||||||
Fannie Mae Pool FM6400 |
| |||||||||||
2.00% | 03/01/51 | 97,693 | 78,404 | |||||||||
Fannie Mae Pool FS1334 |
| |||||||||||
2.00% | 11/01/51 | 153,087 | 121,737 | |||||||||
Fannie Mae Pool FS1598 |
| |||||||||||
2.00% | 04/01/52 | 113,806 | 90,126 | |||||||||
Fannie Mae Pool MA4398 |
| |||||||||||
2.00% | 08/01/51 | 159,426 | 126,691 | |||||||||
Fannie Mae REMICS, |
| |||||||||||
Series 2019-25, Class PA |
| |||||||||||
3.00% | 05/25/48 | 188,612 | 170,492 | |||||||||
Freddie Mac Gold Pool G67708 |
| |||||||||||
3.50% | 03/01/48 | 36,377 | 33,291 | |||||||||
Freddie Mac Pool QA7550 |
| |||||||||||
3.00% | 03/01/50 | 62,743 | 54,879 | |||||||||
Freddie Mac Pool QA8518 |
| |||||||||||
3.00% | 04/01/50 | 75,423 | 65,969 | |||||||||
Freddie Mac Pool QC8921 |
| |||||||||||
2.50% | 10/01/51 | 135,576 | 113,211 | |||||||||
Freddie Mac Pool QD1841 |
| |||||||||||
2.00% | 11/01/51 | 130,474 | 103,494 | |||||||||
Freddie Mac Pool RA4201 |
| |||||||||||
2.00% | 12/01/50 | 90,824 | 72,253 | |||||||||
Freddie Mac Pool RA5552 |
| |||||||||||
3.00% | 07/01/51 | 217,376 | 188,499 | |||||||||
Freddie Mac Pool RA5855 |
| |||||||||||
2.50% | 09/01/51 | 188,157 | 156,286 | |||||||||
Freddie Mac Pool RA6071 |
| |||||||||||
2.00% | 10/01/51 | 135,593 | 108,038 | |||||||||
Freddie Mac Pool RA6528 |
| |||||||||||
2.50% | 02/01/52 | 22,029 | 18,254 | |||||||||
Freddie Mac Pool RA7091 |
| |||||||||||
2.50% | 03/01/52 | 134,995 | 111,720 | |||||||||
See accompanying Notes to Financial Statements.
| 159 / Annual Report March 2024 |
Table of Contents
Sustainable Securitized Fund
Schedule of Portfolio Investments
March 31, 2024
| Issues | Maturity Date | Principal Amount | Value | |||||||||
MORTGAGE-BACKED (continued) |
| |||||||||||
U.S. Agency Mortgage-Backed (continued) |
| |||||||||||
Freddie Mac Pool RA7543 |
| |||||||||||
4.00% | 06/01/52 | $ | 112,524 | $ | 104,294 | |||||||
Freddie Mac Pool SD7511 |
| |||||||||||
3.50% | 01/01/50 | 32,708 | 29,793 | |||||||||
Freddie Mac Pool SD7549 |
| |||||||||||
2.00% | 01/01/52 | 134,895 | 108,619 | |||||||||
Freddie Mac Pool SD8222 |
| |||||||||||
4.00% | 06/01/52 | 89,925 | 83,288 | |||||||||
Freddie Mac REMICS, |
| |||||||||||
Series 3067, Class FA |
| |||||||||||
(SOFR30A plus 0.46%) |
| |||||||||||
5.78% | 11/15/352 | 52,045 | 51,435 | |||||||||
Freddie Mac REMICS, |
| |||||||||||
Series 3071, Class TF |
| |||||||||||
(SOFR30A plus 0.41%) |
| |||||||||||
5.73% | 04/15/352 | 6,224 | 6,217 | |||||||||
Freddie Mac REMICS, |
| |||||||||||
Series 4139, Class DA |
| |||||||||||
1.25% | 12/15/27 | 16,157 | 15,205 | |||||||||
Ginnie Mae (TBA) |
| |||||||||||
2.50% | 04/20/54 | 150,000 | 127,852 | |||||||||
4.50% | 04/20/54 | 200,000 | 192,224 | |||||||||
5.00% | 04/20/54 | 100,000 | 98,298 | |||||||||
5.50% | 04/20/54 | 25,000 | 24,982 | |||||||||
Ginnie Mae, |
| |||||||||||
Series 2023-113, Class FD |
| |||||||||||
(SOFR30A plus 1.35%) |
| |||||||||||
6.50% | 08/20/532 | 71,915 | 72,066 | |||||||||
Ginnie Mae, |
| |||||||||||
Series 2023-116, Class FL |
| |||||||||||
(SOFR30A plus 1.15%) |
| |||||||||||
6.47% | 08/20/532 | 24,308 | 24,425 | |||||||||
UMBS (TBA) |
| |||||||||||
3.00% | 04/01/54 | 75,000 | 64,577 | |||||||||
4.00% | 04/01/54 | 175,000 | 162,108 | |||||||||
4.50% | 04/01/54 | 175,000 | 166,694 | |||||||||
5.00% | 04/01/54 | 125,000 | 121,978 | |||||||||
5.50% | 04/01/54 | 125,000 | 124,392 | |||||||||
|
|
| ||||||||||
| 3,917,190 | ||||||||||||
|
|
| ||||||||||
Total Mortgage-Backed |
| |||||||||||
(Cost $6,066,613) |
| 5,714,482 | ||||||||||
|
|
| ||||||||||
U.S. TREASURY SECURITIES — 21.95% |
| |||||||||||
U.S. Treasury Bonds — 2.00% |
| |||||||||||
U.S. Treasury Bonds (WI) |
| |||||||||||
4.25% | 02/15/54 | 158,000 | 155,457 | |||||||||
|
|
| ||||||||||
U.S. Treasury Notes — 19.95% |
| |||||||||||
U.S. Treasury Notes |
| |||||||||||
4.25% | 03/15/27 | 94,000 | 93,585 | |||||||||
4.50% | 03/31/26 | 256,000 | 255,420 | |||||||||
| Issues | Maturity Date | Principal Amount | Value | |||||||||||
U.S. TREASURY SECURITIES (continued) |
| |||||||||||||
U.S. Treasury Notes (continued) |
| |||||||||||||
U.S. Treasury Notes (WI) |
| |||||||||||||
4.00% | 02/15/34 | $ | 387,000 | $ | 380,741 | |||||||||
4.25% | 02/28/29 | 349,000 | 349,600 | |||||||||||
4.25% | 03/31/29 | 470,000 | 468,132 | |||||||||||
|
|
| ||||||||||||
| 1,547,478 | ||||||||||||||
|
|
| ||||||||||||
Total U.S. Treasury Securities |
| |||||||||||||
(Cost $1,701,110) |
| 1,702,935 | ||||||||||||
|
|
| ||||||||||||
Total Bonds — 111.17% |
| |||||||||||||
(Cost $9,019,511) |
| 8,625,401 | ||||||||||||
|
|
| ||||||||||||
| Issues | Maturity Date | Principal Amount/Shares | Value | |||||||||||
| SHORT-TERM INVESTMENTS — 12.28% |
| |||||||||||||
| Money Market Funds — 12.28% |
| |||||||||||||
Dreyfus Government Cash Management Fund |
| |||||||||||||
5.20%5 | 241,000 | 241,000 | ||||||||||||
Fidelity Investments Money Market Funds - Government Portfolio |
| |||||||||||||
5.21%5 | 507,061 | 507,061 | ||||||||||||
Morgan Stanley Institutional Liquidity Funds - Government Portfolio |
| |||||||||||||
5.22%5 | 205,000 | 205,000 | ||||||||||||
|
|
| ||||||||||||
Total Short-Term Investments |
| |||||||||||||
(Cost $953,061) |
| 953,061 | ||||||||||||
|
|
| ||||||||||||
Total Investments - 123.45% |
| |||||||||||||
(Cost $9,972,572) |
| 9,578,462 | ||||||||||||
|
|
| ||||||||||||
| Liabilities in Excess of Other Assets - (23.45)% |
| (1,819,258 | ) | |||||||||||
|
|
| ||||||||||||
| Net Assets - 100.00% |
| $ | 7,759,204 | |||||||||||
|
|
| ||||||||||||
| 1 | Securities exempt from registration under Rule 144A of the Securities Act of 1933, as amended. The securities may be resold in transactions exempt from registration, normally to qualified institutional buyers. |
| 2 | Floating rate security. The rate disclosed was in effect at March 31, 2024. |
| 3 | Foreign denominated security issued by foreign domiciled entity. |
| 4 | Variable rate security. Interest rate disclosed is as of the most recent information available. Certain variable rate securities are not based on a published reference rate and spread but are determined by the issuer or agent and are based on current market conditions. |
| 5 | Represents the current yield as of March 31, 2024. |
| ** | Securities backed by mortgage or consumer loans where payment is periodically made will have an effective maturity date sooner than the stated maturity date. |
See accompanying Notes to Financial Statements.
| Annual Report March 2024 / 160 |
Table of Contents
Sustainable Securitized Fund
Schedule of Portfolio Investments
March 31, 2024
Note: For Fund compliance purposes, the Fund’s industry classifications refer to any one or more of the industry sub-classifications used by one or more widely recognized market indexes or ratings group indexes, and/or as defined by Fund management. This definition may not apply for purposes of this report, which may combine industry sub-classifications for more meaningful presentation for investors.
(CLO): Collateralized Loan Obligation
(IO): Interest Only
(SOFR): Secured Overnight Financing Rate
(STEP): Step Coupon Bond
(TBA): To-Be-Announced
(WI): When Issued
| Description | Number of Contracts | Expiration Date | Notional Amount | Value | Unrealized Appreciation (Depreciation) | |||||||||||||||
FUTURES CONTRACTS: LONG POSITIONS |
| |||||||||||||||||||
U.S. Treasury Two-Year Note | 9 | 06/28/24 | $ | 1,840,359 | $ | (1,361) | $ | (1,361) | ||||||||||||
U.S. Treasury Ten-Year Ultra Bond | 6 | 06/18/24 | 687,656 | 3,974 | 3,974 | |||||||||||||||
U.S. Treasury Ultra Bond | 1 | 06/18/24 | 129,000 | 2,482 | 2,482 | |||||||||||||||
|
|
|
|
|
| |||||||||||||||
| 2,657,015 | 5,095 | 5,095 | ||||||||||||||||||
|
|
|
|
|
| |||||||||||||||
FUTURES CONTRACTS: SHORT POSITIONS |
| |||||||||||||||||||
U.S. Treasury Five-Year Note | 1 | 06/28/24 | (107,015) | (287) | (287) | |||||||||||||||
|
|
|
|
|
| |||||||||||||||
TOTAL FUTURES CONTRACTS | $ | 2,550,000 | $ | 4,808 | $ | 4,808 | ||||||||||||||
|
|
|
|
|
| |||||||||||||||
See accompanying Notes to Financial Statements.
| 161 / Annual Report March 2024 |
Table of Contents
Schedule of Portfolio Investments
March 31, 2024
| Issues | Maturity Date | Principal Amount | Value | |||||||||
| BONDS – 112.48% |
| |||||||||||
| ASSET-BACKED SECURITIES — 5.07%** |
| |||||||||||
Academic Loan Funding Trust, |
| |||||||||||
Series 2012-1A, Class A2 |
| |||||||||||
(SOFR30A plus 1.21%) |
| |||||||||||
6.53% | 12/27/441,2 | $ | 11,675,943 | $ | 11,536,655 | |||||||
AGL CLO 1 Ltd., |
| |||||||||||
Series 2019-1A, Class BR |
| |||||||||||
(Cayman Islands) |
| |||||||||||
(CME Term SOFR 3-Month plus 1.91%) |
| |||||||||||
7.23% | 10/20/341,2,3 | 24,800,000 | 24,812,698 | |||||||||
AGL CLO 17 Ltd., |
| |||||||||||
Series 2022-17A, Class A |
| |||||||||||
(Cayman Islands) |
| |||||||||||
(CME Term SOFR 3-Month plus 1.33%) |
| |||||||||||
6.65% | 01/21/351,2,3 | 30,520,000 | 30,533,734 | |||||||||
Aimco CLO 11 Ltd., |
| |||||||||||
Series 2020-11A, Class AR |
| |||||||||||
(Cayman Islands) |
| |||||||||||
(CME Term SOFR 3-Month plus 1.39%) |
| |||||||||||
6.71% | 10/17/341,2,3 | 6,805,000 | 6,803,734 | |||||||||
Allegro CLO XIII Ltd., |
| |||||||||||
Series 2021-1A, Class B |
| |||||||||||
(Cayman Islands) |
| |||||||||||
(CME Term SOFR 3-Month plus 1.96%) |
| |||||||||||
7.28% | 07/20/341,2,3 | 15,610,000 | 15,625,126 | |||||||||
AMMC CLO 15 Ltd., |
| |||||||||||
Series 2014-15A, Class AR3 |
| |||||||||||
(Cayman Islands) |
| |||||||||||
(CME Term SOFR 3-Month plus 1.38%) |
| |||||||||||
6.70% | 01/15/321,2,3 | 27,712,848 | 27,761,346 | |||||||||
AMMC CLO 22 Ltd., |
| |||||||||||
Series 2018-22A, Class B |
| |||||||||||
(Cayman Islands) |
| |||||||||||
(CME Term SOFR 3-Month plus 1.71%) |
| |||||||||||
7.04% | 04/25/311,2,3 | 19,750,000 | 19,748,815 | |||||||||
AMMC CLO 26 Ltd., |
| |||||||||||
Series 2023-26A, Class A1 |
| |||||||||||
(Cayman Islands) |
| |||||||||||
(CME Term SOFR 3-Month plus 1.95%) |
| |||||||||||
7.26% | 04/15/361,2,3 | 8,250,000 | 8,295,457 | |||||||||
AMMC CLO 30 Ltd., |
| |||||||||||
Series 2024-30A, Class A1 |
| |||||||||||
(Cayman Islands) |
| |||||||||||
(CME Term SOFR 3-Month plus 1.68%) |
| |||||||||||
6.97% | 01/15/371,2,3 | 24,070,000 | 24,177,111 | |||||||||
AMSR Trust, |
| |||||||||||
Series 2021-SFR1, Class G |
| |||||||||||
4.61% | 06/17/382 | 15,250,000 | 13,138,137 | |||||||||
Apidos CLO XV, |
| |||||||||||
Series 2013-15A, Class BRR |
| |||||||||||
(Cayman Islands) |
| |||||||||||
(CME Term SOFR 3-Month plus 1.81%) |
| |||||||||||
7.13% | 04/20/311,2,3 | 10,000,000 | 10,009,650 | |||||||||
| Issues | Maturity Date | Principal Amount | Value | |||||||||
| ASSET-BACKED SECURITIES (continued) |
| |||||||||||
Apidos CLO XVIII, |
| |||||||||||
Series 2018-18A, Class B |
| |||||||||||
(Cayman Islands) |
| |||||||||||
(CME Term SOFR 3-Month plus 1.91%) |
| |||||||||||
7.23% | 10/22/301,2,3 | $ | 11,200,000 | $ | 11,216,352 | |||||||
Apidos CLO Xxv, |
| |||||||||||
Series 2016-25A, Class A1R2 |
| |||||||||||
(Cayman Islands) |
| |||||||||||
(CME Term SOFR 3-Month plus 1.15%) |
| |||||||||||
6.46% | 10/20/311,2,3 | 50,000,000 | 50,046,300 | |||||||||
Barings CLO Ltd., |
| |||||||||||
Series 2018-3A, Class A1 |
| |||||||||||
(Cayman Islands) |
| |||||||||||
(CME Term SOFR 3-Month plus 1.21%) |
| |||||||||||
6.53% | 07/20/291,2,3 | 7,847,913 | 7,853,956 | |||||||||
Barings CLO Ltd., |
| |||||||||||
Series 2020-4A, Class A |
| |||||||||||
(Cayman Islands) |
| |||||||||||
(CME Term SOFR 3-Month plus 1.48%) |
| |||||||||||
6.80% | 01/20/321,2,3 | 19,110,000 | 19,124,390 | |||||||||
Bayview Commercial Asset Trust, |
| |||||||||||
Series 2005-1A, Class A1 |
| |||||||||||
(CME Term SOFR 1-Month plus 0.56%) |
| |||||||||||
5.89% | 04/25/351,2 | 1,173,977 | 1,121,577 | |||||||||
BCRED MML CLO, LLC, |
| |||||||||||
Series 2022-1A, Class A1 |
| |||||||||||
(CME Term SOFR 3-Month plus 1.65%) |
| |||||||||||
6.97% | 04/20/351,2 | 48,400,000 | 48,199,237 | |||||||||
BlueMountain CLO XXXII Ltd., |
| |||||||||||
Series 2021-32A, Class B |
| |||||||||||
(Cayman Islands) |
| |||||||||||
(CME Term SOFR 3-Month plus 1.96%) |
| |||||||||||
7.28% | 10/15/341,2,3 | 15,000,000 | 15,009,000 | |||||||||
BlueMountain Fuji U.S. CLO I Ltd., |
| |||||||||||
Series 2017-1A, Class A1R |
| |||||||||||
(Cayman Islands) |
| |||||||||||
(CME Term SOFR 3-Month plus 1.24%) |
| |||||||||||
6.56% | 07/20/291,2,3 | 10,548,530 | 10,554,817 | |||||||||
Brazos Education Loan Authority, Inc., |
| |||||||||||
Series 2012-1, Class A1 |
| |||||||||||
(SOFR30A plus 0.81%) |
| |||||||||||
6.13% | 12/26/351 | 9,267 | 9,234 | |||||||||
Carvana Auto Receivables Trust, |
| |||||||||||
Series 2021-N1, Class R |
| |||||||||||
0.00% | 01/10/282 | 53,821 | 4,866,606 | |||||||||
Carvana Auto Receivables Trust, |
| |||||||||||
Series 2021-P4, Class R |
| |||||||||||
0.00% | 09/11/282 | 43,250 | 10,643,501 | |||||||||
Carvana Auto Receivables Trust, |
| |||||||||||
Series 2023-N1, Class R |
| |||||||||||
0.00% | 04/10/302 | 30,000 | 11,924,246 | |||||||||
Carvana Auto Receivables Trust, |
| |||||||||||
Series 2023-N1, Class XS |
| |||||||||||
0.00% | 04/10/302,4,5 | 378,802,018 | 6,040,756 | |||||||||
Carvana Auto Receivables Trust, |
| |||||||||||
Series 2023-N3, Class R |
| |||||||||||
0.00% | 09/10/302 | 30,900 | 7,902,298 | |||||||||
See accompanying Notes to Financial Statements.
| Annual Report March 2024 / 162 |
Table of Contents
Total Return Bond Fund
Schedule of Portfolio Investments
March 31, 2024
| Issues | Maturity Date | Principal Amount | Value | |||||||||
| ASSET-BACKED SECURITIES (continued) |
| |||||||||||
Catskill Park CLO Ltd., |
| |||||||||||
Series 2017-1A, Class A2 |
| |||||||||||
(Cayman Islands) |
| |||||||||||
(CME Term SOFR 3-Month plus 1.96%) |
| |||||||||||
7.28% | 04/20/291,2,3 | $ | 6,000,000 | $ | 6,003,150 | |||||||
Cedar Funding II CLO Ltd., |
| |||||||||||
Series 2013-1A, Class BRR |
| |||||||||||
(Cayman Islands) |
| |||||||||||
(CME Term SOFR 3-Month plus 1.61%) |
| |||||||||||
6.93% | 04/20/341,2,3 | 4,800,000 | 4,737,643 | |||||||||
Cedar Funding V CLO Ltd., |
| |||||||||||
Series 2016-5A, Class BR |
| |||||||||||
(Cayman Islands) |
| |||||||||||
(CME Term SOFR 3-Month plus 2.01%) |
| |||||||||||
7.33% | 07/17/311,2,3 | 7,000,000 | 7,004,354 | |||||||||
Cedar Funding VIII CLO Ltd., |
| |||||||||||
Series 2017-8A, Class BR |
| |||||||||||
(Cayman Islands) |
| |||||||||||
(CME Term SOFR 3-Month plus 1.91%) |
| |||||||||||
7.23% | 10/17/341,2,3 | 9,550,000 | 9,526,822 | |||||||||
CIFC Funding 2014 Ltd., |
| |||||||||||
Series 2014-1A, Class BR2 |
| |||||||||||
(Cayman Islands) |
| |||||||||||
(CME Term SOFR 3-Month plus 1.66%) |
| |||||||||||
6.96% | 01/18/311,2,3 | 8,000,000 | 7,991,936 | |||||||||
CIFC Funding Ltd., |
| |||||||||||
Series 2013-2A, Class A2L2 |
| |||||||||||
(Cayman Islands) |
| |||||||||||
(CME Term SOFR 3-Month plus 1.76%) |
| |||||||||||
7.06% | 10/18/301,2,3 | 10,500,000 | 10,514,385 | |||||||||
CIFC Funding Ltd., |
| |||||||||||
Series 2014-5A, Class BR2 |
| |||||||||||
(Cayman Islands) |
| |||||||||||
(CME Term SOFR 3-Month plus 2.06%) |
| |||||||||||
7.38% | 10/17/311,2,3 | 3,990,000 | 3,994,317 | |||||||||
CIFC Funding Ltd., |
| |||||||||||
Series 2017-4A, Class A2R |
| |||||||||||
(Cayman Islands) |
| |||||||||||
(CME Term SOFR 3-Month plus 1.81%) |
| |||||||||||
7.13% | 10/24/301,2,3 | 3,475,000 | 3,475,035 | |||||||||
CIFC Funding Ltd., |
| |||||||||||
Series 2018-1A, Class B |
| |||||||||||
(Cayman Islands) |
| |||||||||||
(CME Term SOFR 3-Month plus 1.66%) |
| |||||||||||
6.96% | 04/18/311,2,3 | 9,950,000 | 9,944,428 | |||||||||
CIFC Funding Ltd., |
| |||||||||||
Series 2020-2A, Class BR |
| |||||||||||
(Cayman Islands) |
| |||||||||||
(CME Term SOFR 3-Month plus 1.86%) |
| |||||||||||
7.18% | 10/20/341,2,3 | 9,000,000 | 8,998,110 | |||||||||
CIFC Funding Ltd., |
| |||||||||||
Series 2021-6A, Class B |
| |||||||||||
(Cayman Islands) |
| |||||||||||
(CME Term SOFR 3-Month plus 1.91%) |
| |||||||||||
7.23% | 10/15/341,2,3 | 20,000,000 | 20,046,200 | |||||||||
| Issues | Maturity Date | Principal Amount | Value | |||||||||
| ASSET-BACKED SECURITIES (continued) |
| |||||||||||
CIFC Funding Ltd., |
| |||||||||||
Series 2022-1A, Class A |
| |||||||||||
(Cayman Islands) |
| |||||||||||
(CME Term SOFR 3-Month plus 1.32%) |
| |||||||||||
6.64% | 04/17/351,2,3 | $ | 25,000,000 | $ | 25,012,000 | |||||||
CIFC Funding Ltd., |
| |||||||||||
Series 2023-2A, Class A |
| |||||||||||
(Cayman Islands) |
| |||||||||||
(CME Term SOFR 3-Month plus 1.75%) |
| |||||||||||
7.08% | 01/21/371,2,3 | 14,000,000 | 14,077,700 | |||||||||
CIT Education Loan Trust, |
| |||||||||||
Series 2007-1, Class B |
| |||||||||||
(SOFR90A plus 0.56%) |
| |||||||||||
5.91% | 06/25/421,2 | 6,262,828 | 5,501,903 | |||||||||
Clear Creek CLO LTD. |
| |||||||||||
Series 2015-1A, Class AR |
| |||||||||||
(Cayman Islands) |
| |||||||||||
(CME Term SOFR 3-Month plus 1.46%) |
| |||||||||||
6.78% | 10/20/301,2,3 | 13,135,140 | 13,157,864 | |||||||||
Clover CLO LLC, |
| |||||||||||
Series 2020-1A, Class AR |
| |||||||||||
(Cayman Islands) |
| |||||||||||
(CME Term SOFR 3-Month plus 1.42%) |
| |||||||||||
6.74% | 04/15/341,2,3 | 38,800,000 | 38,835,618 | |||||||||
College Loan Corp. Trust, |
| |||||||||||
Series 2005-2, Class B |
| |||||||||||
(SOFR90A plus 0.75%) |
| |||||||||||
6.11% | 01/15/371 | 1,238,124 | 1,142,630 | |||||||||
CVC Cordatus Loan Fund VIII DAC, |
| |||||||||||
Series 8X, Class BRR |
| |||||||||||
(Ireland) |
| |||||||||||
(3-Month Euribor plus 1.40%) |
| |||||||||||
5.34% | 07/15/341,3 | 8,200,000 | 8,633,952 | |||||||||
CyrusOne Data Centers Issuer I LLC, |
| |||||||||||
Series 2023-2A, Class A2 |
| |||||||||||
5.56% | 11/20/482 | 22,650,000 | 22,217,630 | |||||||||
Dryden 30 Senior Loan Fund, |
| |||||||||||
Series 2013-30A, Class BR |
| |||||||||||
(Cayman Islands) |
| |||||||||||
(CME Term SOFR 3-Month plus 1.51%) |
| |||||||||||
6.82% | 11/15/281,2,3 | 1,500,000 | 1,496,978 | |||||||||
Dryden 61 CLO Ltd., |
| |||||||||||
Series 2018-61A, Class BR |
| |||||||||||
(Cayman Islands) |
| |||||||||||
(CME Term SOFR 3-Month plus 1.66%) |
| |||||||||||
6.98% | 01/17/321,2,3 | 3,000,000 | 2,992,095 | |||||||||
Dryden 65 CLO Ltd., |
| |||||||||||
Series 2018-65A, Class B |
| |||||||||||
(Cayman Islands) |
| |||||||||||
(CME Term SOFR 3-Month plus 1.86%) |
| |||||||||||
7.16% | 07/18/301,2,3 | 3,500,000 | 3,500,070 | |||||||||
Dryden 83 CLO Ltd., |
| |||||||||||
Series 2020-83A, Class A |
| |||||||||||
(Cayman Islands) |
| |||||||||||
(CME Term SOFR 3-Month plus 1.48%) |
| |||||||||||
6.78% | 01/18/321,2,3 | 29,220,000 | 29,239,051 | |||||||||
See accompanying Notes to Financial Statements.
| 163 / Annual Report March 2024 |
Table of Contents
Total Return Bond Fund
Schedule of Portfolio Investments
March 31, 2024
| Issues | Maturity Date | Principal Amount | Value | |||||||||
| ASSET-BACKED SECURITIES (continued) |
| |||||||||||
Dryden 92 CLO Ltd., |
| |||||||||||
Series 2021-92A, Class B |
| |||||||||||
(Cayman Islands) |
| |||||||||||
(CME Term SOFR 3-Month plus 1.91%) |
| |||||||||||
7.23% | 11/20/341,2,3 | $ | 22,500,000 | $ | 22,512,510 | |||||||
Dryden XXVI Senior Loan Fund, |
| |||||||||||
Series 2013-26A, Class AR |
| |||||||||||
(Cayman Islands) |
| |||||||||||
(CME Term SOFR 3-Month plus 1.16%) |
| |||||||||||
6.48% | 04/15/291,2,3 | 15,567,516 | 15,557,397 | |||||||||
Eaton Vance CLO Ltd., |
| |||||||||||
Series 2013-1A, Class A13R |
| |||||||||||
(Cayman Islands) |
| |||||||||||
(CME Term SOFR 3-Month plus 1.51%) |
| |||||||||||
6.83% | 01/15/341,2,3 | 23,850,000 | 23,862,641 | |||||||||
Eaton Vance CLO Ltd., |
| |||||||||||
Series 2018-1A, Class B |
| |||||||||||
(Cayman Islands) |
| |||||||||||
(CME Term SOFR 3-Month plus 2.01%) |
| |||||||||||
7.33% | 10/15/301,2,3 | 5,000,000 | 5,003,045 | |||||||||
Eaton Vance CLO Ltd., |
| |||||||||||
Series 2020-1A, Class BR |
| |||||||||||
(Cayman Islands) |
| |||||||||||
(CME Term SOFR 3-Month plus 1.91%) |
| |||||||||||
7.23% | 10/15/341,2,3 | 25,000,000 | 25,000,500 | |||||||||
ECMC Group Student Loan Trust, |
| |||||||||||
Series 2016-1A, Class A |
| |||||||||||
(SOFR30A plus 1.46%) |
| |||||||||||
6.78% | 07/26/661,2 | 26,795,996 | 26,929,843 | |||||||||
Elmwood CLO XI Ltd., |
| |||||||||||
Series 2021-4A, Class B |
| |||||||||||
(Cayman Islands) |
| |||||||||||
(CME Term SOFR 3-Month plus 1.86%) |
| |||||||||||
7.18% | 10/20/341,2,3 | 16,000,000 | 16,023,568 | |||||||||
Fillmore Park CLO Ltd., |
| |||||||||||
Series 2018-1A, Class B1B2 |
| |||||||||||
(Cayman Islands) |
| |||||||||||
(CME Term SOFR 3-Month plus 1.81%) |
| |||||||||||
7.13% | 07/15/301,2,3 | 8,000,000 | 8,000,160 | |||||||||
FirstKey Homes Trust, |
| |||||||||||
Series 2021-SFR1, Class F1 |
| |||||||||||
3.24% | 08/17/382 | 12,416,000 | 11,268,012 | |||||||||
FirstKey Homes Trust, |
| |||||||||||
Series 2021-SFR2, Class F1 |
| |||||||||||
2.91% | 09/17/382 | 12,677,000 | 11,342,867 | |||||||||
Flatiron CLO 21 Ltd., |
| |||||||||||
Series 2021-1A, Class A1 |
| |||||||||||
(Cayman Islands) |
| |||||||||||
(CME Term SOFR 3-Month plus 1.37%) |
| |||||||||||
6.68% | 07/19/341,2,3 | 52,500,000 | 52,528,875 | |||||||||
Global SC Finance II SRL, |
| |||||||||||
Series 2014-1A, Class A2 |
| |||||||||||
(Barbados) |
| |||||||||||
3.09% | 07/17/292,3 | 2,956,294 | 2,925,078 | |||||||||
| Issues | Maturity Date | Principal Amount | Value | |||||||||
| ASSET-BACKED SECURITIES (continued) |
| |||||||||||
Goal Capital Funding Trust, |
| |||||||||||
Series 2006-1, Class B |
| |||||||||||
(LIBOR USD 3-Month plus 0.45%) |
| |||||||||||
6.04% | 08/25/421 | $ | 1,144,568 | $ | 1,078,069 | |||||||
GoldenTree Loan Management U.S. CLO 8 Ltd., |
| |||||||||||
Series 2020-8A, Class AR |
| |||||||||||
(Cayman Islands) |
| |||||||||||
(CME Term SOFR 3-Month plus 1.41%) |
| |||||||||||
6.73% | 10/20/341,2,3 | 36,180,000 | 36,227,287 | |||||||||
Golub Capital Partners CLO 64B Ltd., |
| |||||||||||
Series 2022-64A, Class B |
| |||||||||||
(United Kingdom) |
| |||||||||||
(CME Term SOFR 3-Month plus 3.30%) |
| |||||||||||
8.62% | 10/25/351,2,3 | 8,800,000 | 8,875,328 | |||||||||
Golub Capital Partners CLO 66B Ltd., |
| |||||||||||
Series 2023-66A, Class A |
| |||||||||||
(United Kingdom) |
| |||||||||||
(CME Term SOFR 3-Month plus 1.95%) |
| |||||||||||
7.27% | 04/25/361,2,3 | 20,000,000 | 20,121,000 | |||||||||
Greenwood Park CLO Ltd., |
| |||||||||||
Series 2018-1A, Class B |
| |||||||||||
(Cayman Islands) |
| |||||||||||
(CME Term SOFR 3-Month plus 1.66%) |
| |||||||||||
6.98% | 04/15/311,2,3 | 10,000,000 | 10,001,030 | |||||||||
Highbridge Loan Management Ltd., |
| |||||||||||
Series 12A-18, Class A2 |
| |||||||||||
(Cayman Islands) |
| |||||||||||
(CME Term SOFR 3-Month plus 1.76%) |
| |||||||||||
7.06% | 07/18/311,2,3 | 7,000,000 | 6,997,900 | |||||||||
HPS Loan Management Ltd. |
| |||||||||||
Series 15A-19, Class A1R |
| |||||||||||
(United Kingdom) |
| |||||||||||
(CME Term SOFR 3-Month plus 1.32%) |
| |||||||||||
6.64% | 01/22/351,2,3 | 35,720,000 | 35,722,536 | |||||||||
HPS Loan Management Ltd., |
| |||||||||||
Series 2021-16A, Class B |
| |||||||||||
(Cayman Islands) |
| |||||||||||
(CME Term SOFR 3-Month plus 1.96%) |
| |||||||||||
7.28% | 01/23/351,2,3 | 19,250,000 | 19,249,365 | |||||||||
HPS Loan Management Ltd., |
| |||||||||||
Series 2023-17A, Class A |
| |||||||||||
(United Kingdom) |
| |||||||||||
(CME Term SOFR 3-Month plus 1.90%) |
| |||||||||||
7.22% | 04/23/361,2,3 | 17,400,000 | 17,488,392 | |||||||||
HPS Loan Management Ltd., |
| |||||||||||
Series 2023-18A, Class B |
| |||||||||||
(Cayman Islands) |
| |||||||||||
(CME Term SOFR 3-Month plus 2.95%) |
| |||||||||||
8.27% | 07/20/361,2,3 | 10,000,000 | 10,124,250 | |||||||||
Invesco U.S. CLO Ltd., |
| |||||||||||
Series 2023-2A, Class A |
| |||||||||||
(United Kingdom) |
| |||||||||||
(CME Term SOFR 3-Month plus 1.80%) |
| |||||||||||
7.12% | 04/21/361,2,3 | 12,600,000 | 12,669,035 | |||||||||
J.G. Wentworth XXX LLC, |
| |||||||||||
Series 2013-3A, Class A |
| |||||||||||
4.08% | 01/17/732 | 476,277 | 446,486 | |||||||||
See accompanying Notes to Financial Statements.
| Annual Report March 2024 / 164 |
Table of Contents
Total Return Bond Fund
Schedule of Portfolio Investments
March 31, 2024
| Issues | Maturity Date | Principal Amount | Value | |||||||||
| ASSET-BACKED SECURITIES (continued) |
| |||||||||||
J.G. Wentworth XXXII LLC, |
| |||||||||||
Series 2014-2A, Class A |
| |||||||||||
3.61% | 01/17/732 | $ | 30,042,151 | $ | 26,954,834 | |||||||
LCM Loan Income Fund I Ltd., |
| |||||||||||
Series 1A, Class B |
| |||||||||||
(Cayman Islands) |
| |||||||||||
(CME Term SOFR 3-Month plus 1.71%) |
| |||||||||||
7.03% | 04/20/311,2,3 | 7,710,000 | 7,692,205 | |||||||||
LCM XIV LP, |
| |||||||||||
Series 14A, Class AR |
| |||||||||||
(Cayman Islands) |
| |||||||||||
(CME Term SOFR 3-Month plus 1.30%) |
| |||||||||||
6.62% | 07/20/311,2,3 | 9,642,504 | 9,649,254 | |||||||||
LCM XIV LP, |
| |||||||||||
Series 14A, Class BR |
| |||||||||||
(Cayman Islands) |
| |||||||||||
(CME Term SOFR 3-Month plus 1.84%) |
| |||||||||||
7.16% | 07/20/311,2,3 | 3,385,000 | 3,379,821 | |||||||||
Madison Park Funding XLVIII Ltd., |
| |||||||||||
Series 2021-48A, Class A |
| |||||||||||
(Cayman Islands) |
| |||||||||||
(CME Term SOFR 3-Month plus 1.41%) |
| |||||||||||
6.72% | 04/19/331,2,3 | 30,635,000 | 30,637,451 | |||||||||
Madison Park Funding XVII Ltd., |
| |||||||||||
Series 2015-17A, Class BR2 |
| |||||||||||
(Cayman Islands) |
| |||||||||||
(CME Term SOFR 3-Month plus 1.76%) |
| |||||||||||
7.08% | 07/21/301,2,3 | 10,000,000 | 9,996,500 | |||||||||
Madison Park Funding XXIX Ltd., |
| |||||||||||
Series 2018-29A, Class AR |
| |||||||||||
(Cayman Islands) |
| |||||||||||
(CME Term SOFR 3-Month plus 1.18%) |
| |||||||||||
0.00% | 10/18/301,2,3 | 50,000,000 | 50,046,450 | |||||||||
Madison Park Funding XXXVIII Ltd., |
| |||||||||||
Series 2021-38A, Class A |
| |||||||||||
(Cayman Islands) |
| |||||||||||
(CME Term SOFR 3-Month plus 1.38%) |
| |||||||||||
6.70% | 07/17/341,2,3 | 10,500,000 | 10,508,957 | |||||||||
Magnetite XII Ltd., |
| |||||||||||
Series 2015-12A, Class AR4 |
| |||||||||||
(Cayman Islands) |
| |||||||||||
(CME Term SOFR 3-Month plus 1.15%) |
| |||||||||||
6.47% | 10/15/311,2,3 | 50,000,000 | 50,046,400 | |||||||||
Magnetite XXIII Ltd., |
| |||||||||||
Series 2019-23A, Class BR |
| |||||||||||
(Cayman Islands) |
| |||||||||||
(CME Term SOFR 3-Month plus 1.91%) |
| |||||||||||
7.24% | 01/25/351,2,3 | 20,000,000 | 20,031,820 | |||||||||
Magnetite XXV Ltd., |
| |||||||||||
Series 2020-25A, Class A |
| |||||||||||
(Cayman Islands) |
| |||||||||||
(CME Term SOFR 3-Month plus 1.46%) |
| |||||||||||
6.79% | 01/25/321,2,3 | 27,025,000 | 27,072,564 | |||||||||
MetroNet, |
| |||||||||||
Series 2023-3, Class A |
| |||||||||||
7.95% | 04/20/532,4,5 | 24,026,000 | 24,163,960 | |||||||||
| Issues | Maturity Date | Principal Amount | Value | |||||||||
| ASSET-BACKED SECURITIES (continued) |
| |||||||||||
Navient Student Loan Trust, |
| |||||||||||
Series 2014-1, Class A3 |
| |||||||||||
(SOFR30A plus 0.62%) |
| |||||||||||
5.94% | 06/25/311 | $ | 409,260 | $ | 404,010 | |||||||
Navient Student Loan Trust, |
| |||||||||||
Series 2014-3, Class A |
| |||||||||||
(SOFR30A plus 0.73%) |
| |||||||||||
6.05% | 03/25/831 | 31,889,206 | 31,883,736 | |||||||||
Navient Student Loan Trust, |
| |||||||||||
Series 2014-4, Class A |
| |||||||||||
(SOFR30A plus 0.73%) |
| |||||||||||
6.05% | 03/25/831 | 56,017,809 | 55,925,844 | |||||||||
Navient Student Loan Trust, |
| |||||||||||
Series 2015-1, Class A2 |
| |||||||||||
(SOFR30A plus 0.71%) |
| |||||||||||
6.03% | 04/25/401 | 39,695,223 | 38,971,793 | |||||||||
Navient Student Loan Trust, |
| |||||||||||
Series 2016-7A, Class A |
| |||||||||||
(SOFR30A plus 1.26%) |
| |||||||||||
6.58% | 03/25/661,2 | 43,397,047 | 43,620,100 | |||||||||
Nelnet Student Loan Trust, |
| |||||||||||
Series 2006-1, Class A6 |
| |||||||||||
(CME Term SOFR 3-Month plus 0.71%) |
| |||||||||||
6.03% | 08/23/361,2 | 5,897,419 | 5,861,265 | |||||||||
Nelnet Student Loan Trust, |
| |||||||||||
Series 2014-4A, Class A2 |
| |||||||||||
(SOFR30A plus 1.06%) |
| |||||||||||
6.38% | 11/25/481,2 | 9,465,993 | 9,440,110 | |||||||||
Neuberger Berman Loan Advisers CLO 33 Ltd., |
| |||||||||||
Series 2019-33A, Class BR |
| |||||||||||
(Cayman Islands) |
| |||||||||||
(CME Term SOFR 3-Month plus 1.86%) |
| |||||||||||
7.18% | 10/16/331,2,3 | 23,000,000 | 23,022,149 | |||||||||
Neuberger Berman Loan Advisers CLO 47 Ltd., |
| |||||||||||
Series 2022-47A, Class A |
| |||||||||||
(Cayman Islands) |
| |||||||||||
(CME Term SOFR 3-Month plus 1.30%) |
| |||||||||||
6.62% | 04/14/351,2,3 | 32,050,000 | 32,071,474 | |||||||||
NYACK Park CLO Ltd., |
| |||||||||||
Series 2021-1A, Class B1 |
| |||||||||||
(Cayman Islands) |
| |||||||||||
(CME Term SOFR 3-Month plus 1.86%) |
| |||||||||||
7.18% | 10/20/341,2,3 | 20,000,000 | 20,012,500 | |||||||||
OCP CLO Ltd., |
| |||||||||||
Series 2014-6A, Class A2R |
| |||||||||||
(Cayman Islands) |
| |||||||||||
(CME Term SOFR 3-Month plus 1.98%) |
| |||||||||||
7.30% | 10/17/301,2,3 | 4,000,000 | 4,002,264 | |||||||||
OCP CLO Ltd., |
| |||||||||||
Series 2017-13A, Class A2R |
| |||||||||||
(Cayman Islands) |
| |||||||||||
(CME Term SOFR 3-Month plus 1.81%) |
| |||||||||||
7.13% | 07/15/301,2,3 | 5,675,000 | 5,677,872 | |||||||||
See accompanying Notes to Financial Statements.
| 165 / Annual Report March 2024 |
Table of Contents
Total Return Bond Fund
Schedule of Portfolio Investments
March 31, 2024
| Issues | Maturity Date | Principal Amount | Value | |||||||||
| ASSET-BACKED SECURITIES (continued) |
| |||||||||||
OCP CLO Ltd., |
| |||||||||||
Series 2020-19A, Class BR |
| |||||||||||
(Cayman Islands) |
| |||||||||||
(CME Term SOFR 3-Month plus 1.96%) |
| |||||||||||
7.28% | 10/20/341,2,3 | $ | 15,500,000 | $ | 15,515,128 | |||||||
Octagon 52 Ltd., |
| |||||||||||
Series 2021-1A, Class B |
| |||||||||||
(Cayman Islands) |
| |||||||||||
(CME Term SOFR 3-Month plus 1.71%) |
| |||||||||||
7.03% | 04/20/341,2,3 | 10,955,000 | 10,904,629 | |||||||||
Octagon 67 Ltd., |
| |||||||||||
Series 2023-1A, Class A1 |
| |||||||||||
(Cayman Islands) |
| |||||||||||
(CME Term SOFR 3-Month plus 1.80%) |
| |||||||||||
7.12% | 04/25/361,2,3 | 21,210,000 | 21,296,113 | |||||||||
Octagon Investment Partners 20-R Ltd., |
| |||||||||||
Series 2019-4A, Class BR |
| |||||||||||
(Cayman Islands) |
| |||||||||||
(CME Term SOFR 3-Month plus 1.96%) |
| |||||||||||
7.26% | 05/12/311,2,3 | 17,500,000 | 17,473,645 | |||||||||
Octagon Investment Partners 27 Ltd., |
| |||||||||||
Series 2016-1A, Class A2R |
| |||||||||||
(Cayman Islands) |
| |||||||||||
(CME Term SOFR 3-Month plus 1.61%) |
| |||||||||||
6.93% | 07/15/301,2,3 | 10,000,000 | 10,000,700 | |||||||||
Octagon Investment Partners 44 Ltd., |
| |||||||||||
Series 2019-1A, Class BR |
| |||||||||||
(Cayman Islands) |
| |||||||||||
(CME Term SOFR 3-Month plus 1.96%) |
| |||||||||||
7.28% | 10/15/341,2,3 | 18,800,000 | 18,817,916 | |||||||||
Octagon Investment Partners 46 Ltd., |
| |||||||||||
Series 2020-2A, Class BR |
| |||||||||||
(Cayman Islands) |
| |||||||||||
(CME Term SOFR 3-Month plus 1.91%) |
| |||||||||||
7.23% | 07/15/361,2,3 | 7,250,000 | 7,243,113 | |||||||||
Octagon Investment Partners XXI Ltd., |
| |||||||||||
Series 2014-1A, Class A2R3 |
| |||||||||||
(Cayman Islands) |
| |||||||||||
(CME Term SOFR 3-Month plus 1.66%) |
| |||||||||||
6.97% | 02/14/311,2,3 | 1,470,000 | 1,465,796 | |||||||||
OHA Credit Funding 3 Ltd., |
| |||||||||||
Series 2019-3A, Class AR |
| |||||||||||
(Cayman Islands) |
| |||||||||||
(CME Term SOFR 3-Month plus 1.40%) |
| |||||||||||
6.72% | 07/02/351,2,3 | 33,250,000 | 33,274,938 | |||||||||
OHA Credit Funding 7 Ltd., |
| |||||||||||
Series 2020-7A, Class AR |
| |||||||||||
(Cayman Islands) |
| |||||||||||
(CME Term SOFR 3-Month plus 1.30%) |
| |||||||||||
6.61% | 02/24/371,2,3 | 6,960,000 | 6,967,092 | |||||||||
Palmer Square CLO Ltd., |
| |||||||||||
Series 2018-1A, Class A1R |
| |||||||||||
(Cayman Islands) |
| |||||||||||
(CME Term SOFR 3-Month plus 1.52%) |
| |||||||||||
6.84% | 04/18/371,2,3 | 23,000,000 | 23,021,850 | |||||||||
| Issues | Maturity Date | Principal Amount | Value | |||||||||
| ASSET-BACKED SECURITIES (continued) |
| |||||||||||
Palmer Square CLO Ltd., |
| |||||||||||
Series 2021-4A, Class B |
| |||||||||||
(Cayman Islands) |
| |||||||||||
(CME Term SOFR 3-Month plus 1.91%) |
| |||||||||||
7.23% | 10/15/341,2,3 | $ | 19,500,000 | $ | 19,491,030 | |||||||
Park Avenue Institutional Advisers CLO Ltd., |
| |||||||||||
Series 2021-1A, Class A1A |
| |||||||||||
(Cayman Islands) |
| |||||||||||
(CME Term SOFR 3-Month plus 1.65%) |
| |||||||||||
6.97% | 01/20/341,2,3 | 32,000,000 | 32,032,736 | |||||||||
Progress Residential Trust, |
| |||||||||||
Series 2021-SFR2, Class H |
| |||||||||||
5.00% | 04/19/382 | 21,439,000 | 19,861,699 | |||||||||
Progress Residential Trust, |
| |||||||||||
Series 2021-SFR6, Class E2 |
| |||||||||||
2.53% | 07/17/382 | 3,973,000 | 3,596,544 | |||||||||
Progress Residential Trust, |
| |||||||||||
Series 2021-SFR6, Class F |
| |||||||||||
3.42% | 07/17/382 | 10,437,000 | 9,487,657 | |||||||||
Progress Residential Trust, |
| |||||||||||
Series 2021-SFR6, Class G |
| |||||||||||
4.00% | 07/17/382 | 8,896,000 | 8,008,868 | |||||||||
Progress Residential Trust, |
| |||||||||||
Series 2021-SFR7, Class F |
| |||||||||||
3.83% | 08/17/402 | 23,777,000 | 20,562,079 | |||||||||
Progress Residential Trust, |
| |||||||||||
Series 2021-SFR8, Class E1 |
| |||||||||||
2.38% | 10/17/382 | 17,400,000 | 15,703,130 | |||||||||
Progress Residential Trust, |
| |||||||||||
Series 2021-SFR8, Class E2 |
| |||||||||||
2.53% | 10/17/382 | 13,425,000 | 12,044,871 | |||||||||
Progress Residential Trust, |
| |||||||||||
Series 2021-SFR8, Class F |
| |||||||||||
3.18% | 10/17/382 | 61,665,000 | 55,379,878 | |||||||||
Progress Residential Trust, |
| |||||||||||
Series 2021-SFR8, Class G |
| |||||||||||
4.01% | 10/17/382 | 19,482,000 | 17,380,940 | |||||||||
Progress Residential, |
| |||||||||||
Series 2021-SFR1, Class E |
| |||||||||||
2.11% | 04/17/382 | 3,000,000 | 2,738,813 | |||||||||
Progress Residential, |
| |||||||||||
Series 2021-SFR3, Class E1 |
| |||||||||||
2.54% | 05/17/262 | 3,055,000 | 2,803,108 | |||||||||
Progress Residential, |
| |||||||||||
Series 2021-SFR3, Class G |
| |||||||||||
4.25% | 05/17/262 | 3,190,000 | 2,899,029 | |||||||||
Rad CLO 18 Ltd., |
| |||||||||||
Series 2023-18A, Class A1 |
| |||||||||||
(Cayman Islands) |
| |||||||||||
(CME Term SOFR 3-Month plus 1.95%) |
| |||||||||||
7.26% | 04/15/361,2,3 | 29,590,000 | 29,771,150 | |||||||||
Recette CLO Ltd., |
| |||||||||||
Series 2015-1A, Class ARR |
| |||||||||||
(Cayman Islands) |
| |||||||||||
(CME Term SOFR 3-Month plus 1.34%) |
| |||||||||||
6.66% | 04/20/341,2,3 | 32,680,000 | 32,694,771 | |||||||||
See accompanying Notes to Financial Statements.
| Annual Report March 2024 / 166 |
Table of Contents
Total Return Bond Fund
Schedule of Portfolio Investments
March 31, 2024
| Issues | Maturity Date | Principal Amount | Value | |||||||||
| ASSET-BACKED SECURITIES (continued) |
| |||||||||||
Regatta XIV Funding Ltd., |
| |||||||||||
Series 2018-3A, Class B |
| |||||||||||
(Cayman Islands) |
| |||||||||||
(CME Term SOFR 3-Month plus 2.11%) |
| |||||||||||
7.44% | 10/25/311,2,3 | $ | 1,900,000 | $ | 1,901,197 | |||||||
Regatta XX Funding Ltd., |
| |||||||||||
Series 2021-2A, Class B |
| |||||||||||
(Cayman Islands) |
| |||||||||||
(CME Term SOFR 3-Month plus 1.96%) |
| |||||||||||
7.28% | 10/15/341,2,3 | 17,000,000 | 17,000,850 | |||||||||
Rockford Tower CLO Ltd., |
| |||||||||||
Series 2017-2A, Class AR |
| |||||||||||
(Cayman Islands) |
| |||||||||||
(CME Term SOFR 3-Month plus 1.28%) |
| |||||||||||
6.60% | 10/15/291,2,3 | 7,436,016 | 7,434,752 | |||||||||
Rockford Tower CLO Ltd., |
| |||||||||||
Series 2017-3A, Class A |
| |||||||||||
(Cayman Islands) |
| |||||||||||
(CME Term SOFR 3-Month plus 1.45%) |
| |||||||||||
6.77% | 10/20/301,2,3 | 3,385,895 | 3,394,224 | |||||||||
Rockford Tower CLO Ltd., |
| |||||||||||
Series 2019-2A, Class BR |
| |||||||||||
(Cayman Islands) |
| |||||||||||
(CME Term SOFR 3-Month plus 1.91%) |
| |||||||||||
7.23% | 08/20/321,2,3 | 20,000,000 | 19,996,860 | |||||||||
Rockford Tower CLO Ltd., |
| |||||||||||
Series 2020-1A, Class A1R |
| |||||||||||
(Cayman Islands) |
| |||||||||||
(CME Term SOFR 3-Month plus 1.52%) |
| |||||||||||
6.84% | 01/20/361,2,3 | 22,730,000 | 22,743,411 | |||||||||
RRE 15 Loan Management DAC, |
| |||||||||||
Series 15X, Class A1 |
| |||||||||||
(Ireland) |
| |||||||||||
(3-Month Euribor plus 1.75%) |
| |||||||||||
5.69% | 10/15/351,3 | 5,000,000 | 5,418,306 | |||||||||
Sixth Street CLO XVII Ltd., |
| |||||||||||
Series 2021-17A, Class A |
| |||||||||||
(Cayman Islands) |
| |||||||||||
(CME Term SOFR 3-Month plus 1.50%) |
| |||||||||||
6.82% | 01/20/341,2,3 | 12,975,000 | 12,989,130 | |||||||||
Sixth Street CLO XX Ltd., |
| |||||||||||
Series 2021-20A, Class B |
| |||||||||||
(Cayman Islands) |
| |||||||||||
(CME Term SOFR 3-Month plus 1.91%) |
| |||||||||||
7.23% | 10/20/341,2,3 | 25,000,000 | 25,000,250 | |||||||||
Skyline Aircraft Finance LLC, |
| |||||||||||
Series 2021-1, Class A |
| |||||||||||
3.23% | 05/10/374,5,6 | 26,545,041 | 23,709,075 | |||||||||
SLC Student Loan Trust, |
| |||||||||||
Series 2004-1, Class B |
| |||||||||||
(SOFR90A plus 0.55%) |
| |||||||||||
5.91% | 08/15/311 | 160,966 | 137,215 | |||||||||
SLC Student Loan Trust, |
| |||||||||||
Series 2008-1, Class A4A |
| |||||||||||
(SOFR90A plus 1.86%) |
| |||||||||||
7.22% | 12/15/321 | 5,691,326 | 5,779,327 | |||||||||
| Issues | Maturity Date | Principal Amount | Value | |||||||||
| ASSET-BACKED SECURITIES (continued) |
| |||||||||||
SLM Student Loan Trust, |
| |||||||||||
Series 2003-12, Class B |
| |||||||||||
(SOFR90A plus 0.85%) |
| |||||||||||
6.21% | 12/15/681 | $ | 31,252 | $ | 30,003 | |||||||
SLM Student Loan Trust, |
| |||||||||||
Series 2005-9, Class A7A |
| |||||||||||
(SOFR90A plus 0.86%) |
| |||||||||||
6.22% | 01/25/411 | 35,089,119 | 34,870,416 | |||||||||
SLM Student Loan Trust, |
| |||||||||||
Series 2006-2, Class A6 |
| |||||||||||
(SOFR90A plus 0.43%) |
| |||||||||||
5.79% | 01/25/411 | 19,707,679 | 19,228,379 | |||||||||
SLM Student Loan Trust, |
| |||||||||||
Series 2006-8, Class A6 |
| |||||||||||
(SOFR90A plus 0.42%) |
| |||||||||||
5.78% | 01/25/411 | 21,911,540 | 21,224,957 | |||||||||
SLM Student Loan Trust, |
| |||||||||||
Series 2007-1, Class A6 |
| |||||||||||
(SOFR90A plus 0.40%) |
| |||||||||||
5.76% | 01/27/421 | 21,444,919 | 20,837,656 | |||||||||
SLM Student Loan Trust, |
| |||||||||||
Series 2007-1, Class B |
| |||||||||||
(SOFR90A plus 0.48%) |
| |||||||||||
5.84% | 01/27/421 | 2,506,702 | 2,285,455 | |||||||||
SLM Student Loan Trust, |
| |||||||||||
Series 2007-6, Class B |
| |||||||||||
(SOFR90A plus 1.11%) |
| |||||||||||
6.47% | 04/27/431 | 3,157,817 | 2,987,926 | |||||||||
SLM Student Loan Trust, |
| |||||||||||
Series 2007-7, Class A4 |
| |||||||||||
(SOFR90A plus 0.59%) |
| |||||||||||
5.95% | 01/25/221 | 145,429 | 142,216 | |||||||||
SLM Student Loan Trust, |
| |||||||||||
Series 2008-2, Class B |
| |||||||||||
(SOFR90A plus 1.46%) |
| |||||||||||
6.82% | 01/25/831 | 38,874,000 | 37,348,895 | |||||||||
SLM Student Loan Trust, |
| |||||||||||
Series 2008-3, Class A3 |
| |||||||||||
(SOFR90A plus 1.26%) |
| |||||||||||
6.62% | 10/25/211 | 9,524 | 9,458 | |||||||||
SLM Student Loan Trust, |
| |||||||||||
Series 2008-3, Class B |
| |||||||||||
(SOFR90A plus 1.46%) |
| |||||||||||
6.82% | 04/26/831 | 2,260,000 | 2,156,188 | |||||||||
SLM Student Loan Trust, |
| |||||||||||
Series 2008-4, Class A4 |
| |||||||||||
(SOFR90A plus 1.91%) |
| |||||||||||
7.27% | 07/25/221 | 1,077,528 | 1,089,061 | |||||||||
SLM Student Loan Trust, |
| |||||||||||
Series 2008-4, Class B |
| |||||||||||
(SOFR90A plus 2.11%) |
| |||||||||||
7.47% | 04/25/731 | 8,849,000 | 8,920,645 | |||||||||
SLM Student Loan Trust, |
| |||||||||||
Series 2008-5, Class A4 |
| |||||||||||
(SOFR90A plus 1.96%) |
| |||||||||||
7.32% | 07/25/231 | 14,981,941 | 14,972,248 | |||||||||
See accompanying Notes to Financial Statements.
| 167 / Annual Report March 2024 |
Table of Contents
Total Return Bond Fund
Schedule of Portfolio Investments
March 31, 2024
| Issues | Maturity Date | Principal Amount | Value | |||||||||
| ASSET-BACKED SECURITIES (continued) |
| |||||||||||
SLM Student Loan Trust, |
| |||||||||||
Series 2008-5, Class B |
| |||||||||||
(SOFR90A plus 2.11%) |
| |||||||||||
7.47% | 07/25/731 | $ | 37,199,000 | $ | 37,023,480 | |||||||
SLM Student Loan Trust, |
| |||||||||||
Series 2008-6, Class A4 |
| |||||||||||
(SOFR90A plus 1.36%) |
| |||||||||||
6.72% | 07/25/231 | 7,517,921 | 7,465,309 | |||||||||
SLM Student Loan Trust, |
| |||||||||||
Series 2008-6, Class B |
| |||||||||||
(SOFR90A plus 2.11%) |
| |||||||||||
7.47% | 07/26/831 | 31,424,000 | 29,888,661 | |||||||||
SLM Student Loan Trust, |
| |||||||||||
Series 2008-7, Class B |
| |||||||||||
(SOFR90A plus 2.11%) |
| |||||||||||
7.47% | 07/26/831 | 17,206,000 | 16,148,174 | |||||||||
SLM Student Loan Trust, |
| |||||||||||
Series 2011-1, Class A2 |
| |||||||||||
(SOFR30A plus 1.26%) |
| |||||||||||
6.58% | 10/25/341 | 1,177,387 | 1,181,520 | |||||||||
SLM Student Loan Trust, |
| |||||||||||
Series 2012-1, Class A3 |
| |||||||||||
(SOFR30A plus 1.06%) |
| |||||||||||
6.38% | 09/25/281 | 378,822 | 366,738 | |||||||||
SLM Student Loan Trust, |
| |||||||||||
Series 2012-2, Class A |
| |||||||||||
(SOFR30A plus 0.81%) |
| |||||||||||
6.13% | 01/25/291 | 8,238,458 | 8,038,032 | |||||||||
SLM Student Loan Trust, |
| |||||||||||
Series 2012-7, Class A3 |
| |||||||||||
(SOFR30A plus 0.76%) |
| |||||||||||
6.08% | 05/26/261 | 14,396,949 | 13,954,739 | |||||||||
Student Loan Consolidation Center Student Loan Trust I, |
| |||||||||||
Series 2002-2, Class B2 |
| |||||||||||
(28 Day Auction Rate plus 0.00%) |
| |||||||||||
1.61% | 07/01/421,2 | 17,000,000 | 15,710,499 | |||||||||
Symphony CLO XXIX Ltd., |
| |||||||||||
Series 2021-29A, Class B |
| |||||||||||
(Cayman Islands) |
| |||||||||||
(CME Term SOFR 3-Month plus 1.91%) |
| |||||||||||
7.23% | 01/15/341,2,3 | 14,500,000 | 14,509,092 | |||||||||
Trestles CLO IV Ltd., |
| |||||||||||
Series 2021-4A, Class A |
| |||||||||||
(Cayman Islands) |
| |||||||||||
(CME Term SOFR 3-Month plus 1.43%) |
| |||||||||||
6.75% | 07/21/341,2,3 | 40,000,000 | 40,014,160 | |||||||||
U.S. Small Business Administration, |
| |||||||||||
Series 2022-25F, Class 1 |
| |||||||||||
4.01% | 06/01/47 | 66,698,155 | 62,680,425 | |||||||||
United Auto Credit Securitization Trust, |
| |||||||||||
Series 2022-2, Class R1 |
| |||||||||||
0.00% | 04/10/292 | 33,600 | 3 | |||||||||
Voya CLO Ltd., |
| |||||||||||
Series 2019-4A, Class BR |
| |||||||||||
(Cayman Islands) |
| |||||||||||
(CME Term SOFR 3-Month plus 2.01%) |
| |||||||||||
7.33% | 01/15/351,2,3 | 17,500,000 | 17,517,028 | |||||||||
| Issues | Maturity Date | Principal Amount | Value | |||||||||
| ASSET-BACKED SECURITIES (continued) |
| |||||||||||
Voya CLO Ltd., |
| |||||||||||
Series 2020-2A, Class BR |
| |||||||||||
(Cayman Islands) |
| |||||||||||
(CME Term SOFR 3-Month plus 1.96%) |
| |||||||||||
7.27% | 07/19/341,2,3 | $ | 11,825,000 | $ | 11,830,558 | |||||||
|
|
| ||||||||||
| Total Asset-Backed Securities |
| |||||||||||
(Cost $2,606,427,973) |
| 2,634,400,852 | ||||||||||
|
|
| ||||||||||
| BANK LOANS — 1.39%* |
| |||||||||||
| Automotive — 0.01% |
| |||||||||||
First Brands Group LLC, |
| |||||||||||
Term Loan B, 1st Lien |
| |||||||||||
(SOFR plus 5.26%) |
| |||||||||||
10.57% | 03/30/271 | 3,164,136 | 3,172,837 | |||||||||
|
|
| ||||||||||
| Communications — 0.17% |
| |||||||||||
CCI Buyer, Inc., |
| |||||||||||
Term Loan B, 1st Lien |
| |||||||||||
(SOFR plus 4.00%) |
| |||||||||||
9.30% | 12/17/271 | 4,923,233 | 4,900,807 | |||||||||
CSC Holdings LLC, |
| |||||||||||
Term Loan B5, 1st Lien |
| |||||||||||
(SOFR plus 2.50%) |
| |||||||||||
7.94% | 04/15/271 | 6,257,196 | 5,673,931 | |||||||||
Frontier Communications Holdings LLC, |
| |||||||||||
Term Loan B, 1st Lien |
| |||||||||||
(SOFR plus 3.86%) |
| |||||||||||
8.62% | 10/08/271 | 18,246,305 | 18,229,245 | |||||||||
New Insight Holdings, Inc., |
| |||||||||||
Term Loan B, 1st Lien |
| |||||||||||
(SOFR plus 5.76%) |
| |||||||||||
11.07% | 12/20/241 | 4,796,664 | 2,894,499 | |||||||||
SBA Senior Finance II LLC, |
| |||||||||||
Term Loan B, 1st Lien |
| |||||||||||
(SOFR plus 2.00%) |
| |||||||||||
7.34% | 01/25/311 | 15,549,685 | 15,595,868 | |||||||||
Zayo Group Holdings, Inc., |
| |||||||||||
Term Loan B, 1st Lien |
| |||||||||||
(SOFR plus 3.11%) |
| |||||||||||
8.44% | 03/09/271 | 42,781,678 | 37,660,069 | |||||||||
(SOFR plus 4.33%) |
| |||||||||||
9.66% | 03/09/271 | 4,159,948 | 3,741,915 | |||||||||
|
|
| ||||||||||
| 88,696,334 | ||||||||||||
|
|
| ||||||||||
| Consumer Discretionary — 0.10% |
| |||||||||||
City Brewing Co. LLC, |
| |||||||||||
Term Loan B, 1st Lien |
| |||||||||||
(SOFR plus 3.76%) |
| |||||||||||
8.32% | 04/05/281 | 8,632,967 | 6,779,211 | |||||||||
Naked Juice, LLC, |
| |||||||||||
Term Loan, 1st Lien (Luxembourg) |
| |||||||||||
(SOFR plus 3.35%) |
| |||||||||||
8.66% | 01/24/291,3 | 41,927,959 | 39,321,717 | |||||||||
Term Loan, 2nd Lien |
| |||||||||||
(SOFR plus 6.10%) |
| |||||||||||
11.00% | 01/24/301 | 4,735,415 | 3,881,549 | |||||||||
See accompanying Notes to Financial Statements.
| Annual Report March 2024 / 168 |
Table of Contents
Total Return Bond Fund
Schedule of Portfolio Investments
March 31, 2024
| Issues | Maturity Date | Principal Amount | Value | |||||||||
BANK LOANS (continued) |
| |||||||||||
Consumer Discretionary (continued) |
| |||||||||||
Osmosis Buyer Ltd., |
| |||||||||||
Term Loan B, 1st Lien |
| |||||||||||
(SOFR plus 3.75%) |
| |||||||||||
9.07% | 07/31/281 | $ | 1,329,954 | $ | 1,333,838 | |||||||
(SOFR plus 4.25%) |
| |||||||||||
9.57% - 9.58% | 07/31/281,7 | 448,696 | 451,267 | |||||||||
|
|
| ||||||||||
| 51,767,582 | ||||||||||||
|
|
| ||||||||||
| Entertainment — 0.06% |
| |||||||||||
Elanco Animal Health, Inc., |
| |||||||||||
Term Loan B, 1st Lien |
| |||||||||||
(SOFR plus 1.85%) |
| |||||||||||
7.18% | 08/01/271 | 31,468,829 | 31,392,675 | |||||||||
William Morris Endeavor Entertainment LLC, |
| |||||||||||
Term Loan B1, 1st Lien |
| |||||||||||
(SOFR plus 2.86%) |
| |||||||||||
8.19% | 05/16/251 | 2,881,106 | 2,882,647 | |||||||||
|
|
| ||||||||||
| 34,275,322 | ||||||||||||
|
|
| ||||||||||
| Finance — 0.09% |
| |||||||||||
Avolon TLB Borrower 1 U.S. LLC, |
| |||||||||||
Term Loan B6, 1st Lien |
| |||||||||||
(SOFR plus 2.00%) |
| |||||||||||
7.33% | 06/22/281 | 9,881,149 | 9,895,082 | |||||||||
Deerfield Dakota Holding LLC, |
| |||||||||||
Term Loan B, 1st Lien |
| |||||||||||
(SOFR plus 3.75%) |
| |||||||||||
9.06% | 04/09/271 | 8,327,093 | 8,296,449 | |||||||||
Jane Street Group LLC, |
| |||||||||||
Term Loan B, 1st Lien |
| |||||||||||
(SOFR plus 2.61%) |
| |||||||||||
7.94% | 01/26/281 | 8,356,660 | 8,370,240 | |||||||||
Setanta Aircraft Leasing DAC, |
| |||||||||||
Term Loan B, 1st Lien |
| |||||||||||
(SOFR plus 2.26%) |
| |||||||||||
7.56% | 11/06/281 | 16,790,000 | 16,843,644 | |||||||||
Telenet Financing USD LLC, |
| |||||||||||
Term Loan AR, 1st Lien |
| |||||||||||
(SOFR plus 2.11%) |
| |||||||||||
7.44% | 04/30/281 | 4,630,109 | 4,512,411 | |||||||||
|
|
| ||||||||||
| 47,917,826 | ||||||||||||
|
|
| ||||||||||
| Food — 0.01% |
| |||||||||||
8th Avenue Food & Provisions, Inc., |
| |||||||||||
Term Loan B, 1st Lien |
| |||||||||||
(SOFR plus 3.86%) |
| |||||||||||
9.19% | 10/01/251 | 1,101,546 | 1,084,869 | |||||||||
H-Food Holdings LLC, |
| |||||||||||
Term Loan, 1st Lien |
| |||||||||||
(SOFR plus 3.95%) |
| |||||||||||
9.29% | 05/23/251 | 3,235,874 | 2,368,271 | |||||||||
|
|
| ||||||||||
| 3,453,140 | ||||||||||||
|
|
| ||||||||||
| Issues | Maturity Date | Principal Amount | Value | |||||||||
BANK LOANS (continued) |
| |||||||||||
Gaming — 0.04% |
| |||||||||||
Caesars Entertainment, Inc., |
| |||||||||||
Term Loan B1, 1st Lien |
| |||||||||||
(SOFR plus 2.75%) |
| |||||||||||
8.04% | 02/06/311 | $ | 8,265,738 | $ | 8,282,518 | |||||||
Churchill Downs, Inc., |
| |||||||||||
Term Loan B1, 1st Lien |
| |||||||||||
(SOFR plus 2.10%) |
| |||||||||||
7.43% | 03/17/281 | 10,620,256 | 10,636,877 | |||||||||
Penn National Gaming, Inc., |
| |||||||||||
Term Loan B, 1st Lien |
| |||||||||||
(SOFR plus 2.85%) |
| |||||||||||
7.66% | 05/03/291 | 3,407,972 | 3,415,435 | |||||||||
|
|
| ||||||||||
| 22,334,830 | ||||||||||||
|
|
| ||||||||||
| Health Care — 0.19% |
| |||||||||||
Avantor Funding, Inc., |
| |||||||||||
Term Loan B5, 1st Lien |
| |||||||||||
(SOFR plus 2.35%) |
| |||||||||||
7.68% | 11/08/271 | 13,028,188 | 13,062,973 | |||||||||
Bausch + Lomb Corp., |
| |||||||||||
Term Loan B, 1st Lien (Canada) |
| |||||||||||
(SOFR plus 3.35%) |
| |||||||||||
8.68% | 05/10/271,3 | 3,727,318 | 3,692,840 | |||||||||
Term Loan, 1st Lien (Canada) |
| |||||||||||
(SOFR plus 4.00%) |
| |||||||||||
9.33% | 09/29/281,3 | 1,841,247 | 1,843,557 | |||||||||
Carestream Dental Equipment, Inc., |
| |||||||||||
Term Loan, 1st Lien |
| |||||||||||
(LIBOR plus 3.25%) |
| |||||||||||
8.56% | 09/01/241 | 8,423,903 | 7,356,890 | |||||||||
Carestream Dental, Inc., |
| |||||||||||
Term Loan, 1st Lien |
| |||||||||||
(LIBOR plus 4.50%) |
| |||||||||||
9.94% | 09/01/241 | 2,572,162 | 2,245,279 | |||||||||
Genesee & Wyoming, Inc., |
| |||||||||||
Term Loan, 1st Lien |
| |||||||||||
(SOFR plus 2.10%) |
| |||||||||||
7.40% | 12/30/261 | 2,606,006 | 2,610,644 | |||||||||
Grifols Worldwide Operations USA, Inc., |
| |||||||||||
Term Loan B, 1st Lien |
| |||||||||||
(SOFR plus 2.15%) |
| |||||||||||
7.46% | 11/15/271 | 12,488,206 | 12,118,992 | |||||||||
Jazz Financing Lux SARL, |
| |||||||||||
Term Loan B, 1st Lien (Luxembourg) |
| |||||||||||
(SOFR plus 3.11%) |
| |||||||||||
8.44% | 05/05/281,3 | 20,268,122 | 20,394,798 | |||||||||
Medline Borrower LP, |
| |||||||||||
Term Loan B, 1st Lien |
| |||||||||||
(SOFR plus 3.11%) |
| |||||||||||
8.44% | 10/23/281 | 13,314,583 | 13,358,455 | |||||||||
Organon & Co., |
| |||||||||||
Term Loan B, 1st Lien |
| |||||||||||
(SOFR plus 3.11%) |
| |||||||||||
7.75% | 06/02/281 | 9,592,323 | 9,638,318 | |||||||||
See accompanying Notes to Financial Statements.
| 169 / Annual Report March 2024 |
Table of Contents
Total Return Bond Fund
Schedule of Portfolio Investments
March 31, 2024
| Issues | Maturity Date | Principal Amount | Value | |||||||||
BANK LOANS (continued) |
| |||||||||||
Health Care (continued) |
| |||||||||||
Peraton Corp., |
| |||||||||||
Term Loan B, 1st Lien |
| |||||||||||
(SOFR plus 3.85%) |
| |||||||||||
9.18% | 02/01/281 | $ | 4,354,045 | $ | 4,358,486 | |||||||
Perrigo Investments LLC, |
| |||||||||||
Term Loan B, 1st Lien |
| |||||||||||
(SOFR plus 2.35%) |
| |||||||||||
7.15% | 04/20/291 | 738,750 | 737,520 | |||||||||
Prestige Brands, Inc., |
| |||||||||||
Term Loan B5, 1st Lien |
| |||||||||||
(SOFR plus 2.11%) |
| |||||||||||
7.44% | 07/03/281 | 122,727 | 123,494 | |||||||||
Star Parent, Inc., |
| |||||||||||
Term Loan B, 1st Lien |
| |||||||||||
(SOFR plus 4.00%) |
| |||||||||||
9.31% | 09/27/301 | 6,358,307 | 6,326,929 | |||||||||
|
|
| ||||||||||
| 97,869,175 | ||||||||||||
|
|
| ||||||||||
| Industrials — 0.17% |
| |||||||||||
Artera Services LLC, |
| |||||||||||
Term Loan, 1st Lien |
| |||||||||||
(SOFR plus 4.50%) |
| |||||||||||
9.81% | 02/15/311 | 6,131,010 | 6,161,665 | |||||||||
ASP Blade Holdings, Inc., |
| |||||||||||
Term Loan B, 1st Lien |
| |||||||||||
(SOFR plus 4.26%) |
| |||||||||||
9.56% | 10/16/281 | 670,144 | 607,821 | |||||||||
Berry Global, Inc., |
| |||||||||||
Term Loan AA, 1st Lien |
| |||||||||||
(SOFR plus 1.86%) |
| |||||||||||
7.18% | 07/01/291 | 38,292,845 | 38,320,415 | |||||||||
Coherent Corp., |
| |||||||||||
Term Loan B, 1st Lien |
| |||||||||||
(SOFR plus 2.86%) |
| |||||||||||
7.38% - 7.67% | 07/02/291 | 2,163,891 | 2,170,924 | |||||||||
Filtration Group Corp., |
| |||||||||||
Term Loan, 1st Lien |
| |||||||||||
(SOFR plus 4.36%) |
| |||||||||||
9.69% | 10/21/281 | 2,957,188 | 2,969,948 | |||||||||
Michaels Cos., Inc. (The), |
| |||||||||||
Term Loan, 1st Lien |
| |||||||||||
(SOFR plus 4.51%) |
| |||||||||||
9.82% | 04/15/281 | 27,463,400 | 24,710,881 | |||||||||
Patriot Container Corp., |
| |||||||||||
Term Loan B, 1st Lien |
| |||||||||||
(SOFR plus 3.85%) |
| |||||||||||
9.18% | 03/20/251 | 2,557,854 | 2,486,592 | |||||||||
Transdigm, Inc., |
| |||||||||||
Term Loan I, 1st Lien |
| |||||||||||
(SOFR plus 2.75%) |
| |||||||||||
8.08% | 08/24/281 | 12,791,451 | 12,849,460 | |||||||||
|
|
| ||||||||||
| 90,277,706 | ||||||||||||
|
|
| ||||||||||
| Issues | Maturity Date | Principal Amount | Value | |||||||||
BANK LOANS (continued) |
| |||||||||||
Information Technology — 0.25% |
| |||||||||||
Arches Buyer, Inc., |
| |||||||||||
Term Loan B, 1st Lien |
| |||||||||||
(SOFR plus 3.35%) |
| |||||||||||
8.68% | 12/06/271 | $ | 5,482,597 | $ | 5,323,081 | |||||||
Athenahealth Group, Inc., |
| |||||||||||
Term Loan B, 1st Lien |
| |||||||||||
(SOFR plus 3.25%) |
| |||||||||||
8.25% | 02/15/291 | 7,037,978 | 6,989,064 | |||||||||
Buzz Merger Sub Ltd., |
| |||||||||||
Term Loan B, 1st Lien |
| |||||||||||
(SOFR plus 2.85%) |
| |||||||||||
8.18% | 01/29/271 | 4,567,151 | 4,582,862 | |||||||||
Central Parent LLC, |
| |||||||||||
Term Loan B, 1st Lien |
| |||||||||||
(SOFR plus 4.00%) |
| |||||||||||
9.31% | 07/06/291 | 6,640,922 | 6,668,216 | |||||||||
EagleView Technology Co., |
| |||||||||||
Term Loan B, 1st Lien |
| |||||||||||
(SOFR plus 3.76%) |
| |||||||||||
9.06% | 08/14/251 | 13,768,884 | 13,406,212 | |||||||||
Gainwell Acquisition Corp., |
| |||||||||||
Term Loan B, 1st Lien |
| |||||||||||
(SOFR plus 4.10%) |
| |||||||||||
8.72% - 8.99% | 10/01/271 | 17,761,932 | 17,022,592 | |||||||||
Magnite, Inc., |
| |||||||||||
Term Loan B, 1st Lien |
| |||||||||||
(SOFR plus 4.50%) |
| |||||||||||
9.60% - 9.82% | 02/06/311 | 2,488,979 | 2,496,247 | |||||||||
Match Group, Inc., |
| |||||||||||
Term Loan B, 1st Lien |
| |||||||||||
(SOFR plus 1.90%) |
| |||||||||||
7.23% | 02/13/271 | 1,793,280 | 1,793,280 | |||||||||
MH Sub I LLC, |
| |||||||||||
Term Loan B3, 1st Lien |
| |||||||||||
(SOFR plus 4.25%) |
| |||||||||||
9.58% | 05/03/281 | 3,009,283 | 2,994,913 | |||||||||
NortonLifeLock, Inc., |
| |||||||||||
Term Loan A2, 1st Lien |
| |||||||||||
(SOFR plus 1.85%) |
| |||||||||||
7.18% | 09/10/271 | 6,059,921 | 6,051,710 | |||||||||
Open Text Corp., |
| |||||||||||
Term Loan B, 1st Lien (Canada) |
| |||||||||||
(SOFR plus 1.85%) |
| |||||||||||
7.18% | 05/30/251,3 | 6,669,740 | 6,684,347 | |||||||||
(SOFR plus 2.85%) |
| |||||||||||
8.18% | 01/31/301,3 | 7,726,243 | 7,748,224 | |||||||||
Oracle Corp., |
| |||||||||||
Term Loan A1, 1st Lien |
| |||||||||||
(SOFR plus 0.60%) |
| |||||||||||
6.46% | 08/16/271 | 36,838,700 | 36,884,748 | |||||||||
Proofpoint,Inc., |
| |||||||||||
Term Loan B, 1st Lien (Canada) |
| |||||||||||
(SOFR plus 3.36%) |
| |||||||||||
8.69% | 08/31/281,3 | 925,271 | 926,784 | |||||||||
See accompanying Notes to Financial Statements.
| Annual Report March 2024 / 170 |
Table of Contents
Total Return Bond Fund
Schedule of Portfolio Investments
March 31, 2024
| Issues | Maturity Date | Principal Amount | Value | |||||||||
BANK LOANS (continued) |
| |||||||||||
Information Technology (continued) |
| |||||||||||
Renaissance Holding Corp., |
| |||||||||||
Term Loan, 1st Lien |
| |||||||||||
(SOFR plus 4.25%) |
| |||||||||||
9.58% | 04/05/301 | $ | 5,419,566 | $ | 5,436,502 | |||||||
Spin Holdco, Inc., |
| |||||||||||
Term Loan B, 1st Lien |
| |||||||||||
(SOFR plus 4.26%) |
| |||||||||||
9.59% | 03/03/281 | 3,167,687 | 2,941,751 | |||||||||
SS&C Technologies Holdings, Inc., |
| |||||||||||
Term Loan B5, 1st Lien |
| |||||||||||
(SOFR plus 1.86%) |
| |||||||||||
7.19% | 04/16/251 | 2,356,477 | 2,359,399 | |||||||||
|
|
| ||||||||||
| 130,309,932 | ||||||||||||
|
|
| ||||||||||
| Insurance — 0.06% |
| |||||||||||
Acrisure LLC, |
| |||||||||||
Term Loan B1, 1st Lien |
| |||||||||||
(SOFR plus 3.50%) |
| |||||||||||
8.94% | 02/15/271 | 19,618,245 | 19,630,506 | |||||||||
Asurion LLC, |
| |||||||||||
Term Loan B4, 2nd Lien |
| |||||||||||
(SOFR plus 5.25%) |
| |||||||||||
10.58% | 01/20/291 | 3,290,000 | 2,959,207 | |||||||||
Term Loan B8, 1st Lien |
| |||||||||||
(SOFR plus 3.36%) |
| |||||||||||
8.69% | 12/23/261 | 7,618,534 | 7,482,467 | |||||||||
|
|
| ||||||||||
| 30,072,180 | ||||||||||||
|
|
| ||||||||||
| Materials — 0.03% |
| |||||||||||
Chemours Co. (The), |
| |||||||||||
Term Loan B3, 1st Lien |
| |||||||||||
(SOFR plus 3.50%) |
| |||||||||||
8.83% | 08/18/281 | 11,215,072 | 11,198,249 | |||||||||
Mativ Holdings, Inc., |
| |||||||||||
Delayed-Draw Term Loan, 1st Lien |
| |||||||||||
(SOFR plus 2.60%) |
| |||||||||||
7.93% | 05/06/271 | 3,157,435 | 3,110,074 | |||||||||
|
|
| ||||||||||
| 14,308,323 | ||||||||||||
|
|
| ||||||||||
| Residential REITs — 0.03% |
| |||||||||||
Invitation Homes Operating Partnership LP, |
| |||||||||||
Term Loan A, 1st Lien |
| |||||||||||
(SOFR plus 1.00%) |
| |||||||||||
6.42% | 01/31/251 | 17,500,000 | 17,390,625 | |||||||||
|
|
| ||||||||||
| Retail — 0.10% |
| |||||||||||
1011778 BC Unlimited Liability Co., |
| |||||||||||
Term Loan B5, 1st Lien (Canada) |
| |||||||||||
(SOFR plus 2.25%) |
| |||||||||||
7.58% | 09/20/301,3 | 8,287,917 | 8,293,097 | |||||||||
AmWINS Group, Inc., |
| |||||||||||
Term Loan B, 1st Lien |
| |||||||||||
(SOFR plus 2.36%) |
| |||||||||||
7.69% | 02/19/281 | 30,438,907 | 30,476,956 | |||||||||
| Issues | Maturity Date | Principal Amount | Value | |||||||||
BANK LOANS (continued) |
| |||||||||||
Retail (continued) |
| |||||||||||
KFC Holding Co., |
| |||||||||||
Term Loan B, 1st Lien |
| |||||||||||
(SOFR plus 1.86%) |
| |||||||||||
7.19% | 03/15/281 | $ | 8,584,806 | $ | 8,590,558 | |||||||
Whatabrands LLC, |
| |||||||||||
Term Loan B, 1st Lien |
| |||||||||||
(SOFR plus 3.36%) |
| |||||||||||
8.69% | 08/03/281 | 2,981,176 | 2,986,408 | |||||||||
|
|
| ||||||||||
| 50,347,019 | ||||||||||||
|
|
| ||||||||||
| Services — 0.08% |
| |||||||||||
Amentum Government Services Holdings LLC, |
| |||||||||||
Term Loan B, 1st Lien |
| |||||||||||
(SOFR plus 4.11%) |
| |||||||||||
8.63% | 01/29/271 | 3,320,170 | 3,332,620 | |||||||||
Boost Newco Borrower LLC, |
| |||||||||||
Term Loan B, 1st Lien |
| |||||||||||
(SOFR plus 3.00%) |
| |||||||||||
8.31% | 01/31/311 | 7,253,153 | 7,287,931 | |||||||||
Clean Harbors, Inc., |
| |||||||||||
Term Loan B, 1st Lien |
| |||||||||||
(SOFR plus 1.86%) |
| |||||||||||
7.19% | 10/08/281 | 5,047,701 | 5,063,475 | |||||||||
Element Materials Technology Group U.S. Holdings, Inc., |
| |||||||||||
Delayed-Draw Term Loan, 1st Lien |
| |||||||||||
(SOFR plus 4.35%) |
| |||||||||||
9.66% | 07/06/291 | 2,056,490 | 2,060,777 | |||||||||
Term Loan B, 1st Lien |
| |||||||||||
(SOFR plus 4.35%) |
| |||||||||||
9.66% | 07/06/291 | 4,455,727 | 4,465,018 | |||||||||
Pre-Paid Legal Services, Inc., |
| |||||||||||
Term Loan, 1st Lien |
| |||||||||||
(SOFR plus 3.86%) |
| |||||||||||
9.18% | 12/15/281 | 4,938,516 | 4,921,305 | |||||||||
Prime Security Services Borrower, LLC, |
| |||||||||||
Term Loan A, 1st Lien |
| |||||||||||
(SOFR plus 2.35%) |
| |||||||||||
7.50% | 03/14/281 | 2,909,430 | 2,899,727 | |||||||||
Trans Union LLC, |
| |||||||||||
Term Loan B, 1st Lien |
| |||||||||||
(SOFR plus 2.00%) |
| |||||||||||
7.33% | 12/01/281 | 5,548,510 | 5,552,339 | |||||||||
TruGreen LP, |
| |||||||||||
Term Loan B, 1st Lien |
| |||||||||||
(SOFR plus 4.10%) |
| |||||||||||
9.43% | 11/02/271 | 4,055,323 | 3,955,218 | |||||||||
|
|
| ||||||||||
| 39,538,410 | ||||||||||||
|
|
| ||||||||||
| Total Bank Loans |
| |||||||||||
(Cost $728,081,617) |
| 721,731,241 | ||||||||||
|
|
| ||||||||||
| CORPORATES — 19.18%* |
| |||||||||||
| Banking — 3.92% |
| |||||||||||
Bank of America Corp. |
| |||||||||||
1.73% | 07/22/276 | 82,743,000 | 76,333,588 | |||||||||
2.30% | 07/21/326 | 2,000 | 1,638 | |||||||||
2.59% | 04/29/316 | 1,736,000 | 1,496,008 | |||||||||
See accompanying Notes to Financial Statements.
| 171 / Annual Report March 2024 |
Table of Contents
Total Return Bond Fund
Schedule of Portfolio Investments
March 31, 2024
| Issues | Maturity Date | Principal Amount | Value | |||||||||
CORPORATES (continued) |
| |||||||||||
Banking (continued) |
| |||||||||||
2.69% | 04/22/326 | $ | 12,409,000 | $ | 10,495,862 | |||||||
3.42% | 12/20/286 | 1,587,000 | 1,490,124 | |||||||||
Bank of America Corp. |
| |||||||||||
(MTN) |
| |||||||||||
1.92% | 10/24/316 | 18,688,000 | 15,263,627 | |||||||||
2.09% | 06/14/296 | 241,298,000 | 213,352,880 | |||||||||
2.50% | 02/13/316 | 201,000 | 173,223 | |||||||||
3.97% | 03/05/296 | 336,000 | 321,739 | |||||||||
(CME Term SOFR 3-Month plus 0.91%) |
| |||||||||||
6.25% | 12/01/261 | 50,000,000 | 48,715,030 | |||||||||
Bank of America Corp., |
| |||||||||||
Series N |
| |||||||||||
1.66% | 03/11/276 | 166,038,000 | 154,786,385 | |||||||||
2.65% | 03/11/326 | 3,841,000 | 3,248,026 | |||||||||
DNB Bank ASA |
| |||||||||||
(Norway) |
| |||||||||||
0.86% | 09/30/252,3,6 | 54,865,000 | 53,531,868 | |||||||||
HSBC Holdings PLC |
| |||||||||||
(United Kingdom) |
| |||||||||||
1.59% | 05/24/273,6 | 14,609,000 | 13,446,058 | |||||||||
2.01% | 09/22/283,6 | 77,459,000 | 69,278,170 | |||||||||
2.21% | 08/17/293,6 | 109,557,000 | 96,075,166 | |||||||||
3.97% | 05/22/303,6 | 2,650,000 | 2,476,617 | |||||||||
4.76% | 06/09/283,6 | 3,116,000 | 3,056,411 | |||||||||
6.33% | 03/09/443,6 | 1,000 | 1,074 | |||||||||
JPMorgan Chase & Co. |
| |||||||||||
0.77% | 08/09/256 | 41,694,000 | 40,925,236 | |||||||||
0.82% | 06/01/256 | 30,872,000 | 30,609,412 | |||||||||
0.97% | 06/23/256 | 179,824,000 | 177,765,371 | |||||||||
1.04% | 02/04/276 | 6,590,000 | 6,098,398 | |||||||||
1.56% | 12/10/256 | 163,875,000 | 159,350,741 | |||||||||
1.58% | 04/22/276 | 19,179,000 | 17,789,412 | |||||||||
1.95% | 02/04/326 | 48,035,000 | 39,153,678 | |||||||||
2.01% | 03/13/266 | 2,732,000 | 2,641,315 | |||||||||
2.07% | 06/01/296 | 1,295,000 | 1,148,335 | |||||||||
2.18% | 06/01/286 | 2,490,000 | 2,278,433 | |||||||||
2.55% | 11/08/326 | 19,314,000 | 16,086,043 | |||||||||
2.58% | 04/22/326 | 31,454,000 | 26,584,287 | |||||||||
2.95% | 02/24/286 | 30,236,000 | 28,429,169 | |||||||||
2.96% | 01/25/336 | 12,277,000 | 10,492,931 | |||||||||
3.70% | 05/06/306 | 2,876,000 | 2,695,499 | |||||||||
4.01% | 04/23/296 | 2,671,000 | 2,560,945 | |||||||||
4.45% | 12/05/296 | 8,325,000 | 8,113,018 | |||||||||
5.01% | 01/23/306 | 10,505,000 | 10,466,103 | |||||||||
Lloyds Banking Group PLC |
| |||||||||||
(United Kingdom) |
| |||||||||||
3.87% | 07/09/253,6 | 27,225,000 | 27,084,199 | |||||||||
PNC Financial Services Group, Inc. (The) |
| |||||||||||
5.07% | 01/24/346 | 76,598,000 | 74,216,878 | |||||||||
5.68% | 01/22/356 | 20,690,000 | 20,904,440 | |||||||||
6.88% | 10/20/346 | 14,075,000 | 15,423,382 | |||||||||
Santander UK Group Holdings PLC |
| |||||||||||
(United Kingdom) |
| |||||||||||
1.53% | 08/21/263,6 | 6,354,000 | 5,987,337 | |||||||||
1.67% | 06/14/273,6 | 42,806,000 | 39,186,115 | |||||||||
2.47% | 01/11/283,6 | 20,406,000 | 18,754,060 | |||||||||
| Issues | Maturity Date | Principal Amount | Value | |||||||||||||
CORPORATES (continued) |
| |||||||||||||||
Banking (continued) |
| |||||||||||||||
3.82% |
| 11/03/283,6 | $ | 2,200,000 | $ | 2,068,653 | ||||||||||
U.S. Bancorp |
| |||||||||||||||
4.65% |
| 02/01/296 | 70,000 | 68,616 | ||||||||||||
4.84% |
| 02/01/346 | 66,902,000 | 63,561,858 | ||||||||||||
5.68% |
| 01/23/356 | 17,365,000 | 17,548,913 | ||||||||||||
5.84% |
| 06/12/346 | 1,735,000 | 1,770,269 | ||||||||||||
5.85% |
| 10/21/336 | 32,895,000 | 33,615,780 | ||||||||||||
Wells Fargo & Co. |
| |||||||||||||||
(MTN) |
| |||||||||||||||
2.16% |
| 02/11/266 | 16,673,000 | 16,177,620 | ||||||||||||
2.39% |
| 06/02/286 | 74,765,000 | 68,452,929 | ||||||||||||
2.88% |
| 10/30/306 | 161,948,000 | 143,254,337 | ||||||||||||
3.35% |
| 03/02/336 | 99,716,000 | 86,498,195 | ||||||||||||
3.53% |
| 03/24/286 | 40,965,000 | 39,004,232 | ||||||||||||
4.90% |
| 07/25/336 | 4,193,000 | 4,041,972 | ||||||||||||
5.57% |
| 07/25/296 | 11,374,000 | 11,512,135 | ||||||||||||
|
|
| ||||||||||||||
| 2,035,863,740 | ||||||||||||||||
|
|
| ||||||||||||||
| Communications — 1.82% |
| |||||||||||||||
C&W Senior Finance Ltd. |
| |||||||||||||||
(Cayman Islands) |
| |||||||||||||||
6.88% |
| 09/15/272,3 | 2,200,000 | 2,081,640 | ||||||||||||
Cable One, Inc. |
| |||||||||||||||
4.00% |
| 11/15/302 | 20,620,000 | 16,135,150 | ||||||||||||
Charter Communications Operating LLC/Charter |
| |||||||||||||||
Communications Operating Capital |
| |||||||||||||||
2.30% |
| 02/01/32 | 10,000,000 | 7,725,181 | ||||||||||||
3.70% |
| 04/01/51 | 3,627,000 | 2,252,621 | ||||||||||||
3.90% |
| 06/01/52 | 12,000,000 | 7,665,240 | ||||||||||||
4.80% |
| 03/01/50 | 122,389,000 | 90,674,091 | ||||||||||||
5.38% |
| 04/01/38 | 2,030,000 | 1,768,867 | ||||||||||||
5.38% |
| 05/01/47 | 116,802,000 | 94,438,818 | ||||||||||||
5.75% |
| 04/01/48 | 33,533,000 | 28,259,669 | ||||||||||||
Charter Communications Operating, LLC/Charter |
| |||||||||||||||
Communications Operating Capital |
| |||||||||||||||
5.13% |
| 07/01/49 | 14,837,000 | 11,536,954 | ||||||||||||
5.25% |
| 04/01/53 | 6,547,000 | 5,190,737 | ||||||||||||
CommScope, Inc. |
| |||||||||||||||
4.75% |
| 09/01/292 | 29,008,000 | 20,885,760 | ||||||||||||
CSC Holdings LLC |
| |||||||||||||||
4.50% |
| 11/15/312 | 835,000 | 591,780 | ||||||||||||
4.63% |
| 12/01/302 | 4,879,000 | 2,476,092 | ||||||||||||
5.38% |
| 02/01/282 | 22,749,000 | 19,586,495 | ||||||||||||
5.75% |
| 01/15/302 | 21,758,000 | 11,535,400 | ||||||||||||
6.50% |
| 02/01/292 | 62,590,000 | 53,086,065 | ||||||||||||
7.50% |
| 04/01/282 | 5,318,000 | 3,589,097 | ||||||||||||
11.25% |
| 05/15/282 | 3,010,000 | 2,986,759 | ||||||||||||
11.75% |
| 01/31/292 | 4,625,000 | 4,630,781 | ||||||||||||
Frontier Communications Holdings LLC |
| |||||||||||||||
8.63% |
| 03/15/312 | 22,571,000 | 23,067,377 | ||||||||||||
Global Switch Finance BV |
| |||||||||||||||
(EMTN) |
| |||||||||||||||
(Netherlands) | ||||||||||||||||
1.38% |
| 10/07/303 | 63,777,000 | 63,840,650 | ||||||||||||
See accompanying Notes to Financial Statements.
| Annual Report March 2024 / 172 |
Table of Contents
Total Return Bond Fund
Schedule of Portfolio Investments
March 31, 2024
| Issues | Maturity Date | Principal Amount | Value | |||||||||||||
CORPORATES (continued) |
| |||||||||||||||
Communications (continued) |
| |||||||||||||||
Intelsat Jackson Holdings SA (Luxembourg) |
| |||||||||||||||
6.50% | 03/15/30 | 2,3 | $ | 7,044,000 | $ | 6,568,715 | ||||||||||
Northwest Fiber LLC/Northwest Fiber Finance Sub, Inc. |
| |||||||||||||||
4.75% | 04/30/27 | 2 | 5,597,000 | 5,736,925 | ||||||||||||
6.00% | 02/15/28 | 2 | 9,286,000 | 9,564,580 | ||||||||||||
Qwest Corp. |
| |||||||||||||||
7.25% | 09/15/25 | 4,044,000 | 3,998,505 | |||||||||||||
SES GLOBALAmericas Holdings, Inc. |
| |||||||||||||||
5.30% | 03/25/44 | 2 | 55,170,000 | 42,251,984 | ||||||||||||
Sprint Spectrum Co. LLC/Sprint Spectrum Co. II LLC/Sprint Spectrum Co. III LLC |
| |||||||||||||||
4.74% | 03/20/25 | 2 | 23,502,250 | 23,376,735 | ||||||||||||
5.15% | 03/20/28 | 2 | 240,876,000 | 240,374,255 | ||||||||||||
TDC Net A/S, |
| |||||||||||||||
(EMTN) |
| |||||||||||||||
(Germany) |
| |||||||||||||||
6.50% | 06/01/31 | 3 | 11,800,000 | 13,763,923 | ||||||||||||
Time Warner Cable LLC |
| |||||||||||||||
4.50% | 09/15/42 | 18,977,000 | 14,054,990 | |||||||||||||
5.50% | 09/01/41 | 37,297,000 | 31,078,994 | |||||||||||||
VZ Secured Financing BV |
| |||||||||||||||
(Netherlands) |
| |||||||||||||||
5.00% | 01/15/32 | 2,3 | 38,556,000 | 33,133,242 | ||||||||||||
VZ Secured Financing BV, |
| |||||||||||||||
Series REGS |
| |||||||||||||||
(Netherlands) |
| |||||||||||||||
3.50% | 01/15/32 | 3 | 30,755,000 | 29,203,810 | ||||||||||||
Zayo Group Holdings, Inc. |
| |||||||||||||||
4.00% | 03/01/27 | 2 | 3,817,000 | 3,145,315 | ||||||||||||
Ziggo BV |
| |||||||||||||||
(Netherlands) |
| |||||||||||||||
4.88% | 01/15/30 | 2,3 | 15,255,000 | 13,734,687 | ||||||||||||
|
| |||||||||||||||
| 943,991,884 | ||||||||||||||||
|
| |||||||||||||||
| Consumer Discretionary — 1.12% |
| |||||||||||||||
Altria Group, Inc. |
| |||||||||||||||
3.70% | 02/04/51 | 995,000 | 696,834 | |||||||||||||
Bacardi Ltd. |
| |||||||||||||||
(Bermuda) |
| |||||||||||||||
5.15% | 05/15/38 | 2,3 | 12,881,000 | 12,310,379 | ||||||||||||
5.30% | 05/15/48 | 2,3 | 3,831,000 | 3,622,932 | ||||||||||||
BAT Capital Corp. |
| |||||||||||||||
3.73% | 09/25/40 | 3,182,000 | 2,365,310 | |||||||||||||
4.39% | 08/15/37 | 16,468,000 | 13,851,360 | |||||||||||||
4.54% | 08/15/47 | 60,885,000 | 47,050,061 | |||||||||||||
4.76% | 09/06/49 | 25,502,000 | 20,318,153 | |||||||||||||
BAT International Finance PLC |
| |||||||||||||||
(EMTN) |
| |||||||||||||||
(United Kingdom) |
| |||||||||||||||
2.25% | 09/09/52 | 3 | 47,526,000 | 26,930,295 | ||||||||||||
4.00% | 11/23/55 | 3 | 8,700,000 | 7,128,044 | ||||||||||||
Everi Holdings, Inc. |
| |||||||||||||||
5.00% | 07/15/29 | 2 | 3,500,000 | 3,473,750 | ||||||||||||
| Issues | Maturity Date | Principal Amount | Value | |||||||||||||
CORPORATES (continued) |
| |||||||||||||||
Consumer Discretionary (continued) |
| |||||||||||||||
Imperial Brands Finance PLC |
| |||||||||||||||
(United Kingdom) |
| |||||||||||||||
3.13% | 07/26/24 | 2,3 | $ | 15,312,000 | $ | 15,181,118 | ||||||||||
3.50% | 07/26/26 | 2,3 | 40,000,000 | 38,190,331 | ||||||||||||
Philip Morris International, Inc. |
| |||||||||||||||
1.88% | 11/06/37 | 12,495,000 | 10,384,634 | |||||||||||||
Reynolds American, Inc. |
| |||||||||||||||
5.85% | 08/15/45 | 63,022,000 | 58,685,599 | |||||||||||||
Spectrum Brands, Inc. |
| |||||||||||||||
3.88% | 03/15/31 | 2 | 14,712,000 | 14,211,307 | ||||||||||||
Triton Water Holdings, Inc. |
| |||||||||||||||
6.25% | 04/01/29 | 2 | 8,390,000 | 7,660,238 | ||||||||||||
WarnerMedia Holdings, Inc. |
| |||||||||||||||
5.05% | 03/15/42 | 6,935,000 | 5,960,333 | |||||||||||||
5.14% | 03/15/52 | 304,615,000 | 253,216,711 | |||||||||||||
5.39% | 03/15/62 | 52,245,000 | 43,367,566 | |||||||||||||
|
| |||||||||||||||
| 584,604,955 | ||||||||||||||||
|
| |||||||||||||||
Consumer Products — 0.01% |
| |||||||||||||||
Newell Brands, Inc. |
| |||||||||||||||
7.00% | 04/01/46 | 3,935,000 | 3,181,725 | |||||||||||||
|
| |||||||||||||||
Diversified REITs — 0.82% |
| |||||||||||||||
American Tower Corp. |
| |||||||||||||||
0.95% | 10/05/30 | 22,201,000 | 20,285,305 | |||||||||||||
1.00% | 01/15/32 | 4,658,000 | 4,119,179 | |||||||||||||
1.88% | 10/15/30 | 13,336,000 | 10,823,398 | |||||||||||||
2.70% | 04/15/31 | 42,899,000 | 36,339,432 | |||||||||||||
5.55% | 07/15/33 | 20,425,000 | 20,599,292 | |||||||||||||
5.65% | 03/15/33 | 4,974,000 | 5,059,213 | |||||||||||||
CapitaLand Ascendas REIT |
| |||||||||||||||
(EMTN) |
| |||||||||||||||
(Slovenia) |
| |||||||||||||||
0.75% | 06/23/28 | 3 | 10,032,000 | 9,389,378 | ||||||||||||
Crown Castle, Inc. |
| |||||||||||||||
2.10% | 04/01/31 | 23,220,000 | 18,813,603 | |||||||||||||
Digital Dutch Finco BV |
| |||||||||||||||
(Netherlands) |
| |||||||||||||||
1.00% | 01/15/32 | 3 | 5,000,000 | 4,292,617 | ||||||||||||
1.25% | 02/01/31 | 3 | 26,308,000 | 23,628,966 | ||||||||||||
Digital Intrepid Holding BV |
| |||||||||||||||
(Netherlands) |
| |||||||||||||||
0.63% | 07/15/31 | 3 | 26,530,000 | 22,467,779 | ||||||||||||
1.38% | 07/18/32 | 3 | 22,395,000 | 19,623,579 | ||||||||||||
GLP Capital LP/GLP Financing II, Inc. |
| |||||||||||||||
3.25% | 01/15/32 | 8,388,000 | 7,110,759 | |||||||||||||
4.00% | 01/15/30 | 33,680,000 | 30,874,119 | |||||||||||||
4.00% | 01/15/31 | 7,310,000 | 6,538,659 | |||||||||||||
5.30% | 01/15/29 | 30,710,000 | 30,341,173 | |||||||||||||
5.38% | 04/15/26 | 20,098,000 | 19,936,310 | |||||||||||||
5.75% | 06/01/28 | 24,498,000 | 24,535,458 | |||||||||||||
VICI Properties LP |
| |||||||||||||||
4.95% | 02/15/30 | 9,655,000 | 9,336,964 | |||||||||||||
5.13% | 05/15/32 | 41,147,000 | 39,423,291 | |||||||||||||
VICI Properties LP/VICI Note Co., Inc. |
| |||||||||||||||
3.88% | 02/15/29 | 2 | 15,043,000 | 13,857,738 | ||||||||||||
4.13% | 08/15/30 | 2 | 3,627,000 | 3,299,845 | ||||||||||||
See accompanying Notes to Financial Statements.
| 173 / Annual Report March 2024 |
Table of Contents
Total Return Bond Fund
Schedule of Portfolio Investments
March 31, 2024
| Issues | Maturity Date | Principal Amount | Value | |||||||||||||
CORPORATES (continued) |
| |||||||||||||||
Diversified REITs (continued) |
| |||||||||||||||
4.50% | 01/15/28 | 2 | $ | 19,194,000 | $ | 18,437,624 | ||||||||||
Vonovia SE |
| |||||||||||||||
(Georgia) |
| |||||||||||||||
1.00% | 06/16/33 | 3 | 3,300,000 | 2,696,185 | ||||||||||||
2.25% | 04/07/30 | 3 | 4,500,000 | 4,414,309 | ||||||||||||
Vonovia SE |
| |||||||||||||||
(EMTN) |
| |||||||||||||||
(Georgia) |
| |||||||||||||||
0.75% | 09/01/32 | 3 | 6,600,000 | 5,414,962 | ||||||||||||
Vonovia SE, |
| |||||||||||||||
(EMTN) |
| |||||||||||||||
(Georgia) |
| |||||||||||||||
5.00% | 11/23/30 | 3 | 11,700,000 | 13,296,105 | ||||||||||||
|
| |||||||||||||||
| 424,955,242 | ||||||||||||||||
|
| |||||||||||||||
Electric — 1.61% |
| |||||||||||||||
Alliant Energy Finance LLC |
| |||||||||||||||
5.95% | 03/30/29 | 2 | 4,120,000 | 4,248,108 | ||||||||||||
Alliant Energy Finance, LLC |
| |||||||||||||||
3.60% | 03/01/32 | 2 | 4,515,000 | 4,001,023 | ||||||||||||
American Electric Power Co., Inc. |
| |||||||||||||||
5.75% | 11/01/27 | 7,930,000 | 8,116,411 | |||||||||||||
Appalachian Power Co. |
| |||||||||||||||
4.45% | 06/01/45 | 100,000 | 83,020 | |||||||||||||
5.65% | 04/01/34 | 18,900,000 | 19,082,584 | |||||||||||||
Appalachian Power Co., |
| |||||||||||||||
Series Z |
| |||||||||||||||
3.70% | 05/01/50 | 9,450,000 | 6,730,530 | |||||||||||||
Arizona Public Service Co. |
| |||||||||||||||
6.35% | 12/15/32 | 20,904,000 | 22,335,072 | |||||||||||||
Black Hills Corp. |
| |||||||||||||||
4.35% | 05/01/33 | 2,785,000 | 2,551,450 | |||||||||||||
6.15% | 05/15/34 | 8,020,000 | 8,280,344 | |||||||||||||
Comision Federal de Electricidad, |
| |||||||||||||||
Series REGS |
| |||||||||||||||
(Mexico) |
| |||||||||||||||
3.88% | 07/26/33 | 3 | 4,340,000 | 3,532,760 | ||||||||||||
Duke Energy Carolinas LLC |
| |||||||||||||||
4.00% | 09/30/42 | 11,040,000 | 9,241,521 | |||||||||||||
4.25% | 12/15/41 | 14,683,000 | 12,660,987 | |||||||||||||
5.35% | 01/15/53 | 8,611,000 | 8,518,240 | |||||||||||||
5.40% | 01/15/54 | 25,000,000 | 24,897,463 | |||||||||||||
Duke Energy Corp. |
| |||||||||||||||
3.85% | 06/15/34 | 86,657,000 | 92,919,935 | |||||||||||||
Duke Energy Florida LLC |
| |||||||||||||||
5.88% | 11/15/33 | 17,960,000 | 19,011,594 | |||||||||||||
6.20% | 11/15/53 | 35,000,000 | 38,687,831 | |||||||||||||
Duke Energy Progress LLC |
| |||||||||||||||
5.35% | 03/15/53 | 5,000,000 | 4,893,207 | |||||||||||||
Eversource Energy |
| |||||||||||||||
5.95% | 02/01/29 | 8,980,000 | 9,276,459 | |||||||||||||
FirstEnergy Pennsylvania Electric Co. |
| |||||||||||||||
3.25% | 03/15/28 | 2 | 125,000 | 115,801 | ||||||||||||
4.00% | 04/15/25 | 2 | 35,719,000 | 34,853,147 | ||||||||||||
4.15% | 04/15/25 | 2 | 28,335,000 | 27,857,834 | ||||||||||||
4.30% | 01/15/29 | 2 | 18,381,000 | 17,775,951 | ||||||||||||
| Issues | Maturity Date | Principal Amount | Value | |||||||||||||
CORPORATES (continued) |
| |||||||||||||||
Electric (continued) |
| |||||||||||||||
5.15% | 03/30/26 | 2 | $ | 3,000,000 | $ | 2,976,370 | ||||||||||
FirstEnergy Transmission LLC |
| |||||||||||||||
2.87% | 09/15/28 | 2 | 50,514,000 | 46,090,945 | ||||||||||||
4.35% | 01/15/25 | 2 | 23,330,000 | 23,051,238 | ||||||||||||
4.55% | 04/01/49 | 2 | 5,175,000 | 4,383,450 | ||||||||||||
5.45% | 07/15/44 | 2 | 24,625,000 | 23,491,505 | ||||||||||||
Interstate Power and Light Co. |
| |||||||||||||||
5.70% | 10/15/33 | 15,980,000 | 16,388,586 | |||||||||||||
Jersey Central Power & Light Co. |
| |||||||||||||||
2.75% | 03/01/32 | 2 | 820,000 | 685,384 | ||||||||||||
4.30% | 01/15/26 | 2 | 8,645,000 | 8,453,084 | ||||||||||||
4.70% | 04/01/24 | 2 | 49,765,000 | 49,765,000 | ||||||||||||
6.40% | 05/15/36 | 10,780,000 | 11,309,387 | |||||||||||||
Mong Duong Finance Holdings BV, |
| |||||||||||||||
Series REGS |
| |||||||||||||||
(Netherlands) |
| |||||||||||||||
5.13% | 05/07/29 | 3 | 1,683,180 | 1,610,425 | ||||||||||||
New England Power Co. |
| |||||||||||||||
5.94% | 11/25/52 | 2 | 20,670,000 | 21,516,168 | ||||||||||||
Niagara Mohawk Power Corp. |
| |||||||||||||||
3.03% | 06/27/50 | 2 | 3,543,000 | 2,273,720 | ||||||||||||
4.28% | 10/01/34 | 2 | 4,375,000 | 3,925,292 | ||||||||||||
Public Service Co. of New Mexico |
| |||||||||||||||
3.85% | 08/01/25 | 14,390,000 | 14,067,806 | |||||||||||||
Southwestern Electric Power Co. |
| |||||||||||||||
3.25% | 11/01/51 | 6,519,000 | 4,332,223 | |||||||||||||
5.30% | 04/01/33 | 47,200,000 | 46,649,594 | |||||||||||||
Southwestern Electric Power Co., |
| |||||||||||||||
Series K |
| |||||||||||||||
2.75% | 10/01/26 | 26,488,000 | 24,843,787 | |||||||||||||
Southwestern Electric Power Co., |
| |||||||||||||||
Series L |
| |||||||||||||||
3.85% | 02/01/48 | 19,395,000 | 14,284,355 | |||||||||||||
TenneT Holding BV |
| |||||||||||||||
(EMTN) |
| |||||||||||||||
(Netherlands) |
| |||||||||||||||
2.75% | 05/17/42 | 3 | 38,400,000 | 38,898,345 | ||||||||||||
4.50% | 10/28/34 | 3 | 18,555,000 | 22,034,523 | ||||||||||||
4.75% | 10/28/42 | 3 | 61,891,000 | 76,902,995 | ||||||||||||
|
| |||||||||||||||
| 837,605,454 | ||||||||||||||||
|
| |||||||||||||||
Energy — 0.74% |
| |||||||||||||||
Boston Gas Co. |
| |||||||||||||||
3.76% | 03/16/32 | 2 | 25,917,000 | 22,857,173 | ||||||||||||
6.12% | 07/20/53 | 2 | 13,275,000 | 13,587,242 | ||||||||||||
Brooklyn Union Gas Co. (The) |
| |||||||||||||||
6.39% | 09/15/33 | 2 | 35,000,000 | 36,320,245 | ||||||||||||
Ecopetrol SA |
| |||||||||||||||
(Colombia) |
| |||||||||||||||
8.88% | 01/13/33 | 3 | 5,000,000 | 5,291,785 | ||||||||||||
Energy Transfer LP |
| |||||||||||||||
5.00% | 05/15/50 | 390,000 | 342,411 | |||||||||||||
5.40% | 10/01/47 | 10,088,000 | 9,326,102 | |||||||||||||
Galaxy Pipeline Assets Bidco Ltd. |
| |||||||||||||||
(United Kingdom) |
| |||||||||||||||
2.16% | 03/31/34 | 2,3 | 16,812,966 | 14,492,782 | ||||||||||||
See accompanying Notes to Financial Statements.
| Annual Report March 2024 / 174 |
Table of Contents
Total Return Bond Fund
Schedule of Portfolio Investments
March 31, 2024
| Issues | Maturity Date | Principal Amount | Value | |||||||||||||
CORPORATES (continued) |
| |||||||||||||||
Energy (continued) |
| |||||||||||||||
KazMunayGas National Co. JSC |
| |||||||||||||||
(Kazakhstan) |
| |||||||||||||||
3.50% | 04/14/33 | 2,3 | $ | 1,800,000 | $ | 1,501,020 | ||||||||||
| KazMunayGas National Co. JSC, |
| |||||||||||||||
Series REGS |
| |||||||||||||||
(Kazakhstan) |
| |||||||||||||||
3.50% | 04/14/33 | 3 | 15,883,000 | 13,244,834 | ||||||||||||
4.75% | 04/19/27 | 3 | 3,195,000 | 3,113,527 | ||||||||||||
| KazMunayGas National Co. JSC, |
| |||||||||||||||
Series REGS (EMTN) |
| |||||||||||||||
(Kazakhstan) |
| |||||||||||||||
5.38% | 04/24/30 | 3 | 6,856,000 | 6,739,119 | ||||||||||||
KeySpan Gas East Corp. |
| |||||||||||||||
5.99% | 03/06/33 | 2 | 5,530,000 | 5,615,478 | ||||||||||||
Kinder Morgan, Inc. |
| |||||||||||||||
(GMTN) |
| |||||||||||||||
7.80% | 08/01/31 | 150,000 | 170,395 | |||||||||||||
| National Gas Transmission PLC, |
| |||||||||||||||
(EMTN) |
| |||||||||||||||
(United Kingdom) |
| |||||||||||||||
4.25% | 04/05/30 | 3 | 26,895,000 | 29,909,656 | ||||||||||||
Pertamina Persero PT |
| |||||||||||||||
(Indonesia) |
| |||||||||||||||
3.10% | 08/27/30 | 2,3 | 34,071,000 | 30,169,871 | ||||||||||||
Petroleos Mexicanos |
| |||||||||||||||
(Mexico) |
| |||||||||||||||
6.35% | 02/12/48 | 3 | 9,556,000 | 6,104,982 | ||||||||||||
6.75% | 09/21/47 | 3 | 35,807,000 | 23,740,041 | ||||||||||||
Piedmont Natural Gas Co., Inc. |
| |||||||||||||||
2.50% | 03/15/31 | 7,272,000 | 6,146,996 | |||||||||||||
5.40% | 06/15/33 | 10,545,000 | 10,661,053 | |||||||||||||
QazaqGaz NC JSC, |
| |||||||||||||||
Series REGS |
| |||||||||||||||
(Kazakhstan) |
| |||||||||||||||
4.38% | 09/26/27 | 3 | 6,350,000 | 5,988,685 | ||||||||||||
Rockies Express Pipeline LLC |
| |||||||||||||||
4.80% | 05/15/30 | 2 | 1,905,000 | 1,769,745 | ||||||||||||
6.88% | 04/15/40 | 2 | 15,140,000 | 14,931,825 | ||||||||||||
Southern Co. Gas Capital Corp. |
| |||||||||||||||
4.40% | 05/30/47 | 50,000 | 41,623 | |||||||||||||
5.15% | 09/15/32 | 6,370,000 | 6,404,538 | |||||||||||||
5.75% | 09/15/33 | 20,800,000 | 21,589,584 | |||||||||||||
Southern Gas Corridor CJSC, |
| |||||||||||||||
Series REGS |
| |||||||||||||||
(Azerbaijan) |
| |||||||||||||||
6.88% | 03/24/26 | 3 | 16,442,000 | 16,639,304 | ||||||||||||
TC PipeLines LP |
| |||||||||||||||
4.38% | 03/13/25 | 2,198,000 | 2,170,461 | |||||||||||||
TransCanada PipeLines Ltd. |
| |||||||||||||||
(Canada) |
| |||||||||||||||
4.63% | 03/01/34 | 3 | 13,715,000 | 12,969,009 | ||||||||||||
5.85% | 03/15/36 | 3 | 2,878,000 | 2,962,457 | ||||||||||||
| TransMontaigne Partners LP/TLP Finance Corp. |
| |||||||||||||||
6.13% | 02/15/26 | 34,635,000 | 33,119,719 | |||||||||||||
Venture Global LNG, Inc. |
| |||||||||||||||
9.50% | 02/01/29 | 2 | 18,223,000 | 19,658,529 | ||||||||||||
| Issues | Maturity Date | Principal Amount | Value | |||||||||||||
CORPORATES (continued) |
| |||||||||||||||
Energy (continued) |
| |||||||||||||||
9.88% | 02/01/32 | 2 | $ | 8,298,000 | $ | 8,951,527 | ||||||||||
|
| |||||||||||||||
| 386,531,718 | ||||||||||||||||
|
| |||||||||||||||
Finance — 2.66% |
| |||||||||||||||
| AerCap Ireland Capital DAC/AerCap Global Aviation Trust |
| |||||||||||||||
(Ireland) |
| |||||||||||||||
2.45% | 10/29/26 | 3 | 21,203,000 | 19,705,160 | ||||||||||||
3.00% | 10/29/28 | 3 | 63,242,000 | 57,256,049 | ||||||||||||
3.30% | 01/30/32 | 3 | 105,825,000 | 90,713,719 | ||||||||||||
Air Lease Corp. |
| |||||||||||||||
2.20% | 01/15/27 | 23,695,000 | 21,816,938 | |||||||||||||
3.25% | 03/01/25 | 19,930,000 | 19,461,104 | |||||||||||||
3.25% | 10/01/29 | 5,000,000 | 4,532,197 | |||||||||||||
4.25% | 09/15/24 | 5,554,000 | 5,515,108 | |||||||||||||
4.63% | 10/01/28 | 2,000,000 | 1,947,501 | |||||||||||||
Air Lease Corp. |
| |||||||||||||||
(MTN) |
| |||||||||||||||
2.30% | 02/01/25 | 35,195,000 | 34,188,812 | |||||||||||||
2.88% | 01/15/26 | 10,055,000 | 9,620,856 | |||||||||||||
3.00% | 02/01/30 | 2,000,000 | 1,770,170 | |||||||||||||
Alta Wind Holdings LLC |
| |||||||||||||||
7.00% | 06/30/35 | 2,4,5 | 2,963,214 | 3,030,429 | ||||||||||||
Avolon Holdings Funding Ltd. |
| |||||||||||||||
(Cayman Islands) |
| |||||||||||||||
2.53% | 11/18/27 | 2,3 | 171,755,000 | 152,847,347 | ||||||||||||
2.88% | 02/15/25 | 2,3 | 20,755,000 | 20,205,989 | ||||||||||||
3.25% | 02/15/27 | 2,3 | 12,880,000 | 11,993,212 | ||||||||||||
3.95% | 07/01/24 | 2,3 | 35,499,000 | 35,305,082 | ||||||||||||
4.38% | 05/01/26 | 2,3 | 7,405,000 | 7,165,981 | ||||||||||||
Citigroup, Inc. |
| |||||||||||||||
1.46% | 06/09/27 | 6 | 28,281,000 | 25,974,294 | ||||||||||||
2.52% | 11/03/32 | 6 | 25,568,000 | 21,007,700 | ||||||||||||
2.57% | 06/03/31 | 6 | 868,000 | 741,951 | ||||||||||||
2.67% | 01/29/31 | 6 | 3,838,000 | 3,329,917 | ||||||||||||
2.98% | 11/05/30 | 6 | 5,739,000 | 5,099,989 | ||||||||||||
3.06% | 01/25/33 | 6 | 53,760,000 | 45,701,171 | ||||||||||||
3.98% | 03/20/30 | 6 | 3,965,000 | 3,738,685 | ||||||||||||
6.04% | 10/30/24 | 6 | 672,000 | 672,960 | ||||||||||||
EverBank Financial Corp. |
| |||||||||||||||
5.75% | 07/02/25 | 4,045,000 | 3,798,694 | |||||||||||||
Gaci First Investment Co. |
| |||||||||||||||
(Cayman Islands) |
| |||||||||||||||
5.25% | 10/13/32 | 3 | 6,400,000 | 6,473,190 | ||||||||||||
GGAM Finance Ltd. |
| |||||||||||||||
(Cayman Islands) |
| |||||||||||||||
8.00% | 06/15/28 | 2,3 | 12,949,000 | 13,515,519 | ||||||||||||
Goldman Sachs Group, Inc. (The) |
| |||||||||||||||
1.43% | 03/09/27 | 6 | 97,484,000 | 90,308,604 | ||||||||||||
1.54% | 09/10/27 | 6 | 97,458,000 | 89,063,321 | ||||||||||||
1.95% | 10/21/27 | 6 | 1,337,000 | 1,229,866 | ||||||||||||
2.38% | 07/21/32 | 6 | 449,000 | 368,367 | ||||||||||||
3.27% | 09/29/25 | 6 | 27,707,000 | 27,378,344 | ||||||||||||
3.50% | 04/01/25 | 31,914,000 | 31,321,514 | |||||||||||||
(SOFR Rate plus 0.49%) |
| |||||||||||||||
5.84% | 10/21/24 | 1 | 77,465,000 | 77,517,105 | ||||||||||||
See accompanying Notes to Financial Statements.
| 175 / Annual Report March 2024 |
Table of Contents
Total Return Bond Fund
Schedule of Portfolio Investments
March 31, 2024
| Issues | Maturity Date | Principal Amount | Value | |||||||||||||
CORPORATES (continued) |
| |||||||||||||||
Finance (continued) |
| |||||||||||||||
| Icahn Enterprises LP/Icahn Enterprises Finance Corp. |
| |||||||||||||||
4.38% | 02/01/29 | $ | 18,068,000 | $ | 15,444,707 | |||||||||||
9.75% | 01/15/29 | 2 | 17,562,000 | 18,329,898 | ||||||||||||
| Morgan Stanley |
| |||||||||||||||
0.79% | 05/30/25 | 6 | 64,230,000 | 63,637,403 | ||||||||||||
0.99% | 12/10/26 | 6 | 15,176,000 | 14,068,780 | ||||||||||||
1.59% | 05/04/27 | 6 | 4,653,000 | 4,304,785 | ||||||||||||
2.48% | 09/16/36 | 6 | 35,169,000 | 27,810,630 | ||||||||||||
5.30% | 04/20/37 | 6 | 1,801,000 | 1,731,659 | ||||||||||||
| Morgan Stanley |
| |||||||||||||||
| (GMTN) |
| |||||||||||||||
1.51% | 07/20/27 | 6 | 1,000,000 | 918,130 | ||||||||||||
2.24% | 07/21/32 | 6 | 52,964,000 | 43,250,543 | ||||||||||||
| Morgan Stanley |
| |||||||||||||||
| (MTN) |
| |||||||||||||||
1.16% | 10/21/25 | 6 | 162,926,000 | 158,690,928 | ||||||||||||
1.79% | 02/13/32 | 6 | 6,428,000 | 5,140,181 | ||||||||||||
1.93% | 04/28/32 | 6 | 2,890,000 | 2,320,296 | ||||||||||||
2.63% | 02/18/26 | 6 | 11,200,000 | 10,903,222 | ||||||||||||
| Nationwide Building Society |
| |||||||||||||||
| (United Kingdom) |
| |||||||||||||||
2.97% | 02/16/28 | 2,3,6 | 64,520,000 | 60,215,221 | ||||||||||||
4.30% | 03/08/29 | 2,3,6 | 13,000,000 | 12,466,073 | ||||||||||||
|
| |||||||||||||||
| 1,383,549,301 | ||||||||||||||||
|
| |||||||||||||||
Food — 0.83% |
| |||||||||||||||
| ELO SACA |
| |||||||||||||||
| (EMTN) |
| |||||||||||||||
| (France) |
| |||||||||||||||
6.00% | 03/22/29 | 3 | 30,500,000 | 33,434,697 | ||||||||||||
| JBS USA LUX SA/JBS USA Food Co./JBS Luxembourg Sarl |
| |||||||||||||||
| (Canada) |
| |||||||||||||||
6.75% | 03/15/34 | 2,3 | 111,146,000 | 116,892,836 | ||||||||||||
7.25% | 11/15/53 | 2,3 | 5,461,000 | 5,873,405 | ||||||||||||
| JBS USA LUX SA/JBS USA Food Co./JBS USA Finance, Inc. |
| |||||||||||||||
| (Canada) |
| |||||||||||||||
3.00% | 05/15/32 | 3 | 5,000,000 | 4,065,008 | ||||||||||||
3.75% | 12/01/31 | 3 | 22,699,000 | 19,682,672 | ||||||||||||
4.38% | 02/02/52 | 3 | 69,462,000 | 50,363,954 | ||||||||||||
5.50% | 01/15/30 | 3 | 16,622,000 | 16,391,629 | ||||||||||||
6.50% | 12/01/52 | 3 | 7,475,000 | 7,405,546 | ||||||||||||
| Pilgrim’s Pride Corp. |
| |||||||||||||||
3.50% | 03/01/32 | 85,672,000 | 72,720,717 | |||||||||||||
4.25% | 04/15/31 | 1,429,000 | 1,290,764 | |||||||||||||
6.25% | 07/01/33 | 44,546,000 | 45,641,439 | |||||||||||||
6.88% | 05/15/34 | 6,810,000 | 7,269,720 | |||||||||||||
| Simmons Foods, Inc./Simmons Prepared Foods, Inc./ |
| |||||||||||||||
| Simmons Pet Food, Inc./Simmons Feed |
| |||||||||||||||
4.63% | 03/01/29 | 2 | 10,731,000 | 9,503,672 | ||||||||||||
| Smithfield Foods, Inc. |
| |||||||||||||||
2.63% | 09/13/31 | 2 | 14,435,000 | 11,312,163 | ||||||||||||
3.00% | 10/15/30 | 2 | 8,890,000 | 7,383,836 | ||||||||||||
4.25% | 02/01/27 | 2 | 24,855,000 | 23,901,918 | ||||||||||||
|
| |||||||||||||||
| 433,133,976 | ||||||||||||||||
|
| |||||||||||||||
| Issues | Maturity Date | Principal Amount | Value | |||||||||||||
CORPORATES (continued) |
| |||||||||||||||
Health Care — 1.56% |
| |||||||||||||||
| 1375209 BC Ltd. |
| |||||||||||||||
| (Canada) |
| |||||||||||||||
9.00% | 01/30/28 | 2,3 | $ | 35,559,000 | $ | 34,886,499 | ||||||||||
| Bayer U.S. Finance II LLC |
| |||||||||||||||
2.85% | 04/15/25 | 2 | 2,805,000 | 2,710,676 | ||||||||||||
3.95% | 04/15/45 | 2 | 17,489,000 | 12,421,232 | ||||||||||||
4.38% | 12/15/28 | 2 | 84,521,000 | 79,597,092 | ||||||||||||
4.40% | 07/15/44 | 2 | 69,196,000 | 53,031,464 | ||||||||||||
4.63% | 06/25/38 | 2 | 46,534,000 | 38,766,289 | ||||||||||||
4.88% | 06/25/48 | 2 | 44,314,000 | 35,644,682 | ||||||||||||
5.50% | 08/15/25 | 2 | 13,932,000 | 13,828,990 | ||||||||||||
5.50% | 07/30/35 | 2 | 3,820,000 | 3,594,203 | ||||||||||||
| Bayer U.S. Finance LLC |
| |||||||||||||||
6.50% | 11/21/33 | 2 | 17,750,000 | 18,064,991 | ||||||||||||
6.88% | 11/21/53 | 2 | 28,175,000 | 28,958,416 | ||||||||||||
| Becton Dickinson & Co. |
| |||||||||||||||
3.36% | 06/06/24 | 1,013,000 | 1,008,702 | |||||||||||||
| Catalent Pharma Solutions, Inc. |
| |||||||||||||||
3.50% | 04/01/30 | 2 | 17,205,000 | 16,401,005 | ||||||||||||
| Catalent Pharma Solutions, Inc., |
| |||||||||||||||
| Series REGS |
| |||||||||||||||
2.38% | 03/01/28 | 16,070,000 | 16,515,529 | |||||||||||||
| Centene Corp. |
| |||||||||||||||
3.00% | 10/15/30 | 90,980,000 | 78,086,933 | |||||||||||||
| Embecta Corp. |
| |||||||||||||||
6.75% | 02/15/30 | 2 | 20,239,000 | 17,707,314 | ||||||||||||
| Fresenius Finance Ireland PLC |
| |||||||||||||||
| (EMTN) |
| |||||||||||||||
| (Ireland) |
| |||||||||||||||
0.88% | 10/01/31 | 3 | 7,910,000 | 6,952,658 | ||||||||||||
| Fresenius Medical Care U.S. Finance III, Inc. |
| |||||||||||||||
1.88% | 12/01/26 | 2 | 67,592,000 | 61,193,898 | ||||||||||||
| Grifols SA, |
| |||||||||||||||
| Series REGS |
| |||||||||||||||
| (Spain) |
| |||||||||||||||
1.63% | 02/15/25 | 3 | 1,900,000 | 1,959,088 | ||||||||||||
3.20% | 05/01/25 | 3 | 33,210,000 | 33,133,965 | ||||||||||||
3.88% | 10/15/28 | 3 | 48,610,000 | 41,612,255 | ||||||||||||
| HCA, Inc. |
| |||||||||||||||
2.38% | 07/15/31 | 563,000 | 463,690 | |||||||||||||
5.25% | 06/15/26 | 20,209,000 | 20,155,637 | |||||||||||||
5.25% | 06/15/49 | 66,501,000 | 60,745,067 | |||||||||||||
5.88% | 02/15/26 | 3,915,000 | 3,931,654 | |||||||||||||
| Illumina, Inc. |
| |||||||||||||||
2.55% | 03/23/31 | 200,000 | 165,560 | |||||||||||||
5.75% | 12/13/27 | 4,480,000 | 4,537,164 | |||||||||||||
| Kedrion SpA |
| |||||||||||||||
| (Italy) |
| |||||||||||||||
6.50% | 09/01/29 | 2,3 | 36,805,000 | 33,581,729 | ||||||||||||
| Medtronic Global Holdings SCA |
| |||||||||||||||
| (Luxembourg) |
| |||||||||||||||
3.38% | 10/15/34 | 3 | 195,000 | 211,200 | ||||||||||||
| ModivCare Escrow Issuer, Inc. |
| |||||||||||||||
5.00% | 10/01/29 | 2 | 40,661,000 | 29,534,661 | ||||||||||||
| ModivCare, Inc. |
| |||||||||||||||
5.88% | 11/15/25 | 2 | 5,835,000 | 5,687,824 | ||||||||||||
See accompanying Notes to Financial Statements.
| Annual Report March 2024 / 176 |
Table of Contents
Total Return Bond Fund
Schedule of Portfolio Investments
March 31, 2024
| Issues | Maturity Date | Principal Amount | Value | |||||||||||||
CORPORATES (continued) |
| |||||||||||||||
Health Care (continued) |
| |||||||||||||||
| Premier Health Partners, |
| |||||||||||||||
| Series G |
| |||||||||||||||
2.91% | 11/15/26 | $ | 2,229,000 | $ | 2,049,635 | |||||||||||
| Revvity, Inc. |
| |||||||||||||||
0.85% | 09/15/24 | 12,935,000 | 12,640,578 | |||||||||||||
| Royalty Pharma PLC |
| |||||||||||||||
| (United Kingdom) |
| |||||||||||||||
1.75% | 09/02/27 | 3 | 1,295,000 | 1,151,407 | ||||||||||||
| Sartorius Finance BV |
| |||||||||||||||
| (Netherlands) |
| |||||||||||||||
4.88% | 09/14/35 | 3 | 1,200,000 | 1,399,466 | ||||||||||||
| Universal Health Services, Inc. |
| |||||||||||||||
1.65% | 09/01/26 | 45,000,000 | 41,027,456 | |||||||||||||
|
| |||||||||||||||
| 813,358,609 | ||||||||||||||||
|
| |||||||||||||||
Health Care REITs — 0.22% |
| |||||||||||||||
| DOC DR LLC |
| |||||||||||||||
2.63% | 11/01/31 | 4,632,000 | 3,819,629 | |||||||||||||
3.95% | 01/15/28 | 1,245,000 | 1,190,256 | |||||||||||||
4.30% | 03/15/27 | 8,717,000 | 8,536,769 | |||||||||||||
| Healthcare Reality Holdings LP |
| |||||||||||||||
2.00% | 03/15/31 | 767,000 | 610,387 | |||||||||||||
3.10% | 02/15/30 | 35,467,000 | 30,847,773 | |||||||||||||
| Healthcare Realty Holdings LP |
| |||||||||||||||
2.05% | 03/15/31 | 20,129,000 | 15,620,915 | |||||||||||||
2.40% | 03/15/30 | 29,082,000 | 23,831,937 | |||||||||||||
3.63% | 01/15/28 | 25,359,000 | 23,453,329 | |||||||||||||
3.88% | 05/01/25 | 9,381,000 | 9,176,255 | |||||||||||||
|
| |||||||||||||||
| 117,087,250 | ||||||||||||||||
|
| |||||||||||||||
Industrial REITs — 0.10% |
| |||||||||||||||
| LXP Industrial Trust |
| |||||||||||||||
6.75% | 11/15/28 | 4,015,000 | 4,191,769 | |||||||||||||
| Prologis Euro Finance LLC |
| |||||||||||||||
0.50% | 02/16/32 | 11,611,000 | 9,827,978 | |||||||||||||
1.00% | 02/16/41 | 5,698,000 | 3,909,948 | |||||||||||||
| Prologis Euro Finance LLC, |
| |||||||||||||||
| (EMTN) |
| |||||||||||||||
4.25% | 01/31/43 | 30,738,000 | 33,514,985 | |||||||||||||
|
| |||||||||||||||
| 51,444,680 | ||||||||||||||||
|
| |||||||||||||||
Industrials — 0.70% |
| |||||||||||||||
| Ardagh Packaging Finance PLC/Ardagh Holdings USA, Inc. |
| |||||||||||||||
| (Canada) |
| |||||||||||||||
4.13% | 08/15/26 | 2,3 | 4,950,000 | 4,496,156 | ||||||||||||
5.25% | 08/15/27 | 2,3 | 66,603,000 | 42,009,623 | ||||||||||||
| Ardagh Packaging Finance PLC/Ardagh Holdings USA, Inc., |
| |||||||||||||||
| Series REGS |
| |||||||||||||||
| (Canada) |
| |||||||||||||||
2.13% | 08/15/26 | 3 | 3,470,000 | 3,233,167 | ||||||||||||
| Berry Global, Inc. |
| |||||||||||||||
1.57% | 01/15/26 | 42,992,000 | 40,262,950 | |||||||||||||
1.65% | 01/15/27 | 16,949,000 | 15,397,059 | |||||||||||||
4.88% | 07/15/26 | 2 | 82,131,000 | 80,548,648 | ||||||||||||
5.65% | 01/15/34 | 2 | 1,570,000 | 1,563,246 | ||||||||||||
| Boeing Co. (The) |
| |||||||||||||||
4.88% | 05/01/25 | 19,940,000 | 19,721,835 | |||||||||||||
| Issues | Maturity Date | Principal Amount | Value | |||||||||||||
CORPORATES (continued) |
| |||||||||||||||
Industrials (continued) |
| |||||||||||||||
5.81% | 05/01/50 | $ | 35,720,000 | $ | 33,828,877 | |||||||||||
5.93% | 05/01/60 | 15,000,000 | 14,081,035 | |||||||||||||
| General Electric Co. |
| |||||||||||||||
| (MTN) |
| |||||||||||||||
| (CME Term SOFR 3-Month plus 0.64%) |
| |||||||||||||||
5.91% | 05/05/26 | 1 | 1,785,000 | 1,790,246 | ||||||||||||
| (CME Term SOFR 3-Month plus 0.74%) |
| |||||||||||||||
6.05% | 08/15/36 | 1 | 11,550,000 | 10,727,743 | ||||||||||||
| Honeywell International, Inc. |
| |||||||||||||||
3.75% | 03/01/36 | 47,920,000 | 52,304,446 | |||||||||||||
| L3Harris Technologies, Inc. |
| |||||||||||||||
3.95% | 05/28/24 | 12,890,000 | 12,855,257 | |||||||||||||
| OT Merger Corp. |
| |||||||||||||||
7.88% | 10/15/29 | 2 | 30,592,000 | 22,069,449 | ||||||||||||
| Trivium Packaging Finance BV |
| |||||||||||||||
| (Netherlands) |
| |||||||||||||||
8.50% | 08/15/27 | 2,3 | 7,578,000 | 7,502,220 | ||||||||||||
|
| |||||||||||||||
| 362,391,957 | ||||||||||||||||
|
| |||||||||||||||
Information Technology — 0.01% |
| |||||||||||||||
| Open Text Corp. |
| |||||||||||||||
| (Canada) |
| |||||||||||||||
6.90% | 12/01/27 | 2,3 | 3,061,000 | 3,160,176 | ||||||||||||
|
| |||||||||||||||
Insurance — 1.07% |
| |||||||||||||||
| Athene Global Funding |
| |||||||||||||||
1.61% | 06/29/26 | 2 | 61,330,000 | 56,300,770 | ||||||||||||
1.99% | 08/19/28 | 2 | 11,040,000 | 9,563,921 | ||||||||||||
| (SOFR Index plus 0.70%) |
| |||||||||||||||
6.06% | 05/24/24 | 1,2 | 120,615,000 | 120,753,164 | ||||||||||||
| Farmers Exchange Capital |
| |||||||||||||||
7.05% | 07/15/28 | 2 | 13,283,000 | 13,427,195 | ||||||||||||
7.20% | 07/15/48 | 2 | 18,415,000 | 17,015,697 | ||||||||||||
| Farmers Exchange Capital II |
| |||||||||||||||
6.15% | 11/01/53 | 2,6 | 59,331,000 | 52,992,390 | ||||||||||||
| Farmers Exchange Capital III |
| |||||||||||||||
5.45% | 10/15/54 | 2,6 | 80,605,000 | 66,726,020 | ||||||||||||
| Farmers Insurance Exchange |
| |||||||||||||||
4.75% | 11/01/57 | 2,6 | 23,060,000 | 17,119,986 | ||||||||||||
| Metropolitan Life Global Funding I |
| |||||||||||||||
3.30% | 03/21/29 | 2 | 16,005,000 | 14,836,875 | ||||||||||||
4.30% | 08/25/29 | 2 | 6,940,000 | 6,694,377 | ||||||||||||
| Nationwide Mutual Insurance Co. |
| |||||||||||||||
7.88% | 12/15/24 | 2,6 | 42,571,000 | 42,574,948 | ||||||||||||
| Protective Life Global Funding |
| |||||||||||||||
1.90% | 07/06/28 | 2 | 47,980,000 | 42,693,125 | ||||||||||||
| Teachers Insurance & Annuity Association of America |
| |||||||||||||||
3.30% | 05/15/50 | 2 | 82,665,000 | 58,026,051 | ||||||||||||
4.27% | 05/15/47 | 2 | 3,496,000 | 2,906,059 | ||||||||||||
4.38% | 09/15/54 | 2,6 | 35,635,000 | 35,068,088 | ||||||||||||
|
| |||||||||||||||
| 556,698,666 | ||||||||||||||||
|
| |||||||||||||||
Materials — 0.36% |
| |||||||||||||||
| Corp. Nacional del Cobre de Chile, |
| |||||||||||||||
| Series REGS |
| |||||||||||||||
| (Chile) |
| |||||||||||||||
5.13% | 02/02/33 | 3 | 11,110,000 | 10,570,054 | ||||||||||||
See accompanying Notes to Financial Statements.
| 177 / Annual Report March 2024 |
Table of Contents
Total Return Bond Fund
Schedule of Portfolio Investments
March 31, 2024
| Issues | Maturity Date | Principal Amount | Value | |||||||||||
CORPORATES (continued) |
| |||||||||||||
| Materials (continued) |
| |||||||||||||
| Indonesia Asahan Aluminium PT/Mineral Industri Indonesia Persero PT, |
| |||||||||||||
| Series REGS |
| |||||||||||||
| (Indonesia) |
| |||||||||||||
5.45% | 05/15/30 | 3 | $ | 14,861,000 | $ | 14,706,446 | ||||||||
| International Flavors & Fragrances, Inc. |
| |||||||||||||
1.83% | 10/15/27 | 2 | 1,615,000 | 1,433,427 | ||||||||||
2.30% | 11/01/30 | 2 | 68,565,000 | 56,988,268 | ||||||||||
3.27% | 11/15/40 | 2 | 10,351,000 | 7,376,526 | ||||||||||
3.47% | 12/01/50 | 2 | 9,947,000 | 6,634,665 | ||||||||||
5.00% | 09/26/48 | 104,037,000 | 89,045,228 | |||||||||||
|
| |||||||||||||
| 186,754,614 | ||||||||||||||
|
| |||||||||||||
Office REITs — 0.19% |
| |||||||||||||
| Hudson Pacific Properties LP |
| |||||||||||||
3.25% | 01/15/30 | 58,668,000 | 45,279,435 | |||||||||||
3.95% | 11/01/27 | 17,035,000 | 15,107,103 | |||||||||||
4.65% | 04/01/29 | 21,870,000 | 18,653,264 | |||||||||||
| Kilroy Realty LP |
| |||||||||||||
2.50% | 11/15/32 | 3,705,000 | 2,792,838 | |||||||||||
2.65% | 11/15/33 | 25,004,000 | 18,545,171 | |||||||||||
|
| |||||||||||||
| 100,377,811 | ||||||||||||||
|
| |||||||||||||
Residential REITs — 0.16% |
| |||||||||||||
| American Homes 4 Rent LP |
| |||||||||||||
3.38% | 07/15/51 | 17,118,000 | 11,426,480 | |||||||||||
| Invitation Homes Operating Partnership LP |
| |||||||||||||
2.00% | 08/15/31 | 30,593,000 | 24,347,981 | |||||||||||
2.70% | 01/15/34 | 40,308,000 | 31,958,589 | |||||||||||
4.15% | 04/15/32 | 4,798,000 | 4,393,921 | |||||||||||
5.50% | 08/15/33 | 13,766,000 | 13,720,221 | |||||||||||
|
| |||||||||||||
| 85,847,192 | ||||||||||||||
|
| |||||||||||||
Retail — 0.14% |
| |||||||||||||
| Ferrellgas LP/Ferrellgas Finance Corp. |
| |||||||||||||
5.88% | 04/01/29 | 2 | 9,650,000 | 9,206,582 | ||||||||||
| Michaels Cos., Inc. (The) |
| |||||||||||||
7.88% | 05/01/29 | 2 | 83,531,000 | 62,747,928 | ||||||||||
|
| |||||||||||||
| 71,954,510 | ||||||||||||||
|
| |||||||||||||
Retail REITs — 0.04% |
| |||||||||||||
| Federal Realty OP LP |
| |||||||||||||
7.48% | 08/15/26 | 18,825,000 | 19,419,656 | |||||||||||
|
| |||||||||||||
Services — 0.14% |
| |||||||||||||
| Adtalem Global Education, Inc. |
| |||||||||||||
5.50% | 03/01/28 | 2 | 11,557,000 | 11,078,918 | ||||||||||
| Global Payments, Inc. |
| |||||||||||||
4.88% | 03/17/31 | 6,568,000 | 7,489,464 | |||||||||||
| WASH Multifamily Acquisition, Inc. |
| |||||||||||||
5.75% | 04/15/26 | 2 | 1,791,000 | 1,751,402 | ||||||||||
| Waste Pro USA, Inc. |
| |||||||||||||
5.50% | 02/15/26 | 2 | 12,536,000 | 12,357,215 | ||||||||||
| Worldline SA |
| |||||||||||||
| (France) |
| |||||||||||||
0.00% | 07/30/25 | 3,8 | 104,010 | 12,431,628 | ||||||||||
| Issues | Maturity Date | Principal Amount | Value | |||||||||
CORPORATES (continued) |
| |||||||||||
| Services (continued) |
| |||||||||||
0.00% | 07/30/263,8 | $ | 259,400 | $ | 25,380,703 | |||||||
|
| |||||||||||
| 70,489,330 | ||||||||||||
|
| |||||||||||
Specialized REITs — 0.50% |
| |||||||||||
| Annington Funding PLC |
| |||||||||||
| (EMTN) |
| |||||||||||
| (United Kingdom) |
| |||||||||||
2.31% | 10/06/323 | 45,583,000 | 45,299,319 | |||||||||
3.18% | 07/12/293 | 10,509,000 | 11,920,675 | |||||||||
3.94% | 07/12/473 | 6,700,000 | 6,496,328 | |||||||||
| Annington Funding PLC, |
| |||||||||||
| (EMTN) |
| |||||||||||
| (United Kingdom) |
| |||||||||||
3.69% | 07/12/343 | 1,100,000 | 1,185,064 | |||||||||
| Blackstone Property Partners Europe Holdings SARL |
| |||||||||||
| (EMTN) |
| |||||||||||
| (Luxembourg) |
| |||||||||||
1.00% | 05/04/283 | 20,141,000 | 18,818,071 | |||||||||
1.63% | 04/20/303 | 13,650,000 | 12,302,872 | |||||||||
1.75% | 03/12/293 | 42,369,000 | 39,913,098 | |||||||||
| Extra Space Storage LP |
| |||||||||||
2.20% | 10/15/30 | 1,090,000 | 904,233 | |||||||||
2.35% | 03/15/32 | 34,221,000 | 27,401,765 | |||||||||
2.40% | 10/15/31 | 14,348,000 | 11,810,316 | |||||||||
2.55% | 06/01/31 | 4,000,000 | 3,331,630 | |||||||||
3.88% | 12/15/27 | 10,980,000 | 10,436,158 | |||||||||
3.90% | 04/01/29 | 1,430,000 | 1,348,111 | |||||||||
| LEG Immobilien SE |
| |||||||||||
| (EMTN) |
| |||||||||||
| (Georgia) |
| |||||||||||
0.88% | 03/30/333 | 8,100,000 | 6,688,492 | |||||||||
1.50% | 01/17/343 | 3,800,000 | 3,248,700 | |||||||||
| Realty Income Corp. |
| |||||||||||
5.13% | 07/06/34 | 49,085,000 | 57,920,795 | |||||||||
|
| |||||||||||
| 259,025,627 | ||||||||||||
|
| |||||||||||
Transportation — 0.39% |
| |||||||||||
| American Airlines Pass-Through Trust, |
| |||||||||||
| Series 2017-2, Class AA |
| |||||||||||
3.35% | 10/15/29 | 14,007,925 | 12,922,311 | |||||||||
| Delta Air Lines Pass-Through Trust, |
| |||||||||||
| Series 2020-1, Class AA |
| |||||||||||
2.00% | 06/10/28 | 71,280,357 | 64,465,095 | |||||||||
| JetBlue Airways Pass-Through Trust, |
| |||||||||||
| Series 2020-1, Class A |
| |||||||||||
4.00% | 11/15/32 | 8,559,289 | 7,910,808 | |||||||||
| U.S. Airways Pass-Through Trust, |
| |||||||||||
| Series 2012-1, Class A |
| |||||||||||
5.90% | 10/01/24 | 20,626,610 | 20,626,610 | |||||||||
| U.S. Airways Pass-Through Trust, |
| |||||||||||
| Series 2012-2, Class A |
| |||||||||||
4.63% | 06/03/25 | 5,795 | 5,697 | |||||||||
| United Airlines Pass-Through Trust, |
| |||||||||||
| Series 2013-1, Class A |
| |||||||||||
4.30% | 08/15/25 | 9,953,579 | 9,770,182 | |||||||||
See accompanying Notes to Financial Statements.
| Annual Report March 2024 / 178 |
Table of Contents
Total Return Bond Fund
Schedule of Portfolio Investments
March 31, 2024
| Issues | Maturity Date | Principal Amount | Value | |||||||||||
| CORPORATES (continued) |
| |||||||||||||
| Transportation (continued) |
| |||||||||||||
| United Airlines Pass-Through Trust, |
| |||||||||||||
| Series 2018-1, Class AA |
| |||||||||||||
3.50% | 03/01/30 | $ | 25,661,694 | $ | 23,608,759 | |||||||||
| United Airlines Pass-Through Trust, |
| |||||||||||||
| Series 2023-1, Class A |
| |||||||||||||
5.80% | 01/15/36 | 62,905,000 | 63,862,089 | |||||||||||
|
| |||||||||||||
| 203,171,551 | ||||||||||||||
|
| |||||||||||||
| Water — 0.07% |
| |||||||||||||
| Suez SACA |
| |||||||||||||
| (EMTN) |
| |||||||||||||
| (France) |
| |||||||||||||
2.88% | 05/24/34 | 3 | 3,200,000 | 3,220,059 | ||||||||||
| Thames Water Utilities Finance PLC |
| |||||||||||||
| (EMTN) |
| |||||||||||||
| (United Kingdom) |
| |||||||||||||
4.38% | 01/18/31 | 3 | 33,525,000 | 33,764,469 | ||||||||||
|
| |||||||||||||
| 36,984,528 | ||||||||||||||
|
| |||||||||||||
| Total Corporates |
| |||||||||||||
(Cost $10,542,851,485) |
| 9,971,584,152 | ||||||||||||
|
| |||||||||||||
| FOREIGN GOVERNMENT OBLIGATIONS — 0.61% |
| |||||||||||||
| Foreign Government Obligations — 0.61% |
| |||||||||||||
| Brazilian Government International Bond |
| |||||||||||||
| (Brazil) |
| |||||||||||||
6.00% | 10/20/333 | 20,120,000 | 19,965,076 | |||||||||||
6.13% | 03/15/343 | 17,393,000 | 17,231,245 | |||||||||||
| Colombia Government International Bond |
| |||||||||||||
| (Colombia) |
| |||||||||||||
3.00% | 01/30/303 | 5,971,000 | 4,951,153 | |||||||||||
3.13% | 04/15/313 | 15,729,000 | 12,597,356 | |||||||||||
8.00% | 04/20/333 | 1,670,000 | 1,767,862 | |||||||||||
| Costa Rica Government International Bond, |
| |||||||||||||
| Series REGS |
| |||||||||||||
| (Costa Rica) |
| |||||||||||||
6.55% | 04/03/343 | 5,000,000 | 5,181,000 | |||||||||||
| Dominican Republic International Bond |
| |||||||||||||
| (Dominican Republic) |
| |||||||||||||
4.50% | 01/30/302,3 | 25,047,000 | 22,855,388 | |||||||||||
| Dominican Republic International Bond, |
| |||||||||||||
| Series REGS |
| |||||||||||||
| (Dominican Republic) |
| |||||||||||||
4.88% | 09/23/323 | 8,500,000 | 7,635,347 | |||||||||||
| Finance Department Government of Sharjah |
| |||||||||||||
| (United Arab Emirates) |
| |||||||||||||
6.50% | 11/23/322,3 | 6,705,000 | 6,973,871 | |||||||||||
| Guatemala Government Bond, |
| |||||||||||||
| Series REGS |
| |||||||||||||
| (Guam) |
| |||||||||||||
5.25% | 08/10/293 | 19,100,000 | 18,530,407 | |||||||||||
| Hungary Government International Bond |
| |||||||||||||
| (Hungary) |
| |||||||||||||
2.13% | 09/22/312,3 | 17,300,000 | 13,760,420 | |||||||||||
| Mexico Government International Bond |
| |||||||||||||
| (Mexico) |
| |||||||||||||
2.66% | 05/24/313 | 17,589,000 | 14,716,892 | |||||||||||
| Issues | Maturity Date | Principal Amount | Value | |||||||||
| FOREIGN GOVERNMENT OBLIGATIONS (continued) |
| |||||||||||
| Foreign Government Obligations (continued) |
| |||||||||||
3.50% | 02/12/343 | $ | 14,767,000 | $ | 12,318,876 | |||||||
4.75% | 04/27/323 | 2,350,000 | 2,232,376 | |||||||||
6.35% | 02/09/353 | 11,940,000 | 12,335,214 | |||||||||
| Oman Government International Bond, |
| |||||||||||
| Series REGS |
| |||||||||||
| (Oman) |
| |||||||||||
5.63% | 01/17/283 | 10,500,000 | 10,567,200 | |||||||||
6.75% | 10/28/273 | 2,800,000 | 2,917,600 | |||||||||
| Panama Government International Bond |
| |||||||||||
| (Panama) |
| |||||||||||
2.25% | 09/29/323 | 10,887,000 | 7,800,016 | |||||||||
3.16% | 01/23/303 | 18,249,000 | 15,209,401 | |||||||||
| Paraguay Government International Bond, |
| |||||||||||
| Series REGS |
| |||||||||||
| (Papua New Guinea) |
| |||||||||||
4.95% | 04/28/313 | 14,150,000 | 13,673,145 | |||||||||
| Peruvian Government International Bond |
| |||||||||||
| (Peru) |
| |||||||||||
2.78% | 01/23/313 | 27,300,000 | 23,472,540 | |||||||||
| Republic of Poland Government International Bond |
| |||||||||||
| (Poland) |
| |||||||||||
4.88% | 10/04/333 | 18,565,000 | 18,308,803 | |||||||||
| Republic of South Africa Government International Bond |
| |||||||||||
| (South Africa) |
| |||||||||||
4.30% | 10/12/283 | 1,556,000 | 1,400,244 | |||||||||
4.85% | 09/30/293 | 9,814,000 | 8,819,881 | |||||||||
5.88% | 06/22/303 | 5,535,000 | 5,140,908 | |||||||||
5.88% | 04/20/323 | 10,600,000 | 9,567,136 | |||||||||
| Romanian Government International Bond |
| |||||||||||
| (Romania) |
| |||||||||||
6.63% | 02/17/282,3 | 2,840,000 | 2,932,300 | |||||||||
| Romanian Government International Bond, |
| |||||||||||
| Series REGS |
| |||||||||||
| (Romania) |
| |||||||||||
3.00% | 02/14/313 | 26,000,000 | 21,863,400 | |||||||||
|
| |||||||||||
| Total Foreign Government Obligations |
| |||||||||||
| (Cost $336,235,197) |
| 314,725,057 | ||||||||||
|
| |||||||||||
| MORTGAGE-BACKED — 53.10%** |
| |||||||||||
| Non-Agency Commercial Mortgage-Backed — 3.93% |
| |||||||||||
| 1301 Properties Owner LP |
| |||||||||||
2.08% | 09/07/254,5 | 47,327,027 | 47,019,401 | |||||||||
| Banc of America Merrill Lynch Commercial Mortgage Trust, |
| |||||||||||
| Series 2018-PARK, Class A |
| |||||||||||
4.09% | 08/10/382,6 | 122,930,000 | 114,038,485 | |||||||||
| BGME Trust, |
| |||||||||||
| Series 2021-VR, Class A |
| |||||||||||
2.99% | 01/10/432,6 | 20,000,000 | 15,491,030 | |||||||||
| BGME Trust, |
| |||||||||||
| Series 2021-VR, Class B |
| |||||||||||
2.99% | 01/10/432,6 | 32,137,000 | 23,702,628 | |||||||||
| Blackstone Industrial Portfolio - Proj Foxtrot |
| |||||||||||
2.23% | 04/09/254,5,6 | 78,837,983 | 77,024,709 | |||||||||
| BMO Mortgage Trust, |
| |||||||||||
| Series 2022-C2, Class A5 |
| |||||||||||
4.81% | 07/15/546 | 21,624,000 | 21,448,421 | |||||||||
See accompanying Notes to Financial Statements.
| 179 / Annual Report March 2024 |
Table of Contents
Total Return Bond Fund
Schedule of Portfolio Investments
March 31, 2024
| Issues | Maturity Date | Principal Amount | Value | |||||||||||
| MORTGAGE-BACKED (continued) |
| |||||||||||||
| Non-Agency Commercial Mortgage-Backed (continued) |
| |||||||||||||
| BX Commercial Mortgage Trust, |
| |||||||||||||
| Series 2020-VIV4, Class A |
| |||||||||||||
2.84% | 03/09/44 | 2 | $ | 180,165,000 | $ | 155,868,872 | ||||||||
| BX Commercial Mortgage Trust, |
| |||||||||||||
| Series 2022-CSMO, Class A |
| |||||||||||||
| (CME Term SOFR 1-Month plus 2.11%) |
| |||||||||||||
7.44% | 06/15/27 | 1,2 | 132,924,000 | 133,458,763 | ||||||||||
| BX Commercial Mortgage Trust, |
| |||||||||||||
| Series 2022-CSMO, Class B |
| |||||||||||||
| (CME Term SOFR 1-Month plus 3.14%) |
| |||||||||||||
8.47% | 06/15/27 | 1,2 | 90,170,000 | 90,612,266 | ||||||||||
| BX Trust, |
| |||||||||||||
| Series 2019-OC11, Class A |
| |||||||||||||
3.20% | 12/09/41 | 2 | 42,270,000 | 37,653,607 | ||||||||||
| BXHPP Trust, |
| |||||||||||||
| Series 2021-FILM, Class A |
| |||||||||||||
| (CME Term SOFR 1-Month plus 0.76%) |
| |||||||||||||
6.09% | 08/15/36 | 1,2 | 57,000,000 | 55,054,334 | ||||||||||
| BXHPP Trust, |
| |||||||||||||
| Series 2021-FILM, Class B |
| |||||||||||||
| (CME Term SOFR 1-Month plus 1.01%) |
| |||||||||||||
6.34% | 08/15/36 | 1,2 | 16,602,000 | 15,671,341 | ||||||||||
| BXHPP Trust, |
| |||||||||||||
| Series 2021-FILM, Class C |
| |||||||||||||
| (CME Term SOFR 1-Month plus 1.21%) |
| |||||||||||||
6.54% | 08/15/36 | 1,2 | 15,057,000 | 14,107,685 | ||||||||||
| BXHPP Trust, |
| |||||||||||||
| Series 2021-FILM, Class D |
| |||||||||||||
| (CME Term SOFR 1-Month plus 1.61%) |
| |||||||||||||
6.94% | 08/15/36 | 1,2 | 11,500,000 | 10,672,986 | ||||||||||
| CALI Mortgage Trust, |
| |||||||||||||
| Series 2019-101C, Class XA (IO) |
| |||||||||||||
0.30% | 03/10/39 | 2,6 | 272,551,000 | 3,746,868 | ||||||||||
| Capital Funding Mortgage Trust, |
| |||||||||||||
| Series 2021-M01, Class A |
| |||||||||||||
| (LIBOR USD 1-Month plus 2.25%) |
| |||||||||||||
7.69% | 12/19/24 | 1,2 | 90,174,649 | 83,981,278 | ||||||||||
| CENT Trust, |
| |||||||||||||
| Series 2023-CITY, Class A |
| |||||||||||||
| (CME Term SOFR 1-Month plus 2.62%) |
| |||||||||||||
7.95% | 09/15/38 | 1,2 | 88,590,000 | 89,784,905 | ||||||||||
| Century Plaza Towers, |
| |||||||||||||
| Series 2019-CPT, Class A |
| |||||||||||||
2.87% | 11/13/39 | 2 | 27,645,000 | 23,877,476 | ||||||||||
| Citigroup Commercial Mortgage Trust, |
| |||||||||||||
| Series 2020-555, Class A |
| |||||||||||||
2.65% | 12/10/41 | 2 | 5,000,000 | 4,262,356 | ||||||||||
| Citigroup Commercial Mortgage Trust, |
| |||||||||||||
| Series 2022-GC48, Class A5 |
| |||||||||||||
4.58% | 05/15/54 | 6 | 26,458,000 | 25,790,106 | ||||||||||
| Commercial Mortgage Pass-Through Certificates, |
| |||||||||||||
| Series 2023-BRND, Class A |
| |||||||||||||
7.12% | 07/10/40 | 2,6 | 46,000,000 | 48,263,476 | ||||||||||
| Issues | Maturity Date | Principal Amount | Value | |||||||||||
| MORTGAGE-BACKED (continued) |
| |||||||||||||
| Non-Agency Commercial Mortgage-Backed (continued) |
| |||||||||||||
| Credit Suisse Mortgage Capital Certificates, |
| |||||||||||||
| Series 2019-ICE4, Class A |
| |||||||||||||
| (CME Term SOFR 1-Month plus 1.03%) |
| |||||||||||||
6.35% | 05/15/36 | 1,2 | $ | 16,359,300 | $ | 16,355,195 | ||||||||
| Credit Suisse Mortgage Capital Trust, |
| |||||||||||||
| Series 2019-ICE4, Class D |
| |||||||||||||
| (CME Term SOFR 1-Month plus 1.65%) |
| |||||||||||||
6.97% | 05/15/36 | 1,2 | 9,975,183 | 9,969,930 | ||||||||||
| Credit Suisse Mortgage Capital Trust, |
| |||||||||||||
| Series 2022-MDR, Class A |
| |||||||||||||
| (CME Term SOFR 1-Month plus 4.81%) |
| |||||||||||||
10.14% | 08/15/25 | 1,2 | 85,000,000 | 84,639,158 | ||||||||||
| DC Office Trust, |
| |||||||||||||
| Series 2019-MTC, Class A |
| |||||||||||||
2.97% | 09/15/45 | 2 | 31,135,000 | 26,602,527 | ||||||||||
| Fontainebleau Miami Beach Trust, |
| |||||||||||||
| Series 2019-FBLU, Class A |
| |||||||||||||
3.14% | 12/10/36 | 2 | 20,000,000 | 19,536,721 | ||||||||||
| Frost CMBS DAC, |
| |||||||||||||
| Series 2021-1X, Class EUA |
| |||||||||||||
| (Ireland) |
| |||||||||||||
| (3-Month Euribor plus 1.15%) |
| |||||||||||||
5.08% | 11/20/33 | 1,3 | 2,999,545 | 3,131,331 | ||||||||||
| Hudson Yards Mortgage Trust, |
| |||||||||||||
| Series 2019-30HY, Class A |
| |||||||||||||
3.23% | 07/10/39 | 2 | 84,915,000 | 76,112,321 | ||||||||||
| Hudson Yards Mortgage Trust, |
| |||||||||||||
| Series 2019-55HY, Class A |
| |||||||||||||
2.94% | 12/10/41 | 2,6 | 81,025,000 | 71,113,965 | ||||||||||
| Last Mile Logistics Pan Euro Finance DAC, |
| |||||||||||||
| Series 1X, Class A |
| |||||||||||||
| (Ireland) |
| |||||||||||||
| (3-Month Euribor plus 0.75%) |
| |||||||||||||
4.67% | 08/17/33 | 1,3 | 5,917,625 | 6,292,202 | ||||||||||
| Last Mile Securities PE 2021 DAC, |
| |||||||||||||
| Series 2021-1X, Class A1 |
| |||||||||||||
| (Ireland) |
| |||||||||||||
| (3-Month Euribor plus 0.90%) |
| |||||||||||||
4.82% | 08/17/31 | 1,3 | 5,361,896 | 5,732,769 | ||||||||||
| LoanCore Issuer Ltd., |
| |||||||||||||
| Series 2021-CRE5, Class A |
| |||||||||||||
| (Cayman Islands) |
| |||||||||||||
| (CME Term SOFR 1-Month plus 1.41%) |
| |||||||||||||
6.74% | 07/15/36 | 1,2,3 | 22,461,272 | 22,364,029 | ||||||||||
| MF1 Ltd., |
| |||||||||||||
| Series 2022-FL8, Class A |
| |||||||||||||
| (Cayman Islands) |
| |||||||||||||
| (CME Term SOFR 1-Month plus 1.35%) |
| |||||||||||||
6.68% | 02/19/37 | 1,2,3 | 24,295,160 | 24,156,231 | ||||||||||
| MKT Mortgage Trust, |
| |||||||||||||
| Series 2020-525M, Class A |
| |||||||||||||
2.69% | 02/12/40 | 2 | 8,500,000 | 6,940,083 | ||||||||||
| NRTH Mortgage Trust, |
| |||||||||||||
| Series 2024-PARK, Class A |
| |||||||||||||
| (CME Term SOFR 1-Month plus 1.64%) |
| |||||||||||||
6.94% | 03/15/41 | 1,2 | 21,267,000 | 21,342,758 | ||||||||||
See accompanying Notes to Financial Statements.
| Annual Report March 2024 / 180 |
Table of Contents
Total Return Bond Fund
Schedule of Portfolio Investments
March 31, 2024
| Issues | Maturity Date | Principal Amount | Value | |||||||||
| MORTGAGE-BACKED (continued) |
| |||||||||||
| Non-Agency Commercial Mortgage-Backed (continued) |
| |||||||||||
| One Bryant Park Trust, |
| |||||||||||
| Series 2019-OBP, Class A |
| |||||||||||
2.52% | 09/15/542 | $ | 147,667,000 | $ | 126,318,546 | |||||||
| Project Colt (Acquired 03/08/2022, cost $100,000,000) |
| |||||||||||
7.05% | 03/10/274,5,6 | 100,000,000 | 99,310,000 | |||||||||
| Queens Center Mortgage Trust, |
| |||||||||||
| Series 2013-QCA, Class A |
| |||||||||||
3.28% | 01/11/372 | 9,170,000 | 8,674,007 | |||||||||
| SFAVE Commercial Mortgage Securities Trust, |
| |||||||||||
| Series 2015-5AVE, Class A1 |
| |||||||||||
3.87% | 01/05/432,6 | 56,465,000 | 42,708,443 | |||||||||
| SFAVE Commercial Mortgage Securities Trust, |
| |||||||||||
| Series 2015-5AVE, Class A2B |
| |||||||||||
4.14% | 01/05/432,6 | 8,710,000 | 6,419,857 | |||||||||
| SHOW 2022-BIZ A |
| |||||||||||
| Series 2022-BIZ, Class A |
| |||||||||||
| (CME Term SOFR 1-Month plus 2.98%) |
| |||||||||||
8.30% | 01/15/271,2 | 68,000,000 | 64,227,425 | |||||||||
| SREIT Trust, |
| |||||||||||
| Series 2021-PALM, Class G |
| |||||||||||
| (CME Term SOFR 1-Month plus 3.73%) |
| |||||||||||
9.06% | 10/15/341,2 | 40,000,000 | 39,147,836 | |||||||||
| Taurus UK DAC, |
| |||||||||||
| Series 2021-UK1A, Class A |
| |||||||||||
| (Ireland) |
| |||||||||||
| (SONIA plus 0.85%) |
| |||||||||||
6.07% | 05/17/311,2,3 | 4,765,002 | 5,972,234 | |||||||||
| Taurus UK DAC, |
| |||||||||||
| Series 2021-UK1X, Class C |
| |||||||||||
| (Ireland) |
| |||||||||||
| (SONIA plus 1.65%) |
| |||||||||||
6.87% | 05/17/311,3 | 975,833 | 1,204,925 | |||||||||
| Taurus UK DAC, |
| |||||||||||
| Series 2021-UK1X, Class D |
| |||||||||||
| (Ireland) |
| |||||||||||
| (SONIA plus 2.60%) |
| |||||||||||
7.82% | 05/17/311,3 | 5,618,732 | 6,983,988 | |||||||||
| Taurus UK DAC, |
| |||||||||||
| Series 2021-UK1X, Class E |
| |||||||||||
| (Ireland) |
| |||||||||||
| (SONIA plus 3.65%) |
| |||||||||||
8.87% | 05/17/311,3 | 5,761,682 | 7,063,880 | |||||||||
| Taurus UK DAC, |
| |||||||||||
| Series 2021-UK4X, Class D |
| |||||||||||
| (Ireland) |
| |||||||||||
| (SONIA plus 2.10%) |
| |||||||||||
7.32% | 08/17/311,3 | 2,795,554 | 3,525,666 | |||||||||
| Taurus UK DAC, |
| |||||||||||
| Series 2021-UK5, Class B |
| |||||||||||
| (Ireland) |
| |||||||||||
| (SONIA plus 1.65%) |
| |||||||||||
6.87% | 05/17/311,3 | 3,094,000 | 3,885,953 | |||||||||
| Westfield Galleria at Roseville |
| |||||||||||
8.40% | 03/29/254,5 | 141,900,000 | 141,758,100 | |||||||||
|
| |||||||||||
| 2,043,021,073 | ||||||||||||
|
| |||||||||||
| Issues | Maturity Date | Principal Amount | Value | |||||||||
| MORTGAGE-BACKED (continued) |
| |||||||||||
| Non-Agency Mortgage-Backed — 9.61% |
| |||||||||||
| Aames Mortgage Trust, |
| |||||||||||
| Series 2002-1, Class A3 (STEP-reset date 05/25/24) |
| |||||||||||
7.40% | 06/25/32 | $ | 16,066 | $ | 15,621 | |||||||
| ACE Securities Corp. Home Equity Loan Trust, |
| |||||||||||
| Series 2004-IN1, Class A1 |
| |||||||||||
| (CME Term SOFR 1-Month plus 0.75%) |
| |||||||||||
6.08% | 05/25/341 | 119,285 | 110,650 | |||||||||
| ACE Securities Corp. Home Equity Loan Trust, |
| |||||||||||
| Series 2006-HE3, Class A2C |
| |||||||||||
| (CME Term SOFR 1-Month plus 0.41%) |
| |||||||||||
5.74% | 06/25/361 | 2,312,500 | 1,679,935 | |||||||||
| ACE Securities Corp. Home Equity Loan Trust, |
| |||||||||||
| Series 2007-ASP2, Class A1 |
| |||||||||||
| (CME Term SOFR 1-Month plus 0.49%) |
| |||||||||||
5.82% | 06/25/371 | 25,108,599 | 18,121,240 | |||||||||
| Adjustable Rate Mortgage Trust, |
| |||||||||||
| Series 2005-10, Class 6A1 |
| |||||||||||
| (CME Term SOFR 1-Month plus 0.65%) |
| |||||||||||
5.98% | 01/25/361 | 131,551 | 119,023 | |||||||||
| Adjustable Rate Mortgage Trust, |
| |||||||||||
| Series 2007-3, Class 2A1 |
| |||||||||||
6.27% | 11/25/372,6 | 25,008,442 | 17,091,202 | |||||||||
| Ajax Mortgage Loan Trust, |
| |||||||||||
| Series 2019-F, Class A1 (STEP-reset date 04/25/24) |
| |||||||||||
2.86% | 07/25/592 | 94,627 | 89,251 | |||||||||
| Alternative Loan Trust, |
| |||||||||||
| Series 2004-30CB, Class 1A6 |
| |||||||||||
5.50% | 02/25/35 | 23,422,649 | 21,880,120 | |||||||||
| Alternative Loan Trust, |
| |||||||||||
| Series 2004-J6, Class 2A1 |
| |||||||||||
6.50% | 11/25/31 | 1,895 | 1,844 | |||||||||
| Alternative Loan Trust, |
| |||||||||||
| Series 2005-76, Class 2A1 |
| |||||||||||
| (Federal Reserve US 12-Month Cumulative Average plus 1.00%) |
| |||||||||||
6.09% | 02/25/361 | 29,200,339 | 26,181,989 | |||||||||
| Alternative Loan Trust, |
| |||||||||||
| Series 2005-84, Class 1A1 |
| |||||||||||
4.76% | 02/25/366 | 24,648 | 22,655 | |||||||||
| Alternative Loan Trust, |
| |||||||||||
| Series 2006-HY13, Class 4A1 |
| |||||||||||
4.77% | 02/25/376 | 666,319 | 572,380 | |||||||||
| Alternative Loan Trust, |
| |||||||||||
| Series 2007-J1, Class 2A1 |
| |||||||||||
| (CME Term SOFR 1-Month plus 0.31%) |
| |||||||||||
5.64% | 03/25/371 | 529,574 | 135,678 | |||||||||
| American Home Mortgage Assets Trust, |
| |||||||||||
| Series 2006-3, Class 2A12 |
| |||||||||||
| (Federal Reserve US 12-Month Cumulative Average plus 1.15%) |
| |||||||||||
6.24% | 10/25/461 | 29,701,401 | 20,274,034 | |||||||||
| American Home Mortgage Assets Trust, |
| |||||||||||
| Series 2007-1, Class A1 |
| |||||||||||
| (Federal Reserve US 12-Month Cumulative Average plus 0.70%) |
| |||||||||||
5.79% | 02/25/471 | 43,546,615 | 16,920,908 | |||||||||
See accompanying Notes to Financial Statements.
| 181 / Annual Report March 2024 |
Table of Contents
Total Return Bond Fund
Schedule of Portfolio Investments
March 31, 2024
| Issues | Maturity Date | Principal Amount | Value | |||||||||
| MORTGAGE-BACKED (continued) |
| |||||||||||
| Non-Agency Mortgage-Backed (continued) |
| |||||||||||
| American Home Mortgage Assets Trust, |
| |||||||||||
| Series 2007-2, Class A1 |
| |||||||||||
| (CME Term SOFR 1-Month plus 0.24%) |
| |||||||||||
5.57% | 03/25/471 | $ | 22,694,898 | $ | 20,778,477 | |||||||
| American Home Mortgage Investment Trust, |
| |||||||||||
| Series 2004-3, Class 2A |
| |||||||||||
| (TSFR6M plus 1.93%) |
| |||||||||||
4.64% | 10/25/341 | 2,791,833 | 2,721,993 | |||||||||
| Argent Securities, Inc., Asset-Backed Pass-Through Certificates, |
| |||||||||||
| Series 2005-W2, Class M1 |
| |||||||||||
| (CME Term SOFR 1-Month plus 0.85%) |
| |||||||||||
6.18% | 10/25/351 | 66,665 | 65,105 | |||||||||
| Argent Securities, Inc., Asset-Backed Pass-Through Certificates, |
| |||||||||||
| Series 2005-W3, Class M1 |
| |||||||||||
| (CME Term SOFR 1-Month plus 0.77%) |
| |||||||||||
6.10% | 11/25/351 | 10,832,414 | 10,433,353 | |||||||||
| Asset-Backed Funding Certificates, |
| |||||||||||
| Series 2006-OPT3, Class A3B |
| |||||||||||
| (CME Term SOFR 1-Month plus 0.43%) |
| |||||||||||
5.76% | 11/25/361 | 39,256,932 | 15,940,909 | |||||||||
| Asset-Backed Funding Certificates, |
| |||||||||||
| Series 2007-WMC1, Class A2A |
| |||||||||||
| (CME Term SOFR 1-Month plus 0.86%) |
| |||||||||||
6.19% | 06/25/371 | 20,168,067 | 15,784,386 | |||||||||
| Asset-Backed Funding Certificates, |
| |||||||||||
| Series 2007-WMC1, Class A2B |
| |||||||||||
| (CME Term SOFR 1-Month plus 1.11%) |
| |||||||||||
6.44% | 06/25/371 | 14,733,479 | 12,213,929 | |||||||||
| Asset-Backed Securities Corp. Home Equity Loan Trust, |
| |||||||||||
| Series 2006-HE6, Class A5 |
| |||||||||||
| (CME Term SOFR 1-Month plus 0.57%) |
| |||||||||||
5.90% | 11/25/361 | 12,282,114 | 11,786,026 | |||||||||
| Banc of America Funding Trust, |
| |||||||||||
| Series 2003-2, Class 1A1 |
| |||||||||||
6.50% | 06/25/32 | 10,130 | 10,001 | |||||||||
| Banc of America Funding Trust, |
| |||||||||||
| Series 2006-D, Class 3A1 |
| |||||||||||
4.42% | 05/20/366 | 2,341,983 | 2,174,557 | |||||||||
| Banc of America Funding Trust, |
| |||||||||||
| Series 2006-E, Class 2A1 |
| |||||||||||
4.98% | 06/20/366 | 28,082 | 25,069 | |||||||||
| Banc of America Funding Trust, |
| |||||||||||
| Series 2006-H, Class 3A1 |
| |||||||||||
4.48% | 09/20/466 | 507,349 | 406,482 | |||||||||
| Banc of America Mortgage Trust, |
| |||||||||||
| Series 2004-F, Class 1A1 |
| |||||||||||
5.21% | 07/25/346 | 12,854 | 12,144 | |||||||||
| Banc of America Mortgage Trust, |
| |||||||||||
| Series 2005-C, Class 2A2 |
| |||||||||||
4.68% | 04/25/356 | 75,295 | 76,747 | |||||||||
| Banc of America Mortgage Trust, |
| |||||||||||
| Series 2007-1, Class 1A24 |
| |||||||||||
6.00% | 03/25/37 | 323,253 | 260,059 | |||||||||
| Issues | Maturity Date | Principal Amount | Value | |||||||||
| MORTGAGE-BACKED (continued) |
| |||||||||||
| Non-Agency Mortgage-Backed (continued) |
| |||||||||||
| Banc of America Mortgage Trust, |
| |||||||||||
| Series 2007-3, Class 1A1 |
| |||||||||||
6.00% | 09/25/37 | $ | 140,431 | $ | 112,997 | |||||||
| BCAP LLC Trust, |
| |||||||||||
| Series 2007-AA2, Class 2A5 |
| |||||||||||
6.00% | 04/25/37 | 208,156 | 94,923 | |||||||||
| BCAP LLC Trust, |
| |||||||||||
| Series 2007-AA5, Class A1 |
| |||||||||||
| (CME Term SOFR 1-Month plus 1.41%) |
| |||||||||||
6.74% | 09/25/471 | 11,859,540 | 10,333,961 | |||||||||
| Bear Stearns ALT-ATrust, |
| |||||||||||
| Series 2005-4, Class 22A2 |
| |||||||||||
4.70% | 05/25/356 | 7,178 | 6,478 | |||||||||
| Bear Stearns ALT-A Trust, |
| |||||||||||
| Series 2006-4, Class 32A1 |
| |||||||||||
4.27% | 07/25/366 | 1,265,416 | 628,211 | |||||||||
| Bear Stearns ARM Trust, |
| |||||||||||
| Series 2004-1, Class 13A2 |
| |||||||||||
4.93% | 04/25/346 | 3,928 | 3,722 | |||||||||
| Bear Stearns ARM Trust, |
| |||||||||||
| Series 2004-10, Class 14A1 |
| |||||||||||
4.78% | 01/25/356 | 1,614,766 | 1,528,975 | |||||||||
| Bear Stearns ARM Trust, |
| |||||||||||
| Series 2006-4, Class 2A1 |
| |||||||||||
4.34% | 10/25/366 | 176,473 | 153,727 | |||||||||
| Bear Stearns Asset-Backed Securities I Trust, |
| |||||||||||
| Series 2005-AC5, Class 2A3 |
| |||||||||||
| (CME Term SOFR 1-Month plus 0.36%) |
| |||||||||||
5.69% | 08/25/201 | 894,817 | 533,221 | |||||||||
| Bear Stearns Asset-Backed Securities I Trust, |
| |||||||||||
| Series 2006-AC2, Class 21A3 |
| |||||||||||
6.00% | 03/25/36 | 55,663 | 55,000 | |||||||||
| Bear Stearns Asset-Backed Securities I Trust, |
| |||||||||||
| Series 2006-HE9, Class 3A |
| |||||||||||
| (CME Term SOFR 1-Month plus 0.39%) |
| |||||||||||
5.72% | 11/25/361 | 2,427,057 | 2,367,316 | |||||||||
| Bear Stearns Asset-Backed Securities I Trust, |
| |||||||||||
| Series 2007-AC1, Class A3 (STEP-reset date 05/25/24) |
| |||||||||||
6.55% | 02/25/37 | 24,123,794 | 21,383,693 | |||||||||
| Bear Stearns Asset-Backed Securities Trust, |
| |||||||||||
| Series 2003-AC7, Class A1 (STEP-reset date 05/25/24) |
| |||||||||||
5.50% | 01/25/34 | 415,476 | 353,434 | |||||||||
| Bear Stearns Asset-Backed Securities Trust, |
| |||||||||||
| Series 2003-AC7, Class A2 (STEP-reset date 05/25/24) |
| |||||||||||
5.75% | 01/25/34 | 374,580 | 318,574 | |||||||||
| Bear Stearns Mortgage Funding Trust, |
| |||||||||||
| Series 2006-AR3, Class 1A1 |
| |||||||||||
| (CME Term SOFR 1-Month plus 0.47%) |
| |||||||||||
5.80% | 10/25/361 | 882,724 | 776,427 | |||||||||
| Bear Stearns Mortgage Funding Trust, |
| |||||||||||
| Series 2006-AR5, Class 1A1 |
| |||||||||||
| (CME Term SOFR 1-Month plus 0.27%) |
| |||||||||||
5.60% | 12/25/461 | 12,339,279 | 10,845,764 | |||||||||
See accompanying Notes to Financial Statements.
| Annual Report March 2024 / 182 |
Table of Contents
Total Return Bond Fund
Schedule of Portfolio Investments
March 31, 2024
| Issues | Maturity Date | Principal Amount | Value | |||||||
| MORTGAGE-BACKED (continued) |
| |||||||||
| Non-Agency Mortgage-Backed (continued) |
| |||||||||
| Bear Stearns Mortgage Funding Trust, |
| |||||||||
| Series 2007-AR5, Class 1A1A |
| |||||||||
| (CME Term SOFR 1-Month plus 0.45%) |
| |||||||||
5.78% | 06/25/471 | $ | 1,986,785 | $ | 1,645,088 | |||||
| Carrington Mortgage Loan Trust, |
| |||||||||
| Series 2006-NC3, Class A4 |
| |||||||||
| (CME Term SOFR 1-Month plus 0.35%) |
| |||||||||
5.68% | 08/25/361 | 46,429,000 | 35,550,990 | |||||||
| Carrington Mortgage Loan Trust, |
| |||||||||
| Series 2006-OPT1, Class M1 |
| |||||||||
| (CME Term SOFR 1-Month plus 0.64%) |
| |||||||||
5.97% | 02/25/361 | 27,951 | 27,536 | |||||||
| Carrington Mortgage Loan Trust, |
| |||||||||
| Series 2007-RFC1, Class A4 |
| |||||||||
| (CME Term SOFR 1-Month plus 0.33%) |
| |||||||||
5.66% | 10/25/361 | 22,415,000 | 19,202,085 | |||||||
| Chase Funding Trust, |
| |||||||||
| Series 2003-5, Class 2A2 |
| |||||||||
| (CME Term SOFR 1-Month plus 0.71%) |
| |||||||||
6.04% | 07/25/331 | 3,059 | 2,939 | |||||||
| Chase Funding Trust, |
| |||||||||
| Series 2004-2, Class 2A2 |
| |||||||||
| (CME Term SOFR 1-Month plus 0.61%) |
| |||||||||
5.94% | 02/26/351 | 3,388 | 3,291 | |||||||
| Chase Mortgage Finance Trust, |
| |||||||||
| Series 2006-A1, Class 1A2 |
| |||||||||
4.34% | 09/25/366 | 331,036 | 296,051 | |||||||
| Chase Mortgage Finance Trust, |
| |||||||||
| Series 2006-S3, Class 2A1 |
| |||||||||
5.50% | 11/25/21 | 1,302,896 | 406,105 | |||||||
| Chase Mortgage Finance Trust, |
| |||||||||
| Series 2007-A2, Class 2A3 |
| |||||||||
5.81% | 06/25/356 | 634,286 | 620,545 | |||||||
| ChaseFlex Trust, |
| |||||||||
| Series 2005-2, Class 4A2 |
| |||||||||
5.50% | 06/25/36 | 290,121 | 120,527 | |||||||
| ChaseFlex Trust, |
| |||||||||
| Series 2006-2, Class A2B |
| |||||||||
| (CME Term SOFR 1-Month plus 0.31%) |
| |||||||||
4.70% | 09/25/361 | 3,948,790 | 3,222,710 | |||||||
| CIM Trust, |
| |||||||||
| Series 2019-R1, Class A |
| |||||||||
3.25% | 10/25/582,6 | 38,083,805 | 33,885,949 | |||||||
| CIM Trust, |
| |||||||||
| Series 2019-R3, Class A |
| |||||||||
2.63% | 06/25/582,6 | 80,130,296 | 72,383,119 | |||||||
| CIM Trust, |
| |||||||||
| Series 2019-R4, Class A1 |
| |||||||||
3.00% | 10/25/592,6 | 80,907,201 | 73,964,206 | |||||||
| CIM Trust, |
| |||||||||
| Series 2020-R1, Class A1 |
| |||||||||
2.85% | 10/27/592,6 | 124,216,770 | 108,181,093 | |||||||
| CIM Trust, |
| |||||||||
| Series 2020-R3, Class A1A |
| |||||||||
4.00% | 01/26/602,6 | 97,395,563 | 91,683,800 | |||||||
| Issues | Maturity Date | Principal Amount | Value | |||||||
| MORTGAGE-BACKED (continued) |
| |||||||||
| Non-Agency Mortgage-Backed (continued) |
| |||||||||
| CIM Trust, |
| |||||||||
| Series 2020-R6, Class A1 |
| |||||||||
2.25% | 12/25/602,6 | $ | 73,595,778 | $ | 62,995,528 | |||||
| CIM Trust, |
| |||||||||
| Series 2020-R6, Class A1A |
| |||||||||
2.25% | 12/25/602,6 | 45,452,197 | 39,644,197 | |||||||
| CIM Trust, |
| |||||||||
| Series 2020-R7, Class A1A |
| |||||||||
2.25% | 12/27/612,6 | 187,895,215 | 163,997,142 | |||||||
| CIM Trust, |
| |||||||||
| Series 2021-R1, Class A2 |
| |||||||||
2.40% | 08/25/562,6 | 69,118,237 | 60,661,787 | |||||||
| CIM Trust, |
| |||||||||
| Series 2021-R2, Class A2 |
| |||||||||
2.50% | 01/25/572,6 | 62,685,281 | 55,990,869 | |||||||
| CIM Trust, |
| |||||||||
| Series 2021-R3, Class A1A |
| |||||||||
1.95% | 06/25/572,6 | 222,569,249 | 196,795,730 | |||||||
| CIM Trust, |
| |||||||||
| Series 2021-R4, Class A1A |
| |||||||||
2.00% | 05/01/612,6 | 171,813,216 | 150,476,557 | |||||||
| CIM Trust, |
| |||||||||
| Series 2021-R5, Class A1 |
| |||||||||
2.00% | 08/25/612,6 | 38,395,584 | 31,418,681 | |||||||
| CIM Trust, |
| |||||||||
| Series 2021-R5, Class A1A |
| |||||||||
2.00% | 08/25/612,6 | 153,918,608 | 128,116,801 | |||||||
| CIM Trust, |
| |||||||||
| Series 2022-I1, Class A1 |
| |||||||||
4.35% | 02/25/672,6 | 36,408,266 | 35,431,596 | |||||||
| CIM Trust, |
| |||||||||
| Series 2022-NR1, Class A1 (STEP-reset date 05/25/24) |
| |||||||||
5.00% | 07/25/622 | 82,098,721 | 79,921,192 | |||||||
| CIM Trust, |
| |||||||||
| Series 2023-R1,Class A1A |
| |||||||||
5.40% | 04/25/622,6 | 275,359,701 | 264,468,371 | |||||||
| CIM Trust, |
| |||||||||
| Series 2023-R3, Class A1 |
| |||||||||
4.50% | 01/25/632,6 | 38,514,199 | 35,267,633 | |||||||
| CIM Trust, |
| |||||||||
| Series 2023-R3, Class A1A |
| |||||||||
4.50% | 01/25/632,6 | 218,666,172 | 202,067,792 | |||||||
| Citicorp Mortgage Securities, Inc., |
| |||||||||
| Series 2005-1, Class 1A12 |
| |||||||||
5.00% | 02/25/35 | 70,781 | 66,528 | |||||||
| Citicorp Residential Mortgage Trust, |
| |||||||||
| Series 2007-1, Class A5 (STEP-reset date 05/25/24) |
| |||||||||
4.79% | 03/25/37 | 118,504 | 117,120 | |||||||
| Citigroup Mortgage Loan Trust, |
| |||||||||
| Series 2005-9, Class 1A1 |
| |||||||||
| (CME Term SOFR 1-Month plus 0.37%) |
| |||||||||
5.70% | 11/25/351 | 89,936 | 73,863 | |||||||
| Citigroup Mortgage Loan Trust, |
| |||||||||
| Series 2006-AR2, Class 1A1 |
| |||||||||
5.49% | 03/25/366 | 6,330,187 | 4,819,897 | |||||||
See accompanying Notes to Financial Statements.
| 183 / Annual Report March 2024 |
Table of Contents
Total Return Bond Fund
Schedule of Portfolio Investments
March 31, 2024
| Issues | Maturity Date | Principal Amount | Value | |||||||
| MORTGAGE-BACKED (continued) |
| |||||||||
| Non-Agency Mortgage-Backed (continued) |
| |||||||||
Citigroup Mortgage Loan Trust, |
| |||||||||
Series 2006-AR3, Class 1A2A |
| |||||||||
4.28% | 06/25/366 | $ | 790,457 | $ | 715,760 | |||||
Citigroup Mortgage Loan Trust, |
| |||||||||
| Series 2006-WF2, Class A1 (STEP-reset date 05/25/24) |
| |||||||||
7.25% | 05/25/36 | 28,505,357 | 14,853,751 | |||||||
Citigroup Mortgage Loan Trust, |
| |||||||||
| Series 2007-6, Class 1A4A |
| |||||||||
4.44% | 03/25/376 | 118,137 | 102,853 | |||||||
Citigroup Mortgage Loan Trust, |
| |||||||||
| Series 2007-AR5, Class 1A1A |
| |||||||||
5.21% | 04/25/376 | 46,663 | 40,381 | |||||||
Citigroup Mortgage Loan Trust, |
| |||||||||
| Series 2014-5, Class 2A2 |
| |||||||||
| (LIBOR USD 1-Month plus 1.75%) |
| |||||||||
4.93% | 02/20/361,2 | 5,239,039 | 4,488,831 | |||||||
| Citigroup Mortgage Loan Trust, Inc., |
| |||||||||
| Series 2005-5, Class 3A2A |
| |||||||||
5.15% | 10/25/356 | 309,789 | 259,380 | |||||||
| Countrywide Asset-Backed Certificates Trust, |
| |||||||||
| Series 2005-13, Class AF4 |
| |||||||||
5.81% | 04/25/366 | 113,696 | 100,772 | |||||||
| Countrywide Asset-Backed Certificates Trust, |
| |||||||||
| Series 2007-13, Class 2A2 |
| |||||||||
| (CME Term SOFR 1-Month plus 0.91%) |
| |||||||||
6.24% | 10/25/471 | 6,326,301 | 5,685,457 | |||||||
| Countrywide Home Loan Mortgage Pass-Through Trust, |
| |||||||||
| Series 2001-HYB1, Class 1A1 |
| |||||||||
5.26% | 06/19/316 | 5,296 | 5,112 | |||||||
| Countrywide Home Loan Mortgage Pass-Through Trust, |
| |||||||||
| Series 2003-J8, Class 1A4 |
| |||||||||
5.25% | 09/25/23 | 20,352 | 19,340 | |||||||
| Countrywide Home Loan Mortgage Pass-Through Trust, |
| |||||||||
| Series 2004-14, Class 4A1 |
| |||||||||
5.36% | 08/25/346 | 543,385 | 486,936 | |||||||
| Countrywide Home Loan Mortgage Pass-Through Trust, |
| |||||||||
| Series 2004-25, Class 1A1 |
| |||||||||
| (CME Term SOFR 1-Month plus 0.77%) |
| |||||||||
6.10% | 02/25/351 | 59,774 | 57,836 | |||||||
| Countrywide Home Loan Mortgage Pass-Through Trust, |
| |||||||||
| Series 2004-7, Class 2A1 |
| |||||||||
4.24% | 06/25/346 | 41,035 | 37,411 | |||||||
| Countrywide Home Loan Mortgage Pass-Through Trust, |
| |||||||||
| Series 2004-HYB3, Class 1A |
| |||||||||
5.32% | 06/20/346 | 8,298 | 7,963 | |||||||
| Countrywide Home Loan Mortgage Pass-Through Trust, |
| |||||||||
| Series 2004-HYB4, Class 2A1 |
| |||||||||
5.25% | 09/20/346 | 403,910 | 380,208 | |||||||
| Countrywide Home Loan Mortgage Pass-Through Trust, |
| |||||||||
| Series 2005-11, Class 1A2 |
| |||||||||
4.49% | 04/25/356 | 448,074 | 384,337 | |||||||
| Countrywide Home Loan Mortgage Pass-Through Trust, |
| |||||||||
| Series 2005-9, Class 1A1 |
| |||||||||
| (CME Term SOFR 1-Month plus 0.71%) |
| |||||||||
6.04% | 05/25/351 | 2,015,921 | 1,696,833 | |||||||
| Issues | Maturity Date | Principal Amount | Value | |||||||
| MORTGAGE-BACKED (continued) |
| |||||||||
| Non-Agency Mortgage-Backed (continued) |
| |||||||||
| Countrywide Home Loan Mortgage Pass-Through Trust, |
| |||||||||
Series 2007-HY5, Class 1A1 |
| |||||||||
4.75% | 09/25/476 | $ | 469,911 | $ | 354,232 | |||||
| Countrywide Home Loan Mortgage Pass-Through Trust, |
| |||||||||
Series 2007-HYB1, Class 1A1 |
| |||||||||
3.73% | 03/25/376 | 895,697 | 697,031 | |||||||
| Credit Suisse First Boston Mortgage Securities Corp., |
| |||||||||
Series 2003-AR20, Class 2A4 |
| |||||||||
4.95% | 08/25/336 | 5,182 | 4,985 | |||||||
| Credit Suisse First Boston Mortgage Securities Corp., |
| |||||||||
Series 2005-6, Class 8A1 |
| |||||||||
4.50% | 07/25/20 | 2,664 | 2,372 | |||||||
| Credit Suisse First Boston Mortgage-Backed Pass-Through Certificates, |
| |||||||||
Series 2004-1, Class 2A1 |
| |||||||||
6.50% | 02/25/34 | 7,008 | 6,913 | |||||||
| Credit Suisse First Boston Mortgage-Backed Pass-Through Certificates, |
| |||||||||
Series 2004-AR5, Class 6A1 |
| |||||||||
5.49% | 06/25/346 | 40,818 | 40,041 | |||||||
Credit Suisse Mortgage Capital Certificates, |
| |||||||||
Series 2021-RP11, Class CERT |
| |||||||||
3.78% | 10/27/612 | 9,161,542 | 7,191,157 | |||||||
Credit Suisse Mortgage Capital Certificates, |
| |||||||||
Series 2022-RPL1, Class CERT |
| |||||||||
4.23% | 04/25/612 | 9,330,483 | 7,928,172 | |||||||
| Credit Suisse Mortgage Capital Trust, |
| |||||||||
| Series 2006-2, Class 5A1 |
| |||||||||
| (CME Term SOFR 1-Month plus 0.81%) |
| |||||||||
6.00% | 03/25/361 | 3,037,125 | 1,033,813 | |||||||
| Credit Suisse Mortgage Capital Trust, |
| |||||||||
| Series 2015-6R, Class 2A1 |
| |||||||||
| (CME Term SOFR 1-Month plus 0.31%) |
| |||||||||
7.30% | 11/27/461,2 | 1,124,019 | 1,115,230 | |||||||
Credit Suisse Mortgage Capital Trust, |
| |||||||||
Series 2021-NQM6, Class A1 |
| |||||||||
1.17% | 07/25/662,6 | 6,494,857 | 5,299,672 | |||||||
Credit Suisse Mortgage Capital Trust, |
| |||||||||
Series 2021-RP11, Class PT |
| |||||||||
3.76% | 10/25/612,6 | 218,095,425 | 174,462,774 | |||||||
Credit Suisse Mortgage Capital Trust, |
| |||||||||
Series 2021-RP11, Class SA (IO) |
| |||||||||
0.00% | 10/25/612,4,5,6 | 186,220 | 180,048 | |||||||
Credit Suisse Mortgage Capital Trust, |
| |||||||||
Series 2022-RPL1, Class PT |
| |||||||||
4.64% | 04/25/612,6 | 224,083,976 | 193,234,066 | |||||||
Credit Suisse Mortgage Capital Trust, |
| |||||||||
Series 2022-RPL1, Class SA (IO) |
| |||||||||
0.00% | 04/25/612,4,5,6 | 508,843 | 492,629 | |||||||
Credit-Based Asset Servicing and Securitization LLC, |
| |||||||||
Series 2003-CB1, Class AF (STEP-reset date 05/25/24) |
| |||||||||
3.95% | 01/25/33 | 3,954 | 3,723 | |||||||
| Credit-Based Asset Servicing and Securitization LLC, |
| |||||||||
| Series 2006-CB7, Class A1 |
| |||||||||
| (CME Term SOFR 1-Month plus 0.39%) |
| |||||||||
5.72% | 10/25/361 | 33,360,305 | 23,644,126 | |||||||
See accompanying Notes to Financial Statements.
| Annual Report March 2024 / 184 |
Table of Contents
Total Return Bond Fund
Schedule of Portfolio Investments
March 31, 2024
| Issues | Maturity Date | Principal Amount | Value | |||||||
| MORTGAGE-BACKED (continued) |
| |||||||||
Non-Agency Mortgage-Backed (continued) |
| |||||||||
| Credit-Based Asset Servicing and Securitization LLC, |
| |||||||||
| Series 2006-CB8, Class A1 |
| |||||||||
| (CME Term SOFR 1-Month plus 0.39%) |
| |||||||||
5.72% | 10/25/361 | $ | 8,467,387 | $ | 7,680,306 | |||||
| Credit-Based Asset Servicing and Securitization LLC, |
| |||||||||
| Series 2006-CB9, Class A3 |
| |||||||||
| (CME Term SOFR 1-Month plus 0.41%) |
| |||||||||
5.74% | 11/25/361 | 22,212,765 | 9,756,493 | |||||||
| Credit-Based Asset Servicing and Securitization LLC, |
| |||||||||
| Series 2007-CB1, Class AF4 (STEP-reset date 05/25/24) |
| |||||||||
3.19% | 01/25/37 | 5,968,643 | 1,778,274 | |||||||
| Credit-Based Asset Servicing and Securitization LLC, |
| |||||||||
| Series 2007-CB1, Class AF5 (STEP-reset date 05/25/24) |
| |||||||||
3.19% | 01/25/37 | 11,216,502 | 3,344,231 | |||||||
| Credit-Based Asset Servicing and Securitization LLC, |
| |||||||||
| Series 2007-CB5, Class A2 |
| |||||||||
| (CME Term SOFR 1-Month plus 0.28%) |
| |||||||||
3.39% | 04/25/371 | 19,427,036 | 12,292,113 | |||||||
| Credit-Based Asset Servicing and Securitization LLC, |
| |||||||||
| Mortgage Loan Trust, |
| |||||||||
| Series 2007-CB2, Class A2C (STEP-reset date 05/25/24) |
| |||||||||
3.57% | 02/25/37 | 22,686,017 | 13,632,457 | |||||||
| Credit-Based Asset Servicing and Securitization LLC, |
| |||||||||
| Mortgage Loan Trust, |
| |||||||||
| Series 2007-CB2, Class A2D (STEP-reset date 05/25/24) |
| |||||||||
3.57% | 02/25/37 | 16,609,542 | 9,992,741 | |||||||
| Credit-Based Asset Servicing and Securitization LLC, |
| |||||||||
| Mortgage Loan Trust, |
| |||||||||
| Series 2007-CB2, Class A2E (STEP-reset date 05/25/24) |
| |||||||||
3.57% | 02/25/37 | 3,020,419 | 1,815,520 | |||||||
| CSAB Mortgage-Backed Trust, |
| |||||||||
| Series 2006-4, Class A6B (STEP-reset date 05/25/24) |
| |||||||||
6.28% | 12/25/36 | 5,268,016 | 234,783 | |||||||
| Deephaven Residential Mortgage Trust, |
| |||||||||
| Series 2021-4, Class A1 |
| |||||||||
1.93% | 11/25/662,6 | 21,799,633 | 18,716,940 | |||||||
| Deutsche ALT-A Securities Mortgage Loan Trust, |
| |||||||||
| Series 2006-AR3, Class A1 |
| |||||||||
| (CME Term SOFR 1-Month plus 0.49%) |
| |||||||||
5.82% | 08/25/361 | 1,771,760 | 1,642,351 | |||||||
| Deutsche ALT-A Securities Mortgage Loan Trust, |
| |||||||||
| Series 2006-AR4, Class A1 |
| |||||||||
| (CME Term SOFR 1-Month plus 0.37%) |
| |||||||||
5.70% | 12/25/361 | 1,370,631 | 457,378 | |||||||
| Deutsche ALT-A Securities Mortgage Loan Trust, |
| |||||||||
| Series 2006-AR4, Class A2 |
| |||||||||
| (CME Term SOFR 1-Month plus 0.49%) |
| |||||||||
5.82% | 12/25/361 | 25,157,719 | 8,377,941 | |||||||
| Deutsche ALT-A Securities Mortgage Loan Trust, |
| |||||||||
| Series 2006-AR6, Class A6 |
| |||||||||
| (CME Term SOFR 1-Month plus 0.49%) |
| |||||||||
5.82% | 02/25/371 | 330,226 | 280,944 | |||||||
| Deutsche ALT-A Securities Mortgage Loan Trust, |
| |||||||||
| Series 2007-3, Class 1A1 |
| |||||||||
| (CME Term SOFR 1-Month plus 1.81%) |
| |||||||||
7.14% | 10/25/471 | 17,263,229 | 12,602,117 | |||||||
| Issues | Maturity Date | Principal Amount | Value | |||||||
| MORTGAGE-BACKED (continued) |
| |||||||||
Non-Agency Mortgage-Backed (continued) |
| |||||||||
| Deutsche ALT-A Securities Mortgage Loan Trust, |
| |||||||||
| Series 2007-AR3, Class 2A4 |
| |||||||||
| (CME Term SOFR 1-Month plus 0.81%) |
| |||||||||
6.14% | 06/25/371 | $ | 16,010,210 | $ | 13,524,160 | |||||
| Deutsche ALT-A Securities Mortgage Loan Trust, |
| |||||||||
| Series 2007-OA3, Class A1 |
| |||||||||
| (CME Term SOFR 1-Month plus 0.25%) |
| |||||||||
5.58% | 07/25/471 | 26,651,857 | 24,338,041 | |||||||
| Deutsche ALT-A Securities, Inc., Mortgage Loan Trust, |
| |||||||||
| Series 2005-6, Class 1A7 |
| |||||||||
5.50% | 12/25/35 | 227,268 | 182,636 | |||||||
| Deutsche ALT-A Securities, Inc., Mortgage Loan Trust, |
| |||||||||
| Series 2006-AR1, Class 2A1 |
| |||||||||
3.87% | 02/25/366 | 479,521 | 323,596 | |||||||
| DSLA Mortgage Loan Trust, |
| |||||||||
| Series 2004-AR4, Class 2A1A |
| |||||||||
| (CME Term SOFR 1-Month plus 0.83%) |
| |||||||||
6.16% | 01/19/451 | 1,041,424 | 832,199 | |||||||
| DSLA Mortgage Loan Trust, |
| |||||||||
| Series 2005-AR1, Class 2A1A |
| |||||||||
| (CME Term SOFR 1-Month plus 0.61%) |
| |||||||||
5.94% | 02/19/451 | 56,896 | 55,211 | |||||||
| DSLA Mortgage Loan Trust, |
| |||||||||
| Series 2005-AR3, Class 2A1A |
| |||||||||
| (CME Term SOFR 1-Month plus 0.59%) |
| |||||||||
5.92% | 07/19/451 | 62,010 | 57,215 | |||||||
| DSLA Mortgage Loan Trust, |
| |||||||||
| Series 2006-AR2, Class 2A1A |
| |||||||||
| (CME Term SOFR 1-Month plus 0.31%) |
| |||||||||
5.64% | 10/19/361 | 13,071,319 | 8,343,582 | |||||||
| DSLA Mortgage Loan Trust, |
| |||||||||
| Series 2007-AR1, Class 2A1A |
| |||||||||
| (CME Term SOFR 1-Month plus 0.25%) |
| |||||||||
5.58% | 03/19/371 | 5,238,253 | 4,382,818 | |||||||
| Equity One Mortgage Pass-Through Trust, |
| |||||||||
| Series 2002-4, Class M1 |
| |||||||||
5.22% | 02/25/336 | 5,654 | 5,420 | |||||||
| Equity One Mortgage Pass-Through Trust, |
| |||||||||
| Series 2002-5, Class M1 (STEP-reset date 05/25/24) |
| |||||||||
5.80% | 11/25/32 | 28,245 | 27,463 | |||||||
| Fannie Mae Connecticut Avenue Securities, |
| |||||||||
| Series 2019-R07, Class 1B1 |
| |||||||||
| (SOFR30A plus 3.51%) |
| |||||||||
8.83% | 10/25/391,2 | 11,882,286 | 12,238,645 | |||||||
| Fannie Mae Connecticut Avenue Securities, |
| |||||||||
| Series 2021-R01, Class 1B1 |
| |||||||||
| (SOFR30A plus 3.10%) |
| |||||||||
8.42% | 10/25/411,2 | 5,660,000 | 5,831,644 | |||||||
| Fannie Mae Connecticut Avenue Securities, |
| |||||||||
| Series 2022-R01, Class 1M2 |
| |||||||||
| (SOFR30A plus 1.90%) |
| |||||||||
7.22% | 12/25/411,2 | 28,907,099 | 29,143,886 | |||||||
| First Franklin Mortgage Loan Trust, |
| |||||||||
| Series 2006-FF13, Class A2C |
| |||||||||
| (CME Term SOFR 1-Month plus 0.43%) |
| |||||||||
5.76% | 10/25/361 | 9,052,001 | 5,822,706 | |||||||
See accompanying Notes to Financial Statements.
| 185 / Annual Report March 2024 |
Table of Contents
Total Return Bond Fund
Schedule of Portfolio Investments
March 31, 2024
| Issues | Maturity Date | Principal Amount | Value | |||||||
| MORTGAGE-BACKED (continued) |
| |||||||||
Non-Agency Mortgage-Backed (continued) |
| |||||||||
| First Franklin Mortgage Loan Trust, |
| |||||||||
| Series 2006-FF13, Class A2D |
| |||||||||
| (CME Term SOFR 1-Month plus 0.59%) |
| |||||||||
5.92% | 10/25/361 | $ | 570,797 | $ | 367,759 | |||||
| First Franklin Mortgage Loan Trust, |
| |||||||||
| Series 2006-FF18, Class A2B |
| |||||||||
| (CME Term SOFR 1-Month plus 0.33%) |
| |||||||||
5.66% | 12/25/371 | 4,637,056 | 4,132,696 | |||||||
| First Franklin Mortgage Loan Trust, |
| |||||||||
| Series 2006-FF18, Class A2C |
| |||||||||
| (CME Term SOFR 1-Month plus 0.43%) |
| |||||||||
5.76% | 12/25/371 | 12,752,320 | 11,369,245 | |||||||
| First Franklin Mortgage Loan Trust, |
| |||||||||
| Series 2006-FF18, Class A2D |
| |||||||||
| (CME Term SOFR 1-Month plus 0.53%) |
| |||||||||
5.86% | 12/25/371 | 9,242,466 | 8,241,305 | |||||||
| First Franklin Mortgage Loan Trust, |
| |||||||||
| Series 2006-FF5, Class 1A |
| |||||||||
| (CME Term SOFR 1-Month plus 0.41%) |
| |||||||||
5.74% | 04/25/361 | 3,995,227 | 3,997,073 | |||||||
| First Franklin Mortgage Loan Trust, |
| |||||||||
| Series 2007-FF1, Class A2C |
| |||||||||
| (CME Term SOFR 1-Month plus 0.39%) |
| |||||||||
5.72% | 01/25/381 | 49,947,268 | 26,150,072 | |||||||
| First Franklin Mortgage Loan Trust, |
| |||||||||
| Series 2007-FF2, Class A1 |
| |||||||||
| (CME Term SOFR 1-Month plus 0.39%) |
| |||||||||
5.72% | 03/25/371 | 45,043,100 | 23,244,505 | |||||||
| First Franklin Mortgage Loan Trust, |
| |||||||||
| Series 2007-FF2, Class A2B |
| |||||||||
| (CME Term SOFR 1-Month plus 0.31%) |
| |||||||||
5.64% | 03/25/371 | 19,910,619 | 9,727,054 | |||||||
| First Franklin Mortgage Loan Trust, |
| |||||||||
| Series 2007-FF2, Class A2C |
| |||||||||
| (CME Term SOFR 1-Month plus 0.41%) |
| |||||||||
5.74% | 03/25/371 | 11,414,439 | 5,593,227 | |||||||
| First Franklin Mortgage Loan Trust, |
| |||||||||
| Series 2007-FF2, Class A2D |
| |||||||||
| (CME Term SOFR 1-Month plus 0.55%) |
| |||||||||
5.88% | 03/25/371 | 33,765,223 | 16,596,705 | |||||||
| First Horizon Alternative Mortgage Securities Trust, |
| |||||||||
| Series 2004-AA2, Class 1A1 |
| |||||||||
6.52% | 08/25/346 | 2,498,659 | 2,443,740 | |||||||
| First Horizon Alternative Mortgage Securities Trust, |
| |||||||||
| Series 2004-AA3, Class A1 |
| |||||||||
5.82% | 09/25/346 | 5,725 | 5,634 | |||||||
| First Horizon Alternative Mortgage Securities Trust, |
| |||||||||
| Series 2004-AA4, Class A1 |
| |||||||||
6.09% | 10/25/346 | 377,758 | 368,996 | |||||||
| First Horizon Alternative Mortgage Securities Trust, |
| |||||||||
| Series 2005-AA10, Class 1A1 |
| |||||||||
6.19% | 12/25/356 | 6,413,465 | 5,314,377 | |||||||
| First Horizon Alternative Mortgage Securities Trust, |
| |||||||||
| Series 2005-AA12, Class 2A1 |
| |||||||||
5.72% | 02/25/366 | 6,466,412 | 4,295,450 | |||||||
| Issues | Maturity Date | Principal Amount | Value | |||||||
| MORTGAGE-BACKED (continued) |
| |||||||||
Non-Agency Mortgage-Backed (continued) |
| |||||||||
| First Horizon Alternative Mortgage Securities Trust, |
| |||||||||
| Series 2005-AA4, Class 2A1 |
| |||||||||
5.82% | 06/25/356 | $ | 6,674,916 | $ | 6,056,173 | |||||
| First Horizon Alternative Mortgage Securities Trust, |
| |||||||||
| Series 2005-AA7, Class 2A1 |
| |||||||||
6.08% | 09/25/356 | 4,930,613 | 4,301,487 | |||||||
| First Horizon Alternative Mortgage Securities Trust, |
| |||||||||
| Series 2005-AA8, Class 2A1 |
| |||||||||
5.87% | 10/25/356 | 7,309,385 | 4,546,462 | |||||||
| First Horizon Alternative Mortgage Securities Trust, |
| |||||||||
| Series 2005-AA9, Class 2A1 |
| |||||||||
6.16% | 11/25/356 | 6,491,300 | 5,535,224 | |||||||
| First Horizon Mortgage Pass-Through Trust, |
| |||||||||
| Series 2004-AR6, Class 2A1 |
| |||||||||
4.73% | 12/25/346 | 67,728 | 64,261 | |||||||
| First Horizon Mortgage Pass-Through Trust, |
| |||||||||
| Series 2006-AR4, Class 1A2 |
| |||||||||
5.15% | 01/25/376 | 40,902 | 22,088 | |||||||
| First Horizon Mortgage Pass-Through Trust, |
| |||||||||
| Series 2007-AR3, Class 1A1 |
| |||||||||
4.82% | 11/25/376 | 71,393 | 32,454 | |||||||
| Freddie Mac Structured Agency Credit Risk Debt Notes, |
| |||||||||
| Series 2021-DNA3, Class M2 |
| |||||||||
| (SOFR30A plus 2.10%) |
| |||||||||
7.42% | 10/25/331,2 | 23,022,000 | 23,470,405 | |||||||
| Freddie Mac Structured Agency Credit Risk Debt Notes, |
| |||||||||
| Series 2021-HQA1, Class M2 |
| |||||||||
| (SOFR30A plus 2.25%) |
| |||||||||
7.57% | 08/25/331,2 | 10,931,425 | 11,194,540 | |||||||
| Freddie Mac Structured Agency Credit Risk Debt Notes, |
| |||||||||
| Series 2022-DNA2, Class M1B |
| |||||||||
| (SOFR30A plus 2.40%) |
| |||||||||
7.72% | 02/25/421,2 | 18,930,000 | 19,294,668 | |||||||
| Freddie Mac Structured Agency Credit Risk Debt Notes, |
| |||||||||
| Series 2022-DNA3, Class M1B |
| |||||||||
| (SOFR30A plus 2.90%) |
| |||||||||
8.22% | 04/25/421,2 | 7,000,000 | 7,251,731 | |||||||
| GMACM Home Equity Loan Trust, |
| |||||||||
| Series 2000-HE2, Class A1 |
| |||||||||
| (CME Term SOFR 1-Month plus 0.55%) |
| |||||||||
4.64% | 06/25/301 | 7,720 | 7,098 | |||||||
| GMACM Mortgage Corp. Loan Trust, |
| |||||||||
| Series 2005-AR6, Class 3A1 |
| |||||||||
4.25% | 11/19/356 | 172,652 | 144,461 | |||||||
| GMACM Mortgage Corp. Loan Trust, |
| |||||||||
| Series 2006-AR2, Class 1A1 |
| |||||||||
0.00% | 05/19/366 | 1,539,215 | 887,863 | |||||||
| GreenPoint Mortgage Funding Trust, |
| |||||||||
| Series 2005-AR4, Class G41B |
| |||||||||
| (CME Term SOFR 1-Month plus 0.31%) |
| |||||||||
5.64% | 10/25/451 | 10,203,844 | 9,714,777 | |||||||
| GreenPoint Mortgage Funding Trust, |
| |||||||||
| Series 2006-OH1, Class A1 |
| |||||||||
| (CME Term SOFR 1-Month plus 0.47%) |
| |||||||||
5.80% | 01/25/371 | 9,014,790 | 7,901,030 | |||||||
See accompanying Notes to Financial Statements.
| Annual Report March 2024 / 186 |
Table of Contents
Total Return Bond Fund
Schedule of Portfolio Investments
March 31, 2024
| Issues | Maturity Date | Principal Amount | Value | |||||||
| MORTGAGE-BACKED (continued) |
| |||||||||
Non-Agency Mortgage-Backed (continued) |
| |||||||||
| GS Mortgage-Backed Securities Corp. Trust, |
| |||||||||
| Series 2022-PJ2, Class A4 |
| |||||||||
2.50% | 06/25/522,6 | $ | 27,813,028 | $ | 22,445,982 | |||||
| GS Mortgage-Backed Securities Corp. Trust, |
| |||||||||
| Series 2022-PJ4, Class A4 |
| |||||||||
2.50% | 09/25/522,6 | 64,615,706 | 52,146,890 | |||||||
| GS Mortgage-Backed Securities Trust, |
| |||||||||
| Series 2018-RPL1, Class A1A |
| |||||||||
3.75% | 10/25/572 | 15,987,839 | 15,374,109 | |||||||
| GS Mortgage-Backed Securities Trust, |
| |||||||||
| Series 2021-PJ9, Class A2 |
| |||||||||
2.50% | 02/26/522,6 | 8,241,739 | 6,646,190 | |||||||
| GS Mortgage-Backed Securities Trust, |
| |||||||||
| Series 2022-PJ5, Class A4 |
| |||||||||
2.50% | 10/25/522,6 | 73,072,409 | 58,971,714 | |||||||
| GS Mortgage-Backed Securities Trust, |
| |||||||||
| Series 2022-PJ6, Class A3 |
| |||||||||
2.50% | 01/25/532,6 | 95,671,324 | 77,209,743 | |||||||
| GS Mortgage-Backed Securities Trust, |
| |||||||||
| Series 2023-PJ1, Class A3 |
| |||||||||
3.00% | 02/25/532,6 | 93,836,796 | 78,790,845 | |||||||
| GSAA Home Equity Trust, |
| |||||||||
| Series 2005-11, Class 2A2 |
| |||||||||
| (CME Term SOFR 1-Month plus 0.75%) |
| |||||||||
6.08% | 10/25/351 | 55,191 | 54,872 | |||||||
| GSAA Home Equity Trust, |
| |||||||||
| Series 2005-11, Class 3A2 |
| |||||||||
| (CME Term SOFR 1-Month plus 0.75%) |
| |||||||||
6.08% | 10/25/351 | 10,948 | 11,238 | |||||||
| GSAA Home Equity Trust, |
| |||||||||
| Series 2005-6, Class M1 |
| |||||||||
| (CME Term SOFR 1-Month plus 0.76%) |
| |||||||||
6.09% | 06/25/351 | 21,320 | 21,243 | |||||||
| GSAMP Trust, |
| |||||||||
| Series 2005-AHL2, Class A2D |
| |||||||||
| (CME Term SOFR 1-Month plus 0.81%) |
| |||||||||
6.14% | 12/25/351 | 15,931,498 | 14,949,802 | |||||||
| GSAMP Trust, |
| |||||||||
| Series 2007-HE2, Class A1 |
| |||||||||
| (CME Term SOFR 1-Month plus 0.35%) |
| |||||||||
5.68% | 03/25/471 | 63,226,372 | 52,222,827 | |||||||
| GSMSC Resecuritization Trust, |
| |||||||||
| Series 2015-3R, Class 1B |
| |||||||||
| (CME Term SOFR 1-Month plus 0.39%) |
| |||||||||
5.72% | 01/26/371,2 | 13,563,350 | 12,219,433 | |||||||
| GSR Mortgage Loan Trust, |
| |||||||||
| Series 2004-9, Class 3A1 |
| |||||||||
4.94% | 08/25/346 | 1,695 | 1,589 | |||||||
| GSR Mortgage Loan Trust, |
| |||||||||
| Series 2004-9, Class 5A7 |
| |||||||||
4.61% | 08/25/346 | 25,395 | 25,250 | |||||||
| GSR Mortgage Loan Trust, |
| |||||||||
| Series 2005-AR5, Class 2A3 |
| |||||||||
4.76% | 10/25/356 | 1,730,617 | 950,056 | |||||||
| Issues | Maturity Date | Principal Amount | Value | |||||||
| MORTGAGE-BACKED (continued) |
| |||||||||
Non-Agency Mortgage-Backed (continued) |
| |||||||||
| GSR Mortgage Loan Trust, |
| |||||||||
| Series 2005-AR6, Class 4A5 |
| |||||||||
5.47% | 09/25/356 | $ | 40,789 | $ | 38,739 | |||||
| GSR Mortgage Loan Trust, |
| |||||||||
| Series 2007-AR2, Class 2A1 |
| |||||||||
5.04% | 05/25/376 | 1,161,754 | 658,624 | |||||||
| HarborView Mortgage Loan Trust, |
| |||||||||
| Series 2004-1, Class 2A |
| |||||||||
6.02% | 04/19/346 | 3,163 | 3,035 | |||||||
| HarborView Mortgage Loan Trust, |
| |||||||||
| Series 2004-11, Class 3A2A |
| |||||||||
| (CME Term SOFR 1-Month plus 0.79%) |
| |||||||||
6.12% | 01/19/351 | 150,345 | 141,242 | |||||||
| HarborView Mortgage Loan Trust, |
| |||||||||
| Series 2004-3, Class 1A |
| |||||||||
5.64% | 05/19/346 | 28,434 | 27,187 | |||||||
| HarborView Mortgage Loan Trust, |
| |||||||||
| Series 2004-5, Class 2A6 |
| |||||||||
4.58% | 06/19/346 | 1,123 | 1,056 | |||||||
| HarborView Mortgage Loan Trust, |
| |||||||||
| Series 2005-3, Class 2A1A |
| |||||||||
| (CME Term SOFR 1-Month plus 0.59%) |
| |||||||||
5.92% | 06/19/351 | 136,812 | 129,184 | |||||||
| HarborView Mortgage Loan Trust, |
| |||||||||
| Series 2006-1, Class 2A1A |
| |||||||||
| (CME Term SOFR 1-Month plus 0.59%) |
| |||||||||
5.92% | 03/19/361 | 9,845,938 | 9,022,727 | |||||||
| HarborView Mortgage Loan Trust, |
| |||||||||
| Series 2006-10, Class 1A1A |
| |||||||||
| (CME Term SOFR 1-Month plus 0.51%) |
| |||||||||
5.83% | 11/19/361 | 47,966,283 | 37,969,290 | |||||||
| HarborView Mortgage Loan Trust, |
| |||||||||
| Series 2006-4, Class 1A1A |
| |||||||||
| (CME Term SOFR 1-Month plus 0.47%) |
| |||||||||
5.80% | 05/19/461 | 29,001,012 | 15,333,183 | |||||||
| HarborView Mortgage Loan Trust, |
| |||||||||
| Series 2006-5, Class 1A1A |
| |||||||||
| (Federal Reserve US 12-Month Cumulative Average plus 0.91%) |
| |||||||||
6.00% | 07/19/471 | 33,258,468 | 12,575,958 | |||||||
| HarborView Mortgage Loan Trust, |
| |||||||||
| Series 2006-7, Class 1A |
| |||||||||
| (CME Term SOFR 1-Month plus 0.53%) |
| |||||||||
5.86% | 09/19/461 | 49,335,275 | 42,013,377 | |||||||
| HarborView Mortgage Loan Trust, |
| |||||||||
| Series 2007-7, Class 1A1 |
| |||||||||
| (CME Term SOFR 1-Month plus 2.11%) |
| |||||||||
6.44% | 10/25/371 | 15,517,882 | 12,401,317 | |||||||
| HarborView Mortgage Loan Trust, |
| |||||||||
| Series 2007-7, Class 2A1A |
| |||||||||
| (CME Term SOFR 1-Month plus 2.11%) |
| |||||||||
6.44% | 10/25/371 | 11,863,036 | 11,166,328 | |||||||
| HSI Asset Securitization Corp. Trust, |
| |||||||||
| Series 2006-HE1, Class 1A1 |
| |||||||||
| (CME Term SOFR 1-Month plus 0.39%) |
| |||||||||
5.72% | 10/25/361 | 51,282,910 | 16,655,212 | |||||||
See accompanying Notes to Financial Statements.
| 187 / Annual Report March 2024 |
Table of Contents
Total Return Bond Fund
Schedule of Portfolio Investments
March 31, 2024
| Issues | Maturity Date | Principal Amount | Value | |||||||||
| MORTGAGE-BACKED (continued) |
| |||||||||||
| Non-Agency Mortgage-Backed (continued) |
| |||||||||||
Impac CMB Trust, |
| |||||||||||
Series 2004-8, Class 2A1 |
| |||||||||||
(CME Term SOFR 1-Month plus 0.81%) |
| |||||||||||
6.14% | 10/25/341 | $ | 42,083 | $ | 41,424 | |||||||
Impac CMB Trust, |
| |||||||||||
Series 2005-1, Class 1A1 |
| |||||||||||
(CME Term SOFR 1-Month plus 0.63%) |
| |||||||||||
5.96% | 04/25/351 | 1,493,588 | 1,411,741 | |||||||||
Impac Secured Assets Trust, |
| |||||||||||
Series 2006-3, Class A1 |
| |||||||||||
(CME Term SOFR 1-Month plus 0.45%) |
| |||||||||||
5.78% | 11/25/361 | 3,588,865 | 3,213,659 | |||||||||
Impac Secured Assets Trust, |
| |||||||||||
Series 2006-5, Class 1A1C |
| |||||||||||
(CME Term SOFR 1-Month plus 0.65%) |
| |||||||||||
5.98% | 02/25/371 | 6,143,441 | 5,479,512 | |||||||||
Impac Secured Assets Trust, |
| |||||||||||
Series 2007-2, Class 1A1B |
| |||||||||||
(CME Term SOFR 1-Month plus 0.61%) |
| |||||||||||
5.94% | 05/25/371 | 28,645,615 | 23,455,758 | |||||||||
IndyMac Index Mortgage Loan Trust, |
| |||||||||||
Series 2004-AR4, Class 1A |
| |||||||||||
4.67% | 08/25/346 | 568,282 | 534,667 | |||||||||
IndyMac Index Mortgage Loan Trust, |
| |||||||||||
Series 2004-AR7, Class A2 |
| |||||||||||
(CME Term SOFR 1-Month plus 0.97%) |
| |||||||||||
6.30% | 09/25/341 | 33,381 | 28,729 | |||||||||
IndyMac Index Mortgage Loan Trust, |
| |||||||||||
Series 2005-AR1, Class 4A1 |
| |||||||||||
4.50% | 03/25/356 | 33,115 | 32,745 | |||||||||
IndyMac Index Mortgage Loan Trust, |
| |||||||||||
Series 2005-AR19, Class A1 |
| |||||||||||
3.71% | 10/25/356 | 16,907,905 | 13,415,248 | |||||||||
IndyMac Index Mortgage Loan Trust, |
| |||||||||||
Series 2005-AR6, Class 2A1 |
| |||||||||||
(CME Term SOFR 1-Month plus 0.59%) |
| |||||||||||
5.92% | 04/25/351 | 324,225 | 268,302 | |||||||||
IndyMac Index Mortgage Loan Trust, |
| |||||||||||
Series 2006-AR19, Class 1A2 |
| |||||||||||
3.86% | 08/25/366 | 10,136,726 | 6,851,192 | |||||||||
IndyMac Index Mortgage Loan Trust, |
| |||||||||||
Series 2006-AR27, Class 2A2 |
| |||||||||||
(CME Term SOFR 1-Month plus 0.51%) |
| |||||||||||
5.84% | 10/25/361 | 10,756,089 | 9,434,555 | |||||||||
IndyMac Index Mortgage Loan Trust, |
| |||||||||||
Series 2006-AR35, Class 2A3A |
| |||||||||||
(CME Term SOFR 1-Month plus 0.51%) |
| |||||||||||
5.84% | 01/25/371 | 25,375,836 | 22,494,646 | |||||||||
IndyMac Index Mortgage Loan Trust, |
| |||||||||||
Series 2006-AR7, Class 1A1 |
| |||||||||||
3.82% | 05/25/366 | 2,531,743 | 2,108,667 | |||||||||
IndyMac Index Mortgage Loan Trust, |
| |||||||||||
Series 2006-AR7, Class 2A1 |
| |||||||||||
3.76% | 05/25/366 | 17,497,631 | 12,066,539 | |||||||||
| Issues | Maturity Date | Principal Amount | Value | |||||||||
| MORTGAGE-BACKED (continued) |
| |||||||||||
| Non-Agency Mortgage-Backed (continued) |
| |||||||||||
IndyMac Index Mortgage Loan Trust, |
| |||||||||||
Series 2007-AR1, Class 1A2 |
| |||||||||||
4.02% | 03/25/376 | $ | 283,185 | $ | 213,029 | |||||||
IndyMac Index Mortgage Loan Trust, |
| |||||||||||
Series 2007-AR11, Class 1A1 |
| |||||||||||
3.11% | 06/25/376 | 2,272,004 | 1,966,276 | |||||||||
IndyMac Index Mortgage Loan Trust, |
| |||||||||||
Series 2007-AR7, Class 1A1 |
| |||||||||||
3.50% | 11/25/376 | 1,416,246 | 1,157,012 | |||||||||
IndyMac Manufactured Housing Contract Pass-Through |
| |||||||||||
Certificates, |
| |||||||||||
Series 1997-1, Class A3 |
| |||||||||||
6.61% | 02/25/28 | 13,566 | 13,446 | |||||||||
JPMorgan Alternative Loan Trust, |
| |||||||||||
Series 2006-A2, Class 5A1 |
| |||||||||||
4.02% | 05/25/366 | 3,843,947 | 2,231,586 | |||||||||
JPMorgan Mortgage Acquisition Trust, |
| |||||||||||
| Series 2006-WF1, Class A3A (STEP-reset date 05/25/24) |
| |||||||||||
6.33% | 07/25/36 | 27,542,600 | 7,479,446 | |||||||||
JPMorgan Mortgage Acquisition Trust, |
| |||||||||||
Series 2006-WF1, Class A6 (STEP-reset date 05/25/24) |
| |||||||||||
6.50% | 07/25/36 | 3,840,749 | 1,102,994 | |||||||||
JPMorgan Mortgage Acquisition Trust, |
| |||||||||||
Series 2007-CH5, Class A5 |
| |||||||||||
(CME Term SOFR 1-Month plus 0.37%) |
| |||||||||||
5.70% | 06/25/371 | 3,296 | 3,293 | |||||||||
JPMorgan Mortgage Acquisition Trust, |
| |||||||||||
Series 2007-HE1, Class AF1 |
| |||||||||||
(CME Term SOFR 1-Month plus 0.21%) |
| |||||||||||
4.59% | 03/25/471 | 99,385 | 64,826 | |||||||||
JPMorgan Mortgage Acquisition Trust, |
| |||||||||||
Series 2007-HE1, Class AF2 (STEP-reset date 05/25/24) |
| |||||||||||
4.29% | 03/25/47 | 6,501,595 | 4,201,693 | |||||||||
JPMorgan Mortgage Acquisition Trust, |
| |||||||||||
Series 2007-HE1, Class AF3 (STEP-reset date 05/25/24) |
| |||||||||||
4.29% | 05/25/35 | 5,471,885 | 3,536,216 | |||||||||
JPMorgan Mortgage Acquisition Trust, |
| |||||||||||
Series 2007-HE1, Class AF4 (STEP-reset date 05/25/24) |
| |||||||||||
4.29% | 03/25/47 | 2,487,221 | 1,607,350 | |||||||||
JPMorgan Mortgage Acquisition Trust, |
| |||||||||||
Series 2007-HE1, Class AV4 |
| |||||||||||
(CME Term SOFR 1-Month plus 0.39%) |
| |||||||||||
5.72% | 03/25/471 | 240,000 | 219,080 | |||||||||
JPMorgan Mortgage Trust, |
| |||||||||||
Series 2003-A2, Class 2A3 |
| |||||||||||
4.91% | 11/25/336 | 39,626 | 38,059 | |||||||||
JPMorgan Mortgage Trust, |
| |||||||||||
Series 2004-A4, Class 1A3 |
| |||||||||||
5.96% | 09/25/346 | 91,880 | 85,414 | |||||||||
JPMorgan Mortgage Trust, |
| |||||||||||
Series 2005-A5, Class TA1 |
| |||||||||||
5.94% | 08/25/356 | 39,147 | 36,313 | |||||||||
JPMorgan Mortgage Trust, |
| |||||||||||
Series 2005-S2, Class 4A3 |
| |||||||||||
5.50% | 09/25/20 | 1,603,731 | 1,058,215 | |||||||||
See accompanying Notes to Financial Statements.
| Annual Report March 2024 / 188 |
Table of Contents
Total Return Bond Fund
Schedule of Portfolio Investments
March 31, 2024
| Issues | Maturity Date | Principal Amount | Value | |||||||||
MORTGAGE-BACKED (continued) |
| |||||||||||
| Non-Agency Mortgage-Backed (continued) |
| |||||||||||
JPMorgan Mortgage Trust, |
| |||||||||||
Series 2006-A2, Class 5A3 |
| |||||||||||
6.09% | 11/25/336 | $ | 966 | $ | 963 | |||||||
JPMorgan Mortgage Trust, |
| |||||||||||
Series 2006-A3, Class 2A1 |
| |||||||||||
4.91% | 05/25/366 | 435,401 | 364,989 | |||||||||
JPMorgan Mortgage Trust, |
| |||||||||||
Series 2006-A3, Class 3A3 |
| |||||||||||
4.29% | 05/25/366 | 281,583 | 226,838 | |||||||||
JPMorgan Mortgage Trust, |
| |||||||||||
Series 2006-A4, Class 1A1 |
| |||||||||||
4.64% | 06/25/366 | 244,851 | 177,393 | |||||||||
JPMorgan Mortgage Trust, |
| |||||||||||
Series 2006-A4, Class 1A4 |
| |||||||||||
4.64% | 06/25/366 | 789,322 | 571,860 | |||||||||
JPMorgan Mortgage Trust, |
| |||||||||||
Series 2006-A5, Class 2A4 |
| |||||||||||
5.07% | 08/25/366 | 215,543 | 173,865 | |||||||||
JPMorgan Mortgage Trust, |
| |||||||||||
Series 2007-A1, Class 5A2 |
| |||||||||||
5.52% | 07/25/356 | 489,321 | 477,488 | |||||||||
JPMorgan Mortgage Trust, |
| |||||||||||
Series 2007-A3, Class 2A3 |
| |||||||||||
4.90% | 05/25/376 | 1,079,012 | 882,639 | |||||||||
JPMorgan Mortgage Trust, |
| |||||||||||
Series 2007-A3, Class 3A2 |
| |||||||||||
4.43% | 05/25/376 | 182,443 | 158,935 | |||||||||
JPMorgan Mortgage Trust, |
| |||||||||||
Series 2007-A4, Class 1A1 |
| |||||||||||
4.49% | 06/25/376 | 1,589,712 | 1,228,903 | |||||||||
JPMorgan Mortgage Trust, |
| |||||||||||
Series 2007-A4, Class 2A3 |
| |||||||||||
4.63% | 06/25/376 | 223,994 | 173,584 | |||||||||
JPMorgan Mortgage Trust, |
| |||||||||||
Series 2021-13, Class A3A |
| |||||||||||
2.00% | 04/25/522,6 | 46,074,897 | 35,488,715 | |||||||||
JPMorgan Mortgage Trust, |
| |||||||||||
Series 2021-14, Class A3A |
| |||||||||||
2.00% | 05/25/522,6 | 35,065,044 | 26,946,947 | |||||||||
JPMorgan Mortgage Trust, |
| |||||||||||
Series 2021-INV8, Class A2 |
| |||||||||||
3.00% | 05/25/522,6 | 41,189,358 | 34,644,114 | |||||||||
Lehman ABS Mortgage Loan Trust, |
| |||||||||||
Series 2007-1, Class 2A2 |
| |||||||||||
(CME Term SOFR 1-Month plus 0.31%) |
| |||||||||||
5.64% | 06/25/371,2 | 168,867 | 110,984 | |||||||||
Lehman XS Trust, |
| |||||||||||
Series 2005-5N, Class 3A1A |
| |||||||||||
(CME Term SOFR 1-Month plus 0.41%) |
| |||||||||||
5.74% | 11/25/351 | 1,104,662 | 1,086,003 | |||||||||
Lehman XS Trust, |
| |||||||||||
Series 2005-7N, Class 1A1A |
| |||||||||||
(CME Term SOFR 1-Month plus 0.65%) |
| |||||||||||
5.98% | 12/25/351 | 229,216 | 212,390 | |||||||||
| Issues | Maturity Date | Principal Amount | Value | |||||||||
MORTGAGE-BACKED (continued) |
| |||||||||||
| Non-Agency Mortgage-Backed (continued) |
| |||||||||||
Lehman XS Trust, |
| |||||||||||
Series 2006-12N, Class A31A |
| |||||||||||
(CME Term SOFR 1-Month plus 0.51%) |
| |||||||||||
5.84% | 08/25/461 | $ | 6,849,029 | $ | 6,777,814 | |||||||
Lehman XS Trust, |
| |||||||||||
Series 2006-14N, Class 3A2 |
| |||||||||||
(CME Term SOFR 1-Month plus 0.35%) |
| |||||||||||
5.68% | 08/25/361 | 22,466 | 22,864 | |||||||||
Lehman XS Trust, |
| |||||||||||
Series 2006-5, Class 1A1A |
| |||||||||||
(CME Term SOFR 1-Month plus 0.53%) |
| |||||||||||
5.86% | 04/25/361 | 17,488,664 | 14,854,406 | |||||||||
Lehman XS Trust, |
| |||||||||||
Series 2006-8, Class 1A1A |
| |||||||||||
(CME Term SOFR 1-Month plus 0.27%) |
| |||||||||||
5.38% | 06/25/361 | 22,156,630 | 19,445,326 | |||||||||
Lehman XS Trust, |
| |||||||||||
Series 2007-4N, Class 1A3 |
| |||||||||||
(CME Term SOFR 1-Month plus 0.59%) |
| |||||||||||
5.92% | 03/25/471 | 14,257,994 | 12,232,158 | |||||||||
Long Beach Mortgage Loan Trust, |
| |||||||||||
Series 2004-4, Class M1 |
| |||||||||||
(CME Term SOFR 1-Month plus 1.01%) |
| |||||||||||
6.34% | 10/25/341 | 47,781 | 45,985 | |||||||||
Luminent Mortgage Trust, |
| |||||||||||
Series 2006-5, Class A1A |
| |||||||||||
(CME Term SOFR 1-Month plus 0.49%) |
| |||||||||||
5.82% | 07/25/361 | 26,525,932 | 16,927,807 | |||||||||
Luminent Mortgage Trust, |
| |||||||||||
Series 2006-6, Class A1 |
| |||||||||||
(CME Term SOFR 1-Month plus 0.51%) |
| |||||||||||
5.84% | 10/25/461 | 8,879,044 | 7,747,737 | |||||||||
MASTR Adjustable Rate Mortgages Trust, |
| |||||||||||
Series 2003-6, Class 4A2 |
| |||||||||||
4.37% | 01/25/346 | 10,216 | 9,769 | |||||||||
MASTR Adjustable Rate Mortgages Trust, |
| |||||||||||
Series 2003-7, Class 3A1 |
| |||||||||||
5.81% | 11/25/336 | 246,362 | 237,265 | |||||||||
MASTR Adjustable Rate Mortgages Trust, |
| |||||||||||
Series 2004-13, Class 3A1 |
| |||||||||||
5.37% | 11/21/346 | 1,447,208 | 1,358,963 | |||||||||
MASTR Adjustable Rate Mortgages Trust, |
| |||||||||||
Series 2004-8, Class 2A1 |
| |||||||||||
5.11% | 09/25/346 | 1,167,420 | 1,104,667 | |||||||||
MASTR Adjustable Rate Mortgages Trust, |
| |||||||||||
Series 2006-2, Class 5A1 |
| |||||||||||
4.36% | 05/25/366 | 5,131,015 | 2,064,261 | |||||||||
MASTR Adjustable Rate Mortgages Trust, |
| |||||||||||
Series 2007-1, Class I1A |
| |||||||||||
(CME Term SOFR 1-Month plus 0.50%) |
| |||||||||||
5.83% | 01/25/471 | 79,808,457 | 33,591,547 | |||||||||
MASTR Asset-Backed Securities Trust, |
| |||||||||||
Series 2006-HE4, Class A3 |
| |||||||||||
(CME Term SOFR 1-Month plus 0.41%) |
| |||||||||||
5.74% | 11/25/361 | 12,152,323 | 3,877,892 | |||||||||
See accompanying Notes to Financial Statements.
| 189 / Annual Report March 2024 |
Table of Contents
Total Return Bond Fund
Schedule of Portfolio Investments
March 31, 2024
| Issues | Maturity Date | Principal Amount | Value | |||||||||
MORTGAGE-BACKED (continued) |
| |||||||||||
| Non-Agency Mortgage-Backed (continued) |
| |||||||||||
MASTR Asset-Backed Securities Trust, |
| |||||||||||
Series 2006-HE4, Class A4 |
| |||||||||||
(CME Term SOFR 1-Month plus 0.53%) |
| |||||||||||
5.86% | 11/25/361 | $ | 3,375,645 | $ | 1,046,731 | |||||||
MASTR Asset-Backed Securities Trust, |
| |||||||||||
Series 2007-HE1, Class A3 |
| |||||||||||
(CME Term SOFR 1-Month plus 0.32%) |
| |||||||||||
5.65% | 05/25/371 | 11,962,305 | 11,413,614 | |||||||||
MASTR Seasoned Securitization Trust, |
| |||||||||||
Series 2004-1, Class 4A1 |
| |||||||||||
6.22% | 10/25/326 | 6,857 | 6,620 | |||||||||
| Mellon Residential Funding Corp. Mortgage Pass-Through Certificates, |
| |||||||||||
Series 2001-TBC1, Class A1 |
| |||||||||||
(CME Term SOFR 1-Month plus 0.81%) |
| |||||||||||
6.14% | 11/15/311 | 330,334 | 312,057 | |||||||||
| Merrill Lynch First Franklin Mortgage Loan Trust, |
| |||||||||||
Series 2007-1, Class A1 |
| |||||||||||
(CME Term SOFR 1-Month plus 0.39%) |
| |||||||||||
5.72% | 04/25/371 | 125,033,470 | 55,002,886 | |||||||||
| Merrill Lynch First Franklin Mortgage Loan Trust, |
| |||||||||||
Series 2007-1, Class A2B |
| |||||||||||
(CME Term SOFR 1-Month plus 0.45%) |
| |||||||||||
5.78% | 04/25/371 | 25,104,300 | 9,832,586 | |||||||||
| Merrill Lynch First Franklin Mortgage Loan Trust, |
| |||||||||||
Series 2007-1, Class A2C |
| |||||||||||
(CME Term SOFR 1-Month plus 0.61%) |
| |||||||||||
5.94% | 04/25/371 | 52,589,540 | 20,774,283 | |||||||||
| Merrill Lynch First Franklin Mortgage Loan Trust, |
| |||||||||||
Series 2007-2, Class A2C |
| |||||||||||
(CME Term SOFR 1-Month plus 0.59%) |
| |||||||||||
5.92% | 05/25/371 | 25,879,291 | 19,280,202 | |||||||||
| Merrill Lynch First Franklin Mortgage Loan Trust, |
| |||||||||||
Series 2007-2, Class A2D |
| |||||||||||
(CME Term SOFR 1-Month plus 0.75%) |
| |||||||||||
6.08% | 05/25/371 | 12,780,317 | 9,554,034 | |||||||||
| Merrill Lynch First Franklin Mortgage Loan Trust, |
| |||||||||||
Series 2007-3, Class A2C |
| |||||||||||
(CME Term SOFR 1-Month plus 0.47%) |
| |||||||||||
5.80% | 06/25/371 | 4,423,753 | 4,258,365 | |||||||||
| Merrill Lynch First Franklin Mortgage Loan Trust, |
| |||||||||||
Series 2007-3, Class A2D |
| |||||||||||
(CME Term SOFR 1-Month plus 0.61%) |
| |||||||||||
5.94% | 06/25/371 | 6,592,923 | 6,362,559 | |||||||||
| Merrill Lynch First Franklin Mortgage Loan Trust, |
| |||||||||||
Series 2007-4, Class 2A2 |
| |||||||||||
(CME Term SOFR 1-Month plus 0.35%) |
| |||||||||||
5.68% | 07/25/371 | 10,583,639 | 9,290,508 | |||||||||
| Merrill Lynch First Franklin Mortgage Loan Trust, |
| |||||||||||
Series 2007-4, Class 2A3 |
| |||||||||||
(CME Term SOFR 1-Month plus 0.43%) |
| |||||||||||
5.76% | 07/25/371 | 7,758,071 | 6,837,005 | |||||||||
Merrill Lynch Mortgage Investors Trust, |
| |||||||||||
Series 2003-A6, Class 2A |
| |||||||||||
6.30% | 10/25/336 | 130,802 | 129,947 | |||||||||
| Issues | Maturity Date | Principal Amount | Value | |||||||||
MORTGAGE-BACKED (continued) |
| |||||||||||
| Non-Agency Mortgage-Backed (continued) |
| |||||||||||
Merrill Lynch Mortgage Investors Trust, |
| |||||||||||
Series 2004-A4, Class A1 |
| |||||||||||
4.92% | 08/25/346 | $ | 576,718 | $ | 545,124 | |||||||
Merrill Lynch Mortgage Investors Trust, |
| |||||||||||
Series 2005-A10, Class A |
| |||||||||||
(CME Term SOFR 1-Month plus 0.53%) |
| |||||||||||
5.86% | 02/25/361 | 3,976 | 3,790 | |||||||||
Merrill Lynch Mortgage Investors Trust, |
| |||||||||||
| Series 2006-WMC2, Class A2B (STEP-reset date 05/25/24) |
| |||||||||||
3.95% | 03/25/37 | 26,911,880 | 5,694,137 | |||||||||
Merrill Lynch Mortgage Investors Trust, |
| |||||||||||
| Series 2006-WMC2, Class A2D (STEP-reset date 05/25/24) |
| |||||||||||
3.95% | 03/25/37 | 21,063,003 | 4,276,961 | |||||||||
Merrill Lynch Mortgage Investors Trust, |
| |||||||||||
Series 2007-2, Class 1A1 |
| |||||||||||
(US Treasury Yield Curve Rate T Note Constant Maturity |
| |||||||||||
1-Year plus 2.40%) |
| |||||||||||
7.40% | 08/25/361 | 1,478,524 | 1,279,571 | |||||||||
Mid-State Capital Corp. Trust, |
| |||||||||||
Series 2005-1, Class A |
| |||||||||||
5.75% | 01/15/40 | 4,460,098 | 4,390,250 | |||||||||
Mid-State Capital Corp. Trust, |
| |||||||||||
Series 2006-1, Class A |
| |||||||||||
5.79% | 10/15/402 | 5,256,818 | 5,164,387 | |||||||||
Mid-State Trust XI, |
| |||||||||||
Series 11, Class A1 |
| |||||||||||
4.86% | 07/15/38 | 80,488 | 78,888 | |||||||||
Morgan Stanley Mortgage Loan Trust, |
| |||||||||||
Series 2004-11AR, Class 1A1 |
| |||||||||||
(CME Term SOFR 1-Month plus 0.43%) |
| |||||||||||
5.76% | 01/25/351 | 59,447 | 55,400 | |||||||||
Morgan Stanley Mortgage Loan Trust, |
| |||||||||||
Series 2004-7AR, Class 2A4 |
| |||||||||||
5.39% | 09/25/346 | 245,620 | 236,905 | |||||||||
Morgan Stanley Mortgage Loan Trust, |
| |||||||||||
Series 2005-2AR, Class A |
| |||||||||||
(CME Term SOFR 1-Month plus 0.37%) |
| |||||||||||
5.70% | 04/25/351 | 612,707 | 605,585 | |||||||||
Morgan Stanley Mortgage Loan Trust, |
| |||||||||||
Series 2006-7, Class 5A2 |
| |||||||||||
5.96% | 06/25/366 | 654,332 | 185,240 | |||||||||
Morgan Stanley Mortgage Loan Trust, |
| |||||||||||
Series 2007-7AX, Class 2A1 |
| |||||||||||
(CME Term SOFR 1-Month plus 0.35%) |
| |||||||||||
5.68% | 04/25/371 | 4,070,919 | 1,116,152 | |||||||||
Mortgage Funding PLC, |
| |||||||||||
Series 2008-1, Class A3 |
| |||||||||||
(United Kingdom) |
| |||||||||||
(SONIA plus 1.22%) |
| |||||||||||
6.44% | 03/13/461,3 | 9,900,000 | 12,458,608 | |||||||||
Mortgage IT Trust, |
| |||||||||||
Series 2005-1, Class 1A1 |
| |||||||||||
(CME Term SOFR 1-Month plus 0.75%) |
| |||||||||||
6.08% | 02/25/351 | 1,436,692 | 1,432,324 | |||||||||
See accompanying Notes to Financial Statements.
| Annual Report March 2024 / 190 |
Table of Contents
Total Return Bond Fund
Schedule of Portfolio Investments
March 31, 2024
| Issues | Maturity Date | Principal Amount | Value | |||||||||
MORTGAGE-BACKED (continued) |
| |||||||||||
| Non-Agency Mortgage-Backed (continued) |
| |||||||||||
MortgageIT Trust, |
| |||||||||||
Series 2005-4, Class A1 |
| |||||||||||
(CME Term SOFR 1-Month plus 0.67%) |
| |||||||||||
6.00% | 10/25/351 | $ | 1,486,422 | $ | 1,479,848 | |||||||
MortgageIT Trust, |
| |||||||||||
Series 2005-5, Class A1 |
| |||||||||||
(CME Term SOFR 1-Month plus 0.63%) |
| |||||||||||
5.96% | 12/25/351 | 311,963 | 301,372 | |||||||||
Nationstar Home Equity Loan Trust, |
| |||||||||||
Series 2007-C, Class 2AV4 |
| |||||||||||
(CME Term SOFR 1-Month plus 0.36%) |
| |||||||||||
5.69% | 06/25/371 | 3,899,920 | 3,718,930 | |||||||||
New Century Home Equity Loan Trust, |
| |||||||||||
Series 2005-1, Class M1 |
| |||||||||||
(CME Term SOFR 1-Month plus 0.79%) |
| |||||||||||
6.12% | 03/25/351 | 70,447 | 71,134 | |||||||||
NLT Trust, |
| |||||||||||
Series 2021-INV3, Class PT |
| |||||||||||
0.00% | 11/25/562,6 | 154,230,430 | 141,129,774 | |||||||||
NRPL, |
| |||||||||||
Series 2019-3A, Class A1 (STEP-reset date 05/25/24) |
| |||||||||||
7.00% | 07/25/592 | 37,525,961 | 37,858,396 | |||||||||
Oakwood Mortgage Investors, Inc., |
| |||||||||||
Series 2000-A, Class A5 |
| |||||||||||
8.16% | 09/15/296 | 20,571,005 | 4,181,182 | |||||||||
Onslow Bay Mortgage Loan Trust, |
| |||||||||||
Series 2021-NQM4, Class A1 |
| |||||||||||
1.96% | 10/25/612,6 | 4,801,466 | 4,002,097 | |||||||||
Ownit Mortgage Loan Trust, |
| |||||||||||
Series 2006-4, Class A1 |
| |||||||||||
(CME Term SOFR 1-Month plus 0.39%) |
| |||||||||||
5.72% | 05/25/371 | 4,568,202 | 4,430,071 | |||||||||
Ownit Mortgage Loan Trust, |
| |||||||||||
Series 2006-4, Class A2D |
| |||||||||||
(CME Term SOFR 1-Month plus 0.59%) |
| |||||||||||
5.92% | 05/25/371 | 14,615,107 | 11,453,860 | |||||||||
Popular ABS Mortgage Pass-Through Trust, |
| |||||||||||
Series 2005-6, Class A5 (STEP-reset date 05/25/24) |
| |||||||||||
3.34% | 01/25/36 | 17,581,726 | 15,647,592 | |||||||||
Popular ABS Mortgage Pass-Through Trust, |
| |||||||||||
Series 2007-A, Class A3 |
| |||||||||||
(CME Term SOFR 1-Month plus 0.42%) |
| |||||||||||
5.75% | 06/25/471 | 19,761,559 | 17,930,943 | |||||||||
Popular ABS, Inc., |
| |||||||||||
Series 1998-1, Class A2 (STEP-reset date 05/25/24) |
| |||||||||||
7.48% | 11/25/29 | 44,896 | 42,424 | |||||||||
PRET LLC, |
| |||||||||||
Series 2022-RN2, Class A1 (STEP-reset date 04/25/24) |
| |||||||||||
5.00% | 06/25/522 | 191,690,539 | 187,439,361 | |||||||||
PRPM LLC, |
| |||||||||||
Series 2022-3, Class A1 (STEP-reset date 04/25/24) |
| |||||||||||
5.56% | 06/25/272 | 28,868,680 | 28,526,026 | |||||||||
PRPM LLC, |
| |||||||||||
Series 2022-4, Class A1 (STEP-reset date 04/25/24) |
| |||||||||||
5.00% | 08/25/272 | 54,690,688 | 53,553,313 | |||||||||
| Issues | Maturity Date | Principal Amount | Value | |||||||||
MORTGAGE-BACKED (continued) |
| |||||||||||
| Non-Agency Mortgage-Backed (continued) |
| |||||||||||
Residential Accredit Loans Trust, |
| |||||||||||
Series 2005-QA4, Class A41 |
| |||||||||||
4.41% | 04/25/356 | $ | 16,795 | $ | 16,673 | |||||||
Residential Accredit Loans Trust, |
| |||||||||||
Series 2005-QA7, Class A1 |
| |||||||||||
4.63% | 07/25/356 | 1,978,836 | 1,534,573 | |||||||||
Residential Accredit Loans Trust, |
| |||||||||||
Series 2005-QO5, Class A1 |
| |||||||||||
| (Federal Reserve US 12-Month Cumulative Average plus 1.00%) |
| |||||||||||
6.09% | 01/25/461 | 3,407,346 | 2,674,792 | |||||||||
Residential Accredit Loans Trust, |
| |||||||||||
Series 2006-QA1, Class A11 |
| |||||||||||
5.28% | 01/25/366 | 95,611 | 73,569 | |||||||||
Residential Accredit Loans Trust, |
| |||||||||||
Series 2006-QA1, Class A21 |
| |||||||||||
5.26% | 01/25/366 | 7,885,956 | 5,691,744 | |||||||||
Residential Accredit Loans Trust, |
| |||||||||||
Series 2006-QA7, Class 2A1 |
| |||||||||||
(CME Term SOFR 1-Month plus 0.48%) |
| |||||||||||
5.81% | 08/25/361 | 12,971,820 | 11,701,900 | |||||||||
Residential Accredit Loans Trust, |
| |||||||||||
Series 2006-QS10, Class AV (IO) |
| |||||||||||
0.55% | 08/25/364,5,6 | 12,157,336 | 215,060 | |||||||||
Residential Accredit Loans Trust, |
| |||||||||||
Series 2006-QS12, Class 2A9 |
| |||||||||||
(CME Term SOFR 1-Month plus 0.49%) |
| |||||||||||
5.82% | 09/25/361 | 120,705 | 88,648 | |||||||||
Residential Accredit Loans Trust, |
| |||||||||||
Series 2006-QS2, Class 1AV (IO) |
| |||||||||||
0.48% | 02/25/364,5,6 | 43,741,156 | 569,125 | |||||||||
Residential Accredit Loans Trust, |
| |||||||||||
Series 2006-QS7, Class AV (IO) |
| |||||||||||
0.72% | 06/25/364,5,6 | 20,048,242 | 343,197 | |||||||||
Residential Accredit Loans Trust, |
| |||||||||||
Series 2006-QS8, Class AV (IO) |
| |||||||||||
0.79% | 08/25/364,5,6 | 49,281,825 | 1,110,650 | |||||||||
Residential Accredit Loans Trust, |
| |||||||||||
Series 2007-QS1, Class 2A4 |
| |||||||||||
(CME Term SOFR 1-Month plus 0.66%) |
| |||||||||||
5.99% | 01/25/371 | 9,128,288 | 6,212,438 | |||||||||
Residential Accredit Loans Trust, |
| |||||||||||
Series 2007-QS10, Class AV (IO) |
| |||||||||||
0.48% | 09/25/374,5,6 | 37,425,934 | 680,269 | |||||||||
Residential Accredit Loans Trust, |
| |||||||||||
Series 2007-QS4, Class 3AV (IO) |
| |||||||||||
0.36% | 03/25/374,5,6 | 23,641,197 | 263,718 | |||||||||
Residential Accredit Loans Trust, |
| |||||||||||
Series 2007-QS5, Class AV (IO) |
| |||||||||||
0.29% | 03/25/374,5,6 | 25,839,577 | 308,307 | |||||||||
Residential Accredit Loans Trust, |
| |||||||||||
Series 2007-QS6, Class AV (IO) |
| |||||||||||
0.33% | 04/25/374,5,6 | 56,183,330 | 478,794 | |||||||||
Residential Accredit Loans Trust, |
| |||||||||||
Series 2007-QS7, Class 2AV (IO) |
| |||||||||||
0.38% | 06/25/374,5,6 | 21,579,998 | 224,784 | |||||||||
See accompanying Notes to Financial Statements.
| 191 / Annual Report March 2024 |
Table of Contents
Total Return Bond Fund
Schedule of Portfolio Investments
March 31, 2024
| Issues | Maturity Date | Principal Amount | Value | |||||||||
MORTGAGE-BACKED (continued) |
| |||||||||||
| Non-Agency Mortgage-Backed (continued) |
| |||||||||||
Residential Accredit Loans Trust, |
| |||||||||||
Series 2007-QS8, Class AV (IO) |
| |||||||||||
0.43% | 06/25/374,5,6 | $ | 50,640,246 | $ | 887,754 | |||||||
Residential Asset Mortgage Products Trust, |
| |||||||||||
Series 2004-SL3, Class A4 |
| |||||||||||
8.50% | 12/25/31 | 11,719 | 5,629 | |||||||||
Residential Asset Securities Corp., |
| |||||||||||
Series 2006-KS3, Class M1 |
| |||||||||||
(CME Term SOFR 1-Month plus 0.44%) |
| |||||||||||
5.94% | 04/25/361 | 212,670 | 209,813 | |||||||||
Residential Asset Securitization Trust, |
| |||||||||||
Series 2004-IP2, Class 1A1 |
| |||||||||||
5.96% | 12/25/346 | 122,079 | 121,218 | |||||||||
Residential Asset Securitization Trust, |
| |||||||||||
Series 2004-IP2, Class 2A1 |
| |||||||||||
4.09% | 12/25/346 | 10,439 | 9,335 | |||||||||
Residential Asset Securitization Trust, |
| |||||||||||
Series 2004-IP2, Class 3A1 |
| |||||||||||
6.07% | 12/25/346 | 240,180 | 228,133 | |||||||||
Residential Asset Securitization Trust, |
| |||||||||||
Series 2006-A7CB, Class 1A3 |
| |||||||||||
6.25% | 07/25/36 | 1,506,242 | 1,157,614 | |||||||||
Residential Funding Mortgage Securities Trust, |
| |||||||||||
Series 2005-SA5, Class 1A |
| |||||||||||
4.03% | 11/25/356 | 2,069,282 | 1,244,573 | |||||||||
Residential Funding Mortgage Securities Trust, |
| |||||||||||
Series 2006-SA3, Class 3A1 |
| |||||||||||
5.65% | 09/25/366 | 119,234 | 105,899 | |||||||||
Residential Funding Mortgage Securities Trust, |
| |||||||||||
Series 2006-SA4, Class 2A1 |
| |||||||||||
5.55% | 11/25/366 | 31,991 | 27,633 | |||||||||
Residential Funding Mortgage Securities Trust, |
| |||||||||||
Series 2007-SA2, Class 2A2 |
| |||||||||||
5.39% | 04/25/376 | 768,857 | 634,162 | |||||||||
Saxon Asset Securities Trust, |
| |||||||||||
| Series 2001-2, Class AF6 (STEP-reset date 05/25/24) |
| |||||||||||
6.81% | 06/25/16 | 5 | 9 | |||||||||
Saxon Asset Securities Trust, |
| |||||||||||
Series 2007-2, Class A2C |
| |||||||||||
(CME Term SOFR 1-Month plus 0.35%) |
| |||||||||||
5.68% | 05/25/471 | 151,923 | 106,216 | |||||||||
| Securitized Asset-Backed Receivables LLC Trust, |
| |||||||||||
| Series 2006-CB1, Class AF2 (STEP-reset date 05/25/24) |
| |||||||||||
2.84% | 01/25/36 | 5,389,648 | 4,375,265 | |||||||||
| Securitized Asset-Backed Receivables LLC Trust, |
| |||||||||||
Series 2006-CB5, Class A3 |
| |||||||||||
(CME Term SOFR 1-Month plus 0.39%) |
| |||||||||||
5.72% | 06/25/361 | 188,112 | 124,336 | |||||||||
| Securitized Asset-Backed Receivables LLC Trust, |
| |||||||||||
Series 2007-BR1, Class A2A |
| |||||||||||
(CME Term SOFR 1-Month plus 0.33%) |
| |||||||||||
5.66% | 02/25/371 | 5,110,607 | 2,166,224 | |||||||||
| Securitized Asset-Backed Receivables LLC Trust, |
| |||||||||||
Series 2007-BR1, Class A2B |
| |||||||||||
(CME Term SOFR 1-Month plus 0.65%) |
| |||||||||||
5.98% | 02/25/371 | 25,299,102 | 10,748,121 | |||||||||
| Issues | Maturity Date | Principal Amount | Value | |||||||||
MORTGAGE-BACKED (continued) |
| |||||||||||
| Non-Agency Mortgage-Backed (continued) |
| |||||||||||
| Securitized Asset-Backed Receivables LLC Trust, |
| |||||||||||
Series 2007-BR2, Class A2 |
| |||||||||||
(CME Term SOFR 1-Month plus 0.57%) |
| |||||||||||
5.90% | 02/25/371 | $ | 33,215,532 | $ | 14,668,013 | |||||||
| Securitized Asset-Backed Receivables LLC Trust, |
| |||||||||||
Series 2007-BR5, Class A2A |
| |||||||||||
(CME Term SOFR 1-Month plus 0.24%) |
| |||||||||||
5.57% | 05/25/371 | 10,809,322 | 8,072,717 | |||||||||
| Securitized Asset-Backed Receivables LLC Trust, |
| |||||||||||
Series 2007-BR5, Class A2C |
| |||||||||||
(CME Term SOFR 1-Month plus 0.46%) |
| |||||||||||
5.79% | 05/25/371 | 8,152,297 | 6,087,975 | |||||||||
| Securitized Asset-Backed Receivables LLC Trust, |
| |||||||||||
Series 2007-NC1, Class A2B |
| |||||||||||
(CME Term SOFR 1-Month plus 0.41%) |
| |||||||||||
5.74% | 12/25/361 | 25,118,020 | 12,160,701 | |||||||||
| Securitized Asset-Backed Receivables LLC Trust, |
| |||||||||||
Series 2007-NC2, Class A2B |
| |||||||||||
(CME Term SOFR 1-Month plus 0.39%) |
| |||||||||||
5.72% | 01/25/371 | 12,301,795 | 9,710,568 | |||||||||
Sequoia Mortgage Trust, |
| |||||||||||
Series 2003-2, Class A1 |
| |||||||||||
(CME Term SOFR 1-Month plus 0.77%) |
| |||||||||||
6.10% | 06/20/331 | 12,593 | 12,190 | |||||||||
Sequoia Mortgage Trust, |
| |||||||||||
Series 2003-8, Class A1 |
| |||||||||||
(CME Term SOFR 1-Month plus 0.75%) |
| |||||||||||
6.08% | 01/20/341 | 458 | 440 | |||||||||
Sequoia Mortgage Trust, |
| |||||||||||
Series 2004-3, Class A |
| |||||||||||
(TSFR6M plus 0.93%) |
| |||||||||||
6.42% | 05/20/341 | 35,038 | 34,988 | |||||||||
Sequoia Mortgage Trust, |
| |||||||||||
Series 2004-4, Class A |
| |||||||||||
(TSFR6M plus 0.95%) |
| |||||||||||
6.44% | 05/20/341 | 46,779 | 44,626 | |||||||||
SG Mortgage Securities Trust, |
| |||||||||||
Series 2007-NC1, Class A2 |
| |||||||||||
(CME Term SOFR 1-Month plus 0.35%) |
| |||||||||||
5.68% | 12/25/361,2 | 11,586,234 | 6,839,504 | |||||||||
Soundview Home Loan Trust, |
| |||||||||||
Series 2005-OPT1, Class M2 |
| |||||||||||
(CME Term SOFR 1-Month plus 0.79%) |
| |||||||||||
6.12% | 06/25/351 | 4,288,343 | 4,187,021 | |||||||||
| Structured Adjustable Rate Mortgage Loan Trust, |
| |||||||||||
Series 2004-1, Class 3A3 |
| |||||||||||
6.42% | 02/25/346 | 5,257 | 4,881 | |||||||||
| Structured Adjustable Rate Mortgage Loan Trust, |
| |||||||||||
Series 2004-12, Class 2A |
| |||||||||||
5.59% | 09/25/346 | 1,580,715 | 1,521,202 | |||||||||
| Structured Adjustable Rate Mortgage Loan Trust, |
| |||||||||||
Series 2004-14, Class 1A |
| |||||||||||
6.01% | 10/25/346 | 23,172 | 23,142 | |||||||||
| Structured Adjustable Rate Mortgage Loan Trust, |
| |||||||||||
Series 2004-14, Class 2A |
| |||||||||||
6.43% | 10/25/346 | 2,327,918 | 2,267,699 | |||||||||
See accompanying Notes to Financial Statements.
| Annual Report March 2024 / 192 |
Table of Contents
Total Return Bond Fund
Schedule of Portfolio Investments
March 31, 2024
| Issues | Maturity Date | Principal Amount | Value | |||||||||
MORTGAGE-BACKED (continued) |
| |||||||||||
Non-Agency Mortgage-Backed (continued) |
| |||||||||||
Structured Adjustable Rate Mortgage Loan Trust, |
| |||||||||||
Series 2004-15, Class A |
| |||||||||||
5.58% | 10/25/346 | $ | 1,123,087 | $ | 1,076,756 | |||||||
Structured Adjustable Rate Mortgage Loan Trust, |
| |||||||||||
Series 2004-17, Class A1 |
| |||||||||||
4.18% | 11/25/346 | 20,790 | 18,309 | |||||||||
Structured Adjustable Rate Mortgage Loan Trust, |
| |||||||||||
Series 2004-20, Class 1A2 |
| |||||||||||
5.35% | 01/25/356 | 250,907 | 230,939 | |||||||||
Structured Adjustable Rate Mortgage Loan Trust, |
| |||||||||||
Series 2005-12, Class 3A1 |
| |||||||||||
5.69% | 06/25/356 | 278,217 | 239,781 | |||||||||
Structured Adjustable Rate Mortgage Loan Trust, |
| |||||||||||
Series 2005-18, Class 7A3 |
| |||||||||||
4.31% | 09/25/356 | 8,765,885 | 4,703,543 | |||||||||
Structured Adjustable Rate Mortgage Loan Trust, |
| |||||||||||
Series 2006-12, Class 1A1 |
| |||||||||||
(CME Term SOFR 1-Month plus 0.43%) |
| |||||||||||
5.76% | 01/25/371 | 13,021,184 | 11,461,670 | |||||||||
Structured Adjustable Rate Mortgage Loan Trust, |
| |||||||||||
Series 2007-9, Class 2A1 |
| |||||||||||
4.43% | 10/25/476 | 439,515 | 282,923 | |||||||||
Structured Asset Mortgage Investments II Trust, |
| |||||||||||
Series 2005-AR8, Class A1A |
| |||||||||||
(CME Term SOFR 1-Month plus 0.67%) |
| |||||||||||
6.00% | 02/25/361 | 226,420 | 187,041 | |||||||||
Structured Asset Mortgage Investments II Trust, |
| |||||||||||
Series 2005-AR8, Class A3 |
| |||||||||||
(Federal Reserve US 12-Month Cumulative Average plus 2.00%) |
| |||||||||||
7.06% | 02/25/361 | 7,303,881 | 6,086,027 | |||||||||
Structured Asset Mortgage Investments II Trust, |
| |||||||||||
Series 2006-AR7, Class A1A |
| |||||||||||
(CME Term SOFR 1-Month plus 0.53%) |
| |||||||||||
5.86% | 08/25/361 | 9,307,971 | 7,359,323 | |||||||||
Structured Asset Mortgage Investments II Trust, |
| |||||||||||
Series 2006-AR8, Class A1BG |
| |||||||||||
(CME Term SOFR 1-Month plus 0.23%) |
| |||||||||||
5.56% | 10/25/361 | 7,892,042 | 6,755,588 | |||||||||
Structured Asset Mortgage Investments II Trust, |
| |||||||||||
Series 2007-AR6, Class A1 |
| |||||||||||
(Federal Reserve US 12-Month Cumulative Average plus 1.50%) |
| |||||||||||
6.59% | 08/25/471 | 79,145,413 | 66,244,679 | |||||||||
Structured Asset Securities Corp. Mortgage Pass-Through Certificates, Series 1997-2, Class 2A4 |
| |||||||||||
7.25% | 03/28/30 | 219 | 212 | |||||||||
Structured Asset Securities Corp. Mortgage Pass-Through Certificates, |
| |||||||||||
Series 2003-26A, Class 3A5 |
| |||||||||||
6.51% | 09/25/336 | 68,120 | 65,307 | |||||||||
Structured Asset Securities Corp. Trust, |
| |||||||||||
Series 2005-5, Class 2A4 |
| |||||||||||
5.50% | 04/25/35 | 760,594 | 699,873 | |||||||||
| Issues | Maturity Date | Principal Amount | Value | |||||||||
MORTGAGE-BACKED (continued) |
| |||||||||||
Non-Agency Mortgage-Backed (continued) |
| |||||||||||
SunTrust Adjustable Rate Mortgage Loan Trust, |
| |||||||||||
Series 2007-3, Class 1A1 |
| |||||||||||
5.03% | 06/25/376 | $ | 1,304,959 | $ | 823,521 | |||||||
Thornburg Mortgage Securities Trust, |
| |||||||||||
Series 2004-4, Class 2A |
| |||||||||||
5.01% | 12/25/446 | 55,776 | 51,100 | |||||||||
Wachovia Mortgage Loan Trust, |
| |||||||||||
Series 2006-ALT1, Class A3 |
| |||||||||||
(CME Term SOFR 1-Month plus 0.57%) |
| |||||||||||
2.02% | 01/25/371 | 9,524,155 | 3,561,832 | |||||||||
Wachovia Mortgage Loan Trust, |
| |||||||||||
Series 2006-AMN1, Class A3 |
| |||||||||||
(CME Term SOFR 1-Month plus 0.59%) |
| |||||||||||
1.90% | 08/25/361 | 14,927,677 | 5,146,178 | |||||||||
WaMu Asset-Backed Certificates, |
| |||||||||||
Series 2007-HE1, Class 2A2 |
| |||||||||||
(CME Term SOFR 1-Month plus 0.22%) |
| |||||||||||
5.55% | 01/25/371 | 2,831,005 | 1,324,631 | |||||||||
WaMu Asset-Backed Certificates, |
| |||||||||||
Series 2007-HE1, Class 2A4 |
| |||||||||||
(CME Term SOFR 1-Month plus 0.34%) |
| |||||||||||
5.67% | 01/25/371 | 8,772,526 | 3,796,975 | |||||||||
WaMu Mortgage Pass-Through Certificates, |
| |||||||||||
Series 2003-AR6, Class A1 |
| |||||||||||
5.39% | 06/25/336 | 1,237,760 | 1,190,697 | |||||||||
WaMu Mortgage Pass-Through Certificates, |
| |||||||||||
Series 2004-AR3, Class A2 |
| |||||||||||
4.65% | 06/25/346 | 12,615 | 11,454 | |||||||||
WaMu Mortgage Pass-Through Certificates, |
| |||||||||||
Series 2004-AR6, Class A |
| |||||||||||
(CME Term SOFR 1-Month plus 0.95%) |
| |||||||||||
6.28% | 05/25/441 | 4,542 | 4,543 | |||||||||
WaMu Mortgage Pass-Through Certificates, |
| |||||||||||
Series 2005-3, Class 2A3 |
| |||||||||||
(CME Term SOFR 1-Month plus 0.66%) |
| |||||||||||
5.50% | 05/25/351 | 1,225,476 | 951,807 | |||||||||
WaMu Mortgage Pass-Through Certificates, |
| |||||||||||
Series 2005-4, Class CB13 |
| |||||||||||
(CME Term SOFR 1-Month plus 0.61%) |
| |||||||||||
5.50% | 06/25/351 | 2,451,383 | 2,071,326 | |||||||||
WaMu Mortgage Pass-Through Certificates, |
| |||||||||||
Series 2005-AR1, Class A1A |
| |||||||||||
(CME Term SOFR 1-Month plus 0.75%) |
| |||||||||||
6.08% | 01/25/451 | 290,873 | 273,175 | |||||||||
WaMu Mortgage Pass-Through Certificates, |
| |||||||||||
Series 2005-AR13, Class A1A1 |
| |||||||||||
(CME Term SOFR 1-Month plus 0.69%) |
| |||||||||||
6.02% | 10/25/451 | 1,927,469 | 1,847,133 | |||||||||
WaMu Mortgage Pass-Through Certificates, |
| |||||||||||
Series 2005-AR14, Class 2A1 |
| |||||||||||
4.72% | 12/25/356 | 1,199,698 | 1,068,321 | |||||||||
WaMu Mortgage Pass-Through Certificates, |
| |||||||||||
Series 2005-AR15, Class A1A1 |
| |||||||||||
(CME Term SOFR 1-Month plus 0.63%) |
| |||||||||||
5.96% | 11/25/451 | 13,796,424 | 12,609,717 | |||||||||
See accompanying Notes to Financial Statements.
| 193 / Annual Report March 2024 |
Table of Contents
Total Return Bond Fund
Schedule of Portfolio Investments
March 31, 2024
| Issues | Maturity Date | Principal Amount | Value | |||||||||
MORTGAGE-BACKED (continued) |
| |||||||||||
Non-Agency Mortgage-Backed (continued) |
| |||||||||||
WaMu Mortgage Pass-Through Certificates, |
| |||||||||||
Series 2005-AR17, Class A1A1 |
| |||||||||||
(CME Term SOFR 1-Month plus 0.65%) |
| |||||||||||
5.98% | 12/25/451 | $ | 6,314,817 | $ | 5,555,169 | |||||||
WaMu Mortgage Pass-Through Certificates, |
| |||||||||||
Series 2005-AR19, Class A1A2 |
| |||||||||||
(CME Term SOFR 1-Month plus 0.69%) |
| |||||||||||
6.02% | 12/25/451 | 5,643,692 | 5,461,816 | |||||||||
WaMu Mortgage Pass-Through Certificates, |
| |||||||||||
Series 2005-AR2, Class 2A1A |
| |||||||||||
(CME Term SOFR 1-Month plus 0.73%) |
| |||||||||||
6.06% | 01/25/451 | 346,217 | 338,236 | |||||||||
WaMu Mortgage Pass-Through Certificates, |
| |||||||||||
Series 2005-AR2, Class 2A21 |
| |||||||||||
(CME Term SOFR 1-Month plus 0.77%) |
| |||||||||||
6.10% | 01/25/451 | 29,444 | 28,765 | |||||||||
WaMu Mortgage Pass-Through Certificates, |
| |||||||||||
Series 2005-AR2, Class 2A23 |
| |||||||||||
(CME Term SOFR 1-Month plus 0.87%) |
| |||||||||||
6.20% | 01/25/451 | 1,229,415 | 1,201,127 | |||||||||
WaMu Mortgage Pass-Through Certificates, |
| |||||||||||
Series 2005-AR6, Class 2A1A |
| |||||||||||
(CME Term SOFR 1-Month plus 0.57%) |
| |||||||||||
5.90% | 04/25/451 | 54,614 | 53,154 | |||||||||
WaMu Mortgage Pass-Through Certificates, |
| |||||||||||
Series 2005-AR8, Class 1A1A |
| |||||||||||
(CME Term SOFR 1-Month plus 0.65%) |
| |||||||||||
5.98% | 07/25/451 | 58,451 | 55,398 | |||||||||
WaMu Mortgage Pass-Through Certificates, |
| |||||||||||
Series 2006-AR10, Class 1A4 |
| |||||||||||
4.44% | 09/25/366 | 6,002,269 | 5,346,834 | |||||||||
WaMu Mortgage Pass-Through Certificates, |
| |||||||||||
Series 2006-AR16, Class 3A1 |
| |||||||||||
4.06% | 12/25/366 | 349,099 | 299,813 | |||||||||
WaMu Mortgage Pass-Through Certificates, |
| |||||||||||
Series 2006-AR3, Class A1A |
| |||||||||||
(Federal Reserve US 12-Month Cumulative Average plus 1.00%) |
| |||||||||||
6.09% | 02/25/461 | 7,582,540 | 6,641,174 | |||||||||
WaMu Mortgage Pass-Through Certificates, |
| |||||||||||
Series 2006-AR4, Class 1A1A |
| |||||||||||
(Federal Reserve US 12-Month Cumulative Average plus 0.94%) |
| |||||||||||
4.49% | 05/25/461 | 2,641,256 | 2,383,900 | |||||||||
WaMu Mortgage Pass-Through Certificates, |
| |||||||||||
Series 2006-AR7, Class 2A |
| |||||||||||
(Federal Reserve US 12-Month Cumulative Average plus 0.98%) |
| |||||||||||
6.07% | 07/25/461 | 4,665,662 | 4,027,193 | |||||||||
WaMu Mortgage Pass-Through Certificates, |
| |||||||||||
Series 2007-HY7, Class 4A2 |
| |||||||||||
4.54% | 07/25/376 | 139,068 | 115,235 | |||||||||
| Issues | Maturity Date | Principal Amount | Value | |||||||||
MORTGAGE-BACKED (continued) |
| |||||||||||
Non-Agency Mortgage-Backed (continued) |
| |||||||||||
WaMu Mortgage Pass-Through Certificates, |
| |||||||||||
Series 2007-OA1, Class A1A |
| |||||||||||
(Federal Reserve US 12-Month Cumulative Average plus 0.70%) |
| |||||||||||
5.79% | 02/25/471 | $ | 7,409,161 | $ | 6,161,458 | |||||||
WaMu MSC Mortgage Pass-Through Certificates, |
| |||||||||||
Series 2002-AR1, Class 1A1 |
| |||||||||||
6.57% | 11/25/306 | 48,983 | 48,715 | |||||||||
Wells Fargo Alternative Loan Trust, |
| |||||||||||
Series 2007-PA5, Class 1A1 |
| |||||||||||
6.25% | 11/25/37 | 68,201 | 58,243 | |||||||||
Wells Fargo Mortgage-Backed Securities Trust, |
| |||||||||||
Series 2006-AR1, Class 1A1 |
| |||||||||||
6.45% | 03/25/366 | 1,129,536 | 1,066,458 | |||||||||
|
|
| ||||||||||
| 4,995,538,922 | ||||||||||||
|
|
| ||||||||||
| U.S. Agency Commercial Mortgage-Backed — 0.76% |
| |||||||||||
Fannie Mae Pool AM4869 |
| |||||||||||
4.07% | 12/01/25 | 1,626,589 | 1,601,038 | |||||||||
Fannie Mae Pool AM6770 |
| |||||||||||
3.77% | 09/01/29 | 150,484 | 144,517 | |||||||||
Fannie Mae Pool BL6060 |
| |||||||||||
2.46% | 04/01/40 | 125,360,000 | 90,491,521 | |||||||||
Freddie Mac Multifamily Structured Pass-Through |
| |||||||||||
Certificates, |
| |||||||||||
Series K157, Class A3 |
| |||||||||||
3.99% | 08/25/336 | 300,000 | 281,671 | |||||||||
Ginnie Mae, |
| |||||||||||
Series 2020-193, Class AC |
| |||||||||||
1.25% | 09/16/62 | 33,055,429 | 23,365,669 | |||||||||
Ginnie Mae, |
| |||||||||||
Series 2020-193, Class IO (IO) |
| |||||||||||
0.78% | 09/16/626 | 553,699,302 | 30,596,316 | |||||||||
Ginnie Mae, |
| |||||||||||
Series 2021-10, Class IO (IO) |
| |||||||||||
0.99% | 05/16/636 | 60,463,002 | 4,216,575 | |||||||||
Ginnie Mae, |
| |||||||||||
Series 2021-14, Class AB |
| |||||||||||
1.34% | 06/16/63 | 42,181,201 | 31,494,758 | |||||||||
Ginnie Mae, |
| |||||||||||
Series 2021-150, Class IO (IO) |
| |||||||||||
1.03% | 11/16/636 | 33,397,066 | 2,230,750 | |||||||||
Ginnie Mae, |
| |||||||||||
Series 2021-17, Class IO (IO) |
| |||||||||||
1.05% | 01/16/616 | 133,352,039 | 9,957,937 | |||||||||
Ginnie Mae, |
| |||||||||||
Series 2021-2, Class AH |
| |||||||||||
1.50% | 06/16/63 | 98,112,553 | 73,875,063 | |||||||||
Ginnie Mae, |
| |||||||||||
Series 2021-21, Class AH |
| |||||||||||
1.40% | 06/16/63 | 67,668,900 | 51,464,333 | |||||||||
Ginnie Mae, |
| |||||||||||
Series 2021-31, Class B |
| |||||||||||
1.25% | 01/16/61 | 73,536,083 | 55,673,475 | |||||||||
See accompanying Notes to Financial Statements.
| Annual Report March 2024 / 194 |
Table of Contents
Total Return Bond Fund
Schedule of Portfolio Investments
March 31, 2024
| Issues | Maturity Date | Principal Amount | Value | |||||||||
MORTGAGE-BACKED (continued) |
| |||||||||||
U.S. Agency Commercial Mortgage-Backed (continued) |
| |||||||||||
Ginnie Mae, |
| |||||||||||
Series 2021-31, Class IO (IO) |
| |||||||||||
0.94% | 01/16/616 | $ | 112,454,822 | $ | 7,487,658 | |||||||
Ginnie Mae, |
| |||||||||||
Series 2022-32, Class IO (IO) |
| |||||||||||
0.53% | 02/01/626 | 272,080,457 | 11,645,479 | |||||||||
|
|
| ||||||||||
| 394,526,760 | ||||||||||||
|
|
| ||||||||||
| U.S. Agency Mortgage-Backed — 38.80% |
| |||||||||||
Fannie Mae Pool 190375 |
| |||||||||||
5.50% | 11/01/36 | 300,545 | 306,913 | |||||||||
Fannie Mae Pool 190396 |
| |||||||||||
4.50% | 06/01/39 | 4,220 | 4,127 | |||||||||
Fannie Mae Pool 313182 |
| |||||||||||
7.50% | 10/01/26 | 255 | 255 | |||||||||
Fannie Mae Pool 394854 |
| |||||||||||
6.50% | 05/01/27 | 143 | 146 | |||||||||
Fannie Mae Pool 545191 |
| |||||||||||
7.00% | 09/01/31 | 1,159 | 1,179 | |||||||||
Fannie Mae Pool 545756 |
| |||||||||||
7.00% | 06/01/32 | 243 | 254 | |||||||||
Fannie Mae Pool 613142 |
| |||||||||||
7.00% | 11/01/31 | 4,881 | 5,034 | |||||||||
Fannie Mae Pool 625666 |
| |||||||||||
7.00% | 01/01/32 | 2,309 | 2,381 | |||||||||
Fannie Mae Pool 633698 |
| |||||||||||
7.50% | 02/01/31 | 16,764 | 17,166 | |||||||||
Fannie Mae Pool 655928 |
| |||||||||||
7.00% | 08/01/32 | 51,246 | 53,094 | |||||||||
Fannie Mae Pool 725257 |
| |||||||||||
5.50% | 02/01/34 | 394,528 | 402,858 | |||||||||
Fannie Mae Pool 734830 |
| |||||||||||
4.50% | 08/01/33 | 5,477 | 5,353 | |||||||||
Fannie Mae Pool 734922 |
| |||||||||||
4.50% | 09/01/33 | 646,759 | 632,192 | |||||||||
Fannie Mae Pool 735207 |
| |||||||||||
7.00% | 04/01/34 | 9,258 | 9,473 | |||||||||
Fannie Mae Pool 735224 |
| |||||||||||
5.50% | 02/01/35 | 1,399,417 | 1,429,013 | |||||||||
Fannie Mae Pool 735651 |
| |||||||||||
4.50% | 06/01/35 | 1,637,030 | 1,618,543 | |||||||||
Fannie Mae Pool 740297 |
| |||||||||||
5.50% | 10/01/33 | 819 | 837 | |||||||||
Fannie Mae Pool 745147 |
| |||||||||||
4.50% | 12/01/35 | 10,027 | 9,801 | |||||||||
Fannie Mae Pool 753168 |
| |||||||||||
4.50% | 12/01/33 | 3,410 | 3,333 | |||||||||
Fannie Mae Pool 815422 |
| |||||||||||
4.50% | 02/01/35 | 17,669 | 17,270 | |||||||||
Fannie Mae Pool 839109 |
| |||||||||||
(RFUCCT1Y plus 1.91%) |
| |||||||||||
6.16% | 11/01/351 | 3,090 | 3,084 | |||||||||
Fannie Mae Pool 844773 |
| |||||||||||
(RFUCCT1Y plus 1.56%) |
| |||||||||||
5.81% | 12/01/351 | 1,439 | 1,435 | |||||||||
| Issues | Maturity Date | Principal Amount | Value | |||||||||
MORTGAGE-BACKED (continued) |
| |||||||||||
U.S. Agency Mortgage-Backed (continued) |
| |||||||||||
Fannie Mae Pool 888412 |
| |||||||||||
7.00% | 04/01/37 | $ | 63,757 | $ | 64,047 | |||||||
Fannie Mae Pool 889184 |
| |||||||||||
5.50% | 09/01/36 | 1,464,450 | 1,495,422 | |||||||||
Fannie Mae Pool AB1613 |
| |||||||||||
4.00% | 10/01/40 | 13,936,351 | 13,276,143 | |||||||||
Fannie Mae Pool AB1803 |
| |||||||||||
4.00% | 11/01/40 | 16,748,777 | 16,006,171 | |||||||||
Fannie Mae Pool AB2127 |
| |||||||||||
3.50% | 01/01/26 | 1,939,779 | 1,905,813 | |||||||||
Fannie Mae Pool AB3679 |
| |||||||||||
3.50% | 10/01/41 | 5,810,478 | 5,376,520 | |||||||||
Fannie Mae Pool AB3864 |
| |||||||||||
3.50% | 11/01/41 | 4,327,873 | 3,997,293 | |||||||||
Fannie Mae Pool AB4045 |
| |||||||||||
3.50% | 12/01/41 | 5,626,732 | 5,232,893 | |||||||||
Fannie Mae Pool AB4262 |
| |||||||||||
3.50% | 01/01/32 | 2,583,653 | 2,485,068 | |||||||||
Fannie Mae Pool AB6385 |
| |||||||||||
3.00% | 10/01/42 | 197,266 | 176,880 | |||||||||
Fannie Mae Pool AB9703 |
| |||||||||||
3.50% | 06/01/43 | 10,295,877 | 9,432,541 | |||||||||
Fannie Mae Pool AC8279 |
| |||||||||||
4.50% | 08/01/39 | 5,987 | 5,823 | |||||||||
Fannie Mae Pool AE0138 |
| |||||||||||
4.50% | 03/01/40 | 24,867 | 24,397 | |||||||||
Fannie Mae Pool AE0482 |
| |||||||||||
5.50% | 01/01/38 | 3,401,327 | 3,459,704 | |||||||||
Fannie Mae Pool AH3780 |
| |||||||||||
4.00% | 02/01/41 | 6,623,531 | 6,313,962 | |||||||||
Fannie Mae Pool AJ1404 |
| |||||||||||
4.00% | 09/01/41 | 8,581,276 | 8,134,018 | |||||||||
Fannie Mae Pool AL0209 |
| |||||||||||
4.50% | 05/01/41 | 10,158,458 | 9,948,261 | |||||||||
Fannie Mae Pool AL0851 |
| |||||||||||
6.00% | 10/01/40 | 5,776,628 | 6,038,192 | |||||||||
Fannie Mae Pool AL2521 |
| |||||||||||
3.50% | 09/01/42 | 65,283 | 60,544 | |||||||||
Fannie Mae Pool AL4597 |
| |||||||||||
4.00% | 01/01/44 | 26,381,882 | 25,072,761 | |||||||||
Fannie Mae Pool AL6348 |
| |||||||||||
3.50% | 02/01/45 | 22,910 | 21,023 | |||||||||
Fannie Mae Pool AL7092 |
| |||||||||||
3.00% | 07/01/45 | 36,705 | 32,648 | |||||||||
Fannie Mae Pool AL8037 |
| |||||||||||
4.50% | 07/01/34 | 77,194 | 75,906 | |||||||||
Fannie Mae Pool AL8256 |
| |||||||||||
3.00% | 08/01/43 | 332,048 | 297,824 | |||||||||
Fannie Mae Pool AL8356 |
| |||||||||||
4.50% | 07/01/34 | 179,693 | 176,751 | |||||||||
Fannie Mae Pool AL8960 |
| |||||||||||
4.50% | 05/01/46 | 15,621,442 | 15,265,552 | |||||||||
Fannie Mae Pool AL9106 |
| |||||||||||
4.50% | 02/01/46 | 19,554,679 | 19,109,180 | |||||||||
Fannie Mae Pool AL9217 |
| |||||||||||
3.50% | 10/01/46 | 13,850,787 | 12,724,641 | |||||||||
See accompanying Notes to Financial Statements.
| 195 / Annual Report March 2024 |
Table of Contents
Total Return Bond Fund
Schedule of Portfolio Investments
March 31, 2024
| Issues | Maturity Date | Principal Amount | Value | |||||||||
MORTGAGE-BACKED (continued) |
| |||||||||||
U.S. Agency Mortgage-Backed (continued) |
| |||||||||||
Fannie Mae Pool AL9472 |
| |||||||||||
4.00% | 10/01/43 | $ | 3,255,424 | $ | 3,085,833 | |||||||
Fannie Mae Pool AL9722 |
| |||||||||||
4.50% | 08/01/46 | 64,452,518 | 62,984,147 | |||||||||
Fannie Mae Pool AL9846 |
| |||||||||||
4.50% | 02/01/47 | 67,907,391 | 66,360,310 | |||||||||
Fannie Mae Pool AS8605 |
| |||||||||||
3.00% | 01/01/32 | 89,335 | 84,656 | |||||||||
Fannie Mae Pool AS8663 |
| |||||||||||
4.50% | 01/01/47 | 11,730,784 | 11,398,336 | |||||||||
Fannie Mae Pool AS9830 |
| |||||||||||
4.00% | 06/01/47 | 21,548,459 | 20,379,977 | |||||||||
Fannie Mae Pool AS9972 |
| |||||||||||
4.00% | 07/01/47 | 19,465,282 | 18,344,028 | |||||||||
Fannie Mae Pool AT9649 |
| |||||||||||
4.00% | 07/01/43 | 114,690 | 109,836 | |||||||||
Fannie Mae Pool AU3739 |
| |||||||||||
3.50% | 08/01/43 | 19,060,392 | 17,544,747 | |||||||||
Fannie Mae Pool BD2450 |
| |||||||||||
3.50% | 01/01/47 | 39,498 | 36,092 | |||||||||
Fannie Mae Pool BM4299 |
| |||||||||||
3.00% | 03/01/30 | 11,064,593 | 10,741,602 | |||||||||
Fannie Mae Pool BM4304 |
| |||||||||||
3.00% | 02/01/30 | 13,337,973 | 12,965,360 | |||||||||
Fannie Mae Pool BM5164 |
| |||||||||||
4.00% | 11/01/48 | 23,900,815 | 22,566,452 | |||||||||
Fannie Mae Pool BM5507 |
| |||||||||||
3.00% | 09/01/48 | 5,266,393 | 4,651,155 | |||||||||
Fannie Mae Pool BN4316 |
| |||||||||||
4.00% | 01/01/49 | 16,183 | 15,294 | |||||||||
Fannie Mae Pool BQ6913 |
| |||||||||||
2.00% | 12/01/51 | 429,272,446 | 340,424,919 | |||||||||
Fannie Mae Pool BQ7006 |
| |||||||||||
2.00% | 01/01/52 | 102,788,297 | 81,513,962 | |||||||||
Fannie Mae Pool BT6823 |
| |||||||||||
2.50% | 10/01/51 | 104,177,209 | 86,495,026 | |||||||||
Fannie Mae Pool BU1450 |
| |||||||||||
2.00% | 01/01/52 | 172,121,108 | 136,496,797 | |||||||||
Fannie Mae Pool BU1452 |
| |||||||||||
2.00% | 01/01/52 | 259,286,996 | 205,509,924 | |||||||||
Fannie Mae Pool BV2994 |
| |||||||||||
2.50% | 04/01/52 | 2,590,728 | 2,143,634 | |||||||||
Fannie Mae Pool BV7773 |
| |||||||||||
2.50% | 04/01/52 | 93,911,083 | 77,763,115 | |||||||||
Fannie Mae Pool BV8459 |
| |||||||||||
3.00% | 04/01/52 | 135,324,019 | 116,571,942 | |||||||||
Fannie Mae Pool BW9897 |
| |||||||||||
4.50% | 10/01/52 | 89,414,683 | 85,205,533 | |||||||||
Fannie Mae Pool CA0862 |
| |||||||||||
3.50% | 09/01/47 | 2,077,651 | 1,892,494 | |||||||||
Fannie Mae Pool CA0996 |
| |||||||||||
3.50% | 01/01/48 | 28,623 | 26,162 | |||||||||
Fannie Mae Pool CA1187 |
| |||||||||||
3.50% | 02/01/48 | 32,004,463 | 29,166,814 | |||||||||
Fannie Mae Pool CA1191 |
| |||||||||||
3.50% | 11/01/47 | 2,404,922 | 2,189,849 | |||||||||
| Issues | Maturity Date | Principal Amount | Value | |||||||||
MORTGAGE-BACKED (continued) |
| |||||||||||
U.S. Agency Mortgage-Backed (continued) |
| |||||||||||
Fannie Mae Pool CA1710 |
| |||||||||||
4.50% | 05/01/48 | $ | 72,213 | $ | 69,819 | |||||||
Fannie Mae Pool CA1711 |
| |||||||||||
4.50% | 05/01/48 | 7,157,269 | 6,920,002 | |||||||||
Fannie Mae Pool CA2208 |
| |||||||||||
4.50% | 08/01/48 | 15,640,479 | 15,121,990 | |||||||||
Fannie Mae Pool CA2327 |
| |||||||||||
4.00% | 09/01/48 | 22,174,367 | 21,007,518 | |||||||||
Fannie Mae Pool CA2493 |
| |||||||||||
4.50% | 10/01/48 | 4,167,696 | 4,026,141 | |||||||||
Fannie Mae Pool CA3633 |
| |||||||||||
3.50% | 06/01/49 | 16,132,849 | 14,754,759 | |||||||||
Fannie Mae Pool CA4011 |
| |||||||||||
3.50% | 08/01/49 | 14,834,237 | 13,210,918 | |||||||||
Fannie Mae Pool CA5689 |
| |||||||||||
3.00% | 05/01/50 | 54,700,292 | 47,929,481 | |||||||||
Fannie Mae Pool CA8513 |
| |||||||||||
2.50% | 01/01/51 | 49,879,479 | 41,255,963 | |||||||||
Fannie Mae Pool CB0610 |
| |||||||||||
2.50% | 05/01/51 | 57,746,955 | 48,268,540 | |||||||||
Fannie Mae Pool CB2313 |
| |||||||||||
2.50% | 12/01/51 | 145,542,749 | 121,443,629 | |||||||||
Fannie Mae Pool CB2365 |
| |||||||||||
2.00% | 09/01/51 | 155,097,316 | 123,170,326 | |||||||||
Fannie Mae Pool CB2767 |
| |||||||||||
2.00% | 01/01/52 | 68,625,995 | 54,741,158 | |||||||||
Fannie Mae Pool CB3582 |
| |||||||||||
3.00% | 05/01/52 | 15,880,491 | 13,724,441 | |||||||||
Fannie Mae Pool CB5675 |
| |||||||||||
4.50% | 02/01/53 | 48,555,882 | 46,283,630 | |||||||||
Fannie Mae Pool CB6854 |
| |||||||||||
4.50% | 08/01/53 | 35,336,971 | 33,673,602 | |||||||||
Fannie Mae Pool FM2310 |
| |||||||||||
3.00% | 01/01/48 | 8,283,566 | 7,306,574 | |||||||||
Fannie Mae Pool FM2318 |
| |||||||||||
3.50% | 09/01/49 | 140,278,637 | 128,003,040 | |||||||||
Fannie Mae Pool FM2388 |
| |||||||||||
3.50% | 04/01/48 | 14,420,459 | 13,229,970 | |||||||||
Fannie Mae Pool FM9672 |
| |||||||||||
2.50% | 12/01/51 | 118,001,342 | 97,657,380 | |||||||||
Fannie Mae Pool FS1571 |
| |||||||||||
2.00% | 04/01/52 | 36,007,270 | 28,532,256 | |||||||||
Fannie Mae Pool FS1598 |
| |||||||||||
2.00% | 04/01/52 | 96,553,389 | 76,463,155 | |||||||||
Fannie Mae Pool FS1622 |
| |||||||||||
2.00% | 03/01/52 | 189,579,332 | 150,341,652 | |||||||||
Fannie Mae Pool FS2536 |
| |||||||||||
2.50% | 02/01/52 | 3,595,214 | 2,982,811 | |||||||||
Fannie Mae Pool FS2943 |
| |||||||||||
2.00% | 02/01/51 | 39,809,297 | 31,669,397 | |||||||||
Fannie Mae Pool FS3275 |
| |||||||||||
3.00% | 04/01/52 | 19,721,259 | 17,039,806 | |||||||||
Fannie Mae Pool FS5494 |
| |||||||||||
3.00% | 07/01/52 | 154,142,270 | 132,882,853 | |||||||||
Fannie Mae Pool FS5635 |
| |||||||||||
4.00% | 11/01/52 | 69,227,163 | 64,117,678 | |||||||||
See accompanying Notes to Financial Statements.
| Annual Report March 2024 / 196 |
Table of Contents
Total Return Bond Fund
Schedule of Portfolio Investments
March 31, 2024
| Issues | Maturity Date | Principal Amount | Value | |||||||||
MORTGAGE-BACKED (continued) |
| |||||||||||
U.S. Agency Mortgage-Backed (continued) |
| |||||||||||
Fannie Mae Pool FS6789 |
| |||||||||||
3.00% | 12/01/52 | $ | 73,966,026 | $ | 63,716,429 | |||||||
Fannie Mae Pool MA1146 |
| |||||||||||
4.00% | 08/01/42 | 16,270,741 | 15,461,743 | |||||||||
Fannie Mae Pool MA1177 |
| |||||||||||
3.50% | 09/01/42 | 21,753,982 | 20,067,047 | |||||||||
Fannie Mae Pool MA1404 |
| |||||||||||
3.50% | 04/01/43 | 45,055 | 41,277 | |||||||||
Fannie Mae Pool MA1432 |
| |||||||||||
3.00% | 05/01/33 | 33,483 | 31,444 | |||||||||
Fannie Mae Pool MA1459 |
| |||||||||||
3.00% | 06/01/33 | 15,852 | 14,875 | |||||||||
Fannie Mae Pool MA1527 |
| |||||||||||
3.00% | 08/01/33 | 23,199,129 | 21,767,285 | |||||||||
Fannie Mae Pool MA1561 |
| |||||||||||
3.00% | 09/01/33 | 14,717,888 | 13,806,460 | |||||||||
Fannie Mae Pool MA1582 |
| |||||||||||
3.50% | 09/01/43 | 7,578,648 | 6,943,184 | |||||||||
Fannie Mae Pool MA1584 |
| |||||||||||
3.50% | 09/01/33 | 22,318,335 | 21,299,114 | |||||||||
Fannie Mae Pool MA1608 |
| |||||||||||
3.50% | 10/01/33 | 15,402,412 | 14,742,141 | |||||||||
Fannie Mae Pool MA1982 |
| |||||||||||
3.50% | 08/01/34 | 30,956 | 29,382 | |||||||||
Fannie Mae Pool MA2895 |
| |||||||||||
3.00% | 02/01/47 | 37,443 | 33,069 | |||||||||
Fannie Mae Pool MA2960 |
| |||||||||||
4.00% | 04/01/47 | 18,269,444 | 17,216,604 | |||||||||
Fannie Mae Pool MA3027 |
| |||||||||||
4.00% | 06/01/47 | 13,717,344 | 12,926,834 | |||||||||
Fannie Mae Pool MA3029 |
| |||||||||||
3.00% | 06/01/32 | 14,179,673 | 13,453,307 | |||||||||
Fannie Mae Pool MA3060 |
| |||||||||||
3.00% | 07/01/32 | 6,374 | 6,034 | |||||||||
Fannie Mae Pool MA3120 |
| |||||||||||
3.50% | 09/01/47 | 1,064,255 | 969,411 | |||||||||
Fannie Mae Pool MA3182 |
| |||||||||||
3.50% | 11/01/47 | 22,577,830 | 20,574,846 | |||||||||
Fannie Mae Pool MA3210 |
| |||||||||||
3.50% | 12/01/47 | 39,122,103 | 35,687,574 | |||||||||
Fannie Mae Pool MA3238 |
| |||||||||||
3.50% | 01/01/48 | 33,882,554 | 30,876,676 | |||||||||
Fannie Mae Pool MA3276 |
| |||||||||||
3.50% | 02/01/48 | 13,280,021 | 12,101,889 | |||||||||
Fannie Mae Pool MA3305 |
| |||||||||||
3.50% | 03/01/48 | 17,742,109 | 16,155,544 | |||||||||
Fannie Mae Pool MA3332 |
| |||||||||||
3.50% | 04/01/48 | 48,857,588 | 44,488,563 | |||||||||
Fannie Mae Pool MA3364 |
| |||||||||||
3.50% | 05/01/33 | 5,383,510 | 5,177,985 | |||||||||
Fannie Mae Pool MA3537 |
| |||||||||||
4.50% | 12/01/48 | 9,340,038 | 9,031,149 | |||||||||
Fannie Mae Pool MA3811 |
| |||||||||||
3.00% | 10/01/49 | 5,473,107 | 4,709,326 | |||||||||
Fannie Mae Pool MA3846 |
| |||||||||||
3.00% | 11/01/49 | 29,780 | 25,624 | |||||||||
| Issues | Maturity Date | Principal Amount | Value | |||||||||
MORTGAGE-BACKED (continued) |
| |||||||||||
U.S. Agency Mortgage-Backed (continued) |
| |||||||||||
Fannie Mae Pool MA3942 |
| |||||||||||
3.00% | 02/01/50 | $ | 10,663,918 | $ | 9,032,216 | |||||||
Fannie Mae Pool MA3997 |
| |||||||||||
3.00% | 04/01/50 | 13,152,927 | 11,265,908 | |||||||||
Fannie Mae Pool MA4128 |
| |||||||||||
2.00% | 09/01/40 | 117,184,248 | 99,045,902 | |||||||||
Fannie Mae Pool MA4158 |
| |||||||||||
2.00% | 10/01/50 | 165,470,609 | 132,104,261 | |||||||||
Fannie Mae Pool MA4237 |
| |||||||||||
2.00% | 01/01/51 | 2,247,520 | 1,790,211 | |||||||||
Fannie Mae Pool MA4281 |
| |||||||||||
2.00% | 03/01/51 | 36,491,504 | 29,030,000 | |||||||||
Fannie Mae Pool MA4305 |
| |||||||||||
2.00% | 04/01/51 | 81,941,164 | 65,160,855 | |||||||||
Fannie Mae Pool MA4333 |
| |||||||||||
2.00% | 05/01/41 | 67,952,129 | 57,030,703 | |||||||||
Fannie Mae Pool MA4492 |
| |||||||||||
2.00% | 12/01/51 | 90,367,076 | 71,703,107 | |||||||||
Fannie Mae Pool MA4493 |
| |||||||||||
2.50% | 12/01/51 | 145,847,545 | 120,944,894 | |||||||||
Fannie Mae Pool MA4547 |
| |||||||||||
2.00% | 02/01/52 | 17,948,210 | 14,225,686 | |||||||||
Fannie Mae Pool MA4548 |
| |||||||||||
2.50% | 02/01/52 | 171,722,043 | 142,294,914 | |||||||||
Fannie Mae Pool MA4562 |
| |||||||||||
2.00% | 03/01/52 | 141,706,930 | 112,288,947 | |||||||||
Fannie Mae Pool MA4563 |
| |||||||||||
2.50% | 03/01/52 | 209,868,091 | 173,764,918 | |||||||||
Fannie Mae Pool MA4577 |
| |||||||||||
2.00% | 04/01/52 | 126,045,351 | 99,846,935 | |||||||||
Fannie Mae Pool MA4578 |
| |||||||||||
2.50% | 04/01/52 | 340,786,969 | 282,162,092 | |||||||||
Fannie Mae Pool MA4733 |
| |||||||||||
4.50% | 09/01/52 | 316,564,744 | 301,657,757 | |||||||||
Fannie Mae REMICS, |
| |||||||||||
Series 1999-11, Class Z |
| |||||||||||
5.50% | 03/25/29 | 7,158 | 6,870 | |||||||||
Fannie Mae REMICS, |
| |||||||||||
Series 2001-52, Class YZ |
| |||||||||||
6.50% | 10/25/31 | 48,708 | 49,636 | |||||||||
Fannie Mae REMICS, |
| |||||||||||
Series 2005-122, Class SG (IO) |
| |||||||||||
(-1.00 X SOFR30A plus 6.49%, 6.60% Cap) |
| |||||||||||
1.17% | 11/25/351 | 12,022 | 141 | |||||||||
Fannie Mae REMICS, |
| |||||||||||
Series 2005-92, Class US (IO) |
| |||||||||||
(-1.00 X SOFR30A plus 5.99%, 6.10% Cap) |
| |||||||||||
0.67% | 10/25/251 | 118,481 | 320 | |||||||||
Fannie Mae REMICS, |
| |||||||||||
Series 2006-4, Class WE |
| |||||||||||
4.50% | 02/25/36 | 20,918 | 20,373 | |||||||||
Fannie Mae REMICS, |
| |||||||||||
Series 2006-49, Class SE |
| |||||||||||
(-4.00 X SOFR30A plus 28.54%, 29.00% Cap) |
| |||||||||||
7.26% | 04/25/361 | 583,413 | 603,039 | |||||||||
See accompanying Notes to Financial Statements.
| 197 / Annual Report March 2024 |
Table of Contents
Total Return Bond Fund
Schedule of Portfolio Investments
March 31, 2024
| Issues | Maturity Date | Principal Amount | Value | |||||||||
MORTGAGE-BACKED (continued) |
| |||||||||||
U.S. Agency Mortgage-Backed (continued) |
| |||||||||||
Fannie Mae REMICS, |
| |||||||||||
Series 2007-17, Class SI (IO) |
| |||||||||||
(-1.00 X SOFR30A plus 6.29%, 6.40% Cap) |
| |||||||||||
0.97% | 03/25/371 | $ | 598,052 | $ | 48,916 | |||||||
Fannie Mae REMICS, |
| |||||||||||
Series 2007-34, Class SB (IO) |
| |||||||||||
(-1.00 X SOFR30A plus 6.00%, 6.11% Cap) |
| |||||||||||
0.68% | 04/25/371 | 1,284,729 | 88,813 | |||||||||
Fannie Mae REMICS, |
| |||||||||||
Series 2007-64, Class FA |
| |||||||||||
(SOFR30A plus 0.58%) |
| |||||||||||
5.90% | 07/25/371 | 1,828 | 1,819 | |||||||||
Fannie Mae REMICS, |
| |||||||||||
Series 2008-24, Class NA |
| |||||||||||
6.75% | 06/25/37 | 131,917 | 136,929 | |||||||||
Fannie Mae REMICS, |
| |||||||||||
Series 2010-116, Class SE (IO) |
| |||||||||||
(-1.00 X SOFR30A plus 6.49%, 6.60% Cap) |
| |||||||||||
1.17% | 10/25/401 | 1,706,023 | 164,541 | |||||||||
Fannie Mae REMICS, |
| |||||||||||
Series 2010-17, Class SB (IO) |
| |||||||||||
(-1.00 X SOFR30A plus 6.24%, 6.35% Cap) |
| |||||||||||
0.92% | 03/25/401 | 3,528,862 | 317,569 | |||||||||
Fannie Mae REMICS, |
| |||||||||||
Series 2010-43, Class KS (IO) |
| |||||||||||
(-1.00 X SOFR30A plus 6.31%, 6.42% Cap) |
| |||||||||||
0.99% | 05/25/401 | 6,240,550 | 578,891 | |||||||||
Fannie Mae REMICS, |
| |||||||||||
Series 2011-101, Class HE |
| |||||||||||
4.00% | 10/25/41 | 7,217,331 | 6,895,849 | |||||||||
Fannie Mae REMICS, |
| |||||||||||
Series 2011-111, Class DB |
| |||||||||||
4.00% | 11/25/41 | 6,600,356 | 6,277,832 | |||||||||
Fannie Mae REMICS, |
| |||||||||||
Series 2012-84, Class VZ |
| |||||||||||
3.50% | 08/25/42 | 5,555,957 | 5,166,122 | |||||||||
Fannie Mae REMICS, |
| |||||||||||
Series 2013-101, Class BO (PO) |
| |||||||||||
0.00% | 10/25/438 | 8,848,438 | 6,536,022 | |||||||||
Fannie Mae REMICS, |
| |||||||||||
Series 2013-101, Class CO (PO) |
| |||||||||||
0.00% | 10/25/438 | 5,079,480 | 3,745,533 | |||||||||
Fannie Mae REMICS, |
| |||||||||||
Series 2016-45, Class AF |
| |||||||||||
(SOFR30A plus 0.61%) |
| |||||||||||
5.93% | 07/25/461 | 6,455,295 | 6,317,772 | |||||||||
Fannie Mae REMICS, |
| |||||||||||
Series 2016-72, Class FA |
| |||||||||||
(SOFR30A plus 0.61%) |
| |||||||||||
5.93% | 10/25/461 | 13,194,802 | 12,907,516 | |||||||||
Fannie Mae REMICS, |
| |||||||||||
Series 2016-74, Class GF |
| |||||||||||
(SOFR30A plus 0.61%) |
| |||||||||||
5.93% | 10/25/461 | 10,412,904 | 10,249,331 | |||||||||
| Issues | Maturity Date | Principal Amount | Value | |||||||||
MORTGAGE-BACKED (continued) |
| |||||||||||
U.S. Agency Mortgage-Backed (continued) |
| |||||||||||
Fannie Mae REMICS, |
| |||||||||||
Series 2016-75, Class FL |
| |||||||||||
(SOFR30A plus 0.61%) |
| |||||||||||
5.93% | 10/25/461 | $ | 10,387,945 | $ | 10,225,295 | |||||||
Fannie Mae REMICS, |
| |||||||||||
Series 2018-29, Class AP |
| |||||||||||
3.50% | 11/25/46 | 18,749,976 | 18,186,302 | |||||||||
Fannie Mae REMICS, |
| |||||||||||
Series 2018-38, Class LA |
| |||||||||||
3.00% | 06/25/48 | 12,778,072 | 11,269,500 | |||||||||
Fannie Mae REMICS, |
| |||||||||||
Series 2018-38, Class PA |
| |||||||||||
3.50% | 06/25/47 | 15,936 | 15,021 | |||||||||
Fannie Mae REMICS, |
| |||||||||||
Series 2018-45, Class GA |
| |||||||||||
3.00% | 06/25/48 | 14,283,931 | 12,402,472 | |||||||||
Fannie Mae REMICS, |
| |||||||||||
Series 2018-57, Class QA |
| |||||||||||
3.50% | 05/25/46 | 9,934 | 9,758 | |||||||||
Fannie Mae REMICS, |
| |||||||||||
Series 2018-86, Class JA |
| |||||||||||
4.00% | 05/25/47 | 533,671 | 518,199 | |||||||||
Fannie Mae REMICS, |
| |||||||||||
Series 2018-94, Class KD |
| |||||||||||
3.50% | 12/25/48 | 3,095,100 | 2,779,557 | |||||||||
Fannie Mae REMICS, |
| |||||||||||
Series 2019-1, Class AB |
| |||||||||||
3.50% | 02/25/49 | 1,239,633 | 1,131,850 | |||||||||
Fannie Mae REMICS, |
| |||||||||||
Series 2019-1, Class KP |
| |||||||||||
3.25% | 02/25/49 | 1,253,273 | 1,128,279 | |||||||||
Fannie Mae REMICS, |
| |||||||||||
Series 2019-26, Class JE |
| |||||||||||
3.00% | 06/25/49 | 3,696,273 | 3,212,312 | |||||||||
Fannie Mae REMICS, |
| |||||||||||
Series 2019-45, Class PA |
| |||||||||||
3.00% | 08/25/49 | 13,555,635 | 11,958,107 | |||||||||
Fannie Mae REMICS, |
| |||||||||||
Series 2019-52, Class PA |
| |||||||||||
3.00% | 09/25/49 | 3,913,623 | 3,425,687 | |||||||||
Fannie Mae REMICS, |
| |||||||||||
Series 2019-67, Class FE |
| |||||||||||
(SOFR30A plus 0.56%) |
| |||||||||||
5.88% | 11/25/491 | 25,691,067 | 25,075,426 | |||||||||
Fannie Mae REMICS, |
| |||||||||||
Series 2019-79, Class FA |
| |||||||||||
(SOFR30A plus 0.61%) |
| |||||||||||
5.93% | 01/25/501 | 71,609 | 70,672 | |||||||||
Fannie Mae Trust, |
| |||||||||||
Series 2003-W2, Class 2A9 |
| |||||||||||
5.90% | 07/25/42 | 14,725 | 14,601 | |||||||||
Freddie Mac Gold Pool A24156 |
| |||||||||||
6.50% | 10/01/31 | 31,600 | 32,370 | |||||||||
Freddie Mac Gold Pool A25162 |
| |||||||||||
5.50% | 05/01/34 | 701,140 | 716,633 | |||||||||
See accompanying Notes to Financial Statements.
| Annual Report March 2024 / 198 |
Table of Contents
Total Return Bond Fund
Schedule of Portfolio Investments
March 31, 2024
| Issues | Maturity Date | Principal Amount | Value | |||||||||||||
MORTGAGE-BACKED (continued) |
| |||||||||||||||
U.S. Agency Mortgage-Backed (continued) |
| |||||||||||||||
Freddie Mac Gold Pool A39012 |
| |||||||||||||||
5.50% | 06/01/35 | $ | 17,058 | $ | 17,481 | |||||||||||
Freddie Mac Gold Pool A54856 |
| |||||||||||||||
5.00% | 01/01/34 | 1,439,521 | 1,432,585 | |||||||||||||
Freddie Mac Gold Pool A61164 |
| |||||||||||||||
5.00% | 04/01/36 | 4,560 | 4,576 | |||||||||||||
Freddie Mac Gold Pool A97038 |
| |||||||||||||||
4.00% | 02/01/41 | 5,150,420 | 4,941,089 | |||||||||||||
Freddie Mac Gold Pool C01492 |
| |||||||||||||||
5.00% | 02/01/33 | 176,335 | 176,764 | |||||||||||||
Freddie Mac Gold Pool C04546 |
| |||||||||||||||
3.00% | 02/01/43 | 9,616,291 | 8,600,987 | |||||||||||||
Freddie Mac Gold Pool C04573 |
| |||||||||||||||
3.00% | 03/01/43 | 11,841,123 | 10,591,275 | |||||||||||||
Freddie Mac Gold Pool C46104 |
| |||||||||||||||
6.50% | 09/01/29 | 3,991 | 4,098 | |||||||||||||
Freddie Mac Gold Pool C55789 |
| |||||||||||||||
7.50% | 10/01/27 | 505 | 504 | |||||||||||||
Freddie Mac Gold Pool G00992 |
| |||||||||||||||
7.00% | 11/01/28 | 219 | 226 | |||||||||||||
Freddie Mac Gold Pool G01515 |
| |||||||||||||||
5.00% | 02/01/33 | 221,410 | 221,739 | |||||||||||||
Freddie Mac Gold Pool G02579 |
| |||||||||||||||
5.00% | 12/01/34 | 333,393 | 335,692 | |||||||||||||
Freddie Mac Gold Pool G02884 |
| |||||||||||||||
6.00% | 04/01/37 | 1,041,487 | 1,089,973 | |||||||||||||
Freddie Mac Gold Pool G02955 |
| |||||||||||||||
5.50% | 03/01/37 | 1,542,196 | 1,580,039 | |||||||||||||
Freddie Mac Gold Pool G03357 |
| |||||||||||||||
5.50% | 08/01/37 | 445,152 | 457,318 | |||||||||||||
Freddie Mac Gold Pool G03676 |
| |||||||||||||||
5.50% | 12/01/37 | 1,004,323 | 1,028,576 | |||||||||||||
Freddie Mac Gold Pool G03783 |
| |||||||||||||||
5.50% | 01/01/38 | 844,523 | 864,917 | |||||||||||||
Freddie Mac Gold Pool G03985 |
| |||||||||||||||
6.00% | 03/01/38 | 5,282 | 5,501 | |||||||||||||
Freddie Mac Gold Pool G04438 |
| |||||||||||||||
5.50% | 05/01/38 | 2,290,319 | 2,349,066 | |||||||||||||
Freddie Mac Gold Pool G04703 |
| |||||||||||||||
5.50% | 08/01/38 | 1,783,459 | 1,829,259 | |||||||||||||
Freddie Mac Gold Pool G04706 |
| |||||||||||||||
5.50% | 09/01/38 | 74,487 | 76,395 | |||||||||||||
Freddie Mac Gold Pool G05866 |
| |||||||||||||||
4.50% | 02/01/40 | 7,432,600 | 7,302,504 | |||||||||||||
Freddie Mac Gold Pool G06361 |
| |||||||||||||||
4.00% | 03/01/41 | 10,319 | 9,844 | |||||||||||||
Freddie Mac Gold Pool G06498 |
| |||||||||||||||
4.00% | 04/01/41 | 9,993,879 | 9,522,940 | |||||||||||||
Freddie Mac Gold Pool G06499 |
| |||||||||||||||
4.00% | 03/01/41 | 4,351,814 | 4,163,987 | |||||||||||||
Freddie Mac Gold Pool G07408 |
| |||||||||||||||
3.50% | 06/01/43 | 10,971,051 | 10,193,990 | |||||||||||||
Freddie Mac Gold Pool G07786 |
| |||||||||||||||
4.00% | 08/01/44 | 84,322,615 | 80,558,103 | |||||||||||||
Freddie Mac Gold Pool G07848 |
| |||||||||||||||
3.50% | 04/01/44 | 52,660,555 | 48,853,242 | |||||||||||||
| Issues | Maturity Date | Principal Amount | Value | |||||||||||
MORTGAGE-BACKED (continued) |
| |||||||||||||
U.S. Agency Mortgage-Backed (continued) |
| |||||||||||||
Freddie Mac Gold Pool G07849 |
| |||||||||||||
3.50% | 05/01/44 | $ | 6,954,894 | $ | 6,453,583 | |||||||||
Freddie Mac Gold Pool G07924 |
| |||||||||||||
3.50% | 01/01/45 | 7,739,175 | 7,116,520 | |||||||||||
Freddie Mac Gold Pool G07925 |
| |||||||||||||
4.00% | 02/01/45 | 5,548,213 | 5,271,268 | |||||||||||
Freddie Mac Gold Pool G08676 |
| |||||||||||||
3.50% | 11/01/45 | 18,844,915 | 17,282,263 | |||||||||||
Freddie Mac Gold Pool G08681 |
| |||||||||||||
3.50% | 12/01/45 | 12,654,982 | 11,605,609 | |||||||||||
Freddie Mac Gold Pool G08698 |
| |||||||||||||
3.50% | 03/01/46 | 651 | 597 | |||||||||||
Freddie Mac Gold Pool G08710 |
| |||||||||||||
3.00% | 06/01/46 | 76,195,368 | 67,383,168 | |||||||||||
Freddie Mac Gold Pool G08711 |
| |||||||||||||
3.50% | 06/01/46 | 5,360,562 | 4,902,938 | |||||||||||
Freddie Mac Gold Pool G08715 |
| |||||||||||||
3.00% | 08/01/46 | 104,260,435 | 92,202,434 | |||||||||||
Freddie Mac Gold Pool G08721 |
| |||||||||||||
3.00% | 09/01/46 | 10,550,281 | 9,332,311 | |||||||||||
Freddie Mac Gold Pool G08722 |
| |||||||||||||
3.50% | 09/01/46 | 23,985,972 | 21,938,324 | |||||||||||
Freddie Mac Gold Pool G08726 |
| |||||||||||||
3.00% | 10/01/46 | 113,122,972 | 99,957,523 | |||||||||||
Freddie Mac Gold Pool G08727 |
| |||||||||||||
3.50% | 10/01/46 | 21,130,795 | 19,326,889 | |||||||||||
Freddie Mac Gold Pool G08732 |
| |||||||||||||
3.00% | 11/01/46 | 69,717,600 | 61,603,744 | |||||||||||
Freddie Mac Gold Pool G08741 |
| |||||||||||||
3.00% | 01/01/47 | 44,463,555 | 39,288,808 | |||||||||||
Freddie Mac Gold Pool G08742 |
| |||||||||||||
3.50% | 01/01/47 | 33,933,532 | 31,036,674 | |||||||||||
Freddie Mac Gold Pool G08747 |
| |||||||||||||
3.00% | 02/01/47 | 15,635,816 | 13,816,092 | |||||||||||
Freddie Mac Gold Pool G08757 |
| |||||||||||||
3.50% | 04/01/47 | 12,343,655 | 11,262,823 | |||||||||||
Freddie Mac Gold Pool G08758 |
| |||||||||||||
4.00% | 04/01/47 | 9,498 | 9,001 | |||||||||||
Freddie Mac Gold Pool G08762 |
| |||||||||||||
4.00% | 05/01/47 | 9,532,150 | 9,032,305 | |||||||||||
Freddie Mac Gold Pool G08779 |
| |||||||||||||
3.50% | 09/01/47 | 47,729 | 43,531 | |||||||||||
Freddie Mac Gold Pool G08784 |
| |||||||||||||
3.50% | 10/01/47 | 42,168 | 38,476 | |||||||||||
Freddie Mac Gold Pool G08792 |
| |||||||||||||
3.50% | 12/01/47 | 36,204 | 33,034 | |||||||||||
Freddie Mac Gold Pool G08826 |
| |||||||||||||
5.00% | 06/01/48 | 6,942,714 | 6,897,181 | |||||||||||
Freddie Mac Gold Pool G08833 |
| |||||||||||||
5.00% | 07/01/48 | 3,897,082 | 3,874,281 | |||||||||||
Freddie Mac Gold Pool G08838 |
| |||||||||||||
5.00% | 09/01/48 | 2,099,374 | 2,084,769 | |||||||||||
Freddie Mac Gold Pool G08840 |
| |||||||||||||
5.00% | 08/01/48 | 604,941 | 601,427 | |||||||||||
Freddie Mac Gold Pool G08843 |
| |||||||||||||
4.50% | 10/01/48 | 4,907,793 | 4,747,166 | |||||||||||
See accompanying Notes to Financial Statements.
| 199 / Annual Report March 2024 |
Table of Contents
Total Return Bond Fund
Schedule of Portfolio Investments
March 31, 2024
| Issues | Maturity Date | Principal Amount | Value | |||||||||||||
MORTGAGE-BACKED (continued) |
| |||||||||||||||
U.S. Agency Mortgage-Backed (continued) |
| |||||||||||||||
Freddie Mac Gold Pool G08844 |
| |||||||||||||||
5.00% | 10/01/48 | $ | 5,487,712 | $ | 5,451,721 | |||||||||||
Freddie Mac Gold Pool G08848 |
| |||||||||||||||
4.50% | 11/01/48 | 863,298 | 837,172 | |||||||||||||
Freddie Mac Gold Pool G08849 |
| |||||||||||||||
5.00% | 11/01/48 | 1,948,033 | 1,933,446 | |||||||||||||
Freddie Mac Gold Pool G16085 |
| |||||||||||||||
2.50% | 02/01/32 | 1,973,671 | 1,846,953 | |||||||||||||
Freddie Mac Gold Pool G16502 |
| |||||||||||||||
3.50% | 05/01/33 | 36,581 | 35,228 | |||||||||||||
Freddie Mac Gold Pool G16524 |
| |||||||||||||||
3.50% | 05/01/33 | 14,567,468 | 14,028,613 | |||||||||||||
Freddie Mac Gold Pool G16584 |
| |||||||||||||||
3.50% | 08/01/33 | 2,127,941 | 2,046,568 | |||||||||||||
Freddie Mac Gold Pool G16607 |
| |||||||||||||||
3.50% | 09/01/33 | 20,938,583 | 20,128,015 | |||||||||||||
Freddie Mac Gold Pool G16623 |
| |||||||||||||||
2.50% | 09/01/32 | 15,696,993 | 14,709,512 | |||||||||||||
Freddie Mac Gold Pool G16755 |
| |||||||||||||||
3.50% | 02/01/34 | 20,506,859 | 19,719,773 | |||||||||||||
Freddie Mac Gold Pool G16756 |
| |||||||||||||||
3.50% | 01/01/34 | 1,900,701 | 1,827,159 | |||||||||||||
Freddie Mac Gold Pool G18592 |
| |||||||||||||||
3.00% | 03/01/31 | 13,889 | 13,243 | |||||||||||||
Freddie Mac Gold Pool G18596 |
| |||||||||||||||
3.00% | 04/01/31 | 16,218,527 | 15,524,291 | |||||||||||||
Freddie Mac Gold Pool G18691 |
| |||||||||||||||
3.00% | 06/01/33 | 6,013,347 | 5,685,453 | |||||||||||||
Freddie Mac Gold Pool G18692 |
| |||||||||||||||
3.50% | 06/01/33 | 8,130,859 | 7,818,924 | |||||||||||||
Freddie Mac Gold Pool G18713 |
| |||||||||||||||
3.50% | 11/01/33 | 9,839,505 | 9,447,866 | |||||||||||||
Freddie Mac Gold Pool G18716 |
| |||||||||||||||
3.50% | 12/01/33 | 27,729 | 26,623 | |||||||||||||
Freddie Mac Gold Pool G60023 |
| |||||||||||||||
3.50% | 04/01/45 | 8,290,765 | 7,660,004 | |||||||||||||
Freddie Mac Gold Pool G60080 |
| |||||||||||||||
3.50% | 06/01/45 | 87,178,868 | 80,219,384 | |||||||||||||
Freddie Mac Gold Pool G60138 |
| |||||||||||||||
3.50% | 08/01/45 | 69,319,192 | 64,045,391 | |||||||||||||
Freddie Mac Gold Pool G60238 |
| |||||||||||||||
3.50% | 10/01/45 | 26,763,861 | 24,535,555 | |||||||||||||
Freddie Mac Gold Pool G60344 |
| |||||||||||||||
4.00% | 12/01/45 | 64,419 | 61,207 | |||||||||||||
Freddie Mac Gold Pool G67700 |
| |||||||||||||||
3.50% | 08/01/46 | 20,413,871 | 18,716,242 | |||||||||||||
Freddie Mac Gold Pool G67703 |
| |||||||||||||||
3.50% | 04/01/47 | 146,927,985 | 134,643,670 | |||||||||||||
Freddie Mac Gold Pool G67707 |
| |||||||||||||||
3.50% | 01/01/48 | 76,287,045 | 69,791,582 | |||||||||||||
Freddie Mac Gold Pool G67711 |
| |||||||||||||||
4.00% | 03/01/48 | 43,485,525 | 41,222,036 | |||||||||||||
Freddie Mac Gold Pool G67713 |
| |||||||||||||||
4.00% | 06/01/48 | 388,385 | 367,319 | |||||||||||||
Freddie Mac Gold Pool G67714 |
| |||||||||||||||
4.00% | 07/01/48 | 63,485 | 60,161 | |||||||||||||
| Issues | Maturity Date | Principal Amount | Value | |||||||||||
MORTGAGE-BACKED (continued) |
| |||||||||||||
U.S. Agency Mortgage-Backed (continued) |
| |||||||||||||
Freddie Mac Gold Pool G67717 |
| |||||||||||||
4.00% | 11/01/48 | $ | 53,479,963 | $ | 50,679,536 | |||||||||
Freddie Mac Gold Pool H00790 |
| |||||||||||||
5.50% | 05/01/37 | 3,876 | 3,918 | |||||||||||
Freddie Mac Gold Pool H05069 |
| |||||||||||||
5.50% | 05/01/37 | 61,010 | 61,656 | |||||||||||
Freddie Mac Gold Pool Q05804 |
| |||||||||||||
4.00% | 01/01/42 | 17,367,576 | 16,597,434 | |||||||||||
Freddie Mac Gold Pool U99097 |
| |||||||||||||
3.50% | 07/01/43 | 25,098,263 | 23,023,756 | |||||||||||
Freddie Mac Gold Pool V62078 |
| |||||||||||||
3.50% | 08/01/33 | 2,211,428 | 2,126,588 | |||||||||||
Freddie Mac Gold Pool V62129 |
| |||||||||||||
3.50% | 08/01/33 | 5,099,455 | 4,903,750 | |||||||||||
Freddie Mac Gold Pool V80356 |
| |||||||||||||
3.50% | 08/01/43 | 18,065,494 | 16,613,548 | |||||||||||
Freddie Mac Pool QD3162 |
| |||||||||||||
2.00% | 12/01/51 | 134,397,952 | 106,648,502 | |||||||||||
Freddie Mac Pool QD7213 |
| |||||||||||||
2.00% | 02/01/52 | 92,234,564 | 73,042,964 | |||||||||||
Freddie Mac Pool QE0312 |
| |||||||||||||
2.00% | 04/01/52 | 6,366,580 | 5,041,861 | |||||||||||
Freddie Mac Pool QE0521 |
| |||||||||||||
2.50% | 04/01/52 | 2,895,850 | 2,397,683 | |||||||||||
Freddie Mac Pool RA4201 |
| |||||||||||||
2.00% | 12/01/50 | 8,320,288 | 6,619,019 | |||||||||||
Freddie Mac Pool RA4398 |
| |||||||||||||
2.00% | 01/01/51 | 71,247,826 | 56,755,041 | |||||||||||
Freddie Mac Pool RA4542 |
| |||||||||||||
2.50% | 02/01/51 | 43,572,616 | 36,120,132 | |||||||||||
Freddie Mac Pool RA5285 |
| |||||||||||||
2.50% | 05/01/51 | 108,538,059 | 90,665,113 | |||||||||||
Freddie Mac Pool RA6507 |
| |||||||||||||
2.00% | 12/01/51 | 122,668,342 | 97,514,080 | |||||||||||
Freddie Mac Pool RB5077 |
| |||||||||||||
2.00% | 10/01/40 | 88,453,877 | 74,569,064 | |||||||||||
Freddie Mac Pool RE6029 |
| |||||||||||||
3.00% | 02/01/50 | 3,636,629 | 3,114,890 | |||||||||||
Freddie Mac Pool SD1178 |
| |||||||||||||
2.00% | 03/01/52 | 15,823,779 | 12,541,869 | |||||||||||
Freddie Mac Pool SD2148 |
| |||||||||||||
4.50% | 01/01/53 | 48,795,447 | 46,539,242 | |||||||||||
Freddie Mac Pool SD2322 |
| |||||||||||||
4.50% | 09/01/52 | 142,194,941 | 135,579,023 | |||||||||||
Freddie Mac Pool SD3302 |
| |||||||||||||
2.00% | 10/01/51 | 59,149,265 | 46,991,674 | |||||||||||
Freddie Mac Pool SD3631 |
| |||||||||||||
3.00% | 07/01/52 | 74,432,099 | 64,119,848 | |||||||||||
Freddie Mac Pool SD3890 |
| |||||||||||||
3.00% | 08/01/52 | 96,164,969 | 82,854,402 | |||||||||||
Freddie Mac Pool SD4636 |
| |||||||||||||
3.00% | 01/01/53 | 107,801,162 | 92,893,092 | |||||||||||
Freddie Mac Pool SD7502 |
| |||||||||||||
3.50% | 07/01/49 | 6,383,100 | 5,817,820 | |||||||||||
Freddie Mac Pool SD7503 |
| |||||||||||||
3.50% | 08/01/49 | 13,940,229 | 12,706,616 | |||||||||||
See accompanying Notes to Financial Statements.
| Annual Report March 2024 / 200 |
Table of Contents
Total Return Bond Fund
Schedule of Portfolio Investments
March 31, 2024
| Issues | Maturity Date | Principal Amount | Value | |||||||||||
MORTGAGE-BACKED (continued) |
| |||||||||||||
U.S. Agency Mortgage-Backed (continued) |
| |||||||||||||
Freddie Mac Pool SD7511 |
| |||||||||||||
3.50% | 01/01/50 | $ | 14,340,815 | $ | 13,062,789 | |||||||||
Freddie Mac Pool SD8121 |
| |||||||||||||
2.00% | 01/01/51 | 112,194 | 89,496 | |||||||||||
Freddie Mac Pool SD8182 |
| |||||||||||||
2.00% | 12/01/51 | 25,842,327 | 20,498,580 | |||||||||||
Freddie Mac Pool SD8188 |
| |||||||||||||
2.00% | 01/01/52 | 40,909,602 | 32,474,864 | |||||||||||
Freddie Mac Pool SD8189 |
| |||||||||||||
2.50% | 01/01/52 | 343,816,890 | 284,697,731 | |||||||||||
Freddie Mac Pool SD8193 |
| |||||||||||||
2.00% | 02/01/52 | 76,742,756 | 60,826,028 | |||||||||||
Freddie Mac Pool SD8199 |
| |||||||||||||
2.00% | 03/01/52 | 128,926,892 | 102,100,579 | |||||||||||
Freddie Mac Pool SD8204 |
| |||||||||||||
2.00% | 04/01/52 | 11,901,637 | 9,432,803 | |||||||||||
Freddie Mac Pool SD8205 |
| |||||||||||||
2.50% | 04/01/52 | 295,471,525 | 244,642,170 | |||||||||||
Freddie Mac Pool SD8211 |
| |||||||||||||
2.00% | 05/01/52 | 11,530,110 | 9,136,490 | |||||||||||
Freddie Mac Pool SD8266 |
| |||||||||||||
4.50% | 11/01/52 | 300,998,484 | 286,733,458 | |||||||||||
Freddie Mac Pool ZA5103 |
| |||||||||||||
3.50% | 12/01/47 | 110,596 | 100,790 | |||||||||||
Freddie Mac Pool ZA5128 |
| |||||||||||||
3.50% | 12/01/47 | 354,799 | 323,069 | |||||||||||
Freddie Mac Pool ZM1779 |
| |||||||||||||
3.00% | 09/01/46 | 11,533,958 | 10,189,183 | |||||||||||
Freddie Mac Pool ZM2285 |
| |||||||||||||
3.00% | 12/01/46 | 13,516,045 | 11,937,056 | |||||||||||
Freddie Mac Pool ZS4693 |
| |||||||||||||
3.00% | 12/01/46 | 13,537,278 | 11,955,809 | |||||||||||
Freddie Mac Pool ZS4768 |
| |||||||||||||
3.50% | 05/01/48 | 925,712 | 842,347 | |||||||||||
Freddie Mac Pool ZT0277 |
| |||||||||||||
3.50% | 10/01/46 | 1,356,429 | 1,241,481 | |||||||||||
Freddie Mac Pool ZT1403 |
| |||||||||||||
3.50% | 11/01/33 | 10,793,736 | 10,368,173 | |||||||||||
Freddie Mac REMICS, |
| |||||||||||||
Series 1980, Class Z |
| |||||||||||||
7.00% | 07/15/27 | 16,714 | 16,710 | |||||||||||
Freddie Mac REMICS, |
| |||||||||||||
Series 2098, Class TZ |
| |||||||||||||
6.00% | 01/15/28 | 72,680 | 72,534 | |||||||||||
Freddie Mac REMICS, |
| |||||||||||||
Series 2174, Class PN |
| |||||||||||||
6.00% | 07/15/29 | 5,517 | 5,495 | |||||||||||
Freddie Mac REMICS, |
| |||||||||||||
Series 2313, Class LA |
| |||||||||||||
6.50% | 05/15/31 | 2,002 | 2,028 | |||||||||||
Freddie Mac REMICS, |
| |||||||||||||
Series 2433, Class SA |
| |||||||||||||
(-2.60 X SOFR30A plus 20.63%, 20.93% Cap) |
| |||||||||||||
6.80% | 02/15/32 | 1 | 3,670 | 4,035 | ||||||||||
| Issues | Maturity Date | Principal Amount | Value | |||||||||||
MORTGAGE-BACKED (continued) |
| |||||||||||||
U.S. Agency Mortgage-Backed (continued) |
| |||||||||||||
Freddie Mac REMICS, |
| |||||||||||||
Series 2481, Class AW |
| |||||||||||||
6.50% | 08/15/32 | $ | 5,639 | $ | 5,686 | |||||||||
Freddie Mac REMICS, |
| |||||||||||||
Series 3019, Class SW (IO) |
| |||||||||||||
(-1.00 X SOFR30A plus 7.09%, 7.20% Cap) |
| |||||||||||||
1.77% | 08/15/35 | 1 | 542,034 | 66,414 | ||||||||||
Freddie Mac REMICS, |
| |||||||||||||
Series 3063, Class YG |
| |||||||||||||
5.50% | 11/15/35 | 1,409,159 | 1,439,246 | |||||||||||
Freddie Mac REMICS, |
| |||||||||||||
Series 3300, Class SA (IO) |
| |||||||||||||
(-1.00 X SOFR30A plus 7.09%, 7.20% Cap) |
| |||||||||||||
1.77% | 08/15/35 | 1 | 239,645 | 21,077 | ||||||||||
Freddie Mac REMICS, |
| |||||||||||||
Series 3752, Class XL |
| |||||||||||||
4.50% | 11/15/40 | 23,437,682 | 23,080,192 | |||||||||||
Freddie Mac REMICS, |
| |||||||||||||
Series 3891, Class HS (IO) |
| |||||||||||||
(-1.00 X SOFR30A plus 5.84%, 5.95% Cap) |
| |||||||||||||
0.52% | 07/15/41 | 1 | 3,030,455 | 108,582 | ||||||||||
Freddie Mac REMICS, |
| |||||||||||||
Series 3904, Class JB |
| |||||||||||||
4.50% | 08/15/41 | 5,477,634 | 5,392,761 | |||||||||||
Freddie Mac REMICS, |
| |||||||||||||
Series 3925, Class LB |
| |||||||||||||
4.50% | 09/15/41 | 9,215,000 | 8,969,437 | |||||||||||
Freddie Mac REMICS, |
| |||||||||||||
Series 3928, Class JD |
| |||||||||||||
4.00% | 09/15/41 | 14,958,568 | 14,497,346 | |||||||||||
Freddie Mac REMICS, |
| |||||||||||||
Series 4102, Class TC |
| |||||||||||||
2.50% | 09/15/41 | 4,709,393 | 4,474,736 | |||||||||||
Freddie Mac REMICS, |
| |||||||||||||
Series 4161, Class BA |
| |||||||||||||
2.50% | 12/15/41 | 7,189,360 | 6,870,971 | |||||||||||
Freddie Mac REMICS, |
| |||||||||||||
Series 4656, Class EZ |
| |||||||||||||
4.00% | 02/15/47 | 205,673 | 189,836 | |||||||||||
Freddie Mac REMICS, |
| |||||||||||||
Series 4818, Class CA |
| |||||||||||||
3.00% | 04/15/48 | 1,084,154 | 950,352 | |||||||||||
Freddie Mac REMICS, |
| |||||||||||||
Series 4846, Class PA |
| |||||||||||||
4.00% | 06/15/47 | 101,116 | 99,498 | |||||||||||
Freddie Mac REMICS, |
| |||||||||||||
Series 4852, Class CA |
| |||||||||||||
4.00% | 11/15/47 | 5,888,536 | 5,641,802 | |||||||||||
Freddie Mac REMICS, |
| |||||||||||||
Series 4860, Class BH |
| |||||||||||||
3.50% | 10/15/48 | 2,169,531 | 2,050,369 | |||||||||||
Freddie Mac REMICS, |
| |||||||||||||
Series 4860, Class PA |
| |||||||||||||
3.50% | 02/15/49 | 1,900,874 | 1,718,100 | |||||||||||
See accompanying Notes to Financial Statements.
| 201 / Annual Report March 2024 |
Table of Contents
Total Return Bond Fund
Schedule of Portfolio Investments
March 31, 2024
| Issues | Maturity Date | Principal Amount | Value | |||||||||||
MORTGAGE-BACKED (continued) |
| |||||||||||||
U.S. Agency Mortgage-Backed (continued) |
| |||||||||||||
Freddie Mac REMICS, |
| |||||||||||||
Series 4879, Class BC |
| |||||||||||||
3.00% | 04/15/49 | $ | 626,531 | $ | 562,131 | |||||||||
Freddie Mac REMICS, |
| |||||||||||||
Series 4896, Class DA |
| |||||||||||||
3.00% | 01/15/49 | 630,803 | 550,377 | |||||||||||
Freddie Mac REMICS, |
| |||||||||||||
Series 4937, Class MF |
| |||||||||||||
(SOFR30A plus 0.56%) |
| |||||||||||||
5.88% | 12/25/49 | 1 | 5,022,980 | 4,941,841 | ||||||||||
Freddie Mac Strips, |
| |||||||||||||
Series 309, Class PO (PO) |
| |||||||||||||
0.00% | 08/15/43 | 8 | 10,586,213 | 7,878,014 | ||||||||||
Freddie Mac Strips, |
| |||||||||||||
Series 319, Class F2 |
| |||||||||||||
(SOFR30A plus 0.61%) |
| |||||||||||||
5.93% | 11/15/43 | 1 | 1,812,568 | 1,774,585 | ||||||||||
Ginnie Mae (TBA) |
| |||||||||||||
2.50% | 04/20/54 | 801,000,000 | 682,727,344 | |||||||||||
4.50% | 04/20/54 | 843,125,000 | 810,345,312 | |||||||||||
5.00% | 04/20/54 | 704,750,000 | 692,751,934 | |||||||||||
5.50% | 04/20/54 | 433,450,000 | 433,144,118 | |||||||||||
Ginnie Mae I Pool 782817 |
| |||||||||||||
4.50% | 11/15/39 | 8,216,571 | 8,118,328 | |||||||||||
Ginnie Mae I Pool AA5452 |
| |||||||||||||
3.50% | 07/15/42 | 67,681 | 63,047 | |||||||||||
Ginnie Mae II Pool 2631 |
| |||||||||||||
7.00% | 08/20/28 | 599 | 612 | |||||||||||
Ginnie Mae II Pool 3388 |
| |||||||||||||
4.50% | 05/20/33 | 1,353 | 1,324 | |||||||||||
Ginnie Mae II Pool 3427 |
| |||||||||||||
4.50% | 08/20/33 | 726 | 717 | |||||||||||
Ginnie Mae II Pool 3554 |
| |||||||||||||
4.50% | 05/20/34 | 607 | 600 | |||||||||||
Ginnie Mae II Pool 4058 |
| |||||||||||||
5.00% | 12/20/37 | 392 | 395 | |||||||||||
Ginnie Mae II Pool 4342 |
| |||||||||||||
5.00% | 01/20/39 | 568 | 573 | |||||||||||
Ginnie Mae II Pool 4520 |
| |||||||||||||
5.00% | 08/20/39 | 10,656 | 10,739 | |||||||||||
Ginnie Mae II Pool 5140 |
| |||||||||||||
4.50% | 08/20/41 | 23,607 | 23,271 | |||||||||||
Ginnie Mae II Pool 5175 |
| |||||||||||||
4.50% | 09/20/41 | 25,533 | 25,170 | |||||||||||
Ginnie Mae II Pool 5281 |
| |||||||||||||
4.50% | 01/20/42 | 7,263 | 7,160 | |||||||||||
Ginnie Mae II Pool 783591 |
| |||||||||||||
4.50% | 07/20/41 | 9,109 | 8,979 | |||||||||||
Ginnie Mae II Pool 80968 |
| |||||||||||||
(US Treasury Yield Curve Rate T Note Constant Maturity |
| |||||||||||||
1-Year plus 1.50%) |
| |||||||||||||
3.63% | 07/20/34 | 1 | 5,489 | 5,402 | ||||||||||
Ginnie Mae II Pool 81267 |
| |||||||||||||
(US Treasury Yield Curve Rate T Note Constant Maturity |
| |||||||||||||
1-Year plus 1.50%) |
| |||||||||||||
3.63% | 03/20/35 | 1 | 6,707 | 6,511 | ||||||||||
| Issues | Maturity Date | Principal Amount | Value | |||||||||||
MORTGAGE-BACKED (continued) |
| |||||||||||||
U.S. Agency Mortgage-Backed (continued) |
| |||||||||||||
Ginnie Mae II Pool 81432 |
| |||||||||||||
(US Treasury Yield Curve Rate T Note Constant Maturity |
| |||||||||||||
1-Year plus 1.50%) |
| |||||||||||||
3.63% | 08/20/35 | 1 | $ | 8,959 | $ | 8,884 | ||||||||
Ginnie Mae II Pool 81497 |
| |||||||||||||
(US Treasury Yield Curve Rate T Note Constant Maturity |
| |||||||||||||
1-Year plus 1.50%) |
| |||||||||||||
3.75% | 10/20/35 | 1 | 7,307 | 7,213 | ||||||||||
Ginnie Mae II Pool 8631 |
| |||||||||||||
(US Treasury Yield Curve Rate T Note Constant Maturity |
| |||||||||||||
1-Year plus 1.50%) |
| |||||||||||||
4.00% | 05/20/25 | 1 | 429 | 426 | ||||||||||
Ginnie Mae II Pool 8644 |
| |||||||||||||
(US Treasury Yield Curve Rate T Note Constant Maturity |
| |||||||||||||
1-Year plus 1.50%) |
| |||||||||||||
4.50% | 06/20/25 | 1 | 285 | 282 | ||||||||||
Ginnie Mae II Pool MA0627 |
| |||||||||||||
4.50% | 12/20/42 | 29,969 | 29,552 | |||||||||||
Ginnie Mae II Pool MA0701 |
| |||||||||||||
4.50% | 01/20/43 | 29,188 | 28,773 | |||||||||||
Ginnie Mae II Pool MA1157 |
| |||||||||||||
3.50% | 07/20/43 | 28,062 | 26,082 | |||||||||||
Ginnie Mae II Pool MA1997 |
| |||||||||||||
4.50% | 06/20/44 | 7,474 | 7,356 | |||||||||||
Ginnie Mae II Pool MA2374 |
| |||||||||||||
5.00% | 11/20/44 | 159,140 | 159,646 | |||||||||||
Ginnie Mae II Pool MA2756 |
| |||||||||||||
4.50% | 04/20/45 | 15,539 | 15,337 | |||||||||||
Ginnie Mae II Pool MA2828 |
| |||||||||||||
4.50% | 05/20/45 | 638,542 | 630,243 | |||||||||||
Ginnie Mae II Pool MA2894 |
| |||||||||||||
4.50% | 06/20/45 | 251,064 | 247,027 | |||||||||||
Ginnie Mae II Pool MA3036 |
| |||||||||||||
4.50% | 08/20/45 | 24,252 | 23,936 | |||||||||||
Ginnie Mae II Pool MA3309 |
| |||||||||||||
3.00% | 12/20/45 | 5,054 | 4,526 | |||||||||||
Ginnie Mae II Pool MA3456 |
| |||||||||||||
4.50% | 02/20/46 | 161,574 | 158,581 | |||||||||||
Ginnie Mae II Pool MA3521 |
| |||||||||||||
3.50% | 03/20/46 | 18,741,476 | 17,243,226 | |||||||||||
Ginnie Mae II Pool MA3524 |
| |||||||||||||
5.00% | 03/20/46 | 8,156 | 8,229 | |||||||||||
Ginnie Mae II Pool MA3597 |
| |||||||||||||
3.50% | 04/20/46 | 47,349,521 | 43,774,646 | |||||||||||
Ginnie Mae II Pool MA3600 |
| |||||||||||||
5.00% | 04/20/46 | 4,610,784 | 4,651,841 | |||||||||||
Ginnie Mae II Pool MA3662 |
| |||||||||||||
3.00% | 05/20/46 | 1,825,884 | 1,635,131 | |||||||||||
Ginnie Mae II Pool MA3663 |
| |||||||||||||
3.50% | 05/20/46 | 13,430,778 | 12,415,777 | |||||||||||
Ginnie Mae II Pool MA3665 |
| |||||||||||||
4.50% | 05/20/46 | 67,673 | 66,473 | |||||||||||
Ginnie Mae II Pool MA3666 |
| |||||||||||||
5.00% | 05/20/46 | 2,583,612 | 2,606,624 | |||||||||||
Ginnie Mae II Pool MA3738 |
| |||||||||||||
4.50% | 06/20/46 | 287,514 | 282,418 | |||||||||||
See accompanying Notes to Financial Statements.
| Annual Report March 2024 / 202 |
Table of Contents
Total Return Bond Fund
Schedule of Portfolio Investments
March 31, 2024
| Issues | Maturity Date | Principal Amount | Value | |||||||||||
MORTGAGE-BACKED (continued) |
| |||||||||||||
U.S. Agency Mortgage-Backed (continued) |
| |||||||||||||
Ginnie Mae II Pool MA3739 |
| |||||||||||||
5.00% | 06/20/46 | $ | 1,572,135 | $ | 1,586,134 | |||||||||
Ginnie Mae II Pool MA3805 |
| |||||||||||||
4.50% | 07/20/46 | 2,200,638 | 2,160,255 | |||||||||||
Ginnie Mae II Pool MA3806 |
| |||||||||||||
5.00% | 07/20/46 | 116,921 | 117,962 | |||||||||||
Ginnie Mae II Pool MA3873 |
| |||||||||||||
3.00% | 08/20/46 | 14,103,605 | 12,650,594 | |||||||||||
Ginnie Mae II Pool MA3876 |
| |||||||||||||
4.50% | 08/20/46 | 2,480,465 | 2,436,497 | |||||||||||
Ginnie Mae II Pool MA3877 |
| |||||||||||||
5.00% | 08/20/46 | 513,683 | 515,087 | |||||||||||
Ginnie Mae II Pool MA3937 |
| |||||||||||||
3.50% | 09/20/46 | 10,850,674 | 9,983,140 | |||||||||||
Ginnie Mae II Pool MA3939 |
| |||||||||||||
4.50% | 09/20/46 | 1,363,036 | 1,343,938 | |||||||||||
Ginnie Mae II Pool MA4003 |
| |||||||||||||
3.00% | 10/20/46 | 5,671,909 | 5,084,021 | |||||||||||
Ginnie Mae II Pool MA4006 |
| |||||||||||||
4.50% | 10/20/46 | 1,460,491 | 1,434,603 | |||||||||||
Ginnie Mae II Pool MA4007 |
| |||||||||||||
5.00% | 10/20/46 | 2,753,999 | 2,778,515 | |||||||||||
Ginnie Mae II Pool MA4069 |
| |||||||||||||
3.50% | 11/20/46 | 33,876,257 | 31,303,693 | |||||||||||
Ginnie Mae II Pool MA4071 |
| |||||||||||||
4.50% | 11/20/46 | 3,904,546 | 3,848,561 | |||||||||||
Ginnie Mae II Pool MA4072 |
| |||||||||||||
5.00% | 11/20/46 | 861,838 | 869,510 | |||||||||||
Ginnie Mae II Pool MA4126 |
| |||||||||||||
3.00% | 12/20/46 | 97,728,107 | 87,518,280 | |||||||||||
Ginnie Mae II Pool MA4127 |
| |||||||||||||
3.50% | 12/20/46 | 38,239,395 | 35,331,488 | |||||||||||
Ginnie Mae II Pool MA4129 |
| |||||||||||||
4.50% | 12/20/46 | 13,914,150 | 13,673,332 | |||||||||||
Ginnie Mae II Pool MA4196 |
| |||||||||||||
3.50% | 01/20/47 | 8,861 | 8,175 | |||||||||||
Ginnie Mae II Pool MA4198 |
| |||||||||||||
4.50% | 01/20/47 | 108,356 | 106,232 | |||||||||||
Ginnie Mae II Pool MA4199 |
| |||||||||||||
5.00% | 01/20/47 | 2,567,441 | 2,590,295 | |||||||||||
Ginnie Mae II Pool MA4264 |
| |||||||||||||
4.50% | 02/20/47 | 31,305,596 | 30,710,575 | |||||||||||
Ginnie Mae II Pool MA4265 |
| |||||||||||||
5.00% | 02/20/47 | 567,750 | 572,808 | |||||||||||
Ginnie Mae II Pool MA4324 |
| |||||||||||||
5.00% | 03/20/47 | 3,085,130 | 3,107,822 | |||||||||||
Ginnie Mae II Pool MA4382 |
| |||||||||||||
3.50% | 04/20/47 | 21,594,487 | 19,891,321 | |||||||||||
Ginnie Mae II Pool MA4384 |
| |||||||||||||
4.50% | 04/20/47 | 1,304,647 | 1,277,852 | |||||||||||
Ginnie Mae II Pool MA4385 |
| |||||||||||||
5.00% | 04/20/47 | 5,276,153 | 5,297,144 | |||||||||||
Ginnie Mae II Pool MA4453 |
| |||||||||||||
4.50% | 05/20/47 | 69,478,698 | 67,872,365 | |||||||||||
Ginnie Mae II Pool MA4454 |
| |||||||||||||
5.00% | 05/20/47 | 11,652,900 | 11,730,461 | |||||||||||
| Issues | Maturity Date | Principal Amount | Value | |||||||||||
MORTGAGE-BACKED (continued) |
| |||||||||||||
U.S. Agency Mortgage-Backed (continued) |
| |||||||||||||
Ginnie Mae II Pool MA4510 |
| |||||||||||||
3.50% | 06/20/47 | $ | 29,604 | $ | 27,332 | |||||||||
Ginnie Mae II Pool MA4511 |
| |||||||||||||
4.00% | 06/20/47 | 4,182,633 | 3,975,118 | |||||||||||
Ginnie Mae II Pool MA4512 |
| |||||||||||||
4.50% | 06/20/47 | 242,963 | 237,583 | |||||||||||
Ginnie Mae II Pool MA4513 |
| |||||||||||||
5.00% | 06/20/47 | 214,651 | 214,380 | |||||||||||
Ginnie Mae II Pool MA4586 |
| |||||||||||||
3.50% | 07/20/47 | 35,326,371 | 32,624,958 | |||||||||||
Ginnie Mae II Pool MA4588 |
| |||||||||||||
4.50% | 07/20/47 | 37,942 | 37,127 | |||||||||||
Ginnie Mae II Pool MA4589 |
| |||||||||||||
5.00% | 07/20/47 | 10,361,947 | 10,421,201 | |||||||||||
Ginnie Mae II Pool MA4652 |
| |||||||||||||
3.50% | 08/20/47 | 2,682,125 | 2,467,843 | |||||||||||
Ginnie Mae II Pool MA4655 |
| |||||||||||||
5.00% | 08/20/47 | 12,078,140 | 12,120,079 | |||||||||||
Ginnie Mae II Pool MA4719 |
| |||||||||||||
3.50% | 09/20/47 | 33,366,596 | 30,740,828 | |||||||||||
Ginnie Mae II Pool MA4720 |
| |||||||||||||
4.00% | 09/20/47 | 82,531 | 78,291 | |||||||||||
Ginnie Mae II Pool MA4722 |
| |||||||||||||
5.00% | 09/20/47 | 232,370 | 233,553 | |||||||||||
Ginnie Mae II Pool MA4781 |
| |||||||||||||
5.00% | 10/20/47 | 2,874,077 | 2,890,512 | |||||||||||
Ginnie Mae II Pool MA4836 |
| |||||||||||||
3.00% | 11/20/47 | 76,067,042 | 68,062,628 | |||||||||||
Ginnie Mae II Pool MA4837 |
| |||||||||||||
3.50% | 11/20/47 | 83,026,668 | 76,425,441 | |||||||||||
Ginnie Mae II Pool MA4838 |
| |||||||||||||
4.00% | 11/20/47 | 27,652,812 | 26,239,126 | |||||||||||
Ginnie Mae II Pool MA4840 |
| |||||||||||||
5.00% | 11/20/47 | 897,416 | 896,284 | |||||||||||
Ginnie Mae II Pool MA4900 |
| |||||||||||||
3.50% | 12/20/47 | 5,334,975 | 4,908,751 | |||||||||||
Ginnie Mae II Pool MA4901 |
| |||||||||||||
4.00% | 12/20/47 | 18,587,381 | 17,637,144 | |||||||||||
Ginnie Mae II Pool MA4961 |
| |||||||||||||
3.00% | 01/20/48 | 259,844 | 232,160 | |||||||||||
Ginnie Mae II Pool MA4963 |
| |||||||||||||
4.00% | 01/20/48 | 30,533,541 | 28,972,584 | |||||||||||
Ginnie Mae II Pool MA5078 |
| |||||||||||||
4.00% | 03/20/48 | 46,279 | 43,882 | |||||||||||
Ginnie Mae II Pool MA5137 |
| |||||||||||||
4.00% | 04/20/48 | 9,911,620 | 9,380,225 | |||||||||||
Ginnie Mae II Pool MA5399 |
| |||||||||||||
4.50% | 08/20/48 | 2,227,877 | 2,169,341 | |||||||||||
Ginnie Mae II Pool MA5466 |
| |||||||||||||
4.00% | 09/20/48 | 4,068,833 | 3,848,146 | |||||||||||
Ginnie Mae II Pool MA5467 |
| |||||||||||||
4.50% | 09/20/48 | 20,743 | 20,181 | |||||||||||
Ginnie Mae II Pool MA5528 |
| |||||||||||||
4.00% | 10/20/48 | 18,687,882 | 17,711,597 | |||||||||||
Ginnie Mae II Pool MA5530 |
| |||||||||||||
5.00% | 10/20/48 | 3,384,140 | 3,363,306 | |||||||||||
See accompanying Notes to Financial Statements.
| 203 / Annual Report March 2024 |
Table of Contents
Total Return Bond Fund
Schedule of Portfolio Investments
March 31, 2024
| Issues | Maturity Date | Principal Amount | Value | |||||||||||||
MORTGAGE-BACKED (continued) |
| |||||||||||||||
U.S. Agency Mortgage-Backed (continued) |
| |||||||||||||||
Ginnie Mae II Pool MA5651 |
| |||||||||||||||
4.00% | 12/20/48 | $ | 6,687 | $ | 6,313 | |||||||||||
Ginnie Mae II Pool MA6030 |
| |||||||||||||||
3.50% | 07/20/49 | 7,469,654 | 6,695,481 | |||||||||||||
Ginnie Mae II Pool MA6080 |
| |||||||||||||||
3.00% | 08/20/49 | 1,629 | 1,410 | |||||||||||||
Ginnie Mae II Pool MA6081 |
| |||||||||||||||
3.50% | 08/20/49 | 3,110,271 | 2,787,914 | |||||||||||||
Ginnie Mae II Pool MA6209 |
| |||||||||||||||
3.00% | 10/20/49 | 3,036,617 | 2,627,929 | |||||||||||||
Ginnie Mae II Pool MA6210 |
| |||||||||||||||
3.50% | 10/20/49 | 1,550,000 | 1,389,355 | |||||||||||||
Ginnie Mae II Pool MA7589 |
| |||||||||||||||
2.50% | 09/20/51 | 93,351,498 | 79,601,942 | |||||||||||||
Ginnie Mae, |
| |||||||||||||||
Series 2003-86, Class ZK |
| |||||||||||||||
5.00% | 10/20/33 | 2,789,827 | 2,797,351 | |||||||||||||
Ginnie Mae, |
| |||||||||||||||
Series 2007-35, Class PY (IO) |
| |||||||||||||||
(-1.00 X CME Term SOFR 1-Month plus 6.64%, 6.75% Cap) |
| |||||||||||||||
1.31% | 06/16/37 | 1 | 5,774,483 | 605,113 | ||||||||||||
Ginnie Mae, |
| |||||||||||||||
Series 2009-106, Class SD (IO) |
| |||||||||||||||
(-1.00 X CME Term SOFR 1-Month plus 6.14%, 6.25% Cap) |
| |||||||||||||||
0.81% | 03/20/36 | 1 | 4,944,485 | 181,841 | ||||||||||||
Ginnie Mae, |
| |||||||||||||||
Series 2009-106, Class XI (IO) |
| |||||||||||||||
(-1.00 X CME Term SOFR 1-Month plus 6.69%, 6.80% Cap) |
| |||||||||||||||
1.36% | 05/20/37 | 1 | 12,158,591 | 519,529 | ||||||||||||
Ginnie Mae, |
| |||||||||||||||
Series 2009-124, Class SC (IO) |
| |||||||||||||||
(-1.00 X CME Term SOFR 1-Month plus 6.37%, 6.48% Cap) |
| |||||||||||||||
1.04% | 12/20/39 | 1 | 1,991,310 | 191,805 | ||||||||||||
Ginnie Mae, |
| |||||||||||||||
Series 2009-66, Class XS (IO) |
| |||||||||||||||
(-1.00 X CME Term SOFR 1-Month plus 6.69%, 6.80% Cap) |
| |||||||||||||||
1.36% | 07/16/39 | 1 | 11,475 | 470 | ||||||||||||
Ginnie Mae, |
| |||||||||||||||
Series 2009-8, Class PS (IO) |
| |||||||||||||||
(-1.00 X CME Term SOFR 1-Month plus 6.19%, 6.30% Cap) |
| |||||||||||||||
0.86% | 08/16/38 | 1 | 7,753 | 45 | ||||||||||||
Ginnie Mae, |
| |||||||||||||||
Series 2010-4, Class SL (IO) |
| |||||||||||||||
(-1.00 X CME Term SOFR 1-Month plus 6.29%, 6.40% Cap) |
| |||||||||||||||
0.96% | 01/16/40 | 1 | 25,973 | 2,404 | ||||||||||||
Ginnie Mae, |
| |||||||||||||||
Series 2010-4, Class SM (IO) |
| |||||||||||||||
(-1.00 X CME Term SOFR 1-Month plus 5.69%, 5.80% Cap) |
| |||||||||||||||
0.36% | 01/16/40 | 1 | 4,722,342 | 365,452 | ||||||||||||
Ginnie Mae, |
| |||||||||||||||
Series 2010-6, Class BS (IO) |
| |||||||||||||||
(-1.00 X CME Term SOFR 1-Month plus 6.39%, 6.50% Cap) |
| |||||||||||||||
1.06% | 09/16/39 | 1 | 123,770 | 336 | ||||||||||||
Ginnie Mae, |
| |||||||||||||||
Series 2011-146, Class EI (IO) |
| |||||||||||||||
5.00% | 11/16/41 | 62,951 | 11,023 | |||||||||||||
| Issues | Maturity Date | Principal Amount | Value | |||||||||||||
MORTGAGE-BACKED (continued) |
| |||||||||||||||
U.S. Agency Mortgage-Backed (continued) |
| |||||||||||||||
Ginnie Mae, |
| |||||||||||||||
Series 2014-108, Class PA |
| |||||||||||||||
2.63% | 12/20/39 | $ | 4,233,747 | $ | 3,950,850 | |||||||||||
Ginnie Mae, |
| |||||||||||||||
Series 2018-124, Class NW |
| |||||||||||||||
3.50% | 09/20/48 | 622,476 | 556,237 | |||||||||||||
Ginnie Mae, |
| |||||||||||||||
Series 2019-1, Class NP |
| |||||||||||||||
3.50% | 01/20/49 | 5,605,966 | 5,131,498 | |||||||||||||
Ginnie Mae, |
| |||||||||||||||
Series 2019-119, Class JE |
| |||||||||||||||
3.00% | 09/20/49 | 4,133,469 | 3,652,518 | |||||||||||||
Ginnie Mae, |
| |||||||||||||||
Series 2019-15, Class GT |
| |||||||||||||||
3.50% | 02/20/49 | 6,562,607 | 5,947,049 | |||||||||||||
Ginnie Mae, |
| |||||||||||||||
Series 2019-44, Class CA |
| |||||||||||||||
3.50% | 12/20/48 | 36,772 | 36,526 | |||||||||||||
Ginnie Mae, |
| |||||||||||||||
Series 2019-71, Class PT |
| |||||||||||||||
3.00% | 06/20/49 | 732,963 | 652,276 | |||||||||||||
Ginnie Mae, |
| |||||||||||||||
Series 2019-86, Class C |
| |||||||||||||||
2.50% | 03/20/49 | 9,161,297 | 7,692,317 | |||||||||||||
Ginnie Mae, |
| |||||||||||||||
Series 2019-90, Class HE |
| |||||||||||||||
3.00% | 07/20/49 | 6,400,956 | 5,606,235 | |||||||||||||
Ginnie Mae, |
| |||||||||||||||
Series 2022-201, Class FB |
| |||||||||||||||
(SOFR30A plus 1.25%) |
| |||||||||||||||
6.50% | 11/20/52 | 1 | 9,784,754 | 9,760,632 | ||||||||||||
Ginnie Mae, |
| |||||||||||||||
Series 2023-134, Class F |
| |||||||||||||||
(SOFR30A plus 1.00%) |
| |||||||||||||||
6.32% | 08/20/53 | 1 | 66,376,473 | 66,205,937 | ||||||||||||
Ginnie Mae, |
| |||||||||||||||
Series 2024-30, Class AF |
| |||||||||||||||
(SOFR30A plus 1.25%) |
| |||||||||||||||
6.50% | 02/20/54 | 1 | 86,746,724 | 86,764,532 | ||||||||||||
Ginnie Mae, |
| |||||||||||||||
Series 2024-30, Class CF |
| |||||||||||||||
(SOFR30A plus 1.25%) |
| |||||||||||||||
6.50% | 02/20/54 | 1 | 91,003,382 | 91,139,122 | ||||||||||||
Ginnie Mae, |
| |||||||||||||||
Series 2024-30, Class DF |
| |||||||||||||||
(SOFR30A plus 1.30%) |
| |||||||||||||||
6.50% | 02/20/54 | 1 | 88,349,760 | 88,349,567 | ||||||||||||
UMBS (TBA) |
| |||||||||||||||
2.00% | 04/01/54 | 1,158,525,000 | 917,649,371 | |||||||||||||
2.50% | 04/01/54 | 581,725,000 | 481,296,578 | |||||||||||||
3.00% | 04/01/54 | 855,675,000 | 736,762,461 | |||||||||||||
3.50% | 04/01/54 | 841,650,000 | 753,720,720 | |||||||||||||
4.00% | 04/01/54 | 1,971,450,000 | 1,826,209,533 | |||||||||||||
4.50% | 04/01/54 | 1,150,800,000 | 1,096,181,996 | |||||||||||||
5.00% | 04/01/54 | 909,925,000 | 887,922,495 | |||||||||||||
See accompanying Notes to Financial Statements.
| Annual Report March 2024 / 204 |
Table of Contents
Total Return Bond Fund
Schedule of Portfolio Investments
March 31, 2024
| Issues | Maturity Date | Principal Amount | Value | |||||||||
MORTGAGE-BACKED (continued) |
| |||||||||||
U.S. Agency Mortgage-Backed (continued) |
| |||||||||||
5.50% | 04/01/54 | $ | 666,750,000 | $ | 663,508,148 | |||||||
|
|
| ||||||||||
| 20,164,094,230 | ||||||||||||
|
|
| ||||||||||
Total Mortgage-Backed (Cost $29,414,987,599) |
| 27,597,180,985 | ||||||||||
|
|
| ||||||||||
| MUNICIPAL BONDS — 0.33%* |
| |||||||||||
| California — 0.06% |
| |||||||||||
| Los Angeles Department of Airports Revenue Bonds, Port, Airport and Marina Improvements, Series A |
| |||||||||||
5.00% | 05/15/44 | 185,000 | 192,223 | |||||||||
| Regents of the University of California Medical Center Pooled Revenue Bonds, Health, Hospital and Nursing Home Improvements, Series N |
| |||||||||||
3.01% | 05/15/50 | 17,955,000 | 12,441,363 | |||||||||
3.26% | 05/15/60 | 17,050,000 | 11,769,216 | |||||||||
| University of California, Taxable, College & University, Revenue Bonds, University & College Improvements, Series AP |
| |||||||||||
3.93% | 05/15/45 | 6,615,000 | 6,112,936 | |||||||||
|
|
| ||||||||||
| 30,515,738 | ||||||||||||
|
|
| ||||||||||
Colorado — 0.01% |
| |||||||||||
| City & County of Denver Airport System Revenue Bonds, Series C |
| |||||||||||
2.39% | 11/15/31 | 6,010,000 | 5,162,978 | |||||||||
|
|
| ||||||||||
New Jersey — 0.00% |
| |||||||||||
| Jersey City Municipal Utilities Authority Revenue Bonds, Water Utility Improvements, Series B |
| |||||||||||
5.47% | 05/15/27 | 240,000 | 243,015 | |||||||||
| New Jersey Turnpike Authority Revenue Bonds, Highway Revenue, Series F |
| |||||||||||
3.73% | 01/01/36 | 300,000 | 270,493 | |||||||||
|
|
| ||||||||||
| 513,508 | ||||||||||||
|
|
| ||||||||||
New York — 0.26% |
| |||||||||||
| City of New York General Obligation Bonds, Public Improvements, Series D |
| |||||||||||
5.99% | 12/01/36 | 2,000,000 | 2,083,180 | |||||||||
| City of New York General Obligation Bonds, Public Improvements, Series F |
| |||||||||||
3.62% | 04/01/31 | 3,145,000 | 2,953,824 | |||||||||
| New York City Transitional Finance Authority Future Tax Secured Revenue Bonds, Public Improvements |
| |||||||||||
5.51% | 08/01/37 | 20,415,000 | 20,841,916 | |||||||||
| New York City Transitional Finance Authority Future Tax Secured Revenue Bonds, Public Improvements, Series A2 |
| |||||||||||
2.15% | 05/01/25 | 430,000 | 416,260 | |||||||||
| New York City Transitional Finance Authority Future Tax Secured Revenue Bonds, Public Improvements, Series B3 |
| |||||||||||
2.00% | 08/01/35 | 4,055,000 | 3,015,179 | |||||||||
| New York City Transitional Finance Authority Future Tax Secured Revenue Bonds, Public Improvements, Series D |
| |||||||||||
2.40% | 11/01/32 | 12,135,000 | 10,132,542 | |||||||||
| Issues | Maturity Date | Principal Amount | Value | |||||||||
| MUNICIPAL BONDS (continued) |
| |||||||||||
| New York (continued) |
| |||||||||||
| New York City Transitional Finance Authority Future Tax Secured Revenue Bonds, Public Improvements, Series E |
| |||||||||||
1.97% | 02/01/33 | $ | 3,090,000 | $ | 2,456,989 | |||||||
| New York City Transitional Finance Authority Future Tax Secured Revenue Bonds, Public Improvements, Subseries FI |
| |||||||||||
4.00% | 08/01/33 | 6,450,000 | 6,031,761 | |||||||||
| New York City Transitional Finance Authority Future Tax Secured Revenue Bonds, Public Improvements, Subseries SU |
| |||||||||||
3.88% | 08/01/31 | 3,135,000 | 2,967,134 | |||||||||
| New York City Transitional Finance Authority Future Tax Secured Revenue Bonds, School Improvements, Series G-3 |
| |||||||||||
5.27% | 05/01/27 | 13,135,000 | 13,283,181 | |||||||||
| New York City Transitional Finance Authority Future Tax Secured Revenue Bonds, Series A, Subseries A-2 |
| |||||||||||
4.60% | 05/01/31 | 820,000 | 814,403 | |||||||||
| New York City Transitional Finance Authority Future Tax Secured Revenue Bonds, Series F, Subseries F-3 |
| |||||||||||
5.13% | 02/01/35 | 1,250,000 | 1,274,514 | |||||||||
5.15% | 02/01/36 | 1,250,000 | 1,272,052 | |||||||||
| New York City Transitional Finance Authority Future Tax Secured Revenue Bonds, Series G |
| |||||||||||
2.45% | 11/01/34 | 3,000,000 | 2,408,666 | |||||||||
| New York State Dormitory Authority Revenue Bonds, University & College Improvements |
| |||||||||||
5.29% | 03/15/33 | 44,990,000 | 45,299,059 | |||||||||
5.43% | 03/15/39 | 21,300,000 | 21,290,404 | |||||||||
| New York State Dormitory Authority Revenue Bonds, University & College Improvements, Series A |
| |||||||||||
4.00% | 03/15/47 | 155,000 | 151,900 | |||||||||
| New York State Urban Development Corp. Revenue Bonds, Public Improvements |
| |||||||||||
5.77% | 03/15/39 | 135,000 | 137,746 | |||||||||
|
|
| ||||||||||
| 136,830,710 | ||||||||||||
|
|
| ||||||||||
Texas — 0.00% |
| |||||||||||
| Texas A&M University Revenue Bonds, University & College Improvements, Series B |
| |||||||||||
2.69% | 05/15/25 | 350,000 | 341,157 | |||||||||
|
|
| ||||||||||
Total Municipal Bonds (Cost $202,546,791) |
| 173,364,091 | ||||||||||
|
|
| ||||||||||
| U.S. TREASURY SECURITIES — 32.80% |
| |||||||||||
| U.S. Treasury Bonds — 10.68% |
| |||||||||||
U.S. Treasury Bonds (WI) |
| |||||||||||
4.25% | 02/15/54 | 1,913,040,000 | 1,882,252,012 | |||||||||
4.50% | 02/15/44 | 3,650,131,000 | 3,671,803,653 | |||||||||
|
|
| ||||||||||
| 5,554,055,665 | ||||||||||||
|
|
| ||||||||||
| U.S. Treasury Notes — 22.12% |
| |||||||||||
U.S. Treasury Notes |
| |||||||||||
4.25% | 03/15/27 | 1,637,695,000 | 1,630,466,116 | |||||||||
4.50% | 03/31/26 | 1,114,000 | 1,111,476 | |||||||||
U.S. Treasury Notes (WI) |
| |||||||||||
4.00% | 02/15/34 | 2,446,524,000 | 2,406,958,080 | |||||||||
See accompanying Notes to Financial Statements.
| 205 / Annual Report March 2024 |
Table of Contents
Total Return Bond Fund
Schedule of Portfolio Investments
March 31, 2024
| Issues | Maturity Date | Principal Amount | Value | |||||||||
| U.S. TREASURY SECURITIES (continued) |
| |||||||||||
| U.S. Treasury Notes (continued) |
| |||||||||||
4.25% | 02/28/29 | $ | 2,536,796,000 | $ | 2,541,156,118 | |||||||
4.25% | 03/31/29 | 4,936,608,000 | 4,916,983,403 | |||||||||
|
|
| ||||||||||
| 11,496,675,193 | ||||||||||||
|
|
| ||||||||||
Total U.S. Treasury Securities (Cost $17,030,776,308) |
| 17,050,730,858 | ||||||||||
|
|
| ||||||||||
Total Bonds — 112.48% (Cost $60,861,906,970) |
| 58,463,717,236 | ||||||||||
|
|
| ||||||||||
| Issues | Shares | Value | ||||||||||
| COMMON STOCK — 0.13% |
| |||||||||||
| Communications — 0.13% |
| |||||||||||
Intelsat Emergence SA3,4,5,9 (Luxembourg) |
| 2,400,250 | 64,506,719 | |||||||||
|
|
| ||||||||||
| Electric — 0.00% |
| |||||||||||
Homer City Holdings LLC4,5,9,10 |
| 1,180,703 | — | |||||||||
|
|
| ||||||||||
| Total Common Stock (Cost $145,530,045) |
| 64,506,719 | ||||||||||
|
|
| ||||||||||
| Issues | Maturity Date | Principal Amount/Shares | Value | |||||||||
| SHORT-TERM INVESTMENTS — 14.67% |
| |||||||||||
| Money Market Funds — 9.35% |
| |||||||||||
| Dreyfus Government Cash Management Fund |
| |||||||||||
5.20%11 | 1,336,386,000 | 1,336,386,000 | ||||||||||
| Fidelity Investments Money Market Funds - Government Portfolio |
| |||||||||||
5.21%11,12 | 14,480,809 | 14,480,809 | ||||||||||
| JPMorgan U.S. Government Money Market Fund |
| |||||||||||
5.16%11 | 944,700,000 | 944,700,000 | ||||||||||
| Morgan Stanley Institutional Liquidity Funds - Government Portfolio |
| |||||||||||
5.22%11 | 2,565,457,000 | 2,565,457,000 | ||||||||||
|
|
| ||||||||||
| 4,861,023,809 | ||||||||||||
|
|
| ||||||||||
| Repurchase Agreements — 0.96% |
| |||||||||||
| JPMorgan Chase & Co. (Dated 03/28/24, total to be received $500,516,250, (collateralized by U.S. Treasury Securities, 2.38% to 4.50%, due from 08/15/24 to 11/15/25, par and fair value of $512,997,500 and $507,807,406, respectively)) |
| |||||||||||
5.31% | 04/04/24 | 500,000,000 | 500,000,000 | |||||||||
|
|
| ||||||||||
| U.S. Agency Discount Notes — 3.44% |
| |||||||||||
| Federal Home Loan Bank |
| |||||||||||
5.34%13 | 05/15/24 | 300,000,000 | 297,935,805 | |||||||||
5.29%13 | 07/19/24 | 291,000,000 | 286,337,007 | |||||||||
4.93%13 | 08/28/24 | 100,000,000 | 97,843,375 | |||||||||
5.06%13 | 10/04/24 | 100,000,000 | 97,345,780 | |||||||||
4.93%13 | 10/30/24 | 200,000,000 | 194,024,000 | |||||||||
5.16%13 | 11/08/24 | 100,000,000 | 96,886,910 | |||||||||
5.30%13 | 05/22/24 | 719,040,000 | 718,825,992 | |||||||||
|
|
| ||||||||||
| 1,789,198,869 | ||||||||||||
|
|
| ||||||||||
| Issues | Maturity Date | Principal Amount/Shares | Value | |||||||
| SHORT-TERM INVESTMENTS (continued) |
| |||||||||
| U.S. Treasury Bills — 0.92% |
| |||||||||
| U.S. Treasury Bills (WI) |
| |||||||||
5.32%13 | 05/30/24 | $ | 280,000,000 | $ | 277,464,712 | |||||
5.29%13 | 07/09/24 | 100,000,000 | 98,530,480 | |||||||
5.32%13 | 05/16/24 | 100,000,000 | 99,304,000 | |||||||
|
|
| ||||||||
| 475,299,192 | ||||||||||
|
|
| ||||||||
Total Short-Term Investments |
| |||||||||
(Cost $7,626,989,765) |
| 7,625,521,870 | ||||||||
|
|
| ||||||||
Total Investments - 127.28% |
| |||||||||
(Cost $68,634,426,780) |
| 66,153,745,825 | ||||||||
|
|
| ||||||||
| Net unrealized appreciation on unfunded commitments - 0.00% |
| 294 | ||||||||
| Liabilities in Excess of Other Assets - (27.28)% |
| (14,178,092,158 | ) | |||||||
|
|
| ||||||||
| Net Assets - 100.00% |
| $ | 51,975,653,961 | |||||||
|
|
| ||||||||
| 1 | Floating rate security. The rate disclosed was in effect at March 31, 2024. |
| 2 | Securities exempt from registration under Rule 144A of the Securities Act of 1933, as amended. The securities may be resold in transactions exempt from registration, normally to qualified institutional buyers. |
| 3 | Foreign denominated security issued by foreign domiciled entity. |
| 4 | Security is valued using significant unobservable inputs and is classified as Level 3 in the fair value hierarchy. |
| 5 | Illiquid security as determined under procedures approved by the Board of Trustees. The aggregate value of illiquid securities is $492,317,484, which is 0.95% of total net assets. |
| 6 | Variable rate security. Interest rate disclosed is as of the most recent information available. Certain variable rate securities are not based on a published reference rate and spread but are determined by the issuer or agent and are based on current market conditions. |
| 7 | Excluded from the investment total above is an unfunded delayed draw term loan commitment in an amount not to exceed $51,598, at an interest rate of 9.58% and a maturity of July 31, 2028. The investment is not accruing an unused commitment fee. |
| 8 | Zero coupon bond. The rate shown is the effective yield as of March 31, 2024. |
| 9 | Non-income producing security. |
| 10 | Affiliated investment. |
| 11 | Represents the current yield as of March 31, 2024. |
| 12 | Securities, or a portion thereof, pledged as collateral for swaps. The total market value of collateral pledged is $121,532. |
| 13 | Represents annualized yield at date of purchase. |
| * | Securities with a call or reset feature will have an effective maturity date sooner than the stated maturity. |
| ** | Securities backed by mortgage or consumer loans where payment is periodically made will have an effective maturity date sooner than the stated maturity date. |
See accompanying Notes to Financial Statements.
| Annual Report March 2024 / 206 |
Table of Contents
Total Return Bond Fund
Schedule of Portfolio Investments
March 31, 2024
Note: For Fund compliance purposes, the Fund’s industry classifications refer to any one or more of the industry sub-classifications used by one or more widely recognized market indexes or ratings group indexes, and/or as defined by Fund management. This definition may not apply for purposes of this report, which may combine industry sub-classifications for more meaningful presentation for investors.
(CLO): Collateralized Loan Obligation
(EMTN): Euro Medium-Term Note
(EUR): Euro
(EURIBOR): Euro InterBank Offer Rate
(GBP): British Pound
(GMTN): Global Medium-Term Note
(IO): Interest Only
(LIBOR): London InterBank Offer Rate
(MTN): Medium-Term Note
(PO): Principal Only
(REIT): Real Estate Investment Trust
(RFUCCT): Refinitiv USD IBOR Consumer Cash Fallback
(SOFR): Secured Overnight Financing Rate
(SONIA): Sterling Overnight Index Average
(STEP): Step Coupon Bond
(TBA): To-Be-Announced
(TSFR): Term Secured overnight financing rate
(USD): U.S. Dollar
(WI): When Issued
Currency to be Purchased | Currency to be Sold | Counterparty | Settlement Date | Unrealized Appreciation (Depreciation) | ||||||||||||||||||
FOREIGN CURRENCY EXCHANGE CONTRACT |
| |||||||||||||||||||||
GBP 15,677,000 | USD 19,798,928 | State Street Global Markets LLC | 04/12/24 | $ | 6,635 | |||||||||||||||||
USD 273,706,881 | EUR 249,379,000 | Citibank N.A. | 04/12/24 | 4,220,790 | ||||||||||||||||||
USD 8,629,102 | EUR 7,973,000 | State Street Global Markets LLC | 04/12/24 | 13,251 | ||||||||||||||||||
USD 1,207,974,609 | EUR 1,097,504,000 | Bank of America N.A. | 04/12/24 | 21,980,352 | ||||||||||||||||||
USD 64,200,426 | EUR 59,061,000 | The Bank of New York Mellon | 04/12/24 | 377,418 | ||||||||||||||||||
USD 3,011,664 | EUR 2,774,000 | Goldman Sachs International | 04/12/24 | 14,000 | ||||||||||||||||||
USD 186,290,766 | GBP 145,945,000 | Citibank N.A. | 04/12/24 | 1,910,916 | ||||||||||||||||||
|
| |||||||||||||||||||||
| 28,523,362 | ||||||||||||||||||||||
|
| |||||||||||||||||||||
EUR 2,819,017 | USD 3,049,810 | Bank of America N.A. | 04/02/24 | (4,681) | ||||||||||||||||||
USD 16,607,145 | EUR 15,392,664 | State Street Global Markets LLC | 04/03/24 | (20,801) | ||||||||||||||||||
EUR 7,572,000 | USD 8,315,343 | Goldman Sachs International | 04/12/24 | (132,823) | ||||||||||||||||||
EUR 144,349,000 | USD 156,976,526 | Citibank N.A. | 04/12/24 | (988,861) | ||||||||||||||||||
EUR 69,076,000 | USD 75,089,736 | Bank of America N.A. | 04/12/24 | (444,234) | ||||||||||||||||||
EUR 29,213,000 | USD 31,726,889 | The Bank of New York Mellon | 04/12/24 | (158,484) | ||||||||||||||||||
EUR 237,997,000 | USD 261,265,652 | State Street Global Markets LLC | 04/12/24 | (4,079,278) | ||||||||||||||||||
GBP 1,758,000 | USD 2,233,799 | Goldman Sachs International | 04/12/24 | (12,827) | ||||||||||||||||||
GBP 17,195,000 | USD 21,737,937 | Citibank N.A. | 04/12/24 | (14,606) | ||||||||||||||||||
GBP 935,000 | USD 1,189,017 | Bank of America N.A. | 04/12/24 | (7,783) | ||||||||||||||||||
|
| |||||||||||||||||||||
| (5,864,378) | ||||||||||||||||||||||
|
| |||||||||||||||||||||
| NET UNREALIZED APPRECIATION |
| $ | 22,658,984 | |||||||||||||||||||
|
| |||||||||||||||||||||
| Description | Number of Contracts | Expiration Date | Notional Amount | Value | Unrealized Appreciation (Depreciation) | |||||||||||||||
FUTURES CONTRACTS: LONG POSITIONS |
| |||||||||||||||||||
| U.S. Treasury Two-Year Note | 65,391 | 06/28/24 | $ | 13,371,437,831 | $ | (25,899,356) | $ | (25,899,356) | ||||||||||||
| U.S. Treasury Five-Year Note | 12,683 | 06/28/24 | 1,357,279,235 | (1,307,998) | (1,307,998) | |||||||||||||||
| U.S. Treasury Ultra Bond | 1,644 | 06/18/24 | 212,076,000 | 5,161,456 | 5,161,456 | |||||||||||||||
| U.S. Treasury Ten-Year Ultra Bond | 1,042 | 06/18/24 | 119,422,974 | 692,958 | 692,958 | |||||||||||||||
|
|
|
|
|
| |||||||||||||||
| 15,060,216,040 | (21,352,940) | (21,352,940) | ||||||||||||||||||
|
|
|
|
|
| |||||||||||||||
FUTURES CONTRACTS: SHORT POSITIONS |
| |||||||||||||||||||
| Euro-Bund Future | 3,467 | 06/06/24 | (499,422,737) | (1,126,359) | (1,126,359) | |||||||||||||||
| Euro-Bobl Future | 1,846 | 06/06/24 | (235,752,660) | (1,049,112) | (1,049,112) | |||||||||||||||
| U.S. Treasury Ten-Year Note | 827 | 06/18/24 | (91,629,020) | 639,784 | 639,784 | |||||||||||||||
| Euro-Buxl 30 Year | 597 | 06/06/24 | (87,558,408) | (1,767,365) | (1,767,365) | |||||||||||||||
| Euro-Schatz Future | 356 | 06/06/24 | (40,639,536) | (4,540) | (4,540) | |||||||||||||||
| Long Gilt Future | 317 | 06/26/24 | (40,020,998) | (984,971) | (984,971) | |||||||||||||||
|
|
|
|
|
| |||||||||||||||
| (995,023,359) | (4,292,563) | (4,292,563) | ||||||||||||||||||
|
|
|
|
|
| |||||||||||||||
TOTAL FUTURES CONTRACTS | $ | 14,065,192,681 | $ | (25,645,503) | $ | (25,645,503) | ||||||||||||||
|
|
|
|
|
| |||||||||||||||
See accompanying Notes to Financial Statements.
| 207 / Annual Report March 2024 |
Table of Contents
Total Return Bond Fund
Schedule of Portfolio Investments
March 31, 2024
| Counterparty | Interest Rate | Trade Date | Maturity Date | Repurchase Amount | Principal Amount | Value | ||||||||||||||
REVERSE REPURCHASE AGREEMENTS | ||||||||||||||||||||
| Barclays Bank PLC | 2.000% | 03/22/24 | 04/01/24 | $ | (503,945,903 | ) | $ | (503,750,000 | ) | $ | (503,750,000 | ) | ||||||||
| Barclays Bank PLC | 2.000% | 03/20/24 | 04/01/24 | (499,680,173 | ) | (499,375,000 | ) | (499,375,000 | ) | |||||||||||
| Barclays Bank PLC | 1.650% | 03/19/24 | 04/01/24 | (498,398,969 | ) | (498,125,000 | ) | (498,125,000 | ) | |||||||||||
|
| |||||||||||||||||||
TOTAL REVERSE REPURCHASE AGREEMENTS |
| $ | (1,501,250,000 | ) | ||||||||||||||||
|
| |||||||||||||||||||
| Received by the Fund | Paid by the Fund | |||||||||||||||||||||||||||||||
| Description | Maturity Date | Rate | Frequency | Rate | Frequency | Notional Amount (000’s) | Value | Premiums (Received) | Unrealized Appreciation | |||||||||||||||||||||||
| SWAPS: INTEREST RATE |
| |||||||||||||||||||||||||||||||
Interest Rate Swap1 | 06/16/53 | | GBP-SONIA-OIS USD-SOFR- |
| Annual | 3.25% | Annual | $ | 33,460 | $ | 2,615,569 | $ | (510,308) | $ | 3,125,877 | |||||||||||||||||
Interest Rate Swap1 | 12/20/53 | COMPOUND | Annual | 3.52% | Annual | 461,741 | 5,384,183 | — | 5,384,183 | |||||||||||||||||||||||
|
|
|
|
|
|
|
| |||||||||||||||||||||||||
TOTAL SWAPS CONTRACTS |
| $ | 495,201 | $ | 7,999,752 | $ | (510,308 | ) | $ | 8,510,060 | ||||||||||||||||||||||
|
|
|
|
|
|
|
| |||||||||||||||||||||||||
1 Centrally cleared. | ||||||||||||||||||||||||||||||||
See accompanying Notes to Financial Statements.
| Annual Report March 2024 / 208 |
Table of Contents
Schedule of Portfolio Investments
March 31, 2024
| Issues | Maturity Date | Principal Amount | Value | |||||||
| BONDS – 108.23% |
| |||||||||
| ASSET-BACKED SECURITIES — 3.52%** |
| |||||||||
| AmeriCredit Automobile Receivables Trust, |
| |||||||||
| Series 2022-2, Class C |
| |||||||||
5.32% | 04/18/28 | $ | 320,000 | $ | 320,381 | |||||
| AMMC CLO XI Ltd., |
| |||||||||
| Series 2012-11A, Class A1R2 |
| |||||||||
| (Cayman Islands) |
| |||||||||
| (CME Term SOFR 3-Month plus 1.27%) |
| |||||||||
6.59% | 04/30/311,2,3 | 177,057 | 177,200 | |||||||
| Flatiron CLO 17 Ltd., |
| |||||||||
| Series 2017-1A, Class AR |
| |||||||||
| (Cayman Islands) |
| |||||||||
| (CME Term SOFR 3-Month plus 1.24%) |
| |||||||||
6.55% | 05/15/301,2,3 | 171,197 | 171,311 | |||||||
| GoldenTree Loan Management U.S. CLO 4 Ltd., |
| |||||||||
| Series 2019-4A, Class ARR |
| |||||||||
| (Cayman Islands) |
| |||||||||
| (CME Term SOFR 3-Month plus 1.15%) |
| |||||||||
6.48% | 04/24/311,2,3 | 250,000 | 250,252 | |||||||
| LCM 29 Ltd., |
| |||||||||
| Series 29A, Class XR |
| |||||||||
| (Cayman Islands) |
| |||||||||
| (CME Term SOFR 3-Month plus 1.06%) |
| |||||||||
6.38% | 04/15/311,2,3 | 68,182 | 68,171 | |||||||
| Madison Park Funding XXIX Ltd., |
| |||||||||
| Series 2018-29A, Class AR |
| |||||||||
| (Cayman Islands) |
| |||||||||
| (CME Term SOFR 3-Month plus 1.18%) |
| |||||||||
0.00% | 10/18/301,2,3 | 250,000 | 250,232 | |||||||
| Navient Private Education Refi Loan Trust, |
| |||||||||
| Series 2021-CA, Class A |
| |||||||||
1.06% | 10/15/693 | 335,168 | 294,829 | |||||||
| Palmer Square Loan Funding Ltd., |
| |||||||||
| Series 2022-3A, Class A1BR |
| |||||||||
| (Cayman Islands) |
| |||||||||
| (CME Term SOFR 3-Month plus 1.40%) |
| |||||||||
6.72% | 04/15/311,2,3 | 250,000 | 250,123 | |||||||
|
|
| ||||||||
| Total Asset-Backed Securities |
| |||||||||
| (Cost $1,809,450) |
| 1,782,499 | ||||||||
|
|
| ||||||||
| CORPORATES — 22.32%* |
| |||||||||
| Banking — 6.67% |
| |||||||||
| Bank of America Corp. |
| |||||||||
3.42% | 12/20/284 | 70,000 | 65,727 | |||||||
| Bank of America Corp. |
| |||||||||
| (MTN) |
| |||||||||
3.82% | 01/20/284 | 985,000 | 948,962 | |||||||
| JPMorgan Chase & Co. |
| |||||||||
1.04% | 02/04/274 | 1,185,000 | 1,096,601 | |||||||
| Lloyds Banking Group PLC |
| |||||||||
| (United Kingdom) |
| |||||||||
1.63% | 05/11/272,4 | 125,000 | 115,176 | |||||||
| PNC Financial Services Group, Inc. (The) |
| |||||||||
5.58% | 06/12/294 | 55,000 | 55,703 | |||||||
| U.S. Bancorp |
| |||||||||
4.65% | 02/01/294 | 200,000 | 196,047 | |||||||
| Issues | Maturity Date | Principal Amount | Value | |||||||
| CORPORATES (continued) |
| |||||||||
| Banking (continued) |
| |||||||||
| Wells Fargo & Co. |
| |||||||||
| (MTN) |
| |||||||||
2.16% | 02/11/264 | $ | 930,000 | $ | 902,368 | |||||
|
|
| ||||||||
| 3,380,584 | ||||||||||
|
|
| ||||||||
| Communications — 0.40% |
| |||||||||
| Northwest Fiber LLC/Northwest Fiber Finance Sub, Inc. |
| |||||||||
6.00% | 02/15/283 | 14,000 | 14,420 | |||||||
| T-Mobile USA, Inc. |
| |||||||||
2.25% | 02/15/26 | 200,000 | 189,298 | |||||||
|
|
| ||||||||
| 203,718 | ||||||||||
|
|
| ||||||||
| Consumer Discretionary — 0.86% |
| |||||||||
| Imperial Brands Finance PLC |
| |||||||||
| (United Kingdom) |
| |||||||||
6.13% | 07/27/272,3 | 135,000 | 137,813 | |||||||
| Spectrum Brands, Inc. |
| |||||||||
3.88% | 03/15/313 | 15,000 | 14,489 | |||||||
| WarnerMedia Holdings, Inc. |
| |||||||||
3.76% | 03/15/27 | 300,000 | 286,307 | |||||||
|
|
| ||||||||
| 438,609 | ||||||||||
|
|
| ||||||||
| Diversified REITs — 1.38% |
| |||||||||
| Digital Euro Finco LLC |
| |||||||||
2.63% | 04/15/24 | 385,000 | 415,547 | |||||||
| VICI Properties LP/VICI Note Co., Inc. |
| |||||||||
5.75% | 02/01/273 | 285,000 | 284,942 | |||||||
|
|
| ||||||||
| 700,489 | ||||||||||
|
|
| ||||||||
| Electric — 1.42% |
| |||||||||
| Alliant Energy Finance LLC |
| |||||||||
5.95% | 03/30/293 | 135,000 | 139,198 | |||||||
| Eversource Energy |
| |||||||||
2.90% | 03/01/27 | 200,000 | 188,220 | |||||||
| FirstEnergy Pennsylvania Electric Co. |
| |||||||||
4.00% | 04/15/253 | 250,000 | 243,940 | |||||||
4.15% | 04/15/253 | 150,000 | 147,474 | |||||||
|
|
| ||||||||
| 718,832 | ||||||||||
|
|
| ||||||||
| Energy — 0.96% |
| |||||||||
| Southern Co. Gas Capital Corp. |
| |||||||||
3.88% | 11/15/25 | 500,000 | 487,500 | |||||||
|
|
| ||||||||
| Finance — 4.41% |
| |||||||||
| AerCap Ireland Capital DAC/AerCap Global Aviation Trust |
| |||||||||
| (Ireland) |
| |||||||||
2.45% | 10/29/262 | 300,000 | 278,807 | |||||||
| Air Lease Corp. |
| |||||||||
3.63% | 04/01/27 | 200,000 | 190,653 | |||||||
| Avolon Holdings Funding Ltd. |
| |||||||||
| (Cayman Islands) |
| |||||||||
2.53% | 11/18/272,3 | 283,000 | 251,846 | |||||||
| Citigroup, Inc. |
| |||||||||
1.46% | 06/09/274 | 815,000 | 748,526 | |||||||
| Morgan Stanley |
| |||||||||
0.99% | 12/10/264 | 605,000 | 560,860 | |||||||
See accompanying Notes to Financial Statements.
| 209 / Annual Report March 2024 |
Table of Contents
Ultra Short Bond Fund
Schedule of Portfolio Investments
March 31, 2024
| Issues | Maturity Date | Principal Amount | Value | |||||||
| CORPORATES (continued) |
| |||||||||
| Finance (continued) |
| |||||||||
| Morgan Stanley |
| |||||||||
| (GMTN) |
| |||||||||
1.51% | 07/20/274 | $ | 225,000 | $ | 206,579 | |||||
|
|
| ||||||||
| 2,237,271 | ||||||||||
|
|
| ||||||||
| Health Care — 1.79% |
| |||||||||
| 1375209 BC Ltd. |
| |||||||||
| (Canada) |
| |||||||||
9.00% | 01/30/282,3 | 35,000 | 34,338 | |||||||
| Amgen, Inc. |
| |||||||||
5.15% | 03/02/28 | 195,000 | 196,391 | |||||||
| Bayer U.S. Finance LLC |
| |||||||||
6.25% | 01/21/293 | 220,000 | 223,829 | |||||||
| Grifols SA |
| |||||||||
| (Spain) |
| |||||||||
4.75% | 10/15/282,3 | 35,000 | 28,986 | |||||||
| HCA, Inc. |
| |||||||||
5.38% | 02/01/25 | 175,000 | 174,556 | |||||||
5.88% | 02/15/26 | 250,000 | 251,063 | |||||||
|
|
| ||||||||
| 909,163 | ||||||||||
|
|
| ||||||||
| Health Care REITs — 0.40% |
| |||||||||
| Healthcare Realty Holdings LP |
| |||||||||
3.63% | 01/15/28 | 220,000 | 203,468 | |||||||
|
|
| ||||||||
| Industrials — 1.05% |
| |||||||||
| Amcor Flexibles North America, Inc. |
| |||||||||
4.00% | 05/17/25 | 300,000 | 294,644 | |||||||
| Ardagh Packaging Finance PLC/Ardagh Holdings USA, Inc. |
| |||||||||
| (Canada) |
| |||||||||
4.13% | 08/15/262,3 | 10,000 | 9,083 | |||||||
| Berry Global, Inc. |
| |||||||||
5.50% | 04/15/28 | 225,000 | 226,645 | |||||||
|
|
| ||||||||
| 530,372 | ||||||||||
|
|
| ||||||||
| Insurance — 1.03% |
| |||||||||
| Athene Global Funding |
| |||||||||
| (SOFR Index plus 0.70%) |
| |||||||||
6.06% | 05/24/241,3 | 150,000 | 150,172 | |||||||
| Nationwide Mutual Insurance Co. |
| |||||||||
7.88% | 12/15/243,4 | 370,000 | 370,034 | |||||||
|
|
| ||||||||
| 520,206 | ||||||||||
|
|
| ||||||||
| Materials — 0.68% |
| |||||||||
| International Flavors & Fragrances, Inc. |
| |||||||||
1.83% | 10/15/273 | 390,000 | 346,153 | |||||||
|
|
| ||||||||
| Services — 0.61% |
| |||||||||
| Adtalem Global Education, Inc. |
| |||||||||
5.50% | 03/01/283 | 10,000 | 9,586 | |||||||
| Global Payments, Inc. |
| |||||||||
2.15% | 01/15/27 | 300,000 | 276,881 | |||||||
| Worldline SA |
| |||||||||
| (France) |
| |||||||||
0.00% | 07/30/252,5 | 200 | 23,905 | |||||||
|
|
| ||||||||
| 310,372 | ||||||||||
|
|
| ||||||||
| Issues | Maturity Date | Principal Amount | Value | |||||||
| CORPORATES (continued) |
| |||||||||
| Specialized REITs — 0.66% |
| |||||||||
| Extra Space Storage LP |
| |||||||||
3.88% | 12/15/27 | $ | 205,000 | $ | 194,846 | |||||
5.70% | 04/01/28 | 135,000 | 137,520 | |||||||
|
|
| ||||||||
| 332,366 | ||||||||||
|
|
| ||||||||
| Total Corporates |
| |||||||||
| (Cost $11,276,950) |
| 11,319,103 | ||||||||
|
|
| ||||||||
| MORTGAGE-BACKED — 44.51%** |
| |||||||||
| Non-Agency Commercial Mortgage-Backed — 3.02% |
| |||||||||
| BX Commercial Mortgage Trust, |
| |||||||||
| Series 2022-CSMO, Class A |
| |||||||||
| (CME Term SOFR 1-Month plus 2.11%) |
| |||||||||
7.44% | 06/15/271,3 | 205,000 | 205,825 | |||||||
| CAMB Commercial Mortgage Trust, |
| |||||||||
| Series 2019-LIFE, Class B |
| |||||||||
| (CME Term SOFR 1-Month plus 1.55%) |
| |||||||||
6.87% | 12/15/371,3 | 150,000 | 150,047 | |||||||
| Fontainebleau Miami Beach Trust, |
| |||||||||
| Series 2019-FBLU, Class A |
| |||||||||
3.14% | 12/10/363 | 150,000 | 146,525 | |||||||
| FS Rialto, |
| |||||||||
| Series 2019-FL1, Class A |
| |||||||||
| (Cayman Islands) |
| |||||||||
| (CME Term SOFR 1-Month plus 1.31%) |
| |||||||||
6.64% | 12/16/361,2,3 | 235,017 | 235,050 | |||||||
| Great Wolf Trust, |
| |||||||||
| Series 2024-WOLF, Class A |
| |||||||||
| (CME Term SOFR 1-Month plus 1.54%) |
| |||||||||
6.84% | 03/15/391,3 | 152,000 | 152,380 | |||||||
| JPMBB Commercial Mortgage Securities Trust, |
| |||||||||
| Series 2014-C26, Class A3 |
| |||||||||
3.23% | 01/15/48 | 239,675 | 236,758 | |||||||
| MF1 Ltd., |
| |||||||||
| Series 2020-FL4, Class A |
| |||||||||
| (CME Term SOFR 1-Month plus 1.81%) |
| |||||||||
7.14% | 11/15/351,3 | 215,898 | 216,458 | |||||||
| Wells Fargo Commercial Mortgage Trust, |
| |||||||||
| Series 2017-SMP, Class A |
| |||||||||
| (CME Term SOFR 1-Month plus 0.92%) |
| |||||||||
6.25% | 12/15/341,3 | 200,000 | 189,628 | |||||||
|
|
| ||||||||
| 1,532,671 | ||||||||||
|
|
| ||||||||
| Non-Agency Mortgage-Backed — 10.53% |
| |||||||||
| Aames Mortgage Trust, |
| |||||||||
| Series 2002-1, Class A3 (STEP-reset date 05/25/24) |
| |||||||||
7.40% | 06/25/32 | 8,033 | 7,810 | |||||||
| Adjustable Rate Mortgage Trust, |
| |||||||||
| Series 2005-1, Class 1A1 |
| |||||||||
5.47% | 05/25/354 | 14,911 | 14,604 | |||||||
| Ajax Mortgage Loan Trust, |
| |||||||||
| Series 2019-F, Class A1 (STEP-reset date 04/25/24) |
| |||||||||
2.86% | 07/25/593 | 122,665 | 115,695 | |||||||
| Alternative Loan Trust, |
| |||||||||
| Series 2004-J6, Class 2A1 |
| |||||||||
6.50% | 11/25/31 | 15,509 | 15,094 | |||||||
See accompanying Notes to Financial Statements.
| Annual Report March 2024 / 210 |
Table of Contents
Ultra Short Bond Fund
Schedule of Portfolio Investments
March 31, 2024
| Issues | Maturity Date | Principal Amount | Value | |||||||
| MORTGAGE-BACKED (continued) |
| |||||||||
| Non-Agency Mortgage-Backed (continued) |
| |||||||||
| Ameriquest Mortgage Securities, Inc., Asset-Backed Pass-Through Certificates, |
| |||||||||
| Series 2005-R10, Class M3 |
| |||||||||
| (CME Term SOFR 1-Month plus 0.79%) |
| |||||||||
6.12% | 01/25/361 | $ | 334,325 | $ | 328,004 | |||||
| Ameriquest Mortgage Securities, Inc., Asset-Backed Pass-Through Certificates, |
| |||||||||
| Series 2005-R3, Class M4 |
| |||||||||
| (CME Term SOFR 1-Month plus 1.04%) |
| |||||||||
6.37% | 05/25/351 | 178,968 | 176,546 | |||||||
| Ameriquest Mortgage Securities, Inc., Asset-Backed Pass-Through Certificates, |
| |||||||||
| Series 2006-R2, Class M1 |
| |||||||||
| (CME Term SOFR 1-Month plus 0.62%) |
| |||||||||
5.95% | 04/25/361 | 95,461 | 95,322 | |||||||
| Banc of America Funding Trust, |
| |||||||||
| Series 2003-2, Class 1A1 |
| |||||||||
6.50% | 06/25/32 | 2,416 | 2,386 | |||||||
| Citigroup Mortgage Loan Trust, |
| |||||||||
| Series 2007-AMC4, Class A2D |
| |||||||||
| (CME Term SOFR 1-Month plus 0.38%) |
| |||||||||
5.71% | 05/25/371 | 130,881 | 128,515 | |||||||
| Citigroup Mortgage Loan Trust, Inc., |
| |||||||||
| Series 2006-WFH4, Class M2 |
| |||||||||
| (CME Term SOFR 1-Month plus 0.55%) |
| |||||||||
5.88% | 11/25/361 | 451,356 | 443,200 | |||||||
| Credit Suisse First Boston Mortgage Securities Corp., |
| |||||||||
| Series 2002-AR31, Class 4A2 |
| |||||||||
6.25% | 11/25/324 | 14,413 | 14,277 | |||||||
| DSLA Mortgage Loan Trust, |
| |||||||||
| Series 2004-AR3, Class 2A2A |
| |||||||||
| (CME Term SOFR 1-Month plus 0.85%) |
| |||||||||
6.17% | 07/19/441 | 60,519 | 55,270 | |||||||
| First Franklin Mortgage Loan Trust, |
| |||||||||
| Series 2005-FF8, Class M2 |
| |||||||||
| (CME Term SOFR 1-Month plus 0.89%) |
| |||||||||
6.22% | 09/25/351 | 312,338 | 310,775 | |||||||
| First Franklin Mortgage Loan Trust, |
| |||||||||
| Series 2006-FFH1, Class M1 |
| |||||||||
| (CME Term SOFR 1-Month plus 0.67%) |
| |||||||||
6.00% | 01/25/361 | 491,593 | 474,613 | |||||||
| GE Mortgage Services LLC, |
| |||||||||
| Series 1998-HE1, Class A7 |
| |||||||||
6.47% | 06/25/28 | 1 | 1 | |||||||
| GSAMP Trust, |
| |||||||||
| Series 2005-HE5, Class M3 |
| |||||||||
| (CME Term SOFR 1-Month plus 0.80%) |
| |||||||||
6.13% | 11/25/351 | 101,996 | 100,693 | |||||||
| HSI Asset Securitization Corp. Trust, |
| |||||||||
| Series 2006-OPT2, Class M2 |
| |||||||||
| (CME Term SOFR 1-Month plus 0.70%) |
| |||||||||
6.03% | 01/25/361 | 277,004 | 271,052 | |||||||
| IndyMac Index Mortgage Loan Trust, |
| |||||||||
| Series 2004-AR6, Class 6A1 |
| |||||||||
5.33% | 10/25/344 | 68,100 | 62,701 | |||||||
| Issues | Maturity Date | Principal Amount | Value | |||||||
| MORTGAGE-BACKED (continued) |
| |||||||||
| Non-Agency Mortgage-Backed (continued) |
| |||||||||
| JPMorgan Mortgage Trust, |
| |||||||||
| Series 2005-A2, Class 9A1 |
| |||||||||
6.13% | 04/25/354 | $ | 40,586 | $ | 39,220 | |||||
| MASTR Adjustable Rate Mortgages Trust, |
| |||||||||
| Series 2004-12, Class 5A1 |
| |||||||||
5.67% | 10/25/344 | 8,048 | 7,720 | |||||||
| MASTR Adjustable Rate Mortgages Trust, |
| |||||||||
| Series 2007-1, Class I2A1 |
| |||||||||
| (CME Term SOFR 1-Month plus 0.43%) |
| |||||||||
5.76% | 01/25/471 | 47,028 | 46,842 | |||||||
| MASTR Seasoned Securitization Trust, |
| |||||||||
| Series 2004-1, Class 4A1 |
| |||||||||
6.22% | 10/25/324 | 15,184 | 14,659 | |||||||
| Merrill Lynch Mortgage Investors Trust, |
| |||||||||
| Series 2003-A1, Class 2A |
| |||||||||
| (TSFR12M plus 2.34%) |
| |||||||||
7.43% | 12/25/321 | 116,073 | 110,189 | |||||||
| MortgageIT Trust, |
| |||||||||
| Series 2005-1, Class 1A1 |
| |||||||||
| (CME Term SOFR 1-Month plus 0.75%) |
| |||||||||
6.08% | 02/25/351 | 314,600 | 313,643 | |||||||
| Ownit Mortgage Loan Trust, |
| |||||||||
| Series 2006-3, Class A2D |
| |||||||||
| (CME Term SOFR 1-Month plus 0.65%) |
| |||||||||
5.98% | 03/25/371 | 388,076 | 369,538 | |||||||
| Park Place Securities, Inc., Asset-Backed Pass-Through Certificates, |
| |||||||||
| Series 2004-WHQ2, Class M4 |
| |||||||||
| (CME Term SOFR 1-Month plus 1.69%) |
| |||||||||
7.02% | 02/25/351 | 272,605 | 265,004 | |||||||
| PRPM LLC, |
| |||||||||
| Series 2021-3, Class A1 (STEP-reset date 04/25/24) |
| |||||||||
1.87% | 04/25/263 | 184,566 | 180,755 | |||||||
| Residential Asset Mortgage Products Trust, |
| |||||||||
| Series 2004-SL1, Class A2 |
| |||||||||
8.50% | 11/25/31 | 34,405 | 11,396 | |||||||
| Residential Asset Securities Corp., |
| |||||||||
| Series 2006-KS3, Class M1 |
| |||||||||
| (CME Term SOFR 1-Month plus 0.44%) |
| |||||||||
5.94% | 04/25/361 | 203,537 | 200,802 | |||||||
| Residential Asset Securities Corp., |
| |||||||||
| Series 2006-KS5, Class A4 |
| |||||||||
| (CME Term SOFR 1-Month plus 0.37%) |
| |||||||||
5.70% | 07/25/361 | 153,570 | 153,229 | |||||||
| Residential Asset Securitization Trust, |
| |||||||||
| Series 2004-IP2, Class 2A1 |
| |||||||||
4.09% | 12/25/344 | 51,801 | 46,326 | |||||||
| Soundview Home Loan Trust, |
| |||||||||
| Series 2005-OPT1, Class M2 |
| |||||||||
| (CME Term SOFR 1-Month plus 0.79%) |
| |||||||||
6.12% | 06/25/351 | 381,114 | 372,109 | |||||||
| Structured Asset Investment Loan Trust, |
| |||||||||
| Series 2005-HE3, Class M1 |
| |||||||||
| (CME Term SOFR 1-Month plus 0.83%) |
| |||||||||
6.16% | 09/25/351 | 82,799 | 81,337 | |||||||
See accompanying Notes to Financial Statements.
| 211 / Annual Report March 2024 |
Table of Contents
Ultra Short Bond Fund
Schedule of Portfolio Investments
March 31, 2024
| Issues | Maturity Date | Principal Amount | Value | |||||||
| MORTGAGE-BACKED (continued) |
| |||||||||
| Non-Agency Mortgage-Backed (continued) |
| |||||||||
| Structured Asset Securities Corp. Mortgage Loan Trust, |
| |||||||||
| Series 2006-EQ1A, Class A1 |
| |||||||||
| (CME Term SOFR 1-Month plus 0.38%) |
| |||||||||
5.71% | 07/25/361,3 | $ | 57,500 | $ | 57,207 | |||||
| Structured Asset Securities Corp. Mortgage Loan Trust, |
| |||||||||
| Series 2006-OPT1, Class A1 |
| |||||||||
| (CME Term SOFR 1-Month plus 0.29%) |
| |||||||||
5.62% | 04/25/361 | 87,178 | 86,516 | |||||||
| Terwin Mortgage Trust, |
| |||||||||
| Series 2006-5, Class 1A2B |
| |||||||||
| (CME Term SOFR 1-Month plus 0.53%) |
| |||||||||
5.86% | 07/25/371,3 | 269,362 | 266,737 | |||||||
| Terwin NIMs Trust, |
| |||||||||
| Series 2004-13AL, Class 2PX (IO) |
| |||||||||
0.34% | 08/25/343,6,7 | 838,132 | 9,388 | |||||||
| WaMu Mortgage Pass-Through Certificates, |
| |||||||||
| Series 2002-AR6, Class A |
| |||||||||
| (Federal Reserve US 12-Month Cumulative Average plus 1.40%) |
| |||||||||
6.49% | 06/25/421 | 8,051 | 7,366 | |||||||
| WaMu Mortgage Pass-Through Certificates, |
| |||||||||
| Series 2003-AR6, Class A1 |
| |||||||||
5.39% | 06/25/334 | 21,989 | 21,153 | |||||||
| WaMu Mortgage Pass-Through Certificates, |
| |||||||||
| Series 2005-4, Class CB13 |
| |||||||||
| (CME Term SOFR 1-Month plus 0.61%) |
| |||||||||
5.50% | 06/25/351 | 74,182 | 62,681 | |||||||
|
|
| ||||||||
| 5,340,375 | ||||||||||
|
|
| ||||||||
| U.S. Agency Commercial Mortgage-Backed — 3.35% |
| |||||||||
| Freddie Mac Multifamily Structured Pass-Through Certificates, |
| |||||||||
| Series KJ34, Class A1 |
| |||||||||
0.68% | 06/25/26 | 133,261 | 127,605 | |||||||
| Freddie Mac Multifamily Structured Pass-Through Certificates, |
| |||||||||
| Series KS07, Class X (IO) |
| |||||||||
0.61% | 09/25/254 | 3,289,385 | 27,932 | |||||||
| Freddie Mac Multifamily Structured Pass-Through Certificates, |
| |||||||||
| Series Q004, Class AFL |
| |||||||||
| (Federal Reserve US 12-Month Cumulative Average plus 0.74%) |
| |||||||||
5.83% | 05/25/441 | 95,397 | 94,841 | |||||||
| Freddie Mac Multifamily Structured Pass-Through Certificates, |
| |||||||||
| Series Q010, Class APT1 |
| |||||||||
6.50% | 04/25/464 | 27,302 | 27,495 | |||||||
| Ginnie Mae, |
| |||||||||
| Series 2008-92, Class E |
| |||||||||
5.56% | 03/16/444 | 70,168 | 69,714 | |||||||
| Ginnie Mae, |
| |||||||||
| Series 2010-159, Class D |
| |||||||||
4.56% | 09/16/444 | 99,697 | 98,273 | |||||||
| Issues | Maturity Date | Principal Amount | Value | |||||||
| MORTGAGE-BACKED (continued) |
| |||||||||
| U.S. Agency Commercial Mortgage-Backed (continued) |
| |||||||||
| Ginnie Mae, |
| |||||||||
| Series 2011-165, Class IO (IO) |
| |||||||||
0.00% | 10/16/514 | $ | 2,064,390 | $ | 21 | |||||
| Ginnie Mae, |
| |||||||||
| Series 2011-92, Class C |
| |||||||||
3.73% | 04/16/524 | 860,610 | 811,362 | |||||||
| Ginnie Mae, |
| |||||||||
| Series 2012-135, Class IO (IO) |
| |||||||||
0.34% | 01/16/534 | 1,564,166 | 14,691 | |||||||
| Ginnie Mae, |
| |||||||||
| Series 2014-157, Class C |
| |||||||||
3.15% | 10/16/544 | 440,581 | 423,909 | |||||||
|
|
| ||||||||
| 1,695,843 | ||||||||||
|
|
| ||||||||
| U.S. Agency Mortgage-Backed — 27.61% |
| |||||||||
| Fannie Mae Pool 254548 |
| |||||||||
5.50% | 12/01/32 | 39,705 | 40,343 | |||||||
| Fannie Mae Pool 555098 |
| |||||||||
| (RFUCCT1Y plus 1.62%) |
| |||||||||
5.86% | 11/01/321 | 4,839 | 4,808 | |||||||
| Fannie Mae Pool 555424 |
| |||||||||
5.50% | 05/01/33 | 27,145 | 27,662 | |||||||
| Fannie Mae Pool 655133 |
| |||||||||
7.00% | 08/01/32 | 4,753 | 4,771 | |||||||
| Fannie Mae Pool 655151 |
| |||||||||
7.00% | 08/01/32 | 3,521 | 3,509 | |||||||
| Fannie Mae Pool 762525 |
| |||||||||
6.50% | 11/01/33 | 7,788 | 7,719 | |||||||
| Fannie Mae Pool 770900 |
| |||||||||
| (RFUCCT1Y plus 1.56%) |
| |||||||||
4.94% | 04/01/341 | 44,916 | 44,930 | |||||||
| Fannie Mae Pool AD0538 |
| |||||||||
6.00% | 05/01/24 | 179 | 178 | |||||||
| Fannie Mae Pool AE0443 |
| |||||||||
6.50% | 10/01/39 | 34,642 | 36,044 | |||||||
| Fannie Mae Pool AL0851 |
| |||||||||
6.00% | 10/01/40 | 29,704 | 31,049 | |||||||
| Fannie Mae REMICS, |
| |||||||||
| Series 2001-42, Class SB |
| |||||||||
| (-16.00 X SOFR30A plus 126.17%, 8.50% Cap) |
| |||||||||
8.50% | 09/25/311 | 494 | 487 | |||||||
| Fannie Mae REMICS, |
| |||||||||
| Series 2001-60, Class OF |
| |||||||||
| (SOFR30A plus 1.06%) |
| |||||||||
6.38% | 10/25/311 | 36,299 | 36,682 | |||||||
| Fannie Mae REMICS, |
| |||||||||
| Series 2002-30, Class FB |
| |||||||||
| (SOFR30A plus 1.11%) |
| |||||||||
6.43% | 08/25/311 | 34,062 | 34,198 | |||||||
| Fannie Mae REMICS, |
| |||||||||
| Series 2003-124, Class TS |
| |||||||||
| (-14.00 X SOFR30A plus 99.20%, 9.80% Cap) |
| |||||||||
9.80% | 01/25/341 | 5,987 | 5,997 | |||||||
See accompanying Notes to Financial Statements.
| Annual Report March 2024 / 212 |
Table of Contents
Ultra Short Bond Fund
Schedule of Portfolio Investments
March 31, 2024
| Issues | Maturity Date | Principal Amount | Value | |||||||
| MORTGAGE-BACKED (continued) |
| |||||||||
| U.S. Agency Mortgage-Backed (continued) |
| |||||||||
| Fannie Mae REMICS, |
| |||||||||
| Series 2004-60, Class FW |
| |||||||||
| (SOFR30A plus 0.56%) |
| |||||||||
5.88% | 04/25/341 | $ | 72,258 | $ | 72,133 | |||||
| Fannie Mae REMICS, |
| |||||||||
| Series 2004-96, Class MT |
| |||||||||
| (-17.50 X SOFR30A plus 123.12%, 7.00% Cap) |
| |||||||||
7.00% | 12/25/341 | 10,049 | 9,195 | |||||||
| Fannie Mae REMICS, |
| |||||||||
| Series 2005-73, Class DF |
| |||||||||
| (SOFR30A plus 0.36%) |
| |||||||||
5.68% | 08/25/351 | 50,272 | 49,737 | |||||||
| Fannie Mae REMICS, |
| |||||||||
| Series 2007-68, Class SC (IO) |
| |||||||||
| (-1.00 X SOFR30A plus 6.59%, 6.70% Cap) |
| |||||||||
1.27% | 07/25/371 | 44,032 | 4,233 | |||||||
| Fannie Mae REMICS, |
| |||||||||
| Series 2010-109, Class PF |
| |||||||||
| (SOFR30A plus 0.51%) |
| |||||||||
5.83% | 10/25/401 | 27,555 | 27,244 | |||||||
| Fannie Mae REMICS, |
| |||||||||
| Series 2010-26, Class S (IO) |
| |||||||||
| (-1.00 X SOFR30A plus 6.12%, 6.23% Cap) |
| |||||||||
0.80% | 11/25/361 | 164,406 | 14,758 | |||||||
| Fannie Mae REMICS, |
| |||||||||
| Series 2010-95, Class FB |
| |||||||||
| (SOFR30A plus 0.51%) |
| |||||||||
5.83% | 09/25/401 | 30,567 | 30,371 | |||||||
| Fannie Mae REMICS, |
| |||||||||
| Series 2011-47, Class GF |
| |||||||||
| (SOFR30A plus 0.68%) |
| |||||||||
6.00% | 06/25/411 | 546,611 | 544,029 | |||||||
| Fannie Mae REMICS, |
| |||||||||
| Series 2018-79, Class FA |
| |||||||||
| (SOFR30A plus 0.36%) |
| |||||||||
5.68% | 11/25/481 | 38,056 | 37,189 | |||||||
| Fannie Mae REMICS, |
| |||||||||
| Series 2019-79, Class FA |
| |||||||||
| (SOFR30A plus 0.61%) |
| |||||||||
5.93% | 01/25/501 | 89,511 | 88,340 | |||||||
| Fannie Mae REMICS, |
| |||||||||
| Series 2020-10, Class FA |
| |||||||||
| (SOFR30A plus 0.61%) |
| |||||||||
5.93% | 03/25/501 | 253,916 | 247,207 | |||||||
| Freddie Mac REMICS, |
| |||||||||
| Series 2368, Class AF |
| |||||||||
| (SOFR30A plus 1.06%) |
| |||||||||
6.38% | 10/15/311 | 27,642 | 27,838 | |||||||
| Freddie Mac REMICS, |
| |||||||||
| Series 2733, Class FB |
| |||||||||
| (SOFR30A plus 0.71%) |
| |||||||||
6.03% | 10/15/331 | 261,631 | 259,840 | |||||||
| Freddie Mac REMICS, |
| |||||||||
| Series 3085, Class FW |
| |||||||||
| (SOFR30A plus 0.81%) |
| |||||||||
6.13% | 08/15/351 | 178,691 | 174,388 | |||||||
| Issues | Maturity Date | Principal Amount | Value | |||||||
| MORTGAGE-BACKED (continued) |
| |||||||||
| U.S. Agency Mortgage-Backed (continued) |
| |||||||||
| Freddie Mac REMICS, |
| |||||||||
| Series 3300, Class FA |
| |||||||||
| (SOFR30A plus 0.41%) |
| |||||||||
5.73% | 08/15/351 | $ | 166,301 | $ | 163,804 | |||||
| Freddie Mac REMICS, |
| |||||||||
| Series 3325, Class NF |
| |||||||||
| (SOFR30A plus 0.41%) |
| |||||||||
5.73% | 08/15/351 | 33,408 | 32,906 | |||||||
| Freddie Mac REMICS, |
| |||||||||
| Series 3895, Class BF |
| |||||||||
| (SOFR30A plus 0.61%) |
| |||||||||
5.93% | 07/15/411 | 110,051 | 108,571 | |||||||
| Freddie Mac REMICS, |
| |||||||||
| Series 3946, Class FD |
| |||||||||
| (SOFR30A plus 0.46%) |
| |||||||||
5.78% | 04/15/411 | 4,002 | 4,001 | |||||||
| Freddie Mac Strips, |
| |||||||||
| Series 263, Class F5 |
| |||||||||
| (SOFR30A plus 0.61%) |
| |||||||||
5.93% | 06/15/421 | 135,110 | 133,134 | |||||||
| Ginnie Mae (TBA) |
| |||||||||
4.50% | 04/20/54 | 825,000 | 792,925 | |||||||
5.00% | 04/20/54 | 700,000 | 688,083 | |||||||
5.50% | 05/20/54 | 425,000 | 424,468 | |||||||
| Ginnie Mae II Pool 80546 |
| |||||||||
| (US Treasury Yield Curve Rate T Note Constant Maturity 1-Year plus 1.50%) |
| |||||||||
3.75% | 10/20/311 | 3,669 | 3,607 | |||||||
| Ginnie Mae II Pool 80610 |
| |||||||||
| (US Treasury Yield Curve Rate T Note Constant Maturity 1-Year plus 1.50%) |
| |||||||||
3.88% | 06/20/321 | 47,471 | 47,171 | |||||||
| Ginnie Mae II Pool 80614 |
| |||||||||
| (US Treasury Yield Curve Rate T Note Constant Maturity 1-Year plus 1.50%) |
| |||||||||
3.63% | 07/20/321 | 4,714 | 4,653 | |||||||
| Ginnie Mae II Pool 80687 |
| |||||||||
| (US Treasury Yield Curve Rate T Note Constant Maturity 1-Year plus 1.50%) |
| |||||||||
3.88% | 04/20/331 | 38,320 | 37,669 | |||||||
| Ginnie Mae II Pool 8684 |
| |||||||||
| (US Treasury Yield Curve Rate T Note Constant Maturity 1-Year plus 1.50%) |
| |||||||||
3.63% | 08/20/251 | 3,036 | 3,013 | |||||||
| Ginnie Mae II Pool MA0331 |
| |||||||||
| (US Treasury Yield Curve Rate T Note Constant Maturity 1-Year plus 1.50%) |
| |||||||||
3.63% | 08/20/421 | 37,205 | 36,807 | |||||||
| Ginnie Mae, |
| |||||||||
| Series 2004-2, Class FW |
| |||||||||
| (CME Term SOFR 1-Month plus 1.51%) |
| |||||||||
6.84% | 01/16/341 | 232,011 | 232,972 | |||||||
| Ginnie Mae, |
| |||||||||
| Series 2009-92, Class FC |
| |||||||||
| (CME Term SOFR 1-Month plus 0.91%) |
| |||||||||
6.24% | 10/16/391 | 56,101 | 56,503 | |||||||
See accompanying Notes to Financial Statements.
| 213 / Annual Report March 2024 |
Table of Contents
Ultra Short Bond Fund
Schedule of Portfolio Investments
March 31, 2024
| Issues | Maturity Date | Principal Amount | Value | |||||||
| MORTGAGE-BACKED (continued) |
| |||||||||
| U.S. Agency Mortgage-Backed (continued) |
| |||||||||
| Ginnie Mae, |
| |||||||||
| Series 2010-19, Class FD |
| |||||||||
| (CME Term SOFR 1-Month plus 0.56%) |
| |||||||||
5.89% | 07/16/391 | $ | 8,072 | $ | 8,088 | |||||
| Ginnie Mae, |
| |||||||||
| Series 2011-70, Class IL (IO) |
| |||||||||
| (-1.00 X CME Term SOFR 1-Month plus 6.99%, 0.60% Cap) |
| |||||||||
0.60% | 06/16/371 | 880,190 | 3,068 | |||||||
| Ginnie Mae, |
| |||||||||
| Series 2023-113, Class FD |
| |||||||||
| (SOFR30A plus 1.35%) |
| |||||||||
6.50% | 08/20/531 | 527,378 | 528,481 | |||||||
| Ginnie Mae, |
| |||||||||
| Series 2023-116, Class FL |
| |||||||||
| (SOFR30A plus 1.15%) |
| |||||||||
6.47% | 08/20/531 | 510,460 | 512,915 | |||||||
| Ginnie Mae, |
| |||||||||
| Series 2024-51, Class F |
| |||||||||
| (SOFR30A plus 1.00%) |
| |||||||||
6.32% | 03/20/541 | 500,000 | 500,868 | |||||||
| Ginnie Mae, |
| |||||||||
| Series 2024-51, Class PF |
| |||||||||
| (SOFR30A plus 1.00%) |
| |||||||||
6.32% | 03/20/541 | 600,000 | 600,956 | |||||||
| Ginnie Mae, |
| |||||||||
| Series 2024-51, Class TF |
| |||||||||
| (SOFR30A plus 1.00%) |
| |||||||||
6.32% | 03/20/541 | 500,000 | 500,102 | |||||||
| UMBS (TBA) |
| |||||||||
3.50% | 04/01/39 | 425,000 | 403,800 | |||||||
4.00% | 04/01/39 | 750,000 | 726,357 | |||||||
4.00% | 04/01/54 | 850,000 | 787,379 | |||||||
4.50% | 04/01/39 | 1,625,000 | 1,600,045 | |||||||
4.50% | 04/01/54 | 825,000 | 785,845 | |||||||
5.00% | 04/01/39 | 1,425,000 | 1,423,034 | |||||||
5.00% | 04/01/54 | 750,000 | 731,865 | |||||||
5.50% | 04/01/54 | 250,000 | 248,784 | |||||||
|
|
| ||||||||
| 13,996,753 | ||||||||||
|
|
| ||||||||
Total Mortgage-Backed (Cost $23,014,208) |
| 22,565,642 | ||||||||
|
|
| ||||||||
| MUNICIPAL BONDS — 0.36%* |
| |||||||||
Massachusetts — 0.36% |
| |||||||||
| Commonwealth of Massachusetts Revenue Bonds, Series B |
| |||||||||
4.11% | 07/15/31 | 187,937 | 183,681 | |||||||
|
|
| ||||||||
| Total Municipal Bonds |
| |||||||||
| (Cost $183,609) |
| |||||||||
| U.S. TREASURY SECURITIES — 37.52% |
| |||||||||
| U.S. Agency Discount Notes — 3.81% |
| |||||||||
| U.S. International Development Finance Corp., |
| |||||||||
| Series 2 |
| |||||||||
1.49% | 08/15/31 | 2,172,973 | 1,930,164 | |||||||
|
|
| ||||||||
| Issues | Maturity Date | Principal Amount | Value | |||||||||
| U.S. TREASURY SECURITIES (continued) |
| |||||||||||
| U.S. Treasury Notes — 33.71% |
| |||||||||||
| U.S. Treasury Notes |
| |||||||||||
4.25% | 03/15/27 | $ | 935,000 | $ | 930,873 | |||||||
4.50% | 03/31/26 | 10,590,000 | 10,566,003 | |||||||||
| U.S. Treasury Notes (WI) |
| |||||||||||
4.25% | 02/28/29 | 2,175,000 | 2,178,738 | |||||||||
4.25% | 03/31/29 | 3,430,000 | 3,416,365 | |||||||||
|
| |||||||||||
| 17,091,979 | ||||||||||||
|
| |||||||||||
| Total U.S. Treasury Securities |
| |||||||||||
| (Cost $19,275,707) |
| 19,022,143 | ||||||||||
|
| |||||||||||
| Total Bonds — 108.23% |
| |||||||||||
| (Cost $55,559,924) |
| 54,873,068 | ||||||||||
|
| |||||||||||
| Issues | Maturity Date | Principal Amount/Shares | Value | |||||||||
| SHORT-TERM INVESTMENTS — 24.52% |
| |||||||||||
| Money Market Funds — 12.73% |
| |||||||||||
| Dreyfus Government Cash Management Fund |
| |||||||||||
5.20%8 |
| 2,000,000 | 2,000,000 | |||||||||
| Fidelity Investments Money Market Funds - Government Portfolio |
| |||||||||||
5.21%8 |
| 20,535 | 20,535 | |||||||||
| JPMorgan U.S. Government Money Market Fund |
| |||||||||||
5.16%8 |
| 2,000,000 | 2,000,000 | |||||||||
| Morgan Stanley Institutional Liquidity Funds - Government Portfolio |
| |||||||||||
5.22%8 |
| 2,433,000 | 2,433,000 | |||||||||
|
| |||||||||||
| 6,453,535 | ||||||||||||
|
| |||||||||||
| U.S. Treasury Bills — 11.79% |
| |||||||||||
| U.S. Treasury Bills |
| |||||||||||
5.49%9 | 04/11/24 | 1,000,000 | 998,546 | |||||||||
| U.S. Treasury Bills (WI) |
| |||||||||||
5.31%9 | 04/16/24 | 1,000,000 | 997,370 | |||||||||
5.28%9 | 05/16/24 | 2,000,000 | 1,986,080 | |||||||||
5.47%9 | 04/04/24 | 2,000,000 | 1,998,250 | |||||||||
|
| |||||||||||
| 5,980,246 | ||||||||||||
|
| |||||||||||
| Total Short-Term Investments |
| |||||||||||
| (Cost $12,436,079) |
| 12,433,781 | ||||||||||
|
| |||||||||||
| Total Investments - 132.75% |
| |||||||||||
| (Cost $67,996,003) |
| 67,306,849 | ||||||||||
|
| |||||||||||
Liabilities in Excess of Other Assets - (32.75)% |
| (16,606,250) | ||||||||||
|
| |||||||||||
| Net Assets - 100.00% |
| $ | 50,700,599 | |||||||||
|
| |||||||||||
| 1 | Floating rate security. The rate disclosed was in effect at March 31, 2024. |
| 2 | Foreign denominated security issued by foreign domiciled entity. |
| 3 | Securities exempt from registration under Rule 144A of the Securities Act of 1933, as amended. The securities may be resold in transactions exempt from registration, normally to qualified institutional buyers. |
| 4 | Variable rate security. Interest rate disclosed is as of the most recent information available. Certain variable rate securities are not based on a published reference rate and spread but are determined by the issuer or agent and are based on current market conditions. |
See accompanying Notes to Financial Statements.
| Annual Report March 2024 / 214 |
Table of Contents
Ultra Short Bond Fund
Schedule of Portfolio Investments
March 31, 2024
| 5 | Zero coupon bond. The rate shown is the effective yield as of March 31, 2024. |
| 6 | Security is valued using significant unobservable inputs and is classified as Level 3 in the fair value hierarchy. |
| 7 | Illiquid security as determined under procedures approved by the Board of Trustees. The aggregate value of illiquid securities is $9,388, which is 0.02% of total net assets. |
| 8 | Represents the current yield as of March 31, 2024. |
| 9 | Represents annualized yield at date of purchase. |
| * | Securities with a call or reset feature will have an effective maturity date sooner than the stated maturity. |
| ** | Securities backed by mortgage or consumer loans where payment is periodically made will have an effective maturity date sooner than the stated maturity date. |
Note: For Fund compliance purposes, the Fund’s industry classifications refer to any one or more of the industry sub-classifications used by one or more widely recognized market indexes or ratings group indexes, and/or as defined by Fund management. This definition may not apply for purposes of this report, which may combine industry sub-classifications for more meaningful presentation for investors.
(CLO): Collateralized Loan Obligation
(EUR): Euro
(GBP): British Pound
(GMTN): Global Medium-Term Note
(IO): Interest Only
(MTN): Medium-Term Note
(REIT): Real Estate Investment Trust
(RFUCCT): Refinitiv USD IBOR Consumer Cash Fallback
(SOFR): Secured Overnight Financing Rate
(STEP): Step Coupon Bond
(TBA): To-Be-Announced
(TSFR): Term Secured overnight financing rate
(WI): When Issued
Currency to be Purchased | Currency to be Sold | Counterparty | Settlement Date | Unrealized Appreciation (Depreciation) | ||||||||||
FOREIGN CURRENCY EXCHANGE CONTRACT | ||||||||||||||
GBP 217,000 | USD 273,159 | Citibank N.A. | 04/12/24 | $ | 988 | |||||||||
USD 524,102 | EUR 476,000 | Citibank N.A. | 04/12/24 | 9,723 | ||||||||||
USD 24,208 | EUR 22,000 | Bank of America N.A. | 04/12/24 | 435 | ||||||||||
USD 276,989 | GBP 217,000 | Citibank N.A. | 04/12/24 | 2,841 | ||||||||||
|
| |||||||||||||
| 13,987 | ||||||||||||||
|
| |||||||||||||
EUR 98,000 | USD 106,645 | Bank of America N.A. | 04/12/24 | (743) | ||||||||||
|
| |||||||||||||
NET UNREALIZED APPRECIATION | $ | 13,244 | ||||||||||||
|
| |||||||||||||
| Description | Number of Contracts | Expiration Date | Notional Amount | Value | Unrealized Appreciation | |||||||||||||||
FUTURES CONTRACTS: LONG POSITIONS |
| |||||||||||||||||||
U.S. Treasury Two-Year Note | 125 | 06/28/24 | $ | 25,560,547 | $ | (22,965) | $ | (22,965) | ||||||||||||
Euro-Schatz Future | 1 | 06/06/24 | 114,156 | 26 | 26 | |||||||||||||||
|
|
|
|
|
| |||||||||||||||
| 25,674,703 | (22,939) | (22,939) | ||||||||||||||||||
|
|
|
|
|
| |||||||||||||||
FUTURES CONTRACTS: SHORT POSITIONS |
| |||||||||||||||||||
U.S. Treasury Five-Year Note | 128 | 06/28/24 | (13,698,000) | (36,782) | (36,782) | |||||||||||||||
U.S. Treasury Ten-Year Ultra Bond | 20 | 06/18/24 | (2,292,188) | (14,484) | (14,484) | |||||||||||||||
U.S. Treasury Ultra Bond | 2 | 06/18/24 | (258,000) | (2,549) | (2,549) | |||||||||||||||
|
|
|
|
|
| |||||||||||||||
| (16,248,188) | (53,815) | (53,815) | ||||||||||||||||||
|
|
|
|
|
| |||||||||||||||
TOTAL FUTURES CONTRACTS | $ | 9,426,515 | $ | (76,754) | $ | (76,754) | ||||||||||||||
|
|
|
|
|
| |||||||||||||||
See accompanying Notes to Financial Statements.
| 215 / Annual Report March 2024 |
Table of Contents
Schedule of Portfolio Investments
March 31, 2024
| Issues | Maturity Date | Principal Amount | Value | |||||||
| BONDS – 104.18% |
| |||||||||
| ASSET-BACKED SECURITIES — 14.00%** |
| |||||||||
321 Henderson Receivables VI LLC, |
| |||||||||
Series 2010-1A, Class B |
| |||||||||
9.31% | 07/15/611 | $ | 133,636 | $ | 138,056 | |||||
Allegro CLO XII Ltd., |
| |||||||||
Series 2020-1A, Class B |
| |||||||||
(Cayman Islands) |
| |||||||||
(CME Term SOFR 3-Month plus 1.96%) |
| |||||||||
7.28% | 01/21/321,2,3 | 5,270,000 | 5,272,914 | |||||||
AMSR Trust, |
| |||||||||
Series 2020-SFR1, Class G |
| |||||||||
4.31% | 04/17/371 | 10,503,000 | 10,153,491 | |||||||
AMSR Trust, |
| |||||||||
Series 2020-SFR3, Class H |
| |||||||||
6.50% | 09/17/371 | 6,000,000 | 5,851,822 | |||||||
AMSR Trust, |
| |||||||||
Series 2022-SFR3, Class E1 |
| |||||||||
4.00% | 10/17/391 | 10,000,000 | 9,099,312 | |||||||
Barings CLO Ltd., |
| |||||||||
Series 2020-4A, Class B |
| |||||||||
(Cayman Islands) |
| |||||||||
(CME Term SOFR 3-Month plus 1.81%) |
| |||||||||
7.13% | 01/20/321,2,3 | 8,300,000 | 8,300,083 | |||||||
Bayview Commercial Asset Trust, |
| |||||||||
Series 2005-1A, Class A1 |
| |||||||||
(CME Term SOFR 1-Month plus 0.56%) |
| |||||||||
5.89% | 04/25/351,2 | 378,831 | 361,922 | |||||||
Blackrock Rainier CLO VI Ltd., |
| |||||||||
Series 2021-6A, Class A |
| |||||||||
(Cayman Islands) |
| |||||||||
(CME Term SOFR 3-Month plus 1.96%) |
| |||||||||
7.28% | 04/20/331,2,3 | 10,000,000 | 9,996,920 | |||||||
BlueMountain Fuji U.S. CLO I Ltd., |
| |||||||||
Series 2017-1A, Class BR |
| |||||||||
(Cayman Islands) |
| |||||||||
(CME Term SOFR 3-Month plus 1.76%) |
| |||||||||
7.08% | 07/20/291,2,3 | 5,500,000 | 5,497,305 | |||||||
Carvana Auto Receivables Trust, |
| |||||||||
Series 2021-N3, Class R |
| |||||||||
0.00% | 06/12/281 | 19,250 | 2,032,664 | |||||||
Carvana Auto Receivables Trust, |
| |||||||||
Series 2021-N4, Class R |
| |||||||||
0.00% | 09/12/281 | 26,800 | 1,585,475 | |||||||
Carvana Auto Receivables Trust, |
| |||||||||
Series 2021-P4, Class R |
| |||||||||
0.00% | 09/11/281 | 14,200 | 3,494,514 | |||||||
Carvana Auto Receivables Trust, |
| |||||||||
Series 2022-N1, Class R |
| |||||||||
0.00% | 12/11/281 | 71,000 | 5,151,171 | |||||||
Carvana Auto Receivables Trust, |
| |||||||||
Series 2022-P2, Class R |
| |||||||||
1.00% | 05/10/291 | 54,850 | 7,670,758 | |||||||
Carvana Auto Receivables Trust, |
| |||||||||
Series 2023-P3, Class R |
| |||||||||
0.00% | 08/12/301 | 16,200 | 3,463,857 | |||||||
| Issues | Maturity Date | Principal Amount | Value | |||||||
| ASSET-BACKED SECURITIES (continued) |
| |||||||||
Cedar Funding XII CLO Ltd., |
| |||||||||
Series 2020-12A, Class A1R |
| |||||||||
(Cayman Islands) |
| |||||||||
(CME Term SOFR 3-Month plus 1.39%) |
| |||||||||
6.72% | 10/25/341,2,3 | $ | 1,000,000 | $ | 1,000,550 | |||||
CIFC Funding 2014 Ltd., |
| |||||||||
Series 2014-1A, Class BR2 |
| |||||||||
(Cayman Islands) |
| |||||||||
(CME Term SOFR 3-Month plus 1.66%) |
| |||||||||
6.96% | 01/18/311,2,3 | 8,525,000 | 8,516,407 | |||||||
CIT Education Loan Trust, |
| |||||||||
Series 2007-1, Class B |
| |||||||||
(SOFR90A plus 0.56%) |
| |||||||||
5.91% | 06/25/421,2 | 1,092,989 | 960,192 | |||||||
Clover CLO LLC, |
| |||||||||
Series 2018-1A, Class BR |
| |||||||||
(Cayman Islands) |
| |||||||||
(CME Term SOFR 3-Month plus 1.96%) |
| |||||||||
7.28% | 04/20/321,2,3 | 15,800,000 | 15,802,528 | |||||||
CoreVest American Finance Trust, |
| |||||||||
Series 2019-3, Class XA (IO) |
| |||||||||
2.02% | 10/15/521,4 | 3,633,876 | 50,562 | |||||||
CoreVest American Finance Trust, |
| |||||||||
Series 2020-1, Class A2 |
| |||||||||
2.30% | 03/15/501 | 5,197,000 | 4,745,349 | |||||||
CoreVest American Finance Trust, |
| |||||||||
Series 2020-4, Class XA (IO) |
| |||||||||
3.81% | 12/15/521,4 | 16,488,974 | 846,785 | |||||||
CoreVest American Finance Trust, |
| |||||||||
Series 2020-4, Class XB (IO) |
| |||||||||
2.76% | 12/15/521,4 | 12,500,000 | 833,989 | |||||||
CoreVest American Finance Trust, |
| |||||||||
Series 2021-3, Class XA (IO) |
| |||||||||
2.38% | 10/15/541,4 | 66,179,472 | 3,208,288 | |||||||
DataBank Issuer, |
| |||||||||
Series 2021-1A, Class A2 |
| |||||||||
2.06% | 02/27/511 | 6,047,860 | 5,524,067 | |||||||
Exeter Automobile Receivables Trust, |
| |||||||||
Series 2023-3A, Class D |
| |||||||||
6.68% | 04/16/29 | 6,120,000 | 6,187,472 | |||||||
Flexential Issuer, |
| |||||||||
Series 2021-1A, Class C |
| |||||||||
6.93% | 11/27/511 | 9,755,000 | 8,741,916 | |||||||
FRTKL, |
| |||||||||
Series 2021-SFR1, Class G |
| |||||||||
4.11% | 09/17/381 | 9,435,000 | 8,393,599 | |||||||
GBX Leasing, |
| |||||||||
Series 2022-1, Class A |
| |||||||||
2.87% | 02/20/521 | 9,256,357 | 8,279,128 | |||||||
Global SC Finance II SRL, |
| |||||||||
Series 2014-1A, Class A2 |
| |||||||||
(Barbados) |
| |||||||||
3.09% | 07/17/291,3 | 84,328 | 83,437 | |||||||
Goal Capital Funding Trust, |
| |||||||||
Series 2006-1, Class B |
| |||||||||
(LIBOR USD 3-Month plus 0.45%) |
| |||||||||
6.04% | 08/25/422 | 200,801 | 189,135 | |||||||
See accompanying Notes to Financial Statements.
| Annual Report March 2024 / 216 |
Table of Contents
Unconstrained Bond Fund
Schedule of Portfolio Investments
March 31, 2024
| Issues | Maturity Date | Principal Amount | Value | |||||||
| ASSET-BACKED SECURITIES (continued) |
| |||||||||
GoldenTree Loan Management U.S. CLO 1 Ltd., |
| |||||||||
Series 2021-9A, Class B |
| |||||||||
(Cayman Islands) |
| |||||||||
(CME Term SOFR 3-Month plus 1.76%) |
| |||||||||
7.08% | 01/20/331,2,3 | $ | 3,905,000 | $ | 3,899,260 | |||||
Golub Capital Partners CLO 54M L.P, |
| |||||||||
Series 2021-54A, Class A |
| |||||||||
(Cayman Islands) |
| |||||||||
(CME Term SOFR 3-Month plus 1.79%) |
| |||||||||
7.06% | 08/05/331,2,3 | 9,600,000 | 9,595,181 | |||||||
LAD Auto Receivables Trust, |
| |||||||||
Series 2023-3A,Class D |
| |||||||||
6.92% | 12/16/301 | 4,000,000 | 4,070,104 | |||||||
Madison Park Funding XXVII Ltd., |
| |||||||||
Series 2018-27A, Class A2 |
| |||||||||
(Cayman Islands) |
| |||||||||
(CME Term SOFR 3-Month plus 1.61%) |
| |||||||||
6.93% | 04/20/301,2,3 | 2,530,000 | 2,524,702 | |||||||
Magnetite XXI Ltd., |
| |||||||||
Series 2019-21A, Class BR |
| |||||||||
(Cayman Islands) |
| |||||||||
(CME Term SOFR 3-Month plus 1.61%) |
| |||||||||
6.93% | 04/20/341,2,3 | 8,000,000 | 7,997,136 | |||||||
MetroNet, |
| |||||||||
Series 2023-3, Class A |
| |||||||||
7.95% | 04/20/531,5,6 | 2,650,000 | 2,665,217 | |||||||
Nelnet Student Loan Trust, |
| |||||||||
Series 2006-2, Class B |
| |||||||||
(SOFR90A plus 0.46%) |
| |||||||||
5.82% | 01/25/382 | 2,083,625 | 1,750,906 | |||||||
Neuberger Berman Loan Advisers CLO 24 Ltd., |
| |||||||||
Series 2017-24A, Class BR |
| |||||||||
(Cayman Islands) |
| |||||||||
(CME Term SOFR 3-Month plus 1.76%) |
| |||||||||
7.07% | 04/19/301,2,3 | 750,000 | 749,700 | |||||||
Octagon Investment Partners 46 Ltd., |
| |||||||||
Series 2020-2A,Class AR |
| |||||||||
(Cayman Islands) |
| |||||||||
(CME Term SOFR 3-Month plus 1.42%) |
| |||||||||
6.74% | 07/15/361,2,3 | 6,400,000 | 6,401,600 | |||||||
OHA Credit Funding 7 Ltd., |
| |||||||||
Series 2020-7A, Class AR |
| |||||||||
(Cayman Islands) |
| |||||||||
(CME Term SOFR 3-Month plus 1.30%) |
| |||||||||
6.61% | 02/24/371,2,3 | 5,000,000 | 5,005,095 | |||||||
OHA Credit Funding 8 Ltd., |
| |||||||||
Series 2021-8A, Class B1 |
| |||||||||
(Cayman Islands) |
| |||||||||
(CME Term SOFR 3-Month plus 1.76%) |
| |||||||||
7.06% | 01/18/341,2,3 | 6,650,000 | 6,647,739 | |||||||
Park Avenue Institutional Advisers CLO Ltd., |
| |||||||||
Series 2021-1A, Class A2 |
| |||||||||
(Cayman Islands) |
| |||||||||
(CME Term SOFR 3-Month plus 2.01%) |
| |||||||||
7.33% | 01/20/341,2,3 | 4,850,000 | 4,850,504 | |||||||
| Issues | Maturity Date | Principal Amount | Value | |||||||
| ASSET-BACKED SECURITIES (continued) |
| |||||||||
Progress Residential Trust, |
| |||||||||
Series 2020-SFR1, Class H |
| |||||||||
5.27% | 04/17/371 | $ | 7,100,000 | $ | 6,929,565 | |||||
Progress Residential Trust, |
| |||||||||
Series 2021-SFR2, Class G |
| |||||||||
4.25% | 04/19/381 | 7,956,000 | 7,255,265 | |||||||
Progress Residential, |
| |||||||||
Series 2021-SFR1, Class F |
| |||||||||
2.76% | 04/17/381 | 4,237,000 | 3,847,431 | |||||||
Progress Residential, |
| |||||||||
Series 2021-SFR3, Class F |
| |||||||||
3.44% | 05/17/261 | 3,700,000 | 3,391,191 | |||||||
Progress Residential, |
| |||||||||
Series 2021-SFR3, Class G |
| |||||||||
4.25% | 05/17/261 | 15,752,000 | 14,315,205 | |||||||
Rad CLO 22 Ltd., |
| |||||||||
Series 2023-22A, Class D |
| |||||||||
(Cayman Islands) |
| |||||||||
(CME Term SOFR 3-Month plus 5.00%) |
| |||||||||
10.37% | 01/20/371,2,3 | 3,940,000 | 4,018,918 | |||||||
Rad CLO 7 Ltd., |
| |||||||||
Series 2020-7A, Class B1R |
| |||||||||
(Cayman Islands) |
| |||||||||
(CME Term SOFR 3-Month plus 1.90%) |
| |||||||||
7.23% | 04/17/361,2,3 | 7,280,000 | 7,319,334 | |||||||
Regata XII Funding Ltd., |
| |||||||||
Series 2019-1A, Class BR |
| |||||||||
(Cayman Islands) |
| |||||||||
(CME Term SOFR 3-Month plus 1.86%) |
| |||||||||
7.18% | 10/15/321,2,3 | 3,890,000 | 3,892,517 | |||||||
RRE 15 Loan Management DAC, |
| |||||||||
Series 15X, Class A1 |
| |||||||||
(Ireland) |
| |||||||||
(3-Month Euribor plus 1.75%) |
| |||||||||
5.69% | 10/15/352,3 | 5,000,000 | 5,418,306 | |||||||
Sabey Data Center Issuer LLC, |
| |||||||||
Series 2020-1, Class A2 |
| |||||||||
3.81% | 04/20/451 | 7,905,000 | 7,715,202 | |||||||
Skyline Aircraft Finance LLC, |
| |||||||||
Series 2021-1, Class A |
| |||||||||
3.23% | 05/10/374,5,6 | 8,493,754 | 7,586,315 | |||||||
SLC Student Loan Trust, |
| |||||||||
Series 2004-1, Class B |
| |||||||||
(SOFR90A plus 0.55%) |
| |||||||||
5.91% | 08/15/312 | 260,147 | 221,762 | |||||||
SLM Student Loan EDC Repackaging Trust, |
| |||||||||
Series 2013-M1, Class M1R |
| |||||||||
0.00% | 10/28/291 | 6,250 | 2,452,376 | |||||||
SLM Student Loan Trust, |
| |||||||||
Series 2003-12, Class B |
| |||||||||
(SOFR90A plus 0.85%) |
| |||||||||
6.21% | 12/15/682 | 2,459,731 | 2,361,365 | |||||||
SLM Student Loan Trust, |
| |||||||||
Series 2003-4, Class A5D |
| |||||||||
(SOFR90A plus 1.01%) |
| |||||||||
6.37% | 03/15/331,2 | 1,197,090 | 1,169,418 | |||||||
See accompanying Notes to Financial Statements.
| 217 / Annual Report March 2024 |
Table of Contents
Unconstrained Bond Fund
Schedule of Portfolio Investments
March 31, 2024
| Issues | Maturity Date | Principal Amount | Value | |||||||
| ASSET-BACKED SECURITIES (continued) |
| |||||||||
| SLM Student Loan Trust, |
| |||||||||
| Series 2003-7, Class B |
| |||||||||
| (SOFR90A plus 0.83%) |
| |||||||||
6.19% | 09/15/392 | $ | 1,727,839 | $ | 1,578,351 | |||||
| SLM Student Loan Trust, |
| |||||||||
| Series 2004-10, Class B |
| |||||||||
| (SOFR90A plus 0.63%) |
| |||||||||
5.99% | 01/25/402 | 6,165,667 | 5,756,042 | |||||||
| SLM Student Loan Trust, |
| |||||||||
| Series 2004-2, Class B |
| |||||||||
| (SOFR90A plus 0.73%) |
| |||||||||
6.09% | 07/25/392 | 307,781 | 289,052 | |||||||
| SLM Student Loan Trust, |
| |||||||||
| Series 2005-3, Class B |
| |||||||||
| (SOFR90A plus 0.41%) |
| |||||||||
5.77% | 04/25/402 | 2,026,456 | 1,913,045 | |||||||
| SLM Student Loan Trust, |
| |||||||||
| Series 2006-8, Class B |
| |||||||||
| (SOFR90A plus 0.49%) |
| |||||||||
5.85% | 01/25/412 | 2,100,741 | 1,959,867 | |||||||
| SLM Student Loan Trust, |
| |||||||||
| Series 2007-7, Class B |
| |||||||||
| (SOFR90A plus 1.01%) |
| |||||||||
6.37% | 10/27/702 | 2,195,000 | 2,037,315 | |||||||
| SLM Student Loan Trust, |
| |||||||||
| Series 2007-8, Class B |
| |||||||||
| (SOFR90A plus 1.26%) |
| |||||||||
6.62% | 04/27/832 | 3,389,127 | 3,258,319 | |||||||
| SLM Student Loan Trust, |
| |||||||||
| Series 2008-2, Class B |
| |||||||||
| (SOFR90A plus 1.46%) |
| |||||||||
6.82% | 01/25/832 | 1,000,000 | 960,768 | |||||||
| SLM Student Loan Trust, |
| |||||||||
| Series 2008-3, Class B |
| |||||||||
| (SOFR90A plus 1.46%) |
| |||||||||
6.82% | 04/26/832 | 710,000 | 677,386 | |||||||
| SLM Student Loan Trust, |
| |||||||||
| Series 2008-4, Class A4 |
| |||||||||
| (SOFR90A plus 1.91%) |
| |||||||||
7.27% | 07/25/222 | 564,017 | 570,053 | |||||||
| SLM Student Loan Trust, |
| |||||||||
| Series 2008-4, Class B |
| |||||||||
| (SOFR90A plus 2.11%) |
| |||||||||
7.47% | 04/25/732 | 710,000 | 715,748 | |||||||
| SLM Student Loan Trust, |
| |||||||||
| Series 2008-5, Class B |
| |||||||||
| (SOFR90A plus 2.11%) |
| |||||||||
7.47% | 07/25/732 | 7,315,000 | 7,280,485 | |||||||
| SLM Student Loan Trust, |
| |||||||||
| Series 2008-6, Class A4 |
| |||||||||
| (SOFR90A plus 1.36%) |
| |||||||||
6.72% | 07/25/232 | 6,790,256 | 6,742,737 | |||||||
| SLM Student Loan Trust, |
| |||||||||
| Series 2008-6, Class B |
| |||||||||
| (SOFR90A plus 2.11%) |
| |||||||||
7.47% | 07/26/832 | 710,000 | 675,310 | |||||||
| Issues | Maturity Date | Principal Amount | Value | |||||||
| ASSET-BACKED SECURITIES (continued) |
| |||||||||
| SLM Student Loan Trust, |
| |||||||||
| Series 2008-7, Class B |
| |||||||||
| (SOFR90A plus 2.11%) |
| |||||||||
7.47% | 07/26/832 | $ | 820,000 | $ | 769,586 | |||||
| SLM Student Loan Trust, |
| |||||||||
| Series 2012-1, Class A3 |
| |||||||||
| (SOFR30A plus 1.06%) |
| |||||||||
6.38% | 09/25/282 | 497,443 | 481,575 | |||||||
| SLM Student Loan Trust, |
| |||||||||
| Series 2012-2, Class A |
| |||||||||
| (SOFR30A plus 0.81%) |
| |||||||||
6.13% | 01/25/292 | 756,642 | 738,234 | |||||||
| SLM Student Loan Trust, |
| |||||||||
| Series 2012-7, Class B |
| |||||||||
| (SOFR30A plus 1.91%) |
| |||||||||
7.23% | 09/25/432 | 2,200,000 | 2,025,550 | |||||||
| SLM Student Loan Trust, |
| |||||||||
| Series 2014-1, Class A3 |
| |||||||||
| (SOFR30A plus 0.71%) |
| |||||||||
6.03% | 02/26/292 | 659,533 | 635,274 | |||||||
| Structured Receivables Finance LLC, |
| |||||||||
| Series 2010-A, Class B |
| |||||||||
7.61% | 01/16/461 | 1,275,468 | 1,275,468 | |||||||
| Structured Receivables Finance LLC, |
| |||||||||
| Series 2010-B, Class B |
| |||||||||
7.97% | 08/15/361 | 961,955 | 985,872 | |||||||
| Student Loan Consolidation Center Student Loan Trust I, |
| |||||||||
| Series 2002-2, Class B2 |
| |||||||||
| (28 Day Auction Rate plus 0.00%) |
| |||||||||
1.61% | 07/01/421,2 | 150,000 | 138,622 | |||||||
| TCI-Flatiron CLO Ltd., |
| |||||||||
| Series 2017-1A, Class B |
| |||||||||
| (Cayman Islands) |
| |||||||||
| (CME Term SOFR 3-Month plus 1.82%) |
| |||||||||
7.14% | 11/18/301,2,3 | 5,090,000 | 5,090,865 | |||||||
| Textainer Marine Containers VII Ltd., |
| |||||||||
| Series 2020-3A, Class A |
| |||||||||
| (Bermuda) |
| |||||||||
2.11% | 09/20/451,3 | 5,929,050 | 5,394,734 | |||||||
| TIF Funding II LLC, |
| |||||||||
| Series 2020-1A, Class A |
| |||||||||
2.09% | 08/20/451 | 2,607,550 | 2,365,281 | |||||||
| TIF Funding II, LLC, |
| |||||||||
| Series 2021-1A, Class B |
| |||||||||
2.54% | 02/20/461 | 2,957,563 | 2,515,167 | |||||||
| Triton Container Finance VIII, LLC, |
| |||||||||
| Series 2021-1A, Class B |
| |||||||||
2.58% | 03/20/461 | 2,283,425 | 1,953,079 | |||||||
| Westlake Automobile Receivables Trust, |
| |||||||||
| Series 2023-3A, Class D |
| |||||||||
6.47% | 03/15/291 | 9,640,000 | 9,754,915 | |||||||
| Westlake Automobile Receivables Trust, |
| |||||||||
| Series 2024-1A, Class D |
| |||||||||
6.02% | 10/15/291 | 6,390,000 | 6,416,764 | |||||||
|
|
| ||||||||
| Total Asset-Backed Securities |
| |||||||||
| (Cost $398,698,183) |
| 360,440,446 | ||||||||
|
|
| ||||||||
See accompanying Notes to Financial Statements.
| Annual Report March 2024 / 218 |
Table of Contents
Unconstrained Bond Fund
Schedule of Portfolio Investments
March 31, 2024
| Issues | Maturity Date | Principal Amount | Value | |||||||
| BANK LOANS — 3.20%* |
| |||||||||
| Automotive — 0.01% |
| |||||||||
| First Brands Group LLC, |
| |||||||||
| Term Loan B, 1st Lien |
| |||||||||
| (SOFR plus 5.26%) |
| |||||||||
10.57% | 03/30/272 | $ | 342,387 | $ | 343,329 | |||||
|
|
| ||||||||
| Communications — 0.18% |
| |||||||||
| CCI Buyer, Inc., |
| |||||||||
| Term Loan B, 1st Lien |
| |||||||||
| (SOFR plus 4.00%) |
| |||||||||
9.30% | 12/17/272 | 1,465,995 | 1,459,318 | |||||||
| CSC Holdings LLC, |
| |||||||||
| Term Loan B5, 1st Lien |
| |||||||||
| (SOFR plus 2.50%) |
| |||||||||
7.94% | 04/15/272 | 901,495 | 817,462 | |||||||
| Frontier Communications Holdings LLC, |
| |||||||||
| Term Loan B, 1st Lien |
| |||||||||
| (SOFR plus 3.86%) |
| |||||||||
8.62% | 10/08/272 | 510,864 | 510,386 | |||||||
| New Insight Holdings, Inc., |
| |||||||||
| Term Loan B, 1st Lien |
| |||||||||
| (SOFR plus 5.76%) |
| |||||||||
11.07% | 12/20/242 | 535,755 | 323,296 | |||||||
| Zayo Group Holdings, Inc., |
| |||||||||
| Term Loan B, 1st Lien |
| |||||||||
| (SOFR plus 3.11%) |
| |||||||||
8.44% | 03/09/272 | 563,487 | 496,029 | |||||||
| (SOFR plus 4.33%) |
| |||||||||
9.66% | 03/09/272 | 1,037,091 | 932,874 | |||||||
|
|
| ||||||||
| 4,539,365 | ||||||||||
|
|
| ||||||||
| Consumer Discretionary — 0.18% |
| |||||||||
| ADMI Corp., |
| |||||||||
| Term Loan B2, 1st Lien |
| |||||||||
| (SOFR plus 3.49%) |
| |||||||||
8.82% | 12/23/272 | 560,045 | 541,143 | |||||||
| City Brewing Co. LLC, |
| |||||||||
| Term Loan B, 1st Lien |
| |||||||||
| (SOFR plus 3.76%) |
| |||||||||
8.32% | 04/05/282 | 1,601,517 | 1,257,623 | |||||||
| Hanesbrands, Inc., |
| |||||||||
| Term Loan A, 1st Lien |
| |||||||||
| (SOFR plus 2.60%) |
| |||||||||
7.93% | 11/19/262 | 739,077 | 728,915 | |||||||
| Naked Juice, LLC, |
| |||||||||
| Term Loan, 2nd Lien |
| |||||||||
| (SOFR plus 6.10%) |
| |||||||||
11.00% | 01/24/302 | 1,110,195 | 910,010 | |||||||
| Triton Water Holdings, Inc., |
| |||||||||
| Term Loan B, 1st Lien |
| |||||||||
| (SOFR plus 3.51%) |
| |||||||||
8.23% | 03/31/282 | 1,201,781 | 1,190,671 | |||||||
|
|
| ||||||||
| 4,628,362 | ||||||||||
|
|
| ||||||||
| Issues | Maturity Date | Principal Amount | Value | |||||||
| BANK LOANS (continued) |
| |||||||||
| Energy — 0.03% |
| |||||||||
| NGL Energy Operating LLC, |
| |||||||||
| Term Loan B, 1st Lien |
| |||||||||
| (SOFR plus 4.50%) |
| |||||||||
9.83% | 02/03/312 | $ | 720,064 | $ | 722,764 | |||||
|
|
| ||||||||
| Entertainment — 0.02% |
| |||||||||
| William Morris Endeavor Entertainment LLC, |
| |||||||||
| Term Loan B1, 1st Lien |
| |||||||||
| (SOFR plus 2.86%) |
| |||||||||
8.19% | 05/16/252 | 586,069 | 586,382 | |||||||
|
|
| ||||||||
| Finance — 0.06% |
| |||||||||
| Avolon TLB Borrower 1 U.S. LLC, |
| |||||||||
| Term Loan B6, 1st Lien |
| |||||||||
| (SOFR plus 2.00%) |
| |||||||||
7.33% | 06/22/282 | 454,814 | 455,455 | |||||||
| Deerfield Dakota Holding LLC, |
| |||||||||
| Term Loan B, 1st Lien |
| |||||||||
| (SOFR plus 3.75%) |
| |||||||||
9.06% | 04/09/272 | 198,140 | 197,411 | |||||||
| Jane Street Group LLC, |
| |||||||||
| Term Loan B, 1st Lien |
| |||||||||
| (SOFR plus 2.61%) |
| |||||||||
7.94% | 01/26/282 | 962,530 | 964,094 | |||||||
|
|
| ||||||||
| 1,616,960 | ||||||||||
|
|
| ||||||||
| Food — 0.02% |
| |||||||||
| 8th Avenue Food & Provisions, Inc., |
| |||||||||
| Term Loan B, 1st Lien |
| |||||||||
| (SOFR plus 3.86%) |
| |||||||||
9.19% | 10/01/252 | 140,059 | 137,939 | |||||||
| H-Food Holdings LLC, |
| |||||||||
| Term Loan, 1st Lien |
| |||||||||
| (SOFR plus 3.95%) |
| |||||||||
9.29% | 05/23/252 | 544,560 | 398,553 | |||||||
|
|
| ||||||||
| 536,492 | ||||||||||
|
|
| ||||||||
| Gaming — 0.10% |
| |||||||||
| Caesars Entertainment, Inc., |
| |||||||||
| Term Loan B1, 1st Lien |
| |||||||||
| (SOFR plus 2.75%) |
| |||||||||
8.04% | 02/06/312 | 1,219,307 | 1,221,782 | |||||||
| Ontario Gaming Gta Ltd. Partnership, |
| |||||||||
| Term Loan B, 1st Lien (Canada) |
| |||||||||
| (SOFR plus 4.25%) |
| |||||||||
9.57% | 08/01/302,3 | 613,380 | 616,229 | |||||||
| Penn National Gaming, Inc., |
| |||||||||
| Term Loan B, 1st Lien |
| |||||||||
| (SOFR plus 2.85%) |
| |||||||||
7.66% | 05/03/292 | 603,169 | 604,490 | |||||||
|
|
| ||||||||
| 2,442,501 | ||||||||||
|
|
| ||||||||
| Health Care — 0.34% |
| |||||||||
| Bausch + Lomb Corp., |
| |||||||||
| Term Loan B, 1st Lien (Canada) |
| |||||||||
| (SOFR plus 3.35%) |
| |||||||||
8.68% | 05/10/272,3 | 309,165 | 306,305 | |||||||
See accompanying Notes to Financial Statements.
| 219 / Annual Report March 2024 |
Table of Contents
Unconstrained Bond Fund
Schedule of Portfolio Investments
March 31, 2024
| Issues | Maturity Date | Principal Amount | Value | |||||||
| BANK LOANS (continued) |
| |||||||||
| Health Care (continued) |
| |||||||||
| Carestream Dental Equipment, Inc., |
| |||||||||
| Term Loan, 1st Lien |
| |||||||||
| (LIBOR plus 3.25%) |
| |||||||||
8.56% | 09/01/242 | $ | 2,538,231 | $ | 2,216,726 | |||||
| Carestream Dental, Inc., |
| |||||||||
| Term Loan, 1st Lien |
| |||||||||
| (LIBOR plus 4.50%) |
| |||||||||
9.94% | 09/01/242 | 637,042 | 556,084 | |||||||
| Genesee & Wyoming, Inc., |
| |||||||||
| Term Loan, 1st Lien |
| |||||||||
| (SOFR plus 2.10%) |
| |||||||||
7.40% | 12/30/262 | 812,094 | 813,539 | |||||||
| Grifols Worldwide Operations USA, Inc., |
| |||||||||
| Term Loan B, 1st Lien |
| |||||||||
| (SOFR plus 2.15%) |
| |||||||||
7.46% | 11/15/272 | 1,264,585 | 1,227,198 | |||||||
| Jazz Financing Lux SARL, |
| |||||||||
| Term Loan B, 1st Lien (Luxembourg) |
| |||||||||
| (SOFR plus 3.11%) |
| |||||||||
8.44% | 05/05/282,3 | 1,113,257 | 1,120,215 | |||||||
| Medline Borrower LP, |
| |||||||||
| Term Loan B, 1st Lien |
| |||||||||
| (SOFR plus 2.86%) |
| |||||||||
8.20% | 10/23/282 | 446,332 | 447,959 | |||||||
| Organon & Co., |
| |||||||||
| Term Loan B, 1st Lien |
| |||||||||
| (SOFR plus 3.11%) |
| |||||||||
7.75% | 06/02/282 | 393,480 | 395,366 | |||||||
| Pathway Vet Alliance LLC, |
| |||||||||
| Term Loan B, 1st Lien |
| |||||||||
| (SOFR plus 3.86%) |
| |||||||||
9.19% | 03/31/272 | 1,111,045 | 978,070 | |||||||
| Star Parent, Inc., |
| |||||||||
| Term Loan B, 1st Lien |
| |||||||||
| (SOFR plus 4.00%) |
| |||||||||
9.31% | 09/27/302 | 409,689 | 407,667 | |||||||
| U.S. Renal Care, Inc., |
| |||||||||
| Term Loan, 1st Lien |
| |||||||||
| (SOFR plus 5.11%) |
| |||||||||
10.44% | 06/20/282 | 207,215 | 180,622 | |||||||
|
|
| ||||||||
| 8,649,751 | ||||||||||
|
|
| ||||||||
| Health Care REITs — 0.11% |
| |||||||||
| Aveanna Healthcare LLC, |
| |||||||||
| Term Loan B, 1st Lien |
| |||||||||
| (SOFR plus 3.85%) |
| |||||||||
9.19% | 07/17/282 | 2,925,580 | 2,820,566 | |||||||
|
|
| ||||||||
| Industrials — 0.60% |
| |||||||||
| Artera Services LLC, |
| |||||||||
| Term Loan, 1st Lien |
| |||||||||
| (SOFR plus 4.50%) |
| |||||||||
9.81% | 02/15/312 | 686,827 | 690,261 | |||||||
| ASP Blade Holdings, Inc., |
| |||||||||
| Term Loan B, 1st Lien |
| |||||||||
| (SOFR plus 4.26%) |
| |||||||||
9.56% | 10/16/282 | 513,824 | 466,038 | |||||||
| Issues | Maturity Date | Principal Amount | Value | |||||||
| BANK LOANS (continued) |
| |||||||||
| Industrials (continued) |
| |||||||||
| Berry Global, Inc., |
| |||||||||
| Term Loan AA, 1st Lien |
| |||||||||
| (SOFR plus 1.86%) |
| |||||||||
7.18% | 07/01/292 | $ | 1,771,974 | $ | 1,773,250 | |||||
| Coherent Corp., |
| |||||||||
| Term Loan B, 1st Lien |
| |||||||||
| (SOFR plus 2.86%) |
| |||||||||
7.38% - 7.67% | 07/02/292 | 397,680 | 398,973 | |||||||
| DTI Holdco, Inc., |
| |||||||||
| Term Loan B, 1st Lien |
| |||||||||
| (SOFR plus 4.75%) |
| |||||||||
10.06% | 04/26/292 | 241,306 | 241,608 | |||||||
| Filtration Group Corp., |
| |||||||||
| Term Loan, 1st Lien |
| |||||||||
| (SOFR plus 4.36%) |
| |||||||||
9.69% | 10/21/282 | 325,931 | 327,338 | |||||||
| Michaels Cos., Inc. (The), |
| |||||||||
| Term Loan, 1st Lien |
| |||||||||
| (SOFR plus 4.51%) |
| |||||||||
9.82% | 04/15/282 | 3,403,750 | 3,062,609 | |||||||
| Patriot Container Corp., |
| |||||||||
| Term Loan B, 1st Lien |
| |||||||||
| (SOFR plus 3.85%) |
| |||||||||
9.18% | 03/20/252 | 153,204 | 148,935 | |||||||
| Term Loan, 2nd Lien |
| |||||||||
| (SOFR plus 7.75%) |
| |||||||||
13.08% | 03/20/262 | 637,132 | 554,305 | |||||||
| Plaze, Inc., |
| |||||||||
| Term Loan B, 1st Lien |
| |||||||||
| (SOFR plus 3.86%) |
| |||||||||
9.19% | 08/03/262 | 3,386,250 | 3,343,922 | |||||||
| Term Loan B, 1st Lien (Luxembourg) |
| |||||||||
| (SOFR plus 3.61%) |
| |||||||||
8.94% | 08/03/262,3 | 1,676,449 | 1,655,493 | |||||||
| ProAmpac PG Borrower LLC, |
| |||||||||
| Term Loan B, 1st Lien |
| |||||||||
| (SOFR plus 4.50%) |
| |||||||||
9.80% - 9.82% | 09/15/282 | 1,346,110 | 1,350,149 | |||||||
| Transdigm, Inc., |
| |||||||||
| Term Loan I, 1st Lien |
| |||||||||
| (SOFR plus 2.75%) |
| |||||||||
8.08% | 08/24/282 | 1,478,897 | 1,485,604 | |||||||
|
|
| ||||||||
| 15,498,485 | ||||||||||
|
|
| ||||||||
| Information Technology — 0.70% |
| |||||||||
| Arches Buyer, Inc., |
| |||||||||
| Term Loan B, 1st Lien |
| |||||||||
| (SOFR plus 3.35%) |
| |||||||||
8.68% | 12/06/272 | 585,233 | 568,206 | |||||||
| Athenahealth Group, Inc., |
| |||||||||
| Term Loan B, 1st Lien |
| |||||||||
| (SOFR plus 3.25%) |
| |||||||||
8.25% | 02/15/292 | 438,583 | 435,535 | |||||||
See accompanying Notes to Financial Statements.
| Annual Report March 2024 / 220 |
Table of Contents
Unconstrained Bond Fund
Schedule of Portfolio Investments
March 31, 2024
| Issues | Maturity Date | Principal Amount | Value | |||||||
| BANK LOANS (continued) |
| |||||||||
| Information Technology (continued) |
| |||||||||
| Buzz Merger Sub Ltd., |
| |||||||||
| Term Loan B, 1st Lien |
| |||||||||
| (SOFR plus 2.85%) |
| |||||||||
8.18% | 01/29/272 | $ | 349,907 | $ | 351,110 | |||||
| Central Parent LLC, |
| |||||||||
| Term Loan B, 1st Lien |
| |||||||||
| (SOFR plus 4.00%) |
| |||||||||
9.31% | 07/06/292 | 673,251 | 676,018 | |||||||
| CT Technologies Intermediate Holdings, Inc., |
| |||||||||
| Term Loan, 1st Lien |
| |||||||||
| (SOFR plus 4.36%) |
| |||||||||
9.69% | 12/16/252 | 921,500 | 920,924 | |||||||
| EagleView Technology Co., |
| |||||||||
| Term Loan B, 1st Lien |
| |||||||||
| (SOFR plus 3.76%) |
| |||||||||
9.06% | 08/14/252 | 5,051,722 | 4,918,659 | |||||||
| Gainwell Acquisition Corp., |
| |||||||||
| Term Loan B, 1st Lien |
| |||||||||
| (SOFR plus 4.10%) |
| |||||||||
8.72% - 8.99% | 10/01/272 | 2,192,030 | 2,100,787 | |||||||
| Magnite, Inc., |
| |||||||||
| Term Loan B, 1st Lien |
| |||||||||
| (SOFR plus 4.50%) |
| |||||||||
9.60% - 9.82% | 02/06/312 | 276,382 | 277,189 | |||||||
| MH Sub I LLC, |
| |||||||||
| Term Loan B3, 1st Lien |
| |||||||||
| (SOFR plus 4.25%) |
| |||||||||
9.58% | 05/03/282 | 281,536 | 280,191 | |||||||
| NortonLifeLock, Inc., |
| |||||||||
| Term Loan A2, 1st Lien |
| |||||||||
| (SOFR plus 1.85%) |
| |||||||||
7.18% | 09/10/272 | 1,326,161 | 1,324,364 | |||||||
| Open Text Corp., |
| |||||||||
| Term Loan B, 1st Lien (Canada) |
| |||||||||
| (SOFR plus 1.85%) |
| |||||||||
7.18% | 05/30/252,3 | 227,622 | 228,120 | |||||||
| (SOFR plus 2.85%) |
| |||||||||
8.18% | 01/31/302,3 | 416,052 | 417,236 | |||||||
| Oracle Corp., |
| |||||||||
| Term Loan A1, 1st Lien |
| |||||||||
| (SOFR plus 0.60%) |
| |||||||||
6.46% | 08/16/272 | 1,656,374 | 1,658,444 | |||||||
| Renaissance Holding Corp., |
| |||||||||
| Term Loan, 1st Lien |
| |||||||||
| (SOFR plus 4.25%) |
| |||||||||
9.58% | 04/05/302 | 599,174 | 601,047 | |||||||
| Spin Holdco, Inc., |
| |||||||||
| Term Loan B, 1st Lien |
| |||||||||
| (SOFR plus 4.26%) |
| |||||||||
9.59% | 03/03/282 | 2,160,658 | 2,006,549 | |||||||
| Xerox Corp., |
| |||||||||
| Term Loan B, 1st Lien |
| |||||||||
| (SOFR plus 4.00%) |
| |||||||||
9.33% | 11/15/292 | 1,222,707 | 1,229,970 | |||||||
|
|
| ||||||||
| 17,994,349 | ||||||||||
|
|
| ||||||||
| Issues | Maturity Date | Principal Amount | Value | |||||||
| BANK LOANS (continued) |
| |||||||||
| Insurance — 0.14% |
| |||||||||
| Acrisure LLC, |
| |||||||||
| Term Loan B1, 1st Lien |
| |||||||||
| (SOFR plus 3.50%) |
| |||||||||
8.94% | 02/15/272 | $ | 1,112,343 | $ | 1,113,038 | |||||
| Asurion LLC, |
| |||||||||
| Term Loan B10, 1st Lien |
| |||||||||
| (SOFR plus 4.10%) |
| |||||||||
8.91% | 08/19/282 | 985,000 | 951,141 | |||||||
| Term Loan B4, 2nd Lien |
| |||||||||
| (SOFR plus 5.25%) |
| |||||||||
10.58% | 01/20/292 | 300,000 | 269,836 | |||||||
| Term Loan B8, 1st Lien |
| |||||||||
| (SOFR plus 3.36%) |
| |||||||||
8.69% | 12/23/262 | 1,319,633 | 1,296,065 | |||||||
|
|
| ||||||||
| 3,630,080 | ||||||||||
|
|
| ||||||||
| Materials — 0.14% |
| |||||||||
| Chemours Co. (The), |
| |||||||||
| Term Loan B3, 1st Lien |
| |||||||||
| (SOFR plus 3.50%) |
| |||||||||
8.83% | 08/18/282 | 512,475 | 511,706 | |||||||
| Herens U.S. Holdco Corp., |
| |||||||||
| Term Loan B, 1st Lien |
| |||||||||
| (SOFR plus 4.03%) |
| |||||||||
9.33% | 07/03/282 | 1,687,861 | 1,593,298 | |||||||
| Schweitzer-Mauduit International, Inc., |
| |||||||||
| Term Loan B, 1st Lien |
| |||||||||
| (SOFR plus 3.86%) |
| |||||||||
9.19% | 04/20/282 | 1,567,868 | 1,570,486 | |||||||
|
|
| ||||||||
| 3,675,490 | ||||||||||
|
|
| ||||||||
| Office REITs — 0.09% |
| |||||||||
| Rent-A-Center, Inc., |
| |||||||||
| Term Loan B, 1st Lien |
| |||||||||
| (SOFR plus 3.68%) |
| |||||||||
8.12% | 02/17/282 | 2,240,984 | 2,244,244 | |||||||
|
|
| ||||||||
| Retail — 0.27% |
| |||||||||
| 1011778 BC Unlimited Liability Co., |
| |||||||||
| Term Loan B5, 1st Lien (Canada) |
| |||||||||
| (SOFR plus 2.25%) |
| |||||||||
7.58% | 09/20/302,3 | 410,174 | 410,430 | |||||||
| AmWINS Group, Inc., |
| |||||||||
| Term Loan B, 1st Lien |
| |||||||||
| (SOFR plus 2.36%) |
| |||||||||
7.69% | 02/19/282 | 2,714,363 | 2,717,756 | |||||||
| BW Gas & Convenience Holdings LLC, |
| |||||||||
| Term Loan B, 1st Lien |
| |||||||||
| (SOFR plus 3.61%) |
| |||||||||
8.94% | 03/31/282 | 3,501,000 | 3,479,119 | |||||||
| KFC Holding Co., |
| |||||||||
| Term Loan B, 1st Lien |
| |||||||||
| (SOFR plus 1.86%) |
| |||||||||
7.19% | 03/15/282 | 458,187 | 458,494 | |||||||
|
|
| ||||||||
| 7,065,799 | ||||||||||
|
|
| ||||||||
See accompanying Notes to Financial Statements.
| 221 / Annual Report March 2024 |
Table of Contents
Unconstrained Bond Fund
Schedule of Portfolio Investments
March 31, 2024
| Issues | Maturity Date | Principal Amount | Value | |||||||
| BANK LOANS (continued) |
| |||||||||
| Services — 0.16% |
| |||||||||
| Amentum Government Services Holdings LLC, |
| |||||||||
| Term Loan B, 1st Lien |
| |||||||||
| (SOFR plus 4.11%) |
| |||||||||
8.63% | 01/29/272 | $ | 1,291,247 | $ | 1,296,089 | |||||
| Clean Harbors, Inc., |
| |||||||||
| Term Loan B, 1st Lien |
| |||||||||
| (SOFR plus 1.86%) |
| |||||||||
7.19% | 10/08/282 | 1,158,737 | 1,162,358 | |||||||
| Element Materials Technology Group U.S. Holdings, Inc., |
| |||||||||
| Delayed-Draw Term Loan, 1st Lien |
| |||||||||
| (SOFR plus 4.35%) |
| |||||||||
9.66% | 07/06/292 | 122,826 | 123,082 | |||||||
| Term Loan B, 1st Lien |
| |||||||||
| (SOFR plus 4.35%) |
| |||||||||
9.66% | 07/06/292 | 266,122 | 266,677 | |||||||
| Pre-Paid Legal Services, Inc., |
| |||||||||
| Term Loan, 1st Lien |
| |||||||||
| (SOFR plus 3.86%) |
| |||||||||
9.18% | 12/15/282 | 533,384 | 531,526 | |||||||
| Trans Union LLC, |
| |||||||||
| Term Loan B, 1st Lien |
| |||||||||
| (SOFR plus 2.00%) |
| |||||||||
7.33% | 12/01/282 | 600,346 | 600,760 | |||||||
| TruGreen LP, |
| |||||||||
| Term Loan B, 1st Lien |
| |||||||||
| (SOFR plus 4.10%) |
| |||||||||
9.43% | 11/02/272 | 169,937 | 165,742 | |||||||
|
|
| ||||||||
| 4,146,234 | ||||||||||
|
|
| ||||||||
| Specialized REITs — 0.05% |
| |||||||||
| Greystar Real Estate Partners LLC, |
| |||||||||
| Term Loan B1, 1st Lien |
| |||||||||
| (SOFR plus 3.25%) |
| |||||||||
8.58% | 08/21/302 | 1,300,076 | 1,303,326 | |||||||
|
|
| ||||||||
| Total Bank Loans |
| |||||||||
| (Cost $83,176,974) |
| 82,444,479 | ||||||||
|
|
| ||||||||
| CORPORATES — 20.80%* |
| |||||||||
| Banking — 4.40% |
| |||||||||
| Bank of America Corp. |
| |||||||||
1.73% | 07/22/274 | 611,000 | 563,671 | |||||||
| Bank of America Corp. |
| |||||||||
| (MTN) |
| |||||||||
1.32% | 06/19/264 | 4,222,000 | 4,013,269 | |||||||
1.92% | 10/24/314 | 7,570,000 | 6,182,880 | |||||||
2.09% | 06/14/294 | 8,194,000 | 7,245,039 | |||||||
| (CME Term SOFR 3-Month plus 0.91%) |
| |||||||||
6.25% | 12/01/262 | 4,400,000 | 4,286,923 | |||||||
| Bank of America Corp., |
| |||||||||
| Series N |
| |||||||||
1.66% | 03/11/274 | 11,114,000 | 10,360,857 | |||||||
| Bank of America Corp., |
| |||||||||
| Series RR |
| |||||||||
4.38%4,7 | 2,340,000 | 2,205,437 | ||||||||
| Issues | Maturity Date | Principal Amount | Value | |||||||
| CORPORATES (continued) |
| |||||||||
| Banking (continued) |
| |||||||||
| HSBC Holdings PLC |
| |||||||||
| (United Kingdom) |
| |||||||||
2.10% | 06/04/263,4 | $ | 2,480,000 | $ | 2,379,238 | |||||
2.21% | 08/17/293,4 | 5,275,000 | 4,625,870 | |||||||
4.76% | 06/09/283,4 | 2,260,000 | 2,216,781 | |||||||
| JPMorgan Chase & Co. |
| |||||||||
1.56% | 12/10/254 | 19,055,000 | 18,528,930 | |||||||
1.58% | 04/22/274 | 10,250,000 | 9,507,350 | |||||||
1.95% | 02/04/324 | 1,415,000 | 1,153,377 | |||||||
2.07% | 06/01/294 | 510,000 | 452,240 | |||||||
2.55% | 11/08/324 | 1,605,000 | 1,336,756 | |||||||
2.58% | 04/22/324 | 175,000 | 147,906 | |||||||
| Lloyds Banking Group PLC |
| |||||||||
| (United Kingdom) |
| |||||||||
3.57% | 11/07/283,4 | 2,130,000 | 1,998,348 | |||||||
3.87% | 07/09/253,4 | 4,000,000 | 3,979,313 | |||||||
| PNC Financial Services Group, Inc. (The) |
| |||||||||
5.07% | 01/24/344 | 2,945,000 | 2,853,452 | |||||||
6.88% | 10/20/344 | 2,405,000 | 2,635,398 | |||||||
| Santander UK Group Holdings PLC |
| |||||||||
| (United Kingdom) |
| |||||||||
1.67% | 06/14/273,4 | 2,620,000 | 2,398,440 | |||||||
| U.S. Bancorp |
| |||||||||
3.70%4,7 | 1,980,000 | 1,715,729 | ||||||||
4.84% | 02/01/344 | 4,320,000 | 4,104,320 | |||||||
5.68% | 01/23/354 | 630,000 | 636,673 | |||||||
5.84% | 06/12/344 | 900,000 | 918,295 | |||||||
| Wells Fargo & Co. |
| |||||||||
| (MTN) |
| |||||||||
2.16% | 02/11/264 | 4,550,000 | 4,414,812 | |||||||
2.57% | 02/11/314 | 1,406,000 | 1,212,244 | |||||||
3.35% | 03/02/334 | 12,925,000 | 11,211,733 | |||||||
|
|
| ||||||||
| 113,285,281 | ||||||||||
|
|
| ||||||||
| Communications — 1.76% |
| |||||||||
| C&W Senior Finance Ltd. |
| |||||||||
| (Cayman Islands) |
| |||||||||
6.88% | 09/15/271,3 | 300,000 | 283,860 | |||||||
| Cable One, Inc. |
| |||||||||
4.00% | 11/15/301 | 1,592,000 | 1,245,740 | |||||||
| Charter Communications Operating LLC/Charter |
| |||||||||
| Communications Operating Capital |
| |||||||||
4.80% | 03/01/50 | 4,765,000 | 3,530,236 | |||||||
5.38% | 05/01/47 | 3,050,000 | 2,466,040 | |||||||
5.75% | 04/01/48 | 2,347,000 | 1,977,916 | |||||||
6.65% | 02/01/34 | 800,000 | 820,334 | |||||||
| Charter Communications Operating, LLC/Charter |
| |||||||||
| Communications Operating Capital |
| |||||||||
5.25% | 04/01/53 | 1,000,000 | 792,842 | |||||||
| CommScope, Inc. |
| |||||||||
4.75% | 09/01/291 | 1,430,000 | 1,029,600 | |||||||
| CSC Holdings LLC |
| |||||||||
4.63% | 12/01/301 | 500,000 | 253,750 | |||||||
5.38% | 02/01/281 | 650,000 | 559,639 | |||||||
6.50% | 02/01/291 | 2,353,000 | 1,995,710 | |||||||
7.50% | 04/01/281 | 2,522,000 | 1,702,088 | |||||||
See accompanying Notes to Financial Statements.
| Annual Report March 2024 / 222 |
Table of Contents
Unconstrained Bond Fund
Schedule of Portfolio Investments
March 31, 2024
| Issues | Maturity Date | Principal Amount | Value | |||||||
| CORPORATES (continued) |
| |||||||||
| Communications (continued) |
| |||||||||
11.25% | 05/15/281 | $ | 1,000,000 | $ | 992,279 | |||||
11.75% | 01/31/291 | 196,000 | 196,245 | |||||||
| Frontier Communications Holdings LLC |
| |||||||||
6.75% | 05/01/291 | 3,140,000 | 2,801,774 | |||||||
8.63% | 03/15/311 | 1,854,000 | 1,894,773 | |||||||
| Global Switch Finance BV |
| |||||||||
| (EMTN) |
| |||||||||
| (Netherlands) |
| |||||||||
1.38% | 10/07/303 | 4,505,000 | 4,509,496 | |||||||
| Northwest Fiber LLC/Northwest Fiber Finance Sub, Inc. |
| |||||||||
4.75% | 04/30/271 | 1,396,000 | 1,430,900 | |||||||
6.00% | 02/15/281 | 444,000 | 457,320 | |||||||
| SES GLOBAL Americas Holdings, Inc. |
| |||||||||
5.30% | 03/25/441 | 7,494,000 | 5,739,285 | |||||||
| TDC Net A/S, |
| |||||||||
| (EMTN) |
| |||||||||
| (Germany) |
| |||||||||
6.50% | 06/01/313 | 500,000 | 583,217 | |||||||
| Tele Columbus AG, |
| |||||||||
| Series REGS |
| |||||||||
| (Georgia) |
| |||||||||
10.00% | 03/19/293,8 | 2,240,000 | 1,688,602 | |||||||
| Time Warner Cable LLC |
| |||||||||
5.50% | 09/01/41 | 4,443,000 | 3,702,281 | |||||||
| VZ Secured Financing BV |
| |||||||||
| (Netherlands) |
| |||||||||
5.00% | 01/15/321,3 | 2,495,000 | 2,144,088 | |||||||
| VZ Secured Financing BV, |
| |||||||||
| Series REGS |
| |||||||||
| (Netherlands) |
| |||||||||
3.50% | 01/15/323 | 2,800,000 | 2,658,776 | |||||||
|
|
| ||||||||
| 45,456,791 | ||||||||||
|
|
| ||||||||
| Consumer Discretionary — 1.47% |
| |||||||||
| Bacardi Ltd. |
| |||||||||
| (Bermuda) |
| |||||||||
5.15% | 05/15/381,3 | 1,500,000 | 1,433,551 | |||||||
| BAT Capital Corp. |
| |||||||||
4.76% | 09/06/49 | 7,059,000 | 5,624,101 | |||||||
| Becle, SAB de CV |
| |||||||||
| (Mexico) |
| |||||||||
2.50% | 10/14/311,3 | 4,450,000 | 3,545,115 | |||||||
| Everi Holdings, Inc. |
| |||||||||
5.00% | 07/15/291 | 1,296,000 | 1,286,280 | |||||||
| Imperial Brands Finance PLC |
| |||||||||
| (United Kingdom) |
| |||||||||
3.13% | 07/26/241,3 | 1,500,000 | 1,487,179 | |||||||
4.25% | 07/21/251,3 | 1,880,000 | 1,847,195 | |||||||
| Philip Morris International, Inc. |
| |||||||||
1.45% | 08/01/39 | 495,000 | 372,079 | |||||||
| Reynolds American, Inc. |
| |||||||||
5.85% | 08/15/45 | 7,245,000 | 6,746,488 | |||||||
| Spectrum Brands, Inc. |
| |||||||||
3.88% | 03/15/311 | 1,765,000 | 1,704,932 | |||||||
| Triton Water Holdings, Inc. |
| |||||||||
6.25% | 04/01/291 | 117,000 | 106,823 | |||||||
| Issues | Maturity Date | Principal Amount | Value | |||||||
| CORPORATES (continued) |
| |||||||||
| Consumer Discretionary (continued) |
| |||||||||
| WarnerMedia Holdings, Inc. |
| |||||||||
5.05% | 03/15/42 | $ | 7,970,000 | $ | 6,849,871 | |||||
5.14% | 03/15/52 | 8,287,000 | 6,888,718 | |||||||
|
|
| ||||||||
| 37,892,332 | ||||||||||
|
|
| ||||||||
| Diversified REITs — 0.97% |
| |||||||||
| American Assets Trust LP |
| |||||||||
3.38% | 02/01/31 | 4,005,000 | 3,274,574 | |||||||
| American Tower Corp. |
| |||||||||
1.00% | 01/15/32 | 1,435,000 | 1,269,004 | |||||||
2.70% | 04/15/31 | 3,045,000 | 2,579,398 | |||||||
| CapitaLand Ascendas REIT |
| |||||||||
| (EMTN) |
| |||||||||
| (Slovenia) |
| |||||||||
0.75% | 06/23/283 | 525,000 | 491,370 | |||||||
| Digital Dutch Finco BV |
| |||||||||
| (Netherlands) |
| |||||||||
1.00% | 01/15/323 | 2,600,000 | 2,232,161 | |||||||
| Digital Intrepid Holding BV |
| |||||||||
| (Netherlands) |
| |||||||||
1.38% | 07/18/323 | 1,000,000 | 876,248 | |||||||
| GLP Capital LP/GLP Financing II, Inc. |
| |||||||||
5.30% | 01/15/29 | 2,280,000 | 2,252,617 | |||||||
5.75% | 06/01/28 | 6,241,000 | 6,250,543 | |||||||
| VICI Properties LP |
| |||||||||
4.95% | 02/15/30 | 450,000 | 435,177 | |||||||
5.13% | 05/15/32 | 2,441,000 | 2,338,743 | |||||||
| VICI Properties LP/VICI Note Co., Inc. |
| |||||||||
3.88% | 02/15/291 | 1,120,000 | 1,031,753 | |||||||
4.13% | 08/15/301 | 113,000 | 102,807 | |||||||
4.63% | 06/15/251 | 250,000 | 246,565 | |||||||
| Vonovia SE |
| |||||||||
| (Georgia) |
| |||||||||
1.00% | 06/16/333 | 300,000 | 245,108 | |||||||
2.25% | 04/07/303 | 300,000 | 294,287 | |||||||
| Vonovia SE |
| |||||||||
| (EMTN) |
| |||||||||
| (Georgia) |
| |||||||||
0.75% | 09/01/323 | 1,100,000 | 902,494 | |||||||
| Vonovia SE, |
| |||||||||
| (EMTN) |
| |||||||||
| (Georgia) |
| |||||||||
5.00% | 11/23/303 | 200,000 | 227,284 | |||||||
|
|
| ||||||||
| 25,050,133 | ||||||||||
|
|
| ||||||||
| Electric — 1.14% |
| |||||||||
| Alliant Energy Finance, LLC |
| |||||||||
3.60% | 03/01/321 | 8,130,000 | 7,204,501 | |||||||
| Cleco Power LLC |
| |||||||||
6.00% | 12/01/40 | 825,000 | 831,315 | |||||||
| Comision Federal de Electricidad, |
| |||||||||
| Series REGS |
| |||||||||
| (Mexico) |
| |||||||||
3.88% | 07/26/333 | 650,000 | 529,100 | |||||||
| Dominion Energy, Inc. |
| |||||||||
5.75% | 10/01/544 | 2,515,000 | 2,511,955 | |||||||
See accompanying Notes to Financial Statements.
| 223 / Annual Report March 2024 |
Table of Contents
Unconstrained Bond Fund
Schedule of Portfolio Investments
March 31, 2024
| Issues | Maturity Date | Principal Amount | Value | |||||||
| CORPORATES (continued) |
| |||||||||
| Electric (continued) |
| |||||||||
| Duke Energy Corp. |
| |||||||||
3.85% | 06/15/34 | $ | 3,840,000 | $ | 4,117,527 | |||||
| FirstEnergy Pennsylvania Electric Co. |
| |||||||||
4.00% | 04/15/251 | 2,625,000 | 2,561,368 | |||||||
| FirstEnergy Transmission LLC |
| |||||||||
2.87% | 09/15/281 | 3,153,000 | 2,876,920 | |||||||
| Mong Duong Finance Holdings BV, |
| |||||||||
| Series REGS |
| |||||||||
| (Netherlands) |
| |||||||||
5.13% | 05/07/293 | 322,802 | 308,848 | |||||||
| Southwestern Electric Power Co., |
| |||||||||
| Series M |
| |||||||||
4.10% | 09/15/28 | 2,190,000 | 2,101,196 | |||||||
| TenneT Holding BV |
| |||||||||
| (EMTN) |
| |||||||||
| (Netherlands) |
| |||||||||
2.75% | 05/17/423 | 1,670,000 | 1,691,673 | |||||||
4.50% | 10/28/343 | 645,000 | 765,953 | |||||||
4.75% | 10/28/423 | 3,075,000 | 3,820,858 | |||||||
|
|
| ||||||||
| 29,321,214 | ||||||||||
|
|
| ||||||||
| Energy — 1.18% |
| |||||||||
| Ecopetrol SA |
| |||||||||
| (Colombia) |
| |||||||||
8.88% | 01/13/333 | 780,000 | 825,518 | |||||||
| Energy Transfer LP, |
| |||||||||
| Series B |
| |||||||||
6.63%4,7 | 3,251,000 | 3,048,307 | ||||||||
| Energy Transfer Operating LP |
| |||||||||
5.30% | 04/15/47 | 1,000,000 | 911,447 | |||||||
| Galaxy Pipeline Assets Bidco Ltd. |
| |||||||||
| (United Kingdom) |
| |||||||||
2.16% | 03/31/341,3 | 1,698,880 | 1,464,435 | |||||||
| Global Partners LP/GLP Finance Corp. |
| |||||||||
6.88% | 01/15/29 | 800,000 | 794,300 | |||||||
| KazMunayGas National Co. JSC, |
| |||||||||
| Series REGS |
| |||||||||
| (Kazakhstan) |
| |||||||||
3.50% | 04/14/333 | 1,586,000 | 1,322,565 | |||||||
4.75% | 04/19/273 | 205,000 | 199,773 | |||||||
| KazMunayGas National Co. JSC, |
| |||||||||
| Series REGS (EMTN) |
| |||||||||
| (Kazakhstan) |
| |||||||||
5.38% | 04/24/303 | 2,424,000 | 2,382,676 | |||||||
| National Gas Transmission PLC, |
| |||||||||
| (EMTN) |
| |||||||||
| (United Kingdom) |
| |||||||||
4.25% | 04/05/303 | 970,000 | 1,078,727 | |||||||
| NGL Energy Operating LLC/NGL Energy Finance Corp. |
| |||||||||
8.38% | 02/15/321 | 1,080,000 | 1,108,402 | |||||||
| Pertamina Persero PT |
| |||||||||
| (Indonesia) |
| |||||||||
3.10% | 08/27/301,3 | 4,079,000 | 3,611,955 | |||||||
| Petroleos Mexicanos |
| |||||||||
| (Mexico) |
| |||||||||
6.35% | 02/12/483 | 652,000 | 416,539 | |||||||
| Issues | Maturity Date | Principal Amount | Value | |||||||
| CORPORATES (continued) |
| |||||||||
| Energy (continued) |
| |||||||||
6.75% | 09/21/473 | $ | 1,598,000 | $ | 1,059,474 | |||||
| QazaqGaz NC JSC, |
| |||||||||
| Series REGS |
| |||||||||
| (Kazakhstan) |
| |||||||||
4.38% | 09/26/273 | 650,000 | 613,015 | |||||||
| Southern Co. Gas Capital Corp. |
| |||||||||
3.88% | 11/15/25 | 2,410,000 | 2,349,750 | |||||||
| Southern Gas Corridor CJSC, |
| |||||||||
| Series REGS |
| |||||||||
| (Azerbaijan) |
| |||||||||
6.88% | 03/24/263 | 2,776,000 | 2,809,312 | |||||||
| TransMontaigne Partners LP/TLP Finance Corp. |
| |||||||||
6.13% | 02/15/26 | 3,846,000 | 3,677,738 | |||||||
| Venture Global LNG, Inc. |
| |||||||||
9.50% | 02/01/291 | 1,311,000 | 1,414,275 | |||||||
9.88% | 02/01/321 | 1,300,000 | 1,402,384 | |||||||
|
|
| ||||||||
| 30,490,592 | ||||||||||
|
|
| ||||||||
| Finance — 2.95% |
| |||||||||
| AerCap Ireland Capital DAC/AerCap Global Aviation Trust |
| |||||||||
| (Ireland) |
| |||||||||
3.00% | 10/29/283 | 10,100,000 | 9,144,020 | |||||||
| American Express Co., |
| |||||||||
| Series D |
| |||||||||
3.55%4,7 | 2,350,000 | 2,181,094 | ||||||||
| Avolon Holdings Funding Ltd. |
| |||||||||
| (Cayman Islands) |
| |||||||||
2.53% | 11/18/271,3 | 5,278,000 | 4,696,971 | |||||||
2.88% | 02/15/251,3 | 3,555,000 | 3,460,964 | |||||||
| Charles Schwab Corp. (The) |
| |||||||||
| Series K |
| |||||||||
5.00%4,7 | 2,020,000 | 1,936,291 | ||||||||
| Citigroup, Inc. |
| |||||||||
0.98% | 05/01/254 | 5,930,000 | 5,904,162 | |||||||
2.98% | 11/05/304 | 2,380,000 | 2,114,998 | |||||||
3.06% | 01/25/334 | 2,543,000 | 2,161,794 | |||||||
| Gaci First Investment Co. |
| |||||||||
| (Cayman Islands) |
| |||||||||
5.25% | 10/13/323 | 650,000 | 657,433 | |||||||
| GGAM Finance Ltd. |
| |||||||||
| (Cayman Islands) |
| |||||||||
6.88% | 04/15/291,3 | 945,000 | 953,809 | |||||||
8.00% | 06/15/281,3 | 644,000 | 672,175 | |||||||
| Goldman Sachs Group, Inc. (The) |
| |||||||||
1.95% | 10/21/274 | 4,295,000 | 3,950,842 | |||||||
| (SOFR Rate plus 0.49%) |
| |||||||||
5.84% | 10/21/242 | 5,565,000 | 5,568,743 | |||||||
| Goldman Sachs Group, Inc. (The), |
| |||||||||
| Series VAR |
| |||||||||
1.09% | 12/09/264 | 16,885,000 | 15,682,432 | |||||||
| Icahn Enterprises LP/Icahn Enterprises Finance Corp. |
| |||||||||
4.38% | 02/01/29 | 721,000 | 616,318 | |||||||
5.25% | 05/15/27 | 1,448,000 | 1,346,640 | |||||||
9.75% | 01/15/291 | 2,065,000 | 2,155,292 | |||||||
| Morgan Stanley |
| |||||||||
0.79% | 05/30/254 | 1,395,000 | 1,382,129 | |||||||
See accompanying Notes to Financial Statements.
| Annual Report March 2024 / 224 |
Table of Contents
Unconstrained Bond Fund
Schedule of Portfolio Investments
March 31, 2024
| Issues | Maturity Date | Principal Amount | Value | |||||||
| CORPORATES (continued) |
| |||||||||
| Finance (continued) |
| |||||||||
2.48% | 09/16/364 | $ | 2,505,000 | $ | 1,980,882 | |||||
| Morgan Stanley |
| |||||||||
| (GMTN) |
| |||||||||
2.95% | 05/07/324 | 3,250,000 | 3,375,980 | |||||||
| Morgan Stanley |
| |||||||||
| (MTN) |
| |||||||||
1.16% | 10/21/254 | 2,382,000 | 2,320,083 | |||||||
| Nationwide Building Society |
| |||||||||
| (United Kingdom) |
| |||||||||
2.97% | 02/16/281,3,4 | 3,835,000 | 3,579,128 | |||||||
|
|
| ||||||||
| 75,842,180 | ||||||||||
|
|
| ||||||||
| Food — 0.86% |
| |||||||||
| ELO SACA |
| |||||||||
| (EMTN) |
| |||||||||
| (France) |
| |||||||||
6.00% | 03/22/293 | 3,500,000 | 3,836,769 | |||||||
| H-Food Holdings LLC/Hearthside Finance Co., Inc. |
| |||||||||
8.50% | 06/01/261 | 3,012,000 | 225,900 | |||||||
| JBS USA LUX SA/JBS USA Food Co./JBS Luxembourg Sarl |
| |||||||||
| (Canada) |
| |||||||||
6.75% | 03/15/341,3 | 3,955,000 | 4,159,494 | |||||||
| JBS USA LUX SA/JBS USA Food Co./JBS USA Finance, Inc. |
| |||||||||
| (Canada) |
| |||||||||
3.00% | 05/15/323 | 2,940,000 | 2,390,225 | |||||||
3.75% | 12/01/313 | 796,000 | 690,224 | |||||||
6.50% | 12/01/523 | 1,555,000 | 1,540,552 | |||||||
| Pilgrim’s Pride Corp. |
| |||||||||
3.50% | 03/01/32 | 382,000 | 324,252 | |||||||
4.25% | 04/15/31 | 2,000,000 | 1,806,528 | |||||||
6.25% | 07/01/33 | 2,975,000 | 3,048,159 | |||||||
6.88% | 05/15/34 | 360,000 | 384,302 | |||||||
| Smithfield Foods, Inc. |
| |||||||||
2.63% | 09/13/311 | 4,690,000 | 3,675,375 | |||||||
|
|
| ||||||||
| 22,081,780 | ||||||||||
|
|
| ||||||||
| Health Care — 1.36% |
| |||||||||
| 1375209 BC Ltd. |
| |||||||||
| (Canada) |
| |||||||||
9.00% | 01/30/281,3 | 2,506,000 | 2,458,606 | |||||||
| Bayer U.S. Finance II LLC |
| |||||||||
4.38% | 12/15/281 | 3,059,000 | 2,880,793 | |||||||
4.63% | 06/25/381 | 2,775,000 | 2,311,782 | |||||||
4.88% | 06/25/481 | 1,915,000 | 1,540,361 | |||||||
5.50% | 08/15/251 | 2,000,000 | 1,985,212 | |||||||
| Bayer U.S. Finance LLC |
| |||||||||
6.88% | 11/21/531 | 3,643,000 | 3,744,295 | |||||||
| CAB SELAS, |
| |||||||||
| Series REGS |
| |||||||||
| (France) |
| |||||||||
3.38% | 02/01/283 | 1,080,000 | 1,057,983 | |||||||
| Cano Health LLC |
| |||||||||
6.25% | 10/01/281,5,6,9,10 | 1,076,000 | 936 | |||||||
| Catalent Pharma Solutions, Inc. |
| |||||||||
3.50% | 04/01/301 | 2,981,000 | 2,841,697 | |||||||
| Issues | Maturity Date | Principal Amount | Value | |||||||
| CORPORATES (continued) |
| |||||||||
| Health Care (continued) |
| |||||||||
| Ephios Subco 3 SARL |
| |||||||||
| (Luxembourg) |
| |||||||||
7.88% | 01/31/311,3 | $ | 360,000 | $ | 409,193 | |||||
| Fresenius Finance Ireland PLC |
| |||||||||
| (EMTN) |
| |||||||||
| (Ireland) |
| |||||||||
0.88% | 10/01/313 | 1,000,000 | 878,971 | |||||||
| Grifols SA, |
| |||||||||
| Series REGS |
| |||||||||
| (Spain) |
| |||||||||
3.20% | 05/01/253 | 1,025,000 | 1,022,653 | |||||||
3.88% | 10/15/283 | 2,940,000 | 2,516,767 | |||||||
| Kedrion SpA |
| |||||||||
| (Italy) |
| |||||||||
6.50% | 09/01/291,3 | 3,600,000 | 3,284,723 | |||||||
| Medtronic Global Holdings SCA |
| |||||||||
| (Luxembourg) |
| |||||||||
3.38% | 10/15/343 | 900,000 | 974,770 | |||||||
| ModivCare Escrow Issuer, Inc. |
| |||||||||
5.00% | 10/01/291 | 5,122,000 | 3,720,433 | |||||||
| Prime Healthcare Services, Inc. |
| |||||||||
7.25% | 11/01/251 | 1,551,000 | 1,554,877 | |||||||
| Universal Health Services, Inc. |
| |||||||||
1.65% | 09/01/26 | 1,500,000 | 1,367,582 | |||||||
2.65% | 01/15/32 | 590,000 | 483,040 | |||||||
|
|
| ||||||||
| 35,034,674 | ||||||||||
|
|
| ||||||||
| Health Care REITs — 0.19% |
| |||||||||
| Healthcare Reality Holdings LP |
| |||||||||
2.00% | 03/15/31 | 175,000 | 139,267 | |||||||
3.50% | 08/01/26 | 2,257,000 | 2,153,997 | |||||||
| Healthcare Realty Holdings LP |
| |||||||||
2.05% | 03/15/31 | 391,000 | 303,432 | |||||||
3.63% | 01/15/28 | 625,000 | 578,032 | |||||||
3.88% | 05/01/25 | 1,695,000 | 1,658,006 | |||||||
|
|
| ||||||||
| 4,832,734 | ||||||||||
|
|
| ||||||||
| Industrial REITs — 0.09% |
| |||||||||
| LXP Industrial Trust |
| |||||||||
2.70% | 09/15/30 | 2,000,000 | 1,673,990 | |||||||
| Prologis Euro Finance LLC, |
| |||||||||
| (EMTN) |
| |||||||||
4.25% | 01/31/43 | 610,000 | 665,109 | |||||||
|
|
| ||||||||
| 2,339,099 | ||||||||||
|
|
| ||||||||
| Industrials — 1.01% |
| |||||||||
| Ardagh Packaging Finance PLC/Ardagh Holdings USA, Inc. |
| |||||||||
| (Canada) |
| |||||||||
4.13% | 08/15/261,3 | 887,000 | 805,675 | |||||||
5.25% | 08/15/271,3 | 4,441,000 | 2,798,302 | |||||||
| Artera Services LLC |
| |||||||||
8.50% | 02/15/311 | 875,000 | 897,726 | |||||||
| Berry Global, Inc. |
| |||||||||
1.65% | 01/15/27 | 105,000 | 95,386 | |||||||
4.88% | 07/15/261 | 1,195,000 | 1,171,977 | |||||||
5.65% | 01/15/341 | 2,300,000 | 2,290,105 | |||||||
See accompanying Notes to Financial Statements.
| 225 / Annual Report March 2024 |
Table of Contents
Unconstrained Bond Fund
Schedule of Portfolio Investments
March 31, 2024
| Issues | Maturity Date | Principal Amount | Value | |||||||
| CORPORATES (continued) |
| |||||||||
| Industrials (continued) |
| |||||||||
| Boeing Co. (The) |
| |||||||||
5.81% | 05/01/50 | $ | 2,690,000 | $ | 2,547,583 | |||||
| General Electric Co. |
| |||||||||
| (MTN) |
| |||||||||
| (CME Term SOFR 3-Month plus 0.74%) |
| |||||||||
6.05% | 08/15/362 | 10,370,000 | 9,631,749 | |||||||
| Honeywell International, Inc. |
| |||||||||
3.75% | 03/01/36 | 1,670,000 | 1,822,797 | |||||||
| OT Merger Corp. |
| |||||||||
7.88% | 10/15/291 | 5,555,000 | 4,007,446 | |||||||
|
|
| ||||||||
| 26,068,746 | ||||||||||
|
|
| ||||||||
| Information Technology — 0.27% |
| |||||||||
| Open Text Corp. |
| |||||||||
| (Canada) |
| |||||||||
6.90% | 12/01/271,3 | 5,545,000 | 5,724,658 | |||||||
| RingCentral, Inc. |
| |||||||||
8.50% | 08/15/301 | 1,195,000 | 1,243,498 | |||||||
|
|
| ||||||||
| 6,968,156 | ||||||||||
|
|
| ||||||||
| Insurance — 0.98% |
| |||||||||
| Acrisure LLC/Acrisure Finance, Inc. |
| |||||||||
6.00% | 08/01/291 | 2,272,000 | 2,090,240 | |||||||
| Athene Global Funding |
| |||||||||
1.99% | 08/19/281 | 3,980,000 | 3,447,863 | |||||||
2.72% | 01/07/291 | 1,535,000 | 1,355,715 | |||||||
3.21% | 03/08/271 | 2,225,000 | 2,080,428 | |||||||
| Farmers Exchange Capital |
| |||||||||
7.20% | 07/15/481 | 150,000 | 138,602 | |||||||
| Farmers Exchange Capital II |
| |||||||||
6.15% | 11/01/531,4 | 2,500,000 | 2,232,913 | |||||||
| Farmers Insurance Exchange |
| |||||||||
4.75% | 11/01/571,4 | 3,800,000 | 2,821,160 | |||||||
8.63% | 05/01/241 | 942,000 | 943,019 | |||||||
| Nationwide Mutual Insurance Co. |
| |||||||||
7.88% | 12/15/241,4 | 3,825,000 | 3,825,355 | |||||||
| Teachers Insurance & Annuity Association of America |
| |||||||||
4.38% | 09/15/541,4 | 6,470,000 | 6,367,070 | |||||||
|
|
| ||||||||
| 25,302,365 | ||||||||||
|
|
| ||||||||
| Materials — 0.61% |
| |||||||||
| ASP Unifrax Holdings, Inc. |
| |||||||||
5.25% | 09/30/281 | 2,460,000 | 1,590,346 | |||||||
| Corp. Nacional del Cobre de Chile, |
| |||||||||
| Series REGS |
| |||||||||
| (Chile) |
| |||||||||
5.13% | 02/02/333 | 3,232,000 | 3,074,925 | |||||||
| Indonesia Asahan Aluminium PT/Mineral Industri Indonesia |
| |||||||||
| Persero PT, |
| |||||||||
| Series REGS |
| |||||||||
| (Indonesia) |
| |||||||||
5.45% | 05/15/303 | 3,600,000 | 3,562,560 | |||||||
| International Flavors & Fragrances, Inc. |
| |||||||||
2.30% | 11/01/301 | 7,835,000 | 6,512,114 | |||||||
3.27% | 11/15/401 | 130,000 | 92,643 | |||||||
3.47% | 12/01/501 | 605,000 | 403,536 | |||||||
4.38% | 06/01/47 | 150,000 | 116,300 | |||||||
| Issues | Maturity Date | Principal Amount | Value | |||||||
| CORPORATES (continued) |
| |||||||||
| Materials (continued) |
| |||||||||
5.00% | 09/26/48 | $ | 320,000 | $ | 273,888 | |||||
|
|
| ||||||||
| 15,626,312 | ||||||||||
|
|
| ||||||||
| Office REITs — 0.15% |
| |||||||||
| Hudson Pacific Properties LP |
| |||||||||
3.25% | 01/15/30 | 1,655,000 | 1,277,314 | |||||||
3.95% | 11/01/27 | 2,852,000 | 2,529,231 | |||||||
4.65% | 04/01/29 | 85,000 | 72,498 | |||||||
|
|
| ||||||||
| 3,879,043 | ||||||||||
|
|
| ||||||||
| Residential REITs — 0.23% |
| |||||||||
| American Homes 4 Rent LP |
| |||||||||
4.30% | 04/15/52 | 3,234,000 | 2,552,261 | |||||||
| Invitation Homes Operating Partnership LP |
| |||||||||
2.70% | 01/15/34 | 3,325,000 | 2,636,258 | |||||||
4.15% | 04/15/32 | 144,000 | 131,873 | |||||||
5.50% | 08/15/33 | 525,000 | 523,254 | |||||||
|
|
| ||||||||
| 5,843,646 | ||||||||||
|
|
| ||||||||
| Retail — 0.27% |
| |||||||||
| Ferrellgas LP/Ferrellgas Finance Corp. |
| |||||||||
5.88% | 04/01/291 | 2,874,000 | 2,741,940 | |||||||
| Michaels Cos., Inc. (The) |
| |||||||||
7.88% | 05/01/291 | 5,775,000 | 4,338,141 | |||||||
|
|
| ||||||||
| 7,080,081 | ||||||||||
|
|
| ||||||||
| Services — 0.31% |
| |||||||||
| Adtalem Global Education, Inc. |
| |||||||||
5.50% | 03/01/281 | 1,325,000 | 1,270,188 | |||||||
| Global Payments, Inc. |
| |||||||||
4.88% | 03/17/31 | 1,255,000 | 1,431,071 | |||||||
| Hertz Corp. (The) |
| |||||||||
5.00% | 12/01/291 | 1,650,000 | 1,278,750 | |||||||
| WASH Multifamily Acquisition, Inc. |
| |||||||||
5.75% | 04/15/261 | 605,000 | 591,624 | |||||||
| Waste Pro USA, Inc. |
| |||||||||
5.50% | 02/15/261 | 605,000 | 596,372 | |||||||
| Worldline SA |
| |||||||||
| (France) |
| |||||||||
0.00% | 07/30/263,11 | 28,200 | 2,759,198 | |||||||
|
|
| ||||||||
| 7,927,203 | ||||||||||
|
|
| ||||||||
| Specialized REITs — 0.46% |
| |||||||||
| Add Hero Holdings Ltd., |
| |||||||||
| Series IAI |
| |||||||||
| (United Kingdom) |
| |||||||||
8.50% | 09/30/293,12 | 411,561 | 11,561 | |||||||
9.00% | 09/30/303,13 | 316,586 | 7,915 | |||||||
9.80% | 09/30/313,14 | 411,561 | 9,309 | |||||||
| Annington Funding PLC |
| |||||||||
| (EMTN) |
| |||||||||
| (United Kingdom) |
| |||||||||
2.31% | 10/06/323 | 1,800,000 | 1,788,798 | |||||||
3.18% | 07/12/293 | 595,000 | 674,926 | |||||||
See accompanying Notes to Financial Statements.
| Annual Report March 2024 / 226 |
Table of Contents
Unconstrained Bond Fund
Schedule of Portfolio Investments
March 31, 2024
| Issues | Maturity Date | Principal Amount | Value | |||||||
| CORPORATES (continued) |
| |||||||||
| Specialized REITs (continued) |
| |||||||||
| Blackstone Property Partners Europe Holdings SARL |
| |||||||||
| (EMTN) |
| |||||||||
| (Luxembourg) |
| |||||||||
1.00% | 05/04/283 | $ | 1,340,000 | $ | 1,251,984 | |||||
1.63% | 04/20/303 | 1,355,000 | 1,221,274 | |||||||
1.75% | 03/12/293 | 1,225,000 | 1,153,994 | |||||||
| China Aoyuan Group Ltd., |
| |||||||||
| Series IAI |
| |||||||||
| (Cayman Islands) |
| |||||||||
0.00% | 09/30/283,11 | 58,465 | 1,170 | |||||||
5.50% | 09/30/313,8 | 239,908 | 3,644 | |||||||
| China Aoyuan Group Ltd., |
| |||||||||
| Series IAI (STEP-reset date 09/30/24) |
| |||||||||
| (Cayman Islands) |
| |||||||||
0.00%3,7 | 654,163 | 13,083 | ||||||||
| China SCE Group Holdings Ltd. |
| |||||||||
| (Cayman Islands) |
| |||||||||
7.00% | 05/02/253,5,6,9,10 | 1,070,000 | 61,525 | |||||||
| Extra Space Storage LP |
| |||||||||
2.35% | 03/15/32 | 2,750,000 | 2,202,006 | |||||||
| LEG Immobilien SE |
| |||||||||
| (EMTN) |
| |||||||||
| (Georgia) |
| |||||||||
0.88% | 03/30/333 | 400,000 | 330,296 | |||||||
1.50% | 01/17/343 | 100,000 | 85,492 | |||||||
| Realty Income Corp. |
| |||||||||
4.88% | 07/06/30 | 710,000 | 813,213 | |||||||
5.13% | 07/06/34 | 1,505,000 | 1,775,915 | |||||||
| Sunac China Holdings Ltd. |
| |||||||||
| (Cayman Islands) |
| |||||||||
1.00% | 09/30/321,3,5,6,8 | 354,827 | 23,064 | |||||||
6.00% | 09/30/251,3,5,6,15 | 294,186 | 34,567 | |||||||
6.25% | 09/30/261,3,5,6,16 | 294,543 | 30,780 | |||||||
6.50% | 09/30/271,3,5,6,17 | 589,800 | 54,262 | |||||||
6.75% | 09/30/281,3,5,6,18 | 885,773 | 72,633 | |||||||
7.00% | 09/30/291,3,5,6,19 | 886,844 | 64,296 | |||||||
7.25% | 09/30/301,3,5,6,20 | 417,092 | 26,902 | |||||||
| Times China Holdings Ltd. |
| |||||||||
| (Cayman Islands) |
| |||||||||
6.75% | 07/08/253,5,6,9,10 | 1,040,000 | 29,969 | |||||||
| Zhenro Properties Group Ltd. |
| |||||||||
| (Cayman Islands) |
| |||||||||
6.63% | 01/07/263,5,6,9,10 | 1,810,000 | 29,268 | |||||||
|
|
| ||||||||
| 11,771,846 | ||||||||||
|
|
| ||||||||
| Transportation — 0.07% |
| |||||||||
| American Airlines Pass-Through Trust, |
| |||||||||
| Series 2015-2, Class AA |
| |||||||||
3.60% | 09/22/27 | 1,761,185 | 1,668,098 | |||||||
| U.S. Airways Pass-Through Trust, |
| |||||||||
| Series 2012-1, Class A |
| |||||||||
5.90% | 10/01/24 | 42,483 | 42,483 | |||||||
|
|
| ||||||||
| 1,710,581 | ||||||||||
|
|
| ||||||||
| Issues | Maturity Date | Principal Amount | Value | |||||||
| CORPORATES (continued) |
| |||||||||
| Water — 0.07% |
| |||||||||
| Thames Water Utilities Finance PLC |
| |||||||||
| (EMTN) |
| |||||||||
| (United Kingdom) |
| |||||||||
4.38% | 01/18/313 | $ | 1,695,000 | $ | 1,707,107 | |||||
|
|
| ||||||||
Total Corporates (Cost $563,382,729) |
| 535,511,896 | ||||||||
|
|
| ||||||||
| FOREIGN GOVERNMENT OBLIGATIONS — 1.84% |
| |||||||||
Foreign Government Obligations — 1.84% |
| |||||||||
| Brazilian Government International Bond |
| |||||||||
| (Brazil) |
| |||||||||
6.00% | 10/20/333 | 1,230,000 | 1,220,529 | |||||||
6.13% | 03/15/343 | 1,310,000 | 1,297,817 | |||||||
| Colombia Government International Bond |
| |||||||||
| (Colombia) |
| |||||||||
3.00% | 01/30/303 | 1,598,000 | 1,325,062 | |||||||
3.13% | 04/15/313 | 2,027,000 | 1,623,424 | |||||||
8.00% | 04/20/333 | 200,000 | 211,720 | |||||||
| Costa Rica Government International Bond, |
| |||||||||
| Series REGS |
| |||||||||
| (Costa Rica) |
| |||||||||
6.55% | 04/03/343 | 650,000 | 673,530 | |||||||
| Dominican Republic International Bond |
| |||||||||
| (Dominican Republic) |
| |||||||||
4.50% | 01/30/301,3 | 3,900,000 | 3,558,750 | |||||||
| Dominican Republic International Bond, |
| |||||||||
| Series REGS |
| |||||||||
| (Dominican Republic) |
| |||||||||
4.88% | 09/23/323 | 600,000 | 538,966 | |||||||
| Finance Department Government of Sharjah |
| |||||||||
| (United Arab Emirates) |
| |||||||||
6.50% | 11/23/321,3 | 1,629,000 | 1,694,323 | |||||||
| Guatemala Government Bond, |
| |||||||||
| Series REGS |
| |||||||||
| (Guam) |
| |||||||||
5.25% | 08/10/293 | 3,050,000 | 2,959,044 | |||||||
| Hungary Government International Bond |
| |||||||||
| (Hungary) |
| |||||||||
2.13% | 09/22/311,3 | 4,200,000 | 3,340,680 | |||||||
| Mexico Government International Bond |
| |||||||||
| (Mexico) |
| |||||||||
2.66% | 05/24/313 | 4,731,000 | 3,958,475 | |||||||
6.35% | 02/09/353 | 2,850,000 | 2,944,335 | |||||||
| Oman Government International Bond, |
| |||||||||
| Series REGS |
| |||||||||
| (Oman) |
| |||||||||
5.63% | 01/17/283 | 2,640,000 | 2,656,896 | |||||||
| Panama Government International Bond |
| |||||||||
| (Panama) |
| |||||||||
2.25% | 09/29/323 | 1,000,000 | 716,452 | |||||||
3.16% | 01/23/303 | 3,321,000 | 2,767,846 | |||||||
| Paraguay Government International Bond, |
| |||||||||
| Series REGS |
| |||||||||
| (Papua New Guinea) |
| |||||||||
4.95% | 04/28/313 | 2,185,000 | 2,111,365 | |||||||
See accompanying Notes to Financial Statements.
| 227 / Annual Report March 2024 |
Table of Contents
Unconstrained Bond Fund
Schedule of Portfolio Investments
March 31, 2024
| Issues | Maturity Date | Principal Amount | Value | |||||||
| FOREIGN GOVERNMENT OBLIGATIONS (continued) |
| |||||||||
| Foreign Government Obligations (continued) |
| |||||||||
| Peruvian Government International Bond |
| |||||||||
| (Peru) |
| |||||||||
2.78% | 01/23/313 | $ | 3,860,000 | $ | 3,318,828 | |||||
| Republic of Poland Government International Bond |
| |||||||||
| (Poland) |
| |||||||||
4.88% | 10/04/333 | 2,670,000 | 2,633,154 | |||||||
| Republic of South Africa Government International Bond |
| |||||||||
| (South Africa) |
| |||||||||
4.30% | 10/12/283 | 827,000 | 744,217 | |||||||
4.85% | 09/30/293 | 1,283,000 | 1,153,037 | |||||||
5.88% | 06/22/303 | 875,000 | 812,700 | |||||||
5.88% | 04/20/323 | 1,064,000 | 960,324 | |||||||
| Romanian Government International Bond |
| |||||||||
| (Romania) |
| |||||||||
6.63% | 02/17/281,3 | 450,000 | 464,625 | |||||||
| Romanian Government International Bond, |
| |||||||||
| Series REGS |
| |||||||||
| (Romania) |
| |||||||||
3.00% | 02/14/313 | 4,400,000 | 3,699,960 | |||||||
|
|
| ||||||||
Total Foreign Government Obligations (Cost $50,658,215) |
| 47,386,059 | ||||||||
|
|
| ||||||||
| MORTGAGE-BACKED — 63.21%** |
| |||||||||
Non-Agency Commercial Mortgage-Backed — 9.32% |
| |||||||||
| 1345 Avenue of the Americas & Park Avenue Plaza Trust, |
| |||||||||
| Series 2005-1, Class A3 |
| |||||||||
5.28% | 08/10/351 | 7,801,704 | 7,439,327 | |||||||
| 245 Park Avenue Trust, |
| |||||||||
| Series 2017-245P, Class A |
| |||||||||
3.51% | 06/05/371 | 5,000,000 | 4,595,347 | |||||||
| A10 Bridge Asset Financing, |
| |||||||||
| Series 2021-D, Class A1FL |
| |||||||||
| (SOFR30A plus 1.45%) |
| |||||||||
6.77% | 10/01/381,2 | 3,301,536 | 3,197,645 | |||||||
| Banc of America Merrill Lynch Commercial Mortgage Trust, |
| |||||||||
| Series 2015-200P, Class D |
| |||||||||
3.60% | 04/14/331,4 | 3,407,500 | 3,225,238 | |||||||
| Banc of America Merrill Lynch Commercial Mortgage Trust, |
| |||||||||
| Series 2015-200P, Class F |
| |||||||||
3.60% | 04/14/331,4 | 4,000,000 | 3,728,785 | |||||||
| Banc of America Merrill Lynch Commercial Mortgage Trust, |
| |||||||||
| Series 2018-PARK, Class A |
| |||||||||
4.09% | 08/10/381,4 | 7,985,000 | 7,407,446 | |||||||
| Banc of America Merrill Lynch Commercial Mortgage Trust, |
| |||||||||
| Series 2020-BHP3, Class A |
| |||||||||
| (CME Term SOFR 1-Month plus 2.01%) |
| |||||||||
7.34%03/15/371,2 | 5,000,000 | 5,005,790 | ||||||||
| Banc of America Merrill Lynch Commercial Mortgage Trust, |
| |||||||||
| Series 2020-BOC, Class X (IO) |
| |||||||||
0.47% | 01/15/321,4 | 98,610,000 | 1,060,866 | |||||||
| Blackstone Industrial Portfolio - Proj Foxtrot |
| |||||||||
2.23% | 04/09/254,5,6 | 2,654,890 | 2,593,828 | |||||||
| BX Commercial Mortgage Trust, |
| |||||||||
| Series 2020-VIVA, Class D |
| |||||||||
3.55% | 03/11/441,4 | 5,000,000 | 4,309,891 | |||||||
| Issues | Maturity Date | Principal Amount | Value | |||||||
| MORTGAGE-BACKED (continued) |
| |||||||||
| Non-Agency Commercial Mortgage-Backed (continued) |
| |||||||||
| BX Commercial Mortgage Trust, |
| |||||||||
| Series 2021-XL2, Class J |
| |||||||||
| (CME Term SOFR 1-Month plus 4.00%) |
| |||||||||
9.33% | 10/15/381,2 | $ | 8,914,004 | $ | 8,597,726 | |||||
| BX Trust, |
| |||||||||
| Series 2019-OC11, Class A |
| |||||||||
3.20% | 12/09/411 | 7,060,000 | 6,288,963 | |||||||
| BX Trust, |
| |||||||||
| Series 2021-LBA, Class EJV |
| |||||||||
| (CME Term SOFR 1-Month plus 2.11%) |
| |||||||||
7.44% | 02/15/361,2 | 1,500,000 | 1,473,754 | |||||||
| BX Trust, |
| |||||||||
| Series 2024-PAT, Class A |
| |||||||||
| (CME Term SOFR 1-Month plus 2.09%) |
| |||||||||
7.34% | 03/15/261,2 | 5,236,000 | 5,239,105 | |||||||
| BXHPP Trust, |
| |||||||||
| Series 2021-FILM, Class E |
| |||||||||
| (CME Term SOFR 1-Month plus 2.11%) |
| |||||||||
7.44% | 08/15/361,2 | 3,917,000 | 3,511,225 | |||||||
| CAMB Commercial Mortgage Trust, |
| |||||||||
| Series 2019-LIFE, Class F |
| |||||||||
| (CME Term SOFR 1-Month plus 2.85%) |
| |||||||||
8.17% | 12/15/371,2 | 9,700,000 | 9,639,472 | |||||||
| CAMB Commercial Mortgage Trust, |
| |||||||||
| Series 2019-LIFE, Class G |
| |||||||||
| (CME Term SOFR 1-Month plus 3.55%) |
| |||||||||
8.87% | 12/15/371,2 | 8,503,000 | 8,337,823 | |||||||
| CD Mortgage Trust, |
| |||||||||
| Series 2016-CD1, Class XA (IO) |
| |||||||||
1.36% | 08/10/494 | 58,628,401 | 1,359,939 | |||||||
| Citigroup Commercial Mortgage Trust, |
| |||||||||
| Series 2015-GC27, Class XA (IO) |
| |||||||||
1.30% | 02/10/484 | 56,212,858 | 283,245 | |||||||
| Commercial Mortgage Trust, |
| |||||||||
| Series 2012-CR4, Class XA (IO) |
| |||||||||
1.14% | 10/15/454 | 8,525,699 | 887 | |||||||
| Commercial Mortgage Trust, |
| |||||||||
| Series 2014-CR16, Class XA (IO) |
| |||||||||
0.80% | 04/10/474 | 32,202,440 | 94,284 | |||||||
| Commercial Mortgage Trust, |
| |||||||||
| Series 2017-PANW, Class D |
| |||||||||
3.93% | 10/10/291,4 | 4,440,000 | 3,956,797 | |||||||
| Commercial Mortgage Trust, |
| |||||||||
| Series 2020-CBM, Class XCP (IO) |
| |||||||||
0.60% | 02/10/371,4 | 68,872,262 | 221,896 | |||||||
| Credit Suisse Mortgage Capital Trust, |
| |||||||||
| Series 2019-ICE4, Class D |
| |||||||||
| (CME Term SOFR 1-Month plus 1.65%) |
| |||||||||
6.97% | 05/15/361,2 | 5,700,817 | 5,697,815 | |||||||
| CSAIL Commercial Mortgage Trust, |
| |||||||||
| Series 2019-C16, Class XA (IO) |
| |||||||||
1.54% | 06/15/524 | 89,919,397 | 5,238,884 | |||||||
| CSMC, |
| |||||||||
| Series 2021-BPNY, Class A |
| |||||||||
| (CME Term SOFR 1-Month plus 3.83%) |
| |||||||||
9.15% | 08/15/261,2 | 12,734,000 | 11,455,767 | |||||||
See accompanying Notes to Financial Statements.
| Annual Report March 2024 / 228 |
Table of Contents
Unconstrained Bond Fund
Schedule of Portfolio Investments
March 31, 2024
| Issues | Maturity Date | Principal Amount | Value | |||||||
| MORTGAGE-BACKED (continued) |
| |||||||||
| Non-Agency Commercial Mortgage-Backed (continued) |
| |||||||||
| DOLP Trust, |
| |||||||||
| Series 2021-NYC, Class D |
| |||||||||
3.70% | 05/10/411,4 | $ | 4,740,000 | $ | 3,500,509 | |||||
| DROP Mortgage Trust, |
| |||||||||
| Series 2021-FILE, Class D |
| |||||||||
| (CME Term SOFR 1-Month plus 2.86%) |
| |||||||||
8.19% | 10/15/431,2 | 3,145,000 | 2,445,043 | |||||||
| Fontainebleau Miami Beach Trust, |
| |||||||||
| Series 2019-FBLU, Class F |
| |||||||||
3.96% | 12/10/361,4 | 2,410,000 | 2,337,340 | |||||||
| FREMF Mortgage Trust, |
| |||||||||
| Series 2019-KF71, Class B |
| |||||||||
| (SOFR30A plus 2.41%) |
| |||||||||
7.73% | 10/25/291,2 | 686,033 | 634,819 | |||||||
| FREMF Mortgage Trust, |
| |||||||||
| Series 2020-KF75, Class B |
| |||||||||
| (SOFR30A plus 2.36%) |
| |||||||||
7.68% | 12/25/291,2 | 1,328,890 | 1,222,570 | |||||||
| FREMF Mortgage Trust, |
| |||||||||
| Series 2020-KF88, Class C |
| |||||||||
| (SOFR30A plus 9.11%) |
| |||||||||
14.43% | 09/25/301,2 | 3,625,274 | 3,664,831 | |||||||
| Grace Trust, |
| |||||||||
| Series 2020-GRCE, Class A |
| |||||||||
2.35% | 12/10/401 | 8,000,000 | 6,519,086 | |||||||
| Grace Trust, |
| |||||||||
| Series 2020-GRCE, Class D |
| |||||||||
2.68% | 12/10/401,4 | 2,950,000 | 2,249,204 | |||||||
| GS Mortgage Securities Corp. Trust, |
| |||||||||
| Series 2020-UPTN, Class XA (IO) |
| |||||||||
0.35% | 02/10/371,4 | 40,999,000 | 79,475 | |||||||
| GS Mortgage Securities Corp. Trust, |
| |||||||||
| Series 2023-FUN, Class B |
| |||||||||
| (CME Term SOFR 1-Month plus 2.79%) |
| |||||||||
8.12% | 03/15/281,2 | 5,160,000 | 5,186,239 | |||||||
| GS Mortgage Securities Trust, |
| |||||||||
| Series 2014-GC20, Class XA (IO) |
| |||||||||
0.79% | 04/10/474 | 2,184,818 | 1,179 | |||||||
| GSCG Trust, |
| |||||||||
| Series 2019-600C, Class G |
| |||||||||
3.99% | 09/06/341,4 | 9,212,000 | 185,283 | |||||||
| Hilton USA Trust, |
| |||||||||
| Series 2016-HHV, Class F |
| |||||||||
4.19% | 11/05/381,4 | 7,840,000 | 7,246,927 | |||||||
| Hudson Yards Mortgage Trust, |
| |||||||||
| Series 2019-55HY, Class A |
| |||||||||
2.94% | 12/10/411,4 | 6,555,000 | 5,753,188 | |||||||
| Hudson Yards Mortgage Trust, |
| |||||||||
| Series 2019-55HY, Class F |
| |||||||||
2.94% | 12/10/411,4 | 6,891,000 | 5,060,794 | |||||||
| ILPT Commercial Mortgage Trust, |
| |||||||||
| Series 2022-LPFX, Class A |
| |||||||||
3.38% | 03/15/321 | 11,770,000 | 10,080,863 | |||||||
| Issues | Maturity Date | Principal Amount | Value | |||||||
| MORTGAGE-BACKED (continued) |
| |||||||||
| Non-Agency Commercial Mortgage-Backed (continued) |
| |||||||||
| JPMorgan Chase Commercial Mortgage Securities Trust, |
| |||||||||
| Series 2022-NLP, Class H |
| |||||||||
| (CME Term SOFR 1-Month plus 5.01%) |
| |||||||||
10.34% | 04/15/371,2 | $ | 5,320,724 | $ | 3,577,316 | |||||
| Life Mortgage Trust, |
| |||||||||
| Series 2021-BMR, Class G |
| |||||||||
| (CME Term SOFR 1-Month plus 3.06%) |
| |||||||||
8.39% | 03/15/381,2 | 7,095,079 | 6,860,080 | |||||||
| Med Trust, |
| |||||||||
| Series 2021-MDLN, Class F |
| |||||||||
| (CME Term SOFR 1-Month plus 4.11%) |
| |||||||||
9.44% | 11/15/381,2 | 6,468,954 | 6,471,875 | |||||||
| MF1 Ltd., |
| |||||||||
| Series 2020-FL4, Class B |
| |||||||||
| (CME Term SOFR 1-Month plus 2.86%) |
| |||||||||
8.19% | 11/15/351,2 | 6,000,000 | 6,004,441 | |||||||
| MF1 Ltd., |
| |||||||||
| Series 2020-FL4, Class D |
| |||||||||
| (CME Term SOFR 1-Month plus 4.21%) |
| |||||||||
9.54% | 11/15/351,2 | 4,481,000 | 4,402,036 | |||||||
| MKT Mortgage Trust, |
| |||||||||
| Series 2020-525M, Class C |
| |||||||||
2.94% | 02/12/401,4 | 4,970,000 | 3,413,348 | |||||||
| MKT Mortgage Trust, |
| |||||||||
| Series 2020-525M, Class D |
| |||||||||
2.94% | 02/12/401,4 | 7,500,000 | 4,781,780 | |||||||
| MKT Mortgage Trust, |
| |||||||||
| Series 2020-525M, Class XA (IO) |
| |||||||||
0.21% | 02/12/401,4 | 147,585,000 | 1,609,031 | |||||||
| Morgan Stanley Bank of America Merrill Lynch Trust, |
| |||||||||
| Series 2015-C22, Class XA (IO) |
| |||||||||
0.99% | 04/15/484 | 64,889,827 | 329,751 | |||||||
| Morgan Stanley Bank of America Merrill Lynch Trust, |
| |||||||||
| Series 2015-C24, Class XA (IO) |
| |||||||||
0.68% | 05/15/484 | 99,514,609 | 606,738 | |||||||
| Morgan Stanley Capital I Trust, |
| |||||||||
| Series 2018-MP, Class A |
| |||||||||
4.28% | 07/11/401,4 | 2,500,000 | 2,235,606 | |||||||
| Natixis Commercial Mortgage Securities Trust, |
| |||||||||
| Series 2018-ALXA, Class E |
| |||||||||
4.32% | 01/15/431,4 | 1,095,000 | 592,383 | |||||||
| NRTH Mortgage Trust, |
| |||||||||
| Series 2024-PARK, Class A |
| |||||||||
| (CME Term SOFR 1-Month plus 1.64%) |
| |||||||||
6.94% | 03/15/411,2 | 5,335,000 | 5,354,005 | |||||||
| One New York Plaza Trust, |
| |||||||||
| Series 2020-1NYP, Class AJ |
| |||||||||
| (CME Term SOFR 1-Month plus 1.36%) |
| |||||||||
6.69% | 01/15/361,2 | 2,630,000 | 2,505,876 | |||||||
| SFAVE Commercial Mortgage Securities Trust, |
| |||||||||
| Series 2015-5AVE, Class A2B |
| |||||||||
4.14% | 01/05/431,4 | 1,840,000 | 1,356,204 | |||||||
| SFAVE Commercial Mortgage Securities Trust, |
| |||||||||
| Series 2015-5AVE, Class C |
| |||||||||
4.39% | 01/05/431,4 | 10,000,000 | 5,804,369 | |||||||
See accompanying Notes to Financial Statements.
| 229 / Annual Report March 2024 |
Table of Contents
Unconstrained Bond Fund
Schedule of Portfolio Investments
March 31, 2024
| Issues | Maturity Date | Principal Amount | Value | |||||||
| MORTGAGE-BACKED (continued) |
| |||||||||
| Non-Agency Commercial Mortgage-Backed (continued) |
| |||||||||
| SFAVE Commercial Mortgage Securities Trust, |
| |||||||||
| Series 2015-5AVE, Class D |
| |||||||||
4.39% | 01/05/431,4 | $ | 13,330,000 | $ | 6,305,232 | |||||
| VMC Finance LLC, |
| |||||||||
| Series 2021-HT1, Class B |
| |||||||||
| (CME Term SOFR 1-Month plus 4.61%) |
| |||||||||
9.94% | 01/18/371,2 | 1,600,000 | 1,526,111 | |||||||
| Wells Fargo Commercial Mortgage Trust, |
| |||||||||
| Series 2014-LC16, Class XA (IO) |
| |||||||||
0.97% | 08/15/504 | 16,061,634 | 11,992 | |||||||
| Wells Fargo Commercial Mortgage Trust, |
| |||||||||
| Series 2016-C33, Class XA (IO) |
| |||||||||
1.56% | 03/15/594 | 74,041,085 | 1,662,314 | |||||||
| Westfield Galleria at Roseville |
| |||||||||
8.40% | 03/29/255,6 | 4,300,000 | 4,295,700 | |||||||
| WF-RBS Commercial Mortgage Trust, |
| |||||||||
| Series 2013-C14, Class XA (IO) |
| |||||||||
0.35% | 06/15/464 | 1,933,417 | 3,848 | |||||||
| WF-RBS Commercial Mortgage Trust, |
| |||||||||
| Series 2014-C23, Class XA (IO) |
| |||||||||
0.54% | 10/15/574 | 70,999,256 | 26,376 | |||||||
|
|
| ||||||||
| 239,865,507 | ||||||||||
|
|
| ||||||||
| Non-Agency Mortgage-Backed — 32.05% |
| |||||||||
| ACE Securities Corp. Home Equity Loan Trust, |
| |||||||||
| Series 2006-HE3, Class A2C |
| |||||||||
| (CME Term SOFR 1-Month plus 0.41%) |
| |||||||||
5.74% | 06/25/362 | 4,467,103 | 3,245,165 | |||||||
| ACE Securities Corp. Home Equity Loan Trust, |
| |||||||||
| Series 2006-NC3, Class A2C |
| |||||||||
| (CME Term SOFR 1-Month plus 0.43%) |
| |||||||||
5.76% | 12/25/362 | 51,518,363 | 13,741,045 | |||||||
| ACE Securities Corp. Home Equity Loan Trust, |
| |||||||||
| Series 2007-ASP1, Class A1 |
| |||||||||
| (CME Term SOFR 1-Month plus 0.43%) |
| |||||||||
5.76% | 03/25/372 | 27,610,825 | 12,408,945 | |||||||
| ACE Securities Corp. Home Equity Loan Trust, |
| |||||||||
| Series 2007-ASP1, Class A2D |
| |||||||||
| (CME Term SOFR 1-Month plus 0.87%) |
| |||||||||
6.20% | 03/25/372 | 2,193,523 | 858,128 | |||||||
| Adjustable Rate Mortgage Trust, |
| |||||||||
| Series 2005-4, Class 5A1 |
| |||||||||
4.20% | 08/25/354 | 1,153,596 | 917,251 | |||||||
| Adjustable Rate Mortgage Trust, |
| |||||||||
| Series 2007-1, Class 1A1 |
| |||||||||
5.35% | 03/25/374 | 1,042,518 | 859,749 | |||||||
| Alternative Loan Trust, |
| |||||||||
| Series 2005-74T1, Class A1 |
| |||||||||
6.00% | 01/25/36 | 5,166,242 | 2,936,052 | |||||||
| Alternative Loan Trust, |
| |||||||||
| Series 2005-76, Class 1A1 |
| |||||||||
| (Federal Reserve US 12-Month Cumulative Average plus 1.48%) |
| |||||||||
6.57% | 01/25/362 | 2,307,339 | 2,126,070 | |||||||
| Issues | Maturity Date | Principal Amount | Value | |||||||
| MORTGAGE-BACKED (continued) |
| |||||||||
| Non-Agency Mortgage-Backed (continued) |
| |||||||||
| Alternative Loan Trust, |
| |||||||||
| Series 2006-HY12, Class A5 |
| |||||||||
4.14% | 08/25/364 | $ | 1,933,986 | $ | 1,764,767 | |||||
| American Home Mortgage Investment Trust, |
| |||||||||
| Series 2006-1, Class 11A1 |
| |||||||||
| (CME Term SOFR 1-Month plus 0.39%) |
| |||||||||
5.72% | 03/25/462 | 7,771,141 | 6,628,379 | |||||||
| American Home Mortgage Investment Trust, |
| |||||||||
| Series 2006-1, Class 12A1 |
| |||||||||
| (CME Term SOFR 1-Month plus 0.51%) |
| |||||||||
5.84% | 03/25/462 | 2,409,054 | 2,055,759 | |||||||
| Argent Securities, Inc., Asset-Backed Pass-Through |
| |||||||||
| Certificates, |
| |||||||||
| Series 2006-W3, Class A2C |
| |||||||||
| (CME Term SOFR 1-Month plus 0.47%) |
| |||||||||
5.80% | 04/25/362 | 37,910,462 | 11,415,014 | |||||||
| Asset-Backed Funding Certificates, |
| |||||||||
| Series 2007-WMC1, Class A1A |
| |||||||||
| (CME Term SOFR 1-Month plus 1.36%) |
| |||||||||
6.69% | 06/25/372 | 15,743,110 | 11,366,211 | |||||||
| Asset-Backed Funding Certificates, |
| |||||||||
| Series 2007-WMC1, Class A2B |
| |||||||||
| (CME Term SOFR 1-Month plus 1.11%) |
| |||||||||
6.44% | 06/25/372 | 2,875,451 | 2,383,725 | |||||||
| Asset-Backed Securities Corp. Home Equity Loan Trust, |
| |||||||||
| Series 2004-HE9, Class M1 |
| |||||||||
| (CME Term SOFR 1-Month plus 1.09%) |
| |||||||||
6.42% | 12/25/342 | 1,021,117 | 923,505 | |||||||
| Asset-Backed Securities Corp. Home Equity Loan Trust, |
| |||||||||
| Series 2006-HE5, Class A5 |
| |||||||||
| (CME Term SOFR 1-Month plus 0.59%) |
| |||||||||
3.24% | 07/25/362 | 9,655,264 | 9,317,146 | |||||||
| Banc of America Alternative Loan Trust, |
| |||||||||
| Series 2003-8, Class 1CB1 |
| |||||||||
5.50% | 10/25/33 | 358,239 | 346,228 | |||||||
| Banc of America Funding Trust, |
| |||||||||
| Series 2006-D, Class 3A1 |
| |||||||||
4.42% | 05/20/364 | 562,489 | 522,277 | |||||||
| Banc of America Funding Trust, |
| |||||||||
| Series 2015-R3, Class 6A2 |
| |||||||||
5.26% | 05/27/361,4 | 8,613,319 | 8,054,812 | |||||||
| Banc of America Mortgage Trust, |
| |||||||||
| Series 2005-K, Class 2A1 |
| |||||||||
5.12% | 12/25/354 | 538,751 | 476,731 | |||||||
| BCAP LLC Trust, |
| |||||||||
| Series 2007-AA1, Class 2A1 |
| |||||||||
| (CME Term SOFR 1-Month plus 0.47%) |
| |||||||||
5.80% | 03/25/372 | 2,329,557 | 2,064,432 | |||||||
| BCAP LLC Trust, |
| |||||||||
| Series 2014-RR3, Class 4A1 |
| |||||||||
3.62% | 03/26/361,4 | 30,378 | 30,378 | |||||||
| Bear Stearns ALT-A Trust, |
| |||||||||
| Series 2005-2, Class 2A4 |
| |||||||||
4.12% | 04/25/354 | 683,927 | 619,120 | |||||||
See accompanying Notes to Financial Statements.
| Annual Report March 2024 / 230 |
Table of Contents
Unconstrained Bond Fund
Schedule of Portfolio Investments
March 31, 2024
| Issues | Maturity Date | Principal Amount | Value | |||||||
| MORTGAGE-BACKED (continued) |
| |||||||||
| Non-Agency Mortgage-Backed (continued) |
| |||||||||
| Bear Stearns ALT-A Trust, |
| |||||||||
| Series 2005-8, Class 11A1 |
| |||||||||
| (CME Term SOFR 1-Month plus 0.65%) |
| |||||||||
5.98% | 10/25/352 | $ | 4,739,586 | $ | 4,305,587 | |||||
| Bear Stearns ARM Trust, |
| |||||||||
| Series 2005-9, Class A1 |
| |||||||||
| (US Treasury Yield Curve Rate T Note Constant Maturity |
| |||||||||
| 1-Year plus 2.30%) |
| |||||||||
7.67% | 10/25/352 | 830,159 | 773,682 | |||||||
| Bear Stearns Asset-Backed Securities I Trust, |
| |||||||||
| Series 2005-AC6, Class 1A3 |
| |||||||||
5.50% | 09/25/354 | 247,685 | 239,309 | |||||||
| Bear Stearns Asset-Backed Securities I Trust, |
| |||||||||
| Series 2006-AC2, Class 21A3 |
| |||||||||
6.00% | 03/25/36 | 6,530 | 6,453 | |||||||
| Bear Stearns Mortgage Funding Trust, |
| |||||||||
| Series 2007-AR4, Class 1A1 |
| |||||||||
| (CME Term SOFR 1-Month plus 0.51%) |
| |||||||||
5.84% | 09/25/472 | 4,199,954 | 3,853,633 | |||||||
| Bear Stearns Mortgage Funding Trust, |
| |||||||||
| Series 2007-AR4, Class 2A1 |
| |||||||||
| (CME Term SOFR 1-Month plus 0.32%) |
| |||||||||
5.65% | 06/25/372 | 3,257,459 | 3,013,409 | |||||||
| Carrington Mortgage Loan Trust, |
| |||||||||
| Series 2006-NC4, Class A4 |
| |||||||||
| (CME Term SOFR 1-Month plus 0.35%) |
| |||||||||
5.68% | 10/25/362 | 14,364,300 | 12,868,634 | |||||||
| Carrington Mortgage Loan Trust, |
| |||||||||
| Series 2006-OPT1, Class M1 |
| |||||||||
| (CME Term SOFR 1-Month plus 0.64%) |
| |||||||||
5.97% | 02/25/362 | 652,783 | 643,092 | |||||||
| Cascade MH Asset Trust, |
| |||||||||
| Series 2022-MH1, Class A (STEP-reset date 05/25/24) |
| |||||||||
4.25% | 08/25/541 | 6,526,001 | 5,936,290 | |||||||
| Chase Mortgage Finance Trust, |
| |||||||||
| Series 2007-A1, Class 8A1 |
| |||||||||
5.81% | 02/25/374 | 347,703 | 334,213 | |||||||
| CIM Trust, |
| |||||||||
| Series 2019-R3, Class A |
| |||||||||
2.63% | 06/25/581,4 | 5,532,918 | 4,997,983 | |||||||
| CIM Trust, |
| |||||||||
| Series 2020-R1, Class A1 |
| |||||||||
2.85% | 10/27/591,4 | 9,554,790 | 8,321,321 | |||||||
| CIM Trust, |
| |||||||||
| Series 2020-R3, Class A1A |
| |||||||||
4.00% | 01/26/601,4 | 5,710,241 | 5,375,364 | |||||||
| CIM Trust, |
| |||||||||
| Series 2020-R6, Class A1A |
| |||||||||
2.25% | 12/25/601,4 | 4,584,266 | 3,998,477 | |||||||
| CIM Trust, |
| |||||||||
| Series 2020-R7, Class A1A |
| |||||||||
2.25% | 12/27/611,4 | 7,198,756 | 6,283,159 | |||||||
| CIM Trust, |
| |||||||||
| Series 2021-NR3, Class A1 (STEP-reset date 05/25/24) |
| |||||||||
2.57% | 06/25/571 | 2,438,032 | 2,408,752 | |||||||
| Issues | Maturity Date | Principal Amount | Value | |||||||
| MORTGAGE-BACKED (continued) |
| |||||||||
| Non-Agency Mortgage-Backed (continued) |
| |||||||||
| CIM Trust, |
| |||||||||
| Series 2021-NR4, Class A1 (STEP-reset date 05/25/24) |
| |||||||||
2.82% | 10/25/611 | $ | 10,558,576 | $ | 10,249,746 | |||||
| CIM Trust, |
| |||||||||
| Series 2021-R3, Class A1B |
| |||||||||
1.95% | 06/25/571,4 | 18,287,000 | 13,617,932 | |||||||
| CIM Trust, |
| |||||||||
| Series 2021-R4, Class A1A |
| |||||||||
2.00% | 05/01/611,4 | 9,507,815 | 8,327,085 | |||||||
| CIM Trust, |
| |||||||||
| Series 2021-R4, Class A1B |
| |||||||||
2.00% | 05/01/611,4 | 10,243,493 | 7,340,524 | |||||||
| CIM Trust, |
| |||||||||
| Series 2021-R5, Class A1A |
| |||||||||
2.00% | 08/25/611,4 | 8,382,899 | 6,977,650 | |||||||
| CIM Trust, |
| |||||||||
| Series 2023-NR1, Class A1 (STEP-reset date 05/25/24) |
| |||||||||
6.00% | 06/25/621 | 11,766,500 | 11,604,857 | |||||||
| CIM Trust, |
| |||||||||
| Series 2023-R1, Class A1A |
| |||||||||
5.40% | 04/25/621,4 | 12,046,987 | 11,570,491 | |||||||
| CIM Trust, |
| |||||||||
| Series 2023-R3, Class A1B |
| |||||||||
4.50% | 01/25/631,4 | 11,444,000 | 8,972,808 | |||||||
| Citigroup Mortgage Loan Trust, |
| |||||||||
| Series 2005-9, Class 1A1 |
| |||||||||
| (CME Term SOFR 1-Month plus 0.37%) |
| |||||||||
5.70% | 11/25/352 | 36,897 | 30,303 | |||||||
| Citigroup Mortgage Loan Trust, |
| |||||||||
| Series 2006-AR3, Class 1A2A |
| |||||||||
4.28% | 06/25/364 | 56,373 | 51,045 | |||||||
| Citigroup Mortgage Loan Trust, |
| |||||||||
| Series 2006-HE3, Class A2C |
| |||||||||
| (CME Term SOFR 1-Month plus 0.43%) |
| |||||||||
5.76% | 12/25/362 | 6,010,342 | 4,049,181 | |||||||
| Citigroup Mortgage Loan Trust, |
| |||||||||
| Series 2006-HE3, Class A2D |
| |||||||||
| (CME Term SOFR 1-Month plus 0.57%) |
| |||||||||
5.90% | 12/25/362 | 6,423,267 | 4,329,265 | |||||||
| Countrywide Home Loan Mortgage Pass-Through Trust, |
| |||||||||
| Series 2005-3, Class 1A2 |
| |||||||||
| (CME Term SOFR 1-Month plus 0.69%) |
| |||||||||
6.02% | 04/25/352 | 2,270,742 | 2,143,019 | |||||||
| Countrywide Home Loan Mortgage Pass-Through Trust, |
| |||||||||
| Series 2005-9, Class 1A1 |
| |||||||||
| (CME Term SOFR 1-Month plus 0.71%) |
| |||||||||
6.04% | 05/25/352 | 55,308 | 46,554 | |||||||
| Credit Suisse First Boston Mortgage Securities Corp., |
| |||||||||
| Series 2003-AR26, Class 3A1 |
| |||||||||
6.47% | 11/25/334 | 304,947 | 291,316 | |||||||
| Credit Suisse First Boston Mortgage Securities Corp., |
| |||||||||
| Series 2005-11, Class 1A1 |
| |||||||||
6.50% | 12/25/35 | 512,895 | 250,181 | |||||||
See accompanying Notes to Financial Statements.
| 231 / Annual Report March 2024 |
Table of Contents
Unconstrained Bond Fund
Schedule of Portfolio Investments
March 31, 2024
| Issues | Maturity Date | Principal Amount | Value | |||||||
| MORTGAGE-BACKED (continued) |
| |||||||||
| Non-Agency Mortgage-Backed (continued) |
| |||||||||
| Credit Suisse First Boston Mortgage-Backed Pass-Through |
| |||||||||
| Certificates, |
| |||||||||
| Series 2004-AR5, Class 9A1 |
| |||||||||
3.70% | 06/25/344 | $ | 27,791 | $ | 25,915 | |||||
| Credit Suisse Mortgage Capital Certificates, |
| |||||||||
| Series 2022-RPL1, Class CERT |
| |||||||||
4.23% | 04/25/611 | 465,614 | 395,636 | |||||||
| Credit Suisse Mortgage Capital Trust, |
| |||||||||
| Series 2006-8, Class 3A1 |
| |||||||||
6.00% | 10/25/21 | 20,143 | 5,624 | |||||||
| Credit Suisse Mortgage Capital Trust, |
| |||||||||
| Series 2020-RPL2, Class A12 |
| |||||||||
3.54% | 02/25/601,4 | 8,839,710 | 8,863,680 | |||||||
| Credit Suisse Mortgage Capital Trust, |
| |||||||||
| Series 2022-RPL1, Class PT |
| |||||||||
4.64% | 04/25/611,4 | 11,016,769 | 9,500,077 | |||||||
| Credit-Based Asset Servicing and Securitization LLC, |
| |||||||||
| Series 2006-CB2, Class AF3 (STEP-reset date 05/25/24) |
| |||||||||
3.05% | 12/25/36 | 623,946 | 539,022 | |||||||
| Credit-Based Asset Servicing and Securitization LLC, |
| |||||||||
| Series 2006-CB9, Class A2 |
| |||||||||
| (CME Term SOFR 1-Month plus 0.33%) |
| |||||||||
5.66% | 11/25/362 | 6,885,827 | 3,122,044 | |||||||
| Credit-Based Asset Servicing and Securitization LLC, |
| |||||||||
| Series 2007-CB1, Class AF2 (STEP-reset date 05/25/24) |
| |||||||||
3.19% | 01/25/37 | 2,421,564 | 720,554 | |||||||
| Credit-Based Asset Servicing and Securitization LLC, |
| |||||||||
| Series 2007-CB4, Class A1A |
| |||||||||
| (CME Term SOFR 1-Month plus 0.20%) |
| |||||||||
3.17% | 04/25/372 | 264,230 | 259,954 | |||||||
| Credit-Based Asset Servicing and Securitization LLC, |
| |||||||||
| Series 2007-CB5, Class A1 |
| |||||||||
| (CME Term SOFR 1-Month plus 0.17%) |
| |||||||||
3.39% | 04/25/372 | 1,234,117 | 756,467 | |||||||
| Credit-Based Asset Servicing and Securitization LLC, |
| |||||||||
| Mortgage Loan Trust, |
| |||||||||
| Series 2007-CB2, Class A2B (STEP-reset date 05/25/24) |
| |||||||||
3.57% | 02/25/37 | 3,954,775 | 2,396,929 | |||||||
| Credit-Based Asset Servicing and Securitization LLC, |
| |||||||||
| Mortgage Loan Trust, |
| |||||||||
| Series 2007-CB2, Class A2C (STEP-reset date 05/25/24) |
| |||||||||
3.57% | 02/25/37 | 946,543 | 568,795 | |||||||
| Credit-Based Asset Servicing and Securitization LLC, |
| |||||||||
| Mortgage Loan Trust, |
| |||||||||
| Series 2007-CB3, Class A3 (STEP-reset date 05/25/24) |
| |||||||||
3.32% | 03/25/37 | 5,253,024 | 1,910,719 | |||||||
| CSMC Mortgage-Backed Trust, |
| |||||||||
| Series 2006-1, Class 1A4 |
| |||||||||
5.50% | 02/25/36 | 2,564,275 | 2,242,611 | |||||||
| CSMC Trust, |
| |||||||||
| Series 2021-RPL7, Class A1 |
| |||||||||
1.93% | 07/27/611,4 | 7,218,663 | 6,936,225 | |||||||
| CSMCM Trust, |
| |||||||||
| Series 2018-SP3, Class CERT |
| |||||||||
4.53% | 10/25/581,4 | 12,193,597 | 10,366,898 | |||||||
| Issues | Maturity Date | Principal Amount | Value | |||||||
| MORTGAGE-BACKED (continued) |
| |||||||||
| Non-Agency Mortgage-Backed (continued) |
| |||||||||
| DSLA Mortgage Loan Trust, |
| |||||||||
| Series 2004-AR4, Class 2A1A |
| |||||||||
| (CME Term SOFR 1-Month plus 0.83%) |
| |||||||||
6.16% | 01/19/452 | $ | 413,571 | $ | 330,484 | |||||
| DSLA Mortgage Loan Trust, |
| |||||||||
| Series 2005-AR6, Class 2A1A |
| |||||||||
| (CME Term SOFR 1-Month plus 0.69%) |
| |||||||||
6.02% | 10/19/452 | 3,266,634 | 2,902,884 | |||||||
| DSLA Mortgage Loan Trust, |
| |||||||||
| Series 2006-AR2, Class 2A1A |
| |||||||||
| (CME Term SOFR 1-Month plus 0.31%) |
| |||||||||
5.64% | 10/19/362 | 5,207,187 | 3,323,811 | |||||||
| DSLA Mortgage Loan Trust, |
| |||||||||
| Series 2007-AR1, Class 2A1A |
| |||||||||
| (CME Term SOFR 1-Month plus 0.25%) |
| |||||||||
5.58% | 03/19/372 | 1,141,344 | 954,956 | |||||||
| Fannie Mae Connecticut Avenue Securities, |
| |||||||||
| Series 2019-R06, Class 2B1 |
| |||||||||
| (SOFR30A plus 3.86%) |
| |||||||||
9.18% | 09/25/391,2 | 5,559,451 | 5,786,155 | |||||||
| Fannie Mae Connecticut Avenue Securities, |
| |||||||||
| Series 2021-R01, Class 1B1 |
| |||||||||
| (SOFR30A plus 3.10%) |
| |||||||||
8.42% | 10/25/411,2 | 2,500,000 | 2,575,814 | |||||||
| First Franklin Mortgage Loan Trust, |
| |||||||||
| Series 2006-FF13, Class A2C |
| |||||||||
| (CME Term SOFR 1-Month plus 0.43%) |
| |||||||||
5.76% | 10/25/362 | 11,537,570 | 7,421,550 | |||||||
| First Franklin Mortgage Loan Trust, |
| |||||||||
| Series 2006-FF18, Class A2D |
| |||||||||
| (CME Term SOFR 1-Month plus 0.53%) |
| |||||||||
5.86% | 12/25/372 | 673,556 | 600,595 | |||||||
| First Franklin Mortgage Loan Trust, |
| |||||||||
| Series 2006-FF4, Class A3 |
| |||||||||
| (CME Term SOFR 1-Month plus 0.67%) |
| |||||||||
5.02% | 03/25/362 | 1,371,838 | 1,360,695 | |||||||
| First Franklin Mortgage Loan Trust, |
| |||||||||
| Series 2006-FF5, Class M1 |
| |||||||||
| (CME Term SOFR 1-Month plus 0.52%) |
| |||||||||
5.85% | 04/25/362 | 3,860,000 | 2,923,870 | |||||||
| First Franklin Mortgage Loan Trust, |
| |||||||||
| Series 2006-FF9, Class 2A4 |
| |||||||||
| (CME Term SOFR 1-Month plus 0.61%) |
| |||||||||
5.94% | 06/25/362 | 10,218,000 | 8,954,979 | |||||||
| First Franklin Mortgage Loan Trust, |
| |||||||||
| Series 2007-FF1, Class A2D |
| |||||||||
| (CME Term SOFR 1-Month plus 0.55%) |
| |||||||||
5.88% | 01/25/382 | 3,772,452 | 1,975,060 | |||||||
| First Franklin Mortgage Loan Trust, |
| |||||||||
| Series 2007-FF2, Class A2B |
| |||||||||
| (CME Term SOFR 1-Month plus 0.31%) |
| |||||||||
5.64% | 03/25/372 | 515,226 | 251,706 | |||||||
| First Horizon Alternative Mortgage Securities Trust, |
| |||||||||
| Series 2004-AA3, Class A1 |
| |||||||||
5.82% | 09/25/344 | 89,473 | 88,055 | |||||||
See accompanying Notes to Financial Statements.
| Annual Report March 2024 / 232 |
Table of Contents
Unconstrained Bond Fund
Schedule of Portfolio Investments
March 31, 2024
| Issues | Maturity Date | Principal Amount | Value | |||||||
| MORTGAGE-BACKED (continued) |
| |||||||||
| Non-Agency Mortgage-Backed (continued) |
| |||||||||
| First Horizon Alternative Mortgage Securities Trust, |
| |||||||||
| Series 2004-AA3, Class A3 |
| |||||||||
5.82% | 09/25/344 | $ | 137,582 | $ | 135,402 | |||||
| First Horizon Alternative Mortgage Securities Trust, |
| |||||||||
| Series 2005-AA10, Class 1A1 |
| |||||||||
6.19% | 12/25/354 | 665,391 | 551,362 | |||||||
| First Horizon Alternative Mortgage Securities Trust, |
| |||||||||
| Series 2005-AA12, Class 2A1 |
| |||||||||
5.72% | 02/25/364 | 866,544 | 575,620 | |||||||
| First Horizon Alternative Mortgage Securities Trust, |
| |||||||||
| Series 2005-AA3, Class 3A1 |
| |||||||||
6.74% | 05/25/354 | 828,698 | 747,864 | |||||||
| First Horizon Alternative Mortgage Securities Trust, |
| |||||||||
| Series 2005-AA7, Class 2A1 |
| |||||||||
6.08% | 09/25/354 | 1,123,741 | 980,356 | |||||||
| First Horizon Alternative Mortgage Securities Trust, |
| |||||||||
| Series 2005-AA8, Class 2A1 |
| |||||||||
5.87% | 10/25/354 | 1,453,002 | 903,772 | |||||||
| First Horizon Alternative Mortgage Securities Trust, |
| |||||||||
| Series 2005-AA9, Class 2A1 |
| |||||||||
6.16% | 11/25/354 | 814,328 | 694,389 | |||||||
| First Horizon Mortgage Pass-Through Trust, |
| |||||||||
| Series 2005-AR4, Class 1A1 |
| |||||||||
3.86% | 09/25/354 | 1,194,672 | 761,273 | |||||||
| First Horizon Mortgage Pass-Through Trust, |
| |||||||||
| Series 2005-AR4, Class 2A1 |
| |||||||||
4.94% | 10/25/354 | 37,845 | 35,060 | |||||||
| First Horizon Mortgage Pass-Through Trust, |
| |||||||||
| Series 2005-AR5, Class 2A1 |
| |||||||||
5.75% | 11/25/354 | 487,334 | 388,658 | |||||||
| First Horizon Mortgage Pass-Through Trust, |
| |||||||||
| Series 2007-AR2, Class 1A2 |
| |||||||||
5.81% | 08/25/374 | 52,119 | 17,900 | |||||||
| Freddie Mac Structured Agency Credit Risk Debt Notes, |
| |||||||||
| Series 2021-DNA2, Class M2 |
| |||||||||
| (SOFR30A plus 2.30%) |
| |||||||||
7.62% | 08/25/331,2 | 7,991,626 | 8,166,275 | |||||||
| Freddie Mac Structured Agency Credit Risk Debt Notes, |
| |||||||||
| Series 2021-DNA3, Class M2 |
| |||||||||
| (SOFR30A plus 2.10%) |
| |||||||||
7.42% | 10/25/331,2 | 4,245,000 | 4,327,681 | |||||||
| Freddie Mac Structured Agency Credit Risk Debt Notes, |
| |||||||||
| Series 2021-HQA1, Class M2 |
| |||||||||
| (SOFR30A plus 2.25%) |
| |||||||||
7.57% | 08/25/331,2 | 8,107,202 | 8,302,339 | |||||||
| Freddie Mac Structured Agency Credit Risk Debt Notes, |
| |||||||||
| Series 2021-HQA2, Class M2 |
| |||||||||
| (SOFR30A plus 2.05%) |
| |||||||||
7.37% | 12/25/331,2 | 4,970,957 | 5,040,500 | |||||||
| Freddie Mac Structured Agency Credit Risk Debt Notes, |
| |||||||||
| Series 2022-DNA1, Class M1B |
| |||||||||
| (SOFR30A plus 1.85%) |
| |||||||||
7.17% | 01/25/421,2 | 3,485,000 | 3,509,562 | |||||||
| GMACM Mortgage Corp. Loan Trust, |
| |||||||||
| Series 2005-AR5, Class 3A1 |
| |||||||||
4.27% | 09/19/354 | 896,991 | 702,855 | |||||||
| Issues | Maturity Date | Principal Amount | Value | |||||||
| MORTGAGE-BACKED (continued) |
| |||||||||
| Non-Agency Mortgage-Backed (continued) |
| |||||||||
| GMACM Mortgage Corp. Loan Trust, |
| |||||||||
| Series 2006-AR1, Class 1A1 |
| |||||||||
3.64% | 04/19/364 | $ | 2,618,231 | $ | 2,049,674 | |||||
| GreenPoint Manufactured Housing, |
| |||||||||
| Series 2000-1, Class A4 |
| |||||||||
8.14% | 03/20/304 | 4,103,597 | 2,728,309 | |||||||
| GreenPoint Mortgage Funding Trust, |
| |||||||||
| Series 2007-AR1, Class 2A1A |
| |||||||||
| (CME Term SOFR 1-Month plus 0.51%) |
| |||||||||
5.84% | 03/25/472 | 8,180,856 | 7,270,135 | |||||||
| GSAMP Trust, |
| |||||||||
| Series 2007-FM2, Class A1 |
| |||||||||
| (CME Term SOFR 1-Month plus 0.25%) |
| |||||||||
5.58% | 01/25/372 | 16,816,785 | 9,612,116 | |||||||
| GSR Mortgage Loan Trust, |
| |||||||||
| Series 2005-7F, Class 3A3 (IO) |
| |||||||||
| (-1.00 X CME Term SOFR 1-Month plus 5.39%, 5.50% Cap) |
| |||||||||
0.06% | 09/25/352,5,6 | 9,540 | 367 | |||||||
| GSR Mortgage Loan Trust, |
| |||||||||
| Series 2005-AR4, Class 5A1 |
| |||||||||
4.97% | 07/25/354 | 339,569 | 316,789 | |||||||
| GSR Mortgage Loan Trust, |
| |||||||||
| Series 2006-AR2, Class 2A1 |
| |||||||||
4.37% | 04/25/364 | 158,763 | 106,283 | |||||||
| HarborView Mortgage Loan Trust, |
| |||||||||
| Series 2005-10, Class 2A1A |
| |||||||||
| (CME Term SOFR 1-Month plus 0.73%) |
| |||||||||
6.06% | 11/19/352 | 870,320 | 600,458 | |||||||
| HarborView Mortgage Loan Trust, |
| |||||||||
| Series 2006-7, Class 1A |
| |||||||||
| (CME Term SOFR 1-Month plus 0.53%) |
| |||||||||
5.86% | 09/19/462 | 7,990,122 | 6,804,300 | |||||||
| HarborView Mortgage Loan Trust, |
| |||||||||
| Series 2007-6, Class 1A1A |
| |||||||||
| (CME Term SOFR 1-Month plus 0.31%) |
| |||||||||
5.64% | 08/19/372 | 8,796,640 | 7,569,815 | |||||||
| Home Equity Mortgage Loan Asset-Backed Trust, |
| |||||||||
| Series 2005-D, Class AII4 |
| |||||||||
| (CME Term SOFR 1-Month plus 0.81%) |
| |||||||||
6.14% | 03/25/362 | 818,202 | 807,891 | |||||||
| HSI Asset Securitization Corp. Trust, |
| |||||||||
| Series 2005-OPT1, Class M1 |
| |||||||||
| (CME Term SOFR 1-Month plus 0.74%) |
| |||||||||
6.07% | 11/25/352 | 815,558 | 800,610 | |||||||
| HSI Asset Securitization Corp. Trust, |
| |||||||||
| Series 2006-HE1, Class 1A1 |
| |||||||||
| (CME Term SOFR 1-Month plus 0.39%) |
| |||||||||
5.72% | 10/25/362 | 10,769,411 | 3,497,595 | |||||||
| HSI Asset Securitization Corp. Trust, |
| |||||||||
| Series 2006-HE2, Class 1A |
| |||||||||
| (CME Term SOFR 1-Month plus 0.37%) |
| |||||||||
5.70% | 12/25/362 | 26,072,369 | 10,375,856 | |||||||
| HSI Asset Securitization Corp. Trust, |
| |||||||||
| Series 2006-WMC1, Class A1 |
| |||||||||
| (CME Term SOFR 1-Month plus 0.21%) |
| |||||||||
5.54% | 07/25/362 | 9,820,310 | 4,252,313 | |||||||
See accompanying Notes to Financial Statements.
| 233 / Annual Report March 2024 |
Table of Contents
Unconstrained Bond Fund
Schedule of Portfolio Investments
March 31, 2024
| Issues | Maturity Date | Principal Amount | Value | |||||||
| MORTGAGE-BACKED (continued) |
| |||||||||
| Non-Agency Mortgage-Backed (continued) |
| |||||||||
| HSI Asset Securitization Corp. Trust, |
| |||||||||
| Series 2006-WMC1, Class A2 |
| |||||||||
| (CME Term SOFR 1-Month plus 0.31%) |
| |||||||||
5.64% | 07/25/362 | $ | 10,869,191 | $ | 4,739,086 | |||||
| HSI Asset Securitization Corp. Trust, |
| |||||||||
| Series 2006-WMC1, Class A4 |
| |||||||||
| (CME Term SOFR 1-Month plus 0.61%) |
| |||||||||
5.94% | 07/25/362 | 9,504,599 | 4,225,387 | |||||||
| Impac CMB Trust, |
| |||||||||
| Series 2005-2, Class 1A1 |
| |||||||||
| (CME Term SOFR 1-Month plus 0.63%) |
| |||||||||
5.96% | 04/25/352 | 1,582,293 | 1,490,677 | |||||||
| IndyMac Index Mortgage Loan Trust, |
| |||||||||
| Series 2005-AR14, Class 1A1A |
| |||||||||
| (CME Term SOFR 1-Month plus 0.67%) |
| |||||||||
6.00% | 07/25/352 | 7,731,070 | 5,544,500 | |||||||
| IndyMac Index Mortgage Loan Trust, |
| |||||||||
| Series 2005-AR19, Class A1 |
| |||||||||
3.71% | 10/25/354 | 1,693,044 | 1,343,313 | |||||||
| IndyMac Index Mortgage Loan Trust, |
| |||||||||
| Series 2006-AR27, Class 1A3 |
| |||||||||
| (CME Term SOFR 1-Month plus 0.65%) |
| |||||||||
5.98% | 10/25/362 | 4,829,125 | 1,993,999 | |||||||
| IndyMac Index Mortgage Loan Trust, |
| |||||||||
| Series 2006-AR4, Class A2A |
| |||||||||
| (CME Term SOFR 1-Month plus 0.61%) |
| |||||||||
5.94% | 05/25/462 | 9,680,932 | 9,321,197 | |||||||
| IndyMac Index Mortgage Loan Trust, |
| |||||||||
| Series 2006-AR9, Class 3A3 |
| |||||||||
3.39% | 06/25/364 | 2,561,667 | 2,116,836 | |||||||
| IndyMac Index Mortgage Loan Trust, |
| |||||||||
| Series 2007-FLX4, Class 2A1 |
| |||||||||
| (CME Term SOFR 1-Month plus 0.47%) |
| |||||||||
5.80% | 07/25/372 | 11,314,532 | 10,381,588 | |||||||
| IndyMac Manufactured Housing Contract Pass-Through |
| |||||||||
| Certificates, |
| |||||||||
| Series 1998-1, Class A4 |
| |||||||||
6.49% | 09/25/28 | 13,368 | 13,352 | |||||||
| JPMorgan Mortgage Acquisition Trust, |
| |||||||||
| Series 2006-CH1, Class M2 |
| |||||||||
| (CME Term SOFR 1-Month plus 0.55%) |
| |||||||||
5.88% | 07/25/362 | 184,061 | 183,822 | |||||||
| JPMorgan Mortgage Acquisition Trust, |
| |||||||||
| Series 2006-WMC4, Class A1A |
| |||||||||
| (CME Term SOFR 1-Month plus 0.24%) |
| |||||||||
5.57% | 12/25/362 | 6,790,025 | 4,157,445 | |||||||
| JPMorgan Mortgage Acquisition Trust, |
| |||||||||
| Series 2006-WMC4, Class A4 |
| |||||||||
| (CME Term SOFR 1-Month plus 0.26%) |
| |||||||||
5.59% | 12/25/362 | 8,576,048 | 4,441,719 | |||||||
| JPMorgan Mortgage Trust, |
| |||||||||
| Series 2005-A6, Class 7A1 |
| |||||||||
5.04% | 08/25/354 | 13,367 | 11,043 | |||||||
| JPMorgan Mortgage Trust, |
| |||||||||
| Series 2006-A3, Class 2A1 |
| |||||||||
4.91% | 05/25/364 | 15,503 | 12,996 | |||||||
| Issues | Maturity Date | Principal Amount | Value | |||||||
| MORTGAGE-BACKED (continued) |
| |||||||||
| Non-Agency Mortgage-Backed (continued) |
| |||||||||
| Legacy Mortgage Asset Trust, |
| |||||||||
| Series 2017-RPL1, Class A |
| |||||||||
| (CME Term SOFR 1-Month plus 1.86%) |
| |||||||||
7.19% | 01/28/701,2 | $ | 757,670 | $ | 759,682 | |||||
| Lehman XS Trust, |
| |||||||||
| Series 2005-5N, Class 3A1A |
| |||||||||
| (CME Term SOFR 1-Month plus 0.41%) |
| |||||||||
5.74% | 11/25/352 | 506,388 | 497,834 | |||||||
| Lehman XS Trust, |
| |||||||||
| Series 2006-17, Class 1A3 |
| |||||||||
| (CME Term SOFR 1-Month plus 0.61%) |
| |||||||||
5.94% | 08/25/462 | 11,419,868 | 9,914,827 | |||||||
| Lehman XS Trust, |
| |||||||||
| Series 2006-GP2, Class 1A5A |
| |||||||||
| (CME Term SOFR 1-Month plus 0.53%) |
| |||||||||
5.86% | 06/25/462 | 3,315,721 | 3,024,945 | |||||||
| Lehman XS Trust, |
| |||||||||
| Series 2007-18N, Class 1A1 |
| |||||||||
| (CME Term SOFR 1-Month plus 1.81%) |
| |||||||||
7.14% | 10/25/372 | 2,622,575 | 2,379,520 | |||||||
| Long Beach Mortgage Loan Trust, |
| |||||||||
| Series 2006-2, Class 1A |
| |||||||||
| (CME Term SOFR 1-Month plus 0.47%) |
| |||||||||
5.80% | 03/25/462 | 5,706,833 | 4,478,663 | |||||||
| Long Beach Mortgage Loan Trust, |
| |||||||||
| Series 2006-9, Class 2A2 |
| |||||||||
| (CME Term SOFR 1-Month plus 0.33%) |
| |||||||||
5.66% | 10/25/362 | 47,869,046 | 15,001,465 | |||||||
| MASTR Adjustable Rate Mortgages Trust, |
| |||||||||
| Series 2003-7, Class 3A1 |
| |||||||||
5.81% | 11/25/334 | 71,141 | 68,514 | |||||||
| MASTR Adjustable Rate Mortgages Trust, |
| |||||||||
| Series 2004-15, Class 8A1 |
| |||||||||
6.09% | 10/25/344 | 67,129 | 65,030 | |||||||
| MASTR Adjustable Rate Mortgages Trust, |
| |||||||||
| Series 2004-3, Class 3A3 |
| |||||||||
5.19% | 04/25/344 | 23,230 | 21,270 | |||||||
| MASTR Adjustable Rate Mortgages Trust, |
| |||||||||
| Series 2006-OA2, Class 1A1 |
| |||||||||
| (Federal Reserve US 12-Month Cumulative Average plus |
| |||||||||
| 0.80%) |
| |||||||||
5.89% | 12/25/462 | 15,460,421 | 11,128,167 | |||||||
| MASTR Asset-Backed Securities Trust, |
| |||||||||
| Series 2006-WMC1, Class A3 |
| |||||||||
| (CME Term SOFR 1-Month plus 0.47%) |
| |||||||||
5.80% | 02/25/362 | 15,810,103 | 5,433,256 | |||||||
| MASTR Asset-Backed Securities Trust, |
| |||||||||
| Series 2007-HE1, Class A4 |
| |||||||||
| (CME Term SOFR 1-Month plus 0.39%) |
| |||||||||
5.72% | 05/25/372 | 3,150,000 | 2,481,992 | |||||||
| MASTR Asset-Backed Securities Trust, |
| |||||||||
| Series 2007-WMC1, Class A2 |
| |||||||||
| (CME Term SOFR 1-Month plus 0.21%) |
| |||||||||
5.54% | 01/25/372 | 15,896,399 | 4,303,112 | |||||||
See accompanying Notes to Financial Statements.
| Annual Report March 2024 / 234 |
Table of Contents
Unconstrained Bond Fund
Schedule of Portfolio Investments
March 31, 2024
| Issues | Maturity Date | Principal Amount | Value | |||||||
| MORTGAGE-BACKED (continued) |
| |||||||||
| Non-Agency Mortgage-Backed (continued) |
| |||||||||
| Merrill Lynch Alternative Note Asset Trust, |
| |||||||||
| Series 2007-A3, Class A2D |
| |||||||||
| (CME Term SOFR 1-Month plus 0.77%) |
| |||||||||
6.10% | 04/25/372,5,6 | $ | 883,581 | $ | 41,078 | |||||
| Merrill Lynch Alternative Note Asset Trust, |
| |||||||||
| Series 2007-OAR2, Class A2 |
| |||||||||
| (CME Term SOFR 1-Month plus 0.53%) |
| |||||||||
5.86% | 04/25/372 | 6,677,218 | 5,381,966 | |||||||
| Merrill Lynch First Franklin Mortgage Loan Trust, |
| |||||||||
| Series 2007-1, Class A2C |
| |||||||||
| (CME Term SOFR 1-Month plus 0.61%) |
| |||||||||
5.94% | 04/25/372 | 16,171,124 | 6,388,029 | |||||||
| Merrill Lynch First Franklin Mortgage Loan Trust, |
| |||||||||
| Series 2007-4, Class 2A4 |
| |||||||||
| (CME Term SOFR 1-Month plus 0.61%) |
| |||||||||
5.94% | 07/25/372 | 406,889 | 361,697 | |||||||
| Merrill Lynch First Franklin Mortgage Loan Trust, |
| |||||||||
| Series 2007-5, Class 1A |
| |||||||||
| (CME Term SOFR 1-Month plus 0.96%) |
| |||||||||
6.29% | 10/25/372 | 21,854,561 | 12,773,077 | |||||||
| Merrill Lynch Mortgage Investors Trust, |
| |||||||||
| Series 2003-A6, Class 2A |
| |||||||||
6.30% | 10/25/334 | 62,618 | 62,209 | |||||||
| Merrill Lynch Mortgage Investors Trust, |
| |||||||||
| Series 2007-2, Class 1A1 |
| |||||||||
| (US Treasury Yield Curve Rate T Note Constant Maturity |
| |||||||||
| 1-Year plus 2.40%) |
| |||||||||
7.40% | 08/25/362 | 554,777 | 480,125 | |||||||
| Morgan Stanley ABS Capital I Trust, |
| |||||||||
| Series 2006-NC2, Class A2D |
| |||||||||
| (CME Term SOFR 1-Month plus 0.69%) |
| |||||||||
6.02% | 02/25/362 | 723,163 | 717,113 | |||||||
| Morgan Stanley ABS Capital I, Inc., Trust, |
| |||||||||
| Series 2006-HE4, Class A3 |
| |||||||||
| (CME Term SOFR 1-Month plus 0.41%) |
| |||||||||
5.74% | 06/25/362 | 8,781,118 | 4,609,452 | |||||||
| Morgan Stanley ABS Capital I, Inc., Trust, |
| |||||||||
| Series 2006-HE4, Class A4 |
| |||||||||
| (CME Term SOFR 1-Month plus 0.59%) |
| |||||||||
5.92% | 06/25/362 | 9,367,469 | 4,949,653 | |||||||
| Morgan Stanley ABS Capital I, Inc., Trust, |
| |||||||||
| Series 2007-NC3, Class A2C |
| |||||||||
| (CME Term SOFR 1-Month plus 0.30%) |
| |||||||||
5.63% | 05/25/372 | 19,818,660 | 14,810,802 | |||||||
| Morgan Stanley Home Equity Loan Trust, |
| |||||||||
| Series 2006-3, Class A4 |
| |||||||||
| (CME Term SOFR 1-Month plus 0.63%) |
| |||||||||
5.96% | 04/25/362 | 11,285,488 | 7,744,979 | |||||||
| Morgan Stanley Mortgage Loan Trust, |
| |||||||||
| Series 2004-7AR, Class 2A4 |
| |||||||||
5.39% | 09/25/344 | 127,358 | 122,840 | |||||||
| Morgan Stanley Mortgage Loan Trust, |
| |||||||||
| Series 2006-2, Class 1A |
| |||||||||
5.25% | 02/25/21 | 34,541 | 33,354 | |||||||
| Issues | Maturity Date | Principal Amount | Value | |||||||
| MORTGAGE-BACKED (continued) |
| |||||||||
| Non-Agency Mortgage-Backed (continued) |
| |||||||||
| MortgageIT Trust, |
| |||||||||
| Series 2005-2, Class 2A |
| |||||||||
| (CME Term SOFR 1-Month plus 1.76%) |
| |||||||||
7.09% | 05/25/352 | $ | 485,913 | $ | 451,201 | |||||
| New York Mortgage Trust, |
| |||||||||
| Series 2005-3, Class A1 |
| |||||||||
| (CME Term SOFR 1-Month plus 0.59%) |
| |||||||||
5.92% | 02/25/362 | 133,326 | 130,704 | |||||||
| Nomura Asset Acceptance Corp., |
| |||||||||
| Series 2005-AR4, Class 4A1 |
| |||||||||
5.22% | 08/25/354 | 1,998,580 | 1,533,943 | |||||||
| NRPL, |
| |||||||||
| Series 2019-3A, Class A1 (STEP-reset date 05/25/24) |
| |||||||||
7.00% | 07/25/591 | 7,710,497 | 7,778,803 | |||||||
| Oakwood Mortgage Investors, Inc., |
| |||||||||
| Series 2000-A, Class A5 |
| |||||||||
8.16% | 09/15/294 | 10,211,723 | 2,075,595 | |||||||
| Option One Mortgage Loan Trust, |
| |||||||||
| Series 2007-4, Class 2A2 |
| |||||||||
| (CME Term SOFR 1-Month plus 0.29%) |
| |||||||||
5.62% | 04/25/372 | 12,369,562 | 7,067,059 | |||||||
| Option One Mortgage Loan Trust, |
| |||||||||
| Series 2007-5, Class 2A2 |
| |||||||||
| (CME Term SOFR 1-Month plus 0.28%) |
| |||||||||
5.61% | 05/25/372 | 17,966,822 | 9,498,962 | |||||||
| Ownit Mortgage Loan Trust, |
| |||||||||
| Series 2006-2, Class A1 |
| |||||||||
| (CME Term SOFR 1-Month plus 0.53%) |
| |||||||||
5.86% | 01/25/372 | 3,151,284 | 3,036,678 | |||||||
| PHH Alternative Mortgage Trust, |
| |||||||||
| Series 2007-2, Class 1A4 |
| |||||||||
| (CME Term SOFR 1-Month plus 0.71%) |
| |||||||||
6.04% | 05/25/372 | 5,388,896 | 4,682,683 | |||||||
| Popular ABS Mortgage Pass-Through Trust, |
| |||||||||
| Series 2007-A, Class A3 |
| |||||||||
| (CME Term SOFR 1-Month plus 0.42%) |
| |||||||||
5.75% | 06/25/472 | 4,423,608 | 4,013,826 | |||||||
| PRET LLC, |
| |||||||||
| Series 2022-RN2, Class A2 (STEP-reset date 04/25/24) |
| |||||||||
6.50% | 06/25/521 | 16,833,000 | 15,953,984 | |||||||
| PRET, LLC, |
| |||||||||
| Series 2022-RN1, Class A1 (STEP-reset date 04/25/24) |
| |||||||||
3.72% | 07/25/511 | 13,705,467 | 13,368,448 | |||||||
| PRPM LLC, |
| |||||||||
| Series 2021-9, Class A1 (STEP-reset date 04/25/24) |
| |||||||||
2.36% | 10/25/261 | 13,419,438 | 13,108,656 | |||||||
| PRPM, LLC, |
| |||||||||
| Series 2021-8, Class A1 |
| |||||||||
1.74% | 09/25/261,4 | 7,687,059 | 7,408,990 | |||||||
| RAAC Trust, |
| |||||||||
| Series 2005-SP1, Class 4A1 |
| |||||||||
7.00% | 09/25/34 | 27,220 | 21,440 | |||||||
| Residential Accredit Loans Trust, |
| |||||||||
| Series 2005-QA13, Class 2A1 |
| |||||||||
5.28% | 12/25/354 | 1,253,660 | 1,074,330 | |||||||
See accompanying Notes to Financial Statements.
| 235 / Annual Report March 2024 |
Table of Contents
Unconstrained Bond Fund
Schedule of Portfolio Investments
March 31, 2024
| Issues | Maturity Date | Principal Amount | Value | |||||||
| MORTGAGE-BACKED (continued) |
| |||||||||
| Non-Agency Mortgage-Backed (continued) |
| |||||||||
| Residential Accredit Loans Trust, |
| |||||||||
| Series 2005-QA4, Class A41 |
| |||||||||
4.41% | 04/25/354 | $ | 1,370 | $ | 1,360 | |||||
| Residential Accredit Loans Trust, |
| |||||||||
| Series 2005-QA7, Class A21 |
| |||||||||
5.09% | 07/25/354 | 415,913 | 388,410 | |||||||
| Residential Accredit Loans Trust, |
| |||||||||
| Series 2005-QA8, Class CB21 |
| |||||||||
5.20% | 07/25/354 | 490,890 | 273,397 | |||||||
| Residential Accredit Loans Trust, |
| |||||||||
| Series 2006-QS13, Class 2A1 |
| |||||||||
5.75% | 09/25/21 | 2,372 | 1,200 | |||||||
| Residential Accredit Loans Trust, |
| |||||||||
| Series 2006-QS16, Class A6 |
| |||||||||
6.00% | 11/25/36 | 308,663 | 234,221 | |||||||
| Residential Accredit Loans Trust, |
| |||||||||
| Series 2007-QA3, Class A1 |
| |||||||||
| (CME Term SOFR 1-Month plus 0.31%) |
| |||||||||
5.64% | 05/25/372 | 13,382,284 | 12,286,386 | |||||||
| Residential Accredit Loans Trust, |
| |||||||||
| Series 2007-QH6, Class A1 |
| |||||||||
| (CME Term SOFR 1-Month plus 0.49%) |
| |||||||||
5.82% | 07/25/372 | 6,905,726 | 6,456,751 | |||||||
| Residential Accredit Loans Trust, |
| |||||||||
| Series 2007-QS1, Class 2AV (IO) |
| |||||||||
0.17% | 01/25/374,5,6 | 1,339,576 | 6,674 | |||||||
| Residential Asset Securitization Trust, |
| |||||||||
| Series 2006-A9CB, Class A9 |
| |||||||||
6.00% | 09/25/36 | 4,940,857 | 1,543,019 | |||||||
| Residential Funding Mortgage Securities Trust, |
| |||||||||
| Series 2007-SA2, Class 1A |
| |||||||||
4.74% | 04/25/374 | 187,465 | 97,653 | |||||||
| Saxon Asset Securities Trust, |
| |||||||||
| Series 2007-2, Class A2C |
| |||||||||
| (CME Term SOFR 1-Month plus 0.35%) |
| |||||||||
5.68% | 05/25/472 | 12,270,676 | 8,578,953 | |||||||
| Securitized Asset-Backed Receivables LLC Trust, |
| |||||||||
| Series 2006-CB1, Class AF4 (STEP-reset date 05/25/24) |
| |||||||||
2.84% | 01/25/36 | 3,457,769 | 2,806,465 | |||||||
| Securitized Asset-Backed Receivables LLC Trust, |
| |||||||||
| Series 2006-WM4, Class A1 |
| |||||||||
| (CME Term SOFR 1-Month plus 0.49%) |
| |||||||||
5.82% | 11/25/361,2 | 8,318,332 | 3,852,140 | |||||||
| Securitized Asset-Backed Receivables LLC Trust, |
| |||||||||
| Series 2007-BR2, Class A2 |
| |||||||||
| (CME Term SOFR 1-Month plus 0.57%) |
| |||||||||
5.90% | 02/25/372 | 5,690,423 | 2,512,897 | |||||||
| Securitized Asset-Backed Receivables LLC Trust, |
| |||||||||
| Series 2007-BR4, Class A2B |
| |||||||||
| (CME Term SOFR 1-Month plus 0.31%) |
| |||||||||
5.64% | 05/25/372 | 9,143,773 | 5,457,742 | |||||||
| Securitized Asset-Backed Receivables LLC Trust, |
| |||||||||
| Series 2007-NC1, Class A2B |
| |||||||||
| (CME Term SOFR 1-Month plus 0.41%) |
| |||||||||
5.74% | 12/25/362 | 5,362,747 | 2,596,334 | |||||||
| Issues | Maturity Date | Principal Amount | Value | |||||||
| MORTGAGE-BACKED (continued) |
| |||||||||
| Non-Agency Mortgage-Backed (continued) |
| |||||||||
| Soundview Home Loan Trust, |
| |||||||||
| Series 2007-OPT1, Class 2A3 |
| |||||||||
| (CME Term SOFR 1-Month plus 0.32%) |
| |||||||||
5.65% | 06/25/372 | $ | 17,466,267 | $ | 11,464,805 | |||||
| Soundview Home Loan Trust, |
| |||||||||
| Series 2007-WMC1, Class 3A3 |
| |||||||||
| (CME Term SOFR 1-Month plus 0.37%) |
| |||||||||
5.70% | 02/25/372 | 946,135 | 266,178 | |||||||
| Specialty Underwriting & Residential Finance Trust, |
| |||||||||
| Series 2007-BC2, Class A1 |
| |||||||||
| (CME Term SOFR 1-Month plus 0.34%) |
| |||||||||
5.67% | 04/25/372 | 18,839,182 | 13,292,245 | |||||||
| Structured Adjustable Rate Mortgage Loan Trust, |
| |||||||||
| Series 2004-12, Class 2A |
| |||||||||
5.59% | 09/25/344 | 254,887 | 245,291 | |||||||
| Structured Adjustable Rate Mortgage Loan Trust, |
| |||||||||
| Series 2004-2, Class 4A2 |
| |||||||||
5.98% | 03/25/344 | 548,508 | 526,222 | |||||||
| Structured Adjustable Rate Mortgage Loan Trust, |
| |||||||||
| Series 2005-12, Class 3A1 |
| |||||||||
5.69% | 06/25/354 | 184,361 | 158,892 | |||||||
| Structured Adjustable Rate Mortgage Loan Trust, |
| |||||||||
| Series 2005-7, Class 1A3 |
| |||||||||
5.08% | 04/25/354 | 1,789,696 | 1,607,912 | |||||||
| Structured Asset Investment Loan Trust, |
| |||||||||
| Series 2004-6, Class A3 |
| |||||||||
| (CME Term SOFR 1-Month plus 0.91%) |
| |||||||||
6.24% | 07/25/342 | 6,901,600 | 6,897,118 | |||||||
| Structured Asset Mortgage Investments II Trust, |
| |||||||||
| Series 2006-AR3, Class 22A1 |
| |||||||||
4.37% | 05/25/364 | 358,387 | 178,862 | |||||||
| Structured Asset Mortgage Investments II Trust, |
| |||||||||
| Series 2006-AR5, Class 1A1 |
| |||||||||
| (CME Term SOFR 1-Month plus 0.53%) |
| |||||||||
5.86% | 05/25/362 | 174,179 | 112,039 | |||||||
| Structured Asset Mortgage Investments II Trust, |
| |||||||||
| Series 2006-AR7, Class A1BG |
| |||||||||
| (CME Term SOFR 1-Month plus 0.23%) |
| |||||||||
5.56% | 08/25/362 | 5,743,125 | 4,885,445 | |||||||
| Structured Asset Securities Corp. Mortgage Loan Trust, |
| |||||||||
| Series 2005-2XS, Class 2A2 |
| |||||||||
| (CME Term SOFR 1-Month plus 1.61%) |
| |||||||||
6.94% | 02/25/352 | 25,887 | 26,320 | |||||||
| Structured Asset Securities Corp. Mortgage Loan Trust, |
| |||||||||
| Series 2005-4XS, Class 2A1A |
| |||||||||
| (CME Term SOFR 1-Month plus 1.86%) |
| |||||||||
7.19% | 03/25/352 | 724,794 | 693,700 | |||||||
| Structured Asset Securities Corp. Mortgage Pass-Through |
| |||||||||
| Certificates, |
| |||||||||
| Series 2003-34A, Class 3A3 |
| |||||||||
5.89% | 11/25/334 | 13,051 | 12,893 | |||||||
| SunTrust Adjustable Rate Mortgage Loan Trust, |
| |||||||||
| Series 2007-4, Class 3A1 |
| |||||||||
4.42% | 10/25/374 | 629,768 | 559,177 | |||||||
See accompanying Notes to Financial Statements.
| Annual Report March 2024 / 236 |
Table of Contents
Unconstrained Bond Fund
Schedule of Portfolio Investments
March 31, 2024
| Issues | Maturity Date | Principal Amount | Value | |||||||
| MORTGAGE-BACKED (continued) |
| |||||||||
| Non-Agency Mortgage-Backed (continued) |
| |||||||||
| SunTrust Adjustable Rate Mortgage Loan Trust, |
| |||||||||
| Series 2007-S1, Class 5A1 |
| |||||||||
5.37% | 01/25/374 | $ | 29,752 | $ | 28,043 | |||||
| Towd Point Mortgage Trust, |
| |||||||||
| Series 2017-4, Class B1 |
| |||||||||
3.66% | 06/25/571,4 | 8,650,000 | 7,353,077 | |||||||
| Towd Point Mortgage Trust, |
| |||||||||
| Series 2019-1, Class B1 |
| |||||||||
3.79% | 03/25/581,4 | 7,087,000 | 5,658,366 | |||||||
| VOLT XCIV LLC, |
| |||||||||
| Series 2021-NPL3, Class A1 (STEP-reset date 04/25/24) |
| |||||||||
5.24% | 02/27/511 | 7,628,383 | 7,470,015 | |||||||
| WaMu Asset-Backed Certificates, |
| |||||||||
| Series 2007-HE1, Class 2A2 |
| |||||||||
| (CME Term SOFR 1-Month plus 0.22%) |
| |||||||||
5.55% | 01/25/372 | 5,009,049 | 2,343,741 | |||||||
| WaMu Asset-Backed Certificates, |
| |||||||||
| Series 2007-HE2, Class 2A2 |
| |||||||||
| (CME Term SOFR 1-Month plus 0.33%) |
| |||||||||
5.66% | 02/25/372 | 27,797,532 | 8,316,844 | |||||||
| WaMu Mortgage Pass-Through Certificates, |
| |||||||||
| Series 2004-AR13, Class A1A |
| |||||||||
| (CME Term SOFR 1-Month plus 0.83%) |
| |||||||||
6.16% | 11/25/342 | 93,847 | 91,581 | |||||||
| WaMu Mortgage Pass-Through Certificates, |
| |||||||||
| Series 2004-AR14, Class A1 |
| |||||||||
5.31% | 01/25/354 | 293,016 | 278,161 | |||||||
| WaMu Mortgage Pass-Through Certificates, |
| |||||||||
| Series 2004-AR6, Class A |
| |||||||||
| (CME Term SOFR 1-Month plus 0.95%) |
| |||||||||
6.28% | 05/25/442 | 386 | 386 | |||||||
| WaMu Mortgage Pass-Through Certificates, |
| |||||||||
| Series 2005-AR14, Class 2A1 |
| |||||||||
4.72% | 12/25/354 | 10,051 | 8,950 | |||||||
| WaMu Mortgage Pass-Through Certificates, |
| |||||||||
| Series 2005-AR16, Class 1A3 |
| |||||||||
4.86% | 12/25/354 | 790,154 | 706,889 | |||||||
| WaMu Mortgage Pass-Through Certificates, |
| |||||||||
| Series 2005-AR2, Class 2A21 |
| |||||||||
| (CME Term SOFR 1-Month plus 0.77%) |
| |||||||||
6.10% | 01/25/452 | 291,452 | 284,738 | |||||||
| WaMu Mortgage Pass-Through Certificates, |
| |||||||||
| Series 2006-AR3, Class A1A |
| |||||||||
| (Federal Reserve US 12-Month Cumulative Average plus |
| |||||||||
| 1.00%) |
| |||||||||
6.09% | 02/25/462 | 2,921,459 | 2,558,763 | |||||||
| WaMu Mortgage Pass-Through Certificates, |
| |||||||||
| Series 2006-AR4, Class 1A1A |
| |||||||||
| (Federal Reserve US 12-Month Cumulative Average plus |
| |||||||||
| 0.94%) |
| |||||||||
4.49% | 05/25/462 | 1,243,878 | 1,122,678 | |||||||
| WaMu Mortgage Pass-Through Certificates, |
| |||||||||
| Series 2006-AR7, Class 2A |
| |||||||||
| (Federal Reserve US 12-Month Cumulative Average plus |
| |||||||||
| 0.98%) |
| |||||||||
6.07% | 07/25/462 | 2,600,220 | 2,244,395 | |||||||
| Issues | Maturity Date | Principal Amount | Value | |||||||
| MORTGAGE-BACKED (continued) |
| |||||||||
| Non-Agency Mortgage-Backed (continued) |
| |||||||||
| WaMu Mortgage Pass-Through Certificates, |
| |||||||||
| Series 2007-HY3, Class 1A1 |
| |||||||||
3.91% | 03/25/374 | $ | 1,454,640 | $ | 1,144,163 | |||||
| WaMu Mortgage Pass-Through Certificates, |
| |||||||||
| Series 2007-OC1, Class A1 |
| |||||||||
| (CME Term SOFR 1-Month plus 0.59%) |
| |||||||||
5.92% | 01/25/472 | 4,123,330 | 3,836,662 | |||||||
| Wells Fargo Alternative Loan Trust, |
| |||||||||
| Series 2007-PA5, Class 1A1 |
| |||||||||
6.25% | 11/25/37 | 1,153,266 | 984,877 | |||||||
| Wells Fargo Home Equity Asset-Backed Securities Trust, |
| |||||||||
| Series 2007-1, Class A3 |
| |||||||||
| (CME Term SOFR 1-Month plus 0.75%) |
| |||||||||
6.08% | 03/25/372 | 4,690,000 | 4,219,338 | |||||||
| Wells Fargo Mortgage-Backed Securities Trust, |
| |||||||||
| Series 2006-AR14, Class 2A1 |
| |||||||||
6.37% | 10/25/364 | 242,905 | 228,309 | |||||||
| Wells Fargo Mortgage-Backed Securities Trust, |
| |||||||||
| Series 2006-AR4, Class 1A1 |
| |||||||||
6.09% | 04/25/364 | 65,350 | 60,499 | |||||||
|
|
| ||||||||
| 825,145,436 | ||||||||||
|
|
| ||||||||
| U.S. Agency Commercial Mortgage-Backed — 1.03% |
| |||||||||
| Fannie Mae-Aces, |
| |||||||||
| Series 2016-M11, Class X2 (IO) |
| |||||||||
3.05% | 07/25/394 | 9,952,834 | 145,987 | |||||||
| Fannie Mae-Aces, |
| |||||||||
| Series 2016-M2, Class X3 (IO) |
| |||||||||
2.04% | 04/25/364 | 5,282,796 | 46,980 | |||||||
| Fannie Mae-Aces, |
| |||||||||
| Series 2016-M4, Class X2 (IO) |
| |||||||||
2.68% | 01/25/394 | 19,406,863 | 105,208 | |||||||
| Fannie Mae-Aces, |
| |||||||||
| Series 2019-M29, Class X4 (IO) |
| |||||||||
0.70% | 03/25/294 | 117,375,779 | 3,086,214 | |||||||
| Freddie Mac Multifamily PC REMIC Trust, |
| |||||||||
| Series 2019-P002, Class X (IO) |
| |||||||||
0.89% | 07/25/334 | 14,520,699 | 1,082,623 | |||||||
| Freddie Mac Multifamily Structured Pass-Through |
| |||||||||
| Certificates, |
| |||||||||
| Series K041, Class X3 (IO) |
| |||||||||
1.64% | 11/25/424 | 160,569,309 | 1,518,777 | |||||||
| Freddie Mac Multifamily Structured Pass-Through |
| |||||||||
| Certificates, |
| |||||||||
| Series K043, Class X3 (IO) |
| |||||||||
1.63% | 02/25/434 | 58,000,000 | 700,593 | |||||||
| Freddie Mac Multifamily Structured Pass-Through |
| |||||||||
| Certificates, |
| |||||||||
| Series K051, Class X3 (IO) |
| |||||||||
1.61% | 10/25/434 | 44,865,280 | 1,066,430 | |||||||
| Freddie Mac Multifamily Structured Pass-Through |
| |||||||||
| Certificates, |
| |||||||||
| Series K053, Class X3 (IO) |
| |||||||||
1.64% | 03/25/444 | 78,150,000 | 2,283,719 | |||||||
See accompanying Notes to Financial Statements.
| 237 / Annual Report March 2024 |
Table of Contents
Unconstrained Bond Fund
Schedule of Portfolio Investments
March 31, 2024
| Issues | Maturity Date | Principal Amount | Value | |||||||
| MORTGAGE-BACKED (continued) |
| |||||||||
| U.S. Agency Commercial Mortgage-Backed (continued) |
| |||||||||
| Freddie Mac Multifamily Structured Pass-Through |
| |||||||||
| Certificates, |
| |||||||||
| Series K054, Class X1 (IO) |
| |||||||||
1.15% | 01/25/264 | $ | 51,005,396 | $ | 831,263 | |||||
| Freddie Mac Multifamily Structured Pass-Through |
| |||||||||
| Certificates, |
| |||||||||
| Series K055, Class X3 (IO) |
| |||||||||
1.65% | 04/25/444 | 32,000,000 | 964,368 | |||||||
| Freddie Mac Multifamily Structured Pass-Through |
| |||||||||
| Certificates, |
| |||||||||
| Series K056, Class X1 (IO) |
| |||||||||
1.24% | 05/25/264 | 53,250,116 | 1,160,850 | |||||||
| Freddie Mac Multifamily Structured Pass-Through |
| |||||||||
| Certificates, |
| |||||||||
| Series K057, Class X1 (IO) |
| |||||||||
1.16% | 07/25/264 | 117,241,969 | 2,340,630 | |||||||
| Freddie Mac Multifamily Structured Pass-Through |
| |||||||||
| Certificates, |
| |||||||||
| Series K726, Class X1 (IO) |
| |||||||||
0.94% | 04/25/244 | 13,971,318 | 1,122 | |||||||
| Freddie Mac Multifamily Structured Pass-Through |
| |||||||||
| Certificates, |
| |||||||||
| Series KC05, Class X1 (IO) |
| |||||||||
1.23% | 06/25/274 | 81,251,534 | 1,674,123 | |||||||
| Freddie Mac Multifamily Structured Pass-Through |
| |||||||||
| Certificates, |
| |||||||||
| Series KC07, Class X1 (IO) |
| |||||||||
0.72% | 09/25/264 | 81,633,683 | 894,546 | |||||||
| Freddie Mac Multifamily Structured Pass-Through |
| |||||||||
| Certificates, |
| |||||||||
| Series KIR1, Class X (IO) |
| |||||||||
1.02% | 03/25/264 | 109,604,689 | 1,805,526 | |||||||
| Freddie Mac Multifamily Structured Pass-Through |
| |||||||||
| Certificates, |
| |||||||||
| Series KL05, Class X1HG (IO) |
| |||||||||
1.22% | 12/25/274 | 49,531,000 | 1,576,740 | |||||||
| Freddie Mac Multifamily Structured Pass-Through |
| |||||||||
| Certificates, |
| |||||||||
| Series KS06, Class X (IO) |
| |||||||||
1.02% | 08/25/264 | 63,998,421 | 937,494 | |||||||
| Freddie Mac Multifamily Structured Pass-Through |
| |||||||||
| Certificates, |
| |||||||||
| Series KS07, Class X (IO) |
| |||||||||
0.61% | 09/25/254 | 98,211,639 | 833,974 | |||||||
| Ginnie Mae, |
| |||||||||
| Series 2011-152, Class IO (IO) |
| |||||||||
0.00% | 08/16/514 | 4,536,132 | 79 | |||||||
| Ginnie Mae, |
| |||||||||
| Series 2012-112, Class IO (IO) |
| |||||||||
0.11% | 02/16/534 | 18,537,514 | 36,530 | |||||||
| Ginnie Mae, |
| |||||||||
| Series 2012-78, Class IO (IO) |
| |||||||||
0.08% | 06/16/524 | 28,339,078 | 15,727 | |||||||
| Ginnie Mae, |
| |||||||||
| Series 2014-103, Class IO (IO) |
| |||||||||
0.19% | 05/16/554 | 13,904,166 | 87,289 | |||||||
| Issues | Maturity Date | Principal Amount | Value | |||||||
| MORTGAGE-BACKED (continued) |
| |||||||||
| U.S. Agency Commercial Mortgage-Backed (continued) |
| |||||||||
| Ginnie Mae, |
| |||||||||
| Series 2014-125, Class IO (IO) |
| |||||||||
0.90% | 11/16/544 | $ | 8,395,164 | $ | 177,136 | |||||
| Ginnie Mae, |
| |||||||||
| Series 2023-127, Class IO (IO) |
| |||||||||
0.42% | 07/16/574 | 187,003,661 | 3,164,177 | |||||||
|
|
| ||||||||
| 26,538,105 | ||||||||||
|
|
| ||||||||
| U.S. Agency Mortgage-Backed — 20.81% |
| |||||||||
| Fannie Mae Pool FS1598 |
| |||||||||
2.00% | 04/01/52 | 15,851,636 | 12,553,325 | |||||||
| Fannie Mae Pool FS6943 |
| |||||||||
3.00% | 06/01/52 | 25,336,616 | 21,827,499 | |||||||
| Fannie Mae Pool MA4563 |
| |||||||||
2.50% | 03/01/52 | 25,609,000 | 21,203,537 | |||||||
| Fannie Mae Pool MA4733 |
| |||||||||
4.50% | 09/01/52 | 17,900,736 | 17,057,793 | |||||||
| Fannie Mae Pool MA5037 |
| |||||||||
4.50% | 06/01/53 | 2,151,928 | 2,048,724 | |||||||
| Fannie Mae REMICS, |
| |||||||||
| Series 2006-11, Class PS |
| |||||||||
| (-3.67 X SOFR30A plus 24.15%, 24.57% Cap) |
| |||||||||
4.64% | 03/25/362 | 10,068 | 10,865 | |||||||
| Fannie Mae REMICS, |
| |||||||||
| Series 2006-8, Class HJ (IO) |
| |||||||||
| (-1.00 X SOFR30A plus 6.49%, 6.60% Cap) |
| |||||||||
1.17% | 03/25/362 | 408,447 | 34,939 | |||||||
| Fannie Mae REMICS, |
| |||||||||
| Series 2007-52, Class LS (IO) |
| |||||||||
| (-1.00 X SOFR30A plus 5.94%, 6.05% Cap) |
| |||||||||
0.62% | 06/25/372 | 21,693 | 1,100 | |||||||
| Fannie Mae REMICS, |
| |||||||||
| Series 2007-77, Class SK (IO) |
| |||||||||
| (-1.00 X SOFR30A plus 5.76%, 5.87% Cap) |
| |||||||||
0.44% | 08/25/372 | 46,586 | 3,147 | |||||||
| Fannie Mae REMICS, |
| |||||||||
| Series 2007-88, Class JI (IO) |
| |||||||||
| (-1.00 X SOFR30A plus 6.34%, 6.45% Cap) |
| |||||||||
1.02% | 04/25/372 | 441,682 | 39,189 | |||||||
| Fannie Mae REMICS, |
| |||||||||
| Series 2008-18, Class SM (IO) |
| |||||||||
| (-1.00 X SOFR30A plus 6.89%, 7.00% Cap) |
| |||||||||
1.57% | 03/25/382 | 32,233 | 3,314 | |||||||
| Fannie Mae REMICS, |
| |||||||||
| Series 2008-62, Class SN (IO) |
| |||||||||
| (-1.00 X SOFR30A plus 6.09%, 6.20% Cap) |
| |||||||||
0.77% | 07/25/382 | 61,359 | 3,457 | |||||||
| Fannie Mae REMICS, |
| |||||||||
| Series 2010-116, Class SE (IO) |
| |||||||||
| (-1.00 X SOFR30A plus 6.49%, 6.60% Cap) |
| |||||||||
1.17% | 10/25/402 | 24,230 | 2,337 | |||||||
| Fannie Mae REMICS, |
| |||||||||
| Series 2013-5, Class GF |
| |||||||||
| (SOFR30A plus 1.21%) |
| |||||||||
5.00% | 10/25/422 | 124,529 | 120,320 | |||||||
See accompanying Notes to Financial Statements.
| Annual Report March 2024 / 238 |
Table of Contents
Unconstrained Bond Fund
Schedule of Portfolio Investments
March 31, 2024
| Issues | Maturity Date | Principal Amount | Value | |||||||
| MORTGAGE-BACKED (continued) |
| |||||||||
| U.S. Agency Mortgage-Backed (continued) |
| |||||||||
| Fannie Mae REMICS, |
| |||||||||
| Series 2014-49, Class CF |
| |||||||||
| (SOFR30A plus 1.11%) |
| |||||||||
6.00% | 07/25/432 | $ | 4,570,881 | $ | 4,244,013 | |||||
| Freddie Mac Pool SD8199 |
| |||||||||
2.00% | 03/01/52 | 40,656,178 | 32,196,691 | |||||||
| Freddie Mac Pool SD8213 |
| |||||||||
3.00% | 05/01/52 | 10,096,032 | 8,697,008 | |||||||
| Freddie Mac Pool SD8244 |
| |||||||||
4.00% | 09/01/52 | 23,357,225 | 21,633,287 | |||||||
| Freddie Mac Pool SD8256 |
| |||||||||
4.00% | 10/01/52 | 18,534,982 | 17,166,961 | |||||||
| Freddie Mac Pool SD8265 |
| |||||||||
4.00% | 11/01/52 | 27,433,880 | 25,415,569 | |||||||
| Freddie Mac Pool SD8275 |
| |||||||||
4.50% | 12/01/52 | 33,986,826 | 32,386,392 | |||||||
| Freddie Mac Pool SD8347 |
| |||||||||
4.50% | 08/01/53 | 10,762,456 | 10,251,612 | |||||||
| Freddie Mac REMICS, |
| |||||||||
| Series 3339, Class JS |
| |||||||||
| (-6.50 X SOFR30A plus 42.09%, 42.84% Cap) |
| |||||||||
7.52% | 07/15/372 | 6,021 | 7,751 | |||||||
| Freddie Mac REMICS, |
| |||||||||
| Series 3404, Class AS (IO) |
| |||||||||
| (-1.00 X SOFR30A plus 5.78%, 5.90% Cap) |
| |||||||||
0.46% | 01/15/382 | 30,524 | 2,064 | |||||||
| Freddie Mac REMICS, |
| |||||||||
| Series 3439, Class SC (IO) |
| |||||||||
| (-1.00 X SOFR30A plus 5.79%, 5.90% Cap) |
| |||||||||
0.47% | 04/15/382 | 23,155 | 1,316 | |||||||
| Freddie Mac REMICS, |
| |||||||||
| Series 3885, Class PO (PO) |
| |||||||||
0.00% | 11/15/3311 | 8,590 | 7,222 | |||||||
| Freddie Mac REMICS, |
| |||||||||
| Series 4030, Class HS (IO) |
| |||||||||
| (-1.00 X SOFR30A plus 6.50%, 6.61% Cap) |
| |||||||||
1.18% | 04/15/422 | 56,323 | 5,436 | |||||||
| Freddie Mac REMICS, |
| |||||||||
| Series 4993, Class OP (PO) |
| |||||||||
0.00% | 10/25/5811 | 1,705,829 | 1,521,082 | |||||||
| Ginnie Mae (TBA) |
| |||||||||
4.50% | 04/20/54 | 39,975,000 | 38,420,820 | |||||||
5.00% | 04/20/54 | 32,600,000 | 32,044,999 | |||||||
5.50% | 05/20/54 | 20,225,000 | 20,199,685 | |||||||
| Ginnie Mae, |
| |||||||||
| Series 2011-146, Class EI (IO) |
| |||||||||
5.00% | 11/16/41 | 54,514 | 9,545 | |||||||
| Ginnie Mae, |
| |||||||||
| Series 2011-70, Class IL (IO) |
| |||||||||
| (-1.00 X CME Term SOFR 1-Month plus 6.99%, 0.60% Cap) |
| |||||||||
0.60% | 06/16/372 | 322,087 | 1,123 | |||||||
| Ginnie Mae, |
| |||||||||
| Series 2011-81, Class IC (IO) |
| |||||||||
| (-1.00 X CME Term SOFR 1-Month plus 6.61%, 0.62% Cap) |
| |||||||||
0.62% | 07/20/352 | 369,947 | 3,073 | |||||||
| Issues | Maturity Date | Principal Amount | Value | |||||||
| MORTGAGE-BACKED (continued) |
| |||||||||
| U.S. Agency Mortgage-Backed (continued) |
| |||||||||
| Ginnie Mae, |
| |||||||||
| Series 2013-135, Class CS (IO) |
| |||||||||
| (-1.00 X CME Term SOFR 1-Month plus 6.09%, 6.20% Cap) |
| |||||||||
0.76% | 09/16/432 | $ | 1,287,235 | $ | 116,195 | |||||
| Ginnie Mae, |
| |||||||||
| Series 2017-136, Class IO (IO) |
| |||||||||
5.00% | 09/20/47 | 238,220 | 49,780 | |||||||
| Ginnie Mae, |
| |||||||||
| Series 2024-30, Class AF |
| |||||||||
| (SOFR30A plus 1.25%) |
| |||||||||
6.50% | 02/20/542 | 1,048,179 | 1,048,394 | |||||||
| UMBS (TBA) |
| |||||||||
2.00% | 04/01/54 | 24,400,000 | 19,326,855 | |||||||
2.50% | 04/01/54 | 50,175,000 | 41,512,838 | |||||||
3.00% | 04/01/54 | 22,350,000 | 19,244,037 | |||||||
3.50% | 04/01/54 | 2,625,000 | 2,350,760 | |||||||
4.00% | 04/01/54 | 30,350,000 | 28,114,058 | |||||||
4.50% | 04/01/54 | 54,050,000 | 51,484,738 | |||||||
5.00% | 04/01/54 | 32,825,000 | 32,031,273 | |||||||
5.50% | 04/01/54 | 21,450,000 | 21,345,706 | |||||||
|
|
| ||||||||
| 535,749,829 | ||||||||||
|
|
| ||||||||
Total Mortgage-Backed (Cost $1,899,288,246) |
| 1,627,298,877 | ||||||||
|
|
| ||||||||
| MUNICIPAL BONDS — 0.32%* |
| |||||||||
Florida — 0.16% |
| |||||||||
| County of Miami-Dade Aviation Revenue Bonds, Airport and |
| |||||||||
| Marina Improvements, Series B |
| |||||||||
2.81% | 10/01/34 | 1,000,000 | 828,266 | |||||||
2.86% | 10/01/35 | 1,750,000 | 1,428,160 | |||||||
| County of Miami-Dade Aviation Revenue Bonds, Airport and |
| |||||||||
| Marina Improvements, Series D |
| |||||||||
3.35% | 10/01/29 | 2,000,000 | 1,872,837 | |||||||
|
|
| ||||||||
| 4,129,263 | ||||||||||
|
|
| ||||||||
| New York — 0.16% |
| |||||||||
| New York City Transitional Finance Authority Future Tax |
| |||||||||
| Secured Revenue Bonds, Public Improvements, Subseries |
| |||||||||
| FI |
| |||||||||
3.95% | 08/01/32 | 1,000,000 | 940,346 | |||||||
| New York State Dormitory Authority Revenue Bonds, |
| |||||||||
| University & College Improvements |
| |||||||||
5.29% | 03/15/33 | 3,100,000 | 3,121,295 | |||||||
|
|
| ||||||||
| 4,061,641 | ||||||||||
|
|
| ||||||||
Total Municipal Bonds (Cost $9,286,099) |
| 8,190,904 | ||||||||
|
|
| ||||||||
| U.S. TREASURY SECURITIES — 0.81% |
| |||||||||
U.S. Treasury Notes — 0.81% |
| |||||||||
| U.S. Treasury Notes |
| |||||||||
4.25% | 03/15/27 | 9,260,000 | 9,219,126 | |||||||
See accompanying Notes to Financial Statements.
| 239 / Annual Report March 2024 |
Table of Contents
Unconstrained Bond Fund
Schedule of Portfolio Investments
March 31, 2024
| Issues | Maturity Date | Principal Amount | Value | |||||||
| U.S. TREASURY SECURITIES (continued) |
| |||||||||
| U.S. Treasury Notes (continued) |
| |||||||||
| U.S. Treasury Notes (WI) |
| |||||||||
4.25% | 03/31/29 | $ | 11,785,000 | $ | 11,738,151 | |||||
|
|
| ||||||||
Total U.S. Treasury Securities (Cost $20,979,998) |
| 20,957,277 | ||||||||
|
|
| ||||||||
Total Bonds — 104.18% (Cost $3,025,470,444) |
| 2,682,229,938 | ||||||||
|
|
| ||||||||
| Issues | Shares | Value | ||||||||
| COMMON STOCK — 0.37% |
| |||||||||
| Communications — 0.15% |
| |||||||||
| Intelsat Emergence SA3,5,6,9 |
| |||||||||
| (Luxembourg) | 141,371 | 3,799,346 | ||||||||
|
|
| ||||||||
| Electric — 0.00% |
| |||||||||
| Homer City Holdings LLC5,6,9 | 112,222 | — | ||||||||
|
|
| ||||||||
| Finance — 0.22% |
| |||||||||
| AGNC Investment Corp. | 582,000 | 5,761,800 | ||||||||
|
|
| ||||||||
| Specialized REITs — 0.00% |
| |||||||||
| Aoyuan New Shares3,9 |
| |||||||||
| (Cayman Islands) | 408,855 | 8,254 | ||||||||
| China Aoyuan Group Ltd.3,9 |
| |||||||||
| (Cayman Islands) | 163,541 | 3,301 | ||||||||
|
|
| ||||||||
| 11,555 | ||||||||||
|
|
| ||||||||
Total Common Stock (Cost $17,396,204) |
| 9,572,701 | ||||||||
|
|
| ||||||||
| Issues | Maturity Date | Principal Amount/Shares | Value | |||||||
| SHORT-TERM INVESTMENTS — 11.35% |
| |||||||||
| Money Market Funds — 3.87% |
| |||||||||
| Fidelity Investments Money Market Funds - Government |
| |||||||||
| Portfolio |
| |||||||||
5.21%21,22 | 332,717 | 332,717 | ||||||||
| Morgan Stanley Institutional Liquidity Funds - Government |
| |||||||||
| Portfolio |
| |||||||||
5.22%21 | 99,306,148 | 99,306,148 | ||||||||
|
|
| ||||||||
| 99,638,865 | ||||||||||
|
|
| ||||||||
| U.S. Agency Discount Notes — 0.77% |
| |||||||||
| Federal Home Loan Bank |
| |||||||||
5.34%23 | 05/15/24 | 20,000,000 | 19,862,387 | |||||||
|
|
| ||||||||
| U.S. Treasury Bills — 6.71% |
| |||||||||
| U.S. Treasury Bills |
| |||||||||
5.49%23 | 04/11/24 | 25,000,000 | 24,963,653 | |||||||
5.26%23 | 09/19/24 | 50,000,000 | 48,763,272 | |||||||
| U.S. Treasury Bills (WI) |
| |||||||||
5.32%23 | 05/30/24 | 50,000,000 | 49,547,270 | |||||||
5.29%23 | 07/09/24 | 25,000,000 | 24,632,620 | |||||||
| Issues | Maturity Date | Principal Amount/Shares | Value | |||||||
| SHORT-TERM INVESTMENTS (continued) |
| |||||||||
| U.S. Treasury Bills (continued) |
| |||||||||
5.35%23 | 05/16/24 | $ | 25,000,000 | $ | 24,826,000 | |||||
|
|
| ||||||||
| 172,732,815 | ||||||||||
|
|
| ||||||||
Total Short-Term Investments (Cost $292,308,723) |
| 292,234,067 | ||||||||
|
|
| ||||||||
Total Investments - 115.90% (Cost $3,335,175,371) |
| 2,984,036,706 | ||||||||
|
|
| ||||||||
| Liabilities in Excess of Other Assets - (15.90)% |
| (409,362,059 | ) | |||||||
|
|
| ||||||||
Net Assets - 100.00% |
| $ | 2,574,674,647 | |||||||
|
|
| ||||||||
| 1 | Securities exempt from registration under Rule 144A of the Securities Act of 1933, as amended. The securities may be resold in transactions exempt from registration, normally to qualified institutional buyers. |
| 2 | Floating rate security. The rate disclosed was in effect at March 31, 2024. |
| 3 | Foreign denominated security issued by foreign domiciled entity. |
| 4 | Variable rate security. Interest rate disclosed is as of the most recent information available. Certain variable rate securities are not based on a published reference rate and spread but are determined by the issuer or agent and are based on current market conditions. |
| 5 | Security is valued using significant unobservable inputs and is classified as Level 3 in the fair value hierarchy. |
| 6 | Illiquid security as determined under procedures approved by the Board of Trustees. The aggregate value of illiquid securities is $21,416,727, which is 0.83% of total net assets. |
| 7 | Perpetual security with no stated maturity date. |
| 8 | Payment-in-kind (“PIK”) security. |
| 9 | Non-income producing security. |
| 10 | Security is currently in default with regard to scheduled interest or principal payments. |
| 11 | Zero coupon bond. The rate shown is the effective yield as of March 31, 2024. |
| 12 | Payment-in-kind (“PIK”) security. Income may be paid in additional securities or cash at the discretion of the issuer - 7.50% cash or 8.50% payment-in-kind interest. |
| 13 | Payment-in-kind (“PIK”) security. Income may be paid in additional securities or cash at the discretion of the issuer - 8.00% cash or 9.00% payment-in-kind interest. |
| 14 | Payment-in-kind (“PIK”) security. Income may be paid in additional securities or cash at the discretion of the issuer - 8.80% cash or 9.80% payment-in-kind interest. |
| 15 | Payment-in-kind (“PIK”) security. Income may be paid in additional securities or cash at the discretion of the issuer - 5.00% cash or 6.00% payment-in-kind interest. |
| 16 | Payment-in-kind (“PIK”) security. Income may be paid in additional securities or cash at the discretion of the issuer - 5.25% cash or 6.25% payment-in-kind interest. |
| 17 | Payment-in-kind (“PIK”) security. Income may be paid in additional securities or cash at the discretion of the issuer - 5.50% cash or 6.50% payment-in-kind interest. |
| 18 | Payment-in-kind (“PIK”) security. Income may be paid in additional securities or cash at the discretion of the issuer - 5.75% cash or 6.75% payment-in-kind interest. |
| 19 | Payment-in-kind (“PIK”) security. Income may be paid in additional securities or cash at the discretion of the issuer - 6.00% cash or 7.00% payment-in-kind interest. |
| 20 | Payment-in-kind (“PIK”) security. Income may be paid in additional securities or cash at the discretion of the issuer - 6.25% cash or 7.25% payment-in-kind interest. |
| 21 | Represents the current yield as of March 31, 2024. |
| 22 | Securities, or a portion thereof, pledged as collateral for swaps. The total market value of collateral pledged is $28,075. |
| 23 | Represents annualized yield at date of purchase. |
| * | Securities with a call or reset feature will have an effective maturity date sooner than the stated maturity. |
| ** | Securities backed by mortgage or consumer loans where payment is periodically made will have an effective maturity date sooner than the stated maturity date. |
See accompanying Notes to Financial Statements.
| Annual Report March 2024 / 240 |
Table of Contents
Unconstrained Bond Fund
Schedule of Portfolio Investments
March 31, 2024
Note: For Fund compliance purposes, the Fund’s industry classifications refer to any one or more of the industry sub-classifications used by one or more widely recognized market indexes or ratings group indexes, and/or as defined by Fund management. This definition may not apply for purposes of this report, which may combine industry sub-classifications for more meaningful presentation for investors.
(CLO): Collateralized Loan Obligation
(EDC): Economic Development Corporation
(EMTN): Euro Medium-Term Note
(EUR): Euro
(EURIBOR): Euro InterBank Offer Rate
(GBP): British Pound
(GMTN): Global Medium-Term Note
(IO): Interest Only
(LIBOR): London InterBank Offer Rate
(MTN): Medium-Term Note
(PO): Principal Only
(REIT): Real Estate Investment Trust
(SOFR): Secured Overnight Financing Rate
(STEP): Step Coupon Bond
(TBA): To-Be-Announced
(USD): U.S. Dollar
(WI): When Issued
Currency to be Purchased | Currency to be Sold | Counterparty | Settlement Date | Unrealized Appreciation (Depreciation) | ||||||||||||
FOREIGN CURRENCY EXCHANGE CONTRACT |
| |||||||||||||||
USD 76,986,638 | EUR 69,989,000 | Citibank N.A. | 04/12/24 | $ | 1,354,519 | |||||||||||
USD 128,110 | EUR 118,000 | Goldman Sachs International | 04/12/24 | 596 | ||||||||||||
USD 698,546 | EUR 644,000 | The Bank of New York Mellon | 04/12/24 | 2,621 | ||||||||||||
USD 3,667,994 | EUR 3,371,000 | Bank of America N.A. | 04/12/24 | 25,195 | ||||||||||||
USD 2,453,327 | GBP 1,922,000 | Citibank N.A. | 04/12/24 | 25,165 | ||||||||||||
|
| |||||||||||||||
| 1,408,096 | ||||||||||||||||
|
| |||||||||||||||
EUR 10,448,000 | USD 11,349,214 | Citibank N.A. | 04/12/24 | (58,806) | ||||||||||||
EUR 4,350,000 | USD 4,733,111 | Bank of America N.A. | 04/12/24 | (32,376) | ||||||||||||
EUR 1,177,000 | USD 1,272,974 | The Bank of New York Mellon | 04/12/24 | (1,074) | ||||||||||||
EUR 1,449,000 | USD 1,567,205 | Goldman Sachs International | 04/12/24 | (1,374) | ||||||||||||
|
| |||||||||||||||
| (93,630) | ||||||||||||||||
|
| |||||||||||||||
NET UNREALIZED APPRECIATION |
| $ | 1,314,466 | |||||||||||||
|
| |||||||||||||||
| Description | Number of Contracts | Expiration Date | Notional Amount | Value | Unrealized Appreciation (Depreciation) | |||||||||||||||
FUTURES CONTRACTS: LONG POSITIONS |
| |||||||||||||||||||
U.S. Treasury Five-Year Note | 5,040 | 06/28/24 | $ | 539,358,775 | $ | 380,702 | $ | 380,702 | ||||||||||||
U.S. Treasury Two-Year Note | 3,709 | 06/28/24 | 758,432,551 | (577,382) | (577,382) | |||||||||||||||
Euro-Bobl Future | 40 | 06/06/24 | 5,108,400 | 14,737 | 14,737 | |||||||||||||||
|
|
|
|
|
| |||||||||||||||
| 1,302,899,726 | (181,943) | (181,943) | ||||||||||||||||||
|
|
|
|
|
| |||||||||||||||
FUTURES CONTRACTS: SHORT POSITIONS |
| |||||||||||||||||||
U.S. Treasury Ten-Year Ultra Bond | 2,186 | 06/18/24 | (250,536,105) | (1,612,956) | (1,612,956) | |||||||||||||||
U.S. Treasury Ultra Bond | 480 | 06/18/24 | (61,920,000) | (610,668) | (610,668) | |||||||||||||||
Euro-Bund Future | 196 | 06/06/24 | (28,233,878) | (195,709) | (195,709) | |||||||||||||||
Euro-Bobl Future | 167 | 06/06/24 | (21,327,570) | (95,793) | (95,793) | |||||||||||||||
Euro-Buxl 30 Year | 26 | 06/06/24 | (3,813,264) | (76,971) | (76,971) | |||||||||||||||
Euro-Schatz Future | 14 | 06/06/24 | (1,598,184) | 74 | 74 | |||||||||||||||
|
|
|
|
|
| |||||||||||||||
| (367,429,001) | (2,592,023) | (2,592,023) | ||||||||||||||||||
|
|
|
|
|
| |||||||||||||||
TOTAL FUTURES CONTRACTS | $ | 935,470,725 | $ | (2,773,966) | $ | (2,773,966) | ||||||||||||||
|
|
|
|
|
| |||||||||||||||
See accompanying Notes to Financial Statements.
| 241 / Annual Report March 2024 |
Table of Contents
Unconstrained Bond Fund
Schedule of Portfolio Investments
March 31, 2024
| Received by the Fund | Paid by the Fund | |||||||||||||||||||||||||||||||
| Description | Maturity Date | Rate | Frequency | Rate | Frequency | Notional Amount (000’s) | Value | Premiums Paid | Unrealized Appreciation | |||||||||||||||||||||||
| SWAPS: INTEREST RATE |
| |||||||||||||||||||||||||||||||
Interest Rate Swap1 | 12/20/53 | | USD-SOFR- COMPOUND |
| Annual | 3.52% | Annual | $ | 21,211 | $ | 247,333 | $ | — | $ | 247,333 | |||||||||||||||||
|
|
|
|
|
|
|
| |||||||||||||||||||||||||
TOTAL SWAPS CONTRACTS |
| $ | 21,211 | $ | 247,333 | $ | — | $ | 247,333 | |||||||||||||||||||||||
|
|
|
|
|
|
|
| |||||||||||||||||||||||||
1 Centrally cleared. | ||||||||||||||||||||||||||||||||
See accompanying Notes to Financial Statements.
| Annual Report March 2024 / 242 |
Table of Contents
Statements of Assets and Liabilities
March 31, 2024
ASSETS: | ALPHATRAK 500 FUND | CORPORATE BOND FUND | FLEXIBLE INCOME FUND | |||||||||||||||||||
Investments, at value - Unaffiliated (Cost $33,576,238, $6,011,377 and $474,051,336, respectively) (Note 2) | $ | 33,722,414 | $ | 5,309,573 | $ | 438,779,477 | ||||||||||||||||
Investments, at value - Affiliated (Cost $0, $0 and $0, respectively) (Note 5) | — | — | — | |||||||||||||||||||
Cash and cash equivalents (Note 2) | — | — | 56,904 | |||||||||||||||||||
Foreign Currency, at value (Cost $0, $0 and $81, respectively) | — | — | 81 | |||||||||||||||||||
Cash on deposit with brokers for collateral on swaps (Note 2) | — | 6,485 | — | |||||||||||||||||||
Cash on deposit with brokers for collateral on futures (Note 2) | 1,352,000 | 32,000 | 1,303,000 | |||||||||||||||||||
Receivable for securities sold | 753,695 | — | 18,081,783 | |||||||||||||||||||
Dividends and interest receivable | 140,236 | 48,577 | 2,920,349 | |||||||||||||||||||
Due from Adviser (Note 6) | 10,793 | 20,690 | 27,949 | |||||||||||||||||||
Receivable for capital stock sold | 8,369 | — | 739,140 | |||||||||||||||||||
Unrealized appreciation on foreign currency exchange contracts | — | — | 158,470 | |||||||||||||||||||
Unrealized appreciation on foreign currency transactions | — | — | 1,566 | |||||||||||||||||||
Receivable for daily variation margin on futures contracts (Note 3) | — | 117 | 97 | |||||||||||||||||||
Unrealized appreciation on swap contracts | — | 898 | — | |||||||||||||||||||
Other assets | 11,117 | 1,255 | 29,052 | |||||||||||||||||||
|
|
|
|
|
| |||||||||||||||||
Total assets | 35,998,624 | 5,419,595 | 462,097,868 | |||||||||||||||||||
|
|
|
|
|
| |||||||||||||||||
Liabilities: | ||||||||||||||||||||||
Payable for securities purchased | 5,683,839 | 152,231 | 103,390,188 | |||||||||||||||||||
Payable for daily variation margin on futures contracts (Note 3) | 43,025 | 2,469 | 234,309 | |||||||||||||||||||
Payable for capital stock redeemed | 33,253 | 9,613 | 1,291,561 | |||||||||||||||||||
Distributions payable | 126 | 666 | 90,375 | |||||||||||||||||||
Unrealized depreciation on foreign currency exchange contracts | — | — | 16,097 | |||||||||||||||||||
Advisory fees payable (Note 6) | 9,890 | 1,688 | 130,211 | |||||||||||||||||||
Accrued trustees fees and expenses | 147 | 29 | 1,629 | |||||||||||||||||||
Accrued distribution (12b-1) and service fees payable | — | 581 | 10,172 | |||||||||||||||||||
Administrative fees payable | 25,862 | 19,738 | 53,281 | |||||||||||||||||||
Audit fees payable | 35,830 | 24,080 | 39,124 | |||||||||||||||||||
Accrued other expenses | 24,981 | 20,722 | 85,452 | |||||||||||||||||||
|
|
|
|
|
| |||||||||||||||||
Total liabilities | 5,856,953 | 231,817 | 105,342,399 | |||||||||||||||||||
|
|
|
|
|
| |||||||||||||||||
Net assets | $ | 30,141,671 | $ | 5,187,778 | $ | 356,755,469 | ||||||||||||||||
|
|
|
|
|
| |||||||||||||||||
Class M Shares: | ||||||||||||||||||||||
Net assets (Applicable to 2,464,695, 312,678 and 6,430,958,shares of beneficial interest issued and outstanding, respectively, unlimited number of shares authorized with a $0.01 par value) | $ | 30,141,671 | $ | 2,809,332 | $ | 49,559,150 | ||||||||||||||||
|
|
|
|
|
| |||||||||||||||||
Net asset value, offering and redemption price per Class M share | $ | 12.23 | $ | 8.98 | $ | 7.71 | ||||||||||||||||
|
|
|
|
|
| |||||||||||||||||
Class I Shares: | ||||||||||||||||||||||
Net assets (Applicable to 0, 264,696 and 39,870,741, shares of beneficial interest issued and outstanding, respectively, unlimited number of shares authorized with a $0.01 par value) | N/A | $ | 2,378,446 | $ | 307,196,319 | |||||||||||||||||
|
|
|
|
|
| |||||||||||||||||
Net asset value, offering and redemption price per Class I share | N/A | $ | 8.99 | $ | 7.70 | |||||||||||||||||
|
|
|
|
|
| |||||||||||||||||
Net Assets Consist of: | ||||||||||||||||||||||
Paid-in Capital (Note 9) | $ | 29,783,815 | $ | 7,711,925 | $ | 412,383,350 | ||||||||||||||||
Accumulated Earnings (Loss) | 357,856 | (2,524,147) | (55,627,881) | |||||||||||||||||||
|
|
|
|
|
| |||||||||||||||||
Net assets | $ | 30,141,671 | $ | 5,187,778 | $ | 356,755,469 | ||||||||||||||||
|
|
|
|
|
| |||||||||||||||||
See accompanying Notes to Financial Statements.
| Annual Report March 2024 / 243 |
Table of Contents
Metropolitan West Funds
Statements of Assets and Liabilities
March 31, 2024
ASSETS: | FLOATING RATE INCOME FUND | HIGH YIELD BOND FUND | INTERMEDIATE BOND FUND | |||||||||||||||||||
Investments, at value - Unaffiliated (Cost $315,863,526, $472,018,014 and $1,170,427,838, respectively) (Note 2) | $ | 313,065,049 | $ | 461,953,344 | $ | 1,159,514,111 | ||||||||||||||||
Investments, at value - Affiliated (Cost $0, $27,171,821 and $0, respectively) (Note 5) | — | — | — | |||||||||||||||||||
Cash and cash equivalents (Note 2) | 1,261,258 | 350,485 | 128,906,291 | |||||||||||||||||||
Foreign Currency, at value (Cost $11, $166 and $0, respectively) | 11 | 166 | — | |||||||||||||||||||
Cash on deposit with brokers for collateral on swaps (Note 2) | — | — | 462,568 | |||||||||||||||||||
Cash on deposit with brokers for collateral on futures (Note 2) | 4,000 | 1,393,000 | 2,952,000 | |||||||||||||||||||
Receivable for securities sold | 6,379,157 | 4,751,471 | 2,740,880 | |||||||||||||||||||
Dividends and interest receivable | 1,851,933 | 6,102,541 | 4,156,919 | |||||||||||||||||||
Receivable for capital stock sold | 679,066 | 590,323 | 2,345,853 | |||||||||||||||||||
Unrealized appreciation on foreign currency exchange contracts | 15,117 | 220,368 | 441,417 | |||||||||||||||||||
Unrealized appreciation on foreign currency transactions | 6,200 | 2,147 | — | |||||||||||||||||||
Net unrealized appreciation on unfunded commitments (Note 8) | 1,817 | 1,478 | — | |||||||||||||||||||
Receivable for daily variation margin on futures contracts (Note 3) | 130 | 713 | 3,829 | |||||||||||||||||||
Due from Adviser (Note 6) | — | 15,194 | — | |||||||||||||||||||
Other assets | 8,378 | 618 | 806 | |||||||||||||||||||
|
|
|
|
|
| |||||||||||||||||
Total assets | 323,272,116 | 475,381,848 | 1,301,524,674 | |||||||||||||||||||
|
|
|
|
|
| |||||||||||||||||
Liabilities: | ||||||||||||||||||||||
Foreign bank overdraft (Cost $0, $0 and $1,627, respectively) | — | — | 1,627 | |||||||||||||||||||
Payable for securities purchased | 20,342,382 | 5,520,131 | 328,152,976 | |||||||||||||||||||
Distributions payable | 519,883 | 490,002 | 469,833 | |||||||||||||||||||
Payable for capital stock redeemed | 66,945 | 1,195,018 | 1,578,660 | |||||||||||||||||||
Unrealized depreciation on foreign currency exchange contracts | — | 3,114 | 26,595 | |||||||||||||||||||
Unrealized depreciation on foreign currency transactions | — | — | 457 | |||||||||||||||||||
Payable for daily variation margin on futures contracts (Note 3) | — | 112,736 | 374,472 | |||||||||||||||||||
Advisory fees payable (Note 6) | 162,760 | 191,455 | 282,243 | |||||||||||||||||||
Accrued trustees fees and expenses | 1,711 | 2,521 | 4,726 | |||||||||||||||||||
Accrued distribution (12b-1) and service fees payable | 2,058 | 22,869 | 3,057 | |||||||||||||||||||
Administrative fees payable | 40,108 | 24,252 | 39,932 | |||||||||||||||||||
Accrued other expenses | 85,597 | 109,680 | 221,601 | |||||||||||||||||||
|
|
|
|
|
| |||||||||||||||||
Total liabilities | 21,221,444 | 7,671,778 | 331,156,179 | |||||||||||||||||||
|
|
|
|
|
| |||||||||||||||||
Net assets | $ | 302,050,672 | $ | 467,710,070 | $ | 970,368,495 | ||||||||||||||||
|
|
|
|
|
| |||||||||||||||||
Class M Shares: | ||||||||||||||||||||||
Net assets (Applicable to 1,003,458, 11,997,116 and 1,907,699, shares of beneficial interest issued and outstanding, respectively, unlimited number of shares authorized with a $0.01 par value) | $ | 9,521,245 | $ | 111,387,534 | $ | 17,845,241 | ||||||||||||||||
|
|
|
|
|
| |||||||||||||||||
Net asset value, offering and redemption price per Class M share | $ | 9.49 | $ | 9.28 | $ | 9.35 | ||||||||||||||||
|
|
|
|
|
| |||||||||||||||||
Class I Shares: | ||||||||||||||||||||||
Net assets (Applicable to 30,837,290, 38,392,204 and 101,869,339, shares of beneficial interest issued and outstanding, respectively, unlimited number of shares authorized with a $0.01 par value) | $ | 292,518,748 | $ | 356,322,536 | $ | 952,523,254 | ||||||||||||||||
|
|
|
|
|
| |||||||||||||||||
Net asset value, offering and redemption price per Class I share | $ | 9.49 | $ | 9.28 | $ | 9.35 | ||||||||||||||||
|
|
|
|
|
| |||||||||||||||||
Plan Class Shares: | ||||||||||||||||||||||
Net assets (Applicable to 1,129, 0 and 0, shares of beneficial interest issued and outstanding, respectively, unlimited number of shares authorized with a $0.01 par value) | $ | 10,679 | N/A | N/A | ||||||||||||||||||
|
|
|
|
|
| |||||||||||||||||
Net asset value, offering and redemption price per Plan Class share | $ | 9.46 | N/A | N/A | ||||||||||||||||||
|
|
|
|
|
| |||||||||||||||||
Net Assets Consist of: | ||||||||||||||||||||||
Paid-in Capital (Note 9) | $ | 326,931,927 | $ | 604,743,579 | $ | 1,075,156,001 | ||||||||||||||||
Accumulated Earnings (Loss) | (24,881,255) | (137,033,509) | (104,787,506) | |||||||||||||||||||
|
|
|
|
|
| |||||||||||||||||
Net assets | $ | 302,050,672 | $ | 467,710,070 | $ | 970,368,495 | ||||||||||||||||
|
|
|
|
|
| |||||||||||||||||
See accompanying Notes to Financial Statements.
| 244 / Annual Report March 2024 |
Table of Contents
Metropolitan West Funds
Statements of Assets and Liabilities
March 31, 2024
ASSETS: | INVESTMENT GRADE CREDIT FUND | LOW DURATION BOND FUND | OPPORTUNISTIC HIGH INCOME CREDIT FUND | |||||||||||||||||||||
Investments, at value - Unaffiliated (Cost $31,746,776, $1,721,314,582 and $1,675,644, respectively) (Note 2) | $ | 30,402,068 | $ | 1,698,764,724 | $ | 1,519,684 | ||||||||||||||||||
Investments, at value - Affiliated (Cost $0, $0 and $0, respectively) (Note 5) | — | — | — | |||||||||||||||||||||
Cash and cash equivalents (Note 2) | 5,138,407 | 84,625,975 | 852 | |||||||||||||||||||||
Foreign Currency, at value (Cost $0, $942 and $0, respectively) | — | 943 | — | |||||||||||||||||||||
Cash on deposit with brokers for collateral on swaps (Note 2) | 5,811 | 214,970 | — | |||||||||||||||||||||
Cash on deposit with brokers for collateral on futures (Note 2) | 59,000 | 6,934,000 | 8,000 | |||||||||||||||||||||
Receivable for capital stock sold | 665,369 | 960,329 | — | |||||||||||||||||||||
Dividends and interest receivable | 164,931 | 4,920,054 | 16,631 | |||||||||||||||||||||
Receivable for securities sold | 65,063 | 44,512,463 | 12,371 | |||||||||||||||||||||
Due from Adviser (Note 6) | 28,611 | — | 9,483 | |||||||||||||||||||||
Unrealized appreciation on swap contracts | 805 | — | — | |||||||||||||||||||||
Unrealized appreciation on foreign currency exchange contracts | 158 | 314,681 | — | |||||||||||||||||||||
Receivable for daily variation margin on futures contracts (Note 3) | — | 308,938 | — | |||||||||||||||||||||
Other assets | 3,352 | 13,861 | 802 | |||||||||||||||||||||
|
|
|
|
|
| |||||||||||||||||||
Total assets | 36,533,575 | 1,841,570,938 | 1,567,823 | |||||||||||||||||||||
|
|
|
|
|
| |||||||||||||||||||
Liabilities: | ||||||||||||||||||||||||
Payable for securities purchased | 9,747,931 | 569,562,151 | 24,915 | |||||||||||||||||||||
Payable for capital stock redeemed | 75,456 | 5,293,227 | 362 | |||||||||||||||||||||
Payable for daily variation margin on futures contracts (Note 3) | 10,719 | 1,053,744 | 977 | |||||||||||||||||||||
Distributions payable | 688 | 500,743 | — | |||||||||||||||||||||
Unrealized depreciation on foreign currency exchange contracts | — | 24,869 | — | |||||||||||||||||||||
Unrealized depreciation on foreign currency transactions | — | 1,392 | — | |||||||||||||||||||||
Advisory fees payable (Note 6) | 6,736 | 306,928 | 588 | |||||||||||||||||||||
Accrued trustees fees and expenses | 60 | 7,348 | 9 | |||||||||||||||||||||
Accrued distribution (12b-1) and service fees payable | 1,204 | 23,892 | 45 | |||||||||||||||||||||
Administrative fees payable | 23,961 | 44,689 | 18,365 | |||||||||||||||||||||
Transfer agent fees payable | 5,171 | 190,704 | 4,008 | |||||||||||||||||||||
Audit fees payable | 24,080 | 40,053 | 19,321 | |||||||||||||||||||||
Accrued other expenses | 18,748 | 45,450 | 7,345 | |||||||||||||||||||||
|
|
|
|
|
| |||||||||||||||||||
Total liabilities | 9,914,754 | 577,095,190 | 75,935 | |||||||||||||||||||||
|
|
|
|
|
| |||||||||||||||||||
Net assets | $ | 26,618,821 | $ | 1,264,475,748 | $ | 1,491,888 | ||||||||||||||||||
|
|
|
|
|
| |||||||||||||||||||
Class M Shares: | ||||||||||||||||||||||||
Net assets (Applicable to 784,171, 18,460,695 and 34,868, shares of beneficial interest issued and outstanding, respectively, unlimited number of shares authorized with a $0.01 par value) | $ | 6,040,546 | $ | 152,720,731 | $ | 267,124 | ||||||||||||||||||
|
|
|
|
|
| |||||||||||||||||||
Net asset value, offering and redemption price per Class M share | $ | 7.70 | $ | 8.27 | $ | 7.66 | ||||||||||||||||||
|
|
|
|
|
| |||||||||||||||||||
Class I Shares: | ||||||||||||||||||||||||
Net assets (Applicable to 2,671,571, 134,377,563 and 160,025, shares of beneficial interest issued and outstanding, respectively, unlimited number of shares authorized with a $0.01 par value) | $ | 20,578,275 | $ | 1,111,744,535 | $ | 1,224,764 | ||||||||||||||||||
|
|
|
|
|
| |||||||||||||||||||
Net asset value, offering and redemption price per Class I share | $ | 7.70 | $ | 8.27 | $ | 7.65 | ||||||||||||||||||
|
|
|
|
|
| |||||||||||||||||||
Administrative Class Shares: | ||||||||||||||||||||||||
Net assets (Applicable to 0, 981 and 0, shares of beneficial interest issued and outstanding, respectively, unlimited number of shares authorized with a $0.01 par value) | N/A | $ | 10,482 | N/A | ||||||||||||||||||||
|
|
|
|
|
| |||||||||||||||||||
Net asset value, offering and redemption price per Administrative Class share | N/A | $ | 10.68 | 1 | N/A | |||||||||||||||||||
|
|
|
|
|
| |||||||||||||||||||
Net Assets Consist of: | ||||||||||||||||||||||||
Paid-in Capital (Note 9) | $ | 30,055,487 | $ | 1,480,595,947 | $ | 2,319,301 | ||||||||||||||||||
Accumulated Earnings (Loss) | (3,436,666 | ) | (216,120,199 | ) | (827,413 | ) | ||||||||||||||||||
|
|
|
|
|
| |||||||||||||||||||
Net assets | $ | 26,618,821 | $ | 1,264,475,748 | $ | 1,491,888 | ||||||||||||||||||
|
|
|
|
|
| |||||||||||||||||||
| 1 | The net asset values of the Administrative Class Shares of the Low Duration Bond Fund were calculated using unrounded net assets of $10,481.75 divided by the unrounded shares outstanding of 981.38. |
See accompanying Notes to Financial Statements.
| Annual Report March 2024 / 245 |
Table of Contents
Metropolitan West Funds
Statements of Assets and Liabilities
March 31, 2024
ASSETS: | STRATEGIC INCOME FUND | SUSTAINABLE SECURITIZED FUND | TOTAL RETURN BOND FUND | |||||||||||||||||||||
Investments, at value - Unaffiliated (Cost $93,829,295, $9,972,572 and $68,569,239,340, respectively) (Note 2) | $ | 87,040,985 | $ | 9,578,462 | $ | 66,153,745,825 | ||||||||||||||||||
Investments, at value - Affiliated (Cost $0, $0 and $65,187,440, respectively) (Note 5) | — | — | — | |||||||||||||||||||||
Cash and cash equivalents (Note 2) | — | 5 | 971,082,907 | |||||||||||||||||||||
Foreign Currency, at value (Cost $11, $0 and $0, respectively) | 11 | — | — | |||||||||||||||||||||
Cash on deposit with brokers for collateral on swaps (Note 2) | 13,223 | — | 105,029,042 | |||||||||||||||||||||
Cash on deposit with brokers for collateral on futures (Note 2) | 237,000 | 42,000 | 162,250,000 | |||||||||||||||||||||
Receivable for securities sold | 1,602,984 | — | 1,313,212,528 | |||||||||||||||||||||
Dividends and interest receivable | 521,623 | 45,329 | 276,208,266 | |||||||||||||||||||||
Receivable for capital stock sold | 20,083 | 4,100 | 102,418,954 | |||||||||||||||||||||
Unrealized appreciation on foreign currency exchange contracts | 19,317 | — | 28,523,362 | |||||||||||||||||||||
Unrealized appreciation on swap contracts | 1,830 | — | 8,510,060 | |||||||||||||||||||||
Unrealized appreciation on foreign currency transactions | — | 2 | — | |||||||||||||||||||||
Net unrealized appreciation on unfunded commitments (Note 8) | — | — | 294 | |||||||||||||||||||||
Due from Adviser (Note 6) | — | 20,448 | — | |||||||||||||||||||||
Receivable for daily variation margin on futures contracts (Note 3) | — | 680 | 851,517 | |||||||||||||||||||||
Other assets | 8,339 | 649 | 115,632 | |||||||||||||||||||||
|
|
|
|
|
| |||||||||||||||||||
Total assets | 89,465,395 | 9,691,675 | 69,121,948,387 | |||||||||||||||||||||
|
|
|
|
|
| |||||||||||||||||||
Liabilities: | ||||||||||||||||||||||||
Reverse repurchase agreements (Proceeds $0, $0 and | ||||||||||||||||||||||||
$1,501,250,000, respectively) (Note 3) | — | — | 1,501,250,000 | |||||||||||||||||||||
Bank overdraft | 772 | — | — | |||||||||||||||||||||
Foreign bank overdraft (Cost $0, $0 and $85,637, respectively) | — | — | 85,687 | |||||||||||||||||||||
Payable for securities purchased | 13,917,238 | 1,859,776 | 15,457,340,038 | |||||||||||||||||||||
Payable for capital stock redeemed | 102,730 | 16,516 | 127,373,626 | |||||||||||||||||||||
Payable for daily variation margin on futures contracts (Note 3) | 34,192 | 1,828 | 14,973,769 | |||||||||||||||||||||
Unrealized depreciation on foreign currency transactions | 9,387 | — | 29,112 | |||||||||||||||||||||
Distributions payable | 2,637 | — | 15,026,997 | |||||||||||||||||||||
Unrealized depreciation on foreign currency exchange contracts | 907 | — | 5,864,378 | |||||||||||||||||||||
Premiums received for swap contracts | — | — | 510,308 | |||||||||||||||||||||
Advisory fees payable (Note 6) | 40,480 | 2,416 | 14,977,053 | |||||||||||||||||||||
Accrued trustees fees and expenses | 343 | 38 | 292,825 | |||||||||||||||||||||
Accrued distribution (12b-1) and service fees payable | 10,623 | 5 | 1,058,468 | |||||||||||||||||||||
Administrative fees payable | 37,193 | 19,352 | 566,608 | |||||||||||||||||||||
Accrued other expenses | 66,902 | 32,540 | 6,945,557 | |||||||||||||||||||||
|
|
|
|
|
| |||||||||||||||||||
Total liabilities | 14,223,404 | 1,932,471 | 17,146,294,426 | |||||||||||||||||||||
|
|
|
|
|
| |||||||||||||||||||
Net assets | $ | 75,241,991 | $ | 7,759,204 | $ | 51,975,653,961 | ||||||||||||||||||
|
|
|
|
|
| |||||||||||||||||||
Class M Shares: | ||||||||||||||||||||||||
Net assets (Applicable to 8,467,294, 5,255 and 424,049,209, shares of beneficial interest issued and outstanding, respectively, unlimited number of shares authorized with a $0.01 par value) | $ | 52,304,367 | $ | 43,847 | $ | 3,826,231,252 | ||||||||||||||||||
|
|
|
|
|
| |||||||||||||||||||
Net asset value, offering and redemption price per Class M share | $ | 6.18 | $ | 8.34 | $ | 9.02 | ||||||||||||||||||
|
|
|
|
|
| |||||||||||||||||||
Class I Shares: | ||||||||||||||||||||||||
Net assets (Applicable to 3,714,442, 924,112 and 3,446,644,876, shares of beneficial interest issued and outstanding, respectively, unlimited number of shares authorized with a $0.01 par value) | $ | 22,937,624 | $ | 7,715,357 | $ | 31,087,118,695 | ||||||||||||||||||
|
|
|
|
|
| |||||||||||||||||||
Net asset value, offering and redemption price per Class I share | $ | 6.18 | $ | 8.35 | $ | 9.02 | ||||||||||||||||||
|
|
|
|
|
| |||||||||||||||||||
Class I-2 Shares: | ||||||||||||||||||||||||
Net assets (Applicable to 0, 0 and 7,505,916, shares of beneficial interest issued and outstanding, respectively, unlimited number of shares authorized with a $0.01 par value) | N/A | N/A | $ | 67,699,167 | ||||||||||||||||||||
|
|
|
|
|
| |||||||||||||||||||
Net asset value, offering and redemption price per Class I-2 share | N/A | N/A | $ | 9.02 | ||||||||||||||||||||
|
|
|
|
|
| |||||||||||||||||||
Administrative Class Shares: | ||||||||||||||||||||||||
Net assets (Applicable to 0, 0 and 131,944,182, shares of beneficial interest issued and outstanding, respectively, unlimited number of shares authorized with a $0.01 par value) | N/A | N/A | $ | 1,191,463,664 | ||||||||||||||||||||
|
|
|
|
|
| |||||||||||||||||||
Net asset value, offering and redemption price per Administrative Class share | N/A | N/A | $ | 9.03 | ||||||||||||||||||||
|
|
|
|
|
| |||||||||||||||||||
Plan Class Shares: | ||||||||||||||||||||||||
Net assets (Applicable to 0, 0 and 1,868,351,523, shares of beneficial interest issued and outstanding, respectively, unlimited number of shares authorized with a $0.01 par value) | N/A | N/A | $ | 15,803,141,183 | ||||||||||||||||||||
|
|
|
|
|
| |||||||||||||||||||
Net asset value, offering and redemption price per Plan Class share | N/A | N/A | $ | 8.46 | ||||||||||||||||||||
|
|
|
|
|
| |||||||||||||||||||
See accompanying Notes to Financial Statements.
| 246 / Annual Report March 2024 |
Table of Contents
Metropolitan West Funds
Statements of Assets and Liabilities
March 31, 2024
ASSETS: | STRATEGIC INCOME FUND | SUSTAINABLE SECURITIZED FUND | TOTAL RETURN BOND FUND | |||||||||||||||||||||
Net Assets Consist of: | ||||||||||||||||||||||||
Paid-in Capital (Note 9) | $ | 86,763,098 | $ | 9,617,671 | $ | 65,872,560,008 | ||||||||||||||||||
Accumulated Earnings (Loss) | (11,521,107) | (1,858,467) | (13,896,906,047) | |||||||||||||||||||||
|
|
|
|
|
| |||||||||||||||||||
Net assets | $ | 75,241,991 | $ | 7,759,204 | $ | 51,975,653,961 | ||||||||||||||||||
|
|
|
|
|
| |||||||||||||||||||
See accompanying Notes to Financial Statements.
| Annual Report March 2024 / 247 |
Table of Contents
Metropolitan West Funds
Statements of Assets and Liabilities
March 31, 2024
ASSETS: | ULTRA SHORT BOND FUND | UNCONSTRAINED BOND FUND | ||||||||||||||||||
Investments, at value - Unaffiliated (Cost $67,996,003 and $3,335,175,371, respectively) (Note 2) | $ | 67,306,849 | $ | 2,984,036,706 | ||||||||||||||||
Investments, at value - Affiliated (Cost $0 and $0, respectively) (Note 5) | — | — | ||||||||||||||||||
Cash and cash equivalents (Note 2) | 6,171,811 | — | ||||||||||||||||||
Cash on deposit with brokers for collateral on swaps (Note 2) | — | 5,470,222 | ||||||||||||||||||
Cash on deposit with brokers for collateral on futures (Note 2) | 291,000 | 8,614,000 | ||||||||||||||||||
Receivable for securities sold | 2,049,648 | 138,047,314 | ||||||||||||||||||
Dividends and interest receivable | 124,692 | 16,454,881 | ||||||||||||||||||
Receivable for capital stock sold | 62,356 | 3,111,629 | ||||||||||||||||||
Receivable for daily variation margin on futures contracts (Note 3) | 14,999 | 454 | ||||||||||||||||||
Unrealized appreciation on foreign currency exchange contracts | 13,987 | 1,408,097 | ||||||||||||||||||
Unrealized appreciation on foreign currency transactions | — | 20,354 | ||||||||||||||||||
Unrealized appreciation on swap contracts | — | 247,333 | ||||||||||||||||||
Other assets | 921 | 641 | ||||||||||||||||||
|
|
|
| |||||||||||||||||
Total assets | 76,036,263 | 3,157,411,631 | ||||||||||||||||||
|
|
|
| |||||||||||||||||
Liabilities: | ||||||||||||||||||||
Bank overdraft | — | 962,180 | ||||||||||||||||||
Foreign bank overdraft (Cost $0 and $274, respectively) | — | 275 | ||||||||||||||||||
Payable for securities purchased | 25,048,919 | 566,594,815 | ||||||||||||||||||
Payable for capital stock redeemed | 148,950 | 9,103,809 | ||||||||||||||||||
Payable for daily variation margin on futures contracts (Note 3) | 26,673 | 1,610,663 | ||||||||||||||||||
Distributions payable | 854 | 2,503,981 | ||||||||||||||||||
Unrealized depreciation on foreign currency exchange contracts | 743 | 93,631 | ||||||||||||||||||
Unrealized depreciation on foreign currency transactions | 49 | — | ||||||||||||||||||
Advisory fees payable (Note 6) | 20,127 | 1,378,416 | ||||||||||||||||||
Accrued trustees fees and expenses | 379 | 13,234 | ||||||||||||||||||
Accrued distribution (12b-1) and service fees payable | 1,678 | 29,099 | ||||||||||||||||||
Administrative fees payable | 24,639 | 70,758 | ||||||||||||||||||
Accrued other expenses | 62,653 | 376,123 | ||||||||||||||||||
|
|
|
| |||||||||||||||||
Total liabilities | 25,335,664 | 582,736,984 | ||||||||||||||||||
|
|
|
| |||||||||||||||||
Net assets | $ | 50,700,599 | $ | 2,574,674,647 | ||||||||||||||||
|
|
|
| |||||||||||||||||
Class M Shares: | ||||||||||||||||||||
Net assets (Applicable to 3,157,713 and 13,745,498, shares of beneficial interest issued and outstanding, respectively, unlimited number of shares authorized with a $0.01 par value) | $ | 12,917,184 | $ | 141,735,576 | ||||||||||||||||
|
|
|
| |||||||||||||||||
Net asset value, offering and redemption price per Class M share | $ | 4.09 | $ | 10.31 | ||||||||||||||||
|
|
|
| |||||||||||||||||
Class I Shares: | ||||||||||||||||||||
Net assets (Applicable to 9,220,091 and 197,548,988, shares of beneficial interest issued and outstanding, respectively, unlimited number of shares authorized with a $0.01 par value) | $ | 37,783,415 | $ | 2,035,210,754 | ||||||||||||||||
|
|
|
| |||||||||||||||||
Net asset value, offering and redemption price per Class I share | $ | 4.10 | $ | 10.30 | ||||||||||||||||
|
|
|
| |||||||||||||||||
Plan Class Shares: | ||||||||||||||||||||
Net assets (Applicable to 0 and 38,620,666, shares of beneficial interest issued and outstanding, respectively, unlimited number of shares authorized with a $0.01 par value) | N/A | $ | 397,728,317 | |||||||||||||||||
|
|
|
| |||||||||||||||||
Net asset value, offering and redemption price per Plan Class share | N/A | $ | 10.30 | |||||||||||||||||
|
|
|
| |||||||||||||||||
Net Assets Consist of: | ||||||||||||||||||||
Paid-in Capital (Note 9) | $ | 64,003,793 | $ | 3,141,591,636 | ||||||||||||||||
Accumulated Earnings (Loss) | (13,303,194 | ) | (566,916,989 | ) | ||||||||||||||||
|
|
|
| |||||||||||||||||
Net assets | $ | 50,700,599 | $ | 2,574,674,647 | ||||||||||||||||
|
|
|
| |||||||||||||||||
See accompanying Notes to Financial Statements.
| 248 / Annual Report March 2024 |
Table of Contents
[THIS PAGE INTENTIONALLY LEFT BLANK]
Table of Contents
Statements of Operations
For the Year Ended March 31, 2024
| ALPHATRAK 500 FUND | CORPORATE BOND FUND | FLEXIBLE INCOME FUND | ||||||||||||||||||||||
Investment Income: | ||||||||||||||||||||||||
Interest | $ | 1,277,337 | $ | 246,122 | $ | 28,152,356 | ||||||||||||||||||
Dividends | 140,299 | 7,933 | 671,203 | |||||||||||||||||||||
|
|
|
|
|
|
|
|
| ||||||||||||||||
Total investment income | 1,417,636 | 254,055 | 28,823,559 | |||||||||||||||||||||
|
|
|
|
|
|
|
|
| ||||||||||||||||
Expenses: | ||||||||||||||||||||||||
Investment advisory fees (Note 6) | 117,723 | 22,985 | 1,505,543 | |||||||||||||||||||||
Administration fees | 100,891 | 86,344 | 234,221 | |||||||||||||||||||||
Distribution (12b-1) and service fees - class specific (Note 7): | ||||||||||||||||||||||||
Class M | — | 7,833 | 117,603 | |||||||||||||||||||||
Professional fees | 49,674 | 34,810 | 56,692 | |||||||||||||||||||||
Transfer agent fees | 31,904 | 32,004 | 353,127 | |||||||||||||||||||||
Custodian fees | 28,490 | 32,332 | 70,000 | |||||||||||||||||||||
Registration and filing fees | 20,692 | 32,205 | 28,675 | |||||||||||||||||||||
Trustees’ fees and expenses | 601 | 112 | 6,679 | |||||||||||||||||||||
Commitment fee | 239 | 42 | 2,921 | |||||||||||||||||||||
Interest expense | — | 7 | — | |||||||||||||||||||||
Miscellaneous expenses | 7,115 | 4,904 | 28,548 | |||||||||||||||||||||
|
|
|
|
|
|
|
|
| ||||||||||||||||
Total operating expenses | 357,329 | 253,578 | 2,404,009 | |||||||||||||||||||||
Expenses waived and reimbursed (Note 6) | (224,890 | ) | (217,007 | ) | (446,297 | ) | ||||||||||||||||||
|
|
|
|
|
|
|
|
| ||||||||||||||||
Net expenses | 132,439 | 36,571 | 1,957,712 | |||||||||||||||||||||
|
|
|
|
|
|
|
|
| ||||||||||||||||
Net investment income | 1,285,197 | 217,484 | 26,865,847 | |||||||||||||||||||||
|
|
|
|
|
|
|
|
| ||||||||||||||||
Realized and Change in Unrealized Gain (Loss) on Investments, Futures Contracts, Foreign Currency Exchange Contracts, Foreign Currency Transactions, Options and Swaptions Written and Swap Contracts: |
| |||||||||||||||||||||||
Net realized gain (loss) on: | ||||||||||||||||||||||||
Investments - Unaffiliated | (415,975 | ) | (570,096 | ) | (8,117,754 | ) | ||||||||||||||||||
Futures contracts | 6,433,475 | (30,640 | ) | (722,661 | ) | |||||||||||||||||||
Foreign currency exchange contracts | — | — | (45,604 | ) | ||||||||||||||||||||
Foreign currency transactions | — | 59 | 45,872 | |||||||||||||||||||||
Swap contracts | — | 7,774 | — | |||||||||||||||||||||
Net change in unrealized appreciation | ||||||||||||||||||||||||
(depreciation) on: | ||||||||||||||||||||||||
Investments - Unaffiliated | 1,285,422 | 528,470 | 1,840,977 | |||||||||||||||||||||
Futures contracts | (1,182,472 | ) | (6,779 | ) | (1,342,270 | ) | ||||||||||||||||||
Foreign currency exchange contracts | — | — | 185,050 | |||||||||||||||||||||
Foreign currency transactions | — | — | 358 | |||||||||||||||||||||
Swap contracts | — | 2,612 | — | |||||||||||||||||||||
|
|
|
|
|
|
|
|
| ||||||||||||||||
Net realized and change in unrealized gain (loss) on investments, futures contracts,foreign currency exchange contracts, foreign currency transactions, options and swaptions written and swap contracts | 6,120,450 | (68,600 | ) | (8,156,032 | ) | |||||||||||||||||||
|
|
|
|
|
|
|
|
| ||||||||||||||||
Net Increase in Net Assets from Operations | $ | 7,405,647 | $ | 148,884 | $ | 18,709,815 | ||||||||||||||||||
|
|
|
|
|
|
|
|
| ||||||||||||||||
See accompanying Notes to Financial Statements.
| 250 / Annual Report March 2024 |
Table of Contents
Metropolitan West Funds
Statements of Operations
For the Year Ended March 31, 2024
| FLOATING RATE INCOME FUND | HIGH YIELD BOND FUND | INTERMEDIATE BOND FUND | ||||||||||||||||||||||
Investment Income: | ||||||||||||||||||||||||
Interest | $ | 31,498,081 | $ | 35,891,999 | $ | 42,495,535 | ||||||||||||||||||
Dividends | 600,820 | 962,827 | 3,792,095 | |||||||||||||||||||||
|
|
|
|
|
|
|
|
| ||||||||||||||||
Total investment income | 32,098,901 | 36,854,826 | 46,287,630 | |||||||||||||||||||||
|
|
|
|
|
|
|
|
| ||||||||||||||||
Expenses: | ||||||||||||||||||||||||
Investment advisory fees (Note 6) | 1,849,510 | 2,486,802 | 3,364,665 | |||||||||||||||||||||
Administration fees | 194,073 | 113,920 | 189,561 | |||||||||||||||||||||
Distribution (12b-1) and service fees - class specific (Note 7): | ||||||||||||||||||||||||
Class M | 26,432 | 304,232 | 39,761 | |||||||||||||||||||||
Transfer agent fees | 153,257 | 313,958 | 759,057 | |||||||||||||||||||||
Registration and filing fees | 56,240 | 46,335 | 52,169 | |||||||||||||||||||||
Professional fees | 50,190 | 52,793 | 64,282 | |||||||||||||||||||||
Custodian fees | 25,324 | 24,093 | 77,681 | |||||||||||||||||||||
Trustees’ fees and expenses | 6,833 | 10,232 | 19,314 | |||||||||||||||||||||
Commitment fee | 2,770 | 4,097 | 8,595 | |||||||||||||||||||||
Interest expense | 44 | — | 756 | |||||||||||||||||||||
Miscellaneous expenses | 20,081 | 67,444 | 76,580 | |||||||||||||||||||||
Repayment of reimbursed expenses - Class I (Note 6) | 2,258 | — | 18,757 | |||||||||||||||||||||
|
|
|
|
|
|
|
|
| ||||||||||||||||
Total operating expenses | 2,387,012 | 3,423,906 | 4,671,178 | |||||||||||||||||||||
Expenses waived and reimbursed (Note 6) | (11,906 | ) | (135,512 | ) | (1,163 | ) | ||||||||||||||||||
|
|
|
|
|
|
|
|
| ||||||||||||||||
Net expenses | 2,375,106 | 3,288,394 | 4,670,015 | |||||||||||||||||||||
|
|
|
|
|
|
|
|
| ||||||||||||||||
Net investment income | 29,723,795 | 33,566,432 | 41,617,615 | |||||||||||||||||||||
|
|
|
|
|
|
|
|
| ||||||||||||||||
Realized and Change in Unrealized Gain (Loss) on Investments, Futures Contracts, Foreign Currency Exchange Contracts, Foreign Currency Transactions, Options and Swaptions Written and Swap Contracts: |
| |||||||||||||||||||||||
Net realized gain (loss) on: | ||||||||||||||||||||||||
Investments - Unaffiliated | (4,305,117 | ) | (17,002,189 | ) | (19,886,504 | ) | ||||||||||||||||||
Futures contracts | — | (1,953,219 | ) | (7,692,820 | ) | |||||||||||||||||||
Foreign currency exchange contracts | — | (6,664 | ) | (65,484 | ) | |||||||||||||||||||
Foreign currency transactions | 539 | 27,392 | 89,828 | |||||||||||||||||||||
Swap contracts | — | 75,949 | 30,438 | |||||||||||||||||||||
Net change in unrealized appreciation | ||||||||||||||||||||||||
(depreciation) on: | ||||||||||||||||||||||||
Investments - Unaffiliated | 11,395,269 | 27,018,172 | 9,726,533 | |||||||||||||||||||||
Futures contracts | (350 | ) | 105,270 | (3,169,611 | ) | |||||||||||||||||||
Foreign currency exchange contracts | 15,117 | 251,280 | 529,276 | |||||||||||||||||||||
Foreign currency transactions | 5,187 | (994 | ) | (5,398 | ) | |||||||||||||||||||
Swap contracts | — | (15,927 | ) | (8,867 | ) | |||||||||||||||||||
|
|
|
|
|
|
|
|
| ||||||||||||||||
Net realized and change in unrealized gain (loss) on investments, futures contracts,foreign currency exchange contracts, foreign currency transactions, options and swaptions written and swap contracts | 7,110,645 | 8,499,070 | (20,452,609 | ) | ||||||||||||||||||||
|
|
|
|
|
|
|
|
| ||||||||||||||||
Net Increase in Net Assets from Operations | $ | 36,834,440 | $ | 42,065,502 | $ | 21,165,006 | ||||||||||||||||||
|
|
|
|
|
|
|
|
| ||||||||||||||||
See accompanying Notes to Financial Statements.
| Annual Report March 2024 / 251 |
Table of Contents
Metropolitan West Funds
Statements of Operations
For the Year Ended March 31, 2024
| INVESTMENT GRADE CREDIT FUND | LOW DURATION BOND FUND | OPPORTUNISTIC HIGH INCOME CREDIT FUND | ||||||||||||||||||||||
Investment Income: | ||||||||||||||||||||||||
Interest | $ | 747,022 | $ | 65,429,803 | $ | 131,980 | ||||||||||||||||||
Dividends | 46,721 | 3,246,964 | 9,982 | |||||||||||||||||||||
|
|
|
|
|
|
|
|
| ||||||||||||||||
Total investment income | 793,743 | 68,676,767 | 141,962 | |||||||||||||||||||||
|
|
|
|
|
|
|
|
| ||||||||||||||||
Expenses: | ||||||||||||||||||||||||
Investment advisory fees (Note 6) | 46,117 | 4,357,369 | 8,632 | |||||||||||||||||||||
Administration fees | 103,599 | 227,020 | 84,411 | |||||||||||||||||||||
Distribution (12b-1) and service fees - class specific (Note 7): | ||||||||||||||||||||||||
Class M | 10,179 | 375,265 | 530 | |||||||||||||||||||||
Administrative Class | — | 22 | — | |||||||||||||||||||||
Custodian fees | 38,915 | 75,942 | 7,849 | |||||||||||||||||||||
Transfer agent fees | 38,028 | 1,236,742 | 29,526 | |||||||||||||||||||||
Registration and filing fees | 35,266 | 47,741 | 71,494 | |||||||||||||||||||||
Professional fees | 34,881 | 65,558 | 28,475 | |||||||||||||||||||||
Trustees’ fees and expenses | 239 | 28,577 | 36 | |||||||||||||||||||||
Commitment fee | 107 | 11,034 | 13 | |||||||||||||||||||||
Interest expense | 13 | 4,207 | 1 | |||||||||||||||||||||
Miscellaneous expenses | 5,772 | 112,209 | 3,908 | |||||||||||||||||||||
|
|
|
|
|
|
|
|
| ||||||||||||||||
Total operating expenses | 313,116 | 6,541,686 | 234,875 | |||||||||||||||||||||
Expenses waived and reimbursed (Note 6) | (239,989 | ) | — | (223,986 | ) | |||||||||||||||||||
|
|
|
|
|
|
|
|
| ||||||||||||||||
Net expenses | 73,127 | 6,541,686 | 10,889 | |||||||||||||||||||||
|
|
|
|
|
|
|
|
| ||||||||||||||||
Net investment income | 720,616 | 62,135,081 | 131,073 | |||||||||||||||||||||
|
|
|
|
|
|
|
|
| ||||||||||||||||
Realized and Change in Unrealized Gain (Loss) on Investments, Futures Contracts, Foreign Currency Exchange Contracts, Foreign Currency Transactions, Options and Swaptions Written and Swap Contracts: |
| |||||||||||||||||||||||
Net realized gain (loss) on: | ||||||||||||||||||||||||
Investments - Unaffiliated | (750,193 | ) | (31,384,390 | ) | (141,782 | ) | ||||||||||||||||||
Futures contracts | (55,979 | ) | (4,242,472 | ) | (9,786 | ) | ||||||||||||||||||
Foreign currency exchange contracts | — | (96,529 | ) | — | ||||||||||||||||||||
Foreign currency transactions | 326 | 73,028 | 74 | |||||||||||||||||||||
Options and swaptions written | — | 540,000 | — | |||||||||||||||||||||
Swap contracts | 6,932 | 76,700 | — | |||||||||||||||||||||
Net change in unrealized appreciation | ||||||||||||||||||||||||
(depreciation) on: | ||||||||||||||||||||||||
Investments - Unaffiliated | 719,531 | 28,652,588 | 163,622 | |||||||||||||||||||||
Futures contracts | (11,169 | ) | (4,450,800 | ) | (11,705 | ) | ||||||||||||||||||
Foreign currency exchange contracts | 158 | 404,188 | — | |||||||||||||||||||||
Foreign currency transactions | — | (11,457 | ) | — | ||||||||||||||||||||
Options and swaptions written | — | (539,997 | ) | — | ||||||||||||||||||||
Swap contracts | 2,339 | (28,033 | ) | — | ||||||||||||||||||||
|
|
|
|
|
|
|
|
| ||||||||||||||||
Net realized and change in unrealized gain (loss) on investments, futures contracts, foreign currency exchange contracts, foreign currency transactions, options and swaptions written and swap contracts | (88,055 | ) | (11,007,174 | ) | 423 | |||||||||||||||||||
|
|
|
|
|
|
|
|
| ||||||||||||||||
Net Increase in Net Assets from Operations | $ | 632,561 | $ | 51,127,907 | $ | 131,496 | ||||||||||||||||||
|
|
|
|
|
|
|
|
| ||||||||||||||||
See accompanying Notes to Financial Statements.
| 252 / Annual Report March 2024 |
Table of Contents
Metropolitan West Funds
Statements of Operations
For the Year Ended March 31, 2024
STRATEGIC | SUSTAINABLE SECURITIZED FUND | TOTAL RETURN | ||||||||||||||||||||||
Investment Income: | ||||||||||||||||||||||||
Interest | $ | 5,684,396 | $ | 426,562 | $ | 2,722,204,101 | ||||||||||||||||||
Dividends | 177,360 | 15,050 | 87,575,215 | |||||||||||||||||||||
|
|
|
|
|
|
|
|
| ||||||||||||||||
Total investment income | 5,861,756 | 441,612 | 2,809,779,316 | |||||||||||||||||||||
|
|
|
|
|
|
|
|
| ||||||||||||||||
Expenses: | ||||||||||||||||||||||||
Investment advisory fees (Note 6) | 459,665 | 28,664 | 205,161,647 | |||||||||||||||||||||
Administration fees | 167,059 | 82,993 | 3,329,541 | |||||||||||||||||||||
Distribution (12b-1) and service fees - class specific (Note 7): | — | — | — | |||||||||||||||||||||
Class M | 127,486 | 109 | 10,275,598 | |||||||||||||||||||||
Administrative Class | — | — | 5,512,568 | |||||||||||||||||||||
Transfer agent fees | 99,189 | 31,396 | 31,783,928 | |||||||||||||||||||||
Custodian fees | 51,201 | 14,361 | 955,571 | |||||||||||||||||||||
Professional fees | 48,734 | 31,918 | 685,493 | |||||||||||||||||||||
Registration and filing fees | 29,397 | 73,287 | 373,614 | |||||||||||||||||||||
Trustees’ fees and expenses | 1,398 | 147 | 1,199,471 | |||||||||||||||||||||
Commitment fee | 636 | 57 | 479,542 | |||||||||||||||||||||
Interest expense | — | 7 | 8,338,654 | |||||||||||||||||||||
Miscellaneous expenses | 16,064 | 10,823 | 3,967,752 | |||||||||||||||||||||
|
|
|
|
|
|
|
|
| ||||||||||||||||
Total operating expenses | 1,000,829 | 273,762 | 272,063,379 | |||||||||||||||||||||
Expenses waived and reimbursed (Note 6) | (312,702 | ) | (238,549 | ) | — | |||||||||||||||||||
|
|
|
|
|
|
|
|
| ||||||||||||||||
Net expenses | 688,127 | 35,213 | 272,063,379 | |||||||||||||||||||||
|
|
|
|
|
|
|
|
| ||||||||||||||||
Net investment income | 5,173,629 | 406,399 | 2,537,715,937 | |||||||||||||||||||||
|
|
|
|
|
|
|
|
| ||||||||||||||||
Realized and Change in Unrealized Gain (Loss) on Investments, Futures Contracts, Foreign Currency Exchange Contracts, Foreign Currency Transactions, Options and Swaptions Written and Swap Contracts: |
| |||||||||||||||||||||||
Net realized gain (loss) on: | ||||||||||||||||||||||||
Investments - Unaffiliated | (1,666,769 | ) | (781,206 | ) | (3,143,613,406 | ) | ||||||||||||||||||
Futures contracts | 277,216 | (67,460 | ) | (513,009,556 | ) | |||||||||||||||||||
Foreign currency exchange contracts | 654 | (1,423 | ) | 2,446,066 | ||||||||||||||||||||
Foreign currency transactions | 7,514 | (425 | ) | 9,210,762 | ||||||||||||||||||||
Swap contracts | 15,916 | — | 48,583,899 | |||||||||||||||||||||
Net change in unrealized appreciation (depreciation) on: | ||||||||||||||||||||||||
Investments - Unaffiliated | 816,002 | 740,604 | 1,640,901,744 | |||||||||||||||||||||
Futures contracts | (21,149 | ) | (17,574 | ) | (177,599,074 | ) | ||||||||||||||||||
Foreign currency exchange contracts | 20,816 | 3,724 | 33,469,580 | |||||||||||||||||||||
Foreign currency transactions | (9,426 | ) | (33 | ) | (449,580 | ) | ||||||||||||||||||
Swap contracts | 5,349 | — | 18,699,943 | |||||||||||||||||||||
|
|
|
|
|
|
|
|
| ||||||||||||||||
Net realized and change in unrealized (loss) on investments, futures contracts, foreign currency exchange contracts, foreign currency transactions, options and swaptions written and swap contracts | (553,877 | ) | (123,793 | ) | (2,081,359,622 | ) | ||||||||||||||||||
|
|
|
|
|
|
|
|
| ||||||||||||||||
Net Increase in Net Assets from Operations | $ | 4,619,752 | $ | 282,606 | $ | 456,356,315 | ||||||||||||||||||
|
|
|
|
|
|
|
|
| ||||||||||||||||
See accompanying Notes to Financial Statements.
| Annual Report March 2024 / 253 |
Table of Contents
Metropolitan West Funds
Statements of Operations
For the Year Ended March 31, 2024
| ULTRA SHORT BOND FUND | UNCONSTRAINED BOND FUND | |||||||||||||||||||||
Investment Income: | ||||||||||||||||||||||
Interest | $ | 3,484,687 | $ | 195,029,326 | ||||||||||||||||||
Dividends | 295,594 | 3,828,213 | ||||||||||||||||||||
|
|
|
|
|
| |||||||||||||||||
Total investment income | 3,780,281 | 198,857,539 | ||||||||||||||||||||
|
|
|
|
|
| |||||||||||||||||
Expenses: | ||||||||||||||||||||||
Investment advisory fees (Note 6) | 200,325 | 17,442,126 | ||||||||||||||||||||
Administration fees | 105,733 | 325,227 | ||||||||||||||||||||
Distribution (12b-1) and service fees - class specific (Note 7): | — | — | ||||||||||||||||||||
Class M | 23,681 | 375,001 | ||||||||||||||||||||
Transfer agent fees | 96,567 | 1,660,042 | ||||||||||||||||||||
Professional fees | 48,277 | 122,258 | ||||||||||||||||||||
Registration and filing fees | 33,448 | 101,824 | ||||||||||||||||||||
Custodian fees | 32,720 | 124,197 | ||||||||||||||||||||
Trustees’ fees and expenses | 1,592 | 52,886 | ||||||||||||||||||||
Commitment fee | 489 | 21,789 | ||||||||||||||||||||
Interest expense | 124 | 34,208 | ||||||||||||||||||||
Miscellaneous expenses | 12,411 | 207,401 | ||||||||||||||||||||
Repayment of reimbursed expenses - Class M (Note 6) | — | 2,053 | ||||||||||||||||||||
Repayment of reimbursed expenses - Plan Class (Note 6) | — | 9,216 | ||||||||||||||||||||
|
|
|
|
|
| |||||||||||||||||
Total operating expenses | 555,367 | 20,478,228 | ||||||||||||||||||||
Expenses waived and reimbursed (Note 6) | (259,120 | ) | — | |||||||||||||||||||
|
|
|
|
|
| |||||||||||||||||
Net expenses | 296,247 | 20,478,228 | ||||||||||||||||||||
|
|
|
|
|
| |||||||||||||||||
Net investment income | 3,484,034 | 178,379,311 | ||||||||||||||||||||
|
|
|
|
|
| |||||||||||||||||
Realized and Change in Unrealized Gain (Loss) on Investments, Futures Contracts, Foreign Currency Exchange Contracts, Foreign Currency Transactions, Options and Swaptions Written and Swap Contracts: |
| |||||||||||||||||||||
Net realized gain (loss) on: | ||||||||||||||||||||||
Investments - Unaffiliated | (2,344,733 | ) | (87,742,798 | ) | ||||||||||||||||||
Futures contracts | 353,161 | 6,486,601 | ||||||||||||||||||||
Foreign currency exchange contracts | (4,597 | ) | (201,537 | ) | ||||||||||||||||||
Foreign currency transactions | 1,552 | 371,176 | ||||||||||||||||||||
Swap contracts | 6,309 | 2,367,104 | ||||||||||||||||||||
Net change in unrealized appreciation (depreciation) on: | ||||||||||||||||||||||
Investments - Unaffiliated | 1,011,069 | 44,753,648 | ||||||||||||||||||||
Futures contracts | 63,483 | (604,218 | ) | |||||||||||||||||||
Foreign currency exchange contracts | 17,712 | 1,697,738 | ||||||||||||||||||||
Foreign currency transactions | (546 | ) | (2,583 | ) | ||||||||||||||||||
Swap contracts | (997 | ) | 668,574 | |||||||||||||||||||
|
|
|
|
|
| |||||||||||||||||
Net realized and change in unrealized (loss) on investments, futures contracts, foreign currency exchange contracts, foreign currency transactions, options and swaptions written and swap contracts | (897,587 | ) | (32,206,295 | ) | ||||||||||||||||||
|
|
|
|
|
| |||||||||||||||||
Net Increase in Net Assets from Operations | $ | 2,586,447 | $ | 146,173,016 | ||||||||||||||||||
|
|
|
|
|
| |||||||||||||||||
See accompanying Notes to Financial Statements.
| 254 / Annual Report March 2024 |
Table of Contents
[THIS PAGE INTENTIONALLY LEFT BLANK]
Table of Contents
Statements of Changes in Net Assets
ALPHATRAK 500 FUND | CORPORATE BOND FUND | |||||||||||||||||||||||||||||||
YEAR ENDED 2024 | YEAR ENDED 2023 | YEAR ENDED 2024 | YEAR ENDED 2023 | |||||||||||||||||||||||||||||
Operations: | ||||||||||||||||||||||||||||||||
Net investment income | $ | 1,285,197 | $ | 875,717 | $ | 217,484 | $285,898 | |||||||||||||||||||||||||
Net realized (loss) on investments | (415,975) | (797,424) | (570,096) | (1,186,234) | ||||||||||||||||||||||||||||
Net realized gain (loss) on futures contracts, foreign currency exchange contracts, foreign currency transactions, options and swaptions written and swap contracts | 6,433,475 | (3,406,039) | (22,807) | 12,468 | ||||||||||||||||||||||||||||
Net change in unrealized appreciation (depreciation) on investments | 1,285,422 | (820,315) | 528,470 | (74,878) | ||||||||||||||||||||||||||||
Net change in unrealized appreciation (depreciation) on futures contracts, foreign currency exchange contracts, foreign currency transactions, options and swaptions written and swap contracts | (1,182,472) | (501,369) | (4,167) | 26,654 | ||||||||||||||||||||||||||||
|
|
|
|
|
|
|
|
|
| |||||||||||||||||||||||
Net increase (decrease) in net assets resulting from operations | 7,405,647 | (4,649,430) | 148,884 | (936,092) | ||||||||||||||||||||||||||||
|
|
|
|
|
|
|
|
|
| |||||||||||||||||||||||
Distributions to Shareholders: | ||||||||||||||||||||||||||||||||
Class M | (1,228,684) | (1,425,275) | (114,651) | (142,778) | ||||||||||||||||||||||||||||
Class I | — | — | (102,270) | (141,214) | ||||||||||||||||||||||||||||
|
|
|
|
|
|
|
|
|
| |||||||||||||||||||||||
Total Distributions | (1,228,684) | (1,425,275) | (216,921) | (283,992) | ||||||||||||||||||||||||||||
|
|
|
|
|
|
|
|
|
| |||||||||||||||||||||||
Capital Share Transactions: | ||||||||||||||||||||||||||||||||
Class M: | ||||||||||||||||||||||||||||||||
Proceeds from sale of shares | 3,240,665 | 1,688,163 | 142,998 | 1,105,501 | ||||||||||||||||||||||||||||
Shares issued in reinvestment of distributions | 1,228,235 | 1,425,012 | 114,650 | 142,767 | ||||||||||||||||||||||||||||
Cost of shares redeemed | (9,465,645) | (13,179,485) | (1,705,604) | (2,035,825) | ||||||||||||||||||||||||||||
|
|
|
|
|
|
|
|
|
| |||||||||||||||||||||||
Total Class M capital share transactions | (4,996,745) | (10,066,310) | (1,447,956) | (787,557) | ||||||||||||||||||||||||||||
|
|
|
|
|
|
|
|
|
| |||||||||||||||||||||||
Class I: | ||||||||||||||||||||||||||||||||
Proceeds from sale of shares | — | — | 323,768 | 230,073 | ||||||||||||||||||||||||||||
Shares issued in reinvestment of distributions | — | — | 93,392 | 135,703 | ||||||||||||||||||||||||||||
Cost of shares redeemed | — | — | (879,250) | (3,749,112) | ||||||||||||||||||||||||||||
|
|
|
|
|
|
|
|
|
| |||||||||||||||||||||||
Total Class I capital share transactions | — | — | (462,090) | (3,383,336) | ||||||||||||||||||||||||||||
|
|
|
|
|
|
|
|
|
| |||||||||||||||||||||||
Net (decrease) in net assets derived from capital share transactions | (4,996,745) | (10,066,310) | (1,910,046) | (4,170,893) | ||||||||||||||||||||||||||||
|
|
|
|
|
|
|
|
|
| |||||||||||||||||||||||
Net increase (decrease) in net assets | 1,180,218 | (16,141,015) | (1,978,083) | (5,390,977) | ||||||||||||||||||||||||||||
Net assets at beginning of year | 28,961,453 | 45,102,468 | 7,165,861 | 12,556,838 | ||||||||||||||||||||||||||||
|
|
|
|
|
|
|
|
|
| |||||||||||||||||||||||
Net assets at end of year | $ | 30,141,671 | $ | 28,961,453 | $ | 5,187,778 | $7,165,861 | |||||||||||||||||||||||||
|
|
|
|
|
|
|
|
|
| |||||||||||||||||||||||
See accompanying Notes to Financial Statements.
| 256 / Annual Report March 2024 |
Table of Contents
Metropolitan West Funds
Statements of Changes in Net Assets
| FLEXIBLE INCOME FUND | FLOATING RATE INCOME FUND | |||||||||||||||||||||||||||||||||||
| YEAR ENDED MARCH 31, 2024 | YEAR ENDED MARCH 31, 2023 | YEAR ENDED MARCH 31, 2024 | YEAR ENDED MARCH 31, 2023 | |||||||||||||||||||||||||||||||||
Operations: | ||||||||||||||||||||||||||||||||||||
Net investment income | $ | 26,865,847 | $ | 21,543,153 | $ | 29,723,795 | $ | 25,534,633 | ||||||||||||||||||||||||||||
Net realized (loss) on investments | (8,117,754) | (9,155,600) | (4,305,117) | (16,313,982 | ) | |||||||||||||||||||||||||||||||
Net realized gain (loss) on futures contracts, foreign currency exchange contracts, foreign currency transactions, options and swaptions written and swap contracts | (722,393) | 1,558,426 | 539 | 93,351 | ||||||||||||||||||||||||||||||||
Net change in unrealized appreciation (depreciation) on investments | 1,840,977 | (16,288,207) | 11,395,269 | (7,196,020 | ) | |||||||||||||||||||||||||||||||
Net change in unrealized appreciation (depreciation) on futures contracts, foreign currency exchange contracts, foreign currency transactions, options and swaptions written and swap contracts | (1,156,862) | 1,280,679 | 19,954 | (11,725 | ) | |||||||||||||||||||||||||||||||
|
|
|
|
|
|
|
|
|
|
|
| |||||||||||||||||||||||||
Net increase (decrease) in net assets resulting from operations | 18,709,815 | (1,061,549) | 36,834,440 | 2,106,257 | ||||||||||||||||||||||||||||||||
|
|
|
|
|
|
|
|
|
|
|
| |||||||||||||||||||||||||
Distributions to Shareholders: | ||||||||||||||||||||||||||||||||||||
Class M | (3,673,154) | (3,284,784) | (915,742) | (809,656 | ) | |||||||||||||||||||||||||||||||
Class I | (23,170,141) | (18,815,999) | (28,847,128) | (24,770,860 | ) | |||||||||||||||||||||||||||||||
Plan Class | — | — | (511) | (6 | ) | |||||||||||||||||||||||||||||||
|
|
|
|
|
|
|
|
|
|
|
| |||||||||||||||||||||||||
Total Distributions | (26,843,295) | (22,100,783) | (29,763,381) | (25,580,522 | ) | |||||||||||||||||||||||||||||||
|
|
|
|
|
|
|
|
|
|
|
| |||||||||||||||||||||||||
Capital Share Transactions: | ||||||||||||||||||||||||||||||||||||
Class M: | ||||||||||||||||||||||||||||||||||||
Proceeds from sale of shares | 23,986,102 | 41,165,753 | 5,872,845 | 4,031,325 | ||||||||||||||||||||||||||||||||
Shares issued in reinvestment of distributions | 3,662,333 | 3,259,132 | 827,603 | 752,139 | ||||||||||||||||||||||||||||||||
Cost of shares redeemed | (26,032,498) | (23,746,600) | (8,403,470) | (9,931,101 | ) | |||||||||||||||||||||||||||||||
|
|
|
|
|
|
|
|
|
|
|
| |||||||||||||||||||||||||
Total Class M capital share transactions | 1,615,937 | 20,678,285 | (1,703,022) | (5,147,637 | ) | |||||||||||||||||||||||||||||||
|
|
|
|
|
|
|
|
|
|
|
| |||||||||||||||||||||||||
Class I: | ||||||||||||||||||||||||||||||||||||
Proceeds from sale of shares | 115,283,235 | 229,652,950 | 36,817,127 | 73,729,818 | ||||||||||||||||||||||||||||||||
Shares issued in reinvestment of distributions | 21,822,353 | 17,189,579 | 22,377,284 | 20,289,450 | ||||||||||||||||||||||||||||||||
Cost of shares redeemed | (104,231,117) | (123,618,442) | (101,940,658) | (218,088,025 | ) | |||||||||||||||||||||||||||||||
|
|
|
|
|
|
|
|
|
|
|
| |||||||||||||||||||||||||
Total Class I capital share transactions | 32,874,471 | 123,224,087 | (42,746,247) | (124,068,757 | ) | |||||||||||||||||||||||||||||||
|
|
|
|
|
|
|
|
|
|
|
| |||||||||||||||||||||||||
Plan Class: | ||||||||||||||||||||||||||||||||||||
Proceeds from sale of shares | — | — | 9,995 | — | ||||||||||||||||||||||||||||||||
Shares issued in reinvestment of distributions | — | — | 511 | 6 | ||||||||||||||||||||||||||||||||
|
|
|
|
|
|
|
|
|
|
|
| |||||||||||||||||||||||||
Total Plan Class capital share transactions | — | — | 10,506 | 6 | ||||||||||||||||||||||||||||||||
|
|
|
|
|
|
|
|
|
|
|
| |||||||||||||||||||||||||
Net increase (decrease) in net assets derived from capital share transactions | 34,490,408 | 143,902,372 | (44,438,763) | (129,216,388 | ) | |||||||||||||||||||||||||||||||
|
|
|
|
|
|
|
|
|
|
|
| |||||||||||||||||||||||||
Net increase (decrease) in net assets | 26,356,928 | 120,740,040 | (37,367,704) | (152,690,653 | ) | |||||||||||||||||||||||||||||||
Net assets at beginning of year | 330,398,541 | 209,658,501 | 339,418,376 | 492,109,029 | ||||||||||||||||||||||||||||||||
|
|
|
|
|
|
|
|
|
|
|
| |||||||||||||||||||||||||
Net assets at end of year | $ | 356,755,469 | $ | 330,398,541 | $ | 302,050,672 | $ | 339,418,376 | ||||||||||||||||||||||||||||
|
|
|
|
|
|
|
|
|
|
|
| |||||||||||||||||||||||||
See accompanying Notes to Financial Statements.
| Annual Report March 2024 / 257 |
Table of Contents
Metropolitan West Funds
Statements of Changes in Net Assets
HIGH YIELD BOND FUND | INTERMEDIATE BOND FUND | |||||||||||||||||||||||||||||||||
YEAR ENDED MARCH 31, 2024 | YEAR ENDED MARCH 31, 2023 | YEAR ENDED MARCH 31, 2024 | YEAR ENDED MARCH 31, 2023 | |||||||||||||||||||||||||||||||
Operations: | ||||||||||||||||||||||||||||||||||
Net investment income | $ | 33,566,432 | $ | 31,928,889 | $ | 41,617,615 | $ | 27,101,959 | ||||||||||||||||||||||||||
Net realized (loss) on investments | (17,002,189) | (57,819,428) | (19,886,504) | (37,576,129) | ||||||||||||||||||||||||||||||
Net realized gain (loss) on futures contracts, foreign currency exchange contracts, foreign currency transactions, options and swaptions written and swap contracts | (1,856,542) | 6,354,058 | (7,638,038) | (8,083,233) | ||||||||||||||||||||||||||||||
Net change in unrealized appreciation (depreciation) on investments | 27,018,172 | (9,639,134) | 9,726,533 | (838,619) | ||||||||||||||||||||||||||||||
Net change in unrealized appreciation (depreciation) on futures contracts, foreign currency exchange contracts, foreign currency transactions, options and swaptions written and swap contracts | 339,629 | (1,957,971) | (2,654,600) | 4,586,399 | ||||||||||||||||||||||||||||||
|
|
|
|
|
|
|
|
|
|
|
| |||||||||||||||||||||||
Net increase (decrease) in net assets resulting from operations | 42,065,502 | (31,133,586) | 21,165,006 | (14,809,623) | ||||||||||||||||||||||||||||||
|
|
|
|
|
|
|
|
|
|
|
| |||||||||||||||||||||||
Distributions to Shareholders: | ||||||||||||||||||||||||||||||||||
Class M | (7,978,484) | (8,006,047) | (776,161) | (651,240) | ||||||||||||||||||||||||||||||
Class I | (25,617,093) | (24,105,082) | (40,847,296) | (26,538,105) | ||||||||||||||||||||||||||||||
|
|
|
|
|
|
|
|
|
|
|
| |||||||||||||||||||||||
Total Distributions | (33,595,577) | (32,111,129) | (41,623,457) | (27,189,345) | ||||||||||||||||||||||||||||||
|
|
|
|
|
|
|
|
|
|
|
| |||||||||||||||||||||||
Capital Share Transactions: | ||||||||||||||||||||||||||||||||||
Class M: | ||||||||||||||||||||||||||||||||||
Proceeds from sale of shares | 28,953,228 | 48,460,943 | 5,313,966 | 6,760,189 | ||||||||||||||||||||||||||||||
Shares issued in reinvestment of distributions | 7,661,376 | 7,763,239 | 774,768 | 650,341 | ||||||||||||||||||||||||||||||
Cost of shares redeemed | (61,238,115) | (75,823,675) | (8,825,375) | (9,887,413) | ||||||||||||||||||||||||||||||
|
|
|
|
|
|
|
|
|
|
|
| |||||||||||||||||||||||
Total Class M capital share transactions | (24,623,511) | (19,599,493) | (2,736,641) | (2,476,883) | ||||||||||||||||||||||||||||||
|
|
|
|
|
|
|
|
|
|
|
| |||||||||||||||||||||||
Class I: | ||||||||||||||||||||||||||||||||||
Proceeds from sale of shares | 114,335,825 | 194,509,306 | 307,256,991 | 459,988,616 | ||||||||||||||||||||||||||||||
Shares issued in reinvestment of distributions | 20,462,368 | 20,309,691 | 35,763,780 | 23,375,376 | ||||||||||||||||||||||||||||||
Cost of shares redeemed | (146,132,953) | (359,485,585) | (247,428,013) | (333,934,491) | ||||||||||||||||||||||||||||||
|
|
|
|
|
|
|
|
|
|
|
| |||||||||||||||||||||||
Total Class I capital share transactions | (11,334,760) | (144,666,588) | 95,592,758 | 149,429,501 | ||||||||||||||||||||||||||||||
|
|
|
|
|
|
|
|
|
|
|
| |||||||||||||||||||||||
Net increase (decrease) in net assets derived from capital share transactions | (35,958,271) | (164,266,081) | 92,856,117 | 146,952,618 | ||||||||||||||||||||||||||||||
|
|
|
|
|
|
|
|
|
|
|
| |||||||||||||||||||||||
Net increase (decrease) in net assets | (27,488,346) | (227,510,796) | 72,397,666 | 104,953,650 | ||||||||||||||||||||||||||||||
Net assets at beginning of year | 495,198,416 | 722,709,212 | 897,970,829 | 793,017,179 | ||||||||||||||||||||||||||||||
|
|
|
|
|
|
|
|
|
|
|
| |||||||||||||||||||||||
Net assets at end of year | $ | 467,710,070 | $ | 495,198,416 | $ | 970,368,495 | $ | 897,970,829 | ||||||||||||||||||||||||||
|
|
|
|
|
|
|
|
|
|
|
| |||||||||||||||||||||||
See accompanying Notes to Financial Statements.
| 258 / Annual Report March 2024 |
Table of Contents
Metropolitan West Funds
Statements of Changes in Net Assets
INVESTMENT GRADE CREDIT FUND | LOW DURATION BOND FUND | |||||||||||||||||||||||||||||||||
YEAR ENDED MARCH 31, 2024 | YEAR ENDED MARCH 31, 2023 | YEAR ENDED MARCH 31, 2024 | YEAR ENDED MARCH 31, 2023 | |||||||||||||||||||||||||||||||
Operations: | ||||||||||||||||||||||||||||||||||
Net investment income | $ | 720,616 | $ | 771,068 | $ | 62,135,081 | $ | 61,988,491 | ||||||||||||||||||||||||||
Net realized (loss) on investments | (750,193) | (742,145) | (31,384,390) | (90,474,634) | ||||||||||||||||||||||||||||||
Net realized gain (loss) on futures contracts, foreign currency exchange contracts, foreign currency transactions, options and swaptions written and swap contracts | (48,721) | 10,587 | (3,649,273) | 2,702,326 | ||||||||||||||||||||||||||||||
Net change in unrealized appreciation (depreciation) on investments | 719,531 | (300,238) | 28,652,588 | 974,373 | ||||||||||||||||||||||||||||||
Net change in unrealized appreciation (depreciation) on futures contracts, foreign currency exchange contracts, foreign currency transactions, options and swaptions written and swap contracts | (8,672) | 38,270 | (4,626,099) | 1,569,971 | ||||||||||||||||||||||||||||||
|
|
|
|
|
|
|
|
|
|
|
| |||||||||||||||||||||||
Net increase (decrease) in net assets resulting from operations | 632,561 | (222,458) | 51,127,907 | (23,239,473) | ||||||||||||||||||||||||||||||
|
|
|
|
|
|
|
|
|
|
|
| |||||||||||||||||||||||
Distributions to Shareholders: | ||||||||||||||||||||||||||||||||||
From net earnings | ||||||||||||||||||||||||||||||||||
Class M | (217,135) | (193,447) | (8,065,480) | (11,675,128) | ||||||||||||||||||||||||||||||
Class I | (503,697) | (576,495) | (54,036,315) | (50,784,593) | ||||||||||||||||||||||||||||||
Administrative Class | — | — | (235) | (17,270) | ||||||||||||||||||||||||||||||
From tax return of capital | ||||||||||||||||||||||||||||||||||
Class M | — | (6,494) | — | — | ||||||||||||||||||||||||||||||
Class I | — | (18,167) | — | — | ||||||||||||||||||||||||||||||
|
|
|
|
|
|
|
|
|
|
|
| |||||||||||||||||||||||
Total Distributions | (720,832) | (794,603) | (62,102,030) | (62,476,991) | ||||||||||||||||||||||||||||||
|
|
|
|
|
|
|
|
|
|
|
| |||||||||||||||||||||||
Capital Share Transactions: | ||||||||||||||||||||||||||||||||||
Class M: | ||||||||||||||||||||||||||||||||||
Proceeds from sale of shares | 4,619,139 | 1,337,353 | 23,878,819 | 94,963,791 | ||||||||||||||||||||||||||||||
Shares issued in reinvestment of distributions | 215,703 | 199,463 | 7,989,466 | 11,599,618 | ||||||||||||||||||||||||||||||
Cost of shares redeemed | (1,808,358) | (542,274) | (175,627,096) | (266,373,973) | ||||||||||||||||||||||||||||||
|
|
|
|
|
|
|
|
|
|
|
| |||||||||||||||||||||||
Total Class M capital share transactions | 3,026,484 | 994,542 | (143,758,811) | (159,810,564) | ||||||||||||||||||||||||||||||
|
|
|
|
|
|
|
|
|
|
|
| |||||||||||||||||||||||
Class I: | ||||||||||||||||||||||||||||||||||
Proceeds from sale of shares | 16,250,851 | 2,645,893 | 229,594,053 | 676,046,610 | ||||||||||||||||||||||||||||||
Shares issued in reinvestment of distributions | 497,271 | 584,846 | 46,323,700 | 45,199,055 | ||||||||||||||||||||||||||||||
Cost of shares redeemed | (3,393,060) | (3,781,800) | (634,863,182) | (1,191,261,709) | ||||||||||||||||||||||||||||||
|
|
|
|
|
|
|
|
|
|
|
| |||||||||||||||||||||||
Total Class I capital share transactions | 13,355,062 | (551,061) | (358,945,429) | (470,016,044) | ||||||||||||||||||||||||||||||
|
|
|
|
|
|
|
|
|
|
|
| |||||||||||||||||||||||
Administrative Class: | ||||||||||||||||||||||||||||||||||
Proceeds from sale of shares | — | — | 10,044 | 341,423 | ||||||||||||||||||||||||||||||
Shares issued in reinvestment of distributions | — | — | 233 | 16,180 | ||||||||||||||||||||||||||||||
Cost of shares redeemed | — | — | (716) | (1,987,464) | ||||||||||||||||||||||||||||||
|
|
|
|
|
|
|
|
|
|
|
| |||||||||||||||||||||||
Total Administrative Class capital share transactions | — | — | 9,561 | (1,629,861) | ||||||||||||||||||||||||||||||
|
|
|
|
|
|
|
|
|
|
|
| |||||||||||||||||||||||
Net increase (decrease) in net assets derived from capital share transactions | 16,381,546 | 443,481 | (502,694,679) | (631,456,469) | ||||||||||||||||||||||||||||||
|
|
|
|
|
|
|
|
|
|
|
| |||||||||||||||||||||||
Net increase (decrease) in net assets | 16,293,275 | (573,580) | (513,668,802) | (717,172,933) | ||||||||||||||||||||||||||||||
Net assets at beginning of year | 10,325,546 | 10,899,126 | 1,778,144,550 | 2,495,317,483 | ||||||||||||||||||||||||||||||
|
|
|
|
|
|
|
|
|
|
|
| |||||||||||||||||||||||
Net assets at end of year | $ | 26,618,821 | $ | 10,325,546 | $ | 1,264,475,748 | $ | 1,778,144,550 | ||||||||||||||||||||||||||
|
|
|
|
|
|
|
|
|
|
|
| |||||||||||||||||||||||
See accompanying Notes to Financial Statements.
| Annual Report March 2024 / 259 |
Table of Contents
Metropolitan West Funds
Statements of Changes in Net Assets
OPPORTUNISTIC HIGH INCOME CREDIT FUND | STRATEGIC INCOME FUND | |||||||||||||||||||||||||||
YEAR ENDED MARCH 31, 2024 | YEAR ENDED MARCH 31, 2023 | YEAR ENDED MARCH 31, 2024 | YEAR ENDED MARCH 31, 2023 | |||||||||||||||||||||||||
Operations: | ||||||||||||||||||||||||||||
Net investment income | $ | 131,073 | $ | 266,498 | $ | 5,173,629 | $ | 3,476,991 | ||||||||||||||||||||
Net realized (loss) on investments | (141,782) | (431,304) | (1,666,769) | (2,469,993) | ||||||||||||||||||||||||
Net realized gain (loss) on futures contracts, foreign currency exchange contracts, foreign currency transactions, options and swaptions written and swap contracts | (9,712) | (37,305) | 301,300 | 501,888 | ||||||||||||||||||||||||
Net change in unrealized appreciation (depreciation) on investments | 163,622 | (27,281) | 816,002 | (850,399) | ||||||||||||||||||||||||
Net change in unrealized appreciation (depreciation) on futures contracts, foreign currency exchange contracts, foreign currency transactions, options and swaptions written and swap contracts | (11,705) | 17,597 | (4,410) | 28,320 | ||||||||||||||||||||||||
|
|
|
|
|
|
|
|
|
|
|
| |||||||||||||||||
Net increase (decrease) in net assets resulting from operations | 131,496 | (211,795) | 4,619,752 | 686,807 | ||||||||||||||||||||||||
|
|
|
|
|
|
|
|
|
|
|
| |||||||||||||||||
Distributions to Shareholders: | ||||||||||||||||||||||||||||
From net earnings | ||||||||||||||||||||||||||||
Class M | (16,060) | (17,339) | (3,794,595) | (2,536,732) | ||||||||||||||||||||||||
Class I | (120,902) | (259,044) | (1,498,263) | (1,178,986) | ||||||||||||||||||||||||
From tax return of capital | ||||||||||||||||||||||||||||
Class M | — | (603) | — | — | ||||||||||||||||||||||||
Class I | — | (7,178) | — | — | ||||||||||||||||||||||||
|
|
|
|
|
|
|
|
|
|
|
| |||||||||||||||||
Total Distributions | (136,962) | (284,164) | (5,292,858) | (3,715,718) | ||||||||||||||||||||||||
|
|
|
|
|
|
|
|
|
|
|
| |||||||||||||||||
Capital Share Transactions: | ||||||||||||||||||||||||||||
Class M: | ||||||||||||||||||||||||||||
Proceeds from sale of shares | 302,351 | 543,779 | 6,753,106 | 43,540,763 | ||||||||||||||||||||||||
Shares issued in reinvestment of distributions | 16,060 | 17,942 | 3,784,613 | 2,526,946 | ||||||||||||||||||||||||
Cost of shares redeemed | (359,655) | (295,730) | (8,380,137) | (10,331,770) | ||||||||||||||||||||||||
|
|
|
|
|
|
|
|
|
|
|
| |||||||||||||||||
Total Class M capital share transactions | (41,244) | 265,991 | 2,157,582 | 35,735,939 | ||||||||||||||||||||||||
|
|
|
|
|
|
|
|
|
|
|
| |||||||||||||||||
Class I: | ||||||||||||||||||||||||||||
Proceeds from sale of shares | 19,372 | 506,250 | 12,920,425 | 12,916,300 | ||||||||||||||||||||||||
Shares issued in reinvestment of distributions | 118,774 | 255,696 | 1,409,912 | 1,109,471 | ||||||||||||||||||||||||
Cost of shares redeemed | (672,238) | (1,500,632) | (6,793,483) | (6,635,438) | ||||||||||||||||||||||||
|
|
|
|
|
|
|
|
|
|
|
| |||||||||||||||||
Total Class I capital share transactions | (534,092) | (738,686) | 7,536,854 | 7,390,333 | ||||||||||||||||||||||||
|
|
|
|
|
|
|
|
|
|
|
| |||||||||||||||||
Net increase (decrease) in net assets derived from capital share transactions | (575,336) | (472,695) | 9,694,436 | 43,126,272 | ||||||||||||||||||||||||
|
|
|
|
|
|
|
|
|
|
|
| |||||||||||||||||
Net increase (decrease) in net assets | (580,802) | (968,654) | 9,021,330 | 40,097,361 | ||||||||||||||||||||||||
Net assets at beginning of year | 2,072,690 | 3,041,344 | 66,220,661 | 26,123,300 | ||||||||||||||||||||||||
|
|
|
|
|
|
|
|
|
|
|
| |||||||||||||||||
Net assets at end of year | $ | 1,491,888 | $ | 2,072,690 | $ | 75,241,991 | $ | 66,220,661 | ||||||||||||||||||||
|
|
|
|
|
|
|
|
|
|
|
| |||||||||||||||||
See accompanying Notes to Financial Statements.
| 260 / Annual Report March 2024 |
Table of Contents
Metropolitan West Funds
Statements of Changes in Net Assets
SUSTAINABLE SECURITIZED FUND | TOTAL RETURN BOND FUND | |||||||||||||||||||||||||||||||||
YEAR ENDED MARCH 31, 2024 | YEAR ENDED MARCH 31, 2023 | YEAR ENDED MARCH 31, 2024 | YEAR ENDED MARCH 31, 2023 | |||||||||||||||||||||||||||||||
Operations: | ||||||||||||||||||||||||||||||||||
Net investment income | $ | 406,399 | $ | 281,087 | $ | 2,537,715,937 | $ | 2,141,648,942 | ||||||||||||||||||||||||||
Net realized (loss) on investments | (781,206) | (491,703) | (3,143,613,406) | (4,531,899,804) | ||||||||||||||||||||||||||||||
Net realized gain (loss) on futures contracts, foreign currency exchange contracts, foreign currency transactions, options and swaptions written and swap contracts | (69,308) | 13,099 | (452,768,829) | (830,744,776) | ||||||||||||||||||||||||||||||
Net change in unrealized appreciation (depreciation) on investments | 740,604 | (544,191) | 1,640,901,744 | (1,855,532,089) | ||||||||||||||||||||||||||||||
Net change in unrealized appreciation (depreciation) on futures contracts, foreign currency exchange contracts, foreign currency transactions, options and swaptions written and swap contracts | (13,883) | (13,813) | (125,879,131) | 495,422,606 | ||||||||||||||||||||||||||||||
|
|
|
|
|
|
|
|
|
|
|
| |||||||||||||||||||||||
Net increase (decrease) in net assets resulting from operations | 282,606 | (755,521) | 456,356,315 | (4,581,105,121) | ||||||||||||||||||||||||||||||
|
|
|
|
|
|
|
|
|
|
|
| |||||||||||||||||||||||
Distributions to Shareholders: | ||||||||||||||||||||||||||||||||||
From net earnings | ||||||||||||||||||||||||||||||||||
Class M | (2,014) | (789) | (199,080,510) | (183,930,026) | ||||||||||||||||||||||||||||||
Class I | (363,941) | (323,549) | (1,514,156,186) | (1,310,563,915) | ||||||||||||||||||||||||||||||
Class I-2 | — | — | (3,711,760) | (4,553,863) | ||||||||||||||||||||||||||||||
Administrative Class | — | — | (53,157,819) | (48,358,996) | ||||||||||||||||||||||||||||||
Plan Class | — | — | (743,968,929) | (622,261,058) | ||||||||||||||||||||||||||||||
From tax return of capital | ||||||||||||||||||||||||||||||||||
Class M | (223) | — | — | — | ||||||||||||||||||||||||||||||
Class I | (40,201) | — | — | — | ||||||||||||||||||||||||||||||
|
|
|
|
|
|
|
|
|
|
|
| |||||||||||||||||||||||
Total Distributions | (406,379) | (324,338) | (2,514,075,204) | (2,169,667,858) | ||||||||||||||||||||||||||||||
|
|
|
|
|
|
|
|
|
|
|
| |||||||||||||||||||||||
Capital Share Transactions: | ||||||||||||||||||||||||||||||||||
Class M: | ||||||||||||||||||||||||||||||||||
Proceeds from sale of shares | 55,533 | 41,210 | 918,790,227 | 3,495,653,899 | ||||||||||||||||||||||||||||||
Shares issued in reinvestment of distributions | 2,168 | 789 | 197,785,406 | 182,610,816 | ||||||||||||||||||||||||||||||
Cost of shares redeemed | (63,013) | (5,381) | (3,558,742,020) | (2,967,490,699) | ||||||||||||||||||||||||||||||
|
|
|
|
|
|
|
|
|
|
|
| |||||||||||||||||||||||
Total Class M capital share transactions | (5,312) | 36,618 | (2,442,166,387) | 710,774,016 | ||||||||||||||||||||||||||||||
|
|
|
|
|
|
|
|
|
|
|
| |||||||||||||||||||||||
Class I: | ||||||||||||||||||||||||||||||||||
Proceeds from sale of shares | 1,713,982 | 2,980,028 | 8,262,045,253 | 10,638,504,466 | ||||||||||||||||||||||||||||||
Shares issued in reinvestment of distributions | 403,645 | 318,619 | 1,360,470,247 | 1,180,906,284 | ||||||||||||||||||||||||||||||
Cost of shares redeemed | (2,640,186) | (4,515,723) | (15,603,067,223) | (16,232,632,010) | ||||||||||||||||||||||||||||||
|
|
|
|
|
|
|
|
|
|
|
| |||||||||||||||||||||||
Total Class I capital share transactions | (522,559) | (1,217,076) | (5,980,551,723) | (4,413,221,260) | ||||||||||||||||||||||||||||||
|
|
|
|
|
|
|
|
|
|
|
| |||||||||||||||||||||||
Class I-2: | ||||||||||||||||||||||||||||||||||
Proceeds from sale of shares | — | — | 33,425,455 | 76,304,739 | ||||||||||||||||||||||||||||||
Shares issued in reinvestment of distributions | — | — | 3,688,076 | 4,553,247 | ||||||||||||||||||||||||||||||
Cost of shares redeemed | — | — | (67,704,008) | (132,967,258) | ||||||||||||||||||||||||||||||
|
|
|
|
|
|
|
|
|
|
|
| |||||||||||||||||||||||
Total Class I-2 capital share transactions | — | — | (30,590,477) | (52,109,272) | ||||||||||||||||||||||||||||||
|
|
|
|
|
|
|
|
|
|
|
| |||||||||||||||||||||||
Administrative Class: | ||||||||||||||||||||||||||||||||||
Proceeds from sale of shares | — | — | 248,831,090 | 293,651,286 | ||||||||||||||||||||||||||||||
Shares issued in reinvestment of distributions | — | — | 51,891,253 | 47,629,092 | ||||||||||||||||||||||||||||||
Cost of shares redeemed | — | — | (616,843,156) | (573,634,236) | ||||||||||||||||||||||||||||||
|
|
|
|
|
|
|
|
|
|
|
| |||||||||||||||||||||||
Total Administrative Class capital share transactions | — | — | (316,120,813) | (232,353,858) | ||||||||||||||||||||||||||||||
|
|
|
|
|
|
|
|
|
|
|
| |||||||||||||||||||||||
Plan Class: | ||||||||||||||||||||||||||||||||||
Proceeds from sale of shares | — | — | 3,421,603,095 | 2,968,909,350 | ||||||||||||||||||||||||||||||
Shares issued in reinvestment of distributions | — | — | 689,320,525 | 584,159,563 | ||||||||||||||||||||||||||||||
Cost of shares redeemed | — | — | (5,424,667,833) | (6,205,668,308) | ||||||||||||||||||||||||||||||
|
|
|
|
|
|
|
|
|
|
|
| |||||||||||||||||||||||
Total Plan Class capital share transactions | — | — | (1,313,744,213) | (2,652,599,395) | ||||||||||||||||||||||||||||||
|
|
|
|
|
|
|
|
|
|
|
| |||||||||||||||||||||||
Net (decrease) in net assets derived from capital share transactions | (527,871) | (1,180,458) | (10,083,173,613) | (6,639,509,769) | ||||||||||||||||||||||||||||||
|
|
|
|
|
|
|
|
|
|
|
| |||||||||||||||||||||||
Net (decrease) in net assets | (651,644) | (2,260,317) | (12,140,892,502) | (13,390,282,748) | ||||||||||||||||||||||||||||||
Net assets at beginning of year | 8,410,848 | 10,671,165 | 64,116,546,463 | 77,506,829,211 | ||||||||||||||||||||||||||||||
|
|
|
|
|
|
|
|
|
|
|
| |||||||||||||||||||||||
Net assets at end of year | $ | 7,759,204 | $ | 8,410,848 | $ | 51,975,653,961 | $ | 64,116,546,463 | ||||||||||||||||||||||||||
|
|
|
|
|
|
|
|
|
|
|
| |||||||||||||||||||||||
See accompanying Notes to Financial Statements.
| Annual Report March 2024 / 261 |
Table of Contents
Metropolitan West Funds
Statements of Changes in Net Assets
ULTRA SHORT BOND FUND | UNCONSTRAINED BOND FUND | |||||||||||||||||||||||||||||||
YEAR ENDED MARCH 31, 2024 | YEAR ENDED MARCH 31, 2023 | YEAR ENDED MARCH 31, 2024 | YEAR ENDED MARCH 31, 2023 | |||||||||||||||||||||||||||||
Operations: | ||||||||||||||||||||||||||||||||
Net investment income | $ | 3,484,034 | $ | 3,035,558 | $ | 178,379,311 | $164,181,166 | |||||||||||||||||||||||||
Net realized (loss) on investments | (2,344,733) | (5,388,169) | (87,742,798) | (170,331,474) | ||||||||||||||||||||||||||||
Net realized gain on futures contracts, foreign currency exchange contracts, foreign currency transactions, options and swaptions written and swap contracts | 356,425 | 2,104,149 | 9,023,344 | 74,637,642 | ||||||||||||||||||||||||||||
Net change in unrealized appreciation (depreciation) on investments | 1,011,070 | 1,062,414 | 44,753,648 | (160,704,924) | ||||||||||||||||||||||||||||
Net change in unrealized appreciation (depreciation) on futures contracts, foreign currency exchange contracts, foreign currency transactions, options and swaptions written and swap contracts | 79,651 | (645,153) | 1,759,511 | 2,436,594 | ||||||||||||||||||||||||||||
|
|
|
|
|
|
|
|
|
| |||||||||||||||||||||||
Net increase (decrease) in net assets resulting from operations | 2,586,447 | 168,799 | 146,173,016 | (89,780,996) | ||||||||||||||||||||||||||||
|
|
|
|
|
|
|
|
|
| |||||||||||||||||||||||
Distributions to Shareholders: | ||||||||||||||||||||||||||||||||
From net earnings | ||||||||||||||||||||||||||||||||
Class M | (632,667) | (638,279) | (9,524,330) | (9,125,883) | ||||||||||||||||||||||||||||
Class I | (2,861,175) | (2,405,102) | (142,902,881) | (145,485,600) | ||||||||||||||||||||||||||||
Plan Class | — | — | (25,240,397) | (16,733,784) | ||||||||||||||||||||||||||||
From tax return of capital | ||||||||||||||||||||||||||||||||
Class M | — | — | (88,102) | — | ||||||||||||||||||||||||||||
Class I | — | — | (1,321,873) | — | ||||||||||||||||||||||||||||
Plan Class | — | — | (233,477) | — | ||||||||||||||||||||||||||||
|
|
|
|
|
|
|
|
|
| |||||||||||||||||||||||
Total Distributions | (3,493,842) | (3,043,381) | (179,311,060) | (171,345,267) | ||||||||||||||||||||||||||||
|
|
|
|
|
|
|
|
|
| |||||||||||||||||||||||
Capital Share Transactions: | ||||||||||||||||||||||||||||||||
Class M: | ||||||||||||||||||||||||||||||||
Proceeds from sale of shares | 987,487 | 3,375,187 | 22,080,451 | 28,256,559 | ||||||||||||||||||||||||||||
Shares issued in reinvestment of distributions | 607,715 | 622,331 | 9,478,301 | 9,026,236 | ||||||||||||||||||||||||||||
Cost of shares redeemed | (8,603,378) | (22,824,795) | (48,055,330) | (77,734,166) | ||||||||||||||||||||||||||||
|
|
|
|
|
|
|
|
|
| |||||||||||||||||||||||
Total Class M capital share transactions | (7,008,176) | (18,827,277) | (16,496,578) | (40,451,371) | ||||||||||||||||||||||||||||
|
|
|
|
|
|
|
|
|
| |||||||||||||||||||||||
Class I: | ||||||||||||||||||||||||||||||||
Proceeds from sale of shares | 10,434,114 | 64,753,429 | 678,623,647 | 1,024,325,769 | ||||||||||||||||||||||||||||
Shares issued in reinvestment of distributions | 2,857,961 | 2,403,227 | 102,224,307 | 106,577,781 | ||||||||||||||||||||||||||||
Cost of shares redeemed | (76,523,093) | (121,342,857) | (1,070,859,376) | (2,197,064,956) | ||||||||||||||||||||||||||||
|
|
|
|
|
|
|
|
|
| |||||||||||||||||||||||
Total Class I capital share transactions | (63,231,018) | (54,186,201) | (290,011,422) | (1,066,161,406) | ||||||||||||||||||||||||||||
|
|
|
|
|
|
|
|
|
| |||||||||||||||||||||||
Plan Class: | ||||||||||||||||||||||||||||||||
Proceeds from sale of shares | — | — | 28,461,757 | 243,626,742 | ||||||||||||||||||||||||||||
Shares issued in reinvestment of distributions | — | — | 25,473,840 | 16,733,248 | ||||||||||||||||||||||||||||
Cost of shares redeemed | — | — | (5,145,946) | (11,237,412) | ||||||||||||||||||||||||||||
|
|
|
|
|
|
|
|
|
| |||||||||||||||||||||||
Total Plan Class capital share transactions | — | — | 48,789,651 | 249,122,578 | ||||||||||||||||||||||||||||
|
|
|
|
|
|
|
|
|
| |||||||||||||||||||||||
Net (decrease) in net assets derived from capital share transactions | (70,239,194) | (73,013,478) | (257,718,349) | (857,490,199) | ||||||||||||||||||||||||||||
|
|
|
|
|
|
|
|
|
| |||||||||||||||||||||||
Net (decrease) in net assets | (71,146,589) | (75,888,060) | (290,856,393) | (1,118,616,462) | ||||||||||||||||||||||||||||
Net assets at beginning of year | 121,847,188 | 197,735,248 | 2,865,531,040 | 3,984,147,502 | ||||||||||||||||||||||||||||
|
|
|
|
|
|
|
|
|
| |||||||||||||||||||||||
Net assets at end of year | $ | 50,700,599 | $ | 121,847,188 | $ | 2,574,674,647 | $2,865,531,040 | |||||||||||||||||||||||||
|
|
|
|
|
|
|
|
|
| |||||||||||||||||||||||
See accompanying Notes to Financial Statements.
| 262 / Annual Report March 2024 |
Table of Contents
Financial Highlights
ALPHATRAK 500 FUND CLASS M | ||||||||||||||||||||||||||||||||||
| YEAR ENDED MARCH 31, 2024 | YEAR ENDED MARCH 31, 2023 | YEAR ENDED MARCH 31, 2022 | YEAR ENDED MARCH 31, 2021 | YEAR ENDED MARCH 31, 2020 | ||||||||||||||||||||||||||||||
Net Asset Value, Beginning of Year | $ | 9.87 | $ | 11.48 | $ | 13.26 | $ | 8.89 | $ | 10.73 | ||||||||||||||||||||||||
|
|
|
|
|
|
|
|
|
| |||||||||||||||||||||||||
Income from Investment Operations: | ||||||||||||||||||||||||||||||||||
Net investment income1 | 0.47 | 0.27 | 0.11 | 0.18 | 0.31 | |||||||||||||||||||||||||||||
Net realized and unrealized gain (loss) | 2.35 | (1.42) | 1.81 | 5.14 | (1.14) | |||||||||||||||||||||||||||||
|
|
|
|
|
|
|
|
|
| |||||||||||||||||||||||||
Total Income (Loss) from Investment Operations | 2.82 | (1.15) | 1.92 | 5.32 | (0.83) | |||||||||||||||||||||||||||||
|
|
|
|
|
|
|
|
|
| |||||||||||||||||||||||||
Less Distributions: | ||||||||||||||||||||||||||||||||||
From net investment income | (0.46) | (0.27) | (0.12) | (0.20) | (0.30) | |||||||||||||||||||||||||||||
From net capital gains | — | (0.19) | (3.58) | (0.75) | (0.71) | |||||||||||||||||||||||||||||
|
|
|
|
|
|
|
|
|
| |||||||||||||||||||||||||
Total Distributions | (0.46) | (0.46) | (3.70) | (0.95) | (1.01) | |||||||||||||||||||||||||||||
|
|
|
|
|
|
|
|
|
| |||||||||||||||||||||||||
Net Asset Value, End of Year | $ | 12.23 | $ | 9.87 | $ | 11.48 | $ | 13.26 | $ | 8.89 | ||||||||||||||||||||||||
|
|
|
|
|
|
|
|
|
| |||||||||||||||||||||||||
Total Return | 29.17% | (9.77)% | 13.35% | 60.83% | (9.36)% | |||||||||||||||||||||||||||||
Ratios/Supplemental Data: | ||||||||||||||||||||||||||||||||||
Net Assets, end of year (in thousands) | $ | 30,142 | $ | 28,961 | $ | 45,102 | $ | 36,770 | $ | 29,066 | ||||||||||||||||||||||||
Ratio of Expenses to Average Net Assets | ||||||||||||||||||||||||||||||||||
Before expense waivers and reimbursements | 1.21% | 1.28% | 0.83%2 | 1.26% | 1.04% | |||||||||||||||||||||||||||||
After expense waivers and reimbursements | 0.45% | 0.45% | 0.83% | 0.90% | 0.90% | |||||||||||||||||||||||||||||
Ratio of Net Investment Income to Average Net Assets | ||||||||||||||||||||||||||||||||||
After expense waivers and reimbursements | 4.37% | 2.70% | 0.78% | 1.57% | 2.80% | |||||||||||||||||||||||||||||
Portfolio Turnover Rate | 260% | 166% | 94% | 60% | 89% | |||||||||||||||||||||||||||||
| 1 | Per share numbers have been calculated using the average share method. |
| 2 | Includes recoupment of past waived fees. Excluding the recoupment of past waived fees, the ratio would have been 0.66%. |
See accompanying Notes to Financial Statements.
| 263 / Annual Report March 2024 |
Table of Contents
Metropolitan West Funds
Financial Highlights
CORPORATE BOND FUND CLASS M | ||||||||||||||||||||||||||||||||||
| YEAR ENDED MARCH 31, 2024 | YEAR ENDED MARCH 31, 2023 | YEAR ENDED MARCH 31, 2022 | YEAR ENDED MARCH 31, 2021 | YEAR ENDED MARCH 31, 2020 | ||||||||||||||||||||||||||||||
Net Asset Value, Beginning of Year | $ | 9.03 | $ | 9.89 | $ | 10.65 | $ | 10.32 | $ | 10.31 | ||||||||||||||||||||||||
|
|
|
|
|
|
|
|
|
| |||||||||||||||||||||||||
Income from Investment Operations: | ||||||||||||||||||||||||||||||||||
Net investment income1 | 0.32 | 0.26 | 0.22 | 0.28 | 0.88 | |||||||||||||||||||||||||||||
Net realized and unrealized gain (loss) | (0.05) | (0.86) | (0.69) | 0.50 | 0.06 | |||||||||||||||||||||||||||||
|
|
|
|
|
|
|
|
|
| |||||||||||||||||||||||||
Total Income (Loss) from Investment Operations | 0.27 | (0.60) | (0.47) | 0.78 | 0.94 | |||||||||||||||||||||||||||||
|
|
|
|
|
|
|
|
|
| |||||||||||||||||||||||||
Less Distributions: | ||||||||||||||||||||||||||||||||||
From net investment income | (0.32) | (0.26) | (0.22) | (0.40) | (0.86) | |||||||||||||||||||||||||||||
From net capital gains | — | — | (0.07) | (0.05) | (0.07) | |||||||||||||||||||||||||||||
|
|
|
|
|
|
|
|
|
| |||||||||||||||||||||||||
Total Distributions | (0.32) | (0.26) | (0.29) | (0.45) | (0.93) | |||||||||||||||||||||||||||||
|
|
|
|
|
|
|
|
|
| |||||||||||||||||||||||||
Net Asset Value, End of Year | $ | 8.98 | $ | 9.03 | $ | 9.89 | $ | 10.65 | $ | 10.32 | ||||||||||||||||||||||||
|
|
|
|
|
|
|
|
|
| |||||||||||||||||||||||||
Total Return | 3.15% | (6.02)% | (4.67)% | 7.55% | 9.19% | |||||||||||||||||||||||||||||
Ratios/Supplemental Data: | ||||||||||||||||||||||||||||||||||
Net Assets, end of year (in thousands) | $ | 2,809 | $ | 4,296 | $ | 5,622 | $ | 8,190 | $ | 876 | ||||||||||||||||||||||||
Ratio of Expenses to Average Net Assets | ||||||||||||||||||||||||||||||||||
Before expense waivers and reimbursements | 4.56% | 3.93% | 2.73% | 3.16% | 8.55% | |||||||||||||||||||||||||||||
After expense waivers and reimbursements | 0.75% | 0.75% | 0.75% | 0.75% | 0.75% | |||||||||||||||||||||||||||||
Ratio of Net Investment Income to Average Net Assets | ||||||||||||||||||||||||||||||||||
After expense waivers and reimbursements | 3.67% | 2.87% | 2.01% | 2.54% | 8.31% | |||||||||||||||||||||||||||||
Portfolio Turnover Rate | 136% | 124% | 148% | 84% | 65% | |||||||||||||||||||||||||||||
| 1 | Per share numbers have been calculated using the average share method. |
See accompanying Notes to Financial Statements.
| Annual Report March 2024 / 264 |
Table of Contents
Metropolitan West Funds
Financial Highlights
CORPORATE BOND FUND CLASS I | ||||||||||||||||||||||||||||||||||
| YEAR ENDED MARCH 31, 2024 | YEAR ENDED MARCH 31, 2023 | YEAR ENDED MARCH 31, 2022 | YEAR ENDED MARCH 31, 2021 | YEAR ENDED MARCH 31, 2020 | ||||||||||||||||||||||||||||||
Net Asset Value, Beginning of Year | $ | 9.03 | $ | 9.89 | $ | 10.65 | $ | 10.32 | $ | 10.31 | ||||||||||||||||||||||||
|
|
|
|
|
|
|
|
|
| |||||||||||||||||||||||||
Income from Investment Operations: | ||||||||||||||||||||||||||||||||||
Net investment income1 | 0.35 | 0.28 | 0.24 | 0.40 | 0.91 | |||||||||||||||||||||||||||||
Net realized and unrealized gain (loss) | (0.04) | (0.86) | (0.69) | 0.41 | 0.06 | |||||||||||||||||||||||||||||
|
|
|
|
|
|
|
|
|
| |||||||||||||||||||||||||
Total Income (Loss) from Investment Operations | 0.31 | (0.58) | (0.45) | 0.81 | 0.97 | |||||||||||||||||||||||||||||
|
|
|
|
|
|
|
|
|
| |||||||||||||||||||||||||
Less Distributions: | ||||||||||||||||||||||||||||||||||
From net investment income | (0.35) | (0.28) | (0.24) | (0.43) | (0.89) | |||||||||||||||||||||||||||||
From net capital gains | — | — | (0.07) | (0.05) | (0.07) | |||||||||||||||||||||||||||||
|
|
|
|
|
|
|
|
|
| |||||||||||||||||||||||||
Total Distributions | (0.35) | (0.28) | (0.31) | (0.48) | (0.96) | |||||||||||||||||||||||||||||
|
|
|
|
|
|
|
|
|
| |||||||||||||||||||||||||
Net Asset Value, End of Year | $ | 8.99 | $ | 9.03 | $ | 9.89 | $ | 10.65 | $ | 10.32 | ||||||||||||||||||||||||
|
|
|
|
|
|
|
|
|
| |||||||||||||||||||||||||
Total Return | 3.52% | (5.79)% | (4.44)% | 7.81% | 9.46% | |||||||||||||||||||||||||||||
Ratios/Supplemental Data: | ||||||||||||||||||||||||||||||||||
Net Assets, end of year (in thousands) | $ | 2,379 | $ | 2,870 | $ | 6,935 | $ | 4,730 | $ | 2,392 | ||||||||||||||||||||||||
Ratio of Expenses to Average Net Assets | ||||||||||||||||||||||||||||||||||
Before expense waivers and reimbursements | 4.24% | 3.39% | 2.40% | 3.54% | 8.30% | |||||||||||||||||||||||||||||
After expense waivers and reimbursements | 0.50% | 0.50% | 0.50% | 0.50% | 0.50% | |||||||||||||||||||||||||||||
Ratio of Net Investment Income to Average Net Assets | ||||||||||||||||||||||||||||||||||
After expense waivers and reimbursements | 3.92% | 3.05% | 2.25% | 3.64% | 8.62% | |||||||||||||||||||||||||||||
Portfolio Turnover Rate | 136% | 124% | 148% | 84% | 65% | |||||||||||||||||||||||||||||
| 1 | Per share numbers have been calculated using the average share method. |
See accompanying Notes to Financial Statements.
| 265 / Annual Report March 2024 |
Table of Contents
Metropolitan West Funds
Financial Highlights
FLEXIBLE INCOME FUND CLASS M | ||||||||||||||||||||||||||||||||||
YEAR ENDED | YEAR ENDED MARCH 31, 2023 | YEAR ENDED MARCH 31, 2022 | YEAR ENDED MARCH 31, 2021 | YEAR ENDED MARCH 31, 2020 | ||||||||||||||||||||||||||||||
Net Asset Value, Beginning of Year | $ | 7.89 | $ | 8.75 | $ | 9.86 | $ | 9.82 | $ | 10.79 | ||||||||||||||||||||||||
|
|
|
|
|
|
|
|
|
| |||||||||||||||||||||||||
Income from Investment Operations: | ||||||||||||||||||||||||||||||||||
Net investment income1 | 0.60 | 0.68 | 0.88 | 0.69 | 1.86 | |||||||||||||||||||||||||||||
Net realized and unrealized gain (loss) | (0.18) | (0.83) | (1.07) | 0.34 | (0.85) | |||||||||||||||||||||||||||||
|
|
|
|
|
|
|
|
|
| |||||||||||||||||||||||||
Total Income (Loss) from Investment Operations | 0.42 | (0.15) | (0.19) | 1.03 | 1.01 | |||||||||||||||||||||||||||||
|
|
|
|
|
|
|
|
|
| |||||||||||||||||||||||||
Less Distributions: | ||||||||||||||||||||||||||||||||||
From net investment income | (0.60) | (0.71) | (0.89) | (0.97) | (1.98) | |||||||||||||||||||||||||||||
From net capital gains | — | — | (0.03) | (0.02) | — | |||||||||||||||||||||||||||||
|
|
|
|
|
|
|
|
|
| |||||||||||||||||||||||||
Total Distributions | (0.60) | (0.71) | (0.92) | (0.99) | (1.98) | |||||||||||||||||||||||||||||
|
|
|
|
|
|
|
|
|
| |||||||||||||||||||||||||
Net Asset Value, End of Year | $ | 7.71 | $ | 7.89 | $ | 8.75 | $ | 9.86 | $ | 9.82 | ||||||||||||||||||||||||
|
|
|
|
|
|
|
|
|
| |||||||||||||||||||||||||
Total Return | 5.64% | (1.50)% | (2.30)% | 10.89% | 9.82% | |||||||||||||||||||||||||||||
Ratios/Supplemental Data: | ||||||||||||||||||||||||||||||||||
Net Assets, end of year (in thousands) | $ | 49,559 | $ | 49,027 | $ | 31,941 | $ | 21,174 | $ | 1 | ||||||||||||||||||||||||
Ratio of Expenses to Average Net Assets | ||||||||||||||||||||||||||||||||||
Before expense waivers and reimbursements | 0.94% | 1.00% | 1.04% | 1.28% | 3.76% | |||||||||||||||||||||||||||||
After expense waivers and reimbursements | 0.80% | 0.80% | 0.80% | 0.80% | 0.80% | |||||||||||||||||||||||||||||
Ratio of Net Investment Income to Average Net Assets | ||||||||||||||||||||||||||||||||||
After expense waivers and reimbursements | 7.82% | 8.53% | 9.33% | 7.01% | 17.64% | |||||||||||||||||||||||||||||
Portfolio Turnover Rate | 332% | 248% | 210% | 177% | 122% | |||||||||||||||||||||||||||||
| 1 | Per share numbers have been calculated using the average share method. |
See accompanying Notes to Financial Statements.
| Annual Report March 2024 / 266 |
Table of Contents
Metropolitan West Funds
Financial Highlights
FLEXIBLE INCOME FUND CLASS I | ||||||||||||||||||||||||||||||||||
| YEAR ENDED MARCH 31, 2024 | YEAR ENDED MARCH 31, 2023 | YEAR ENDED MARCH 31, 2022 | YEAR ENDED MARCH 31, 2021 | YEAR ENDED MARCH 31, 2020 | ||||||||||||||||||||||||||||||
Net Asset Value, Beginning of Period | $ | 7.89 | $ | 8.75 | $ | 9.86 | $ | 9.82 | $ | 10.78 | ||||||||||||||||||||||||
|
|
|
|
|
|
|
|
|
| |||||||||||||||||||||||||
Income from Investment Operations: | ||||||||||||||||||||||||||||||||||
Net investment income1 | 0.62 | 0.70 | 0.91 | 0.73 | 1.90 | |||||||||||||||||||||||||||||
Net realized and unrealized gain (loss) | (0.19) | (0.83) | (1.08) | 0.30 | (0.85) | |||||||||||||||||||||||||||||
|
|
|
|
|
|
|
|
|
| |||||||||||||||||||||||||
Total Income (Loss) from Investment Operations | 0.43 | (0.13) | (0.17) | 1.03 | 1.05 | |||||||||||||||||||||||||||||
|
|
|
|
|
|
|
|
|
| |||||||||||||||||||||||||
Less Distributions: | ||||||||||||||||||||||||||||||||||
From net investment income | (0.62) | (0.73) | (0.91) | (0.97) | (2.01) | |||||||||||||||||||||||||||||
From net capital gains | — | — | (0.03) | (0.02) | — | |||||||||||||||||||||||||||||
|
|
|
|
|
|
|
|
|
| |||||||||||||||||||||||||
Total Distributions | (0.62) | (0.73) | (0.94) | (0.99) | (2.01) | |||||||||||||||||||||||||||||
|
|
|
|
|
|
|
|
|
| |||||||||||||||||||||||||
Net Asset Value, End of Year | $ | 7.70 | $ | 7.89 | $ | 8.75 | $ | 9.86 | $ | 9.82 | ||||||||||||||||||||||||
|
|
|
|
|
|
|
|
|
| |||||||||||||||||||||||||
Total Return | 5.77% | (1.25)% | (2.05)% | 10.83% | 10.14% | |||||||||||||||||||||||||||||
Ratios/Supplemental Data: | ||||||||||||||||||||||||||||||||||
Net Assets, end of year (in thousands) | $ | 307,196 | $ | 281,372 | $ | 177,717 | $ | 158,834 | $ | 8,934 | ||||||||||||||||||||||||
Ratio of Expenses to Average Net Assets | ||||||||||||||||||||||||||||||||||
Before expense waivers and reimbursements | 0.68% | 0.74% | 0.79% | 1.01% | 3.51% | |||||||||||||||||||||||||||||
After expense waivers and reimbursements | 0.55% | 0.55% | 0.55% | 0.55% | 0.55% | |||||||||||||||||||||||||||||
Ratio of Net Investment Income to Average Net Assets | ||||||||||||||||||||||||||||||||||
After expense waivers and reimbursements | 8.07% | 8.78% | 9.55% | 7.41% | 18.14% | |||||||||||||||||||||||||||||
Portfolio Turnover Rate | 332% | 248% | 210% | 177% | 122% | |||||||||||||||||||||||||||||
| 1 | Per share numbers have been calculated using the average share method. |
See accompanying Notes to Financial Statements.
| 267 / Annual Report March 2024 |
Table of Contents
Metropolitan West Funds
Financial Highlights
FLOATING RATE INCOME FUND CLASS M | ||||||||||||||||||||||||||||||||||
| YEAR ENDED MARCH 31, 2024 | YEAR ENDED MARCH 31, 2023 | YEAR ENDED MARCH 31, 2022 | YEAR ENDED MARCH 31, 2021 | YEAR ENDED MARCH 31, 2020 | ||||||||||||||||||||||||||||||
Net Asset Value, Beginning of Year | $ | 9.29 | $ | 9.79 | $ | 9.95 | $ | 8.98 | $ | 9.90 | ||||||||||||||||||||||||
|
|
|
|
|
|
|
|
|
| |||||||||||||||||||||||||
Income from Investment Operations: | ||||||||||||||||||||||||||||||||||
Net investment income1 | 0.81 | 0.56 | 0.31 | 0.30 | 0.42 | |||||||||||||||||||||||||||||
Net realized and unrealized gain (loss) | 0.20 | (0.48) | (0.16) | 0.97 | (0.92) | |||||||||||||||||||||||||||||
|
|
|
|
|
|
|
|
|
| |||||||||||||||||||||||||
Total Income (Loss) from Investment Operations | 1.01 | 0.08 | 0.15 | 1.27 | (0.50) | |||||||||||||||||||||||||||||
|
|
|
|
|
|
|
|
|
| |||||||||||||||||||||||||
Less Distributions: | ||||||||||||||||||||||||||||||||||
From net investment income | (0.81) | (0.58) | (0.31) | (0.30) | (0.42) | |||||||||||||||||||||||||||||
|
|
|
|
|
|
|
|
|
| |||||||||||||||||||||||||
Net Asset Value, End of Year | $ | 9.49 | $ | 9.29 | $ | 9.79 | $ | 9.95 | $ | 8.98 | ||||||||||||||||||||||||
|
|
|
|
|
|
|
|
|
| |||||||||||||||||||||||||
Total Return | 11.36% | 0.96% | 1.50% | 14.30% | (5.36)% | |||||||||||||||||||||||||||||
Ratios/Supplemental Data: | ||||||||||||||||||||||||||||||||||
Net Assets, end of year (in thousands) | $ | 9,521 | $ | 11,002 | $ | 17,003 | $ | 13,815 | $ | 6,084 | ||||||||||||||||||||||||
Ratio of Expenses to Average Net Assets | ||||||||||||||||||||||||||||||||||
Before expense waivers and reimbursements | 1.01% | 1.02% | 1.00% | 0.99% | 1.00% | |||||||||||||||||||||||||||||
After expense waivers and reimbursements | 0.90% | 0.90% | 0.90% | 0.90% | 0.90% | |||||||||||||||||||||||||||||
Ratio of Net Investment Income to Average Net Assets | ||||||||||||||||||||||||||||||||||
After expense waivers and reimbursements | 8.65% | 5.98% | 3.12% | 3.05% | 4.27% | |||||||||||||||||||||||||||||
Portfolio Turnover Rate | 77% | 43% | 49% | 38% | 51% | |||||||||||||||||||||||||||||
| 1 | Per share numbers have been calculated using the average share method. |
See accompanying Notes to Financial Statements.
| Annual Report March 2024 / 268 |
Table of Contents
Metropolitan West Funds
Financial Highlights
| FLOATING RATE INCOME FUND CLASS I | ||||||||||||||||||||||||||||||||||
| YEAR ENDED MARCH 31, 2024 | YEAR ENDED MARCH 31, 2023 | YEAR ENDED MARCH 31, 2022 | YEAR ENDED MARCH 31, 2021 | YEAR ENDED MARCH 31, 2020 | ||||||||||||||||||||||||||||||
Net Asset Value, Beginning of Year | $ | 9.29 | $ | 9.78 | $ | 9.95 | $ | 8.98 | $ | 9.90 | ||||||||||||||||||||||||
|
|
|
|
|
|
|
|
|
| |||||||||||||||||||||||||
Income from Investment Operations: | ||||||||||||||||||||||||||||||||||
Net investment income1 | 0.83 | 0.58 | 0.33 | 0.32 | 0.44 | |||||||||||||||||||||||||||||
Net realized and unrealized gain (loss) | 0.20 | (0.47) | (0.17) | 0.97 | (0.92) | |||||||||||||||||||||||||||||
|
|
|
|
|
|
|
|
|
| |||||||||||||||||||||||||
Total Income (Loss) from Investment Operations | 1.03 | 0.11 | 0.16 | 1.29 | (0.48) | |||||||||||||||||||||||||||||
|
|
|
|
|
|
|
|
|
| |||||||||||||||||||||||||
Less Distributions: | ||||||||||||||||||||||||||||||||||
From net investment income | (0.83) | (0.60) | (0.33) | (0.32) | (0.44) | |||||||||||||||||||||||||||||
|
|
|
|
|
|
|
|
|
| |||||||||||||||||||||||||
Net Asset Value, End of Year | $ | 9.49 | $ | 9.29 | $ | 9.78 | $ | 9.95 | $ | 8.98 | ||||||||||||||||||||||||
|
|
|
|
|
|
|
|
|
| |||||||||||||||||||||||||
Total Return | 11.58% | 1.26% | 1.61% | 14.52% | (5.17)% | |||||||||||||||||||||||||||||
Ratios/Supplemental Data: | ||||||||||||||||||||||||||||||||||
Net Assets, end of year (in thousands) | $ | 292,519 | $ | 328,416 | $ | 475,105 | $ | 417,927 | $ | 250,187 | ||||||||||||||||||||||||
Ratio of Expenses to Average Net Assets | ||||||||||||||||||||||||||||||||||
Before expense waivers and reimbursements | 0.70%2 | 0.70% | 0.69%3 | 0.70%4 | 0.70% | |||||||||||||||||||||||||||||
After expense waivers and reimbursements | 0.70% | 0.70% | 0.69% | 0.70% | 0.70% | |||||||||||||||||||||||||||||
Ratio of Net Investment Income to Average Net Assets | ||||||||||||||||||||||||||||||||||
After expense waivers and reimbursements | 8.85% | 6.22% | 3.32% | 3.25% | 4.47% | |||||||||||||||||||||||||||||
Portfolio Turnover Rate | 77% | 43% | 49% | 38% | 51% | |||||||||||||||||||||||||||||
| 1 | Per share numbers have been calculated using the average share method. |
| 2 | Includes recoupment of past waived fees. Excluding the recoupment of past waived fees, the ratio would have been 0.70%. |
| 3 | Includes recoupment of past waived fees. Excluding the recoupment of past waived fees, the ratio would have been 0.69%. |
| 4 | Includes recoupment of past waived fees. Excluding the recoupment of past waived fees, the ratio would have been 0.68%. |
See accompanying Notes to Financial Statements.
| 269 / Annual Report March 2024 |
Table of Contents
Metropolitan West Funds
Financial Highlights
FLOATING RATE INCOME FUND PLAN CLASS* | ||||||||||||||||||||||||
| YEAR ENDED MARCH 31, 2024 | YEAR ENDED MARCH 31, 2023 | YEAR ENDED MARCH 31, 2022 | PERIOD ENDED MARCH 31, 2021 | |||||||||||||||||||||
Net Asset Value, Beginning of Period | $ | 9.27 | $ | 9.78 | $ | 9.95 | $ | 9.97 | ||||||||||||||||
|
|
|
|
|
|
|
| |||||||||||||||||
Income from Investment Operations: | ||||||||||||||||||||||||
Net investment income1 | 0.84 | 0.59 | 0.35 | 0.05 | ||||||||||||||||||||
Net realized and unrealized gain (loss) | 0.17 | (0.51) | (0.18) | (0.02) | ||||||||||||||||||||
|
|
|
|
|
|
|
| |||||||||||||||||
Total Income from Investment Operations | 1.01 | 0.08 | 0.17 | 0.03 | ||||||||||||||||||||
|
|
|
|
|
|
|
| |||||||||||||||||
Less Distributions: | ||||||||||||||||||||||||
From net investment income | (0.82) | (0.59) | (0.34) | (0.05) | ||||||||||||||||||||
|
|
|
|
|
|
|
| |||||||||||||||||
Net Asset Value, End of Period | $ | 9.46 | $ | 9.27 | $ | 9.78 | $ | 9.95 | ||||||||||||||||
|
|
|
|
|
|
|
| |||||||||||||||||
Total Return | 11.32% | 1.00% | 1.76% | 1.31%2 | ||||||||||||||||||||
Ratios/Supplemental Data: | ||||||||||||||||||||||||
Net Assets, end of period (in thousands) | $ | 11 | $ | 1033 | $ | 1023 | $ | 1003 | ||||||||||||||||
Ratio of Expenses to Average Net Assets | ||||||||||||||||||||||||
Before expense waivers and reimbursements | 0.63% | 0.15%4 | 0.65% | 0.62%5 | ||||||||||||||||||||
After expense waivers and reimbursements | 0.60% | 0.15% | 0.60% | 0.56%5 | ||||||||||||||||||||
Ratio of Net Investment Income to Average Net Assets | ||||||||||||||||||||||||
After expense waivers and reimbursements | 9.02% | 6.32% | 3.53% | 3.15%5 | ||||||||||||||||||||
Portfolio Turnover Rate | 77% | 43% | 49% | 38%2 | ||||||||||||||||||||
| * | The Floating Rate Income Fund Plan Class Shares commenced operations on January 29, 2021. |
| 1 | Per share numbers have been calculated using the average share method. |
| 2 | Non-Annualized. |
| 3 | Represents the whole number without rounding to the 000s. |
| 4 | Includes recoupment of past waived fees. Excluding the recoupment of past waived fees, the ratio would have been 0.10%. |
| 5 | Annualized. |
See accompanying Notes to Financial Statements.
| Annual Report March 2024 / 270 |
Table of Contents
Metropolitan West Funds
Financial Highlights
HIGH YIELD BOND FUND CLASS M | ||||||||||||||||||||||||||||||||||
| YEAR ENDED MARCH 31, 2024 | YEAR ENDED MARCH 31, 2023 | YEAR ENDED MARCH 31, 2022 | YEAR ENDED MARCH 31, 2021 | YEAR ENDED MARCH 31, 2020 | ||||||||||||||||||||||||||||||
Net Asset Value, Beginning of Year | $ | 9.12 | $ | 10.06 | $ | 10.57 | $ | 9.27 | $ | 9.66 | ||||||||||||||||||||||||
|
|
|
|
|
|
|
|
|
| |||||||||||||||||||||||||
Income from Investment Operations: | ||||||||||||||||||||||||||||||||||
Net investment income1 | 0.60 | 0.50 | 0.38 | 0.36 | 0.40 | |||||||||||||||||||||||||||||
Net realized and unrealized gain (loss) | 0.16 | (0.93) | (0.51) | 1.31 | (0.39) | |||||||||||||||||||||||||||||
|
|
|
|
|
|
|
|
|
| |||||||||||||||||||||||||
Total Income (Loss) from Investment Operations | 0.76 | (0.43) | (0.13) | 1.67 | 0.01 | |||||||||||||||||||||||||||||
|
|
|
|
|
|
|
|
|
| |||||||||||||||||||||||||
Less Distributions: | ||||||||||||||||||||||||||||||||||
From net investment income | (0.60) | (0.51) | (0.38) | (0.37) | (0.40) | |||||||||||||||||||||||||||||
|
|
|
|
|
|
|
|
|
| |||||||||||||||||||||||||
Net Asset Value, End of Year | $ | 9.28 | $ | 9.12 | $ | 10.06 | $ | 10.57 | $ | 9.27 | ||||||||||||||||||||||||
|
|
|
|
|
|
|
|
|
| |||||||||||||||||||||||||
Total Return | 8.64% | (4.20)% | (1.30)% | 18.14% | (0.06)% | |||||||||||||||||||||||||||||
Ratios/Supplemental Data: | ||||||||||||||||||||||||||||||||||
Net Assets, end of year (in thousands) | $ | 111,388 | $ | 134,178 | $ | 169,941 | $ | 198,337 | $ | 126,587 | ||||||||||||||||||||||||
Ratio of Expenses to Average Net Assets | ||||||||||||||||||||||||||||||||||
Before expense waivers and reimbursements | 0.91% | 0.91% | 0.90% | 0.91% | 0.93% | |||||||||||||||||||||||||||||
After expense waivers and reimbursements | 0.85% | 0.85% | 0.85% | 0.85% | 0.85% | |||||||||||||||||||||||||||||
Ratio of Net Investment Income to Average Net Assets | ||||||||||||||||||||||||||||||||||
After expense waivers and reimbursements | 6.55% | 5.45% | 3.61% | 3.53% | 4.07% | |||||||||||||||||||||||||||||
Portfolio Turnover Rate | 82% | 116% | 117% | 108% | 181% | |||||||||||||||||||||||||||||
| 1 | Per share numbers have been calculated using the average share method. |
See accompanying Notes to Financial Statements.
| 271 / Annual Report March 2024 |
Table of Contents
Metropolitan West Funds
Financial Highlights
HIGH YIELD BOND FUND CLASS I | ||||||||||||||||||||||||||||||||||
| YEAR ENDED MARCH 31, 2024 | YEAR ENDED MARCH 31, 2023 | YEAR ENDED MARCH 31, 2022 | YEAR ENDED MARCH 31, 2021 | YEAR ENDED MARCH 31, 2020 | ||||||||||||||||||||||||||||||
Net Asset Value, Beginning of Year | $ | 9.12 | $ | 10.05 | $ | 10.57 | $ | 9.26 | $ | 9.65 | ||||||||||||||||||||||||
|
|
|
|
|
|
|
|
|
| |||||||||||||||||||||||||
Income from Investment Operations: | ||||||||||||||||||||||||||||||||||
Net investment income1 | 0.62 | 0.52 | 0.41 | 0.39 | 0.42 | |||||||||||||||||||||||||||||
Net realized and unrealized gain (loss) | 0.16 | (0.92) | (0.52) | 1.31 | (0.39) | |||||||||||||||||||||||||||||
|
|
|
|
|
|
|
|
|
| |||||||||||||||||||||||||
Total Income (Loss) from Investment Operations | 0.78 | (0.40) | (0.11) | 1.70 | 0.03 | |||||||||||||||||||||||||||||
|
|
|
|
|
|
|
|
|
| |||||||||||||||||||||||||
Less Distributions: | ||||||||||||||||||||||||||||||||||
From net investment income | (0.62) | (0.53) | (0.41) | (0.39) | (0.42) | |||||||||||||||||||||||||||||
|
|
|
|
|
|
|
|
|
| |||||||||||||||||||||||||
Net Asset Value, End of Year | $ | 9.28 | $ | 9.12 | $ | 10.05 | $ | 10.57 | $ | 9.26 | ||||||||||||||||||||||||
|
|
|
|
|
|
|
|
|
| |||||||||||||||||||||||||
Total Return | 8.91% | (3.87)% | (1.15)% | 18.56% | 0.19% | |||||||||||||||||||||||||||||
Ratios/Supplemental Data: | ||||||||||||||||||||||||||||||||||
Net Assets, end of year (in thousands) | $ | 356,322 | $ | 361,021 | $ | 552,768 | $ | 572,082 | $ | 289,352 | ||||||||||||||||||||||||
Ratio of Expenses to Average Net Assets | ||||||||||||||||||||||||||||||||||
Before expense waivers and reimbursements | 0.62% | 0.61% | 0.61% | 0.61% | 0.62% | |||||||||||||||||||||||||||||
After expense waivers and reimbursements | 0.60% | 0.60% | 0.60% | 0.60% | 0.60% | |||||||||||||||||||||||||||||
Ratio of Net Investment Income to Average Net Assets | ||||||||||||||||||||||||||||||||||
After expense waivers and reimbursements | 6.81% | 5.67% | 3.88% | 3.77% | 4.33% | |||||||||||||||||||||||||||||
Portfolio Turnover Rate | 82% | 116% | 117% | 108% | 181% | |||||||||||||||||||||||||||||
| 1 | Per share numbers have been calculated using the average share method. |
See accompanying Notes to Financial Statements.
| Annual Report March 2024 / 272 |
Table of Contents
Metropolitan West Funds
Financial Highlights
| INTERMEDIATE BOND FUND CLASS M | ||||||||||||||||||||||||||||||||||||||||||
| YEAR ENDED MARCH 31, 2024 | YEAR ENDED MARCH 31, 2023 | YEAR ENDED MARCH 31, 2022 | YEAR ENDED MARCH 31, 2021 | YEAR ENDED MARCH 31, 2020 | ||||||||||||||||||||||||||||||||||||||
Net Asset Value, Beginning of Year | $ | 9.57 | $ | 10.10 | $ | 10.74 | $ | 10.65 | $ | 10.37 | ||||||||||||||||||||||||||||||||
|
|
|
|
|
|
|
|
|
| |||||||||||||||||||||||||||||||||
Income from Investment Operations: | ||||||||||||||||||||||||||||||||||||||||||
Net investment income1 | 0.38 | 0.29 | 0.11 | 0.13 | 0.26 | |||||||||||||||||||||||||||||||||||||
Net realized and unrealized gain (loss) | (0.22) | (0.53) | (0.61) | 0.36 | 0.28 | |||||||||||||||||||||||||||||||||||||
|
|
|
|
|
|
|
|
|
| |||||||||||||||||||||||||||||||||
Total Income (Loss) from Investment Operations | 0.16 | (0.24) | (0.50) | 0.49 | 0.54 | |||||||||||||||||||||||||||||||||||||
|
|
|
|
|
|
|
|
|
| |||||||||||||||||||||||||||||||||
Less Distributions: | ||||||||||||||||||||||||||||||||||||||||||
From net investment income | (0.38) | (0.29) | (0.11) | (0.13) | (0.26) | |||||||||||||||||||||||||||||||||||||
From net capital gains | — | — | (0.03) | (0.27) | — | |||||||||||||||||||||||||||||||||||||
|
|
|
|
|
|
|
|
|
| |||||||||||||||||||||||||||||||||
Total Distributions | (0.38) | (0.29) | (0.14) | (0.40) | (0.26) | |||||||||||||||||||||||||||||||||||||
|
|
|
|
|
|
|
|
|
| |||||||||||||||||||||||||||||||||
Net Asset Value, End of Year | $ | 9.35 | $ | 9.57 | $ | 10.10 | $ | 10.74 | $ | 10.65 | ||||||||||||||||||||||||||||||||
|
|
|
|
|
|
|
|
|
| |||||||||||||||||||||||||||||||||
Total Return | 1.80% | (2.32)% | (4.63)% | 4.63% | 5.27% | |||||||||||||||||||||||||||||||||||||
Ratios/Supplemental Data: | ||||||||||||||||||||||||||||||||||||||||||
Net Assets, end of year (in thousands) | $ | 17,845 | $ | 21,053 | $ | 24,746 | $ | 36,452 | $ | 33,836 | ||||||||||||||||||||||||||||||||
Ratio of Expenses to Average Net Assets | ||||||||||||||||||||||||||||||||||||||||||
Before expense waivers and reimbursements | 0.71% | 0.72% | 0.70% | 0.71% | 0.71% | |||||||||||||||||||||||||||||||||||||
After expense waivers and reimbursements | 0.70% | 0.70% | 0.70% | 0.70% | 0.70% | |||||||||||||||||||||||||||||||||||||
Ratio of Net Investment Income to Average Net Assets | ||||||||||||||||||||||||||||||||||||||||||
After expense waivers and reimbursements | 4.10% | 3.00% | 1.04% | 1.22% | 2.49% | |||||||||||||||||||||||||||||||||||||
Portfolio Turnover Rate | 588% | 516% | 399% | 372% | 393% | |||||||||||||||||||||||||||||||||||||
| 1 | Per share numbers have been calculated using the average share method. |
See accompanying Notes to Financial Statements.
| 273 / Annual Report March 2024 |
Table of Contents
Metropolitan West Funds
Financial Highlights
INTERMEDIATE BOND FUND CLASS I | ||||||||||||||||||||||||||||||
| YEAR ENDED MARCH 31, 2024 | YEAR ENDED MARCH 31, 2023 | YEAR ENDED MARCH 31, 2022 | YEAR ENDED MARCH 31, 2021 | YEAR ENDED MARCH 31, 2020 | ||||||||||||||||||||||||||
Net Asset Value, Beginning of Year | $ | 9.56 | $ | 10.10 | $ | 10.73 | $ | 10.65 | $ | 10.36 | ||||||||||||||||||||
|
|
|
|
|
|
|
|
|
| |||||||||||||||||||||
Income from Investment Operations: | ||||||||||||||||||||||||||||||
Net investment income1 | 0.40 | 0.31 | 0.14 | 0.16 | 0.29 | |||||||||||||||||||||||||
Net realized and unrealized gain (loss) | (0.21) | (0.54) | (0.60) | 0.35 | 0.28 | |||||||||||||||||||||||||
|
|
|
|
|
|
|
|
|
| |||||||||||||||||||||
Total Income (Loss) from Investment Operations | 0.19 | (0.23) | (0.46) | 0.51 | 0.57 | |||||||||||||||||||||||||
|
|
|
|
|
|
|
|
|
| |||||||||||||||||||||
Less Distributions: | ||||||||||||||||||||||||||||||
From net investment income | (0.40) | (0.31) | (0.14) | (0.16) | (0.28) | |||||||||||||||||||||||||
From net capital gains | — | — | (0.03) | (0.27) | — | |||||||||||||||||||||||||
|
|
|
|
|
|
|
|
|
| |||||||||||||||||||||
Total Distributions | (0.40) | (0.31) | (0.17) | (0.43) | (0.28) | |||||||||||||||||||||||||
|
|
|
|
|
|
|
|
|
| |||||||||||||||||||||
Net Asset Value, End of Year | $ | 9.35 | $ | 9.56 | $ | 10.10 | $ | 10.73 | $ | 10.65 | ||||||||||||||||||||
|
|
|
|
|
|
|
|
|
| |||||||||||||||||||||
Total Return | 2.12% | (2.22)% | (4.33)% | 4.76% | 5.60% | |||||||||||||||||||||||||
Ratios/Supplemental Data: | ||||||||||||||||||||||||||||||
Net Assets, end of year (in thousands) | $ | 952,523 | $ | 876,918 | $ | 768,271 | $ | 766,063 | $ | 693,038 | ||||||||||||||||||||
Ratio of Expenses to Average Net Assets | ||||||||||||||||||||||||||||||
Before expense waivers and reimbursements | 0.48%2 | 0.49% | 0.47% | 0.48% | 0.48% | |||||||||||||||||||||||||
After expense waivers and reimbursements | 0.48% | 0.49% | 0.47% | 0.48% | 0.48% | |||||||||||||||||||||||||
Ratio of Net Investment Income to Average Net Assets | ||||||||||||||||||||||||||||||
After expense waivers and reimbursements | 4.33% | 3.26% | 1.29% | 1.44% | 2.69% | |||||||||||||||||||||||||
Portfolio Turnover Rate | 588% | 516% | 399% | 372% | 393% | |||||||||||||||||||||||||
| 1 | Per share numbers have been calculated using the average share method. |
| 2 | Includes recoupment of past waived fees. Excluding the recoupment of past waived fees, the ratio would have been 0.48%. |
See accompanying Notes to Financial Statements.
| Annual Report March 2024 / 274 |
Table of Contents
Metropolitan West Funds
Financial Highlights
INVESTMENT GRADE CREDIT FUND CLASS M | ||||||||||||||||||||||||||||||
| YEAR ENDED MARCH 31, 2024 | YEAR ENDED MARCH 31, 2023 | YEAR ENDED MARCH 31, 2022 | YEAR ENDED MARCH 31, 2021 | YEAR ENDED MARCH 31, 2020 | ||||||||||||||||||||||||||
Net Asset Value, Beginning of Year | $ | 7.82 | $ | 8.70 | $ | 9.67 | $ | 9.65 | $ | 10.31 | ||||||||||||||||||||
|
|
|
|
|
|
|
|
|
| |||||||||||||||||||||
Income from Investment Operations: | ||||||||||||||||||||||||||||||
Net investment income1 | 0.41 | 0.63 | 0.45 | 0.59 | 1.05 | |||||||||||||||||||||||||
Net realized and unrealized gain (loss) | (0.11) | (0.84) | (0.95) | 0.17 | (0.55) | |||||||||||||||||||||||||
|
|
|
|
|
|
|
|
|
| |||||||||||||||||||||
Total Income (Loss) from Investment Operations | 0.30 | (0.21) | (0.50) | 0.76 | 0.50 | |||||||||||||||||||||||||
|
|
|
|
|
|
|
|
|
| |||||||||||||||||||||
Less Distributions: | ||||||||||||||||||||||||||||||
From net investment income | (0.42) | (0.65) | (0.46) | (0.63) | (1.05) | |||||||||||||||||||||||||
From net capital gains | — | — | (0.01) | (0.11) | (0.11) | |||||||||||||||||||||||||
From tax return of capital | — | (0.02) | — | — | — | |||||||||||||||||||||||||
|
|
|
|
|
|
|
|
|
| |||||||||||||||||||||
Total Distributions | (0.42) | (0.67) | (0.47) | (0.74) | (1.16) | |||||||||||||||||||||||||
|
|
|
|
|
|
|
|
|
| |||||||||||||||||||||
Net Asset Value, End of Year | $ | 7.70 | $ | 7.82 | $ | 8.70 | $ | 9.67 | $ | 9.65 | ||||||||||||||||||||
|
|
|
|
|
|
|
|
|
| |||||||||||||||||||||
Total Return | 4.01% | (2.24)% | (5.42)% | 7.97% | 4.80% | |||||||||||||||||||||||||
Ratios/Supplemental Data: | ||||||||||||||||||||||||||||||
Net Assets, end of year (in thousands) | $ | 6,041 | $ | 3,026 | $ | 2,259 | $ | 2,126 | $ | 837 | ||||||||||||||||||||
Ratio of Expenses to Average Net Assets | ||||||||||||||||||||||||||||||
Before expense waivers and reimbursements | 2.56% | 3.90% | 2.16% | 2.93% | 3.86% | |||||||||||||||||||||||||
After expense waivers and reimbursements | 0.70% | 0.70% | 0.70% | 0.70% | 0.70% | |||||||||||||||||||||||||
Ratio of Net Investment Income to Average Net Assets | ||||||||||||||||||||||||||||||
After expense waivers and reimbursements | 5.33% | 7.93% | 4.75% | 6.02% | 10.33% | |||||||||||||||||||||||||
Portfolio Turnover Rate | 491% | 231% | 345% | 92% | 76% | |||||||||||||||||||||||||
| 1 | Per share numbers have been calculated using the average share method. |
See accompanying Notes to Financial Statements.
| 275 / Annual Report March 2024 |
Table of Contents
Metropolitan West Funds
Financial Highlights
INVESTMENT GRADE CREDIT FUND CLASS I | ||||||||||||||||||||||||||||||
| YEAR ENDED MARCH 31, 2024 | YEAR ENDED MARCH 31, 2023 | YEAR ENDED MARCH 31, 2022 | YEAR ENDED MARCH 31, 2021 | YEAR ENDED MARCH 31, 2020 | ||||||||||||||||||||||||||
Net Asset Value, Beginning of Year | $ | 7.82 | $ | 8.70 | $ | 9.67 | $ | 9.65 | $ | 10.31 | ||||||||||||||||||||
|
|
|
|
|
|
|
|
|
| |||||||||||||||||||||
Income from Investment Operations: | ||||||||||||||||||||||||||||||
Net investment income1 | 0.42 | 0.67 | 0.45 | 0.65 | 1.07 | |||||||||||||||||||||||||
Net realized and unrealized gain (loss) | (0.10) | (0.86) | (0.93) | 0.13 | (0.55) | |||||||||||||||||||||||||
|
|
|
|
|
|
|
|
|
| |||||||||||||||||||||
Total Income (Loss) from Investment Operations | 0.32 | (0.19) | (0.48) | 0.78 | 0.52 | |||||||||||||||||||||||||
|
|
|
|
|
|
|
|
|
| |||||||||||||||||||||
Less Distributions: | ||||||||||||||||||||||||||||||
From net investment income | (0.44) | (0.67) | (0.48) | (0.65) | (1.07) | |||||||||||||||||||||||||
From net capital gains | — | — | (0.01) | (0.11) | (0.11) | |||||||||||||||||||||||||
From tax return of capital | — | (0.02) | — | — | — | |||||||||||||||||||||||||
|
|
|
|
|
|
|
|
|
| |||||||||||||||||||||
Total Distributions | (0.44) | (0.69) | (0.49) | (0.76) | (1.18) | |||||||||||||||||||||||||
|
|
|
|
|
|
|
|
|
| |||||||||||||||||||||
Net Asset Value, End of Year | $ | 7.70 | $ | 7.82 | $ | 8.70 | $ | 9.67 | $ | 9.65 | ||||||||||||||||||||
|
|
|
|
|
|
|
|
|
| |||||||||||||||||||||
Total Return | 4.23% | (2.03)% | (5.22)% | 8.20% | 5.02% | |||||||||||||||||||||||||
Ratios/Supplemental Data: | ||||||||||||||||||||||||||||||
Net Assets, end of year (in thousands) | $ | 20,578 | $ | 7,299 | $ | 8,640 | $ | 10,105 | $ | 6,431 | ||||||||||||||||||||
Ratio of Expenses to Average Net Assets | ||||||||||||||||||||||||||||||
Before expense waivers and reimbursements | 2.30% | 3.62% | 1.87% | 2.68% | 3.61% | |||||||||||||||||||||||||
After expense waivers and reimbursements | 0.49% | 0.49% | 0.49% | 0.49% | 0.49% | |||||||||||||||||||||||||
Ratio of Net Investment Income to Average Net Assets | ||||||||||||||||||||||||||||||
After expense waivers and reimbursements | 5.53% | 8.38% | 4.79% | 6.56% | 10.54% | |||||||||||||||||||||||||
Portfolio Turnover Rate | 491% | 231% | 345% | 92% | 76% | |||||||||||||||||||||||||
| 1 | Per share numbers have been calculated using the average share method. |
See accompanying Notes to Financial Statements.
| Annual Report March 2024 / 276 |
Table of Contents
Metropolitan West Funds
Financial Highlights
LOW DURATION BOND FUND CLASS M | ||||||||||||||||||||||||||||||
| YEAR ENDED MARCH 31, 2024 | YEAR ENDED MARCH 31, 2023 | YEAR ENDED MARCH 31, 2022 | YEAR ENDED MARCH 31, 2021 | YEAR ENDED MARCH 31, 2020 | ||||||||||||||||||||||||||
Net Asset Value, Beginning of Year | $ | 8.30 | $ | 8.57 | $ | 8.88 | $ | 8.65 | $ | 8.68 | ||||||||||||||||||||
|
|
|
|
|
|
|
|
|
| |||||||||||||||||||||
Income from Investment Operations: | ||||||||||||||||||||||||||||||
Net investment income1 | 0.34 | 0.22 | 0.08 | 0.11 | 0.20 | |||||||||||||||||||||||||
Net realized and unrealized gain (loss) | (0.03) | (0.26) | (0.31) | 0.23 | (0.03) | |||||||||||||||||||||||||
|
|
|
|
|
|
|
|
|
| |||||||||||||||||||||
Total Income (Loss) from Investment Operations | 0.31 | (0.04) | (0.23) | 0.34 | 0.17 | |||||||||||||||||||||||||
|
|
|
|
|
|
|
|
|
| |||||||||||||||||||||
Less Distributions: | ||||||||||||||||||||||||||||||
From net investment income | (0.34) | (0.23) | (0.08) | (0.11) | (0.20) | |||||||||||||||||||||||||
|
|
|
|
|
|
|
|
|
| |||||||||||||||||||||
Net Asset Value, End of Year | $ | 8.27 | $ | 8.30 | $ | 8.57 | $ | 8.88 | $ | 8.65 | ||||||||||||||||||||
|
|
|
|
|
|
|
|
|
| |||||||||||||||||||||
Total Return | 3.82% | (0.46)% | (2.65)% | 3.91% | 1.93% | |||||||||||||||||||||||||
Ratios/Supplemental Data: | ||||||||||||||||||||||||||||||
Net Assets, end of year (in thousands) | $ | 152,721 | $ | 298,833 | $ | 474,682 | $ | 445,538 | $ | 449,701 | ||||||||||||||||||||
Ratio of Expenses to Average Net Assets | ||||||||||||||||||||||||||||||
Before expense waivers and reimbursements | 0.62% | 0.63% | 0.62% | 0.62% | 0.62% | |||||||||||||||||||||||||
After expense waivers and reimbursements | 0.62% | 0.63% | 0.62% | 0.62% | 0.62% | |||||||||||||||||||||||||
Ratio of Net Investment Income to Average Net Assets | ||||||||||||||||||||||||||||||
After expense waivers and reimbursements | 4.08% | 2.66% | 0.87% | 1.22% | 2.32% | |||||||||||||||||||||||||
Portfolio Turnover Rate | 461% | 450% | 347% | 256% | 233% | |||||||||||||||||||||||||
| 1 | Per share numbers have been calculated using the average share method. |
See accompanying Notes to Financial Statements.
| 277 / Annual Report March 2024 |
Table of Contents
Metropolitan West Funds
Financial Highlights
LOW DURATION BOND FUND CLASS I | ||||||||||||||||||||||||||||||
| YEAR ENDED MARCH 31, 2024 | YEAR ENDED MARCH 31, 2023 | YEAR ENDED MARCH 31, 2022 | YEAR ENDED MARCH 31, 2021 | YEAR ENDED MARCH 31, 2020 | ||||||||||||||||||||||||||
Net Asset Value, Beginning of Year | $ | 8.30 | $ | 8.58 | $ | 8.88 | $ | 8.65 | $ | 8.68 | ||||||||||||||||||||
|
|
|
|
|
|
|
|
|
| |||||||||||||||||||||
Income from Investment Operations: | ||||||||||||||||||||||||||||||
Net investment income1 | 0.35 | 0.24 | 0.09 | 0.12 | 0.22 | |||||||||||||||||||||||||
Net realized and unrealized gain (loss) | (0.03) | (0.28) | (0.30) | 0.24 | (0.03) | |||||||||||||||||||||||||
|
|
|
|
|
|
|
|
|
| |||||||||||||||||||||
Total Income (Loss) from Investment Operations | 0.32 | (0.04) | (0.21) | 0.36 | 0.19 | |||||||||||||||||||||||||
|
|
|
|
|
|
|
|
|
| |||||||||||||||||||||
Less Distributions: | ||||||||||||||||||||||||||||||
From net investment income | (0.35) | (0.24) | (0.09) | (0.13) | (0.22) | |||||||||||||||||||||||||
|
|
|
|
|
|
|
|
|
| |||||||||||||||||||||
Net Asset Value, End of Year | $ | 8.27 | $ | 8.30 | $ | 8.58 | $ | 8.88 | $ | 8.65 | ||||||||||||||||||||
|
|
|
|
|
|
|
|
|
| |||||||||||||||||||||
Total Return | 4.03% | (0.37)% | (2.34)% | 4.12% | 2.14% | |||||||||||||||||||||||||
Ratios/Supplemental Data: | ||||||||||||||||||||||||||||||
Net Assets, end of year (in thousands) | $ | 1,111,745 | $ | 1,479,311 | $ | 2,018,926 | $ | 2,034,540 | $ | 1,456,456 | ||||||||||||||||||||
Ratio of Expenses to Average Net Assets | ||||||||||||||||||||||||||||||
Before expense waivers and reimbursements | 0.42% | 0.42% | 0.41% | 0.42% | 0.42% | |||||||||||||||||||||||||
After expense waivers and reimbursements | 0.42% | 0.42% | 0.41% | 0.42% | 0.42% | |||||||||||||||||||||||||
Ratio of Net Investment Income to Average Net Assets | ||||||||||||||||||||||||||||||
After expense waivers and reimbursements | 4.31% | 2.85% | 1.07% | 1.39% | 2.51% | |||||||||||||||||||||||||
Portfolio Turnover Rate | 461% | 450% | 347% | 256% | 233% | |||||||||||||||||||||||||
| 1 | Per share numbers have been calculated using the average share method. |
See accompanying Notes to Financial Statements.
| Annual Report March 2024 / 278 |
Table of Contents
Metropolitan West Funds
Financial Highlights
LOW DURATION BOND FUND ADMINISTRATIVE CLASS | ||||||||||||||||||||||||||||||
| YEAR ENDED MARCH 31, 2024 | YEAR ENDED MARCH 31, 2023 | YEAR ENDED MARCH 31, 2022 | YEAR ENDED MARCH 31, 2021 | YEAR ENDED MARCH 31, 2020 | ||||||||||||||||||||||||||
Net Asset Value, Beginning of Year | $ | 10.73 | $ | 11.08 | $ | 11.48 | $ | 11.18 | $ | 11.21 | ||||||||||||||||||||
|
|
|
|
|
|
|
|
|
| |||||||||||||||||||||
Income from Investment Operations: | ||||||||||||||||||||||||||||||
Net investment income1 | 0.44 | 0.22 | 0.09 | 0.13 | 0.26 | |||||||||||||||||||||||||
Net realized and unrealized gain (loss) | (0.06) | (0.28) | (0.40) | 0.30 | (0.05) | |||||||||||||||||||||||||
|
|
|
|
|
|
|
|
|
| |||||||||||||||||||||
Total Income (Loss) from Investment Operations | 0.38 | (0.06) | (0.31) | 0.43 | 0.21 | |||||||||||||||||||||||||
|
|
|
|
|
|
|
|
|
| |||||||||||||||||||||
Less Distributions: | ||||||||||||||||||||||||||||||
From net investment income | (0.43) | (0.29) | (0.09) | (0.13) | (0.24) | |||||||||||||||||||||||||
|
|
|
|
|
|
|
|
|
| |||||||||||||||||||||
Net Asset Value, End of Year | $ | 10.68 | $ | 10.73 | $ | 11.08 | $ | 11.48 | $ | 11.18 | ||||||||||||||||||||
|
|
|
|
|
|
|
|
|
| |||||||||||||||||||||
Total Return | 3.77% | (0.48)% | (2.74)% | 3.83% | 1.90% | |||||||||||||||||||||||||
Ratios/Supplemental Data: | ||||||||||||||||||||||||||||||
Net Assets, end of year (in thousands) | $ | 10 | $ | 7762 | $ | 1,709 | $ | 88 | $ | 94 | ||||||||||||||||||||
Ratio of Expenses to Average Net Assets | ||||||||||||||||||||||||||||||
Before expense waivers and reimbursements | 0.70% | 0.72% | 0.72% | 0.73% | 0.72% | |||||||||||||||||||||||||
After expense waivers and reimbursements | 0.70% | 0.72% | 0.72% | 0.73% | 0.72% | |||||||||||||||||||||||||
Ratio of Net Investment Income to Average Net Assets | ||||||||||||||||||||||||||||||
After expense waivers and reimbursements | 4.18% | 2.05% | 0.80% | 1.11% | 2.27% | |||||||||||||||||||||||||
Portfolio Turnover Rate | 461% | 450% | 347% | 256% | 233% | |||||||||||||||||||||||||
| 1 | Per share numbers have been calculated using the average share method. |
| 2 | Represents the whole number without rounding to the 000s. |
See accompanying Notes to Financial Statements.
| 279 / Annual Report March 2024 |
Table of Contents
Metropolitan West Funds
Financial Highlights
OPPORTUNISTIC HIGH INCOME CREDIT FUND CLASS M* | ||||||||||||||||||||
| YEAR ENDED MARCH 31, 2024 | YEAR ENDED MARCH 31, 2023 | PERIOD ENDED MARCH 31, 2022 | ||||||||||||||||||
Net Asset Value, Beginning of Period | $ | 7.55 | $ | 8.99 | $10.00 | |||||||||||||||
|
|
|
|
| ||||||||||||||||
Income from Investment Operations: | ||||||||||||||||||||
Net investment income1 | 0.55 | 0.55 | 0.88 | |||||||||||||||||
Net realized and unrealized gain (loss) | 0.14 | (1.25) | (1.07) | |||||||||||||||||
|
|
|
|
| ||||||||||||||||
Total Income (Loss) from Investment Operations | 0.69 | (0.70) | (0.19) | |||||||||||||||||
|
|
|
|
| ||||||||||||||||
Less Distributions: | ||||||||||||||||||||
From net investment income | (0.58) | (0.72) | (0.76) | |||||||||||||||||
From net capital gains | — | — | (0.06) | |||||||||||||||||
From tax return of capital | — | (0.02) | — | |||||||||||||||||
|
|
|
|
| ||||||||||||||||
Total Distributions | (0.58) | (0.74) | (0.82) | |||||||||||||||||
|
|
|
|
| ||||||||||||||||
Net Asset Value, End of Period | $ | 7.66 | $ | 7.55 | $ 8.99 | |||||||||||||||
|
|
|
|
| ||||||||||||||||
Total Return | 9.55% | (7.74)% | (2.09)%2 | |||||||||||||||||
Ratios/Supplemental Data: | ||||||||||||||||||||
Net Assets, end of period (in thousands) | $ | 267 | $ | 314 | $70 | |||||||||||||||
Ratio of Expenses to Average Net Assets | ||||||||||||||||||||
Before expense waivers and reimbursements | 13.25% | 10.77% | 5.78%3 | |||||||||||||||||
After expense waivers and reimbursements | 0.85% | 0.85% | 0.85%3 | |||||||||||||||||
Ratio of Net Investment Income to Average Net Assets | ||||||||||||||||||||
After expense waivers and reimbursements | 7.29% | 7.26% | 14.30%3 | |||||||||||||||||
Portfolio Turnover Rate | 63% | 131% | 104%2 | |||||||||||||||||
| * | The Opportunistic High Income Credit Fund Class M Shares commenced operations on August 2, 2021. |
| 1 | Per share numbers have been calculated using the average share method. |
| 2 | Non-Annualized. |
| 3 | Annualized. |
See accompanying Notes to Financial Statements.
| Annual Report March 2024 / 280 |
Table of Contents
Metropolitan West Funds
Financial Highlights
OPPORTUNISTIC HIGH INCOME CREDIT FUND | ||||||||||||||||||||
| YEAR ENDED MARCH 31, 2024 | YEAR ENDED MARCH 31, 2023 | PERIOD ENDED MARCH 31, 2022 | ||||||||||||||||||
Net Asset Value, Beginning of Period | $ | 7.55 | $ | 8.98 | $10.00 | |||||||||||||||
|
|
|
|
| ||||||||||||||||
Income from Investment Operations: | ||||||||||||||||||||
Net investment income1 | 0.57 | 0.71 | 0.80 | |||||||||||||||||
Net realized and unrealized gain (loss) | 0.12 | (1.38) | (0.98) | |||||||||||||||||
|
|
|
|
| ||||||||||||||||
Total Income (Loss) from Investment Operations | 0.69 | (0.67) | (0.18) | |||||||||||||||||
|
|
|
|
| ||||||||||||||||
Less Distributions: | ||||||||||||||||||||
From net investment income | (0.59) | (0.74) | (0.78) | |||||||||||||||||
From net capital gains | — | — | (0.06) | |||||||||||||||||
From tax return of capital | — | (0.02) | — | |||||||||||||||||
|
|
|
|
| ||||||||||||||||
Total Distributions | (0.59) | (0.76) | (0.84) | |||||||||||||||||
|
|
|
|
| ||||||||||||||||
Net Asset Value, End of Period | $ | 7.65 | $ | 7.55 | $ 8.98 | |||||||||||||||
|
|
|
|
| ||||||||||||||||
Total Return | 9.66% | (7.41)% | (2.04)%2 | |||||||||||||||||
Ratios/Supplemental Data: | ||||||||||||||||||||
Net Assets, end of period (in thousands) | $ | 1,225 | $ | 1,759 | $2,971 | |||||||||||||||
Ratio of Expenses to Average Net Assets | ||||||||||||||||||||
Before expense waivers and reimbursements | 13.65% | 8.88% | 5.42%3 | |||||||||||||||||
After expense waivers and reimbursements | 0.60% | 0.60% | 0.60%3 | |||||||||||||||||
Ratio of Net Investment Income to Average Net Assets | ||||||||||||||||||||
After expense waivers and reimbursements | 7.63% | 9.07% | 12.43%3 | |||||||||||||||||
Portfolio Turnover Rate | 63% | 131% | 104%2 | |||||||||||||||||
| * | The Opportunistic High Income Credit Fund Class I Shares commenced operations on August 2, 2021. |
| 1 | Per share numbers have been calculated using the average share method. |
| 2 | Non-Annualized. |
| 3 | Annualized. |
See accompanying Notes to Financial Statements.
| 281 / Annual Report March 2024 |
Table of Contents
Metropolitan West Funds
Financial Highlights
STRATEGIC INCOME FUND CLASS M | ||||||||||||||||||||||||||||||
| YEAR ENDED MARCH 31, 2024 | YEAR ENDED MARCH 31, 2023 | YEAR ENDED MARCH 31, 2022 | YEAR ENDED MARCH 31, 2021 | YEAR ENDED MARCH 31, 2020 | ||||||||||||||||||||||||||
Net Asset Value, Beginning of Year | $ | 6.24 | $ | 6.89 | $ | 7.83 | $ | 7.29 | $ | 7.89 | ||||||||||||||||||||
|
|
|
|
|
|
|
|
|
| |||||||||||||||||||||
Income from Investment Operations: | ||||||||||||||||||||||||||||||
Net investment income1 | 0.45 | 0.51 | 0.73 | 0.47 | 0.31 | |||||||||||||||||||||||||
Net realized and unrealized gain (loss) | (0.05) | (0.54) | (0.94) | 0.54 | (0.60) | |||||||||||||||||||||||||
|
|
|
|
|
|
|
|
|
| |||||||||||||||||||||
Total Income (Loss) from Investment Operations | 0.40 | (0.03) | (0.21) | 1.01 | (0.29) | |||||||||||||||||||||||||
|
|
|
|
|
|
|
|
|
| |||||||||||||||||||||
Less Distributions: | ||||||||||||||||||||||||||||||
From net investment income | (0.46) | (0.62) | (0.73) | (0.47) | (0.31) | |||||||||||||||||||||||||
|
|
|
|
|
|
|
|
|
| |||||||||||||||||||||
Net Asset Value, End of Year | $ | 6.18 | $ | 6.24 | $ | 6.89 | $ | 7.83 | $ | 7.29 | ||||||||||||||||||||
|
|
|
|
|
|
|
|
|
| |||||||||||||||||||||
Total Return | 6.67% | (0.23)% | (2.99)% | 14.14% | (3.86)% | |||||||||||||||||||||||||
Ratios/Supplemental Data: | ||||||||||||||||||||||||||||||
Net Assets, end of year (in thousands) | $ | 52,304 | $ | 50,681 | $ | 16,813 | $ | 15,471 | $ | 10,413 | ||||||||||||||||||||
Ratio of Expenses to Average Net Assets | ||||||||||||||||||||||||||||||
Before expense waivers and reimbursements | 1.49% | 1.86% | 3.02% | 2.73% | 2.43% | |||||||||||||||||||||||||
After expense waivers and reimbursements | 1.04% | 1.04% | 1.04% | 2.28% | 2.35% | |||||||||||||||||||||||||
Ratio of Net Investment Income to Average Net Assets | ||||||||||||||||||||||||||||||
After expense waivers and reimbursements | 7.26% | 8.24% | 9.71% | 6.12% | 3.95% | |||||||||||||||||||||||||
Portfolio Turnover Rate | 260% | 177% | 77% | 24% | 50% | |||||||||||||||||||||||||
| 1 | Per share numbers have been calculated using the average share method. |
See accompanying Notes to Financial Statements.
| Annual Report March 2024 / 282 |
Table of Contents
Metropolitan West Funds
Financial Highlights
STRATEGIC INCOME FUND CLASS I | ||||||||||||||||||||||||||||||
| YEAR ENDED MARCH 31, 2024 | YEAR ENDED MARCH 31, 2023 | YEAR ENDED MARCH 31, 2022 | YEAR ENDED MARCH 31, 2021 | YEAR ENDED MARCH 31, 2020 | ||||||||||||||||||||||||||
Net Asset Value, Beginning of Year | $ | 6.24 | $ | 6.89 | $ | 7.83 | $ | 7.29 | $ | 7.89 | ||||||||||||||||||||
|
|
|
|
|
|
|
|
|
| |||||||||||||||||||||
Income from Investment Operations: | ||||||||||||||||||||||||||||||
Net investment income1 | 0.46 | 0.57 | 0.76 | 0.46 | 0.33 | |||||||||||||||||||||||||
Net realized and unrealized gain (loss) | (0.05) | (0.59) | (0.95) | 0.56 | (0.60) | |||||||||||||||||||||||||
|
|
|
|
|
|
|
|
|
| |||||||||||||||||||||
Total Income (Loss) from Investment Operations | 0.41 | (0.02) | (0.19) | 1.02 | (0.27) | |||||||||||||||||||||||||
|
|
|
|
|
|
|
|
|
| |||||||||||||||||||||
Less Distributions: | ||||||||||||||||||||||||||||||
From net investment income | (0.47) | (0.63) | (0.75) | (0.48) | (0.33) | |||||||||||||||||||||||||
|
|
|
|
|
|
|
|
|
| |||||||||||||||||||||
Net Asset Value, End of Year | $ | 6.18 | $ | 6.24 | $ | 6.89 | $ | 7.83 | $ | 7.29 | ||||||||||||||||||||
|
|
|
|
|
|
|
|
|
| |||||||||||||||||||||
Total Return | 7.10% | –% | (2.76)% | 14.19% | (3.61)% | |||||||||||||||||||||||||
Ratios/Supplemental Data: | ||||||||||||||||||||||||||||||
Net Assets, end of year (in thousands) | $ | 22,938 | $ | 15,540 | $ | 9,310 | $ | 9,799 | $ | 48,252 | ||||||||||||||||||||
Ratio of Expenses to Average Net Assets | ||||||||||||||||||||||||||||||
Before expense waivers and reimbursements | 1.22% | 1.65% | 2.77% | 2.08%2 | 2.20% | |||||||||||||||||||||||||
After expense waivers and reimbursements | 0.80% | 0.80% | 0.80% | 2.08% | 2.10% | |||||||||||||||||||||||||
Ratio of Net Investment Income to Average Net Assets | ||||||||||||||||||||||||||||||
After expense waivers and reimbursements | 7.46% | 9.08% | 10.06% | 5.92% | 4.23% | |||||||||||||||||||||||||
Portfolio Turnover Rate | 260% | 177% | 77% | 24% | 50% | |||||||||||||||||||||||||
| 1 | Per share numbers have been calculated using the average share method. |
| 2 | Includes recoupment of past waived fees. Excluding the recoupment of past waived fees, the ratio would have been 1.93%. |
See accompanying Notes to Financial Statements.
| 283 / Annual Report March 2024 |
Table of Contents
Metropolitan West Funds
Financial Highlights
SUSTAINABLE SECURITIZED FUND CLASS M* | ||||||||||||||||||
| YEAR ENDED MARCH 31, 2024 | YEAR ENDED MARCH 31, 2023 | PERIOD ENDED MARCH 31, 2022 | ||||||||||||||||
Net Asset Value, Beginning of Period | $ | 8.45 | $ | 9.36 | $10.00 | |||||||||||||
|
|
|
|
| ||||||||||||||
Income from Investment Operations: | ||||||||||||||||||
Net investment income1 | 0.42 | 0.21 | 0.05 | |||||||||||||||
Net realized and unrealized loss | (0.07) | (0.88) | (0.61) | |||||||||||||||
|
|
|
|
| ||||||||||||||
Total Income (Loss) from Investment Operations | 0.35 | (0.67) | (0.56) | |||||||||||||||
|
|
|
|
| ||||||||||||||
Less Distributions: | ||||||||||||||||||
From net investment income | (0.41) | (0.24) | (0.08) | |||||||||||||||
From tax return of capital | (0.05) | — | — | |||||||||||||||
|
|
|
|
| ||||||||||||||
Total Distributions | (0.46) | (0.24) | (0.08) | |||||||||||||||
|
|
|
|
| ||||||||||||||
Net Asset Value, End of Period | $ | 8.34 | $ | 8.45 | $9.36 | |||||||||||||
|
|
|
|
| ||||||||||||||
Total Return | 4.33% | (7.15)% | (5.60)%2 | |||||||||||||||
Ratios/Supplemental Data: | ||||||||||||||||||
Net Assets, end of period (in thousands) | $ | 44 | $ | 50 | $16 | |||||||||||||
Ratio of Expenses to Average Net Assets | ||||||||||||||||||
Before expense waivers and reimbursements | 4.15% | 3.35% | 2.15%3 | |||||||||||||||
After expense waivers and reimbursements | 0.70% | 0.70% | 0.79%3 | |||||||||||||||
Ratio of Net Investment Income to Average Net Assets | ||||||||||||||||||
After expense waivers and reimbursements | 5.13% | 2.43% | 0.97%3 | |||||||||||||||
Portfolio Turnover Rate | 312% | 312% | 276%2 | |||||||||||||||
| * | The Sustainable Securitized Fund Class M Shares commenced operations on October 1, 2021. |
| 1 | Per share numbers have been calculated using the average share method. |
| 2 | Non-Annualized. |
| 3 | Annualized. |
See accompanying Notes to Financial Statements.
| Annual Report March 2024 / 284 |
Table of Contents
Metropolitan West Funds
Financial Highlights
SUSTAINABLE SECURITIZED FUND CLASS I* | ||||||||||||||||||
| YEAR ENDED MARCH 31, 2024 | YEAR ENDED MARCH 31, 2023 | PERIOD ENDED MARCH 31, 2022 | ||||||||||||||||
Net Asset Value, Beginning of Period | $ | 8.45 | $ | 9.37 | $10.00 | |||||||||||||
|
|
|
|
| ||||||||||||||
Income from Investment Operations: | ||||||||||||||||||
Net investment income1 | 0.47 | 0.23 | 0.05 | |||||||||||||||
Net realized and unrealized loss | (0.09) | (0.89) | (0.63) | |||||||||||||||
|
|
|
|
| ||||||||||||||
Total Income (Loss) from Investment Operations | 0.38 | (0.66) | (0.58) | |||||||||||||||
|
|
|
|
| ||||||||||||||
Less Distributions: | ||||||||||||||||||
From net investment income | (0.43) | (0.26) | (0.05) | |||||||||||||||
From tax return of capital | (0.05) | — | — | |||||||||||||||
|
|
|
|
| ||||||||||||||
Total Distributions | (0.48) | (0.26) | (0.05) | |||||||||||||||
|
|
|
|
| ||||||||||||||
Net Asset Value, End of Period | $ | 8.35 | $ | 8.45 | $9.37 | |||||||||||||
|
|
|
|
| ||||||||||||||
Total Return | 4.67% | (7.04)% | (5.87)%2 | |||||||||||||||
Ratios/Supplemental Data: | ||||||||||||||||||
Net Assets, end of period (in thousands) | $ | 7,715 | $ | 8,361 | $10,655 | |||||||||||||
Ratio of Expenses to Average Net Assets | ||||||||||||||||||
Before expense waivers and reimbursements | 3.82% | 2.93% | 1.80%3 | |||||||||||||||
After expense waivers and reimbursements | 0.49% | 0.49% | 0.49%3 | |||||||||||||||
Ratio of Net Investment Income to Average Net Assets | ||||||||||||||||||
After expense waivers and reimbursements | 5.67% | 2.61% | 0.94%3 | |||||||||||||||
Portfolio Turnover Rate | 312% | 312% | 276%2 | |||||||||||||||
| * | The Sustainable Securitized Fund Class I Shares commenced operations on October 1, 2021. |
| 1 | Per share numbers have been calculated using the average share method. |
| 2 | Non-Annualized. |
| 3 | Annualized. |
See accompanying Notes to Financial Statements.
| 285 / Annual Report March 2024 |
Table of Contents
Metropolitan West Funds
Financial Highlights
| TOTAL RETURN BOND FUND CLASS M | ||||||||||||||||||||||||||||||
| YEAR ENDED MARCH 31, 2024 | YEAR ENDED MARCH 31, 2023 | YEAR ENDED MARCH 31, 2022 | YEAR ENDED MARCH 31, 2021 | YEAR ENDED MARCH 31, 2020 | ||||||||||||||||||||||||||
Net Asset Value, Beginning of Year | $ | 9.28 | $ | 10.19 | $ | 10.82 | $ | 11.12 | $ | 10.64 | ||||||||||||||||||||
|
|
|
|
|
|
|
|
|
| |||||||||||||||||||||
Income from Investment Operations: | ||||||||||||||||||||||||||||||
Net investment income1 | 0.37 | 0.28 | 0.13 | 0.15 | 0.26 | |||||||||||||||||||||||||
Net realized and unrealized gain (loss) | (0.26) | (0.91) | (0.63) | 0.24 | 0.57 | |||||||||||||||||||||||||
|
|
|
|
|
|
|
|
|
| |||||||||||||||||||||
Total Income (Loss) from Investment Operations | 0.11 | (0.63) | (0.50) | 0.39 | 0.83 | |||||||||||||||||||||||||
|
|
|
|
|
|
|
|
|
| |||||||||||||||||||||
Less Distributions: | ||||||||||||||||||||||||||||||
From net investment income | (0.37) | (0.28) | (0.13) | (0.15) | (0.26) | |||||||||||||||||||||||||
From net capital gains | — | — | (0.00)2 | (0.54) | (0.09) | |||||||||||||||||||||||||
Total Distributions | (0.37) | (0.28) | (0.13) | (0.69) | (0.35) | |||||||||||||||||||||||||
|
|
|
|
|
|
|
|
|
| |||||||||||||||||||||
Net Asset Value, End of Year | $ | 9.02 | $ | 9.28 | $ | 10.19 | $ | 10.82 | $ | 11.12 | ||||||||||||||||||||
|
|
|
|
|
|
|
|
|
| |||||||||||||||||||||
Total Return | 1.24% | (6.10)% | (4.69)% | 3.31% | 7.93% | |||||||||||||||||||||||||
Ratios/Supplemental Data: | ||||||||||||||||||||||||||||||
Net Assets, end of year (in thousands) | $ | 3,826,231 | $ | 6,442,440 | $ | 6,213,223 | $ | 7,154,434 | $ | 8,979,527 | ||||||||||||||||||||
Ratio of Expenses to Average Net Assets | ||||||||||||||||||||||||||||||
Before expense waivers and reimbursements | 0.66% | 0.67% | 0.65% | 0.67% | 0.67% | |||||||||||||||||||||||||
After expense waivers and reimbursements | 0.66% | 0.67% | 0.65% | 0.67% | 0.67% | |||||||||||||||||||||||||
Ratio of Net Investment Income to Average Net Assets | ||||||||||||||||||||||||||||||
After expense waivers and reimbursements | 4.11% | 3.04% | 1.17% | 1.28% | 2.38% | |||||||||||||||||||||||||
Portfolio Turnover Rate | 450% | 426% | 467% | 470% | 405% | |||||||||||||||||||||||||
| 1 | Per share numbers have been calculated using the average share method. |
| 2 | Amount is greater than $(0.005) per share. |
See accompanying Notes to Financial Statements.
| Annual Report March 2024 / 286 |
Table of Contents
Metropolitan West Funds
Financial Highlights
TOTAL RETURN BOND FUND CLASS I | ||||||||||||||||||||||||||||||
| YEAR ENDED MARCH 31, 2024 | YEAR ENDED MARCH 31, 2023 | YEAR ENDED MARCH 31, 2022 | YEAR ENDED MARCH 31, 2021 | YEAR ENDED MARCH 31, 2020 | ||||||||||||||||||||||||||
Net Asset Value, Beginning of Year | $ | 9.28 | $ | 10.18 | $ | 10.82 | $ | 11.12 | $ | 10.64 | ||||||||||||||||||||
|
|
|
|
|
|
|
|
|
| |||||||||||||||||||||
Income from Investment Operations: | ||||||||||||||||||||||||||||||
Net investment income1 | 0.39 | 0.30 | 0.15 | 0.17 | 0.28 | |||||||||||||||||||||||||
Net realized and unrealized gain (loss) | (0.26) | (0.90) | (0.64) | 0.24 | 0.57 | |||||||||||||||||||||||||
|
|
|
|
|
|
|
|
|
| |||||||||||||||||||||
Total Income (Loss) from Investment Operations | 0.13 | (0.60) | (0.49) | 0.41 | 0.85 | |||||||||||||||||||||||||
|
|
|
|
|
|
|
|
|
| |||||||||||||||||||||
Less Distributions: | ||||||||||||||||||||||||||||||
From net investment income | (0.39) | (0.30) | (0.15) | (0.17) | (0.28) | |||||||||||||||||||||||||
From net capital gains | — | — | (0.00)2 | (0.54) | (0.09) | |||||||||||||||||||||||||
|
|
|
|
|
|
|
|
|
| |||||||||||||||||||||
Total Distributions | (0.39) | (0.30) | (0.15) | (0.71) | (0.37) | |||||||||||||||||||||||||
|
|
|
|
|
|
|
|
|
| |||||||||||||||||||||
Net Asset Value, End of Year | $ | 9.02 | $ | 9.28 | $ | 10.18 | $ | 10.82 | $ | 11.12 | ||||||||||||||||||||
|
|
|
|
|
|
|
|
|
| |||||||||||||||||||||
Total Return | 1.45% | (5.80)% | (4.58)% | 3.54% | 8.16% | |||||||||||||||||||||||||
Ratios/Supplemental Data: | ||||||||||||||||||||||||||||||
Net Assets, end of year (in thousands) | $ | 31,087,119 | $ | 38,399,347 | $ | 46,961,971 | $ | 52,980,073 | $ | 46,086,494 | ||||||||||||||||||||
Ratio of Expenses to Average Net Assets | ||||||||||||||||||||||||||||||
Before expense waivers and reimbursements | 0.45% | 0.45% | 0.44% | 0.45% | 0.45% | |||||||||||||||||||||||||
After expense waivers and reimbursements | 0.45% | 0.45% | 0.44% | 0.45% | 0.45% | |||||||||||||||||||||||||
Ratio of Net Investment Income to Average Net Assets | ||||||||||||||||||||||||||||||
After expense waivers and reimbursements | 4.35% | 3.19% | 1.38% | 1.49% | 2.60% | |||||||||||||||||||||||||
Portfolio Turnover Rate | 450% | 426% | 467% | 470% | 405% | |||||||||||||||||||||||||
| 1 | Per share numbers have been calculated using the average share method. |
| 2 | Amount is greater than $(0.005) per share. |
See accompanying Notes to Financial Statements.
| 287 / Annual Report March 2024 |
Table of Contents
Metropolitan West Funds
Financial Highlights
TOTAL RETURN BOND FUND CLASS I-2* | ||||||||||||||||||||||||||||||
| YEAR ENDED MARCH 31, 2024 | YEAR ENDED MARCH 31, 2023 | YEAR ENDED MARCH 31, 2022 | YEAR ENDED MARCH 31, 2021 | PERIOD ENDED MARCH 31, 2020 | ||||||||||||||||||||||||||
Net Asset Value, Beginning of Period | $ | 9.28 | $ | 10.18 | $ | 10.82 | $ | 11.12 | $ | 11.48 | ||||||||||||||||||||
|
|
|
|
|
|
|
|
|
| |||||||||||||||||||||
Income from Investment Operations: | ||||||||||||||||||||||||||||||
Net investment income1 | 0.38 | 0.29 | 0.14 | 0.15 | 0.02 | |||||||||||||||||||||||||
Net realized and unrealized gain (loss) | (0.26) | (0.89) | (0.64) | 0.27 | (0.36) | |||||||||||||||||||||||||
|
|
|
|
|
|
|
|
|
| |||||||||||||||||||||
Total Income (Loss) from Investment Operations | 0.12 | (0.60) | (0.50) | 0.42 | (0.34) | |||||||||||||||||||||||||
|
|
|
|
|
|
|
|
|
| |||||||||||||||||||||
Less Distributions: | ||||||||||||||||||||||||||||||
From net investment income | (0.38) | (0.30) | (0.14) | (0.18) | (0.02) | |||||||||||||||||||||||||
From net capital gains | — | — | (0.00) 2 | (0.54) | — | |||||||||||||||||||||||||
|
|
|
|
|
|
|
|
|
| |||||||||||||||||||||
Total Distributions | (0.38) | (0.30) | (0.14) | (0.72) | (0.02) | |||||||||||||||||||||||||
|
|
|
|
|
|
|
|
|
| |||||||||||||||||||||
Net Asset Value, End of Period | $ | 9.02 | $ | 9.28 | $ | 10.18 | $ | 10.82 | $ | 11.12 | ||||||||||||||||||||
|
|
|
|
|
|
|
|
|
| |||||||||||||||||||||
Total Return | 1.39% | (5.87)% | (4.65)% | 3.65% | (2.93)%3 | |||||||||||||||||||||||||
Ratios/Supplemental Data: | ||||||||||||||||||||||||||||||
Net Assets, end of period (in thousands) | $ | 67,699 | $ | 102,076 | $ | 170,455 | $ | 116,857 | $ | 974 | ||||||||||||||||||||
Ratio of Expenses to Average Net Assets | ||||||||||||||||||||||||||||||
Before expense waivers and reimbursements | 0.51% | 0.52% | 0.52% | 0.52% | 0.33%5 | |||||||||||||||||||||||||
After expense waivers and reimbursements | 0.51% | 0.52% | 0.52% | 0.52% | 0.33%5 | |||||||||||||||||||||||||
Ratio of Net Investment Income to Average Net Assets | ||||||||||||||||||||||||||||||
After expense waivers and reimbursements | 4.28% | 3.06% | 1.33% | 1.32% | 3.49%5 | |||||||||||||||||||||||||
Portfolio Turnover Rate | 450% | 426% | 467% | 470% | 405%3 | |||||||||||||||||||||||||
| * | The Total Return Bond Fund Class I-2 Shares commenced operations on March 6, 2020. |
| 1 | Per share numbers have been calculated using the average share method. |
| 2 | Amount is greater than $(0.005) per share. |
| 3 | Non-Annualized. |
| 4 | Represents the whole number without rounding to the 000s. |
| 5 | Annualized. |
See accompanying Notes to Financial Statements.
| Annual Report March 2024 / 288 |
Table of Contents
Metropolitan West Funds
Financial Highlights
TOTAL RETURN BOND FUND ADMINISTRATIVE CLASS | ||||||||||||||||||||||||||||||
| YEAR ENDED MARCH 31, 2024 | YEAR ENDED MARCH 31, 2023 | YEAR ENDED MARCH 31, 2022 | YEAR ENDED MARCH 31, 2021 | YEAR ENDED MARCH 31, 2020 | ||||||||||||||||||||||||||
Net Asset Value, Beginning of Year | $ | 9.29 | $ | 10.19 | $ | 10.83 | $ | 11.13 | $ | 10.65 | ||||||||||||||||||||
|
|
|
|
|
|
|
|
|
| |||||||||||||||||||||
Income from Investment Operations: | ||||||||||||||||||||||||||||||
Net investment income1 | 0.36 | 0.27 | 0.12 | 0.13 | 0.25 | |||||||||||||||||||||||||
Net realized and unrealized gain (loss) | (0.26) | (0.90) | (0.65) | 0.24 | 0.57 | |||||||||||||||||||||||||
|
|
|
|
|
|
|
|
|
| |||||||||||||||||||||
Total Income (Loss) from Investment Operations | 0.10 | (0.63) | (0.53) | 0.37 | 0.82 | |||||||||||||||||||||||||
|
|
|
|
|
|
|
|
|
| |||||||||||||||||||||
Less Distributions: | ||||||||||||||||||||||||||||||
From net investment income | (0.36) | (0.27) | (0.11) | (0.13) | (0.25) | |||||||||||||||||||||||||
From net capital gains | — | — | (0.00)2 | (0.54) | (0.09) | |||||||||||||||||||||||||
|
|
|
|
|
|
|
|
|
| |||||||||||||||||||||
Total Distributions | (0.36) | (0.27) | (0.11) | (0.67) | (0.34) | |||||||||||||||||||||||||
|
|
|
|
|
|
|
|
|
| |||||||||||||||||||||
Net Asset Value, End of Year | $ | 9.03 | $ | 9.29 | $ | 10.19 | $ | 10.83 | $ | 11.13 | ||||||||||||||||||||
|
|
|
|
|
|
|
|
|
| |||||||||||||||||||||
Total Return | 1.12% | (6.10)% | (4.89)% | 3.19% | 7.80% | |||||||||||||||||||||||||
Ratios/Supplemental Data: | ||||||||||||||||||||||||||||||
Net Assets, end of year (in thousands) | $ | 1,191,464 | $ | 1,549,862 | $ | 1,963,315 | $ | 2,083,842 | $ | 1,739,034 | ||||||||||||||||||||
Ratio of Expenses to Average Net Assets | ||||||||||||||||||||||||||||||
Before expense waivers and reimbursements | 0.78% | 0.78% | 0.77% | 0.78% | 0.78% | |||||||||||||||||||||||||
After expense waivers and reimbursements | 0.78% | 0.78% | 0.77% | 0.78% | 0.78% | |||||||||||||||||||||||||
Ratio of Net Investment Income to Average Net Assets | ||||||||||||||||||||||||||||||
After expense waivers and reimbursements | 4.01% | 2.83% | 1.06% | 1.15% | 2.26% | |||||||||||||||||||||||||
Portfolio Turnover Rate | 450% | 426% | 467% | 470% | 405% | |||||||||||||||||||||||||
| 1 | Per share numbers have been calculated using the average share method. |
| 2 | Amount is greater than $(0.005) per share. |
See accompanying Notes to Financial Statements.
| 289 / Annual Report March 2024 |
Table of Contents
Metropolitan West Funds
Financial Highlights
TOTAL RETURN BOND FUND PLAN CLASS | ||||||||||||||||||||||||||||||
| YEAR ENDED MARCH 31, 2024 | YEAR ENDED MARCH 31, 2023 | YEAR ENDED MARCH 31, 2022 | YEAR ENDED MARCH 31, 2021 | YEAR ENDED MARCH 31, 2020 | ||||||||||||||||||||||||||
Net Asset Value, Beginning of Year | $ | 8.70 | $ | 9.55 | $ | 10.15 | $ | 10.46 | $ | 10.01 | ||||||||||||||||||||
|
|
|
|
|
|
|
|
|
| |||||||||||||||||||||
Income from Investment Operations: | ||||||||||||||||||||||||||||||
Net investment income1 | 0.37 | 0.29 | 0.15 | 0.17 | 0.28 | |||||||||||||||||||||||||
Net realized and unrealized gain (loss) | (0.24) | (0.85) | (0.60) | 0.23 | 0.54 | |||||||||||||||||||||||||
|
|
|
|
|
|
|
|
|
| |||||||||||||||||||||
Total Income (Loss) from Investment Operations | 0.13 | (0.56) | (0.45) | 0.40 | 0.82 | |||||||||||||||||||||||||
|
|
|
|
|
|
|
|
|
| |||||||||||||||||||||
Less Distributions: | ||||||||||||||||||||||||||||||
From net investment income | (0.37) | (0.29) | (0.15) | (0.17) | (0.28) | |||||||||||||||||||||||||
From net capital gains | — | — | (0.00)2 | (0.54) | (0.09) | |||||||||||||||||||||||||
|
|
|
|
|
|
|
|
|
| |||||||||||||||||||||
Total Distributions | (0.37) | (0.29) | (0.15) | (0.71) | (0.37) | |||||||||||||||||||||||||
|
|
|
|
|
|
|
|
|
| |||||||||||||||||||||
Net Asset Value, End of Year | $ | 8.46 | $ | 8.70 | $ | 9.55 | $ | 10.15 | $ | 10.46 | ||||||||||||||||||||
|
|
|
|
|
|
|
|
|
| |||||||||||||||||||||
Total Return | 1.58% | (5.79)% | (4.50)% | 3.65% | 8.29% | |||||||||||||||||||||||||
Ratios/Supplemental Data: | ||||||||||||||||||||||||||||||
Net Assets, end of year (in thousands) | $ | 15,803,141 | $ | 17,622,821 | $ | 22,197,865 | $ | 24,605,977 | $ | 23,822,841 | ||||||||||||||||||||
Ratio of Expenses to Average Net Assets | ||||||||||||||||||||||||||||||
Before expense waivers and reimbursements | 0.37% | 0.37% | 0.36% | 0.37% | 0.37% | |||||||||||||||||||||||||
After expense waivers and reimbursements | 0.37% | 0.37% | 0.36% | 0.37% | 0.37% | |||||||||||||||||||||||||
Ratio of Net Investment Income to Average Net Assets | ||||||||||||||||||||||||||||||
After expense waivers and reimbursements | 4.43% | 3.26% | 1.47% | 1.57% | 2.67% | |||||||||||||||||||||||||
Portfolio Turnover Rate | 450% | 426% | 467% | 470% | 405% | |||||||||||||||||||||||||
| 1 | Per share numbers have been calculated using the average share method. |
| 2 | Amount is greater than $(0.005) per share. |
See accompanying Notes to Financial Statements.
| Annual Report March 2024 / 290 |
Table of Contents
Metropolitan West Funds
Financial Highlights
ULTRA SHORT BOND FUND CLASS M | ||||||||||||||||||||||||||||||
| YEAR ENDED MARCH 31, 2024 | YEAR ENDED MARCH 31, 2023 | YEAR ENDED MARCH 31, 2022 | YEAR ENDED MARCH 31, 2021 | YEAR ENDED MARCH 31, 2020 | ||||||||||||||||||||||||||
Net Asset Value, Beginning of Year | $ | 4.10 | $ | 4.18 | $ | 4.25 | $ | 4.23 | $ | 4.26 | ||||||||||||||||||||
|
|
|
|
|
|
|
|
|
| |||||||||||||||||||||
Income from Investment Operations: | ||||||||||||||||||||||||||||||
Net investment income1 | 0.17 | 0.09 | 0.02 | 0.02 | 0.11 | |||||||||||||||||||||||||
Net realized and unrealized gain (loss) | (0.00) | (0.07) | (0.07) | 0.02 | (0.03) | |||||||||||||||||||||||||
|
|
|
|
|
|
|
|
|
| |||||||||||||||||||||
Total Income (Loss) from Investment Operations | 0.17 | 0.02 | (0.05) | 0.04 | 0.08 | |||||||||||||||||||||||||
|
|
|
|
|
|
|
|
|
| |||||||||||||||||||||
Less Distributions: | ||||||||||||||||||||||||||||||
From net investment income | (0.18) | (0.10) | (0.02) | (0.02) | (0.11) | |||||||||||||||||||||||||
|
|
|
|
|
|
|
|
|
| |||||||||||||||||||||
Net Asset Value, End of Year | $ | 4.09 | $ | 4.10 | $ | 4.18 | $ | 4.25 | $ | 4.23 | ||||||||||||||||||||
|
|
|
|
|
|
|
|
|
| |||||||||||||||||||||
Total Return | 4.14% | 0.49% | (1.14)% | 1.03% | 1.85% | |||||||||||||||||||||||||
Ratios/Supplemental Data: | ||||||||||||||||||||||||||||||
Net Assets, end of year (in thousands) | $ | 12,917 | $ | 19,995 | $ | 39,477 | $ | 61,925 | $ | 28,355 | ||||||||||||||||||||
Ratio of Expenses to Average Net Assets | ||||||||||||||||||||||||||||||
Before expense waivers and reimbursements | 0.84% | 0.75% | 0.64% | 0.65% | 0.77% | |||||||||||||||||||||||||
After expense waivers and reimbursements | 0.50% | 0.50% | 0.50% | 0.50% | 0.50% | |||||||||||||||||||||||||
Ratio of Net Investment Income to Average Net Assets | ||||||||||||||||||||||||||||||
After expense waivers and reimbursements | 4.25% | 2.24% | 0.49% | 0.49% | 2.53% | |||||||||||||||||||||||||
Portfolio Turnover Rate | 544% | 479% | 336% | 210% | 303% | |||||||||||||||||||||||||
| 1 | Per share numbers have been calculated using the average share method. |
See accompanying Notes to Financial Statements.
| 291 / Annual Report March 2024 |
Table of Contents
Metropolitan West Funds
Financial Highlights
ULTRA SHORT BOND FUND CLASS I | ||||||||||||||||||||||||||||||
| YEAR ENDED MARCH 31, 2024 | YEAR ENDED MARCH 31, 2023 | YEAR ENDED MARCH 31, 2022 | YEAR ENDED MARCH 31, 2021 | YEAR ENDED MARCH 31, 2020 | ||||||||||||||||||||||||||
Net Asset Value, Beginning of Year | $ | 4.11 | $ | 4.18 | $ | 4.26 | $ | 4.23 | $ | 4.27 | ||||||||||||||||||||
|
|
|
|
|
|
|
|
|
| |||||||||||||||||||||
Income from Investment Operations: | ||||||||||||||||||||||||||||||
Net investment income1 | 0.18 | 0.10 | 0.03 | 0.03 | 0.12 | |||||||||||||||||||||||||
Net realized and unrealized gain (loss) | (0.01) | (0.06) | (0.08) | 0.03 | (0.04) | |||||||||||||||||||||||||
|
|
|
|
|
|
|
|
|
| |||||||||||||||||||||
Total Income (Loss) from Investment Operations | 0.17 | 0.04 | (0.05) | 0.06 | 0.08 | |||||||||||||||||||||||||
|
|
|
|
|
|
|
|
|
| |||||||||||||||||||||
Less Distributions: | ||||||||||||||||||||||||||||||
From net investment income | (0.18) | (0.11) | (0.03) | (0.03) | (0.12) | |||||||||||||||||||||||||
|
|
|
|
|
|
|
|
|
| |||||||||||||||||||||
Net Asset Value, End of Year | $ | 4.10 | $ | 4.11 | $ | 4.18 | $ | 4.26 | $ | 4.23 | ||||||||||||||||||||
|
|
|
|
|
|
|
|
|
| |||||||||||||||||||||
Total Return | 4.31% | 0.90% | (1.21)% | 1.43% | 1.78% | |||||||||||||||||||||||||
Ratios/Supplemental Data: | ||||||||||||||||||||||||||||||
Net Assets, end of year (in thousands) | $ | 37,783 | $ | 101,852 | $ | 158,258 | $ | 181,248 | $ | 76,340 | ||||||||||||||||||||
Ratio of Expenses to Average Net Assets | ||||||||||||||||||||||||||||||
Before expense waivers and reimbursements | 0.66% | 0.60% | 0.49% | 0.48% | 0.58% | |||||||||||||||||||||||||
After expense waivers and reimbursements | 0.34% | 0.34% | 0.34% | 0.34% | 0.34% | |||||||||||||||||||||||||
Ratio of Net Investment Income to Average Net Assets | ||||||||||||||||||||||||||||||
After expense waivers and reimbursements | 4.37% | 2.40% | 0.66% | 0.67% | 2.70% | |||||||||||||||||||||||||
Portfolio Turnover Rate | 544% | 479% | 336% | 210% | 303% | |||||||||||||||||||||||||
| 1 | Per share numbers have been calculated using the average share method. |
See accompanying Notes to Financial Statements.
| Annual Report March 2024 / 292 |
Table of Contents
Metropolitan West Funds
Financial Highlights
UNCONSTRAINED BOND FUND CLASS M | ||||||||||||||||||||||||||||||
| YEAR ENDED MARCH 31, 2024 | YEAR ENDED MARCH 31, 2023 | YEAR ENDED MARCH 31, 2022 | YEAR ENDED MARCH 31, 2021 | YEAR ENDED MARCH 31, 2020 | ||||||||||||||||||||||||||
Net Asset Value, Beginning of Year | $ | 10.41 | $ | 11.17 | $ | 11.96 | $ | 11.12 | $ | 11.80 | ||||||||||||||||||||
|
|
|
|
|
|
|
|
|
| |||||||||||||||||||||
Income from Investment Operations: | ||||||||||||||||||||||||||||||
Net investment income1 | 0.65 | 0.51 | 0.30 | 0.30 | 0.42 | |||||||||||||||||||||||||
Net realized and unrealized gain (loss) | (0.09) | (0.74) | (0.66) | 0.93 | (0.69) | |||||||||||||||||||||||||
|
|
|
|
|
|
|
|
|
| |||||||||||||||||||||
Total Income (Loss) from Investment Operations | 0.56 | (0.23) | (0.36) | 1.23 | (0.27) | |||||||||||||||||||||||||
|
|
|
|
|
|
|
|
|
| |||||||||||||||||||||
Less Distributions: | ||||||||||||||||||||||||||||||
From net investment income | (0.65) | (0.53) | (0.30) | (0.30) | (0.41) | |||||||||||||||||||||||||
From net capital gains | — | — | (0.13) | (0.09) | — | |||||||||||||||||||||||||
From tax return of capital | (0.01) | — | — | — | — | |||||||||||||||||||||||||
|
|
|
|
|
|
|
|
|
| |||||||||||||||||||||
Total Distributions | (0.66) | (0.53) | (0.43) | (0.39) | (0.41) | |||||||||||||||||||||||||
|
|
|
|
|
|
|
|
|
| |||||||||||||||||||||
Net Asset Value, End of Year | $ | 10.31 | $ | 10.41 | $ | 11.17 | $ | 11.96 | $ | 11.12 | ||||||||||||||||||||
|
|
|
|
|
|
|
|
|
| |||||||||||||||||||||
Total Return | 5.57% | (1.93)% | (3.15)% | 11.14% | (2.47)% | |||||||||||||||||||||||||
Ratios/Supplemental Data: | ||||||||||||||||||||||||||||||
Net Assets, end of year (in thousands) | $ | 141,736 | $ | 160,181 | $ | 214,792 | $ | 258,424 | $ | 267,139 | ||||||||||||||||||||
Ratio of Expenses to Average Net Assets | ||||||||||||||||||||||||||||||
Before expense waivers and reimbursements | 1.04%2 | 1.04% | 1.02% | 1.03% | 1.03% | |||||||||||||||||||||||||
After expense waivers and reimbursements | 1.04% | 1.04% | 1.02% | 1.03% | 1.03% | |||||||||||||||||||||||||
Ratio of Net Investment Income to Average Net Assets | ||||||||||||||||||||||||||||||
After expense waivers and reimbursements | 6.37% | 4.81% | 2.50% | 2.56% | 3.49% | |||||||||||||||||||||||||
Portfolio Turnover Rate | 257% | 223% | 182% | 165% | 85% | |||||||||||||||||||||||||
| 1 | Per share numbers have been calculated using the average share method. |
| 2 | Includes recoupment of past waived fees. Excluding the recoupment of past waived fees, the ratio would have been 1.04%. |
See accompanying Notes to Financial Statements.
| 293 / Annual Report March 2024 |
Table of Contents
Metropolitan West Funds
Financial Highlights
UNCONSTRAINED BOND FUND CLASS I | ||||||||||||||||||||||||||||||
| YEAR ENDED MARCH 31, 2024 | YEAR ENDED MARCH 31, 2023 | YEAR ENDED MARCH 31, 2022 | YEAR ENDED MARCH 31, 2021 | YEAR ENDED MARCH 31, 2020 | ||||||||||||||||||||||||||
Net Asset Value, Beginning of Year | $ | 10.40 | $ | 11.16 | $ | 11.95 | $ | 11.12 | $ | 11.79 | ||||||||||||||||||||
|
|
|
|
|
|
|
|
|
| |||||||||||||||||||||
Income from Investment Operations: | ||||||||||||||||||||||||||||||
Net investment income1 | 0.68 | 0.53 | 0.33 | 0.33 | 0.44 | |||||||||||||||||||||||||
Net realized and unrealized gain (loss) | (0.10) | (0.73) | (0.66) | 0.92 | (0.67) | |||||||||||||||||||||||||
|
|
|
|
|
|
|
|
|
| |||||||||||||||||||||
Total Income (Loss) from Investment Operations | 0.58 | (0.20) | (0.33) | 1.25 | (0.23) | |||||||||||||||||||||||||
|
|
|
|
|
|
|
|
|
| |||||||||||||||||||||
Less Distributions: | ||||||||||||||||||||||||||||||
From net investment income | (0.67) | (0.56) | (0.33) | (0.33) | (0.44) | |||||||||||||||||||||||||
From net capital gains | — | — | (0.13) | (0.09) | — | |||||||||||||||||||||||||
From tax return of capital | (0.01) | — | — | — | — | |||||||||||||||||||||||||
|
|
|
|
|
|
|
|
|
| |||||||||||||||||||||
Total Distributions | (0.68) | (0.56) | (0.46) | (0.42) | (0.44) | |||||||||||||||||||||||||
|
|
|
|
|
|
|
|
|
| |||||||||||||||||||||
Net Asset Value, End of Year | $ | 10.30 | $ | 10.40 | $ | 11.16 | $ | 11.95 | $ | 11.12 | ||||||||||||||||||||
|
|
|
|
|
|
|
|
|
| |||||||||||||||||||||
Total Return | 5.87% | (1.65)% | (2.88)% | 11.35% | (2.11)% | |||||||||||||||||||||||||
Ratios/Supplemental Data: | ||||||||||||||||||||||||||||||
Net Assets, end of year (in thousands) | $ | 2,035,211 | $ | 2,353,053 | $ | 3,648,832 | $ | 3,271,289 | $ | 2,760,187 | ||||||||||||||||||||
Ratio of Expenses to Average Net Assets | ||||||||||||||||||||||||||||||
Before expense waivers and reimbursements | 0.75% | 0.76% | 0.74% | 0.75% | 0.75% | |||||||||||||||||||||||||
After expense waivers and reimbursements | 0.75% | 0.76% | 0.74% | 0.75% | 0.75% | |||||||||||||||||||||||||
Ratio of Net Investment Income to Average Net Assets | ||||||||||||||||||||||||||||||
After expense waivers and reimbursements | 6.65% | 5.04% | 2.79% | 2.82% | 3.72% | |||||||||||||||||||||||||
Portfolio Turnover Rate | 257% | 223% | 182% | 165% | 85% | |||||||||||||||||||||||||
| 1 | Per share numbers have been calculated using the average share method. |
See accompanying Notes to Financial Statements.
| Annual Report March 2024 / 294 |
Table of Contents
Metropolitan West Funds
Financial Highlights
UNCONSTRAINED BOND FUND PLAN CLASS* | ||||||||||||||||||||||||||||||
| YEAR ENDED MARCH 31, 2024 | YEAR ENDED MARCH 31, 2023 | YEAR ENDED MARCH 31, 2022 | YEAR ENDED MARCH 31, 2021 | PERIOD ENDED MARCH 31, 2020 | ||||||||||||||||||||||||||
Net Asset Value, Beginning of Period | $ | 10.40 | $ | 11.15 | $ | 11.94 | $ | 11.11 | $ | 11.96 | ||||||||||||||||||||
|
|
|
|
|
|
|
|
|
| |||||||||||||||||||||
Income from Investment Operations: | ||||||||||||||||||||||||||||||
Net investment income1 | 0.69 | 0.56 | 0.34 | 0.34 | 0.03 | |||||||||||||||||||||||||
Net realized and unrealized gain (loss) | (0.10) | (0.74) | (0.66) | 0.92 | (0.85) | |||||||||||||||||||||||||
|
|
|
|
|
|
|
|
|
| |||||||||||||||||||||
Total Income (Loss) from Investment Operations | 0.59 | (0.18) | (0.32) | 1.26 | (0.82) | |||||||||||||||||||||||||
|
|
|
|
|
|
|
|
|
| |||||||||||||||||||||
Less Distributions: | ||||||||||||||||||||||||||||||
From net investment income | (0.68) | (0.57) | (0.34) | (0.34) | (0.03) | |||||||||||||||||||||||||
From net capital gains | — | — | (0.13) | (0.09) | — | |||||||||||||||||||||||||
From tax return of capital | (0.01) | — | — | — | — | |||||||||||||||||||||||||
|
|
|
|
|
|
|
|
|
| |||||||||||||||||||||
Total Distributions | (0.69) | (0.57) | (0.47) | (0.43) | (0.03) | |||||||||||||||||||||||||
|
|
|
|
|
|
|
|
|
| |||||||||||||||||||||
Net Asset Value, End of Period | $ | 10.30 | $ | 10.40 | $ | 11.15 | $ | 11.94 | $ | 11.11 | ||||||||||||||||||||
|
|
|
|
|
|
|
|
|
| |||||||||||||||||||||
Total Return | 5.93% | (1.50)% | (2.83)% | 11.44% | (6.88)%2 | |||||||||||||||||||||||||
Ratios/Supplemental Data: | ||||||||||||||||||||||||||||||
Net Assets, end of period (in thousands) | $ | 397,728 | $ | 352,297 | $ | 120,524 | $ | 63,815 | $ | 933 | ||||||||||||||||||||
Ratio of Expenses to Average Net Assets | ||||||||||||||||||||||||||||||
Before expense waivers and reimbursements | 0.70%4 | 0.70% | 0.69% | 0.69% | 0.68%5 | |||||||||||||||||||||||||
After expense waivers and reimbursements | 0.70% | 0.70% | 0.69% | 0.69% | 0.68%5 | |||||||||||||||||||||||||
Ratio of Net Investment Income to Average Net Assets | ||||||||||||||||||||||||||||||
After expense waivers and reimbursements | 6.73% | 5.41% | 2.87% | 2.88% | 4.06%5 | |||||||||||||||||||||||||
Portfolio Turnover Rate | 257% | 223% | 182% | 165% | 85%2 | |||||||||||||||||||||||||
| * | The Unconstrained Bond Fund Plan Class Shares commenced operations on March 6, 2020. |
| 1 | Per share numbers have been calculated using the average share method. |
| 2 | Non-Annualized. |
| 3 | Represents the whole number without rounding to the 000s. |
| 4 | Includes recoupment of past waived fees. Excluding the recoupment of past waived fees, the ratio would have been 0.69%. |
| 5 | Annualized. |
See accompanying Notes to Financial Statements.
| 295 / Annual Report March 2024 |
Table of Contents
March 31, 2024
| 1. | SUMMARY OF ORGANIZATION |
The Metropolitan West Funds (the “Trust”) is an open-end management investment company organized as a Delaware statutory trust on December 9, 1996 and registered under the Investment Company Act of 1940, as amended (the “1940 Act”). Metropolitan West Asset Management, LLC (the “Adviser”), a federally registered investment adviser, provides the Funds (as defined below) with investment management services. The Trust currently consists of fourteen separate portfolios (each a “Fund” and collectively, the “Funds”): Metropolitan West AlphaTrak 500 Fund (the “AlphaTrak 500 Fund”), Metropolitan West Corporate Bond Fund (the “Corporate Bond Fund”), Metropolitan West Flexible Income Fund (the “Flexible Income Fund”), Metropolitan West Floating Rate Income Fund (the “Floating Rate Income Fund”), Metropolitan West High Yield Bond Fund (the “High Yield Bond Fund”), Metropolitan West Intermediate Bond Fund (the “Intermediate Bond Fund”), Metropolitan West Investment Grade Credit Fund (the “Investment Grade Credit Fund”), Metropolitan West Low Duration Bond Fund (the “Low Duration Bond Fund”), Metropolitan West Opportunistic High Income Credit Fund (the “Opportunistic High Income Credit Fund”), Metropolitan West Strategic Income Fund (the “Strategic Income Fund”), Metropolitan West Sustainable Securitized Fund (the “Sustainable Securitized Fund”), Metropolitan West Total Return Bond Fund (the “Total Return Bond Fund”), Metropolitan West Ultra Short Bond Fund (the “Ultra Short Bond Fund”) and Metropolitan West Unconstrained Bond Fund (the “Unconstrained Bond Fund”). The AlphaTrak 500 Fund commenced investment operations on June 29, 1998 with Class M shares. The Corporate Bond Fund commenced investment operations on June 29, 2018 with Class M and Class I shares. The Flexible Income Fund commenced investment operations on November 30, 2018 with Class M and Class I shares. The Floating Rate Income Fund commenced investment operations on June 28, 2013 with Class M and Class I shares. The Plan Class was added on January 29, 2021. The High Yield Bond Fund commenced investment operations on September 30, 2002 with Class M shares. Class I was added on March 31, 2003. The Intermediate Bond Fund commenced investment operations on June 28, 2002 with the Class I shares. Class M was added on June 30, 2003. The Investment Grade Credit Fund commenced investment operations on June 29, 2018 with Class M and Class I shares. The Low Duration Bond Fund commenced investment operations on March 31, 1997 with the Class M shares. Class I was added on March 31, 2000, and the Administrative Class was added on September 22, 2009. The Opportunistic High Income Credit Fund commenced investment operations on August 2, 2021 with Class M and Class I shares. The Strategic Income Fund commenced investment operations on June 30, 2003 with Class M shares. Class I was added on March 31, 2004. The Sustainable Securitized Fund commenced investment operations on October 1, 2021 with Class M and Class I shares. The Total Return Bond Fund commenced investment operations on March 31, 1997 with the Class M shares. Class I was added on March 31, 2000; Class I-2 was added on March 6, 2020; Administrative Class was added on December 18, 2009; and the Plan Class added on July 31, 2011. The Ultra Short Bond Fund commenced investment operations on June 30, 2003 with the Class M shares. Class I was added on July 31, 2004. The Unconstrained Bond Fund commenced investment operations on September 30, 2011 with Class M and Class I shares; and the Plan Class was added on March 6, 2020. Each Fund is an investment company following the accounting and reporting guidance of the Financial Accounting Standards Board (“FASB”) Accounting Standards Codification (“ASC”) No. 946, Financial Services – Investment Companies.
The AlphaTrak 500 Fund seeks to achieve a total return that exceeds the total return of the Standard & Poor’s 500 Index (the “S&P 500 Index”). The Fund combines non-leveraged investments in S&P 500 Index futures contracts and/or swaps or exchange-traded funds (ETFs) that track the S&P 500 Index with a diversified portfolio of fixed-income securities of varying maturities with a portfolio duration of up to three years. The Fund’s dollar-weighted average maturity is up to five years.
The Corporate Bond Fund seeks to maximize long-term total return, by investing at least 80% of its net assets, plus any borrowings for investment purposes, in a diversified portfolio of corporate debt instruments of varying maturities issued by U.S. and foreign corporations domiciled in developed market and emerging market countries. There is no limit on the weighted average maturity of the Fund’s portfolio, and the Fund’s average portfolio duration is expected, but not required, to vary from three to nine years.
The Flexible Income Fund seeks a high level of current income with a secondary objective of long-term capital appreciation by utilizing a flexible investment approach that allocates investments across a range of global investment opportunities related to credit, currencies and interest rates. There is no limit on the weighted average maturity of the Fund’s portfolio, and the Fund’s average portfolio duration is expected, but not required, to vary from zero to eight years.
The Floating Rate Income Fund seeks primarily to maximize current income with a secondary objective of long-term capital appreciation, by investing at least 80% of its net assets, plus any borrowings for investment purposes, in floating rate investments and in investments that are the economic equivalent of floating rate investments. The Fund’s portfolio securities may have any duration or maturity.
| Annual Report March 2024 / 296 |
Table of Contents
Notes to Financial Statements (Continued)
The High Yield Bond Fund seeks to maximize long-term total return consistent with preservation of capital. The Fund invests at least 80% of its net assets, plus any borrowings for investment purposes, in high yield bonds (commonly known as “junk bonds”). The remainder of the Fund’s net assets may be invested in investment grade securities rated by one of the nationally recognized statistical rating organizations or, if unrated, determined by the Adviser to be of comparable quality. The Fund’s portfolio duration is two to eight years. The Fund’s dollar-weighted average maturity is expected to range from two to fifteen years.
The Intermediate Bond Fund seeks to maximize current income, consistent with preservation of capital. The Fund invests at least 80% of its net assets, plus any borrowings for investment purposes, in fixed income securities it regards as bonds. The Fund’s portfolio duration is one to six years. The Fund’s dollar-weighted average maturity is expected to range from three to seven years.
The Investment Grade Credit Fund seeks to maximize long-term total return. The Fund invests at least 80% of its net assets, plus any borrowings for investment purposes, in securities and instruments it regards as bonds in the U.S and abroad, including emerging markets, and may purchase securities of varying maturities issued by domestic and foreign corporations and governments. There is no limit on the weighted average maturity of the Fund’s portfolio, and the Fund’s average portfolio duration is expected, but not required, to vary from two to eight years.
The Low Duration Bond Fund seeks to maximize current income, consistent with preservation of capital. The Fund invests at least 80% of its net assets, plus any borrowings for investment purposes, in fixed income securities it regards as bonds. The Fund’s portfolio duration is up to three years. The Fund’s dollar-weighted average maturity is expected to range from one to five years.
The Opportunistic High Income Credit Fund seeks to maximize total returns through a combination of current income and capital appreciation by investing at least 80% of its net assets in investments across a range of investment opportunities related to income-generating credit securities, with an emphasis on higher volatility, lower-quality debt securities rated below investment grade, or unrated securities determined by the Adviser to be of comparable quality. There is no limit on the weighted average maturity of the Fund’s portfolio, and there is no limit on the Fund’s average portfolio duration.
The Strategic Income Fund seeks to maximize long-term total return without tracking any particular markets or indices. This Fund uses techniques intended to provide absolute (positive) returns in all markets by employing a strategy intended to produce high income while exploiting disparities or inefficiencies in markets. The Fund focuses on inefficiencies related to secured or asset-backed debt compared with unsecured and subordinated debt or equity of companies and issuers. Additionally, the Fund focuses on longer-term cyclical anomalies in the fixed income markets to both enhance yield and realize potential price appreciation. These anomalies include shifts in the portfolio’s duration, yield curve anomalies, and sector- and issue-specific dislocations.
The Sustainable Securitized Fund (formerly, ESG Securitized Fund) seeks to maximize current income and achieve above average long-term total return by investing at least 80% of its net assets in debt securities issued by securitized vehicles and similar instruments that the Adviser believes satisfy one or more of its positive-screening environmental, social and governance (“ESG”) criteria to support sustainable initiatives. The Fund’s portfolio duration is two to eight years and the Fund’s dollar-weighted average maturity ranges from two to fifteen years.
The Total Return Bond Fund seeks to maximize long-term total return. The Fund invests at least 80% of its net assets, plus any borrowings for investment purposes, in fixed income securities it regards as bonds. The Fund’s portfolio duration is two to eight years. The Fund’s dollar-weighted average maturity is expected to range from two to fifteen years.
The Ultra Short Bond Fund seeks to maximize current income, consistent with preservation of capital. The Fund invests at least 80% of its net assets, plus any borrowings for investment purposes, in fixed income securities it regards as bonds. The Fund’s portfolio duration normally will remain within one year of its benchmark index. The Fund’s dollar-weighted average maturity normally exceeds one year.
The Unconstrained Bond Fund seeks to provide investors with positive long-term returns irrespective of general securities market conditions. The Fund intends to pursue its objective by utilizing a flexible investment approach that allocates investments across a range of global investment opportunities related to credit, currencies and interest rates. The Fund invests at least 80% of its net assets, plus any borrowings for investment purposes, in securities and instruments it regards as bonds in the U.S. and abroad, including emerging markets, and may purchase securities of varying maturities issued by domestic and foreign corporations and governments. There is no limit on the weighted average maturity of the Fund’s portfolio, and the average portfolio duration of the fixed-income portion of the Fund’s portfolio is expected to vary from negative three (-3) years to positive eight (8) years.
A more complete description of the objectives and strategies of each of the Funds can be found in the Prospectuses and the Statement of Additional Information, which can be obtained at www.tcw.com or by calling (800) 241-4671.
| 2. | SIGNIFICANT ACCOUNTING POLICIES |
The following is a summary of significant accounting policies consistently followed by the Trust:
| 297 / Annual Report March 2024 |
Table of Contents
Notes to Financial Statements (Continued)
Net Asset Value:
The Net Asset Value (“NAV”) of each class of a Fund is determined by dividing the net assets attributable to each class of shares of the Fund by the number of issued and outstanding shares of the class of the Fund on each business day as of 4 p.m. ET.
Security Valuation:
Pursuant to Rule 2a-5 under the 1940 Act, the Board of Trustees (the “Board” or the “Board of Trustees”) has designated the Adviser as the “valuation designee” with respect to the fair valuation of the Funds’ portfolio securities, subject to oversight by and periodic reporting to the Board. Fixed income securities for which market quotations are readily available were valued during the period at prices as provided by independent pricing vendors or broker quotes. The Funds received pricing information from independent pricing vendors selected and overseen by the valuation designee. Securities with a demand feature exercisable within one to seven days are valued at par. The Funds also use a benchmark pricing system to the extent vendors’ prices for their securities are either inaccurate (such as when the reported prices are different from recent known market transactions) or are not available from another pricing source. For a security priced using this system, the Adviser initially selects a proxy composed of a relevant security (e.g., U.S. Treasury Note) or benchmark (e.g., LIBOR) and a multiplier, divisor or margin that the Adviser believes would together best reflect changes in the market value of the security. The value of the security changes daily based on changes to the market price of the assigned benchmark. The benchmark pricing system is continuously reviewed by the Adviser and implemented according to the pricing policy reviewed by the Board. S&P 500 Index futures contracts are valued at the first sale price after 4 p.m. ET on the Chicago Mercantile Exchange. All other futures contracts are valued at the official settlement price of the exchange on which those securities are traded. Equity securities, including depository receipts, are valued at the last reported sale price or the market’s closing price on the exchange or market on which such securities are traded, as of the close of business on the day the securities are being valued or, lacking any sales, at the average of the bid and ask prices. In cases where equity securities are traded on more than one exchange, the securities are valued on the exchange or market determined by the Adviser to be the broadest and most representative market, which may be either a securities exchange or the over-the-counter market. Equity options are valued at the average of the bid and ask prices. Securities and other assets that could not be valued as described above were valued at their fair value as determined by the Adviser in accordance with procedures approved by and under the general oversight of the Board.
Investments in registered open-ended investment companies, including those classified as money market funds, are valued based upon the reported NAV of such investments.
Fair value methods used by the Adviser included, but were not limited to, obtaining market quotations from secondary pricing services, broker-dealers, or widely used quotation systems. General factors considered in determining the fair value of securities include fundamental analytical data, the nature and duration of any restrictions on disposition of the securities, and an evaluation of the forces that influence the market in which the investments are purchased and sold. These securities are either categorized as Level 2 or 3 depending on the relevant inputs used. In the event that the security or asset could not be valued pursuant to one of the valuation methods used by the Adviser, the value of the security or asset was determined in good faith by the Adviser, as the valuation designee. When a Fund uses these fair valuation methods that use significant unobservable inputs to determine NAV, securities will be priced by a method that the Adviser believes accurately reflects fair value and are categorized as Level 3 of the fair value hierarchy. These methods may require subjective determinations about the value of a security. While the Funds’ policy is intended to result in a calculation of its NAV that fairly reflects security values as of the time of pricing, the Funds cannot guarantee that values determined by the Adviser would accurately reflect the price that a Fund could obtain for a security if it were to dispose of that security as of the time of pricing (for instance, in a forced or distressed sale). The prices used by the Funds may differ from the value that would be realized if the securities were sold.
Foreign Currency Translation:
The books and records of each Fund are maintained in U.S. dollars as follows: (1) foreign currency denominated securities and other assets and liabilities stated in foreign currencies are translated using the daily spot rate; and (2) purchases, sales, income and expenses are translated at the rate of exchange prevailing on the respective dates of such transactions. The resultant exchange gains and losses are included in net realized or net unrealized gain (loss) in the Statements of Operations. Pursuant to U.S. federal income tax regulations, certain foreign exchange gains and losses included in realized and unrealized gains and losses are reclassified to ordinary income for federal income tax purposes.
Foreign Taxes:
The Funds may be subject to withholding taxes on income and capital gains imposed by certain countries in which they invest. The withholding tax on income is netted against the income accrued or received. Any reclaimable taxes are recorded as income. The withholding tax on realized or unrealized gain is recorded as a liability.
| Annual Report March 2024 / 298 |
Table of Contents
Notes to Financial Statements (Continued)
Securities and Derivatives Transactions and Investment Income:
Securities transactions are accounted for no later than the first NAV calculation on the first business day following the trade date. However, for financial reporting purposes, portfolio securities transactions are reported on the trade date. Cost is determined and gains and losses are based on the first-in, first-out method for both financial statement and federal income tax purposes. Dividend income is recorded on the ex-dividend date. Interest income is accrued daily. Discounts, including original issue discount, and premiums on securities are amortized using the effective interest method.
Distributions to Shareholders:
Distributions to shareholders are recorded on the ex-dividend date. The Funds (except the AlphaTrak 500 Fund) expect to declare dividends daily and pay them monthly to shareholders. TheAlphaTrak 500 Fund expects to declare and pay dividends to shareholders quarterly. Distributions of net capital gains, if any, will be made at least annually. The Board may determine to declare and make distributions more or less frequently.
Federal Income Taxation:
It is each Fund’s policy to continue to comply with the requirements of the Internal Revenue Code applicable to regulated investment companies and to distribute all of its net taxable income, including any net realized gain on investments, to its shareholders. Therefore, no federal income tax provision is required.
Income and long-term capital gain distributions are determined in accordance with federal income tax regulations, which may differ from accounting principles generally accepted in the United States of America (“GAAP”). Distributions determined in accordance with tax regulations may differ in amount or character from net investment income and realized gains for financial reporting purposes. Financial reporting records are adjusted for permanent book/tax differences to reflect tax character. Financial records are not adjusted for temporary differences.
Management has analyzed the Funds’ tax positions taken on federal income tax returns for all open tax years (current and prior three tax years), and has concluded that no provision for federal income tax is required in the Funds’ financial statements. The Funds are subject to examination by U.S. federal and state tax authorities for returns filed for the prior three and four fiscal years, respectively.
As of and during the year ended March 31, 2024, the Funds did not have a liability for any unrecognized tax benefits. The Funds recognize interest and penalties, if any, related to unrecognized tax benefits as income tax expense in the Statements of Operations. During the year, the Funds did not incur any interest or penalties.
Cash and Cash Equivalents:
The Trust has defined cash and cash equivalents as cash which can be in interest-bearing accounts. The Funds also maintain cash in bank account deposits that, at times, may exceed federally insured limits. The Funds have not experienced any losses in any such accounts.
Use of Estimates:
The preparation of financial statements in conformity with GAAP requires management to make estimates and assumptions that affect the reported amounts of assets and liabilities and disclosure of contingent assets and liabilities at the date of the financial statements and the reported amounts of increases and decreases in net assets from operations during the reporting period. Actual results could differ from those estimates.
Fair Value Measurements:
Various inputs are used in determining the fair value of investments, which are as follows:
| * Level 1 - | unadjusted quoted prices in active markets for identical securities | |
| * Level 2 - | other significant observable inputs (including quoted prices for similar securities, interest rates, prepayment speeds, credit risk, etc.) | |
| * Level 3 - | significant unobservable inputs that are not corroborated by observable market data | |
The inputs or methodology used for valuing investments are not necessarily an indication of the risk associated with investing in those investments and the determination of the significance of a particular input to the fair value measurement in its entirety requires judgment and consideration of factors specific to each security.
| 299 / Annual Report March 2024 |
Table of Contents
Notes to Financial Statements (Continued)
The availability of observable inputs can vary from security to security and is affected by a wide variety of factors, including, for example, the type of security, whether the security is new and not yet established in the marketplace, the liquidity of markets, and other characteristics particular to the security. To the extent that valuation is based on models or inputs that are less observable or unobservable in the market, the determination of fair value requires more judgment. Accordingly, the degree of judgment exercised in determining fair value is greatest for instruments categorized as Level 3.
In periods of market dislocation, the observability of prices and inputs may be reduced for many instruments. This condition, as well as changes related to liquidity of investments, could cause a security to be reclassified between Level 1, Level 2, or Level 3.
In certain cases, the inputs used to measure fair value may fall into different levels of the fair value hierarchy. In such cases, for disclosure purposes the level in the fair value hierarchy within which the fair value measurement falls in its entirety is determined based on the lowest level input that is significant to the fair value measurement in its entirety.
Asset-backed securities and mortgage-backed securities. The fair value of asset-backed securities and mortgage-backed securities is estimated based on models that consider the estimated cash flows of each debt tranche of the issuer, establish a benchmark yield, and develop an estimated tranche-specific spread to the benchmark yield based on the unique attributes of the tranche including, but not limited to, the prepayment speed assumptions and attributes of the collateral. To the extent the inputs are observable and timely, the values would be categorized as Level 2 of the fair value hierarchy; otherwise they would be categorized as Level 3.
Bank loans. The fair value of bank loans is estimated using recently executed transactions, market price quotations, credit/market events, and cross-asset pricing. Inputs are generally observable market inputs obtained from independent sources. Bank loans are generally categorized as Level 2 of the fair value hierarchy, unless key inputs are unobservable; they would then be categorized as Level 3.
Corporate bonds. The fair value of corporate bonds is estimated using recently executed transactions, market price quotations (where observable), bond spreads, or credit default swap spreads adjusted for any basis difference between cash and derivative instruments. Corporate bonds are generally categorized as Level 2 of the fair value hierarchy; in instances where prices, spreads, or any of the other aforementioned key inputs are unobservable, they are categorized as Level 3 of the hierarchy.
Credit default swaps. Credit default swaps are fair valued using pricing models that take into account, among other factors, information received from market makers and broker-dealers, default probabilities from index-specific credit spread curves, recovery rates, and cash flows. To the extent that these inputs are observable and timely, the fair values of credit default swaps would be categorized as Level 2; otherwise the fair values would be categorized as Level 3.
Equity securities. Securities such as common stocks and warrants are generally valued based on quoted prices from the applicable exchange. To the extent these securities are actively traded, valuation adjustments are not applied and they are categorized as Level 1 of the fair value hierarchy. Restricted securities issued by publicly held companies are valued at a discount to similar publicly traded securities and may be categorized as Level 2 of the fair value hierarchy to the extent that the discount is considered to be insignificant to the fair value measurement in its entirety; otherwise they may be categorized as Level 3. Restricted securities held in non-public entities are categorized as Level 3 of the fair value hierarchy because they trade infrequently, and therefore the inputs are unobservable.
Foreign currency contracts. The fair value of foreign currency contracts is derived from indices, reference rates, and other inputs or a combination of these factors. These contracts are normally valued on the basis of broker-dealer quotations or by pricing service providers. Depending on the product and the terms of the transaction, the value of financial derivatives can be estimated by a pricing service provider using a series of techniques, including simulation pricing models. The pricing models use inputs that are observed from actively quoted markets such as indices and exchange rates. Foreign currency contracts are categorized as Level 2 of the fair value hierarchy.
Futures contracts. Futures contracts and options on futures contracts are traded on commodity exchanges and are fair valued based on quoted prices from the applicable exchange, and to the extent valuation adjustments are not applied to futures contracts, they are categorized as Level 1. To the extent that valuation adjustments are observable and timely, the fair values of futures contracts would be categorized as Level 2; otherwise the fair values would be categorized as Level 3.
Interest rate swaps. Interest rate swaps are fair valued using pricing models that are based on real-time intraday snap shots of relevant interest rate curves that are built using the most actively traded securities for a given maturity. The pricing models also incorporate cash and money market rates. In addition, market data pertaining to interest rate swaps are monitored regularly to ensure that interest rates are properly depicting the current market rate. To the extent that these inputs are observable and timely, the fair values of interest rate swaps would be categorized as Level 2; otherwise the fair values would be categorized as Level 3.
| Annual Report March 2024 / 300 |
Table of Contents
Notes to Financial Statements (Continued)
Money market funds. Money market funds are open-ended mutual funds that invest in short-term debt securities. To the extent that these funds are valued based upon the reported NAV, they are categorized as Level 1 of the fair value hierarchy.
Municipal bonds. Municipal bonds are fair valued based on pricing models that take into account, among other factors, information received from market makers and broker-dealers, current trades, bid-wanted lists, offerings, market movements, the callability of the bond, state of issuance, benchmark yield curves, and bond insurance. To the extent that these inputs are observable and timely, the fair values of municipal bonds would be categorized as Level 2; otherwise the fair values would be categorized as Level 3.
Options and Swaptions contracts. Exchange-listed options contracts are traded on securities exchanges and are fair valued based on quoted prices from the applicable exchange, and to the extent valuation adjustments are not applied, they are categorized as Level 1. If valuation adjustments are applied and such adjustments are observable and timely, the fair values of exchange-listed options contracts would be categorized as Level 2; otherwise the fair values would be categorized as Level 3. Options and swaptions contracts traded over-the-counter (“OTC”) are fair valued based on pricing models and incorporate various inputs such as interest rates, credit spreads, currency exchange rates and volatility measurements for in-the-money, at-the-money, and out-of-the-money contracts based on a given strike price. To the extent that these inputs are observable and timely, the fair values of OTC options and swaptions contracts would be categorized as Level 2; otherwise the fair values would be categorized as Level 3.
Restricted securities. Restricted securities that are deemed to be both Rule 144A securities and illiquid, as well as restricted securities held in non-public entities, are categorized as Level 3 of the fair value hierarchy because they trade infrequently, and therefore the inputs are unobservable. Any other restricted securities are valued at a discount to similar publicly traded securities and may be categorized as Level 2 of the fair value hierarchy to the extent that the discount is considered to be insignificant to the fair value measurement in its entirety; otherwise they may be categorized as Level 3.
Short-term investments. Short-term investments (commercial paper and repurchase agreements) are valued using market price quotations, and are reflected as Level 2 of the fair value hierarchy.
Total return swaps. Total return swaps are fair valued using pricing models that take into account, among other factors, index spread curves, nominal values, modified duration values and cash flows. To the extent that these inputs are observable and timely, the fair values of total return swaps would be categorized as Level 2; otherwise the fair values would be categorized as Level 3.
U.S. and Foreign government and agency securities. U.S. and Foreign government and agency securities are normally valued using a model that incorporates market observable data such as reported sales of similar securities, broker quotes, yields, bids, offers, quoted market prices, and reference data. Some government securities are actively traded and transparent in the marketplace. As such, they can be categorized as Level 1. Other government and agencies securities are quoted based on similar securities and yields, and therefore would be categorized as Level 2.
As of March 31, 2024, Level 3 securities consist of certain asset-backed and mortgage-backed securities, bank loans, common stocks, corporate bonds and credit default swaps.
| 301 / Annual Report March 2024 |
Table of Contents
Notes to Financial Statements (Continued)
The summary of inputs used to value each Fund’s investments and other financial instruments carried at fair value as of March 31, 2024 is as follows:
| ALPHATRAK 500 FUND | LEVEL 1 | LEVEL 2 | LEVEL 3 | TOTAL | ||||||||||||
|
|
|
|
|
|
|
| |||||||||
Investments in Securities | ||||||||||||||||
Assets: | ||||||||||||||||
Short-Term Investments: | ||||||||||||||||
Money Market Funds | $ | 2,421,760 | $ | — | $ | — | $ | 2,421,760 | ||||||||
U.S. Treasury Bills | 4,064,455 | — | — | 4,064,455 | ||||||||||||
Long-Term Investments: | ||||||||||||||||
Asset-Backed Securities | — | 4,241,082 | — | 4,241,082 | ||||||||||||
Common Stock | — | — | 20,774 | 20,774 | ||||||||||||
Corporates | — | 6,887,180 | — | 6,887,180 | ||||||||||||
Mortgage-Backed Securities | — | 8,068,851 | 22,357 | 8,091,208 | ||||||||||||
Municipal Bonds | — | 248,359 | — | 248,359 | ||||||||||||
Mutual Funds | 4,562,811 | — | — | 4,562,811 | ||||||||||||
U.S. Treasury Securities | 3,184,785 | — | — | 3,184,785 | ||||||||||||
Other Financial Instruments* | ||||||||||||||||
Assets: | ||||||||||||||||
Futures Contracts | 541,043 | — | — | 541,043 | ||||||||||||
|
|
|
|
|
|
|
| |||||||||
Total | $ | 14,774,854 | $ | 19,445,472 | $ | 43,131 | $ | 34,263,457 | ||||||||
|
|
|
|
|
|
|
| |||||||||
| *Other financial instruments include futures. |
| |||||||||||||||
| CORPORATE BOND FUND | LEVEL 1 | LEVEL 2 | LEVEL 3 | TOTAL | ||||||||||||
|
|
|
|
|
|
|
| |||||||||
Investments in Securities | ||||||||||||||||
Assets: | ||||||||||||||||
Short-Term Investments: | ||||||||||||||||
Money Market Funds | $ | 245,646 | $ | — | $ | — | $ | 245,646 | ||||||||
Long-Term Investments: | ||||||||||||||||
Asset-Backed Securities | — | — | 33,144 | 33,144 | ||||||||||||
Corporates | — | 4,172,037 | — | 4,172,037 | ||||||||||||
Mortgage-Backed Securities | — | 26,216 | 518 | 26,734 | ||||||||||||
Municipal Bonds | — | 112,202 | — | 112,202 | ||||||||||||
U.S. Treasury Securities | 719,810 | — | — | 719,810 | ||||||||||||
Other Financial Instruments* | ||||||||||||||||
Assets: | ||||||||||||||||
Swaps Agreements | — | 898 | — | 898 | ||||||||||||
Liabilities: | ||||||||||||||||
Futures Contracts | (3,497) | — | — | (3,497) | ||||||||||||
|
|
|
|
|
|
|
| |||||||||
Total | $ | 961,959 | $ | 4,311,353 | $ | 33,662 | $ | 5,306,974 | ||||||||
|
|
|
|
|
|
|
| |||||||||
| *Other financial instruments include futures and swaps. |
| |||||||||||||||
Annual Report March 2024 / 302
Table of Contents
Notes to Financial Statements (Continued)
| FLEXIBLE INCOME FUND | LEVEL 1 | LEVEL 2 | LEVEL 3 | TOTAL | ||||||||||||
|
|
|
|
|
|
|
| |||||||||
Investments in Securities |
| |||||||||||||||
Assets: | ||||||||||||||||
Short-Term Investments: | ||||||||||||||||
Money Market Funds | $ | 36,240,686 | $ | — | $ | — | $ | 36,240,686 | ||||||||
U.S. Treasury Bills | 45,313,134 | — | — | 45,313,134 | ||||||||||||
Long-Term Investments: | ||||||||||||||||
Asset-Backed Securities | — | 48,447,737 | 405,094 | 48,852,831 | ||||||||||||
Bank Loans | — | 16,927,858 | — | 16,927,858 | ||||||||||||
Common Stock | 253,319 | — | 297,049 | 550,368 | ||||||||||||
Corporates | — | 86,400,029 | 19,919 | 86,419,948 | ||||||||||||
Foreign Government Obligations | — | 4,716,576 | — | 4,716,576 | ||||||||||||
Mortgage-Backed Securities | — | 172,941,914 | 4,281,333 | 177,223,247 | ||||||||||||
Municipal Bonds | — | 696,231 | — | 696,231 | ||||||||||||
U.S. Treasury Securities | 21,838,598 | — | — | 21,838,598 | ||||||||||||
Warrant | — | — | — | — | ||||||||||||
Other Financial Instruments* | ||||||||||||||||
Assets: | ||||||||||||||||
Foreign Currency Exchange Contracts | — | 158,470 | — | 158,470 | ||||||||||||
Futures Contracts Interest | 125,829 | — | — | 125,829 | ||||||||||||
Liabilities: | ||||||||||||||||
Foreign Currency Exchange Contracts | — | (16,097) | — | (16,097) | ||||||||||||
Futures Contracts | (370,795) | — | — | (370,795) | ||||||||||||
|
|
|
|
|
|
|
| |||||||||
Total | $ | 103,400,771 | $ | 330,272,718 | $ | 5,003,395 | $ | 438,676,884 | ||||||||
|
|
|
|
|
|
|
| |||||||||
*Other financial instruments include foreign currency exchange contracts and futures. Interest rate contracts include futures.
|
| |||||||||||||||
| 303 / Annual Report March 2024 |
Table of Contents
Notes to Financial Statements (Continued)
| FLOATING RATE INCOME FUND | LEVEL 1 | LEVEL 2 | LEVEL 3 | TOTAL | ||||||||||||
|
|
|
|
|
|
|
| |||||||||
Investments in Securities | ||||||||||||||||
Assets: | ||||||||||||||||
Short-Term Investments: | ||||||||||||||||
Money Market Funds | $ | 20,330,056 | $ | — | $ | — | $ | 20,330,056 | ||||||||
U.S. Treasury Bills | 4,673,676 | — | — | 4,673,676 | ||||||||||||
Long-Term Investments: | ||||||||||||||||
Asset-Backed Securities | — | 2,925,228 | — | 2,925,228 | ||||||||||||
Bank Loans | — | 274,726,868 | 1,899,654 | 276,626,522 | ||||||||||||
Common Stock | — | — | 260,230 | 260,230 | ||||||||||||
Corporates | — | 7,774,723 | — | 7,774,723 | ||||||||||||
Preferred Stock | — | — | 474,614 | 474,614 | ||||||||||||
Unfunded Commitments Appreciation | — | 1,817 | — | 1,817 | ||||||||||||
Warrant | — | — | — | — | ||||||||||||
Other Financial Instruments* | ||||||||||||||||
Assets: | ||||||||||||||||
Foreign Currency Exchange Contracts | — | 15,117 | — | 15,117 | ||||||||||||
Liabilities: | ||||||||||||||||
Futures Contracts | (350) | — | — | (350) | ||||||||||||
|
|
|
|
|
|
|
| |||||||||
Total | $ | 25,003,382 | $ | 285,443,753 | $ | 2,634,498 | $ | 313,081,633 | ||||||||
|
|
|
|
|
|
|
| |||||||||
*Other financial instruments include foreign currency exchange contracts and futures.
|
| |||||||||||||||
| HIGH YIELD BOND FUND | LEVEL 1 | LEVEL 2 | LEVEL 3 | TOTAL | ||||||||||||
|
|
|
|
|
|
|
| |||||||||
Investments in Securities |
| |||||||||||||||
Assets: | ||||||||||||||||
Short-Term Investments: | ||||||||||||||||
Money Market Funds | $ | 10,278,330 | $ | — | $ | — | $ | 10,278,330 | ||||||||
U.S. Treasury Bills | 29,825,494 | — | — | 29,825,494 | ||||||||||||
Long-Term Investments: | ||||||||||||||||
Bank Loans | — | 72,083,707 | — | 72,083,707 | ||||||||||||
Common Stock | 587,250 | — | 2,034,867 | 2,622,117 | ||||||||||||
Corporates | — | 347,142,320 | 1,360 | 347,143,680 | ||||||||||||
Unfunded Commitments Appreciation | — | 1,478 | — | 1,478 | ||||||||||||
Warrant | — | — | 16 | 16 | ||||||||||||
Other Financial Instruments* | ||||||||||||||||
Assets: | ||||||||||||||||
Foreign Currency Exchange Contracts | ||||||||||||||||
Foreign Currency Risk | — | 220,368 | — | 220,368 | ||||||||||||
Futures Contracts | ||||||||||||||||
Interest Rate Risk | 54,027 | — | — | 54,027 | ||||||||||||
Liabilities: | ||||||||||||||||
Foreign Currency Exchange Contracts | — | (3,114) | — | (3,114) | ||||||||||||
Futures Contracts | (96,663) | — | — | (96,663) | ||||||||||||
|
|
|
|
|
|
|
| |||||||||
Total | $ | 40,648,438 | $ | 419,444,759 | $ | 2,036,243 | $ | 462,129,440 | ||||||||
|
|
|
|
|
|
|
| |||||||||
*Other financial instruments include foreign currency exchange contracts and futures. Interest rate contracts include futures.
|
| |||||||||||||||
Annual Report March 2024 / 304
Table of Contents
Notes to Financial Statements (Continued)
| INTERMEDIATE BOND FUND | LEVEL 1 | LEVEL 2 | LEVEL 3 | TOTAL | ||||||||||||
|
|
|
|
|
|
|
| |||||||||
Investments in Securities | ||||||||||||||||
Assets: | ||||||||||||||||
Short-Term Investments: | ||||||||||||||||
Money Market Funds | $ | 108,672,917 | $ | — | $ | — | $ | 108,672,917 | ||||||||
U.S. Treasury Bills | 105,983,195 | — | — | 105,983,195 | ||||||||||||
Long-Term Investments: | ||||||||||||||||
Asset-Backed Securities | — | 56,239,343 | 1,694,031 | 57,933,374 | ||||||||||||
Bank Loans | — | 9,247,997 | — | 9,247,997 | ||||||||||||
Common Stock | — | — | 410,704 | 410,704 | ||||||||||||
Corporates | — | 195,534,310 | — | 195,534,310 | ||||||||||||
Mortgage-Backed Securities | — | 238,154,241 | — | 238,154,241 | ||||||||||||
Municipal Bonds | — | 7,920,584 | — | 7,920,584 | ||||||||||||
U.S. Treasury Securities | 435,656,789 | — | — | 435,656,789 | ||||||||||||
Other Financial Instruments* | ||||||||||||||||
Assets: | ||||||||||||||||
Foreign Currency Exchange Contracts | ||||||||||||||||
Foreign Currency Risk | — | 441,417 | — | 441,417 | ||||||||||||
Futures Contracts | ||||||||||||||||
Interest Rate Risk | 151,066 | — | — | 151,066 | ||||||||||||
Liabilities: | ||||||||||||||||
Foreign Currency Exchange Contracts | ||||||||||||||||
Foreign Currency Risk | — | (26,595) | — | (26,595) | ||||||||||||
Futures Contracts | ||||||||||||||||
Interest Rate Risk | (438,915) | — | — | (438,915) | ||||||||||||
|
|
|
|
|
|
|
| |||||||||
Total | $ | 650,025,052 | $ | 507,511,297 | $ | 2,104,735 | $ | 1,159,641,084 | ||||||||
|
|
|
|
|
|
|
| |||||||||
*Other financial instruments include foreign currency exchange contracts and futures.
|
| |||||||||||||||
| INVESTMENT GRADE CREDIT FUND | LEVEL 1 | LEVEL 2 | LEVEL 3 | TOTAL | ||||||||||||
|
|
|
|
|
|
|
| |||||||||
Investments in Securities |
| |||||||||||||||
Assets: | ||||||||||||||||
Short-Term Investments: | ||||||||||||||||
Money Market Funds | $ | 2,461,979 | $ | — | $ | — | $ | 2,461,979 | ||||||||
Long-Term Investments: | ||||||||||||||||
Asset-Backed Securities | — | 1,286,298 | 29,461 | 1,315,759 | ||||||||||||
Corporates | — | 11,989,888 | — | 11,989,888 | ||||||||||||
Mortgage-Backed Securities | — | 6,848,240 | 1,738 | 6,849,978 | ||||||||||||
Municipal Bonds | — | 400,101 | — | 400,101 | ||||||||||||
U.S. Treasury Securities | 7,384,363 | — | — | 7,384,363 | ||||||||||||
Other Financial Instruments* | ||||||||||||||||
Assets: | ||||||||||||||||
Foreign Currency Exchange Contracts | ||||||||||||||||
Foreign Currency Risk | — | 158 | — | 158 | ||||||||||||
Futures Contracts | ||||||||||||||||
Interest Rate Risk | 2,265 | — | — | 2,265 | ||||||||||||
Swaps Agreements | ||||||||||||||||
Interest Rate Risk | — | 805 | — | 805 | ||||||||||||
Liabilities: | ||||||||||||||||
Futures Contracts | ||||||||||||||||
Interest Rate Risk | (17,129) | — | — | (17,129) | ||||||||||||
|
|
|
|
|
|
|
| |||||||||
Total | $ | 9,831,478 | $ | 20,525,490 | $ | 31,199 | $ | 30,388,167 | ||||||||
|
|
|
|
|
|
|
| |||||||||
| *Other financial instruments include foreign currency exchange contracts, futures and swaps. |
| |||||||||||||||
305 / Annual Report March 2024
Table of Contents
Notes to Financial Statements (Continued)
| LOW DURATION BOND FUND | LEVEL 1 | LEVEL 2 | LEVEL 3 | TOTAL | ||||||||||||
|
|
|
|
|
|
|
| |||||||||
Investments in Securities | ||||||||||||||||
Assets: | ||||||||||||||||
Short-Term Investments: | ||||||||||||||||
Money Market Funds | $ | 153,817,800 | $ | — | $ | — | $ | 153,817,800 | ||||||||
U.S. Treasury Bills | 53,183,967 | — | — | 53,183,967 | ||||||||||||
Long-Term Investments: | ||||||||||||||||
Asset-Backed Securities | — | 93,820,454 | 5,008,441 | 98,828,895 | ||||||||||||
Bank Loans | — | 18,924,071 | — | 18,924,071 | ||||||||||||
Common Stock | — | — | — | — | ||||||||||||
Corporates | — | 328,271,101 | — | 328,271,101 | ||||||||||||
Mortgage-Backed Securities | — | 699,674,213 | 3,175,417 | 702,849,630 | ||||||||||||
Municipal Bonds | — | 13,900,086 | — | 13,900,086 | ||||||||||||
U.S. Treasury Securities | 328,989,174 | — | — | 328,989,174 | ||||||||||||
Other Financial Instruments* | ||||||||||||||||
Assets: | ||||||||||||||||
Foreign Currency Exchange Contracts | ||||||||||||||||
Foreign Currency Risk | — | 314,681 | — | 314,681 | ||||||||||||
Futures Contracts | ||||||||||||||||
Interest Rate Risk | 3,677 | — | — | 3,677 | ||||||||||||
Liabilities: | ||||||||||||||||
Foreign Currency Exchange Contracts | ||||||||||||||||
Foreign Currency Risk | — | (24,869) | — | (24,869) | ||||||||||||
Futures Contracts | ||||||||||||||||
Interest Rate Risk | (2,050,474) | — | — | (2,050,474) | ||||||||||||
|
|
|
|
|
|
|
| |||||||||
Total | $ | 533,944,144 | $ | 1,154,879,737 | $ | 8,183,858 | $ | 1,697,007,739 | ||||||||
|
|
|
|
|
|
|
| |||||||||
*Other financial instruments include foreign currency exchange contracts and futures.
|
| |||||||||||||||
| OPPORTUNISTIC HIGH INCOME CREDIT FUND | LEVEL 1 | LEVEL 2 | LEVEL 3 | TOTAL | ||||||||||||
|
|
|
|
|
|
|
| |||||||||
Investments in Securities |
| |||||||||||||||
Assets: | ||||||||||||||||
Short-Term Investments: | ||||||||||||||||
Money Market Funds | $ | 211,191 | $ | — | $ | — | $ | 211,191 | ||||||||
U.S. Treasury Bills | 149,293 | — | — | 149,293 | ||||||||||||
Long-Term Investments: | ||||||||||||||||
Bank Loans | — | 73,441 | — | 73,441 | ||||||||||||
Common Stock | 185,017 | — | — | 185,017 | ||||||||||||
Corporates | — | 592,174 | 4 | 592,178 | ||||||||||||
Master Limited Partnerships | 44,690 | — | — | 44,690 | ||||||||||||
Mortgage-Backed Securities | — | 154,285 | 12,869 | 167,154 | ||||||||||||
U.S. Treasury Securities | 96,720 | — | — | 96,720 | ||||||||||||
Other Financial Instruments* | ||||||||||||||||
Assets: | ||||||||||||||||
Futures Contracts | ||||||||||||||||
Interest Rate Risk | 208 | — | — | 208 | ||||||||||||
Liabilities: | ||||||||||||||||
Futures Contracts | ||||||||||||||||
Interest Rate Risk | (914) | — | — | (914) | ||||||||||||
|
|
|
|
|
|
|
| |||||||||
Total | $ | 686,205 | $ | 819,900 | $ | 12,873 | $ | 1,518,978 | ||||||||
|
|
|
|
|
|
|
| |||||||||
| *Other financial instruments include futures. |
| |||||||||||||||
Annual Report March 2024 / 306
Table of Contents
Notes to Financial Statements (Continued)
| STRATEGIC INCOME FUND | LEVEL 1 | LEVEL 2 | LEVEL 3 | TOTAL | ||||||||||||
|
|
|
|
|
|
|
| |||||||||
Investments in Securities | ||||||||||||||||
Assets: | ||||||||||||||||
Short-Term Investments: | ||||||||||||||||
Money Market Funds | $ | 3,914,346 | $ | — | $ | — | $ | 3,914,346 | ||||||||
U.S. Treasury Bills | 14,437,437 | — | — | 14,437,437 | ||||||||||||
Long-Term Investments: | ||||||||||||||||
Asset-Backed Securities | — | 11,116,422 | 98,071 | 11,214,493 | ||||||||||||
Common Stock | 44,550 | — | 28,004 | 72,554 | ||||||||||||
Corporates | — | 18,562,256 | 23 | 18,562,279 | ||||||||||||
Mortgage-Backed Securities | — | 35,978,649 | 335,654 | 36,314,303 | ||||||||||||
Municipal Bonds | — | 96,343 | — | 96,343 | ||||||||||||
U.S. Treasury Securities | 2,429,230 | — | — | 2,429,230 | ||||||||||||
Other Financial Instruments* | ||||||||||||||||
Assets: | ||||||||||||||||
Foreign Currency Exchange Contracts | ||||||||||||||||
Foreign Currency Risk | — | 19,317 | — | 19,317 | ||||||||||||
Futures Contracts | ||||||||||||||||
Interest Rate Risk | 19,105 | — | — | 19,105 | ||||||||||||
Swaps Agreements | ||||||||||||||||
Interest Rate Risk | — | 1,830 | — | 1,830 | ||||||||||||
Liabilities: | ||||||||||||||||
Foreign Currency Exchange Contracts | ||||||||||||||||
Foreign Currency Risk | — | (907) | — | (907) | ||||||||||||
Futures Contracts | ||||||||||||||||
Interest Rate Risk | (45,777) | — | — | (45,777) | ||||||||||||
|
|
|
|
|
|
|
| |||||||||
Total | $ | 20,798,891 | $ | 65,773,910 | $ | 461,752 | $ | 87,034,553 | ||||||||
|
|
|
|
|
|
|
| |||||||||
*Other financial instruments include foreign currency exchange contracts, futures and swaps.
|
| |||||||||||||||
| SUSTAINABLE SECURITIZED FUND | LEVEL 1 | LEVEL 2 | LEVEL 3 | TOTAL | ||||||||||||
|
|
|
|
|
|
|
| |||||||||
Investments in Securities |
| |||||||||||||||
Assets: | ||||||||||||||||
Short-Term Investments: | ||||||||||||||||
Money Market Funds | $ | 953,061 | $ | — | $ | — | $ | 953,061 | ||||||||
Long-Term Investments: | ||||||||||||||||
Asset-Backed Securities | — | 1,207,984 | — | 1,207,984 | ||||||||||||
Mortgage-Backed Securities | — | 5,714,482 | — | 5,714,482 | ||||||||||||
U.S. Treasury Securities | 1,702,935 | — | — | 1,702,935 | ||||||||||||
Other Financial Instruments* | ||||||||||||||||
Assets: | ||||||||||||||||
Futures Contracts | ||||||||||||||||
Interest Rate Risk | 6,456 | — | — | 6,456 | ||||||||||||
Liabilities: | ||||||||||||||||
Futures Contracts | ||||||||||||||||
Interest Rate Risk | (1,648) | — | — | (1,648) | ||||||||||||
|
|
|
|
|
|
|
| |||||||||
Total | $ | 2,660,804 | $ | 6,922,466 | $ | — | $ | 9,583,270 | ||||||||
|
|
|
|
|
|
|
| |||||||||
| *Other financial instruments include futures. |
| |||||||||||||||
307 / Annual Report March 2024
Table of Contents
Notes to Financial Statements (Continued)
| TOTAL RETURN BOND FUND | LEVEL 1 | LEVEL 2 | LEVEL 3 | TOTAL | ||||||||||||
|
|
|
|
|
|
|
| |||||||||
Investments in Securities | ||||||||||||||||
Assets: | ||||||||||||||||
Short-Term Investments: | ||||||||||||||||
Money Market Funds | $ | 4,861,023,809 | $ | — | $ | — | $ | 4,861,023,809 | ||||||||
Repurchase Agreements | — | 500,000,000 | — | 500,000,000 | ||||||||||||
U.S. Agency Discount Notes | — | 1,789,198,869 | — | 1,789,198,869 | ||||||||||||
U.S. Treasury Bills | 475,299,192 | — | — | 475,299,192 | ||||||||||||
Long-Term Investments: | ||||||||||||||||
Asset-Backed Securities | — | 2,580,487,061 | 53,913,791 | 2,634,400,852 | ||||||||||||
Bank Loans | — | 721,731,241 | — | 721,731,241 | ||||||||||||
Common Stock | — | — | 64,506,719 | 64,506,719 | ||||||||||||
Corporates | — | 9,968,553,723 | 3,030,429 | 9,971,584,152 | ||||||||||||
Foreign Government Obligations | — | 314,725,057 | — | 314,725,057 | ||||||||||||
Mortgage-Backed Securities | — | 27,226,314,440 | 370,866,545 | 27,597,180,985 | ||||||||||||
Municipal Bonds | — | 173,364,091 | — | 173,364,091 | ||||||||||||
U.S. Treasury Securities | 17,050,730,858 | — | — | 17,050,730,858 | ||||||||||||
Unfunded Commitments Appreciation | — | 294 | — | 294 | ||||||||||||
Other Financial Instruments* | ||||||||||||||||
Assets: | ||||||||||||||||
Foreign Currency Exchange Contracts | ||||||||||||||||
Foreign Currency Risk | — | 28,523,362 | — | 28,523,362 | ||||||||||||
Futures Contracts | ||||||||||||||||
Interest Rate Risk | 6,494,198 | — | — | 6,494,198 | ||||||||||||
Swaps Agreements | ||||||||||||||||
Interest Rate Risk | — | 7,999,752 | — | 7,999,752 | ||||||||||||
Liabilities: | ||||||||||||||||
Foreign Currency Exchange Contracts | ||||||||||||||||
Foreign Currency Risk | — | (5,864,378) | — | (5,864,378) | ||||||||||||
Futures Contracts | ||||||||||||||||
Interest Rate Risk | (32,139,701) | — | — | (32,139,701) | ||||||||||||
Reverse Repurchase Agreements | — | (1,501,250,000) | — | (1,501,250,000) | ||||||||||||
|
|
|
|
|
|
|
| |||||||||
Total | $ | 22,361,408,356 | $ | 41,803,783,512 | $ | 492,317,484 | $ | 64,657,509,352 | ||||||||
|
|
|
|
|
|
|
| |||||||||
*Other financial instruments include foreign currency exchange contracts, futures, reverse repurchase agreements and swaps.
| Annual Report March 2024 / 308 |
Table of Contents
Notes to Financial Statements (Continued)
| ULTRA SHORT BOND FUND | LEVEL 1 | LEVEL 2 | LEVEL 3 | TOTAL | ||||||||||||
|
|
|
|
|
|
|
| |||||||||
Investments in Securities | ||||||||||||||||
Assets: | ||||||||||||||||
Short-Term Investments: | ||||||||||||||||
Money Market Funds | $ | 6,453,535 | $ | — | $ | — | $ | 6,453,535 | ||||||||
U.S. Treasury Bills | 5,980,246 | — | — | 5,980,246 | ||||||||||||
Long-Term Investments: | ||||||||||||||||
Asset-Backed Securities | — | 1,782,499 | — | 1,782,499 | ||||||||||||
Corporates | — | 11,319,103 | — | 11,319,103 | ||||||||||||
Mortgage-Backed Securities | — | 22,556,254 | 9,388 | 22,565,642 | ||||||||||||
Municipal Bonds | — | 183,681 | — | 183,681 | ||||||||||||
U.S. Treasury Securities | 17,091,979 | 1,930,164 | — | 19,022,143 | ||||||||||||
Other Financial Instruments* | ||||||||||||||||
Assets: | ||||||||||||||||
Foreign Currency Exchange Contracts | ||||||||||||||||
Foreign Currency Risk | — | 13,987 | — | 13,987 | ||||||||||||
Futures Contracts | ||||||||||||||||
Interest Rate Risk | 26 | — | — | 26 | ||||||||||||
Liabilities: | ||||||||||||||||
Foreign Currency Exchange Contracts | ||||||||||||||||
Foreign Currency Risk | — | (743) | — | (743) | ||||||||||||
Futures Contracts | ||||||||||||||||
Interest Rate Risk | (76,780) | — | — | (76,780) | ||||||||||||
|
|
|
|
|
|
|
| |||||||||
Total | $ | 29,449,006 | $ | 37,784,945 | $ | 9,388 | $ | 67,243,339 | ||||||||
|
|
|
|
|
|
|
| |||||||||
*Other financial instruments include foreign currency exchange contracts and futures.
| 309 / Annual Report March 2024 |
Table of Contents
Notes to Financial Statements (Continued)
| UNCONSTRAINED BOND FUND | LEVEL 1 | LEVEL 2 | LEVEL 3 | TOTAL | ||||||||||||
|
|
|
|
|
|
|
| |||||||||
Investments in Securities | ||||||||||||||||
Assets: | ||||||||||||||||
Short-Term Investments: | ||||||||||||||||
Money Market Funds | $ | 99,638,865 | $ | — | $ | — | $ | 99,638,865 | ||||||||
U.S. Agency Discount Notes | — | 19,862,387 | — | 19,862,387 | ||||||||||||
U.S. Treasury Bills | 172,732,815 | — | — | 172,732,815 | ||||||||||||
Long-Term Investments: | ||||||||||||||||
Asset-Backed Securities | — | 350,188,914 | 10,251,532 | 360,440,446 | ||||||||||||
Bank Loans | — | 82,444,479 | — | 82,444,479 | ||||||||||||
Common Stock | 5,773,355 | — | 3,799,346 | 9,572,701 | ||||||||||||
Corporates | — | 535,083,694 | 428,202 | 535,511,896 | ||||||||||||
Foreign Government Obligations | — | 47,386,059 | — | 47,386,059 | ||||||||||||
Mortgage-Backed Securities | — | 1,620,361,230 | 6,937,647 | 1,627,298,877 | ||||||||||||
Municipal Bonds | — | 8,190,904 | — | 8,190,904 | ||||||||||||
U.S. Treasury Securities | 20,957,277 | — | — | 20,957,277 | ||||||||||||
Other Financial Instruments* | ||||||||||||||||
Assets: | ||||||||||||||||
Foreign Currency Exchange Contracts | ||||||||||||||||
Foreign Currency Risk | — | 1,408,096 | — | 1,408,096 | ||||||||||||
Futures Contracts | ||||||||||||||||
Interest Rate Risk | 395,513 | — | — | 395,513 | ||||||||||||
Swaps Agreements | ||||||||||||||||
Interest Rate Risk | — | 247,333 | — | 247,333 | ||||||||||||
Liabilities: | ||||||||||||||||
Foreign Currency Exchange Contracts | ||||||||||||||||
Foreign Currency Risk | — | (93,630) | — | (93,630) | ||||||||||||
Futures Contracts | ||||||||||||||||
Interest Rate Risk | (3,169,479) | — | — | (3,169,479) | ||||||||||||
|
|
|
|
|
|
|
| |||||||||
Total | $ | 296,328,346 | $ | 2,665,079,466 | $ | 21,416,727 | $ | 2,982,824,539 | ||||||||
|
|
|
|
|
|
|
| |||||||||
*Other financial instruments include foreign currency exchange contracts, futures and swaps.
Certain securities held by the Funds are categorized as Level 3 investments. Their prices may be derived by utilizing unobservable prior transaction values or information from third party valuation services. The value of Level 3 investments could be significantly affected by changes in these unobservable inputs.
| Annual Report March 2024 / 310 |
Table of Contents
Notes to Financial Statements (Continued)
For the year ended March 31, 2024, a reconciliation of Level 3 investments is presented when the Fund had a significant amount of Level 3 investments at the beginning and/or end of the period in relation to net assets. The following tables are a reconciliation of Level 3 investments for which significant unobservable inputs were used in determining fair value:
ALPHATRAK 500 FUND | COMMON STOCK | MORTGAGE- BACKED SECURITIES | TOTAL | |||||||||
Balance as of | $ | 20,072 | $ | 29,904 | $ | 49,976 | ||||||
Accrued discounts/premiums | — | (12,327 | ) | (12,327 | ) | |||||||
Realized gain (loss) | — | — | — | |||||||||
Change in unrealized appreciation* | 681 | 4,780 | 5,461 | |||||||||
Purchases | 21 | — | 21 | |||||||||
Sales | — | — | — | |||||||||
Transfers into Level 3** | — | — | — | |||||||||
Transfers out of Level 3** | — | — | — | |||||||||
|
|
|
|
|
|
|
|
| ||||
Balance as of | $ | 20,774 | $ | 22,357 | $ | 43,131 | ||||||
|
|
|
|
|
|
|
|
| ||||
*The change in unrealized appreciation (depreciation) on securities still held at March 31, 2024 was $5,461 and is included in the related net realized gains (losses) and net change in appreciation (depreciation) in the Statements of Operations.
**There were no transfers between level 2 and 3 for the year ended March 31, 2024.
CORPORATE BOND FUND | ASSET-BACKED SECURITIES | MORTGAGE- BACKED SECURITIES | TOTAL | |||||||||
Balance as of | $ | 35,886 | $ | 5,168 | $ | 41,054 | ||||||
Accrued discounts/premiums | — | (2,994 | ) | (2,994 | ) | |||||||
Realized gain (loss) | — | — | — | |||||||||
Change in unrealized (depreciation)* | (96 | ) | (1,656 | ) | (1,752 | ) | ||||||
Purchases | — | — | — | |||||||||
Sales | (2,646 | ) | — | (2,646 | ) | |||||||
Transfers into Level 3** | — | — | — | |||||||||
Transfers out of Level 3** | — | — | — | |||||||||
|
|
|
|
|
|
|
|
| ||||
Balance as of | $ | 33,144 | $ | 518 | $ | 33,662 | ||||||
|
|
|
|
|
|
|
|
| ||||
*The change in unrealized appreciation (depreciation) on securities still held at March 31, 2024 was $(1,752) and is included in the related net realized gains (losses) and net change in appreciation (depreciation) in the Statements of Operations.
**There were no transfers between level 2 and 3 for the year ended March 31, 2024.
311 / Annual Report March 2024
Table of Contents
Notes to Financial Statements (Continued)
FLEXIBLE INCOME FUND | ASSET-BACKED SECURITIES | COMMON STOCK | CORPORATES | MORTGAGE- BACKED SECURITIES | WARRANT | TOTAL | ||||||||||||||||||
Balance as of | $ | 438,609 | $ | 286,780 | $ | 69,795 | $ | 3,404,250 | $ | — | $ | 4,199,434 | ||||||||||||
Accrued discounts/premiums | — | — | 6,045 | (909,255 | ) | — | (903,210 | ) | ||||||||||||||||
Realized gain (loss) | — | — | (299,535 | ) | 181 | — | (299,354 | ) | ||||||||||||||||
Change in unrealized appreciation (depreciation)* | (1,177 | ) | 9,779 | 110,495 | 79,748 | (5,193 | ) | 193,652 | ||||||||||||||||
Purchases | — | 490 | 22,988 | 1,744,818 | — | 1,768,296 | ||||||||||||||||||
Sales | (32,338 | ) | — | (50,094 | ) | (38,409 | ) | — | (120,841 | ) | ||||||||||||||
Transfers into Level 3** | — | — | 160,225 | — | 5,193 | 165,418 | ||||||||||||||||||
Transfers out of Level 3** | — | — | — | — | — | — | ||||||||||||||||||
|
|
|
|
|
|
|
|
|
|
|
| |||||||||||||
Balance as of | $ | 405,094 | $ | 297,049 | $ | 19,919 | $ | 4,281,333 | $ | — | $ | 5,003,395 | ||||||||||||
|
|
|
|
|
|
|
|
|
|
|
| |||||||||||||
*The change in unrealized appreciation (depreciation) on securities still held at March 31, 2024 was $56,913 and is included in the related net realized gains (losses) and net change in appreciation (depreciation) in the Statements of Operations.
**Transfers into and transfers out of level 3 represent the values as of the end of the reporting period. As of March 31, 2023, the Fund used significant observable inputs in determining the value of certain investments. As of March 31, 2024, the Fund used significant unobservable inputs in determining the value of the same investments. As a result, investments with an end of period value of $165,418 transferred from level 2 to level 3 in the disclosure hierarchy.
| FLOATING RATE INCOME FUND | BANK LOANS | COMMON STOCK | PREFERRED STOCK | WARRANT | TOTAL | |||||||||||||||
Balance as of | $ | 2,042,197 | $ | 251,212 | $ | — | $ | — | $ | 2,293,409 | ||||||||||
Accrued discounts/premiums | 38,393 | — | — | — | 38,393 | |||||||||||||||
Realized (loss) | (51,108 | ) | — | — | — | (51,108 | ) | |||||||||||||
Change in unrealized appreciation (depreciation)* | 242,858 | 8,563 | (223,183 | ) | (7,806 | ) | 20,432 | |||||||||||||
Purchases | 777,431 | 455 | 697,797 | — | 1,475,683 | |||||||||||||||
Sales | (754,699 | ) | — | — | — | (754,699 | ) | |||||||||||||
Transfers into Level 3** | — | — | — | 7,806 | 7,806 | |||||||||||||||
Transfers out of Level 3*** | (395,418 | ) | — | — | — | (395,418 | ) | |||||||||||||
|
|
|
|
|
|
|
|
|
| |||||||||||
Balance as of | $ | 1,899,654 | $ | 260,230 | $ | 474,614 | $ | — | $ | 2,634,498 | ||||||||||
|
|
|
|
|
|
|
|
|
| |||||||||||
*The change in unrealized appreciation (depreciation) on securities still held at March 31, 2024 was $(168,366) and is included in the related net realized gains (losses) and net change in appreciation (depreciation) in the Statements of Operations.
**Transfers into and transfers out of level 3 represent the values as of the end of the reporting period. As of March 31, 2023, the Fund used significant observable inputs in determining the value of certain investments. As of March 31, 2024, the Fund used significant unobservable inputs in determining the value of the same investments. As a result, investments with an end of period value of $7,806 transferred from level 2 to level 3 in the disclosure hierarchy.
***Transfers into and transfers out of level 3 represent the values as of the end of the reporting period. As of March 31, 2023, the Fund used significant unobservable inputs in determining the value of certain investments. As of March 31, 2024, the Fund used observable inputs in determining the value of the same investments. As a result, investments with an end of period value of $395,418 transferred from level 3 to level 2 in the disclosure hierarchy.
Annual Report March 2024 / 312
Table of Contents
Notes to Financial Statements (Continued)
HIGH YIELD BOND FUND | COMMON STOCK | CORPORATES | CREDIT DEFAULT SWAPS | WARRANT | TOTAL | |||||||||||||||
Balance as of | $ | 3,261,310 | $ | — | $ | 20,044 | $ | 23 | $ | 3,281,377 | ||||||||||
Accrued discounts/premiums | — | 16,866 | (14,328 | ) | — | 2,538 | ||||||||||||||
Realized (loss) | (200,012 | ) | (2,085,010 | ) | — | — | (2,285,022 | ) | ||||||||||||
Change in unrealized appreciation (depreciation)* | 442,572 | 188,256 | (5,716 | ) | (9,811 | ) | 615,301 | |||||||||||||
Purchases | 5,985 | — | — | — | 5,985 | |||||||||||||||
Sales | (1,474,988 | ) | (365,770 | ) | — | — | (1,840,758 | ) | ||||||||||||
Transfers into Level 3** | — | 2,247,018 | — | 9,804 | 2,256,822 | |||||||||||||||
Transfers out of Level 3** | — | — | — | — | — | |||||||||||||||
|
|
|
|
|
|
|
|
|
|
|
|
|
|
| ||||||
Balance as of | $ | 2,034,867 | $ | 1,360 | $ | — | $ | 16 | $ | 2,036,243 | ||||||||||
|
|
|
|
|
|
|
|
|
|
|
|
|
|
| ||||||
*The change in unrealized appreciation (depreciation) on securities still held at March 31, 2024 was $621,016 and is included in the related net realized gains (losses) and net change in appreciation (depreciation) in the Statements of Operations.
**Transfers into and transfers out of level 3 represent the values as of the end of the reporting period. As of March 31, 2023, the Fund used significant observable inputs in determining the value of certain investments. As of March 31, 2024, the Fund used significant unobservable inputs in determining the value of the same investments. As a result, investments with an end of period value of $2,256,822 transferred from level 2 to level 3 in the disclosure hierarchy.
INTERMEDIATE BOND FUND | ASSET-BACKED SECURITIES | COMMON STOCK | CREDIT DEFAULT | TOTAL | ||||||||||||
Balance as of | $ | 1,834,181 | $ | 396,474 | $ | 20,902 | $ | 2,251,557 | ||||||||
Accrued discounts/premiums | — | — | (14,988 | ) | (14,988 | ) | ||||||||||
Realized gain (loss) | — | — | — | — | ||||||||||||
Change in unrealized appreciation (depreciation)* | (4,919 | ) | 13,527 | (5,914 | ) | 2,694 | ||||||||||
Purchases | — | 703 | — | 703 | ||||||||||||
Sales | (135,231 | ) | — | — | (135,231 | ) | ||||||||||
Transfers into Level 3** | — | — | — | — | ||||||||||||
Transfers out of Level 3** | — | — | — | — | ||||||||||||
|
|
|
|
|
|
|
|
|
|
|
| |||||
Balance as of | $ | 1,694,031 | $ | 410,704 | $ | — | $ | 2,104,735 | ||||||||
|
|
|
|
|
|
|
|
|
|
|
| |||||
*The change in unrealized appreciation (depreciation) on securities still held at March 31, 2024 was $8,608 and is included in the related net realized gains (losses) and net change in appreciation (depreciation) in the Statements of Operations.
**There were no transfers between level 2 and 3 for the year ended March 31, 2024.
INVESTMENT GRADE CREDIT FUND | ASSET-BACKED SECURITIES | MORTGAGE- BACKED SECURITIES | TOTAL | |||||||||
Balance as of | $ | 31,899 | $ | 17,682 | $ | 49,581 | ||||||
Accrued discounts/premiums | — | (5,260 | ) | (5,260 | ) | |||||||
Realized gain (loss) | — | — | — | |||||||||
Change in unrealized (depreciation)* | (86 | ) | (10,684 | ) | (10,770 | ) | ||||||
Purchases | — | — | — | |||||||||
Sales | (2,352 | ) | — | (2,352 | ) | |||||||
Transfers into Level 3** | — | — | — | |||||||||
Transfers out of Level 3** | — | — | — | |||||||||
|
|
|
|
|
|
|
|
| ||||
Balance as of | $ | 29,461 | $ | 1,738 | $ | 31,199 | ||||||
|
|
|
|
|
|
|
|
| ||||
*The change in unrealized appreciation (depreciation) on securities still held at March 31, 2024 was $(10,770) and is included in the related net realized gains (losses) and net change in appreciation (depreciation) in the Statements of Operations.
**There were no transfers between level 2 and 3 for the year ended March 31, 2024.
313 / Annual Report March 2024
Table of Contents
Notes to Financial Statements (Continued)
| LOW DURATION BOND FUND | ASSET-BACKED SECURITIES | CREDIT DEFAULT SWAPS | MORTGAGE- BACKED SECURITIES | TOTAL | ||||||||||||
Balance as of | $ | 5,422,797 | $ | 67,603 | $ | 3,359,676 | $ | 8,850,076 | ||||||||
Accrued discounts/premiums | — | (48,325 | ) | (94,651 | ) | (142,976 | ) | |||||||||
Realized gain (loss) | — | — | — | — | ||||||||||||
Change in unrealized (depreciation)* | (14,544 | ) | (19,278 | ) | (89,608 | ) | (123,430 | ) | ||||||||
Purchases | — | — | — | — | ||||||||||||
Sales | (399,812 | ) | — | — | (399,812 | ) | ||||||||||
Transfers into Level 3** | — | — | — | — | ||||||||||||
Transfers out of Level 3** | — | — | — | — | ||||||||||||
|
|
|
|
|
|
|
|
|
|
|
| |||||
Balance as of | $ | 5,008,441 | $ | — | $ | 3,175,417 | $ | 8,183,858 | ||||||||
|
|
|
|
|
|
|
|
|
|
|
| |||||
*The change in unrealized appreciation (depreciation) on securities still held at March 31, 2024 was $(104,152) and is included in the related net realized gains (losses) and net change in appreciation (depreciation) in the Statements of Operations.
**There were no transfers between level 2 and 3 for the year ended March 31, 2024.
OPPORTUNISTIC HIGH INCOME CREDIT FUND | CORPORATES | MORTGAGE- BACKED SECURITIES | TOTAL | |||||||||
Balance as of | $ | — | $ | 16,821 | $ | 16,821 | ||||||
Accrued discounts/premiums | 11 | (4,927 | ) | (4,916 | ) | |||||||
Realized (loss) | (5,539 | ) | — | (5,539 | ) | |||||||
Change in unrealized appreciation* | 916 | 975 | 1,891 | |||||||||
Purchases | — | — | — | |||||||||
Sales | (1,461 | ) | — | (1,461 | ) | |||||||
Transfers into Level 3** | 6,077 | — | 6,077 | |||||||||
Transfers out of Level 3** | — | — | — | |||||||||
|
|
|
|
|
|
|
|
| ||||
Balance as of | $ | 4 | $ | 12,869 | $ | 12,873 | ||||||
|
|
|
|
|
|
|
|
| ||||
*The change in unrealized appreciation (depreciation) on securities still held at March 31, 2024 was $1,891 and is included in the related net realized gains (losses) and net change in appreciation (depreciation) in the Statements of Operations.
**Transfers into and transfers out of level 3 represent the values as of the end of the reporting period. As of March 31, 2023, the Fund used significant observable inputs in determining the value of certain investments. As of March 31, 2024, the Fund used significant unobservable inputs in determining the value of the same investments. As a result, investments with an end of period value of $6,077 transferred from level 2 to level 3 in the disclosure hierarchy.
Annual Report March 2024 / 314
Table of Contents
Notes to Financial Statements (Continued)
STRATEGIC INCOME FUND | ASSET-BACKED SECURITIES | COMMON STOCK | CORPORATES | MORTGAGE- BACKED SECURITIES | TOTAL | |||||||||||||||
Balance as of | $ | 104,763 | $ | 27,066 | $ | — | $ | 326,465 | $ | 458,294 | ||||||||||
Accrued discounts/premiums | 190 | — | 330 | 207,005 | 207,525 | |||||||||||||||
Realized gain (loss) | — | — | (11,303 | ) | 2,012 | (9,291 | ) | |||||||||||||
Change in unrealized appreciation (depreciation)* | (2,472 | ) | 917 | (10,129 | ) | (197,362 | ) | (209,046 | ) | |||||||||||
Purchases | — | 21 | — | — | 21 | |||||||||||||||
Sales | (4,410 | ) | — | (2,080 | ) | (2,466 | ) | (8,956 | ) | |||||||||||
Transfers into Level 3** | — | — | 23,205 | — | 23,205 | |||||||||||||||
Transfers out of Level 3** | — | — | — | — | — | |||||||||||||||
|
|
|
|
|
|
|
|
|
| |||||||||||
Balance as of | $ | 98,071 | $ | 28,004 | $ | 23 | $ | 335,654 | $ | 461,752 | ||||||||||
|
|
|
|
|
|
|
|
|
| |||||||||||
*The change in unrealized appreciation (depreciation) on securities still held at March 31, 2024 was $(209,046) and is included in the related net realized gains (losses) and net change in appreciation (depreciation) in the Statements of Operations.
**Transfers into and transfers out of level 3 represent the values as of the end of the reporting period. As of March 31, 2023, the Fund used significant observable inputs in determining the value of certain investments. As of March 31, 2024, the Fund used significant unobservable inputs in determining the value of the same investments. As a result, investments with an end of period value of $23,205 transferred from level 2 to level 3 in the disclosure hierarchy. |
| |||||||||||||||||||
TOTAL RETURN BOND FUND | ASSET-BACKED SECURITIES | BANK LOANS | COMMON STOCK | CORPORATES | CREDIT DEFAULT SWAPS | MORTGAGE- BACKED SECURITIES | TOTAL | |||||||||||||||||||||
Balance as of | $ | 25,670,562 | $ | 4,371,966 | $ | 62,266,334 | $ | 2,954,705 | $ | 201,952 | $ | 379,572,729 | $ | 475,038,248 | ||||||||||||||
Accrued discounts/premiums | (6,889,979 | ) | 585 | — | (18,879 | ) | (144,841 | ) | 93,863 | (6,959,251 | ) | |||||||||||||||||
Realized gain (loss) | — | (4,276,742 | ) | — | (10,630 | ) | — | 72,756 | (4,214,616 | ) | ||||||||||||||||||
Change in unrealized appreciation (depreciation)* | 4,584,517 | 2,136,514 | 2,125,557 | 204,798 | (57,111 | ) | 6,572,531 | 15,566,806 | ||||||||||||||||||||
Purchases | 32,441,332 | 766,560 | 114,828 | — | — | — | 33,322,720 | |||||||||||||||||||||
Sales | (1,892,641 | ) | (2,998,883 | ) | — | (99,565 | ) | — | (15,445,334 | ) | (20,436,423 | ) | ||||||||||||||||
Transfers into Level 3** | — | — | — | — | — | — | — | |||||||||||||||||||||
Transfers out of Level 3** | — | — | — | — | — | — | — | |||||||||||||||||||||
|
|
|
|
|
|
|
|
|
|
|
|
|
| |||||||||||||||
Balance as of | $ | 53,913,791 | $ | — | $ | 64,506,719 | $ | 3,030,429 | $ | — | $ | 370,866,545 | $ | 492,317,484 | ||||||||||||||
|
|
|
|
|
|
|
|
|
|
|
|
|
| |||||||||||||||
*The change in unrealized appreciation (depreciation) on securities still held at March 31, 2024 was $13,487,400 and is included in the related net realized gains (losses) and net change in appreciation (depreciation) in the Statements of Operations.
**There were no transfers between level 2 and 3 for the year ended March 31, 2024. |
| |||||||||||||||||||||||||||
315 / Annual Report March 2024
Table of Contents
Notes to Financial Statements (Continued)
ULTRA SHORT BOND FUND | MORTGAGE- BACKED SECURITIES | TOTAL | ||||||
Balance as of | $ | 11,884 | $ | 11,884 | ||||
Accrued discounts/premiums | (5,462 | ) | (5,462 | ) | ||||
Realized gain (loss) | — | — | ||||||
Change in unrealized appreciation* | 2,966 | 2,966 | ||||||
Purchases | — | — | ||||||
Sales | — | — | ||||||
Transfers into Level 3** | — | — | ||||||
Transfers out of Level 3** | — | — | ||||||
|
|
|
| |||||
Balance as of | $ | 9,388 | $ | 9,388 | ||||
|
|
|
| |||||
*The change in unrealized appreciation (depreciation) on securities still held at March 31, 2024 was $2,966 and is included in the related net realized gains (losses) and net change in appreciation (depreciation) in the Statements of Operations.
**There were no transfers between level 2 and 3 for the year ended March 31, 2024. |
| |||||||
| UNCONSTRAINED BOND FUND | ASSET-BACKED SECURITIES | BANK LOANS | COMMON STOCK | CORPORATES | CREDIT DEFAULT SWAPS | MORTGAGE- BACKED SECURITIES | TOTAL | |||||||||||||||||||||
Balance as of | $ | 8,213,942 | $ | 386,748 | $ | 3,667,430 | $ | 1,354,993 | $ | 93,403 | $ | 7,311,772 | $ | 21,028,288 | ||||||||||||||
Accrued discounts/premiums | — | 52 | — | 261,391 | (66,973 | ) | 84,936 | 279,406 | ||||||||||||||||||||
Realized gain (loss) | — | (378,324 | ) | — | (3,622,598 | ) | — | 2,450 | (3,998,472 | ) | ||||||||||||||||||
Change in unrealized appreciation (depreciation)* | (6,812 | ) | 188,997 | 125,185 | 1,132,881 | (26,430 | ) | 58,615 | 1,472,436 | |||||||||||||||||||
Purchases | 2,650,000 | 67,811 | 6,731 | 355,570 | — | — | 3,080,112 | |||||||||||||||||||||
Sales | (605,598 | ) | (265,284 | ) | — | (507,219 | ) | — | (520,126 | ) | (1,898,227 | ) | ||||||||||||||||
Transfers into Level 3** | — | — | — | 1,453,184 | — | — | 1,453,184 | |||||||||||||||||||||
Transfers out of Level 3** | — | — | — | — | — | — | — | |||||||||||||||||||||
|
|
|
|
|
|
|
|
|
|
|
|
|
| |||||||||||||||
Balance as of | $ | 10,251,532 | $ | — | $ | 3,799,346 | $ | 428,202 | $ | — | $ | 6,937,647 | $ | 21,416,727 | ||||||||||||||
|
|
|
|
|
|
|
|
|
|
|
|
|
| |||||||||||||||
*The change in unrealized appreciation (depreciation) on securities still held at March 31, 2024 was $(1,209,706) and is included in the related net realized gains (losses) and net change in appreciation (depreciation) in the Statements of Operations.
**Transfers into and transfers out of level 3 represent the values as of the end of the reporting period. As of March 31, 2023, the Fund used significant observable inputs in determining the value of certain investments. As of March 31, 2024, the Fund used significant unobservable inputs in determining the value of the same investments. As a result, investments with an end of period value of $1,453,184 transferred from level 2 to level 3 in the disclosure hierarchy. |
| |||||||||||||||||||||||||||
Annual Report March 2024 / 316
Table of Contents
Notes to Financial Statements (Continued)
Significant unobservable valuations inputs for Level 3 investments as of March 31, 2024, are as follows:
| ALPHATRAK 500 FUND | FAIR VALUE AT 3/31/24 | VALUATION TECHNIQUE* | UNOBSERVABLE INPUT | RANGE | WEIGHTED AVERAGE | INPUT TO VALUATION IF INPUT INCREASES | ||||||
Common Stock | $20,774 | Third-Party Vendor | Vendor Prices | $26.88 | $26.88 | Increase | ||||||
Mortgage-Backed | ||||||||||||
Securities-Non-Agency | $13,537 | Third-Party Vendor | Vendor Prices | $1.12 | $1.12 | Increase | ||||||
Mortgage-Backed Securities- | ||||||||||||
Non-Agency Commercial | $8,820 | Third-Party Vendor | Vendor Prices | $0.02 - $1.48 | $1.48 | Increase | ||||||
Mortgage-Backed Securities- | ||||||||||||
U.S. Agency Commercial | $— | Broker Quote | Offered Quote | $— | $— | Increase | ||||||
| CORPORATE BOND FUND | FAIR VALUE AT 3/31/24 | VALUATION TECHNIQUE* | UNOBSERVABLE INPUT | RANGE | WEIGHTED AVERAGE | INPUT TO VALUATION IF INPUT INCREASES | ||||||
Asset-Backed Securities | $33,144 | Broker Quote | Offered Quote | $89.32 | $89.32 | Increase | ||||||
Mortgage-Backed Securities- | ||||||||||||
Non-Agency Commercial | $518 | Third-Party Vendor | Vendor Prices | $0.02 - $0.10 | $0.09 | Increase | ||||||
| FLEXIBLE INCOME FUND | FAIR VALUE AT 3/31/24 | VALUATION TECHNIQUE* | UNOBSERVABLE INPUT | RANGE | WEIGHTED AVERAGE | INPUT TO VALUATION IF INPUT INCREASES | ||||||
Asset-Backed Securities | $405,094 | Broker Quote | Offered Quote | $89.32 | $89.32 | Increase | ||||||
Common Stock | $297,049 | Third-Party Vendor | Vendor Prices | $26.88 | $26.88 | Increase | ||||||
Corporate Securities | $19,919 | Third-Party Vendor | Vendor Prices | $0.09 - $11.75 | $8.48 | Increase | ||||||
Mortgage-Backed | ||||||||||||
Securities-Non-Agency | $3,569,964 | Third-Party Vendor | Vendor Prices | $0.00 - $9.99 | $7.55 | Increase | ||||||
Mortgage-Backed Securities- | ||||||||||||
Non-Agency Commercial | $686,049 | Broker Quote | Offered Quote | $97.70 - $99.90 | $99.29 | Increase | ||||||
Mortgage-Backed Securities- | ||||||||||||
Non-Agency Commercial | $25,320 | Third-Party Vendor | Vendor Prices | $0.10 | $0.10 | Increase | ||||||
Warrant | $— | Broker Quote | Offered Quote | $— | $— | Increase | ||||||
| FLOATING RATE INCOME FUND | FAIR VALUE AT 3/31/24 | VALUATION TECHNIQUE* | UNOBSERVABLE INPUT | RANGE | WEIGHTED AVERAGE | INPUT TO VALUATION IF INPUT INCREASES | ||||||
Bank Loans | $1,899,654 | Third-Party Vendor | Vendor Prices | $55.00 - $99.25 | $90.57 | Increase | ||||||
Common Stock | $— | Broker Quote | Offered Quote | $— | $— | Increase | ||||||
Common Stock | $260,230 | Third-Party Vendor | Vendor Prices | $26.88 | $26.88 | Increase | ||||||
Preferred Stock | $474,614 | Third-Party Vendor | Vendor Prices | $0.45 | $0.45 | Increase | ||||||
Warrant | $— | Broker Quote | Offered Quote | $— | $— | Increase | ||||||
| 317 / Annual Report March 2024 |
Table of Contents
Notes to Financial Statements (Continued)
| HIGH YIELD BOND FUND | FAIR VALUE AT 3/31/24 | VALUATION TECHNIQUE* | UNOBSERVABLE INPUT | RANGE | WEIGHTED AVERAGE | INPUT TO VALUATION IF INPUT INCREASES | ||||||
Common Stock | $— | Broker Quote | Offered Quote | $— | $— | Increase | ||||||
Common Stock | $2,034,867 | Third-Party Vendor | Vendor Prices | $26.88 | $26.88 | Increase | ||||||
Corporate Securities | $1,360 | Third-Party Vendor | Vendor Prices | $0.09 | $0.09 | Increase | ||||||
Warrant | $— | Broker Quote | Offered Quote | $— | $— | Increase | ||||||
Warrant | $16 | Third-Party Vendor | Vendor Prices | $1.00 | $1.00 | Increase | ||||||
| INTERMEDIATE BOND FUND | FAIR VALUE AT 3/31/24 | VALUATION TECHNIQUE* | UNOBSERVABLE INPUT | RANGE | WEIGHTED AVERAGE | INPUT TO VALUATION IF INPUT INCREASES | ||||||
Asset-Backed Securities | $1,694,031 | Broker Quote | Offered Quote | $89.32 | $89.32 | Increase | ||||||
Common Stock | $— | Broker Quote | Offered Quote | $— | $— | Increase | ||||||
Common Stock | $410,704 | Third-Party Vendor | Vendor Prices | $26.88 | $26.88 | Increase | ||||||
| INVESTMENT GRADE CREDIT FUND | FAIR VALUE AT 3/31/24 | VALUATION TECHNIQUE* | UNOBSERVABLE INPUT | RANGE | WEIGHTED AVERAGE | INPUT TO VALUATION IF INPUT INCREASES | ||||||
Asset-Backed Securities | $29,461 | Broker Quote | Offered Quote | $89.32 | $89.32 | Increase | ||||||
Mortgage-Backed Securities- | ||||||||||||
Non-Agency Commercial | $1,738 | Third-Party Vendor | Vendor Prices | $0.02 - $0.10 | $0.10 | Increase | ||||||
| LOW DURATION BOND FUND | FAIR VALUE AT 3/31/24 | VALUATION TECHNIQUE* | UNOBSERVABLE INPUT | RANGE | WEIGHTED AVERAGE | INPUT TO VALUATION IF INPUT INCREASES | ||||||
Asset-Backed Securities | $5,008,441 | Broker Quote | Offered Quote | $89.32 | $89.32 | Increase | ||||||
Common Stock | $— | Broker Quote | Offered Quote | $— | $— | Increase | ||||||
Mortgage-Backed | ||||||||||||
Securities-Non-Agency | $478,117 | Third-Party Vendor | Vendor Prices | $1.13 | $1.13 | Increase | ||||||
Mortgage-Backed Securities- | ||||||||||||
Non-Agency Commercial | $2,697,300 | Broker Quote | Offered Quote | $99.90 | $99.90 | Increase | ||||||
| OPPORTUNISTIC HIGH INCOME CREDIT FUND | FAIR VALUE AT 3/31/24 | VALUATION TECHNIQUE* | UNOBSERVABLE INPUT | RANGE | WEIGHTED AVERAGE | INPUT TO VALUATION IF INPUT INCREASES | ||||||
Corporate Securities | $4 | Third-Party Vendor | Vendor Prices | $0.09 | $0.09 | Increase | ||||||
Mortgage-Backed | ||||||||||||
Securities-Non-Agency | $12,869 | Third-Party Vendor | Vendor Prices | $5.90 | $5.90 | Increase |
| Annual Report March 2024 / 318 |
Table of Contents
Notes to Financial Statements (Continued)
| STRATEGIC INCOME FUND | FAIR VALUE AT 3/31/24 | VALUATION TECHNIQUE* | UNOBSERVABLE INPUT | RANGE | WEIGHTED AVERAGE | INPUT TO VALUATION IF INPUT INCREASES | ||||||
Asset-Backed Securities | $55,240 | Broker Quote | Offered Quote | $89.32 | $89.32 | Increase | ||||||
Asset-Backed Securities | $42,831 | Third-Party Vendor | Vendor Prices | $10.20 | $10.20 | Increase | ||||||
Common Stock | $28,004 | Third-Party Vendor | Vendor Prices | $26.88 | $26.88 | Increase | ||||||
Corporate Securities | $23 | Third-Party Vendor | Vendor Prices | $0.09 | $0.09 | Increase | ||||||
Mortgage-Backed | ||||||||||||
Securities-Non-Agency | $335,654 | Third-Party Vendor | Vendor Prices | $4.65 - $10.70 | $9.28 | Increase | ||||||
| TOTAL RETURN BOND FUND | FAIR VALUE AT 3/31/24 | VALUATION TECHNIQUE* | UNOBSERVABLE INPUT | RANGE | WEIGHTED AVERAGE | INPUT TO VALUATION IF INPUT INCREASES | ||||||
Asset-Backed Securities | $47,873,035 | Broker Quote | Offered Quote | $89.32 - $100.57 | $95.00 | Increase | ||||||
Asset-Backed Securities | $6,040,756 | Third-Party Vendor | Vendor Prices | $1.59 | $1.59 | Increase | ||||||
Common Stock | $— | Broker Quote | Offered Quote | $— | $— | Increase | ||||||
Common Stock | $64,506,719 | Third-Party Vendor | Vendor Prices | $26.88 | $26.88 | Increase | ||||||
Corporate Securities | $3,030,429 | Third-Party Vendor | Vendor Prices | $102.27 | $102.27 | Increase | ||||||
Mortgage-Backed | ||||||||||||
Securities-Non-Agency | $5,754,335 | Third-Party Vendor | Vendor Prices | $0.85 - $96.81 | $12.76 | Increase | ||||||
Mortgage-Backed Securities- | ||||||||||||
Non-Agency Commercial | $365,112,210 | Broker Quote | Offered Quote | $97.70 - $99.90 | $99.20 | Increase | ||||||
| ULTRA SHORT BOND FUND | FAIR VALUE AT 3/31/24 | VALUATION TECHNIQUE* | UNOBSERVABLE INPUT | RANGE | WEIGHTED AVERAGE | INPUT TO VALUATION IF INPUT INCREASES | ||||||
Mortgage-Backed | ||||||||||||
Securities-Non-Agency | $9,388 | Third-Party Vendor | Vendor Prices | $1.12 | $1.12 | Increase | ||||||
| UNCONSTRAINED BOND FUND | FAIR VALUE AT 3/31/24 | VALUATION TECHNIQUE* | UNOBSERVABLE INPUT | RANGE | WEIGHTED AVERAGE | INPUT TO VALUATION IF INPUT INCREASES | ||||||
Asset-Backed Securities | $10,251,532 | Broker Quote | Offered Quote | $89.32 - $100.57 | $92.24 | Increase | ||||||
Common Stock | $— | Broker Quote | Offered Quote | $— | $— | Increase | ||||||
Common Stock | $3,799,346 | Third-Party Vendor | Vendor Prices | $26.88 | $26.88 | Increase | ||||||
Corporate Securities | $428,202 | Third-Party Vendor | Vendor Prices | $0.09 - $11.75 | $7.24 | Increase | ||||||
Mortgage-Backed | ||||||||||||
Securities-Non-Agency | $48,119 | Third-Party Vendor | Vendor Prices | $0.50 - $4.65 | $4.07 | Increase | ||||||
Mortgage-Backed Securities- | ||||||||||||
Non-Agency Commercial | $6,889,528 | Broker Quote | Offered Quote | $97.70 - $99.90 | $99.07 | Increase |
* The valuation technique employed on the Level 3 securities involves the use of vendor prices, broker quotes and benchmark pricing. The Adviser monitors the third-party brokers and vendors using the valuation process.
| 319 / Annual Report March 2024 |
Table of Contents
Notes to Financial Statements (Continued)
Derivative Instruments Categorized by Risk Exposure:
The following is a summary of the location of derivative instruments on the Funds’ Statements of Assets and Liabilities as of March 31, 2024:
| LOCATION ON THE STATEMENTS OF ASSETS AND LIABILITIES | ||||
| DERIVATIVE TYPE | ASSET DERIVATIVES | LIABILITY DERIVATIVES | ||
Interest rate contracts | Unrealized appreciation on swap contracts Premiums paid for swap contracts Receivable for daily variation margin Investments, at value | Unrealized depreciation on swap contracts Premiums received on swap contracts Payable for daily variation margin Options written | ||
Credit contracts | Unrealized appreciation on swap contracts Premiums paid for swap contracts | Unrealized depreciation on swap contracts Premiums received for swap contracts | ||
Equity contracts | Unrealized appreciation on swap contracts Premiums paid for swap contracts Receivable for daily variation margin — | Unrealized depreciation on swap contracts Premiums received for swap contracts Payable for daily variation margin Options written | ||
Foreign currency exchange contracts | Unrealized appreciation on foreign currency exchange contracts | Unrealized depreciation on foreign currency exchange contracts | ||
The following is a summary of the Funds’ derivative instrument holdings categorized by primary risk exposure as of March 31, 2024:
| ASSET DERIVATIVE INVESTMENTS | ||||||||||||||||||||||||
| ALPHATRAK 500 FUND | CORPORATE BOND FUND | FLEXIBLE INCOME FUND | FLOATING RATE INCOME FUND | HIGH YIELD BOND FUND | INTERMEDIATE BOND FUND | |||||||||||||||||||
Equity contracts: | $ | 541,043 | $ | — | $ | — | $ | — | $ | — | $ | — | ||||||||||||
Interest contracts: | ||||||||||||||||||||||||
Futures1 | — | — | 125,829 | — | 54,027 | 151,066 | ||||||||||||||||||
Swaps | — | 898 | — | — | — | — | ||||||||||||||||||
Foreign currency exchange contracts: | ||||||||||||||||||||||||
Forwards | — | — | 158,470 | 15,117 | 220,368 | 441,417 | ||||||||||||||||||
|
|
|
|
|
|
|
|
|
|
|
|
|
|
|
|
|
| |||||||
Total | $ | 541,043 | $ | 898 | $ | 284,299 | $ | 15,117 | $ | 274,395 | $ | 592,483 | ||||||||||||
|
|
|
|
|
|
|
|
|
|
|
|
|
|
|
|
|
| |||||||
| ASSET DERIVATIVE INVESTMENTS | ||||||||||||||||||||||||
| INVESTMENT GRADE CREDIT FUND | LOW DURATION BOND FUND | OPPORTUNISTIC HIGH INCOME CREDIT FUND | STRATEGIC INCOME FUND | SUSTAINABLE SECURITIZED FUND | TOTAL RETURN BOND FUND | |||||||||||||||||||
Interest contracts: | ||||||||||||||||||||||||
Futures1 | $ | 2,265 | $ | 3,677 | $ | 208 | $ | 19,105 | $ | 6,456 | $ | 6,494,198 | ||||||||||||
Swaps | 805 | — | — | 1,830 | — | 7,999,752 | ||||||||||||||||||
Foreign currency exchange contracts: | ||||||||||||||||||||||||
Forwards | 158 | 314,681 | — | 19,317 | — | 28,523,362 | ||||||||||||||||||
|
|
|
|
|
|
|
|
|
|
|
|
|
|
|
|
|
| |||||||
Total | $ | 3,228 | $ | 318,358 | $ | 208 | $ | 40,252 | $ | 6,456 | $ | 43,017,312 | ||||||||||||
|
|
|
|
|
|
|
|
|
|
|
|
|
|
|
|
|
| |||||||
Annual Report March 2024 / 320
Table of Contents
Notes to Financial Statements (Continued)
| ASSET DERIVATIVE INVESTMENTS | ||||||||||||
| ULTRA SHORT BOND FUND | UNCONSTRAINED BOND FUND | |||||||||||
Interest contracts: | ||||||||||||
Futures1 | $ | 26 | $ | 395,513 | ||||||||
Swaps | — | 247,333 | ||||||||||
Foreign currency exchange contracts: | ||||||||||||
Forwards | 13,987 | 1,408,096 | ||||||||||
|
|
|
| |||||||||
Total | $ | 14,013 | $ | 2,050,942 | ||||||||
|
|
|
| |||||||||
1Includes cumulative appreciation (depreciation) of financial futures contracts as reported in the Schedules of Portfolio Investments. Only the current day’s margin variation is reported within the Statements of Assets and Liabilities.
| LIABILITY DERIVATIVE INVESTMENTS | ||||||||||||||||||||||||
| ALPHATRAK 500 FUND | CORPORATE BOND FUND | FLEXIBLE INCOME FUND | FLOATING RATE INCOME FUND | HIGH YIELD BOND FUND | INTERMEDIATE BOND FUND | |||||||||||||||||||
Interest contracts: | ||||||||||||||||||||||||
Futures1 | $ | — | $ | (3,497 | ) | $ | (370,795 | ) | $ | (350 | ) | $ | (96,663 | ) | $ | (438,915 | ) | |||||||
Foreign currency exchange contracts: | ||||||||||||||||||||||||
Forwards | — | — | (16,097 | ) | — | (3,114 | ) | (26,595 | ) | |||||||||||||||
|
|
|
|
|
|
|
|
|
|
|
| |||||||||||||
Total | $ | — | $ | (3,497 | ) | $ | (386,892 | ) | $ | (350 | ) | $ | (99,777 | ) | $ | (465,510 | ) | |||||||
|
|
|
|
|
|
|
|
|
|
|
| |||||||||||||
| LIABILITY DERIVATIVE INVESTMENTS | ||||||||||||||||||||||||
INVESTMENT GRADE CREDIT | LOW DURATION | OPPORTUNISTIC HIGH INCOME | STRATEGIC | SUSTAINABLE SECURITIZED | TOTAL RETURN | |||||||||||||||||||
Interest contracts: | ||||||||||||||||||||||||
Futures1 | $ | (17,129 | ) | $ | (2,050,474 | ) | $ | (914 | ) | $ | (45,777 | ) | $ | (1,648 | ) | $ | (32,139,701 | ) | ||||||
Foreign currency exchange contracts: | ||||||||||||||||||||||||
Forwards | — | (24,869 | ) | — | (907 | ) | — | (5,864,378 | ) | |||||||||||||||
|
|
|
|
|
|
|
|
|
|
|
| |||||||||||||
Total | $ | (17,129 | ) | $ | (2,075,343 | ) | $ | (914 | ) | $ | (46,684 | ) | $ | (1,648 | ) | $ | (38,004,079 | ) | ||||||
|
|
|
|
|
|
|
|
|
|
|
| |||||||||||||
| LIABILITY DERIVATIVE INVESTMENTS | ||||||||||||
| ULTRA SHORT | UNCONSTRAINED | |||||||||||
| BOND FUND | BOND FUND | |||||||||||
Interest contracts: | ||||||||||||
Futures1 | $ | (76,780 | ) | $ | (3,169,479 | ) | ||||||
Foreign currency exchange contracts: | ||||||||||||
Forwards | (743 | ) | (93,630 | ) | ||||||||
|
|
|
|
|
| |||||||
Total | $ | (77,523 | ) | $ | (3,263,109 | ) | ||||||
|
|
|
|
|
| |||||||
1Includes cumulative appreciation (depreciation) of financial futures contracts as reported in the Schedules of Portfolio Investments. Only the current day’s margin variation is reported within the Statements of Assets and Liabilities.
321 / Annual Report March 2024
Table of Contents
Notes to Financial Statements (Continued)
The following is a summary of the Funds’ realized gain (loss) and change in unrealized appreciation (depreciation) on derivative investments recognized in the Statements of Operations categorized by primary risk exposure for the year ended March 31, 2024:
| REALIZED GAIN (LOSS) ON DERIVATIVES RECOGNIZED IN THE STATEMENTS OF OPERATIONS | ||||||||||||||||||||||||
| ALPHATRAK 500 FUND | CORPORATE FUND | FLEXIBLE FUND | FLOATING RATE INCOME FUND | HIGH YIELD BOND FUND | INTERMEDIATE BOND FUND | |||||||||||||||||||
Credit contracts: | ||||||||||||||||||||||||
Swaps | $ | — | $ | — | $ | — | $ | — | $ | 75,949 | $ | 30,438 | ||||||||||||
Equity contracts: | ||||||||||||||||||||||||
Futures | 6,433,475 | — | — | — | — | — | ||||||||||||||||||
Interest contracts: | ||||||||||||||||||||||||
Futures | — | (30,640 | ) | (722,661 | ) | — | (1,953,219 | ) | (7,692,820 | ) | ||||||||||||||
Options and swaptions purchased1 | — | — | — | — | — | — | ||||||||||||||||||
Swaps | — | 7,774 | — | — | — | — | ||||||||||||||||||
Foreign currency exchange contracts: | — | — | (45,604 | ) | — | (6,664 | ) | (65,484 | ) | |||||||||||||||
|
|
|
|
|
|
|
|
|
|
|
| |||||||||||||
Total | $ | 6,433,475 | $ | (22,866 | ) | $ | (768,265 | ) | $ | — | $ | (1,883,934 | ) | $ | (7,727,866 | ) | ||||||||
|
|
|
|
|
|
|
|
|
|
|
| |||||||||||||
| REALIZED GAIN (LOSS) ON DERIVATIVES RECOGNIZED IN THE STATEMENTS OF OPERATIONS | ||||||||||||||||||||||||
| INVESTMENT GRADE CREDIT FUND | LOW DURATION BOND FUND | OPPORTUNISTIC HIGH INCOME CREDIT FUND | STRATEGIC INCOME FUND | SUSTAINABLE SECURITIZED FUND | TOTAL RETURN BOND FUND | |||||||||||||||||||
Credit contracts: | ||||||||||||||||||||||||
Swaps | $ | — | $ | 76,700 | $ | — | $ | — | $ | — | $ | 1,082,954 | ||||||||||||
Interest contracts: | ||||||||||||||||||||||||
Futures | (55,979 | ) | (4,242,472 | ) | (9,786 | ) | 277,216 | (67,460 | ) | (513,009,556 | ) | |||||||||||||
Options and swaptions purchased1 | — | (939,000 | ) | — | — | — | — | |||||||||||||||||
Options and swaptions written | — | 540,000 | — | — | — | — | ||||||||||||||||||
Swaps | 6,932 | — | — | 15,916 | — | 47,500,945 | ||||||||||||||||||
Foreign currency exchange contracts: | ||||||||||||||||||||||||
Forwards | — | (96,529 | ) | — | 654 | (1,423 | ) | 2,446,066 | ||||||||||||||||
|
|
|
|
|
|
|
|
|
|
|
| |||||||||||||
Total | $ | (49,047 | ) | $ | (4,661,301 | ) | $ | (9,786 | ) | $ | 293,786 | $ | (68,883 | ) | $ | (461,979,591 | ) | |||||||
|
|
|
|
|
|
|
|
|
|
|
| |||||||||||||
Annual Report March 2024 / 322
Table of Contents
Notes to Financial Statements (Continued)
| REALIZED GAIN (LOSS) ON DERIVATIVES RECOGNIZED IN THE STATEMENTS OF OPERATIONS | ||||||||||||||||
| ULTRA SHORT BOND FUND | UNCONSTRAINED BOND FUND | |||||||||||||||
Credit contracts: | ||||||||||||||||
Swaps | $ | 6,309 | $ | 216,518 | ||||||||||||
Interest contracts: | ||||||||||||||||
Futures | 353,161 | 6,486,601 | ||||||||||||||
Options and swaptions purchased1 | — | — | ||||||||||||||
Swaps | — | 2,150,586 | ||||||||||||||
Foreign currency exchange contracts: | ||||||||||||||||
Forwards | (4,597 | ) | (201,537 | ) | ||||||||||||
|
|
|
| |||||||||||||
Total | $ | 354,873 | $ | 8,652,168 | ||||||||||||
|
|
|
| |||||||||||||
1Options and swaptions purchased are included in net realized gain (loss) from investments — unaffiliated.
| CHANGE IN UNREALIZED APPRECIATION (DEPRECIATION) ON DERIVATIVES RECOGNIZED IN THE STATEMENTS OF OPERATIONS | ||||||||||||||||||||||||
ALPHATRAK | CORPORATE BOND FUND | FLEXIBLE INCOME FUND | FLOATING RATE | HIGH YIELD | INTERMEDIATE | |||||||||||||||||||
Credit contracts: | ||||||||||||||||||||||||
Swaps | $ | — | $ | — | $ | — | $ | — | $ | (15,927 | ) | $ | (8,867 | ) | ||||||||||
Equity contracts: | ||||||||||||||||||||||||
Futures | (1,182,472 | ) | — | — | — | — | — | |||||||||||||||||
Interest contracts: | ||||||||||||||||||||||||
Futures | — | (6,779 | ) | (1,342,270 | ) | (350 | ) | 105,270 | (3,169,611 | ) | ||||||||||||||
Options and swaptions purchased1 | — | — | — | — | — | — | ||||||||||||||||||
Swaps | — | 2,612 | — | — | — | — | ||||||||||||||||||
Foreign currency exchange contracts: | ||||||||||||||||||||||||
Forwards | — | — | 185,050 | 15,117 | 251,280 | 529,276 | ||||||||||||||||||
|
|
|
|
|
|
|
|
|
|
|
| |||||||||||||
Total | $ | (1,182,472 | ) | $ | (4,167 | ) | $ | (1,157,220 | ) | $ | 14,767 | $ | 340,623 | $ | (2,649,202 | ) | ||||||||
|
|
|
|
|
|
|
|
|
|
|
| |||||||||||||
| CHANGE IN UNREALIZED APPRECIATION (DEPRECIATION) ON DERIVATIVES RECOGNIZED IN THE STATEMENTS OF OPERATIONS | ||||||||||||||||||||||||
| INVESTMENT GRADE CREDIT FUND | LOW DURATION BOND FUND | OPPORTUNISTIC HIGH INCOME CREDIT FUND | STRATEGIC INCOME FUND | SUSTAINABLE SECURITIZED FUND | TOTAL RETURN BOND FUND | |||||||||||||||||||
Credit contracts: | ||||||||||||||||||||||||
Swaps | $ | — | $ | (28,033 | ) | $ | — | $ | — | $ | — | $ | (212,172 | ) | ||||||||||
Interest contracts: | ||||||||||||||||||||||||
Futures | (11,169 | ) | (4,450,800 | ) | (11,705 | ) | (21,149 | ) | (17,574 | ) | (177,599,074 | ) | ||||||||||||
Options and swaptions purchased1 | — | 937,524 | — | — | — | — | ||||||||||||||||||
Options and swaptions written | — | (539,997 | ) | — | — | — | — | |||||||||||||||||
Swaps | 2,339 | — | — | 5,349 | — | 18,912,115 | ||||||||||||||||||
Foreign currency exchange contracts: | ||||||||||||||||||||||||
Forwards | 158 | 404,188 | — | 20,816 | 3,724 | 33,469,580 | ||||||||||||||||||
|
|
|
|
|
|
|
|
|
|
|
| |||||||||||||
Total | $ | (8,672 | ) | $ | (3,677,118 | ) | $ | (11,705 | ) | $ | 5,016 | $ | (13,850 | ) | $ | (125,429,551 | ) | |||||||
|
|
|
|
|
|
|
|
|
|
|
| |||||||||||||
323 / Annual Report March 2024
Table of Contents
Notes to Financial Statements (Continued)
| CHANGE IN UNREALIZED APPRECIATION (DEPRECIATION) ON DERIVATIVES RECOGNIZED IN THE STATEMENTS OF OPERATIONS | ||||||||||||||||
ULTRA SHORT BOND FUND | UNCONSTRAINED BOND FUND | |||||||||||||||
Credit contracts: | ||||||||||||||||
Swaps | $ | (997 | ) | $ | (52,935 | ) | ||||||||||
Interest contracts: | ||||||||||||||||
Futures | 63,483 | (604,218) | ||||||||||||||
Options and swaptions purchased1 | — | — | ||||||||||||||
Swaps | — | 721,509 | ||||||||||||||
Foreign currency exchange contracts: | ||||||||||||||||
Forwards | 17,712 | 1,697,738 | ||||||||||||||
|
|
|
|
| ||||||||||||
Total | $ | 80,198 | $ | 1,762,094 | ||||||||||||
|
|
|
|
| ||||||||||||
1Options purchased are included in net change in unrealized appreciation (depreciation) on investments.
| AVERAGE PERIOD BALANCE OF OUTSTANDING DERIVATIVE FINANCIAL INSTRUMENTS1 | ||||||||||||||||||||||||
| ALPHATRAK 500 FUND | CORPORATE FUND | FLEXIBLE INCOME FUND | FLOATING RATE INCOME FUND | HIGH YIELD BOND FUND | INTERMEDIATE BOND FUND | |||||||||||||||||||
Financial futures contracts: | ||||||||||||||||||||||||
Average number of contracts purchased | 116 | 14 | 1,378 | — | 633 | 2,045 | ||||||||||||||||||
Average number of contracts sold | — | 5 | 408 | 1 | 88 | 188 | ||||||||||||||||||
Average value of contracts purchased | $ | 945,653 | $ | 21,803 | $ | 1,955,874 | $ | — | $ | 530,448 | $ | 3,125,463 | ||||||||||||
Average value of contracts sold | $ | — | $ | 10,333 | $ | 1,231,968 | $ | 88 | $ | 127,458 | $ | 640,112 | ||||||||||||
Credit default swaps: | ||||||||||||||||||||||||
Average number of contracts - sell protection | — | — | — | — | 1 | 1 | ||||||||||||||||||
Average notional value - sell protection | $ | — | $ | — | $ | — | $ | — | $ | 1,997,500 | $ | 577,500 | ||||||||||||
Interest rate swaps: | ||||||||||||||||||||||||
Average number of contracts - receives fixed rate | — | 1 | — | — | — | — | ||||||||||||||||||
Average notional - receives fixed rate | $ | — | $ | 77 | $ | — | $ | — | $ | — | $ | — | ||||||||||||
Foreign currency exchange contracts: | ||||||||||||||||||||||||
Average number of contracts sold | — | — | 5 | 1 | 3 | 6 | ||||||||||||||||||
Average value of contracts sold | $ | — | $ | — | $ | 182,963 | $ | 3,779 | $ | 149,171 | $ | 555,059 | ||||||||||||
Annual Report March 2024 / 324
Table of Contents
Notes to Financial Statements (Continued)
| AVERAGE PERIOD BALANCE OF OUTSTANDING DERIVATIVE FINANCIAL INSTRUMENTS1 | ||||||||||||||||||||||||
| INVESTMENT GRADE CREDIT FUND | LOW DURATION BOND FUND | OPPORTUNISTIC HIGH INCOME CREDIT FUND | STRATEGIC INCOME FUND | SUSTAINABLE SECURITIZED FUND | TOTAL RETURN BOND FUND | |||||||||||||||||||
Financial futures contracts: | ||||||||||||||||||||||||
Average number of contracts purchased | 35 | 5,327 | 6 | 137 | 16 | 98,306 | ||||||||||||||||||
Average number of contracts sold | 14 | 3,816 | 1 | 51 | 3 | 7,048 | ||||||||||||||||||
Average value of contracts purchased | $ | 38,318 | $ | 8,110,003 | $ | 7,191 | $ | 162,233 | $ | 31,987 | $ | 172,797,601 | ||||||||||||
Average value of contracts sold | $ | 35,567 | $ | 6,568,038 | $ | 2,491 | $ | 158,976 | $ | 4,729 | $ | 16,169,334 | ||||||||||||
Credit default swaps: | ||||||||||||||||||||||||
Average number of contracts - sell protection | — | 1 | — | — | — | 1 | ||||||||||||||||||
Average notional value - sell protection | $ | — | $ | 1,712,500 | $ | — | $ | — | $ | — | $ | 30,332,500 | ||||||||||||
Interest rate swaps: | ||||||||||||||||||||||||
Average number of contracts - receives fixed rate | 1 | — | — | 1 | — | 2 | ||||||||||||||||||
Average notional - receives fixed rate | $ | 69 | $ | — | $ | — | $ | 157 | $ | — | $ | 498,296 | ||||||||||||
Purchased swaptions: | ||||||||||||||||||||||||
Average number of contracts | — | 1 | — | — | — | — | ||||||||||||||||||
Average notional value | $ | — | $ | 469,500 | $ | — | $ | — | $ | — | $ | — | ||||||||||||
Written swaptions: | ||||||||||||||||||||||||
Average number of contracts | — | 1 | — | — | — | — | ||||||||||||||||||
Average notional value | $ | — | $ | 270,000 | $ | — | $ | — | $ | — | $ | — | ||||||||||||
Foreign currency exchange contracts: | ||||||||||||||||||||||||
Average number of contracts sold | 1 | 3 | — | 2 | 1 | 14 | ||||||||||||||||||
Average value of contracts sold | $ | 40 | $ | 390,474 | $ | — | $ | 19,602 | $ | 5,815 | $ | 33,222,413 | ||||||||||||
| AVERAGE PERIOD BALANCE OF OUTSTANDING DERIVATIVE FINANCIAL INSTRUMENTS1 | ||||||||
| ULTRA SHORT BOND FUND | UNCONSTRAINED BOND FUND | |||||||
Financial futures contracts: | ||||||||
Average number of contracts purchased | 141 | 7,795 | ||||||
Average number of contracts sold | 176 | 3,736 | ||||||
Average value of contracts purchased | $ | 212,966 | $ | 10,462,845 | ||||
Average value of contracts sold | $ | 285,185 | $ | 10,720,658 | ||||
Credit default swaps: | ||||||||
Average number of contracts - sell protection | 1 | 1 | ||||||
Average notional value - sell protection | $ | 195,000 | $ | 5,185,000 | ||||
Interest rate swaps: | ||||||||
Average number of contracts - receives fixed rate | — | 1 | ||||||
Average notional - receives fixed rate | $ | — | $ | 21,164 | ||||
Foreign currency exchange contracts: | ||||||||
Average number of contracts sold | 3 | 7 | ||||||
Average value of contracts sold | $ | 19,367 | $ | 1,659,602 | ||||
1Amounts disclosed represent the volume of derivative contracts for the year ended March 31, 2024.
325 / Annual Report March 2024
Table of Contents
Notes to Financial Statements (Continued)
Counterparty Credit Risk:
A derivative contract may suffer a mark-to-market loss if the value of the contract decreases due to an unfavorable change in the market rates or values of the underlying instrument. Losses can also occur if the counterparty does not perform under the contract.
A Fund’s risk of loss from counterparty credit risk on OTC derivatives is generally limited to the aggregate unrealized gain netted against any collateral held by such Fund. For OTC options purchased, each Fund bears the risk of loss of the amount of the premiums paid plus the positive change in market values net of any collateral held by such Fund should the counterparty fail to perform under the contracts. Options written by the Funds do not typically give rise to counterparty credit risk, as options written generally obligate the Funds to perform, and not the counterparty.
With exchange-traded purchased options and futures and centrally cleared swaps, there is less counterparty credit risk to the Funds since the exchange or clearinghouse, as counterparty to such instruments, guarantees against a possible default. The clearinghouse stands between the buyer and the seller of the contract; therefore, the credit risk is limited to failure of the clearinghouse. While offset rights may exist under applicable law, a Fund does not have a contractual right of offset against a clearing broker or clearinghouse in the event of a default (including the bankruptcy or insolvency) of the clearing broker or clearinghouse. Additionally, credit risk exists in exchange-traded futures and centrally cleared swaps with respect to initial and variation margin that is held in a clearing broker’s customer accounts. While clearing brokers are required to segregate customer margin from their own assets, in the event that a clearing broker becomes insolvent or goes into bankruptcy and at that time there is a shortfall in the aggregate amount of margin held by the clearing broker for all its clients, typically the shortfall would be allocated on a pro rata basis across all the clearing broker’s customers, potentially resulting in losses to the Funds.
In order to better define its contractual rights and to secure rights that will help the Funds mitigate their counterparty risk, a Fund may enter into an International Swaps and Derivatives Association, Inc. Master Agreement (“ISDA Master Agreement”) or similar agreement with its derivative contract counterparties. An ISDA Master Agreement is a bilateral agreement between each Fund and a counterparty that governs OTC derivatives and typically contains, among other things, collateral posting terms and netting provisions in the event of a default and/or termination event. Under an ISDA Master Agreement, each Fund may, under certain circumstances, offset with the counterparty certain derivative financial instruments’ payables and/or receivables with collateral held and/or posted and create one single net payment. The provisions of the ISDA Master Agreement typically permit a single net payment in the event of default including the bankruptcy or insolvency of the counterparty. However, bankruptcy or insolvency laws of a particular jurisdiction may impose restrictions on or prohibitions against the right of offset in bankruptcy, insolvency or other events. In addition, certain ISDA Master Agreements allow counterparties to OTC derivatives to terminate derivative contracts prior to maturity in the event a Fund’s net assets decline by a stated percentage or the Fund fails to meet the terms of its ISDA Master Agreements, which would cause the Fund to accelerate payment of any net liability owed to the counterparty.
Collateral requirements:
For derivatives traded under an ISDA Master Agreement, the collateral requirements are typically calculated by netting the mark-to-market amount for each transaction under such agreement and comparing that amount to the value of any collateral currently pledged by a Fund and the counterparty.
Cash collateral that has been pledged to cover obligations of a Fund, if any, is reported separately on the Statements of Assets and Liabilities as cash pledged as collateral. Non-cash collateral pledged by a Fund, if any, is noted in the Schedules of Portfolio Investments. Generally, the amount of collateral due from or to a party has to exceed a minimum transfer amount threshold typically of $250,000 or $500,000 before a transfer is required, which is determined at the close of business of the Fund, and additional required collateral is delivered to/pledged by the Fund on the next business day. Typically, the Funds and counterparties are not permitted to sell, repledge or use the collateral they receive. To the extent amounts due to a Fund from its counterparties are not fully collateralized, contractually or otherwise, the Fund bears the risk of loss from counterparty non-performance. Each Fund attempts to mitigate counterparty risk by entering into agreements only with counterparties that it believes have the financial resources to honor their obligations and by monitoring the financial stability of those counterparties.
For financial reporting purposes, the Funds do not offset derivative assets and derivative liabilities that are subject to netting arrangements in the Statements of Assets and Liabilities.
The Funds have implemented the disclosure requirements pursuant to FASB Accounting Standards update No. 2011-11, Disclosures about Offsetting Assets and Liabilities that requires disclosures to make financial statements that are prepared under U.S. GAAP more comparable to those prepared under International Financial Reporting Standards. Under this guidance the Funds disclose in the Statements of Assets and Liabilities both gross and net information about instruments and transactions eligible for offset such as instruments and transactions subject to an agreement similar to a master netting arrangement. In addition, the Funds disclose collateral received and posted in connection with master netting agreements or similar arrangements.
Annual Report March 2024 / 326
Table of Contents
Notes to Financial Statements (Continued)
The following table presents Flexible Income Fund’s OTC derivative assets by counterparty net of amounts available for offset under an ISDA Master Agreement or similar agreements and net of the related collateral received or pledged by the Fund as of March 31, 2024:
| FLEXIBLE INCOME FUND | ||||||||||||||||
| COUNTERPARTY | GROSS DERIVATIVE ASSETS IN THE STATEMENT OF ASSETS AND LIABILITIES | COLLATERAL RECEIVED1 | DERIVATIVE ASSETS (LIABILITIES) AVAILABLE FOR OFFSET | NET AMOUNT OF DERIVATIVE ASSETS2 | ||||||||||||
| Bank of America N.A. | ||||||||||||||||
Foreign Currency Exchange Contracts | $ | 1,223 | $ | — | $ | (1,223 | ) | $ | — | |||||||
|
|
|
|
|
|
|
| |||||||||
Citibank N.A. | ||||||||||||||||
Foreign Currency Exchange Contracts | $ | 157,192 | $ | — | $ | (11,149 | ) | $ | 146,043 | |||||||
|
|
|
|
|
|
|
| |||||||||
Goldman Sachs International | ||||||||||||||||
Foreign Currency Exchange Contracts | $ | 55 | $ | — | $ | — | $ | 55 | ||||||||
|
|
|
|
|
|
|
| |||||||||
Total | $ | 158,470 | $ | — | $ | (12,372) | $ | 146,098 | ||||||||
|
|
|
|
|
|
|
| |||||||||
1Excess of collateral received for individual counterparty may not be shown for financial reporting purposes.
2Represents the net amount receivable from the counterparty in the event of default.
The following table presents Flexible Income Fund’s OTC derivative liabilities by counterparty net of amounts available for offset under an ISDA Master Agreement or similar agreements and net of the related collateral received or pledged by the Fund as of March 31, 2024:
| FLEXIBLE INCOME FUND | ||||||||||||||||
| COUNTERPARTY | GROSS DERIVATIVE LIABILITIES IN THE STATEMENT OF ASSETS AND LIABILITIES | COLLATERAL PLEDGED1 | DERIVATIVE (ASSETS) LIABILITIES AVAILABLE FOR OFFSET | NET AMOUNT OF DERIVATIVE LIABILITIES2 | ||||||||||||
Bank of America N.A. | ||||||||||||||||
Foreign Currency Exchange Contracts | $ | 3,941 | $ | — | $ | (1,223) | $ | 2,718 | ||||||||
Citibank N.A. | ||||||||||||||||
Foreign Currency Exchange Contracts | $ | 11,149 | $ | — | $ | (11,149) | $ | — | ||||||||
The Bank of New York Mellon | ||||||||||||||||
Foreign Currency Exchange Contracts | $ | 1,007 | $ | — | $ | — | $ | 1,007 | ||||||||
|
|
|
|
|
|
|
| |||||||||
Total | $ | 16,097 | $ | — | $ | (12,372) | $ | 3,725 | ||||||||
|
|
|
|
|
|
|
| |||||||||
1Excess of collateral pledged for individual counterparty may not be shown for financial reporting purposes. 2Represents the net amount payable to the counterparty in the event of default.
The following table presents Floating Rate Income Fund’s OTC derivative assets by counterparty net of amounts available for offset under an ISDA Master Agreement or similar agreements and net of the related collateral received or pledged by the Fund as of March 31, 2024:
| FLOATING RATE INCOME FUND | ||||||||||||||||||||
| COUNTERPARTY | GROSS DERIVATIVE ASSETS IN THE STATEMENT OF ASSETS AND LIABILITIES | COLLATERAL RECEIVED1 | DERIVATIVE ASSETS (LIABILITIES) AVAILABLE FOR OFFSET | NET AMOUNT OF DERIVATIVE ASSETS2 | ||||||||||||||||
Bank of America N.A. | ||||||||||||||||||||
Foreign Currency Exchange Contracts | $ | 7,514 | $ | — | $ | — | $ | 7,514 | ||||||||||||
|
|
|
|
|
|
|
| |||||||||||||
The Bank of New York Mellon | ||||||||||||||||||||
Foreign Currency Exchange Contracts | $ | 7,603 | $ | — | $ | — | $ | 7,603 | ||||||||||||
|
|
|
|
|
|
|
| |||||||||||||
Total | $ | 15,117 | $ | — | $ | — | $ | 15,117 | ||||||||||||
|
|
|
|
|
|
|
| |||||||||||||
1Excess of collateral received for individual counterparty may not be shown for financial reporting purposes.
2Represents the net amount receivable from the counterparty in the event of default.
327 / Annual Report March 2024
Table of Contents
Notes to Financial Statements (Continued)
The following table presents High Yield Fund’s OTC derivative assets by counterparty net of amounts available for offset under an ISDA Master Agreement or similar agreements and net of the related collateral received or pledged by the Fund as of March 31, 2024:
| HIGH YIELD BOND FUND | ||||||||||||||||
| COUNTERPARTY | GROSS DERIVATIVE ASSETS IN THE STATEMENT OF ASSETS AND LIABILITIES | COLLATERAL RECEIVED1 | DERIVATIVE ASSETS (LIABILITIES) AVAILABLE FOR OFFSET | NET AMOUNT OF DERIVATIVE ASSETS2 | ||||||||||||
Bank of America N.A. | ||||||||||||||||
Foreign Currency Exchange Contracts | $ | 5,000 | $ | — | $ | (2,334) | $ | 2,666 | ||||||||
|
|
|
|
|
|
|
| |||||||||
Citibank N.A. | ||||||||||||||||
Foreign Currency Exchange Contracts | $ | 209,423 | $ | (208,643 | ) | $ | (780) | $ | — | |||||||
|
|
|
|
|
|
|
| |||||||||
The Bank of New York Mellon | ||||||||||||||||
Foreign Currency Exchange Contracts | $ | 5,945 | $ | — | $ | — | $ | 5,945 | ||||||||
|
|
|
|
|
|
|
| |||||||||
Total | $ | 220,368 | $ | (208,643 | ) | $ | (3,114) | $ | 8,611 | |||||||
|
|
|
|
|
|
|
| |||||||||
1Excess of collateral received for individual counterparty may not be shown for financial reporting purposes.
2Represents the net amount receivable from the counterparty in the event of default.
The following table presents High Yield Fund’s OTC derivative liabilities by counterparty net of amounts available for offset under an ISDA Master Agreement or similar agreements and net of the related collateral received or pledged by the Fund as of March 31, 2024:
| HIGH YIELD BOND FUND | ||||||||||||||||
| COUNTERPARTY | GROSS DERIVATIVE LIABILITIES IN THE STATEMENT OF ASSETS AND LIABILITIES | COLLATERAL PLEDGED1 | DERIVATIVE (ASSETS) LIABILITIES AVAILABLE FOR OFFSET | NET AMOUNT OF DERIVATIVE LIABILITIES2 | ||||||||||||
Bank of America N.A. | ||||||||||||||||
Foreign Currency Exchange Contracts | $ | 2,334 | $ | — | $ | (2,334) | $ | — | ||||||||
|
|
|
|
|
|
|
| |||||||||
Citibank N.A. | ||||||||||||||||
Foreign Currency Exchange Contracts | $ | 780 | $ | — | $ | (780) | $ | — | ||||||||
|
|
|
|
|
|
|
| |||||||||
Total | $ | 3,114 | $ | — | $ | (3,114) | $ | — | ||||||||
|
|
|
|
|
|
|
| |||||||||
1Excess of collateral pledged for individual counterparty may not be shown for financial reporting purposes.
2Represents the net amount payable to the counterparty in the event of default.
The following table presents Intermediate Bond Fund’s OTC derivative assets by counterparty net of amounts available for offset under an ISDA Master Agreement or similar agreements and net of the related collateral received or pledged by the Fund as of March 31, 2024:
| INTERMEDIATE BOND FUND | ||||||||||||||||
| COUNTERPARTY | GROSS DERIVATIVE ASSETS IN THE STATEMENT OF ASSETS AND LIABILITIES | COLLATERAL RECEIVED1 | DERIVATIVE ASSETS (LIABILITIES) AVAILABLE FOR OFFSET | NET AMOUNT OF | ||||||||||||
Citibank N.A. | ||||||||||||||||
Foreign Currency Exchange Contracts | $ | 438,855 | $ | (289,386 | ) | $ | (14,458 | ) | $ | 135,011 | ||||||
|
|
|
|
|
|
|
| |||||||||
The Bank of New York Mellon | ||||||||||||||||
Foreign Currency Exchange Contracts | $ | 2,562 | $ | — | $ | (1,141 | ) | $ | 1,421 | |||||||
|
|
|
|
|
|
|
| |||||||||
Total | $ | 441,417 | $ | (289,386 | ) | $ | (15,599 | ) | $ | 136,432 | ||||||
|
|
|
|
|
|
|
| |||||||||
1Excess of collateral received for individual counterparty may not be shown for financial reporting purposes.
2Represents the net amount receivable from the counterparty in the event of default.
Annual Report March 2024 / 328
Table of Contents
Notes to Financial Statements (Continued)
The following table presents Intermediate Bond Fund’s OTC derivative liabilities by counterparty net of amounts available for offset under an ISDA Master Agreement or similar agreements and net of the related collateral received or pledged by the Fund as of March 31, 2024:
| INTERMEDIATE BOND FUND | ||||||||||||||||
| COUNTERPARTY | GROSS DERIVATIVE LIABILITIES IN THE STATEMENT OF ASSETS AND LIABILITIES | COLLATERAL | DERIVATIVE (ASSETS) LIABILITIES AVAILABLE FOR OFFSET | NET AMOUNT OF | ||||||||||||
| Bank of America N.A. | ||||||||||||||||
Foreign Currency Exchange Contracts | $ | 10,813 | $ | — | $ | — | $ | 10,813 | ||||||||
|
|
|
|
|
|
|
| |||||||||
| Citibank N.A. | ||||||||||||||||
Foreign Currency Exchange Contracts | $ | 14,458 | $ | — | $ | (14,458) | $ | — | ||||||||
|
|
|
|
|
|
|
| |||||||||
| Goldman Sachs International | ||||||||||||||||
Foreign Currency Exchange Contracts | $ | 183 | $ | — | $ | — | $ | 183 | ||||||||
|
|
|
|
|
|
|
| |||||||||
| The Bank of New York Mellon | ||||||||||||||||
Foreign Currency Exchange Contracts | $ | 1,141 | $ | — | $ | (1,141) | $ | — | ||||||||
|
|
|
|
|
|
|
| |||||||||
Total | $ | 26,595 | $ | — | $ | (15,599 | ) | $ | 10,996 | |||||||
|
|
|
|
|
|
|
| |||||||||
1Excess of collateral pledged for individual counterparty may not be shown for financial reporting purposes.
2Represents the net amount payable to the counterparty in the event of default.
The following table presents Investment Grade Credit Fund’s OTC derivative assets by counterparty net of amounts available for offset under an ISDA Master Agreement or similar agreements and net of the related collateral received or pledged by the Fund as of March 31, 2024:
| INVESTMENT GRADE CREDIT FUND | ||||||||||||||||
| COUNTERPARTY | GROSS DERIVATIVE ASSETS IN THE STATEMENT OF ASSETS AND LIABILITIES | COLLATERAL | DERIVATIVE ASSETS (LIABILITIES) AVAILABLE FOR OFFSET | NET AMOUNT OF | ||||||||||||
| Bank of America N.A. | ||||||||||||||||
Foreign Currency Exchange Contracts | $ | 158 | $ | — | $ | — | $ | 158 | ||||||||
|
|
|
|
|
|
|
| |||||||||
Total | $ | 158 | $ | — | $ | — | $ | 158 | ||||||||
|
|
|
|
|
|
|
| |||||||||
1Excess of collateral received for individual counterparty may not be shown for financial reporting purposes.
2Represents the net amount receivable from the counterparty in the event of default.
The following table presents Low Duration Bond Fund’s OTC derivative assets by counterparty net of amounts available for offset under an ISDA Master Agreement or similar agreements and net of the related collateral received or pledged by the Fund as of March 31, 2024:
| LOW DURATION BOND FUND | ||||||||||||||||
| COUNTERPARTY | GROSS DERIVATIVE ASSETS IN THE STATEMENT OF ASSETS AND LIABILITIES | COLLATERAL | DERIVATIVE ASSETS (LIABILITIES) AVAILABLE FOR OFFSET | NET AMOUNT OF DERIVATIVE ASSETS2 | ||||||||||||
| Citibank N.A. | ||||||||||||||||
Foreign Currency Exchange Contracts | $ | 311,215 | $ | (141,385 | ) | $ | — | $ | 169,830 | |||||||
|
|
|
|
|
|
|
| |||||||||
| The Bank of New York Mellon | ||||||||||||||||
Foreign Currency Exchange Contracts | $ | 3,466 | $ | — | $ | — | $ | 3,466 | ||||||||
|
|
|
|
|
|
|
| |||||||||
Total | $ | 314,681 | $ | (141,385 | ) | $ | — | $ | 173,296 | |||||||
|
|
|
|
|
|
|
| |||||||||
1Excess of collateral received for individual counterparty may not be shown for financial reporting purposes.
2Represents the net amount receivable from the counterparty in the event of default.
329 / Annual Report March 2024
Table of Contents
Notes to Financial Statements (Continued)
The following table presents Low Duration Bond Fund’s OTC derivative liabilities by counterparty net of amounts available for offset under an ISDA Master Agreement or similar agreements and net of the related collateral received or pledged by the Fund as of March 31, 2024:
| LOW DURATION BOND FUND | ||||||||||||||||||||
| COUNTERPARTY | GROSS DERIVATIVE LIABILITIES IN THE STATEMENT OF ASSETS AND LIABILITIES | COLLATERAL PLEDGED1 | DERIVATIVE (ASSETS) LIABILITIES AVAILABLE FOR OFFSET | NET AMOUNT OF DERIVATIVE LIABILITIES2 | ||||||||||||||||
| Bank of America N.A. | ||||||||||||||||||||
Foreign Currency Exchange Contracts | $ | 24,869 | $ | — | $ | — | $ | 24,869 | ||||||||||||
|
|
|
|
|
|
|
| |||||||||||||
Total | $ | 24,869 | $ | — | $ | — | $ | 24,869 | ||||||||||||
|
|
|
|
|
|
|
| |||||||||||||
1Excess of collateral pledged for individual counterparty may not be shown for financial reporting purposes.
2Represents the net amount payable to the counterparty in the event of default.
The following table presents Strategic Income Fund’s OTC derivative assets by counterparty net of amounts available for offset under an ISDA Master Agreement or similar agreements and net of the related collateral received or pledged by the Fund as of March 31, 2024:
| STRATEGIC INCOME FUND | ||||||||||||||||||||
| COUNTERPARTY | GROSS DERIVATIVE ASSETS IN THE STATEMENT OF ASSETS AND LIABILITIES | COLLATERAL RECEIVED1 | DERIVATIVE ASSETS (LIABILITIES) AVAILABLE FOR OFFSET | NET AMOUNT OF DERIVATIVE ASSETS2 | ||||||||||||||||
| Bank of America N.A. | ||||||||||||||||||||
Foreign Currency Exchange Contracts | $ | 1,284 | $ | — | $ | (569 | ) | $ | 715 | |||||||||||
|
|
|
|
|
|
|
| |||||||||||||
| Citibank N.A. | ||||||||||||||||||||
Foreign Currency Exchange Contracts | $ | 18,033 | $ | — | $ | (338 | ) | $ | 17,695 | |||||||||||
|
|
|
|
|
|
|
| |||||||||||||
Total | $ | 19,317 | $ | — | $ | (907 | ) | $ | 18,410 | |||||||||||
|
|
|
|
|
|
|
| |||||||||||||
1Excess of collateral received for individual counterparty may not be shown for financial reporting purposes.
2Represents the net amount receivable from the counterparty in the event of default.
The following table presents Strategic Income Fund’s OTC derivative liabilities by counterparty net of amounts available for offset under an ISDA Master Agreement or similar agreements and net of the related collateral received or pledged by the Fund as of March 31, 2024:
| STRATEGIC INCOME FUND | ||||||||||||||||||||
| COUNTERPARTY | GROSS DERIVATIVE LIABILITIES IN THE STATEMENT OF ASSETS AND LIABILITIES | COLLATERAL PLEDGED1 | DERIVATIVE (ASSETS) LIABILITIES AVAILABLE FOR OFFSET | NET AMOUNT OF | ||||||||||||||||
| Bank of America N.A. | ||||||||||||||||||||
Foreign Currency Exchange Contracts | $ | 569 | $ | — | $ | (569 | ) | $ | — | |||||||||||
|
|
|
|
|
|
|
| |||||||||||||
| Citibank N.A. | ||||||||||||||||||||
Foreign Currency Exchange Contracts | $ | 338 | $ | — | $ | (338 | ) | $ | — | |||||||||||
|
|
|
|
|
|
|
| |||||||||||||
Total | $ | 907 | $ | — | $ | (907 | ) | $ | — | |||||||||||
|
|
|
|
|
|
|
| |||||||||||||
1Excess of collateral received for individual counterparty may not be shown for financial reporting purposes.
2Represents the net amount receivable from the counterparty in the event of default.
Annual Report March 2024 / 330
Table of Contents
Notes to Financial Statements (Continued)
The following table presents Total Return Bond Fund’s OTC derivative assets by counterparty net of amounts available for offset under an ISDA Master Agreement or similar agreements and net of the related collateral received or pledged by the Fund as of March 31, 2024:
| TOTAL RETURN BOND FUND | ||||||||||||||||||||
| COUNTERPARTY | GROSS DERIVATIVE LIABILITIES IN THE STATEMENT OF ASSETS AND LIABILITIES | COLLATERAL | DERIVATIVE ASSETS (LIABILITIES) AVAILABLE FOR OFFSET | NET AMOUNT OF DERIVATIVE ASSETS2 | ||||||||||||||||
| Bank of America N.A. | ||||||||||||||||||||
Foreign Currency Exchange Contracts | $ | 21,980,352 | $ | (18,633,910) | $ | (456,698) | $ | 2,889,744 | ||||||||||||
|
|
|
|
|
|
|
| |||||||||||||
| Citibank N.A. | ||||||||||||||||||||
Foreign Currency Exchange Contracts | $ | 6,131,706 | $ | (4,851,241) | $ | (1,003,467) | $ | 276,998 | ||||||||||||
|
|
|
|
|
|
|
| |||||||||||||
| Goldman Sachs International | ||||||||||||||||||||
Foreign Currency Exchange Contracts | $ | 14,000 | $ | — | $ | (14,000) | $ | — | ||||||||||||
|
|
|
|
|
|
|
| |||||||||||||
| State Street Global Markets LLC | ||||||||||||||||||||
Foreign Currency Exchange Contracts | $ | 19,886 | $ | — | $ | (19,886) | $ | — | ||||||||||||
|
|
|
|
|
|
|
| |||||||||||||
| The Bank of New York Mellon | ||||||||||||||||||||
Foreign Currency Exchange Contracts | $ | 377,418 | $ | — | $ | (158,484) | $ | 218,934 | ||||||||||||
|
|
|
|
|
|
|
| |||||||||||||
Total | $ | 28,523,362 | $ | (23,485,151) | $ | (1,652,535) | $ | 3,385,676 | ||||||||||||
|
|
|
|
|
|
|
| |||||||||||||
1Excess of collateral received for individual counterparty may not be shown for financial reporting purposes.
2Represents the net amount receivable from the counterparty in the event of default.
The following table presents Total Return Bond Fund’s OTC derivative liabilities by counterparty net of amounts available for offset under an ISDA Master Agreement or similar agreements and net of the related collateral received or pledged by the Fund as of March 31, 2024:
| TOTAL RETURN BOND FUND | ||||||||||||||||||||
| COUNTERPARTY | GROSS DERIVATIVE LIABILITIES IN THE STATEMENT OF ASSETS AND LIABILITIES | COLLATERAL | DERIVATIVE (ASSETS) LIABILITIES AVAILABLE FOR OFFSET | NET AMOUNT OF DERIVATIVE LIABILITIES2 | ||||||||||||||||
| Bank of America N.A. | ||||||||||||||||||||
Foreign Currency Exchange Contracts | $ | 456,698 | $ | — | $ | (456,698) | $ | — | ||||||||||||
|
|
|
|
|
|
|
| |||||||||||||
| Barclays Bank PLC | ||||||||||||||||||||
Reverse Repurchase Agreements | $ | 1,501,250,000 | $ | (1,501,250,000) | $ | — | $ | — | ||||||||||||
|
|
|
|
|
|
|
| |||||||||||||
| Citibank N.A. | ||||||||||||||||||||
Foreign Currency Exchange Contracts | $ | 1,003,467 | $ | — | $ | (1,003,467) | $ | — | ||||||||||||
|
|
|
|
|
|
|
| |||||||||||||
| Goldman Sachs International | ||||||||||||||||||||
Foreign Currency Exchange Contracts | $ | 145,650 | $ | — | $ | (14,000) | $ | 131,650 | ||||||||||||
|
|
|
|
|
|
|
| |||||||||||||
| State Street Global Markets LLC | ||||||||||||||||||||
Foreign Currency Exchange Contracts | $ | 4,100,079 | $ | — | $ | (19,886) | $ | 4,080,193 | ||||||||||||
|
|
|
|
|
|
|
| |||||||||||||
| The Bank of New York Mellon | ||||||||||||||||||||
Foreign Currency Exchange Contracts | $ | 158,484 | $ | — | $ | (158,484) | $ | — | ||||||||||||
|
|
|
|
|
|
|
| |||||||||||||
Total | $ | 1,507,114,378 | $ | (1,501,250,000) | $ | (1,652,535) | $ | 4,211,843 | ||||||||||||
|
|
|
|
|
|
|
| |||||||||||||
1Excess of collateral pledged for individual counterparty may not be shown for financial reporting purposes.
2Represents the net amount payable to the counterparty in the event of default.
331 / Annual Report March 2024
Table of Contents
Notes to Financial Statements (Continued)
The following table presents Ultra Short Bond Fund’s OTC derivative assets by counterparty net of amounts available for offset under an ISDA Master Agreement or similar agreements and net of the related collateral received or pledged by the Fund as of March 31, 2024:
| ULTRA SHORT BOND FUND | ||||||||||||||||||||||||
| COUNTERPARTY | GROSS DERIVATIVE ASSETS IN THE | COLLATERAL RECEIVED1 | DERIVATIVE ASSETS (LIABILITIES) AVAILABLE FOR OFFSET | NET AMOUNT OF | ||||||||||||||||||||
Bank of America N.A. | ||||||||||||||||||||||||
Foreign Currency Exchange Contracts | $ | 435 | $ | — | $ | (435 | ) | $ | — | |||||||||||||||
|
|
|
|
|
|
|
| |||||||||||||||||
Citibank N.A. | ||||||||||||||||||||||||
Foreign Currency Exchange Contracts | $ | 13,552 | $ | — | $ | — | $ | 13,552 | ||||||||||||||||
|
|
|
|
|
|
|
| |||||||||||||||||
Total | $ | 13,987 | $ | — | $ | (435 | ) | $ | 13,552 | |||||||||||||||
|
|
|
|
|
|
|
| |||||||||||||||||
1Excess of collateral received for individual counterparty may not be shown for financial reporting purposes.
2Represents the net amount receivable from the counterparty in the event of default.
The following table presents Ultra Short Fund’s OTC derivative liabilities by counterparty net of amounts available for offset under an ISDA Master Agreement or similar agreements and net of the related collateral received or pledged by the Fund as of March 31, 2024:
| ULTRA SHORT BOND FUND | ||||||||||||||||||||||||||||
| COUNTERPARTY | GROSS DERIVATIVE LIABILITIES IN THE | COLLATERAL PLEDGED1 | DERIVATIVE (ASSETS) LIABILITIES AVAILABLE FOR OFFSET | NET AMOUNT OF | ||||||||||||||||||||||||
Bank of America N.A. | ||||||||||||||||||||||||||||
Foreign Currency Exchange Contracts | $ | 743 | $ | — | $ | (435 | ) | $ | 308 | |||||||||||||||||||
|
|
|
|
|
|
|
| |||||||||||||||||||||
Total | $ | 743 | $ | — | $ | (435 | ) | $ | 308 | |||||||||||||||||||
|
|
|
|
|
|
|
| |||||||||||||||||||||
1Excess of collateral pledged for individual counterparty may not be shown for financial reporting purposes.
2Represents the net amount payable to the counterparty in the event of default.
The following table presents Unconstrained Bond Fund’s OTC derivative assets by counterparty net of amounts available for offset under an ISDA Master Agreement or similar agreements and net of the related collateral received or pledged by the Fund as of March 31, 2024:
| UNCONSTRAINED BOND FUND | ||||||||||||||||||||||||||||
| COUNTERPARTY | GROSS DERIVATIVE ASSETS IN THE | COLLATERAL RECEIVED1 | DERIVATIVE ASSETS (LIABILITIES) AVAILABLE FOR OFFSET | NET AMOUNT OF | ||||||||||||||||||||||||
Bank of America N.A. | ||||||||||||||||||||||||||||
Foreign Currency Exchange Contracts | $ | 25,195 | $ | — | $ | (25,195 | ) | $ | — | |||||||||||||||||||
|
|
|
|
|
|
|
| |||||||||||||||||||||
Citibank N.A. | ||||||||||||||||||||||||||||
Foreign Currency Exchange Contracts | $ | 1,379,684 | $ | (1,215,464 | ) | $ | (58,806 | ) | $ | 105,414 | ||||||||||||||||||
|
|
|
|
|
|
|
| |||||||||||||||||||||
Goldman Sachs International | ||||||||||||||||||||||||||||
Foreign Currency Exchange Contracts | $ | 596 | $ | — | $ | (596 | ) | $ | — | |||||||||||||||||||
|
|
|
|
|
|
|
| |||||||||||||||||||||
The Bank of New York Mellon | ||||||||||||||||||||||||||||
Foreign Currency Exchange Contracts | $ | 2,621 | $ | — | $ | (1,074 | ) | $ | 1,547 | |||||||||||||||||||
|
|
|
|
|
|
|
| |||||||||||||||||||||
Total | $ | 1,408,096 | $ | (1,215,464 | ) | $ | (85,671 | ) | $ | 106,961 | ||||||||||||||||||
|
|
|
|
|
|
|
| |||||||||||||||||||||
1Excess of collateral received for individual counterparty may not be shown for financial reporting purposes.
2Represents the net amount receivable from the counterparty in the event of default.
Annual Report March 2024 / 332
Table of Contents
Notes to Financial Statements (Continued)
The following table presents Unconstrained Bond Fund’s OTC derivative liabilities by counterparty net of amounts available for offset under an ISDA Master Agreement or similar agreements and net of the related collateral received or pledged by the Fund as of March 31, 2024:
| UNCONSTRAINED BOND FUND | ||||||||||||||||||||||||||||
| COUNTERPARTY | GROSS DERIVATIVE LIABILITIES IN THE | COLLATERAL PLEDGED1 | DERIVATIVE (ASSETS) LIABILITIES AVAILABLE FOR OFFSET | NET AMOUNT OF DERIVATIVE LIABILITIES2 | ||||||||||||||||||||||||
Bank of America N.A. | ||||||||||||||||||||||||||||
Foreign Currency Exchange Contracts | $ | 32,376 | $ | — | $ | (25,195 | ) | $ | 7,181 | |||||||||||||||||||
|
|
|
|
|
|
|
| |||||||||||||||||||||
Citibank N.A. | ||||||||||||||||||||||||||||
Foreign Currency Exchange Contracts | $ | 58,806 | $ | — | $ | (58,806 | ) | $ | — | |||||||||||||||||||
|
|
|
|
|
|
|
| |||||||||||||||||||||
Goldman Sachs International | ||||||||||||||||||||||||||||
Foreign Currency Exchange Contracts | $ | 1,374 | $ | — | $ | (596 | ) | $ | 778 | |||||||||||||||||||
|
|
|
|
|
|
|
| |||||||||||||||||||||
The Bank of New York Mellon | ||||||||||||||||||||||||||||
Foreign Currency Exchange Contracts | $ | 1,074 | $ | — | $ | (1,074 | ) | $ | — | |||||||||||||||||||
|
|
|
|
|
|
|
| |||||||||||||||||||||
Total | $ | 93,630 | $ | — | $ | (85,671 | ) | $ | 7,959 | |||||||||||||||||||
|
|
|
|
|
|
|
| |||||||||||||||||||||
1Excess of collateral pledged for individual counterparty may not be shown for financial reporting purposes.
2Represents the net amount payable to the counterparty in the event of default.
| 3. | PORTFOLIO INVESTMENTS |
The Funds may invest in mortgage pass-through securities which represent interests in pools of mortgages in which payments of both principal and interest on the securities are generally made monthly, in effect “passing through” monthly payments made by borrowers on the residential or commercial mortgage loans which underlie the securities (net of any fees paid to the issuer or guarantor of the securities). Mortgage pass-through securities differ from other forms of debt securities, which normally provide for periodic payment of interest in fixed amounts with principal payments at maturity or specified call dates.
The Funds may invest in securities issued by the Federal National Mortgage Association (“FNMA”) and the Federal Home Loan Mortgage Corp. (“FHLMC”). These are fixed-income securities that derive their value from or represent interests in a pool of mortgages or mortgage securities. An unexpectedly high rate of defaults on the mortgages held by a mortgage pool may adversely affect the value of a mortgage-backed security and could result in losses to the Funds. The risk of such defaults is generally higher in the case of mortgage pools that include sub-prime mortgages. Sub-prime mortgages refer to loans made to borrowers with weakened credit histories or with a lower capacity to make timely payments on their mortgages.
Additionally, securities issued by FNMA and FHLMC are not backed by or entitled to the full faith and credit of the United States and are supported by the right to the issuer to borrow from the Treasury.
On September 7, 2008, the Federal Housing Finance Agency was appointed as conservator of FNMA and FHLMC. In addition, the U.S. Department of the Treasury has agreed to provide capital as needed to ensure FNMA and FHLMC continue to provide liquidity to the housing and mortgage markets.
The Funds may also invest in Collateralized Mortgage Obligations (“CMOs”). CMOs are debt obligations collateralized by residential or commercial mortgage loans or residential or commercial mortgage pass-through securities. Interest and principal are generally paid monthly. CMOs may be collateralized by whole mortgage loans or private mortgage pass-through securities but are more typically collateralized by portfolios of mortgage pass-through securities guaranteed by the Government National Mortgage Association (“GNMA”), FHLMC, or FNMA. The issuer of a series of CMOs may elect to be treated for tax purposes as a Real Estate Mortgage Investment Conduit. CMOs are structured into multiple classes, each bearing a different stated maturity. Monthly payment of principal received from the pool of underlying mortgages, including prepayments, is first returned to investors holding the shortest maturity class. Investors holding the longer maturity classes usually receive principal only after shorter classes have been retired. An investor may be partially protected against a sooner than desired return of principal because of the sequential payments.
333 / Annual Report March 2024
Table of Contents
Notes to Financial Statements (Continued)
The Funds may enter into to be announced (“TBA”) commitments to purchase or sell securities for a fixed price at a future date. TBA commitments are considered securities in themselves, and involve a risk of loss if the value of the security to be purchased or sold declines or increases prior to settlement date, which is in addition to the risk of decline in the value of the Funds’ other assets. Unsettled TBA commitments are valued at the current market value of the underlying securities, according to the procedures described in Note 2 under “Security Valuation”.
The Funds may invest in Collateralized Bond Obligations (“CBOs”), Collateralized Loan Obligations (“CLOs”) and other Collateralized Debt Obligations (“CDOs”), which are debt instruments backed solely by a pool of other debt securities. The risks of an investment in a CBO, CLO or other CDO depend largely on the type of the collateral securities and the class of the CBO, CLO or other CDO in which a Fund invests. Some CBOs, CLOs and other CDOs have credit ratings, but are typically issued in various classes with various priorities. Normally, CBOs, CLOs and other CDOs are privately offered and sold (that is, not registered under the securities laws) and may be characterized by the Funds as illiquid securities, but an active dealer market may exist for CBOs, CLOs and other CDOs that qualify for Rule 144A transactions. In addition to the normal interest rate, default and other risks of fixed income securities, CBOs, CLOs and other CDOs carry additional risks, including the possibility that distributions from collateral securities will not be adequate to make interest or other payments, the quality of the collateral may decline in value or default, the Funds may invest in CBOs, CLOs and other CDOs that are subordinate to other classes, there may be volatility in value, and the complex structure of the security may not be fully understood at the time of investment and produce disputes with the issuer or unexpected investment results.
The Funds may invest in stripped mortgage-backed securities issued by the U.S. government, its agencies and instrumentalities. Stripped mortgage-backed securities are usually structured with two classes that receive different proportions of the interest and principal distributions on a pool of mortgage assets. In certain cases, one class will receive all of the interest (the interest-only or “IO” class), while the other class will receive all of the principal (the principal-only or “PO” class). During the year ended March 31, 2024, certain interest-only securities were held as part of the overall mortgage portfolio holdings. The yield to maturity on IOs is sensitive to the rate of principal repayments (including prepayments) on the related underlying mortgage assets, and principal payments may have a material effect on yield to maturity. If the underlying mortgage assets experience greater than anticipated prepayments of principal, a Fund may not fully recoup its initial investment in IOs. Such securities will be considered liquid only if so determined in accordance with guidelines approved by the Board. The Funds also may invest in stripped mortgage-backed securities that are privately issued. These securities will be considered illiquid for purposes of each Fund’s limit on illiquid securities.
The Funds may purchase participations in commercial loans, or may purchase assignments of such loans. Such indebtedness may be secured or unsecured. Loan participations typically represent direct participation in a loan to a corporate borrower, and generally are offered by banks or other financial institutions or lending syndicates. The Funds may participate in such syndications, or can buy part of a loan, becoming a part lender. When purchasing loan participations, a Fund assumes the credit risk associated with the corporate borrower and may assume the credit risk associated with an interposed bank or other financial intermediary. The participation interests in which a Fund intends to invest may not be rated by any nationally recognized rating service. Participations and assignments also involve special types of risk, including interest rate risk, liquidity risk, and the risk of being a lender. If a Fund purchases a participation, it may only be able to enforce its rights through the lender, and may assume the credit risk of the lender in addition to the borrower.
The Funds may also sell a debt or equity security short, that is, without owning it, and borrow the same security from a broker or other institution to complete the sale. The Adviser may use short sales when it believes a security is overvalued or as a partial hedge against a position in a related security of the same issuer held by a Fund. The Corporate Bond Fund, Flexible Income Fund, High Yield Bond Fund, Investment Grade Credit Fund, Opportunistic High Income Credit Fund, Strategic Income Fund and Sustainable Securitized Fund may not make short sales of securities or maintain a short position if more than 33 1/3% of the Fund’s total assets (taken at current value) are held as collateral for such sales at any one time. The AlphaTrak 500 Fund, Intermediate Bond Fund, Low Duration Bond Fund, Total Return Bond Fund, Ultra Short Bond Fund and Unconstrained Bond Fund will not make total short sales exceeding 25% of the Fund’s total assets. The Floating Rate Income Fund will not make total short sales exceeding 15% of the Fund’s total assets. If the value of the security sold short increases, a Fund would lose money because it would need to replace the borrowed security by purchasing it at a higher price. The potential loss is unlimited. (If the short sale was intended as a hedge against another investment, the loss on the short sale may be fully or partially offset by gains in that other investment.) At March 31, 2024, the Funds did not hold any short debt or equity.
A lender may request that the borrowed securities be returned on short notice; if that occurs at a time when other short sellers of the subject security are receiving similar requests, a “short squeeze” can occur. This means that the Funds might be compelled, at the most disadvantageous time, to replace borrowed securities previously sold short, with purchases on the open market at prices significantly greater than those at which the securities were sold short. Short selling also may produce higher than normal portfolio turnover and result in increased transaction costs to the Funds. The Funds also may make short sales “against-the-box”, in which
Annual Report March 2024 / 334
Table of Contents
Notes to Financial Statements (Continued)
the Funds sell short securities they own. The Funds will incur transaction costs, including interest expenses, in connection with opening, maintaining and closing short sales against-the-box, which result in a “constructive sale”, requiring the Fund to recognize any taxable gain from the transaction.
The Funds may invest in payment-in-kind securities (“PIKs”). PIKs give the issuer the option at each interest payment date of making interest payments in either cash or additional debt securities. Those additional debt securities usually have the same terms, including maturity dates and interest rates, and associated risks as the original bonds. The daily market quotations of the original bonds may include the accrued interest (referred to as a dirty price) and require a pro-rata adjustment from the unrealized appreciation or depreciation on investments to interest receivable on the Statements of Assets and Liabilities.
For the year ended March 31, 2024, the Flexible Income Fund, the Floating Rate Income Fund, the High Yield Bond Fund, and the Unconstrained Bond Fund received in-kind payments with respect to PIK securities of $7,197, $102,993, $23,340, and $111,324, respectively.
The Funds may invest in repurchase agreements. In a repurchase agreement, the Funds purchase a security from a counterparty who agrees to repurchase the same security at a mutually agreed upon date and price. On a daily basis, the counterparty is required to maintain collateral subject to the agreement and in value no less than the agreed repurchase amount. The agreements are conditioned upon the collateral being deposited under the Federal Reserve book entry system or held in a segregated account by the Funds’ custodian or designated sub-custodians under tri-party repurchase agreements. In the event the counterparty defaults and the fair value of the collateral declines, the Funds could experience losses, delays and costs in liquidating the collateral.
Master Repurchase Agreements (“MRAs”) permit each Fund, under certain circumstances including an event of default (such as bankruptcy or insolvency), to offset payables and/or receivables under the MRA with collateral held and/or posted to the counterparty and create one single net payment due to or from each Fund. However, bankruptcy or insolvency laws of a particular jurisdiction may impose restrictions on or prohibitions against such a right of offset in the event of an MRA counterparty’s bankruptcy or insolvency. Pursuant to the terms of the MRA, each Fund receives securities as collateral with a market value in excess of the repurchase price to be received by each Fund upon the maturity of the repurchase transaction. Upon a bankruptcy or insolvency of the MRA counterparty, each Fund recognizes a liability with respect to such excess collateral to reflect each Fund’s obligation under bankruptcy law to return the excess to the counterparty. As of March 31, 2024, the Total Return Bond Fund held repurchase agreements which made up 0.96% of net assets.
The Funds may enter into reverse repurchase agreements, whereby a Fund sells securities concurrently with entering into an agreement to repurchase those securities at a later date at a fixed price. During the reverse repurchase agreement period, the Fund continues to receive principal and interest payments on those securities. Reverse repurchase agreements are speculative techniques involving leverage and are considered secured borrowings by the Fund for purposes of the percentage limitations applicable to borrowings in accordance with ASC 860, Transfers and Servicing. Securities sold under reverse repurchase agreements are recorded as a liability. Interest payments made are recorded as a component of interest expense. In periods of increased demand for the security, a Fund may receive a fee for use of the security by the counterparty, which may result in interest income to the Fund. A reverse repurchase agreement involves the risk that the market value of the security sold by a Fund may decline below the repurchase price of the security. A Fund will segregate assets determined to be liquid by the manager or otherwise cover its obligations under reverse repurchase agreements. The average dollar amount and average interest rate of reverse repurchase agreements in the Total Return Bond Fund for the year ended March 31, 2024, was $472,147,049 and (0.61)%.
Reverse repurchase transactions and treasury roll transactions are entered into by a Fund under MRAs. With reverse repurchase transactions and treasury roll transactions, typically the Funds and the counterparties are not permitted to sell, re-pledge, or use the collateral associated with the transaction. Pursuant to the terms of the MRA, a Fund receives or posts securities as collateral with a market value in excess of the repurchase price to be paid or received by a Fund upon the maturity of the transaction. Upon a bankruptcy or insolvency of the MRA counterparty, a Fund is considered an unsecured creditor with respect to excess collateral and, as such, the return of excess collateral may be delayed. As of March 31, 2024, the Total Return Bond Fund held reverse repurchase agreements. These reverse repurchase agreements were pledged by counterparty with U.S. Treasury Obligations valued at $1,501,250,000. The contractual maturity of secured borrowings is within 30 days.
335 / Annual Report March 2024
Table of Contents
Notes to Financial Statements (Continued)
As of March 31, 2024, the following table is a summary of open reverse repurchase agreements by counterparty which are subject to offset under an MRA on a net basis:
| TOTAL RETURN BOND FUND | ||||||||||||
| COUNTERPARTY | REVERSE REPURCHASE AGREEMENTS | FAIR VALUE OF NON-CASH COLLATERAL PLEDGED INCLUDING ACCRUED INTEREST1 | NET AMOUNT | |||||||||
Barclays Bank PLC | $ | 1,501,250,000 | $ | (1,501,250,000 | ) | $ | — | |||||
|
|
|
|
|
| |||||||
| $ | 1,501,250,000 | $ | (1,501,250,000 | ) | $ | — | ||||||
|
|
|
|
|
| |||||||
1Excess of collateral pledged for individual counterparty may not be shown for financial reporting purposes.
In the event the counterparty of securities under an MRA files for bankruptcy or becomes insolvent, a Fund’s use of the proceeds from the agreement may be restricted while the counterparty, or its trustee or receiver, determines whether or not to enforce a Fund’s obligation to repurchase the securities.
Each Fund may enter into when-issued, delayed-delivery, or forward commitment transactions in order to lock in the purchase price of the underlying security, or in order to adjust the interest rate exposure of the Fund’s existing portfolio. In when-issued, delayed-delivery, or forward commitment transactions, a Fund commits to purchase or sell particular securities, with payment and delivery to take place at a future date. Although a Fund does not pay for the securities or start earning interest on them until they are delivered, it immediately assumes the risks of ownership, including the risk of price fluctuation. If a Fund’s counterparty fails to deliver a security purchased on a when-issued, delayed-delivery, or forward commitment basis, there may be a loss, and that Fund may have missed an opportunity to make an alternative investment. Prior to settlement of these transactions, the value of the subject securities will fluctuate, reflecting interest rate changes. In addition, because a Fund is not required to pay for when-issued, delayed-delivery, or forward commitment securities until the delivery date, they may result in a form of leverage to the extent a Fund does not maintain liquid assets equal to the face amount of the contract. The Funds segregate assets (cash and/or securities) to cover the amounts outstanding related to these transactions.
Derivatives:
The Funds may engage in various portfolio investment strategies both to increase the return of the Funds and to economically hedge, or protect, their exposure to interest rate movements and movements in the securities markets. Losses may arise if the value of the contract decreases due to an unfavorable change in the price of the underlying security or if the counterparty does not perform under the contract. The Funds are subject to credit risk, equity price risk and interest rate risk in the normal course of pursuing their investment objectives by investing in various derivative financial instruments, as described below:
Over the reporting period, the Funds engaged in interest rate futures contracts, foreign currency exchange contracts, swap agreements and swaptions as a means of managing interest rate risk and yield curve positioning consistent with the Adviser’s current market perspectives. Additionally, credit default swaps were held for the purposes of (1) hedging valuation risks specific to identified market segments, industries and credits and (2) efficiently gaining income-bearing exposures to selected market segments, industries and credits. The market value of these instruments, realized and changes in unrealized gains and losses, and the types of contracts are included in the Schedule of Portfolio Investments and the Notes to Financial Statements.
Options - The Funds may purchase and write call and put options on securities, securities indices and on foreign currencies. A Fund may purchase put options on securities to seek to protect holdings in an underlying or related security against a substantial decline in market value. A Fund may purchase call options on securities to seek to protect against substantial increases in prices of securities the Fund intends to purchase pending its ability to invest in such securities in an orderly manner. The Fund pays a premium which is included as an asset on the Statements of Assets and Liabilities and subsequently marked-to-market to reflect the current value of the option. Premiums paid for purchasing options which expire are treated as realized losses. A Fund may write a call or put option only if the option is covered by the Fund holding a position in the underlying securities or by other means which would permit immediate satisfaction of the Fund’s obligation as writer of the option. When the Fund writes a call or put, an amount equal to the premium received is recorded as a liability and subsequently marked-to-market to reflect the current value of the option written. These liabilities are included on the Statements of Assets and Liabilities. Premiums received from writing options which expire are treated as realized gains. Premiums received from writing options which are exercised or closed are added to the proceeds or offset against amounts paid on the underlying futures, swap, security or currency transaction to determine the realized gain (loss). The purchase and writing of options involves certain risks. During the option period, the covered call writer has, in return for the premium on the option, given up the opportunity to profit from a price increase in the underlying securities above the sum of the premium and exercise price, but as long as its obligation as a writer continues, has retained the risk of loss should the price of the underlying securities decline. The writer of an option has no control over the time when it may be required to fulfill its obligation as
Annual Report March 2024 / 336
Table of Contents
Notes to Financial Statements (Continued)
a writer of the option. Once an option writer has received an exercise notice, it cannot effect a closing purchase transaction in order to terminate its obligation under the option and must deliver the underlying securities at the exercise price. If a put or call option purchased by the Fund is not sold when it has remaining value, and if the market price of the underlying security, in the case of a put, remains equal to or greater than the exercise price or, in the case of a call, remains less than or equal to the exercise price, the Fund will lose its entire investment in the option. There can be no assurance that a liquid market will exist when a Fund seeks to close out an option position. Furthermore, if trading restrictions or suspensions are imposed on the options markets, a Fund may be unable to close out a position.
The Funds may execute transactions in both listed and over-the-counter options. Listed options involve minimal counterparty risk since listed options are guaranteed against default by the exchange on which they trade. Transactions in certain over-the-counter options may expose the Funds to the risk of default by the counterparty to the transaction. In the event of default by the counterparty to the over-the-counter option transaction, a Fund’s maximum amount of loss is the premium paid (as purchaser) or the unrealized loss of the contract (as writer). As of March 31, 2024, the Funds did not hold any options.
Futures - The Funds purchased or sold exchange-traded futures contracts, which are contracts that obligate the Funds to make or take delivery of a financial instrument or the cash value of a security index at a specified future date at a specified price. The Funds may use futures contracts to manage exposure to the stock and bond markets or changes in interest rates and currency values, or for gaining exposure to markets. Risks of entering into futures contracts include the possibility that there may be an illiquid market at the time the Adviser to the Fund may be attempting to sell some or all of the Fund holdings or that a change in the value of the contract may not correlate with changes in the value of the underlying securities. Upon entering into a futures contract, the Fund is required to deposit either cash or securities (initial margin). Subsequent payments (variation margin) are made or received by the Fund, generally on a daily basis. The variation margin payments are equal to the daily changes in the contract value and are recorded as unrealized gains or losses. The Funds recognize a realized gain or loss when the contract is closed or expires.
Futures transactions involve minimal counterparty risk since futures contracts are guaranteed against default by the exchange on which they trade.
Foreign Currency - The Funds may hold foreign currency as an economic hedge against either specific transactions or portfolio instruments or to obtain exposure to foreign currencies (foreign currency exchange rate risk).
Foreign Currency Exchange Contracts - The Funds entered into foreign currency exchange contracts as an economic hedge against either specific transactions or portfolio instruments or to obtain exposure to foreign currencies (foreign currency exchange rate risk). A foreign currency exchange contract is an agreement between two parties to buy and sell a currency at a set exchange rate on a future date. Foreign currency exchange contracts, when used by a Fund, help to manage the overall exposure to the currencies in which some of the investments held by a Fund are denominated. The contract is marked-to-market daily and the change in market value is recorded by a Fund as an unrealized gain or loss. When the contract is closed, a Fund records a realized gain or loss equal to the difference between the value at the time it was opened and the value at the time it was closed. The use of foreign currency exchange contracts involves the risk that the value of a foreign currency exchange contract changes unfavorably due to movements in the value of the referenced foreign currencies and the risk that a counterparty to the contract does not perform its obligations under the agreement.
Swaps - The Funds invested in swap agreements. Swap agreements are two-party contracts entered into primarily by institutional investors for periods ranging from a few weeks to more than a year. In a standard swap transaction, two parties agree to exchange the returns earned on specific assets, such as the return on, or increase in value of, a particular dollar amount invested at a particular interest rate, in a particular foreign currency, or in a basket of securities representing a particular index. A swap contract may not be assigned without the consent of the counterparty (and in certain circumstances may not be assignable), and may result in losses in the event of a default or bankruptcy of the counterparty.
The Funds entered into credit default swap agreements to provide a measure of protection against defaults of the issuers (i.e., to reduce risk where a Fund owns or has exposure to the referenced obligation) or to take an active long or short position with respect to the likelihood of a particular issuer’s default. The buyer in a credit default contract is obligated to pay the seller a periodic stream of payments over the term of the contract provided no event of default has occurred. In the event of default, the seller must pay the buyer the par value (full notional value) of the reference obligation in exchange for the reference obligation. The Funds may be either the buyer or seller in such transactions. If a Fund is a buyer and no event of default occurs, the Fund loses its investment and recovers nothing. However, if an event of default occurs, the buyer receives full notional value for a reference obligation that may have little or no value. As a seller of a credit default swap, the Fund receives a fixed rate of income throughout the term of the contract, provided there is no default event. If an event of default occurs, the seller may pay the notional value of the reference obligation. The value of the reference obligation received by the seller, coupled with the periodic payments previously received may
337 / Annual Report March 2024
Table of Contents
Notes to Financial Statements (Continued)
be less than the full notional value it pays to the buyer, resulting in a loss of value to the Fund. Credit default swaps involve greater risks than if the Fund had invested in the reference obligation directly. In addition to general market risks, credit default swaps are subject to illiquidity risk, counterparty risk and credit risk.
The aggregate fair value of credit default swaps in a net liability position is reflected as unrealized depreciation. The collateral posted for swap contracts, net of assets received as collateral, is also disclosed in the Notes to Schedules of Portfolio Investments. The maximum potential amount of future payments (undiscounted) that a portfolio as a seller of protection could be required to make under a credit default swap agreement is an amount equal to the notional amount of the agreement. These potential amounts are partially offset by any recovery values of the respective referenced obligations, upfront payments received upon entering into the agreement, or net amounts received from the settlement of buy protection credit default swap agreements entered into by a portfolio for the same referenced entity or entities. As of March 31, 2024, the Funds did not hold any credit default swaps.
The Funds entered into interest rate swap agreements. Interest rate swaps are agreements in which one party pays a floating rate of interest on a notional principal amount and receives a fixed rate of interest on the same notional principal amount for a specified period of time. Alternatively, a party may pay a fixed rate and receive a floating rate. In more complex swaps, the notional principal amount may decline (or amortize) over time. The Funds’ maximum risk of loss due to counterparty default is the discounted NAV of the cash flows paid to/received from the counterparty over the interest rate swap’s remaining life. The Funds enter into interest rate swaps to manage duration, the yield curve, or interest rate risk by economically hedging the value of the fixed-rate bonds which may decrease when interest rates rise (interest rate risk).
The Funds may write (sell) and purchase put and call swaptions. Swaption contracts written by the Funds represent an option that gives the purchaser the right, but not the obligation, to enter into a new swap agreement, or to shorten, extend, cancel or modify an existing swap agreement, on a future date on specified terms. Depending on the terms of the particular option agreement, a Fund will generally incur a greater degree of risk when it writes a swaption than it will incur when it purchases a swaption. When a Fund purchases a swaption, it risks losing only the amount of the premium it has paid should it decide to let the option expire unexercised. However, when a Fund writes a swaption, upon exercise of the option the Fund will become obligated according to the terms of the underlying agreement. At March 31, 2024, the Funds did not hold any swaptions.
In addition to the securities listed above, the AlphaTrak 500 Fund invested in the following equity derivative instruments with a notional or contractual value up to its total assets: S&P 500 Index futures contracts and Mini S&P 500 Index futures contracts. When the above-listed S&P Index derivatives appear to be overvalued relative to the S&P 500 Index, the Fund may invest up to 100% in the common stocks that comprise the S&P 500 Index. The Fund may also invest up to 25% of its total assets in these stocks indirectly by purchasing interests in one or more mutual funds, asset pools, or trusts that invest in such stocks.
The Funds may enter into total return swap agreements. Total return swap is the generic name for any non-traditional swap where one party agrees to pay the other the “total return” of a defined underlying asset, usually in return for receiving a stream of LIBOR-based cash flows. The total return swap may be applied to any underlying asset but is most commonly used with equity indices, single stocks, bonds and defined portfolios of loans and mortgages. The total return swap is a mechanism for the user to accept the economic benefits of asset ownership without utilizing the balance sheet. The other leg of the swap, usually LIBOR, is spread to reflect the non-balance sheet nature of the product. Total return swaps can be designed with any underlying asset agreed between two parties.
As a result, unrealized gains are reported as an asset and unrealized losses are reported as a liability in the Statements of Assets and Liabilities. The change in the value of the swaps, including periodic amounts of interest paid or received on swaps, is reported as unrealized gains or losses in both the Statements of Assets and Liabilities and the Statements of Operations. A realized gain or loss is recorded upon payment or termination of swap agreements. Swap agreements are stated at fair value. Notional principal amounts are used upon payment or receipt of a periodic payment or termination of swap agreements to express the extent of involvement in these transactions, but the amounts subject to credit risk are much smaller. At March 31, 2024, the Funds had outstanding swap agreements as listed in the Funds’ Schedules of Portfolio Investments. Swap transactions present risk of loss in excess of the related amounts in the Statements of Assets and Liabilities.
| 4. | RISK CONSIDERATIONS |
Foreign Investing Risk: The Funds may be exposed to the risk that the Funds’ share prices will fluctuate with market conditions, currency exchange rates and the economic and political climates in countries where the Funds invest.
Market Risk: Because the values of the Funds’ investments will fluctuate with market conditions, so will the value of your investment in the Funds. You could lose money on your investment in the Funds or the Funds could underperform other investments.
Annual Report March 2024 / 338
Table of Contents
Notes to Financial Statements (Continued)
Liquidity Risk: The Funds’ investments in illiquid securities may reduce the returns of the Funds because they may not be able to sell the illiquid securities at an advantageous time or price. Investments in high-yield securities, foreign securities, derivatives or other securities with substantial market and/or credit risk tend to have the greatest exposure to liquidity risk. Certain investments in private placements and Rule 144A securities may be considered illiquid investments. The Funds may invest in private placements and Rule 144A securities.
Interest Rate Risk: The values of the Funds’ investments fluctuate in response to movements in interest rates. If rates rise, the values of debt securities generally fall. The longer the average duration of a Fund’s investment portfolio, the greater the change in value.
Mortgage-Backed and Other Asset-Backed Securities Risk: Each Fund may invest in mortgage-backed or other asset-backed securities. The values of some mortgaged-backed or other asset-backed securities may expose a Fund to a lower rate of return upon reinvestment of principal. When interest rates rise, the value of mortgage-related securities generally will decline; however, when interest rates are declining, the value of mortgage-related securities with prepayment features may not increase as much as other fixed-income securities. The rate of prepayments on underlying mortgages will affect the price and volatility of a mortgage-related security, and may shorten or extend the effective maturity of the security beyond what was anticipated at the time of purchase. If an unanticipated rate of prepayment on underlying mortgages increases the effective maturity of a mortgage-related security, the volatility of the security can be expected to increase. The value of these securities may fluctuate in response to the market’s perception of the creditworthiness of the issuers. Additionally, although mortgages and mortgage-related securities are generally supported by some form of government or private guarantee and/or insurance, there is no assurance that private guarantors or insurers will meet their obligations.
Derivatives Risk: Use of derivatives, which at times is an important part of the Funds’ investment strategy, involves risks different from, or possibly greater than, the risks associated with investing directly in securities and other traditional investments. Investments in derivatives could cause the Funds to lose more than the principal amount invested. Also, suitable derivative transactions may not be available in all circumstances and there can be no assurance that the Funds will engage in these transactions to reduce exposure to other risks when that would be beneficial.
Credit Risk: The values of any of the Funds’ investments may also decline in response to events affecting the issuer or its credit rating. The lower-rated debt securities in which the Fund may invest are considered speculative and are subject to greater volatility and risk of loss than investment-grade securities, particularly in deteriorating economic conditions. The value of some mortgage-related securities in which the Funds invest also may fall because of unanticipated levels of principal prepayments that can occur when interest rates decline.
Certain of the Funds invest a material portion of their assets in securities of issuers that hold mortgage- and asset-backed securities and direct investments in securities backed by commercial and residential mortgage loans and other financial assets. The value and related income of these securities are sensitive to changes in economic conditions, including delinquencies and/or defaults. Continuing shifts in the market’s perception of credit quality on securities backed by commercial and residential mortgage loans and other financial assets may result in increased volatility of market price and periods of illiquidity that can negatively impact the valuation of certain issuers held by the Funds.
Mortgage-backed securities (“MBS”) and asset-backed securities (“ABS”) are characterized and classified in a variety of different ways. These classifications include a view of the securities’ cash flow structure (pass-through, sequential pay, prepayment-protected, interest-only, principal-only, etc.), the security of the claim on the underlying assets (senior, mezzanine and subordinated), as well as types of underlying collateral (prime conforming loans, prime non-conforming loans, Alt-A loans, subprime loans, commercial loans, etc.). In many cases, the classification incorporates a degree of subjectivity: a particular loan might be categorized as “prime” by the underwriting standards of one mortgage issuer while another might classify the loan as “subprime.” In addition to other functions, the risk associated with an investment in a mortgage loan must take into account the nature of the collateral, the form and the level of credit enhancement, the vintage of the loan, the geography of the loan, the purpose of the loan (refinance versus purchase versus equity take-out), the borrower’s credit quality (e.g. FICO score), and whether the loan is a first trust deed or a second lien.
The mortgage industry lacks a single bright-line as to what separates a subprime loan from an Alt-A loan. Often it is a combination of loan characteristics involving both borrower criteria as well as collateral criteria that determine which category a loan is placed in. However, in order to be both conservative and objective as possible, the Adviser applied the following criteria to the Funds’ residential mortgage and asset-backed holdings in coming up with its categorizations:
Sub Prime - Any asset-backed bond whose collateral was residential mortgages which were considered to be subprime, provided that the loans did not belong to the classification of manufactured housing loans.
339 / Annual Report March 2024
Table of Contents
Notes to Financial Statements (Continued)
Alt-A - Any mortgage-backed security whose average borrower FICO score was less than 730 and/or was listed as an Alt-A pool by Bloomberg were considered to be Alt-A bonds.
Counterparty Risk: The Funds may be exposed to counterparty risk, or the risk that an entity with which the Funds have unsettled or open transactions may default. Financial assets, which potentially expose the Funds to credit and counterparty risks, consist principally of investments and cash due from counterparties. The extent of the Funds’ exposure to credit and counterparty risks with respect to these financial assets is approximated by their fair value recorded in the Funds’ Statements of Assets and Liabilities.
LIBOR Risk: The London Interbank Offered Rate (“LIBOR”) was a leading benchmark or reference rate for various commercial and financial contracts, including corporate and municipal bonds, bank loans, asset-backed and mortgage-related securities, interest rate swaps and other derivatives. In July 2017, the United Kingdom’s Financial Conduct Authority (FCA), which regulates LIBOR, announced the gradual phase out of the LIBOR rate, with nearly all LIBOR rate publications having ceased as of June 30, 2023 (some LIBOR rates continue to be published, but only on a temporary and synthetic basis). Alternatives to LIBOR have been established and others may be developed. The U.S. Federal Reserve, in conjunction with the Alternative Reference Rates Committee, a steering committee comprised of large U.S. financial institutions, has identified the Secured Overnight Financial Rate (SOFR) as the preferred alternative rate to LIBOR. SOFR is a relatively new index calculated by short-term repurchase agreements, backed by Treasury securities. There remains uncertainty surrounding the nature of any replacement rates. The transition to a new reference rate may result in (i) increased volatility or illiquidity in markets for instruments or contracts that previously relied on or still rely on LIBOR, (ii) a reduction in the value of certain instruments or contracts held by a Fund, (iii) reduced effectiveness of related Fund transactions, such as hedging, (iv) additional tax, accounting and regulatory risks, or (v) costs incurred in connection with closing out positions and entering into new trades. Any pricing adjustments to a Fund’s investments resulting from a substitute reference rate may also adversely affect a Fund’s performance and/or NAV. There is no assurance that the composition or characteristics of any such alternative reference rate will be similar to or produce the same value or economic equivalence as LIBOR or that instruments or contracts using an alternative rate will have the same volume or liquidity.
Bank Loan Risk: There is a risk of investing in corporate loans made by commercial banks and other financial institutions or institutional investors to companies that need capital to grow or restructure, which includes interest rate risk, liquidity risk and prepayment risk. The Fund may also be subject to the credit risk of other financial institutions and the risks associated with insufficient collateral securing a bank loan, limited available public information about a bank loan, delayed settlement, and less protection for holders of bank loans as compared to holders of registered securities. Bank loans are not registered and otherwise may not be treated as securities under the federal securities laws, meaning investors in loans have less protection against improper practices than investors in securities that are registered under or are otherwise subject to the protections of the securities laws.
| 5. | SECURITIES TRANSACTIONS |
Investment transactions for the year ended March 31, 2024, excluding U.S. government and short-term investments, were as follows:
| PORTFOLIO | PURCHASES | SALES | ||||||
AlphaTrak 500 Fund | $ | 16,137,642 | $ | 14,593,620 | ||||
Corporate Bond Fund | 1,156,124 | 3,289,250 | ||||||
Flexible Income Fund | 118,641,443 | 105,026,660 | ||||||
Floating Rate Income Fund | 240,009,572 | 280,915,362 | ||||||
High Yield Bond Fund | 323,982,455 | 394,744,975 | ||||||
Intermediate Bond Fund | 149,876,936 | 211,187,146 | ||||||
Investment Grade Credit Fund | 12,509,429 | 3,006,072 | ||||||
Low Duration Bond Fund | 194,201,665 | 706,896,003 | ||||||
Opportunistic High Income Credit Fund | 597,854 | 1,453,265 | ||||||
Strategic Income Fund | 19,918,843 | 16,158,591 | ||||||
Sustainable Securitized Fund | 3,776,832 | 4,506,388 | ||||||
Total Return Bond Fund | 5,669,181,520 | 17,690,625,792 | ||||||
Ultra Short Bond Fund | 10,746,679 | 46,721,418 | ||||||
Unconstrained Bond Fund | 504,755,703 | 1,019,123,528 | ||||||
Annual Report March 2024 / 340
Table of Contents
Notes to Financial Statements (Continued)
Investment transactions in U.S. government securities for the year ended March 31, 2024 were as follows:
| PORTFOLIO | PURCHASES | SALES | ||||||
AlphaTrak 500 Fund | $ | 51,105,877 | $ | 47,017,794 | ||||
Corporate Bond Fund | 6,567,622 | 6,313,968 | ||||||
Flexible Income Fund | 1,060,858,277 | 1,033,720,042 | ||||||
High Yield Bond Fund | 34,340,290 | 34,355,682 | ||||||
Intermediate Bond Fund | 5,404,633,554 | 5,356,092,644 | ||||||
Investment Grade Credit Fund | 75,894,038 | 67,925,102 | ||||||
Low Duration Bond Fund | 7,585,842,037 | 7,594,792,202 | ||||||
Opportunistic High Income Credit Fund | 366,653 | 277,349 | ||||||
Strategic Income Fund | 160,875,665 | 156,368,000 | ||||||
Sustainable Securitized Fund | 21,547,438 | 21,770,706 | ||||||
Total Return Bond Fund | 297,754,509,166 | 297,976,580,711 | ||||||
Ultra Short Bond Fund | 433,758,601 | 471,975,258 | ||||||
Unconstrained Bond Fund | 7,312,768,766 | 7,380,262,001 | ||||||
There were no purchases or sales of securities from affiliated investment accounts for the year ended March 31, 2024. These trades are in accordance with the provisions set forth in Section 17(a)-7 of the 1940 Act.
Investment transactions in the shares of affiliated issuers for the year ended March 31, 2024 were as follows:
| VALUE AT BEGINNING OF YEAR | SALES | DIVIDEND/ INTEREST | VALUE AT OF YEAR | SHARES HELD AT END OF YEAR | REALIZED GAIN (LOSS) | CHANGE IN UNREALIZED APPRECIATION | ||||||||||||||||||||||||||
High Yield Bond Fund | ||||||||||||||||||||||||||||||||
Homer City Holdings LLC | $— | $— | $— | $— | $— | 502,908 | $— | $— | ||||||||||||||||||||||||
Total Return Bond Fund | ||||||||||||||||||||||||||||||||
Homer City Holdings LLC | $— | $— | $— | $— | $— | 1,180,703 | $— | $— | ||||||||||||||||||||||||
| 6. | INVESTMENT ADVISORY SERVICES AND OTHER TRANSACTIONS |
As compensation for advisory services, the Adviser charges the AlphaTrak 500 Fund, the Corporate Bond Fund, the Flexible Income Fund, the Floating Rate Income Fund, the High Yield Bond Fund, the Intermediate Bond Fund, the Investment Grade Credit Fund, the Low Duration Bond Fund, the Opportunistic High Income Credit Fund, the Strategic Income Fund, the Sustainable Securitized Fund, the Total Return Bond Fund, the Ultra Short Bond Fund and the Unconstrained Bond Fund a fee, computed daily and payable monthly, at an annual rate of 0.40%, 0.40%, 0.45%, 0.55%, 0.50%, 0.35%, 0.35%, 0.30%, 0.50%, 0.65%, 0.40%, 0.35%, 0.25% and 0.65%, respectively, of each Fund’s average daily net assets.
The Adviser has agreed in an operating expenses agreement with the Trust to limit each Fund’s expenses (excluding interest, taxes, brokerage commissions, short sales dividend expense, acquired fund fees and expenses, and any expenses incurred in connection with any merger or reorganization or extraordinary expenses such as litigation) as described in the table below. The operating expenses agreement has a one-year term, renewable at the end of each fiscal year. Each Fund has agreed to reimburse the Adviser, for a period of up to three years, for any such payments to the extent that the Fund’s operating expenses are otherwise below its expense cap at both the time of the waiver and the recoupment. The Adviser’s obligation will not be recorded as a liability on the books of the applicable Fund to the extent that the total operating expenses of the Fund are at or above the expense cap. However, if the total operating expenses of a Fund fall below the expense cap, the reimbursement to the Adviser (up to the cap) will be accrued by the Fund as a liability if the Adviser seeks to recoup those amounts and the independent trustees have approved that reimbursement. The Adviser may not request or receive reimbursement from a Fund for prior reductions or reimbursements before the payment of a Fund’s operating expenses for the year.
341 / Annual Report March 2024
Table of Contents
Notes to Financial Statements (Continued)
Investment advisory fees and related contractual expense limitations for the year ended March 31, 2024, were as follows:
PORTFOLIO | INVESTMENT ADVISORY FEE RATE | CONTRACTUAL EXPENSE LIMITATION1 | ||||||||||||||||||||
| CLASS M | CLASS I | CLASS I-2 | ADMINI- STRATIVE | PLAN CLASS | CLASS M | CLASS I | CLASS I-2 | ADMINI- STRATIVE CLASS | PLAN CLASS | |||||||||||||
AlphaTrak 500 Fund | 0.40% | N/A | N/A | N/A | N/A | 0.45% | N/A | N/A | N/A | N/A | ||||||||||||
Corporate Bond Fund | 0.40% | 0.40% | N/A | N/A | N/A | 0.75% | 0.50% | N/A | N/A | N/A | ||||||||||||
Flexible Income Fund | 0.45% | 0.45% | N/A | N/A | N/A | 0.80% | 0.55% | N/A | N/A | N/A | ||||||||||||
Floating Rate Income Fund | 0.55% | 0.55% | N/A | N/A | 0.55% | 0.90% | 0.70% | N/A | N/A | 0.60% | ||||||||||||
High Yield Bond Fund | 0.50% | 0.50% | N/A | N/A | N/A | 0.85% | 0.60% | N/A | N/A | N/A | ||||||||||||
Intermediate Bond Fund | 0.35% | 0.35% | N/A | N/A | N/A | 0.70% | 0.49% | N/A | N/A | N/A | ||||||||||||
Investment Grade Credit Fund | 0.35% | 0.35% | N/A | N/A | N/A | 0.70% | 0.49% | N/A | N/A | N/A | ||||||||||||
Low Duration Bond Fund | 0.30% | 0.30% | N/A | 0.30% | N/A | 0.63% | 0.44% | N/A | 0.83% | N/A | ||||||||||||
Opportunistic High Income Credit Fund | 0.50% | 0.50% | N/A | N/A | N/A | 0.85% | 0.60% | N/A | N/A | N/A | ||||||||||||
Strategic Income Fund | 0.65% | 0.65% | N/A | N/A | N/A | 1.04% | 0.80% | N/A | N/A | N/A | ||||||||||||
Sustainable Securitized Fund | 0.40% | 0.40% | N/A | N/A | N/A | 0.70% | 0.49% | N/A | N/A | N/A | ||||||||||||
Total Return Bond Fund | 0.35% | 0.35% | 0.35% | 0.35% | 0.35% | 0.70% | 0.49% | 0.54% | 0.90% | 0.39% | ||||||||||||
Ultra Short Bond Fund | 0.25% | 0.25% | N/A | N/A | N/A | 0.50% | 0.34% | N/A | N/A | N/A | ||||||||||||
Unconstrained Bond Fund | 0.65% | 0.65% | N/A | N/A | 0.65% | 1.04% | 0.80% | N/A | N/A | 0.70% | ||||||||||||
1The Adviser has agreed not to reduce or discontinue this contractual expense limitation until July 31, 2024, unless approved by the Board.
At March 31, 2024, the balance of recoupable expenses with expiration dates for the Funds were as follows:
| PORTFOLIO | 2025 | 2026 | 2027 | TOTAL | ||||||||||||
AlphaTrak 500 Fund | $ | — | $ | 270,246 | $ | 224,890 | $ | 495,136 | ||||||||
Corporate Bond Fund | 257,575 | 293,711 | 217,007 | 768,293 | ||||||||||||
Flexible Income Fund | 441,229 | 471,234 | 446,297 | 1,358,760 | ||||||||||||
Floating Rate Income Fund | 14,896 | 16,938 | 11,906 | 43,740 | ||||||||||||
High Yield Bond Fund | 145,095 | 130,452 | 135,512 | 411,059 | ||||||||||||
Intermediate Bond Fund | 62 | 3,695 | 1,163 | 4,920 | ||||||||||||
Investment Grade Credit Fund | 264,265 | 293,818 | 239,989 | 798,072 | ||||||||||||
Opportunistic High Income Credit Fund | 96,407 | 250,735 | 223,986 | 571,128 | ||||||||||||
Strategic Income Fund | 566,609 | 339,161 | 312,702 | 1,218,472 | ||||||||||||
Sustainable Securitized Fund | 67,666 | 262,567 | 238,549 | 568,782 | ||||||||||||
Ultra Short Bond Fund | 355,828 | 326,076 | 259,120 | 941,024 | ||||||||||||
Unconstrained Bond Fund | — | 1,748 | — | 1,748 | ||||||||||||
|
|
|
|
|
|
|
|
|
|
|
| |||||
Total | $ | 2,209,632 | $ | 2,660,381 | $ | 2,311,121 | $ | 7,181,134 | ||||||||
|
|
|
|
|
|
|
|
|
|
|
| |||||
Certain officers and trustees of the Funds are also officers and directors of the Adviser. Such officers and trustees serve without direct compensation from the Funds. Each of the independent trustees receives an annual retainer of $150,000 and $10,000 for each meeting of the Board attended in person and $2,500 for each meeting attended telephonically. The chairman of the Board receives an annual retainer of $60,000. The respective chairman of the Audit Committee and the Nominating and Governance Committee each receives an additional annual retainer of $40,000 and $20,000, respectively. The Trust has an unfunded, nonqualified deferred compensation plan (the “Deferred Compensation Plan”) for certain eligible Trustees. The Deferred Compensation Plan allows Trustees to defer some or all of their annual trustees’ fees otherwise payable by the Trust for a minimum of three years. The fees deferred are posted to a bookkeeping account maintained by the Trust. The various series of the Trust will use the returns on those Funds selected by the Trustee to determine the income, gains and losses to allocate to the account. At the time for commencing distributions from a Trustee’s deferral account, which is no later than when the Trustee ceases to be a member of the Board, deferred fees will be paid out in a single sum in cash or a maximum of 10 annual installments. The expenses related to the annual retainer, meeting fees, and/or any fluctuation in the selected Funds under the Deferred Compensation Plan are recorded in Trustees’ fees and expenses in the Statements of Operations.
| 7. | SHARE MARKETING (12b-1) PLAN AND SHAREHOLDER SERVICING PLAN |
The Trust has a Share Marketing Plan (or the “12b-1 Plan”) pursuant to Rule 12b-1 of the 1940 Act with respect to Class M shares of the Corporate Bond Fund, the Flexible Income Fund, the Floating Rate Income Fund, the High Yield Bond Fund, the Intermediate Bond Fund, the Investment Grade Credit Fund, the Low Duration Bond Fund, the Opportunistic High Income Credit Fund, the Strategic Income Fund, the Sustainable Securitized Fund, the Total Return Bond Fund, the Ultra Short Bond Fund, the Unconstrained Bond Fund, and the Administrative Class shares of the Low Duration Bond Fund and Total Return Bond Fund.
Annual Report March 2024 / 342
Table of Contents
Notes to Financial Statements (Continued)
Under the 12b-1 Plan, the Trust pays TCW Funds Distributors, Inc., as the Trust’s distribution coordinator, an annual fee up to 0.25% of the particular Fund’s average daily net assets attributable to Class M shares and Administrative Class shares to reimburse expenses in connection with the promotion and distribution of shares of the respective Fund. The Adviser has undertaken to limit the Rule 12b-1 expenses to 0.16% for the Ultra Short Bond Fund, 0.19% for the Low Duration Bond Fund, and 0.21% for the Intermediate Bond Fund and the Total Return Bond Fund, for the year ended March 31, 2024. The AlphaTrak 500 Fund is currently not incurring Rule 12b-1 fees. The Adviser has contractually agreed, through July 31, 2024, to pay the distribution expenses of the AlphaTrak 500 Fund out of its own resources.
The Board of Trustees has adopted a Shareholder Servicing Plan that allows each Fund to pay to broker-dealers and other financial intermediaries a fee for shareholder services provided to Fund shareholders who invest in the Administrative Class shares of a Fund through the intermediary. The fee is payable under the Shareholder Servicing Plan at an annual rate not to exceed 0.25% of the particular Fund’s average daily net assets attributable to the Administrative Share class, but the Adviser has undertaken to limit these expenses for the current fiscal year to 0.20% of the Fund’s average daily net assets invested through the intermediary.
| 8. | COMMITMENTS AND CONTINGENCIES |
The Floating Rate Income Fund, High Yield Bond Fund and Total Return Bond Fund had the following unfunded commitments and unrealized gain by investment as of March 31, 2024:
FLOATING RATE INCOME FUND UNFUNDED COMMITMENTS | MATURITY | AMOUNT | UNREALIZED GAIN | ||||||||||||
Osmosis Buyer Ltd., Term Loan B, 1st Lien | July 2028 | $ | 41,278 | $ | 235 | ||||||||||
Action Environmental Group, Inc. (The), Delayed-Draw Term Loan, 1st Lien | October 2030 | 102,855 | 986 | ||||||||||||
Ryan LLC, Delayed-Draw Term Loan, 1st Lien | November 2030 | 95,834 | 596 | ||||||||||||
|
|
|
| ||||||||||||
Total Unfunded Commitments | $ | 239,967 | $ | 1,817 | |||||||||||
|
|
|
| ||||||||||||
HIGH YIELD BOND FUND UNFUNDED COMMITMENTS | MATURITY | AMOUNT | UNREALIZED GAIN | ||||||||||||
Osmosis Buyer Ltd., Term Loan B, 1st Lien | July 2028 | $ | 154,795 | $ | 882 | ||||||||||
Ryan LLC, Delayed-Draw Term Loan, 1st Lien | November 2030 | 95,834 | 596 | ||||||||||||
|
|
|
| ||||||||||||
Total Unfunded Commitments | $ | 250,629 | $ | 1,478 | |||||||||||
|
|
|
| ||||||||||||
TOTAL RETURN BOND FUND UNFUNDED COMMITMENTS | MATURITY | AMOUNT | UNREALIZED GAIN | ||||||||||||
Osmosis Buyer Ltd., Term Loan B, 1st Lien | July 2028 | $ | 51,598 | $ | 294 | ||||||||||
|
|
|
| ||||||||||||
Total Unfunded Commitments | $ | 51,598 | $ | 294 | |||||||||||
|
|
|
| ||||||||||||
In the normal course of business, the Trust enters into contracts which provide a variety of representations and warranties, and that provide general indemnifications. Such contracts include those with certain service providers, brokers and trading counterparties. Any exposure to the Trust under these arrangements is unknown as it would involve future claims that may be made against the Trust; however, based on the Trust’s experience, the risk of loss is remote and no such claims are expected to occur. As such, the Trust has not accrued any liability in connection with such indemnifications.
343 / Annual Report March 2024
Table of Contents
Notes to Financial Statements (Continued)
| 9. | CAPITAL SHARE TRANSACTIONS |
Each Fund is authorized to issue an unlimited number of shares of beneficial interest with a par value of $0.01 per share. Transactions in shares of beneficial interest were as follows:
| ALPHATRAK 500 FUND | ||||||||||||||||||||||||
| CLASS M | CLASS M | |||||||||||||||||||||||
| YEAR ENDED MARCH 31, 2024 | YEAR ENDED MARCH 31, 2023 | |||||||||||||||||||||||
Change in Fund shares: | ||||||||||||||||||||||||
Shares outstanding at beginning of year | 2,934,340 | 3,928,208 | ||||||||||||||||||||||
|
|
|
| |||||||||||||||||||||
Shares sold | 307,640 | 169,686 | ||||||||||||||||||||||
Shares issued through reinvestment of distributions | 112,162 | 149,894 | ||||||||||||||||||||||
Shares redeemed | (889,447) | (1,313,448) | ||||||||||||||||||||||
|
|
|
|
| ||||||||||||||||||||
Net (decrease) in fund shares | (469,645) | (993,868) | ||||||||||||||||||||||
|
|
|
| |||||||||||||||||||||
Shares outstanding at end of year | 2,464,695 | 2,934,340 | ||||||||||||||||||||||
|
|
|
| |||||||||||||||||||||
| YEAR ENDED MARCH 31, 2024 | YEAR ENDED MARCH 31, 2023 | YEAR ENDED MARCH 31, 2024 | YEAR ENDED MARCH 31, 2023 | |||||||||||||||||||||
Change in Fund shares: | ||||||||||||||||||||||||
Shares outstanding at beginning of year | 475,695 | 568,258 | 317,762 | 701,050 | ||||||||||||||||||||
|
|
|
|
|
|
|
| |||||||||||||||||
Shares sold | 16,293 | 116,264 | 36,749 | 24,849 | ||||||||||||||||||||
Shares issued through reinvestment of distributions | 12,980 | 15,926 | 10,584 | 15,050 | ||||||||||||||||||||
Shares redeemed | (192,290) | (224,753) | (100,399) | (423,187) | ||||||||||||||||||||
|
|
|
|
|
|
|
| |||||||||||||||||
Net (decrease) in fund shares | (163,017) | (92,563) | (53,066) | (383,288) | ||||||||||||||||||||
|
|
|
|
|
|
|
| |||||||||||||||||
Shares outstanding at end of year | 312,678 | 475,695 | 264,696 | 317,762 | ||||||||||||||||||||
|
|
|
|
|
|
|
| |||||||||||||||||
| YEAR ENDED MARCH 31, 2024 | YEAR ENDED MARCH 31, 2023 | YEAR ENDED MARCH 31, 2024 | YEAR ENDED MARCH 31, 2023 | |||||||||||||||||||||
Change in Fund shares: | ||||||||||||||||||||||||
Shares outstanding at beginning of year | 6,211,930 | 3,651,661 | 35,657,009 | 20,317,792 | ||||||||||||||||||||
|
|
|
|
|
|
|
| |||||||||||||||||
Shares sold | 3,118,196 | 5,112,956 | 14,992,551 | 28,619,685 | ||||||||||||||||||||
Shares issued through reinvestment of distributions | 477,131 | 409,001 | 2,842,909 | 2,158,115 | ||||||||||||||||||||
Shares redeemed | (3,376,299) | (2,961,688) | (13,621,728) | (15,438,583) | ||||||||||||||||||||
|
|
|
|
|
|
|
| |||||||||||||||||
Net increase in fund shares | 219,028 | 2,560,269 | 4,213,732 | 15,339,217 | ||||||||||||||||||||
|
|
|
|
|
|
|
| |||||||||||||||||
Shares outstanding at end of year | 6,430,958 | 6,211,930 | 39,870,741 | 35,657,009 | ||||||||||||||||||||
|
|
|
|
|
|
|
| |||||||||||||||||
| YEAR ENDED MARCH 31, 2024 | YEAR ENDED MARCH 31, 2023 | YEAR ENDED MARCH 31, 2024 | YEAR ENDED MARCH 31, 2023 | |||||||||||||||||||||
Change in Fund shares: | ||||||||||||||||||||||||
Shares outstanding at beginning of year | 1,184,024 | 1,737,330 | 35,353,243 | 48,557,554 | ||||||||||||||||||||
|
|
|
|
|
|
|
| |||||||||||||||||
Shares sold | 624,265 | 429,534 | 3,927,446 | 7,854,538 | ||||||||||||||||||||
Shares issued through reinvestment of distributions | 88,139 | 80,718 | 2,384,221 | 2,176,860 | ||||||||||||||||||||
Shares redeemed | (892,970) | (1,063,558) | (10,827,620) | (23,235,709) | ||||||||||||||||||||
|
|
|
|
|
|
|
| |||||||||||||||||
Net (decrease) in fund shares | (180,566) | (553,306) | (4,515,953) | (13,204,311) | ||||||||||||||||||||
|
|
|
|
|
|
|
| |||||||||||||||||
Shares outstanding at end of year | 1,003,458 | 1,184,024 | 30,837,290 | 35,353,243 | ||||||||||||||||||||
|
|
|
|
|
|
|
| |||||||||||||||||
Annual Report March 2024 / 344
Table of Contents
Notes to Financial Statements (Continued)
| FLOATING RATE INCOME FUND | ||||||||||||||||||||||||
| PLAN CLASS | PLAN CLASS | |||||||||||||||||||||||
| YEAR ENDED MARCH 31, 2024 | YEAR ENDED MARCH 31, 2023 | |||||||||||||||||||||||
Change in Fund shares: | ||||||||||||||||||||||||
Shares outstanding at beginning of year | 11 | 10 | ||||||||||||||||||||||
|
|
|
|
|
| |||||||||||||||||||
Shares sold | 1,064 | — | ||||||||||||||||||||||
Shares issued through reinvestment of distributions | 54 | 1 | ||||||||||||||||||||||
|
|
|
|
|
| |||||||||||||||||||
Net increase in fund shares | 1,118 | 1 | ||||||||||||||||||||||
|
|
|
|
|
| |||||||||||||||||||
Shares outstanding at end of year | 1,129 | 11 | ||||||||||||||||||||||
|
|
|
|
|
| |||||||||||||||||||
| HIGH YIELD BOND FUND | ||||||||||||||||||||||||
| CLASS M | CLASS M | CLASS I | CLASS I | |||||||||||||||||||||
| YEAR ENDED MARCH 31, 2024 | YEAR ENDED MARCH 31, 2023 | YEAR ENDED MARCH 31, 2024 | YEAR ENDED MARCH 31, 2023 | |||||||||||||||||||||
Change in Fund shares: | ||||||||||||||||||||||||
Shares outstanding at beginning of year | 14,711,106 | 16,894,728 | 39,596,938 | 54,977,626 | ||||||||||||||||||||
|
|
|
|
|
|
|
|
|
|
|
| |||||||||||||
Shares sold | 3,165,323 | 5,223,122 | 12,622,005 | 21,306,338 | ||||||||||||||||||||
Shares issued through reinvestment of distributions | 842,006 | 848,748 | 2,250,448 | 2,218,309 | ||||||||||||||||||||
Shares redeemed | (6,721,319) | (8,255,492) | (16,077,187) | (38,905,335) | ||||||||||||||||||||
|
|
|
|
|
|
|
|
|
|
|
| |||||||||||||
Net (decrease) in fund shares | (2,713,990) | (2,183,622) | (1,204,734) | (15,380,688) | ||||||||||||||||||||
|
|
|
|
|
|
|
|
|
|
|
| |||||||||||||
Shares outstanding at end of year | 11,997,116 | 14,711,106 | 38,392,204 | 39,596,938 | ||||||||||||||||||||
|
|
|
|
|
|
|
|
|
|
|
| |||||||||||||
| INTERMEDIATE BOND FUND | ||||||||||||||||||||||||
| CLASS M | CLASS M | CLASS I | CLASS I | |||||||||||||||||||||
| YEAR ENDED MARCH 31, 2024 | YEAR ENDED MARCH 31, 2023 | YEAR ENDED MARCH 31, 2024 | YEAR ENDED MARCH 31, 2023 | |||||||||||||||||||||
Change in Fund shares: | ||||||||||||||||||||||||
Shares outstanding at beginning of year | 2,200,742 | 2,450,422 | 91,699,168 | 76,102,332 | ||||||||||||||||||||
|
|
|
|
|
|
|
|
|
|
|
| |||||||||||||
Shares sold | 569,844 | 715,696 | 32,905,385 | 48,199,978 | ||||||||||||||||||||
Shares issued through reinvestment of distributions | 82,972 | 68,103 | 3,833,163 | 2,450,385 | ||||||||||||||||||||
Shares redeemed | (945,859) | (1,033,479) | (26,568,377) | (35,053,527) | ||||||||||||||||||||
|
|
|
|
|
|
|
|
|
|
|
| |||||||||||||
Net increase (decrease) in fund shares | (293,043) | (249,680) | 10,170,171 | 15,596,836 | ||||||||||||||||||||
|
|
|
|
|
|
|
|
|
|
|
| |||||||||||||
Shares outstanding at end of year | 1,907,699 | 2,200,742 | 101,869,339 | 91,699,168 | ||||||||||||||||||||
|
|
|
|
|
|
|
|
|
|
|
| |||||||||||||
| INVESTMENT GRADE CREDIT FUND | ||||||||||||||||||||||||
| CLASS M | CLASS M | CLASS I | CLASS I | |||||||||||||||||||||
| YEAR ENDED MARCH 31, 2024 | YEAR ENDED MARCH 31, 2023 | YEAR ENDED MARCH 31, 2024 | YEAR ENDED MARCH 31, 2023 | |||||||||||||||||||||
Change in Fund shares: | ||||||||||||||||||||||||
Shares outstanding at beginning of year | 386,999 | 259,570 | 933,323 | 992,802 | ||||||||||||||||||||
|
|
|
|
|
|
|
|
|
|
|
| |||||||||||||
Shares sold | 604,265 | 170,204 | 2,122,752 | 333,416 | ||||||||||||||||||||
Shares issued through reinvestment of distributions | 28,184 | 25,100 | 65,011 | 73,219 | ||||||||||||||||||||
Shares redeemed | (235,277) | (67,875) | (449,515) | (466,114) | ||||||||||||||||||||
|
|
|
|
|
|
|
|
|
|
|
| |||||||||||||
Net increase (decrease) in fund shares | 397,172 | 127,429 | 1,738,248 | (59,479) | ||||||||||||||||||||
|
|
|
|
|
|
|
|
|
|
|
| |||||||||||||
Shares outstanding at end of year | 784,171 | 386,999 | 2,671,571 | 933,323 | ||||||||||||||||||||
|
|
|
|
|
|
|
|
|
|
|
| |||||||||||||
| LOW DURATION BOND FUND
| ||||||||||||||||||||||||
| CLASS M | CLASS M | CLASS I | CLASS I | |||||||||||||||||||||
| YEAR ENDED MARCH 31, 2024 | YEAR ENDED MARCH 31, 2023 | YEAR ENDED MARCH 31, 2024 | YEAR ENDED MARCH 31, 2023 | |||||||||||||||||||||
Change in Fund shares: | ||||||||||||||||||||||||
Shares outstanding at beginning of year | 35,993,593 | 55,362,416 | 178,166,430 | 235,428,672 | ||||||||||||||||||||
|
|
|
|
|
|
|
|
|
|
|
| |||||||||||||
Shares sold | 2,905,784 | 11,354,337 | 27,907,420 | 80,958,050 | ||||||||||||||||||||
Shares issued through reinvestment of distributions | 972,473 | 1,400,421 | 5,637,166 | 5,451,820 | ||||||||||||||||||||
Shares redeemed | (21,411,155) | (32,123,581) | (77,333,453) | (143,672,112) | ||||||||||||||||||||
|
|
|
|
|
|
|
|
|
|
|
| |||||||||||||
Net (decrease) in fund shares | (17,532,898) | (19,368,823) | (43,788,867) | (57,262,242) | ||||||||||||||||||||
|
|
|
|
|
|
|
|
|
|
|
| |||||||||||||
Shares outstanding at end of year | 18,460,695 | 35,993,593 | 134,377,563 | 178,166,430 | ||||||||||||||||||||
|
|
|
|
|
|
|
|
|
|
|
| |||||||||||||
345 / Annual Report March 2024
Table of Contents
Notes to Financial Statements (Continued)
| LOW DURATION BOND FUND | ||||||||||||||||||||||||||||
| ADMINISTRATIVE CLASS | ADMINISTRATIVE CLASS | |||||||||||||||||||||||||||
| YEAR ENDED MARCH 31, 2024 | YEAR ENDED MARCH 31, 2023 | |||||||||||||||||||||||||||
Change in Fund shares: | ||||||||||||||||||||||||||||
Shares outstanding at beginning of year | 72 | 154,242 | ||||||||||||||||||||||||||
|
|
|
|
|
| |||||||||||||||||||||||
Shares sold | 954 | 31,293 | ||||||||||||||||||||||||||
Shares issued through reinvestment of distributions | 22 | 1,504 | ||||||||||||||||||||||||||
Shares redeemed | (67) | (186,967) | ||||||||||||||||||||||||||
|
|
|
|
|
| |||||||||||||||||||||||
Net increase (decrease) in fund shares | 909 | (154,170) | ||||||||||||||||||||||||||
|
|
|
|
|
| |||||||||||||||||||||||
Shares outstanding at end of year | 981 | 72 | ||||||||||||||||||||||||||
|
|
|
|
|
| |||||||||||||||||||||||
| OPPORTUNISTIC HIGH INCOME CREDIT FUND | ||||||||||||||||||||||||||||
| CLASS M | CLASS M | CLASS I | CLASS I | |||||||||||||||||||||||||
| YEAR ENDED MARCH 31, 2024 | YEAR ENDED MARCH 31, 2023 | YEAR ENDED MARCH 31, 2024 | YEAR ENDED MARCH 31, 2023 | |||||||||||||||||||||||||
Change in Fund shares: | ||||||||||||||||||||||||||||
Shares outstanding at beginning of year | 41,554 | 7,782 | 232,805 | 330,792 | ||||||||||||||||||||||||
|
|
|
|
|
|
|
|
|
|
|
| |||||||||||||||||
Shares sold | 40,005 | 70,852 | 2,649 | 65,689 | ||||||||||||||||||||||||
Shares issued through reinvestment of distributions | 2,148 | 2,344 | 15,929 | 32,804 | ||||||||||||||||||||||||
Shares redeemed | (48,839) | (39,424) | (91,358) | (196,480) | ||||||||||||||||||||||||
|
|
|
|
|
|
|
|
|
|
|
| |||||||||||||||||
Net increase (decrease) in fund shares | (6,686) | 33,772 | (72,780) | (97,987) | ||||||||||||||||||||||||
|
|
|
|
|
|
|
|
|
|
|
| |||||||||||||||||
Shares outstanding at end of year | 34,868 | 41,554 | 160,025 | 232,805 | ||||||||||||||||||||||||
|
|
|
|
|
|
|
|
|
|
|
| |||||||||||||||||
| STRATEGIC INCOME FUND | ||||||||||||||||||||||||||||
| CLASS M | CLASS M | CLASS I | CLASS I | |||||||||||||||||||||||||
| YEAR ENDED MARCH 31, 2024 | YEAR ENDED MARCH 31, 2023 | YEAR ENDED MARCH 31, 2024 | YEAR ENDED MARCH 31, 2023 | |||||||||||||||||||||||||
Change in Fund shares: | ||||||||||||||||||||||||||||
Shares outstanding at beginning of year | 8,125,761 | 2,439,193 | 2,492,168 | 1,351,121 | ||||||||||||||||||||||||
|
|
|
|
|
|
|
|
|
|
|
| |||||||||||||||||
Shares sold | 1,097,738 | 6,912,813 | 2,098,801 | 2,020,509 | ||||||||||||||||||||||||
Shares issued through reinvestment of distributions | 616,658 | 400,592 | 229,781 | 175,122 | ||||||||||||||||||||||||
Shares redeemed | (1,372,863) | (1,626,837) | (1,106,308) | (1,054,584) | ||||||||||||||||||||||||
|
|
|
|
|
|
|
|
|
|
|
| |||||||||||||||||
Net increase in fund shares | 341,533 | 5,686,568 | 1,222,274 | 1,141,047 | ||||||||||||||||||||||||
|
|
|
|
|
|
|
|
|
|
|
| |||||||||||||||||
Shares outstanding at end of year | 8,467,294 | 8,125,761 | 3,714,442 | 2,492,168 | ||||||||||||||||||||||||
|
|
|
|
|
|
|
|
|
|
|
| |||||||||||||||||
| SUSTAINABLE SECURITIZED FUND | ||||||||||||||||||||||||||||
| CLASS M | CLASS M | CLASS I | CLASS I | |||||||||||||||||||||||||
| YEAR ENDED MARCH 31, 2024 | YEAR ENDED MARCH 31, 2023 | YEAR ENDED MARCH 31, 2024 | YEAR ENDED MARCH 31, 2023 | |||||||||||||||||||||||||
Change in Fund shares: | ||||||||||||||||||||||||||||
Shares outstanding at beginning of year | 5,958 | 1,738 | 989,282 | 1,137,535 | ||||||||||||||||||||||||
|
|
|
|
|
|
|
|
|
|
|
| |||||||||||||||||
Shares sold | 6,763 | 4,755 | 207,789 | 340,886 | ||||||||||||||||||||||||
Shares issued through reinvestment of distributions | 265 | 92 | 48,921 | 37,255 | ||||||||||||||||||||||||
Shares redeemed | (7,731) | (627) | (321,880) | (526,394) | ||||||||||||||||||||||||
|
|
|
|
|
|
|
|
|
|
|
| |||||||||||||||||
Net increase (decrease) in fund shares | (703) | 4,220 | (65,170) | (148,253) | ||||||||||||||||||||||||
|
|
|
|
|
|
|
|
|
|
|
| |||||||||||||||||
Shares outstanding at end of year | 5,255 | 5,958 | 924,112 | 989,282 | ||||||||||||||||||||||||
|
|
|
|
|
|
|
|
|
|
|
| |||||||||||||||||
Annual Report March 2024 / 346
Table of Contents
Notes to Financial Statements (Continued)
TOTAL RETURN BOND FUND | ||||||||||||||||||||||||
CLASS M | CLASS M | CLASS I | CLASS I | |||||||||||||||||||||
| YEAR ENDED MARCH 31, 2024 | YEAR ENDED MARCH 31, 2023 | YEAR ENDED MARCH 31, 2024 | YEAR ENDED MARCH 31, 2023 | |||||||||||||||||||||
Change in Fund shares: | ||||||||||||||||||||||||
Shares outstanding at beginning of year | 694,341,407 | 609,964,109 | 4,139,805,317 | 4,611,465,986 | ||||||||||||||||||||
|
|
|
|
|
|
|
|
|
|
|
| |||||||||||||
Shares sold | 101,926,092 | 383,552,935 | 918,263,351 | 1,136,670,438 | ||||||||||||||||||||
Shares issued through reinvestment of distributions | 22,015,920 | 19,723,265 | 151,631,718 | 127,328,940 | ||||||||||||||||||||
Shares redeemed | (394,234,210) | (318,898,902) | (1,763,055,510) | (1,735,660,047) | ||||||||||||||||||||
|
|
|
|
|
|
|
|
|
|
|
| |||||||||||||
Net increase (decrease) in fund shares | (270,292,198) | 84,377,298 | (693,160,441) | (471,660,669) | ||||||||||||||||||||
|
|
|
|
|
|
|
|
|
|
|
| |||||||||||||
Shares outstanding at end of year | 424,049,209 | 694,341,407 | 3,446,644,876 | 4,139,805,317 | ||||||||||||||||||||
|
|
|
|
|
|
|
|
|
|
|
| |||||||||||||
TOTAL RETURN BOND FUND | ||||||||||||
CLASS I-2 | CLASS I-2 | |||||||||||
YEAR ENDED | YEAR ENDED MARCH 31, 2023 | |||||||||||
Change in Fund shares: | ||||||||||||
Shares outstanding at beginning of year | 11,005,199 | 16,736,662 | ||||||||||
|
|
|
|
|
| |||||||
Shares sold | 3,715,544 | 8,077,028 | ||||||||||
Shares issued through reinvestment of distributions | 410,856 | 490,417 | ||||||||||
Shares redeemed | (7,625,683) | (14,298,908) | ||||||||||
|
|
|
|
|
| |||||||
Net (decrease) in fund shares | (3,499,283) | (5,731,463) | ||||||||||
|
|
|
|
|
| |||||||
Shares outstanding at end of year | 7,505,916 | 11,005,199 | ||||||||||
|
|
|
|
|
| |||||||
| TOTAL RETURN BOND FUND | ||||||||||||||||||||||||
| ADMINISTRATIVE CLASS | ADMINISTRATIVE CLASS | PLAN CLASS | PLAN CLASS | |||||||||||||||||||||
| YEAR ENDED MARCH 31, 2024 | YEAR ENDED MARCH 31, 2023 | YEAR ENDED MARCH 31, 2024 | YEAR ENDED MARCH 31, 2023 | |||||||||||||||||||||
Change in Fund shares: | ||||||||||||||||||||||||
Shares outstanding at beginning of year | 166,912,987 | 192,601,234 | 2,026,068,357 | 2,324,492,622 | ||||||||||||||||||||
|
|
|
|
|
|
|
|
|
|
|
| |||||||||||||
Shares sold | 27,690,579 | 31,195,068 | 406,168,066 | 338,504,144 | ||||||||||||||||||||
Shares issued through reinvestment of distributions | 5,773,993 | 5,128,907 | 81,918,613 | 67,148,068 | ||||||||||||||||||||
Shares redeemed | (68,433,377) | (62,012,222) | (645,803,513) | (704,076,477) | ||||||||||||||||||||
|
|
|
|
|
|
|
|
|
|
|
| |||||||||||||
Net (decrease) in fund shares | (34,968,805) | (25,688,247) | (157,716,834) | (298,424,265) | ||||||||||||||||||||
|
|
|
|
|
|
|
|
|
|
|
| |||||||||||||
Shares outstanding at end of year | 131,944,182 | 166,912,987 | 1,868,351,523 | 2,026,068,357 | ||||||||||||||||||||
|
|
|
|
|
|
|
|
|
|
|
| |||||||||||||
ULTRA SHORT BOND FUND | ||||||||||||||||||||||||
CLASS M | CLASS M | CLASS I | CLASS I | |||||||||||||||||||||
| YEAR ENDED MARCH 31, 2024 | YEAR ENDED MARCH 31, 2023 | YEAR ENDED MARCH 31, 2024 | YEAR ENDED MARCH 31, 2023 | |||||||||||||||||||||
Change in Fund shares: | ||||||||||||||||||||||||
Shares outstanding at beginning of year | 4,875,363 | 9,455,483 | 24,795,459 | 37,852,952 | ||||||||||||||||||||
|
|
|
|
|
|
|
|
|
|
|
| |||||||||||||
Shares sold | 242,055 | 822,824 | 2,559,728 | 15,775,043 | ||||||||||||||||||||
Shares issued through reinvestment of distributions | 149,246 | 151,914 | 700,819 | 585,925 | ||||||||||||||||||||
Shares redeemed | (2,108,951) | (5,554,858) | (18,835,915) | (29,418,461) | ||||||||||||||||||||
|
|
|
|
|
|
|
|
|
|
|
| |||||||||||||
Net (decrease) in fund shares | (1,717,650) | (4,580,120) | (15,575,368) | (13,057,493) | ||||||||||||||||||||
|
|
|
|
|
|
|
|
|
|
|
| |||||||||||||
Shares outstanding at end of year | 3,157,713 | 4,875,363 | 9,220,091 | 24,795,459 | ||||||||||||||||||||
|
|
|
|
|
|
|
|
|
|
|
| |||||||||||||
347 / Annual Report March 2024
Table of Contents
Notes to Financial Statements (Continued)
UNCONSTRAINED BOND FUND | ||||||||||||||||||||||||
CLASS M | CLASS M | CLASS I | CLASS I | |||||||||||||||||||||
| YEAR ENDED MARCH 31, 2024 | YEAR ENDED MARCH 31, 2023 | YEAR ENDED MARCH 31, 2024 | YEAR ENDED MARCH 31, 2023 | |||||||||||||||||||||
Change in Fund shares: | ||||||||||||||||||||||||
Shares outstanding at beginning of year | 15,381,585 | 19,230,240 | 226,158,098 | 326,977,316 | ||||||||||||||||||||
|
|
|
|
|
|
|
|
|
|
|
| |||||||||||||
Shares sold | 2,154,982 | 2,686,340 | 66,379,966 | 97,731,807 | ||||||||||||||||||||
Shares issued through reinvestment of distributions | 926,172 | 864,124 | 9,994,952 | 10,194,594 | ||||||||||||||||||||
Shares redeemed | (4,717,241) | (7,399,119) | (104,984,028) | (208,745,619) | ||||||||||||||||||||
|
|
|
|
|
|
|
|
|
|
|
| |||||||||||||
Net (decrease) in fund shares | (1,636,087) | (3,848,655) | (28,609,110) | (100,819,218) | ||||||||||||||||||||
|
|
|
|
|
|
|
|
|
|
|
| |||||||||||||
Shares outstanding at end of year | 13,745,498 | 15,381,585 | 197,548,988 | 226,158,098 | ||||||||||||||||||||
|
|
|
|
|
|
|
|
|
|
|
| |||||||||||||
UNCONSTRAINED BOND FUND | ||||||||||||||||
PLAN CLASS | PLAN CLASS | |||||||||||||||
| YEAR ENDED MARCH 31, 2024 | YEAR ENDED MARCH 31, 2023 | |||||||||||||||
Change in Fund shares: | ||||||||||||||||
Shares outstanding at beginning of year | 33,873,600 | 10,805,285 | ||||||||||||||
|
|
|
|
|
| |||||||||||
Shares sold | 2,758,702 | 22,518,298 | ||||||||||||||
Shares issued through reinvestment of distributions | 2,492,578 | 1,610,878 | ||||||||||||||
Shares redeemed | (504,214) | (1,060,861) | ||||||||||||||
|
|
|
|
|
| |||||||||||
Net increase in fund shares | 4,747,066 | 23,068,315 | ||||||||||||||
|
|
|
|
|
| |||||||||||
Shares outstanding at end of year | 38,620,666 | 33,873,600 | ||||||||||||||
|
|
|
|
|
| |||||||||||
| 10. | SECURED BORROWINGS |
The contractual maturity of secured borrowings and type of collateral pledged as of March 31, 2024, are summarized in the following table:
| REMAINING CONTRACTUAL MATURITY OF THE AGREEMENTS | ||||||||||||||||||||||||
| SECURED BORROWINGS | COLLATERAL TYPE | OVERNIGHT AND CONTINUOUS | UP TO 30 DAYS | 31-90 DAYS | GREATER THAN 90 DAYS | TOTAL | ||||||||||||||||||
Total Return Bond Fund | ||||||||||||||||||||||||
Reverse repurchase agreements | U.S. Treasury Obligations | $ | — | $ | 1,501,250,000 | $ | — | $ | — | $ | 1,501,250,000 | |||||||||||||
|
|
|
|
|
|
|
|
|
| |||||||||||||||
Total borrowings | $ | — | $ | 1,501,250,000 | $ | — | $ | — | $ | 1,501,250,000 | ||||||||||||||
|
|
|
|
|
|
|
|
|
| |||||||||||||||
| 11. | FEDERAL TAX INFORMATION |
Capital Loss Carryforwards:
At March 31, 2024, the following Funds had available for federal income tax purposes unused capital losses as follows:
| FUND | AMOUNT UTILIZED IN CURRENT YEAR | SHORT-TERM NON-EXPIRING AMOUNTS* | LONG-TERM NON-EXPIRING AMOUNTS* | |||||||||
AlphaTrak 500 Fund | $ | 4,693,551 | $ | — | $ | — | ||||||
Corporate Bond Fund | — | 415,192 | 1,277,596 | |||||||||
Flexible Income Fund | — | 7,458,070 | 12,613,751 | |||||||||
Floating Rate Income Fund | — | 2,450,066 | 17,873,158 | |||||||||
High Yield Bond Fund | — | 35,125,757 | 59,819,642 | |||||||||
Intermediate Bond Fund | — | 71,039,833 | 22,708,450 | |||||||||
Investment Grade Credit Fund | — | 926,372 | 837,187 | |||||||||
Low Duration Bond Fund | — | 125,906,896 | 67,837,058 | |||||||||
Opportunistic High Income Credit Fund | — | 224,425 | 398,457 | |||||||||
Strategic Income Fund | — | 907,781 | 3,880,909 | |||||||||
Sustainable Securitized Fund | — | 431,669 | 1,031,647 | |||||||||
Total Return Bond Fund | — | 7,378,995,390 | 4,009,125,319 | |||||||||
Ultra Short Bond Fund | — | 7,192,997 | 5,493,662 | |||||||||
Unconstrained Bond Fund | — | 105,614,754 | 93,619,253 | |||||||||
| * | Under the Modernization Act of 2010, capital losses incurred by the Funds after March 31, 2011 will not be subject to expiration. In addition, these losses must be utilized prior to the losses incurred in the years preceding enactment. |
Annual Report March 2024 / 348
Table of Contents
Notes to Financial Statements (Continued)
Tax Basis of Distributable Income:
As of March 31, 2024, the components of accumulated earnings (accumulated losses) on a tax basis were as follows:
| ALPHATRAK 500 FUND | CORPORATE BOND FUND | FLEXIBLE INCOME FUND | FLOATING RATE INCOME FUND | HIGH YIELD BOND FUND | INTERMEDIATE BOND FUND | |||||||||||||||||||||
Undistributed ordinary income (inclusive of short-term gains) | $ | 82,635 | $ | 533 | $ | — | $ | 671,369 | $ | 2,925,302 | $ | 923,620 | ||||||||||||||
Undistributed long-term gains | 134,255 | — | — | — | — | — | ||||||||||||||||||||
Other temporary differences | (177 | ) | (270 | ) | (81,977 | ) | (520,482 | ) | (407,701 | ) | (471,568) | |||||||||||||||
Accumulated capital loss carryforwards and post- October losses | — | (1,817,448 | ) | (20,079,848 | ) | (22,106,088 | ) | (100,601,386 | ) | (93,748,283) | ||||||||||||||||
Net unrealized appreciation (depreciation) | 141,143 | (706,962 | ) | (35,466,056 | ) | (2,926,054 | ) | (38,949,724 | ) | (11,491,275) | ||||||||||||||||
|
|
|
|
|
|
|
|
|
|
|
|
| ||||||||||||||
Total accumulated earnings (losses) | $ | 357,856 | $ | (2,524,147 | ) | $ | (55,627,881 | ) | $ | (24,881,255 | ) | $ | (137,033,509 | ) | $ | (104,787,506) | ||||||||||
|
|
|
|
|
|
|
|
|
|
|
|
| ||||||||||||||
| INVESTMENT GRADE CREDIT FUND | LOW DURATION BOND FUND | OPPORTUNISTIC HIGH INCOME CREDIT FUND | STRATEGIC INCOME FUND | SUSTAINABLE SECURITIZED FUND | TOTAL RETURN BOND FUND | |||||||||||||||||||||
Undistributed ordinary income (inclusive of short-term gains) | $ | 274 | $ | 799,885 | $ | — | $ | 222,255 | $ | — | $ | 23,220,802 | ||||||||||||||
Undistributed long-term gains | — | — | — | — | — | — | ||||||||||||||||||||
Other temporary differences | (333 | ) | (503,105 | ) | 286 | (1,633 | ) | — | (12,075,245 | ) | ||||||||||||||||
Accumulated capital loss carryforwards and post- | ||||||||||||||||||||||||||
October losses | (2,073,601 | ) | (193,743,954 | ) | (655,910 | ) | (4,928,361 | ) | (1,463,316 | ) | (11,388,120,709 | ) | ||||||||||||||
Net unrealized appreciation (depreciation) | (1,363,006 | ) | (22,673,025 | ) | (171,789 | ) | (6,813,368 | ) | (395,151 | ) | (2,519,930,895 | ) | ||||||||||||||
|
|
|
|
|
|
|
|
|
|
|
|
| ||||||||||||||
Total accumulated earnings (losses) | $ | (3,436,666 | ) | $ | (216,120,199 | ) | $ | (827,413 | ) | $ | (11,521,107 | ) | $ | (1,858,467 | ) | $ | (13,896,906,047 | ) | ||||||||
|
|
|
|
|
|
|
|
|
|
|
|
| ||||||||||||||
349 / Annual Report March 2024
Table of Contents
Notes to Financial Statements (Continued)
| ULTRA SHORT BOND FUND | UNCONSTRAINED BOND FUND | |||||||
Undistributed ordinary income (inclusive of short-term gains) | $ | 83,015 | $ | — | ||||
Undistributed long-term gains | — | — | ||||||
Other temporary differences | (951) | (2,325,905) | ||||||
Accumulated capital loss carryforwards and post-October losses | (12,686,659) | (211,757,963) | ||||||
Net unrealized appreciation (depreciation) | (698,599) | (352,833,121) | ||||||
|
|
|
| |||||
Total accumulated earnings (losses) | $ | (13,303,194) | $ | (566,916,989) | ||||
|
|
|
| |||||
Permanent differences incurred during the fiscal year ended March 31, 2024, resulting from differences in book and tax accounting have been reclassified at year-end as follows:
| FUND | INCREASE (DECREASE) ACCUMULATED EARNINGS (LOSS) | INCREASE (DECREASE) PAID-IN-CAPITAL | ||||||
Opportunistic High Income Credit Fund | $ | 2,064 | $ | (2,064 | ) | |||
The permanent differences are due to non-deductible expenses and taxable over distributions.
Tax Basis of Distributions to Shareholders:
| ALPHATRAK 500 FUND | CORPORATE BOND FUND | |||||||||||||||
| MARCH 31, 2024 | MARCH 31, 2023 | MARCH 31, 2024 | MARCH 31, 2023 | |||||||||||||
| Distributions from: | ||||||||||||||||
Ordinary income (inclusive of short-term capital gains) | $ | 1,228,636 | $ | 888,057 | $ | 216,869 | $ | 283,604 | ||||||||
Net long-term capital gains | — | 537,219 | — | — | ||||||||||||
|
|
|
|
|
|
|
|
|
|
|
| |||||
Total taxable distributions | $ | 1,228,636 | $ | 1,425,276 | $ | 216,869 | $ | 283,604 | ||||||||
|
|
|
|
|
|
|
|
|
|
|
| |||||
| FLEXIBLE INCOME FUND | FLOATING RATE INCOME FUND | |||||||||||||||
| MARCH 31, 2024 | MARCH 31, 2023 | MARCH 31, 2024 | MARCH 31, 2023 | |||||||||||||
| Distributions from: | ||||||||||||||||
Ordinary income (inclusive of short-term capital gains) | $ | 26,860,706 | $ | 22,045,745 | $ | 29,757,265 | $ | 25,266,781 | ||||||||
|
|
|
|
|
|
|
|
|
|
|
| |||||
Total taxable distributions | $ | 26,860,706 | $ | 22,045,745 | $ | 29,757,265 | $ | 25,266,781 | ||||||||
|
|
|
|
|
|
|
|
|
|
|
| |||||
| HIGH YIELD BOND FUND | INTERMEDIATE BOND FUND | |||||||||||||||
| MARCH 31, 2024 | MARCH 31, 2023 | MARCH 31, 2024 | MARCH 31, 2023 | |||||||||||||
| Distributions from: | ||||||||||||||||
Ordinary income (inclusive of short-term capital gains) | $ | 33,524,300 | $ | 31,729,934 | $ | 41,555,931 | $ | 26,787,772 | ||||||||
|
|
|
|
|
|
|
|
|
|
|
| |||||
Total taxable distributions | $ | 33,524,300 | $ | 31,729,934 | $ | 41,555,931 | $ | 26,787,772 | ||||||||
|
|
|
|
|
|
|
|
|
|
|
| |||||
| INVESTMENT GRADE CREDIT FUND | LOW DURATION BOND FUND | |||||||||||||||
| MARCH 31, 2024 | MARCH 31, 2023 | MARCH 31, 2024 | MARCH 31, 2023 | |||||||||||||
| Distributions from: | ||||||||||||||||
Ordinary income (inclusive of short-term capital gains) | $ | 720,676 | $ | 770,112 | $ | 62,279,679 | $ | 61,930,890 | ||||||||
Return of Capital | — | 24,661 | — | — | ||||||||||||
|
|
|
|
|
|
|
|
|
|
|
| |||||
Total taxable distributions | $ | 720,676 | $ | 794,773 | $ | 62,279,679 | $ | 61,930,890 | ||||||||
|
|
|
|
|
|
|
|
|
|
|
| |||||
Annual Report March 2024 / 350
Table of Contents
Notes to Financial Statements (Continued)
| OPPORTUNISTIC HIGH INCOME CREDIT FUND | STRATEGIC INCOME FUND | |||||||||||||||
| MARCH 31, 2024 | MARCH 31, 2023 | MARCH 31, 2024 | MARCH 31, 2023 | |||||||||||||
| Distributions from: | ||||||||||||||||
Ordinary income (inclusive of short-term capital gains) | $ | 142,390 | $ | 270,955 | $ | 5,299,041 | $ | 3,713,024 | ||||||||
Return of Capital | — | 7,781 | — | — | ||||||||||||
|
|
|
|
|
|
|
|
|
|
|
| |||||
Total taxable distributions | $ | 142,390 | $ | 278,736 | $ | 5,299,041 | $ | 3,713,024 | ||||||||
|
|
|
|
|
|
|
|
|
|
|
| |||||
| SUSTAINABLE SECURITIZED FUND | TOTAL RETURN BOND FUND | |||||||||||||||
| MARCH 31, 2024 | MARCH 31, 2023 | MARCH 31, 2024 | MARCH 31, 2023 | |||||||||||||
| Distributions from: | ||||||||||||||||
Ordinary income (inclusive of short-term capital gains) | $ | 365,955 | $ | 324,338 | $ | 2,515,216,896 | $ | 2,163,571,272 | ||||||||
Return of Capital | 40,424 | — | — | — | ||||||||||||
|
|
|
|
|
|
|
|
|
|
|
| |||||
Total taxable distributions | $ | 406,379 | $ | 324,338 | $ | 2,515,216,896 | $ | 2,163,571,272 | ||||||||
|
|
|
|
|
|
|
|
|
|
|
| |||||
| ULTRA SHORT BOND FUND | UNCONSTRAINED BOND FUND | |||||||||||||||
| MARCH 31, 2024 | MARCH 31, 2023 | MARCH 31, 2024 | MARCH 31, 2023 | |||||||||||||
| Distributions from: | ||||||||||||||||
Ordinary income (inclusive of short-term capital gains) | $ | 3,495,122 | $ | 3,041,991 | $ | 178,292,972 | $ | 170,616,814 | ||||||||
Return of Capital | — | — | 1,643,452 | — | ||||||||||||
|
|
|
|
|
|
|
|
|
|
|
| |||||
Total taxable distributions | $ | 3,495,122 | $ | 3,041,991 | $ | 179,936,424 | $ | 170,616,814 | ||||||||
|
|
|
|
|
|
|
|
|
|
|
| |||||
Tax Cost
As of March 31, 2024, gross unrealized appreciation (depreciation) based on cost for federal income tax purposes were as follows:
| ALPHATRAK 500 FUND | CORPORATE BOND FUND | FLEXIBLE INCOME FUND | FLOATING RATE INCOME FUND | HIGH YIELD BOND FUND | INTERMEDIATE BOND FUND | |||||||||||||||||||||
Tax Cost | $ | 33,581,271 | $ | 6,017,433 | $ | 474,247,134 | $ | 315,999,120 | $ | 500,906,693 | $ | 1,171,004,929 | ||||||||||||||
Gross unrealized appreciation | 917,364 | 40,789 | 6,893,451 | 3,334,929 | 9,024,943 | 5,519,589 | ||||||||||||||||||||
Gross unrealized (depreciation) | (776,221 | ) | (748,649 | ) | (42,361,108 | ) | (6,269,000 | ) | (47,978,292 | ) | (17,010,407 | ) | ||||||||||||||
|
|
|
|
|
|
|
|
|
|
|
|
|
|
|
|
|
| |||||||||
Net unrealized appreciation (depreciation) | $ | 141,143 | $ | (707,860 | ) | $ | (35,467,657 | ) | $ | (2,934,071 | ) | $ | (38,953,349 | ) | $ | (11,490,818 | ) | |||||||||
|
|
|
|
|
|
|
|
|
|
|
|
|
|
|
|
|
| |||||||||
| INVESTMENT GRADE CREDIT FUND | LOW DURATION BOND FUND | OPPORTUNISTIC HIGH INCOME CREDIT FUND | STRATEGIC INCOME FUND | SUSTAINABLE SECURITIZED FUND | TOTAL RETURN BOND FUND | |||||||||||||||||||||
Tax Cost | $ | 31,765,879 | $ | 1,721,436,358 | $ | 1,691,473 | $ | 93,846,795 | $ | 9,973,615 | $ | 68,682,453,807 | ||||||||||||||
Gross unrealized appreciation | 154,419 | 7,150,199 | 105,034 | 1,316,918 | 89,706 | 335,239,467 | ||||||||||||||||||||
Gross unrealized (depreciation) | (1,518,230 | ) | (29,821,833 | ) | (276,823 | ) | (8,122,728 | ) | (484,859 | ) | (2,863,947,449 | ) | ||||||||||||||
|
|
|
|
|
|
|
|
|
|
|
|
|
|
|
|
|
| |||||||||
Net unrealized appreciation (depreciation) | $ | (1,363,811) | $ | (22,671,634) | $ | (171,789 | ) | $ | (6,805,810 | ) | $ | (395,153 | ) | $ | (2,528,707,982 | ) | ||||||||||
|
|
|
|
|
|
|
|
|
|
|
|
|
|
|
|
|
| |||||||||
| ULTRA SHORT BOND FUND | UNCONSTRAINED BOND FUND | |||||||||||||||||||||||||
Tax Cost |
| $ | 68,005,399 | $ | 3,337,137,514 | |||||||||||||||||||||
Gross unrealized appreciation |
| 220,819 | 34,156,617 | |||||||||||||||||||||||
Gross unrealized (depreciation) |
| (919,369 | ) | (387,257,425 | ) | |||||||||||||||||||||
|
|
|
|
|
| |||||||||||||||||||||
Net unrealized appreciation (depreciation) |
| $ | (698,550 | ) | $ | (353,100,808 | ) | |||||||||||||||||||
|
|
|
|
|
| |||||||||||||||||||||
351 / Annual Report March 2024
Table of Contents
Notes to Financial Statements (Continued)
| 12. | COMMITTED LINE OF CREDIT |
The Funds have entered into a $350,000,000 committed revolving line of credit agreement with The Bank of New York Mellon (the “Bank”) for temporary borrowing purposes with an expiration date of October 4, 2024. The interest rate on borrowing is the higher of the federal funds rate or SOFR plus 0.10%, plus 1.25%. There were no borrowings from the line of credit as of or during the year ended March 31, 2024. The Funds pay the Bank a commitment fee equal to 0.15% per annum on the daily unused portion of the committed line amount. The commitment fees incurred by the Funds are presented in the Statements of Operations. The commitment fees are allocated to each applicable portfolio in proportion to its relative average daily net assets and the interest expenses are charged directly to the applicable portfolio.
| 13. | INDEMNIFICATIONS |
Under the Funds’ organizational documents, its officers and trustees are indemnified against certain liability arising out of the performance of their duties to the Funds. In addition, in the normal course of business, the Funds enter into contracts with their vendors and others that provide general indemnification. The Funds’ maximum exposure under these arrangements is unknown, as this would involve further claims that may be made against the Funds. However, based on experience, the Funds expect the risk of loss to be remote.
| 14. | NEW ACCOUNTING PRONOUNCEMENT |
In January 2021, the Financial Accounting Standards Board issued Accounting Standards Update No. 2021-01 (“ASU 2021-01”), “Reference Rate Reform (Topic 848).” ASU 2021-01 is an update of ASU 2020-04, which is in response to concerns about structural risks of interbank offered rates, and particularly the risk of cessation of LIBOR; regulators have undertaken reference rate reform initiatives to identify alternative reference rates that are more observable or transaction based and less susceptible to manipulation. ASU 2020-04 provides optional guidance for a limited period of time to ease the potential burden in accounting for (or recognizing the effects of) reference rate reform on financial reporting. ASU 2020-04 is elective and applies to all entities, subject to meeting certain criteria, that have contracts, hedging relationships, and other transactions that reference LIBOR or another reference rate expected to be discontinued because of reference rate reform. The ASU 2021-01 update clarifies that certain optional expedients and exceptions in Topic 848 for contract modifications and hedge accounting apply to derivatives that are affected by the discounting transition. In December 2022, the FASB issued ASU No. 2022-06, Reference Rate Reform (Topic 848): Deferral of the Sunset Date of Topic 848, which deferred the sunset day of this guidance to December 31, 2024. The amendments in this update are in effect for the Funds. There have been no impacts to date.
In June 2022, the FASB issued ASU No. 2022-03, “Fair Value Measurement of Equity Securities Subject to Contractual Sale Restrictions” (“ASU 2022-03”). ASU 2022-03 (1) clarifies the guidance in ASC 820 on the fair value measurement of an equity security that is subject to a contractual sale restriction and (2) requires specific disclosures related to such an equity security. ASU 2022-03 is effective for fiscal years beginning after December 15, 2023 and interim periods within that fiscal year, with early adoption permitted. There have been no impacts to date.
Annual Report March 2024 / 352
Table of Contents
Report of Independent Registered Public Accounting Firm
To the Shareholders and the Board of Trustees of
The Metropolitan West Funds
Opinion on the Financial Statements and Financial Highlights
We have audited the accompanying statements of assets and liabilities of Metropolitan West Funds (the “Trust”) comprising the Metropolitan West AlphaTrak 500 Fund, Metropolitan West Corporate Bond Fund, Metropolitan West Sustainable Securitized Fund (formerly known as Metropolitan West ESG Securitized Fund), Metropolitan West Flexible Income Fund, Metropolitan West Floating Rate Income Fund, Metropolitan West High Yield Bond Fund, Metropolitan West Intermediate Bond Fund, Metropolitan West Investment Grade Credit Fund, Metropolitan West Low Duration Bond Fund, Metropolitan West Opportunistic High Income Credit Fund, Metropolitan West Strategic Income Fund, Metropolitan West Total Return Bond Fund, Metropolitan West Ultra Short Bond Fund, and Metropolitan West Unconstrained Bond Fund (the “Funds”), including the schedules of portfolio investments, as of March 31, 2024, the related statements of operations for the year then ended, the statements of changes in net assets for each of the two years in the period then ended, and the financial highlights for each of the five years in the period then ended for the Funds, except Metropolitan West Opportunistic High Income Credit Fund and Metropolitan West Sustainable Securitized Fund; the related statements of operations, changes in net assets, and financial highlights for the periods indicated in the table below for Metropolitan West Opportunistic High Income Credit Fund and Metropolitan West Sustainable Securitized Fund, and the related notes.
In our opinion, the financial statements and financial highlights present fairly, in all material respects, the financial position of each of the Funds listed above constituting Metropolitan West Funds as of March 31, 2024, and the results of their operations for the year then ended, the changes in their net assets for each of the two years in the period then ended, and the financial highlights for each of the five years in the period then ended (or for the period listed in the table below) in conformity with accounting principles generally accepted in the United States of America.
Individual Fund Comprising the Metropolitan West Funds
| Statement of Operations
| Statement of Changes in Net Assets
| Financial Highlights
| |||
Metropolitan West Opportunistic High Income Credit Fund | For the year ended March 31, 2024 | For the years ended March 31, 2024 and 2023 | For the years ended March 31, 2024 and 2023, and the period from August 2, 2021 (commencement of operations) through March 31, 2022 | |||
Metropolitan West Sustainable Securitized Fund | For the year ended March 31, 2024 | For the years ended March 31, 2024 and 2023 | For the years ended March 31, 2024 and 2023, and the period from October 1, 2021 (commencement of operations) through March 31, 2022 | |||
Basis for Opinion
These financial statements and financial highlights are the responsibility of the Funds’ management. Our responsibility is to express an opinion on the Funds’ financial statements and financial highlights based on our audits. We are a public accounting firm registered with the Public Company Accounting Oversight Board (United States) (PCAOB) and are required to be independent with respect to the Funds in accordance with the U.S. federal securities laws and the applicable rules and regulations of the Securities and Exchange Commission and the PCAOB.
We conducted our audits in accordance with the standards of the PCAOB. Those standards require that we plan and perform the audit to obtain reasonable assurance about whether the financial statements and financial highlights are free of material misstatement, whether due to error or fraud. The Funds are not required to have, nor were we engaged to perform, an audit of their internal control over financial reporting. As part of our audits, we are required to obtain an understanding of internal control over financial reporting but not for the purpose of expressing an opinion on the effectiveness of the Funds’ internal control over financial reporting. Accordingly, we express no such opinion.
353 / Annual Report March 2024
Table of Contents
Our audits included performing procedures to assess the risks of material misstatement of the financial statements and financial highlights, whether due to error or fraud, and performing procedures that respond to those risks. Such procedures included examining, on a test basis, evidence regarding the amounts and disclosures in the financial statements and financial highlights. Our audits also included evaluating the accounting principles used and significant estimates made by management, as well as evaluating the overall presentation of the financial statements and financial highlights. Our procedures included confirmation of securities owned as of March 31, 2024, by correspondence with the custodian, brokers, and agent banks; when replies were not received from brokers and agent banks, we performed other auditing procedures. We believe that our audits provide a reasonable basis for our opinion.

Los Angeles, California
May 24, 2024
We have served as the auditor of one or more TCW/Metropolitan West Funds investment companies since 1990.
Annual Report March 2024 / 354
Table of Contents
Tax Information Notice
(Unaudited)
For shareholders that do not have a March 31, 2024 tax year end, this notice is for informational purposes only. For shareholders with a March 31, 2024 tax year end, please consult your tax advisor as to the pertinence of this notice. For the fiscal year ended March 31, 2024, each portfolio is reporting the following items with regard to distributions paid during the year. All information is based on financial information available as of the date of this annual report and, accordingly is subject to change. For each item, it is the intention of the Fund to report the maximum amount permitted under the Internal Revenue Code and the regulations thereunder.
| ALPHATRAK 500 FUND | CORPORATE FUND | FLEXIBLE FUND | FLOATING RATE INCOME FUND | HIGH YIELD BOND FUND | INTERMEDIATE BOND FUND | |||||||||||||||||||
Net Investment Income Distributions | 100.00 | % | 100.00 | % | 100.00 | % | 100.00 | % | 100.00 | % | 100.00 | % | ||||||||||||
Short-Term Capital Gain Distributions | 0.00 | % | 0.00 | % | 0.00 | % | 0.00 | % | 0.00 | % | 0.00 | % | ||||||||||||
Long-Term Capital Gain Distributions | 0.00 | % | 0.00 | % | 0.00 | % | 0.00 | % | 0.00 | % | 0.00 | % | ||||||||||||
Return of Capital | 0.00 | % | 0.00 | % | 0.00 | % | 0.00 | % | 0.00 | % | 0.00 | % | ||||||||||||
Tax-Exempt Interest | 0.00 | % | 0.00 | % | 0.00 | % | 0.00 | % | 0.00 | % | 0.00 | % | ||||||||||||
Qualifying For Corporate Dividends Rec Deduction (1) | 0.00 | % | 0.00 | % | 0.00 | % | 0.00 | % | 0.00 | % | 0.07 | % | ||||||||||||
Qualifying Dividend Income (2) | 0.00 | % | 0.00 | % | 0.00 | % | 0.00 | % | 0.00 | % | 0.00 | % | ||||||||||||
U.S. Government Interest (3) | 19.74 | % | 8.22 | % | 2.96 | % | 2.36 | % | 3.18 | % | 43.56 | % | ||||||||||||
Foreign Tax Credit (4) | 0.00 | % | 0.00 | % | 0.00 | % | 0.00 | % | 0.00 | % | 0.00 | % | ||||||||||||
Qualified Interest Income (5) | 78.95 | % | 86.35 | % | 86.59 | % | 98.50 | % | 87.45 | % | 86.00 | % | ||||||||||||
Qualified Short-Term Capital Gain (6) | 0.00 | % | 0.00 | % | 0.00 | % | 0.00 | % | 0.00 | % | 0.00 | % | ||||||||||||
| INVESTMENT GRADE CREDIT FUND | LOW DURATION BOND FUND | OPPORTUNISTIC HIGH INCOME CREDIT FUND | STRATEGIC INCOME FUND | SUSTAINABLE SECURITIZED FUND | TOTAL RETURN BOND FUND | |||||||||||||||||||
Net Investment Income Distributions | 100.00 | % | 100.00 | % | 100.00 | % | 100.00 | % | 90.95 | % | 100.00 | % | ||||||||||||
Short-Term Capital Gain Distributions | 0.00 | % | 0.00 | % | 0.00 | % | 0.00 | % | 0.00 | % | 0.00 | % | ||||||||||||
Long-Term Capital Gain Distributions | 0.00 | % | 0.00 | % | 0.00 | % | 0.00 | % | 0.00 | % | 0.00 | % | ||||||||||||
Return of Capital | 0.00 | % | 0.00 | % | 0.00 | % | 0.00 | % | 9.05 | % | 0.00 | % | ||||||||||||
Tax-Exempt Interest | 0.00 | % | 0.00 | % | 0.00 | % | 0.00 | % | 0.00 | % | 0.00 | % | ||||||||||||
Qualifying For Corporate Dividends Rec Deduction (1) | 0.00 | % | 0.00 | % | 2.05 | % | 0.00 | % | 0.00 | % | 0.00 | % | ||||||||||||
Qualifying Dividend Income (2) | 0.00 | % | 0.00 | % | 2.02 | % | 0.00 | % | 0.00 | % | 0.00 | % | ||||||||||||
U.S. Government Interest (3) | 16.79 | % | 19.35 | % | 1.95 | % | 11.40 | % | 3.61 | % | 30.64 | % | ||||||||||||
Foreign Tax Credit (4) | 0.00 | % | 0.00 | % | 0.00 | % | 0.00 | % | 0.00 | % | 0.00 | % | ||||||||||||
Qualified Interest Income (5) | 98.40 | % | 87.19 | % | 85.17 | % | 84.95 | % | 94.44 | % | 85.31 | % | ||||||||||||
Qualified Short-Term Capital Gain (6) | 0.00 | % | 0.00 | % | 0.00 | % | 0.00 | % | 0.00 | % | 0.00 | % | ||||||||||||
| ULTRA SHORT BOND FUND | UNCONSTRAINED BOND FUND | |||||||||||||||||||||||
Net Investment Income Distributions | 100.00 | % | 99.09 | % | ||||||||||||||||||||
Short-Term Capital Gain Distributions | 0.00 | % | 0.00 | % | ||||||||||||||||||||
Long-Term Capital Gain Distributions | 0.00 | % | 0.00 | % | ||||||||||||||||||||
Return of Capital | 0.00 | % | 0.91 | % | ||||||||||||||||||||
Tax-Exempt Interest | 0.00 | % | 0.00 | % | ||||||||||||||||||||
Qualifying For Corporate Dividends Rec Deduction (1) | 0.00 | % | 0.00 | % | ||||||||||||||||||||
Qualifying Dividend Income (2) | 0.00 | % | 0.00 | % | ||||||||||||||||||||
U.S. Government Interest (3) | 33.69 | % | 4.12 | % | ||||||||||||||||||||
Foreign Tax Credit (4) | 0.00 | % | 0.00 | % | ||||||||||||||||||||
Qualified Interest Income (5) | 89.43 | % | 82.48 | % | ||||||||||||||||||||
Qualified Short-Term Capital Gain (6) | 0.00 | % | 0.00 | % | ||||||||||||||||||||
355 / Annual Report March 2024
Table of Contents
| (1) | Qualifying dividends represent dividends which qualify for the corporate dividends received deduction and is reflected as a percentage of ordinary income distributions (the total of short-term capital gain and net investment income distributions). |
| (2) | The percentage in this column represents the amount of “Qualifying Dividend Income” as created by the Jobs and Growth Tax Relief Reconciliation Act of 2003 and is reflected as a percentage of ordinary income distributions (the total of short-term capital gain and net investment income distributions). |
| (3) | “U.S. Government Interest” represents the amount of interest that was derived from direct U.S. government obligations and distributed during the fiscal year. This amount is reflected as a percentage of total ordinary income distributions (the total of short-term capital gain and net investment income distributions). Generally, interest from direct U.S. government obligations is exempt from state income tax. However, for residents of California, Connecticut and New York, the statutory threshold requirements were not satisfied to permit exemption of these amounts from state income for this fund. |
| (4) | Foreign Tax Credit represents dividends which qualify for the foreign tax credit pass through and is reflected as a percentage of investment company taxable income (the total of short-term capital gain and net investment income). |
| (5) | The percentage in this column represents the amount of “Qualifying Interest Income” as created by The American Jobs Creation Act of 2004. The information is reflected as a percentage of net investment income distributions. |
| (6) | The percentage in this column represents the amount of “Qualifying Short Term Capital Gain” as created by The American Jobs Creation Act of 2004. The information is reflected as a percentage of short-term capital gain distributions. |
Annual Report March 2024 / 356
Table of Contents
Liquidity Risk Management Program (Unaudited)
Rule 22e-4 under the 1940 Act (the “Liquidity Rule”) requires that all registered open-end management investment companies, including the Funds, establish a written liquidity risk management program (a “Liquidity Program”). Under a fund’s Liquidity Program, a fund must assess, manage and periodically review the fund’s liquidity risk, classify the liquidity of each of the fund’s portfolio investments, determine whether to specify highly liquid investment minimum (and, if so, at what level), limit illiquid investments to 15% of fund investments, and establish policies and procedures regarding how and when a fund will engage in redemptions in-kind. Consistent with the Liquidity Rule, the Board has approved the written Liquidity Program for the Funds and has designated a committee of professionals associated with the Adviser to administer the Funds’ Liquidity Program (the “Program Administrator”).
On March 4, 2024, the Board reviewed the Program Administrator’s written annual report (the “Report”) concerning the operation of the Funds’ Liquidity Program for the calendar year ended December 31, 2023 (the “Reporting Period”). The Report addressed the operation of the Liquidity Program and assessed its adequacy and effectiveness of implementation, including, where applicable, the operation of a Fund’s Highly Liquidity Investment Minimum (“HLIM”). The Report discussed, among other things: (1) the liquidity risk framework used to assess, manage, and periodically review each Fund’s liquidity risk and the results of this assessment; (2) the methodology and inputs for classifying each of the Fund’s investments into liquidity categories that reflect an estimate of their liquidity under current market conditions; (3) whether a Fund invested primarily in “Highly Liquid Investments” (as defined under the Liquidity Rule) and the operation and monitoring of the HLIM assigned to a Fund, as applicable; (4) whether a Fund invested more than 15% of its assets in “Illiquid Investments” (as defined under the Liquidity Rule) and the procedures for monitoring for this limit; and (5) the results of stress tests designed to assess liquidity under a hypothetical stressed scenario involving elevated redemptions. The Report concluded that the Liquidity Program was reasonably designed to assess and manage each Fund’s liquidity risk and was adequately and effectively implemented with respect to each Fund during the Reporting Period.
There can be no assurance that the Liquidity Program will achieve its objectives in the future. Please refer to your Fund’s prospectus for more information regarding the Fund’s exposure to liquidity risk and other principal risks to which an investment in the Fund may be subject.
357 / Annual Report March 2024
Table of Contents
Special Meeting of Shareholders - Voting Results
(Unaudited)
On February 15, 2024, the Trust held a Special Meeting of Shareholders to elect nine Trustees of the Trust. Shareholders of record on January 5, 2024 were entitled to vote on the proposal to elect Trustees. All Funds voted together. Each nominee for Trustee named below was elected and will hold office until his or her successor has been duly elected and qualified. The following votes were recorded:
PROPOSAL 1: Election of Trustees
| Trustee Nominee | Shares Voted For | Shares Withheld | ||||||
Patrick C. Haden | 3,578,921,036 | 15,612,583 | ||||||
Martin Luther King III | 3,566,345,875 | 18,046,145 | ||||||
Megan McClellan | 3,566,345,875 | 14,965,129 | ||||||
Peter McMillan | 3,557,018,646 | 16,143,673 | ||||||
Patrick Moore | 3,576,854,622 | 16,251,942 | ||||||
Victoria B. Rogers | 3,580,899,550 | 15,889,336 | ||||||
Robert G. Rooney | 3,558,907,823 | 16,075,647 | ||||||
Michael Swell | 3,582,395,433 | 16,056,576 | ||||||
Andrew Tarica | 3,557,067,023 | 16,717,196 | ||||||
Annual Report March 2024 / 358
Table of Contents
Reorganization of Certain Funds into ETFs
(Unaudited)
On April 8, 2024, the Board of Trustees of the Trust, having determined that a reorganization of each of the following Funds would be in the best interest of the Fund and its shareholders, voted to approve a form of Agreement and Plan of Reorganization to reorganize each Fund with and into a newly-created exchange-traded fund (“ETF”), which will be a series of TCW ETF Trust, as specified below:
| Metropolitan West Fund | New ETF | ||||||
| MetWest Floating Rate Income Fund | g | TCW Senior Loan ETF | |||||
| MetWest Investment Grade Credit Fund | g | TCW Investment Grade Credit ETF | |||||
| MetWest Flexible Income Fund | g | TCW Flexible Income ETF | |||||
Pursuant to applicable law (including the Investment Company Act of 1940) each reorganization may be implemented without shareholder approval. Each reorganization is expected to occur in September 2024 and is expected to be a tax-free reorganization for U.S. federal income tax purposes. Additional information about each reorganization will be made available to shareholders of the applicable Fund in a combined information statement/prospectus prior to the reorganization date.
359 / Annual Report March 2024
Table of Contents
Privacy Policy
The TCW Group, Inc. and Subsidiaries TCW Investment Management Company LLC TCW Asset Management Company LLC Metropolitan West Asset Management, LLC | ||||
| TCW Funds, Inc. | Sepulveda Management LLC | TCW Direct Lending VIII LLC | ||
| TCW Strategic Income Fund, Inc. | TCW Direct Lending LLC | TCW Star Direct Lending LLC | ||
| Metropolitan West Funds | TCW Direct Lending VII LLC | TCW ETF TRUST | ||
Effective January 2024
| WHAT YOU SHOULD KNOW |
At TCW, we recognize the importance of keeping information about you secure and confidential. We do not sell or share your nonpublic personal and financial information with marketers or others outside our affiliated group of companies.
We carefully manage information among our affiliated group of companies to safeguard your privacy and to provide you with consistently excellent service.
We are providing this notice to you to comply with the requirements of Regulation S-P, “Privacy of Consumer Financial Information,” issued by the United States Securities and Exchange Commission.
| OUR PRIVACY POLICY |
We, The TCW Group, Inc. and its subsidiaries, the TCW Funds, Inc., TCW Strategic Income Fund, Inc., the Metropolitan West Funds, Sepulveda Management LLC, TCW Direct Lending LLC, TCW Direct Lending VII LLC, TCW Direct Lending VIII LLC, TCW Star Direct Lending LLC, and TCW ETF TRUST (collectively, “TCW”) are committed to protecting the nonpublic personal and financial information of our customers and consumers who obtain or seek to obtain financial products or services primarily for personal, family or household purposes. We fulfill our commitment by establishing and implementing policies and systems to protect the security and confidentiality of this information.
In our offices, we limit access to nonpublic personal and financial information about you to those TCW personnel who need to know the information in order to provide products or services to you. We maintain physical, electronic, and procedural safeguards to protect your nonpublic personal and financial information.
| CATEGORIES OF INFORMATION WE COLLECT |
We may collect the following types of nonpublic personal and financial information about you from the following sources:
| • | Your name, address and identifying numbers, and other personal and financial information, from you and from identification cards and papers you submit to us, on applications, subscription agreements or other forms or communications. |
| • | Information about your account balances and financial transactions with us, our affiliated entities, or nonaffiliated third parties, from our internal sources, from affiliated entities and from nonaffiliated third parties. |
| • | Information about your account balances and financial transactions and other personal and financial information, from consumer credit reporting agencies or other nonaffiliated third parties, to verify information received from you or others. |
| CATEGORIES OF INFORMATION WE DISCLOSE TO NONAFFILIATED THIRD PARTIES |
We may disclose your name, address and account and other identifying numbers, as well as information about your pending or past transactions and other personal financial information, to nonaffiliated third parties, for our everyday business purposes such as necessary to execute, process, service and confirm your securities transactions and mutual fund transactions, to administer and service your account and commingled investment vehicles in which you are invested, to market our products and services through joint marketing arrangements or to respond to court orders and legal investigations.
Annual Report March 2024 / 360
Table of Contents
We may disclose nonpublic personal and financial information concerning you to law enforcement agencies, federal regulatory agencies, self-regulatory organizations or other nonaffiliated third parties, if required or requested to do so by a court order, judicial subpoena or regulatory inquiry.
We do not otherwise disclose your nonpublic personal and financial information to nonaffiliated third parties, except where we believe in good faith that disclosure is required or permitted by law. Because we do not disclose your nonpublic personal and financial information to nonaffiliated third parties, our Customer Privacy Policy does not contain opt-out provisions.
| CATEGORIES OF INFORMATION WE DISCLOSE TO OUR AFFILIATED ENTITIES |
| • | We may disclose your name, address and account and other identifying numbers, account balances, information about your pending or past transactions and other personal financial information to our affiliated entities for any purpose. |
| • | We regularly disclose your name, address and account and other identifying numbers, account balances and information about your pending or past transactions to our affiliates to execute, process and confirm securities transactions or mutual fund transactions for you, to administer and service your account and commingled investment vehicles in which you are invested, or to market our products and services to you. |
| INFORMATION ABOUT FORMER CUSTOMERS |
We do not disclose nonpublic personal and financial information about former customers to nonaffiliated third parties unless required or requested to do so by a court order, judicial subpoena or regulatory inquiry, or otherwise where we believe in good faith that disclosure is required or permitted by law.
| QUESTIONS |
Should you have any questions about our Customer Privacy Policy, please contact us by email or by regular mail at the address at the end of this policy.
| REMINDER ABOUT TCW’S FINANCIAL PRODUCTS |
Financial products offered by The TCW Group, Inc. and its subsidiaries, the TCW Funds, Inc., TCW Strategic Income Fund, Inc., the Metropolitan West Funds, Sepulveda Management LLC, TCW Direct Lending LLC, TCW Direct Lending VII LLC, TCW Direct Lending VIII LLC, TCW Star Direct Lending LLC, and TCW ETF TRUST.
| • | Are not guaranteed by a bank; |
| • | Are not obligations of The TCW Group, Inc. or of its subsidiaries; |
| • | Are not insured by the Federal Deposit Insurance Corporation; and |
| • | Are subject to investment risks, including possible loss of the principal amount committed or invested, and earnings thereon. |
THE TCW GROUP, INC. | TCW DIRECT LENDING LLC | |
TCW FUNDS, INC. | TCW DIRECT LENDING VII LLC | |
TCW STRATEGIC INCOME FUND, INC. | TCW DIRECT LENDING VIII LLC | |
METROPOLITAN WEST FUNDS | TCW STAR DIRECT LENDING LLC | |
SEPULVEDA MANAGEMENT LLC | TCW ETF TRUST | |
Attention: Privacy Officer | 515 South Flower Street | Los Angeles, CA 90071 | email: privacy@tcw.com | ||
361 / Annual Report March 2024
Table of Contents
[THIS PAGE INTENTIONALLY LEFT BLANK]
Table of Contents
[THIS PAGE INTENTIONALLY LEFT BLANK]
Table of Contents
[THIS PAGE INTENTIONALLY LEFT BLANK]
Table of Contents
TRUSTEES AND OFFICERS (Unaudited)
The business and affairs of the Trust and each Fund is under the direction of the Board of Trustees. Information pertaining to the Trustees and officers of the Trust is provided in the table below. The term “officer” means president, vice president, secretary, treasurer, controller, or any other officer who performs policy making functions. All officers serve without direct compensation from the Funds. You can find more information about the Trustees in the Statement of Additional Information which is available without charge by calling (800) 241-4671.
NAME AND YEAR OF BIRTH*** | POSITION(S) HELD WITH TRUST | TERM OF AND LENGTH OF TIME | PRINCIPAL OCCUPATIONS DURING PAST FIVE YEARS | NUMBER FUNDS IN | OTHER BY TRUSTEE | |||||
| Independent Trustees of the Trust* | ||||||||||
Patrick C. Haden (1953) | Trustee and Vice Chairman of the Board | Indefinite term, since 2010 | President (since 2003), Wilson Ave. Consulting (business consulting firm). | 34 | Auto Club (affiliate of AAA); TCW Funds, Inc. (mutual fund); TCW Strategic Income Fund, Inc. (closed-end fund); TCW ETF Trust (exchange-traded fund). | |||||
Martin Luther King III (1957) | Trustee | Indefinite term, since 1997 | President and Chief Executive Officer (since 1998), The King Center (non-profit organization). Since January 2006, he has served as Chief Executive Officer of Realizing the Dream, a non-profit organization that continues the humanitarian and liberating work of Dr. Martin Luther King, Jr. and Mrs. Coretta Scott King. He has been engaged as an independent motivational lecturer since 1980. | 33 | TCW Funds, Inc. (mutual fund); TCW ETF Trust (exchange-traded fund). | |||||
Peter McMillan (1957) | Trustee and Chairman of the Nominating and Governance Committee | Indefinite term, since 2009 | Co-founder (since 2019), Pacific Oak Capital Advisors (investment advisory firm); Co- founder, Managing Partner and Chief Investment Officer (since May 2013), Temescal Canyon Partners (investment advisory firm); Co-founder and Executive Vice President (2005 – 2019), KBS Capital Advisors (a manager of real estate investment trusts). | 34 | Pacific Oak Strategic Opportunity REIT (real estate investments); Keppel Pacific Oak U.S. REIT (real estate investments); Pacific Oak Residential Trust (real estate investments); TCW Funds, Inc. (mutual fund); TCW DL VII Financing LLC (private fund); TCW Strategic Income Fund, Inc. (closed-end fund); TCW ETF Trust (exchange-traded fund). | |||||
365 / Annual Report March 2024
Table of Contents
NAME AND YEAR OF BIRTH*** | POSITION(S) HELD WITH TRUST | TERM OF AND LENGTH OF TIME | PRINCIPAL OCCUPATIONS DURING PAST FIVE YEARS | NUMBER FUNDS IN | OTHER BY TRUSTEE | |||||
Victoria B. Rogers (1961) | Trustee | Indefinite term since 2024 | President and Chief Executive Officer (since 1996), The Rose Hills Foundation (charitable foundation) | 34 | Norton Simon Museum (art museum); Causeway Capital Management Trust (mutual fund); The Rose Hills Foundation (charitable foundation); Saint John’s Health Center Foundation (charitable foundation); TCW Funds, Inc. (mutual fund); TCW Strategic Income Fund, Inc. (closed-end fund); TCW ETF Trust (exchange-traded fund). | |||||
Robert G. Rooney (1957) | Trustee and Chairman of the Audit Committee | Indefinite term, since 2009 | Founder (since August 2022), RGR Advisors CT, LLC (financial advisory firm); Senior Financial Advisor (August 2020 – March 2021), Chief Financial and Administrative Officer (November 2018 – August 2020), REEF Technology (real estate and technology services company); Chief Financial Officer (January 2018 – November 2018), Citizens Parking Inc. (nationwide automobile parking facilities). | 33 | TCW Funds, Inc. (mutual fund); TCW ETF Trust (exchange-traded fund). | |||||
Michael Swell (1966) | Trustee | Indefinite term, since 2024 | Retired (since 2021); Partner and Managing Director (2007 – 2021), Goldman Sachs Asset Management (asset management company). | 33 | TCW Funds, Inc. (mutual fund); TCW ETF Trust (exchange-traded fund); Apollo Realty Income Solutions Inc. (nontraded real estate investment trust). | |||||
Andrew Tarica (1959) | Trustee and Chairman of the Board | Indefinite term, since 2002 and 2008, respectively | Chief Executive Officer (since February 2001), Meadowbrook Capital Management (asset management company); Employee (2003 – 2022), Cowen Prime Services (broker-dealer). | 34 | TCW Funds, Inc. (mutual fund); TCW Strategic Income Fund, Inc. (closed-end fund); TCW Direct Lending VII, LLC (business development company); TCW Direct Lending VIII, LLC (business development company); TCW Star Direct Lending, LLC (business development company); TCW ETF Trust (exchange–traded fund). | |||||
Annual Report March 2024 / 366
Table of Contents
NAME AND YEAR OF BIRTH*** | POSITION(S) HELD WITH TRUST | TERM OF AND LENGTH OF TIME | PRINCIPAL OCCUPATIONS DURING PAST FIVE YEARS | NUMBER FUNDS IN | OTHER BY TRUSTEE | |||||
| Interested Trustees** | ||||||||||
Megan McClellan (1978) | Trustee and President and Principal Executive Officer | Indefinite term, since 2024 and 2023, respectively | Group Managing Director (since 2023), Adviser, TCW Investment Management Company LLC, The TCW Group, Inc., TCW LLC and TCW Asset Management Company LLC; President and Principal Executive Officer (since 2023), TCW Funds, Inc. and TCW Strategic Income Fund, Inc.; Managing Director (2013-2023), J.P. Morgan Asset Management. | 33 | TCW Funds, Inc. (mutual fund); TCW ETF Trust (exchange-traded fund). | |||||
Patrick Moore (1964) | Trustee | Indefinite term, since 2014 | Group Managing Director (since 2000), the Adviser, TCW Investment Management Company LLC, TCW Asset Management Company LLC, and TCW LLC. Mr. Moore is a member of the CFA Institute. | 33 | TCW Funds, Inc. (mutual fund); TCW ETF Trust (exchange-traded fund). | |||||
| Officers of the Trust who are not Trustees | ||||||||||
Drew Bowden (1961) | Executive Vice President | Indefinite term, since 2023 | Executive Vice President, General Counsel and Secretary (since 2023), the Adviser, The TCW Group, Inc., TCW Asset Management Company LLC, TCW Investment Management Company LLC, TCW LLC; Executive Vice President (since 2023), TCW Funds, Inc. and TCW Strategic Income Fund, Inc.; Chief Operating Officer (2021 – 2023) Western Asset Management Company; Executive Vice President and General Counsel (2020 – 2021) and Senior Vice President and General Counsel (2015 – 2020), Jackson Financial Inc. | N/A | N/A | |||||
Eric Chan (1978) | Assistant Treasurer | Indefinite term, since 2010 | Managing Director of Fund Operations (since 2006), the Adviser and (since 2009), TCW Investment Management Company LLC, TCW Asset Management Company LLC and TCW LLC; Assistant Treasurer (since 2009), TCW Funds, Inc. and TCW Strategic Income Fund, Inc. Mr. Chan is a Certified Public Accountant. | N/A | N/A | |||||
Peter Davidson (1972) | Vice President and Secretary | Indefinite term, since 2022 and 2023, respectively. | Senior Vice President, Associate General Counsel and Assistant Secretary (since 2022), the Adviser, TCW Investment Management Company LLC, TCW Asset Management Company LLC, TCW LLC; Vice President and Assistant Secretary (since 2022), TCW Funds, Inc. and TCW Strategic Income Fund, Inc.; Assistant General Counsel – Investment Products and Advisory Services (2020 – 2022), The Northwestern Mutual Life Insurance Company; Associate General Counsel (2019 – 2020), Resolute Investment Managers; Assistant General Counsel (2003 – 2019), Invesco Ltd. | N/A | N/A | |||||
Lisa Eisen (1963) | Tax Officer | Indefinite term, since 2016 | Tax Officer (since 2016), TCW Funds, Inc. and TCW Strategic Income Fund, Inc.; Managing Director and Director of Tax (since 2016), TCW LLC. | N/A | N/A | |||||
367 / Annual Report March 2024
Table of Contents
NAME AND YEAR OF BIRTH*** | POSITION(S) HELD WITH TRUST | TERM OF AND LENGTH OF TIME | PRINCIPAL OCCUPATIONS DURING PAST FIVE YEARS**** | NUMBER FUNDS IN | OTHER BY TRUSTEE | |||||
Richard Villa (1964) | Treasurer, Principal Financial Officer and Principal Accounting Officer | Indefinite term, since 2021 | Executive Vice President, Chief Financial Officer and Assistant Secretary (since 2016), TCW LLC and (since 2008), the Adviser, TCW Investment Management Company LLC, The TCW Group, Inc., and TCW Asset Management Company LLC; Treasurer, Principal Financial Officer and Principal Accounting Officer (since 2014), TCW Strategic Income Fund, Inc. and TCW Funds, Inc. | N/A | N/A | |||||
Gladys Xiques (1973) | Chief Compliance Officer and Anti- Money Laundering (“AML”) Officer | Indefinite term, since 2021 | Chief Compliance Officer and AML Officer (since 2021), TCW Funds, Inc. and TCW Strategic Income Fund, Inc.; Group Managing Director and Global Chief Compliance Officer (since 2021), TCW LLC, the Adviser, TCW Investment Management Company LLC, and TCW Asset Management Company LLC; Global Chief Compliance Officer (since 2021), The TCW Group, Inc.; Senior Vice President (2015 – 2020), TCW LLC, the Adviser, TCW Investment Management Company LLC, and TCW Asset Management Company LLC. | N/A | N/A | |||||
| * | Denotes a Trustee who is not an “interested” person of the Trust as defined in the 1940 Act. |
| ** | Denotes a Trustee who is an “interested” person of the Trust as defined in the 1940 Act, due to the relationship indicated with the Adviser. |
| *** | For purposes of Trust business, the address for all Trustees and officers is c/o Metropolitan West Asset Management, LLC, 515 South Flower Street, Los Angeles, CA 90071. |
| **** | Positions with The TCW Group, Inc. and its affiliates may have changed over time. |
Annual Report March 2024 / 368
Table of Contents

MetWest Funds
515 South Flower Street
Los Angeles, California 90071
800 241 4671
www.TCW.com
Board of Trustees
Patrick C. Haden
Martin Luther King III
Megan McClellan
Peter McMillan
Patrick Moore
Victoria B. Rogers
Robert G. Rooney
Michael Swell
Andrew Tarica
Officers
Megan McClellan
President and Principal Executive Officer
Drew Bowden
Executive Vice President
Eric Chan
Assistant Treasurer
Peter Davidson
Vice President and Secretary
Lisa Eisen
Tax Officer
Richard Villa
Treasurer, Principal Financial Officer and
Principal Accounting Officer
Gladys Xiques
Chief Compliance Officer and
Anti-Money Laundering Officer
Adviser
Metropolitan West Asset Management, LLC
515 South Flower Street
Los Angeles, CA 90071
Custodian
The Bank of New York Mellon
One Wall Street
New York, NY 10286
Transfer Agent
BNY Mellon Investment Servicing (U.S.) Inc.
P.O. Box 534453
Pittsburgh, PA 15253-4453
Independent Registered Public Accounting Firm
Deloitte & Touche LLP
555 West 5th Street, Suite 2700
Los Angeles, CA 90013
Distributor
TCW Fund Distributors LLC
515 South Flower Street
Los Angeles, CA 90071
Legal Counsel
Paul Hastings LLP
101 California Street, 48th Floor
San Francisco, CA 94111
For Additional Information about the MetWest Funds call: (213) 244-0000 or (800) 241-4671 (toll-free) www.TCW.com
A description of the Funds’ proxy voting policies, procedures, and how the Funds voted proxies relating to their portfolios’ securities during the most recent 12-month period ending June 30 are available (i) without charge, upon request, by calling (800) 241-4671; (ii) on the Securities and Exchange Commission’s website at www.sec.gov.
In addition to its annual and semi-annual reports, the Funds file a complete schedule of portfolio holdings with the SEC for the first and third quarters of each fiscal year on Form NPORT-P. Such filings occur no later than 60 days after the end of the Funds’ first and third quarters and are available on the SEC’s website at www.sec.gov.
To reduce expenses, we may mail only one copy of the Fund’s prospectus and each annual and semi-annual report to those addresses shared by two or more accounts. If you wish to receive individual copies of these documents, please call us at (800) 241-4671 (or contact your financial institution). We will begin sending you individual copies thirty days after receiving your request.
This report is submitted for general information to the shareholders of the Funds. It is not authorized for distribution to prospective investors in the Funds unless preceded or accompanied by an effective Prospectus, which includes details regarding the Funds’ objectives, policies, expenses and other information.
FUNDap 5/2024
Table of Contents
| (b) | Not applicable. |
Item 2. Code of Ethics.
| (a) | The registrant, as of the end of the period covered by this report, has adopted a code of ethics that applies to the registrant’s principal executive officer, principal financial officer, principal accounting officer or controller, or persons performing similar functions, regardless of whether these individuals are employed by the registrant or a third party. |
| (c) | There have been no amendments, during the period covered by this report, to a provision of the code of ethics that applies to the registrant’s principal executive officer, principal financial officer, principal accounting officer or controller, or persons performing similar functions, regardless of whether these individuals are employed by the registrant or a third party, and that relates to any element of the code of ethics description. |
| (d) | The registrant has not granted any waivers, including an implicit waiver, from a provision of the code of ethics that applies to the registrant’s principal executive officer, principal financial officer, principal accounting officer or controller, or persons performing similar functions, regardless of whether these individuals are employed by the registrant or a third party, that relates to one or more of the items set forth in paragraph (b) of this item’s instructions. |
(f)(1) | Pursuant to Item 13(a)(1), the registrant is filing as an exhibit a copy of its code of ethics that applies to its principal executive officer, principal financial officer, principal accounting officer or controller, or persons performing similar functions. |
Item 3. Audit Committee Financial Expert.
As of the end of the period covered by the report, the registrant’s board of directors has determined that Robert Rooney is qualified to serve as audit committee financial expert serving on its audit committee and he is “independent,” as defined by Item 3 of Form N-CSR.
Item 4. Principal Accountant Fees and Services.
Audit Fees
| (a) | The aggregate fees billed for each of the last two fiscal years for professional services rendered by the principal accountant for the audit of the registrant’s annual financial statements or services that are normally provided by the accountant in connection with statutory and regulatory filings or engagements for those fiscal years are $622,107 for 2024 and $610,054 for 2023. |
Table of Contents
Audit-Related Fees
| (b) | The aggregate fees billed in each of the last two fiscal years for assurance and related services by the principal accountant that are reasonably related to the performance of the audit of the registrant’s financial statements and are not reported under paragraph (a) of this Item are $0 for 2024 and $0 for 2023. |
Tax Fees
| (c) | The aggregate fees billed in each of the last two fiscal years for professional services rendered by the principal accountant for tax compliance, tax advice, and tax planning are $137,858 for 2024 and $130,998 for 2023. |
All Other Fees
| (d) | The aggregate fees billed in each of the last two fiscal years for products and services provided by the principal accountant, other than the services reported in paragraphs (a) through (c) of this Item are $0 for 2024 and $0 for 2023. |
| (e) | Audit Committee’s pre-approval policies and procedures described in paragraph (c)(7) of Rule 2-01 of Regulation S-X. |
(e)(1) | Pre-Approval Policies and Procedures. The Audit Committee (“Committee”) of the registrant is responsible for pre-approving (i) all audit and permissible non-audit services to be provided by the independent auditors to the registrant and (ii) all permissible non-audit services to be provided by the independent auditors to Metropolitan West Funds and any affiliate of Metropolitan West Funds that provides services to the registrant (a “Covered Services Provider”) if the independent auditors’ engagement relates directly to the operations and financial reporting of the registrant. The Committee may delegate its responsibility to pre-approve any such audit and permissible non-audit services to the Chairperson of the Committee, and the Chairperson must report to the Committee, at its next regularly scheduled meeting after the Chairperson’s pre-approval of such services, his or her decision(s). The Committee may also establish detailed pre-approval policies and procedures for pre-approval of such services in accordance with applicable laws, including the delegation of some or all of the Committee’s pre-approval responsibilities to other persons (other than Metropolitan West Funds or the registrant’s officers). Pre-approval by the Committee of any permissible non-audit services is not required so long as: (i) the aggregate amount of all such permissible non-audit services provided to the registrant, Metropolitan West Funds and any Covered Services Provider constitutes not more than 5% of the total amount of revenues paid by the registrant to its independent auditors during the fiscal year in which the permissible non-audit services are provided; (ii) the permissible non-audit services were not recognized by the registrant at the time of the engagement to be non-audit services; and (iii) such services are promptly brought to the attention of the Committee and approved by the Committee or the Chairperson prior to the completion of the audit. | |||
(e)(2) | The percentage of services described in each of paragraphs (b) through (d) of this Item that were approved by the audit committee pursuant to paragraph (c)(7)(i)(C) of Rule 2-01 of Regulation S-X are as follows: | |||
(b) N/A |
(c) 100% |
Table of Contents
(d) N/A |
| (f) | The percentage of hours expended on the principal accountant’s engagement to audit the registrant’s financial statements for the most recent fiscal year that were attributed to work performed by persons other than the principal accountant’s full-time, permanent employees was 0%. |
| (g) | The aggregate non-audit fees billed by the registrant’s accountant for services rendered to the registrant, and rendered to the registrant’s investment adviser (not including any sub-adviser whose role is primarily portfolio management and is subcontracted with or overseen by another investment adviser), and any entity controlling, controlled by, or under common control with the adviser that provides ongoing services to the registrant for each of the last two fiscal years of the registrant was $1,060,849 for 2024 and $1,167,405 for 2023. |
| (h) | The registrant’s audit committee of the board of directors has considered whether the provision of non-audit services that were rendered to the registrant’s investment adviser (not including any sub-adviser whose role is primarily portfolio management and is subcontracted with or overseen by another investment adviser), and any entity controlling, controlled by, or under common control with the investment adviser that provides ongoing services to the registrant that were not pre-approved pursuant to paragraph (c)(7)(ii) of Rule 2-01 of Regulation S-X is compatible with maintaining the principal accountant’s independence. |
| (i) | Not applicable. |
| (j) | Not applicable. |
Item 5. Audit Committee of Listed Registrants.
Not applicable.
Item 6. Investments.
| (a) | Schedule of Investments in securities of unaffiliated issuers as of the close of the reporting period is included as part of the report to shareholders filed under Item 1(a) of this form. |
| (b) | Not applicable. |
Item 7. Disclosure of Proxy Voting Policies and Procedures for Closed-End Management
Investment Companies.
Not applicable.
Item 8. Portfolio Managers of Closed-End Management Investment Companies.
Not applicable.
Item 9. Purchases of Equity Securities by Closed-End Management Investment Company and
Affiliated Purchasers.
Not applicable.
Table of Contents
Item 10. Submission of Matters to a Vote of Security Holders.
There have been no material changes to the procedures by which shareholders may recommend nominees to the registrant’s board of directors, where those changes were implemented after the registrant last provided disclosure in response to the requirements of Item 407(c)(2)(iv) of Regulation S-K (17 CFR 229.407) (as required by Item 22(b)(15) of Schedule 14A (17 CFR 240.14a-101)), or this Item.
Item 11. Controls and Procedures.
| (a) | The registrant’s principal executive and principal financial officers, or persons performing similar functions, have concluded that the registrant’s disclosure controls and procedures (as defined in Rule 30a-3(c) under the Investment Company Act of 1940, as amended (the “1940 Act”) (17 CFR 270.30a-3(c))) are effective, as of a date within 90 days of the filing date of the report that includes the disclosure required by this paragraph, based on their evaluation of these controls and procedures required by Rule 30a-3(b) under the 1940 Act (17 CFR 270.30a-3(b)) and Rules 13a-15(b) or 15d-15(b) under the Securities Exchange Act of 1934, as amended (17 CFR 240.13a-15(b) or 240.15d-15(b)). |
| (b) | There were no changes in the registrant’s internal control over financial reporting (as defined in Rule 30a-3(d) under the 1940 Act (17 CFR 270.30a-3(d))) that occurred during the period covered by this report that have materially affected, or are reasonably likely to materially affect, the registrant’s internal control over financial reporting. |
| Item 12. | Disclosure of Securities Lending Activities for Closed-End Management Investment Companies. |
Not applicable.
Item 13. Exhibits.
(a)(1) | ||
(a)(2) | ||
(a)(2)(1) | There were no written solicitations to purchase securities under Rule 23c-1 under the Act sent or given during the period covered by the report by or on behalf of the Registrant to 10 or more persons. | |
(a)(2)(2) | There was no change in the Registrant’s independent public accountant during the period covered by the report. | |
(b) | ||
Table of Contents
SIGNATURES
Pursuant to the requirements of the Securities Exchange Act of 1934 and the Investment Company Act of 1940, the registrant has duly caused this report to be signed on its behalf by the undersigned, thereunto duly authorized.
(Registrant) | Metropolitan West Funds |
By (Signature and Title)* | /s/ Megan McClellan | |
Megan McClellan, President and Principal Executive Officer | ||
(principal executive officer) |
Date | June 5, 2024 |
Pursuant to the requirements of the Securities Exchange Act of 1934 and the Investment Company Act of 1940, this report has been signed below by the following persons on behalf of the registrant and in the capacities and on the dates indicated.
By (Signature and Title)* | /s/ Megan McClellan | |
Megan McClellan, President and Principal Executive Officer | ||
(principal executive officer) |
Date | June 5, 2024 |
By (Signature and Title)* | /s/ Richard Villa | |
Richard Villa, Treasurer, Principal Financial Officer | ||
and Principal Accounting Officer | ||
(principal financial officer) | ||
Date | June 5, 2024 |
* Print the name and title of each signing officer under his or her signature.