Forward Looking Statements
This presentation may include forward-looking statements. The statements contained herein that are not historical facts are forward-looking statements based on management’s current expectations and beliefs concerning future developments and their potential effects on the Company. There can be no assurance that future developments affecting the Company will be the same as those anticipated by management. Actual results may differ from those projected in the forward-looking statements. These forward-looking statements involve risks and uncertainties. These include, but are not limited to, the following risks: (1) changes in the performance of the financial markets, (2) changes in the demand for and market acceptance of the Company’s products and services, (3) changes in general economic conditions including interest rates, presence of competitors with greater financial resources, and the impact of competitive projects and pricing, (4) the effect of the Company’s policies, (5) the continued availability of adequate funding sources, (6) and various legal, regulatory and litigation risks.
PPBI Overview
Southern California Community Bank
as of 9/30/04
| |
| •NASDAQ National Market | | PPBI | |
| •Assets | | $488 million | |
| •Fully diluted shares | | 6,652,867 | |
| •Fully diluted BV per share | | $6.89 | |
| •Annualized ROAA | | 1.85 | |
| • Annualized ROAE | | 17.92 | |
PPBI Overview
| • | | Community bank business model - Thrift Charter |
| • | | Income Property lending focus |
| • | | New management repositioned the Company |
| • | | Exceptional growth prospects being realized |
Comparison 9/30/03 - 9/30/04
Exceptional growth realized
| • | | Net loans increased 111% - $192M to $405M |
| • | | Total Assets increased 90% - $257M to $488M |
| • | | Pre-tax income growth of 594% - $735k to $5.1M |
| • | | Net Income growth of 215% - $1.3M to $4.1M |
Experienced Management Team
| Name (Age) | Position | Years
Experience |
|
| Steven Gardner (43) | | President & Chief Executive Officer | | 21 |
| John Shindler (49) | | Chief Financial Officer | | 27 |
| Eddie Wilcox (37) | | Chief Lending Officer | | 16 |
| Bruce Larson (47) | | Chief Credit Officer | | 21 |
| Kathi Duncan (47) | | Director of Operations and Compliance | | 24 |
| Jim Sanchez (41) | | Director of Information Technology | | 20 |
| Robert Johnson (60) | | Director of Internal Audit | | 32 |
Growth and Operating Strategies
Lending:
| • | | Maturing to full banking relationship |
| • | | Increase Commercial Real Estate Loans |
| • | | Continue to grow market share of MFR loans |
| • | | Commercial Business Lending |
Deposit:
| • | | Core deposit growth through relationship banking |
| • | | Opening of additional branches |
| • | | Business banking relationships |
Southern California Marketplace
| • | | Income Property Loan Markets |
| • | | Multi-family: $17.5B, Commercial Real Estate: $34.8B - 12 months ending 8/31/04 |
| • | | Los Angeles: 6.2%, Orange: 3.2%, San Diego: 3.8%, San Bernardino: 6.0% |
| • | | Los Angeles: 2.9%, Orange: 3.9%, San Diego: 3.5%, San Bernardino: 3.7% |
| • | | Los Angeles: $459.7, Orange: $633.3, San Diego: $573.1, San Bernardino: $306.2 |
| • | | Los Angeles: $53.5, Orange: $74.2, San Diego: $63.4, San Bernardino: $54.3 |
Lending Strategy
| • | | Leverage MFR success to grow CRE |
| • | | MFR market share expansion |
| • | | Business Lending introduced in Q4 2004 |
| • | | Asset quality directs our lending activities |
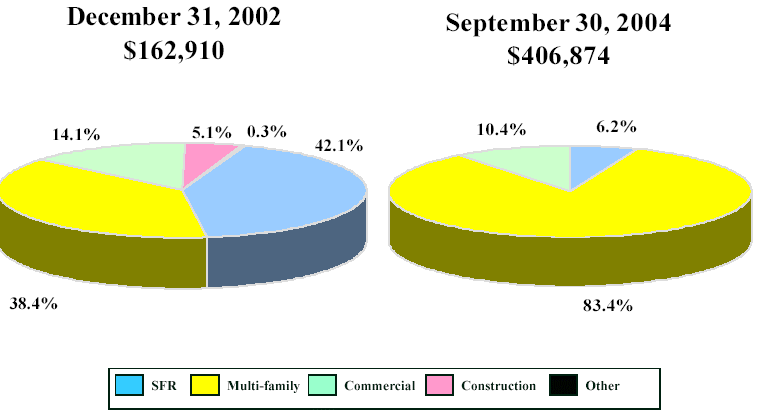
Loan Portfolio Composition
(dollars in thousands)
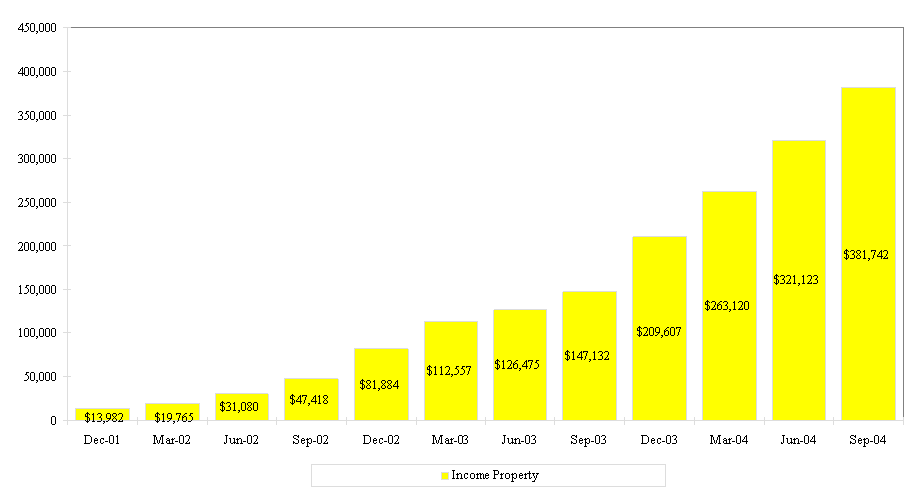
Income Property
(dollars in thousands)

Loan Portfolio Characteristics
As of September 30, 2004
| | |
| Multifamily | | | |
| Average Loan to Value | | 63.5% | |
| Average Debt Coverage Ratio | | 1.33:1 | |
| Average Balance | | $ 687,000 | |
| Commercial Real Estate | |
| Average Loan to Value | | 60.9% | |
| Average Debt Coverage Ratio | | 1.49:1 | |
| Average Balance | | $ 922,000 | |
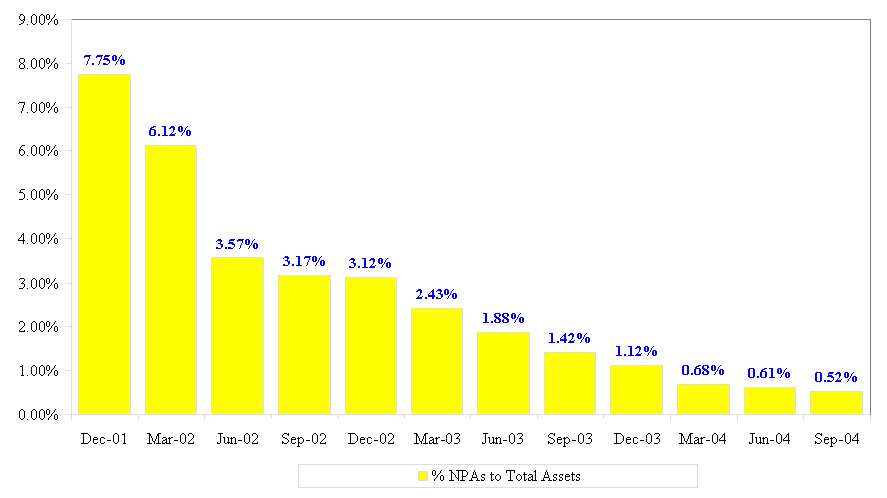
Improving Asset Quality Trends:
NPAs to Total Assets

Branch Banking Strategy
Grow core deposit base
| • | | Relationship banking focus |
| • | | Opening of additional branches |
| • | | Enhanced product offerings |
| • | | Business banking relationship |
Deposit Portfolio Composition
(dollars in thousands)
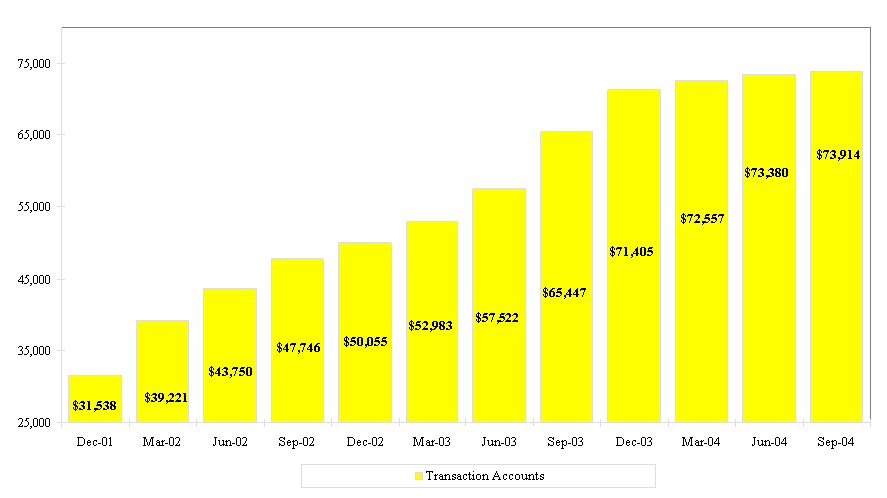
Deposit Transaction Accounts
(dollars in thousands)


Financial Performance
Balance Sheet
(in thousands)
| | As of |
| |
|
| | | 9/30/2004 | | 12/31/2003 | | 12/31/2002 | | 12/31/2001 | |
| | |
| |
| |
| |
| |
| Assets: | | | | | | | | | |
| Cash and Investments | | 69,656 | | 44,715 | | 61,833 | | 42,365 | |
| Loans, net | | 405,853 | | 247,600 | | 158,231 | | 187,176 | |
| Participation Contract | | 1,105 | | 5,977 | | 4,869 | | 4,428 | |
| Other Assets | | 11,531 | | 11,076 | | 13,345 | | 9,698 | |
| | |
| |
| |
| |
| |
| Total Assets | | $ 488,145 | | $ 309,368 | | $ 238,278 | | $ 243,667 | |
| | |
| |
| |
| |
| |
| Liabilities: | | | | | | | | | |
| Deposits | | 278,535 | | 221,447 | | 191,170 | | 232,160 | |
| FHLB Advances and other borrowings | | 151,900 | | 48,600 | | 20,000 | | — | |
| Notes Payable | | — | | — | | 11,440 | | — | |
| Subordinated Debt | | 10,310 | | — | | 1,500 | | 1,500 | |
| Other Liabilities | | 4,622 | | 1,989 | | 2,545 | | 2,359 | |
| | |
| |
| |
| |
| |
| Total Liabilities | | 445,367 | | 272,036 | | 226,655 | | 236,019 | |
| | |
| |
| |
| |
| |
| Stockholders’ Equity | | | | | | | | | |
| Common Stock | | 53 | | 53 | | 13 | | 13 | |
| Additional Paid-in Capital | | 67,564 | | 67,546 | | 43,328 | | 42,628 | |
| Accumulated Deficit | | (24,596 | ) | (30,021 | ) | (32,086 | ) | (34,964 | ) |
| Accumulated Other Comprehensive Income | | (243 | ) | (246 | ) | 368 | | (29 | ) |
| | |
| |
| |
| |
| |
| Total Stockholders’ Equity | | 42,778 | | 37,332 | | 11,623 | | 7,648 | |
| | |
| |
| |
| |
| |
| Total Liabilities and Stockholders’ Equity | | $ 488,145 | | $ 309,368 | | $ 238,278 | | $ 243,667 | |
| | |
| |
| |
| |
| |
| Fully Diluted Book Value per share | | $ 6.89 | | $ 5.98 | | $ 4.98 | | $ 5.73 | |
Income Statement
(dollars in thousands)
| | | 9 Months
Ended
| | 12 Months Ended
| |
| | | 9/30/2004
| | 12/31/2003
| | 12/31/2002
| | 12/31/2001
| |
| | | | | | | | | | |
| Interest Income | | | | | | | | | |
| Loans | | $13,820 | | $ 12,366 | | $ 12,345 | | $ 21,973 | |
| Other Int. Earning Assets | | 3,072 | | 4,882 | | 6,527 | | 2,469 | |
| | |
| |
| |
| |
| |
| Total Interest Income | | 16,892 | | 17,248 | | 18,872 | | 24,442 | |
| | |
| |
| |
| |
| |
| Interest Expense | | | | | | | | | |
| Deposits | | 3,948 | | 4,954 | | 6,314 | | 14,989 | |
| FHLB Advances | | 1,116 | | 541 | | 535 | | 992 | |
| Notes and Debentures | | 218 | | 2,162 | | 2,061 | | 210 | |
| | |
| |
| |
| |
| |
| Total Interest Expense | | 5,282 | | 7,657 | | 8,910 | | 16,191 | |
| | |
| |
| |
| |
| |
| Net Int. Inc. Before Provision | | 11,610 | | 9,591 | | 9,962 | | 8,251 | |
| | |
| |
| |
| |
| |
| Provision for Loan Losses | | 460 | | 655 | | 1,133 | | 3,313 | |
| Non Interest Income | | 3,244 | | 2,315 | | 1,869 | | 3,992 | |
| Non Interest Expense | | 8,544 | | 9,783 | | 10,165 | | 14,340 | |
| | |
| |
| |
| |
| |
| Income Before Taxes | | 5,850 | | 1,468 | | 533 | | (5,410 | ) |
| Inc. Tax Provision/(Benefit) | | 425 | | (597 | ) | (2,345 | ) | 642 | |
| | |
| |
| |
| |
| |
| Net Income | | $ 5,425 | | $ 2,065 | | $ 2,878 | | $(6,052 | ) |
| | |
| |
| |
| |
| |
| Diluted Earnings/(Loss) p er Share | | $ 0.82 | | $ 0.61 | | $ 1.16 | | $ (4.54 | ) |
PPBI Overview
Southern California Community Bank
| • | | Exceptional growth being realized |
| • | | Income Property lending focus |
| • | | Investing for the future |


