
www.ppbi.com
Investor Presentation
Investor Presentation
December 10, 2009
December 10, 2009
Steven R. Gardner
Steven R. Gardner
President & CEO
President & CEO

www.ppbi.com
The statements contained herein that are not historical facts are forward-looking
statements based on management's current expectations and beliefs concerning future
developments and their potential effects on the Company. There can be no assurance
that future developments affecting the Company will be the same as those anticipated
by management. Actual results may differ from those projected in the forward-
looking statements. These forward-looking statements involve risks and uncertainties.
These include, but are not limited to, the following risks: changes in the performance
of the financial markets; changes in the demand for and market acceptance of the
Company's products and services; changes in general economic conditions including
interest rates, presence of competitors with greater financial resources, and the impact
of competitive projects and pricing; the effect of the Company's policies; the
continued availability of adequate funding sources; and various legal, regulatory and
litigation risks; as well as additional risks factors discussed in the reports filed by the
Company with the SEC, which are available on its website at www.sec.gov. Except as
required by law, the Company undertakes no obligation to update any information.
www.ppbi.com
• In 1983, Pacific Premier Bank (the “Bank”)
was founded and later expanded into
subprime lending
was founded and later expanded into
subprime lending
• By 1999, growing losses prompted the Bank
to refocus its strategy
to refocus its strategy
• In 2000, the current management team
took over and developed a three phase
strategic plan to transform the Bank from
a nationwide subprime lender into a
traditional Community Bank
took over and developed a three phase
strategic plan to transform the Bank from
a nationwide subprime lender into a
traditional Community Bank
Phase 1 - Recapitalize Pacific Premier
• Issued $12 million note and warrants
• Lowered the risk profile of the Bank
Phase 2 - Return to Profitability
• Grew the balance sheet
• Raised $27 million via secondary offering
• Retired $12 million note
• Sustained profitability
Phase 3 - Transition into Commercial Bank
• Recruit experienced bankers
• Expand market footprint
• Offer new products and services
• Diversify loan and deposit portfolios
www.ppbi.com
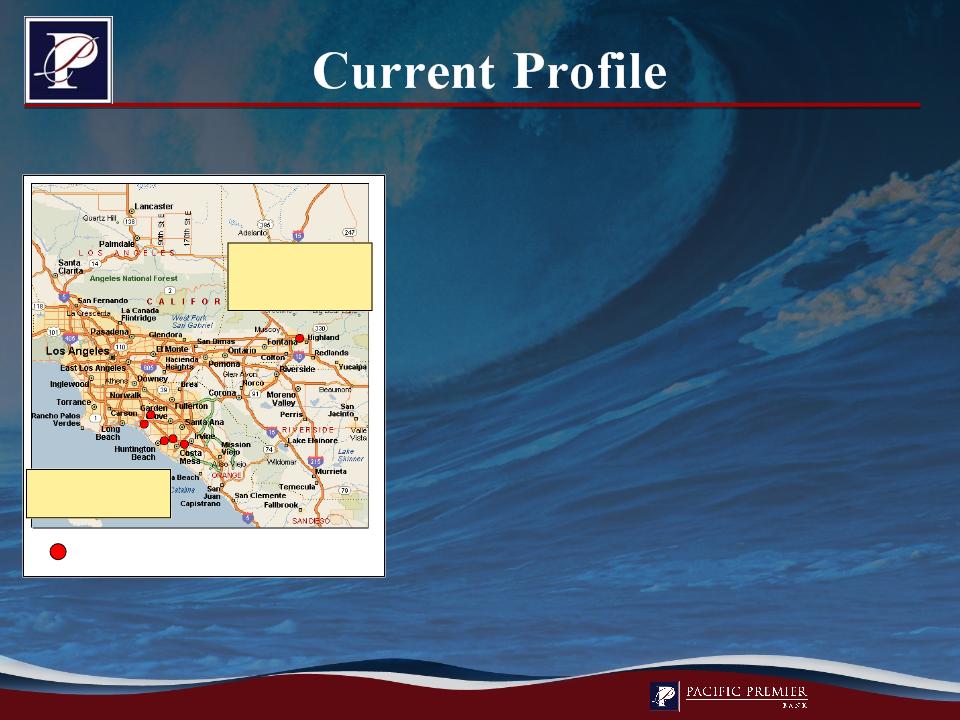
1 Branch in San
Bernardino
County
Bernardino
County
5 Branches in
Orange County
Orange County
Headquarters: | Costa Mesa, California |
Total Assets: | $847.9 million |
Net Loans: | $576.5 million |
Total Deposits: | $606.4 million |
Regional Focus: | Southern California |
Business Focus: | Small and middle market businesses |
Branches: | 6 locations |
As of September 30, 2009
PPBI Branch

www.ppbi.com
At or For the Nine Months Ended | At or For the Year Ended December 31, | |||
dollars in thousands, except per share data | September 30, 2009 | 2008 | 2007 | 2006 |
Balance Sheet | ||||
Total assets | $ 847,865 | $ 739,956 | $ 763,420 | $ 730,874 |
Total loans | 584,614 | 629,019 | 627,461 | 608,642 |
Total deposits | 606,382 | 457,128 | 386,735 | 339,449 |
Total borrowings | 176,810 | 220,210 | 308,275 | 326,801 |
Fully diluted book value per share* | $6.77 | $9.60 | $9.69 | $9.16 |
Statement of Operations | ||||
Net interest income | 17,019 | 21,118 | 18,266 | 17,125 |
Provision for loan losses | 5,535 | 2,241 | 1,651 | 531 |
Net income (loss) | (183) | 708 | 3,619 | 7,428 |
Bank Capital Ratios** | ||||
Tier 1 Leverage | 9.54% | 8.71% | 8.81% | 8.38% |
Tier 1 Risk Based | 12.98% | 10.71% | 10.68% | 10.94% |
Total Risk Based | 14.23% | 11.68% | 11.44% | 11.55% |
*Proforma, post capital raise at 9/30/09 ** Proforma, post capital raise at 9/30/09 assuming $13.5 million in additional capital to the Bank | ||||

www.ppbi.com
• Core deposit growth through small and middle market
business focus
business focus
• Relationship banking via high service levels
• Offensive capital raise - expansion opportunities
Develop the Bank into one of Southern California’s
top performing commercial banks.
top performing commercial banks.
www.ppbi.com
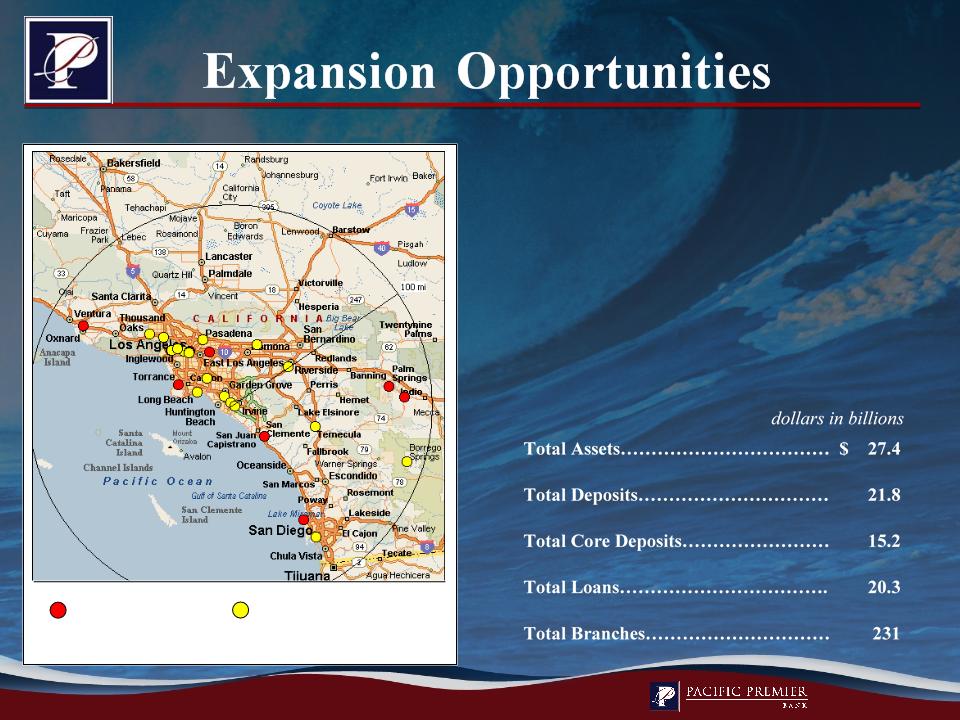
Texas ratio defined as NPAs / tangible equity plus loan loss reserves; Circle
radius represents 100 miles
radius represents 100 miles
SoCal Stressed Institutions
Possible failures as of September 30, 2009 within 100 miles of Costa Mesa, California | ||
Texas Ratio | # of Institutions | |
Near term | 100% + | 9 |
Longer term | 50% to 100% | 19 |
Possible near and longer term failures
Texas Ratio > 100%
Texas Ratio b/t 50-100%
www.ppbi.com
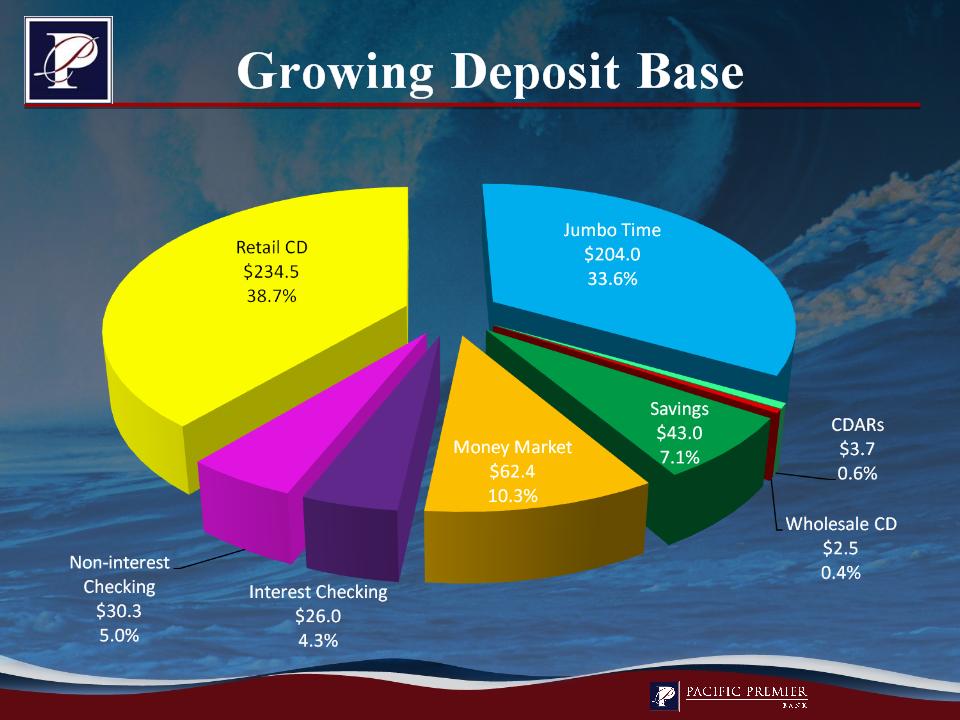
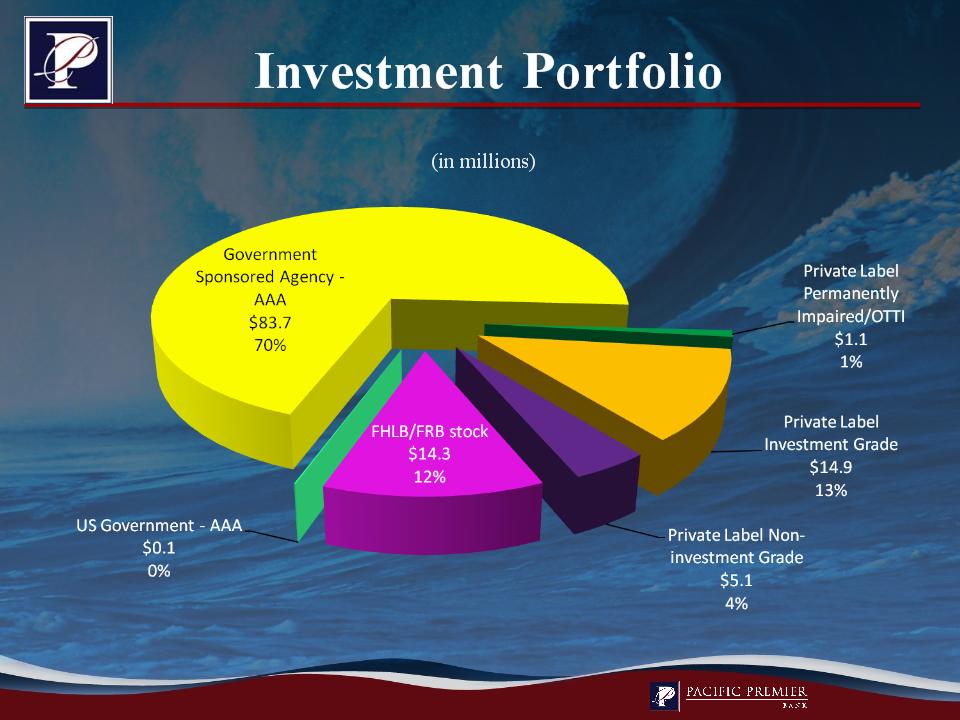
At September 30, 2009
(dollars in millions)

www.ppbi.com
As of September 30, 2009

www.ppbi.com
• Overall Underwriting Philosophy:
• CRE, C&I - business/property and global cash flow
• CRE Loans:
• Multifamily
• Commercial
• No construction, no L&D, no condo conversion, no int. reserves, no
repositioning, no covenant lite, no low doc
repositioning, no covenant lite, no low doc
• Personal guarantees, cross collateral, cross guarantees
• Portfolio Management
• Collections

www.ppbi.com
Average Loan Size | Seasoning (months) | LTV | DCR | |
Multifamily RE | $ 1,052,000 | 49 | 67% | 1.20 |
CRE Investor | $ 1,208,000 | 42 | 58% | 1.42 |
CRE Owner | $ 964,000 | 45 | 54% | ---- |
C & I | $ 356,000 | 25 | ---- | ---- |
SBA | $ 107,000 | 27 | ---- | ---- |
At September 30, 2009
www.ppbi.com
12/31/07 | 12/31/08 | 09/30/09 | |
Balance | $341.3 | $287.6 | $284.1 |
Avg. Bal | $1.087 | $1.053 | $1.052 |
DCR | 1.17 | 1.47 | 1.20 |
LTV | 65 | 65 | 67 |
Rate | 6.77% | 6.30% | 6.20% |
County | Bal | LTV | DCR | |
Los Angeles | $197.8 | 66% | 1.26 | |
Orange | $21.0 | 63% | 1.30 | |
Riv./San Bern. | $25.5 | 76% | 0.87 | |
San Diego | $23.6 | 68% | 1.26 | |
Other * | $16.2 | 64% | 1.17 | |
Total | $284.1 | 67% | 1.20 |
At September 30, 2009
www.ppbi.com
12/31/07 | 12/31/08 | 09/30/09 | |
Balance | $142.1 | $163.4 | $153.4 |
Avg. Bal | $1.184 | $1.202 | $1.208 |
DCR | 1.34 | 1.54 | 1.42 |
LTV | 62 | 57 | 58 |
Rate | 7.25% | 7.04% | 6.88% |
Type | Bal | LTV | DCR |
Office | $45.0 | 60% | 1.43 |
Retail | $46.6 | 55% | 1.41 |
Industrial | $25.8 | 63% | 1.33 |
Other | $35.7 | 57% | 1.52 |
Total | $153.4 | 58% | 1.42 |
At September 30, 2009
www.ppbi.com
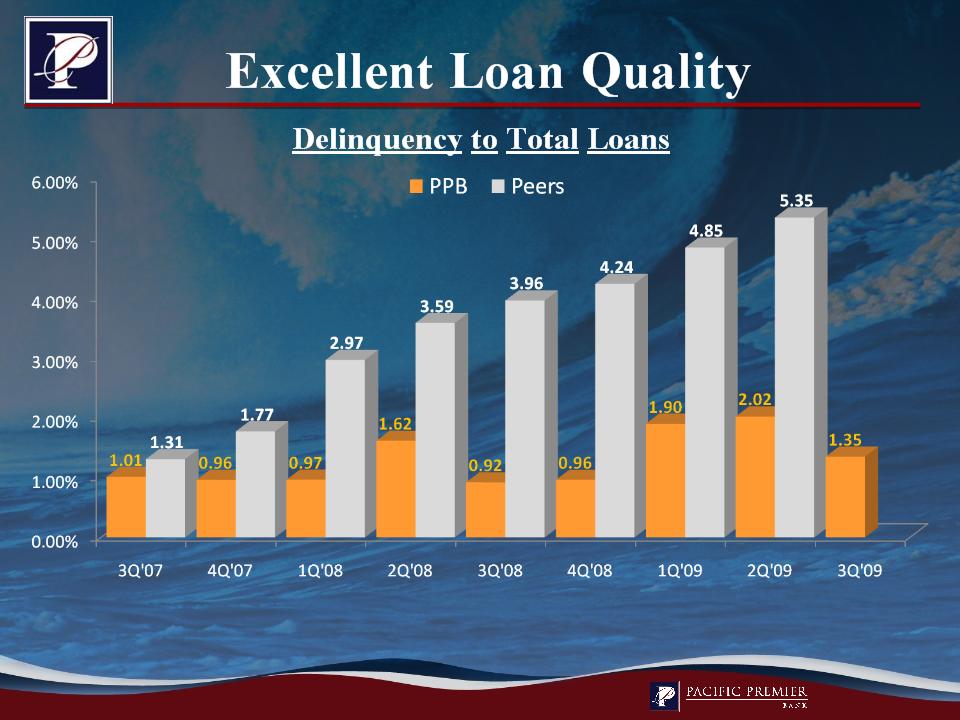
Peers consist of California commercial banks between $500 million and $1 billion, as of the end of the period covered.
Source: FDIC
www.ppbi.com
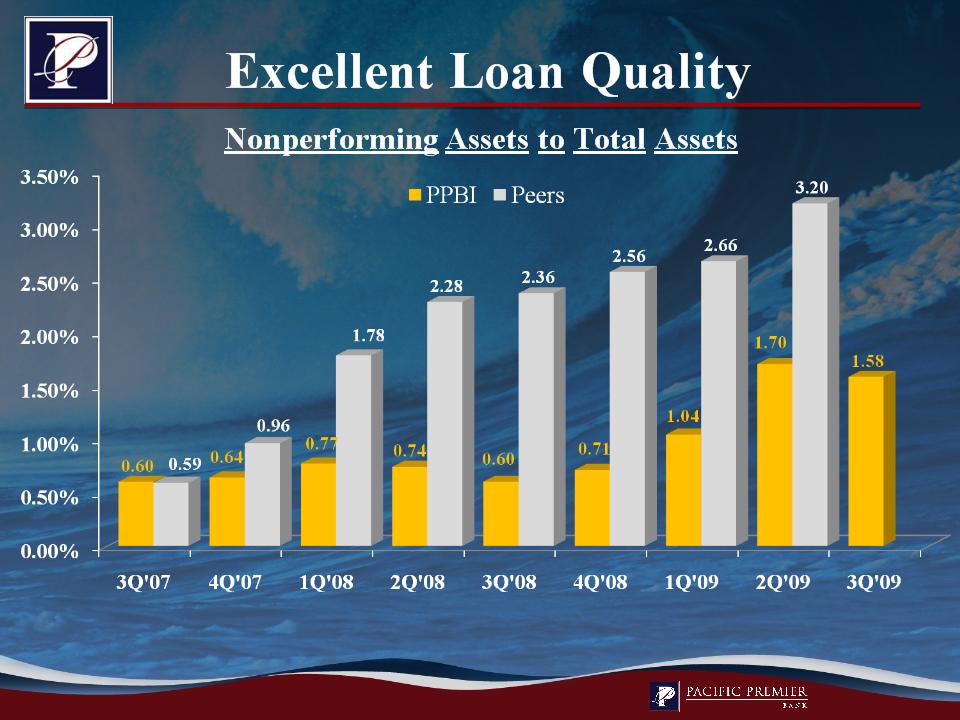
Peers consist of California commercial banks between $500 million and $1 billion, as of the end of the period covered.
Source: FDIC
www.ppbi.com
Book Value at September 30, 2009
In October, private label MBS totaled $9.0 million.

www.ppbi.com
• Bank transition gaining momentum
• Outperform peers due to: Credit Culture
• Target rich environment for acquisitions
• Undervalued stock relative to peers

www.ppbi.com
Questions?
Questions?