www.ppbi.com
Investor Presentation
Investor Presentation
Fourth Quarter 2011
Fourth Quarter 2011
Steven R. Gardner
Steven R. Gardner
President & CEO
President & CEO
1

www.ppbi.com
This presentation contains forward-looking statements regarding events or future financial performance
of the Company, including statements with respect to our objectives and strategies, and the results of
our operations and our business. These statements are based on management's current expectations and
beliefs concerning future developments and their potential effects on the Company. There can be no
assurance that future developments affecting the Company will be the same as those anticipated by
management. Actual results may differ from those projected in the forward-looking statements. We
caution readers of this presentation not to place undue reliance on these forward-looking statements as
a number of risks could cause future results to differ materially from these statements. These risks
include, but are not limited to, the following: changes in the performance of the financial markets;
changes in the demand for and market acceptance of the Company's products and services; changes in
general economic conditions including interest rates, presence of competitors with greater financial
resources, and the impact of competitive projects and pricing; the effect of the Company's policies; the
continued availability of adequate funding sources; and various legal, regulatory and litigation risks; as
well as those additional risks identified in risks factors discussed in the reports filed by the Company
with the SEC, which are available on its website at www.sec.gov. The Company does not undertake
any obligation to update any forward-looking statements for any reason, even if new information
becomes available or other events occur in the future.
2

www.ppbi.com
• In 1983, Pacific Premier Bank (the
“Bank”) was founded and later expanded
into subprime lending
“Bank”) was founded and later expanded
into subprime lending
• By 1999, growing losses prompted the
Bank to refocus its strategy
Bank to refocus its strategy
• In 2000, the current management team
took over and developed a strategic plan to
transform the Bank to a Community Bank
took over and developed a strategic plan to
transform the Bank to a Community Bank
Phase 1 - Recapitalize/Restructure -2000-2002
• Issued $12 million note and warrants
• Lowered the risk profile of the Bank
Phase 2 - Return to Profitability - 2003 -2005
• Grew the balance sheet - multifamily
• Raised $27 million via secondary offering
Phase 3 - Commercial Bank Model 2006-2011
• Business banking and relationship focus
• Raised $15 million Offensive Capital
• Acquired Canyon National Bank from FDIC
in Q1 of 2011, $209 million in assets
in Q1 of 2011, $209 million in assets
3
www.ppbi.com
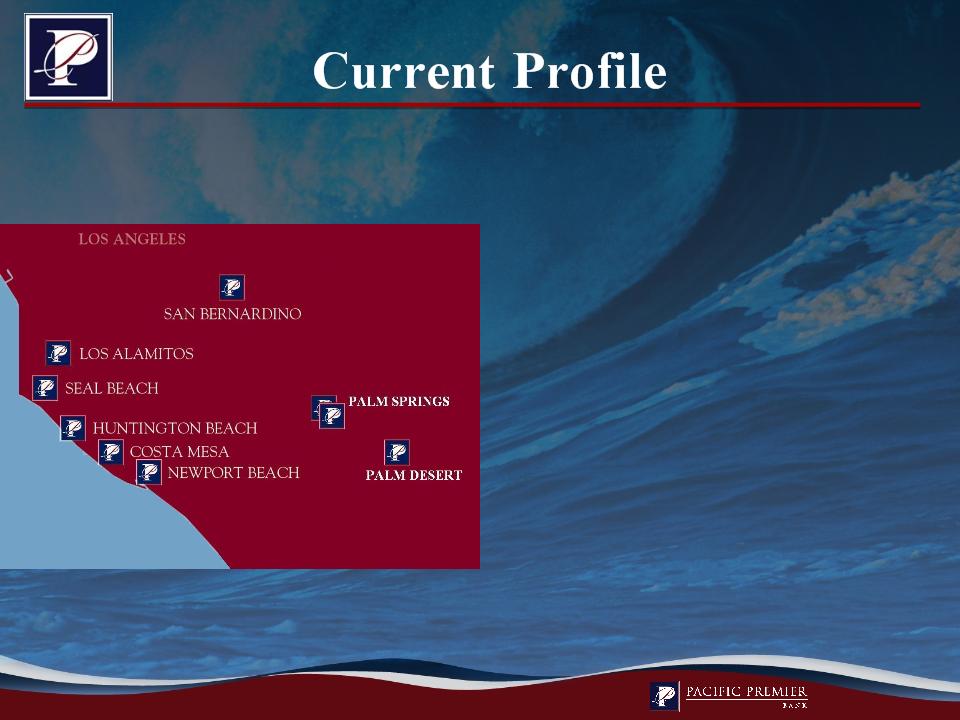
Headquarters: | Costa Mesa, CA |
Business Focus: | Small and middle market businesses |
Total Assets: | $961.1 million |
Branches: | 9 locations |
TCE: | 8.83% |
FD Book Value: | $8.34 |
ROAA YTD: | 1.12% |
ROAE YTD: | 12.91% |
At December 31, 2011
4

www.ppbi.com
Strong Management Team
Name | Position | Age | Experience |
Steve Gardner | President & CEO | 51 | 28 |
Kent Smith | EVP & Chief Financial Officer | 50 | 26 |
Eddie Wilcox | EVP & Chief Banking Officer | 45 | 23 |
Mike Karr | EVP & Chief Credit Officer | 43 | 22 |
Steve Arnold | SVP & General Counsel | 42 | 20 |
Tom Rice | SVP & Chief Information Officer | 40 | 19 |
5
www.ppbi.com
(dollars in thousands) | |||||
Balance Sheets | QTD 12/30/11 | QTD 9/30/11 | QTD 6/30/11 | QTD 3/31/11 | QTD 12/31/10 |
Total assets | $ 961,128 | $ 928,502 | $ 948,111 | $ 956,482 | $ 826,816 |
Net loans | 730,067 | 725,952 | 699,579 | 691,074 | 555,538 |
Total deposits | 828,877 | 797,378 | 815,985 | 832,786 | 659,240 |
Total borrowings | 38,810 | 38,810 | 38,810 | 38,810 | 78,810 |
Statements of Operations | |||||
Net interest income | $ 10,960 | $ 10,231 | $ 10,336 | $ 9,102 | $ 7,533 |
Provision for loan losses | 527 | 1,322 | 1,300 | 106 | 0 |
Noninterest income (loss) | 257 | 2,110 | (1,093) | 5,239 | 14 |
Noninterest expense | 6,616 | 7,074 | 6,855 | 6,359 | 5,009 |
Net income | 2,555 | 2,460 | 785 | 4,772 | 1,600 |
Bank Capital Ratios | |||||
Tier 1 leverage | 9.44 | 9.29 | 8.80 | 9.09 | 10.29 |
Tier 1 risk based | 11.49 | 11.32 | 11.47 | 10.29 | 14.03 |
Total risk based | 12.59 | 12.44 | 12.64 | 11.40 | 15.28 |
6
www.ppbi.com
7
www.ppbi.com
8

www.ppbi.com
• Relationship banking - small/middle market businesses
• Expansion opportunities - FDIC and traditional M&A
• Proactive credit management
• Potential to grow fee income/consumer products
Develop the Bank into one of Southern California’s
top performing commercial banks
top performing commercial banks
9
www.ppbi.com
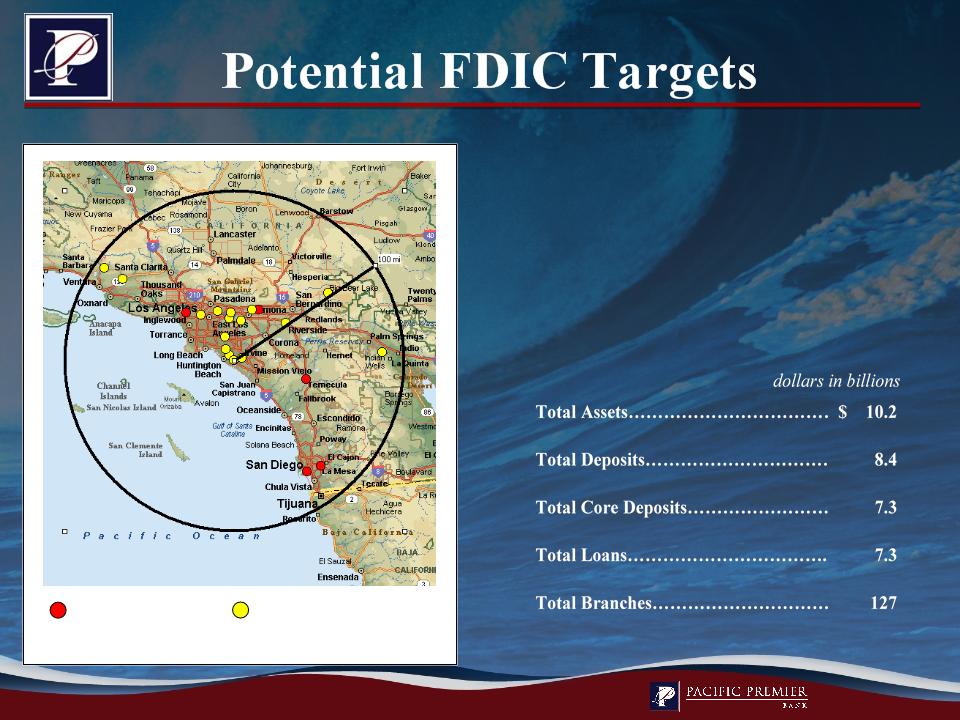
Texas ratio defined as NPAs + 90 days PD / tangible common equity plus
loan loss reserves; Circle radius represents 100 miles
loan loss reserves; Circle radius represents 100 miles
SoCal Stressed Institutions
Possible failures as of September 31, 2011 within 100 miles of Costa Mesa, California | ||
Texas Ratio | # of Institutions | |
Near term | 100% + | 9 |
Longer term | 50% to 100% | 23 |
Possible near and longer term failures
Texas Ratio > 100%
Texas Ratio b/t 50-100%
Source: SNL Financial
10
www.ppbi.com
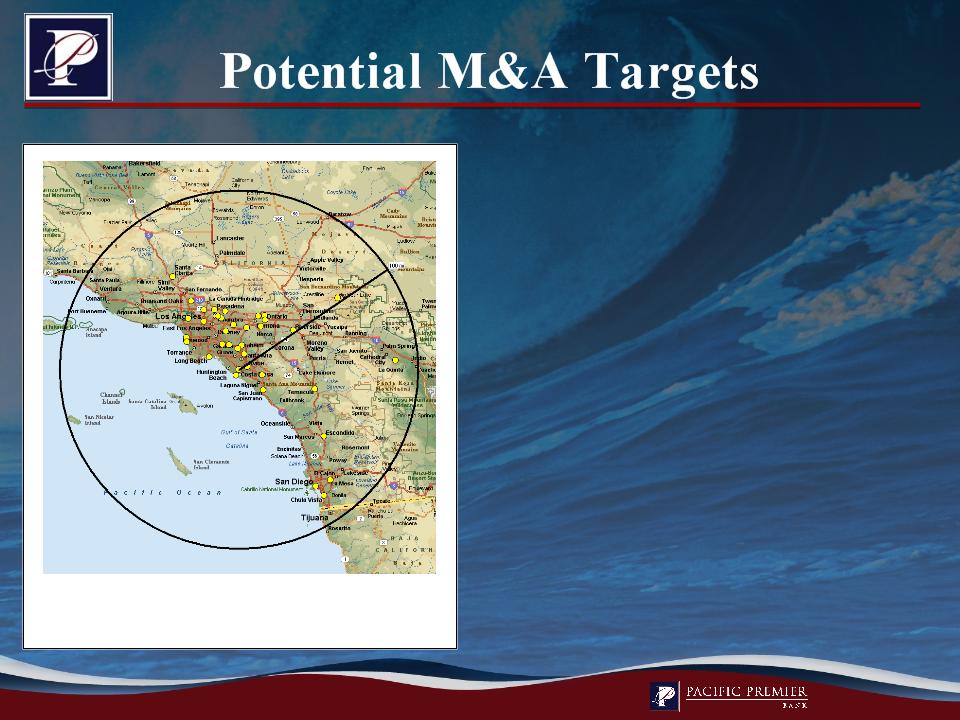
So.Ca. Institutions
Source: SNL Financial
11
Total Assets ………………………………….. | $ 18.2 |
Total Deposits …………………..................... | 14.5 |
Total Core Deposits …………….................... | 12.6 |
Total Loans ……………………..................... | 12.2 |
Total Branches ………………........................ | 236 |
dollars in billions
Potential Targets - $100 to $500 Million 100 miles of Costa Mesa, California | |
# of Institutions | |
$100 to $250 Million | 49 |
$250 to $500 Million | 26 |
www.ppbi.com
1.02%
1.07%
1.40%
Cost - 2.09%
12
0.94%
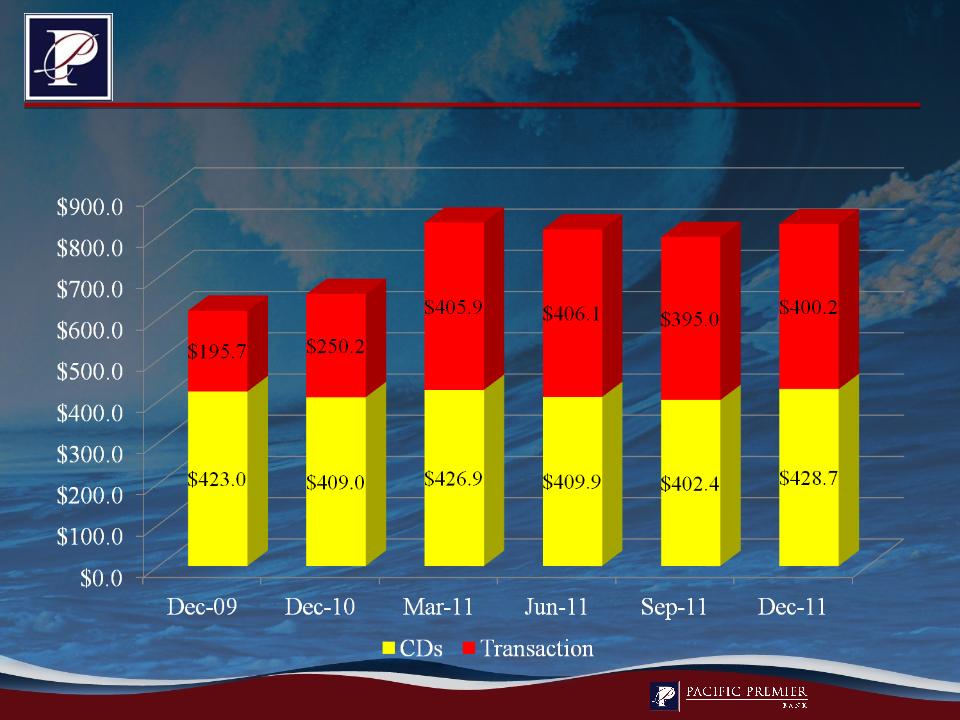
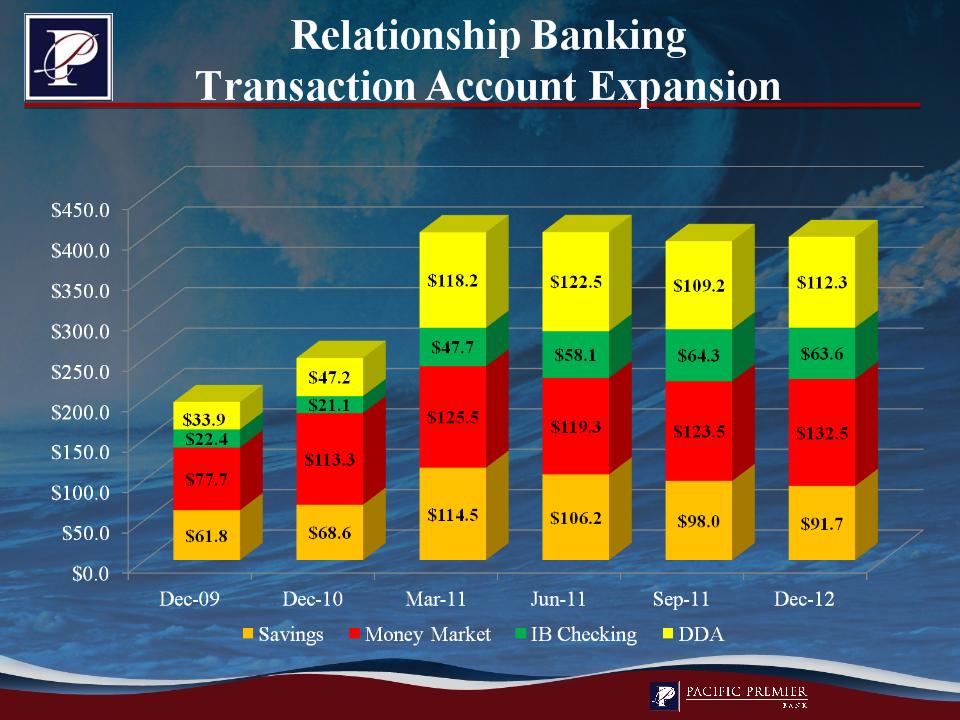
($ in millions)
0.89%
Strong Core Deposit Base
www.ppbi.com
0.34%
0.39%
0.72%
Cost - 0.93%
13
0.37%
($ in millions)
0.37%
www.ppbi.com
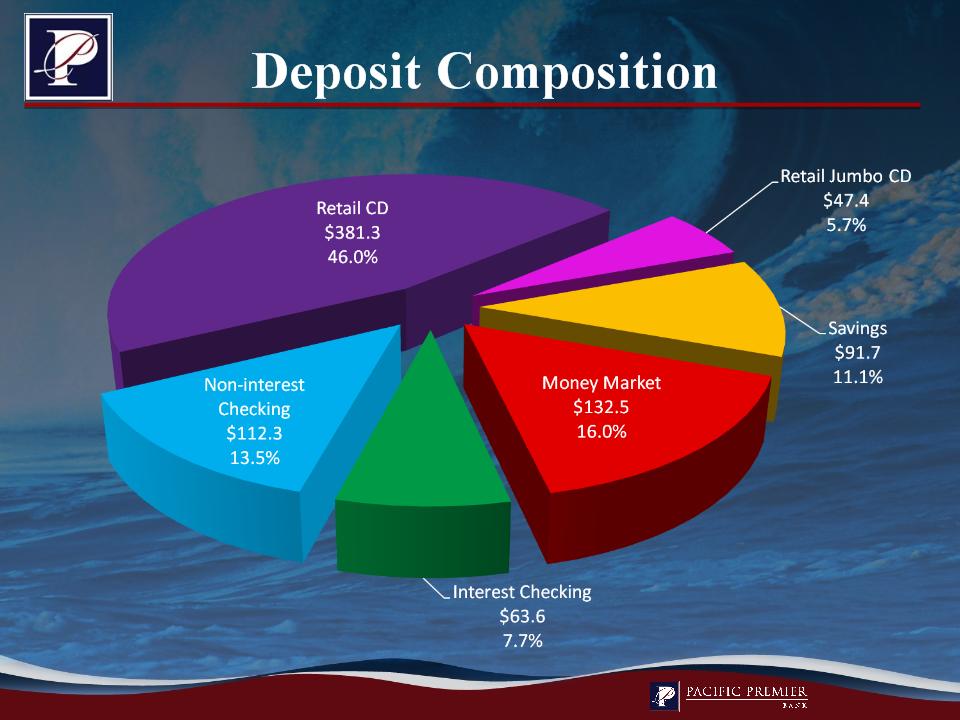
At December 31, 2011
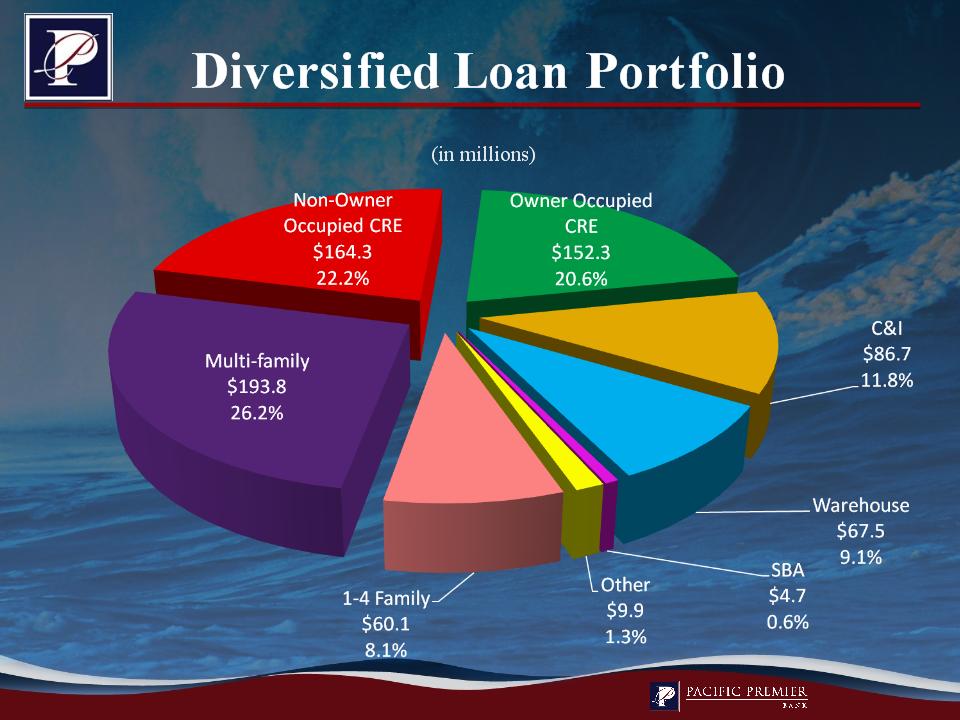
(in millions)
14
www.ppbi.com
• Overall Underwriting Philosophy:
• Global cash flow focused
• Loans:
• Business - owner occupied CRE and C&I
• Investor owned CRE approach
• No CRE TDR, no covenant lite, no high risk lending
• Personal guarantees, cross collateral and cross guarantees
• Proactive Portfolio Management
15
www.ppbi.com
At December 31, 2011
16

www.ppbi.com
Average Loan Size | Average Rate | Seasoning (months) | LTV | DCR | |
Real estate loans: | |||||
Multi-family | $ 972,000 | 6.01% | 62 | 69% | 1.21 |
Non O/O CRE | $ 1,068,000 | 6.56% | 55 | 60% | 1.35 |
Residential 1-4 | $ 187,000 | 5.13% | 38 | 58% | ---- |
Business loans: | |||||
O/O CRE | $ 643,000 | 6.62% | 56 | 62% | ---- |
C & I | $ 265,000 | 5.82% | 35 | ---- | ---- |
Warehouse | $ 8,440,000 | 5.42% | 13 | ---- | ---- |
SBA | $ 135,000 | 6.02% | 23 | ---- | ---- |
At December 31, 2011
17
www.ppbi.com
12/31/11 | 12/31/10 | 12/31/09 | 12/31/08 | |
Balance | $192.4 | $243.6 | $278.7 | $287.6 |
Avg. balance | $0.972 | $1.041 | $1.053 | $1.053 |
Rate | 6.01% | 6.21% | 6.20% | 6.30% |
LTV | 69% | 69% | 67% | 65% |
DCR | 1.21 | 1.20 | 1.20 | 1.47 |
(dollars in millions)
18

www.ppbi.com
Non-owner Occupied CRE
12/31/11 | 12/31/10 | 12/31/09 | 12/31/08 | |
Balance | $163.3 | $130.5 | $149.6 | $163.4 |
Avg. balance | $1.068 | $1.165 | $1.216 | $1.202 |
Rate | 6.56% | 6.66% | 6.85% | 7.04% |
LTV | 60% | 59% | 59% | 57% |
DCR | 1.35 | 1.30 | 1.42 | 1.54 |
(dollars in millions)
19
www.ppbi.com
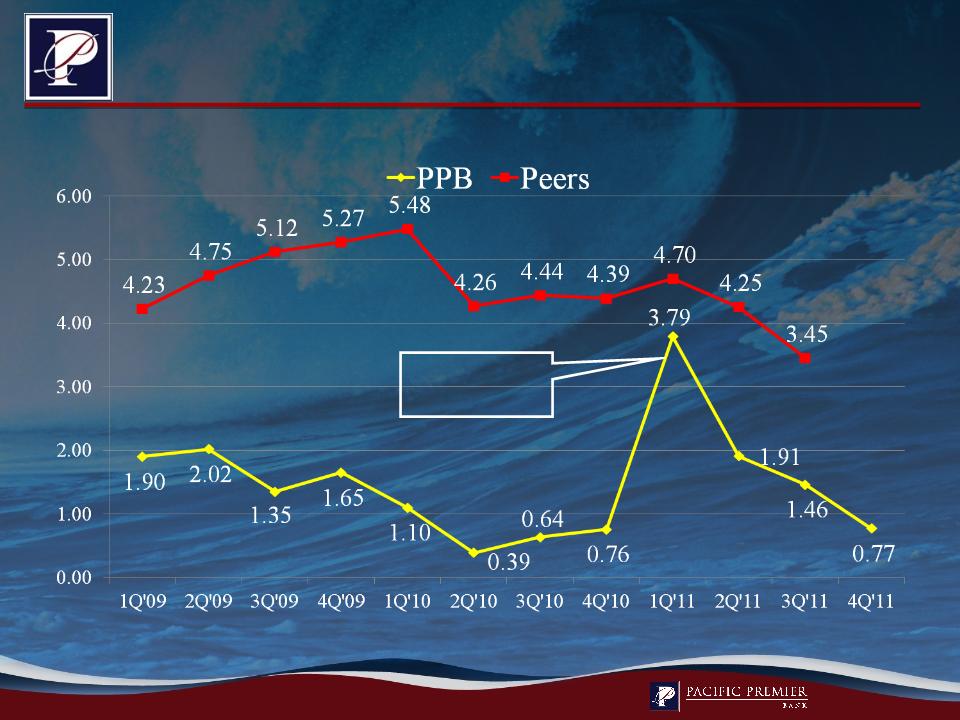
Strong Portfolio Management
Delinquency to Total Loans
California peer group consists of all insured California institutions in the FFIEC database
CNB Acquisition
2/11/11
20
www.ppbi.com
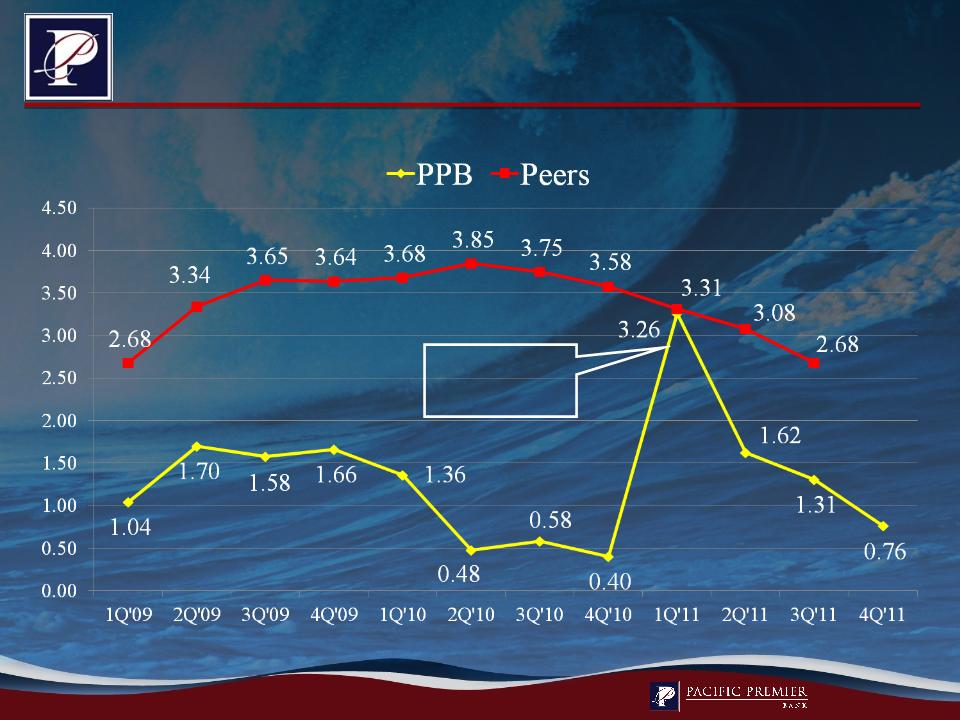
Proactive Asset Management
California peer group consists of all insured California institutions in the FFIEC database
Nonperforming Assets to Total Assets
CNB Acquisition
2/11/11
21
www.ppbi.com
• Bank gaining market share from competitors
• So. CA still one of the best banking markets
• Target rich environment for acquisitions
• Proven management team and track record
22
www.ppbi.com
Questions?
Questions?
23