- PPBI Dashboard
- Financials
- Filings
-
Holdings
- Transcripts
- ETFs
- Insider
- Institutional
- Shorts
-
425 Filing
Pacific Premier Bancorp (PPBI) 425Business combination disclosure
Filed: 12 Dec 12, 12:00am

NASDAQ | PPBI |
Focus | Small & Middle Market Businesses |
Total Assets | $1.089 Billion |
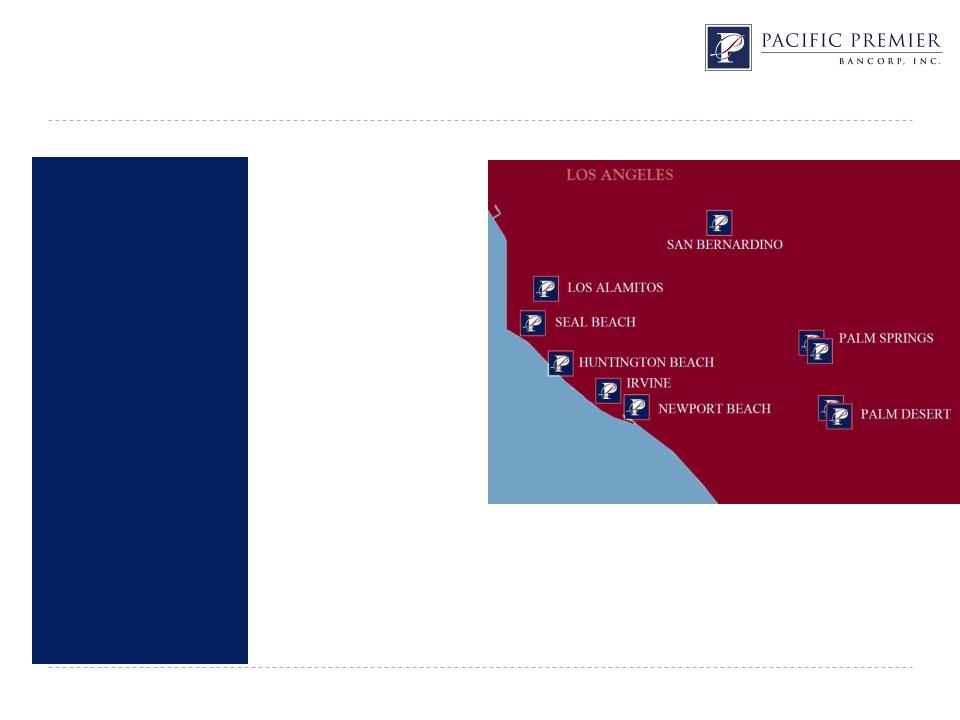
Branches | 10 Locations |
TCE Ratio | 8.94% (1) |
FD Book Value | $9.53 |
Net Income YTD ($000) | $11,965 |
ROAA YTD | 1.56% |
ROAE YTD | 17.23% |
NPAs / Assets | 1.08% |

Strategic Plan - Pre 2008 Stage | o Convert from a Thrift to a Commercial Bank o Diversify the balance sheet, assets and liabilities |
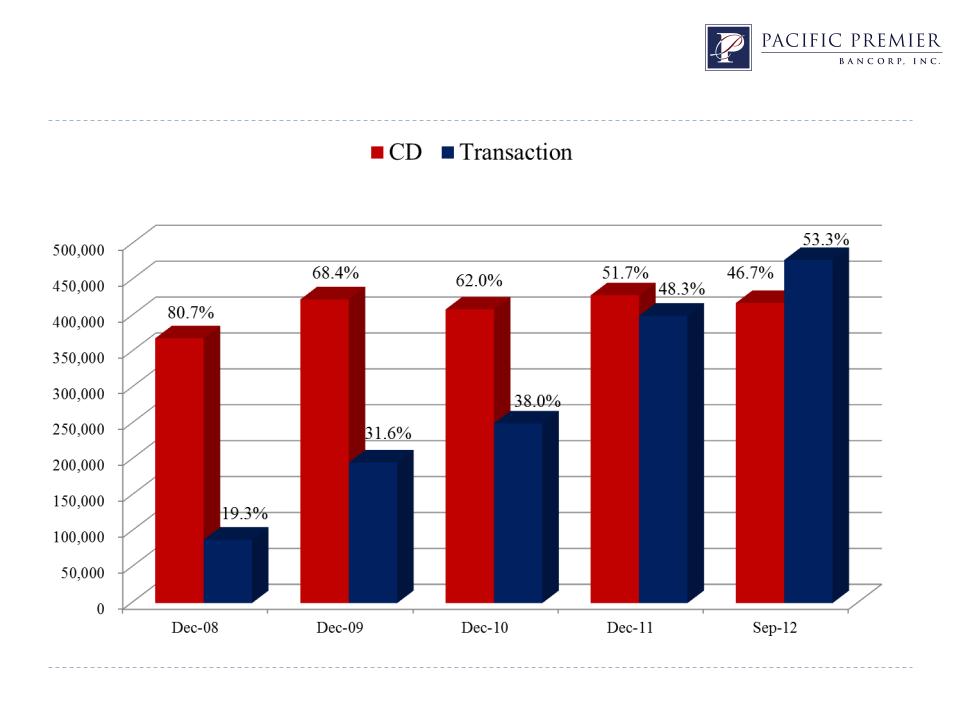
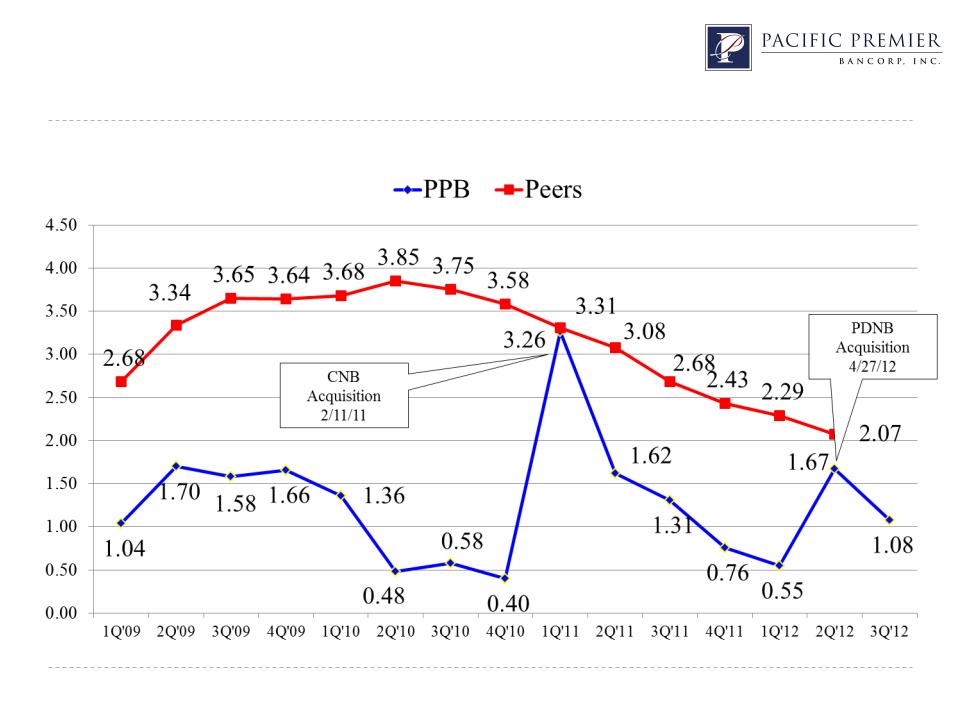
Strategic Plan - Current Stage | o Growth by taking market share from competitors o Growth through disciplined acquisitions o Canyon National Bank - $209 million in assets as of 2/11/11 o Palm Desert National Bank - $121 million in assets as of 4/27/12 o First Associations Bank (Pending) - $356 million in assets as of 9/30/12 o Maintain positive trends in profitability, net interest margin, & credit quality |
Strategic Plan - Next Stage | o $31 million capital raise to support organic growth and acquisitions o Increase fee income - SBA lending o Increase non-interest bearing accounts to 35%+ of deposit base o Build out commercial banking franchise |
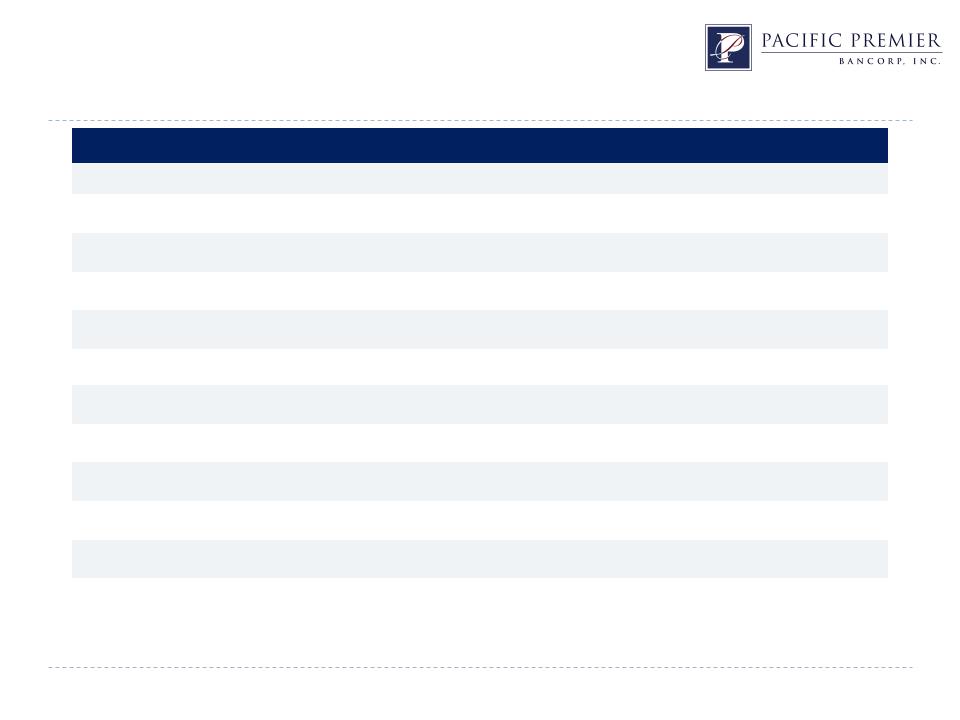
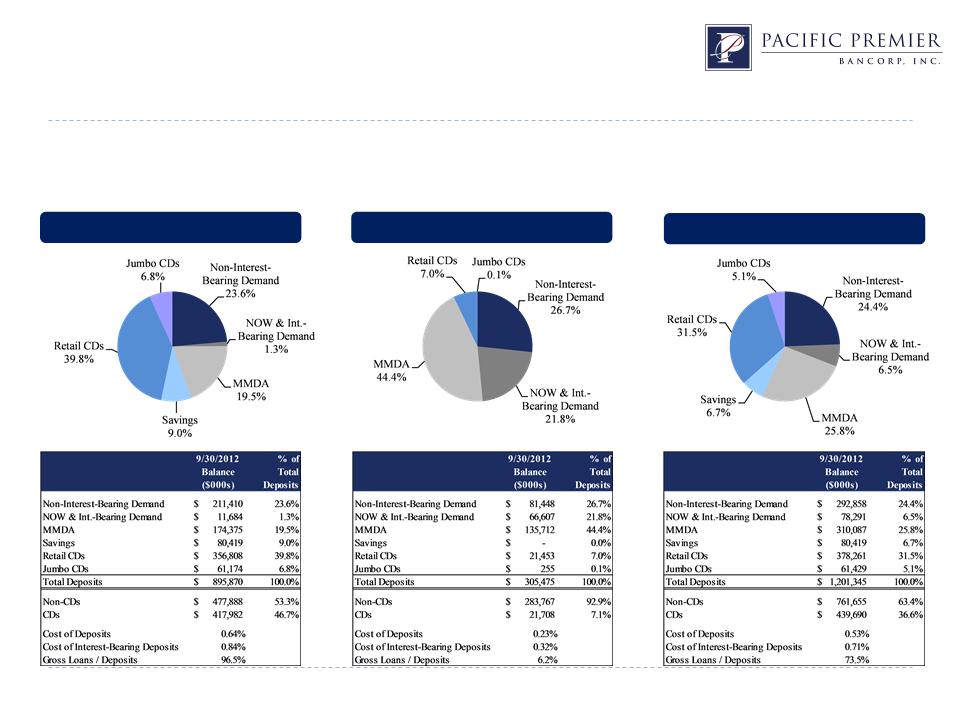
12/31/08 | 9/30/12 | Variance | |
(dollars in thousands) | |||
Transaction Accounts | |||
Noninterest bearing | $29,443 | $211,410 | 618.0% |
Interest bearing checking | 20,989 | 11,684 | (44.3%) |
Money market | 23,463 | 174,375 | 643.2% |
Savings | 14,401 | 80,419 | 458.4% |
Total transaction accounts | 88,296 | 477,888 | 441.2% |
CD Accounts | |||
Time deposits | 341,741 | 471,982 | 38.1% |
Broker/wholesale CDs | 27,091 | 0 | (100.0%) |
Total CDs | 368,832 | 417,982 | 13.3% |
Total deposits | $457,128 | $895,870 | 96.0% |
12/31/08 | 09/30/12 | Variance | |
(dollars in thousands) | |||
Business Loans | |||
Commercial RE owner occupied | $112,406 | $148,139 | 31.8% |
Commercial and industrial | 43,235 | 88,105 | 103.8% |
Warehouse | 0 | 112,053 | n/a |
SBA | 4,942 | 4,736 | (4.2%) |
Total business loans | 160,583 | 353,033 | 119.8% |
CRE Loans | |||
Multi-family | 287,592 | 173,484 | (39.7%) |
Commercial non-owner occupied | 163,428 | 262,046 | 60.3% |
Total CRE loans | 451,020 | 435,530 | (3.4%) |
One-to-four family | 9,925 | 62,771 | 532.5% |
Other loans | 7,239 | 13,504 | 86.5% |
Gross loans | $628,767 | $864,838 | 37.5% |


QTD 9/30/11 | QTD 12/31/11 | QTD 3/31/12 | QTD 6/30/12 | QTD 9/30/12 | |
Balance Sheet | (dollars in thousands, except per share data) | ||||
Total assets | $928,502 | $961,128 | $985,171 | $1,065,035 | $1,089,336 |
Net loans | 725,952 | 730,067 | 687,141 | 790,062 | 856,443 |
Total deposits | 797,378 | 828,877 | 846,717 | 913,191 | 895,870 |
Total borrowings | 38,810 | 38,810 | 38,810 | 38,810 | 85,810 |
Total equity | 84,620 | 86,777 | 89,479 | 96,069 | 99,886 |
Statements of Operations | |||||
Net interest income | $10,231 | $10,960 | $10,041 | $11,282 | $11,854 |
Noninterest income | 2,110 | 257 | 939 | 6,529 | 1,910 |
Noninterest expense | 7,074 | 6,616 | 6,641 | 8,205 | 8,031 |
Net income | 2,460 | 2,555 | 2,692 | 5,811 | 3,462 |
Diluted EPS | $0.23 | $0.24 | $0.25 | $0.55 | $0.32 |
Bank Capital Ratios | |||||
Tier 1 leverage | 9.29% | 9.44% | 9.49% | 9.48% | 9.48% |
Tier 1 risk-based | 11.57% | 11.68% | 12.54% | 11.28% | 11.04% |
Total risk-based | 12.71% | 12.81% | 13.66% | 12.18% | 11.88% |


Total assets ………………………………….. | $ 15.3 |
Total deposits …………………..................... | 12.6 |
Total core deposits …………….................... | 11.0 |
Total loans ……………………..................... | 10.6 |
Total branches ………………........................ | 204 |
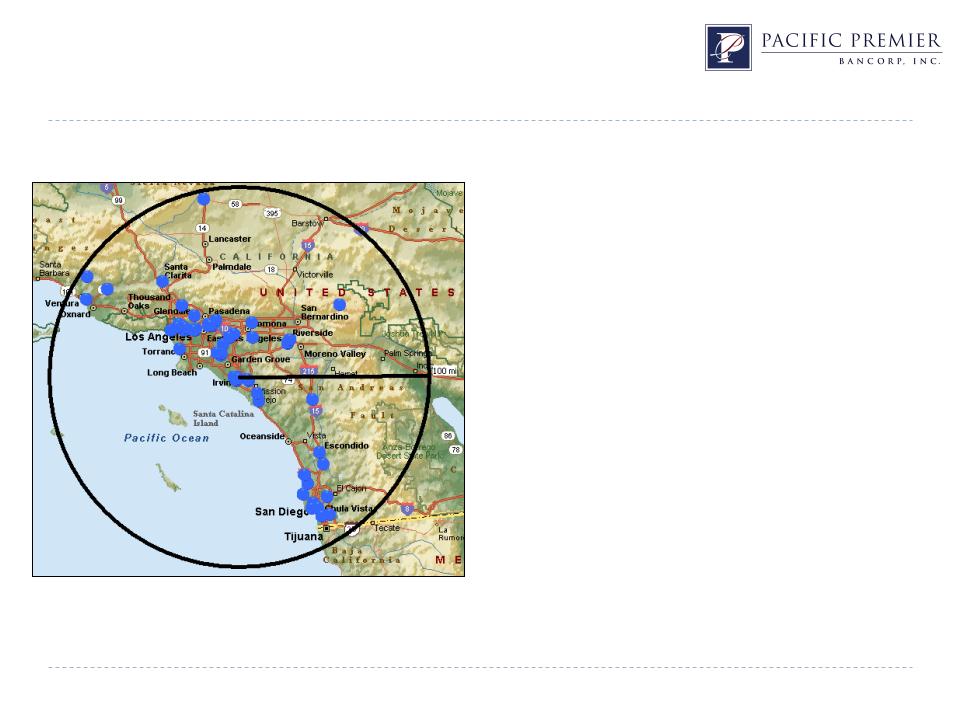
Potential Targets - $100 to $500 million 100 miles from Irvine, California As of September 30, 2012 | |
# of Institutions | |
$100 to $250 million | 43 |
$250 to $500 million | 22 |
Strategic Rationale | o Valuable source of long-term low-cost core deposits o Improves PPBI’s deposit mix and enhances franchise value o HOA Management deposit platform provides additional funding for loan growth |
Attractive Valuation | o Price / tangible book value of 118.2%(1)(2) o Core deposit premium of 2.73%(1) o Price / earnings (last twelve months, tax adjusted)(1)(3) of 17.4x |
Pro Forma Impact to PPBI | o Accretive to EPS beginning in 2013 o Tangible book value payback period approximately 2 years(2)(4) |
Other Transaction Assumptions | o Core deposit intangible asset of $1.5 million, or 0.50% of FAB’s core deposits o Total transaction expenses of approximately $5.1 million |
Preliminary Fair Value Adjustments | o Positive mark on FAB’s HTM securities portfolio from unrealized gain ($5.6 million(1)) o 2.00% fair value mark on FAB’s gross loans |
Cost Savings | o Cost savings of approximately 10.0% (no personnel reduction) o Cost savings are 75.0% phased in during 2013 and 100.0% phased in by 2014 |
Revenue Enhancements | o Readily available liquidity that can be redeployed into PPBI’s commercial banking business model. Additional revenue enhancements from PPBI’s higher cost CD run-off |

PPBI (1) | Pro Forma With FAB (2) | ||
Common Stockholders’ Equity | $99,886 | $109,367 | |
Less: Intangible Assets | $2,703 | $7,840 | |
Tangible Common Equity | $97,183 | $101,527 | |
Book Value per Share | $9.66 | $9.41 | |
Less: Intangible Assets per Share | $0.26 | $0.67 | |
Tangible Book Value per Share | $9.40 | $8.74 | |
Total Assets | $1,089,336 | $1,409,139 | |
Less: Intangible Assets | $2,703 | $7,840 | |
Tangible Assets | $1,086,633 | $1,401,299 | |
Tangible Common Equity Ratio | 8.94% | 7.25% |