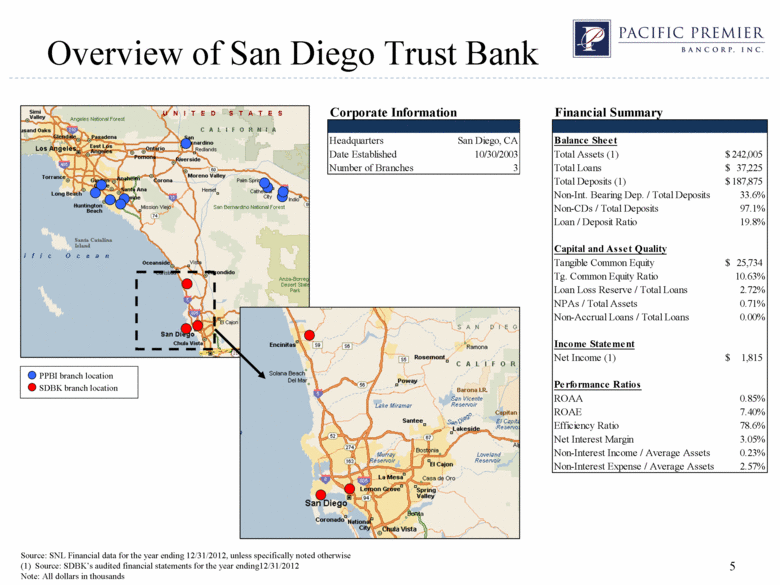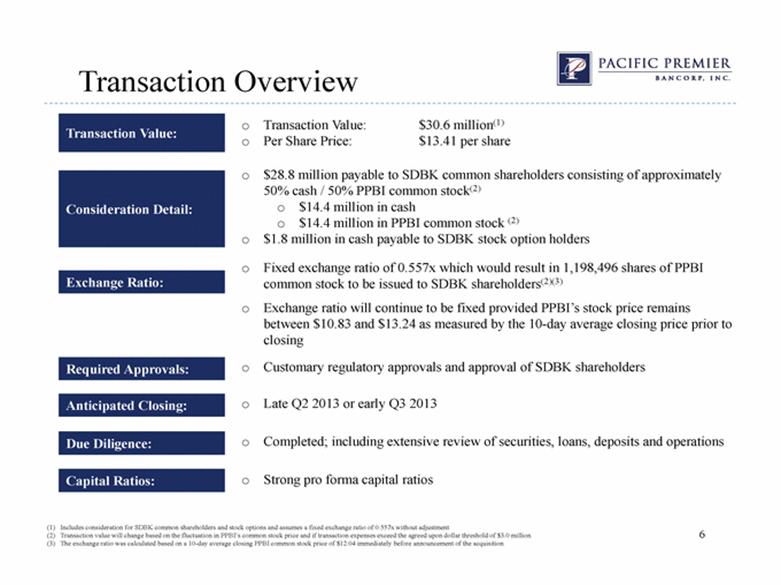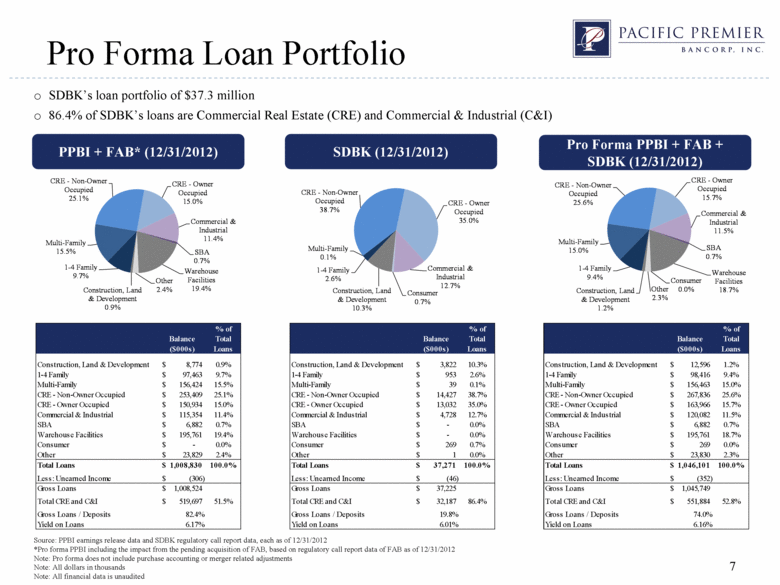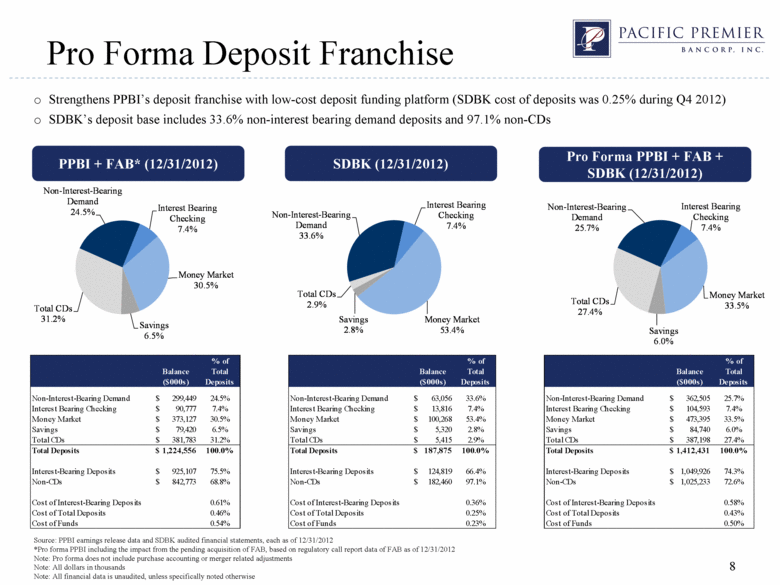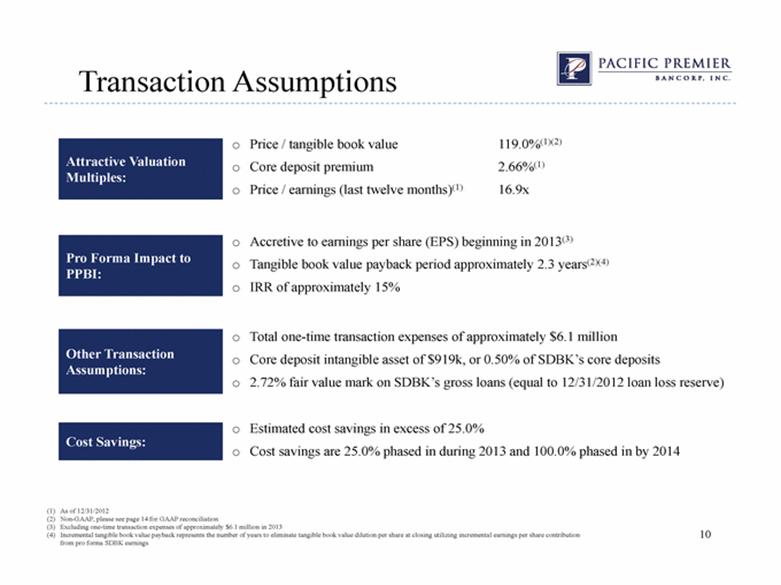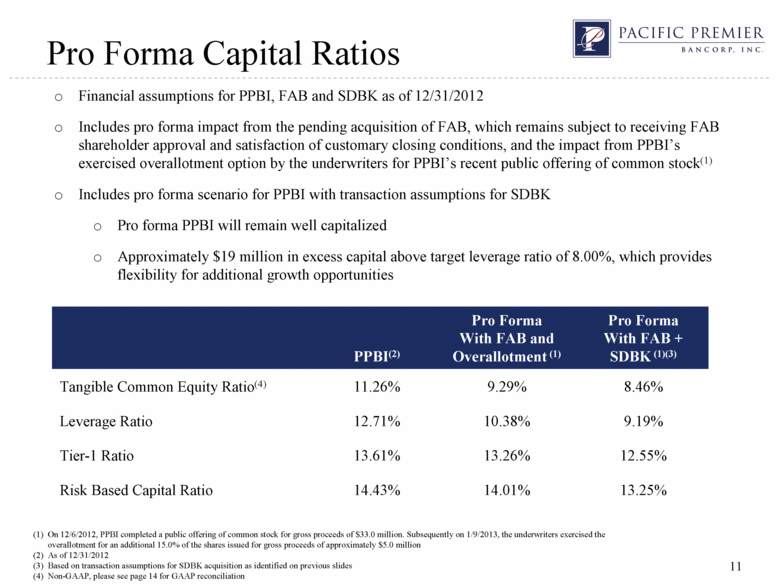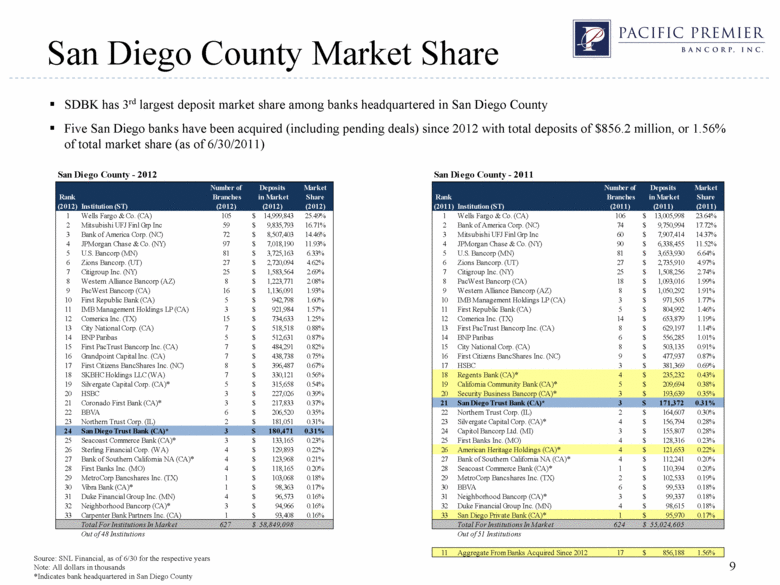
| San Diego County Market Share Source: SNL Financial, as of 6/30 for the respective years Note: All dollars in thousands *Indicates bank headquartered in San Diego County 9 SDBK has 3rd largest deposit market share among banks headquartered in San Diego County Five San Diego banks have been acquired (including pending deals) since 2012 with total deposits of $856.2 million, or 1.56% of total market share (as of 6/30/2011) Rank (2012) Institution (ST) Number of Branches (2012) Deposits in Market (2012) Market Share (2012) Rank (2011) Institution (ST) Number of Branches (2011) Deposits in Market (2011) Market Share (2011) 1 Wells Fargo & Co. (CA) 105 14,999,843 $ 25.49% 1 Wells Fargo & Co. (CA) 106 13,005,998 $ 23.64% 2 Mitsubishi UFJ Finl Grp Inc 59 9,835,793 $ 16.71% 2 Bank of America Corp. (NC) 74 9,750,994 $ 17.72% 3 Bank of America Corp. (NC) 72 8,507,403 $ 14.46% 3 Mitsubishi UFJ Finl Grp Inc 60 7,907,414 $ 14.37% 4 JPMorgan Chase & Co. (NY) 97 7,018,190 $ 11.93% 4 JPMorgan Chase & Co. (NY) 90 6,338,455 $ 11.52% 5 U.S. Bancorp (MN) 81 3,725,163 $ 6.33% 5 U.S. Bancorp (MN) 81 3,653,930 $ 6.64% 6 Zions Bancorp. (UT) 27 2,720,094 $ 4.62% 6 Zions Bancorp. (UT) 27 2,735,910 $ 4.97% 7 Citigroup Inc. (NY) 25 1,583,564 $ 2.69% 7 Citigroup Inc. (NY) 25 1,508,256 $ 2.74% 8 Western Alliance Bancorp (AZ) 8 1,223,771 $ 2.08% 8 PacWest Bancorp (CA) 18 1,093,016 $ 1.99% 9 PacWest Bancorp (CA) 16 1,136,091 $ 1.93% 9 Western Alliance Bancorp (AZ) 8 1,050,292 $ 1.91% 10 First Republic Bank (CA) 5 942,798 $ 1.60% 10 IMB Management Holdings LP (CA) 3 971,505 $ 1.77% 11 IMB Management Holdings LP (CA) 3 921,984 $ 1.57% 11 First Republic Bank (CA) 5 804,992 $ 1.46% 12 Comerica Inc. (TX) 15 734,633 $ 1.25% 12 Comerica Inc. (TX) 14 653,879 $ 1.19% 13 City National Corp. (CA) 7 518,518 $ 0.88% 13 First PacTrust Bancorp Inc. (CA) 8 629,197 $ 1.14% 14 BNP Paribas 5 512,631 $ 0.87% 14 BNP Paribas 6 556,285 $ 1.01% 15 First PacTrust Bancorp Inc. (CA) 7 484,291 $ 0.82% 15 City National Corp. (CA) 8 503,135 $ 0.91% 16 Grandpoint Capital Inc. (CA) 7 438,738 $ 0.75% 16 First Citizens BancShares Inc. (NC) 9 477,937 $ 0.87% 17 First Citizens BancShares Inc. (NC) 8 396,487 $ 0.67% 17 HSBC 3 381,369 $ 0.69% 18 SKBHC Holdings LLC (WA) 7 330,121 $ 0.56% 18 Regents Bank (CA)* 4 235,232 $ 0.43% 19 Silvergate Capital Corp. (CA)* 5 315,658 $ 0.54% 19 California Community Bank (CA)* 5 209,694 $ 0.38% 20 HSBC 3 227,026 $ 0.39% 20 Security Business Bancorp (CA)* 3 193,639 $ 0.35% 21 Coronado First Bank (CA)* 3 217,833 $ 0.37% 21 San Diego Trust Bank (CA)* 3 171,372 $ 0.31% 22 BBVA 6 206,520 $ 0.35% 22 Northern Trust Corp. (IL) 2 164,607 $ 0.30% 23 Northern Trust Corp. (IL) 2 181,051 $ 0.31% 23 Silvergate Capital Corp. (CA)* 4 156,794 $ 0.28% 24 San Diego Trust Bank (CA)* 3 180,471 $ 0.31% 24 Capitol Bancorp Ltd. (MI) 3 155,807 $ 0.28% 25 Seacoast Commerce Bank (CA)* 3 133,165 $ 0.23% 25 First Banks Inc. (MO) 4 128,316 $ 0.23% 26 Sterling Financial Corp. (WA) 4 129,893 $ 0.22% 26 American Heritage Holdings (CA)* 4 121,653 $ 0.22% 27 Bank of Southern California NA (CA)* 4 123,968 $ 0.21% 27 Bank of Southern California NA (CA)* 4 112,241 $ 0.20% 28 First Banks Inc. (MO) 4 118,165 $ 0.20% 28 Seacoast Commerce Bank (CA)* 1 110,394 $ 0.20% 29 MetroCorp Bancshares Inc. (TX) 1 103,068 $ 0.18% 29 MetroCorp Bancshares Inc. (TX) 2 102,533 $ 0.19% 30 Vibra Bank (CA)* 1 98,363 $ 0.17% 30 BBVA 6 99,533 $ 0.18% 31 Duke Financial Group Inc. (MN) 4 96,573 $ 0.16% 31 Neighborhood Bancorp (CA)* 3 99,337 $ 0.18% 32 Neighborhood Bancorp (CA)* 3 94,966 $ 0.16% 32 Duke Financial Group Inc. (MN) 4 98,615 $ 0.18% 33 Carpenter Bank Partners Inc. (CA) 1 93,408 $ 0.16% 33 San Diego Private Bank (CA)* 1 95,970 $ 0.17% Total For Institutions In Market 627 $ 58,849,098 Total For Institutions In Market 624 $ 55,024,605 Out of 48 Institutions Out of 51 Institutions 11 Aggregate From Banks Acquired Since 2012 17 856,188 $ 1.56% San Diego County - 2012 San Diego County - 2011 |
