Exhibit 99.1

Link to searchable text of slide shown above
Link to searchable text of slide shown above
Link to searchable text of slide shown above
Link to searchable text of slide shown above
Link to searchable text of slide shown above
Link to searchable text of slide shown above
Link to searchable text of slide shown above
Link to searchable text of slide shown above
Link to searchable text of slide shown above
Link to searchable text of slide shown above
Link to searchable text of slide shown above
Link to searchable text of slide shown above
Link to searchable text of slide shown above

Link to searchable text of slide shown above
Link to searchable text of slide shown above
Link to searchable text of slide shown above
Link to searchable text of slide shown above

Link to searchable text of slide shown above
Searchable text section of graphics shown above
Exhibit 99.1
[GRAPHIC]
[LOGO]
Regulation FD
This presentation may include forward-looking statements. These forward-looking statements include comments with respect to our objectives and strategies, and the results of our operations and our business.
However, by their nature, these forward-looking statements involve numerous assumptions, uncertainties and opportunities, both general and specific. The risk exists that these statements may not be fulfilled. We caution readers of this presentation not to place undue reliance on these forward-looking statements as a number of factors could cause future company results to differ materially from these statements.
Forward-looking statements may be influenced in particular by factors such as fluctuations in interest rates and stock indices, the effects of competition in the areas in which we operate, and changes in economic, political, regulatory and technological conditions. We caution that the foregoing list is not exhaustive. When relying on forward-looking statements to make decisions, investors should carefully consider the aforementioned factors as well as other uncertainties and events.
2
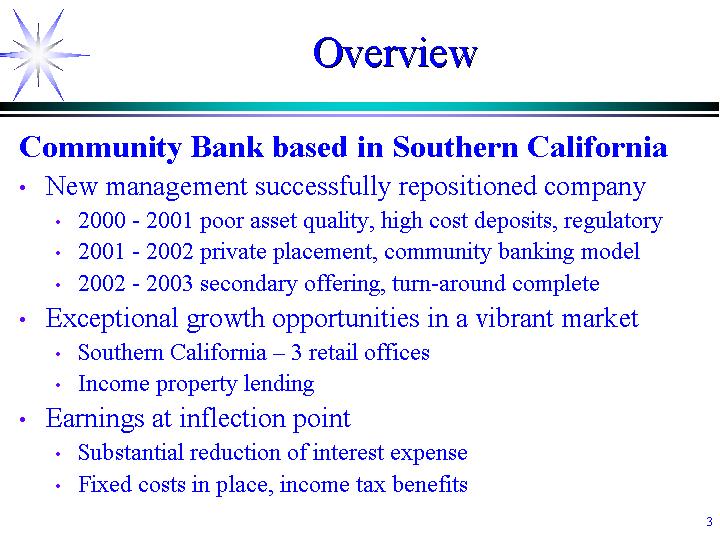
Community Bank based in Southern California
• New management successfully repositioned company
• 2000 - 2001 poor asset quality, high cost deposits, regulatory
• 2001 - 2002 private placement, community banking model
• 2002 - 2003 secondary offering, turn-around complete
• Exceptional growth opportunities in a vibrant market
• Southern California – 3 retail offices
• Income property lending
• Earnings at inflection point
• Substantial reduction of interest expense
• Fixed costs in place, income tax benefits
3
Name (Age) |
| Position |
| Years |
|
|
|
|
|
|
|
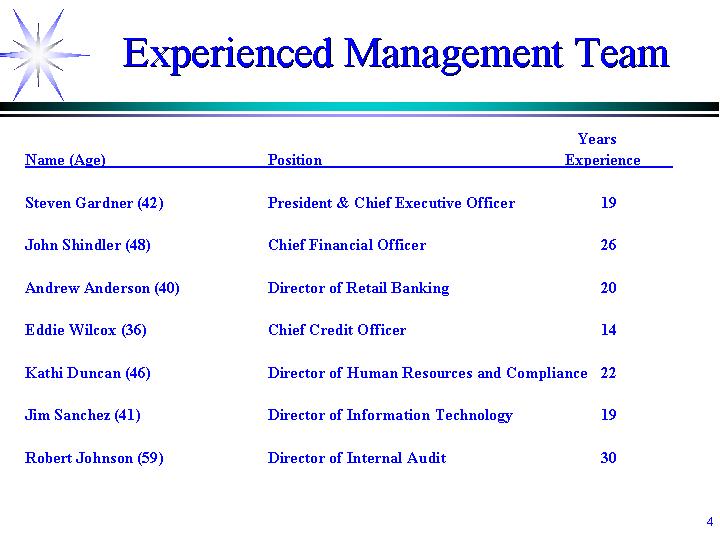
Steven Gardner (42) |
| President & Chief Executive Officer |
| 19 |
|
|
|
|
|
|
|
John Shindler (48) |
| Chief Financial Officer |
| 26 |
|
|
|
|
|
|
|
Andrew Anderson (40) |
| Director of Retail Banking |
| 20 |
|
|
|
|
|
|
|
Eddie Wilcox (36) |
| Chief Credit Officer |
| 14 |
|
|
|
|
|
|
|
Kathi Duncan (46) |
| Director of Human Resources and Compliance |
| 22 |
|
|
|
|
|
|
|
Jim Sanchez (41) |
| Director of Information Technology |
| 19 |
|
|
|
|
|
|
|
Robert Johnson (59) |
| Director of Internal Audit |
| 30 |
|
4
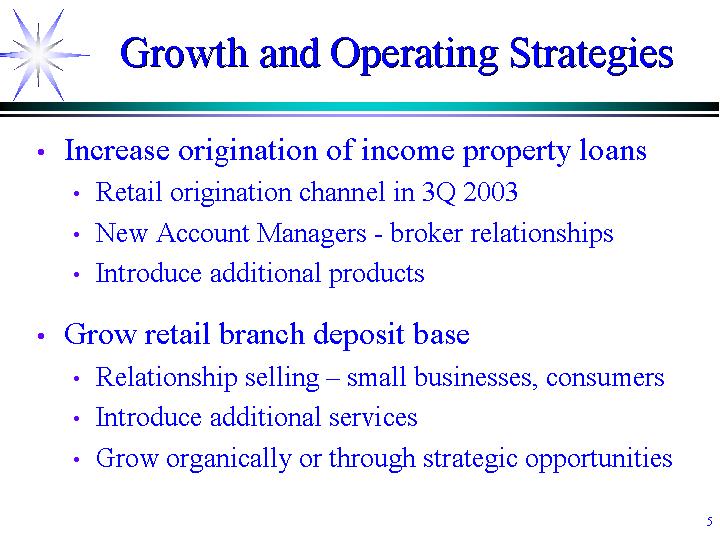
Growth and Operating Strategies
• Increase origination of income property loans
• Retail origination channel in 3Q 2003
• New Account Managers - broker relationships
• Introduce additional products
• Grow retail branch deposit base
• Relationship selling – small businesses, consumers
• Introduce additional services
• Grow organically or through strategic opportunities
5
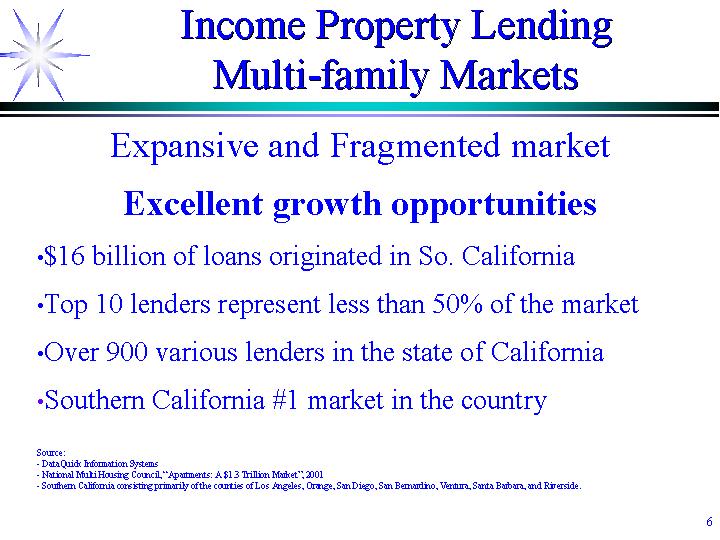
Income Property Lending
Multi-family Markets
Expansive and Fragmented market
Excellent growth opportunities
• $16 billion of loans originated in So. California
• Top 10 lenders represent less than 50% of the market
• Over 900 various lenders in the state of California
• Southern California #1 market in the country
Source:
• DataQuick Information Systems
• National Multi Housing Council, “Apartments: A $1.3 Trillion Market”, 2001
• Southern California consisting primarily of the counties of Los Angeles, Orange, San Diego, San Bernardino, Ventura, Santa Barbara, and Riverside.
6
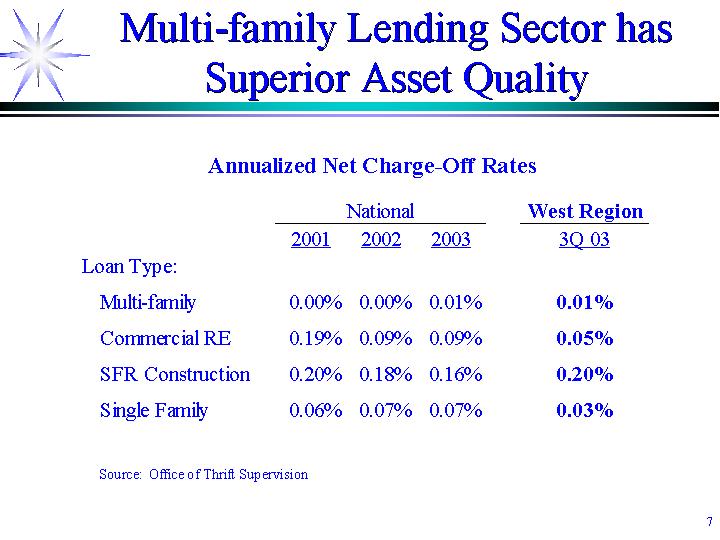
Multi-family Lending Sector has
Superior Asset Quality
Annualized Net Charge-Off Rates
|
| National |
| West Region |
| ||||
|
| 2001 |
| 2002 |
| 2003 |
| 3Q 03 |
|
Loan Type: |
|
|
|
|
|
|
|
|
|
Multi-family |
| 0.00 | % | 0.00 | % | 0.01 | % | 0.01 | % |
Commercial RE |
| 0.19 | % | 0.09 | % | 0.09 | % | 0.05 | % |
SFR Construction |
| 0.20 | % | 0.18 | % | 0.16 | % | 0.20 | % |
Single Family |
| 0.06 | % | 0.07 | % | 0.07 | % | 0.03 | % |
Source: Office of Thrift Supervision
7
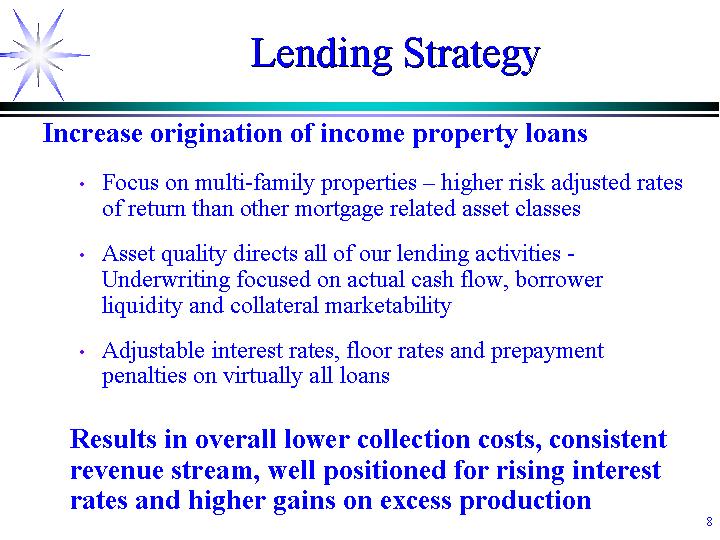
Increase origination of income property loans
• Focus on multi-family properties – higher risk adjusted rates of return than other mortgage related asset classes
• Asset quality directs all of our lending activities - Underwriting focused on actual cash flow, borrower liquidity and collateral marketability
• Adjustable interest rates, floor rates and prepayment penalties on virtually all loans
Results in overall lower collection costs, consistent revenue stream, well positioned for rising interest rates and higher gains on excess production
8
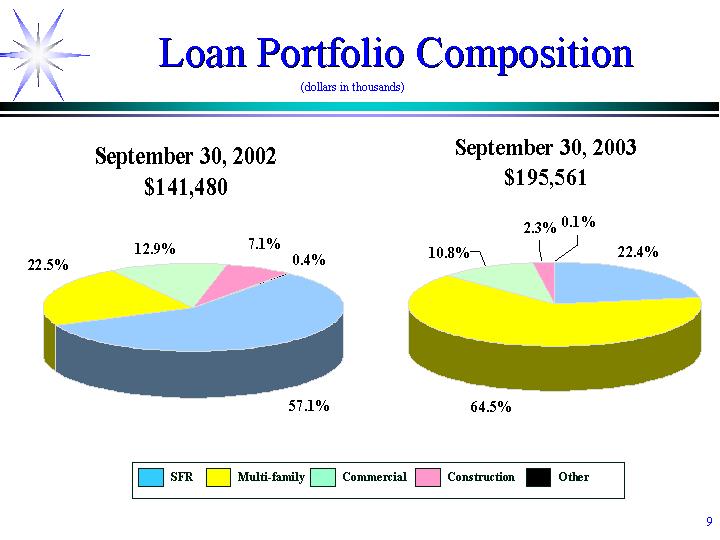
(dollars in thousands)
September 30, 2002
$141,480
[CHART]
September 30, 2003
$ 195,561
[CHART]
9
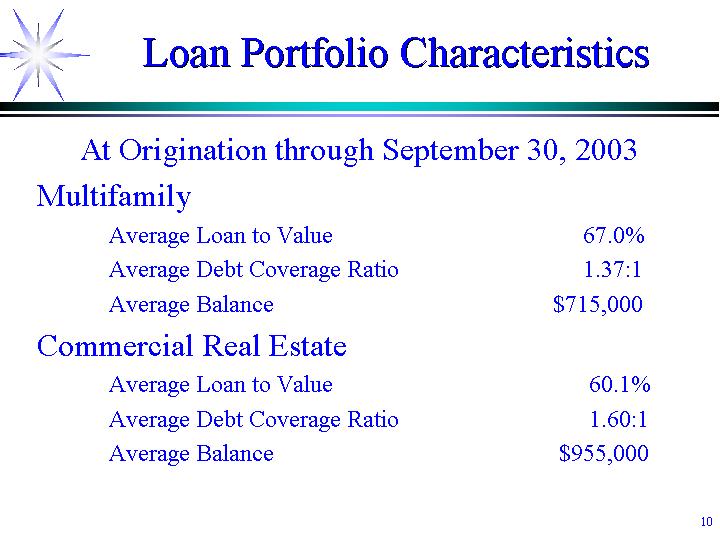
Loan Portfolio Characteristics
At Origination through September 30, 2003
Multifamily |
|
|
| |
Average Loan to Value |
| 67.0 | % | |
Average Debt Coverage Ratio |
| 1.37:1 |
| |
Average Balance |
| $ | 715,000 |
|
|
|
|
| |
Commercial Real Estate |
|
|
| |
Average Loan to Value |
| 60.1 | % | |
Average Debt Coverage Ratio |
| 1.60:1 |
| |
Average Balance |
| $ | 955,000 |
|
10
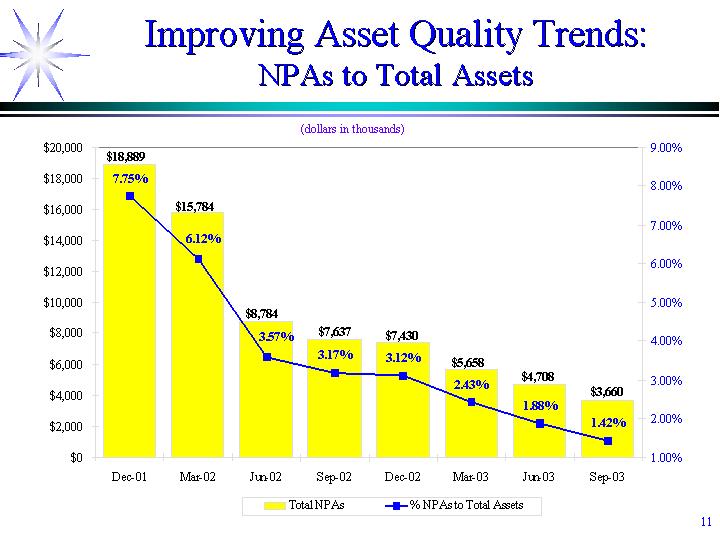
Improving Asset Quality Trends:
NPAs to Total Assets
(dollars in thousands)
[CHART]
11
Grow retail branch deposit base
• Increase transaction accounts with emphasis on relationship banking with small business owners
• Enhanced product offerings – community bank product menu
• Cross-sell of various products and services, multiple accounts per customer to ensure they are “fully banked”
Results in stable deposit base, lower funding cost, increased fee income and improved franchise value
12
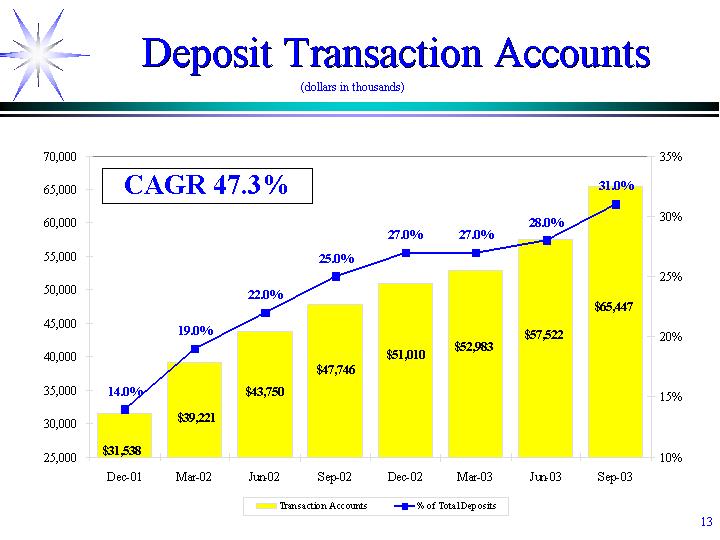
(dollars in thousands)
[CHART]
13
14
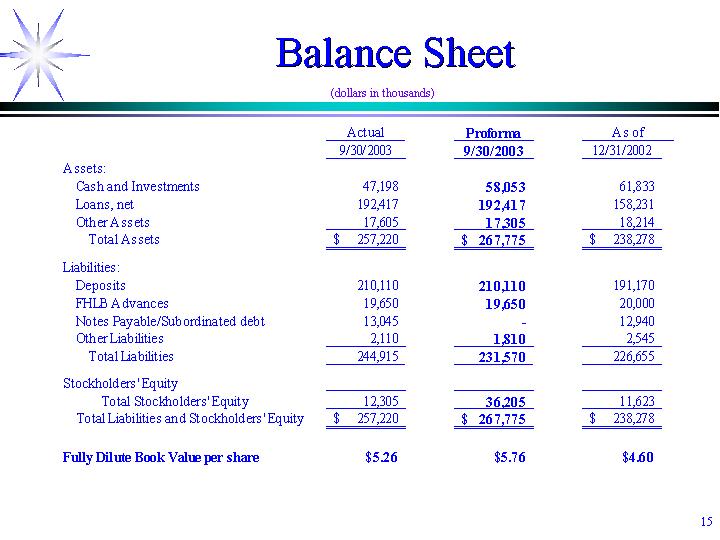
(dollars in thousands)
|
| Actual |
| Proforma |
| As of |
| |||
Assets: |
|
|
|
|
|
|
| |||
Cash and Investments |
| 47,198 |
| 58,053 |
| 61,833 |
| |||
Loans, net |
| 192,417 |
| 192,417 |
| 158,231 |
| |||
Other Assets |
| 17,605 |
| 17,305 |
| 18,214 |
| |||
Total Assets |
| $ | 257,220 |
| $ | 267,775 |
| $ | 238,278 |
|
|
|
|
|
|
|
|
| |||
Liabilities: |
|
|
|
|
|
|
| |||
Deposits |
| 210,110 |
| 210,110 |
| 191,170 |
| |||
FHLB Advances |
| 19,650 |
| 19,650 |
| 20,000 |
| |||
Notes Payable/Subordinated debt |
| 13,045 |
| — |
| 12,940 |
| |||
Other Liabilities |
| 2,110 |
| 1,810 |
| 2,545 |
| |||
Total Liabilities |
| 244,915 |
| 231,570 |
| 226,655 |
| |||
|
|
|
|
|
|
|
| |||
Stockholders’ Equity |
|
|
|
|
|
|
| |||
Total Stockholders’ Equity |
| 12,305 |
| 36,205 |
| 11,623 |
| |||
Total Liabilities and Stockholders’ Equity |
| $ | 257,220 |
| $ | 267,775 |
| $ | 238,278 |
|
|
|
|
|
|
|
|
| |||
Fully Dilute Book Value per share |
| $ | 5.26 |
| $ | 5.76 |
| $ | 4.60 |
|
15
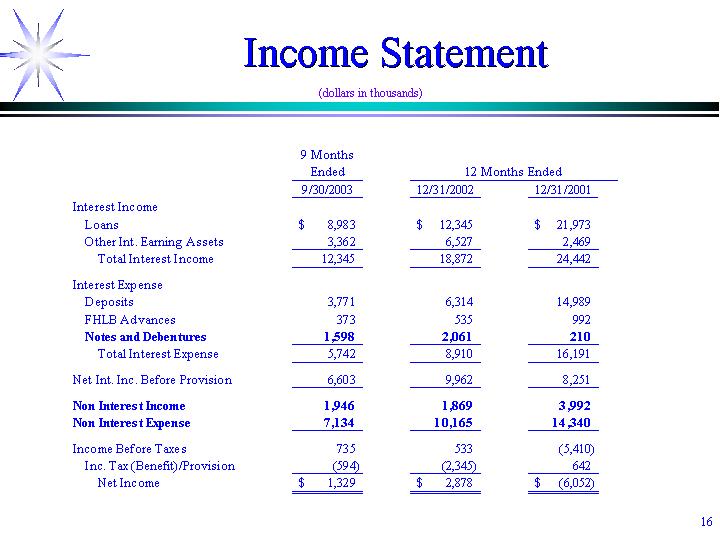
(dollars in thousands)
|
| 9 Months |
|
|
| |||||
|
| 12/31/2002 |
| 12/31/2001 |
| |||||
Interest Income |
|
|
|
|
|
|
| |||
Loans |
| $ | 8,983 |
| $ | 12,345 |
| $ | 21,973 |
|
Other Int. Earning Assets |
| 3,362 |
| 6,527 |
| 2,469 |
| |||
Total Interest Income |
| 12,345 |
| 18,872 |
| 24,442 |
| |||
|
|
|
|
|
|
|
| |||
Interest Expense |
|
|
|
|
|
|
| |||
Deposits |
| 3,771 |
| 6,314 |
| 14,989 |
| |||
FHLB Advances |
| 373 |
| 535 |
| 992 |
| |||
Notes and Debentures |
| 1,598 |
| 2,061 |
| 210 |
| |||
Total Interest Expense |
| 5,742 |
| 8,910 |
| 16,191 |
| |||
|
|
|
|
|
|
|
| |||
Net Int. Inc. Before Provision |
| 6,603 |
| 9,962 |
| 8,251 |
| |||
|
|
|
|
|
|
|
| |||
Non Interest Income |
| 1,946 |
| 1,869 |
| 3,992 |
| |||
Non Interest Expense |
| 7,134 |
| 10,165 |
| 14,340 |
| |||
|
|
|
|
|
|
|
| |||
Income Before Taxes |
| 735 |
| 533 |
| (5,410 | ) | |||
Inc. Tax (Benefit)/Provision |
| (594 | ) | (2,345 | ) | 642 |
| |||
Net Income |
| $ | 1,329 |
| $ | 2,878 |
| $ | (6,052 | ) |
16
• Management repositioned company
• Successful Community Banking business model
• Exceptional growth opportunities
• Southern California
• Earnings at inflection point
• Substantial reduction of interest expense
• Fixed costs in place, income tax benefits
17
[LOGO]
18