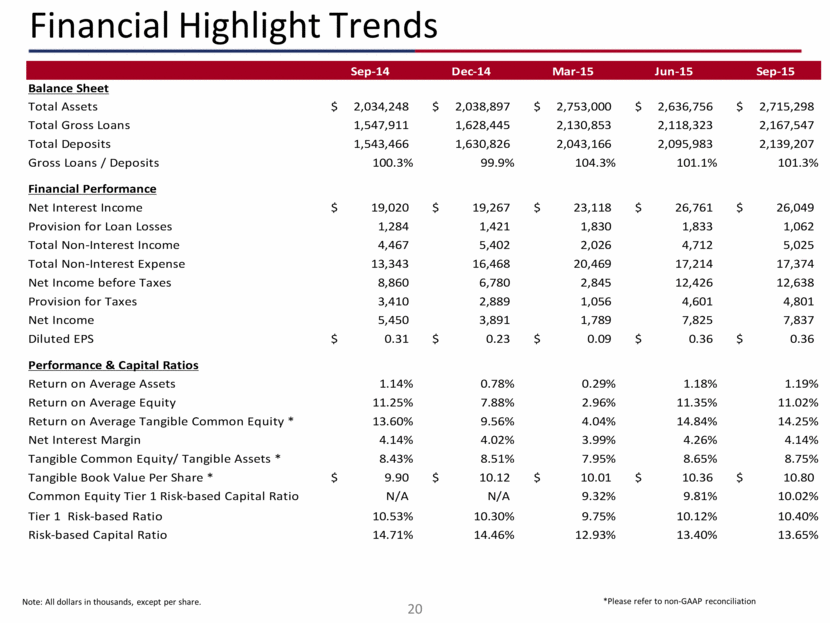
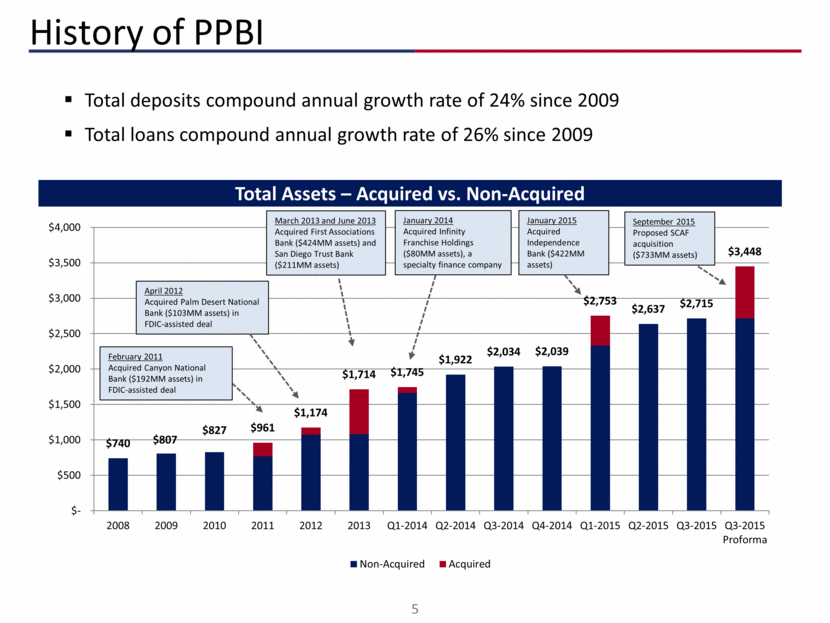
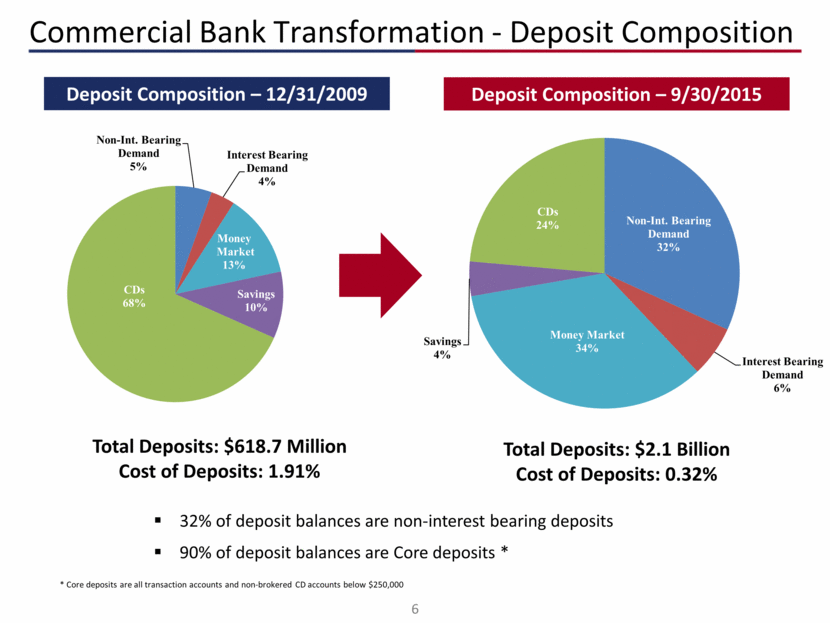
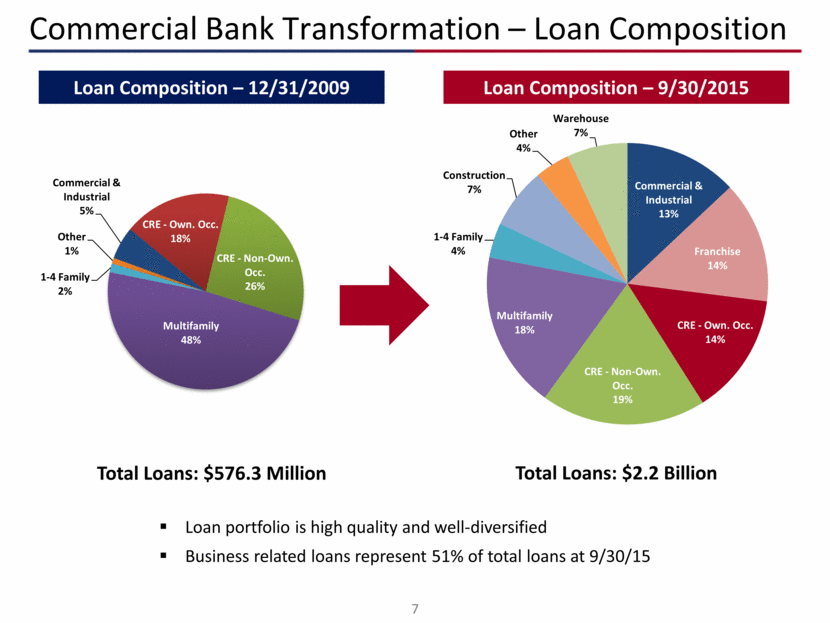
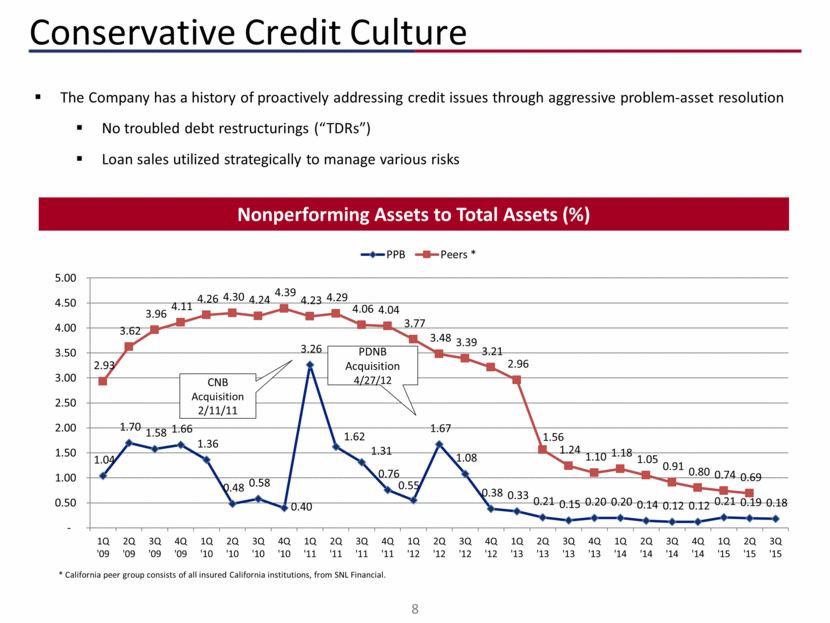
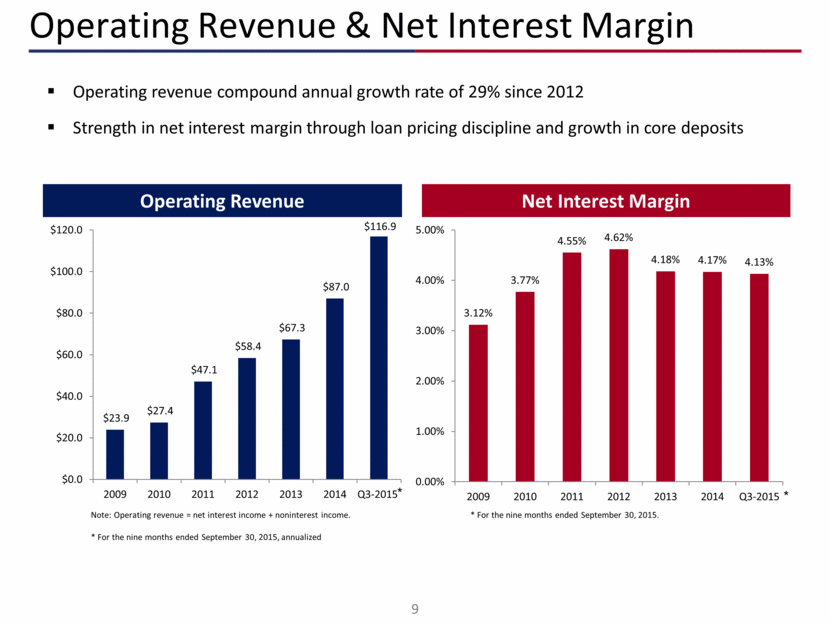
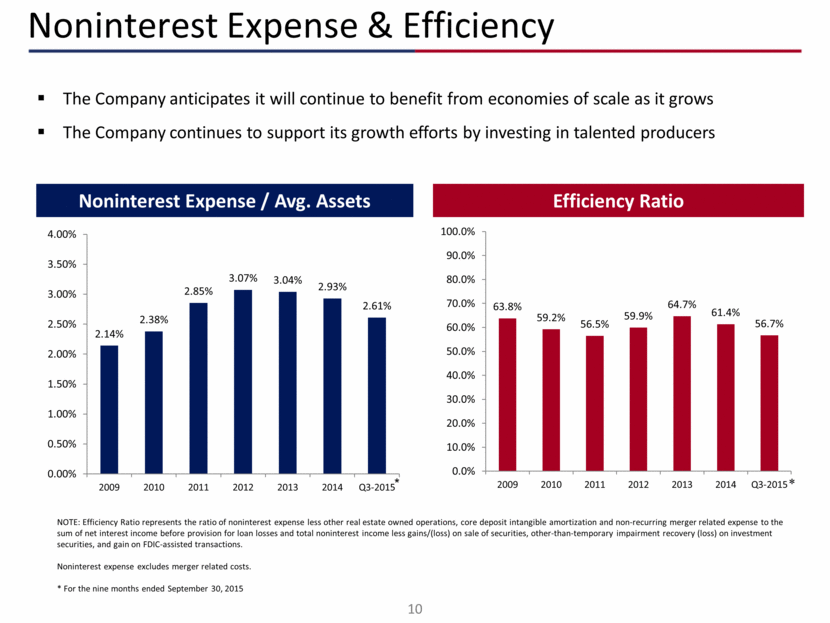
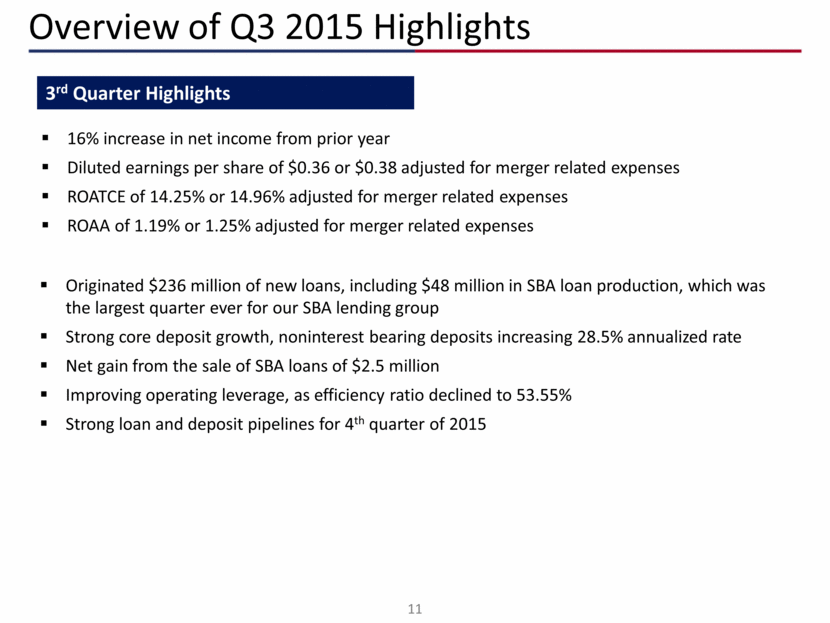
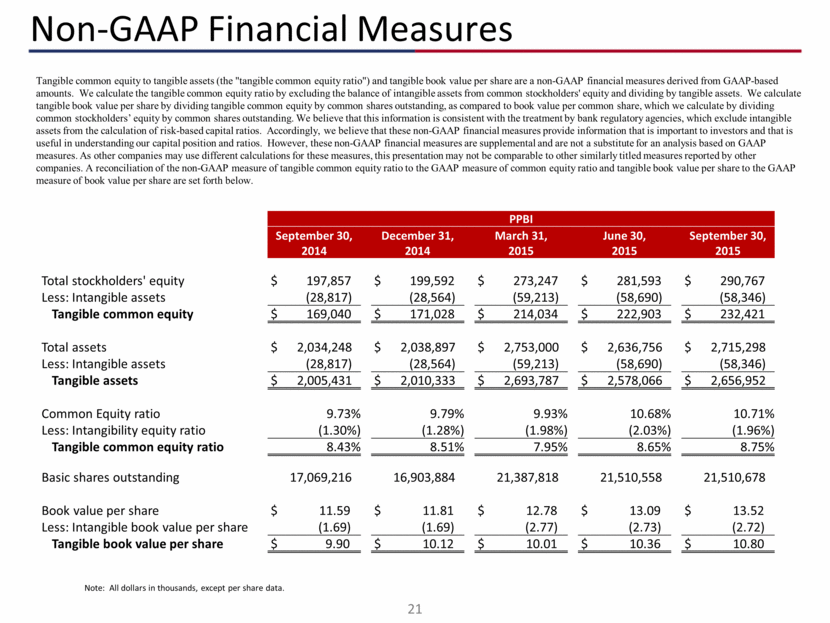
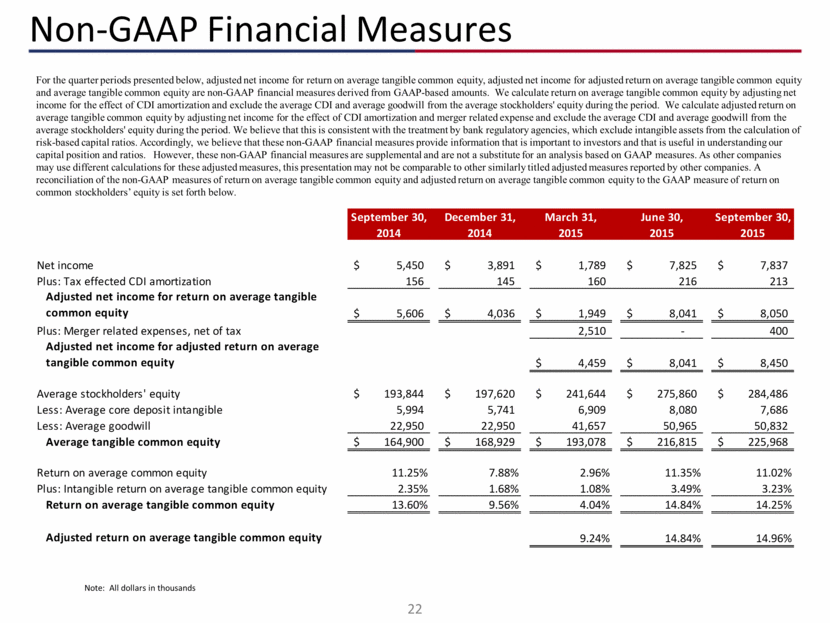
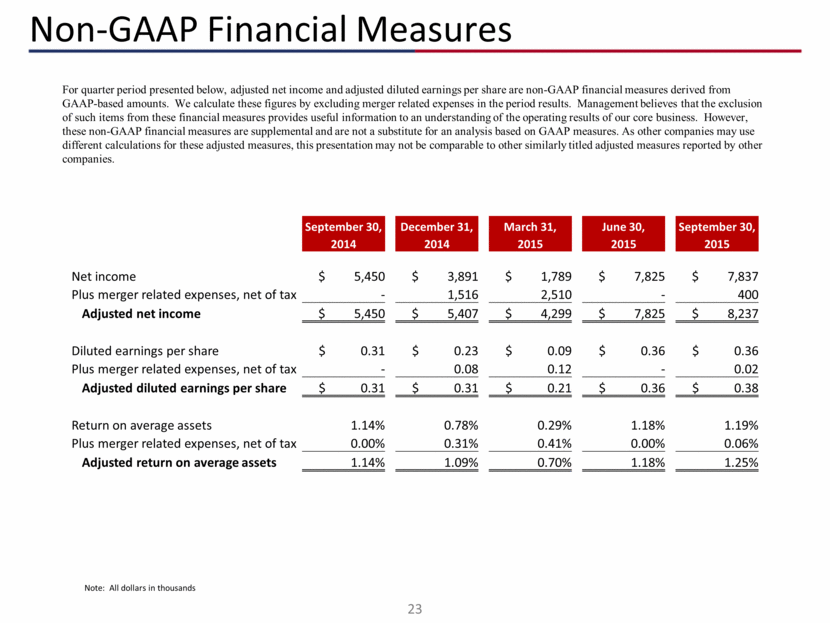
Financial Highlight Trends Note: All dollars in thousands, except per share. *Please refer to non-GAAP reconciliation At And For The Three Months Ended Sep-14 Dec-14 Mar-15 Jun-15 Sep-15 Balance Sheet Total Assets $ 2,034,248 $ 2,038,897 $ 2,753,000 $ 2,636,756 $ 2,715,298 Total Gross Loans 1,547,911 1,628,445 2,130,853 2,118,323 2,167,547 Total Deposits 1,543,466 1,630,826 2,043,166 2,095,983 2,139,207 Gross Loans / Deposits 100.3% 99.9% 104.3% 101.1% 101.3% Financial Performance Net Interest Income $ 19,020 $ 19,267 $ 23,118 $ 26,761 $ 26,049 Provision for Loan Losses 1,284 1,421 1,830 1,833 1,062 Total Non-Interest Income 4,467 5,402 2,026 4,712 5,025 Total Non-Interest Expense 13,343 16,468 20,469 17,214 17,374 Net Income before Taxes 8,860 6,780 2,845 12,426 12,638 Provision for Taxes 3,410 2,889 1,056 4,601 4,801 Net Income 5,450 3,891 1,789 7,825 7,837 Diluted EPS $ 0.31 $ 0.23 $ 0.09 $ 0.36 $ 0.36 Performance & Capital Ratios Return on Average Assets 1.14% 0.78% 0.29% 1.18% 1.19% Return on Average Equity 11.25% 7.88% 2.96% 11.35% 11.02% Return on Average Tangible Common Equity * 13.60% 9.56% 4.04% 14.84% 14.25% Net Interest Margin 4.14% 4.02% 3.99% 4.26% 4.14% Tangible Common Equity/ Tangible Assets * 8.43% 8.51% 7.95% 8.65% 8.75% Tangible Book Value Per Share * $ 9.90 $ 10.12 $ 10.01 $ 10.36 $ 10.80 Common Equity Tier 1 Risk-based Capital Ratio N/A N/A 9.32% 9.81% 10.02% Tier 1 Risk-based Ratio 10.53% 10.30% 9.75% 10.12% 10.40% Risk-based Capital Ratio 14.71% 14.46% 12.93% 13.40% 13.65%
