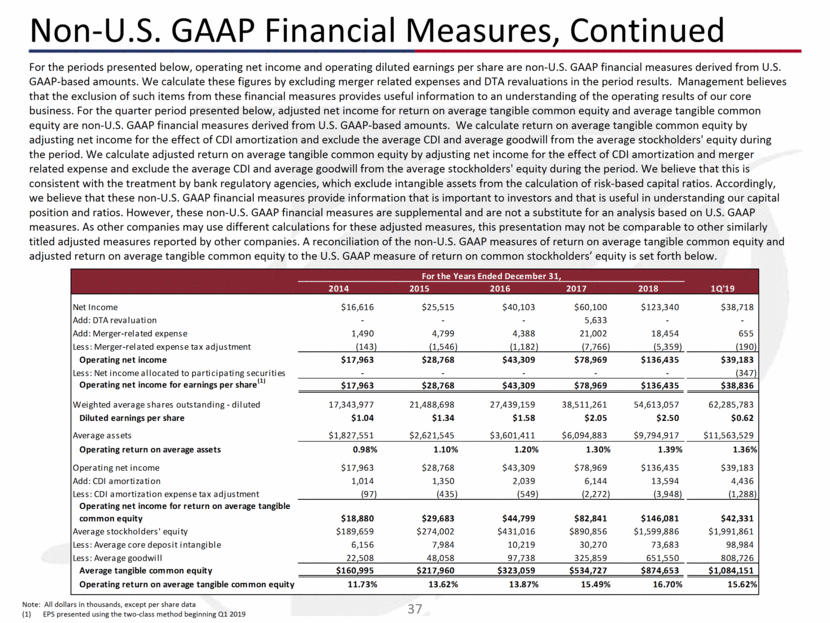
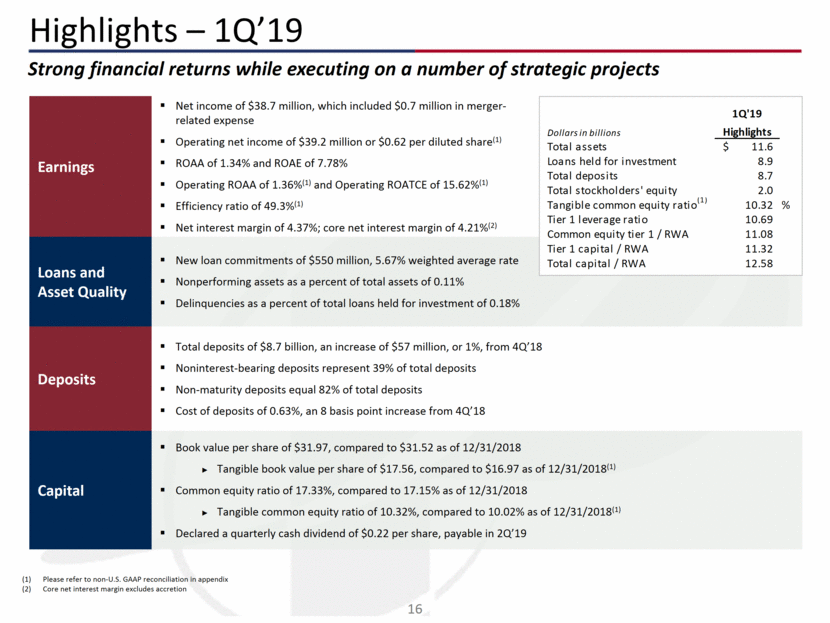
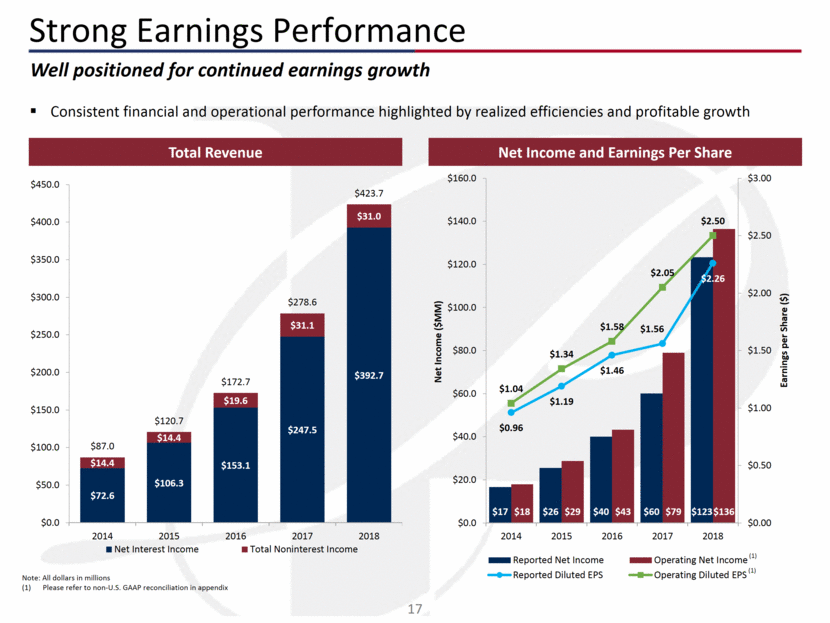
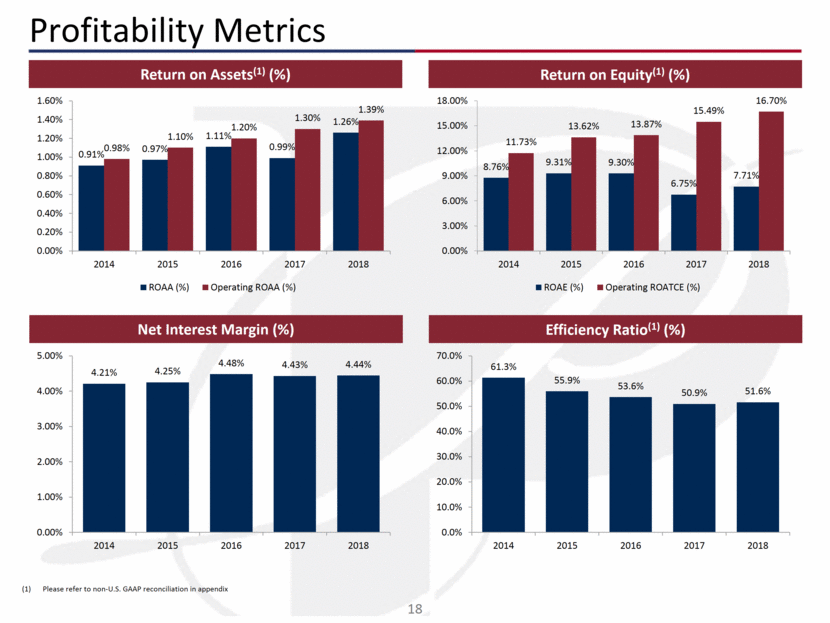
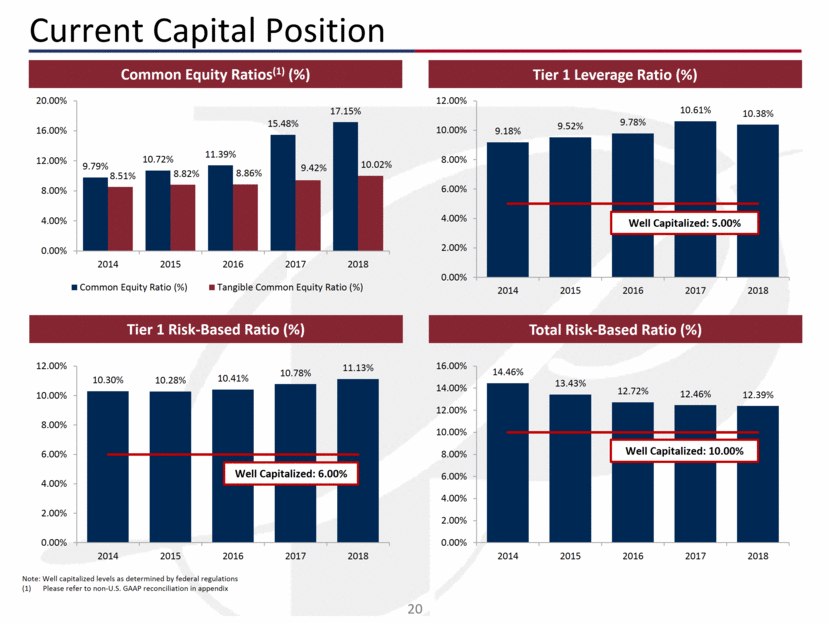
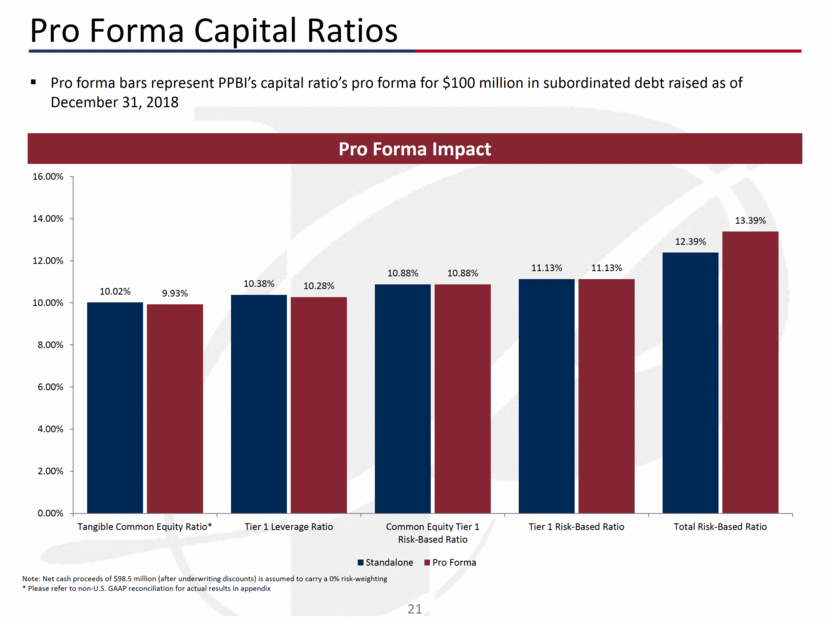
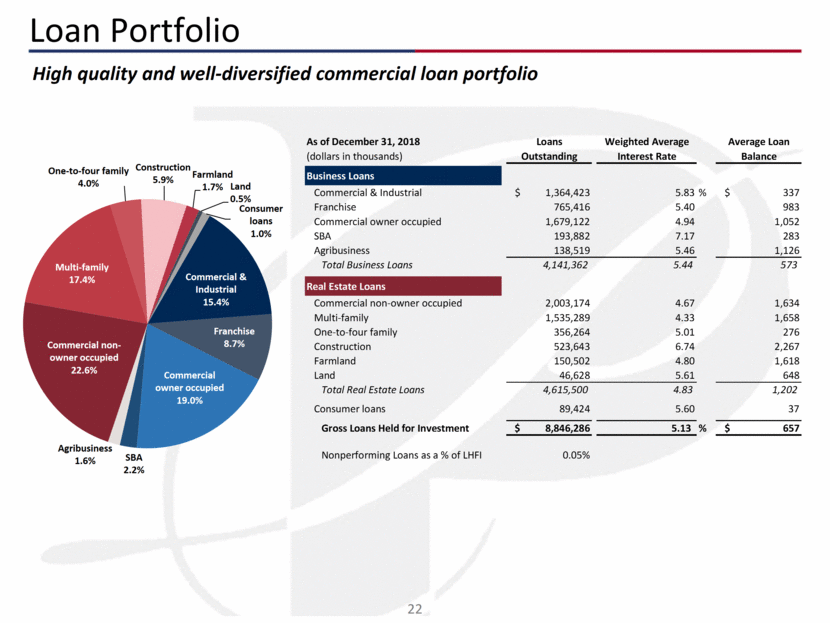
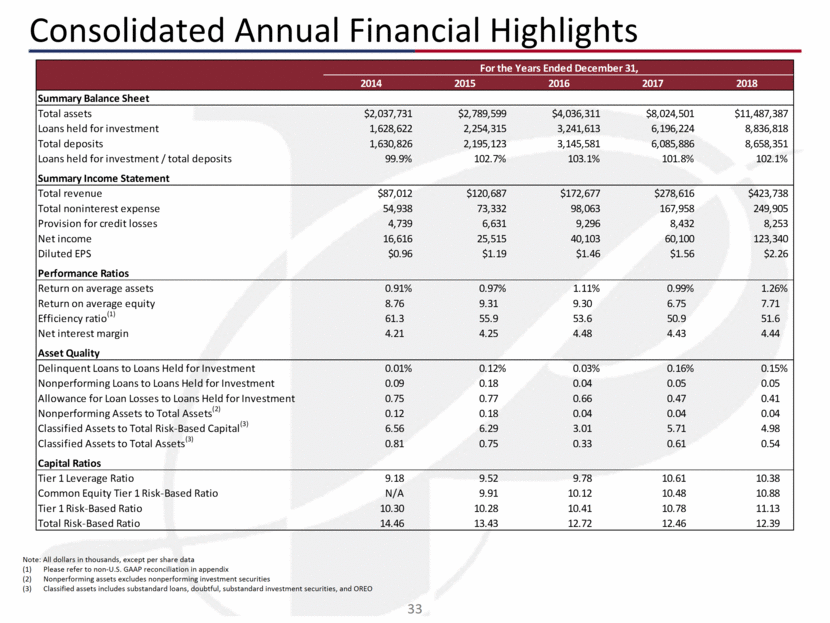
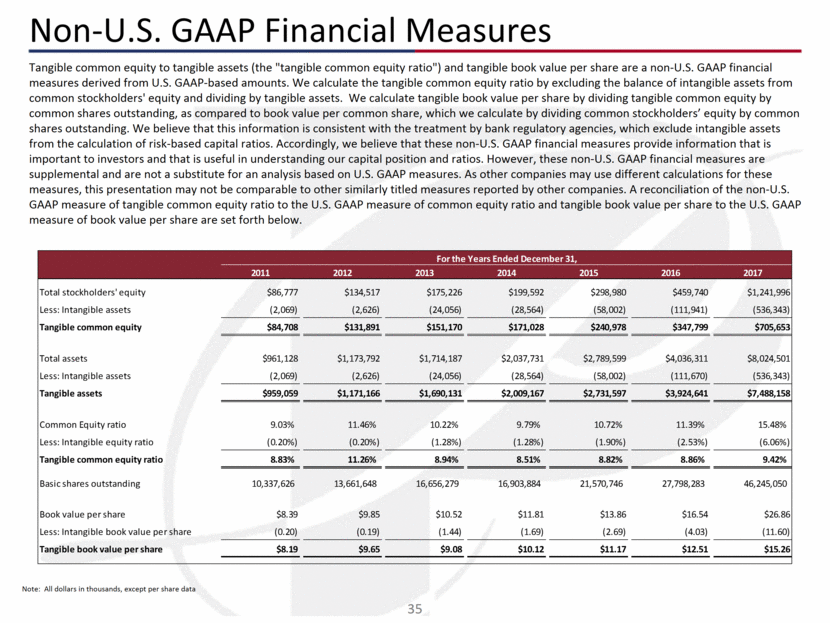
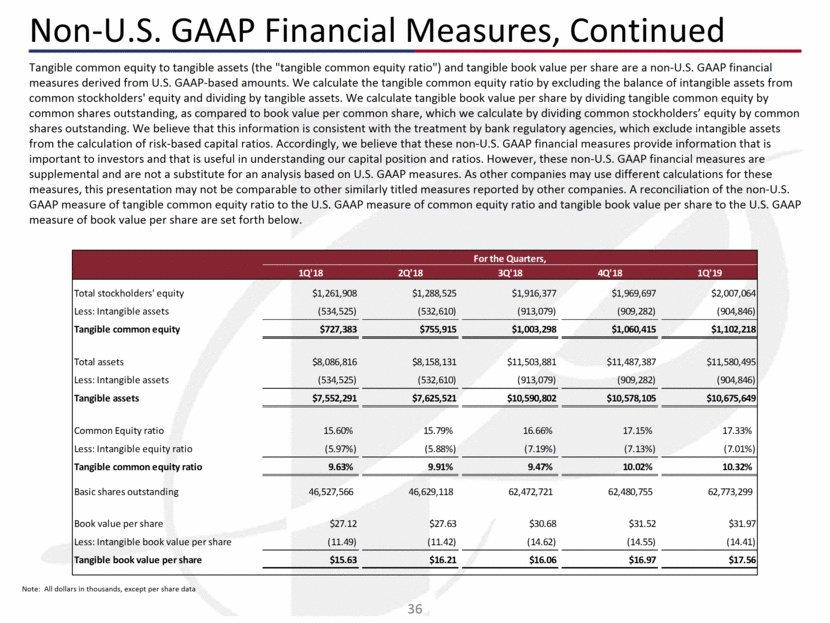
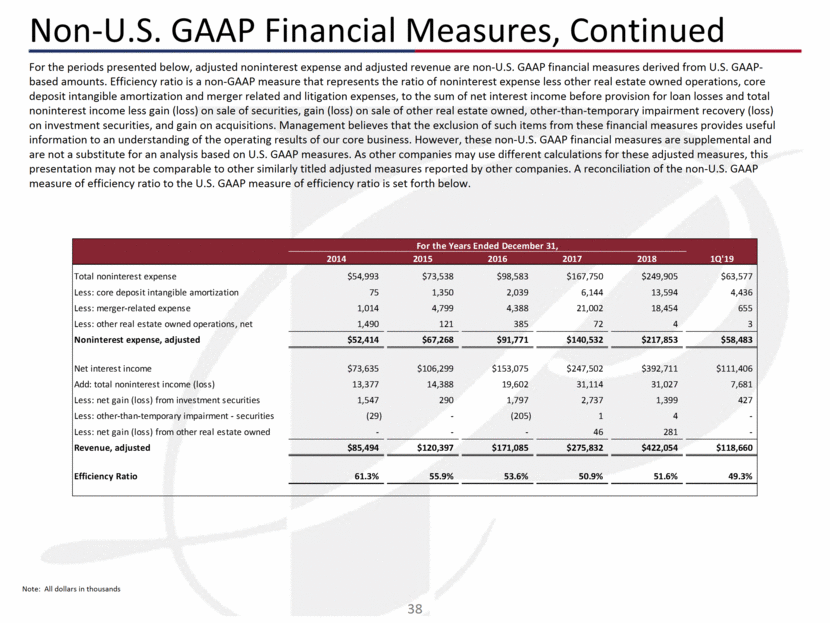
For the periods presented below, operating net income and operating diluted earnings per share are non-U.S. GAAP financial measures derived from U.S. GAAP-based amounts. We calculate these figures by excluding merger related expenses and DTA revaluations in the period results. Management believes that the exclusion of such items from these financial measures provides useful information to an understanding of the operating results of our core business. For the quarter period presented below, adjusted net income for return on average tangible common equity and average tangible common equity are non-U.S. GAAP financial measures derived from U.S. GAAP-based amounts. We calculate return on average tangible common equity by adjusting net income for the effect of CDI amortization and exclude the average CDI and average goodwill from the average stockholders' equity during the period. We calculate adjusted return on average tangible common equity by adjusting net income for the effect of CDI amortization and merger related expense and exclude the average CDI and average goodwill from the average stockholders' equity during the period. We believe that this is consistent with the treatment by bank regulatory agencies, which exclude intangible assets from the calculation of risk-based capital ratios. Accordingly, we believe that these non-U.S. GAAP financial measures provide information that is important to investors and that is useful in understanding our capital position and ratios. However, these non-U.S. GAAP financial measures are supplemental and are not a substitute for an analysis based on U.S. GAAP measures. As other companies may use different calculations for these adjusted measures, this presentation may not be comparable to other similarly titled adjusted measures reported by other companies. A reconciliation of the non-U.S. GAAP measures of return on average tangible common equity and adjusted return on average tangible common equity to the U.S. GAAP measure of return on common stockholders’ equity is set forth below. Non-U.S. GAAP Financial Measures, Continued Note: All dollars in thousands, except per share data EPS presented using the two-class method beginning Q1 2019 2014 2015 2016 2017 2018 1Q'19 Net Income $16,616 $25,515 $40,103 $60,100 $123,340 $38,718 Add: DTA revaluation - - - 5,633 - - Add: Merger-related expense 1,490 4,799 4,388 21,002 18,454 655 Less: Merger-related expense tax adjustment (143) (1,546) (1,182) (7,766) (5,359) (190) Operating net income $17,963 $28,768 $43,309 $78,969 $136,435 $39,183 Less: Net income allocated to participating securities - - - - - (347) Operating net income for earnings per share (1) $17,963 $28,768 $43,309 $78,969 $136,435 $38,836 Weighted average shares outstanding - diluted 17,343,977 21,488,698 27,439,159 38,511,261 54,613,057 62,285,783 Diluted earnings per share $1.04 $1.34 $1.58 $2.05 $2.50 $0.62 Average assets $1,827,551 $2,621,545 $3,601,411 $6,094,883 $9,794,917 $11,563,529 Operating return on average assets 0.98% 1.10% 1.20% 1.30% 1.39% 1.36% Operating net income $17,963 $28,768 $43,309 $78,969 $136,435 $39,183 Add: CDI amortization 1,014 1,350 2,039 6,144 13,594 4,436 Less: CDI amortization expense tax adjustment (97) (435) (549) (2,272) (3,948) (1,288) Operating net income for return on average tangible common equity $18,880 $29,683 $44,799 $82,841 $146,081 $42,331 Average stockholders' equity $189,659 $274,002 $431,016 $890,856 $1,599,886 $1,991,861 Less: Average core deposit intangible 6,156 7,984 10,219 30,270 73,683 98,984 Less: Average goodwill 22,508 48,058 97,738 325,859 651,550 808,726 Average tangible common equity $160,995 $217,960 $323,059 $534,727 $874,653 $1,084,151 Operating return on average tangible common equity 11.73% 13.62% 13.87% 15.49% 16.70% 15.62% For the Years Ended December 31,
