Nasdaq National Market (PPBI)

Regulation FD
This presentation may include forward-looking statements. The statements contained
herein that are not historical facts are forward-looking statements based on
management’s current expectations and beliefs concerning future developments and their
potential effects on the Company. There can be no assurance that future developments
affecting the Company will be the same as those anticipated by management. Actual
results may differ from those projected in the forward-looking statements. These
forward-looking statements involve risks and uncertainties. These include, but are not
limited to, the following risks: (1) changes in the performance of the financial markets,
(2) changes in the demand for and market acceptance of the Company’s products and
services, (3) changes in general economic conditions including interest rates, presence of
competitors with greater financial resources, and the impact of competitive projects and
pricing, (4) the effect of the Company’s policies, (5) the continued availability of
adequate funding sources, (6) actual prepayment rates and credit losses as compared to
prepayment rates and credit losses assumed by the Company for purposes of its valuation
of mortgage derivative securities (the “Participation Contract”), (7) the effect of
changes in market interest rates on the spread between the coupon rate and the pass
through rate and on the discount rate assumed by the Company in its valuation of its
Participation Contract, and (8) various legal, regulatory and litigation risks.
2

Overview
Community Bank based in Southern California
New management successfully repositioned company
2000 - 2001 poor asset quality, high cost deposits, regulatory
2001 - 2002 private placement, community banking model
2002 - 2003 secondary offering, turn-around complete
Exceptional growth opportunities in a vibrant market
Southern California – 3 retail offices
Income property lending
Earnings at inflection point
Substantial reduction of interest expense
Fixed costs in place, income tax benefits
3

Experienced Management Team
4
Years
Name (Age)
Position
Experience
_________________________________________________________________________________
Steven Gardner (43)
President & Chief Executive Officer
20
John Shindler (48)
Chief Financial Officer
27
Andrew Anderson (40)
Director of Retail Banking
21
Eddie Wilcox (37)
Chief Credit Officer
16
Kathi Duncan (47)
Director of Human Resources and Compliance
24
Jim Sanchez (41)
Director of Information Technology
20
Robert Johnson (60)
Director of Internal Audit
32

Growth and Operating Strategies
Increase origination of income property loans
Wholesale origination
New Account Managers hired – Q4 2003
Retail Originations
Grow retail branch deposit base
Relationship selling – small businesses, consumers
Introduce additional products and services
Grow organically or through strategic opportunities
5

Income Property Lending
Multi-family Markets
Excellent growth opportunities
Expansive Fragmented market
$16 billion of loans originated in So. California
Top 10 lenders represent less than 50% of the market
Over 900 various lenders in the state of California
Southern California #1 market in the country
Source:
- DataQuick Information Systems
- National Multi Housing Council, “Apartments: A $1.3 Trillion Market”, 2001
- Southern California consisting primarily of the counties of Los Angeles, Orange, San Diego, San Bernardino, Ventura, Santa Barbara, and Riverside.
6

Multi-family Lending Sector has
Superior Asset Quality
West Region
2001
2002
2003
4Q 03
Loan Type:
Multi-family
0.00%
0.00%
0.01%
0.01%
Commercial RE
0.19%
0.09%
0.08%
0.03%
SFR Construction
0.20%
0.18%
0.09%
-0.02%
Single Family
0.06%
0.07%
0.04%
0.03%
Source: Office of Thrift Supervision
National
Annualized Net Charge-Off Rates
7

Lending Strategy
Increase origination of income property loans
Focus on multi-family properties – higher risk adjusted rates
of return than other mortgage related asset classes
Asset quality directs all of our lending activities -
Underwriting focused on actual cash flow, borrower
liquidity and collateral marketability
Adjustable interest rates, floor rates and prepayment
penalties on virtually all loans
Results in overall lower collection costs, consistent revenue stream,
well positioned for rising interest rates and higher gains on excess production
8
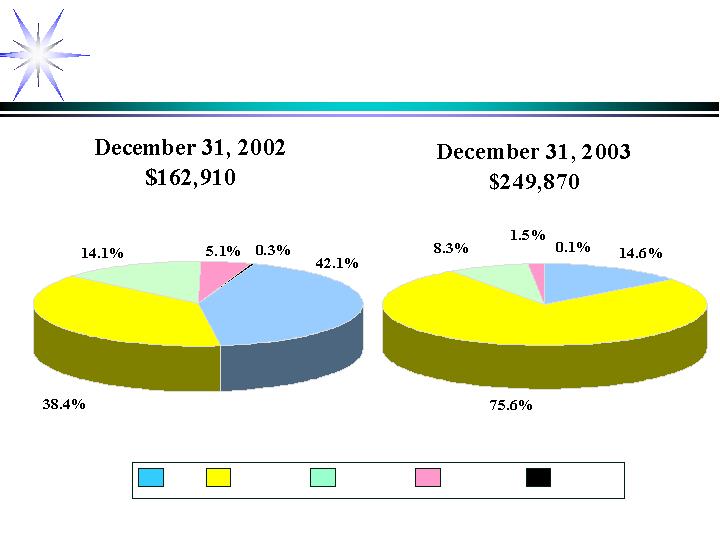
Loan Portfolio Composition
SFR
Multi-family
Commercial
Construction
Other
(dollars in thousands)
9
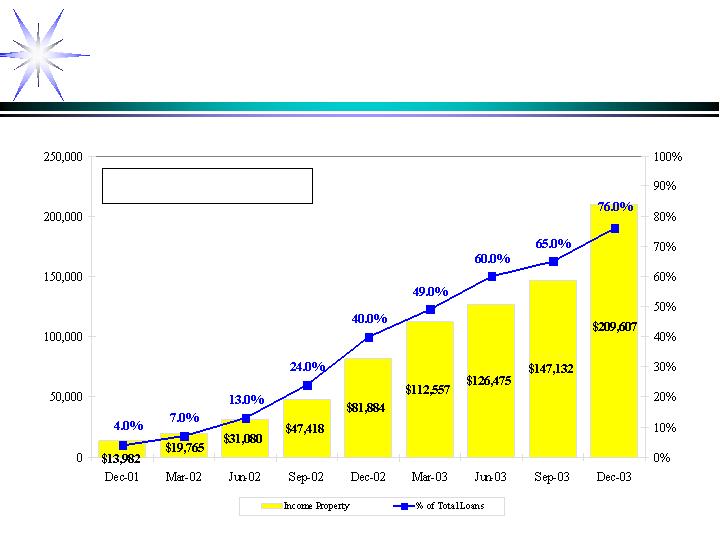
Income Property
(dollars in thousands)
CAGR 170.9%
10

Loan Portfolio Characteristics
11
At Origination through December 31, 2003
Multifamily
Average Loan to Value
66.7%
Average Debt Coverage Ratio
1.36:1
Average Balance
$728,000
Commercial Real Estate
Average Loan to Value
60.8%
Average Debt Coverage Ratio
1.52:1
Average Balance
$981,000
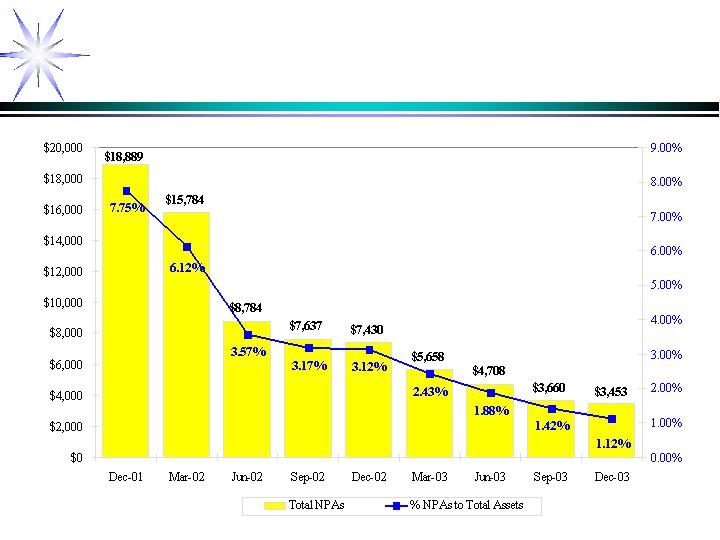
Improving Asset Quality Trends:
NPAs to Total Assets
(dollars in thousands)
12

Retail Branch Strategy
Grow retail branch deposit base
Increase transaction accounts with emphasis on relationship
banking with small business owners
Enhanced product offerings – community bank product
menu
Cross-sell of various products and services, multiple
accounts per customer to ensure they are “fully banked”
Results in stable deposit base, lower funding cost,
increased fee income and improved franchise value
13
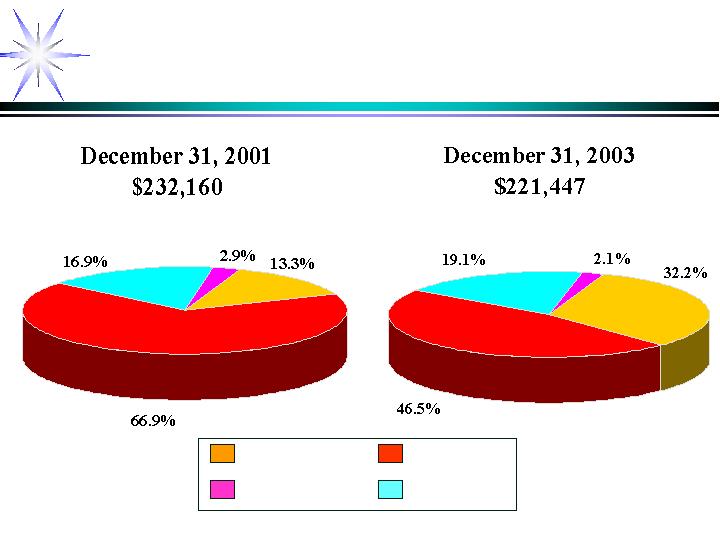
Deposit Portfolio Composition
(dollars in thousands)
Transaction accounts
Jumbo CDs
Wholesale CDs
Retail CDs
14
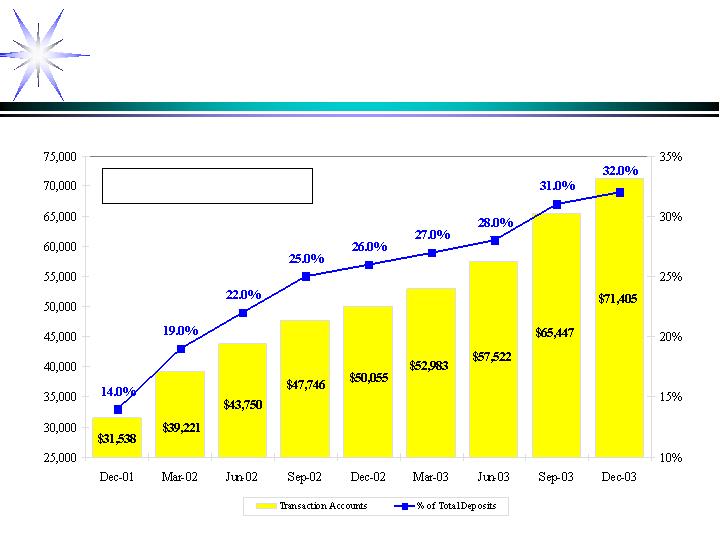
Deposit Transaction Accounts
(dollars in thousands)
CAGR 45.4%
15

Financial Performance

Balance Sheet
As of
12/31/2003
12/31/2002
12/31/2001
12/31/2000
12/31/1999
Assets:
Cash and Investments
44,715
61,833
42,365
75,910
53,148
Loans, net
247,600
158,231
187,176
316,724
434,328
Participation Contract
5,977
4,869
4,428
4,429
9,288
Other Assets
11,076
13,345
9,698
17,358
55,137
Total Assets
309,368
$
238,278
$
243,667
$
414,421
$
551,901
$
Liabilities:
Deposits
221,447
191,170
232,160
345,093
468,859
FHLB Advances
48,600
20,000
-
47,120
17,873
Notes Payable
-
11,440
-
-
-
Subordinated Debt
-
1,500
1,500
1,500
1,500
Other Liabilities
1,989
2,545
2,359
6,808
29,207
Total Liabilities
272,036
226,655
236,019
400,521
517,439
Stockholders' Equity
Common Stock
53
13
13
13
13
Additional Paid-in Capital
67,546
43,328
42,628
42,629
42,579
Accumulated Deficit
(30,021)
(32,086)
(34,964)
(28,912)
(8,130)
Accumulated Other Comprehensive Income
(246)
368
(29)
170
-
Total Stockholders' Equity
37,332
11,623
7,648
13,900
34,462
Total Liabilities and Stockholders' Equity
309,368
$
238,278
$
243,667
$
414,421
$
551,901
$
Fully Diluted Book Value per share
5.98
$
4.98
$
5.73
$
10.42
$
25.90
$
17
(in thousands)

Income Statement
12 Months Ended
12/31/2003
12/31/2002
12/31/2001
12/31/2000
12/31/1999
Interest Income
Loans
12,366
$
12,345
$
21,973
$
38,298
$
40,991
$
Other Int. Earning Assets
4,882
6,527
2,469
3,221
5,387
Total Interest Income
17,248
18,872
24,442
41,519
46,378
Interest Expense
Deposits
4,954
6,314
14,989
25,572
22,000
FHLB Advances
541
535
992
2,664
3,367
Notes and Debentures
2,162
2,061
210
210
210
Total Interest Expense
7,657
8,910
16,191
28,446
25,577
Net Int. Inc. Before Provision
9,591
9,962
8,251
13,073
20,801
Provision for Loan Losses
655
1,133
3,313
2,910
5,382
Non Interest Income
2,315
1,869
3,992
(2,136)
(15,020)
Non Interest Expense
9,783
10,165
14,340
25,806
29,643
Income Before Taxes
1,468
533
(5,410)
(17,779)
(29,244)
Inc. Tax (Benefit)/Provision
(597)
(2,345)
642
3,003
(11,405)
Net Income
2,065
$
2,878
$
(6,052)
$
(20,782)
$
(17,839)
$
Diluted Earnings/(Loss) per Share
0.61
$
1.16
$
(4.54)
$
(15.58)
$
(13.57)
$
18
(dollars in thousands)

Summary
Management repositioned company
Successful Community Banking business model
Exceptional growth opportunities
Southern California
Earnings at inflection point
Substantial reduction of interest expense
Fixed costs in place, income tax benefits
19