Exhibit 99.1
|
|
|
|
|

|
|
|
|
|
|
|
|
|
|
|
|
|
|
|

|
|
|
|
|

|
|
|
|
|
|
|
|
|
|
|
|
|
|
|
|
|
|
|
|
|
|
|
|
|
|
|
|
|
|
|
|
|
|
|

|
|
|
|
|
|
|
|
|
|
|
|
|
|
|
|
|
|
|
|
|
|
|
|
|
|
|
|
|
|

|
|
|
|
|
|
|
|
|
|
|
|
|
|
|
|
|
|
|
|
|
|
|
|
|
|
|
|
|
|
|
|
|
|
|

|
|
|
|
|
|
|
|
|
|
|
|
|
|
|
|
|
|
|
|
|
|
|
|
|

|
|
|
|
|
|
|
|
|
|
|
|
|
|
|
|
|
|
|
|
|
|
|
|
|

|
|
|
|
|

Exhibit 99.1
[GRAPHIC APPEARS HERE]
FBR 2006 Investor Conference
November 29, 2006
Steven R. Gardner
President & CEO
WWW.PPBI.NET
The statements contained herein that are not historical facts are forward looking statements based on management’s current expectations and beliefs concerning future developments and their potential effects on the Company. There can be no assurance that future developments affecting the Company will be the same as those anticipated by management. Actual results may differ from those projected in the forward-looking statements. These forward-looking statements involve risks and uncertainties. These include, but are not limited to, the following risks: (1) changes in the performance of the financial markets, (2) changes in the demand for and market acceptance of the Company’s products and services, (3) changes in general economic conditions including interest rates, presence of competitors with greater financial resources, and the impact of competitive projects and pricing, (4) the effect of the Company’s policies, (5) the continued availability of adequate funding sources, and (6) various legal, regulatory and litigation risks.
[GRAPHICS APPEAR HERE]
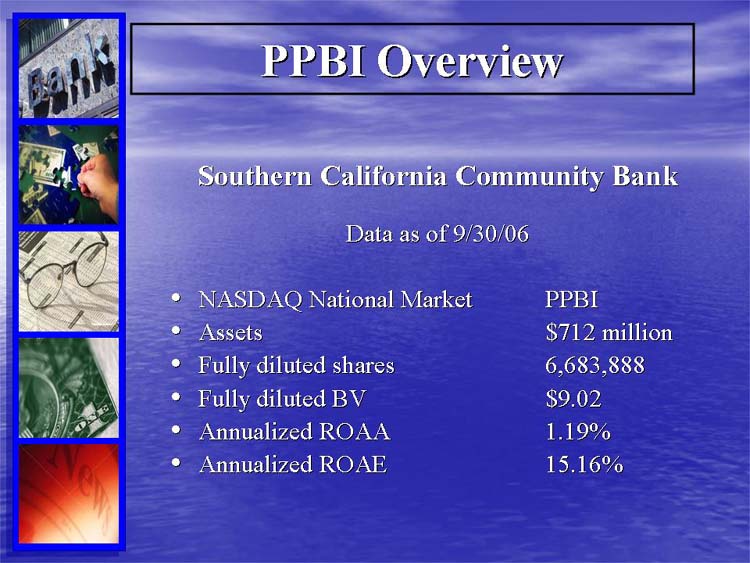
Southern California Community Bank
Data as of 9/30/06
• | NASDAQ National Market |
|
| PPBI |
|
• | Assets |
|
| $712 million |
|
• | Fully diluted shares |
|
| 6,683,888 |
|
• | Fully diluted BV |
|
| $9.02 |
|
• | Annualized ROAA |
|
| 1.19% |
|
• | Annualized ROAE |
|
| 15.16% |
|
[GRAPHICS APPEAR HERE]
• | Company History |
|
|
• | Transitioning business model |
|
|
• | Balance sheet strength |
|
|
• | Favorable relative valuation |
Three Phase
Strategic Business Plan
• | Phase 1 – Recapitalize |
|
|
• | Phase 2 – Growth |
|
|
• | Phase 3 – Commercial Banking Model |
[GRAPHICS APPEAR HERE]
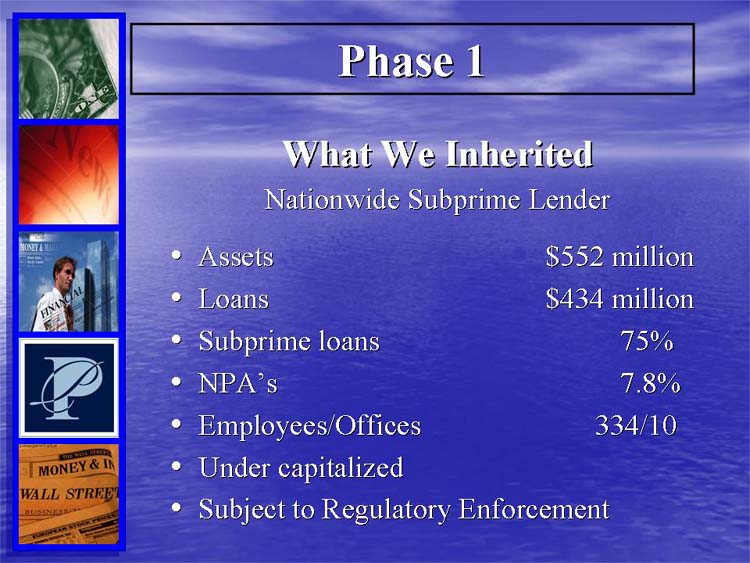
What We Inherited
Nationwide Subprime Lender
• | Assets |
|
| $552 million |
|
• | Loans |
|
| $434 million |
|
• | Subprime loans |
|
| 75% |
|
• | NPA’s |
|
| 7.8% |
|
• | Employees/Offices |
|
| 334/10 |
|
• | Under capitalized |
|
|
|
|
• | Subject to Regulatory Enforcement |
|
|
|
|
[GRAPHICS APPEAR HERE]
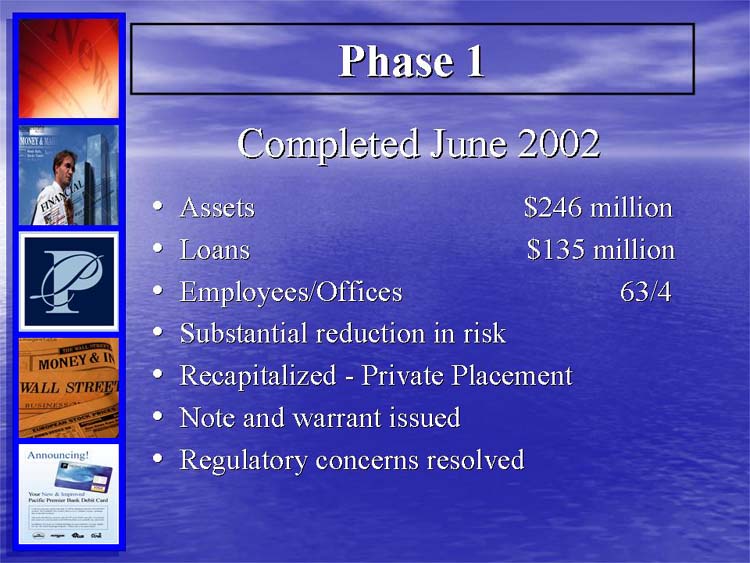
Completed June 2002
• | Assets |
|
| $246 million |
|
• | Loans |
|
| $135 million |
|
• | Employees/Offices |
|
| 63/4 |
|
• | Substantial reduction in risk |
|
|
|
|
• | Recapitalized - Private Placement |
|
|
|
|
• | Note and warrant issued |
|
|
|
|
• | Regulatory concerns resolved |
|
|
|
|
[GRAPHICS APPEAR HERE]
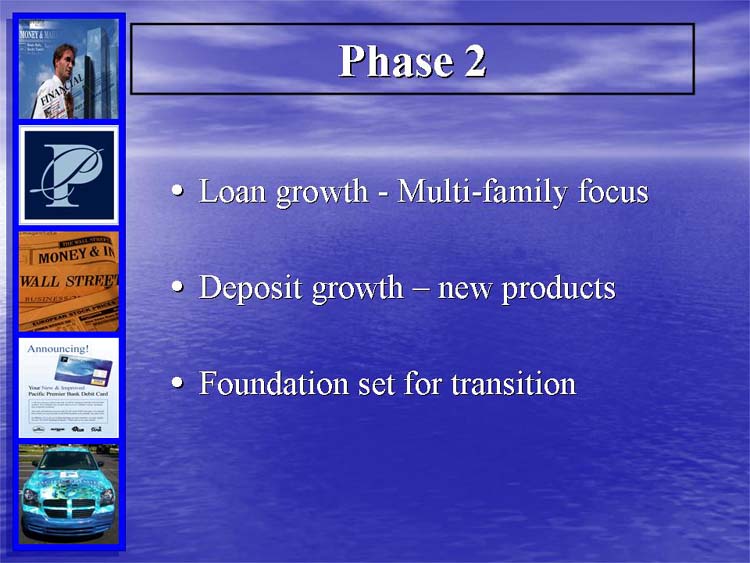
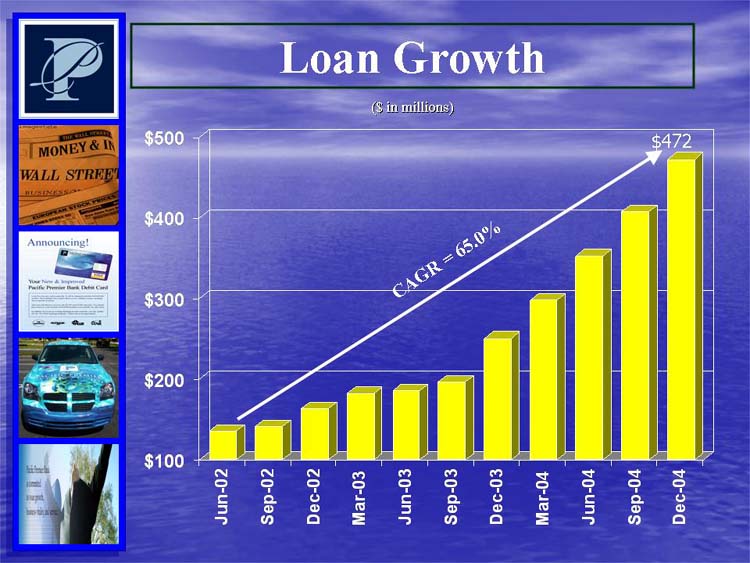
• | Loan growth - Multi-family focus |
|
|
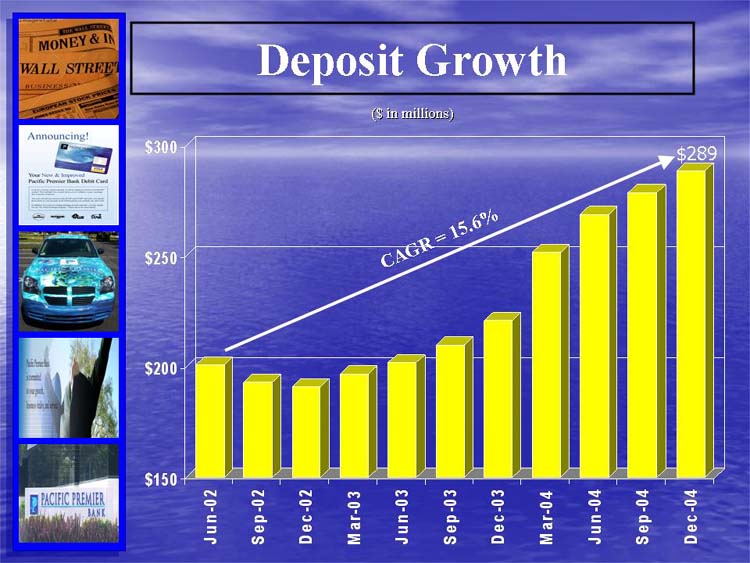
• | Deposit growth – new products |
|
|
• | Foundation set for transition |
[GRAPHICS APPEAR HERE]
[CHART APPEARS HERE]
[GRAPHICS APPEAR HERE]
[CHART APPEARS HERE]
[GRAPHICS APPEAR HERE]
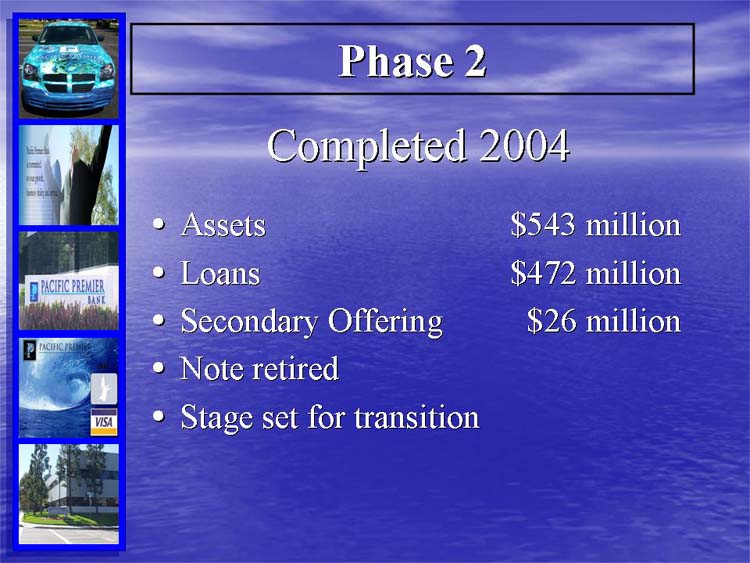
Completed 2004
• | Assets |
|
| $543 million |
|
• | Loans |
|
| $472 million |
|
• | Secondary Offering |
|
| $26 million |
|
• | Note retired |
|
|
|
|
• | Stage set for transition |
|
|
|
|
[GRAPHICS APPEAR HERE]
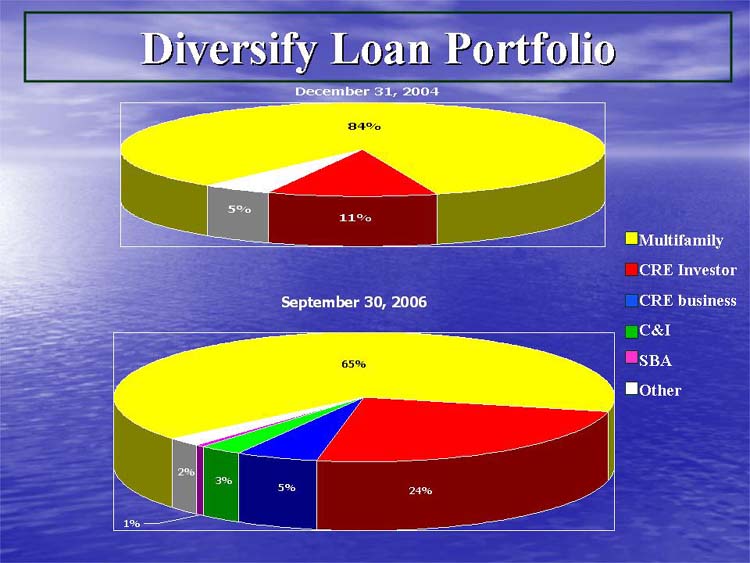
Transition Business Model
• | Diversify Loan Portfolio |
[GRAPHICS APPEAR HERE]
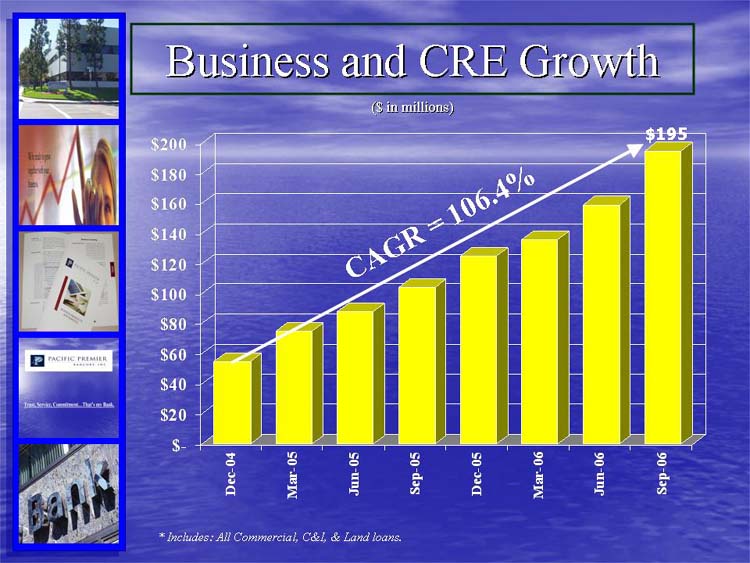
[CHART APPEARS HERE]
* Includes: All Commercial, C&I, & Land loans.
[CHARTS APPEAR HERE]
[GRAPHICS APPEAR HERE]
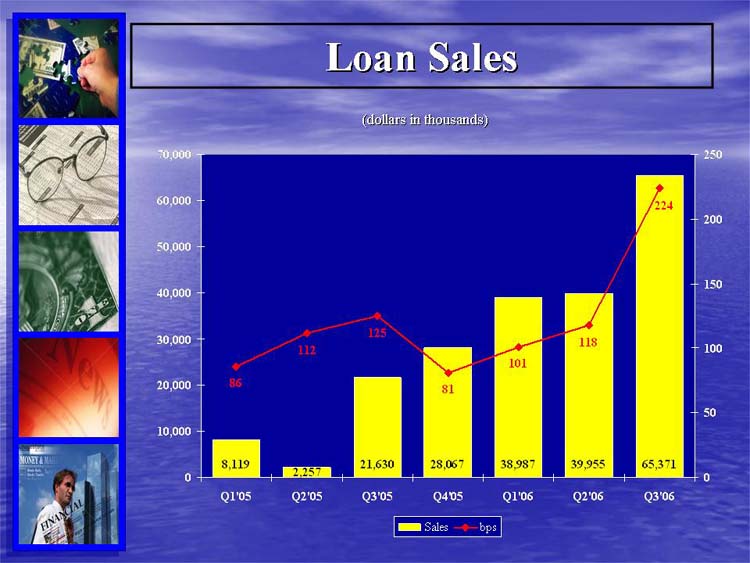
[CHART APPEARS HERE]
[GRAPHICS APPEAR HERE]
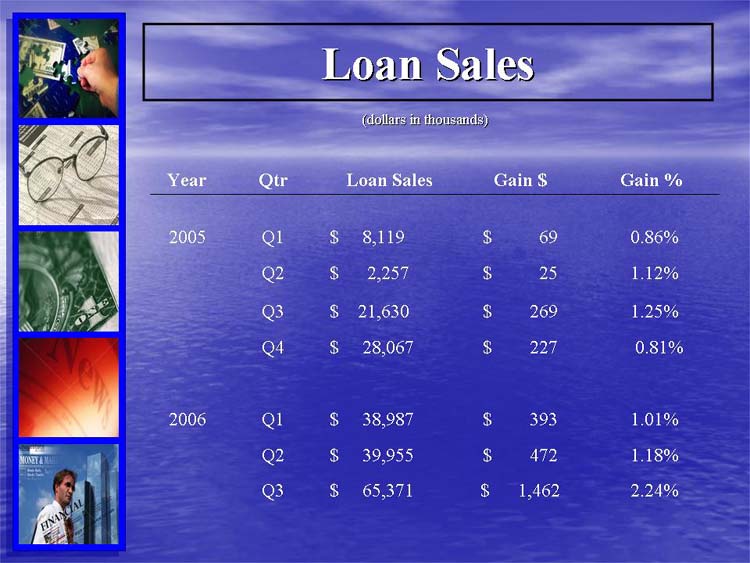
(dollars in thousands)
Year |
| Qtr |
| Loan Sales |
| Gain $ |
| Gain % |
| ||||
|
|
|
|
| |||||||||
2005 |
|
| Q1 |
| $ | 8,119 |
| $ | 69 |
|
| 0.86% |
|
|
|
| Q2 |
| $ | 2,257 |
| $ | 25 |
|
| 1.12% |
|
|
|
| Q3 |
| $ | 21,630 |
| $ | 269 |
|
| 1.25% |
|
|
|
| Q4 |
| $ | 28,067 |
| $ | 227 |
|
| 0.81% |
|
2006 |
|
| Q1 |
| $ | 38,987 |
| $ | 393 |
|
| 1.01% |
|
|
|
| Q2 |
| $ | 39,955 |
| $ | 472 |
|
| 1.18% |
|
|
|
| Q3 |
| $ | 65,371 |
| $ | 1,462 |
|
| 2.24% |
|
[GRAPHICS APPEAR HERE]
Transition Business Model
• | Diversify Loan Portfolio |
|
|
• | Business Banking |
[GRAPHICS APPEAR HERE]
[GRAPHICS APPEAR HERE]
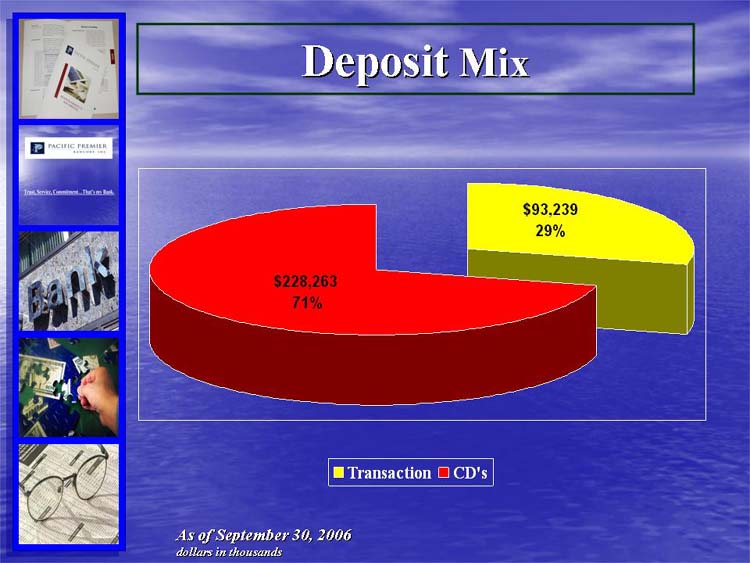
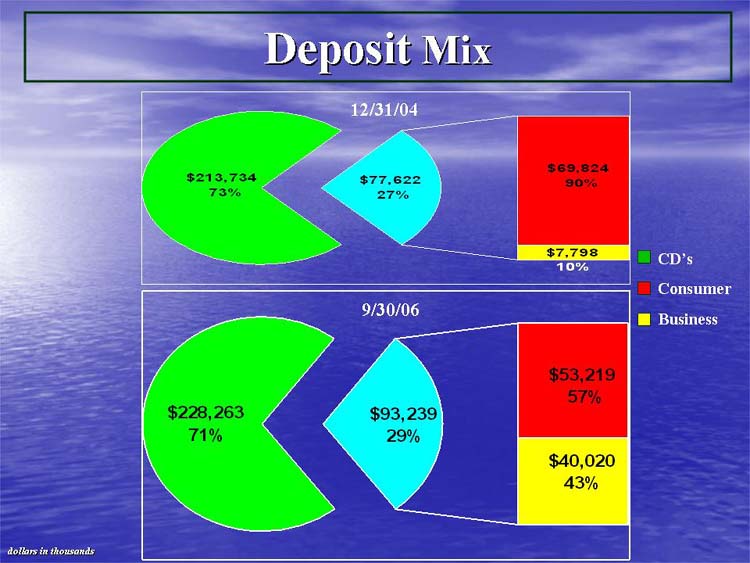
[CHART APPEARS HERE]
As of September 30, 2006
dollars in thousands
[CHARTS APPEAR HERE]
[GRAPHICS APPEAR HERE]
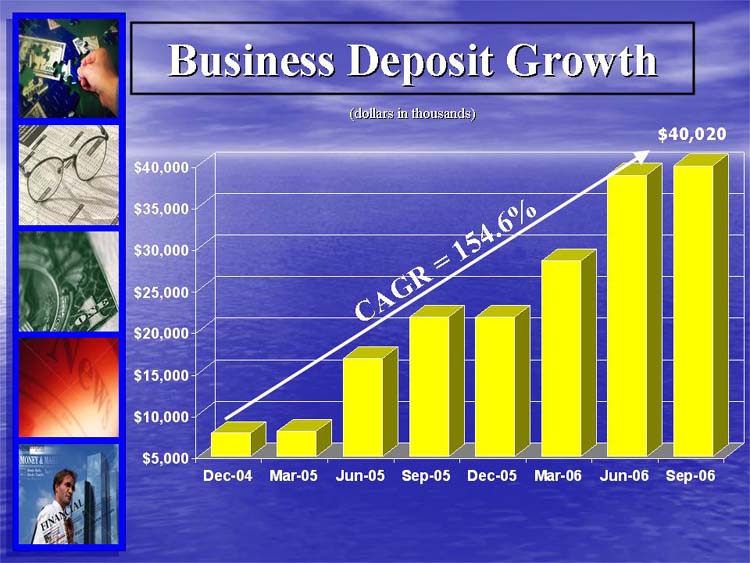
[CHART APPEARS HERE]
Relationship Growth
| 12/31/ 2004 |
| 9/30/2006 |
|
| ||
No. Relationships | 63 |
| 298 |
Loans | $45,143,000 |
| $350,729,000 |
Deposits | $1,194,000 |
| $31,728,000 |
Phase 3
Transition Business Model
• | Diversify Loan Portfolio |
|
|
• | Relationship Banking |
|
|
• | Expansion of Branch Network |
Southern California Market
[GRAPHIC APPEARS HERE]
It’s the Economy
Top 10 States by Population | ||||||||
06/30/2006 Population |
| Projected Population Change 2006-2011 | ||||||
| ||||||||
Rank |
| State |
| (#) |
| Rank |
| (#) |
|
|
|
| |||||
1 |
| California |
| 37,236,136 |
| 1 |
| 2,978,891 |
2 |
| Texas |
| 23,786,899 |
| 2 |
| 2,607,044 |
3 |
| New York |
| 19,532,703 |
| 11 |
| 419,953 |
4 |
| Florida |
| 18,478,309 |
| 3 |
| 2,387,398 |
5 |
| Illinois |
| 13,092,172 |
| 8 |
| 658,536 |
6 |
| Pennsylvania |
| 12,590,137 |
| 23 |
| 242,990 |
7 |
| Ohio |
| 11,627,546 |
| 21 |
| 252,318 |
8 |
| Michigan |
| 10,317,569 |
| 19 |
| 287,860 |
9 |
| Georgia |
| 9,553,796 |
| 4 |
| 1,313,647 |
10 |
| North Carolina |
| 8,905,986 |
| 6 |
| 726,728 |
Source: SNL
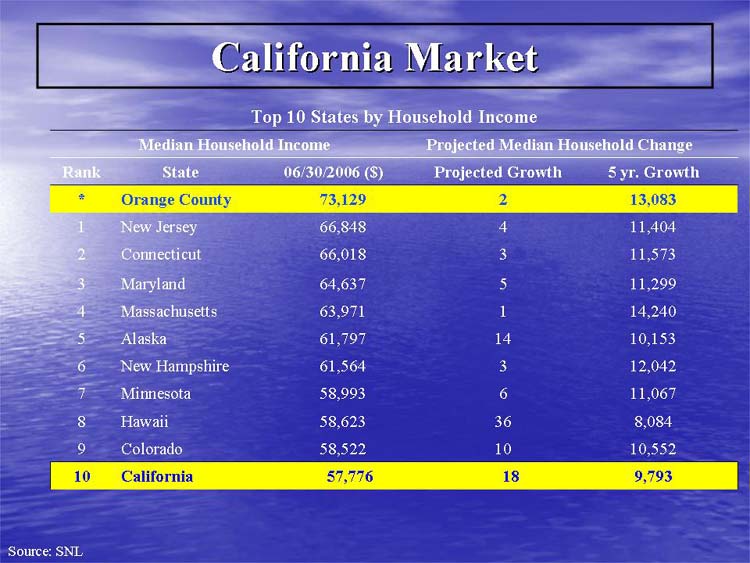
Top 10 States by Household Income | ||||||||
Median Household Income |
| Projected Median Household Change | ||||||
| ||||||||
Rank |
| State |
| 06/30/2006 ($) |
| Projected Growth |
| 5 yr. Growth |
|
|
|
| |||||
* |
| Orange County |
| 73,129 |
| 2 |
| 13,083 |
1 |
| New Jersey |
| 66,848 |
| 4 |
| 11,404 |
2 |
| Connecticut |
| 66,018 |
| 3 |
| 11,573 |
3 |
| Maryland |
| 64,637 |
| 5 |
| 11,299 |
4 |
| Massachusetts |
| 63,971 |
| 1 |
| 14,240 |
5 |
| Alaska |
| 61,797 |
| 14 |
| 10,153 |
6 |
| New Hampshire |
| 61,564 |
| 3 |
| 12,042 |
7 |
| Minnesota |
| 58,993 |
| 6 |
| 11,067 |
8 |
| Hawaii |
| 58,623 |
| 36 |
| 8,084 |
9 |
| Colorado |
| 58,522 |
| 10 |
| 10,552 |
10 |
| California |
| 57,776 |
| 18 |
| 9,793 |
Source: SNL
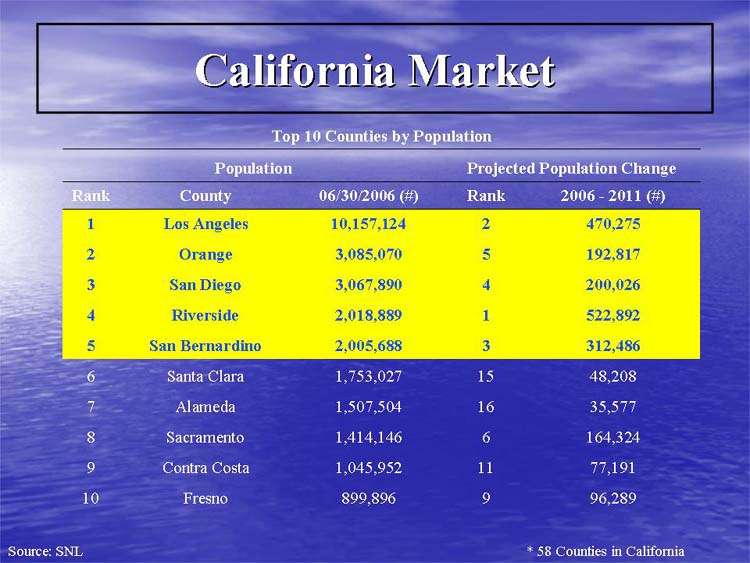
Top 10 Counties by Population | ||||||||
Population |
| Projected Population Change | ||||||
| ||||||||
Rank |
| County |
| 06/30/2006 (#) |
| Rank |
| 2006 - 2011 (#) |
|
|
|
| |||||
1 |
| Los Angeles |
| 10,157,124 |
| 2 |
| 470,275 |
2 |
| Orange |
| 3,085,070 |
| 5 |
| 192,817 |
3 |
| San Diego |
| 3,067,890 |
| 4 |
| 200,026 |
4 |
| Riverside |
| 2,018,889 |
| 1 |
| 522,892 |
5 |
| San Bernardino |
| 2,005,688 |
| 3 |
| 312,486 |
6 |
| Santa Clara |
| 1,753,027 |
| 15 |
| 48,208 |
7 |
| Alameda |
| 1,507,504 |
| 16 |
| 35,577 |
8 |
| Sacramento |
| 1,414,146 |
| 6 |
| 164,324 |
9 |
| Contra Costa |
| 1,045,952 |
| 11 |
| 77,191 |
10 |
| Fresno |
| 899,896 |
| 9 |
| 96,289 |
|
|
| ||||||
Source: SNL |
| * 58 Counties in California | ||||||
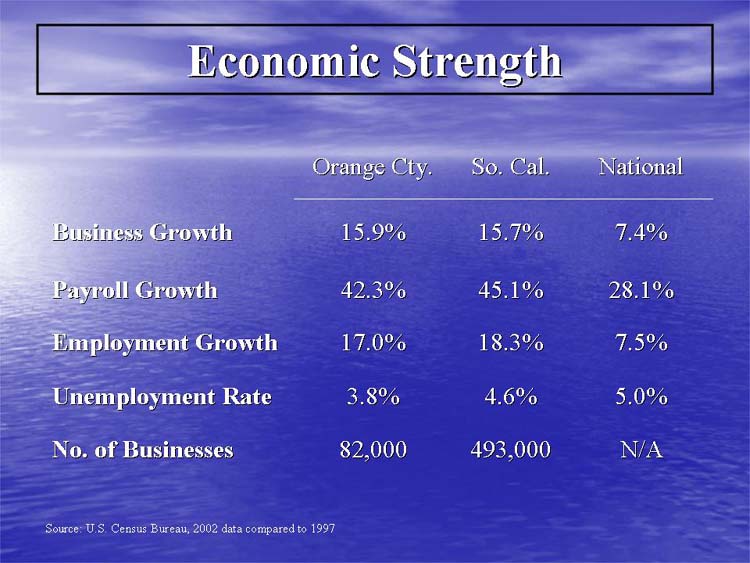
|
| Orange Cty. |
| So. Cal. |
| National |
|
|
|
| |||
Business Growth |
| 15.9% |
| 15.7% |
| 7.4% |
Payroll Growth |
| 42.3% |
| 45.1% |
| 28.1% |
Employment Growth |
| 17.0% |
| 18.3% |
| 7.5% |
Unemployment Rate |
| 3.8% |
| 4.6% |
| 5.0% |
No. of Businesses |
| 82,000 |
| 493,000 |
| N/A |
| ||||||
Source: U.S. Census Bureau, 2002 data compared to 1997 | ||||||
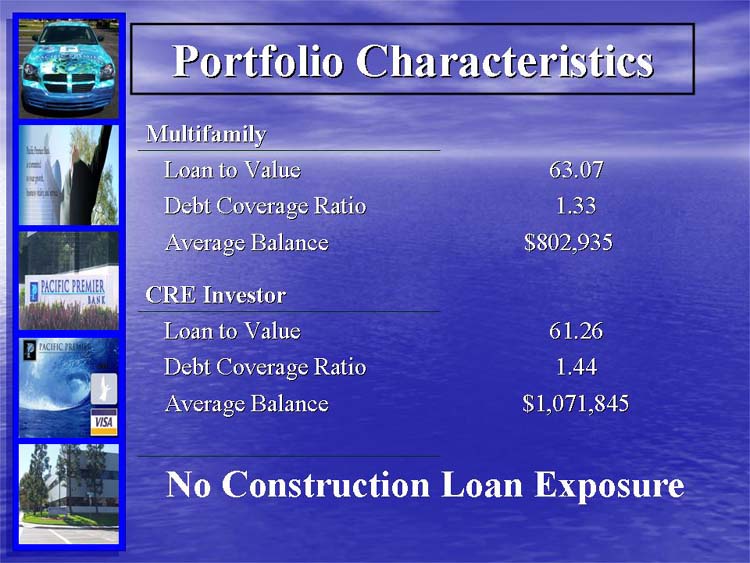
Balance Sheet Strength
Portfolio Characteristics
Multifamily |
|
| |
Loan to Value | 63.07 |
Debt Coverage Ratio | 1.33 |
Average Balance | $802,935 |
|
|
CRE Investor |
|
| |
Loan to Value | 61.26 |
Debt Coverage Ratio | 1.44 |
Average Balance | $1,071,845 |
No Construction Loan Exposure
Asset Quality
Delinquent |
| Nationwide |
| California |
| PPBI ** |
|
|
| ||||
Multi-Family |
| 0.01% |
| 0.01% |
| 0.00% |
Commercial RE |
| 0.08% |
| 0.10% |
| 0.00% |
Single Family |
| 0. 37% |
| 0.65% |
| 0.12% |
Source: FDIC as of 6/30/06 | |
| |
* | Includes past due 30-89 day, 90+ days and accruing, and non-accruals. |
|
|
** | PPBI as of 9/30/06 |
Asset Quality
NPA to Total Assets
[CHART APPEARS HERE]
Attractive Valuation
Valuation relative to California Peers:
|
| P/EPS |
| P/TBV |
|
|
| ||
CA Banks* |
| 14.86x |
| 276% |
PPBI Metrics* |
| 10.4x |
| 135% |
* | As of 10/26/06 |
| |
Source: SNL | |
PPBI Summary
• | Transition to Commercial Bank |
|
|
• | Low Risk Balance Sheet |
|
|
• | On-going Expansion |
|
|
• | Excellent time to invest |
[LOGO OF PACIFIC PREMIER BANCORP, INC.]
Trust, Service, Commitment…That’s my Bank.
WWW.PPBI.NET