Exhibit 99.1

KBW Annual Community Bank Investor Conference July 30 th , 2019
Content • Company and Market Overview • Strategic Vision • Financial Performance • Growth in Shareholder Value 2
This presentation, and the oral presentation that supplements it, have been developed by SB One Bancorp (“SB One” or the “Com pan y”), and are not an offer or the solicitation of an offer to buy securities. Neither this presentation, nor the oral presentation that su pplements it, nor any of their contents, may be used, reproduced, disseminated, quoted or referred to for any other purpose, in whole or in par t, without the prior written consent of the Company. Some of the statements contained in this presentation are “forward - looking statements” within the meaning of Section 27A of the Securities Act of 1933, as amended, and Section 21E of the Securities Exchange Act of 1934, as amended. When used in this presentation, wor ds such as “may,” “plan,” “contemplate,” “anticipate,” “believe,” “intend,” “continue,” “expect,” “project,” “predict,” “estimate,” “ tar get,” “could,” “is likely,” “should,” “would,” “will,” or similar expressions are intended to identify “forward - looking statements” within the meaning of Private Securities Litigation Reform Act of 1995. You are cautioned not to place undue reliance on any forward - looking statement s, which speak only as of the date made. These statements may relate to the Company’s future financial performance, strategic plans o r o bjectives, revenue, expense or earnings projections, or other financial items. By their nature, these statements are subject to numerou s u ncertainties that could cause actual results to differ materially from those anticipated in the statements. Factors that may cause actual results to differ materially from those contemplated by such forward - looking statements include, a mong others, changes to interest rates; the ability to control costs and expenses; our ability to integrate new technology into ou r o perations; general economic conditions; the success of the Company’s efforts to diversify its revenue base by developing additional sour ces of non - interest income while continuing to manage its existing fee - based business; the impact on us of the changing statutory and regul atory requirements; and the risks inherent in commencing operations in new markets. Any or all of our forward - looking statements in th is presentation may turn out to be wrong. They can be affected by inaccurate assumptions we might make or by known or unknown ri sks and uncertainties. Consequently, no forward - looking statements can be guaranteed. Further information about these and other relevant risks and uncertainties may be found in the Company’s Annual Report on Form 10 - K for the fiscal year ended December 31, 2018 and in subseq uent filings with the Securities and Exchange Commission. The Company undertakes no obligation to publicly release the results of any revisions to those forward - looking statements that may be made to reflect events or circumstances after this date or to reflect the occurrenc e of anticipated and unanticipated events. FORWARD - LOOKING STATEMENTS 3

Company and Market Overview

2010 5 Our Evolution Acquired Tri - State Insurance Founded • Acquisition of Community Bank of Bergen County Opened Banking Center in Queens County, NY First M&A 1975 2001 New Executive Leadership Team 2013 • Rights Offering ($7MM) • Closed Warwick Banking Center 2015 2016 • Entered Bergen County, NJ Market • Closed Andover Banking Center (March 2019) 2017 2018 Corporate Rebrand Capital Raise ($28MM) • Sussex Bank and Tri - State 2019 • Acquisition of Enterprise Bank Second M&A • Closed Port Jervis Banking Center • Grand Opening of Weehawken Banking Center (July 27, 2019)
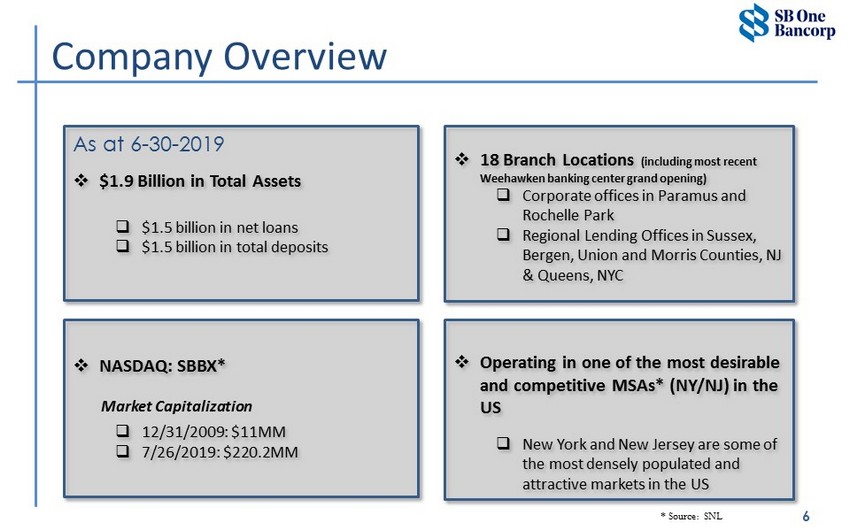
□ Operating in one of the most desirable and competitive MSAs* (NY/NJ) in the US □ New York and New Jersey are some of the most densely populated and attractive markets in the US 6 * Source: SNL Company Overview □ $1.9 Billion in Total Assets □ $1.5 billion in net loans □ $1.5 billion in total deposits □ 18 Branch Locations (including most recent Weehawken banking center grand opening) □ Corporate offices in Paramus and Rochelle Park □ Regional Lending Offices in Sussex, Bergen, Union and Morris Counties, NJ & Queens, NYC □ NASDAQ: SBBX* □ 12/31/2009: $11MM □ 7/26/2019: $220.2MM As at 6 - 30 - 2019 Market Capitalization
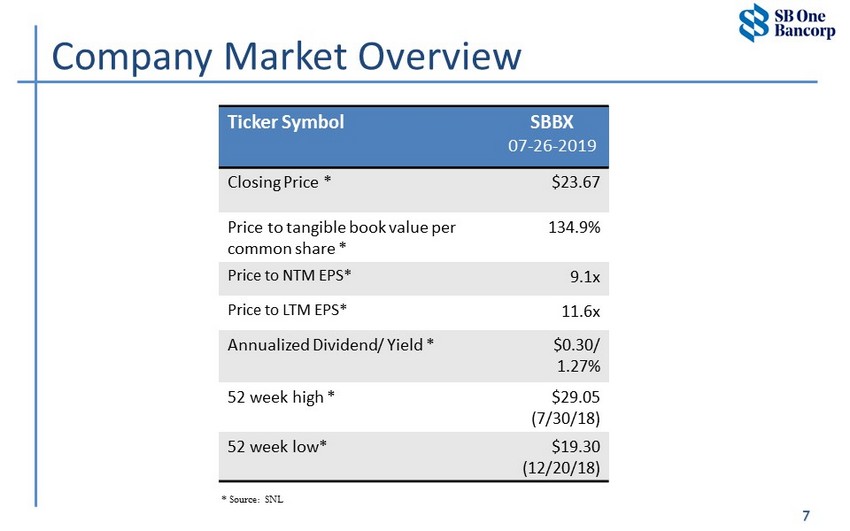
7 * Source: SNL Company Market Overview Ticker Symbol SBBX 07 - 26 - 2019 Closing Price * $23.67 Price to tangible book value per common share * 134.9% Price to NTM EPS* 9.1x Price to LTM EPS* 11.6x Annualized Dividend/ Yield * $0.30/ 1.27% 52 week high * $29.05 (7/30/18) 52 week low* $19.30 (12/20/18)
Strategic Vision

Target High Performing Peer Median (a) Total Assets $3.0 - $5.0 billion in assets $3.8 billion (average) $3.5 billion (median) ROA 1.15% or better 1.53% ROE >13.5% 11.96% NPAs / Assets <1.00% 0.43% Annual EPS growth Double digit N/A We strive to be a high performing business bank that serves northern NJ and the NY Metro Region 9 (a) Source: SNL - High Performing Peers (Banks and Thrifts Assets between $3.0 bill to $5.0 bill and ROAA >= 1.15 % at 3/31/2019) Strategic Vision
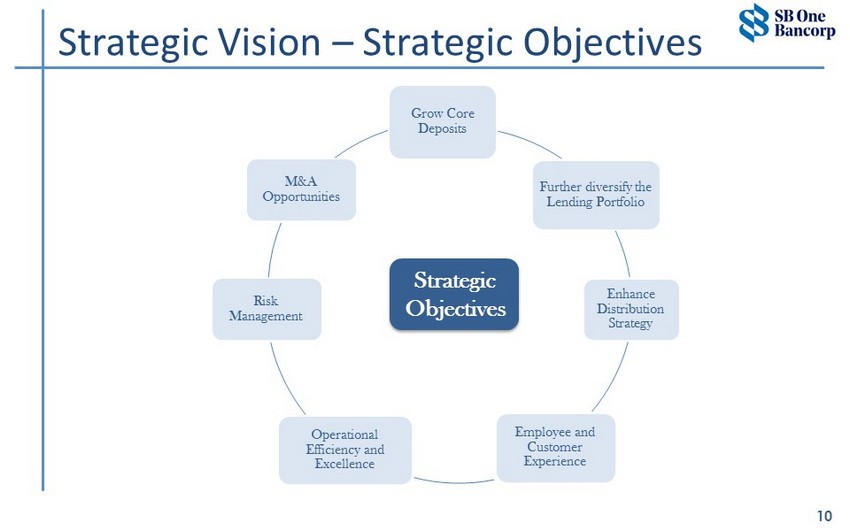
10 Strategic Vision – Strategic Objectives Grow Core Deposits Further diversify the Lending Portfolio Enhance Distribution Strategy Employee and Customer Experience Operational Efficiency and Excellence Risk Management M&A Opportunities Strategic Objectives
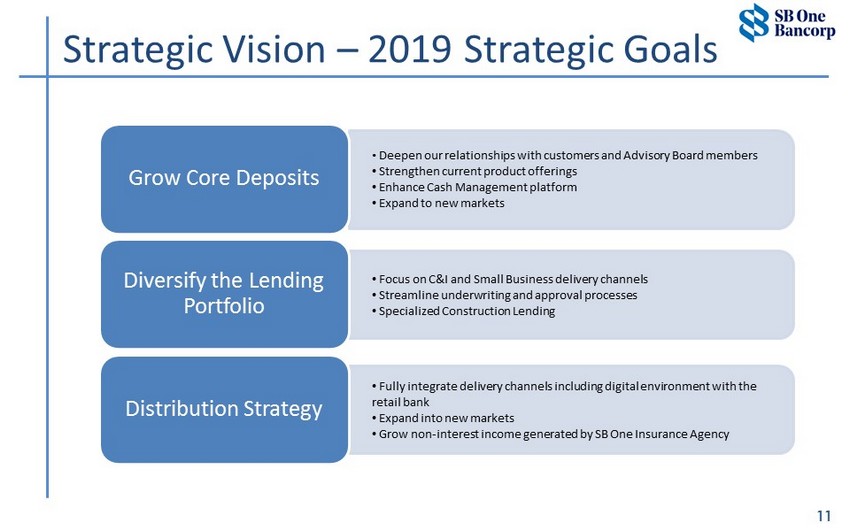
11 • Deepen our relationships with customers and Advisory Board members • Strengthen current product offerings • Enhance Cash Management platform • Expand to new markets Grow Core Deposits • Focus on C&I and Small Business delivery channels • Streamline underwriting and approval processes • Specialized Construction Lending Diversify the Lending Portfolio • Fully integrate delivery channels including digital environment with the retail bank • Expand into new markets • Grow non - interest income generated by SB One Insurance Agency Distribution Strategy Strategic Vision – 2019 Strategic Goals
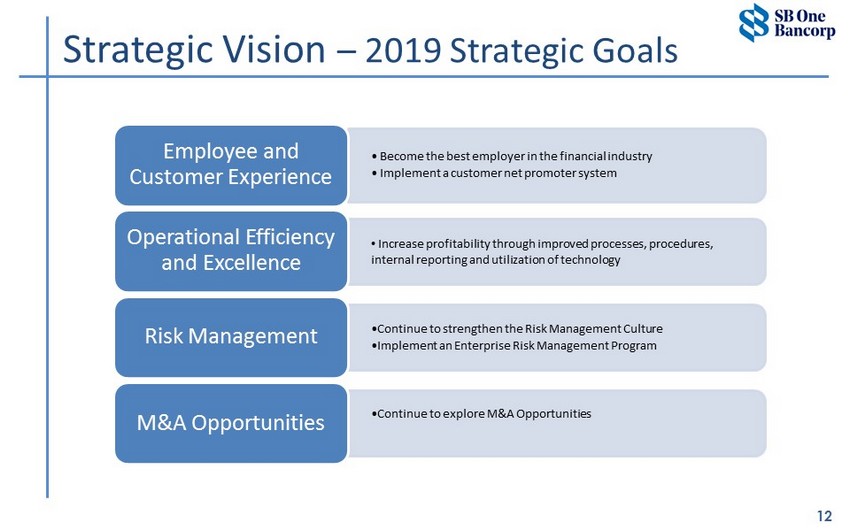
12 • Become the best employer in the financial industry • Implement a customer net promoter system Employee and Customer Experience • Increase profitability through improved processes, procedures, internal reporting and utilization of technology Operational Efficiency and Excellence • Continue to strengthen the Risk Management Culture • Implement an Enterprise Risk Management Program Risk Management • Continue to explore M&A Opportunities M&A Opportunities Strategic Vision – 2019 Strategic Goals

Regional Commercial Lending Office Corporate Operations Center Corporate Executive Center Potential New Markets Weehawken Banking Center - Grand Opening July 27, 2019 Current Banking Centers Through expansion into desired markets and M&A activity we continue to grow core deposit relationships to fund assets and create franchise value. . Market Expansion . . 13
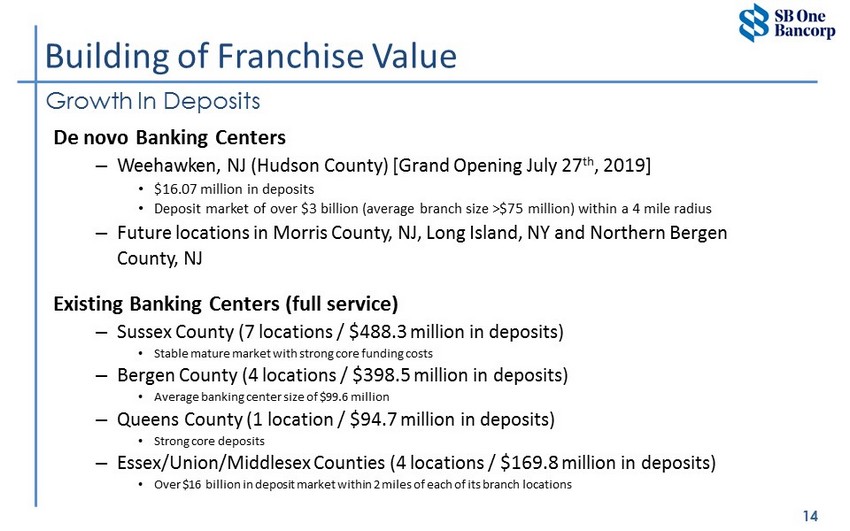
14 Building of Franchise Value De novo Banking Centers – Weehawken, NJ (Hudson County) [Grand Opening July 27 th , 2019] • $16.07 million in deposits • Deposit market of over $3 billion (average branch size >$75 million) within a 4 mile radius – Future locations in Morris County, NJ, Long Island, NY and Northern Bergen County, NJ Existing Banking Centers (full service) – Sussex County (7 locations / $488.3 million in deposits) • Stable mature market with strong core funding costs – Bergen County (4 locations / $398.5 million in deposits) • Average banking center size of $99.6 million – Queens County (1 location / $94.7 million in deposits) • Strong core deposits – Essex/Union/Middlesex Counties (4 locations / $169.8 million in deposits) • Over $16 billion in deposit market within 2 miles of each of its branch locations Growth In Deposits

Building of Franchise Value Digital Banking & Technology Platform Renegotiating core provider contract for better optionality on current and future core digital products Enhancing product suite with focus on cash management tools Leveraging existing technology to revamp digital workflows
Financial Performance
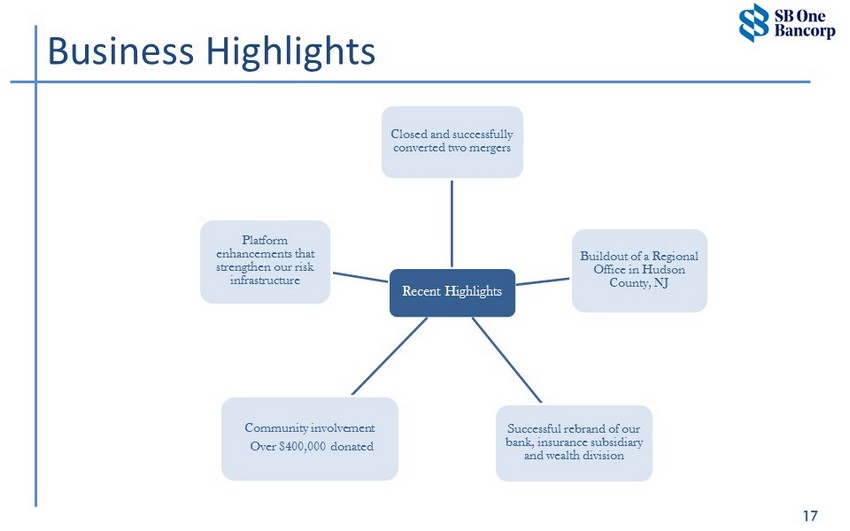
17 Business Highlights Recent Highlights Closed and successfully converted two mergers Buildout of a Regional Office in Hudson County, NJ Community involvement Over $400,000 donated Successful rebrand of our bank, insurance subsidiary and wealth division Platform enhancements that strengthen our risk infrastructure
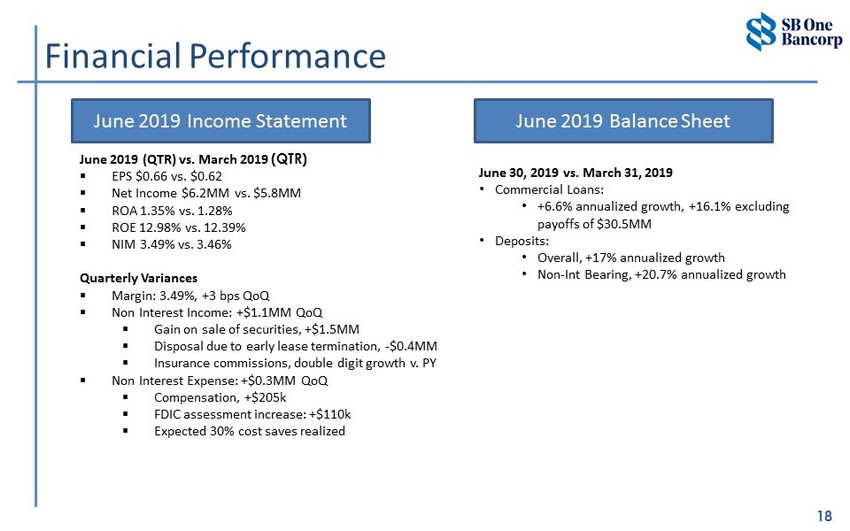
Financial Performance 18 June 30, 2019 vs. March 31, 2019 • Commercial Loans: • +6.6% annualized growth, +16.1% excluding payoffs of $30.5MM • Deposits: • Overall, +17% annualized growth • Non - Int Bearing, +20.7% annualized growth June 2019 (QTR) vs. March 2019 (QTR) ▪ EPS $0.66 vs. $0.62 ▪ Net Income $6.2MM vs. $5.8MM ▪ ROA 1.35% vs. 1.28% ▪ ROE 12.98% vs. 12.39% ▪ NIM 3.49% vs. 3.46% Quarterly Variances ▪ Margin: 3.49%, +3 bps QoQ ▪ Non Interest Income: +$1.1MM QoQ ▪ Gain on sale of securities, +$1.5MM ▪ Disposal due to early lease termination, - $0.4MM ▪ Insurance commissions, double digit growth v. PY ▪ Non Interest Expense: +$0.3MM QoQ ▪ Compensation, +$205k ▪ FDIC assessment increase: +$110k ▪ Expected 30% cost saves realized June 2019 Balance Sheet June 2019 Income Statement
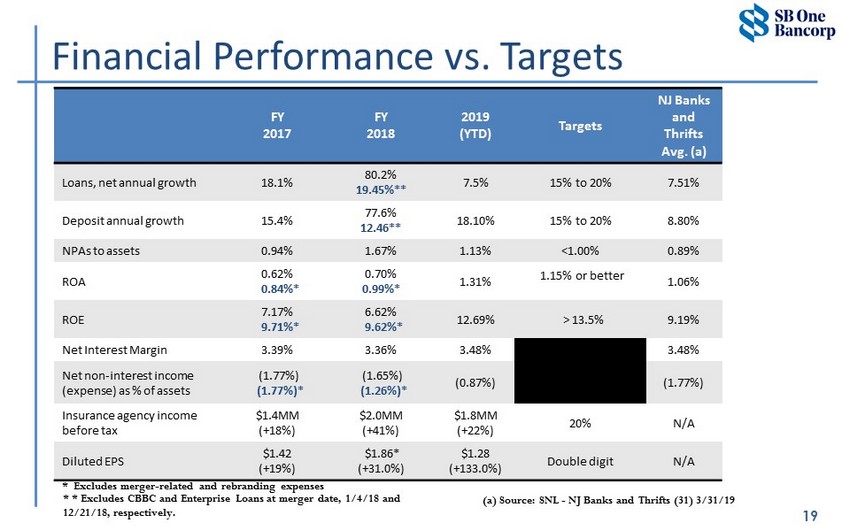
19 Financial Performance vs. Targets FY 2017 FY 2018 2019 (YTD) Targets NJ Banks and Thrifts Avg. (a) Loans, net annual growth 18.1% 80.2% 19.45%** 7.5% 15% to 20% 7.51% Deposit annual growth 15.4% 77.6% 12.46** 18.10% 15% to 20% 8.80% NPAs to assets 0.94% 1.67% 1.13% <1.00% 0.89% ROA 0.62% 0.84%* 0.70% 0.99%* 1.31% 1.15% or better 1.06% ROE 7.17% 9.71%* 6.62% 9.62%* 12.69% > 13.5% 9.19% Net Interest Margin 3.39% 3.36% 3.48% 3.48% Net non - interest income (expense) as % of assets (1.77%) (1.77%)* (1.65%) (1.26%)* (0.87%) (1.77%) Insurance agency income before tax $1.4MM (+18%) $2.0MM (+41%) $1.8MM (+22%) 20% N/A Diluted EPS $1.42 (+19%) $1.86* (+31.0%) $1.28 (+133.0%) Double digit N/A (a) Source: SNL - NJ Banks and Thrifts (31) 3/31/19 * Excludes merger - related and rebranding expenses * * Excludes CBBC and Enterprise Loans at merger date, 1/4/18 and 12/21/18, respectively.
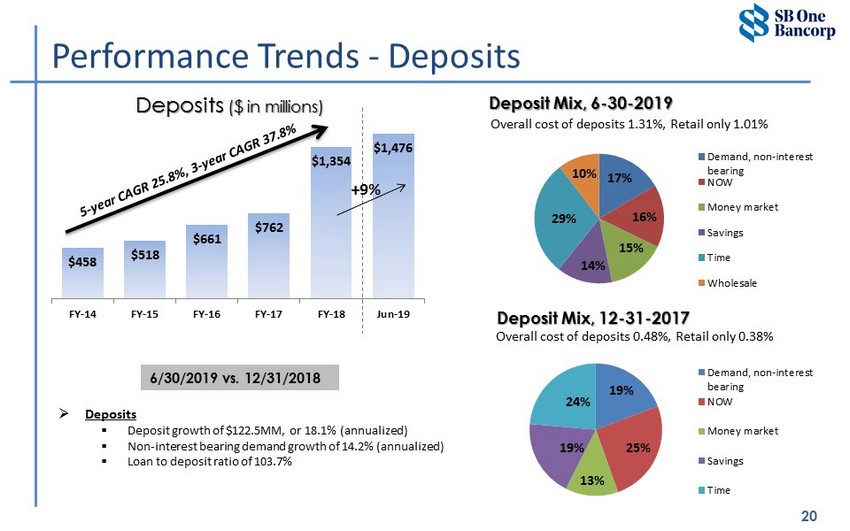
17% 16% 15% 14% 29% 10% Demand, non-interest bearing NOW Money market Savings Time Wholesale $458 $518 $661 $762 $1,354 $1,476 FY-14 FY-15 FY-16 FY-17 FY-18 Jun-19 20 Performance Trends - Deposits Deposits ($ in millions) 6/30/2019 vs. 12/31/2018 +9% Deposit Mix, 6 - 30 - 2019 Overall cost of deposits 1.31%, Retail only 1.01% » Deposits ▪ Deposit growth of $122.5MM, or 18.1% (annualized) ▪ Non - interest bearing demand growth of 14.2% (annualized) ▪ Loan to deposit ratio of 103.7% Deposit Mix, 12 - 31 - 2017 Overall cost of deposits 0.48%, Retail only 0.38% 19% 25% 13% 19% 24% Demand, non-interest bearing NOW Money market Savings Time
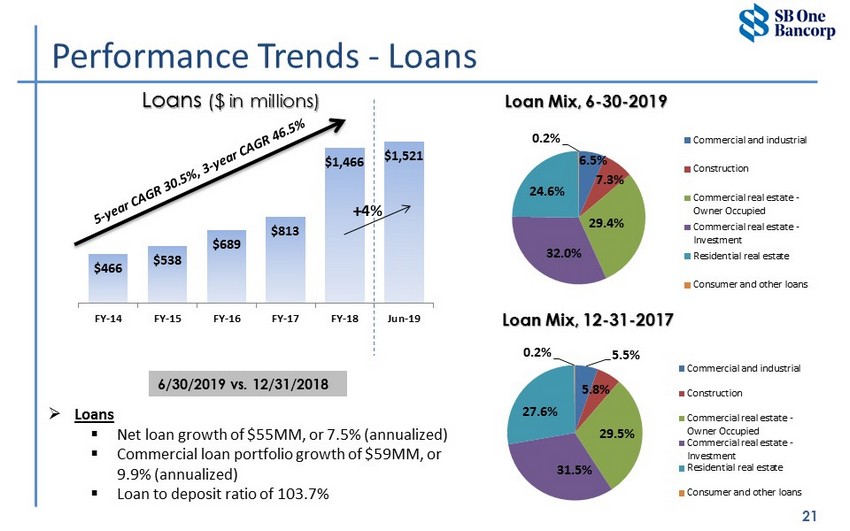
$466 $538 $689 $813 $1,466 $1,521 FY-14 FY-15 FY-16 FY-17 FY-18 Jun-19 21 Performance Trends - Loans Loans ($ in millions) +4% Loan Mix, 6 - 30 - 2019 » Loans ▪ Net loan growth of $55MM, or 7.5% (annualized) ▪ Commercial loan portfolio growth of $59MM, or 9.9% (annualized) ▪ Loan to deposit ratio of 103.7% 6/30/2019 vs. 12/31/2018 6.5% 7.3% 29.4% 32.0% 24.6% 0.2% Commercial and industrial Construction Commercial real estate - Owner Occupied Commercial real estate - Investment Residential real estate Consumer and other loans Loan Mix, 12 - 31 - 2017 5.5% 5.8% 29.5% 31.5% 27.6% 0.2% Commercial and industrial Construction Commercial real estate - Owner Occupied Commercial real estate - Investment Residential real estate Consumer and other loans
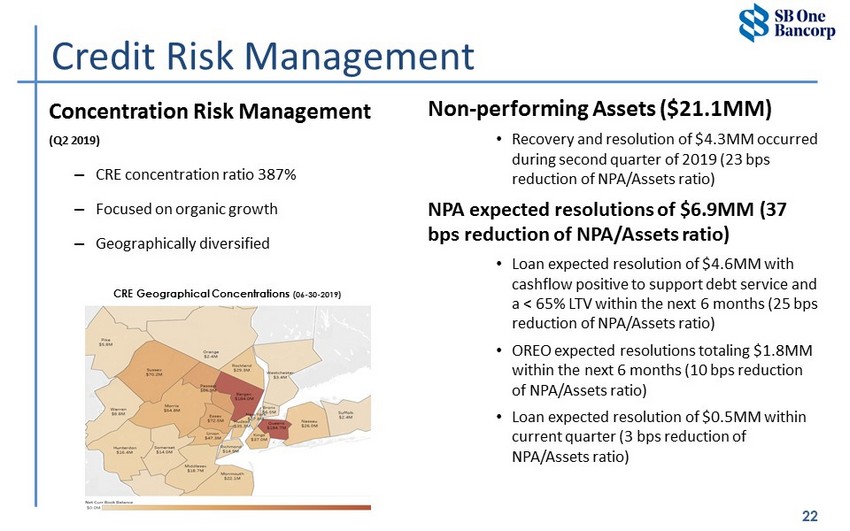
22 Credit Risk Management Concentration Risk Management (Q2 2019) – CRE concentration ratio 387% – Focused on organic growth – Geographically diversified CRE Geographical Concentrations (06 - 30 - 2019) Non - performing Assets ($21.1MM) • Recovery and resolution of $4.3MM occurred during second quarter of 2019 (23 bps reduction of NPA/Assets ratio) NPA expected resolutions of $6.9MM (37 bps reduction of NPA/Assets ratio) • Loan expected resolution of $4.6MM with cashflow positive to support debt service and a < 65% LTV within the next 6 months (25 bps reduction of NPA/Assets ratio) • OREO expected resolutions totaling $1.8MM within the next 6 months (10 bps reduction of NPA/Assets ratio) • Loan expected resolution of $0.5MM within current quarter (3 bps reduction of NPA/Assets ratio)
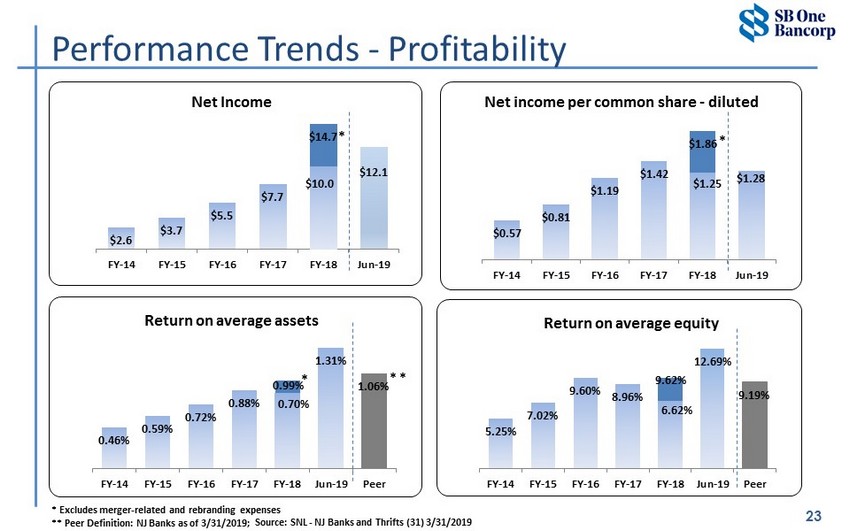
5.25% 7.02% 9.60% 8.96% 9.62% 12.69% 9.19% FY-14 FY-15 FY-16 FY-17 FY-18 Jun-19 Peer Return on average equity 6.62% $0.57 $0.81 $1.19 $1.42 $1.86 $1.28 FY-14 FY-15 FY-16 FY-17 FY-18 Jun-19 Net income per common share - diluted $1.25 0.46% 0.59% 0.72% 0.88% 0.99% 1.31% 1.06% FY-14 FY-15 FY-16 FY-17 FY-18 Jun-19 Peer Return on average assets 0.70% * * * $2.6 $3.7 $5.5 $7.7 $14.7 $12.1 FY-14 FY-15 FY-16 FY-17 FY-18 Jun-19 Net Income $10.0 23 Performance Trends - Profitability * Excludes merger - related and rebranding expenses ** Peer Definition: NJ Banks as of 3/31/2019; Source: SNL - NJ Banks and Thrifts (31) 3/31/2019 * *
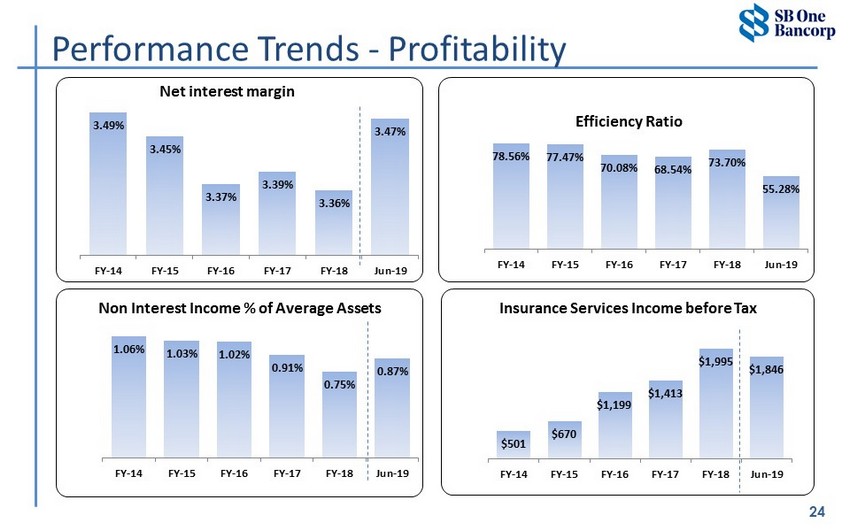
78.56% 77.47% 70.08% 68.54% 73.70% 55.28% FY-14 FY-15 FY-16 FY-17 FY-18 Jun-19 Efficiency Ratio 1.06% 1.03% 1.02% 0.91% 0.75% 0.87% FY-14 FY-15 FY-16 FY-17 FY-18 Jun-19 Non Interest Income % of Average Assets 24 Performance Trends - Profitability 3.49% 3.45% 3.37% 3.39% 3.36% 3.47% FY-14 FY-15 FY-16 FY-17 FY-18 Jun-19 Net interest margin $501 $670 $1,199 $1,413 $1,995 $1,846 FY-14 FY-15 FY-16 FY-17 FY-18 Jun-19 Insurance Services Income before Tax
Growth in Shareholder Value

26 Source: SNL and internal data Growth in Shareholder Value * Price at 07/26/2019 ** TBV at 06/30/19 Projected EPS $2.49 Trading Multiple of EPS 9.65X 10X 12X 14X SBBX Stock Price $23.67* $24.90 $29.88 $34.86 TBV Multiple $17.06** 139% 146% 175% 204% Price to LTM EPS: 11.6x
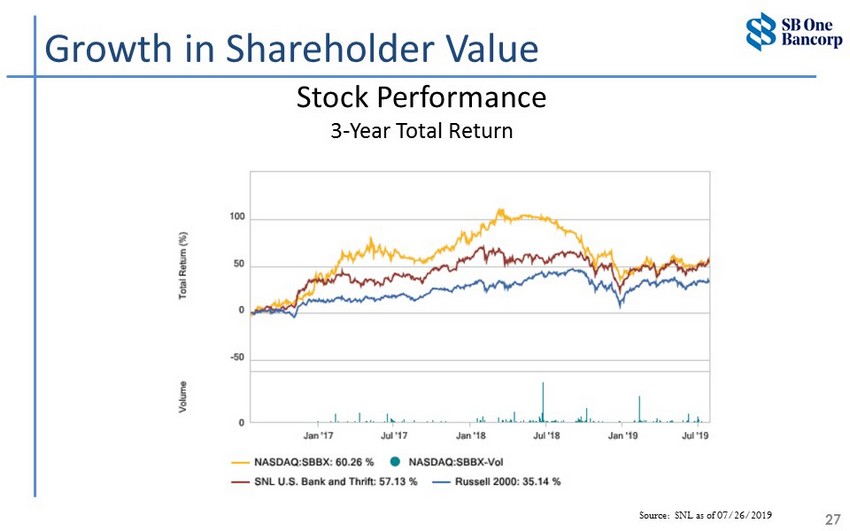
Stock Performance 3 - Year Total Return 27 Growth in Shareholder Value Source: SNL as of 07/26/2019
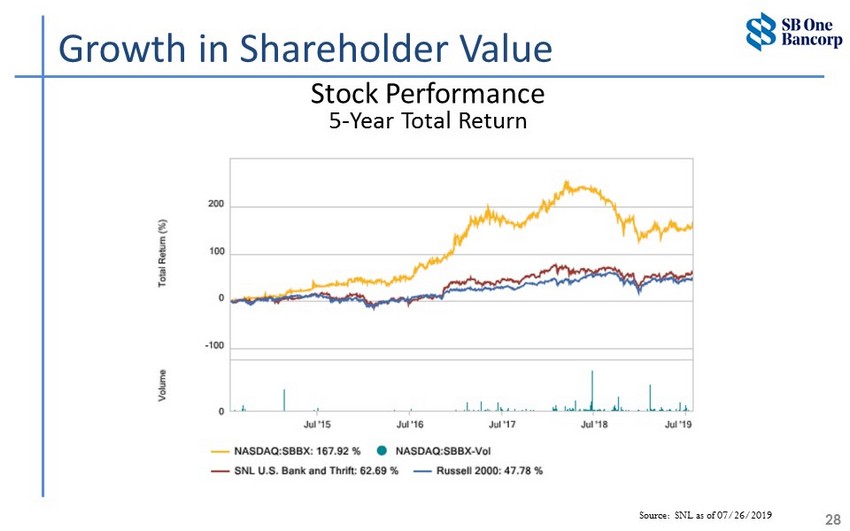
28 Source: SNL as of 07/26/2019 Stock Performance 5 - Year Total Return Growth in Shareholder Value
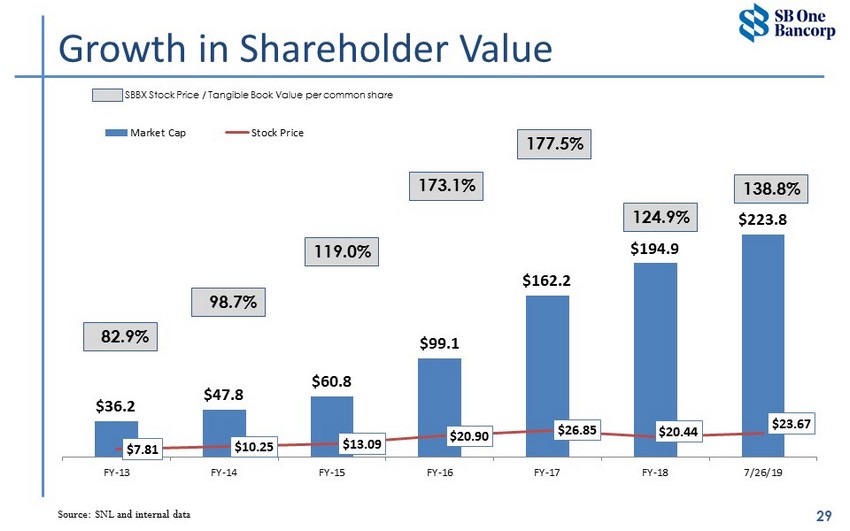
$36.2 $47.8 $60.8 $99.1 $162.2 $194.9 $223.8 $7.81 $10.25 $13.09 $20.90 $26.85 $20.44 $23.67 FY-13 FY-14 FY-15 FY-16 FY-17 FY-18 7/26/19 Market Cap Stock Price 177.5% 29 173.1% Source: SNL and internal data Growth in Shareholder Value 119.0% 98.7% 82.9% SBBX Stock Price / Tangible Book Value per common share 124.9% 138.8%
Q&A