Filed by Knightsbridge Shipping Limited
Commission File No. 000-29106
Pursuant to Rule 425 under the Securities Act of 1933
Subject Company: Golden Ocean Group Limited
Commission File No. for Registration Statement
on Form F-4 filed by Knightsbridge Shipping Limited: 333-200319
The following are copies of (i) Golden Ocean Group Limited's (the "Company") press release announcing the Company's third quarter and nine months 2014 results; (ii) the Company's Condensed Interim Financial Information for the third quarter 2014; (iii) the Company's presentation of third quarter 2014 results; and (iv) a transcript of the Company's audio presentation of the third quarter 2014 results.
Third Quarter and Interim Nine Months 2014 Results
Highlights
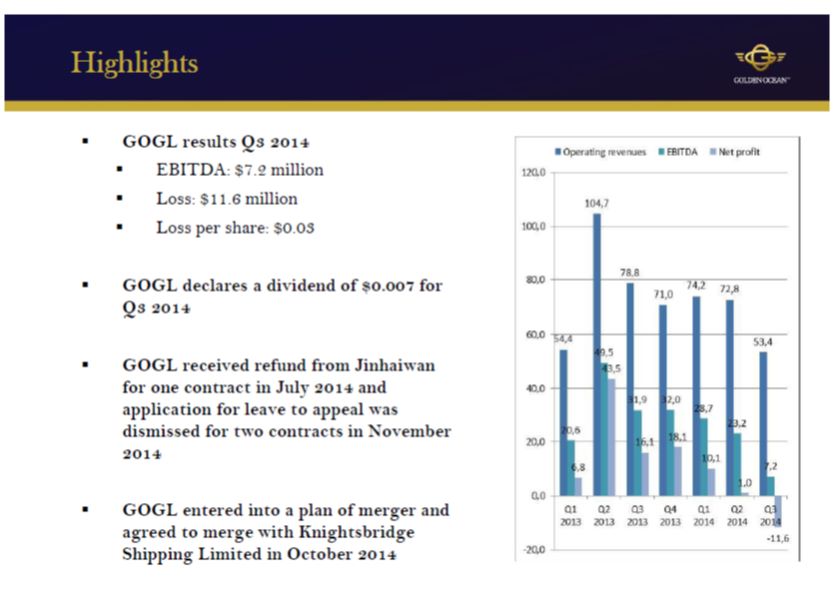
| · | Golden Ocean generates third quarter 2014 EBITDA* of $7.2 million |
| · | Golden Ocean reports loss of $11.6 million for the third quarter of 2014 |
| · | Golden Ocean announces dividends of $0.007 per share for the third quarter of 2014 |
| · | The Company received $47.4 million in refund of instalments and interest from Jinhaiwan in July 2014 |
| · | Two of the applications for leave to appeal were dismissed in High Court in London in November 2014 |
| · | The Company announced the agreement to merge with Knightsbridge Shipping Limited in October 2014 |
| * | EBITDA is equal to operating profit plus depreciation (including impairment related to vessels) and amortisation. |
Third Quarter and Interim nine months 2014 Results
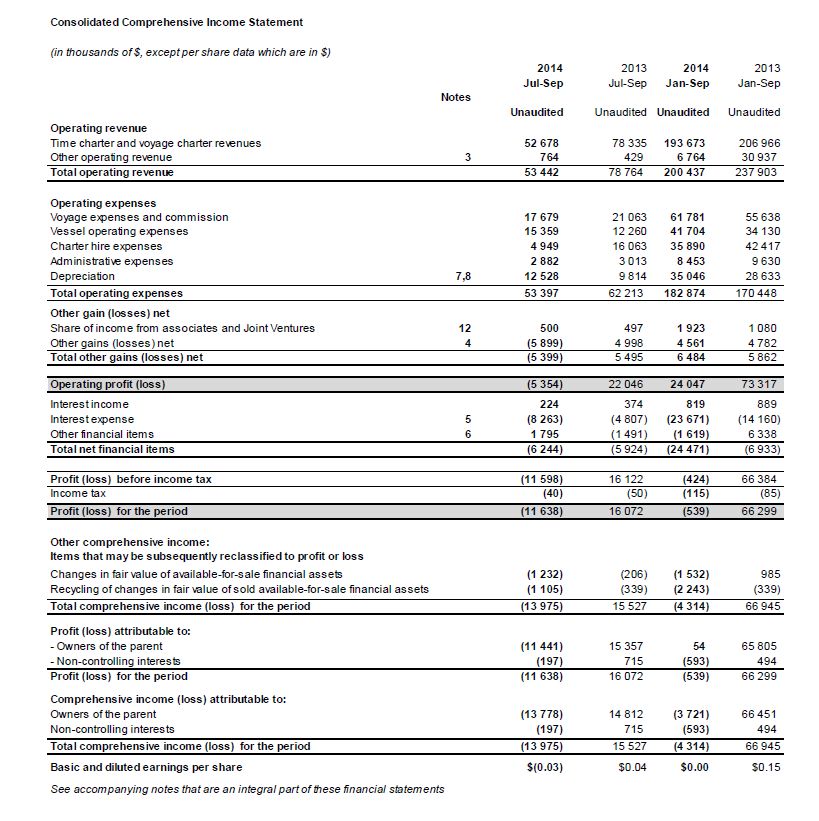
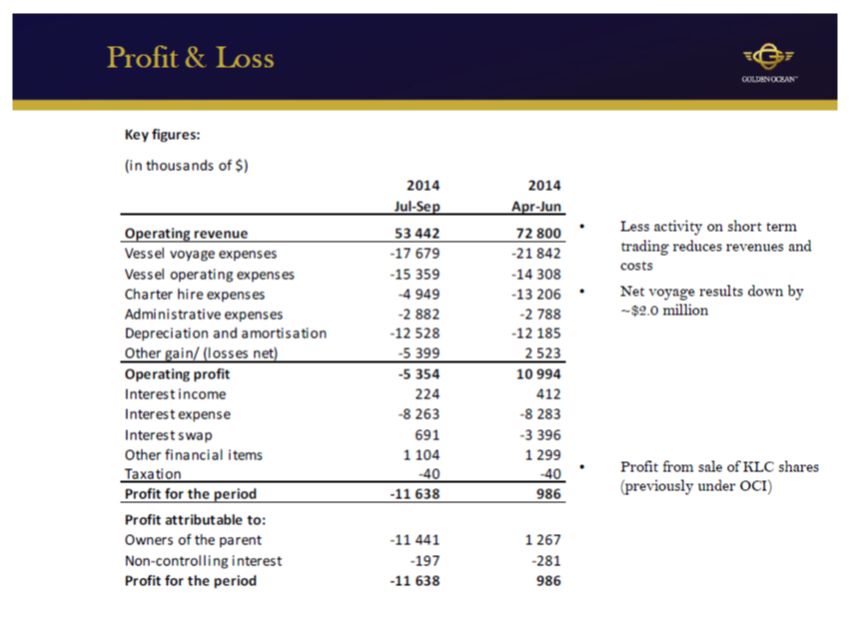
Golden Ocean Group Limited (the "Company" or "Golden Ocean") reports loss of $11.7 million and loss per share of $0.03 for the third quarter of 2014. This compares with profit of $1.0 million and earnings per share at par for the second quarter of 2014. Total operating revenues for the third quarter were $53.4 million; total operating expenses were $53.4 million and other gains/losses net were negative with $5.4 million. Net financial items were negative with $6.2 million.
The loss for the period of $11.7 million is a decrease of $12.6 million compared to last quarter. Net operating income is down by $16.4 million while net financial items are up by $3.7 million. When excluding one-off items the net operating income is down by $0.7 million. The earnings on the vessels are slightly lower in the third quarter of 2014 relative to the second quarter, however this is offset by a smaller negative mark to market change on the freight forward agreements in the third quarter. The net financial cost is reduced in the third quarter relative to the second quarter as the interest rate swaps had a positive mark to market change in the quarter, as opposed to a negative change in the second quarter.
Changes in one-off items relative to last quarter are negative approximately $15.7 million. These one-offs include revaluation of refundable installments on newbuildings (-$10.4 million) and compensation for default of a charter contract (-$5.3 million).
Cash and cash equivalents increased by $2.0 million during the quarter. Cash from operating activities was neutral in the quarter. The Company received $47.4 million from Jinhaiwan during the quarter and spent $5.5 million on installments and docking costs. Financing activities were negative with $41.7 million in the quarter. Repayment of debt, interest and financing charges amounted to $22.7 million, including $13.2 million related to the Jinhaiwan refunds, and dividends declared for second quarter of 2014 results were paid with a total of $11.2 million.
The full report is available in the link below.
November 21, 2014
The Board of Directors
Golden Ocean Group Limited
Hamilton, Bermuda
Golden Ocean Group Limited
Hamilton, Bermuda
Questions should be directed to:
| Herman Billung: | CEO Golden Ocean Management AS |
| +47 22 01 73 41 | |
| Birgitte Ringstad Vartdal: | CFO Golden Ocean Management AS |
| +47 22 01 73 53 |
Important Information For Investors And Shareholders
This communication does not constitute an offer to sell or the solicitation of an offer to buy any securities or a solicitation of any vote or approval. In connection with the proposed transaction between Golden Ocean Group Limited ("Golden Ocean") and Knightsbridge Shipping Limited ("Knightsbridge"), Knightsbridge will file relevant materials with the Securities and Exchange Commission (the "SEC"), including a registration statement of Knightsbridge on Form F-4 that will include a joint proxy statement of Golden Ocean and Knightsbridge that also constitutes a prospectus of Knightsbridge, and the joint proxy statement/prospectus will be mailed to shareholders of Golden Ocean and Knightsbridge. INVESTORS AND SECURITY HOLDERS OF GOLDEN OCEAN AND KNIGHTSBRIDGE ARE URGED TO READ THE JOINT PROXY STATEMENT/PROSPECTUS AND OTHER DOCUMENTS THAT WILL BE FILED WITH THE SEC CAREFULLY AND IN THEIR ENTIRETY WHEN THEY BECOME AVAILABLE BECAUSE THEY WILL CONTAIN IMPORTANT INFORMATION. Investors and security holders will be able to obtain free copies of the registration statement and the joint proxy statement/prospectus (when available) and other documents filed with or furnished to the SEC by Knightsbridge through the website maintained by the SEC at http://www.sec.gov. Copies of the documents filed with or furnished to the SEC by Knightsbridge will be available free of charge on Knightsbridge's website at http://www.knightsbridgeshipping.com. Additional information regarding the participants in the proxy solicitations and a description of their direct and indirect interests, by security holdings or otherwise, will be contained in the joint proxy statement/prospectus and other relevant materials to be filed with or furnished to the SEC when they become available.
This information is subject of the disclosure requirements pursuant to section 5-12 of the Norwegian Securities Trading Act.

Condensed Interim financial information
(Unaudited)
Third quarter 2014
November 21st, 2014
Highlights
| · | Golden Ocean generates third quarter 2014 EBITDA* of $7.2 million |
| · | Golden Ocean reports loss of $11.6 million for the third quarter of 2014 |
| · | Golden Ocean announces dividends of $0.007 per share for the third quarter of 2014 |
| · | The Company received $47.4 million in refund of instalments and interest from Jinhaiwan in July 2014 |
| · | Two of the applications for leave to appeal were dismissed in High Court in London in November 2014 |
| · | The Company announced the agreement to merge with Knightsbridge Shipping Limited in October 2014 |
*EBITDA is equal to operating profit plus depreciation (including impairment related to vessels) and amortisation.
Third Quarter and Interim nine months 2014 Results
Golden Ocean Group Limited (the "Company" or "Golden Ocean") reports loss of $11.7 million and loss per share of $0.03 for the third quarter of 2014. This compares with profit of $1.0 million and earnings per share at par for the second quarter of 2014. Total operating revenues for the third quarter were $53.4 million; total operating expenses were $53.4 million and other gains/losses net were negative with $5.4 million. Net financial items were negative with $6.2 million.
The loss for the period of $11.7 million is a decrease of $12.6 million compared to last quarter. Net operating income is down by $16.4 million while net financial items are up by $3.7 million. When excluding one-off items the net operating income is down by $0.7 million. The earnings on the vessels are slightly lower in the third quarter of 2014 relative to the second quarter, however this is offset by a smaller negative mark to market change on the freight forward agreements in the third quarter. The net financial cost is reduced in the third quarter relative to the second quarter as the interest rate swaps had a positive mark to market change in the quarter, as opposed to a negative change in the second quarter.
Changes in one-off items relative to last quarter are negative approximately $15.7 million. These one-offs include revaluation of refundable installments on newbuildings (-$10.4 million) and compensation for default of a charter contract (-$5.3 million).
The table below shows the split for some key numbers between the long term and the short term portfolio for the third quarter of 2014. Administrative expenses are not allocated. The long term portfolio is defined as owned vessels, long term time charter in contracts and bareboat vessels and relates to the vessels that the Company gives information on in quarterly releases and on the web page. The short term portfolio consists of the vessels, cargoes and derivatives that are entered into with a short duration.
| (in millions of $) | Long term portfolio | Short term portfolio | Total | |||||||||
| Total operating revenue | 44.9 | 8.5 | 53.4 | |||||||||
| Total operating expenses (ex admin) | -42.8 | -7.7 | -50.5 | |||||||||
| Total other gain/losses net | -3.7 | -1.7 | -5.4 | |||||||||
| Operating profit (ex admin) | -1.6 | -0.9 | -2.5 | |||||||||
| Admin expenses | -2.9 | |||||||||||
| Operating profit | -5.4 | |||||||||||
Cash and cash equivalents increased by $2.0 million during the quarter. Cash from operating activities was neutral in the quarter. The Company received $47.4 million from Jinhaiwan during the quarter and spent $5.5 million on installments and docking costs. Financing activities were negative with $41.7 million in the quarter. Repayment of debt, interest and financing charges amounted to $22.7 million, including $13.2 million related to the Jinhaiwan refunds, and dividends declared for second quarter of 2014 results were paid with a total of $11.2 million.
The proposed merger with Knightsbridge Shipping Limited
On October 7, 2014, Golden Ocean and Knightsbridge Shipping Limited ("Knightsbridge") announced that the two companies had entered into an agreement and plan of merger (the "Merger Agreement"), pursuant to which the two companies have agreed to merge, with Knightsbridge as the surviving legal entity (the "Combined Company"). The Combined Company will be renamed Golden Ocean Group Limited upon completion of the merger. As a result of the expected merger, the Combined Company would become one of the world's leading dry bulk companies with a modem fleet of 72 vessels, of which 36 are newbuildings under construction as of September 30, 2014. The merger is subject to approval by the shareholders of Golden Ocean and Knightsbridge in separate special general meetings. Golden Ocean and Knightsbridge filed a registration statement with the Securities and Exchange Commission ("SEC") on November 17, 2014, and once the registration statement is declared effective by the SEC the companies expect to call the special general meetings to ask for approval of the merger. The merger is expected to close in the first quarter of 2015. Completion of the merger is also subject to the execution of certain definitive documents, customary closing conditions and regulatory approvals.
Knightsbridge's ordinary shares are currently listed for trading on the NASDAQ Global Select Market ("NASDAQ"), and Golden Ocean's ordinary shares are currently listed for trading on the Oslo Stock Exchange (the "OSE") and the Singapore Stock Exchange. In accordance with the Merger Agreement, the Combined Company will apply for a secondary listing of its ordinary shares on the OSE, and expects that after the merger its ordinary shares will be listed for trading on both NASDAQ and the OSE.
Shareholders of Golden Ocean at the time the merger is completed will receive shares in Knightsbridge as merger consideration. Pursuant to the Merger Agreement, one share in Golden Ocean will give the right to receive 0.13749 shares in Knightsbridge, and Knightsbridge will issue a total of 61.5 million shares to shareholders in Golden Ocean as merger consideration.
Fleet status
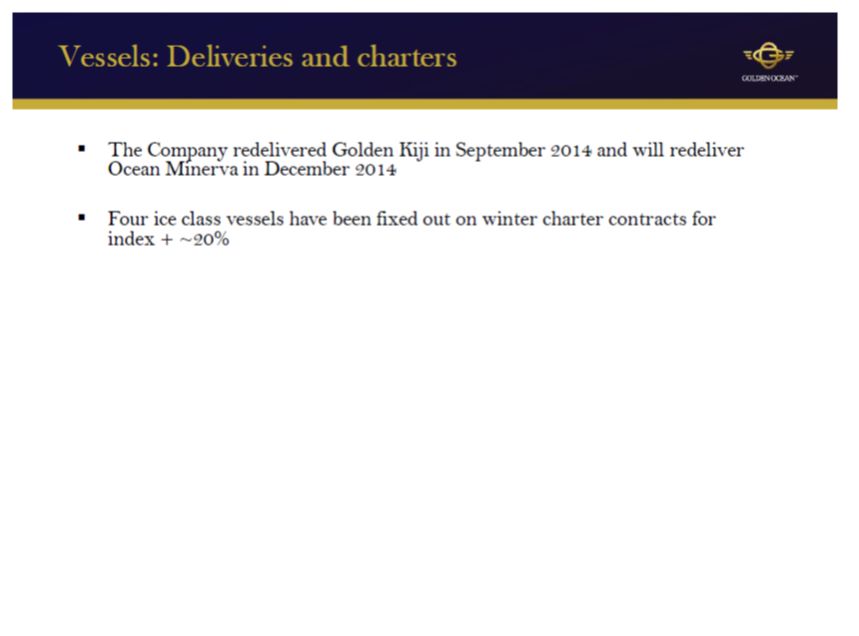
The Company has fixed out four of the Panamax ice class vessels for the winter season at a significant premium to the underlying index. The Company believes that this shows that the ice class niche is attractive for the Company and demonstrates the extra value for having these types of vessels in the portfolio
The Company decided not to declare the optional years on Golden Kiji and the vessel was redelivered to its owners in September 2014. The Company has also decided not to declare the optional years on Ocean Minerva and will redeliver the vessel to its owners during December 2014. Golden Ocean has still chartered in one vessel with purchase option, Golden Heiwa, and one vessel on time charter without purchase option, Golden Sakura.
One vessel, Golden Magnum, has drydocked during the third quarter. So far this year 6 vessels have been drydocked and in total 7 of the Company's vessels are expected to drydock during 2014.
Newbuilding program
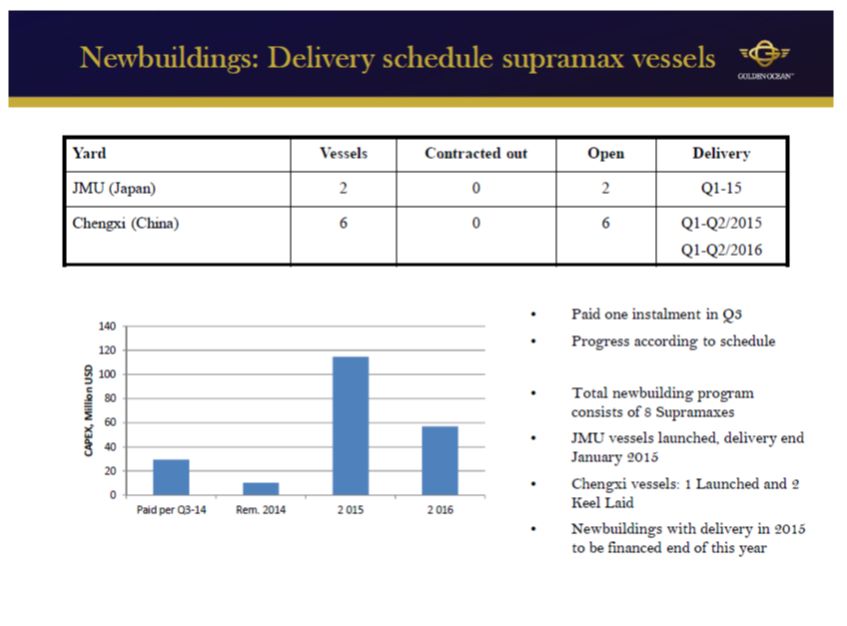
As per today Golden Ocean's total newbuilding program consists of eight Supramax vessels, two vessels from Japan Marine United Corporation ("JMU") and six vessels from Chengxi. The remaining capital expenditure for vessels under construction is $182.1 million as of end of the third quarter 2014. None of the newbuildings are financed yet however the Company is currently in discussions with lenders for financing of the five vessels with delivery first half of 2015. The financing is expected to be concluded prior to delivery of the first vessel in January 2015.
As earlier reported the Company has had arbitration processes ongoing in relation to nine construction contracts cancelled at Zhoushan Jinhaiwan Shipyard Co. Ltd. Last quarter the Company obtained final awards on three of these contracts and in May the Company received $56.2 million as refund for two contracts, covering installments of $45.8 million and interest of $10.4 million. End July the Company received
additional $47.4 million, covering installments of $38.65 million and $8.7 million in interest for the third contract. The Company has paid down debt with in total $31.9 million in relation to these contracts.
For the remaining six contracts Golden Ocean has received awards concluding that Golden Ocean was entitled to cancel the contracts and therefore also entitled to refunds. On two out of these contracts Golden Ocean was not found to be entitled to awarded interest, on the basis of the assumed facts on which the Award was based, but instalments only. Both parties are pursuing appeals in the High Court in London against these awards and the hearing will take place end of November 2014. The yard also applied to the High Court for leave to appeal against the awards made in respect of the four other contracts. For two contracts the court gave leave agreed to the appeal due to overlapping issues with the above appeals, with that appeal to be subject to having the issued heard at the same hearing as above. For the remaining two contracts the High Court dismissed the yard's application for leave to appeal and the award is now final.
The Company's claim towards the yard is secured by refund guarantees from two of the top four Chinese banks including 5 per cent interest from the date of payment of the installment. The Company has in aggregate paid $90.8 million on the last six vessels and has drawn $11.3 million under the related loan facilities.
Corporate
On November 21, 2014 the Board has declared a dividend of $0.007 per share. The record date for the dividend has been set to December 2, 2014, for shareholders holding shares on the Oslo Stock Exchange and December 3, 2014 for shareholders holding shares on the Singapore Stock Exchange, ex dividend date will be December 1, 2014 and the dividend will be paid on or about December 18, 2014.
One of the Company's loan facilities expires in September 2015 and the outstanding debt under this facility, $34.3 million, has been classified as short term debt in the third quarter. The Company is currently in discussions with the lenders to conclude refinancing of this facility together with the financing of the Supramax vessels as described above as well as refinancing of three other facilities at attractive terms.
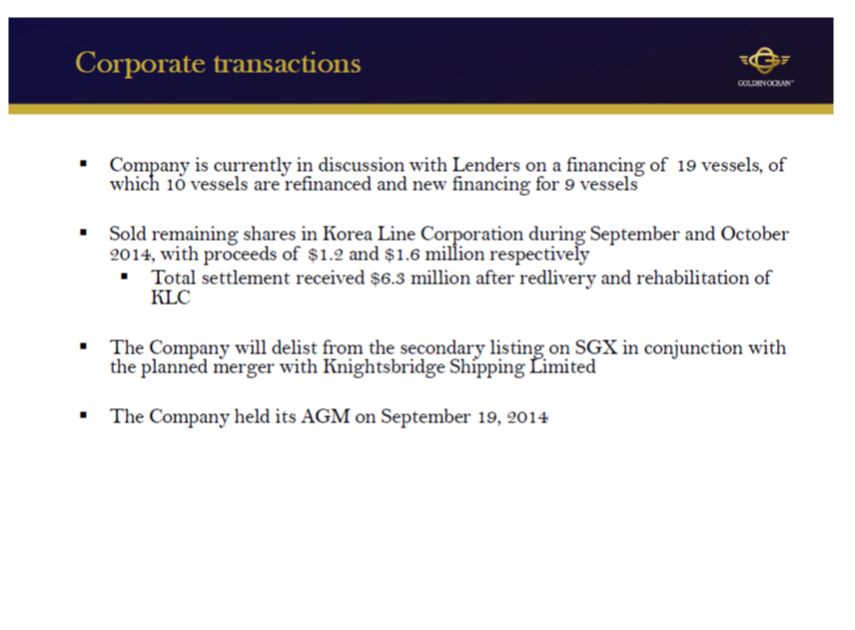
The Company has during the third quarter of 2014 sold 47,685 shares in Korea Line Corporation at krw 26,012 per share with total proceeds of USD 1.2 million, which also has been booked as a profit in the income statement. During the fourth quarter the Company has sold the remaining 67,354 shares at krw 24,949 per share with total proceeds of USD 1.6 million, which will be booked as a profit in the fourth quarter. Including sales proceeds from shares the Company has in total received 6.3 million as a compensation for the default on the charter contracts for Golden Empress and Golden Eminence in 2012.
The Company is continuing with the work on the delisting from the Singapore Stock Exchange and the delisting will take place at the closing of the expected merger.
In connection with the filing of the registration statement with the Securities and Exchange Commission the Company has issued updated financial statements for the years 2011, 2012 and 2013 as well as for the six months ended June 30, 2014, in which certain items have been reclassified within the balance sheet.
As of September 30, 2014 the total number of shares outstanding in Golden Ocean was 447,314,296 of $0.10 par value each. Additionally the Company had stock options for 4.85 million shares outstanding under various share incentive programs for management and the Directors, of which 1.48 million are vested and exercisable.
The Dry bulk market
For the second quarter in a row the dry bulk market surprised on the downside. At the start of the quarter many analysts still believed in a recovery in second half of the year. But as time passed by with a continued lower utilization of the dry bulk fleet than anticipated the sentiment changed resulting in a lower forward curves across the board. In third quarter 2014 Capesize vessels earned on average $12,635 per day compared to $11,900 per day the previous quarter and $18,970 in third quarter last year. Panamax vessels earned on average $5,565 per day in third quarter compared to $6.300 per day previous quarter and $8.925 in third quarter last year.
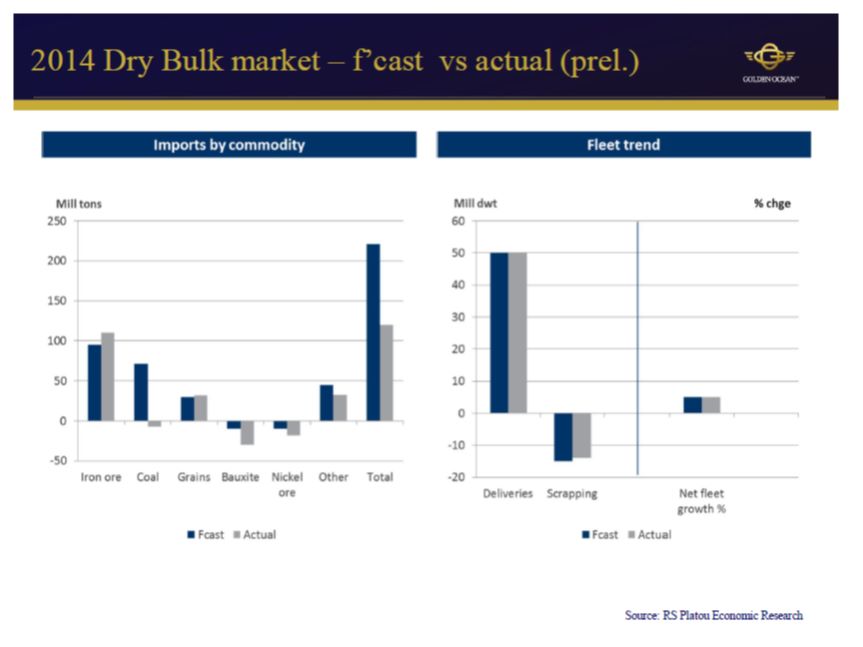
Chinese steel production in third quarter was about 4 million mt lower than in previous quarter, but still 4 million mt higher compared to third quarter of 2013, representing a modest growth of 2.5 per cent. In spite of lower steel production than consensus forecast, iron ore imports continued its strong growth. On the back of strong supply growth from the major international mining companies iron ore prices fell significantly during the quarter. This supports use of high quality imported iron ore compared to domestic sourcing for Chinese steel makers. With recent strong import numbers it is likely that China will import close to 950 million mt of iron ore in 2014, which represents a growth of 100 million mt compared to 2013.
Approximately 11.8 million dwt of new dry bulk capacity was delivered during third quarter of 2014, compared to 11 million dwt in second quarter. Scrapping has been fairly stable the three first quarters of 2014. About 12 million dwt was removed from the tonnage list by the end of September, fairly evenly spread out over the three quarters. If deliveries and scrapping continue at same pace throughout the rest of the year net fleet growth should end up at 5 per cent.
Iron ore has indeed supported demand and supply of new vessels has been in line with expectations, so what has gone wrong so far, compared to the majority of rate estimates made by analysts at the beginning of the year?
The largest negative surprise has come from the coal sector with much lower coal imports to China than expected.Met coal into China declined with 35 per cent during third quarter compared to the same quarter last year which on an annualized basis is only 40 million tons. Steam coal into China did not do much better, declining by 24 per cent in the third quarter on a y-o-y basis to an annualized level of 155 million tons. In all, coal imports to China fell to an annualized level of under 200 million tons. In spite of a promising start to the year it looks like China will end up with total coal imports of around 275 million mt in 2014 against 310 million mt in 2013. This is against a forecasted growth of 7.5 per cent at the beginning of the year. Recently, prices of international coal have generally fallen below the cash costs of Chinese producers, of which a majority are reportedly making losses. Demand for coal in China has slowed down this year, as China's electricity production has flattened out to about 5 per cent growth and other energy sources have substituted for coal, most notably hydroelectric power. In an effort to shore up the domestic mining industry, China has introduced a set of policy measures that are intended to make coal imports more costly. The Chines policy makers seem to be willing to retain as much as possible of domestic production in the energy mix. Branded as an environmental policy, new criteria on ash and sulphur content have been set for coal being used, sold and imported. Having said that, a cold and dry winter in China will have a negative impact on the hydro power capacity. This could force Chinese utilities to import more coal.
Demand for grains has been fairly stable compared to last year, but logistics in South America have improved leading to much lower congestion this year.
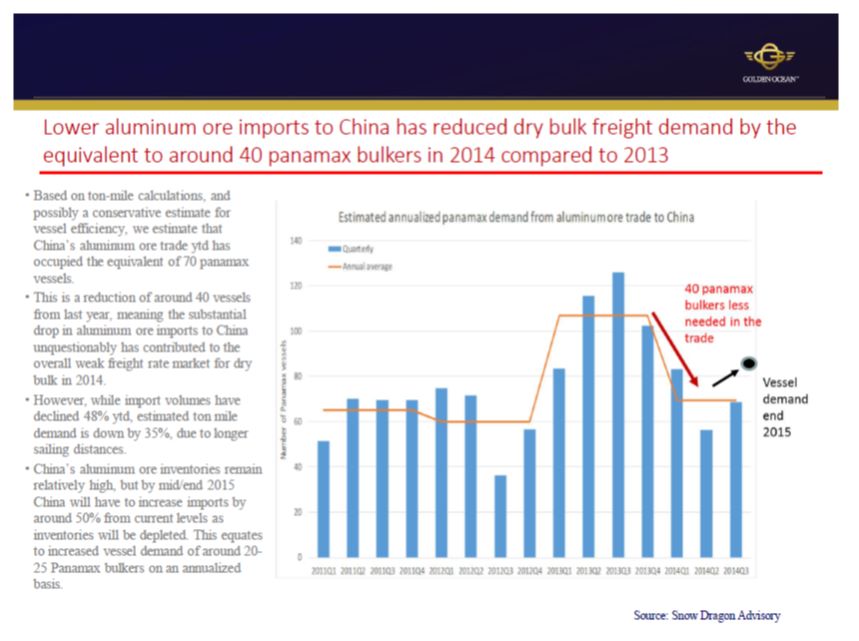
China did a massive stock building of bauxite and nickel ore end of last year to be prepared for the ban introduced by the Indonesian authorities at the start of 2014. The combined shortfall in imports of these two commodities to China could be close to 60 million mt compared to 2013. The negative impact has predominantly been for the smaller sizes. Stockpiles of bauxite in China are considered to be low and restocking will most likely come from areas with longer sailing distances.
The downward pressure on asset prices continued during third quarter. Capesizes were still holding better up than the smaller segments and according to sale and purchase brokers modern vessels (maximum 5 years old) were priced three per cent lower by the end of September compared to end of June 2014, while Panamaxes and Supramaxes lost between 5 and 10 per cent compared to end of June 2014. This was more or less same declines as the previous quarter, but still considerably higher than end of third quarter last year. Yards of good quality seems to be reluctant to reduce prices in spite of lower ordering activity. The reasons are that their order books are still decent and their margins are thin.
Strategy
The Board of Directors is satisfied with the merger agreement entered into with Knightsbridge. The main focus for the management is now related to the implementation process, and the Board and management are dedicated to conclude the process of creating one of the world's leading dry bulk companies. After completion of the merger the Combined Company will be in a position to look for further consolidation opportunities in the dry bulk market.
The spot market has improved in the fourth quarter relative to the third quarter, however longer term coverage has not been offered at attractive earnings so far. As a consequence a vast majority of the fleet remains exposed to spot earnings. Several of the ice dass Panamax vessels are however fixed out to customers through the winter seasons. The earnings are index linked, but with a premium of on average more than 20 per cent compared to the prevailing spot market. The Company will consider taking cover for a part of the fleet when the market improves and such charters offer attractive return on the investment.
Outlook
The ongoing arbitration process against Jinhaiwan continues as expected and as reported earlier. A request for appeal by the counterpart has been rejected by the Tribunal on two contracts. The hearing for the four remaining contracts will take place end November 2014. Consequently the Board of Golden Ocean is still confident that the Company will recover and receive installments and interest within the next half year.
As a result Golden Ocean should have a strong cash position in spite of a disappointing market. If the market remains weak Golden Ocean and later the Combined Company could be in unique position to act as a consolidator in a fragmented industry.
It was well into the fourth quarter when the dry bulk market witnessed a decent recovery. The effect on fourth quarter earnings will be limited, but it is expected that the net result will be slightly better than in the third quarter. Future earnings will continue to correlate with the spot market as long as the existing chartering strategy remains the same.
Golden Ocean is in the process of refinancing 19 vessels in one facility and is together with Knightsbridge discussing financing of most of the remaining newbuildings of the Combined Company. Several leading shipping banks are showing strong interest. A financing with relatively low margins and long repayment profile is expected. Together with low operating cost and G&A, this financing should secure attractive cash break even rates for Golden Ocean and the Combined Company going forward.
Forward Looking Statements
The statements contained in this press release that are not purely historical are forward-looking statements. The forward-looking statements include, but are not limited to, statements regarding the expectations, hopes, beliefs, intentions or strategies regarding the future of Golden Ocean Group Limited ("Golden Ocean"), Knightsbridge Shipping Ltd. ("Knightsbridge") and the shipping market in general. In addition, any statements that refer to projections, forecasts or other characterizations of future events or circumstances, including any underlying assumptions, are forward-looking statements. The words "anticipate", "believe", "continue", "could", "estimate", "expect", "intend", "may", "might", "plan", "possible", "potential", "predict", "project", "forecast", "should", `would" and similar expressions may identify forward-looking statements, but the absence of these words does not mean that a statement is not forward-looking. Forward-looking statements in this press release may include, for example, statements about: the shipping markets, sources of and demand for drybulk and other shipping cargo, and the performance of the shipping markets and the Chinese and global economy.
The forward-looking statements contained in this press release are based on the current expectations and beliefs of Golden Ocean concerning future developments and their potential effects on Golden Ocean, Knightsbridge, the shipping markets and factors affecting supply and demand for drybulk and other shipping cargo, including, among other things, the expected merger between Golden Ocean and Knightsbridge. All statements and information in this press release relating to the merger and the resulting combined company are based on the anticipated effectuation of the merger, which is subject to certain conditions precedent. There can be no assurance that future developments affecting any of them will be those that have been anticipated. These forward-looking statements involve a number of risks, uncertainties (many of which are beyond Golden Ocean's or Knightsbridge's control) or other assumptions that may cause actual results or performance to be materially different from those expressed or implied by these forward-looking statements. Should one or more of these risks or uncertainties materialize, or should any of Golden Ocean's assumptions prove incorrect, actual results may vary in material respects from those projected in these forward-looking statements. Neither Golden Ocean nor Knightsbridge undertake any obligation to update or revise any forward-looking statements, whether as a result of new information, future events or otherwise, except as may be required under applicable securities laws.
Certain shipping, steel, Chinese and global industry information, statistics and charts contained herein have been derived from several sources. You are hereby advised that such industry data, charts and statistics have not been prepared specifically for inclusion in these materials and Golden Ocean has not undertaken any independent investigation to confirm the accuracy or completeness of such information.
Important Information For Investors And Shareholders
This communication does not constitute an offer to sell or the solicitation of an offer to buy any securities or a solicitation of any vote or approval. In connection with the proposed transaction between Golden Ocean Group Limited ("Golden Ocean") and Knightsbridge Shipping Limited ("Knightsbridge"), Knightsbridge will file relevant materials with the Securities and Exchange Commission (the "SEC"), including a registration statement of Knightsbridge on Form F-4 that will include a joint proxy statement of Golden Ocean and Knightsbridge that also constitutes a prospectus of Knightsbridge, and the joint proxy statement/prospectus will be mailed to shareholders of Golden Ocean and Knightsbridge. INVESTORS AND SECURITY HOLDERS OF GOLDEN OCEAN AND KNIGHTSBRIDGE ARE URGED TO READ THE JOINT PROXY STATEMENT/PROSPECTUS AND OTHER DOCUMENTS THAT WILL BE FILED WITH THE SEC CAREFULLY AND IN THEIR ENTIRETY WHEN THEY BECOME AVAILABLE BECAUSE THEY WILL CONTAIN IMPORTANT INFORMATION. Investors and security holders will be able to obtain free copies of the registration statement and the joint proxy statement/prospectus (when available) and other documents filed with or furnished to the SEC by Knightsbridge through the website maintained by the SEC at http://www.sec.gov. Copies of the documents filed with or furnished to the SEC by Knightsbridge will be available free of charge on Knightsbridge's website at http://www.knightsbridgeshipping.com. Additional information regarding the participants in the proxy solicitations and a description of their direct and indirect interests, by security holdings or otherwise, will be contained in the joint proxy statement/prospectus and other relevant materials to be filed with or furnished to the SEC when they become available.
November 21st, 2014
The Board of Directors
Golden Ocean Group Limited
Hamilton, Bermuda
Hamilton, Bermuda
Questions should be directed to:
Herman Billung: CEO Golden Ocean Management AS
+47 22 01 73 41
Birgitte Ringstad Vartdal: CFO Golden Ocean Management AS
+47 22 01 73 53
+47 22 01 73 53
Condensed Interim financial information
Third Quarter 2014
Index
Third Quarter 2014
Index
Consolidated Comprehensive Income Statement for the periods ended September 30, 2014 and 2013
Consolidated Balance Sheet as at September 30, 2014 and December 31, 2013
Consolidated Cash Flow Statement for the periods ended September 30, 2014 and 2013
Consolidated Statement of Changes in Equity for the periods ended September 30, 2014 and 2013
Notes to Condensed Interim financial information
Golden Ocean Group Limited Consolidated Balance Sheet | Notes | 2014 Sep 30 Unaudited | 2013 Dec 31 | |||||||||
| (in thousands of $) | ||||||||||||
| ASSETS | ||||||||||||
| Non current assets | ||||||||||||
| Vessels and equipment | 7 | 824,903 | 667,788 | |||||||||
| Vessels held under finance leases | 8 | 123,890 | 130,795 | |||||||||
| Vessels under construction | 9 | 30,578 | 16,144 | |||||||||
| Other long term receivables | 11 | 9,035 | 8,588 | |||||||||
| Available-for-sale financial assets | 15 | 13,141 | 16,916 | |||||||||
| Derivative financial instruments | 14 | 4,188 | 2,735 | |||||||||
| Instalments on cancelled newbuildings | - | 192,976 | ||||||||||
| Investment in associates and Joint Ventures | 12 | 10,388 | 17,419 | |||||||||
| Total non-current assets | 1,016,123 | 1,053,361 | ||||||||||
| Current assets | ||||||||||||
| Inventories | 11,590 | 10,775 | ||||||||||
| Trade and other receivables | 11 | 30,682 | 25,495 | |||||||||
| Refundable installments on cancelled newbuildings | 24 | 102,595 | - | |||||||||
| Restricted deposit | 10 | 3,996 | 4,960 | |||||||||
| Cash and cash equivalents | 10 | 129,189 | 93,881 | |||||||||
| Total current assets | 278,052 | 135,110 | ||||||||||
| Total assets | 1,294,175 | 1,188,471 | ||||||||||
| EQUITY AND LIABILITIES | ||||||||||||
| Equity attributable to equity holders of the parent | ||||||||||||
| Share capital | 44,731 | 44,726 | ||||||||||
| Additional paid in capital | 99,187 | 99,156 | ||||||||||
| Other reserves | 47,890 | 23,466 | ||||||||||
| Retained earnings | 420,182 | 453,434 | ||||||||||
| 611,990 | 620,782 | |||||||||||
| Non-controlling interests | 15 | 1,108 | ||||||||||
| Total Equity | 612,005 | 621,890 | ||||||||||
| Non-Current Liabilities | ||||||||||||
| Long term debt | 16, 17 | 450,278 | 362,805 | |||||||||
| Obligations under finance leases | 18 | 105,786 | 110,416 | |||||||||
| Other long term liabilities | 1,677 | 1,903 | ||||||||||
| Total non-current liabilities | 557,741 | 475,124 | ||||||||||
| Current Liabilities | ||||||||||||
| Long-term debt - current portion | 16 | 86,106 | 41,214 | |||||||||
| Obligations under finance leases – current portion | 18 | 6,798 | 7,370 | |||||||||
| Amount due to related parties | 2,038 | 1,216 | ||||||||||
| Trade payables and other current liabilities | 19 | 29,487 | 41,656 | |||||||||
| Total current liabilities | 124,429 | 91,456 | ||||||||||
| Total liabilities and shareholders’ equity | 1,294,175 | 1,188,471 | ||||||||||
See accompanying notes that are an integral part of these financial statements
Golden Ocean Group Limited Consolidated Cash Flow Statement | ||||||||||||
| (in thousands of $) | 2014 | 2013 | ||||||||||
| Notes | Jan-Sep | Jan-Sep | ||||||||||
| OPERATING ACTIVITIES | Unaudited | Unaudited | ||||||||||
| Profit (loss) for the period | (539 | ) | 66,384 | |||||||||
| Adjustments for: | ||||||||||||
| Share based payment | 382 | 1,017 | ||||||||||
| Stock options paid in cash | (54 | ) | - | |||||||||
| Gain on sale and Impairment of available-for-sale financial assets | (2,495 | ) | (339 | ) | ||||||||
| Share of (profit) loss from associates and Joint Ventures | 12 | (8,121 | ) | (1,080 | ) | |||||||
| Gain from refundable instalments for cancelled newbuildings | (10,658 | ) | - | |||||||||
| Interest expensed | 16,890 | 7,516 | ||||||||||
| Interest income | (819 | ) | (889 | ) | ||||||||
| Depreciation | 7,8 | 35,046 | 28,633 | |||||||||
| Amortisation of deferred charges | 1,024 | 459 | ||||||||||
| Foreign currency gain (losses) | 179 | 107 | ||||||||||
| Imputed interest on other long term receivables | (447 | ) | (417 | ) | ||||||||
| Net change in: | ||||||||||||
| Amount due to related parties | 822 | (629 | ) | |||||||||
| Derivative financial instrument | 14 | 6,132 | (5,775 | ) | ||||||||
| Trade and other receivables | 11 | (56,34 | ) | (8,788 | ) | |||||||
| Inventories | (816 | ) | (9,261 | ) | ||||||||
| Trade payables and other current liabilities | 19 | (7,657 | ) | (9,985 | ) | |||||||
| Net cash provided by operating activities | 23,235 | 66,954 | ||||||||||
| INVESTING ACTIVITIES | ||||||||||||
| Changes in restricted deposit | 965 | 1,902 | ||||||||||
| Interest received | 819 | 889 | ||||||||||
| Payments on vessels | 7,9 | (156,894 | ) | (49,497 | ) | |||||||
| Capitalised docking and periodic maintenance | (11,510 | ) | (783 | ) | ||||||||
| Investment in Joint Venture | 12 | - | (30,825 | ) | ||||||||
| Proceeds from cancelled newbuildings | 103,569 | - | ||||||||||
| Sale of short term investment | - | 339 | ||||||||||
| Sale of available-for-sale financial assets | 2,495 | - | ||||||||||
| Net cash provided by (used in) investing activities | (60,556 | ) | (77,975 | ) | ||||||||
| FINANCING ACTIVITIES | ||||||||||||
| Payment of financing charges | (3,659 | ) | (714 | ) | ||||||||
| Payment of interest | (12,065 | ) | (7,498 | ) | ||||||||
| Payment of interest swaps | (6,132 | ) | (2,941 | ) | ||||||||
| Repayment of obligations under finance leases | (5,117 | ) | (4,881 | ) | ||||||||
| Repayment of long term debt | (61,895 | ) | (32,706 | ) | ||||||||
| Proceeds from long term debt | - | 24,017 | ||||||||||
| Proceeds from related party | - | 10,000 | ||||||||||
| Proceeds from issue of new shares | 36 | - | ||||||||||
| Payment of dividends | (38,539 | ) | (4,473 | ) | ||||||||
| Proceeds from Convertible bonds | 200,000 | - | ||||||||||
| Net cash (used in) provided by financing activities | 72,629 | (19,196 | ) | |||||||||
| Net change in cash and cash equivalents | 35,308 | (30,217 | ) | |||||||||
| Cash and cash equivalents at beginning of period | 93,881 | 104,359 | ||||||||||
| Cash and cash equivalents at end of period | 10 | 129,189 | 74,142 | |||||||||
Golden Ocean Group Limited
Consolidated Statement of
Changes in Equity
| (in thousands of $) | Total Attributable to equity holders of the parent | |||||||||||||||||||||||||||
| Share Capital | Additional paid in capital | Other Reserves | Retained Earnings | Total | Non-Controlling interests | Total Equity | ||||||||||||||||||||||
| Balance at January 1, 2013 | 44,726 | 99,156 | 16,550 | 377,372 | 537,805 | 491 | 538,296 | |||||||||||||||||||||
| Comprehensive income for the period | - | - | 646 | 65,890 | 66,536 | 494 | 67,030 | |||||||||||||||||||||
| Dividends and related tax | - | - | - | (4,473 | ) | (4,473 | ) | - | (4,473 | ) | ||||||||||||||||||
| Value of services under stock options scheme | - | - | - | 1,017 | 1,017 | - | 1,017 | |||||||||||||||||||||
| Balance at September 30, 2013 | 44,726 | 99,156 | 17,196 | 439,807 | 600,885 | 985 | 601,870 | |||||||||||||||||||||
| Balance at January 1, 2014 | 44,726 | 99,156 | 23,466 | 453,434 | 620,782 | 1,108 | 621,890 | |||||||||||||||||||||
| Comprehensive income (loss) for the period | - | - | (3,690 | ) | (5 | ) | (3,695 | ) | (593 | ) | (4,288 | ) | ||||||||||||||||
| Equity portion Convertible Bond | - | - | 28,114 | - | 28,114 | - | 28,114 | |||||||||||||||||||||
| Issue of new share capital | 5 | 31 | - | - | 36 | 21 | 57 | |||||||||||||||||||||
| Dividends and related tax | - | - | - | (33,575 | ) | (33,575 | ) | (521 | ) | (34,096 | ) | |||||||||||||||||
| Value of services under stock options scheme | - | - | - | 382 | 382 | - | 382 | |||||||||||||||||||||
| Stock option paid in cash | - | - | - | (54 | ) | (54 | ) | - | (54 | ) | ||||||||||||||||||
| Balance at September 30, 2014 | 44,731 | 99,187 | 47,890 | 420,182 | 611,990 | 15 | 612,005 | |||||||||||||||||||||
1. ACCOUNTING PRINCIPLES
The condensed interim financial statements have been prepared in accordance with IAS 34 Interim Financial Reporting. A full description of the accounting principles used in preparing the consolidated financial statements for Golden Ocean Group Ltd. is included in note 2 in the annual report for 2013. The annual consolidated financial statements are prepared in accordance with IFRS as approved by IASB. There have been no changes in the accounting principles in 2014 compared to 2013.
2. ESTIMATES, JUDGEMENTS AND ASSUMPTIONS
Preparation of the interim financial statements in accordance with IFRS implies use of estimates, which are based on judgments and assumptions that affect the application of accounting principles and the reported amounts of assets, liabilities, revenues and expenses. Actual amounts might differ from such estimates. Other than in the case of the item described below, there were no significant changes to the estimates and judgments made in these interim financial statements compared to the previous annual financial statements.
Refundable installments on cancelled newbuildings
Based on the outcome of the arbitration on the installments for the nine cancelled newbuilding contracts there has been a reclassification of these assets from non—financial to financial during second quarter of 2014. The receivables are initially measured at fair value upon the change in classification but do not include interest on the two contracts where the Company was not awarded interest by the court. The Company continues to believe that its appeal to receive interest on all contracts will succeed, however the right to these amounts is not considered virtually certain based on the initial adverse ruling. Had the group judged that it was virtually certain that it had a right to refund of interest for these two contracts where interest was not initially awarded, the value of the financial assets would have been $111.0 million compared to the financial asset of $102.6m that was recorded at September 2014 and resulted in $8.4 million higher pre-tax profits for the third quarter 2014. The denial of interest for these two cancelled contracts will be appealed in front of the High Court in London in November this year.
3. OTHER REVENUE
| (in thousands of $) | 2014Jul-Sep | 2013 Jul-Sep | 2014 Jan-Sep | 2013 Jan-Sep | ||||||||||||
| Management fee revenues | 695 | 429 | 1,365 | 937 | ||||||||||||
| Other revenues | 69 | - | 5,399 | 30,000 | ||||||||||||
| Total other revenue | 764 | 429 | 6,764 | 30,937 | ||||||||||||
Other revenue of $5.3 million in the second quarter of 2014 is related to compensation for a default on a charter contract. Other revenues of $ 30.0 million in second quarter 2013 relates to a settlement from a 2010 claim from a Company for non-performance of a long term charter party.
4. OTHER GAINS (LOSSES) NET
| (in thousands of $) | 2014 Jul-Sep | 2013 Jul-Sep | 2014 Jan-Sep | 2013 Jan-Sep | ||||||||||||
| Gain (loss) on Forward freight agreements | (5,801 | ) | 4,668 | (12,036 | ) | 4,948 | ||||||||||
| Gain (loss) on bunkers derivatives | (219 | ) | 330 | (259 | ) | (166 | ) | |||||||||
| Gain (loss) from refundable installments for cancelled newbuildings | 121 | 10,658 | - | |||||||||||||
| Gain from purchase of Shares in Joint Venture | - | - | 6,198 | - | ||||||||||||
| Total other gains (losses) net | (5,899 | ) | 4,998 | 4,561 | 4,782 | |||||||||||
The refundable installments on cancelled newbuildings have been reclassified from a non — financial asset to a financial asset based on the outcome of the arbitration in the second quarter. The asset has been measured at fair value resulting in a recognised net gain of $4.7 million for the period January 2014 to September 2014. Furthermore the company has received final settlement of three contracts resulting in a gain of $5.9 million.
5. INTEREST EXPENSE
| (in thousands of $) | 2014 Jul-Sep | 2013 Jul-Sep | 2014 Jan-Sep | 2013 Jan-Sep | ||||||||||||
| Interest on bank overdrafts and loans | 6,549 | 3,095 | 19,707 | 9,466 | ||||||||||||
| Interest on obligations under finance leases | 1,897 | 2,048 | 5,757 | 6,185 | ||||||||||||
| Total interest expense | 8,446 | 5,143 | 25,464 | 15,651 | ||||||||||||
| Less amounts included in the cost of qualifying assets | (183 | ) | (337 | ) | (1,793 | ) | (1,491 | ) | ||||||||
| Net interest expense | 8,263 | 4,807 | 23,671 | 14,160 | ||||||||||||
6. OTHER FINANCIAL ITEMS
| (in thousands of $) | 2014 | 2013 | 2014 | 2013 | ||||||||||||
| Jul-Sep | Jul-Sep | Jan-Sep | Jan-Sep | |||||||||||||
| Interest swap | 691 | (2,420 | ) | (44,17 | ) | 5,536 | ||||||||||
| Other financial items | 1,104 | 929 | 2,798 | 802 | ||||||||||||
| Total other financial items | 1,795 | (1,491 | ) | (1,619 | ) | 6,338 | ||||||||||
Total interest rate swap gain in the third quarter was $0.7 million compared to a loss of $2.4 million same quarter previous year. Total interest rate swap loss for the period from January to September 2014 was $4.4 million compared to a gain of 5.5 million for the same period previous year. The Company sold 47,685 shares in Korea Line Corporation in the third quarter. A related gain of $1.2 million is reported as other financial items. In total the Company has sold 102,685 Korea Line shares and booked a gain of $2.5 million for the period January 2014 to September 2014
7. VESSELS AND EQUIPMENT
The Group has the following owned vessels at September 30, 2014.
| Vessel | Built | DWT | Flag | |
| Channel Alliance | 1996 | 171,978 | Hong Kong | |
| Channel Navigator | 1997 | 172,058 | Hong Kong | |
| Golden Saguenay | 2008 | 75,500 | Hong Kong | |
| Golden Opportunity | 2008 | 75,500 | Hong Kong | |
| Golden Ice | 2008 | 75,845 | Hong Kong | |
| Golden Feng | 2009 | 170,500 | Marshall Island | |
| Golden Strength | 2009 | 75,745 | Hong Kong | |
| Golden Shui | 2009 | 170,500 | Marshall Island | |
| Golden Magnum | 2009 | 179,788 | Hong Kong | |
| Golden Beijing | 2010 | 176,000 | Hong Kong | |
| Golden Eminence | 2010 | 79,447 | Hong Kong | |
| Golden Empress | 2010 | 79,600 | Hong Kong | |
| Golden Endeavour | 2010 | 79,600 | Hong Kong | |
| Golden Endurer | 2011 | 79,600 | Hong Kong | |
| Golden Enterprise | 2011 | 79,471 | Hong Kong | |
| Golden Zhoushan | 2011 | 175,834 | Hong Kong | |
| Golden Suek | 2011 | 74,500 | Hong Kong | |
| Golden Bull | 2012 | 74,500 | Hong Kong | |
| Golden Daisy | 2012 | 81,507 | Marshall Island | |
| Golden Ginger | 2012 | 81,487 | Marshall Island | |
| Golden Rose | 2012 | 81,585 | Marshall Island | |
| Golden Brilliant | 2013 | 74,500 | Hong Kong | |
| Golden Pearl | 2013 | 74,187 | Hong Kong | |
| Golden Diamond | 2013 | 74,187 | Hong Kong | |
| Golden Ruby | 2013 | 74,500 | Hong Kong |
| (in thousands of $) | Docking and | |||||||||||||||
| periodic | Fixtures and | |||||||||||||||
| Vessels | maintenance | Equipment | Total | |||||||||||||
| Cost: | ||||||||||||||||
| At January 1, 2013 | 768,452 | 7,482 | 486 | 776,420 | ||||||||||||
| Additions | 51,803 | 3,486 | 10 | 55,299 | ||||||||||||
| Transferred from vessels under construction (note 9) | 29,214 | 1,000 | 30,214 | |||||||||||||
| At December 31, 2013 | 849,469 | 11,968 | 496 | 861,932 | ||||||||||||
| At January 1, 2014 | 849,469 | 11,968 | 496 | 861,932 | ||||||||||||
| Additions | 173,713 | 11,367 | 25 | 185,105 | ||||||||||||
| At September 30, 2014 | 1,023,182 | 23,335 | 521 | 1,047,037 | ||||||||||||
| Accumulated depreciation and impairment: | ||||||||||||||||
| At January 1, 2013 | 161,414 | 3,081 | 408 | 164,903 | ||||||||||||
| Depreciation | 27,192 | 2,025 | 25 | 29,241 | ||||||||||||
| At December 31, 2013 | 188,606 | 5,106 | 433 | 194,144 | ||||||||||||
| At January 1, 2014 | 188,606 | 5,106 | 433 | 194,144 | ||||||||||||
| Impairment (note 2) | ||||||||||||||||
| Depreciation | 24,044 | 3,930 | 16 | 27,990 | ||||||||||||
| At September 30, 2014 | 212,650 | 9 036 | 449 | 222,134 | ||||||||||||
| Carrying amount: | ||||||||||||||||
| At September 30, 2014 | 810,532 | 14 299 | 72 | 824,903 | ||||||||||||
| At December 31, 2013 | 660,863 | 6 862 | 63 | 667,788 | ||||||||||||
The Group has pledged most of it's owned vessels to secure various banking facilities (note 16).
8. VESSELS HELD UNDER FINANCE LEASES
The Group has the following vessels on financial lease at September 30, 2014.
| Vessel | Built | DWT | Flag |
| Golden Lyderhorn | 1999 | 74,242 | Hong Kong |
| Ocean Minerva | 2007 | 75,698 | Panama |
| Golden Heiwa | 2007 | 76,662 | Panama |
| Golden Eclipse | 2010 | 79,600 | Hong Kong |
| (in thousands of $) | ||||
| Cost: | ||||
| At January 1, 2013 | 176,159 | |||
| At December 31, 2013 | 176,159 | |||
| At January 1, 2014 | 176,159 | |||
| Additions | 142 | |||
| At September 30, 2014 | 176,301 | |||
| Accumulated depreciation: | ||||
| At January 1, 2013 | 35,942 | |||
| Depreciation | 9,422 | |||
| At December 31, 2013 | 45,364 | |||
| At January 1, 2014 | 45,364 | |||
| Depreciation | 7,047 | |||
| At September 30, 2014 | 52,411 | |||
| Carrying amount: | ||||
| At September 30, 2014 | 123,890 | |||
| At December 31, 2013 | 130,795 | |||
Vessels held under finance lease are depreciated on the same basis as owned vessels.
9. VESSELS UNDER CONSTRUCTION
| (in thousands of $) | ||||
| At January 1, 2013 | 116,082 | |||
| Additions | 22,288 | |||
| Transferred to instalments on cancelled newbuildings | (92,012 | ) | ||
| Transferred to vessels and equipment (note 7) | (30,214 | ) | ||
| At December 31, 2013 | 16,144 | |||
| At January 1, 2014 | 16,144 | |||
| Additions | 14,434 | |||
| At September 30, 2014 | 30,578 | |||
Additions include instalments, interest and supervision on newbuildings.
10. CASH AND CASH EQUIVALENTS AND RESTRICTED DEPOSIT
| (in thousands of $) | 2014 September | 2013 December | ||||||
| Cash at bank and in hand | 71,689 | 81,381 | ||||||
| Short-term deposits | 57,500 | 12,500 | ||||||
| Cash and cash equivalents | 129,189 | 93,881 | ||||||
| Restricted deposit | 3,996 | 4,960 | ||||||
| Cash and cash equivalents and restricted deposit | 133,185 | 98,841 | ||||||
11. TRADE AND OTHER RECEIVABLES

12. INVESTMENT IN ASSOCIATED COMPANIES AND JOINT VENTURES
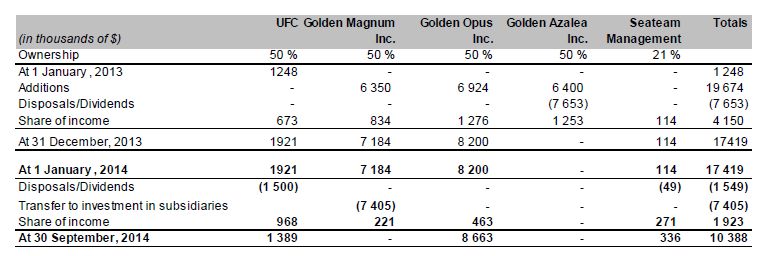
The figures reflect the Group's investment in the above companies.
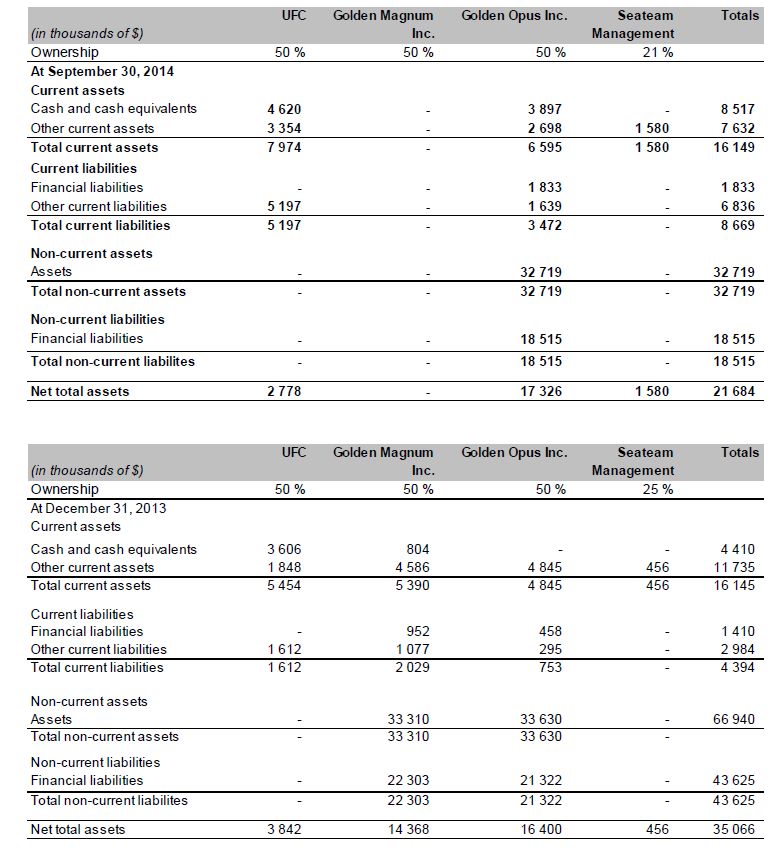
The tables above reflect the total assets and liability for the Group's JV/associated companies.
The Group bought the remaining 50% of Golden Magnum Inc. in the first quarter of 2014 and it is now considered as a fully owned subsidiary where all assets and liability are consolidated into the Group's financial statement.
13. ACQUISITIONS
During March 2014, the Company acquired the 50% outstanding shares in Golden Magnum Inc. for $ 13.6 million from the other joint venture partner. The acquisition resulted in a holding gain on the existing 50% share of 6.2 million, which has been included in other gains in profit and loss in the first quarter of 2014.
The shares were acquired by $13.6 million in cash which is also considered to be the fair value of the consideration.
The fair value of the assets and liabilities in Golden Magnum Inc. were as follows at the acquisition date.
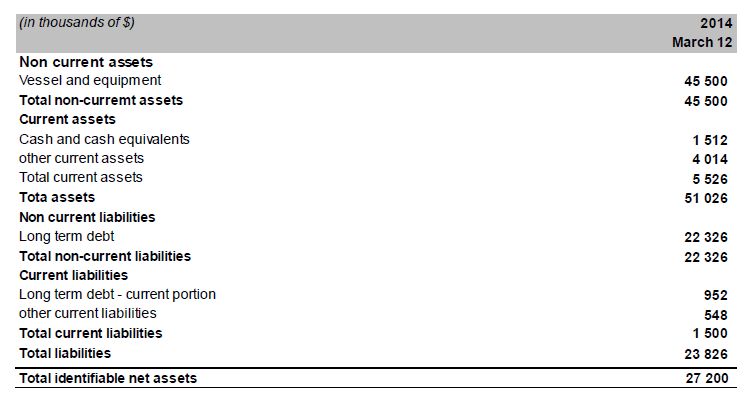
The investment was transferred from investment in joint ventures to investments in subsidiaries as a wholly owned subsidiary and consolidated from the same date.
Since the acquisition date the Group has included $ 4.8 million in revenues and $ 0.4 million in profit and loss for the period ended September 30, 2014. Had the acquisition occurred as of the beginning of the year, the revenue reported for the combined entity would have been $6.1 million and profit and loss $ 0.8 million.
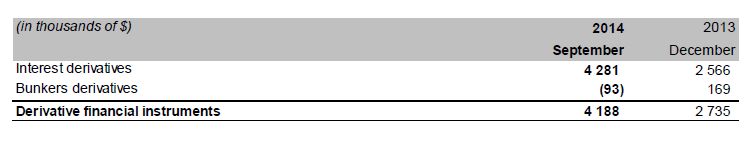
14. DERIVATIVE FINANCIAL INSTRUMENTS
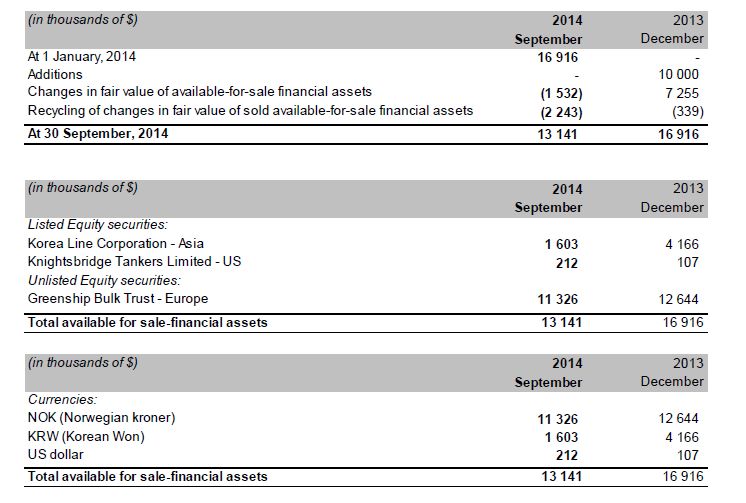
15. AVAILABLE-FOR-SALE FINANCIAL ASSETS
16. LONG - TERM DEBT

All debt is secured by mortgages over sailing vessels and vessels under construction.
All debt related to the cancelled newbuildings has been classified as short term debt as it falls due following the final arbitration award.

All debt is denominated in US Dollars and the bank debt has an interest rate at LIBOR plus a fixed margin of an average of 2.70 percent. The interest rate is mainly repriced on a monthly basis, while some facilities are repriced on a quarterly basis. The Convertible bond debt ($ 200 million) has a fixed coupon of 3.07% p.a. One facility expires in September 2015 and the total loan amount ($34.3 million) is classified as short term debt.
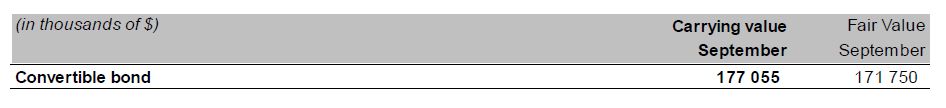
17. CONVERTIBLE BOND
During January 2014 the company issued a $ 200 million 3.07% senior unsecured convertible bonds due 2019, with a conversion price of $ 2.86. The bond was separated into a liability and equity component upon initial recognition of the instrument. $ 171.4 million is estimated to be the fair value of the liability component and is recorded as the initial carrying amount of the liability. The residual value of $ 28.1 million is recognised as an equity component.
18. OBLIGATIONS UNDER FINANCE LEASE

The Group has recorded finance leases on four vessels at September 30, 2014 (and 2013).The Group has purchase options and the exercise price of the option changes based upon the date the option is exercised.
The table below lays out the approximate latest exercisable dates and purchase option amounts based on the date the purchase options are calculated to be exercisable, and the first lease renewal date.
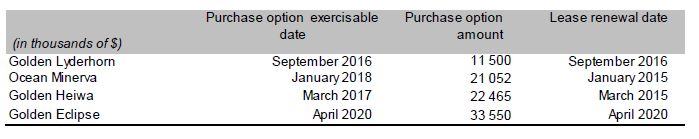
The purchase option exercise prices at the final exercise date for Ocean Minerva and Golden Heiwa are denominated in JPY, and are JPY1.64 billion and JPY1.75 billion respectively.
All lease payments are denominated in US Dollars. The Group's finance lease obligations are secured by the lessor's title to the leased assets.
19. TRADE PAYABLES AND OTHER CURRENT LIABILITIES
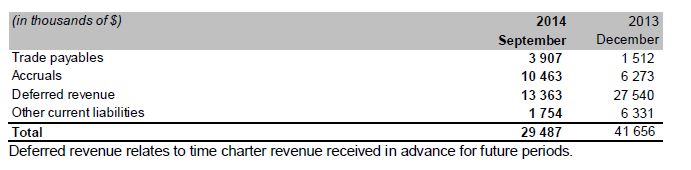
The Company received $14.1 million dollars as income in advance during the fourth quarter of 2013. The amount relates to prepaid hire for one year for three vessels. The remaining amount related to the prepaid hire is $3.5 million at September 30, 2014.
20. CAPITAL COMMITMENTS

The Company has a newbuilding program of eight Supramax vessels. Five of the vessels are expected to be delivered during first half of 2015 while the remaining three are expected to be delivered during first half of 2016.
21. OPERATING LEASES
Rental expense
The future minimum rental payments under the Group's non-cancellable operating leases as of September 30, 2014 are as follows:

Total rental expense for the third quarter of 2014 for operating leases was $4.9 million (Third quarter 2013: $16.1 million). Total rental expense for the period from January to September 2014 was $35.9 million (same period 2013: $42.4 million)
Rental income
The minimum future revenue payments (including owned vessels) to be received under the Group's non-cancellable operating leases as of September 30, 2014 are as follows:

Total rental income from operating leases was $52.7 million in the third quarter of 2014 (Third quarter 2013: $78.3 million). Total rental income for the period from January to September 2014 was $193.7 million (same period 2013: $207.0 million)
22. FINANCIAL RISK MANAGEMENT AND FINANCIAL INSTRUMENTS
Financial Risk
Through its activities the Group is exposed to a variety of financial risks: market risk (including currency risk and interest rate risk), credit risk and liquidity risk. The Group's overall risk management program focuses on the unpredictability of financial markets and seeks to minimize potential adverse effects on the Group's financial performance. The Group makes use of derivative financial instruments such as foreign exchange forward contracts and interest rate swaps to moderate certain risk exposures.
Fair value estimation
The following table presents the Group's assets and liabilities that are measured at fair value at September 30, 2014:


Level 1 is the fair value of financial instruments traded in active markets based on quoted market prices at the balance sheet date. Level 2 is defined as inputs other than quoted prices included within level 1 that are observable for the asset or liability, either directly (that is, as prices) or indirectly (that is, derived from prices). The fair value of financial instruments that are not traded in an active (for example, over the counter derivatives) is determined by using valuation techniques. These valuation techniques maximize the use of observable market data where it is available and rely as little as possible on entity specific estimates. If all significant inputs required to fair value an instrument are observable, the instrument is included in level 2.
Valuation techniques used to derive Level 2 fair values.
Level 2 trading and hedging derivatives comprise forward foreign exchange contracts and interest rate swaps. Fair value of interest rates are set by the bank by using the discounted value of each contract where they use the forward curve for the relevant remaining period as benchmark towards the fixed rates.
The values of the units in available-for-sale financial assets are set to market value at the end of the relevant period when the company is listed on the OTC market in Oslo (less liquid than in level 1 requirement).
All open positions on Fuel Derivatives are benchmarked by the banks (our counterpart) against the relevant forward curve for the relevant products and periods that are open.
Fair value of financial assets and liabilities measured at amortised cost.
The fair value of borrowings, trade and other receivables, other current financial assets, cash and cash equivalents (excluding bank overdrafts), and trade and other payables approximate their carrying amount.
23. SHARE BASED PAYMENTS
Details of the share options outstanding during the quarter are as follows:
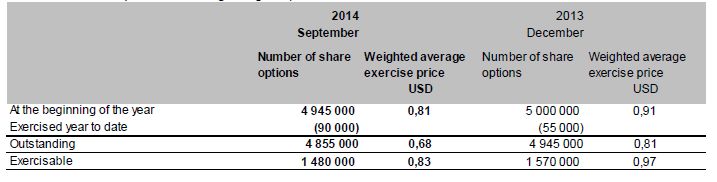
Total outstanding share options relates to the program issued in 2012 (4,355,000 options outstanding) and the program issued in 2009 (500,000 options outstanding) that will expire in October 2017 and November 2014 respectively.
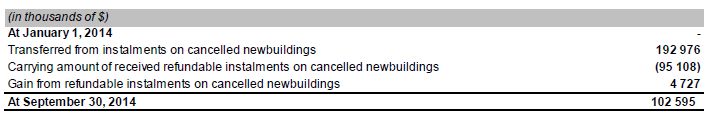
24. REFUNDABLE INSTALMENTS
The Company has cancelled nine newbuilding contracts from Zhoushan Jinhaiwan Shipyard Co. Ltd. Five newbuilding contracts were cancelled in 2013 and four in 2012.
In the second quarter of 2014 the Company received awards for all cancelled newbuildings. The newbuilding contracts were from that point considered to be a receivable. The receivables due not include interest on the two contracts that the Company was not found to be entitled to awarded interest, but installments only.
25. SUBSEQUENT EVENTS
During the fourth quarter the Company has sold the remaining 67,354 shares in Korea Line Corporation at krw 24,949 per share with total proceeds of USD 1.6 million, which will be booked as a profit in the fourth quarter. Including sales proceeds from shares the Company has in total received 6.3 million as a compensation for the default on the charter contracts for Golden Empress and Golden Eminence in 2012.
In October, the Company decided to redeliver the vessel Ocean Minerva to owners during December 2014 and has therefore decided not to declare the optional years and the purchase option. This will result in an accounting loss of $3.5 million on lease termination in the fourth quarter.


Golden Ocean Group Limited – 3Q 2014 Conference Call Transcript
November 21, 2014
Herman Billung, CEO Golden Ocean Management AS:
Thank you very much. Again, welcome to the third quarter of 2014 release and we do it as it we always do that Birgitte takes us through the highlights, financials, operations, and then I do some macro slides in the end, and then we open it up for any Q&A. So, please go ahead, begin.
Birgitte Ringstad Vartdal, CFO Golden Ocean Management AS:
Thank you Herman. Golden Ocean had a negative result with $11.6 million in the third quarter of 2014. This is equivalent to a loss per share of $0.03. The Board of Golden Ocean has decided to declare a dividend of $0.007 for the quarter. As reported in the last release, the Company received refunds for one contract from Jinhaiwan in July. In addition, the Court has dismissed the yard's leave to appeal on two of the remaining contracts. On October 7, Golden Ocean announced an agreement to merge with Knightsbridge Shipping Limited subject to approval in shareholders' meeting.
Go to the numbers, both the revenues and the costs are down in the quarter due to lower activity on the trading portfolio. This is related to operating revenues, vessel voyage expenses, and charter hire expenses. If you look at the net voyage result, this is down by approximately $2 million from the last quarter. In the second quarter, we had some positive -one offs-, $5.3 million in settlements on Golden Feng and $10.4 million related to reevaluation of the Jinhaiwan claim. If you exclude those -one offs-, the operating result is more or less in line in the third quarter with the second quarter result.
The interest income and interest expense is more or less the same, while we have a positive change on the mark to market valuation of the interest rates swaps in the quarter. Under other financial items, we have the value of the sale of Korea line shares. And this ends up with a net loss for the period of $11.6 million.
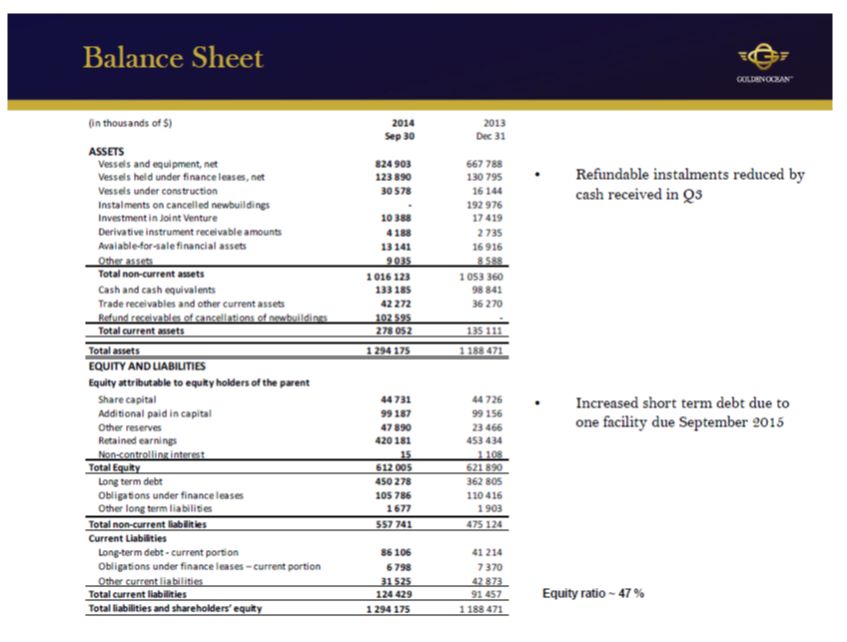
The Company did not take delivery of any new vessels during the third quarter, thus there are no major changes on the balance sheets. The received of refund from Jinhaiwan has reduced the refundable receivables in the quarter. We also paid down debts on loans related to those contracts in the quarter. Short-term debts have increased due to one loan facility that matures in September 2015, and the whole loan of $34 million is classified as short term. In addition to this, there is $9.6 million remaining on the Jinhaiwan loan, which is also classified as short term and ordinary debt repayment for one year.
Total equity is $612 million and the Company has a book equity ratio of 47%.
There have not been many changes to the fleet during the quarter either. The Company has redelivered Golden Kiji in September 2014 and has decided to redeliver Ocean Minerva in December 2014. These vessels were part of what we have called the Dreyfus vessels, which has been long-term time charter in with option years.
The Company has also fixed out four of the ice class vessels with a premium to the spot market or the index of between 20% and 23%. And this demonstrates the additional value that the ice class vessels yield during the winter season.
For the Golden Ocean newbuilding program, there has been one installment paid in the third quarter. The progress is according to schedule. And we expect to have two vessel delivered in January from Universal in Japan and one vessel delivered from Chengxi in China either in January or February, and then two others for the remainder of the first half the of 2015. As you can see, the main payments are on the delivery of the vessels and spread between 2015 and 2016.
Our vessel operating expenses are flat since the last quarter. The panamaxes are on average between $5,300 and $5,400 per day while the capesizes are in the range of $5,600 to $5,700 per day. This has been stable for the last five years, more or less.
The Company expects to have 7 vessels docking during 2014, of which 6 have been drydocked so far. The drydocking expenses is not part of the average operating expenses, but is reported separately.
The Company provided an update on Jinhaiwan in the second quarter release and since then, the yard has had two applications for leave to appeal dismissed. Thus, the Company is now in the process of getting the final order for our repayment and demand repayment from the yard, and subsequently from the refund bank if the yard does not pay. Two other contracts and applications for leave to appeal was accepted, subject to them being heard together with the two contracts where both parties have agreed to leave to appeal. This hearing will take place end of November and we are hoping that we will get an order by the end of the year, but this cannot be guaranteed. The remaining outstanding amount is $102.6 million and the book profit effect in the third quarter is only $100,000, which is additional accrued interest on four of the contracts. If we should be awarded interest on the last two contracts, this will add between $7.5 million and $8.0 million in cash and also positive result effect.
As we said earlier, there has not been many changes to the fleet during the quarter. Therefore, most of the fleet is still trading in the spot market. When it comes to the capesizes, the only coverage is of the ongoing voyages per vessel, while for the panamaxes and the kamsarmaxes, we do have six long-term charter contracts.
The Company is currently in the process of financing the five supermax vessels that will be delivered during the first half of 2015, four sailing vessels that are currently unfinanced and refinancing four loan facilities. In total, this is 19 vessels. The structures seem to be favorable to us, with 20-year profiles for newbuildings and age adjusted for older vessels. This is sort of balanced toward a lower gearing of approximately 55% of the vessel value.
This ties in with the strategy that the Company has had to reduce the gearing and is also similar to the strategy that Knightsbridge Shipping Limited is seeking to obtain.
The Company has sold the remaining shares in the Korea Line Corporation and expects to book a profit of $1.6 million in relation to this sale in the fourth quarter. In total, the CCompany has received settlements of $6.3 million following the redelivery of the Golden Empress and Golden Eminence in early 2012. The total claims the Company had at the time was around $42 million dollars.
The Company is proceeding with a delisting on the Singapore Stock Exchange and expect to conclude that at the closing of the expected merger with Knightsbridge Shipping Limited.
On the proposed merger, Golden Ocean announced it together with Knightsbridge on October 7. If the merger is approved by the shareholders, Knightsbridge will issue 61.5 million shares to the current shareholders in Golden Ocean. Which means that each share of Golden Ocean will have the right to receive 0.13749 shares in Knightsbridge. The transaction is subject to closing conditions, including shareholder approval. Knightsbridge is listed on NASDAQ and the combined company will continue to be listed on NASDAQ. In addition, Knightsbridge is applying for a secondary listing in Oslo. The companies filed a registration statement with the Securities and Exchange Commission on the 17th of November and expect that the statement will become effective sometime around the end of January. It should then allow the companies to call special general meetings and ask for shareholder approval. Should the shareholders approve, then it should be possible to close the transaction shortly thereafter, and we aim at concluding the process within the first quarter of 2015. The combined companies' vision is to create a company with a unique fleet and a strong balance sheet and to build one of the world's leading drybulk shipping companies.
Herman Billung, CEO Golden Ocean Management AS:
Thank you, Birgitte. Then I will just take you through a few macro slides. I just let you know that the sources for this presentation are either Platou economy research or Snowdragon advisory.
So, in 2014, I mean, I guess most of us were too optimistic on the market view. And as a consequence, the forward curve, the long-term forward curve, has dropped considerably. I am trying here to explain a little bit kind of what went wrong in 2014, because it is always nice to be able to explain the deviation from say nine out of ten forecasters analysis.
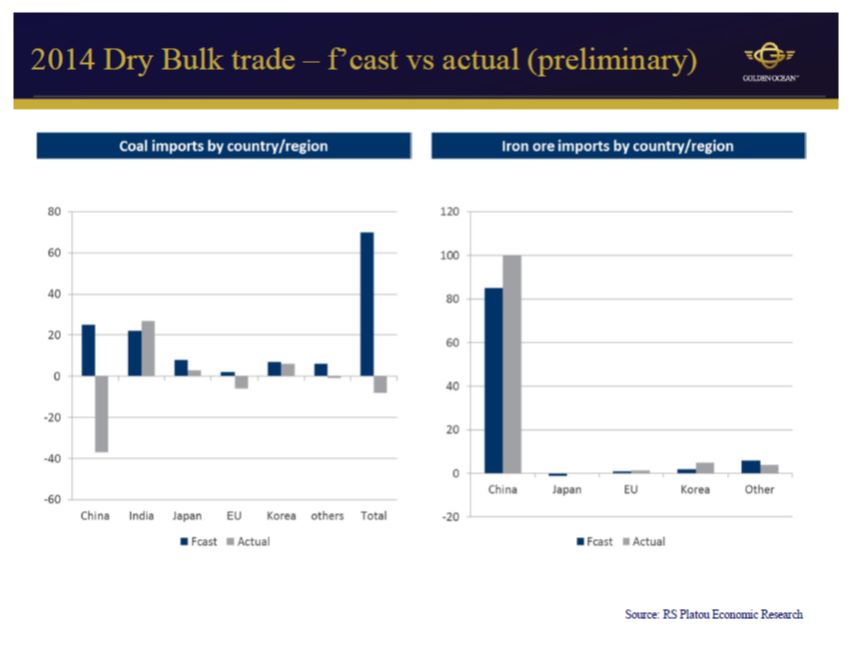
On the first slide here you see that, on the demand side, iron ore definitely lived up to expectations and even more so, by adding another, more than 100 million tons of new iron ore into, that was transported in 2014. On the other hand, it was really the coal that came as a big negative surprise and coal imports to China, that on top of that you also had a shortfall of bauxite and nickel ore due to the ban on exports out of Indonesia. Supply has been according to forecast. We will end up just short of 5% net fleet growth in 2014.
Then if you look into by country, you see on the left that, on coal, you see it's really China that has disappointed immensely. And the main reason for that is China had a very good hydropowered season. Lot of snow in the winter up in the Himalayas and a fairly wet spring and summer adding a lot of hydropower capacity. So I think that is the main eexplanation. Obviously, China will strive to be less dependent on coal, but short term the energy mix will more or less remain the same, which I will show you a little bit later.
The next slide is just showing the actual and impressive growth in imports, the increase in imports of 16% in 2014 of iron ore. I would say I was still somewhat surprised that in spite of falling iron ore prices, the domestic production also increased by 7.5%. Going forward, there are still a lot of new iron ore capacity coming into the market, which most likely will continue to put pressure on the commodity price itself and I think there is a fair chance that some of the domestic iron ore production in China will be even less competitive and the big question mark is whether the Chinese authorities are willing to subsidize the iron ore production in China. We do not see that really coming in big scale. It's not strategic as such for the Chinese authorities, even though there are obviously quite a few workers involved with it, but they also have a environmental issue, which you have to pay attention to when refining iron ore.
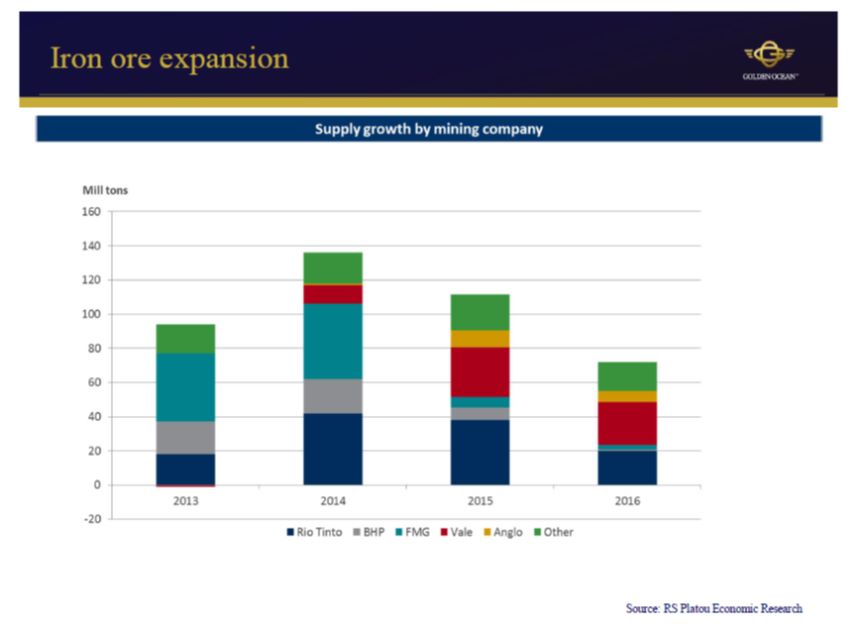
In 2015, the good news is that a lot of the new capacity is coming from Brazil. It is the red part of the column you see. You have to have in mind that for every one ton of iron ore extra coming from Brazil compared to Australia, it's like three tons of Australian iron ore. So, if this lives up to expectations, we should see a decent positive to mild development on the iron ore from a tonnes miles perspective.
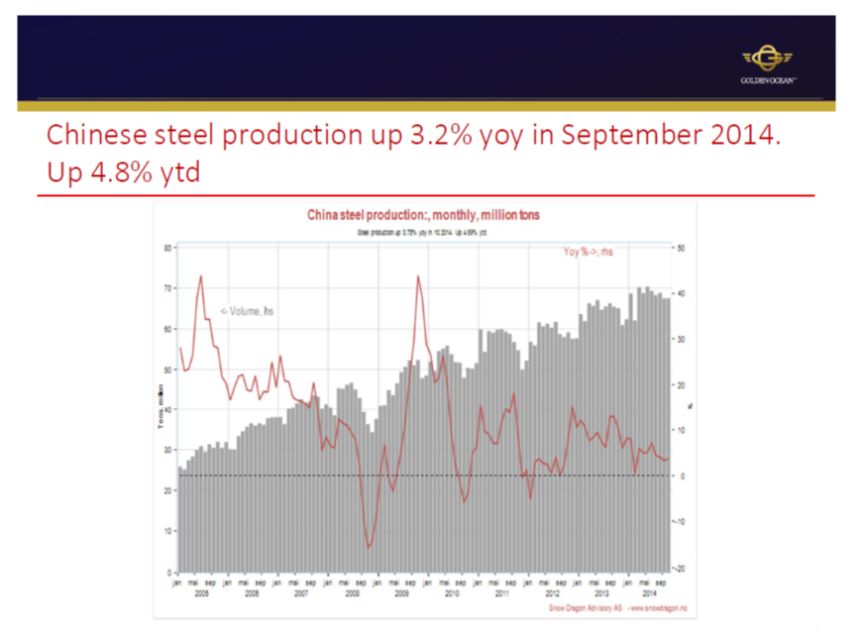
Chinese steel production, steel up 3.2% in September. It is important to note that it looks like most of the production is really going into exports and export growth in China has been strong during 2014.
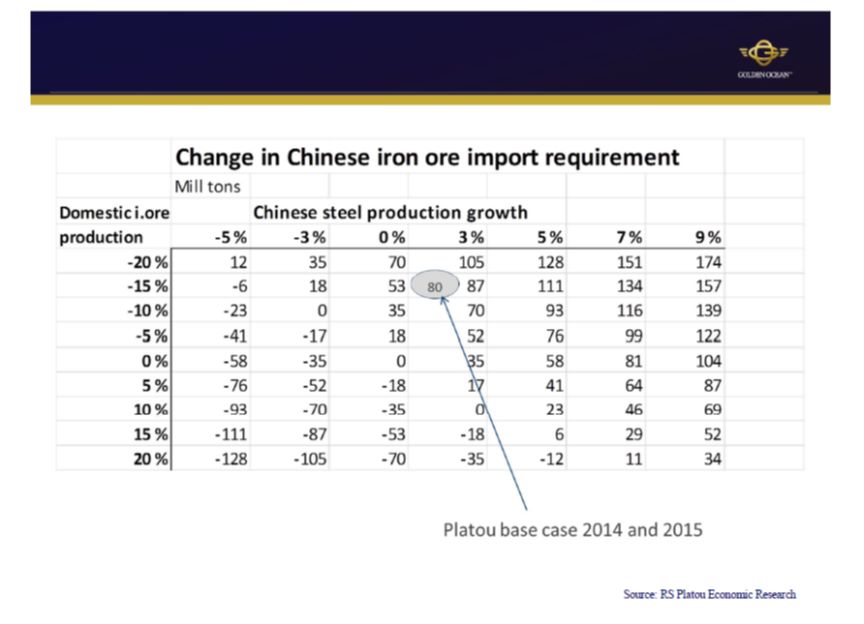
Next slide is showing the base case of Platou and their main assumption for 2015 and increase in iron ore transportation. As you will see, they have very moderate growth in steel production. Their base case is like less than 2%, but at the same time they expect domestic iron ore production to be reduced by 15%, which should cater for another 80 million tons of iron ore, increased iron ore import to China.
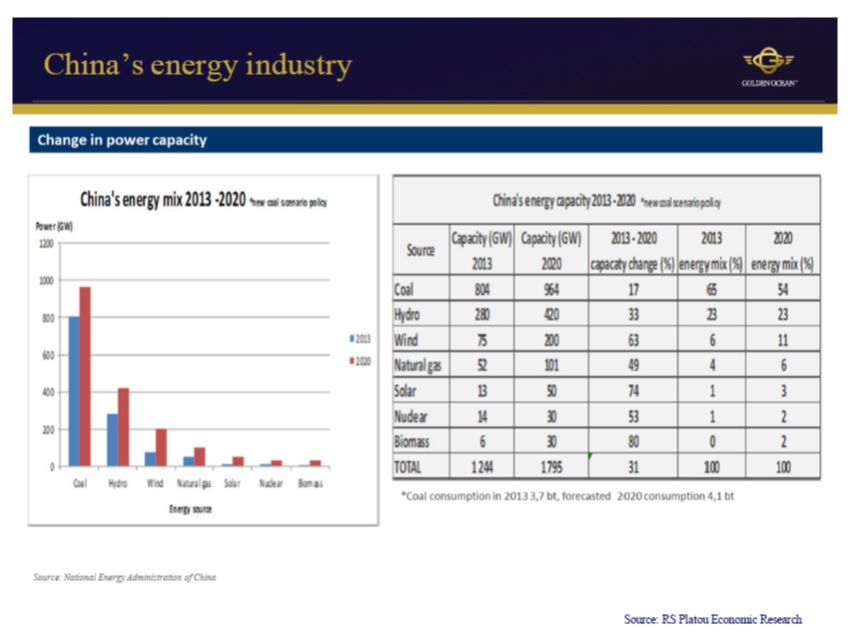
I think it is very difficult to make a fair kind of estimate of what is happening really on the energy side in China. We were taken by surprise in 2014. But if you look long term, and to the right, you will see that even though that China will reduce their energy sourcing from coal from say 65% in 2013 down to 54% in 2020, their actual usage of coal should increase. And then, again, the big question, are they going to source this from domestic sources or are they going to continue to import. And I think that the base case, among most analysts, is that you will have more or less a slight increase in coal imports to China in 2015 and from there not really a big movement either direction.
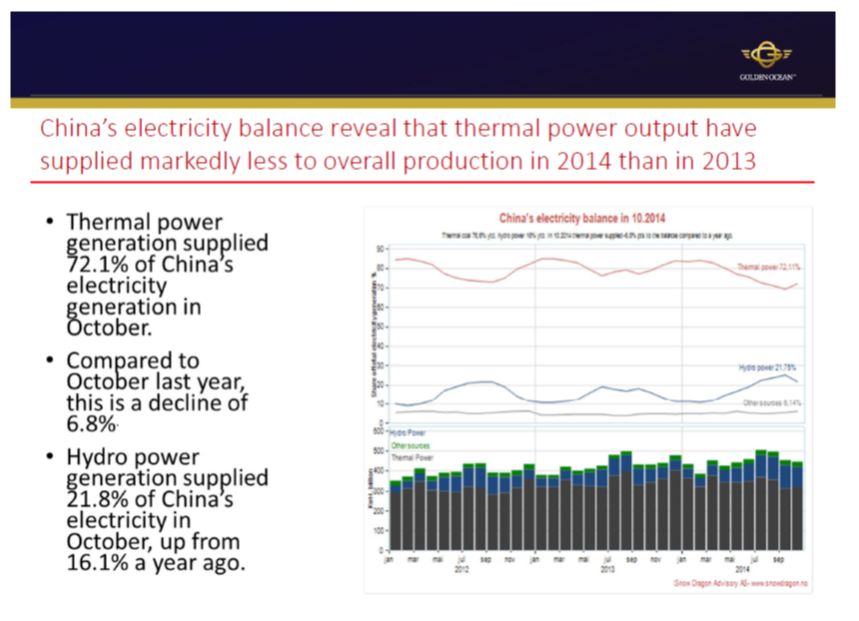
Next slide, it is basically kind of describing what I just mentioned. Hydropower generation should supply 21.8% of China's electricity in October this year. Which is, up from 16.1% a year ago, so that, again, it was again hydropower that was the big difference.
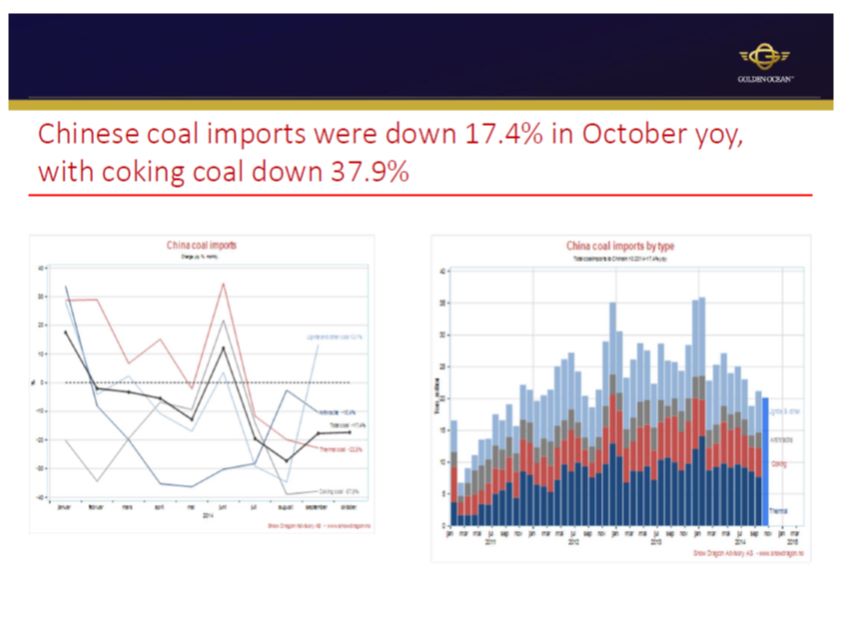
Next slide is just showing the year on year coal imports. And you see on the coking coal, it was even worse, where the reduction was almost 38%.
On the other side, or the other hand, India is looking very promising and I think India will be the country where the coal transportation growth will happen in the years to come. Still a lot of new power plants coming and the infrastructure domestically in India is very complicated so it makes much more sense to transport it by sea, which we see very clear signs of these days, and I think consensus forecasts is that Indian coal imports will grow by something between 50 to 100 million tons over the next four to five years.
I have mentioned the two other kind of negative surprises. One is coming from bauxite, due to the ban on exports out of Indonesia. And, due to that, the Chinese saw this was coming in 2013, and they did a massive restocking, which led to a strong end of 2013 for that trade. But if you look at what has happened and you try to measure it in ton miles and make it into panamax equivalent, it has been a reduction of around 40 panamax bulkers in 2014 compared to '13 on the bauxite trade on its own.
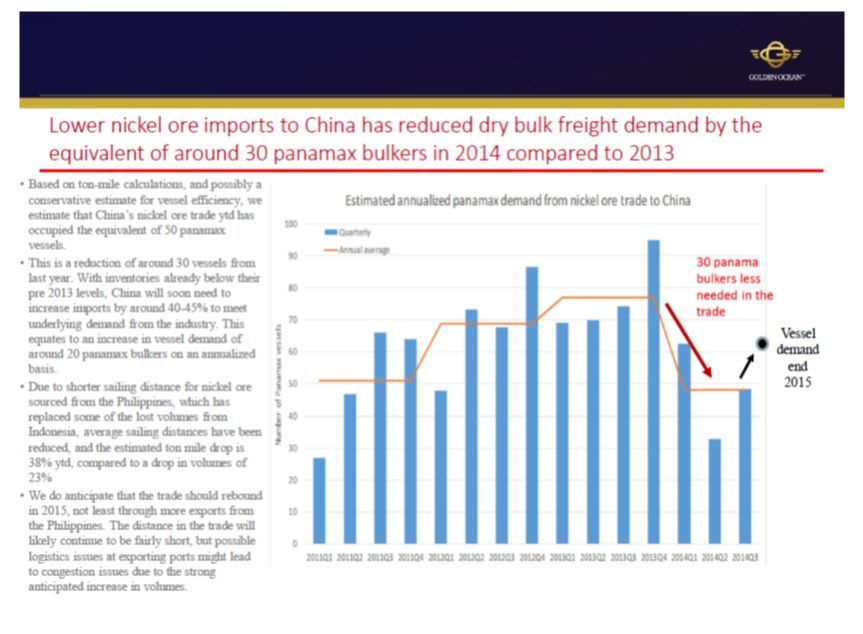
More or less similar happened for nickel ore, where you have a shortfall of around 30 panamaxes. So if you add coal, bauxite, and nickel ore, you are talking about a shortfall of something between 150 to 200 panamaxes in those three commodities on its own.
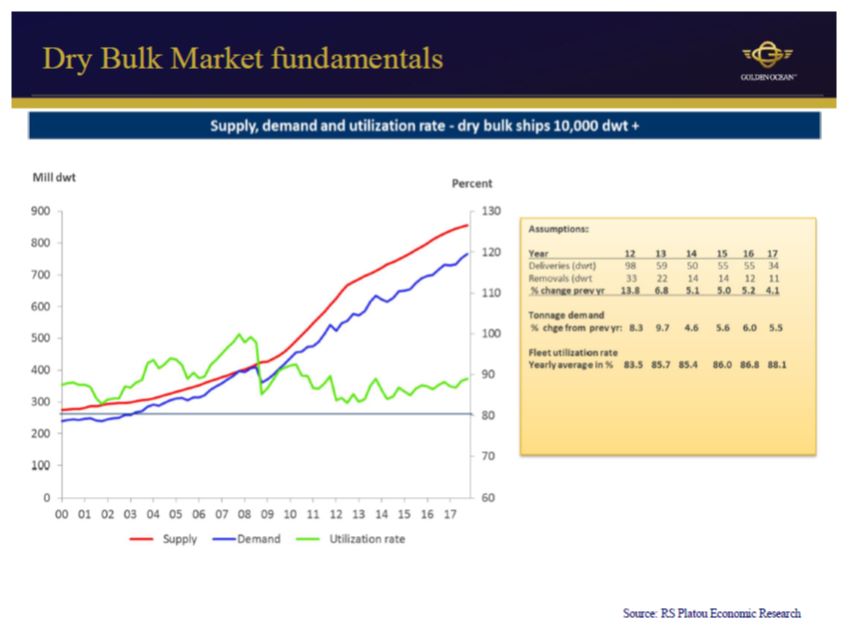
To summarize, and this is what Platou is anticipating for the coming couple of years. They believe that supply growth will be around 5% plus minus and the demand growth will be slightly higher. So, they believe utilization will be slightly higher but not as high as previously forecasted, and they are saying they believe that 2015 will be slightly better than '14, but not massively better. Presently, the foreword curve for '15, '16, '17, its on average just above $14,000 per day and I personally think that it is very little downside in the forward curve and maybe some upside if coal imports to China should be higher in '15 plus at some stage in '15 the Chinese will have to do some restocking both on bauxite and nickel ore.
So that kind of concludes our presentation and then we leave it for you if you have any questions and we will try to answer them. Thank you.
Operator:
Thank you. If you would like to ask a question at this time, please press the * or asterisk, key followed by the digit one on your telephone. Please ensure that the mute function on your telephone is switched off to allow your signal to reach our equipment. If you find that your question has already been answered, you may remove yourself from the cue by pressing * 2. Again, please press * 1 to ask a question. We will pause for just a moment to allow everyone to signal.
Question & Answer
Herman Hildan, RS Platou Markets AS:
Good afternoon Herman and Birgitte. I just have a very brief question. Knightsbridge have guided in the past on the cash break even on in the capes. In light of the restructuring that your are going to do now, how do you now see the cash break even for the combined company?
Birgitte Ringstad Vartdal, CFO Golden Ocean Management AS:
Well, I think Knightsbridge have guided for themselves so we do not have to comment on that. After doing the refinancing of our own financing of supras and refinancing on most of our own panamaxes and kamsarmaxes, the cash break even will be in the area just below $10,000 on the supras and just above $10,000 on the panamaxes. Slightly higher on the vessels we are not refinancing at the moment. On our capesizes, historically its been around $16,000, it is going we have a few vessels that are a bit higher and a few that are bit lower, so it is around $15,000 also for ours going forward.
Herman Hildan, RS Platou Markets AS:
Ok. Thank you very much.
Operator:
We will now take our next questions from Hans Klaas, who is a private investor.
Hans Klass, Private Investor:
Thank you for taking my call. My question is this: with China not going as fast as expected and plenty of capesizes in the water, will you cancel some of the newbuildings if the merger is approved.
Herman Billung, CEO Golden Ocean Management AS:
If we are going to cancel?
Hans Klass, Private Investor:
Well, as I said, because China is not going as fast and there are already so many capesizes in the water, I am wondering why Golden Ocean would need additional capesizes for the fleet.
Herman Billung, CEO Golden Ocean Management AS:
First of all, I am fairly optimistic on capesizes in general due to the iron ore trade, which is still growing. I mean we are not considering at all to cancel any of our newbuildings but we live up to our contractual commitments and we have, and you know, Golden Ocean, we do not have any capesizes on order so that questions is rather for Knightsbridge, but I do not see that coming either.
Hans Klass, Private Investor:
Thank you.
Operator:
As a reminder, if you would like to ask a question, please press * 1. We will now take our next question from Jackie Medina from Cellco Asset Management.
Jackie Medina, Cellco Asset Management:
Hi, good afternoon. I have two quick questions. The $14,000 forward rate you mentioned, for what size is that please. That's one. And two, the coal imports of China depends on the coal price as well, and to the extent it goes any further, given the relatively flat production curve, the prices, I'm sorry, the imports quantity would be affected. How do you think about that and do you have any comments on that. Thank you.
Herman Billung, CEO Golden Ocean Management AS:
On the first question, that is for a capesize, that is for 170,000 tonner, standard Baltic capesize. To the next questions, I mean, right now, as you know, China is the biggest producer of coal. I mean they are producing three and a half billion tons. And there is a lot of sensitivity there and obviously it is pride sensitive, but we have been thinking that it was going to be say more closed down more coal mines due to safety from environmental issues but it looks like the Chinese really have protected their mining industry by, you saw they implemented some taxes, which the good thing about what happened this week was obviously the trade agreement between Australia and China. But I think the biggest uncertainty related to coal imports is rather how the winter, what happening in the winter this year, but still, it is pride sensitive, but I would imagine that also a lot of domestic coal producers are losing money these days.
Jackie Medina, Cellco Asset Management:
Ok. Thank you.
Operator:
We have no further questions at this time. So I would like to turn the call back to today's speakers for any additional or closing remarks.
Herman Billung, CEO Golden Ocean Management AS:
I think just to let you know, that we are very enthusiastic about the merger. As Birgitte said, our ambition is to be the leading drybulk company in our segment, and it obviously has been taking a lot of focus for us the last couple of months, but I think we are well prepared, have a good team, have a lot of good people in place, we are looking forward to create something that we hope our shareholders will appreciate. So, I think that ends our presentation and thank you for listening in and also for those who asked questions. Thank you so much.