 Exhibit 99.1 |
 Kevin Hunt, Chief Executive Officer and President Scott Monette, Chief Financial Officer Matt Pudlowski, Director Business Development Ralcorp Holdings, Inc. |
 2 Forward Looking Statements Please note that this presentation contains forward-looking statements as defined in the Private Securities Litigation Reform Act of 1995. The words “anticipate,” “plan,” “estimate,” “expect,” “intend,” “will,” “should” and similar expressions, as they relate to us, are intended to identify forward-looking statements. These statements reflect management’s current beliefs, assumptions and expectations and are subject to a number of factors and risks that may cause actual results to differ materially. These factors and risks include but are not limited to: (i) changes in actual or expected results of operations (ii) our ability to effectively manage future sales growth along with the growth from acquisitions or continue to make acquisitions at the rate at which we have been acquiring in the past; (iii) significant increases in the costs of certain commodities, packaging or energy used to manufacture our products; (iv) our ability to continue to compete in our business segments and our ability to retain our market position; (v) our ability to maintain a meaningful price gap between our products and those of our competitors, successfully introduce new products or successfully manage costs across all parts of the Company; (vi) significant competition within the private brand business; (vii) our ability to successfully implement business strategies and ongoing or future cost savings initiatives to reduce costs; (viii) the loss of a significant customer; (ix) allegations that our products cause injury or illness, product recalls and product liability claims and other litigation; (x) our ability to anticipate changes in consumer preferences and trends; (xi) our ability to service our outstanding debt or obtain additional financing; (xii) disruptions in the U.S. and global capital and credit markets; (xiii) fluctuations in foreign currency exchange rates; (xiv) the termination or expiration of current co-manufacturing agreements; (xv) consolidations among the retail grocery and foodservice industries; (xvi) change in estimates in critical accounting judgments and changes to or new laws and regulations affecting our business; (xvii) termination of existing anti-dumping measures imposed against certain foreign imports of dry pasta; (xviii) losses or increased funding and expenses related to our qualified pension plan; (xix) labor strikes or work stoppages by our employees; (xx) bankruptcy of a significant customer; (xxi) impairment in the carrying value of goodwill or other intangibles; and (xxii) changes in weather conditions, natural disasters and other events beyond our control; and other risks and uncertainties described from time to time in our periodic reports filed with the Securities and Exchange Commission. Ralcorp does not assume any obligation to update any forward-looking statements or the information contained herein as a result of new information or future events or developments, except as required by law. This presentation includes certain non-GAAP financial measures. The required reconciliations from these non-GAAP financial measures to their comparable GAAP financial measures are included in the appendix to this presentation. |
 3 Additional Information Market and Industry This presentation includes industry and trade association data, forecasts and information that we have prepared based, in part, upon data, forecasts and information obtained from independent trade associations, industry publications and surveys and other independent sources available to us. Some data also are based on our good faith estimates, which are derived from management’s knowledge of the industry and from independent sources. These third-party publications and surveys generally state that the information included therein is believed to have been obtained from sources believed to be reliable. We have not independently verified any of the data from third-party sources nor have we ascertained the underlying economic assumptions on which such data are based. Similarly, we believe our internal research is reliable, even though such research has not been verified by any independent sources. Other Data Financial data regarding the Sara Lee private-brand dough business have been prepared based upon information provided by Sara Lee Company. We have not independently verified any of the data nor have we ascertained the underlying economic assumptions on which such data are based. |
 4 Agenda Agenda Fiscal 2012 Highlights Fiscal 2013 Headwinds and Tailwinds About Ralcorp Private-Brand Market Growth-through-Acquisition Strategy – Amortization & ROIC Financial Position Conclusion |
 Fiscal 2012 Highlights Fiscal 2012 Highlights Bloomfield Stabilization Plan Volume/Price/Commodities Equation Recent Acquisitions – Refrigerated Dough – Petri – Gelit 5 Highlights |
 Fiscal 2013 Headwinds / Tailwinds Volume and Pricing Loss of Bloomfield Customer Higher tax Rate (35.25%) Lower Commodity Costs (1.5%-2.0% of 2012 COGS) Bloomfield Inefficiencies Oklahoma Plant Closure ($10-$12 million) Refrigerated Dough Synergies ($6-$8 million) Petri / Gelit Acquisition Accretion ($0.10 / share) 6 Headwinds Tailwinds |
 7 About Ralcorp Ralcorp is the leader in private-brand food production and a major producer of foodservice products in North America. Spun-off from Ralston-Purina (NYSE: “RAH”) Sales: $987 million Categories: Cereals, crackers, baby food Operated: United States Employees: 2,500 (2) Plants: 6 (2) 1994 Completed the spin-off of Post on February 3, 2012 Sales: $4.2 billion (1) Categories: 22 major product categories Operate: United States, Canada, Italy Employees: 10,000 Plants: 41 The New Ralcorp Note: (1) Management estimates based on FY 2011; excludes Post; Includes Refrigerated Dough. (2) Based on Company’s FY 1994 filings and internal data: excludes resort operations, seasonal resort employees and branded baby food. |
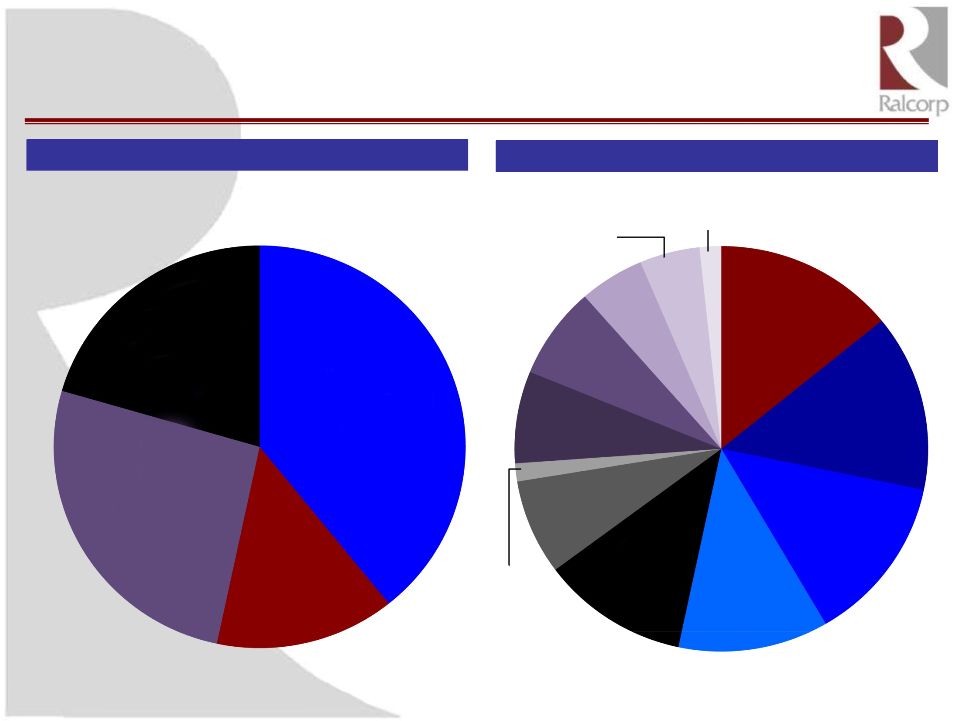 Cereal Products 21% Ralcorp Segment and Product Overview Source: Company filings Note: Reflects trailing 12 months as of September 30, 2011. Pro forma for acquisition of Sara Lee Dough. Numbers do not add to 100% due to rounding off. Note: Snacks, Sauces & Spreads comprises Crackers & Cookies, Snack Nuts, Candy & Chips and Sauces & Spreads. Pasta consists entirely of American Italian Pasta Company. Frozen Pro Forma Net Sales by Segment Pro Forma Net Sales by Product 8 Pasta 14% Snacks, Sauces & Spreads 39% Frozen Bakery Products 26% Pasta 14% Crackers & Cookies 12% Nutritional Bars, Other 8% Snack Nuts, Candy & Chips 14% Sauces & Spreads 13% Ready-to-Eat Cereal 11% Refrigerated Dough 7% Griddle 7% Hot Cereal 1% Cookies 5% Breads 5% Frozen, Other 2% Bakery comprises Griddle, Breads, Cookies, Frozen Dough, Other and Refrigerated Dough. Cereal Products comprises Ready-to-Eat Cereal, Hot Cereal and Nutritional Bars, Other. |
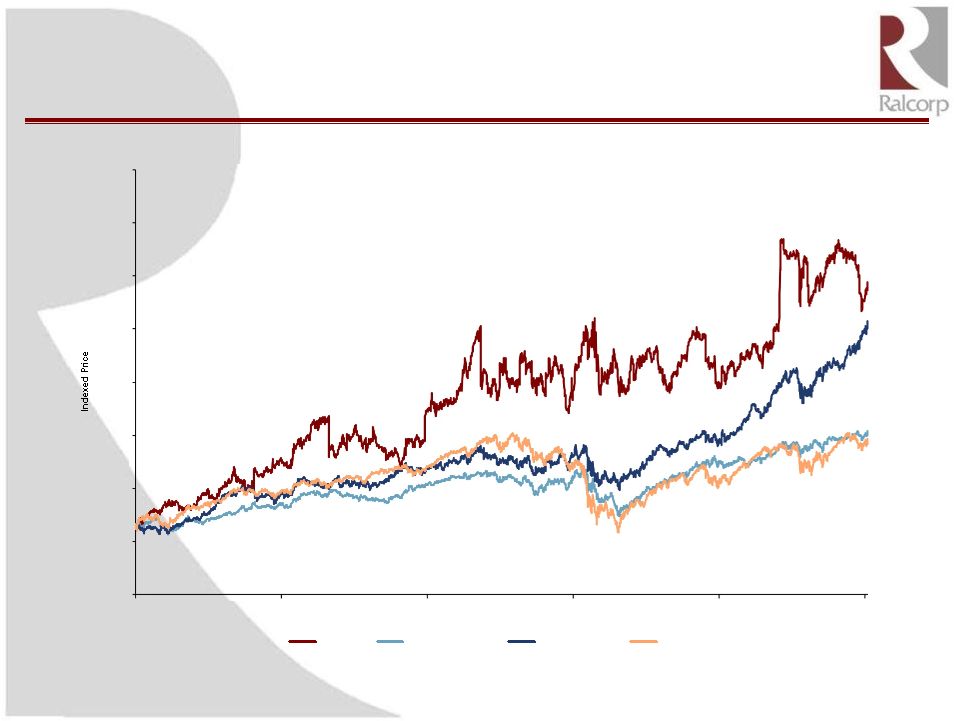 Consistent and Proven Record of Delivering Strong Returns to Shareholders 9 Source: Bloomberg (includes dividends) ¹ Large Cap Food: Campbell, ConAgra, General Mills, Heinz, Hershey, Kellogg and Kraft Foods. ² Mid Cap Food: B&G Foods, Flowers Foods, Hain, Lancaster, McCormick, Synders-Lance and TreeHouse. Last 10 Years (80)% (20)% 40% 100% 160% 220% 280% 340% 400% Oct-02 Sep-04 Aug-06 Jul -08 Jul -10 Jun -12 Daily from 01-Oct-2002 to 02-Jul-2012 Ralcorp Large Cap Food¹ Mid Cap Food² S&P 500 Index 273.1 % 228.6 % 105.1 % 95.9 % |
 10 Private-Brand Market Private-Brand Market |
 Highly Fragmented Market With Substantial Growth Opportunities EBITD A Margin Source: Company filings, presentations and other materials; Packaged Facts – The Future of Food Retailing in the U.S., 3rd Edition U.S. Private Label Market Growth 11 2011 U.S. Private Label Market Share 78% 6% 16% Consolidated Competitors ($ in billions) All Others $87 $92 $97 $103 $108 $113 2009A 2010A 2011E 2012E 2013E 2014E total U.S. private label sales (food and beverage). Note: Consolidated Competitors include Dean Foods, Cott, TreeHouse and Smithfield. Market share calculations based on LTM Sep 2011 sales as a percentage of estimated 2011 |
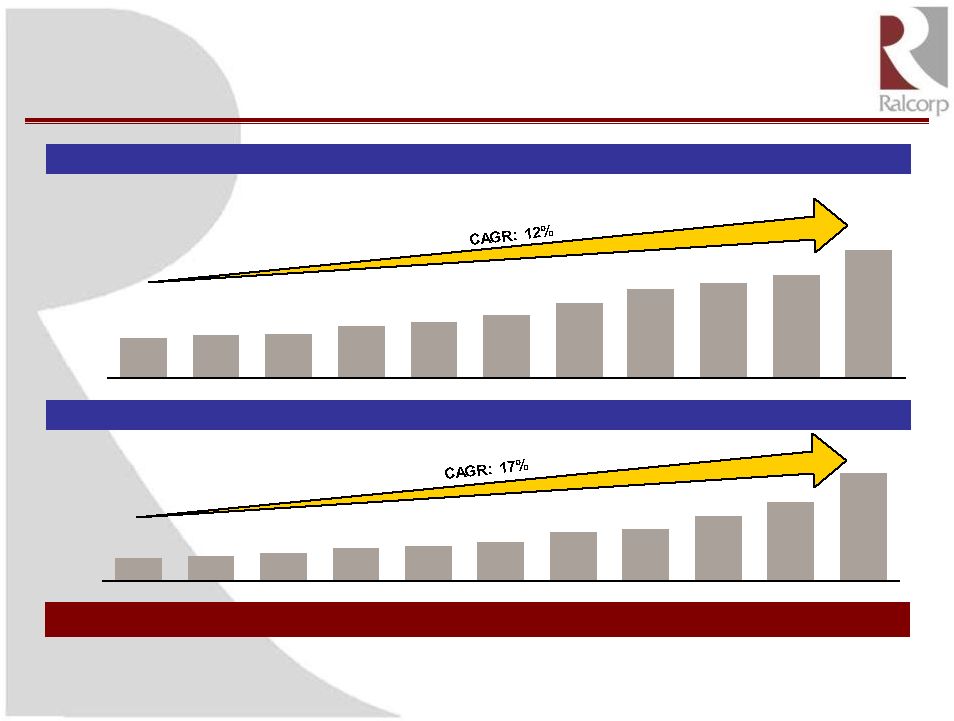
 Private Brand Foods Have Had Impressive Long-Term Growth Rates Source: Hoch Banerji (1993), A.C. Nielsen, BEA, Conference Board, Canback Dangel analysis. 14% 15% 16% 17% 18% 19% 1972 1974 1976 1978 1980 1982 1984 1986 1988 1990 1992 1994 1996 1998 2000 2002 2004 2006 2008 2010 Generics Era - National-Brand Equivalent Era Private Brand Era 12 |
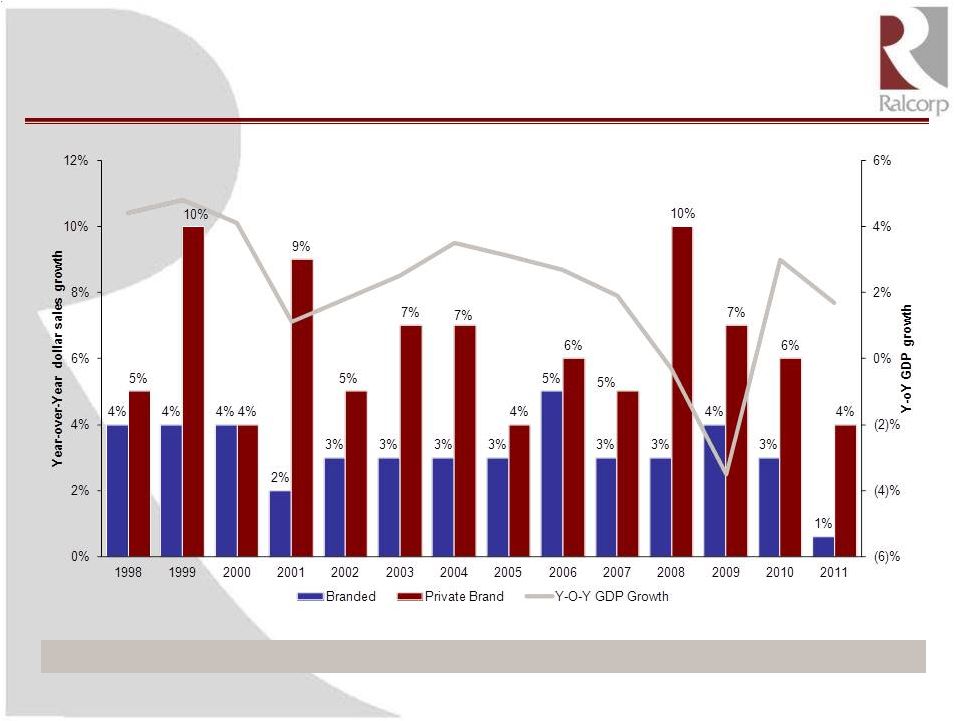 Private-Brand Food Has Grown Throughout the Economic Cycle 13 Source: A.C. Nielsen. Private-Brand Growth Is Not Dependent on a Weak Economy |
 14 Retailer Concentration a Major Driver in Private-Brand Growth Source: Symphony IRI Special Report – Private Label in Europe; Wall Street Estimates United States ~23% Share United Kingdom Canada ~36% Share Private Brand Growth Highly Correlated to Retailer Concentration ~57% Share |
 15 Private-Brand Food Economics Are Powerful for Private-Brand Food Economics Are Powerful for Retailers and Consumers Retailers and Consumers Source: Wall Street research. National Brand Private Brand $10.00 Price to Consumer $7.00 Price to Consumer $7.50 Retailer's Cost $4.00 Retailer's Cost $2.50 Retailer's Gross Profit $3.00 Retailer's Gross Profit Consumer saves 30% Retailer’s gross profit increases 20% Significant Margin Opportunity for Retailers and Price Benefit for Consumers |
 Ralcorp Leads Private Brands in Attractive Categories Ralcorp Leads Private Brands in Attractive Categories 16 Source: IRI FDMx 52-weeks ending October 2, 2011 #1 #2 #1 #1 #1 #1 #1 #1 Ralcorp Position: 60% 30% 65% 45% 70% 90% 50% 70% Cereal Cookies Crackers Snack Nuts Pasta Refrigerated Dough Peanut Butter Jams |
 Ralcorp Categories Have Favorable Growth Dynamics Ralcorp Categories Have Favorable Growth Dynamics 17 Source: Symphony IRI FDMW 52-weeks ending December 25, 2011 Note: Reflects 2007-2011 category growth; Category breakdown percentages may not add to 100% due to rounding. Ralcorp share of private-brand sales represents management estimates. Five Year Category Growth 2.2% 6.6% 9.6% 6.4% 8.7% 3.2% 4.0% 6.3% 0.2% 0.5% 2.4% 4.6% 5.9% 4.1% 1.4% Cereal Cookies Crackers Snack Nuts Pasta Refrig. Dough Peanut Butter Jams Private Brand Branded (0.1%) 33% 11% 16% 9% 33% 24% 21% 19% % Private Brand: $1,445 $8,328 $5,583 $5,415 $2,728 $1,974 $1,787 $1,240 Category Size: |
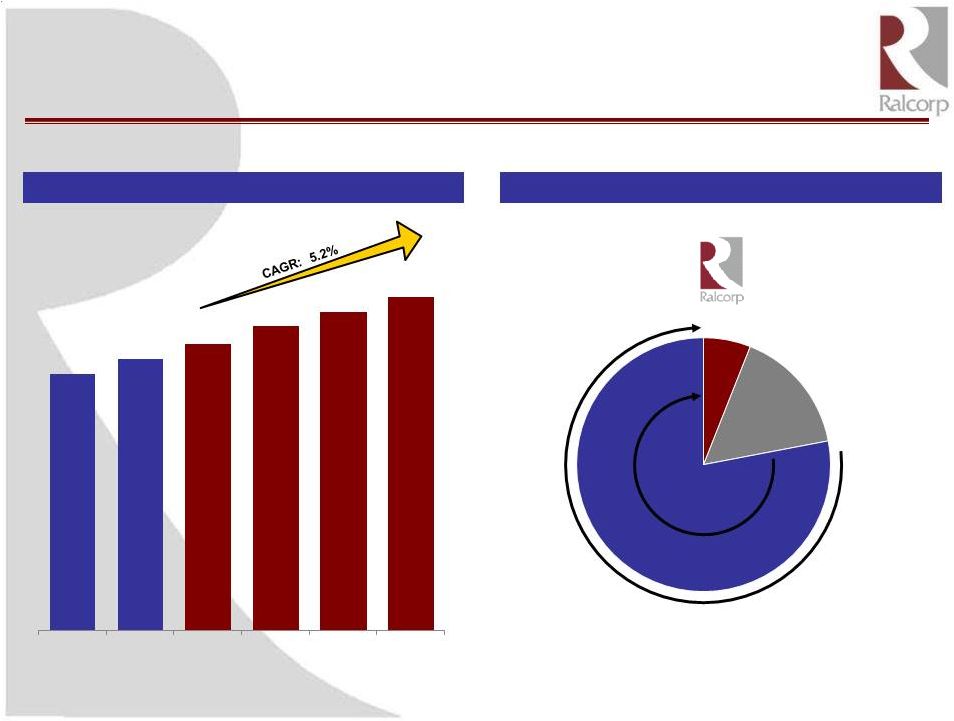
 18 Consistent Private Brand Operating Performance Consistent Private Brand Operating Performance 10% 10% 11% 11% 11% 10% 11% 10% 12% 13% 14% Margin Net Sales Adjusted EBITDA (1) $1,178 $1,280 $1,304 $1,558 $1,675 $1,850 $2,233 $2,644 $2,821 $3,061 $3,787 2001 2002 2003 2004 2005 2006 2007 2008 2009 2010 2011 $114 $127 $140 $165 $179 $193 $244 $256 $324 $396 $536 2001 2002 2003 2004 2005 2006 2007 2008 2009 2010 2011 Average Organic Growth = 3.6% ($ in millions) Source: Company filings for 2002-2011. Note: Excludes non-cash unusual and non-recurring items. Net Sales and Adjusted EBITDA pro forma for separation of Post. (1) Adjusted EBITDA is defined as earnings before interest, income taxes, depreciation, and amortization, excluding Post separation costs, merger and integration costs, provision for legal settlement, adjustments for economic hedges, accelerated depreciation, gains / losses on forward sale contracts, gain on sale of securities, acquired inventory valuation adjustments, goodwill and trademark impairment losses, merger termination fees, and equity method earnings in Vail Resorts, Inc. A reconciliation from Adjusted EBITDA to the comparable GAAP financial measure is included in the appendix. A reconciliation from Adjusted EBITDA to the comparable GAAP financial measure is included in the appendix. Adjusted EBITDA metrics not pro forma for acquisitions. FY 2008-FY 2011. |
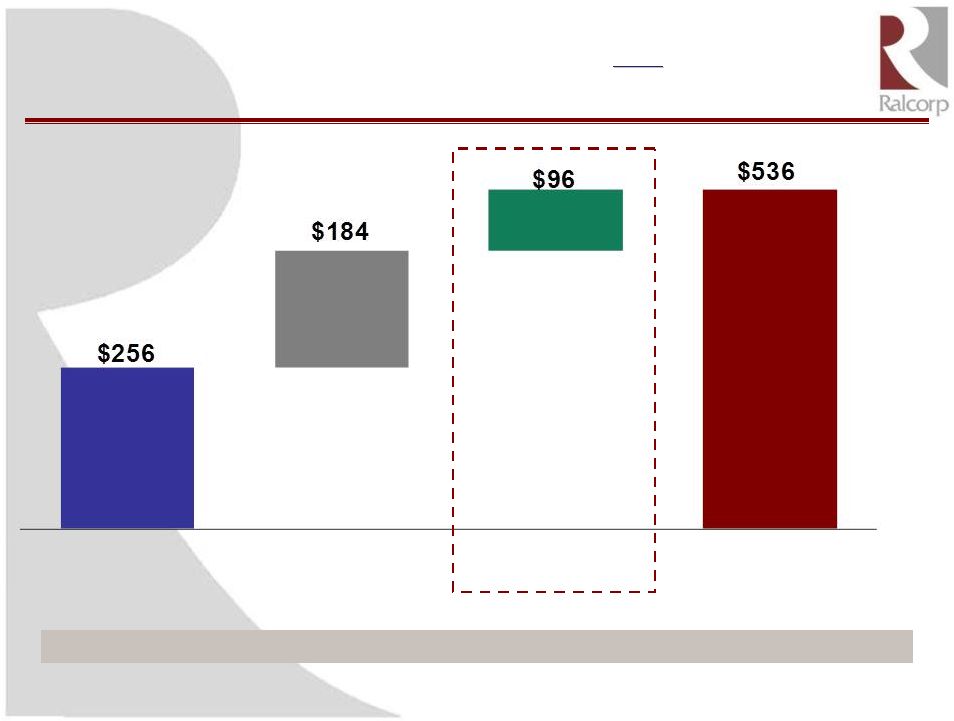 EBITDA Trajectory Driven by Acquisitions and EBITDA Trajectory Driven by Acquisitions and Strong Strong Organic Growth Organic Growth Source: Company filings, management Note: Pro Forma for separation of Post (not pro forma for acquisition of Refrigerated Dough). 19 Ralcorp Has Delivered 11% Organic Growth Annually Since 2008 ($ in millions) 2008 Acquisitions 2011 Organic |
 20 Private-Brand Food Key Takeaways Private-Brand Food Key Takeaways Private brands deliver greater profitability to retailers than branded products Driven by improved product and packaging, private-brand food growth has accelerated over the last two decades and the trend is expected to continue U.S. private-brand market has $100 billion in annual sales and remains highly fragmented Ralcorp is uniquely positioned to capitalize on the private-brand opportunity with leading positions in key product categories |
 21 Growth-through-Acquisition Strategy Growth-through-Acquisition Strategy |
 22 We Have Completed 30 Private-Brand Acquisitions Since We Have Completed 30 Private-Brand Acquisitions Since 1997, Totaling Over $3.3 Billion in Combined Annual Sales 1997, Totaling Over $3.3 Billion in Combined Annual Sales Ralcorp Management has a Successful Track Record of Identifying and Integrating Acquisitions ($ in millions) Petri May-12 $50 Sales Gelit S.r.l. June-12 $40 Sales Flavorhouse Apr-98 $62 Sales Sugarkake Aug-98 $30 Sales Nutcracker Sep-98 $42 Sales Martin Gillet Mar-99 $70 Sales Cascade Cookies Jan-00 $19 Sales Southern Roasted Mar-99 $28 Sales Linette May-00 $28 Sales Ripon Foods Oct-99 $64 Sales Red Wing Jul-00 $348 Sales Wortz Apr-97 $69 Sales Lofthouse Jan-02 $70 Sales Bakery Chef Dec-03 $171 Sales Concept 2 Bakers Feb-04 $34 Sales Medallion Foods Jun-05 $43 Sales Western Waffles Nov-2005 $75 Sales Parco Foods Feb-06 $50 Sales Cottage Bakery Nov-06 $125 Sales Bloomfield Bakers Mar-07 $188 Sales Torbitt & Castleman Jan-01 $80 Sales Beta Brands Jan-07 $10 Sales Pastificio Annoni Dec-11 $13 Sales J.T.Bakeries May-10 $39 Sales N.A.B. / PL Floods May-10 $57 Sales Sepp’s Jun-10 $29 Sales Harvest Manor Mar-09 $180 Sales AIPC Jul-10 $569 Sales Pastries Plus Aug-07 $10 Sales Refrigerated Dough Oct-11 $306 Sales |
 23 Auction (40 % of Deals) Reputation Sourcing Acquisitions: Ralcorp’s Unique Model Sourcing Acquisitions: Ralcorp’s Unique Model Relationships (60 % of Deals) |
 24 Ralcorp’s Acquisition Pipeline is Robust with Nearly 50 Ralcorp’s Acquisition Pipeline is Robust with Nearly 50 Potential Private-Brand M&A Targets Potential Private-Brand M&A Targets >$500 Revenue Scale: >$100 <$500 <$100 ($ in millions) Category growth potential Attractive margins or margin expansion opportunities Strong cash flow characteristics Earnings accretion Attractive returns Acquisition Criteria High Low Synergies |
 (1) Based on FY 2011 Frozen Bakery products segment profit plus depreciation and amortization. (2) Based on 10.0x LTM EBITDA multiple. Total Price Paid $ 725 million Implied EBITDA Multiple (1) 5.7x Implied Value at Current Multiple (2) $ 1,272 million Implied Value Creation (%) 25 Case Study: Building Platform – Case Study: Building Platform – Frozen Bakery Division Frozen Bakery Division ($ in millions) Target Revenue Cascade Cookie Company $19 Lofthouse Foods 70 Bakery Chef 171 C2B 34 Western Waffles 75 Parco 50 Cottage Bakery 125 Pastries Plus 10 Sepp’s 29 Total $592 75% |
 Acquisitions Key Driver of Value, But Contribute Acquisitions Key Driver of Value, But Contribute Amortization Reducing EPS Benefit Amortization Reducing EPS Benefit 26 D&A Highest Among Peer Group as % of Sales 4.5% 4.0% 3.7% 3.4% 3.3% 2.9% 2.6% 2.2% 1.8% Peer Median: 3.1% |
 Ralcorp Trading Level Relative to Peers Ralcorp Trading Level Relative to Peers 27 17.3 x 13.7 x 18.5 x (1.0)x (2.6)x Ralcorp IBES Consensus Adjustment for Post Stake (1) Adjustment for D&A in- line with Peers (2) Ralcorp Adjusted for Post Stake & D&A Mid Cap Median (3) Note: Ralcorp IBES Consensus reflects share price of $68.03 and FY 2013E EPS of $3.94; Reflect figures related to FY 2013E (1) Calculated by reducing share price by proportional share of 19.7% stake in Post valued at $218mm. (2) Calculated assuming D&A as percentage of sales reduced from 4.5% to 3.1% (median of Midcap peers) applied to median FY 2013E consensus estimated sales of $4,479mm, assuming 33.5% tax rate and 56.3mm diluted shares outstanding. (3) Midcap peers include B&G Foods, Flowers Foods, Hain Celestial, Lancaster, McCormick, Smucker’s, Synders-Lance and TreeHouse. |
 ROIC Also Negatively Impacted By Private Brand ROIC Also Negatively Impacted By Private Brand Acquisition Related Intangibles Acquisition Related Intangibles $3,522 $992 $2,530 $264 $49 $313 28 Note: ROIC = Tax Effected Operating Income / (Total debt+Book Equity–Cash); Reflects tax rate of 33.5% Reflects EBIT of $397mm, pro-forma for Post spin off and acquisition of Sara Lee Dough. Reflects pro-rata $21mm adjustment to EBIT from Sara Lee Dough. Reflects debt of $1,981, book equity of $1,672 less cash balance of $131mm as on 31-Mar-2012. Reflects $74mm of amortization expense for the LTM period ending 31-Mar-2012. 7.5 % 4.9 % 12.4 % ROIC LTM (1) 31-Mar-2012 Impact of Acquisition Intangible Adjusted ROIC (Excluding Acquisition Related Intangible) (1) (2) (3) After-Tax Operating Profit (3) Capital Employed (2) |
 Higher D&A Driven By Amortization of Acquired Higher D&A Driven By Amortization of Acquired Intangibles Intangibles 29 Refrigerated Dough (Oct 2011) AIPC (July 2010) Post Foods RMT (Aug 2008) Cash $ 0.9 Receivables 14.7 Inventories 23.1 Other current assets 0.1 Property 62.6 Goodwill 216.6 Other intangible assets 259.6 Total assets acquired $ 577.6 Accounts payable (14.1) Other current liabilities (8.8) Other liabilities (3.2) Total liabilities assumed (26.1) Net assets acquired $ 551.5 Cash $ 39.4 Receivables 42.9 Inventories 48.1 Other current assets 21.0 Property 252.2 Goodwill 534.1 Other intangible assets 568.2 Other assets 1.1 Total assets acquired $ 1,507.0 Accounts payable (24.1) Other current liabilities (29.9) Deferred income taxes (238.3) Other liabilities (4.9) Total liabilities assumed (297.2) Net assets acquired $ 1,209.8 Cash $ 73.3 Receivables 2.6 Inventories 103.9 Other current assets - Property 470.5 Goodwill 1,794.1 Other intangible assets 946.8 Other assets - Total assets acquired $ 3,391.2 Accounts payable - Other current liabilities (17.0) Long-term debt (964.5) Deferred income taxes (448.0) Other liabilities (74.0) Total liabilities assumed (1,503.5) Net assets acquired $ 1,887.7 Definite Lived Assets Amount Amortizable $259.6 $384.4 $245.1 % of Total Assets Acquired 45% 26% 7% Annual Amortization Impact per Share (1) ($0.20) ($0.28) ($0.14) Transaction Value ~$545mm ~$1.2bn ~$2.6bn (1) Adjusted share price for 19.7% stake in Post. |
 30 Significant Financial Flexibility to Continue Growth Strategy Significant Financial Flexibility to Continue Growth Strategy Net Sales: $4.2 billion Source: Company filings; Note: Reflects LTM December 2011 financials. Excludes Post and pro forma for Refrigerated Dough acquisition (1) Refer to appendix for reconciliation. Net Debt: $1.8 billion 20% Ownership Stake in Post Holdings, Inc.: $200+ million EBITDA (1) : $600 million Leverage Profile: 3.0 x |
 31 Conclusion Conclusion Ralcorp is the undisputed leader in the growing private-brand market Committed to Delivering Superior Shareholder Value Through Execution of Our Growth Strategy Strong track record of growth organically and through acquisitions Unique capabilities to deliver on-trend products to retailers and consumers Unparalleled capability in sourcing and completing acquisitions Strong balance sheet and financial flexibility following Post spin-off |
 32 Appendix Appendix |
 33 Ralcorp – Ralcorp – Adjusted EBITDA Reconciliation Adjusted EBITDA Reconciliation Source: Company filings and management estimates. ($ in millions) FY 2001 FY 2002 FY 2003 FY 2004 FY 2005 FY 2006 FY 2007 FY 2008 FY 2009 FY 2010 FY 2011 LTM 12/31/11 Net Earnings $ 39.9 $ 53.8 $ 7.4 $ 65.1 $ 71.4 $ 68.3 $ 31.9 $ 167.8 $ 290.4 $ 208.8 $ (187.2) $ (193.2) Interest expense, net $ 15.9 $ 5.9 $ 3.3 $ 13.1 $ 16.5 $ 27.3 $ 42.3 $ 54.6 $ 99.0 $ 107.8 $ 134.0 $ 132.7 Income taxes 22.1 30.7 16.9 37.2 36.6 29.9 7.5 86.7 156.9 105.3 83.0 78.9 Depreciation and amortization 41.6 35.8 38.7 47.5 55.8 66.8 82.4 99.5 144.7 166.8 226.5 234.0 Adjustments for economic hedges - - - - - - - - - - 28.9 39.5 Post separation costs - - - - - - - - - - 2.8 5.5 Merger and integration costs - - - - - - - 7.9 31.6 33.1 2.5 7.9 Impairment of intangible assets - - 59.0 - - - - - - 39.9 503.5 503.5 Provision for legal settlement - - - - - - - - - 7.5 2.5 - Restructuring/plant closures (excluding depreciation) 2.6 - 14.3 2.4 2.7 0.1 0.9 1.7 0.5 2.5 3.7 3.7 Acquired inventory valuation adjustment - - - - - - - 23.4 0.4 - - - (Gain) loss on forward sale contracts - - - - - 10.6 87.7 (111.8) (17.6) - - - Gain on sale of securities - - - - - (2.6) - (7.1) (70.6) - - - Merger termination fee, net of related expenses (4.2) - - - - - - - - - - - Equity earnings in Vail Resorts, Inc. (3.9) 0.8 0.4 (0.4) (4.5) (7.0) (8.9) (14.0) (9.8) - - - Adjusted EBITDA $ 114.0 $ 127.0 $ 140.0 $ 164.9 $ 178.5 $ 193.4 $ 243.8 $ 308.7 $ 625.5 $ 671.7 $ 800.2 $ 812.5 Pro Forma Acquisition Adjusted Food EBITDA 2.1 1.4 - 8.8 8.9 2.9 12.5 223.7 6.8 143.9 - 37.0 Pro Forma Adjusted EBITDA $ 116.1 $ 128.4 $ 140.0 $ 173.7 $ 187.4 $ 196.3 $ 256.3 $ 532.4 $ 632.3 $ 815.6 $ 800.2 $ 849.5 Post Segment Profit $ - $ - $ - $ - $ - $ - $ - $ 43.3 $ 250.6 $ 220.6 $ 206.0 $ 191.2 Post Depreciation and Amortization - - - - - - - 9.8 50.6 55.4 58.7 59.0 Post Adjusted EBITDA $ - $ - $ - $ - $ - $ - $ - $ 53.1 $ 301.2 $ 276.0 $ 264.7 $ 250.2 Private Brand Adjusted Food EBITDA $ 114.0 $ 127.0 $ 140.0 $ 164.9 $ 178.5 $ 193.4 $ 243.8 $ 255.6 $ 324.3 $ 395.7 $ 535.5 $ 562.3 Private Brand Pro Forma Adjusted EBITDA $ 116.1 $ 128.4 $ 140.0 $ 173.7 $ 187.4 $ 196.3 $ 256.3 $ 479.3 $ 331.1 $ 539.6 $ 535.5 $ 599.3 |