MANAGEMENT’S DISCUSSION AND ANALYSIS
This management’s discussion and analysis (“MD&A”) of ARC Resources Ltd. (“ARC” or the “Company”) is Management’s analysis of the financial performance and significant trends or external factors that may affect future performance. It is dated February 10, 2016 and should be read in conjunction with the audited consolidated financial statements as at and for the year ended December 31, 2015 (the "financial statements"), and the MD&A and unaudited condensed interim consolidated financial statements for the periods ended March 31, 2015, June 30, 2015 and September 30, 2015 as well as ARC’s Annual Information Form that is filed on SEDAR at www.sedar.com. All financial information is reported in Canadian dollars and all per share information is based on diluted weighted average shares, unless otherwise noted.
This MD&A contains additional generally accepted accounting principles ("GAAP") measures, non-GAAP measures and forward-looking statements. Readers are cautioned that the MD&A should be read in conjunction with ARC’s disclosure under the headings “Non-GAAP Measures,” “Additional GAAP Measures,” “Forward-looking Information and Statements” and "Glossary" included at the end of this MD&A.
ABOUT ARC RESOURCES LTD.
ARC is a dividend-paying Canadian oil and gas company headquartered in Calgary, Alberta. ARC’s activities relate to the exploration, development and production of conventional oil and natural gas in Canada with an emphasis on the development of properties with a large volume of hydrocarbons in place commonly referred to as “resource plays.”
ARC’s vision is to be a leading energy producer, focused on delivering results through its strategy of risk-managed value creation. ARC is committed to providing superior long-term financial returns for its shareholders, creating a culture where respect for the individual is paramount and action and passion are rewarded. ARC runs its business in a manner that protects the safety of employees, communities and the environment. ARC’s vision is realized through the four pillars of its strategy:
| |
| 1. | High quality, long-life assets – ARC’s unique suite of assets includes both Montney and other assets. ARC’s Montney assets consist of world-class resource play properties, concentrated in the Montney geological formation in northeast British Columbia and northern Alberta. The Montney assets provide substantial growth opportunities, which ARC will pursue to create value through long-term profitable development. Other assets are located in Alberta and Saskatchewan and include core assets in the Cardium formation in the Pembina area of Alberta. These assets deliver stable production and contribute cash flow to fund future development and support ARC's dividend. |
| |
| 2. | Operational excellence – ARC is focused on capital discipline and cost management to extract the maximum return on its investments while operating in a safe and environmentally responsible manner. Production from individual crude oil and natural gas wells naturally declines over time. In any one year, ARC approves a budget to drill new wells with the intent to first replace production declines and second to potentially increase production volumes and profitability. At times, ARC may also acquire strategic producing or undeveloped properties to enhance current production and reserves or to provide potential future drilling locations. Alternatively, it may strategically dispose of non-core assets that no longer meet its investment criteria. |
| |
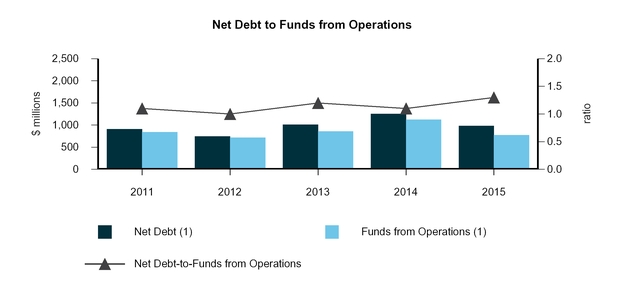
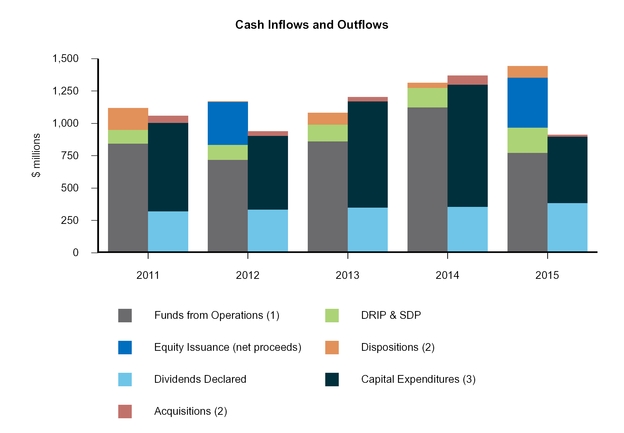
| 3. | Financial flexibility – ARC provides returns to shareholders through a combination of a monthly dividend, currently $0.05 per share outstanding per month, and the potential for capital appreciation. ARC’s long-term goal is to fund dividend payments and capital expenditures necessary for the replacement of production declines using funds from operations (1). ARC will finance value-creating activities through a combination of sources including funds from operations, proceeds from ARC’s Dividend Reinvestment Program (“DRIP”), reduced funding required under the Stock Dividend Program ("SDP"), proceeds from property dispositions, debt capacity, and when appropriate, equity issuance. ARC chooses to maintain prudent debt levels, targeting a maximum net debt to annualized funds from operations of less than two times during specific periods with a long-term target for net debt to be one to 1.5 times annualized funds from operations and less than 20 per cent of total capitalization over the long-term (1). |
| |
| 4. | Top talent and strong leadership culture – ARC is committed to the attraction, retention and development of the best and brightest people in the industry. ARC’s employees conduct business every day in a culture of trust, respect, integrity and accountability. Building leadership talent at all levels of the organization is a key focus. ARC is also committed to corporate leadership through community investment, environmental reporting practices and open communication with all stakeholders. As of February 10, 2016, ARC had 502 employees with 269 professional, technical and support staff in the Calgary office, and 233 individuals located across ARC’s operating areas in western Canada. |
| |
| (1) | Funds from operations, net debt, and total capitalization are additional GAAP measures which may not be comparable to similar additional GAAP measures used by other entities. Refer to the section entitled “Additional GAAP Measures” contained within this MD&A and to Note 15 "Capital Management" in the financial statements. Also refer to the "Funds from Operations" section within this MD&A for a reconciliation of ARC’s net income to funds from operations and cash flow from operating activities. |
Total Return to Shareholders
ARC's business plan has resulted in significant operational success and helped mitigate the headwinds of a challenging commodity price environment, resulting in a trailing five year annualized total return that exceeds the Standard & Poor's ("S&P")/Toronto Stock Exchange ("TSX") Exploration & Producers Index (Table 1).
Table 1 |
| | | | | | |
Total Returns (1) | Trailing One Year |
| Trailing Three Year |
| Trailing Five Year |
|
| Dividends per share outstanding ($) | 1.20 |
| 3.60 |
| 6.00 |
|
| Capital appreciation (depreciation) per share outstanding ($) | (8.46 | ) | (7.74 | ) | (8.71 | ) |
| Total return per share outstanding (%) | (29.6 | ) | (21.1 | ) | (16.3 | ) |
| Annualized total return per share outstanding (%) | (29.6 | ) | (7.6 | ) | (3.5 | ) |
| S&P/TSX Exploration & Producers Index annualized total return (%) | (32.1 | ) | (15.6 | ) | (15.2 | ) |
| |
| (1) | Non-GAAP measure which may not be comparable to similar non-GAAP measures used by other entities. Refer to the section entitled "Non-GAAP Measures" contained within this MD&A. Calculated as at December 31, 2015. |
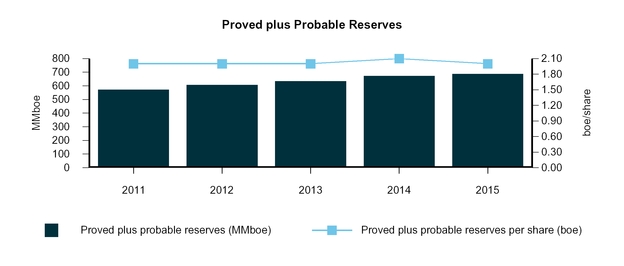
Since 2011, ARC’s production has grown by 30,751 boe per day, or 37 per cent, while its proved plus probable reserves have grown by 114.5 MMboe, or 20 per cent. Table 2 highlights ARC’s production and reserves for the last five years:
Table 2 |
| | | | | | | | | | |
| | 2015 |
| 2014 |
| 2013 |
| 2012 |
| 2011 |
|
Production (boe/d) (1) | 114,167 |
| 112,387 |
| 96,087 |
| 93,546 |
| 83,416 |
|
Daily production per thousand shares (2) | 0.34 |
| 0.35 |
| 0.31 |
| 0.31 |
| 0.29 |
|
Proved plus probable reserves (MMboe) (3)(4) | 686.9 |
| 672.7 |
| 633.9 |
| 607.0 |
| 572.4 |
|
| Proved plus probable reserves per share (boe) | 2.0 |
| 2.1 |
| 2.0 |
| 2.0 |
| 2.0 |
|
| |
| (1) | Reported production amount is based on company interest before royalty burdens. |
| |
| (2) | Daily production per thousand shares represents annual average daily production divided by the diluted weighted average common shares for the respective years ending December 31. |
| |
| (3) | As determined by ARC’s independent reserve evaluator solely at December 31. |
| |
| (4) | Company gross reserves are the gross interest reserves before deduction of royalties and without including any royalty interests. For more information, see ARC’s Annual Information Form as filed on SEDAR at www.sedar.com and the news release entitled “ARC Resources Ltd. Announces the 8th Consecutive Year of ~200% Reserves Replacement, 2015 Finding and Development Costs for 2P Reserves of $6.97 and a Significant Increase in Montney Resource Estimates in 2015” dated February 10, 2016. |
Exhibit 1
Exhibit 1a
ECONOMIC ENVIRONMENT
ARC’s 2015 financial and operating results were impacted by commodity prices and foreign exchange rates which are outlined in Table 3 below:
Table 3 |
| | | | | | | | | | | | |
Selected Benchmark Prices and Exchange Rates (1) | Three Months Ended | Twelve Months Ended |
| | December 31 | December 31 |
| | 2015 |
| 2014 |
| % Change |
| 2015 |
| 2014 |
| % Change |
|
| Brent (US$/bbl) | 44.69 |
| 77.07 |
| (42 | ) | 53.60 |
| 99.45 |
| (46 | ) |
| WTI oil (US$/bbl) | 42.16 |
| 73.20 |
| (42 | ) | 48.76 |
| 92.91 |
| (48 | ) |
| Edmonton Par (Cdn$/bbl) | 52.93 |
| 75.65 |
| (30 | ) | 57.20 |
| 94.46 |
| (39 | ) |
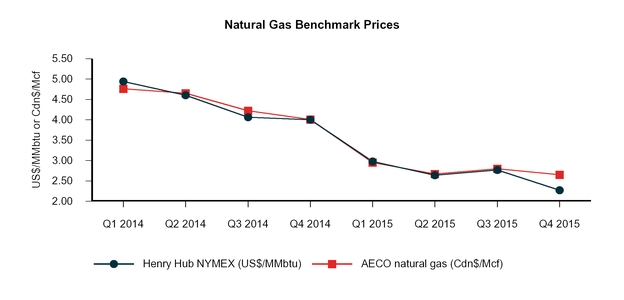
| Henry Hub NYMEX (US$/MMbtu) | 2.27 |
| 4.00 |
| (43 | ) | 2.66 |
| 4.41 |
| (40 | ) |
| AECO natural gas (Cdn$/Mcf) | 2.65 |
| 4.01 |
| (34 | ) | 2.77 |
| 4.42 |
| (37 | ) |
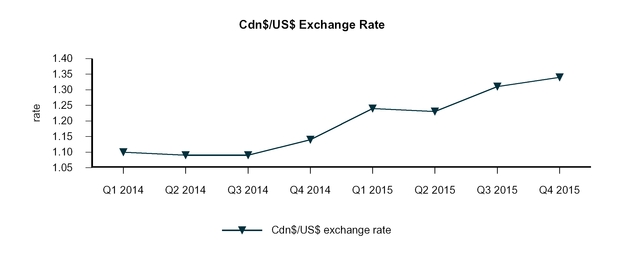
| Cdn$/US$ exchange rate | 1.34 |
| 1.14 |
| 18 |
| 1.28 |
| 1.10 |
| 16 |
|
| |
| (1) | The benchmark prices do not reflect ARC's realized sales prices. For average realized sales prices, refer to Table 13 in this MD&A. Prices and exchange rates presented above represent averages for the respective periods. |
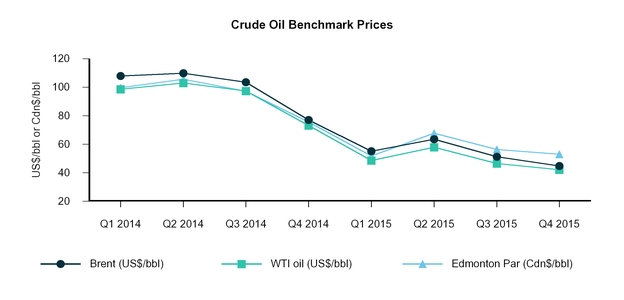
Global crude oil prices continued their decline throughout the fourth quarter of 2015, as persistent oversupply in the market was compounded by OPEC's decision to not reduce production quotas, as well as the anticipation of new Iranian production hitting the market and fears of economic slowdown in China and other emerging economies. The WTI benchmark price averaged 42 per cent lower than the fourth quarter of 2014 and nine per cent lower than the third quarter of 2015. ARC’s crude oil price is primarily referenced to the Edmonton Par benchmark price, which fared moderately better than WTI owing to the decline in the Canadian dollar during 2015. The Edmonton Par price decreased 30 per cent compared to the fourth quarter of 2014 and six per cent from the third quarter of 2015. The differential between WTI and Edmonton Par in the fourth quarter of 2015 narrowed to an average discount of US$2.52, 62 per cent less than the fourth quarter of 2014 and 28 per cent less than the third quarter of 2015. The narrowing of the differential was largely driven by increased local demand for Canadian crude with the initiation of the reversal of Enbridge's Line 9.
Subsequent to December 31, 2015, global crude oil prices have continued to deteriorate, with the WTI crude oil price dropping by approximately 25 per cent from the average realized price in the fourth quarter of 2015. Oversupply continues to be a concern as inventories remain high, delaying the effect of any supply/demand rebalancing.
Exhibit 2
North American natural gas prices, referenced by the average Henry Hub NYMEX price, experienced a pullback of 18 per cent in the fourth quarter of 2015 compared to the third quarter, and were markedly lower in the fourth quarter of 2015 relative to the same period in 2014, decreasing 43 per cent. ARC’s realized natural gas price is primarily referenced to the AECO hub, which was 34 per cent lower in the fourth quarter of 2015 compared to the fourth quarter of 2014 and five per cent lower compared to the third quarter of 2015. The lower prices were impacted by continued oversupply throughout the quarter, resulting in record storage levels at the close of injection season and warmer continental weather reducing normal seasonal demand. The oversupply was slightly alleviated by strong demand for Mexican exports and increased natural gas-fired power generation. Looking ahead to 2016, natural gas pricing is expected to experience continued weakness as a result of a relatively mild winter in the eastern half of North America to-date, and continued strong supply.
Exhibit 2a
The Canadian dollar continued to weaken relative to the US dollar during the fourth quarter of 2015, averaging US$0.75 (Cdn$/US$1.34), as crude oil prices moved lower and the US Federal Reserve raised its interest rates for the first time in almost 10 years, signaling the continued economic recovery in the United States. The devaluation of the Canadian dollar relative to the US dollar serves to partially offset the impact of lower US dollar-denominated crude oil and natural gas prices for Canadian producers.
Exhibit 2b
ANNUAL GUIDANCE AND FINANCIAL HIGHLIGHTS
Table 4 is a summary of ARC’s 2016 and 2015 guidance and a review of 2015 actual results. During this period of prolonged low commodity prices, ARC's strategy and principles remain unchanged; the Company is focused on balance sheet strength, value creation from the development of its high-quality asset base and long-term sustainability of its business. In response to the continued deterioration of commodity prices in late 2015 and early 2016, ARC is reducing its 2016 capital program to $390 million, down from the $550 million previously announced.
ARC's 2016 full-year guidance has been revised to incorporate reduced 2016 capital spending of approximately $390 million. Reflecting the 30 per cent reduction in capital spending, ARC's full-year average production guidance has been revised downward to a range of 116,000 to 120,000 boe per day from the previously guided range of 119,000 to 124,000 boe per day. ARC's full-year guidance for per boe operating costs was lowered to a range of $7.40 to $7.80 per boe to reflect the deferral of certain discretionary expenditures to future periods, and to reflect the continued focus on ARC's northeast British Columbia Montney assets, which have lower relative costs to operate. Lower power prices and the revision of estimates for prior periods benefited 2015 operating costs on a per boe basis; these items are not expected to impact 2016 operating costs, and as such, the guidance for 2016 operating costs on a per boe basis is higher relative to 2015 actual results. All other 2016 per boe guidance estimates that have changed from the original guidance announced on November 4, 2015 reflect revised production guidance for 2016.
Table 4
|
| | | | | | | | | | |
| | 2016 Original
Guidance (1) | 2016 Revised
Guidance (1) | 2015
Guidance (2) | 2015 Actuals | % Variance from Guidance |
|
| Production | | | | | |
| Crude oil (bbl/d) | 34,500 - 36,500 |
| 32,000 - 34,000 |
| 33,500 - 34,500 |
| 32,762 |
| (2 | ) |
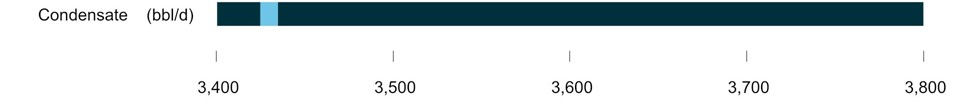
| Condensate (bbl/d) | 3,200 - 3,600 |
| 3,000 - 3,400 |
| 3,400 - 3,800 |
| 3,430 |
| — |
|
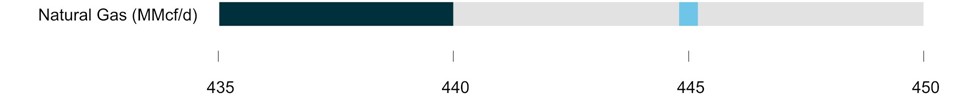
| Natural gas (MMcf/d) | 465 - 475 |
| 460 - 470 |
| 435 - 440 |
| 444.9 |
| 1 |
|
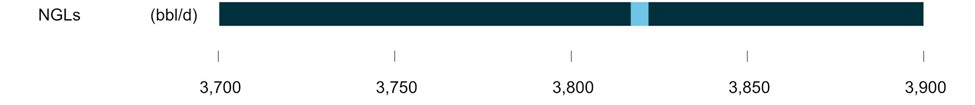
| NGLs (bbl/d) | 4,000 - 4,500 |
| 3,800 - 4,200 |
| 3,700 - 3,900 |
| 3,819 |
| — |
|
| Total (boe/d) | 119,000 - 124,000 |
| 116,000 - 120,000 |
| 113,000 - 115,000 |
| 114,167 |
| — |
|
| Expenses ($/boe) | | | | | |
Operating (3) | 7.70 - 8.10 |
| 7.40 - 7.80 |
| 7.50 - 7.70 |
| 7.15 |
| (5 | ) |
| Transportation | 2.40 - 2.70 |
| 2.40 - 2.70 |
| 2.30 - 2.50 |
| 2.33 |
| — |
|
| G&A expenses before share-based compensation plans | 1.45 - 1.55 |
| 1.55 - 1.65 |
| 1.65 - 1.70 |
| 1.48 |
| (10 | ) |
G&A - share-based compensation plans (4) | 0.55 - 0.75 |
| 0.45 - 0.65 |
| 0.35 - 0.60 |
| 0.17 |
| (51 | ) |
| Interest | 1.00 - 1.20 |
| 1.10 - 1.30 |
| 1.10 - 1.30 |
| 1.22 |
| — |
|
Current income tax (per cent of funds from operations) (5) | 0 - 5 |
| 0 - 5 |
| 0 - 2 |
| — |
| — |
|
| Capital expenditures before land purchases and net property acquisitions (dispositions) ($ millions) | 550 |
| 390 |
| 550 |
| 541.6 |
| (2 | ) |
| Land purchases and net property acquisitions (dispositions) ($ millions) | — |
| — |
| — |
| (67.7 | ) | N/A |
|
| Weighted average shares, diluted (millions) | 351 |
| 351 |
| 339 |
| 341 |
| 1 |
|
| |
| (1) | 2016 revised production guidance incorporates impact of approximately 1,300 boe per day of divested non-core crude oil assets at the end of 2015 and does not take into account the impact of any dispositions that may occur during 2016. |
| |
| (2) | Incorporates impact of approximately 3,600 boe per day of divested non-core assets throughout the first nine months of 2015 (75 per cent natural gas), which resulted in an annual volume impact of approximately 2,200 boe per day of production. |
| |
| (3) | Actual results for the year ended December 31, 2015 include a reduction of approximately $0.40 per boe due to a revision of estimates for prior period operating costs. |
| |
| (4) | Comprises expenses recognized under the RSU and PSU, Share Option and LTRSA Plans. In periods where substantial share price fluctuation occurs, ARC’s G&A expenses are subject to greater volatility. |
| |
| (5) | The 2015 and 2016 corporate tax estimates vary depending on level of commodity prices. |
2015 annual production fell within the guidance range. Crude oil production was two per cent below the guidance range, reflecting the disposition of non-core properties producing approximately 500 barrels per day during the third quarter while natural gas production averaged slightly above the guidance range as a result of exceptional performance from ARC’s newest gas processing facility at Sunrise throughout the fourth quarter.
Exhibit 3
2015 Production Guidance
On a per boe basis, operating costs were below the guidance range during 2015 with higher than expected production volumes for the first half of the year coupled with lower average electricity rates and diligent cost control over turnaround and maintenance activities completed during the year. In 2015, ARC’s G&A expenses averaged lower than the guidance range primarily due to decreased expenses under ARC’s share-based compensation plans. ARC recorded an income tax recovery for 2015, reflecting lower than anticipated taxable income related to decreased commodity prices.
Exhibit 3a
2015 Expenses Guidance
ARC incurred $541.6 million of capital expenditures during 2015. In addition, ARC spent $6.7 million on land purchases during the year and completed net dispositions of assets resulting in net proceeds of $74.4 million.
ARC's 2016 reduced capital program of $390 million will remain focused on balance sheet preservation and long-term value creation through continued development of ARC's low-cost, high-value northeast British Columbia Montney assets. The budget will allow ARC to hold northeast British Columbia facilities at capacity, progress the key infrastructure project at Dawson Phase III, and continue to delineate ARC's highly prospective Attachie asset. Capital allocation to ARC’s assets in Ante Creek, Pembina and Southeast Saskatchewan has been deferred while ARC concentrates investment in larger-scale projects that deliver superior rates of return in the current commodity price environment; ARC also awaits final details on the MRF (1) from the Alberta Government for its Alberta assets. Full-year 2016 annual average production is expected to be in the range of 116,000 to 120,000 boe per day.
Ongoing commodity price volatility may affect ARC's funds from operations and profitability on capital programs. As continued volatility is expected, ARC will continue to take steps to mitigate these risks, focus on capital discipline and cost control, and protect its strong financial position. ARC will adjust spending and the pace of development, if required, to ensure balance sheet strength is protected.
The guidance information presented is intended to provide shareholders with information on Management’s expectations for results from operations. Readers are cautioned that the guidance may not be appropriate for other purposes.
| |
| (1) | Modernized Royalty Framework. Refer to the section entitled “Royalties” contained within this MD&A. |
2015 FOURTH QUARTER FINANCIAL AND OPERATING RESULTS
Financial Highlights
Table 5 |
| | | | | | | | | | | | |
| | Three Months Ended | Twelve Months Ended |
| | December 31 | December 31 |
| ($ millions, except per share and volume data) | 2015 |
| 2014 |
| % Change |
| 2015 |
| 2014 |
| % Change |
|
Funds from operations (1) | 200.7 |
| 251.7 |
| (20 | ) | 773.4 |
| 1,124.0 |
| (31 | ) |
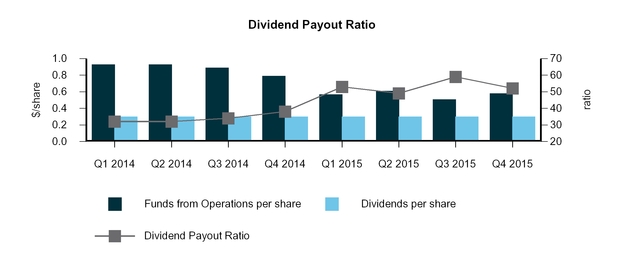
Funds from operations per share (1) | 0.58 |
| 0.79 |
| (27 | ) | 2.27 |
| 3.54 |
| (36 | ) |
| Net income (loss) | (55.0 | ) | 113.7 |
| (148 | ) | (342.7 | ) | 380.8 |
| (190 | ) |
| Net income (loss) per share | (0.16 | ) | 0.36 |
| (144 | ) | (1.01 | ) | 1.20 |
| (184 | ) |
Dividends per share (2) | 0.30 |
| 0.30 |
| — |
| 1.20 |
| 1.20 |
| — |
|
| Average daily production (boe/d) | 119,243 |
| 117,986 |
| 1 |
| 114,167 |
| 112,387 |
| 2 |
|
| |
| (1) | Refer to the sections entitled "Funds from Operations" and “Additional GAAP Measures” contained within this MD&A. |
| |
| (2) | Dividends per share are based on the number of shares outstanding at each dividend record date. |
Funds from Operations
ARC reports funds from operations in total and on a per share basis. Funds from operations does not have a standardized meaning prescribed by Canadian GAAP. Refer to the section entitled “Additional GAAP Measures” contained within this MD&A.
Table 6 is a reconciliation of ARC’s net income (loss) to funds from operations and cash flow from operating activities:
Table 6 |
| | | | | | | | |
| | Three Months Ended | Twelve Months Ended |
| | December 31 | December 31 |
| ($ millions) | 2015 |
| 2014 |
| 2015 |
| 2014 |
|
| Net income (loss) | (55.0 | ) | 113.7 |
| (342.7 | ) | 380.8 |
|
| Adjusted for the following non-cash items: | | | | |
| DD&A and impairment | 263.0 |
| 279.4 |
| 1,065.4 |
| 758.5 |
|
| Accretion of ARO | 3.3 |
| 3.7 |
| 13.4 |
| 14.9 |
|
| E&E expenses | — |
| 9.5 |
| 46.9 |
| 39.4 |
|
| Deferred tax expense (recovery) | 3.2 |
| 23.5 |
| (6.8 | ) | 59.1 |
|
| Unrealized gain on risk management contracts | (41.6 | ) | (212.6 | ) | (152.0 | ) | (205.3 | ) |
| Unrealized loss on foreign exchange | 34.9 |
| 32.7 |
| 178.5 |
| 73.8 |
|
| Loss (gain) on disposal of petroleum and natural gas properties | (8.3 | ) | (0.1 | ) | (31.6 | ) | 1.8 |
|
| Other | 1.2 |
| 1.9 |
| 2.3 |
| 1.0 |
|
| Funds from operations | 200.7 |
| 251.7 |
| 773.4 |
| 1,124.0 |
|
| Net change in other liabilities | (4.0 | ) | 0.4 |
| (22.0 | ) | (20.4 | ) |
| Change in non-cash working capital | (20.9 | ) | 39.1 |
| (62.4 | ) | 49.4 |
|
| Cash flow from operating activities | 175.8 |
| 291.2 |
| 689.0 |
| 1,153.0 |
|
Details of the change in funds from operations from the three and twelve months ended December 31, 2014 to the three and twelve months ended December 31, 2015 are included in Table 7 below:
Table 7 |
| | | | | | | | |
| | Three Months Ended | Twelve Months Ended |
| | December 31 | December 31 |
| | $ millions |
| $/Share |
| $ millions |
| $/Share |
|
| Funds from operations – 2014 | 251.7 |
| 0.79 |
| 1,124.0 |
| 3.54 |
|
| Volume variance | | | | |
| Crude oil and liquids | (30.8 | ) | (0.10 | ) | (147.0 | ) | (0.46 | ) |
| Natural gas | 14.1 |
| 0.04 |
| 67.4 |
| 0.21 |
|
| Price variance | | | | |
| Crude oil and liquids | (84.1 | ) | (0.26 | ) | (529.7 | ) | (1.67 | ) |
| Natural gas | (67.4 | ) | (0.21 | ) | (305.1 | ) | (0.96 | ) |
| Other Revenue | — |
| — |
| 0.4 |
| — |
|
| Realized gain on risk management contracts | 27.1 |
| 0.08 |
| 215.1 |
| 0.68 |
|
| Royalties | 40.4 |
| 0.13 |
| 194.7 |
| 0.62 |
|
| Expenses (recoveries) | | | | |
| Transportation | 3.3 |
| 0.01 |
| (5.4 | ) | (0.02 | ) |
| Operating | 24.6 |
| 0.08 |
| 66.2 |
| 0.21 |
|
| G&A | 12.3 |
| 0.04 |
| 16.6 |
| 0.05 |
|
| Interest | (0.4 | ) | — |
| (3.7 | ) | (0.01 | ) |
| Current tax | 9.3 |
| 0.03 |
| 79.3 |
| 0.25 |
|
| Realized gain on foreign exchange | 0.6 |
| — |
| 0.6 |
| — |
|
| Diluted shares | — |
| (0.05 | ) | — |
| (0.17 | ) |
| Funds from operations – 2015 | 200.7 |
| 0.58 |
| 773.4 |
| 2.27 |
|
Funds from operations decreased by 20 per cent in the fourth quarter of 2015 to $200.7 million from $251.7 million generated in the fourth quarter of 2014. The decrease reflects lower revenue due primarily to significantly lower realized commodity prices and reduced crude oil and liquids production in the fourth quarter of 2015 as compared to the fourth quarter of 2014. Increased natural gas production and realized gains on risk management contracts relative to the fourth quarter of the prior year along with lower royalties, operating costs, G&A expenses and current taxes partially offset the impact of the reduction in commodity prices.
For the year ended December 31, 2015, funds from operations decreased by $350.6 million to $773.4 million from $1,124 million in the prior year. This decrease reflects lower revenue net of royalties, partially offset by increased realized gains on risk management contracts, operating costs, G&A expenses and current taxes.
|
| | |
| ARC Resources Ltd. | Page 10 |
Exhibit 4 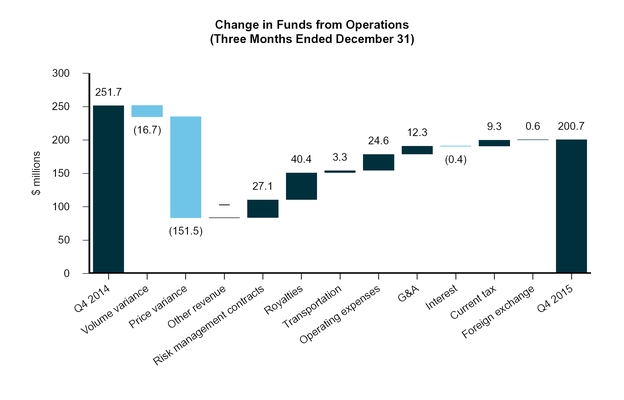 Exhibit 4a
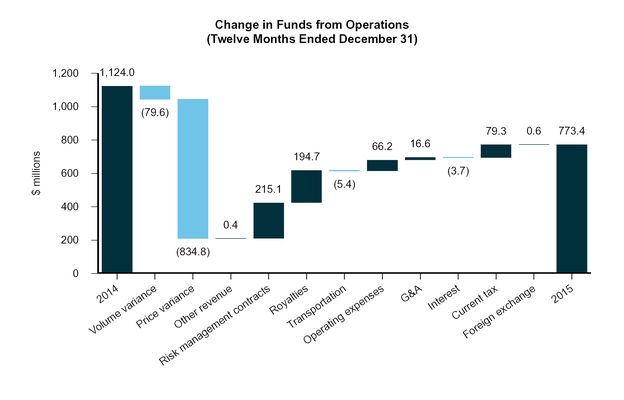
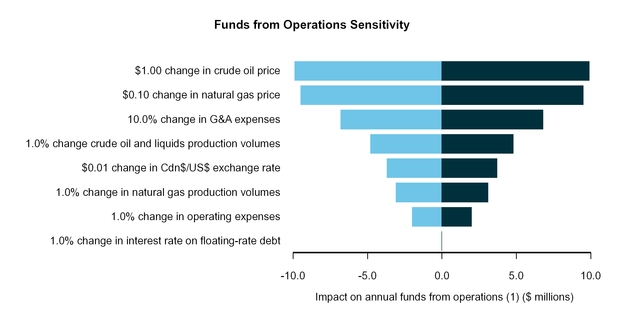
2015 Funds from Operations Sensitivity
Table 8 illustrates sensitivities of pre-hedged operating items to operational and business environment changes and the resulting impact on funds from operations per share:
Table 8 |
| | | | | | |
| | Impact on Annual Funds from Operations (6) |
|
| | Assumption |
| Change |
| $/Share |
|
Business Environment (1) | | | |
Crude oil price (US$ WTI/bbl) (2)(3) | 48.76 |
| 1.00 |
| 0.029 |
|
Natural gas price (Cdn$ AECO/Mcf) (2)(3) | 2.77 |
| 0.10 |
| 0.028 |
|
Cdn$/US$ exchange rate (2)(3)(4) | 1.28 |
| 0.01 |
| 0.011 |
|
Interest rate on floating-rate debt (2) | 2.8 | % | 1.0 | % | — |
|
| Operational | | | |
Crude oil and liquids production volumes (bbl/d) (5) | 40,011 |
| 1.0 | % | 0.014 |
|
Natural gas production volumes (MMcf/d) (5) | 444.9 |
| 1.0 | % | 0.009 |
|
Operating expenses ($/boe) (5) | 7.15 |
| 1.0 | % | 0.006 |
|
G&A expenses ($/boe) (5) | 1.65 |
| 10.0 | % | 0.020 |
|
| |
| (1) | Calculations are performed independently and may not be indicative of actual results that would occur when multiple variables change at the same time. |
| |
| (2) | Prices and rates are indicative of published prices for the year ended December 31, 2015. See Table 13 of this MD&A for additional details. The calculated impact on funds from operations would only be applicable within a limited range of these amounts. |
| |
| (3) | Analysis does not include the effect of risk management contracts. |
| |
| (4) | Includes impact of foreign exchange on crude oil, condensate, and NGLs prices that are presented in US dollars. |
| |
| (5) | Operational assumptions are based upon results for the year ended December 31, 2015. |
| |
| (6) | Refer to the sections entitled "Funds from Operations" and “Additional GAAP Measures” contained within this MD&A. |
Exhibit 5
| |
| (1) | Refer to the sections entitled "Funds from Operations" and “Additional GAAP Measures” contained within this MD&A. |
|
| | |
| ARC Resources Ltd. | Page 11 |
Net Income (Loss)
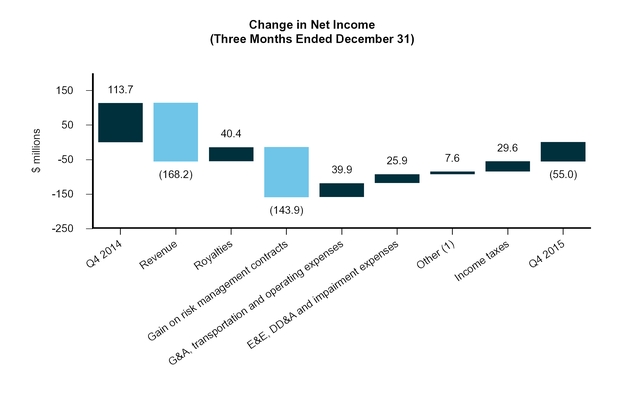
A net loss of $55 million (loss of $0.16 per share) was incurred in the fourth quarter of 2015, a $168.7 million ($0.52 per share) decrease compared to net income of $113.7 million (income of $0.36 per share) in the fourth quarter of 2014. Lower revenue net of royalties and decreased gains on risk management contracts reduced net income while lower operating costs, G&A expenses and income taxes, as well as higher gains on disposal of petroleum and natural gas properties served to partially offset the decrease. ARC also recorded lower DD&A charges in the fourth quarter of 2015 as compared to the same period in the prior year, which were partially offset by increased impairment charges.
Exhibit 6
| |
| (1) | Includes loss on foreign exchange, loss on short-term investments, and gain on disposal of PP&E. |
During the year ended December 31, 2015, ARC incurred a net loss of $342.7 million (loss of $1.01 per share), compared to net income of $380.8 million (income of $1.20 per share) earned during the prior year. Lower commodity prices during 2015 resulted in lower revenue net of royalties, however, the impact of falling prices was partially offset by increased gains on risk management contracts. ARC also recognized lower operating costs, lower G&A expenses, higher gains on disposal of petroleum and natural gas properties, and lower current and deferred taxes during the year. While ARC's DD&A charges were lower in 2015 as compared to the prior year, higher impairment charges were recognized in 2015. Additionally, increased foreign exchange losses were recognized in the current year relating to the revaluation of ARC’s U.S. dollar denominated long-term debt outstanding.
|
| | |
| ARC Resources Ltd. | Page 12 |
Exhibit 6a
| |
| (1) | Includes accretion, interest and financing expenses, loss on short-term investments, and gain on disposal of PP&E. |
Production
Table 9 |
| | | | | | | | | | | | |
| | Three Months Ended | Twelve Months Ended |
| | December 31 | December 31 |
| Production | 2015 |
| 2014 |
| % Change |
| 2015 |
| 2014 |
| % Change |
|
| Light and medium crude oil (bbl/d) | 33,124 |
| 36,276 |
| (9 | ) | 31,827 |
| 35,467 |
| (10 | ) |
| Heavy oil (bbl/d) | 775 |
| 1,166 |
| (34 | ) | 935 |
| 1,058 |
| (12 | ) |
| Condensate (bbl/d) | 3,631 |
| 3,448 |
| 5 |
| 3,430 |
| 3,667 |
| (6 | ) |
| Natural gas (MMcf/d) | 469.1 |
| 432.1 |
| 9 |
| 444.9 |
| 406.1 |
| 10 |
|
| NGLs (bbl/d) | 3,523 |
| 5,075 |
| (31 | ) | 3,819 |
| 4,518 |
| (15 | ) |
| Total production (boe/d) | 119,243 |
| 117,986 |
| 1 |
| 114,167 |
| 112,387 |
| 2 |
|
| % Natural gas production | 66 |
| 61 |
| 8 |
| 65 |
| 60 |
| 8 |
|
| % Crude oil and liquids production | 34 |
| 39 |
| (13 | ) | 35 |
| 40 |
| (13 | ) |
During both the three months and year ended December 31, 2015, crude oil and liquids production decreased 11 per cent from the same periods of the prior year. The decrease in crude oil and liquids production primarily reflects natural declines associated with reduced drilling activity and the disposition of certain non-core assets in Southwestern Saskatchewan in the third quarter of 2015 which had been producing approximately 500 boe per day prior to disposal. The decrease was partially offset by additional production at Tower following the battery expansion that was completed during the fourth quarter.
|
| | |
| ARC Resources Ltd. | Page 13 |
Natural gas production was 469.1 MMcf per day in the fourth quarter of 2015, an increase of nine per cent from the 432.1 MMcf per day produced in the fourth quarter of 2014. The increase is mainly attributed to new production from drilling throughout 2015 in northeastern British Columbia, particularly at Sunrise to fill ARC's new 60 MMcf per day natural gas processing facility which was commissioned during the third quarter of 2015. The increase in natural gas production was partially offset by the disposition of certain non-core assets in South Central Alberta in the second quarter of 2015 which had been producing approximately 14.4 MMcf per day prior to disposal. For the year ended December 31, 2015, natural gas production increased by 10 per cent as new production was brought on throughout 2015 at Sunrise and Parkland which served to offset the impact of lost production due to turnarounds during the year and the second quarter disposition.
Exhibit 7
|
| | |
| ARC Resources Ltd. | Page 14 |
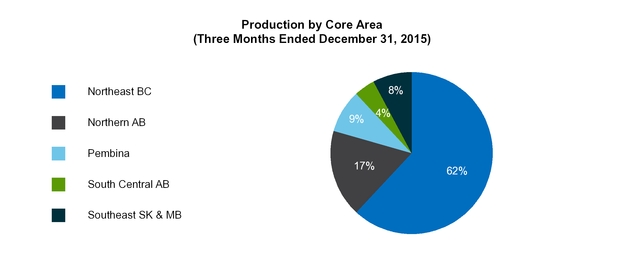
During the fourth quarter of 2015, ARC drilled five natural gas wells (100 per cent ARC) on operated properties. For the year ended December 31, 2015, ARC drilled 60 gross wells (59 net wells) on operated properties consisting of 33 gross (32 net) oil wells, 21 gross (21 net) natural gas wells, five gross (five net) liquids-rich natural gas wells, and one gross (one net) service well. Table 10 summarizes ARC’s production by core area for the fourth quarter of 2015 and 2014:
Table 10
|
| | | | | | | | | | |
| | Three Months Ended December 31, 2015 |
| Production | Total |
| Crude Oil |
| Condensate |
| Natural Gas |
| NGLs |
|
Core Area (1) | (boe/d) |
| (bbl/d) |
| (bbl/d) |
| (MMcf/d) |
| (bbl/d) |
|
| Northeast BC | 73,964 |
| 6,344 |
| 2,677 |
| 379.8 |
| 1,637 |
|
| Northern AB | 20,780 |
| 7,394 |
| 703 |
| 68.9 |
| 1,194 |
|
| Pembina | 10,368 |
| 7,618 |
| 195 |
| 12.8 |
| 432 |
|
South Central AB (2) | 4,821 |
| 3,593 |
| 6 |
| 6.4 |
| 150 |
|
Southeast SK & MB (3) | 9,310 |
| 8,950 |
| 50 |
| 1.2 |
| 110 |
|
| Total | 119,243 |
| 33,899 |
| 3,631 |
| 469.1 |
| 3,523 |
|
|
| | | | | | | | | | |
| | Three Months Ended December 31, 2014 |
| Production | Total |
| Crude Oil |
| Condensate |
| Natural Gas |
| NGLs |
|
Core Area (1) | (boe/d) |
| (bbl/d) |
| (bbl/d) |
| (MMcf/d) |
| (bbl/d) |
|
| Northeast BC | 63,675 |
| 4,372 |
| 2,420 |
| 325.0 |
| 2,704 |
|
| Northern AB | 22,583 |
| 8,496 |
| 748 |
| 70.3 |
| 1,626 |
|
| Pembina | 12,068 |
| 9,331 |
| 167 |
| 12.8 |
| 444 |
|
South Central AB (2) | 8,645 |
| 4,542 |
| 60 |
| 23.0 |
| 213 |
|
Southeast SK & MB (3) | 11,015 |
| 10,701 |
| 53 |
| 1.0 |
| 88 |
|
| Total | 117,986 |
| 37,442 |
| 3,448 |
| 432.1 |
| 5,075 |
|
| |
| (1) | Provincial references: "AB" is Alberta, "BC" is British Columbia, "SK" is Saskatchewan, "MB" is Manitoba. |
| |
| (2) | During the second quarters of 2015 and 2014, ARC disposed of certain non-core assets in this district. Each disposition included assets that had been producing approximately 2,400 boe per day prior to disposal. An additional 500 boe per day were disposed from this district toward the end of the third quarter of 2015. |
| |
| (3) | In December 2015, ARC disposed of certain non-core assets in this district that had been producing approximately 1,300 boe per day prior to disposal. |
Exhibit 8
|
| | |
| ARC Resources Ltd. | Page 15 |
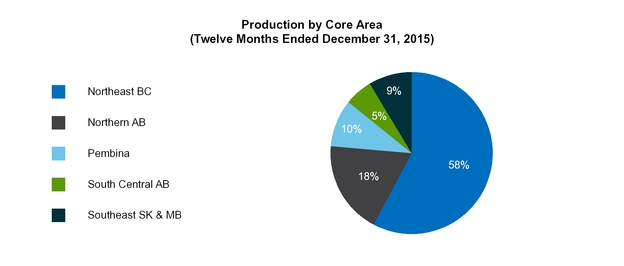
Table 10a summarizes ARC’s production by core area for the twelve months ended December 31, 2015 and 2014:
Table 10a |
| | | | | | | | | | |
| | Twelve Months Ended December 31, 2015 |
| Production | Total |
| Crude Oil |
| Condensate |
| Natural Gas |
| NGLs |
|
Core Area (1) | (boe/d) |
| (bbl/d) |
| (bbl/d) |
| (MMcf/d) |
| (bbl/d) |
|
| Northeast BC | 66,022 |
| 3,406 |
| 2,461 |
| 350.8 |
| 1,687 |
|
| Northern AB | 21,035 |
| 7,497 |
| 710 |
| 68.5 |
| 1,402 |
|
| Pembina | 10,992 |
| 8,227 |
| 175 |
| 12.9 |
| 446 |
|
South Central AB (2) | 6,166 |
| 3,996 |
| 33 |
| 11.6 |
| 196 |
|
Southeast SK & MB (3) | 9,952 |
| 9,636 |
| 51 |
| 1.1 |
| 88 |
|
| Total | 114,167 |
| 32,762 |
| 3,430 |
| 444.9 |
| 3,819 |
|
|
| | | | | | | | | | |
| | Twelve Months Ended December 31, 2014 |
| Production | Total |
| Crude Oil |
| Condensate |
| Natural Gas |
| NGLs |
|
Core Area (1) | (boe/d) |
| (bbl/d) |
| (bbl/d) |
| (MMcf/d) |
| (bbl/d) |
|
| Northeast BC | 57,669 |
| 3,384 |
| 2,580 |
| 296.4 |
| 2,302 |
|
| Northern AB | 23,339 |
| 9,547 |
| 811 |
| 68.8 |
| 1,511 |
|
| Pembina | 11,391 |
| 8,779 |
| 163 |
| 12.3 |
| 405 |
|
South Central AB (2) | 9,190 |
| 4,321 |
| 70 |
| 27.5 |
| 220 |
|
Southeast SK & MB (3) | 10,798 |
| 10,494 |
| 43 |
| 1.1 |
| 80 |
|
| Total | 112,387 |
| 36,525 |
| 3,667 |
| 406.1 |
| 4,518 |
|
| |
| (1) | Provincial references: "AB" is Alberta, "BC" is British Columbia, "SK" is Saskatchewan, "MB" is Manitoba. |
| |
| (2) | During the second quarters of 2015 and 2014, ARC disposed of certain non-core assets in this district. Each disposition included assets that had been producing approximately 2,400 boe per day prior to disposal. An additional 500 boe per day were disposed from this district toward the end of the third quarter of 2015. |
| |
| (3) | In December 2015, ARC disposed of certain non-core assets in this district that had been producing approximately 1,300 boe per day prior to disposal. |
Exhibit 8a
|
| | |
| ARC Resources Ltd. | Page 16 |
Sales of Crude Oil, Natural Gas, Condensate, NGLs and Other Income
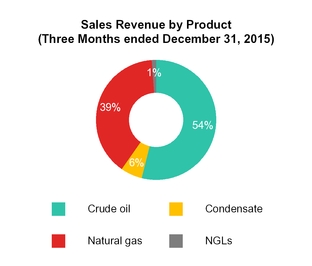
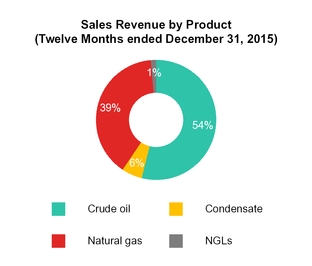
Sales revenue from crude oil, natural gas, condensate, NGLs and other income decreased significantly in both the fourth quarter of 2015 and for the full year as compared to the same periods in 2014. The decreases reflect lower average realized commodity prices for all products in 2015 compared to 2014 as well as decreased crude oil and liquids production volumes.
A breakdown of sales revenue by product is outlined in Table 11:
Table 11 |
| | | | | | | | | | | | |
| | Three Months Ended | Twelve Months Ended |
| | December 31 | December 31 |
Sales revenue by product ($ millions) | 2015 |
| 2014 |
| % Change |
| 2015 |
| 2014 |
| % Change |
|
| Crude oil | 153.5 |
| 249.7 |
| (39 | ) | 640.1 |
| 1,208.4 |
| (47 | ) |
| Condensate | 16.6 |
| 23.5 |
| (29 | ) | 67.4 |
| 125.6 |
| (46 | ) |
| Natural gas | 111.7 |
| 165.0 |
| (32 | ) | 467.9 |
| 705.6 |
| (34 | ) |
| NGLs | 3.5 |
| 15.3 |
| (77 | ) | 14.9 |
| 65.1 |
| (77 | ) |
| Total sales revenue from crude oil, natural gas, condensate and NGLs | 285.3 |
| 453.5 |
| (37 | ) | 1,190.3 |
| 2,104.7 |
| (43 | ) |
| Other income | 0.6 |
| 0.6 |
| — |
| 3.4 |
| 3.0 |
| 13 |
|
| Total sales revenue | 285.9 |
| 454.1 |
| (37 | ) | 1,193.7 |
| 2,107.7 |
| (43 | ) |
Exhibit 9
While ARC’s production mix on a per boe basis is weighted more heavily to natural gas than to crude oil and liquids, ARC's revenue contribution is more heavily weighted to crude oil and liquids production as shown by the table below:
Table 12
|
| | | | |
| | Three Months Ended | Twelve Months Ended |
| | December 31 | December 31 |
| Revenue by Product Type | 2015 | 2014 | 2015 | 2014 |
| | % of Total Revenue | % of Total Revenue | % of Total Revenue | % of Total Revenue |
| Crude oil and liquids | 61 | 64 | 61 | 66 |
| Natural gas | 39 | 36 | 39 | 34 |
| Total sales revenue | 100 | 100 | 100 | 100 |
|
| | |
| ARC Resources Ltd. | Page 17 |
Commodity Prices Prior to Hedging
Table 13 |
| | | | | | | | | | | | |
| | Three Months Ended | Twelve Months Ended |
| | December 31 | December 31 |
| | 2015 |
| 2014 |
| % Change |
| 2015 |
| 2014 |
| % Change |
|
| Average Benchmark Prices | | | | | | |
| AECO natural gas (Cdn$/Mcf) | 2.65 |
| 4.01 |
| (34 | ) | 2.77 |
| 4.42 |
| (37 | ) |
| WTI oil (US$/bbl) | 42.16 |
| 73.20 |
| (42 | ) | 48.76 |
| 92.91 |
| (48 | ) |
| Cdn$/US$ exchange rate | 1.34 |
| 1.14 |
| 18 |
| 1.28 |
| 1.10 |
| 16 |
|
| WTI oil (Cdn$/bbl) | 56.49 |
| 83.45 |
| (32 | ) | 62.41 |
| 102.20 |
| (39 | ) |
| Edmonton Par (Cdn$/bbl) | 52.93 |
| 75.65 |
| (30 | ) | 57.20 |
| 94.46 |
| (39 | ) |
| ARC Average Realized Prices Prior to Hedging | | | | | | |
| Crude oil ($/bbl) | 49.24 |
| 72.49 |
| (32 | ) | 53.53 |
| 90.64 |
| (41 | ) |
| Condensate ($/bbl) | 49.80 |
| 74.04 |
| (33 | ) | 53.84 |
| 93.81 |
| (43 | ) |
| Natural gas ($/Mcf) | 2.59 |
| 4.15 |
| (38 | ) | 2.88 |
| 4.76 |
| (39 | ) |
| NGLs ($/bbl) | 10.73 |
| 32.69 |
| (67 | ) | 10.70 |
| 39.45 |
| (73 | ) |
| Total average realized commodity price prior to other income and hedging ($/boe) | 26.01 |
| 41.78 |
| (38 | ) | 28.57 |
| 51.31 |
| (44 | ) |
| Other income ($/boe) | 0.05 |
| 0.05 |
| — |
| 0.08 |
| 0.07 |
| 14 |
|
| Total average realized price prior to hedging ($/boe) | 26.06 |
| 41.83 |
| (38 | ) | 28.65 |
| 51.38 |
| (44 | ) |
In the fourth quarter of 2015, WTI decreased 42 per cent to US$42.16 per barrel as compared to US$73.20 per barrel in the same period in 2014. Similarly, ARC’s realized crude oil price decreased by 32 per cent over the same time period, averaging $49.24 per barrel. During the fourth quarter of 2015, the differential between WTI and Edmonton posted prices narrowed to an average discount of US$2.52 per barrel compared to US$6.58 per barrel in the same period in 2014. During the same period, the average exchange rate for the Canadian dollar as compared to the US dollar weakened from $1.14 to $1.34. The narrowing of the differential combined with a weaker Canadian dollar served to partially mitigate the overall impact of the decrease in WTI on ARC's average realized prices.
For the year ended December 31, 2015, ARC's average realized crude oil price fell by 41 per cent as compared to the year ended December 31, 2014. This price decrease is primarily attributed to the 48 per cent decrease in WTI over the same time period, partially offset by the effect of a narrowed differential between WTI and Edmonton Par crude oil prices and a weakened Canadian dollar.
Natural gas prices decreased in the fourth quarter and for the year ended December 31, 2015 as compared to the same periods in 2014. Year-over-year North American supply exceeded demand, leaving inventory levels much higher than in the prior year. ARC's average realized natural gas price for the year ended December 31, 2015 of $2.88 per Mcf was higher than the 2014 average AECO monthly index price due in part to ARC's higher than average heat content in its natural gas. Approximately 20 per cent of ARC's natural gas production is sold at Station 2 in British Columbia which has experienced volatile pricing throughout the second half of the year, primarily as a result of maintenance activities on all western Canadian pipelines, leading to insufficient take-away capacity. As a result, ARC's average realized natural gas price for the fourth quarter of 2015 of $2.59 per Mcf was modestly lower than the average AECO monthly index price during the period. ARC has been able to partially mitigate the impact of Station 2 pricing through the physical diversification of its sales points. ARC maintains a diversified sales portfolio that allows some flexibility on a portion of its natural gas sales between monthly average and daily spot pricing at sales hubs in western Canada and the mid-western United States.
|
| | |
| ARC Resources Ltd. | Page 18 |
Risk Management
ARC maintains a risk management program to reduce the volatility of revenues, increase the certainty of funds from operations, and to protect acquisition and development economics. ARC’s risk management program is governed by certain guidelines approved by the Board of Directors (the "Board"). These guidelines currently restrict risk management contracts to a maximum of 55 per cent of total forecast production where a specific commodity (crude oil or natural gas) cannot exceed a maximum of 70 per cent of forecast production for that commodity over the next two years, and with a maximum of 25 per cent of forecast natural gas production in risk management contracts beyond two years and up to five years. ARC’s risk management program guidelines allow for further risk management contracts on anticipated volumes associated with new production arising from specific capital projects and acquisitions or to further protect cash flows for a specific period with approval of the Board.
Gains and losses on risk management contracts are composed of both realized gains and losses, representing the portion of risk management contracts that have settled in cash during the period, and unrealized gains or losses that represent the change in the mark-to-market position of those contracts throughout the period. ARC does not employ hedge accounting for any of its risk management contracts currently in place. ARC considers all of its risk management contracts to be effective economic hedges of its underlying business transactions.
Table 14 summarizes the total gain or loss on risk management contracts for the fourth quarter of 2015 compared to the same period in 2014:
Table 14 |
| | | | | | | | | | | | |
Risk Management Contracts ($ millions) | Crude Oil & Liquids |
| Natural Gas |
| Foreign Currency |
| Power |
| Q4 2015 Total |
| Q4 2014 Total |
|
Realized gain (loss) on contracts (1) | 12.7 |
| 43.2 |
| (3.2 | ) | (0.8 | ) | 51.9 |
| 24.8 |
|
Unrealized gain (loss) on contracts (2) | 20.0 |
| 18.5 |
| 3.9 |
| (0.8 | ) | 41.6 |
| 212.6 |
|
| Gain (loss) on risk management contracts | 32.7 |
| 61.7 |
| 0.7 |
| (1.6 | ) | 93.5 |
| 237.4 |
|
| |
| (1) | Represents actual cash settlements or receipts under the respective contracts. |
| |
| (2) | Represents the change in fair value of the contracts during the period. |
Table 14a summarizes the total gain or loss on risk management contracts for the year ended December 31, 2015 compared to the same period in 2014:
Table 14a |
| | | | | | | | | | | | |
Risk Management Contracts ($ millions) | Crude Oil & Liquids |
| Natural Gas |
| Foreign Currency |
| Power |
| 2015 Total |
| 2014 Total |
|
Realized gain (loss) on contracts (1) | 55.8 |
| 141.2 |
| (9.9 | ) | (1.1 | ) | 186.0 |
| (29.1 | ) |
Unrealized gain (loss) on contracts (2) | 39.4 |
| 109.5 |
| 4.1 |
| (1.0 | ) | 152.0 |
| 205.3 |
|
| Gain (loss) on risk management contracts | 95.2 |
| 250.7 |
| (5.8 | ) | (2.1 | ) | 338.0 |
| 176.2 |
|
| |
| (1) | Represents actual cash settlements or receipts under the respective contracts. |
| |
| (2) | Represents the change in fair value of the contracts during the period. |
During the three and twelve months ended December 31, 2015, ARC recorded gains of $93.5 million and $338 million, respectively, on its risk management contracts. These gains comprised realized gains of $51.9 million and unrealized gains of $41.6 million for the fourth quarter and realized gains of $186 million and unrealized gains of $152 million for the year ended December 31, 2015. The realized gains reflect positive cash settlements received on crude oil contracts with an average floor price of US$90/bbl for the first and second quarters of 2015, crude oil swaps with an average price of $74.77 in the third and fourth quarters, crude oil contracts with an average floor price of $61.80 in the fourth quarter, and on natural gas contracts with an average floor price of $3.94/MMbtu throughout the year. These realized gains are partially offset by realized losses on forward foreign currency and power contracts.
ARC's fourth quarter 2015 unrealized gains on crude oil contracts reflect lower Canadian WTI prices in the forward price curve. During the same period, unrealized gains on natural gas contracts reflect lower forward NYMEX Henry Hub prices, offset by slightly narrower AECO basis through 2019. For the year ended December 31, 2015, ARC's unrealized gains on natural gas contracts primarily reflect lower forward NYMEX Henry Hub prices. Losses for the three months and year ended December 31, 2015 on electricity contracts reflect lower power prices in the forward price curve.
ARC’s risk management contracts provide protection from natural gas prices on 173,400 MMbtu per day for 2016. ARC has also executed long-term natural gas contracts on 154,500 MMbtu per day for 2017, 127,900 MMbtu per day for 2018, 68,400 MMbtu per day for 2019, and 56,800 for 2020. In addition, ARC has AECO basis swap contracts in place,
|
| | |
| ARC Resources Ltd. | Page 19 |
fixing the AECO price received on 140,000 MMbtu per day for 2016, 150,000 MMbtu per day for 2017, 95,000 MMbtu per day for 2018, 60,000 MMbtu per day for 2019, and 10,000 MMbtu per day for 2020.
For crude oil, ARC has 10,000 barrels per day of crude oil production hedged for 2016. In addition, ARC has hedged 3,000 barrels per day of production for the first half of 2017. ARC also has MSW basis swap contracts in place for 2016, fixing the discount between WTI and the mixed sweet crude grade price at Edmonton.
Table 15 summarizes ARC’s average crude oil and natural gas hedged volumes for 2016 through 2020 as at the date of this MD&A. For a complete listing and terms of ARC’s hedging contracts at December 31, 2015, see Note 16 “Financial Instruments and Market Risk Management” in the financial statements.
Table 15
|
| | | | | | | | | | | | | | | | | | | | |
Hedge Positions Summary (1) | | | | | | | | | | |
| As at February 10, 2016 | 2016 | 2017 | 2018 | 2019 | 2020 |
Crude Oil - Cdn$ WTI (2) | Cdn$/bbl |
| bbl/d |
| Cdn$/bbl |
| bbl/d |
| Cdn$/bbl |
| bbl/d |
| Cdn$/bbl |
| bbl/d |
| Cdn$/bbl |
| bbl/d |
|
| Ceiling | 83.38 |
| 3,000 |
| 83.38 |
| 1,488 |
| — |
| — |
| — |
| — |
| — |
| — |
|
| Floor | 70.00 |
| 3,000 |
| 70.00 |
| 1,488 |
| — |
| — |
| — |
| — |
| — |
| — |
|
| Swap | 77.20 |
| 7,000 |
| — |
| — |
| — |
| — |
| — |
| — |
| — |
| — |
|
Crude Oil - MSW (Differential to WTI) (3) | US$/bbl |
| bbl/d |
| US$/bbl |
| bbl/d |
| US$/bbl |
| bbl/d |
| US$/bbl |
| bbl/d |
| US$/bbl |
| bbl/d |
|
| Swap | (3.75 | ) | 9,500 |
| — |
| — |
| — |
| — |
| — |
| — |
| — |
| — |
|
Natural Gas - NYMEX (4) | US$/MMbtu |
| MMbtu/d |
| US$/MMbtu |
| MMbtu/d |
| US$/MMbtu |
| MMbtu/d |
| US$/MMbtu |
| MMbtu/d |
| US$/MMbtu |
| MMbtu/d |
|
| Ceiling | 4.79 |
| 105,000 |
| 4.81 |
| 145,000 |
| 4.92 |
| 90,000 |
| 5.00 |
| 40,000 |
| — |
| — |
|
| Floor | 4.00 |
| 105,000 |
| 4.00 |
| 145,000 |
| 4.00 |
| 90,000 |
| 4.00 |
| 40,000 |
| — |
| — |
|
| Swap | 4.00 |
| 40,000 |
| — |
| — |
| — |
| — |
| — |
| — |
| — |
| — |
|
Natural Gas - AECO (5) | Cdn$/GJ |
| GJ/d |
| Cdn$/GJ |
| GJ/d |
| Cdn$/GJ |
| GJ/d |
| Cdn$/GJ |
| GJ/d |
| Cdn$/GJ |
| GJ/d |
|
| Ceiling | — |
| — |
| — |
| — |
| — |
| — |
| 3.30 |
| 10,000 |
| 3.60 |
| 30,000 |
|
| Floor | — |
| — |
| — |
| — |
| — |
| — |
| 3.00 |
| 10,000 |
| 3.08 |
| 30,000 |
|
| Swap | 2.99 |
| 30,000 |
| 2.75 |
| 10,000 |
| 2.96 |
| 40,000 |
| 3.16 |
| 20,000 |
| 3.35 |
| 30,000 |
|
Natural Gas - AECO Basis (6) | AECO/NYMEX |
| MMbtu/d |
| AECO/NYMEX |
| MMbtu/d |
| AECO/NYMEX |
| MMbtu/d |
| AECO/NYMEX |
| MMbtu/d |
| AECO/NYMEX |
| MMbtu/d |
|
| Swap (percentage of NYMEX) | 90.3 |
| 140,000 |
| 89.3 |
| 150,000 |
| 84.5 |
| 95,000 |
| 82.6 |
| 60,000 |
| 82.5 |
| 10,000 |
|
| |
| (1) | The prices and volumes in this table represent averages for several contracts representing different periods. The average price for the portfolio of options listed above does not have the same payoff profile as the individual option contracts. Viewing the average price of a group of options is purely for indicative purposes. All positions are financially settled against the benchmark prices disclosed in Note 16 “Financial Instruments and Market Risk Management” in the financial statements. |
| |
| (2) | Crude oil prices referenced to WTI, multiplied by the Bank of Canada monthly average noon day rate. |
| |
| (3) | MSW differential refers to the discount between WTI and the mixed sweet crude grade at Edmonton, calculated on a monthly weighted average basis in US$. |
| |
| (4) | Natural gas prices referenced to NYMEX Henry Hub. |
| |
| (5) | Natural gas prices referenced to AECO 7(a) index. |
| |
| (6) | ARC sells the majority of its natural gas production based on AECO pricing. To reduce the risk of weak basis pricing (AECO relative to NYMEX Henry Hub), ARC has hedged a portion of production by tying ARC's price to a percentage of the NYMEX Henry Hub natural gas price. |
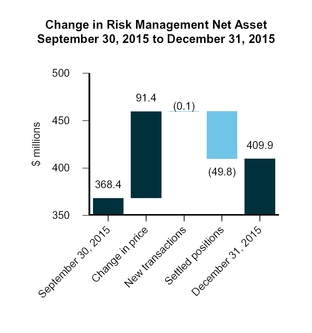
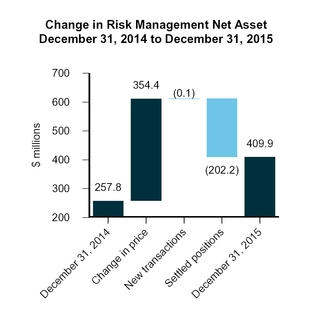
The fair value of ARC’s risk management contracts at December 31, 2015 was a net asset of $409.9 million, representing the expected market price to settle ARC’s contracts at the balance sheet date after any adjustments for credit risk. This may differ from what will eventually be settled in future periods.
|
| | |
| ARC Resources Ltd. | Page 20 |
Exhibit 10
Operating Netbacks
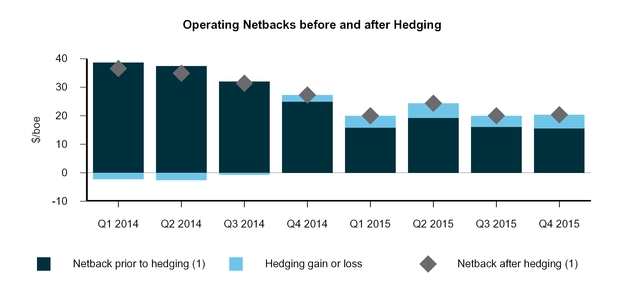
ARC’s fourth quarter and 2015 netbacks prior to hedging were $15.63 per boe and $16.69 per boe, respectively, representing decreases of 37 per cent and 49 per cent as compared to the same periods in 2014.
ARC’s fourth quarter and 2015 netbacks, including realized hedging gains and losses, were $20.36 per boe and $21.15 per boe, respectively, representing decreases of 25 per cent and 35 per cent as compared to the same periods in 2014.
The components of operating netbacks for the fourth quarter of 2015 compared to the same period in 2014 are summarized in Table 16:
Table 16 |
| | | | | | | | | | | | | | |
Netbacks (1) | Crude Oil |
| Heavy Oil |
| Condensate |
| Natural Gas |
| NGLs |
| Q4 2015 Total |
| Q4 2014 Total |
|
| | ($/bbl) |
| ($/bbl) |
| ($/bbl) |
| ($/Mcf) |
| ($/bbl) |
| ($/boe) |
| ($/boe) |
|
| Average sales price | 49.66 |
| 31.26 |
| 49.80 |
| 2.59 |
| 10.73 |
| 26.01 |
| 41.78 |
|
| Other income | — |
| — |
| — |
| — |
| — |
| 0.05 |
| 0.05 |
|
| Total sales | 49.66 |
| 31.26 |
| 49.80 |
| 2.59 |
| 10.73 |
| 26.06 |
| 41.83 |
|
| Royalties | (5.65 | ) | (1.03 | ) | (7.95 | ) | (0.04 | ) | (1.91 | ) | (2.03 | ) | (5.77 | ) |
| Transportation | (2.54 | ) | (0.48 | ) | (3.10 | ) | (0.30 | ) | (7.49 | ) | (2.19 | ) | (2.51 | ) |
Operating expenses (2) | (11.45 | ) | (13.03 | ) | (5.19 | ) | (0.66 | ) | (6.15 | ) | (6.21 | ) | (8.55 | ) |
| Netback prior to hedging | 30.02 |
| 16.72 |
| 33.56 |
| 1.59 |
| (4.82 | ) | 15.63 |
| 25.00 |
|
Hedging gain (3) | 3.89 |
| — |
| — |
| 0.93 |
| — |
| 4.73 |
| 2.29 |
|
| Netback after hedging | 33.91 |
| 16.72 |
| 33.56 |
| 2.52 |
| (4.82 | ) | 20.36 |
| 27.29 |
|
| % of total netback | 46 |
| 1 |
| 5 |
| 49 |
| (1 | ) | 100 |
| 100 |
|
| |
| (1) | Non-GAAP measure which may not be comparable to similar non-GAAP measures used by other entities. Refer to the section entitled "Non-GAAP Measures" contained within this MD&A. |
| |
| (2) | Composed of direct costs incurred to operate crude oil and natural gas wells. A number of assumptions have been made in allocating these costs between crude oil, heavy oil, condensate, natural gas and NGLs production. |
| |
| (3) | Includes realized cash gains and losses on risk management contracts. |
|
| | |
| ARC Resources Ltd. | Page 21 |
Exhibit 11
| |
| (1) | Non-GAAP measure which may not be comparable to similar non-GAAP measures used by other entities. Refer to the section entitled "Non-GAAP Measures" contained within this MD&A. |
The components of operating netbacks for the year ended December 31, 2015 compared to the same period in 2014 are summarized in Table 16a:
Table 16a
|
| | | | | | | | | | | | | | |
Netbacks (1) | Crude Oil |
| Heavy Oil |
| Condensate |
| Natural Gas |
| NGLs |
| 2015 Total |
| 2014 Total |
|
| | ($/bbl) |
| ($/bbl) |
| ($/bbl) |
| ($/Mcf) |
| ($/bbl) |
| ($/boe) |
| ($/boe) |
|
| Average sales price | 53.94 |
| 39.70 |
| 53.84 |
| 2.88 |
| 10.70 |
| 28.57 |
| 51.31 |
|
| Other income | — |
| — |
| — |
| — |
| — |
| 0.08 |
| 0.07 |
|
| Total sales | 53.94 |
| 39.70 |
| 53.84 |
| 2.88 |
| 10.70 |
| 28.65 |
| 51.38 |
|
| Royalties | (5.72 | ) | (0.87 | ) | (9.03 | ) | (0.14 | ) | (2.12 | ) | (2.48 | ) | (7.26 | ) |
| Transportation | (2.57 | ) | (0.52 | ) | (3.00 | ) | (0.32 | ) | (7.81 | ) | (2.33 | ) | (2.23 | ) |
Operating expenses (2) | (12.78 | ) | (10.38 | ) | (5.78 | ) | (0.80 | ) | (6.05 | ) | (7.15 | ) | (8.88 | ) |
| Netback prior to hedging | 32.87 |
| 27.93 |
| 36.03 |
| 1.62 |
| (5.28 | ) | 16.69 |
| 33.01 |
|
Hedging gain (loss) (3) | 4.59 |
| — |
| — |
| 0.82 |
| — |
| 4.46 |
| (0.65 | ) |
| Netback after hedging | 37.46 |
| 27.93 |
| 36.03 |
| 2.44 |
| (5.28 | ) | 21.15 |
| 32.36 |
|
| % of total netback | 50 |
| 1 |
| 5 |
| 45 |
| (1 | ) | 100 |
| 100 |
|
| |
| (1) | Non-GAAP measure which may not be comparable to similar non-GAAP measures used by other entities. Refer to the section entitled "Non-GAAP Measures" contained within this MD&A. |
| |
| (2) | Composed of direct costs incurred to operate crude oil and natural gas wells. A number of assumptions have been made in allocating these costs between crude oil, heavy oil, condensate, natural gas and NGLs production. |
| |
| (3) | Includes realized cash gains and losses on risk management contracts. |
Royalties
ARC pays royalties to the respective provincial governments and landowners of the four western Canadian provinces in which it operates. Approximately 79 per cent of these royalties are Crown royalties. Each province that ARC operates in has established a separate and distinct royalty regime which impacts ARC’s average corporate royalty rate.
In British Columbia, the majority of ARC’s royalty expense stems from production of natural gas and associated liquids. While condensate and NGLs have a flat royalty rate of 20 per cent of sales revenue, the royalty rates for natural gas
|
| | |
| ARC Resources Ltd. | Page 22 |
are based on the drill date of a well and a producer price. All wells spud on or after April 1, 2014 receive a minimum six per cent royalty with additional royalty credits available for horizontal wells drilled to depths greater than 1,900 meters. Wells drilled prior to that date receive a minimum three per cent royalty.
In Alberta, the majority of ARC’s royalties are related to oil production where royalty rates are based on reference prices, production levels and well depths. Similarly, most royalties remitted in Saskatchewan and Manitoba relate to oil production. Royalty calculations in these provinces are based on the classification of the oil product and well productivity.
Each province has various incentive programs in place to promote drilling by reducing the overall royalty expense for producers and offsetting gathering and processing costs. In most cases, the incentive period lasts for a finite period of time (usually twelve months upon commencement of production), after which point the royalty rate usually increases depending on the production rate of the well and prevailing market commodity prices.
In 2016, the provincial government of Alberta announced the key highlights of a proposed Modernized Royalty Framework ("MRF") that will be effective on January 1, 2017. These highlights include providing royalty incentives for the efficient development of conventional crude oil, natural gas, and NGL resources, no changes to the royalty structure of wells drilled prior to 2017 for a 10-year period from the royalty program's implementation date, the replacement of royalty credits/holidays on conventional wells by a revenue minus cost framework with a post-payout royalty rate based on commodity prices, the reduction of royalty rates for mature wells, and a neutral internal rate of return for any given play compared to the current royalty framework. While the provincial government of Alberta has not yet released all of the details of the MRF, the changes are not currently expected to have a material impact on ARC's results of operations. ARC will evaluate the impact of the MRF on the Company’s expected results of operations and cash flows as more details are released.
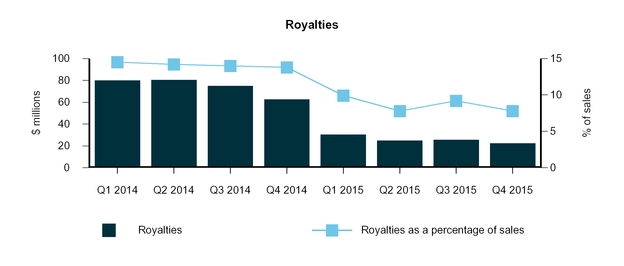
Total royalties as a percentage of pre-hedged commodity product sales revenue decreased from 13.8 per cent ($5.77 per boe) in the fourth quarter of 2014 to 7.8 per cent ($2.03 per boe) in the fourth quarter of 2015 reflecting the "sliding scale" effect of royalty rates with the decrease in average commodity prices during that time period. Similarly, total royalties decreased from $62.7 million in the fourth quarter of 2014 to $22.3 million in the fourth quarter of 2015. For the year ended December 31, 2015, total royalties represented 8.7 per cent of pre-hedged commodity product sales ($2.48 per boe) as compared to 14.1 per cent ($7.26 per boe) for the same period in 2014. The decrease in the royalty rate during the year ended December 31, 2015 as compared to the same period of the prior year also reflects the impact of the decrease in commodity prices on royalties over the same periods.
Exhibit 12
|
| | |
| ARC Resources Ltd. | Page 23 |
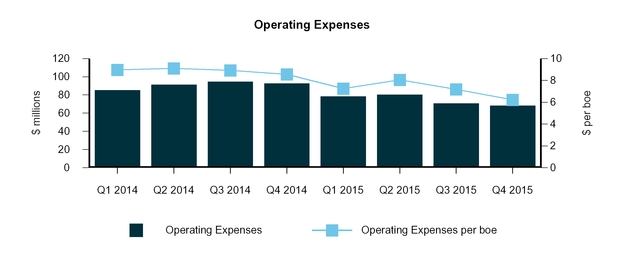
Operating and Transportation Expenses
Operating expenses decreased $2.34 per boe to $6.21 per boe in the fourth quarter of 2015 compared to $8.55 per boe in the fourth quarter of 2014. On an absolute dollar basis, operating expenses have also decreased by $24.6 million or 27 per cent in the fourth quarter of 2015 as compared to the fourth quarter of 2014. For the year ended December 31, 2015 operating expenses decreased by $66.2 million or $1.73 per boe compared to the prior year. The decrease in operating costs for both the three months and year ended December 31, 2015 is mainly a result of reduced maintenance activity levels, the disposition of certain non-core assets throughout the year, increased production volumes from new wells with relatively lower average operating costs, and diligent cost control efforts including negotiating service cost decreases with many of ARC's suppliers throughout 2015. Additionally, electricity costs were lower in 2015 than 2014 with an average Alberta Power Pool Rate of $33.41 per megawatt hour in 2015 as compared to an average of $49.63 per megawatt hour in 2014, further reducing operating costs year-over-year.
ARC hedges a portion of its electricity costs using financial risk management contracts that do not qualify for hedge accounting. The gains and losses associated with these contracts are included within gains and losses on risk management contracts on the consolidated statements of income (the "statements of income"). Had these contracts been recognized within operating expenses, ARC’s operating expenses would have been increased by $0.07 per boe for the three months ended December 31, 2015 (increased $0.03 per boe for the year ended December 31, 2015) as a result of a realized loss of $0.8 million during the period (realized loss of $1.1 million for the year ended December 31, 2015).
Exhibit 13
|
| | |
| ARC Resources Ltd. | Page 24 |
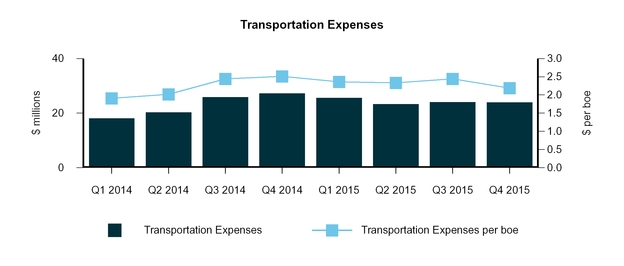
Transportation expenses were $2.19 per boe during the fourth quarter of 2015 ($2.33 per boe for the year ended December 31, 2015) as compared to $2.51 per boe in the fourth quarter of 2014 ($2.23 per boe for the year ended December 31, 2014). Due to reduced trucking costs at the Parkland/Tower area, which became pipeline-connected for its crude oil volumes over the course of 2015, transportation per boe was 13 per cent lower for the fourth quarter of 2015 compared to 2014. The increase in transportation charges for the year ended December 31, 2015 relative to the same period in 2014 is primarily related to transportation arrangements for new production at Sunrise as well as ARC having to secure supplementary takeaway capacity in the second quarter of 2015 due to maintenance and turnaround activity at a third-party facility.
Exhibit 14
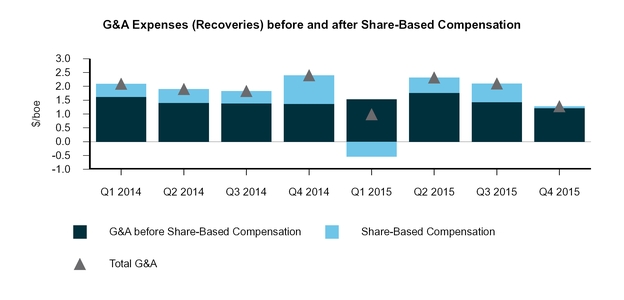
G&A Expenses and Share-Based Compensation
G&A, prior to share-based compensation expense and net of capitalized G&A and overhead recoveries on operated properties, decreased by nine per cent to $13.4 million in the fourth quarter of 2015 from $14.8 million in the fourth quarter of 2014. While G&A expenses before the impact of capitalized G&A and overhead recoveries decreased by 15 per cent from the fourth quarter of 2014 to the fourth quarter of 2015, capitalized G&A and overhead recoveries decreased by 21 per cent during the same period. The reduction in G&A prior to capitalized G&A and overhead recoveries was primarily the result of a significant reduction in cash bonus payments and other discretionary G&A spending in the last half of 2015 relative to 2014. The reduction in capitalized G&A is related to reduced capital spending in the fourth quarter compared to the same period in 2014.
For the year ended December 31, 2015, ARC's G&A prior to share-based compensation expense and net of capitalized G&A and overhead recoveries on operated properties was $61.7 million, a $2.7 million increase from the same period in 2014. The increase reflects decreased capitalized G&A and overhead recoveries from partners associated with lower capital spending, partially offset by lower compensation and bonus expenses.
|
| | |
| ARC Resources Ltd. | Page 25 |
Table 17 is a breakdown of G&A and share-based compensation expenses:
Table 17 |
| | | | | | | | | | | | |
| | Three Months Ended | Twelve Months Ended |
| | December 31 | December 31 |
| G&A and Share-Based Compensation | 2015 |
| 2014 |
| % Change |
| 2015 |
| 2014 |
| % Change |
|
| ($ millions, except per boe) |
G&A expenses (1) | 23.1 |
| 27.1 |
| (15 | ) | 98.5 |
| 107.1 |
| (8 | ) |
| Capitalized G&A and overhead recoveries | (9.7 | ) | (12.3 | ) | (21 | ) | (36.8 | ) | (48.1 | ) | (23 | ) |
| G&A expenses before share-based compensation plans | 13.4 |
| 14.8 |
| (9 | ) | 61.7 |
| 59.0 |
| 5 |
|
G&A – share-based compensation plans (2) | 0.6 |
| 11.2 |
| (95 | ) | 6.9 |
| 25.3 |
| (73 | ) |
| Total G&A and share-based compensation expenses | 14.0 |
| 26.0 |
| (46 | ) | 68.6 |
| 84.3 |
| (19 | ) |
| Total G&A and share-based compensation expenses per boe | 1.28 |
| 2.40 |
| (47 | ) | 1.65 |
| 2.06 |
| (20 | ) |
| |
| (1) | Includes expenses recognized under the DSU Plan. |
| |
| (2) | Comprises expenses recognized under the RSU and PSU, Share Option and LTRSA Plans. |
Exhibit 15
Share-Based Compensation Plans – Restricted Share Unit and Performance Share Unit Plan, Share Option Plan, Deferred Share Unit Plan, and Long-term Restricted Share Award Plan
Restricted Share Unit and Performance Share Unit Plan
The RSU and PSU Plan is designed to offer each eligible employee and officer (the “plan participants”) cash compensation in relation to the underlying value of a specified number of share units. The RSU and PSU Plan consists of RSUs for which the number of units is fixed and will vest over a period of three years and PSUs for which the number of units is variable and will vest at the end of three years.
Upon vesting, the plan participant is entitled to receive a cash payment based on the underlying value of the share units plus accrued dividends. The cash compensation issued upon vesting of the PSUs is dependent upon the total return performance of ARC compared to its peers. Total return is calculated as a sum of the change in the market price of the common shares in the period plus the amount of dividends in the period. A performance multiplier is applied to the PSUs based on the percentile rank of ARC’s total shareholder return compared to its peers. The performance multiplier ranges from zero if ARC’s performance ranks in the bottom quartile, to two for top quartile performance.
ARC recorded a G&A recovery of $0.5 million during the fourth quarter of 2015 in accordance with the RSU and PSU Plan, as compared to an expense of $10.4 million during the fourth quarter of 2014. For the year ended December 31, 2015, ARC recorded an expense in G&A related to the RSU and PSU Plan of $2.6 million, a decrease of $20 million or
|
| | |
| ARC Resources Ltd. | Page 26 |
88 per cent from the year ended December 31, 2014. ARC recognized a decrease in compensation charges for the fourth quarter of 2015 as compared to the fourth quarter of 2014 due to a reduction to the valuation of awards at December 31, 2015 as ARC's share price decreased from $25.16 per share outstanding at December 31, 2014 to $16.70 at December 31, 2015.
During the year ended December 31, 2015, ARC made cash payments of $25.3 million in respect of the RSU and PSU Plan ($39.4 million for the year ended December 31, 2014). Of these payments, $19.5 million were in respect of amounts recorded to G&A expenses ($28.9 million for the year ended December 31, 2014) and $5.8 million were in respect of amounts recorded to operating expenses and capitalized as PP&E and E&E assets ($10.5 million for the year ended December 31, 2014). These amounts were accrued in prior periods.
Table 18 shows the changes to the RSU and PSU Plan during 2015:
Table 18 |
| | | |
RSU and PSU Plan
(number of units, thousands) |
RSUs | PSUs (1) | Total RSUs and PSUs |
| Balance, December 31, 2014 | 625 | 1,513 | 2,138 |
| Granted | 464 | 702 | 1,166 |
| Distributed | (294) | (493) | (787) |
| Forfeited | (65) | (145) | (210) |
| Balance, December 31, 2015 | 730 | 1,577 | 2,307 |
| |
| (1) | Based on underlying units before any effect of the performance multiplier. |
The liability associated with the RSUs and PSUs granted is recognized in the statements of income over the vesting period while being adjusted each period for changes in the underlying share price, accrued dividends and the number of PSUs expected to be issued on vesting. In periods where substantial share price fluctuation occurs, ARC’s G&A expenses are subject to greater volatility.
Due to the variability in the future payments under the plan, ARC estimates that between $12.6 million and $68 million will be paid out in 2016 through 2018 based on the current share price, accrued dividends, and ARC’s market performance relative to its peers. Table 19 is a summary of the range of future expected payments under the RSU and PSU Plan based on variability of the performance multiplier and units outstanding under the RSU and PSU Plan as at December 31, 2015:
Table 19 |
| | | | | | |
| Value of RSU and PSU Plan as at | | | |
| December 31, 2015 | Performance multiplier |
| (units thousands and $ millions, except per share) | — |
| 1.0 |
| 2.0 |
|
| Estimated units to vest | | | |
| RSUs | 754 |
| 754 |
| 754 |
|
| PSUs | — |
| 1,659 |
| 3,318 |
|
Total units (1) | 754 |
| 2,413 |
| 4,072 |
|
Share price (2) | 16.70 |
| 16.70 |
| 16.70 |
|
| Value of RSU and PSU Plan upon vesting | 12.6 |
| 40.3 |
| 68.0 |
|
| 2016 | 5.9 |
| 14.8 |
| 23.7 |
|
| 2017 | 4.2 |
| 11.9 |
| 19.5 |
|
| 2018 | 2.5 |
| 13.6 |
| 24.8 |
|
| |
| (1) | Includes additional estimated units to be issued under the RSU and PSU Plan for dividends accrued to date. |
| |
| (2) | Per share outstanding. Values will fluctuate over the vesting period based on the volatility of the underlying share price. Assumes a future share price of $16.70, which is based on the closing share price at December 31, 2015. |
Share Option Plan
Share options are granted to employees and consultants of ARC, vesting evenly on the fourth and fifth anniversaries of their respective grant dates, and have a maximum term of seven years. The option holder has the right to exercise the options at the original exercise price or at a reduced exercise price, equal to the exercise price at grant date less all dividends paid subsequent to the grant date and prior to the exercise date. On June 24, 2015, ARC granted 998,545 options to officers and certain employees at ARC.
|
| | |
| ARC Resources Ltd. | Page 27 |
At December 31, 2015, ARC had 3.2 million share options outstanding under this plan, representing less than one per cent of outstanding shares, with a weighted average exercise price of $21.95 per share. At December 31, 2015, approximately 0.2 million share options were exercisable with a weighted average exercise price of $21.41 per share. Compensation expense of $0.9 million has been recorded during the fourth quarter of 2015 ($3.4 million for the year ended December 31, 2015) compared to $0.8 million for the fourth quarter of 2014 ($2.7 million for the year ended December 31, 2014), and is included within G&A expenses.
Deferred Share Unit Plan
ARC has a DSU Plan for its non-employee directors under which each director receives a minimum of 60 per cent of their total annual remuneration in the form of DSUs. Each DSU fully vests on the date of grant but is settled in cash only when the director has ceased to be a member of the Board. For the three and twelve months ended December 31, 2015, a G&A expense of $0.1 million and a G&A recovery of $0.3 million were recorded in relation to the DSU Plan (G&A recovery of $0.5 million and a G&A expense of $0.8 million in 2014), respectively.
Long-term Restricted Share Award Plan
On April 30, 2015, at its Annual and Special Meeting of Shareholders, ARC shareholders approved a new Long-term Restricted Share Award ("LTRSA") Plan to award shares of ARC to qualifying officers and employees. With a 10 year term and vesting evenly on the eighth, ninth and tenth anniversary of their respective grant dates, the LTRSA is intended to further align participant compensation with the interests of ARC and its shareholders over the long-term.
LTRSA grants consist of restricted common shares that are awarded at the date of grant and a cash payment made equal to the estimated personal tax obligation associated with the total award. The restricted shares issued on the grant date of the award are held in trust until the vesting conditions have been met.
While in trust, the restricted shares earn dividends which are reinvested into ARC common shares via the stock dividend program. These common shares issued through the stock dividend program are also held in trust until vested. Each LTRSA vests evenly on the eighth, ninth, and tenth anniversaries of their respective grant dates. Restricted shares and any accrued dividends that are subject to forfeiture will be redeemed and cancelled by ARC.
Compensation expense associated with the cash payment is recognized at the fair value on the grant date, while expense associated with the restricted common shares is estimated as the fair value of the award equal to the previous five-day weighted average trading price of ARC shares on the grant date and is recognized over the vesting period.
At December 31, 2015, ARC had 93 thousand restricted shares outstanding under this plan. For the three and twelve months ended December 31, 2015, G&A expenses have been recorded of $nil and $0.7 million relating to the cash payment under the LTRSA Plan ($nil for the three and twelve months ended December 31, 2014), respectively.
|
| | |
| ARC Resources Ltd. | Page 28 |
Interest and Financing Charges
Interest and financing charges increased three per cent to $13.3 million in the fourth quarter of 2015 from $12.9 million in the fourth quarter of 2014. For the year ended December 31, 2015, interest and financing charges were $51 million as compared to $47.3 million in 2014, an increase of eight per cent. The increase in interest charges primarily reflects the increased value of the US dollar relative to the Canadian dollar in 2015 as compared to 2014 as ARC's debt and related interest obligations are primarily held in US dollars.
At December 31, 2015, ARC had $1.1 billion of long-term debt outstanding, including a current portion of $57.9 million that is due for repayment within the next 12 months. ARC's debt balance is fixed at a weighted average interest rate of 4.43 per cent. Approximately 96 per cent (US$772.1 million) of ARC’s debt outstanding is denominated in US dollars.
Exhibit 16
Foreign Exchange Gains and Losses
ARC recorded a foreign exchange loss of $33.9 million in the fourth quarter of 2015 compared to a loss of $32.3 million in the fourth quarter of 2014. The loss is primarily attributed to the unrealized loss associated with the revaluation of ARC’s US dollar denominated debt outstanding from the period of September 30, 2015 to December 31, 2015 and reflects the change in value of the US dollar relative to the Canadian dollar from $1.34 to $1.38.
For the year ended December 31, 2015, ARC recorded a foreign exchange loss of $177.8 million compared to a loss of $73.7 million for the same period in the prior year. During the year ended December 31, 2014, the value of the US dollar relative to the Canadian dollar increased $0.10 from $1.06 at December 31, 2013 to $1.16 at December 31, 2014. During the year ended December 31, 2015, the value of the US dollar relative to the Canadian dollar increased $0.22 from $1.16 at December 31, 2014 to $1.38 at December 31, 2015, resulting in an increased unrealized loss on the revaluation of ARC's US dollar denominated debt.
|
| | |
| ARC Resources Ltd. | Page 29 |
Table 20 shows the various components of foreign exchange gains and losses:
Table 20 |
| | | | | | | | | | |
| | Three Months Ended | Twelve Months Ended |
| | December 31 | December 31 |
Foreign Exchange Gains and Losses ($ millions) | 2015 |
| 2014 |
| % Change | 2015 |
| 2014 |
| % Change |
| Unrealized loss on US denominated debt | (34.9 | ) | (32.7 | ) | 7 | (178.5 | ) | (73.8 | ) | 142 |
| Realized gain on US denominated transactions | 1.0 |
| 0.4 |
| 150 | 0.7 |
| 0.1 |
| 600 |
| Total foreign exchange loss | (33.9 | ) | (32.3 | ) | 5 | (177.8 | ) | (73.7 | ) | 141 |
Taxes
ARC recorded a current income tax recovery of $3 million in the fourth quarter of 2015 ($9 million recovery for the year ended December 31, 2015) compared to $6.3 million expense during the fourth quarter of 2014 ($70.3 million expense for the year ended December 31, 2014). The reduction in current taxes for both the fourth quarter and the year ended December 31, 2015 reflects lower annual taxable income for 2015 related to decreased commodity prices.
During the fourth quarter of 2015, a deferred income tax expense of $3.2 million was recorded ($6.8 million recovery for the year ended December 31, 2015) compared to an expense of $23.5 million in the fourth quarter of 2014 ($59.1 million expense for the year ended December 31, 2014). For both the quarter and year ended December 31, 2015 as compared to the quarter and year ended December 31, 2014, ARC’s decrease in deferred tax expense primarily relates to impairment charges recorded in the third and fourth quarters of 2015 which reduced the book basis of ARC's assets relative to their tax basis and a decrease in unrealized gains recorded on risk management contracts, slightly offset by a net decrease in the asset retirement obligation and an increase to the deferred tax rate as a result of the Alberta corporate tax rate increasing from 10 per cent to 12 per cent effective July 1, 2015.
The income tax pools (detailed in Table 21) are deductible at various rates and annual deductions associated with the initial tax pools will decline over time.
Table 21
|
| | | | |
Income Tax Pool Type ($ millions) | December 31, 2015 |
|
Annual Deductibility |
|
| Canadian oil and gas property expense | 595.2 |
| 10% declining balance |
|
| Canadian development expense | 877.1 |
| 30% declining balance |
|
| Canadian exploration expense | — |
| 100 | % |
| Undepreciated capital cost | 791.4 |
| Primarily 25% declining balance |
|
| Other | 21.8 |
| Various rates, 7% declining balance to 20% |
|
| Total federal tax pools | 2,285.5 |
| |
| Additional Alberta tax pools | 8.6 |
| Various rates, 25% declining balance to 100% |
|
DD&A Expense and Impairment Charges
ARC records DD&A expense on its PP&E over the individual useful lives of the assets employing the unit of production method using proved plus probable reserves and associated estimated future development capital required for its crude oil and natural gas assets, and a straight-line method for its corporate administrative assets. Assets in the E&E phase are not amortized. For the three and twelve months ended December 31, 2015, ARC recorded DD&A expense prior to any impairment of $131.7 million and $595.8 million as compared to $176.4 million and $655.5 million for the three and twelve months ended December 31, 2014. The decrease in DD&A expense for the three months ended December 31, 2015 to $12.01 per boe compared to $16.25 per boe for the fourth quarter of 2014, as well as the decrease for the year ended December 31, 2015 to $14.30 per boe compared to $15.98 per boe for the same period of the prior year, reflects the effect of reduced costs of finding and development of reserves.
Impairment is recognized when the carrying value of an asset or group of assets exceeds its recoverable amount, defined as the higher of its value in use or fair value less costs of disposal. Any asset impairment that is recorded is recoverable to its original value less any associated DD&A expense should there be indicators that the recoverable amount of the asset has increased in value since the time of recording the initial impairment. ARC conducted tests of impairment in 2015 on all of its CGUs as a result of decreases in the outlook of future commodity prices compared to those at December
|
| | |
| ARC Resources Ltd. | Page 30 |
31, 2014 as well as, in some CGUs, negative technical reserve revisions in areas with little capital development activity in the current year and decreased fair values of undeveloped land.
For the three months ended December 31, 2015, impairment charges of $131.3 million ($103 million for the three months ended December 31, 2014) were recognized. The impairment charges recorded for the three months ended December 31, 2015 included impairment charges of $80 million due to a decline in expected future commodity prices and $51.3 million in relation to the disposition of non-core assets located in the Southeast Saskatchewan & Manitoba CGU. For the year ended December 31, 2015, impairment charges of $469.6 million ($103 million for the year ended December 31, 2014) were recognized on its Northern Alberta, Pembina, Redwater, Southern Alberta & Southwest Saskatchewan, and Southeast Saskatchewan & Manitoba CGUs. The impairment charges included $400 million due to a decline in expected future commodity prices and negative technical reserve revisions in some CGUs and $69.6 million in relation to the disposition of non-core assets located in the Southern Alberta & Southwest Saskatchewan and Southeast Saskatchewan & Manitoba CGUs.
The results of the impairment tests conducted during the year ended December 31, 2015 are sensitive to changes in any of the key Management judgments and estimates inherent in the calculations, such as a revision in reserves or resources, a change in forecast commodity prices, expected royalties, required future development expenditures or expected future production costs, which could decrease or increase the recoverable amounts of assets and result in additional impairment charges or recovery of impairment charges. For further information regarding the impairment charges for the year ended December 31, 2015, refer to Note 11 "Impairment" in the financial statements.
A breakdown of DD&A expense and impairment charges is summarized in Table 22:
Table 22 |
| | | | | | | | | | | | |
| | Three Months Ended | Twelve Months Ended |
| | December 31 | December 31 |
DD&A Expense and Impairment Charges ($ millions, except per boe amounts) | 2015 |
| 2014 |
| % Change |
| 2015 |
| 2014 |
| % Change |
|
| Depletion of oil and gas assets | 130.3 |
| 174.7 |
| (25 | ) | 589.7 |
| 649.2 |
| (9 | ) |
| Depreciation of administrative assets | 1.4 |
| 1.7 |
| (18 | ) | 6.1 |
| 6.3 |
| (3 | ) |
| Impairment charges | 131.3 |
| 103.0 |
| 27 |
| 469.6 |
| 103.0 |
| 356 |
|
| Total DD&A expense and impairment charges | 263.0 |
| 279.4 |
| (6 | ) | 1,065.4 |
| 758.5 |
| 40 |
|
| DD&A rate before impairment per boe | 12.01 |
| 16.25 |
| (26 | ) | 14.30 |
| 15.98 |
| (11 | ) |
| DD&A and impairment rate per boe | 23.97 |
| 25.74 |
| (7 | ) | 25.57 |
| 18.49 |
| 38 |
|
During the three and twelve months ended December 31, 2015, ARC recorded impairment charges on E&E assets of $nil and $46.9 million, respectively. Impairment of E&E assets are presented as part of E&E expenses in the statements of income.
Capital Expenditures, Acquisitions and Dispositions
Capital expenditures before acquisitions, dispositions or purchases of undeveloped land totaled $149.5 million in the fourth quarter of 2015 as compared to $249.3 million during the fourth quarter of 2014. This total includes development and production additions to PP&E of $137.4 million and additions to E&E assets of $12.1 million. PP&E expenditures include additions to oil and gas development and production assets and administrative assets. E&E expenditures include asset additions in areas that have been determined by Management to be in the E&E stage.
At the end of the fourth quarter of 2015, ARC divested of certain non-core crude oil assets located in Manitoba. The divested properties had production of approximately 1,300 boe per day, representing less than one per cent of ARC's 2015 proved plus probable oil and gas reserves.
|
| | |
| ARC Resources Ltd. | Page 31 |
A breakdown of capital expenditures, acquisitions and dispositions is shown in Table 23 and 23a:
Table 23 |
| | | | | | | | | | | | | | |
| | Three Months Ended December 31 |
| | 2015 | 2014 | |
Capital Expenditures ($ millions) | E&E |
| PP&E |
| Total |
| E&E |
| PP&E |
| Total |
| % Change |
|
| Geological and geophysical | 0.2 |
| 2.3 |
| 2.5 |
| — |
| 4.7 |
| 4.7 |
| (47 | ) |
| Drilling and completions | 11.1 |
| 97.4 |
| 108.5 |
| 2.5 |
| 161.9 |
| 164.4 |
| (34 | ) |
| Plant and facilities | 0.8 |
| 36.5 |
| 37.3 |
| 1.2 |
| 77.0 |
| 78.2 |
| (52 | ) |
| Administrative assets | — |
| 1.2 |
| 1.2 |
| — |
| 2.0 |
| 2.0 |
| (40 | ) |
| Total capital expenditures | 12.1 |
| 137.4 |
| 149.5 |
| 3.7 |
| 245.6 |
| 249.3 |
| (40 | ) |
| Undeveloped land | 1.5 |
| 3.1 |
| 4.6 |
| 0.6 |
| 17.4 |
| 18.0 |
| (74 | ) |
| Total capital expenditures including undeveloped land purchases | 13.6 |
| 140.5 |
| 154.1 |
| 4.3 |
| 263.0 |
| 267.3 |
| (42 | ) |
Acquisitions (1) | — |
| 0.3 |
| 0.3 |
| — |
| — |
| — |
| — |
|
Dispositions (2) | — |
| (42.2 | ) | (42.2 | ) | — |
| (2.4 | ) | (2.4 | ) | 1,658 |
|
| Total capital expenditures, land purchases and net dispositions | 13.6 |
| 98.6 |
| 112.2 |
| 4.3 |
| 260.6 |
| 264.9 |
| (58 | ) |
| |
| (1) | Excludes $0.9 million of non-cash petroleum and natural gas property transactions in the fourth quarter of 2015 ($4 million in the fourth quarter of 2014). |
| |
| (2) | Represents proceeds and adjustments to proceeds from divestitures. |
For the year ended December 31, 2015, capital expenditures before property acquisitions, dispositions or purchases of undeveloped land totaled $541.6 million as compared to $945.5 million during the same period of 2014. This total includes development and production additions to PP&E of $509.2 million and additions to E&E assets of $32.4 million.
Table 23a |
| | | | | | | | | | | | | | |
| | Twelve Months Ended December 31 |
| | 2015 | 2014 | |
Capital Expenditures ($ millions) | E&E |
| PP&E |
| Total |
| E&E |
| PP&E |
| Total |
| % Change |
|
| Geological and geophysical | 5.3 |
| 10.6 |
| 15.9 |
| 1.4 |
| 16.2 |
| 17.6 |
| (10 | ) |
| Drilling and completions | 26.0 |
| 335.2 |
| 361.2 |
| 30.8 |
| 629.2 |
| 660.0 |
| (45 | ) |
| Plant and facilities | 1.1 |
| 160.9 |
| 162.0 |
| 15.8 |
| 245.6 |
| 261.4 |
| (38 | ) |
| Administrative assets | — |
| 2.5 |
| 2.5 |
| — |
| 6.5 |
| 6.5 |
| (62 | ) |
| Total capital expenditures | 32.4 |
| 509.2 |
| 541.6 |
| 48.0 |
| 897.5 |
| 945.5 |
| (43 | ) |
| Undeveloped land | 1.5 |
| 5.2 |
| 6.7 |
| 1.4 |
| 60.9 |
| 62.3 |
| (89 | ) |
| Total capital expenditures including undeveloped land purchases | 33.9 |
| 514.4 |
| 548.3 |
| 49.4 |
| 958.4 |
| 1,007.8 |
| (46 | ) |
Acquisitions (1) | 14.1 |
| 0.3 |
| 14.4 |
| 1.8 |
| 71.7 |
| 73.5 |
| (80 | ) |
Dispositions (2) | (7.6 | ) | (81.2 | ) | (88.8 | ) | (1.8 | ) | (37.5 | ) | (39.3 | ) | 126 |
|
| Total capital expenditures, land purchases and net dispositions | 40.4 |
| 433.5 |
| 473.9 |
| 49.4 |
| 992.6 |
| 1,042.0 |
| (55 | ) |
| |
| (1) | Excludes $29.6 million of non-cash petroleum and natural gas property transactions in the year ended December 31, 2015 ($5.9 million in the year ended December 31, 2014). |
| |
| (2) | Represents proceeds and adjustments to proceeds from divestitures. |
During the year ended December 31, 2015, ARC has divested of certain non-core assets located in South Central Alberta, Southwestern Saskatchewan and Manitoba. In aggregate, the divested properties had associated production volumes of approximately 4,900 boe per day, which resulted in an annual volume impact of approximately 3,000 boe per day (approximately 40 per cent crude oil and liquids at time of divestments).
|
| | |
| ARC Resources Ltd. | Page 32 |
Asset Retirement Obligations and Reclamation Fund
At December 31, 2015, ARC has recorded ARO of $573.2 million ($616.1 million at December 31, 2014) for the future abandonment and reclamation of ARC’s properties. The estimated ARO includes assumptions in respect of actual costs to abandon wells or reclaim the property, the time frame in which such costs will be incurred, as well as annual inflation factors in order to calculate the undiscounted total future liability. The future liability has been discounted at a liability-specific risk-free interest rate of 2.2 per cent (2.3 per cent at December 31, 2014).
Accretion charges of $3.3 million and $13.4 million for the three and twelve months ended December 31, 2015 ($3.7 million and $14.9 million for 2014), respectively, have been recognized in the statements of income to reflect the increase in ARO associated with the passage of time. Actual spending under ARC’s abandonment and reclamation program for the three and twelve months ended December 31, 2015 was $4.2 million and $12.3 million ($8.7 million and $23 million for 2014), respectively. For the three and twelve months ended December 31, 2015, divestments related to certain non-core assets decreased ARO by $17 million and $81.7 million ($9.5 million and $38 million for 2014), respectively.
In 2005, ARC established a restricted reclamation fund to finance obligations specifically associated with its Redwater property. Minimum contributions to this fund will be approximately $60.8 million in total over the next 40 years. The balance of this fund totaled $34.3 million at December 31, 2015, compared to $35.2 million at December 31, 2014. Under the terms of ARC’s investment policy, cash in the reclamation fund can only be invested in certain securities and require a minimum credit rating for investments of A or higher.
Environmental stewardship is a core value at ARC and abandonment and reclamation activities continue to be made in a prudent, responsible manner with the oversight of the Health, Safety and Environment Committee of the Board. Ongoing abandonment expenditures for all of ARC’s assets are funded entirely out of cash flow from operating activities.
Capitalization, Financial Resources and Liquidity
A breakdown of ARC’s capital structure as at December 31, 2015 and 2014 is outlined in Table 24:
Table 24 |
| | | | |
Capital Structure and Liquidity ($ millions, except per cent and ratio amounts) | December 31, 2015 |
| December 31, 2014 |
|
Long-term debt (1) | 1,114.3 |
| 1,074.8 |
|
Working capital deficit (surplus) (2) | (129.2 | ) | 181.1 |
|
Net debt obligations (3) | 985.1 |
| 1,255.9 |
|
Market value of common shares (4) | 5,796.6 |
| 8,036.1 |
|
Total capitalization (3) | 6,781.7 |
| 9,292.0 |
|
| Net debt as a percentage of total capitalization | 14.5 |
| 13.5 |
|
Net debt to annualized funds from operations (3) | 1.3 |
| 1.1 |
|
| |
| (1) | Includes a current portion of long-term debt of $57.9 million at December 31, 2015 and $49.5 million at December 31, 2014. |
| |
| (2) | Working capital surplus or deficit is calculated as current assets less current liabilities as they appear on the consolidated balance sheets (the "balance sheets"), and excludes current unrealized amounts pertaining to risk management contracts, assets held for sale and ARO contained within liabilities associated with assets held for sale, as well as the current portion of long-term debt and current portion of ARO. |
| |
| (3) | Refer to the section entitled "Additional GAAP Measures” contained within this MD&A. |
| |
| (4) | Calculated using the total common shares outstanding at December 31, 2015 multiplied by the closing share price of $16.70 at December 31, 2015 (closing share price of $25.16 at December 31, 2014). |
At December 31, 2015, ARC had total available credit facilities of approximately $2.4 billion with debt of $1.1 billion currently outstanding. ARC’s long-term debt balance includes a current portion of $57.9 million at December 31, 2015 ($49.5 million at December 31, 2014), reflecting principal payments that are due to be paid within the next 12 months. ARC intends to finance these obligations by using cash on hand or drawing on its syndicated credit facility at the time the payments are due.
On October 26, 2015, ARC extended its syndicated revolving credit facility for one additional year until November 6, 2019 at existing terms.
In January 2015, ARC issued 17.9 million common shares for aggregate gross proceeds of $402.7 million (net proceeds of $386.1 million) on a bought deal basis. The proceeds from this offering were used to temporarily reduce bank indebtedness, increase working capital and to fund ongoing capital expenditure programs.
|
| | |
| ARC Resources Ltd. | Page 33 |
ARC’s debt agreements contain a number of covenants, all of which were met as at December 31, 2015. These agreements are available at www.sedar.com. ARC calculates its covenants four times annually. The major financial covenants are described below:
Table 25 |
| | |
| Covenant description | Estimated Position at December 31, 2015 (1) |
|
| Long-term debt and letters of credit not to exceed three and a quarter times trailing twelve month net income before non-cash items, income taxes and interest expense | 1.4 times |
|
| Long-term debt, letters of credit, and subordinated debt not to exceed four times trailing twelve month net income before non-cash items, income taxes and interest expense | 1.4 times |
|
| Long-term debt and letters of credit not to exceed 50 per cent of the book value of shareholders’ equity and long-term debt, letters of credit and subordinated debt | 30 | % |
| |
| (1) | Estimated position, subject to final approval. |
ARC intends to keep its net debt to less than two times annualized funds from operations during specific periods with a long-term strategy to keep its net debt balance to a ratio of between one and 1.5 times annualized funds from operations and less than 20 per cent of total capitalization. This strategy has resulted in manageable debt levels to date and has positioned ARC to remain well within its debt covenants. To respond to current commodity pricing levels, ARC has reduced its planned 2016 capital expenditure program to $390 million. Additionally, ARC has decided to reduce its dividend to $0.05 per share outstanding per month.
Exhibit 17
| |
| (1) | Refer to the section entitled "Additional GAAP Measures” contained within this MD&A. |
|
| | |
| ARC Resources Ltd. | Page 34 |
ARC typically uses three markets to raise capital: equity, bank debt and long-term notes. Long-term notes are issued to large institutional investors normally with an average term of five to 12 years. The cost of this debt is based upon two factors: the current rate of long-term government bonds and ARC’s credit spread. ARC’s weighted average interest rate on its outstanding long-term notes is currently 4.43 per cent.
Exhibit 18
Table 26
|
| | | | | | | | | | |
| Cash Inflows | 2015 |
| 2014 |
| 2013 |
| 2012 |
| 2011 |
|
Funds from operations (1) | 773.4 |
| 1,124.0 |
| 861.8 |
| 719.8 |
| 844.3 |
|
| DRIP & SDP | 195.5 |
| 151.0 |
| 130.1 |
| 116.3 |
| 105.8 |
|
| Equity issuance (net proceeds) | 386.1 |
| — |
| — |
| 330.7 |
| — |
|
Dispositions (2) | 88.8 |
| 39.3 |
| 89.8 |
| 4.1 |
| 168.4 |
|
| Cash Outflows | | | | | |
| Dividends declared | 410.5 |
| 380.2 |
| 374.0 |
| 357.4 |
| 344.0 |
|
Capital expenditures (3) | 547.9 |
| 1,007.6 |
| 874.2 |
| 607.7 |
| 728.1 |
|
Acquisitions (2) | 14.4 |
| 73.5 |
| 36.4 |
| 36.5 |
| 57.1 |
|
| |
| (1) | Refer to the sections entitled "Funds from Operations" and “Additional GAAP Measures” contained within this MD&A. |
| |
| (2) | Excludes non-cash property transactions. |
| |
| (3) | Excludes capital expenditures attributable to non-cash share options and asset retirement expenditures. |
|
| | |
| ARC Resources Ltd. | Page 35 |
Shareholders’ Equity
At December 31, 2015, there were 347.1 million shares outstanding, an increase of 27.7 million shares compared to December 31, 2014. During the first quarter of 2015, ARC issued 17.9 million shares for aggregate gross proceeds of $402.7 million. The remaining 9.8 million shares issued are attributable to those issued to participants in the DRIP and SDP.
At December 31, 2015, ARC had 3.2 million share options outstanding under its Share Option Plan, representing less than one per cent of outstanding shares, with a weighted average exercise price of $21.95 per share. These options vest in equal parts on the fourth and fifth anniversaries of the grant date. At December 31, 2015, approximately 0.2 million share options were exercisable with a weighted average exercise price of $21.41 per share.
At December 31, 2015, ARC had 93 thousand restricted shares outstanding under its Long-term Restricted Share Award Plan. These awards vest evenly on the eighth, ninth and tenth anniversaries of the grant date. For more information on the restricted shares outstanding and held in trust under ARC's LTRSA Plan, refer to the section entitled "Long-term Restricted Share Award Plan” contained within this MD&A.
Dividends
In the fourth quarter of 2015, ARC declared dividends totaling $103.8 million ($0.30 per share outstanding) compared to $95.7 million ($0.30 per share outstanding) during the fourth quarter of 2014. During the year ended December 31, 2015, ARC declared dividends totaling $410.5 million ($1.20 per share outstanding) compared to $380.2 million ($1.20 per share outstanding) during the year ended December 31, 2014.
As a dividend-paying corporation, ARC declares monthly dividends to its shareholders. ARC continually assesses dividend levels in light of commodity prices, capital expenditure programs, and production volumes to ensure that dividends are in line with the long-term strategy and objectives of ARC as per the following guidelines:
| |
| • | To maintain a dividend policy that, in normal times, in the opinion of Management and the Board, is sustainable after factoring in the impact of current commodity prices on funds from operations. ARC’s objective is to normalize the effect of volatility of commodity prices rather than to pass that volatility onto shareholders in the form of fluctuating monthly dividends. |
| |
| • | To maintain ARC’s financial flexibility, by reviewing ARC’s level of debt to equity and debt to funds from operations. The use of funds from operations and proceeds from equity offerings to fund capital development activities reduces the need to use debt to finance these expenditures. |
ARC is focused on value creation, with the dividend being a key component of its business strategy. As commodity prices have persistently decreased throughout 2015 and into 2016, ARC’s dividend as a percent of funds from operations has increased from an average of 34 per cent in 2014 to an average of 53 per cent in 2015. Based on ARC’s current forecast of its 2016 expected funds from operations, ARC believes that it is prudent to reduce its monthly dividend to $0.05 per share.
Exhibit 19
|
| | |
| ARC Resources Ltd. | Page 36 |
The actual amount of future monthly dividends is proposed by Management and is subject to the approval and discretion of the Board. The Board reviews future dividends in conjunction with their review of quarterly financial and operating results. Dividends are taxable to the shareholder irrespective of whether payment is received in cash or shares via the DRIP. In the case of shares issued via the SDP, dividends received are converted to a future capital gain to the recipient. Shareholders should consult their own tax advisors with respect to tax implications of dividends received in cash or via the DRIP or SDP in their particular circumstances.
On January 18, 2016, ARC confirmed that a dividend of $0.10 per common share designated as an eligible dividend will be paid on February 16, 2016 to shareholders of record on January 29, 2016 with an ex-dividend date of January 27, 2016.
Please refer to ARC’s website at www.arcresources.com for details of the estimated monthly dividend amounts and dividend dates for 2016.
Environmental Initiatives Impacting ARC
In the fourth quarter of 2015, the provincial government of Alberta released its Climate Leadership Plan which will impact all consumers and businesses that contribute to carbon emissions in Alberta. This plan includes imposing carbon pricing that is applied across all sectors, starting at $20 per tonne on January 1, 2017 and moving to $30 per tonne on January 1, 2018, the phase-out of coal-fired power generation by 2030, a cap on oil sands emissions production of 100 megatonnes, and a 45 per cent reduction in methane emissions by the oil and gas sector by 2025. ARC expects the Climate Leadership Plan to increase the cost of operating its properties located in Alberta and is currently evaluating the expected impact of this plan on its results of operations.
Contractual Obligations and Commitments
Table 27 discloses ARC's contractual obligations and commitments at December 31, 2015 and the associated minimum future payments:
Table 27 |
| | | | | | | | | | |
| | Payments Due by Period |
Contractual Obligations and Commitments ($ millions) |
1 Year |
|
2-3 Years |
|
4-5 Years |
| Beyond 5 Years |
|
Total |
|
Debt repayments (1) | 57.9 |
| 134.8 |
| 240.5 |
| 681.1 |
| 1,114.3 |
|
Interest payments (2) | 48.0 |
| 86.6 |
| 70.3 |
| 71.5 |
| 276.4 |
|
Reclamation fund contributions (3) | 3.3 |
| 6.2 |
| 5.7 |
| 45.6 |
| 60.8 |
|
| Purchase commitments | 57.1 |
| 22.6 |
| 8.6 |
| 5.4 |
| 93.7 |
|
| Transportation commitments | 84.5 |
| 166.1 |
| 112.0 |
| 290.5 |
| 653.1 |
|
| Operating leases | 15.5 |
| 29.6 |
| 27.4 |
| 45.1 |
| 117.6 |
|
Risk management contract premiums (4) | 4.5 |
| 5.8 |
| 0.5 |
| — |
| 10.8 |
|
| Total contractual obligations and commitments | 270.8 |
| 451.7 |
| 465.0 |
| 1,139.2 |
| 2,326.7 |
|
| |
| (1) | Long-term and current portion of long-term debt. |
| |
| (2) | Fixed interest payments on senior notes. |
| |
| (3) | Contribution commitments to a restricted reclamation fund associated with the Redwater property. |
| |
| (4) | Fixed premiums to be paid in future periods on certain commodity price risk management contracts. |
In addition to the above risk management contract premiums, ARC has commitments related to its risk management program (see Note 16). As the premiums are related to the underlying risk management contract, they have been recorded at fair market value at December 31, 2015 on the balance sheet as part of risk management contracts.
During the year ended December 31, 2015, ARC increased its transportation commitments by approximately $73.9 million from those presented at December 31, 2014. The increase relates to additional firm natural gas transportation that ARC committed to support the movement of ARC's future natural gas production.
ARC enters into commitments for capital expenditures in advance of the expenditures being made. At a given point in time, it is estimated that ARC has committed to capital expenditures equal to approximately one quarter of its capital budget by means of giving the necessary authorizations to incur the capital expenditures in a future period.
ARC is involved in litigation and claims arising in the normal course of operations. Management is of the opinion that pending litigation will not have a material impact on ARC’s financial position or results of operations and therefore Table 27 does not include any commitments for outstanding litigation and claims.
|
| | |
| ARC Resources Ltd. | Page 37 |
Off-Balance Sheet Arrangements
ARC has certain lease agreements, all of which are reflected in the Contractual Obligations and Commitments table (Table 27), which were entered into in the normal course of operations. All leases have been treated as operating leases whereby the lease payments are included in operating expenses or G&A expenses depending on the nature of the lease. No asset or liability value has been assigned to these leases on the balance sheet as of December 31, 2015.
Related Parties
Interest in Partnership
ARC owns a 99.99% interest in the ARC Resources General Partnership. The other 0.01% of the partnership is owned by 1504793 Alberta Ltd, a 100% owned subsidiary of ARC. ARC’s oil and gas properties are owned and administered by the partnership. ARC is also the sole beneficiary of the Redwater A&R Trust, which administers the reclamation fund on ARC’s behalf.
Key Management Personnel Compensation
ARC has determined that the key management personnel of ARC consists of its officers and directors. Short-term benefits are comprised of salaries and directors' fees, annual bonuses, and other benefits. In addition, the Company provides share-based compensation to its key management personnel under the RSU and PSU, DSU, LTRSA and Share Option Plans. The compensation expense included in G&A expenses relating to key management personnel for the year is as follows:
Table 28
|
| | | | | |
| | Year Ended December 31, 2015 |
| | Year Ended December 31, 2014 |
|
| Short-term benefits | 7.2 |
| | 8.0 |
|
| Share-based compensation | 1.6 |
| | 15.6 |
|
| Total key management personnel compensation | 8.8 |
| | 23.6 |
|
Critical Accounting Estimates
ARC has continuously refined and documented its management and internal reporting systems to ensure that accurate, timely, internal and external information is gathered and disseminated.
ARC’s financial and operating results incorporate certain estimates including:
| |
| • | estimated revenues, royalties and operating expenses on production as at a specific reporting date but for which actual revenues and costs have not yet been received; |
| |
| • | estimated capital expenditures on projects that are in progress; |
| |
| • | estimated DD&A charges that are based on estimates of oil and gas reserves that ARC expects to recover in the future; |
| |
| • | estimated fair values of financial instruments that are subject to fluctuation depending upon the underlying commodity prices, foreign exchange rates and interest rates, volatility curves and the risk of non-performance; |
| |
| • | estimated value of asset retirement obligations that are dependent upon estimates of future costs and timing of expenditures; |
| |
| • | estimated future recoverable value of PP&E, E&E and goodwill and any associated impairment charges or recoveries; and |
| |
| • | estimated compensation expense under ARC’s share-based compensation plans including the PSUs awarded under the RSU and PSU Plan that is based on an adjustment to the final number of PSU awards that eventually vest based on a performance multiplier, the Share Option Plan and the LTRSA Plan. |
ARC has hired individuals and consultants who have the skills required to make such estimates and ensures that individuals or departments with the most knowledge of the activity are responsible for the estimates. Further, past estimates are reviewed and compared to actual results, and actual results are compared to budgets in order to make more informed decisions on future estimates. For further information on the determination of certain estimates inherent
|
| | |
| ARC Resources Ltd. | Page 38 |
in the financial statements, refer to Note 5 “Management Judgments and Estimation Uncertainty” and Note 11 "Impairment" in the financial statements.
ARC’s leadership team’s mandate includes ongoing development of procedures, standards and systems to allow ARC staff to make the best decisions possible and ensuring those decisions are in compliance with ARC’s environmental, health and safety policies.
ASSESSMENT OF BUSINESS RISKS
The ARC management team is focused on long-term strategic planning and has identified the key risks, uncertainties and opportunities associated with ARC’s business that can impact the financial results. They include, but are not limited to:
Volatility of Oil and Natural Gas Prices
ARC’s operational results and financial condition, and therefore the amount of capital expenditures and future dividend payments made to shareholders, are dependent on the prices received for crude oil and natural gas production. Decreasing crude oil and natural gas prices will reduce ARC’s cash flow, impacting ARC’s level of capital expenditures and may result in the shut-in of certain producing properties. Differentials on Canadian crude oil have also shown significant volatility throughout recent years due to pipeline and infrastructure constraints. Any movement in crude oil and natural gas prices will have an effect on ARC’s ability to continue with its capital expenditure program and its ability to pay dividends. Future declines in crude oil and natural gas prices may result in future declines in, or elimination of, any future dividends. Crude oil and natural gas prices are determined by economic and, in some circumstances, political factors. Supply and demand factors, including weather and general economic conditions as well as conditions in other crude oil and natural gas regions, impact prices. ARC may manage the risk associated with changes in commodity prices by entering into crude oil or natural gas price derivative contracts. If ARC engages in activities to manage its commodity price exposure, it may forego the benefits it would otherwise experience if commodity prices were to increase. In addition, commodity derivative contracts activities could expose ARC to losses. To the extent that ARC engages in risk management activities related to commodity prices, it will be subject to credit risks associated with counterparties with which it contracts.
Refinancing and Debt Service
ARC currently has a $1 billion financial covenant-based syndicated credit facility with 12 banks. At the request of ARC, the lenders will review the credit facility each year and determine if they will extend for another year. In the event that the facility is not extended before November 6, 2019, indebtedness under the facility will become repayable at that date. There is also a risk that the credit facility will not be renewed for the same amount or on the same terms. Any of these events could affect ARC’s ability to fund ongoing operations and make future dividend payments.
ARC currently has $1,114.3 million of long-term, fixed interest rate debt outstanding which requires principal repayments in 2016 through 2026. ARC intends to fund these principal repayments with existing credit facilities. In the event ARC is unable to fund future principal repayments, it may impact ARC’s ability to fund its ongoing operations and make future dividend payments.
ARC is required to comply with covenants under the credit facility. In the event that ARC does not comply with covenants under the credit facility, ARC’s access to capital could be restricted or repayment could be required. ARC routinely reviews the covenants based on actual and forecast results and has the ability to make changes to its development plans and/or dividend policy to comply with covenants under the credit facility. If ARC becomes unable to pay its debt service charges or otherwise commits an event of default such as bankruptcy, the lender may foreclose on such assets of ARC or sell the working interests.
Access to Capital Markets
ARC's capital expenditures are financed from funds from operations, borrowings, proceeds from property divestments and possible future equity issuances. ARC's ability to issue equity is dependent upon, among other factors, the overall state of capital markets and investor appetite for investments in the energy industry and ARC securities. Further, if revenues or reserves decline ARC may not have access to the capital necessary to undertake or complete future drilling programs.
|
| | |
| ARC Resources Ltd. | Page 39 |
Additionally, ARC may issue additional common shares from treasury at prices which may result in a decline in production per common share and reserves per common share.
To the extent that external sources of capital become limited or unavailable or available on onerous terms, ARC's ability to make capital investments and maintain or expand existing assets and reserves may be impaired and ARC's assets, liabilities, business, financial condition, results of operations and dividend payments may be materially or adversely affected as a result.
Retention of Key Personnel
A loss in the key personnel of ARC could delay the completion of certain projects or otherwise have a material adverse effect on the Company. Shareholders are dependent on ARC's management and staff in respect of the administration and management of all manners relating to ARC's assets. Any deterioration of ARC's corporate culture could adversely affect ARC's long-term success.
Operational Matters
The operation of oil and gas wells involves a number of operating and natural hazards that may result in blowouts, environmental damage and other unexpected or dangerous conditions resulting in damage to operating subsidiaries of ARC and possible liability to third parties. ARC maintains liability insurance, where available, in amounts consistent with industry standards. Business interruption insurance may also be purchased for selected facilities, to the extent that such insurance is available. ARC may become liable for damages arising from such events against which it cannot insure or against which it may elect not to insure because of high premium costs or other reasons. Costs incurred to repair such damage or pay such liabilities may reduce dividend payments to shareholders.
Continuing production from a property, and to some extent the marketing of production therefrom, are largely dependent upon the ability of the operator of the property. Approximately nine per cent of ARC’s production is operated by third parties. ARC has limited ability to influence costs on partner operated properties. Operating costs on most properties operated by third parties have increased steadily over recent years. To the extent the operator fails to perform these functions properly, ARC’s revenue from such property may be reduced. Payments from production generally flow through the operator and there is a risk of delayed payment, or non-payment and additional expense in recovering such revenues if the operator becomes insolvent. To mitigate this risk, all significant non-operated production is taken in kind and marketed by ARC. Although satisfactory title reviews are generally conducted in accordance with industry standards, such reviews do not guarantee or certify that a defect in the chain of title may not arise to defeat the claim of ARC to certain properties. A reduction of future dividend payments to shareholders could result under such circumstances.
Reserves and Resources Estimates
The reserves and recovery information contained in ARC’s independent reserves evaluation is only an estimate. Likewise, information contained in ARC's Independent Resources Evaluation for its lands in the northeast British Columbia Montney region, including lands at Pouce Coupe, Alberta, is also only an estimate. The actual production and ultimate reserves and resources from the properties may be greater or less than the estimates prepared by the independent reserves evaluator. The reserves and resources reports have been prepared using certain commodity price assumptions. If lower prices for crude oil, natural gas, condensate and NGLs are realized by ARC and substituted for the price assumptions utilized in those reserves and resources reports, the present value of estimated future net cash flows for ARC’s reserves and resources as well as the amount of ARC’s reserves and resources would be reduced and the reduction could be significant.
Depletion of Reserves and Maintenance of Dividend
ARC’s future crude oil and natural gas reserves and production, and therefore its cash flows, will be highly dependent on ARC’s success in exploiting its reserves base and acquiring additional reserves. Without reserves additions through acquisition or development activities, ARC’s reserves and production will decline over time as the oil and natural gas reserves are produced out. There can be no assurance that ARC will make sufficient capital expenditures to maintain production at current levels nor, as a consequence, that the amount of dividends by ARC to shareholders can be maintained at current levels. There can be no assurance that ARC will be successful in developing or acquiring additional reserves on terms that meet ARC’s investment objectives.
Counterparty Risk
ARC assumes customer credit risk associated with oil and gas sales, financial hedging transactions and joint arrangement participants. In the event that ARC’s counterparties default on payments to ARC, cash flows will be impacted and dividend payments to shareholders may be impacted. ARC has established credit policies and controls designed to mitigate the risk of default or non-payment with respect to oil and gas sales, financial hedging transactions and joint arrangement
|
| | |
| ARC Resources Ltd. | Page 40 |
participants. A diversified sales customer base is maintained and exposure to individual entities is reviewed on a regular basis.
Variations in Interest Rates and Foreign Exchange Rates
Variations in interest rates could result in an increase in the amount ARC pays to service debt. World oil prices are quoted in US dollars and the price received by Canadian producers is therefore affected by the Canadian/US dollar exchange rate that may fluctuate over time. A material increase in the value of the Canadian dollar may negatively impact ARC’s net production revenue. Volatility in interest rates and the Canadian dollar may affect future cash flow from operations and reduce funds available for both dividends and capital expenditures. ARC may initiate certain derivative contracts to attempt to mitigate these risks. To the extent that ARC engages in risk management activities related to foreign exchange rates, it will be subject to credit risk associated with counterparties with which it contracts. An increase in Canadian/US exchange rates may impact future dividend payments to shareholders and the value of ARC’s reserves as determined by independent evaluators.
Changes in Income Tax Legislation
In the future, income tax laws or other laws may be changed or interpreted in a manner that adversely affects ARC or its shareholders. Tax authorities having jurisdiction over ARC or its shareholders may disagree with how ARC calculates its income for tax purposes to the detriment of ARC and its shareholders.
Changes in Government Royalty Legislation
Provincial programs related to the crude oil and natural gas industry may change in a manner that adversely impacts shareholders. ARC currently operates in British Columbia, Alberta and Saskatchewan, all of which have different royalty programs that could be revised at any time. Future amendments to royalty programs in any of ARC’s operating jurisdictions could result in reduced cash flow and reduced dividend payments to shareholders.
In 2016, the provincial government of Alberta announced the key highlights of a proposed Modernized Royalty Framework ("MRF") that will be effective on January 1, 2017. The MRF is discussed in this MD&A under the heading "Royalties." The changes are not expected to have a material impact on ARC's results of operations and ARC will evaluate the impact of the MRF on the Company’s expected results of operations and cash flows as more details are released.
Environmental Concerns and Changes in Environmental Legislation
The oil and natural gas industry is subject to environmental regulation pursuant to local, provincial and federal legislation. A breach of such legislation may result in the imposition of fines or issuance of clean-up orders in respect of ARC or its working interests. Such legislation may be changed to impose higher standards and potentially more costly obligations to ARC. Furthermore, Management believes the federal government appears to favor new programs for environmental laws and regulation, particularly in relation to the reduction of emissions, and there is no assurance that any such programs, laws or regulations, if proposed and enacted, will not contain emission reduction targets which ARC cannot meet. Financial penalties or charges could be incurred as a result of the failure to meet such targets. In particular there is uncertainty regarding the Federal Government’s Regulatory Framework for Air Emissions (“Framework”), as issued under the Canadian Environmental Protection Act.
In the fourth quarter of 2015, the provincial government of Alberta released its Climate Leadership Plan which will impact all consumers and businesses that contribute to carbon emissions in Alberta. The Climate Leadership Plan is discussed in this MD&A under the heading "Environmental Initiatives Impacting ARC."
The use of fracture stimulations has been ongoing safely in an environmentally responsible manner in western Canada for decades. With the increase in the use of fracture stimulations in horizontal wells there is increased communication between the oil and natural gas industry and a wider variety of stakeholders regarding the responsible use of this technology. This increased attention to fracture stimulations may result in increased regulation or changes of law which may make the conduct of ARC’s business more expensive or prevent ARC from conducting its business as currently conducted. ARC focuses on conducting its operations in a safe, responsible and transparent manner in the communities in which its people live and work.
Acquisitions
The price paid for acquisitions is based on engineering and economic estimates of the potential reserves made by independent engineers modified to reflect the technical views of Management. These assessments include a number of material assumptions regarding such factors as recoverability and marketability of crude oil, natural gas, condensate and NGLs, future prices of crude oil, natural gas, condensate and NGLs, and operating costs, future capital expenditures and royalties and other government levies that will be imposed over the producing life of the reserves. Many of these
|
| | |
| ARC Resources Ltd. | Page 41 |
factors are subject to change and are beyond the control of the operators of the working interests, Management and ARC. In particular, changes in the prices of and markets for crude oil, natural gas, condensate and NGLs from those anticipated at the time of making such assessments will affect the amount of future dividends and the value of the shares. In addition, all such estimates involve a measure of geological and engineering uncertainty that could result in lower production and reserves than attributed to the working interests. Actual reserves could vary materially from these estimates. Consequently, the reserves acquired may be less than expected, which could adversely impact cash flow and dividends to shareholders.
PROJECT RISKS
ARC manages a variety of small and large projects and plans to continue with the development of several capital projects throughout 2016. Project delays may impact expected revenues from operations. Significant project cost overruns could make a project uneconomic. ARC's ability to execute projects and market oil and natural gas depends upon numerous factors beyond its control, including:
| |
| • | availability of processing capacity; |
| |
| • | availability and proximity of pipeline capacity; |
| |
| • | availability of storage capacity; |
| |
| • | supply of and demand for oil and natural gas; |
| |
| • | availability of alternative fuel sources; |
| |
| • | effects of inclement weather; |
| |
| • | availability of drilling and related equipment; |
| |
| • | unexpected cost increases; |
| |
| • | changes in regulations; and |
| |
| • | availability and productivity of skilled labour. |
Because of these factors, ARC could be unable to execute projects on time, on budget or at all, and may not be able to effectively market the oil and natural gas that ARC produces.
CONTROL ENVIRONMENT
Disclosure Controls and Procedures
As of December 31, 2015, an internal evaluation was carried out of the effectiveness of ARC’s disclosure controls and procedures as defined in Rule 13a-15 under the US Securities Exchange Act of 1934 and as defined in Canada by National Instrument 52-109, Certification of Disclosure in Issuers’ Annual and Interim Filings. Based on that evaluation, the President and Chief Executive Officer and the Senior Vice President and Chief Financial Officer concluded that the disclosure controls and procedures are effective to ensure that the information required to be disclosed in the reports that ARC files or submits under the Exchange Act or under Canadian Securities legislation is recorded, processed, summarized and reported, within the time periods specified in the rules and forms therein. Disclosure controls and procedures include, without limitation, controls and procedures designed to ensure that the information required to be disclosed by ARC in the reports that it files or submits under the Exchange Act or under Canadian Securities Legislation is accumulated and communicated to ARC’s Management, including the senior executive and financial officers, as appropriate to allow timely decisions regarding the required disclosure.
Internal Control over Financial Reporting
Internal control over financial reporting is a process designed to provide reasonable assurance that all assets are safeguarded, transactions are appropriately authorized and to facilitate the preparation of relevant, reliable and timely information. Because of its inherent limitations, internal control over financial reporting may not prevent or detect misstatements. Management has assessed the effectiveness of ARC’s internal control over financial reporting as defined
|
| | |
| ARC Resources Ltd. | Page 42 |
in Rule 13a-15 under the US Securities Exchange Act of 1934 and as defined in Canada by National Instrument 52-109, Certification of Disclosure in Issuers’ Annual and Interim Filings. The assessment was based on the framework in Internal Control - Integrated Framework (2013) issued by the Committee of Sponsoring Organizations of the Treadway Commission. Management concluded that ARC’s internal control over financial reporting was effective as of December 31, 2015. The effectiveness of ARC’s internal control over financial reporting as of December 31, 2015 has been audited by Deloitte LLP, as reflected in their report for 2015. No changes were made to ARC’s internal control over financial reporting during the year ended December 31, 2015 that have materially affected, or are reasonably likely to materially affect, the internal controls over financial reporting.
FINANCIAL REPORTING UPDATE
Future Accounting Policy Changes
In May 2014, the IASB issued IFRS 15 Revenue from Contracts with Customers, which replaces International Accounting Standard ("IAS") 18 Revenue, IAS 11 Construction Contracts, and related interpretations. The standard is required to be adopted either retrospectively or using a modified transition approach for fiscal years beginning on or after January 1, 2018, with earlier adoption permitted. IFRS 15 will be applied by ARC on January 1, 2018 and the Company is currently evaluating the impact of the standard on ARC's financial statements.
In July 2014, the IASB completed the final elements of IFRS 9 Financial Instruments. The standard supersedes earlier versions of IFRS 9 and completes the IASB’s project to replace IAS 39 Financial Instruments: Recognition and Measurement. IFRS 9, as amended, includes a principle-based approach for classification and measurement of financial assets, a single 'expected loss’ impairment model and a substantially-reformed approach to hedge accounting. The standard will come into effect for annual periods beginning on or after January 1, 2018, with earlier adoption permitted. IFRS 9 will be applied on a retrospective basis by ARC on January 1, 2018 and the Company is currently evaluating the impact of the standard on ARC's financial statements.
In January 2016, the IASB issued IFRS 16 Leases, which replaces IAS 17 Leases. For lessees applying IFRS 16, a single recognition and measurement model for leases would apply, with required recognition of assets and liabilities for most leases. The standard will come into effect for annual periods beginning on or after January 1, 2019, with earlier adoption permitted if the entity is also applying IFRS 15 Revenue from Contracts with Customers. IFRS 16 will be applied by ARC on January 1, 2019 and the Company is currently evaluating the impact of the standard on ARC's financial statements.
Non-GAAP Measures
Throughout this MD&A, the company uses the terms operating netback (“netback”) and total return to analyze financial and operating performance. These non-GAAP measures as presented do not have any standardized meaning prescribed by GAAP and therefore may not be comparable with the calculation of similar measures for other entities. Management feels that these non-GAAP measures are key industry benchmarks and measures of performance for ARC and provide investors with information that is commonly used by other oil and gas companies.
Netback
Netback is a common non-GAAP metric used in the oil and gas industry. This measurement assists Management and
investors in evaluating operating results on a per boe basis to better analyze performance on a comparable basis. A calculation of netback is disclosed in Table 16 within this MD&A.
Total return
Total return is a non-GAAP measure that assists Management and investors in evaluating the Company's performance and rate of return on a per share basis. A calculation of total return is disclosed in Table 1 within this MD&A.
Additional GAAP Measures
All additional GAAP Measures described below do not have a standardized meaning prescribed by GAAP and therefore may not be comparable with the calculation of similar measures for other entities.
Funds from Operations
Funds from operations is defined as net income excluding the impact of non-cash DD&A and impairment charges, accretion of ARO, E&E expense, deferred tax expense and recovery, unrealized gains and losses on risk management contracts, unrealized gains and losses on foreign exchange, gains on disposal of petroleum and natural gas properties, unrealized gains and losses on short-term investments, non-cash lease inducement charges, share-based compensation
|
| | |
| ARC Resources Ltd. | Page 43 |
expense, and is further adjusted to include any portion of unrealized gains and losses on risk management contracts settled annually that relate to current period production. Funds from operations per share is calculated as funds from operations divided by the number of weighted average diluted shares. Refer to the reconciliation of funds from operations disclosed in Table 6 within this MD&A and Note 15 "Capital Management" of the financial statements as at and for the years ended December 31, 2015 and 2014. ARC considers funds from operations to be a key measure of operating performance as it demonstrates ARC’s ability to generate the necessary funds to fund future growth through capital investment and to repay debt. Management believes that such a measure provides a better assessment of ARC’s operations on a continuing basis by eliminating certain non-cash charges and charges that are nonrecurring, while respecting that certain risk management contracts that are settled on an annual basis are intended to protect prices on product sales occurring throughout the year. From a business perspective, the most directly comparable measure of funds from operations calculated in accordance with GAAP is net income.
Net Debt
Net debt is defined as long-term debt, including the current portion of long-term debt, plus working capital surplus or deficit. Working capital surplus or deficit is calculated as current assets less current liabilities as they appear on the balance sheets, and excludes current unrealized amounts pertaining to risk management contracts, assets held for sale, ARO contained within liabilities associated with assets held for sale, the current portion of long-term debt and current portion of ARO. Refer to the reconciliation of net debt disclosed in Table 24 within this MD&A and Note 15 "Capital Management" of the financial statements. Net debt is used by Management as a key measure to assess the Company's liquidity.
Total Capitalization
Total capitalization is defined as total shares outstanding multiplied by the closing share price on the Toronto Stock Exchange plus net debt outstanding. Refer to the reconciliation of total capitalization disclosed in Table 24 within this MD&A and Note 15 "Capital Management" of the financial statements. Total capitalization is used by Management and ARC's investors in analyzing the Company's balance sheet strength and liquidity.
Forward-looking Information and Statements
This MD&A contains certain forward-looking information and statements within the meaning of applicable securities laws. The use of any of the words "expect," "anticipate," "continue," "estimate," "objective," "ongoing," "may," "will," "project," "should," "believe," "plans," "intends," "strategy," and similar expressions are intended to identify forward-looking information or statements. In particular, but without limiting the foregoing, this MD&A contains forward-looking information and statements pertaining to the following: ARC’s financial goals under the heading “About ARC Resources Ltd.," ARC’s view of future crude oil, natural gas, condensate and NGLs pricing under the heading “Economic Environment,” ARC’s guidance for 2016 and the re-evaluation of 2016 capital spending under the heading “Annual Guidance and Financial Highlights,” ARC’s risk management plans for 2016 and beyond under the heading “Risk Management,” ARC's view on the impact of the government of Alberta's recently announced Modernized Royalty Framework ("MRF") on ARC's results of operations under the heading "Royalties," ARC’s view as to the estimated future payments under the RSU and PSU Plan under the heading “Share-Based Compensation Plans – Restricted Share Unit and Performance Share Unit Plan, Share Option Plan, Deferred Share Unit Plan, and Long-term Restricted Share Award Plan,” the financing information relating to raising capital under the heading "Capitalization, Financial Resources and Liquidity," ARC's plans in relation to future dividend levels under the heading "Dividends," ARC’s estimates of normal course obligations under the heading “Contractual Obligations and Commitments,” and a number of other matters, including the amount of future asset retirement obligations, future liquidity and financial capacity, future results from operations and operating metrics, future costs, expenses and royalty rates, future interest costs, and future development, exploration, acquisition and development activities (including drilling plans) and related capital expenditures.
The forward-looking information and statements contained in this MD&A reflect several material factors and expectations and assumptions of ARC including, without limitation: that ARC will continue to conduct its operations in a manner consistent with past operations; the general continuance of current industry conditions; the continuance of existing (and in certain circumstances, the implementation of proposed) tax, royalty and regulatory regimes; the accuracy of the estimates of ARC's reserves and resource volumes; certain commodity price and other cost assumptions; and the continued availability of adequate debt and equity financing and funds from operations to fund its planned expenditures. ARC believes the material factors, expectations and assumptions reflected in the forward-looking information and statements are reasonable, but no assurance can be given that these factors, expectations and assumptions will prove to be correct.
The forward-looking information and statements included in this MD&A are not guarantees of future performance and should not be unduly relied upon. Such information and statements involve known and unknown risks, uncertainties and other factors that may cause actual results or events to differ materially from those anticipated in such forward-looking information or statements including, without limitation: changes in commodity prices; changes in the demand for or
|
| | |
| ARC Resources Ltd. | Page 44 |
supply of ARC's products; unanticipated operating results or production declines; changes in tax or environmental laws, royalty rates or other regulatory matters; changes in development plans of ARC or by third-party operators of ARC's properties, increased debt levels or debt service requirements; inaccurate estimation of ARC's oil and gas reserve and resource volumes; limited, unfavorable or a lack of access to capital markets; increased costs; a lack of adequate insurance coverage; the impact of competitors; and certain other risks detailed from time to time in ARC's public disclosure documents (including, without limitation, those risks identified in this MD&A and in ARC's Annual Information Form).
The forward-looking information and statements contained in this MD&A speak only as of the date of this MD&A, and none of ARC or its subsidiaries assumes any obligation to publicly update or revise them to reflect new events or circumstances, except as may be required pursuant to applicable laws.
|
| | |
| ARC Resources Ltd. | Page 45 |
GLOSSARY
The following is a list of abbreviations that may be used in this MD&A:
Measurement
bbl barrel
bbl/d barrels per day
Mbbls thousand barrels
MMbbls million barrels
boe (1) barrels of oil equivalent
boe/d (1) barrels of oil equivalent per day
Mboe (1) thousands of barrels of oil equivalent
MMboe (1) millions of barrels of oil equivalent
Mcf thousand cubic feet
Mcf/d thousand cubic feet per day
MMcf million cubic feet
MMcf/d million cubic feet per day
Bcf billion cubic feet
MMbtu million British Thermal Units
GJ gigajoule
(1) Where applicable in this MD&A natural gas has been converted to boe based on a conversion ratio of six Mcf to one bbl. The boe rate is based on an energy equivalent conversion method primarily applicable at the burner tip. Given that the value ratio based on the current price of crude oil as compared to natural gas is significantly different than the energy equivalency of the conversion ratio, utilizing a conversion ratio of 6:1 may be misleading as an indication of value.
Financial and Business Environment
ARO asset retirement obligations
CGU cash-generating unit
DD&A depletion, depreciation and amortization
DRIP Dividend Reinvestment Program
DSU Deferred Share Unit
E&E exploration and evaluation
GAAP generally accepted accounting principles
G&A general and administrative
IASB International Accounting Standards Board
IFRS International Financial Reporting Standards
LTRSA Long-term Restricted Share Award
MSW Mixed Sweet Blend
NGLs natural gas liquids
NYMEX New York Mercantile Exchange
PP&E property, plant and equipment
PSU Performance Share Unit
RSU Restricted Share Unit
SDP Stock Dividend Program
WTI West Texas Intermediate
|
| | |
| ARC Resources Ltd. | Page 46 |
ANNUAL HISTORICAL REVIEW |
| | | | | | | | | | |
| For the year ended December 31 | | | | | |
| ($ millions, except per share amounts) | 2015 | 2014 | 2013 | 2012 | 2011 |
| FINANCIAL | | | | | |
| Sales of crude oil, natural gas, condensate and NGLs | 1,193.7 |
| 2,107.7 |
| 1,624.3 |
| 1,389.4 |
| 1,438.2 |
|
| Per share, basic | 3.51 |
| 6.66 |
| 5.21 |
| 4.67 |
| 5.02 |
|
| Per share, diluted | 3.51 |
| 6.64 |
| 5.21 |
| 4.67 |
| 5.02 |
|
Funds from operations (1) | 773.4 |
| 1,124.0 |
| 861.8 |
| 719.8 |
| 844.3 |
|
| Per share, basic | 2.27 |
| 3.55 |
| 2.77 |
| 2.42 |
| 2.95 |
|
| Per share, diluted | 2.27 |
| 3.54 |
| 2.76 |
| 2.42 |
| 2.95 |
|
| Net income (loss) and comprehensive income (loss) | (342.6 | ) | 380.8 |
| 240.7 |
| 139.2 |
| 287.0 |
|
| Per share, basic | (1.01 | ) | 1.20 |
| 0.77 |
| 0.47 |
| 1.00 |
|
| Per share, diluted | (1.01 | ) | 1.20 |
| 0.77 |
| 0.47 |
| 1.00 |
|
| Dividends declared | 410.5 |
| 380.2 |
| 374.0 |
| 357.4 |
| 344.0 |
|
Per share (2) | 1.20 |
| 1.20 |
| 1.20 |
| 1.20 |
| 1.20 |
|
| Total assets | 5,932.2 |
| 6,325.5 |
| 5,736.0 |
| 5,627.1 |
| 5,323.9 |
|
| Total liabilities | 2,543.7 |
| 2,773.7 |
| 2,339.9 |
| 2,230.4 |
| 2,162.1 |
|
Net debt outstanding (3) | 985.1 |
| 1,255.9 |
| 1,011.5 |
| 745.6 |
| 909.7 |
|
| Weighted average shares outstanding | 340.5 |
| 316.6 |
| 311.5 |
| 297.2 |
| 286.6 |
|
| Weighted average shares outstanding, diluted | 340.5 |
| 317.2 |
| 311.9 |
| 297.2 |
| 286.6 |
|
| Shares outstanding, end of period | 347.1 |
| 319.4 |
| 314.1 |
| 308.9 |
| 288.9 |
|
| CAPITAL EXPENDITURES |
|
|
|
|
|
| Geological and geophysical | 15.9 |
| 17.6 |
| 19.2 |
| 31.8 |
| 25.9 |
|
| Drilling and completions | 361.2 |
| 660.0 |
| 568.4 |
| 429.8 |
| 456.5 |
|
| Plant and facilities | 162.0 |
| 261.4 |
| 267.7 |
| 131.6 |
| 165.1 |
|
| Other | 2.5 |
| 6.5 |
| 4.6 |
| 5.3 |
| 3.6 |
|
| Total capital expenditures | 541.6 |
| 945.5 |
| 859.9 |
| 598.5 |
| 651.1 |
|
| Undeveloped land purchased at Crown land sales | 6.7 |
| 62.3 |
| 14.3 |
| 9.5 |
| 74.9 |
|
| Total capital expenditures including undeveloped land purchases | 548.3 |
| 1,007.8 |
| 874.2 |
| 608.0 |
| 726.0 |
|
| Acquisitions | 14.4 |
| 73.5 |
| 36.4 |
| 36.5 |
| 57.1 |
|
| Dispositions | (88.8 | ) | (39.3 | ) | (89.8 | ) | (4.1 | ) | (168.4 | ) |
| Total capital expenditures and net acquisitions | 473.9 |
| 1,042.0 |
| 820.8 |
| 640.4 |
| 614.7 |
|
| OPERATING |
|
|
|
|
|
| Production |
|
|
|
|
|
|
|
|
|
|
| Crude oil (bbl/d) | 32,762 |
| 36,525 |
| 32,784 |
| 31,454 |
| 27,158 |
|
| Condensate (bbl/d) | 3,430 |
| 3,667 |
| 2,251 |
| 2,217 |
| 2,052 |
|
| Natural gas (MMcf/d) | 444.9 |
| 406.1 |
| 349.4 |
| 342.9 |
| 310.6 |
|
| NGLs (bbl/d) | 3,819 |
| 4,518 |
| 2,811 |
| 2,728 |
| 2,444 |
|
| Total (boe/d) | 114,167 |
| 112,387 |
| 96,087 |
| 93,546 |
| 83,416 |
|
| Average realized prices, prior to hedging |
|
|
|
|
|
| Crude oil ($/bbl) | 53.53 |
| 90.64 |
| 88.90 |
| 82.03 |
| 89.51 |
|
| Condensate ($/bbl) | 53.84 |
| 93.81 |
| 94.13 |
| 92.63 |
| 96.07 |
|
| Natural gas ($/Mcf) | 2.88 |
| 4.76 |
| 3.45 |
| 2.62 |
| 3.83 |
|
| NGLs ($/bbl) | 10.70 |
| 39.45 |
| 36.25 |
| 38.11 |
| 47.53 |
|
| Oil equivalent ($/boe) | 28.57 |
| 51.31 |
| 46.31 |
| 40.50 |
| 47.15 |
|
RESERVES (company gross) (4) |
|
|
|
|
|
| Proved plus probable reserves |
|
|
|
|
|
| Crude oil and NGLs (mbbl) | 199,826 |
| 192,489 |
| 194,064 |
| 185,548 |
| 170,153 |
|
| Natural gas (bcf) | 2,992.1 |
| 2,881.6 |
| 2,638.8 |
| 2,528.6 |
| 2,413.3 |
|
| Total (mboe) | 686,851 |
| 672,748 |
| 633,864 |
| 606,982 |
| 572,374 |
|
TRADING STATISTICS ($, based on intra-day trading) |
|
|
|
|
|
| High | 25.87 |
| 33.68 |
| 29.95 |
| 26.25 |
| 28.67 |
|
| Low | 15.39 |
| 22.70 |
| 23.12 |
| 18.36 |
| 19.40 |
|
| Close | 16.70 |
| 25.16 |
| 29.57 |
| 24.44 |
| 25.10 |
|
| Average daily volume (thousands) | 1,832 |
| 1,344 |
| 1,064 |
| 1,356 |
| 1,251 |
|
| |
| (1) | Refer to the sections entitled "Funds from Operations" and “Additional GAAP Measures” contained within this MD&A. |
| |
| (2) | Dividends per share are based on the number of shares outstanding at each dividend record date. |
| |
| (3) | Refer to the sections entitled "Capitalization, Financial Resources and Liquidity" and “Additional GAAP Measures” contained within this MD&A. |
| |
| (4) | Company gross reserves are the gross interest reserves before deduction of royalties and without including any royalty interests. |
|
| | |
| ARC Resources Ltd. | Page 47 |
QUARTERLY HISTORICAL REVIEW |
| | | | | | | | | | | | | | | | |
| ($ millions, except per share amounts) | 2015 | 2014 |
| FINANCIAL | Q4 |
| Q3 |
| Q2 |
| Q1 |
| Q4 |
| Q3 |
| Q2 |
| Q1 |
|
| Sales of crude oil, natural gas, condensate, NGLs and other income | 285.9 |
| 279.5 |
| 321.7 |
| 306.6 |
| 454.1 |
| 535.2 |
| 567.0 |
| 551.4 |
|
| Per share, basic | 0.83 |
| 0.82 |
| 0.95 |
| 0.92 |
| 1.43 |
| 1.69 |
| 1.79 |
| 1.75 |
|
| Per share, diluted | 0.83 |
| 0.82 |
| 0.94 |
| 0.92 |
| 1.42 |
| 1.68 |
| 1.79 |
| 1.75 |
|
Funds from operations (1) | 200.7 |
| 174.9 |
| 206.3 |
| 191.5 |
| 251.7 |
| 284.2 |
| 295.8 |
| 292.3 |
|
| Per share, basic | 0.58 |
| 0.51 |
| 0.61 |
| 0.57 |
| 0.79 |
| 0.90 |
| 0.94 |
| 0.93 |
|
| Per share, diluted | 0.58 |
| 0.51 |
| 0.61 |
| 0.57 |
| 0.79 |
| 0.89 |
| 0.93 |
| 0.93 |
|
| Net income (loss) | (55.0 | ) | (235.0 | ) | (51.0 | ) | (1.7 | ) | 113.7 |
| 90.3 |
| 147.4 |
| 29.4 |
|
| Per share, basic | (0.16 | ) | (0.69 | ) | (0.15 | ) | (0.01 | ) | 0.36 |
| 0.28 |
| 0.47 |
| 0.09 |
|
| Per share, diluted | (0.16 | ) | (0.69 | ) | (0.15 | ) | (0.01 | ) | 0.36 |
| 0.28 |
| 0.47 |
| 0.09 |
|
| Dividends declared | 103.8 |
| 103.0 |
| 102.1 |
| 101.6 |
| 95.7 |
| 95.2 |
| 94.8 |
| 94.5 |
|
Per share (2) | 0.30 |
| 0.30 |
| 0.30 |
| 0.30 |
| 0.30 |
| 0.30 |
| 0.30 |
| 0.30 |
|
| Total assets | 5,932.2 |
| 6,072.4 |
| 6,346.0 |
| 6,588.8 |
| 6,325.5 |
| 6,095.5 |
| 5,988.7 |
| 5,949.5 |
|
| Total liabilities | 2,543.7 |
| 2,578.3 |
| 2,565.7 |
| 2,704.2 |
| 2,773.7 |
| 2,603.5 |
| 2,531.1 |
| 2,580.7 |
|
Net debt outstanding (3) | 985.1 |
| 981.1 |
| 878.1 |
| 950.5 |
| 1,255.9 |
| 1,152.8 |
| 1,061.9 |
| 1,096.0 |
|
| Weighted average shares outstanding | 345.6 |
| 342.8 |
| 340.4 |
| 333.2 |
| 318.6 |
| 317.2 |
| 315.9 |
| 314.7 |
|
| Weighted average shares outstanding, diluted | 345.6 |
| 342.8 |
| 340.7 |
| 333.5 |
| 319.1 |
| 317.8 |
| 316.6 |
| 315.2 |
|
| Shares outstanding, end of period | 347.1 |
| 344.2 |
| 341.5 |
| 339.3 |
| 319.4 |
| 317.8 |
| 316.5 |
| 315.3 |
|
| CAPITAL EXPENDITURES |
|
|
|
|
|
|
|
|
|
|
|
|
|
|
|
|
| Geological and geophysical | 2.5 |
| 8.0 |
| 3.1 |
| 2.3 |
| 4.7 |
| 3.5 |
| 3.5 |
| 5.9 |
|
| Drilling and completions | 108.5 |
| 117.9 |
| 51.8 |
| 83.0 |
| 164.4 |
| 154.9 |
| 181.6 |
| 159.1 |
|
| Plant and facilities | 37.3 |
| 37.8 |
| 43.2 |
| 43.7 |
| 78.2 |
| 58.8 |
| 49.4 |
| 75.0 |
|
| Administrative assets | 1.2 |
| 0.5 |
| 0.3 |
| 0.5 |
| 2.0 |
| 1.0 |
| 1.6 |
| 2.0 |
|
| Total capital expenditures | 149.5 |
| 164.2 |
| 98.4 |
| 129.5 |
| 249.3 |
| 218.2 |
| 236.1 |
| 242.0 |
|
| Undeveloped land purchased at Crown land sales | 4.6 |
| 0.6 |
| 0.1 |
| 1.4 |
| 18.0 |
| 21.9 |
| 16.6 |
| 5.8 |
|
| Total capital expenditures including undeveloped land purchases | 154.1 |
| 164.8 |
| 98.5 |
| 130.9 |
| 267.3 |
| 240.1 |
| 252.7 |
| 247.8 |
|
| Acquisitions | 0.3 |
| — |
| 14.1 |
| — |
| — |
| 37.3 |
| 5.5 |
| 30.7 |
|
| Dispositions | (42.2 | ) | (20.7 | ) | (14.9 | ) | (11.0 | ) | (2.4 | ) | (5.1 | ) | (31.8 | ) | — |
|
| Total capital expenditures, land purchases and net acquisitions and dispositions | 112.2 |
| 144.1 |
| 97.7 |
| 119.9 |
| 264.9 |
| 272.3 |
| 226.4 |
| 278.5 |
|
| OPERATING |
|
|
|
|
|
|
|
|
|
|
|
|
|
|
|
|
| Production |
|
|
|
|
|
|
|
|
|
|
|
|
|
|
|
|
| Crude oil (bbl/d) | 33,899 |
| 29,397 |
| 31,958 |
| 35,851 |
| 37,442 |
| 35,871 |
| 35,317 |
| 37,478 |
|
| Condensate (bbl/d) | 3,631 |
| 3,361 |
| 3,139 |
| 3,591 |
| 3,448 |
| 3,862 |
| 4,462 |
| 2,887 |
|
| Natural gas (MMcf/d) | 469.1 |
| 425.1 |
| 426.0 |
| 459.6 |
| 432.1 |
| 424.5 |
| 397.2 |
| 369.6 |
|
| NGLs (bbl/d) | 3,523 |
| 3,653 |
| 3,795 |
| 4,314 |
| 5,075 |
| 5,056 |
| 4,179 |
| 3,743 |
|
| Total (boe/d) | 119,243 |
| 107,261 |
| 109,900 |
| 120,354 |
| 117,986 |
| 115,530 |
| 110,165 |
| 105,699 |
|
| Average realized prices, prior to hedging |
|
|
|
|
|
|
|
|
|
|
|
|
|
|
|
|
| Crude oil ($/bbl) | 49.24 |
| 52.43 |
| 64.49 |
| 48.73 |
| 72.49 |
| 93.34 |
| 102.14 |
| 95.58 |
|
| Condensate ($/bbl) | 49.80 |
| 53.00 |
| 64.84 |
| 49.12 |
| 74.04 |
| 95.55 |
| 103.72 |
| 100.11 |
|
| Natural gas ($/Mcf) | 2.59 |
| 3.03 |
| 2.88 |
| 3.05 |
| 4.15 |
| 4.46 |
| 4.99 |
| 5.60 |
|
| NGLs ($/bbl) | 10.73 |
| 5.68 |
| 9.53 |
| 16.07 |
| 32.69 |
| 39.61 |
| 39.51 |
| 48.54 |
|
| Oil equivalent ($/boe) | 26.01 |
| 28.22 |
| 32.10 |
| 28.20 |
| 41.78 |
| 50.28 |
| 56.44 |
| 57.91 |
|
| TRADING STATISTICS |
|
|
|
|
|
|
|
|
|
|
|
|
|
|
|
|
| ($, based on intra-day trading) |
|
|
|
|
|
|
|
|
|
|
|
|
|
|
|
|
| High | 22.49 |
| 21.98 |
| 25.60 |
| 25.87 |
| 29.85 |
| 32.60 |
| 33.68 |
| 30.66 |
|
| Low | 15.39 |
| 15.57 |
| 21.01 |
| 20.75 |
| 22.70 |
| 28.54 |
| 30.30 |
| 27.52 |
|
| Close | 16.70 |
| 17.64 |
| 21.40 |
| 21.76 |
| 25.16 |
| 29.55 |
| 32.49 |
| 30.45 |
|
| Average daily volume (thousands) | 2,224 |
| 1,736 |
| 1,424 |
| 1,944 |
| 1,886 |
| 1,205 |
| 1,037 |
| 1,248 |
|
| |
| (1) | Refer to the sections entitled "Funds from Operations" and “Additional GAAP Measures” contained within this MD&A. |
| |
| (2) | Dividends per share are based on the number of shares outstanding at each dividend record date. |
| |
| (3) | Refer to the sections entitled "Capitalization, Financial Resources and Liquidity" and “Additional GAAP Measures” contained within this MD&A. |
|
| | |
| ARC Resources Ltd. | Page 48 |
Management’s Report
Management’s Responsibility on Financial Statements
Management is responsible for the preparation of the accompanying consolidated financial statements and for the consistency therewith of all other financial and operating data presented in this annual report. The consolidated financial statements have been prepared in accordance with the accounting policies detailed in the notes thereto. In Management’s opinion, the consolidated financial statements are in accordance with International Financial Reporting Standards as issued by the International Accounting Standards Board, have been prepared within acceptable limits of materiality, and have utilized supportable, reasonable estimates.
To ensure the integrity of our financial statements, we carefully select and train qualified personnel. We also ensure our organizational structure provides appropriate delegation of authority and division of responsibilities. Our policies and procedures are communicated throughout the organization including a written ethics and integrity policy that applies to all employees including the Chief Executive Officer and Chief Financial Officer.
The Board of Directors approves the consolidated financial statements. Their financial statement related responsibilities are fulfilled primarily through the Audit Committee. The Audit Committee is composed entirely of independent directors, and includes at least one director with financial expertise. The Audit Committee meets regularly with Management and the external auditors to discuss reporting and control issues and ensures each party is properly discharging its responsibilities. The Audit Committee also considers the independence of the external auditors and reviews their fees.
The consolidated financial statements have been audited by Deloitte LLP, Chartered Professional Accountants, in accordance with Canadian generally accepted auditing standards and the standards of the Public Company Accounting Oversight Board (United States) on behalf of the shareholders.
Management’s Report on Internal Control over Financial Reporting
Management is responsible for establishing and maintaining an adequate system of internal control over financial reporting. Internal control over financial reporting is a process designed to provide reasonable assurance that all assets are safeguarded, transactions are appropriately authorized and to facilitate the preparation of relevant, reliable and timely information. Because of its inherent limitations, internal control over financial reporting may not prevent or detect misstatements. Management has assessed the effectiveness of the internal control over financial reporting for ARC Resources Ltd. and subsidiaries ("the Company") as defined in Rule 13a-15 under the US Securities Exchange Act of 1934. The assessment was based on the framework in Internal Control - Integrated Framework (2013) issued by the Committee of Sponsoring Organizations of the Treadway Commission. Management concluded that the Company’s internal control over financial reporting was effective as of December 31, 2015. The Company’s internal control over financial reporting as of December 31, 2015 has been audited by Deloitte LLP, the Company’s external auditors, who also audited the Company’s consolidated financial statements for the year ended December 31, 2015.
/s/ Myron M. Stadnyk /s/ P. Van R. Dafoe
President and Chief Executive Officer Senior Vice-President and Chief Financial Officer
Calgary, Alberta
February 10, 2016
|
| | |
| ARC Resources Ltd. | Page 49 |
REPORT OF INDEPENDENT REGISTERED PUBLIC ACCOUNTING FIRM
To the Board of Directors and Shareholders of ARC Resources Ltd:
We have audited the accompanying consolidated financial statements of ARC Resources Ltd. and subsidiaries (the "Company"), which comprise the consolidated balance sheets as at December 31, 2015 and 2014 and the consolidated statements of income and comprehensive income, statements of changes in shareholders’ equity and statements of cash flows for the years then ended, and a summary of significant accounting policies and other explanatory information.
Management's Responsibility for the Consolidated Financial Statements
Management is responsible for the preparation and fair presentation of these consolidated financial statements in accordance with International Financial Reporting Standards as issued by the International Accounting Standards Board, and for such internal control as Management determines is necessary to enable the preparation of consolidated financial statements that are free from material misstatement, whether due to fraud or error.
Auditor's Responsibility
Our responsibility is to express an opinion on these consolidated financial statements based on our audits. We conducted our audits in accordance with Canadian generally accepted auditing standards and the standards of the Public Company Accounting Oversight Board (United States). Those standards require that we comply with ethical requirements and plan and perform the audit to obtain reasonable assurance about whether the consolidated financial statements are free from material misstatement.
An audit involves performing procedures to obtain audit evidence about the amounts and disclosures in the consolidated financial statements. The procedures selected depend on the auditor's judgment, including the assessment of the risks of material misstatement of the consolidated financial statements, whether due to fraud or error. In making those risk assessments, the auditor considers internal control relevant to the entity's preparation and fair presentation of the consolidated financial statements in order to design audit procedures that are appropriate in the circumstances. An audit also includes evaluating the appropriateness of accounting policies used and the reasonableness of accounting estimates made by Management, as well as evaluating the overall presentation of the consolidated financial statements.
We believe that the audit evidence we have obtained in our audits is sufficient and appropriate to provide a basis for our audit opinion.
Opinion
In our opinion, the consolidated financial statements present fairly, in all material respects, the financial position of ARC Resources Ltd. and subsidiaries as at December 31, 2015 and 2014 and their financial performance and their cash flows for the years then ended in accordance with International Financial Reporting Standards as issued by the International Accounting Standards Board.
Other Matter
We have also audited, in accordance with the standards of the Public Company Accounting Oversight Board (United States), the Company’s internal control over financial reporting as of December 31, 2015, based on the criteria established in Internal Control - Integrated Framework (2013) issued by the Committee of Sponsoring Organizations of the Treadway Commission and our report dated February 10, 2016 expressed an unqualified opinion on the Company’s internal control over financial reporting.
/s/ “Deloitte LLP”
Chartered Professional Accountants, Chartered Accountants
February 10, 2016
Calgary, Canada
|
| | |
| ARC Resources Ltd. | Page 50 |
REPORT OF INDEPENDENT REGISTERED PUBLIC ACCOUNTING FIRM
To the Board of Directors and Shareholders of ARC Resources Ltd:
We have audited the internal control over financial reporting of ARC Resources Ltd. and subsidiaries (the “Company”) as of December 31, 2015, based on the criteria established in Internal Control - Integrated Framework (2013) issued by the Committee of Sponsoring Organizations of the Treadway Commission. The Company's Management is responsible for maintaining effective internal control over financial reporting and for its assessment of the effectiveness of internal control over financial reporting, included in the accompanying Management’s Report on Internal Control over Financial Reporting. Our responsibility is to express an opinion on the Company's internal control over financial reporting based on our audit.
We conducted our audit in accordance with the standards of the Public Company Accounting Oversight Board (United States). Those standards require that we plan and perform the audit to obtain reasonable assurance about whether effective internal control over financial reporting was maintained in all material respects. Our audit included obtaining an understanding of internal control over financial reporting, assessing the risk that a material weakness exists, testing and evaluating the design and operating effectiveness of internal control based on the assessed risk, and performing such other procedures as we considered necessary in the circumstances. We believe that our audit provides a reasonable basis for our opinion.
A company's internal control over financial reporting is a process designed by, or under the supervision of, the company's principal executive and principal financial officers, or persons performing similar functions, and effected by the company's board of directors, management, and other personnel to provide reasonable assurance regarding the reliability of financial reporting and the preparation of financial statements for external purposes in accordance with International Financial Reporting Standards as issued by the International Accounting Standards Board. A company's internal control over financial reporting includes those policies and procedures that (1) pertain to the maintenance of records that, in reasonable detail, accurately and fairly reflect the transactions and dispositions of the assets of the company; (2) provide reasonable assurance that transactions are recorded as necessary to permit preparation of financial statements in accordance with International Financial Reporting Standards as issued by the International Accounting Standards Board, and that receipts and expenditures of the company are being made only in accordance with authorizations of management and directors of the company; and (3) provide reasonable assurance regarding prevention or timely detection of unauthorized acquisition, use, or disposition of the company's assets that could have a material effect on the financial statements.
Because of the inherent limitations of internal control over financial reporting, including the possibility of collusion or improper management override of controls, material misstatements due to error or fraud may not be prevented or detected on a timely basis. Also, projections of any evaluation of the effectiveness of the internal control over financial reporting to future periods are subject to the risk that the controls may become inadequate because of changes in conditions, or that the degree of compliance with the policies or procedures may deteriorate.
In our opinion, the Company maintained, in all material respects, effective internal control over financial reporting as of December 31, 2015, based on the criteria established in Internal Control - Integrated Framework (2013) issued by the Committee of Sponsoring Organizations of the Treadway Commission.
We have also audited, in accordance with Canadian generally accepted auditing standards and the standards of the Public Company Accounting Oversight Board (United States), the consolidated financial statements as at and for the year ended December 31, 2015 of the Company and our report dated February 10, 2016 expressed an unmodified/unqualified opinion on those consolidated financial statements.
/s/ “Deloitte LLP”
Chartered Professional Accountants, Chartered Accountants
February 10, 2016
Calgary, Canada
|
| | |
| ARC Resources Ltd. | Page 51 |
|
| | | | | |
| ARC RESOURCES LTD. | | | |
| CONSOLIDATED BALANCE SHEETS | | | |
| As at | | | |
| | | | |
| (Cdn$ millions) | December 31, 2015 |
| | December 31, 2014 |
|
| | | | |
| ASSETS | | | |
| Current assets | | | |
| Cash and cash equivalents (Note 6) | 167.3 |
| | 7.1 |
|
| Short-term investment | 3.2 |
| | 3.6 |
|
| Accounts receivable | 116.6 |
| | 165.0 |
|
| Prepaid expenses | 14.3 |
| | 14.3 |
|
| Risk management contracts (Note 16) | 207.5 |
| | 131.8 |
|
| Assets held for sale (Note 10) | — |
| | 5.8 |
|
| | 508.9 |
| | 327.6 |
|
| Reclamation fund (Note 8) | 34.3 |
| | 35.2 |
|
| Risk management contracts (Note 16) | 204.7 |
| | 128.0 |
|
| Exploration and evaluation assets (Note 9, 11) | 276.4 |
| | 266.4 |
|
| Property, plant and equipment (Note 10, 11) | 4,659.7 |
| | 5,320.1 |
|
| Goodwill (Note 11) | 248.2 |
| | 248.2 |
|
| Total assets | 5,932.2 |
| | 6,325.5 |
|
| | | | |
| LIABILITIES | | | |
| Current liabilities | | | |
| Accounts payable and accrued liabilities | 137.5 |
| | 339.1 |
|
| Current portion of long-term debt (Note 13) | 57.9 |
| | 49.5 |
|
| Current portion of asset retirement obligations (Note 14) | 18.0 |
| | 13.0 |
|
| Dividends payable | 34.7 |
| | 32.0 |
|
| Risk management contracts (Note 16) | 1.6 |
| | 1.0 |
|
| Liabilities associated with assets held for sale (Note 14) | — |
| | 5.5 |
|
| | 249.7 |
| | 440.1 |
|
| Risk management contracts (Note 16) | 0.7 |
| | 1.0 |
|
| Long-term debt (Note 13) | 1,056.4 |
| | 1,025.3 |
|
| Long-term incentive compensation liability (Note 19) | 19.5 |
| | 29.1 |
|
| Other deferred liabilities | 14.1 |
| | 15.8 |
|
| Asset retirement obligations (Note 14) | 555.2 |
| | 603.1 |
|
| Deferred taxes (Note 17) | 648.1 |
| | 659.3 |
|
| Total liabilities | 2,543.7 |
| | 2,773.7 |
|
| Commitments and contingencies (Note 20) | | | |
| | | | |
| SHAREHOLDERS’ EQUITY | | | |
| Shareholders’ capital | 4,536.9 |
| | 3,951.1 |
|
| Contributed surplus | 12.6 |
| | 8.6 |
|
| Deficit | (1,161.1 | ) | | (407.9 | ) |
| Accumulated other comprehensive income | 0.1 |
| | — |
|
| Total shareholders’ equity | 3,388.5 |
| | 3,551.8 |
|
| Total liabilities and shareholders’ equity | 5,932.2 |
| | 6,325.5 |
|
See accompanying notes to the consolidated financial statements.
Approved by the Board of Directors
/s/ Harold N. Kvisle /s/ Kathleen M. O’Neill
Chairman of the Board of Directors and Director Chair of the Audit Committee and Director
|
| | |
| ARC Resources Ltd. | Page 52 |
|
| | | | | |
| ARC RESOURCES LTD. | | | |
| CONSOLIDATED STATEMENTS OF INCOME |
| For the years ended December 31 |
| | |
| (Cdn$ millions, except per share amounts) | 2015 |
| | 2014 |
|
| | | | |
| REVENUE | | | |
| Sales of crude oil, natural gas, condensate, natural gas liquids and other income | 1,193.7 |
| | 2,107.7 |
|
| Royalties | (103.3 | ) | | (298.0 | ) |
| | 1,090.4 |
| | 1,809.7 |
|
| | | | |
| Gain on risk management contracts (Note 16) | 338.0 |
| | 176.2 |
|
| | 1,428.4 |
| | 1,985.9 |
|
| | | | |
| EXPENSES | | | |
| Transportation | 97.0 |
| | 91.6 |
|
| Operating | 298.0 |
| | 364.2 |
|
| Exploration and evaluation expenses (Note 9, 11) | 46.9 |
| | 39.4 |
|
| General and administrative | 68.6 |
| | 84.3 |
|
| Interest and financing charges | 51.0 |
| | 47.3 |
|
| Accretion of asset retirement obligations (Note 14) | 13.4 |
| | 14.9 |
|
| Depletion, depreciation, amortization and impairment (Note 10, 11) | 1,065.4 |
| | 758.5 |
|
| Loss on foreign exchange | 177.8 |
| | 73.7 |
|
| Loss on short-term investment | 0.4 |
| | — |
|
| Gain on disposal of petroleum and natural gas properties | (31.6 | ) | | 1.8 |
|
| | 1,786.9 |
| | 1,475.7 |
|
| Provision for (recovery of) income taxes (Note 17) | | | |
| Current | (9.0 | ) | | 70.3 |
|
| Deferred | (6.8 | ) | | 59.1 |
|
| | (15.8 | ) | | 129.4 |
|
| | | | |
| Net income (loss) | (342.7 | ) | | 380.8 |
|
| | | | |
| Net income (loss) per share (Note 18) | | | |
| Basic | (1.01 | ) | | 1.20 |
|
| Diluted | (1.01 | ) | | 1.20 |
|
See accompanying notes to the consolidated financial statements.
|
| | |
| ARC Resources Ltd. | Page 53 |
|
| | | | | |
| ARC RESOURCES LTD. | | | |
| CONSOLIDATED STATEMENTS OF COMPREHENSIVE INCOME |
| For the years ended December 31 |
| | |
| (Cdn$ millions) | 2015 |
| | 2014 |
|
| | | | |
| Net income (loss) | (342.7 | ) | | 380.8 |
|
| Other comprehensive income | | | |
| Items that may be reclassified into earnings, net of tax: | | | |
| Net unrealized gain on reclamation fund investments | 0.1 |
| | — |
|
| Other comprehensive income | 0.1 |
| | — |
|
| Comprehensive income (loss) | (342.6 | ) | | 380.8 |
|
See accompanying notes to the consolidated financial statements.
|
| | |
| ARC Resources Ltd. | Page 54 |
|
| | | | | | | | | | | | | | |
| ARC RESOURCES LTD. | | | | | | | | | |
| CONSOLIDATED STATEMENTS OF CHANGES IN SHAREHOLDERS' EQUITY |
| For the years ended December 31 |
| (Cdn$ millions) | Shareholders’ Capital
(Note 18) |
| | Contributed Surplus |
| | Deficit |
| | Accumulated other comprehensive income |
| | Total Shareholders’ Equity |
|
| December 31, 2013 | 3,800.8 |
| | 3.8 |
| | (408.5 | ) | | — |
| | 3,396.1 |
|
| Total comprehensive income | — |
| | — |
| | 380.8 |
| | — |
| | 380.8 |
|
| Shares issued pursuant to the dividend reinvestment program | 115.9 |
| | — |
| | — |
| | — |
| | 115.9 |
|
| Shares issued pursuant to the stock dividend program | 35.1 |
| | — |
| | — |
| | — |
| | 35.1 |
|
| Cancellation of shares and return of accrued dividends | (0.7 | ) |
| 1.9 |
|
| — |
| | — |
| | 1.2 |
|
| Recognized under share-based compensation plans (Note 19) | — |
| | 2.9 |
| | — |
| | — |
| | 2.9 |
|
| Dividends declared | — |
| | — |
| | (380.2 | ) | | — |
| | (380.2 | ) |
| December 31, 2014 | 3,951.1 |
| | 8.6 |
| | (407.9 | ) | | — |
| | 3,551.8 |
|
| Net loss | — |
| | — |
| | (342.7 | ) | | — |
| | (342.7 | ) |
| Other comprehensive income | — |
| | — |
| | — |
| | 0.1 |
| | 0.1 |
|
| Total comprehensive income (loss) | — |
| | — |
| | (342.7 | ) | | 0.1 |
| | (342.6 | ) |
| Shares issued for cash | 402.7 |
| | — |
| | — |
| | — |
| | 402.7 |
|
| Shares issued pursuant to the dividend reinvestment program | 151.0 |
| | — |
| | — |
| | — |
| | 151.0 |
|
| Shares issued pursuant to the stock dividend program | 44.5 |
| | — |
| | — |
| | — |
| | 44.5 |
|
Share issuance costs (1) | (12.4 | ) | | — |
| | — |
| | — |
| | (12.4 | ) |
| Recognized under share-based compensation plans (Note 19) | — |
| | 4.0 |
| | — |
| | — |
| | 4.0 |
|
| Dividends declared | — |
| | — |
| | (410.5 | ) | | — |
| | (410.5 | ) |
| December 31, 2015 | 4,536.9 |
| | 12.6 |
| | (1,161.1 | ) | | 0.1 |
| | 3,388.5 |
|
| |
| (1) | Amount is net of deferred tax of $4.4 million. |
See accompanying notes to the consolidated financial statements.
|
| | |
| ARC Resources Ltd. | Page 55 |
|
| | | | | |
| ARC RESOURCES LTD. | | | |
| CONSOLIDATED STATEMENTS OF CASH FLOWS | | |
| For the years ended December 31 |
| | |
| (Cdn$ millions) | 2015 |
| | 2014 |
|
| CASH FLOW FROM (USED IN) OPERATING ACTIVITIES | | | |
| Net income (loss) | (342.7 | ) | | 380.8 |
|
| Add items not involving cash: | | | |
| Unrealized gain on risk management contracts | (152.0 | ) | | (205.3 | ) |
| Accretion of asset retirement obligations (Note 14) | 13.4 |
| | 14.9 |
|
| Depletion, depreciation, amortization and impairment (Note 10, 11) | 1,065.4 |
| | 758.5 |
|
| Exploration and evaluation expenses (Note 9, 11) | 46.9 |
| | 39.4 |
|
| Unrealized loss on foreign exchange | 178.5 |
| | 73.8 |
|
| Gain on disposal of petroleum and natural gas properties | (31.6 | ) | | 1.8 |
|
| Deferred tax expense (recovery) (Note 17) | (6.8 | ) | | 59.1 |
|
| Other (Note 22) | 2.3 |
| | 1.0 |
|
| Net change in other liabilities (Note 22) | (22.0 | ) | | (20.4 | ) |
| Change in non-cash working capital (Note 22) | (62.4 | ) | | 49.4 |
|
| | 689.0 |
| | 1,153.0 |
|
| CASH FLOW FROM (USED IN) FINANCING ACTIVITIES | | | |
| Repayment of long-term debt under revolving credit facilities, net | (83.8 | ) | | (22.1 | ) |
| Issuance of senior notes | — |
| | 166.6 |
|
| Repayment of senior notes | (53.8 | ) | | (43.9 | ) |
| Issuance of common shares (Note 18) | 402.7 |
| | — |
|
| Share issuance costs | (16.8 | ) | | — |
|
| Cash dividends paid | (212.3 | ) | | (228.6 | ) |
| | 36.0 |
| | (128.0 | ) |
| CASH FLOW FROM (USED IN) INVESTING ACTIVITIES | | | |
| Acquisition of petroleum and natural gas properties (Note 9, 10) | (14.4 | ) | | (71.7 | ) |
| Disposal of petroleum and natural gas properties | 88.8 |
| | 37.5 |
|
| Property, plant and equipment development expenditures (Note 10) | (514.0 | ) | | (958.2 | ) |
| Exploration and evaluation asset expenditures (Note 9) | (33.9 | ) | | (49.4 | ) |
| Net reclamation fund withdrawals (contributions) | 0.9 |
| | (2.6 | ) |
| Change in non-cash working capital (Note 22) | (92.2 | ) | | 26.5 |
|
| | (564.8 | ) | | (1,017.9 | ) |
| INCREASE IN CASH AND CASH EQUIVALENTS | 160.2 |
| | 7.1 |
|
| CASH AND CASH EQUIVALENTS, BEGINNING OF YEAR | 7.1 |
| | — |
|
| CASH AND CASH EQUIVALENTS, END OF YEAR | 167.3 |
| | 7.1 |
|
| The following are included in cash flow from operating activities: | | | |
| Income taxes paid in cash | 42.8 |
| | 30.4 |
|
| Interest paid in cash | 52.0 |
| | 46.3 |
|
See accompanying notes to the consolidated financial statements.
|
| | |
| ARC Resources Ltd. | Page 56 |
NOTES TO THE CONSOLIDATED FINANCIAL STATEMENTS
December 31, 2015 and 2014
| |
| 1. | STRUCTURE OF THE BUSINESS |
The principal undertakings of ARC Resources Ltd. and its subsidiaries (collectively the “Company” or “ARC”) are to carry on the business of acquiring, developing and holding interests in petroleum and natural gas properties and assets.
ARC was incorporated in Canada and the Company’s registered office and principal place of business is located at 1200, 308 – 4th Avenue SW, Calgary, Alberta, Canada T2P 0H7.
These consolidated financial statements (the “financial statements”) have been prepared in accordance with International Financial Reporting Standards (“IFRS”) as issued by the International Accounting Standards Board ("IASB"). All financial information is reported in millions of Canadian dollars ("Cdn$"), unless otherwise noted. References to “US$” are to United States dollars.
The financial statements have been prepared on a historical cost basis, except for ARC's cash and cash equivalents, short-term investment, reclamation fund assets, and risk management contracts which are presented at fair value, as detailed in the accounting policies disclosed in Note 3.
The financial statements include the accounts of ARC and its wholly owned subsidiaries, ARC Resources General Partnership (the "partnership") and 1504793 Alberta Ltd. All inter-entity transactions have been eliminated. ARC's operations are viewed as a single operating segment by the chief operating decision maker of the Company for the purpose of resource allocation and assessing performance.
The preparation of the financial statements requires Management to use judgments, estimates and assumptions that affect the reported amounts of assets, liabilities and the disclosure of contingencies at the date of the financial statements, and revenues and expenses during the reporting period. Accordingly, actual results could differ from those estimated. Significant estimates and judgments used in the preparation of the financial statements are detailed in Note 5.
These financial statements were authorized for issue by the Board of Directors on February 10, 2016.
| |
| 3. | SUMMARY OF ACCOUNTING POLICIES |
Revenue Recognition
Revenue associated with the sale of crude oil, natural gas, condensate and natural gas liquids (“NGLs”) owned by ARC is recognized when title is transferred from ARC to its customers. Revenue is measured at the fair value of the consideration received or receivable. Revenue represents ARC's share net of royalty payments to governments and other mineral interest owners. Revenue from the sale of crude oil, natural gas, condensate and NGLs (prior to deduction of transportation costs) is recognized when all of the following conditions have been satisfied:
| |
| • | ARC has transferred the significant risks and rewards of ownership of the goods to the buyer; |
| |
| • | ARC retains no continuing managerial involvement to the degree usually associated with ownership or effective control over the goods sold; |
| |
| • | the amount of revenue can be measured reliably; |
| |
| • | it is probable that the economic benefits associated with the transaction will flow to ARC; and |
| |
| • | the costs incurred or to be incurred in respect of the transaction can be measured reliably. |
Transportation
Costs paid by ARC for the transportation of crude oil, natural gas, condensate and NGLs to the point of title transfer are recognized when the transportation is provided.
Joint Arrangements
ARC conducts many of its oil and gas production activities through jointly controlled operations and the financial statements reflect only ARC’s proportionate interest in such activities. Joint control exists for contractual
|
| | |
| ARC Resources Ltd. | Page 57 |
arrangements governing ARC's assets whereby ARC has less than 100 per cent working interest, all of the partners have control of the arrangement collectively, and spending on the project requires unanimous consent of all parties that collectively control the arrangement and share the associated risks. ARC does not have any joint arrangements that are individually material to the Company or that are structured through joint venture arrangements.
Share-Based Compensation Plans
ARC's share-based compensation plans include both cash-settled awards and equity-settled awards.
Compensation expense associated with cash-settled awards is determined based on the fair value of the award at grant date and is subsequently revalued at each period end. This valuation incorporates the period-end share price, dividends declared during the period, the number of units outstanding at each period end, and certain Management estimates, such as a performance multiplier and estimated forfeiture. Compensation expense is recognized in earnings over the relevant service period with a corresponding increase or decrease in liabilities. Classification of the associated short-term and long-term liabilities is dependent on the expected payout dates.
Compensation expense associated with equity-settled awards is determined based on the fair value of the award at grant date and is recognized over the period that the awards vest, with a corresponding increase to contributed surplus. Depending on the terms of the plan, when the awards are exercised, the associated contributed surplus is recognized in shareholders' capital.
Cash and Cash Equivalents
Cash and cash equivalents include cash on hand, market deposits and similar type instruments, with an original maturity of three months or less when purchased.
Reclamation Fund
ARC's reclamation fund holds investment-grade assets and cash and cash equivalents. Investments are categorized as available-for-sale assets. Available-for-sale assets are initially measured at fair value with subsequent changes in fair value recognized in other comprehensive income ("OCI"), net of tax.
Goodwill
ARC records goodwill relating to a business combination when the total purchase price exceeds the fair value of the identifiable assets and liabilities of the acquired company. Goodwill is stated at cost less any accumulated impairment losses. Goodwill is evaluated for impairment on an annual basis, or more frequently if potential indicators of impairment exist.
Exploration and Evaluation (“E&E”) Assets
E&E costs are capitalized until the technical feasibility and commercial viability, or otherwise, of the relevant projects have been determined. Technical feasibility and commercial viability of E&E assets is dependent upon the existence of economically recoverable reserves and obtaining the appropriate internal and external approvals. E&E costs may include costs of license acquisition, technical services and studies, exploration drilling and testing, and the estimate of any asset retirement costs. Costs incurred prior to obtaining the legal right to explore are expensed as incurred. Net revenues from test production associated with assets classified as E&E are recognized as earned. Assets classified as E&E are not amortized.
If a project classified as E&E is determined to be technically feasible and commercially viable, the relevant cost is transferred from E&E to development and production assets which are classified as PP&E on the consolidated balance sheets (the "balance sheets"). Assets are assessed for impairment prior to any such transfer. If an E&E project is determined to be unsuccessful, all associated costs are charged to the consolidated statements of income (the "statements of income") in E&E expenses at that time.
Property, Plant and Equipment ("PP&E")
Items of PP&E, which include oil and gas development and production assets and administrative assets, are measured at cost less accumulated depletion, depreciation and amortization ("DD&A") and accumulated impairment losses.
Overhead costs that are directly attributable to bringing an asset to the location and condition necessary for it to be capable of use in the manner intended by Management are capitalized. These costs include cash and share-based compensation costs paid to ARC personnel dedicated to capital projects.
Impairment of Non-Financial Assets
Development and Production Assets
ARC’s development and production assets are grouped into cash generating units (“CGUs”) for the purpose of assessing impairment. A CGU is a grouping of assets that generate cash inflows independently of other assets held
|
| | |
| ARC Resources Ltd. | Page 58 |
by the Company. Geological formation, product type, geography and internal management are key factors considered when grouping ARC’s petroleum and natural gas assets into CGUs.
CGUs are reviewed at each reporting date for indicators of potential impairment or, in the case of previously impaired CGUs, recovery. If such indicators exist, an impairment test is performed by comparing the CGU’s carrying value to its recoverable amount, defined as the greater of a CGU’s fair value less costs of disposal and its value in use. Any excess of carrying value over recoverable amount is recognized in the statements of income in DD&A and impairment.
If there is an indicator that a previously recognized impairment charge may no longer be valid, the recoverable amount of the relevant CGU is calculated and compared against the carrying amount. An impairment charge is reversed to the extent that the asset’s recoverable amount does not exceed the carrying amount that would have been determined, net of DD&A, if no impairment loss had been recognized.
E&E Assets
E&E assets are assessed for impairment at the operating segment level. Impairment tests are carried out when E&E assets are transferred to be included as development and production assets, and any time that circumstances arise which could indicate a potential impairment. An impairment loss on E&E assets is recognized if the carrying value of the E&E assets exceeds the recoverable amount. Impairment of E&E assets is recognized in E&E expenses.
Goodwill
Goodwill is assessed for impairment at the operating segment level. Goodwill has not been attributed to individual CGUs as ARC believes the goodwill it has acquired enhances the value of all of its pre-existing CGUs through enhanced operating efficiencies. Irrespective of whether there is any indication of impairment, goodwill balances are tested for impairment annually. An impairment loss on goodwill is recognized if the combined carrying amount of the CGUs including goodwill exceeds the recoverable amount of the CGUs. Impairment of goodwill is recognized in the statements of income in DD&A and impairment. Any impairment loss of goodwill is not reversed.
Assets Held for Sale
Non-current assets are classified as held for sale if their carrying amounts will be recovered through a sale transaction rather than through continuing use. This condition is met when the sale is highly probable and the asset is available for immediate sale in its present condition. For the sale to be highly probable, Management must be committed to a plan to sell the asset and an active program to locate a buyer and complete the plan must have been initiated. The asset must be actively marketed for sale at a price that is reasonable in relation to its current fair value and the sale should be expected to be completed within one year from the date of classification.
Non-current assets classified as held for sale are measured at the lower of the carrying amount and fair value less costs of disposal, with impairments recognized in the statements of income in the period measured. Non-current assets held for sale are classified and presented in current assets and liabilities within the balance sheet. Assets held for sale are not depleted, depreciated or amortized.
Dispositions
Gains on disposal of an item of PP&E or E&E are determined by comparing the proceeds from disposal with the carrying amount of PP&E or E&E and are recognized separately in the statements of income.
Exchanges of properties are measured at fair value, unless the transaction lacks commercial substance or fair value cannot be reasonably measured. Where the exchange is measured at fair value, a gain is recognized in the statements of income.
DD&A
Development and production assets are componentized into groups of assets with similar useful lives for the purposes of performing depletion calculations. Depletion expense is calculated on the unit-of-production basis based on:
| |
| (a) | total estimated proved and probable reserves calculated in accordance with National Instrument 51-101 Standards of Disclosure for Oil and Gas Activities; |
| |
| (b) | total capitalized costs plus estimated future development costs of proved and probable reserves, including future estimated asset retirement costs; and |
| |
| (c) | relative volumes of petroleum and natural gas reserves and production, before royalties, converted at the energy equivalent conversion ratio of six thousand cubic feet of natural gas to one barrel of oil. |
Depreciation of administrative assets is calculated on a straight-line basis over the estimated useful lives of the related assets, which range from three to fourteen years.
|
| | |
| ARC Resources Ltd. | Page 59 |
Government Grants
Government grants are recognized when there is reasonable assurance that ARC will comply with the conditions attached to them and the grants will be received. If a grant is received before it is certain whether compliance with all conditions will be achieved, the grant is recognized as a deferred liability until such conditions are fulfilled. When a grant relates to income, it is recognized in the statements of income in the period in which the expenditures are incurred or income is earned. When a grant relates to an asset, it is recognized as a reduction to the carrying amount of the related asset and amortized into income on a systematic basis over the expected useful life of the underlying asset through reduced DD&A charges.
Provisions and Asset Retirement Obligations ("ARO")
Provisions are recognized when ARC has a present legal or constructive obligation as a result of past events, it is probable that an outflow of economic resources will be required to settle the obligation and a reliable estimate can be made of the amount of the obligation.
A provision for onerous contracts is recognized when the expected economic benefits to be derived by ARC from a contract are lower than the unavoidable cost of meeting the obligations under the contract. The provision is measured at the lower of the expected cost of terminating the contract and the present value of the expected net cost of the remaining term of the contract. Before a provision is established, ARC first recognizes any impairment loss on assets associated with the onerous contract.
Provisions for decommissioning and restoration obligations associated with ARC's E&E and PP&E assets are recognized as ARO. ARO is measured at the present value of Management's best estimate of expenditures required to settle the liability as at the date of the balance sheet. On a periodic basis, Management reviews these estimates and changes, if any, are applied prospectively. The change in fair value of the estimated ARO is recorded as an increase or decrease to the liability, with a corresponding increase or decrease to the carrying amount of the related asset. The capitalized amount in PP&E is depreciated on a unit-of-production basis over the life of the associated proved and probable reserves. The long-term liability is increased each reporting period with the passage of time and the associated accretion charge is recognized in the statements of income. Periodic revisions to the liability-specific risk-free discount rate, estimated timing of cash flows or to the estimated undiscounted cost can also result in an increase or decrease to the ARO and the related asset. Actual costs incurred upon settlement of the obligation are recorded against the ARO to the extent of the liability recorded.
Income Taxes
Deferred tax is recognized using the balance sheet method, providing for temporary differences between the carrying amounts of assets and liabilities for financial reporting purposes and the amounts used for taxation purposes. Deferred tax is measured at the tax rates that are expected to be applied to temporary differences when they reverse, based on the laws that have been substantively enacted by the reporting date.
Deferred income tax expense is recognized in the statements of income except to the extent that deferred tax relates to equity items. Deferred tax assets and tax liabilities are offset to the extent there is a legally enforceable right to set off the recognized amounts and the intent is to either settle on a net basis or to realize the asset and settle the liability simultaneously. Claims made for scientific research and experimental development tax credits are offset against income tax expense.
Financial Instruments
Financial assets, financial liabilities and derivatives are measured at fair value on initial recognition. Measurement in subsequent periods depends on the financial instrument’s classification, as described below. ARC does not employ hedge accounting for its risk management contracts currently in place.
| |
| • | Fair value through profit or loss |
Financial assets and liabilities classified as held-for-trading or designated as at fair value through profit or loss are initially recognized and subsequently measured at fair value with changes in those fair values charged immediately to earnings. ARC classifies its cash and cash equivalents, short-term investment, and risk management contracts as held-for-trading.
| |
| • | Held-to-maturity investments, loans and receivables and other financial liabilities |
Held-to-maturity investments, loans and receivables, and other financial liabilities are initially recognized at fair value, net of directly attributable transaction costs, and are subsequently measured at amortized cost using the effective interest method. ARC classifies accounts receivable as loans and receivables, and classifies accounts payable and accrued liabilities, dividends payable, long-term debt, and long-term incentive compensation liability as other financial liabilities.
|
| | |
| ARC Resources Ltd. | Page 60 |
| |
| • | Available-for-sale financial assets |
Non-derivative financial assets may be designated as available for sale so long as they are not classified in another category above. Available-for-sale financial assets are initially recognized at fair value, net of directly attributable transaction costs, and are subsequently measured at fair value with changes in fair value recognized in OCI, net of tax. Transaction costs related to the purchase of available-for-sale assets are recognized in the statements of income. Amounts recognized in OCI for available-for-sale financial assets are charged to earnings when the asset is derecognized or when there is a significant or prolonged decrease in the value of the asset. ARC classifies its reclamation fund assets as available-for-sale assets.
Fair Value Measurement
ARC measures cash and cash equivalents, short-term investment, risk management contracts, and reclamation fund assets at fair value at each reporting date. Fair value less costs of disposal is also calculated at each reporting date to determine the recoverable amount of non-financial assets that are tested for impairment. In addition, the fair value of long-term debt is disclosed in Note 13.
Fair value is the price that would be received to sell an asset or paid to transfer a liability in an orderly transaction between market participants in its principal or most advantageous market at the measurement date. To estimate the fair value of its financial instruments, ARC uses quoted market prices when available, or third-party models and valuation methodologies that use observable market data. Fair value is measured using the assumptions that market participants would use, including transaction-specific details and non-performance risk.
All financial assets and liabilities for which fair value is measured or disclosed in the financial statements are further categorized using a three-level hierarchy that reflects the significance of the lowest level of inputs used in determining fair value:
| |
| • | Level 1 – Quoted prices are available in active markets for identical assets or liabilities as of the reporting date. Active markets are those in which transactions occur in sufficient frequency and volume to provide pricing information on an ongoing basis. |
| |
| • | Level 2 – Pricing inputs are other than quoted prices in active markets included in Level 1. Prices in Level 2 are either directly or indirectly observable as of the reporting date. Level 2 valuations are based on inputs, including quoted forward prices for commodities, time value and volatility factors, which can be substantially observed or corroborated in the marketplace. |
| |
| • | Level 3 – Valuations in this level are those with inputs for the asset or liability that are not based on observable market data. |
At each reporting date, ARC determines whether transfers have occurred between levels in the hierarchy by reassessing the level of classification for each financial asset and financial liability measured or disclosed at fair value in the financial statements based on the lowest level input that is significant to the fair value measurement as a whole. Assessment of the significance of a particular input to the fair value measurement requires judgment and may affect the placement within the fair value hierarchy.
ARC's risk management contracts are subject to master netting agreements that create a legally enforceable right to offset by counterparty the related financial assets and financial liabilities on the Company's balance sheets in all circumstances. ARC manages these contracts on the basis of its net exposure to market risks and therefore measures their fair value consistently with how market participants would price the net risk exposure at the reporting date under current market conditions.
Impairment of Financial Assets
The Company assesses whether there is objective evidence that indicates a financial asset or group of financial assets is impaired at each reporting date. Objective evidence exists if one or more loss events occur after initial recognition of the financial asset which have an impact on the estimated future cash flows of the financial asset and that impact can be reliably measured. Objective evidence of impairment may include indications that a debtor is experiencing significant financial difficulty, that a debtor has breached certain contracts, the probability that a debtor will enter bankruptcy or other financial reorganization, and changes in economic conditions that correlate with defaults.
If a receivable or group of receivables carried at amortized cost is impaired, the amount of the loss is measured as the difference between the amortized cost of the receivable and its recoverable amount. The carrying amount of the asset is reduced through the use of an allowance account and the loss is recognized in general and administrative ("G&A") expenses. If the amount of the impairment loss decreases in a subsequent period because of a specific
|
| | |
| ARC Resources Ltd. | Page 61 |
event, the impairment loss is reversed through the allowance account. Receivables and the associated allowance balance are written off when there is no longer a probability of future recovery.
When a decline in the fair value of an available-for-sale financial asset has been recognized in OCI and there is objective evidence that the asset is impaired, the cumulative loss is measured as the difference between the acquisition cost of the financial asset and its fair value and is reclassified from equity to G&A expenses.
Foreign Currency Translation
Monetary assets and liabilities denominated in a foreign currency are translated at the rate of exchange in effect at the balance sheet date. Revenues and expenses are translated at the period average rates of exchange. Translation gains and losses are included in earnings in the period in which they arise.
ARC’s functional and presentation currency is Canadian dollars.
| |
| 4. | FUTURE ACCOUNTING POLICY CHANGES |
In May 2014, the IASB issued IFRS 15 Revenue from Contracts with Customers, which replaces International Accounting Standard ("IAS") 18 Revenue, IAS 11 Construction Contracts, and related interpretations. The standard is required to be adopted either retrospectively or using a modified transition approach for fiscal years beginning on or after January 1, 2018, with earlier adoption permitted. IFRS 15 will be applied by ARC on January 1, 2018 and the Company is currently evaluating the impact of the standard on ARC's financial statements.
In July 2014, the IASB completed the final elements of IFRS 9 Financial Instruments. The standard supersedes earlier versions of IFRS 9 and completes the IASB’s project to replace IAS 39 Financial Instruments: Recognition and Measurement. IFRS 9, as amended, includes a principle-based approach for classification and measurement of financial assets, a single 'expected loss’ impairment model and a substantially-reformed approach to hedge accounting. The standard will come into effect for annual periods beginning on or after January 1, 2018, with earlier adoption permitted. IFRS 9 will be applied on a retrospective basis by ARC on January 1, 2018 and the Company is currently evaluating the impact of the standard on ARC's financial statements.
In January 2016, the IASB issued IFRS 16 Leases, which replaces IAS 17 Leases. For lessees applying IFRS 16, a single recognition and measurement model for leases would apply, with required recognition of assets and liabilities for most leases. The standard will come into effect for annual periods beginning on or after January 1, 2019, with earlier adoption permitted if the entity is also applying IFRS 15 Revenue from Contracts with Customers. IFRS 16 will be applied by ARC on January 1, 2019 and the Company is currently evaluating the impact of the standard on ARC's financial statements.
| |
| 5. | MANAGEMENT JUDGMENTS AND ESTIMATION UNCERTAINTY |
The timely preparation of financial statements in accordance with IFRS requires Management to use judgments, estimates and assumptions. These estimates and judgments are subject to change and actual results could differ from those estimated. The key sources of estimation uncertainty that have a significant risk of causing material adjustment to the reported amounts of assets, liabilities, revenues, expenses, and the disclosure of contingencies are discussed below.
Crude Oil and Natural Gas Reserves and Resources
There are a number of inherent uncertainties associated with estimating reserves and resources. Reserve and resource estimates are based on engineering data, estimated future prices, expected future rates of production and the timing and amount of future expenditures, all of which are subject to many uncertainties, interpretations and judgments. Estimates reflect market and regulatory conditions existing at December 31, 2015, which could differ significantly from other points in time throughout the year, or future periods. Reserves and resources have been evaluated at December 31, 2015 by ARC's independent qualified reserves evaluators.
Determination of Cash Generating Units
Determination of what constitutes a CGU is subject to Management judgment. The recoverability of development and production asset carrying values are assessed at the CGU level. The asset composition of a CGU can directly impact the recoverability of the assets included therein.
Recoverability of Asset Carrying Values
Management applies judgment in assessing the existence of indicators of impairment and impairment recovery based on various internal and external factors. The recoverable amount of a CGU or an individual asset is determined
|
| | |
| ARC Resources Ltd. | Page 62 |
as the greater of its fair value less costs of disposal and its value in use. The key estimates ARC applies in determining an acceptable range of recoverable amounts normally includes information on future commodity prices, expected production volumes, quantity of reserves and resources, future development and operating costs, discount rates, and income taxes. Refer to Note 11 for further information on the key estimates used and impairment charges recorded for the year ended December 31, 2015.
Depletion of Oil and Gas Assets
Depletion of oil and gas assets is determined based on total proved and probable reserve values as well as future development costs as estimated by ARC’s independent qualified reserves evaluator. See above for discussion of estimates and judgments involved in reserve estimation.
Oil and Gas Activities
The Company applies judgment when classifying the nature of oil and gas activities as E&E or PP&E, and when determining whether capitalization of the initial costs of these activities is appropriate. The Company uses historical drilling results, project economics, resource quantities, production technology expectations, production costs and future development costs to make judgments about future events and circumstances. See above for discussion of estimates and judgments involved in reserve estimation.
Joint Control
Judgment is required to determine when ARC has joint control over an arrangement, which requires an assessment of the capital and operating activities of the projects it undertakes with partners and when the decisions in relation to those activities require unanimous consent.
Provisions
The determination of provisions may be a complex process that involves Management judgments about the outcomes of future events and estimates on timing and amount of expected future cash flows.
Asset Retirement Obligations
The provision for site restoration and abandonment is based on current legal and constructive requirements, technology, price levels and expected plans for remediation. Actual costs and cash outflows can differ from estimates because of changes in laws and regulations, public expectations, market conditions, discovery and analysis of site conditions and changes in technology.
Fair Value of Financial Instruments
The estimated fair value of financial instruments is reliant upon a number of estimated variables including forward commodity prices, foreign exchange rates and interest rates, volatility curves and risk of non-performance. A change in any one of these factors could result in a change to the overall estimated valuation of the instrument.
Share-Based Compensation
Compensation expense accrued for Performance Share Units ("PSUs") awarded under ARC’s Restricted Share Unit and Performance Share Unit Plan (“RSU and PSU Plan”) is dependent on an adjustment to the final number of PSU awards that eventually vest based on a performance multiplier that is estimated by Management. Large fluctuations in compensation expense may occur due to changes in the underlying share price or revised Management estimates of relevant performance factors.
Compensation expense recorded for ARC’s Share Option Plan is based on a binomial-lattice option pricing model. The inputs to this model, including dividend yield, expected volatility, forfeitures and discount rates, rely on Management judgment. Forfeitures are estimated through the vesting period based on past experience and future expectations, and adjusted upon actual vesting.
Compensation expense recorded for ARC's Long-term Restricted Share Award Plan ("LTRSA Plan") is dependent on Management's estimate of the number of restricted shares that will ultimately vest.
Income Taxes
Tax regulations and legislation are subject to change and differing interpretations requiring Management judgment. Deferred tax assets are recognized when it is considered probable that deductible temporary differences will be recovered in future periods, which requires Management judgment. Deferred tax liabilities are recognized when it is considered probable that temporary differences will be payable to tax authorities in future periods, which requires Management judgment. Income tax filings are subject to audits and re-assessments and changes in facts, circumstances and interpretations of the standards may result in a material increase or decrease in the Company’s provision for income taxes.
|
| | |
| ARC Resources Ltd. | Page 63 |
| |
| 6. | CASH AND CASH EQUIVALENTS |
ARC's cash equivalents balance was $167.3 million at December 31, 2015 and was held in investment-grade assets. The cash balance was $7.1 million at December 31, 2014.
| |
| 7. | FINANCIAL ASSETS AND CREDIT RISK |
Credit risk is the risk of financial loss to ARC if a partner or counterparty to a product sales contract or financial instrument fails to meet its contractual obligations. ARC is exposed to credit risk with respect to its accounts receivable, reclamation fund assets, and risk management contracts. Most of ARC’s accounts receivable relate to crude oil and natural gas sales and are subject to typical industry credit risks. Refer to Note 15 which discusses ARC's capital management objectives and policies. ARC manages its credit risk as follows:
| |
| • | by entering into sales contracts with only established, creditworthy counterparties as verified by a third-party rating agency, through internal evaluation or by requiring security such as letters of credit or parental guarantees; |
| |
| • | by limiting exposure to any one counterparty in accordance with ARC’s credit policy; and |
| |
| • | by restricting cash equivalent investments, reclamation fund investments, and risk management transactions to counterparties that are not less than investment grade. |
The majority of the credit exposure on accounts receivable at December 31, 2015 pertains to accrued revenue for December 2015 production volumes. ARC transacts with a number of crude oil and natural gas marketing companies and commodity end users (“commodity purchasers”). Commodity purchasers and marketing companies typically remit amounts to ARC by the 25th day of the month following production. Joint interest receivables are typically collected within one to three months following production.
ARC’s allowance for doubtful accounts was $nil as at December 31, 2015 ($0.6 million as at December 31, 2014). During the year ended December 31, 2015, ARC recognized $0.1 million of additional accounts receivable as non-collectible in the statements of income ($0.6 million for the year ended December 31, 2014).
When determining whether amounts that are past due are collectible, Management assesses the creditworthiness and past payment history of the counterparty, as well as the nature of the past due amount. ARC considers all amounts greater than 90 days to be past due. At December 31, 2015, $1.3 million of accounts receivable are past due, all of which are considered to be collectible ($2.6 million at December 31, 2014).
ARC's accounts receivable was aged as follows at December 31, 2015:
|
| | |
| Accounts Receivable Aging | December 31, 2015 |
|
| Current (less than 30 days) | 110.2 |
|
| 31 - 60 days | 4.7 |
|
| 61 - 90 days | 0.4 |
|
| Past due (more than 90 days) | 1.3 |
|
| December 31, 2015 | 116.6 |
|
Maximum credit risk is calculated as the total recorded value of accounts receivable, reclamation fund assets, and risk management contracts at the balance sheet date. The carrying value of ARC's accounts receivable approximates the fair value of the underlying financial assets.
|
| | |
| ARC Resources Ltd. | Page 64 |
In 2005, ARC established a restricted reclamation fund to finance obligations specifically associated with its Redwater property. Minimum contributions to this fund will be approximately $60.8 million in total over the next 40 years. Under the terms of ARC’s investment policy, cash in the reclamation fund can only be invested in certain securities and require a minimum credit rating for investments of A or higher.
|
| | | | | |
| | Year Ended December 31, 2015 |
| | Year Ended December 31, 2014 |
|
| Balance, beginning of year | 35.2 |
| | 32.6 |
|
| Contributions | 3.4 |
| | 3.7 |
|
Reimbursed expenditures (1) | (5.1 | ) | | (1.8 | ) |
| Interest earned on funds | 0.7 |
| | 0.7 |
|
| Net unrealized gains on available-for-sale assets | 0.1 |
| | — |
|
| Balance, end of year | 34.3 |
| | 35.2 |
|
(1)Amount differs from actual expenditures incurred by ARC due to timing differences.
Required contributions to this fund will vary over time and have been disclosed as commitments in Note 20. Interest earned on the respective investments is retained within the fund.
| |
| 9. | EXPLORATION AND EVALUATION ("E&E") ASSETS |
|
| | |
| Carrying amount |
| Balance, January 1, 2014 | 265.4 |
|
| Additions | 49.4 |
|
| Transfers to property, plant and equipment | (9.0 | ) |
| Intangible exploration and evaluation expenses | (39.4 | ) |
| Balance, December 31, 2014 | 266.4 |
|
| Additions | 33.9 |
|
| Acquisitions | 27.1 |
|
| Assets reclassified as held for sale and disposed in period (Note 10) | (8.4 | ) |
| Exploration and evaluation expenses (Note 11) | (46.9 | ) |
| Change in asset retirement cost | 4.3 |
|
| Balance, December 31, 2015 | 276.4 |
|
ARC has certain E&E properties that have sales of petroleum products associated with production from test wells. For the years ended December 31, 2015 and 2014, these operating results have been recognized in the statements of income and comprised sales of crude oil, natural gas, condensate and natural gas liquids of $7 million and $19.3 million, royalties of $0.2 million and $1 million, operating expenses of $4.2 million and $6.9 million, and transportation expenses of $0.9 million and $1.6 million, respectively. All cash flows associated with E&E assets for the years ended December 31, 2015 and 2014 are reflected in cash flow from operating activities.
|
| | |
| ARC Resources Ltd. | Page 65 |
| |
| 10. | PROPERTY, PLANT AND EQUIPMENT |
|
| | | | | | | | |
| Cost | Development and Production Assets |
| | Administrative Assets |
| | Total |
|
| Balance, January 1, 2014 | 6,858.5 |
| | 54.9 |
| | 6,913.4 |
|
| Additions | 951.9 |
| | 6.5 |
| | 958.4 |
|
| Acquisitions | 71.7 |
| | — |
| | 71.7 |
|
| Transfers from exploration and evaluation | 9.0 |
| | — |
| | 9.0 |
|
| Change in asset retirement cost | 182.8 |
| | — |
| | 182.8 |
|
| Dispositions | (140.9 | ) | | — |
| | (140.9 | ) |
| Assets reclassified as held for sale | (15.9 | ) | | — |
| | (15.9 | ) |
| Balance, December 31, 2014 | 7,917.1 |
| | 61.4 |
| | 7,978.5 |
|
| Additions | 511.9 |
| | 2.5 |
| | 514.4 |
|
| Acquisitions | 16.8 |
| | — |
| | 16.8 |
|
| Change in asset retirement cost | 33.4 |
| | — |
| | 33.4 |
|
| Assets reclassified as held for sale and disposed in period | (498.0 | ) | | — |
| | (498.0 | ) |
| Balance, December 31, 2015 | 7,981.2 |
| | 63.9 |
| | 8,045.1 |
|
| | | |
| Accumulated DD&A and impairment |
| Balance, January 1, 2014 | (1,963.1 | ) | | (21.8 | ) | | (1,984.9 | ) |
| DD&A | (649.2 | ) | | (6.3 | ) | | (655.5 | ) |
| Impairment | (103.0 | ) | | — |
| | (103.0 | ) |
| Accumulated depletion and impairment associated with dispositions | 74.9 |
| | — |
| | 74.9 |
|
Accumulated depletion and impairment reclassified as held for sale
| 10.1 |
| | — |
| | 10.1 |
|
| Balance, December 31, 2014 | (2,630.3 | ) | | (28.1 | ) | | (2,658.4 | ) |
| DD&A | (589.7 | ) | | (6.1 | ) | | (595.8 | ) |
| Impairment (Note 11) | (469.6 | ) | | — |
| | (469.6 | ) |
| Accumulated depletion and impairment reclassified as held for sale and disposed in period | 338.4 |
| | — |
| | 338.4 |
|
| Balance, December 31, 2015 | (3,351.2 | ) | | (34.2 | ) | | (3,385.4 | ) |
| | | | | | |
| Carrying amounts | | | | | |
| Balance, December 31, 2014 | 5,286.8 |
| | 33.3 |
| | 5,320.1 |
|
| Balance, December 31, 2015 | 4,630.0 |
| | 29.7 |
| | 4,659.7 |
|
For the year ended December 31, 2015, $28 million of direct and incremental G&A expenses were capitalized to PP&E ($39.9 million for the year ended December 31, 2014), respectively.
|
| | |
Assets held for sale (1) | |
| Balance, January 1, 2014 | — |
|
| Additions | 71.8 |
|
| Disposals | (66.0 | ) |
| Balance, December 31, 2014 | 5.8 |
|
| Additions | 168.0 |
|
| Disposals | (173.8 | ) |
| Balance, December 31, 2015 | — |
|
| |
| (1) | Includes E&E and PP&E properties. |
|
| | |
| ARC Resources Ltd. | Page 66 |
E&E Assets
During the year ended December 31, 2015, ARC recorded impairment charges totaling $46.9 million on one of its E&E assets where Management had decided to indefinitely delay any further investment to evaluate the asset and sufficient data existed to indicate that the carrying value of the asset would not be fully recovered from any future development or sale. ARC disposed of this E&E asset in 2015.
For the year ended December 31, 2014, ARC recorded impairment charges to its E&E assets totaling $39.4 million. $11.2 million of these charges were recognized on E&E assets where Management had decided to cease exploration activities and $28.2 million was recognized upon the transfer of an E&E asset to PP&E based on an estimated recoverable amount of $9 million.
At December 31, 2015, there were no indicators of impairment for ARC's remaining E&E assets and therefore an impairment test was not performed.
PP&E
ARC conducted tests of impairment in 2015 on all of its CGUs as a result of decreases in the outlook of future commodity prices compared to those at December 31, 2014 as well as, in some CGUs, negative technical reserve revisions in areas with little capital development activity in the current year and decreased undeveloped land fair values. In estimating the recoverable amount of each CGU, the following information was incorporated:
| |
| i) | The net present value of the after-tax cash flows from proved plus probable oil and gas reserves of each CGU based on reserves estimated by ARC’s independent reserve evaluator at December 31, 2015, adjusted for the net present value of the after-tax abandonment and reclamation costs on proved plus probable undeveloped oil and gas reserves. The reserve evaluation is based on an estimated remaining reserve life up to a maximum of 50 years. |
| |
| ii) | The fair value of undeveloped land based on estimates provided by ARC’s independent land evaluator at December 31, 2015. |
| |
| iii) | Where applicable, economic contingent resources associated with interests in certain of ARC's properties. |
| |
| iv) | Recent transactions completed within the industry on assets with similar geological and geographic characteristics within the relevant CGU. |
Key input estimates used in the determination of cash flows from oil and gas reserves include the following:
| |
| a) | Reserves and resources – Assumptions that are valid at the time of reserve and resource estimation may change significantly when new information becomes available. Changes in forward price estimates, production costs, required capital expenditures or recovery rates may change the economic status of reserves and resources and may ultimately result in reserves and resources being revised. |
| |
| b) | Crude oil and natural gas prices – Forward price estimates of the crude oil and natural gas prices are used in the cash flow model. Commodity prices have fluctuated widely in recent years due to global and regional factors including supply and demand fundamentals, inventory levels, exchange rates, weather, economic and geopolitical factors. |
| |
| c) | Discount rate – The discount rate used to calculate the net present value of cash flows is based on estimates of an approximate industry peer group weighted average cost of capital as appropriate for each CGU being tested. Changes in the general economic environment could result in significant changes to this estimate. |
|
| | |
| ARC Resources Ltd. | Page 67 |
The estimated recoverable amounts were based on fair value less costs of disposal calculations using after-tax discount rates that are based on an estimated industry weighted average cost of capital ranging from nine to nine and a half per cent (December 31, 2014: nine to nine and a half per cent) depending on the resource composition of the assets in the CGU, an inflation rate of two per cent, and the following forward commodity price estimates: |
| | | | | | | | |
| | Edmonton Light Crude Oil |
| WTI Oil |
| AECO Gas |
| Cdn$/US$ |
|
| Year | (Cdn$/bbl) (1,2) |
| (US$/bbl) (1,2) |
| (Cdn$/MMbtu) (1,2) |
| Exchange Rates (1,2) |
|
| 2016 | 55.86 |
| 44.00 |
| 2.76 |
| 0.73 |
|
| 2017 | 64.00 |
| 52.00 |
| 3.27 |
| 0.75 |
|
| 2018 | 68.39 |
| 58.00 |
| 3.45 |
| 0.78 |
|
| 2019 | 73.75 |
| 64.00 |
| 3.63 |
| 0.80 |
|
| 2020 | 78.79 |
| 70.00 |
| 3.81 |
| 0.83 |
|
| 2021 | 82.35 |
| 75.00 |
| 3.90 |
| 0.85 |
|
| 2022 | 88.24 |
| 80.00 |
| 4.10 |
| 0.85 |
|
| 2023 | 94.12 |
| 85.00 |
| 4.30 |
| 0.85 |
|
| 2024 | 96.48 |
| 87.88 |
| 4.50 |
| 0.85 |
|
| 2025 | 98.41 |
| 89.63 |
| 4.60 |
| 0.85 |
|
| Remainder | +2.0% per year |
| +2.0% per year |
| +2.0% per year |
| 0.85 |
|
| |
| (1) | Source: GLJ Petroleum Consultants price forecast, effective January 1, 2016. |
| |
| (2) | The forecast benchmark prices listed above are adjusted for quality differentials, heat content and distance to market in performing the Company's impairment tests. |
As a result of the impairment tests conducted during the year ended December 31, 2015, ARC recorded impairment charges to its PP&E of $400 million ($294.2 million net of deferred tax recovery) in the following CGUs: Northern Alberta, Pembina, Redwater, Southern Alberta & Southwest Saskatchewan, and Southeast Saskatchewan & Manitoba ($103 million for the year ended December 31, 2014 in ARC's Northern Alberta CGU).
For ARC's CGUs with impairment charges recorded for the year ended December 31, 2015, the following table summarizes the asset's primary product composition, estimated recoverable amount, estimated discount rate assumed, impairment charges recognized, and after-tax impairment charges:
|
| | | | | | | | | |
| CGU | Primary type of producing assets | Recoverable amount |
| Discount rate (1) |
| Impairment |
| Impairment, net of tax |
|
| Northern Alberta | Crude oil and natural gas | 802.0 |
| 9.0 | % | 120.0 |
| 88.3 |
|
| Pembina | Crude oil | 697.0 |
| 9.0 | % | 120.0 |
| 88.3 |
|
| Redwater | Crude oil | 255.0 |
| 9.0 | % | 75.0 |
| 55.2 |
|
| Southern Alberta & Southwest Saskatchewan | Natural gas | 34.0 |
| 9.5 | % | 15.0 |
| 11.0 |
|
| Southeast Saskatchewan & Manitoba | Crude oil | 533.0 |
| 9.0 | % | 70.0 |
| 51.4 |
|
| Total impairment recorded for the year ended December 31, 2015 |
|
| 400.0 |
| 294.2 |
|
| |
| (1) | After-tax discount rate based on an estimated industry weighted average cost of capital appropriate for the CGU. |
The fair value less costs of disposal values used to determine the recoverable amounts of the impaired PP&E assets are classified as Level 3 fair value measurements as certain key assumptions are not based on observable market data but, rather, Management's best estimates. Refer to Note 3 for information on fair value hierarchy classifications.
The results of the impairment tests conducted during the year ended December 31, 2015 are sensitive to changes in any of the key judgments, such as a revision in reserves or resources, a change in forecast commodity prices, expected royalties, required future development capital expenditures or expected future production costs, which could decrease or increase the recoverable amounts of assets and result in additional impairment charges or recovery of impairment charges.
|
| | |
| ARC Resources Ltd. | Page 68 |
The following table demonstrates the effect of the assumed discount rate and the effect of forecast benchmark commodity prices estimates on impairment charges for each CGU recorded for the year ended December 31, 2015. The sensitivity is based on a one per cent increase and one per cent decrease in the assumed discount rate and a five per cent increase and five per cent decrease in the forecast benchmark commodity price estimate.
|
| | | | | | | | |
| | Increase in Discount Rate of 1 per cent |
| Decrease in Discount Rate of 1 per cent |
| Increase in Commodity Prices of 5 per cent |
| Decrease in Commodity Prices of 5 per cent |
|
| Northern Alberta | 60.0 |
| (28.0 | ) | (17.0 | ) | 57.0 |
|
| Pembina | 117.0 |
| (9.0 | ) | (49.0 | ) | 40.0 |
|
| Redwater | 17.0 |
| (35.0 | ) | (23.0 | ) | 12.0 |
|
| Southern Alberta & Southwest Saskatchewan | 3.0 |
| (2.0 | ) | (3.0 | ) | 3.0 |
|
| Southeast Saskatchewan & Manitoba | 40.0 |
| (70.0 | ) | (70.0 | ) | 43.0 |
|
Impairment charge increase (decrease) | 237.0 |
| (144.0 | ) | (162.0 | ) | 155.0 |
|
Non-Core Asset Disposition
During the year ended December 31, 2015, ARC completed dispositions of certain non-core PP&E assets. As a result of dispositions in its Southern Alberta & Southwest Saskatchewan and Southeast Saskatchewan & Manitoba CGUs, ARC recorded impairment charges of $18.3 million and $51.3 million in DD&A and impairment in the statements of income, respectively.
Goodwill
The carrying value of goodwill at December 31, 2015 is $248.2 million ($248.2 million as at December 31, 2014). This value is supported by the combined excess recoverable amount over the current carrying value of ARC’s operating segment.
| |
| 12. | FINANCIAL LIABILITIES AND LIQUIDITY RISK |
Liquidity risk is the risk that ARC will not be able to meet its financial obligations as they become due. ARC actively manages its liquidity at a reasonable cost through strategies such as continuously monitoring forecast and actual cash flows from operating, financing and investing activities, available credit and working capital facilities under existing banking arrangements, and opportunities to issue additional equity. Management believes that future cash flows generated from these sources will be adequate to settle ARC’s financial liabilities. Refer to Note 13 for further details on available amounts under existing banking arrangements and Note 15 for further details on ARC's capital management objectives and policies.
The following table details the contractual maturities of ARC’s financial liabilities as at December 31, 2015:
|
| | | | | | | | | | |
| | Carrying Amount |
| 1 Year |
| 2-3 Years |
| 4-5 Years |
| Beyond 5 Years |
|
Accounts payable and accrued liabilities (1) | 137.5 |
| 137.5 |
| — |
| — |
| — |
|
| Dividends payable | 34.7 |
| 34.7 |
| — |
| — |
| — |
|
Risk management contracts (2) | 2.3 |
| 1.6 |
| 0.7 |
| — |
| — |
|
| Long-term debt | 1,114.3 |
| 57.9 |
| 134.8 |
| 240.5 |
| 681.1 |
|
| Long-term incentive compensation liability | 19.5 |
| — |
| 19.5 |
| — |
| — |
|
| Total financial liabilities | 1,308.3 |
| 231.7 |
| 155.0 |
| 240.5 |
| 681.1 |
|
| |
| (1) | Includes the portion of the cash obligations associated with the RSU and PSU Plan that will be settled within one year. |
| |
| (2) | Risk management contracts are derivatives. All other financial liabilities contained in this table are non-derivative liabilities. |
The carrying values of ARC's accounts payable and accrued liabilities, dividends payable, and long-term incentive compensation liability approximate their fair values.
|
| | |
| ARC Resources Ltd. | Page 69 |
|
| | | | | | | | | | | |
| | U.S. $ Denominated | | Canadian $ Amount |
| | December 31, 2015 | | December 31, 2014 | | December 31, 2015 | | December 31, 2014 |
| Syndicated credit facilities | | | | | | | |
| Cdn$ denominated | — |
| | — |
| | — |
| | 83.8 |
|
| Senior notes | | | | | | | |
| Master Shelf Agreement | | | | | | | |
| 5.42% US$ note | 18.8 |
| | 28.1 |
| | 26.0 |
| | 32.6 |
|
| 4.98% US$ note | 40.0 |
| | 50.0 |
| | 55.4 |
| | 58.0 |
|
| 3.72% US$ note | 150.0 |
| | 150.0 |
| | 207.6 |
|
| 174.0 |
|
| 2004 note issuance | | |
|
| | | | |
| 5.10% US$ note | 4.8 |
| | 9.6 |
| | 6.6 |
| | 11.1 |
|
| 2009 note issuance | | |
|
| | | | |
| 7.19% US$ note | 13.5 |
| | 27.0 |
| | 18.7 |
| | 31.3 |
|
| 8.21% US$ note | 35.0 |
| | 35.0 |
| | 48.4 |
| | 40.6 |
|
| 6.50% Cdn$ note | — |
| | — |
| | 5.8 |
| | 11.6 |
|
| 2010 note issuance |
|
| |
|
| | | | |
| 5.36% US$ note | 150.0 |
| | 150.0 |
| | 207.6 |
| | 174.0 |
|
| 2012 note issuance |
|
| |
|
| | | | |
| 3.31% US$ note | 60.0 |
| | 60.0 |
| | 83.0 |
| | 69.7 |
|
| 3.81% US$ note | 300.0 |
| | 300.0 |
| | 415.2 |
| | 348.1 |
|
| 4.49% Cdn$ note | — |
| | — |
| | 40.0 |
| | 40.0 |
|
| Total long-term debt outstanding | 772.1 |
| | 809.7 |
| | 1,114.3 |
| | 1,074.8 |
|
| Long-term debt due within one year | | | | | 57.9 |
| | 49.5 |
|
| Long-term debt due beyond one year | | | | | 1,056.4 |
| | 1,025.3 |
|
Credit Facility
ARC has a $1 billion, annually extendable, financial covenant-based syndicated credit facility (“the facility”). The current maturity date of the facility is November 6, 2019. ARC also has in place a $40 million demand working capital facility and letter of credit facilities from two lenders totaling $40 million. Both the working capital facility and the letter of credit facilities are subject to the same covenants as the syndicated credit facility.
Borrowings under the facility bear interest at Canadian bank prime (2.8 per cent at December 31, 2015 and three per cent at December 31, 2014) or US base rate, or, at ARC’s option, Canadian dollar bankers’ acceptances or US dollar LIBOR loan rates, plus applicable margin and stamping fees. The total stamping fees range between 50 basis points and 215 basis points on Canadian bank prime and US base rate borrowings and between 150 basis points and 315 basis points on Canadian dollar bankers’ acceptance and US dollar LIBOR borrowings. The undrawn portion of the facility is subject to a standby fee in the range of 30 to 63 basis points.
The weighted average interest rate under the credit facility was 2.8 per cent for the year ended December 31, 2015 (2.7 per cent for the year ended December 31, 2014).
|
| | |
| ARC Resources Ltd. | Page 70 |
Senior Notes Issued Under a Master Shelf Agreement
These senior notes were issued in three separate tranches pursuant to an uncommitted Master Shelf Agreement. The terms and rates of these senior notes are summarized below:
|
| | | | |
| Issue Date | Remaining Principal | Coupon Rate | Maturity Date | Principal Payment Terms |
| December 15, 2005 | US$18.8 million | 5.42% | December 15, 2017 | Eight equal installments beginning December 15, 2010 |
| March 5, 2010 | US$40 million | 4.98% | March 5, 2019 | Five equal installments beginning March 5, 2015 |
| September 25, 2014 | US$150 million | 3.72% | September 25, 2026 | Five equal installments beginning September 25, 2022 |
Senior Notes Not Subject to the Master Shelf Agreement
The senior notes not subject to the Master Shelf Agreement were issued by way of private placements. The terms and rates of these senior notes are summarized below:
|
| | | | |
| Issue Date | Remaining Principal | Coupon Rate | Maturity Date | Principal Payment Terms |
| April 27, 2004 | US$4.8 million | 5.10% | April 27, 2016 | Five equal installments beginning April 27, 2012 |
| April 14, 2009 | US$13.5 million | 7.19% | April 14, 2016 | Five equal installments beginning April 14, 2012 |
| April 14, 2009 | US$35 million | 8.21% | April 14, 2021 | Five equal installments beginning April 14, 2017 |
| April 14, 2009 | Cdn$5.8 million | 6.50% | April 14, 2016 | Five equal installments beginning April 14, 2012 |
| May 27, 2010 | US$150 million | 5.36% | May 27, 2022 | Five equal installments beginning May 27, 2018 |
| August 23, 2012 | US$60 million | 3.31% | August 23, 2021 | Five equal installments beginning August 23, 2017 |
| August 23, 2012 | US$300 million | 3.81% | August 23, 2024 | Five equal installments beginning August 23, 2020 |
| August 23, 2012 | Cdn$40 million | 4.49% | August 23, 2024 | Five equal installments beginning August 23, 2020 |
Credit Capacity
The following table summarizes ARC’s available credit capacity and the current amounts drawn as at December 31, 2015:
|
| | | | | | | | |
| | Credit Capacity |
| | Drawn |
| | Remaining |
|
| Syndicated credit facility | 1,000.0 |
| | — |
| | 1,000.0 |
|
| Working capital facility | 40.0 |
| | — |
| | 40.0 |
|
Senior notes subject to a Master Shelf Agreement (1) | 484.4 |
| | 288.9 |
| | 195.5 |
|
| Senior notes not subject to a Master Shelf Agreement | 825.4 |
| | 825.4 |
| | — |
|
| Total | 2,349.8 |
| | 1,114.3 |
| | 1,235.5 |
|
| |
| (1) | Total credit capacity is US$350 million. |
Debt Covenants
The following are the significant financial covenants governing the revolving credit facilities:
| |
| • | long-term debt and letters of credit not to exceed three and a quarter times trailing twelve month net income before non-cash items, income taxes and interest expense; |
| |
| • | long-term debt, letters of credit, and subordinated debt not to exceed four times trailing twelve month net income before non-cash items, income taxes and interest expense; and |
| |
| • | long-term debt and letters of credit not to exceed 50 per cent of the book value of shareholders’ equity and long-term debt, letters of credit, and subordinated debt. |
In the event that ARC enters into a material acquisition whereby the purchase price exceeds 10 per cent of the book value of ARC’s assets, the ratio in the first covenant is increased to 3.5 times, while the third covenant is increased
|
| | |
| ARC Resources Ltd. | Page 71 |
to 55 per cent for the subsequent six month period. As at December 31, 2015, ARC had $15.6 million in letters of credit ($15.5 million at December 31, 2014), no subordinated debt, and was in compliance with all covenants.
At December 31, 2015, the fair value of all senior notes is $1,086.4 million ($974.4 million as at December 31, 2014), compared to a carrying value of $1,114.3 million ($991 million as at December 31, 2014).
| |
| 14. | ASSET RETIREMENT OBLIGATIONS |
The total future ARO was estimated by Management based on ARC’s net ownership interest in all wells and facilities, estimated costs to reclaim and abandon the wells and facilities, and the estimated timing of the costs to be incurred in future periods. ARC has estimated the net present value of its total ARO to be $573.2 million as at December 31, 2015 ($616.1 million at December 31, 2014) based on a total future undiscounted liability of $1.2 billion ($1.6 billion at December 31, 2014). At December 31, 2015, Management estimates that these payments are expected to be made over the next 60 years with the majority of payments being made in years 2064 to 2075. The Bank of Canada's long-term risk-free bond rate of 2.2 per cent (2.3 per cent at December 31, 2014) and an inflation rate of 2 per cent (2 per cent at December 31, 2014) were used to calculate the present value of ARO at December 31, 2015.
The following table reconciles ARC’s provision for its ARO:
|
| | | | | |
| | Year Ended December 31, 2015 |
| | Year Ended December 31, 2014 |
|
| Balance, beginning of year | 616.1 |
| | 475.4 |
|
| Increase in liabilities relating to development activities | 5.3 |
| | 12.6 |
|
Increase in liabilities relating to change in estimates and discount rate (1) | 32.4 |
| | 174.2 |
|
| Settlement of obligations | (12.3 | ) | | (23.0 | ) |
| Accretion | 13.4 |
| | 14.9 |
|
| Dispositions | (81.7 | ) | | (32.5 | ) |
| Reclassified as liabilities associated with assets held for sale | — |
| | (5.5 | ) |
| Balance, end of year | 573.2 |
| | 616.1 |
|
| Expected to be incurred within one year | 18.0 |
| | 13.0 |
|
| Expected to be incurred beyond one year | 555.2 |
| | 603.1 |
|
| |
| (1) | Relates to changes in discount rate and anticipated settlement dates of ARO. |
ARC’s objective when managing its capital is to maintain a conservative structure that will allow it to:
| |
| • | fund its development and exploration program; |
| |
| • | provide financial flexibility to execute on strategic opportunities; and |
| |
| • | maintain a dividend policy that, in normal times, in the opinion of Management and the Board of Directors, is sustainable. |
ARC manages the following capital:
| |
| • | net debt, which comprises long-term debt, including the current portion of long-term debt, and working capital deficit (surplus), if any. Working capital surplus or deficit is calculated as current assets less current liabilities, and excludes current unrealized amounts pertaining to risk management contracts, assets held for sale, ARO contained within liabilities associated with assets held for sale, the current portion of long-term debt and current portion of ARO. |
|
| | |
| ARC Resources Ltd. | Page 72 |
When evaluating ARC’s capital structure, Management’s intends to keep its net debt balance to a ratio of less than two times annualized funds from operations during specific periods with a long-term strategy to keep its net debt balance to a ratio of between one to 1.5 times annualized funds from operations and less than 20 per cent of total market capitalization. As at December 31, 2015 ARC’s net debt to funds from operations ratio is 1.3 and its net debt to total market capitalization ratio is 14.5 per cent.
|
| | | | | |
| | Year Ended December 31, 2015 |
| | Year Ended December 31, 2014 |
|
| Cash flow from operating activities | 689.0 |
| | 1,153.0 |
|
| Net change in other liabilities (Note 22) | 22.0 |
| | 20.4 |
|
| Change in non-cash working capital (Note 22) | 62.4 |
| | (49.4 | ) |
| Funds from operations | 773.4 |
| | 1,124.0 |
|
|
| | | | | |
| | December 31, 2015 |
| | December 31, 2014 |
|
Long-term debt (1) | 1,114.3 |
| | 1,074.8 |
|
| Accounts payable and accrued liabilities | 137.5 |
| | 339.1 |
|
| Dividends payable | 34.7 |
| | 32.0 |
|
| Cash and cash equivalents, accounts receivable, prepaid expenses and short-term investment | (301.4 | ) | | (190.0 | ) |
| Net debt obligations | 985.1 |
| | 1,255.9 |
|
| | | | |
| Shares outstanding (millions) | 347.1 |
| | 319.4 |
|
Share price ($) (2) | 16.70 |
| | 25.16 |
|
| Market capitalization | 5,796.6 |
| | 8,036.1 |
|
| Net debt obligations | 985.1 |
| | 1,255.9 |
|
| Total capitalization | 6,781.7 |
| | 9,292.0 |
|
| | | | |
| Net debt as a percentage of total capitalization (%) | 14.5 |
| | 13.5 |
|
| Net debt to funds from operations (ratio) | 1.3 |
| | 1.1 |
|
| |
| (1) | Includes current portion of long-term debt at December 31, 2015 and 2014 of $57.9 million and $49.5 million, respectively. |
| |
| (2) | TSX closing price as at December 31, 2015 and 2014, respectively. |
ARC manages its capital structure and makes adjustments to it in response to changes in economic conditions and the risk characteristics of the underlying assets. ARC is able to change its capital structure by issuing new shares, new debt or changing its dividend policy.
| |
| 16. | FINANCIAL INSTRUMENTS AND MARKET RISK MANAGEMENT |
Fair Value Hierarchy
All of ARC’s financial instruments carried at fair value are transacted in active markets. ARC’s cash and cash equivalents, short-term investment, and reclamation fund assets are classified as Level 1 measurements in the three-level fair value measurement hierarchy and its risk management contracts and fair value disclosure for its long-term debt are classified as Level 2 measurements. ARC does not have any financial instruments classified as Level 3 and there were no transfers between levels in the hierarchy in the year ended December 31, 2015.
|
| | |
| ARC Resources Ltd. | Page 73 |
Financial Assets and Financial Liabilities Subject to Offsetting
The following is a summary of ARC's financial assets and financial liabilities that are subject to offsetting as at December 31, 2015 and 2014:
|
| | | | | | | | | | |
| | Gross Amounts of Recognized Financial Assets (Liabilities) |
| Gross Amounts of Recognized Financial Assets (Liabilities) Offset in Balance Sheet |
| Net Amounts of Financial Assets (Liabilities) Recognized in Balance Sheet Prior to Credit Risk Adjustment |
| Credit Risk Adjustment |
| Net Amounts of Financial Assets (Liabilities) Recognized in Balance Sheet |
|
| As at December 31, 2015 | | | | | |
| Risk management contracts | | | | |
| Current asset | 214.3 |
| (5.0 | ) | 209.3 |
| (1.8 | ) | 207.5 |
|
| Long-term asset | 210.0 |
| (3.5 | ) | 206.5 |
| (1.8 | ) | 204.7 |
|
| Current liability | (6.6 | ) | 5.0 |
| (1.6 | ) | — |
| (1.6 | ) |
| Long-term liability | (4.2 | ) | 3.5 |
| (0.7 | ) | — |
| (0.7 | ) |
| Net position | 413.5 |
| — |
| 413.5 |
| (3.6 | ) | 409.9 |
|
| | | | | | |
| As at December 31, 2014 | | | | | |
| Risk management contracts | | | | |
| Current asset | 151.0 |
| (18.2 | ) | 132.8 |
| (1.0 | ) | 131.8 |
|
| Long-term asset | 132.1 |
| (3.1 | ) | 129.0 |
| (1.0 | ) | 128.0 |
|
| Current liability | (19.2 | ) | 18.2 |
| (1.0 | ) | — |
| (1.0 | ) |
| Long-term liability | (4.1 | ) | 3.1 |
| (1.0 | ) | — |
| (1.0 | ) |
| Net position | 259.8 |
| — |
| 259.8 |
| (2.0 | ) | 257.8 |
|
Market Risk Management
ARC is exposed to a number of market risks that are part of its normal course of business. Market risks that could adversely affect the value of the Company’s financial assets, liabilities and expected future cash flows include commodity price risk, interest rate risk, and foreign exchange risk. ARC has a risk management program in place that includes financial instruments as disclosed in the risk management contracts section of this note.
ARC’s senior Management oversees the Company’s risk management program and the program is governed by certain guidelines approved by the Risk Committee of the Board of Directors. The objective of the risk management program is to support ARC’s business plan by mitigating adverse changes in commodity prices, interest rates and foreign exchange rates in order to reduce the volatility of revenues, increase the certainty of funds from operations, and to protect acquisition and development economics. All risk management activities are performed by specialist teams that have the appropriate skills, experience and supervision.
ARC has prepared sensitivity analyses in an attempt to demonstrate the hypothetical effect of changes in these market risk factors on ARC’s net income. For the purposes of the sensitivity analyses, the effect of a variation in a particular variable is calculated independently of any change in another variable. In reality, changes in one factor may contribute to changes in another, which may magnify or counteract the sensitivities. The assumptions made to derive the changes in the relevant risk variables in each sensitivity analysis are based on Management’s assessment of reasonably possible changes that could occur at December 31, 2015. The results of the sensitivity analyses should not be considered to be predictive of future performance.
Commodity Price Risk
ARC’s operational results and financial condition are largely dependent on the commodity prices received for its crude oil and natural gas production. Commodity prices have fluctuated widely during recent years due to global and regional factors including supply and demand fundamentals, inventory levels, weather, economic, and geopolitical factors. Movement in commodity prices could have a significant positive or negative impact on ARC’s net income.
The guidelines for ARC’s risk management program currently restrict the amount of risk management contracts to a maximum of 55 per cent of total forecast production whereby a specific commodity (crude oil or natural gas) cannot exceed a maximum of 70 per cent of forecast production for that commodity over the next two years, and with a maximum of 25 percent of forecast natural gas production in risk management contracts beyond two years and up to five years. ARC’s risk management program guidelines allow for further risk management contracts on anticipated
|
| | |
| ARC Resources Ltd. | Page 74 |
volumes associated with new production arising from specific capital projects and acquisitions or to further protect cash flows for a specific period with approval of the Board.
ARC manages the risks associated with changes in commodity prices by entering into a variety of risk management contracts (see Risk Management Contracts section below). The following table illustrates the effects of movement in commodity prices on net income due to changes in the fair value of risk management contracts in place at December 31, 2015. The sensitivity is based on a US$5 increase and decrease in the price of West Texas Intermediate ("WTI"), a US$0.50 increase and decrease in the price of New York Mercantile Exchange ("NYMEX") natural gas, a 10 per cent increase and decrease in the Alberta natural gas trading price ("AECO") basis relative to NYMEX, and a Cdn$10 increase and decrease in the Alberta Electric System Operator ("AESO") power price.
|
| | | | | | | | | | | | |
| Sensitivity of Commodity Price Risk Management Contracts |
| | Increase in Commodity Price | Decrease in Commodity Price |
| | Crude Oil |
| Natural Gas |
| Electricity |
| Crude Oil |
| Natural Gas |
| Electricity |
|
| Net income increase (decrease) | (21.3 | ) | (121.8 | ) | 0.4 |
| 21.6 |
| 119.5 |
| (0.9 | ) |
ARC enters into physical commodity contracts in the normal course of business. These contracts are not derivatives and are treated as executory contracts, which are recognized at cost at the time of transaction.
Interest Rate Risk
ARC may manage its interest cost using a mix of both fixed and variable interest rates on its debt. Changes in interest rates could result in an increase or decrease in the amount ARC pays to service variable interest rate debt. Changes in interest rates could also result in fair value risk on ARC’s fixed rate senior notes. Fair value risk of the senior notes is mitigated due to the fact that ARC generally does not intend to settle its fixed rate debt prior to maturity.
At December 31, 2015, ARC did not hold any variable interest rate debt and therefore was not exposed to interest rate risk on its long-term debt.
Foreign Exchange Risk
North American crude oil and natural gas prices are based upon US dollar denominated commodity prices. As a result, the price received by Canadian producers is affected by the Cdn$/US$ foreign exchange rate that may fluctuate over time. In addition, ARC has US dollar denominated debt and interest obligations of which future cash repayments are directly impacted by the exchange rate in effect on the repayment date.
The following table demonstrates the effect of exchange rate movements on net income due to changes in the fair value of risk management contracts in place at December 31, 2015 as well as the unrealized gain or loss on revaluation of outstanding US dollar denominated debt. The sensitivity is based on a $0.10 increase and decrease in the Cdn$/US$ foreign exchange rate.
|
| | | | | |
| Sensitivity of Foreign Exchange Exposure | Increase in Cdn$/US$ rate |
| | Decrease in Cdn$/US$ rate |
|
| Risk management contracts | 13.4 |
| | (15.5 | ) |
| US dollar denominated debt | (56.7 | ) | | 56.7 |
|
| Net income increase (decrease) | (43.3 | ) | | 41.2 |
|
Increases and decreases in foreign exchange rates applicable to US dollar denominated payables and receivables would have a nominal impact on ARC’s net income for the year ended December 31, 2015.
Risk Management Contracts
The following is a summary of all risk management contracts in place, excluding premiums, as at December 31, 2015. Risk management contract premiums have been disclosed as commitments in Note 20. |
| | | | | |
Financial Cdn$ WTI Crude Oil Contracts (1) |
| | | Volume | Bought Put | Sold Call |
| Term | Contract | bbl/d | Cdn$/bbl | Cdn$/bbl |
| 1-Jan-16 | 30-Jun-17 | Collar | 3,000 | 70.00 | 83.38 |
| |
| (1) | Settled on the monthly average price (monthly average US$/bbl multiplied by the Bank of Canada monthly average noon day rate). |
|
| | |
| ARC Resources Ltd. | Page 75 |
|
| | | | |
Financial Cdn$ WTI Crude Oil Swap Contracts (2) |
| | | Volume | Sold Swap |
| Term | Contract | bbl/d | Cdn$/bbl |
| 1-Jan-16 | 31-Dec-16 | Swap | 7,000 | 77.20 |
| |
| (2) | Settled on the monthly average price (monthly average US$/bbl multiplied by the Bank of Canada monthly average noon day rate). |
|
| | | | | |
Financial MSW Crude Oil Contracts (3) |
| | | Volume | Sold Swap |
|
| Term | Contract | bbl/d | US$/bbl |
|
| 1-Jan-16 | 31-Dec-16 | Swap | 9,500 | (3.75 | ) |
| |
| (3) | Settled on the monthly average Mixed Sweet Blend ("MSW") Differential to WTI. The MSW differential refers to the discount between WTI and the mixed sweet crude grade at Edmonton, calculated on a monthly weighted average basis. |
|
| | | | | | | |
Financial NYMEX Natural Gas Contracts (4) | |
| | | | Volume | Bought Put |
| Sold Call |
|
| Term | Contract | MMbtu/d | US$/MMbtu |
| US$/MMbtu |
|
| 1-Jan-16 | 31-Dec-16 | Collar | 105,000 | 4.00 |
| 4.79 |
|
| 1-Jan-17 | 31-Dec-17 | Collar | 145,000 | 4.00 |
| 4.81 |
|
| 1-Jan-18 | 31-Dec-18 | Collar | 80,000 | 4.00 |
| 4.91 |
|
| 1-Jan-18 | 31-Dec-19 | Collar | 10,000 | 4.00 |
| 5.00 |
|
| 1-Jan-19 | 31-Dec-19 | Collar | 30,000 | 4.00 |
| 5.00 |
|
| |
| (4) | NYMEX Henry Hub "Last Day" Settlement. |
|
| | | | |
Financial NYMEX Natural Gas Swap Contracts (5) |
| | | Volume | Sold Swap |
| Term | Contract | MMbtu/d | US$/MMbtu |
| 1-Jan-16 | 31-Dec-16 | Swap | 40,000 | 4.00 |
| |
| (5) | NYMEX Henry Hub "Last Day" Settlement. |
|
| | | | | |
Financial AECO Natural Gas Swap Contracts (6) |
| | | Volume | Sold Swap |
|
| Term | Contract | GJ/d | Cdn$/GJ |
|
| 1-Jan-16 | 31-Dec-16 | Swap | 30,000 | 2.99 |
|
| 1-Jan-20 | 31-Dec-20 | Swap | 25,000 | 3.36 |
|
| |
| (6) | AECO Monthly (7a) index Cdn$/GJ. |
|
| | |
| ARC Resources Ltd. | Page 76 |
|
| | | | |
Financial AECO Basis Swap Contracts (7) |
| | | Volume | Ratio Sold Swap % |
| Term | Contract | MMbtu/d | AECO/NYMEX |
| 1-Jan-16 | 31-Dec-16 | Swap | 10,000 | 88.4 |
| 1-Jan-16 | 31-Dec-17 | Swap | 110,000 | 90.6 |
| 1-Jan-16 | 30-Jun-18 | Swap | 20,000 | 89.9 |
| 1-Jan-17 | 31-Dec-17 | Swap | 10,000 | 86.1 |
| 1-Jan-17 | 31-Dec-18 | Swap | 10,000 | 77.1 |
| 1-Jan-18 | 31-Dec-18 | Swap | 45,000 | 81.9 |
| 1-Jan-18 | 30-Jun-19 | Swap | 20,000 | 90.8 |
| 1-Jul-18 | 31-Dec-18 | Swap | 20,000 | 85.4 |
| 1-Jan-19 | 31-Dec-19 | Swap | 30,000 | 81.5 |
| 1-Jul-19 | 31-Dec-19 | Swap | 20,000 | 80.7 |
| 1-Jan-20 | 31-Dec-20 | Swap | 10,000 | 82.5 |
| |
| (7) | ARC receives NYMEX price based on Last Day settlement multiplied by AECO/NYMEX US$/MMbtu ratio; ARC pays AECO Monthly (7a) index US$/MMbtu. |
|
| | | | |
Financial Electricity Heat Rate Contracts (8) |
| | | Volume | Heat Rate |
| Term | Contract | MWh | GJ/MWh |
| 1-Jan-16 | 31-Dec-17 | Heat Rate Swap | 20 | 13.71 |
| |
| (8) | ARC pays AECO Monthly (5a) x Heat Rate; ARC receives floating AESO Power Price. |
|
| | | | |
Financial Electricity Contracts (9) |
| | | Volume | Bought Swap |
| Term | Contract | MWh | Cdn$/MWh |
| 1-Jan-16 | 31-Dec-16 | Fixed Rate Swap | 5 | 51.00 |
| |
| (9) | Alberta Power Pool (monthly average 24x7). |
The major components of income tax expense for the years ended December 31, 2015 and 2014 were as follows:
|
| | | | | |
| | December 31, 2015 |
| | December 31, 2014 |
|
| Current: | | | |
| Current year | 2.5 |
| | 87.1 |
|
| Adjustments for prior years | (11.5 | ) | | (16.8 | ) |
| | (9.0 | ) | | 70.3 |
|
| Deferred: |
| |
|
| Origination and reversal of temporary differences | (39.0 | ) | | 53.0 |
|
| Adjustments for prior years | 3.9 |
| | 7.4 |
|
| Changes in tax rates and legislation | 28.3 |
| | (1.3 | ) |
| | (6.8 | ) | | 59.1 |
|
| Total provision for income taxes | (15.8 | ) | | 129.4 |
|
|
| | |
| ARC Resources Ltd. | Page 77 |
The tax provision differs from the amount computed by applying the combined Canadian federal and provincial statutory income tax rates to income before income tax expense as follows:
|
| | | | | |
| | December 31, 2015 |
| | December 31, 2014 |
|
| Income before tax | (358.5 | ) | | 510.2 |
|
Canadian statutory rate (1) | 26.1 | % | | 25.4 | % |
| Expected income tax expense at statutory rates | (93.6 | ) | | 129.8 |
|
| Effect on income tax of: |
|
| |
|
|
| Change in corporate tax rate | 27.1 |
| | (1.3 | ) |
| Non-deductible portion of unrealized foreign exchange losses | 23.1 |
| | 10.0 |
|
| Change in estimated pool balances | (7.6 | ) | | (9.4 | ) |
| Unrecognized deferred tax asset on unrealized foreign exchange losses | 34.2 |
| | — |
|
| Other | 1.0 |
| | 0.3 |
|
| Total provision for income taxes | (15.8 | ) | | 129.4 |
|
| |
| (1) | The tax rate consists of the combined federal and provincial statutory tax rates for the Company and its subsidiaries for the years ended December 31, 2015 and 2014. The combined federal and provincial tax rate increased to 26.1% in 2015 from 25.4% in 2014 due to the Alberta corporate tax rate increasing from 10% to 12% effective July 1, 2015. |
|
| | | | | |
| | December 31, 2015 |
| | December 31, 2014 |
|
| Deferred tax liabilities: | | | |
| PP&E in excess of tax basis | 709.0 |
| | 780.6 |
|
| Risk management contracts | 109.5 |
| | 66.2 |
|
| |
| |
|
| Deferred tax assets: |
| |
|
| Asset retirement obligations | (152.3 | ) | | (158.4 | ) |
| Long-term debt | (34.2 | ) | | (10.8 | ) |
| Risk management contracts | (0.6 | ) | | (0.5 | ) |
| Long-term incentive compensation expense | (10.4 | ) | | (15.2 | ) |
| Unrecognized deferred tax asset on unrealized foreign exchange losses | 34.2 |
| | — |
|
| Other | (7.1 | ) | | (2.6 | ) |
| Deferred taxes | 648.1 |
| | 659.3 |
|
|
| | |
| ARC Resources Ltd. | Page 78 |
A continuity of deferred taxes is detailed in the following table:
|
| | | | | | | | |
| | Balance, December 31, 2014 |
| Recognized in Profit or Loss |
| Recognized in Equity |
| Balance, December 31, 2015 |
|
| | Asset (Liability) |
| Asset (Liability) |
| | Asset (Liability) |
|
| | | | | |
| Property, plant and equipment | (780.6 | ) | 71.6 |
| — |
| (709.0 | ) |
| Risk management contracts | (65.7 | ) | (43.2 | ) | — |
| (108.9 | ) |
| Long-term debt | 10.8 |
| 23.4 |
| — |
| 34.2 |
|
| Asset retirement obligation | 158.4 |
| (6.1 | ) | — |
| 152.3 |
|
| Long-term incentive compensation expense | 15.2 |
| (4.8 | ) | — |
| 10.4 |
|
| Unrecognized deferred tax asset on unrealized foreign exchange losses | — |
| (34.2 | ) | — |
| (34.2 | ) |
| Other | 2.6 |
| 0.1 |
| 4.4 |
| 7.1 |
|
| Total | (659.3 | ) | 6.8 |
| 4.4 |
| (648.1 | ) |
At December 31, 2015, the petroleum and natural gas properties and facilities owned by ARC have an approximate federal tax basis of $2.3 billion ($2.5 billion in 2014) available for future use as deductions from taxable income.
The following is a summary of the estimated ARC tax pools:
|
| | | | | |
| | December 31, 2015 |
| | December 31, 2014 |
|
| Canadian oil and gas property expense | 595.2 |
| | 710.9 |
|
| Canadian development expense | 877.1 |
| | 974.6 |
|
| Canadian exploration expense | — |
| | — |
|
| Undepreciated capital cost | 791.4 |
| | 834.5 |
|
| Other | 21.8 |
| | 10.8 |
|
| Total federal tax pools | 2,285.5 |
| | 2,530.8 |
|
| Additional Alberta tax pools | 8.6 |
| | 19.9 |
|
A deferred tax asset has not been recognized with respect to capital losses relating to unrealized foreign exchange losses on US denominated debt in the amount $257.2 million, as it is not considered probable that the benefit of the capital losses will be realized. Recognition is dependent on the realization of future taxable capital gains.
A deferred tax liability has not been recognized in respect of temporary differences associated with the investment in the partnership, as there are future plans to internally wind-up the partnership on a tax deferred basis using provisions under the Federal Income Tax Act. The taxable temporary differences associated with the investment in the partnership at December 31, 2015 are approximately $2.3 billion ($3 billion at December 31, 2014).
|
| | |
| ARC Resources Ltd. | Page 79 |
ARC is authorized to issue an unlimited number of no par value common shares and 50 million preferred shares without nominal or par value. Common shares carry one vote per share and the right to dividends. Preferred shares may be issued in series with rights and conditions to be determined by ARC's Board of Directors prior to issuance and subject to the Company’s articles. There are no outstanding preferred shares as at December 31, 2015 or 2014.
|
| | | | | |
| (thousands of shares) | Year Ended December 31, 2015 |
| | Year Ended December 31, 2014 |
|
| Common shares, beginning of year | 319,439 |
| | 314,067 |
|
| Equity offering | 17,859 |
| | — |
|
Restricted shares issued pursuant to the LTRSA (1) Plan | 100 |
| | — |
|
| Forfeited restricted shares pursuant to the LTRSA Plan | (7 | ) | | — |
|
| Unvested restricted shares held in trust pursuant to the LTRSA Plan | (93 | ) | | — |
|
| Cancelled shares | (1 | ) | | (47 | ) |
| Dividend reinvestment program | 7,563 |
| | 4,159 |
|
| Stock dividend program | 2,224 |
| | 1,260 |
|
| Common shares, end of year | 347,084 |
| | 319,439 |
|
| |
| (1) | Long-term Restricted Share Award. |
Net income (loss) per common share has been determined based on the following:
|
| | | | | |
(thousands of shares) | Year Ended December 31, 2015 |
| | Year Ended December 31, 2014 |
|
| Weighted average common shares | 340,542 |
| | 316,621 |
|
Dilutive impact of share-based compensation (1) | — |
| | 587 |
|
| Weighted average common shares - diluted | 340,542 |
| | 317,208 |
|
| |
| (1) | Excludes impact of 3.2 million weighted average common shares related to share options and 0.1 million weighted average common shares related to LTRSAs that were anti-dilutive for the year ended December 31, 2015 (0.6 million weighted average common shares related to share options for the year ended December 31, 2014). |
In January 2015, ARC issued 17.9 million common shares at a price of $22.55 per share for aggregate gross proceeds of $402.7 million on a bought deal basis. Share issue costs of $16.6 million were incurred as a result of this transaction.
Dividends declared for the years ended December 31, 2015 and 2014 were $1.20 per common share, respectively.
On January 18, 2016, the Board of Directors declared a dividend of $0.10 per common share, payable in cash or common shares under the Stock Dividend Program, to shareholders of record on January 29, 2016. The dividend payment date is February 16, 2016. Of the $34.7 million in dividends payable at December 31, 2015, $4.5 million is payable in common shares under the Stock Dividend Program ($4.2 million at December 31, 2014).
| |
| 19. | SHARE-BASED COMPENSATION PLANS |
RSU and PSU Plan
ARC’s share-based long-term incentive plan results in employees, officers and directors (the “plan participants”) receiving cash compensation in relation to the value of a specified number of underlying notional share units. The RSU and PSU Plan consists of Restricted Share Units ("RSUs") for which the number of share units is fixed and will vest evenly over a period of three years and PSUs for which the number of share units is variable and will vest at the end of three years.
Upon vesting of the RSUs, the plan participant receives a cash payment based on the fair value of the underlying share units plus all dividends accrued since the grant date. The cash compensation of the PSUs issued upon vesting is further dependent upon an adjustment to the final number of PSU awards that eventually vest based on a performance multiplier. The performance multiplier is calculated at the time of payment using the percentile rank of ARC’s total shareholder return relative to its peers and can result in cash compensation issued upon vesting of the PSUs ranging from zero to two times the value of the PSUs originally granted.
|
| | |
| ARC Resources Ltd. | Page 80 |
Deferred Share Unit Plan (“DSU Plan”)
ARC offers a DSU Plan to non-employee directors, under which each director receives a minimum of 60 per cent of their total annual remuneration in the form of Deferred Share Units ("DSUs"). Each DSU fully vests on the date of grant, but is distributed only when the director has ceased to be a member of the Board of Directors of the Company. Compensation expense associated with the DSU Plan is based on the fair value of DSUs at the date of grant, adjusted to the current fair value of outstanding awards at each period end. Units are settled in cash based on the common share price plus accrued dividends.
The following table summarizes the RSU, PSU and DSU movement for the years ended December 31, 2015 and 2014:
|
| | | | | | | | |
| (number of units, thousands) | RSUs |
| | PSUs (1) |
| | DSUs |
|
| Balance, January 1, 2014 | 638 |
| | 1,492 |
| | 159 |
|
| Granted | 327 |
| | 494 |
| | 61 |
|
| Distributed | (299 | ) | | (435 | ) | | — |
|
| Forfeited | (41 | ) | | (38 | ) | | — |
|
| Balance, December 31, 2014 | 625 |
| | 1,513 |
| | 220 |
|
| Granted | 464 |
| | 702 |
| | 97 |
|
| Distributed | (294 | ) | | (493 | ) | | — |
|
| Forfeited | (65 | ) | | (145 | ) | | — |
|
| Balance, December 31, 2015 | 730 |
| | 1,577 |
| | 317 |
|
| |
| (1) | Based on underlying units before any effect of the performance multiplier. |
Compensation charges relating to the RSU and PSU Plan and DSU Plan can be reconciled as follows:
|
| | | | | |
| | Year Ended December 31, 2015 |
| | Year Ended December 31, 2014 |
|
| G&A expenses | 2.4 |
| | 22.7 |
|
| Operating expense | 1.6 |
| | 3.8 |
|
| PP&E | 1.0 |
| | 4.3 |
|
| Total compensation charges | 5.0 |
| | 30.8 |
|
| Cash payments | 25.3 |
| | 39.4 |
|
At December 31, 2015, $20 million of compensation amounts payable were included in accounts payable and accrued liabilities on the balance sheet ($30.9 million at December 31, 2014) and $19.5 million was included in the long-term incentive compensation liability ($29.1 million at December 31, 2014). A recoverable amount of $0.3 million was included in accounts receivable at December 31, 2015 ($0.5 million at December 31, 2014).
Share Option Plan
Share options are granted to officers and certain employees of ARC which vest evenly on the fourth and fifth anniversary of their grant date and have a maximum term of seven years. The option holder has the right to exercise the options and purchase one common share per option at the original grant price or at a reduced exercise price, equal to the grant price less all dividends paid subsequent to the grant date and prior to the exercise date. The original grant price is calculated as the weighted average trading price of ARC common shares for the five days immediately preceding the grant date.
|
| | |
| ARC Resources Ltd. | Page 81 |
The changes in total share options outstanding and related weighted average exercise prices for the years ended December 31, 2015 and 2014 were as follows:
|
| | | | | |
| | Share Options (number of units, thousands) |
| | Weighted Average Exercise Price ($) |
|
| Balance, January 1, 2014 | 2,022 |
| | 22.12 |
|
| Granted | 569 |
| | 32.94 |
|
| Forfeited | (86 | ) | | 23.85 |
|
| Balance, December 31, 2014 | 2,505 |
| | 23.43 |
|
| Granted | 999 |
| | 21.86 |
|
| Forfeited | (283 | ) | | 22.30 |
|
| Balance, December 31, 2015 | 3,221 |
| | 21.95 |
|
| Exercisable, December 31, 2015 | 174 |
| | 21.41 |
|
The following table summarizes information regarding share options outstanding at December 31, 2015:
|
| | | | | | | | | | |
| Range of exercise price per common share ($) | Number of share options outstanding (thousands) |
| Weighted average exercise price per share for options outstanding ($) |
| Weighted average remaining term (years) |
| Number of share options exercisable (thousands) |
| Weighted average exercise price per share for options exercisable ($) |
|
| 16.00 - 20.00 | 852 |
| 16.00 |
| 3.47 |
| — |
| — |
|
| 20.01 - 25.00 | 1,865 |
| 22.18 |
| 5.09 |
| 174 |
| 21.41 |
|
| 25.01 - 31.14 | 504 |
| 31.14 |
| 5.47 |
| — |
| — |
|
| Total | 3,221 |
| 21.95 |
| 4.72 |
| 174 |
| 21.41 |
|
ARC estimates the fair value of share options granted on the date of grant using a binomial-lattice option pricing model. The following assumptions were used to measure the grant date fair values of share options granted during the years ended December 31, 2015 and 2014:
|
| | | | |
| | Year Ended December 31, 2015 |
| | Year Ended December 31, 2014 |
| Grant date share price ($) | 21.86 |
| | 32.94 |
Exercise price ($) (1) | 21.26 |
| | 32.34 |
| Expected annual dividends ($) | 1.20 |
| | 1.20 |
Expected volatility (%) (2) | 37.00 |
| | 37.00 |
| Risk-free interest rate (%) | 1.40 |
| | 2.09 |
| Expected forfeiture rate (%) | — |
| | — |
Expected life of share option (3) | 5.5 to 6 years |
| | 5.5 to 6 years |
| Fair value per share option ($) | 5.68 |
| | 10.21 |
| |
| (1) | Exercise price is reduced monthly by the amount of dividend declared. |
| |
| (2) | Expected volatility is determined by the average price volatility of the common shares/trust units over the past seven years. |
| |
| (3) | Expected life of the share option is calculated as the mid-point between vesting date and expiry. |
ARC recorded compensation expense of $3.4 million relating to the share option plan for the year ended December 31, 2015 ($2.7 million for the year ended December 31, 2014). During the year ended December 31, 2015, $0.4 million of share option compensation charges were capitalized to PP&E ($0.2 million for the year ended December 31, 2014).
LTRSA Plan
On April 30, 2015, at its Annual and Special Meeting of Shareholders, ARC shareholders approved a new LTRSA Plan to award shares of ARC to qualifying officers and employees. The first grant of the LTRSA Plan occurred on June 24, 2015.
|
| | |
| ARC Resources Ltd. | Page 82 |
LTRSA grants consist of restricted common shares that are awarded at the date of grant and a cash payment made equal to the estimated personal tax obligation associated with the total award. The restricted shares issued on the grant date of the award are held in trust until the vesting conditions have been met.
While in trust, the restricted shares earn dividends which are reinvested into ARC common shares through the stock dividend program. These common shares issued through the stock dividend program are also held in trust until vested. Each LTRSA vests evenly on the eighth, ninth, and tenth anniversaries of their respective grant dates. Restricted shares and any accrued dividends that are subject to forfeiture will be redeemed and cancelled by ARC.
Compensation expense associated with the cash payments made under the LTRSA Plan is recognized immediately, while compensation expense associated with the restricted common shares is recognized over the vesting period with a corresponding charge to contributed surplus. Upon vesting, ARC recognizes an increase in share capital with a corresponding reduction to contributed surplus. The dilutive effect of outstanding LTRSAs is reflected as additional share dilution in the computation of earnings per share.
The estimated fair value of LTRSAs is determined as the weighted average trading price of ARC common shares for the five days immediately preceding the grant date. The changes in total LTRSA outstanding and related fair value per restricted share for the year ended December 31, 2015 were as follows:
|
| | | | | |
| | LTRSA (number of units, thousands) |
| | Fair Value per Restricted Share ($) |
|
| Balance, December 31, 2014 | — |
| | — |
|
| Granted | 100 |
| | 21.56 |
|
| Forfeited | (7 | ) | | 21.86 |
|
| Balance, December 31, 2015 | 93 |
| | 21.54 |
|
ARC recorded G&A expenses of $0.7 million relating to the cash payment under the LTRSA Plan for the year ended December 31, 2015 ($nil for the year ended December 31, 2014).
| |
| 20. | COMMITMENTS AND CONTINGENCIES |
The following is a summary of ARC’s contractual obligations and commitments as at December 31, 2015:
|
| | | | | | | | | | |
| | Payments Due by Period |
| | 1 Year |
| 2-3 Years |
| 4-5 Years |
| Beyond 5 Years |
| Total |
|
Debt repayments (1) | 57.9 |
| 134.8 |
| 240.5 |
| 681.1 |
| 1,114.3 |
|
Interest payments (2) | 48.0 |
| 86.6 |
| 70.3 |
| 71.5 |
| 276.4 |
|
Reclamation fund contributions (3) | 3.3 |
| 6.2 |
| 5.7 |
| 45.6 |
| 60.8 |
|
| Purchase commitments | 57.1 |
| 22.6 |
| 8.6 |
| 5.4 |
| 93.7 |
|
| Transportation commitments | 84.5 |
| 166.1 |
| 112.0 |
| 290.5 |
| 653.1 |
|
| Operating leases | 15.5 |
| 29.6 |
| 27.4 |
| 45.1 |
| 117.6 |
|
Risk management contract premiums (4) | 4.5 |
| 5.8 |
| 0.5 |
| — |
| 10.8 |
|
| Total contractual obligations and commitments | 270.8 |
| 451.7 |
| 465.0 |
| 1,139.2 |
| 2,326.7 |
|
| |
| (1) | Long-term and current portion of long-term debt. |
| |
| (2) | Fixed interest payments on senior notes. |
| |
| (3) | Contribution commitments to a restricted reclamation fund associated with the Redwater property. |
| |
| (4) | Fixed premiums to be paid in future periods on certain commodity price risk management contracts. |
In addition to the above risk management contract premiums, ARC has commitments related to its risk management program (see Note 16). As the premiums are related to the underlying risk management contracts, they have been recorded at fair market value at December 31, 2015 on the balance sheet as part of risk management contracts.
ARC enters into commitments for capital expenditures in advance of the expenditures being made. At a given point in time, it is estimated that ARC has committed to capital expenditures equal to approximately one quarter of its capital budget by means of giving the necessary authorizations to incur the expenditures in a future period.
ARC is involved in litigation and claims arising in the normal course of operations. Such claims are not expected to have a material impact on ARC’s results of operations or cash flows.
|
| | |
| ARC Resources Ltd. | Page 83 |
Interest in Partnership
ARC owns a 99.99% interest in the ARC Resources General Partnership. The other 0.01% of the partnership is owned by 1504793 Alberta Ltd, a 100% owned subsidiary of ARC. ARC’s oil and gas properties are owned and administered by the partnership. ARC is also the sole beneficiary of the Redwater A&R Trust, which administers the reclamation fund on ARC’s behalf.
Key Management Personnel Compensation
ARC has determined that the key management personnel of ARC consists of its officers and directors. Short-term benefits are composed of salaries and directors' fees, annual bonuses, and other benefits. In addition, the Company provides share-based compensation to its key management personnel under the RSU and PSU, DSU, LTRSA and Share Option Plans. The compensation expense included in G&A expenses relating to key management personnel for the year is as follows:
|
| | | | | |
| | Year Ended December 31, 2015 |
| | Year Ended December 31, 2014 |
|
| Short-term benefits | 7.2 |
| | 8.0 |
|
| Share-based compensation | 1.6 |
| | 15.6 |
|
| Total key management personnel compensation | 8.8 |
| | 23.6 |
|
| |
| 22. | SUPPLEMENTAL DISCLOSURES |
Presentation in the Statements of Income
ARC’s statements of income are prepared primarily by nature of item, with the exception of employee compensation expenses which are included in both operating and G&A expense line items.
The following table details the amount of total employee compensation expenses included in operating and G&A expense line items in the statements of income:
|
| | | | | |
| | Year Ended |
| | Year Ended |
|
| | December 31, 2015 |
| | December 31, 2014 |
|
| Operating | 35.8 |
| | 35.3 |
|
| G&A | 60.3 |
| | 84.4 |
|
| Total employee compensation expenses | 96.1 |
|
| 119.7 |
|
Cash Flow Statement Presentation
The following tables provide a detailed breakdown of certain line items contained within cash flow from operating activities:
|
| | | | | |
| | Year Ended |
| | Year Ended |
|
| Change in Non-Cash Working Capital | December 31, 2015 |
| | December 31, 2014 |
|
| Accounts receivable | 48.4 |
| | 12.5 |
|
| Accounts payable and accrued liabilities | (203.0 | ) | | 62.1 |
|
| Prepaid expenses | — |
| | 1.3 |
|
| Total | (154.6 | ) | | 75.9 |
|
| Relating to: | | | |
| Operating activities | (62.4 | ) | | 49.4 |
|
| Investing activities | (92.2 | ) | | 26.5 |
|
| Total change in non-cash working capital | (154.6 | ) | | 75.9 |
|
|
| | | | | |
| | Year Ended |
| | Year Ended |
|
| Other Non-Cash Items | December 31, 2015 |
| | December 31, 2014 |
|
| Non-cash lease inducement | (1.7 | ) | | (1.7 | ) |
| Loss on short-term investment | 0.4 |
| | — |
|
| Share-based compensation expense | 3.6 |
| | 2.7 |
|
| Total other non-cash items | 2.3 |
| | 1.0 |
|
|
| | |
| ARC Resources Ltd. | Page 84 |
|
| | | | | |
| | Year Ended |
| | Year Ended |
|
| Net Change in Other Liabilities | December 31, 2015 |
| | December 31, 2014 |
|
| Long-term incentive compensation liability | (9.6 | ) | | 3.0 |
|
| Risk management contracts | (0.1 | ) | | (0.4 | ) |
| Asset retirement obligations | (12.3 | ) | | (23.0 | ) |
| Total net change in other liabilities | (22.0 | ) | | (20.4 | ) |
|
| | |
| ARC Resources Ltd. | Page 85 |