MANAGEMENT’S DISCUSSION AND ANALYSIS
This management’s discussion and analysis (“MD&A”) of ARC Resources Ltd. (“ARC” or the “Company”) is Management’s analysis of the financial performance and significant trends or external factors that may affect future performance. It is dated July 28, 2016 and should be read in conjunction with the unaudited condensed interim consolidated financial statements (the "financial statements") as at and for the three and six months ended June 30, 2016, and the MD&A and audited consolidated financial statements as at and for the year ended December 31, 2015, as well as ARC’s Annual Information Form that is filed on SEDAR at www.sedar.com. All financial information is reported in Canadian dollars and all per share information is based on diluted weighted average shares, unless otherwise noted.
This MD&A contains non-GAAP measures and forward-looking statements. Readers are cautioned that the MD&A should be read in conjunction with ARC’s disclosure under the headings “Non-GAAP Measures,” “Forward-looking Information and Statements,” and "Glossary" included at the end of this MD&A.
ABOUT ARC RESOURCES LTD.
ARC is a dividend-paying Canadian crude oil and natural gas company headquartered in Calgary, Alberta. ARC’s activities relate to the exploration, development and production of conventional crude oil and natural gas in Canada with an emphasis on the development of properties with a large volume of hydrocarbons in place commonly referred to as “resource plays.”
ARC’s vision is to be a leading energy producer, focused on delivering results through its strategy of risk-managed value creation. ARC is committed to providing superior long-term financial returns for its shareholders, creating a culture where respect for the individual is paramount and action and passion are rewarded. ARC runs its business in a manner that protects the safety of employees, communities and the environment. ARC’s vision is realized through the four pillars of its strategy:
| (1) | High quality, long-life assets – ARC’s unique suite of assets includes both Montney and other assets. ARC’s Montney assets consist of world-class resource play properties, concentrated in the Montney geological formation in northeast British Columbia and northern Alberta. The Montney assets provide substantial growth opportunities, which ARC will pursue to create value through long-term profitable development. Other assets are located in Alberta and Saskatchewan and include core assets in the Cardium formation in the Pembina area of Alberta. These assets deliver stable production and contribute cash flow to fund future development and support ARC's dividend. |
| (2) | Operational excellence – ARC is focused on capital discipline and cost management to extract the maximum return on its investments while operating in a safe and environmentally responsible manner. Production from individual crude oil and natural gas wells naturally declines over time. In any one year, ARC approves a budget to drill new wells with the intent to first replace production declines and second to potentially increase production volumes and profitability. At times, ARC may also acquire strategic producing or undeveloped properties to enhance current production and reserves or to provide potential future drilling locations. Alternatively, it may strategically dispose of non-core assets that no longer meet its investment criteria. |
| (3) | Financial flexibility – ARC provides returns to shareholders through a combination of a monthly dividend, currently $0.05 per share outstanding per month, and the potential for capital appreciation. ARC’s long-term goal is to fund dividend payments and capital expenditures necessary for the replacement of production declines using funds from operations (1). ARC will finance value-creating activities through a combination of sources including funds from operations, proceeds from ARC’s Dividend Reinvestment Program (“DRIP”), reduced funding required under the Stock Dividend Program ("SDP"), proceeds from property dispositions, debt capacity, and when appropriate, equity issuance. ARC chooses to maintain prudent debt levels, targeting a maximum net debt to annualized funds from operations of less than two times for temporary periods with a long-term target for net debt to be one to 1.5 times annualized funds from operations and less than 20 per cent of total capitalization over the long-term(1). |
| (4) | Top talent and strong leadership culture – ARC is committed to the attraction, retention and development of the best and brightest people in the industry. ARC’s employees conduct business every day in a culture of trust, respect, integrity and accountability. Building leadership talent at all levels of the organization is a key focus. ARC is also committed to corporate leadership through community investment, environmental reporting practices and open communication with all stakeholders. As of July 28, 2016, ARC had 493 employees with 267 professional, technical and support staff in the Calgary office, and 226 individuals located across ARC’s operating areas in western Canada. |
| (1) | Refer to Note 9 "Capital Management" in the financial statements as at and for the three and six months ended June 30, 2016 and to the sections entitled "Funds from Operations" and "Capitalization, Financial Resources and Liquidity" contained within this MD&A. |
| ARC Resources Ltd. | 1 | |
Total Return to Shareholders
ARC's business plan has resulted in significant operational success and helped mitigate the headwinds of a challenging commodity price environment, resulting in a trailing five year annualized total return that exceeds the Standard & Poor's ("S&P")/Toronto Stock Exchange ("TSX") Exploration & Producers Index (Table 1). Total return includes both capital appreciation and dividend payments and represents the sum of the change in the market price of the common shares or the index in the period assuming dividends are reinvested in the security or the index. Total return is not a standardized measure and therefore may not be comparable with the calculation of similar measures for other entities. This measure is used to assist Management and investors in evaluating the Company's performance and rate of return on a per share basis, to facilitate comparison over time and to its peers.
Table 1
Total Returns (1) | Trailing One Year | Trailing Three Year | Trailing Five Year | |||
| Dividends per share outstanding ($) | 0.95 | 3.35 | 5.75 | |||
| Capital appreciation (depreciation) per share outstanding ($) | 0.71 | (5.42 | ) | (2.90 | ) | |
| Total return per share outstanding (%) | 8.9 | (7.7 | ) | 12.0 | ||
| Annualized total return per share outstanding (%) | 8.8 | (2.6 | ) | 2.3 | ||
| S&P/TSX Exploration & Producers Index annualized total return (%) | (3.9 | ) | (7.0 | ) | (9.1 | ) |
| (1) | Calculated as at June 30, 2016. |
Since 2012, ARC’s production has grown by 27,413 boe per day, or 29 per cent, while its proved plus probable reserves have grown by 79.9 MMboe, or 13 per cent. Table 2 highlights ARC’s production and reserves for the first six months of 2016 and over the past four years:
Table 2
| 2016 YTD | 2015 | 2014 | 2013 | 2012 | ||||||
Production (boe/d) (1) | 120,959 | 114,167 | 112,387 | 96,087 | 93,546 | |||||
Daily production per thousand shares (2) | 0.35 | 0.34 | 0.35 | 0.31 | 0.31 | |||||
Proved plus probable reserves (MMboe) (3)(4) | n/a | 686.9 | 672.7 | 633.9 | 607.0 | |||||
| Proved plus probable reserves per share (boe) | n/a | 2.0 | 2.1 | 2.0 | 2.0 | |||||
| (1) | Reported production amount is based on company interest before royalty burdens. |
| (2) | Daily production per thousand shares represents average daily production for the six months ended June 30, 2016 and annual average daily production for the full years ended December 31, 2015, 2014, 2013 and 2012 divided by the diluted weighted average common shares for the respective periods. |
| (3) | As determined by ARC’s independent reserve evaluator with an effective date of December 31 for the years shown in accordance with the COGE Handbook. |
| (4) | Company gross reserves are the gross interest reserves before deduction of royalties and without including any royalty interests. For more information, see ARC’s Annual Information Form as filed on SEDAR at www.sedar.com and the news release entitled “ARC Resources Ltd. Announces the 8th Consecutive Year of ~200% Reserves Replacement, 2015 Finding and Development Costs for 2P Reserves of $6.97 and a Significant Increase in Montney Resource Estimates in 2015” dated February 10, 2016. |
| ARC Resources Ltd. | 2 | |
Exhibit 1

Exhibit 1a

| ARC Resources Ltd. | 3 | |
ECONOMIC ENVIRONMENT
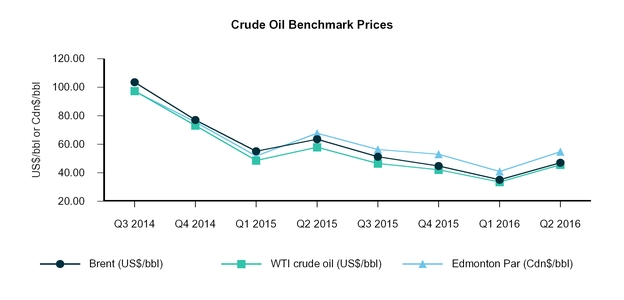
ARC’s second quarter 2016 financial and operating results were impacted by commodity prices and foreign exchange rates which are outlined in Table 3 below:
Table 3
Selected Benchmark Prices and Exchange Rates (1) | Three Months Ended | Six Months Ended | ||||||||||
| June 30 | June 30 | |||||||||||
| 2016 | 2015 | % Change | 2016 | 2015 | % Change | |||||||
| Brent crude oil (US$/bbl) | 47.03 | 63.50 | (26 | ) | 41.21 | 59.35 | (31 | ) | ||||
| WTI crude oil (US$/bbl) | 45.64 | 57.95 | (21 | ) | 39.78 | 53.34 | (25 | ) | ||||
| Edmonton Par (Cdn$/bbl) | 54.78 | 67.73 | (19 | ) | 47.84 | 59.83 | (20 | ) | ||||
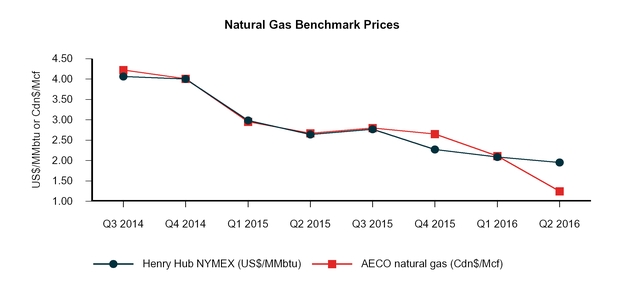
| NYMEX Henry Hub Last Day Settlement (US$/MMbtu) | 1.95 | 2.64 | (26 | ) | 2.02 | 2.81 | (28 | ) | ||||
| AECO natural gas (Cdn$/Mcf) | 1.25 | 2.67 | (53 | ) | 1.68 | 2.81 | (40 | ) | ||||
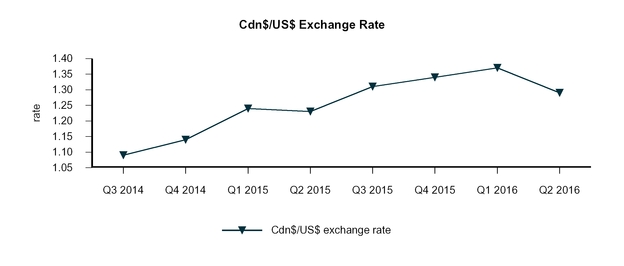
| Cdn$/US$ exchange rate | 1.29 | 1.23 | 5 | 1.33 | 1.24 | 7 | ||||||
| (1) | The benchmark prices do not reflect ARC's realized sales prices. For average realized sales prices, refer to Table 13 in this MD&A. Prices and exchange rates presented above represent averages for the respective periods. |
Global crude oil prices improved over the course of the second quarter of 2016 as US crude oil production volumes continued their decline and unexpected disruptions, caused primarily by Canadian wildfires and unrest in Nigeria, improved the global supply/demand imbalance; however, global crude oil and product inventories still remain elevated. In the second quarter of 2016, the WTI benchmark price averaged 36 per cent higher than the first quarter of 2016 and 21 per cent lower than the second quarter of 2015. ARC's crude oil price is primarily referenced to the Edmonton Par benchmark price, which increased 34 per cent compared to the first quarter of 2016, and decreased 19 per cent compared to the second quarter of 2015. The differential between WTI and Edmonton Par narrowed in the second quarter of 2016 to average a discount of US$3.13, 18 per cent less than the first quarter of 2016 and nine per cent higher than the second quarter of 2015.
Exhibit 2
US natural gas prices, referenced by the average NYMEX Henry Hub last day price, decreased seven per cent relative to the first quarter of 2016 and 26 per cent compared to the second quarter of 2015. ARC's realized natural gas price is primarily referenced to the AECO hub, which decreased 41 per cent relative to the first quarter of 2016 and 53 per cent lower compared to the second quarter of 2015. While Henry Hub prices were relatively stable over the quarter, AECO natural gas prices fell dramatically due to strong regional production, low weather-related demand, and extremely elevated inventory levels. Henry Hub prices rebounded late in the second quarter of 2016 due to declining US production in the face of record seasonal demand. Near-term AECO prices also increased significantly at quarter-end, as falling supply
| ARC Resources Ltd. | 4 | |
and rising local and downstream demand helped to alleviate earlier concerns of inventories reaching maximum capacity during the summer of 2016.
Exhibit 2a
The Canadian dollar remained range-bound relative to the US dollar during the second quarter of 2016, averaging US$0.78 (Cdn$/US$1.29).
Exhibit 2b
| ARC Resources Ltd. | 5 | |
ANNUAL GUIDANCE AND FINANCIAL HIGHLIGHTS
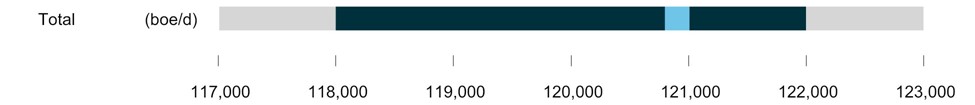
ARC's Board of Directors has approved an increase to its capital program to $450 million, before land purchases and net property acquisitions and dispositions, up from the $390 million previously announced. The increased budget will remain focused on balance sheet strength and long-term value creation, with additional funds being directed at increased investment at Parkland/Tower, increased investment at Ante Creek and Pembina as drilling in Alberta is resumed, and strategic piloting of the Lower Montney in Dawson. ARC expects to spend approximately 75 per cent of its 2016 capital budget in northeast British Columbia. Full-year 2016 annual average production is expected to be in the range of 118,000 to 122,000 boe per day, resulting in modest year-over-year growth.
Ongoing commodity price volatility may affect ARC's funds from operations and profitability on capital programs. As continued volatility is expected, ARC will continue to take steps to mitigate these risks, focus on capital and operating efficiencies, and protect its strong financial position. ARC will continue to screen projects for profitability in a disciplined manner and will adjust spending and the pace of development, if required, to ensure balance sheet strength is protected.
Table 4 is a summary of ARC’s 2016 annual guidance and a review of 2016 year-to-date actual results.
Table 4
| 2016 Guidance | 2016 Revised Guidance (1) | 2016 YTD | % Variance from Guidance | ||||
| Production | |||||||
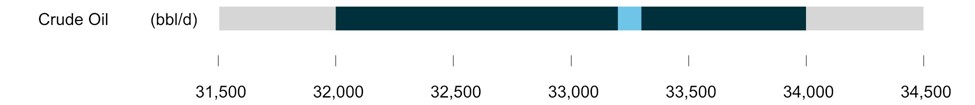
| Crude oil (bbl/d) | 32,000 - 34,000 | 32,000 - 34,000 | 33,277 | — | |||
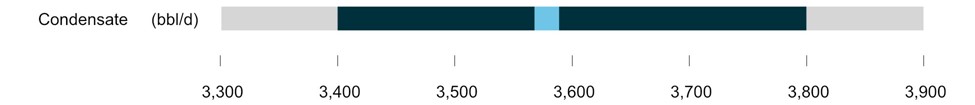
| Condensate (bbl/d) | 3,000 - 3,400 | 3,400 - 3,800 | 3,587 | — | |||
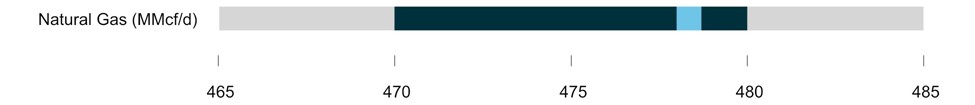
| Natural gas (MMcf/d) | 460 - 470 | 470 - 480 | 478.6 | — | |||
| NGLs (bbl/d) | 3,800 - 4,200 | 4,100 - 4,500 | 4,327 | — | |||
| Total (boe/d) | 116,000 - 120,000 | 118,000 - 122,000 | 120,959 | — | |||
| Expenses ($/boe) | |||||||
| Operating | 7.40 - 7.80 | 6.90 - 7.20 | 6.25 | (9 | ) | ||
| Transportation | 2.40 - 2.70 | 2.40 - 2.70 | 2.19 | (9 | ) | ||
| G&A expenses before share-based compensation plans | 1.55 - 1.65 | 1.55 - 1.65 | 1.73 | 5 | |||
G&A - share-based compensation plans (2) | 0.45 - 0.65 | 0.45 - 0.65 | 0.98 | 51 | |||
| Interest | 1.10 - 1.30 | 1.10 - 1.30 | 1.15 | — | |||
Current income tax (per cent of funds from operations) (3) | 0 - 5 | 0 - 3 | — | — | |||
| Capital expenditures before land purchases and net property acquisitions (dispositions) ($ millions) | 390 | 450 | 171.7 | N/A | |||
| Land purchases and net property acquisitions (dispositions) ($ millions) | N/A | N/A | 123.7 | N/A | |||
| Weighted average shares, diluted (millions) | 351 | 351 | 350 | N/A | |||
| (1) | Incorporates the impact of approximately 3,000 boe per day of light, high-netback crude oil production in Pembina acquired in the second and third quarters of 2016 which will result in an annual volume increase of approximately 1,400 boe per day of production. |
| (2) | Comprises expenses recognized under the RSU and PSU, Share Option and LTRSA Plans. In periods where substantial share price fluctuation occurs, ARC’s G&A expenses are subject to greater volatility. |
| (3) | The 2016 corporate tax estimate varies depending on the level of commodity prices. |
| ARC Resources Ltd. | 6 | |
ARC's 2016 guidance is based on full-year 2016 estimates; certain variances between first half 2016 actual results and 2016 full-year guidance estimates were due to the cyclical and seasonal nature of operations. ARC expects full-year 2016 actual results to closely approximate the revised guidance as the year progresses. First half 2016 production was within the 2016 guided production range; ARC expects that full-year 2016 production will closely approximate the revised guided range, with production trending downwards during the third quarter due to planned maintenance activities and anticipated third-party infrastructure restrictions reducing volumes by approximately 5,000 boe per day, and then modestly rebounding in the fourth quarter.
Exhibit 3
2016 Revised Production Guidance


| ARC Resources Ltd. | 7 | |
On a per boe basis, ARC's first half 2016 operating expenses were below the 2016 guidance range due to the addition of new Montney production at lower relative costs to operate, lower power prices throughout the period, and diligent cost control efforts. Third quarter per boe operating expenses are expected to increase with the corresponding decrease in production, with full-year 2016 operating expenses expected to closely approximate guidance. On a per boe basis, ARC's first half 2016 transportation expenses were below the 2016 guidance range as a result of minimal pipeline disruptions in the period; ARC expects full-year 2016 actual transportation expenses to closely approximate guidance as the year progresses. ARC's first half 2016 G&A expenses were above the 2016 guidance range due primarily to increased costs associated with ARC's share-based compensation plans due to the increase in ARC's share price and improved total return relative to its peers, and lower capitalized G&A as a result of lower capital expenditures; ARC expects full-year 2016 G&A expenses before share-based compensation to closely approximate guidance as the year progresses.
Exhibit 3a
2016 Revised Expenses Guidance


The guidance information presented is intended to provide shareholders with information on Management’s expectations for results from operations. Readers are cautioned that the guidance may not be appropriate for other purposes.
| ARC Resources Ltd. | 8 | |
2016 SECOND QUARTER FINANCIAL AND OPERATING RESULTS
Financial Highlights
Table 5
| Three Months Ended | Six Months Ended | |||||||||||
| June 30 | June 30 | |||||||||||
| ($ millions, except per share and volume data) | 2016 | 2015 | % Change | 2016 | 2015 | % Change | ||||||
Funds from operations (1) | 141.7 | 206.3 | (31 | ) | 291.8 | 397.8 | (27 | ) | ||||
Funds from operations per share (1) | 0.40 | 0.61 | (34 | ) | 0.83 | 1.18 | (30 | ) | ||||
| Net income (loss) | (58.1 | ) | (51.0 | ) | 14 | 6.0 | (52.7 | ) | (111 | ) | ||
| Net income (loss) per share | (0.17 | ) | (0.15 | ) | 13 | 0.02 | (0.16 | ) | (113 | ) | ||
Dividends per share (2) | 0.15 | 0.30 | (50 | ) | 0.35 | 0.60 | (42 | ) | ||||
| Average daily production (boe/d) | 117,695 | 109,900 | 7 | 120,959 | 115,098 | 5 | ||||||
| (1) | Refer to Note 9 "Capital Management" in the financial statements as at and for the three and six months ended June 30, 2016 and to the section entitled "Funds from Operations" contained within this MD&A. |
| (2) | Dividends per share are based on the number of shares outstanding at each dividend record date. |
Funds from Operations
ARC considers funds from operations to be a key measure of operating performance as it demonstrates ARC’s ability to generate the necessary funds to fund sustaining capital and future growth through capital investment and to repay debt. Management believes that such a measure provides an insightful assessment of ARC’s operations on a continuing basis by eliminating certain non-cash charges and charges that are nonrecurring. Funds from operations is not a standardized measure and therefore may not be comparable with the calculation of similar measures for other entities.
ARC reports funds from operations in total and on a per share basis. Refer to Note 9 "Capital Management" in the financial statements as at and for the six months ended June 30, 2016. Table 6 is a reconciliation of ARC’s net income (loss) to funds from operations and cash flow from operating activities:
Table 6
| Three Months Ended | Six Months Ended | |||||||
| June 30 | June 30 | |||||||
| ($ millions) | 2016 | 2015 | 2016 | 2015 | ||||
| Net income (loss) | (58.1 | ) | (51.0 | ) | 6.0 | (52.7 | ) | |
| Adjusted for the following non-cash items: | ||||||||
| DD&A and impairment | 126.0 | 150.8 | 260.2 | 329.5 | ||||
| Accretion of ARO | 3.0 | 3.2 | 6.1 | 6.8 | ||||
| E&E expenses | — | 44.4 | 1.7 | 44.4 | ||||
| Deferred tax expense (recovery) | (40.8 | ) | 25.1 | (34.3 | ) | 38.1 | ||
| Unrealized loss (gain) on risk management contracts | 149.5 | 61.2 | 156.7 | (16.5 | ) | |||
| Unrealized loss (gain) on foreign exchange | 2.1 | (16.9 | ) | (65.3 | ) | 71.4 | ||
| Gain on business combination | (40.2 | ) | — | (40.2 | ) | — | ||
| Gain on disposal of petroleum and natural gas properties | — | (10.6 | ) | — | (23.3 | ) | ||
| Other | 0.2 | 0.1 | 0.9 | 0.1 | ||||
| Funds from operations | 141.7 | 206.3 | 291.8 | 397.8 | ||||
| Net change in other liabilities | 7.8 | 1.7 | 6.7 | (9.9 | ) | |||
| Change in non-cash working capital | 11.5 | (5.9 | ) | 15.2 | (40.1 | ) | ||
| Cash flow from operating activities | 161.0 | 202.1 | 313.7 | 347.8 | ||||
| ARC Resources Ltd. | 9 | |
Details of the change in funds from operations from the three and six months ended June 30, 2015 to the three and six months ended June 30, 2016 are included in Table 7 below:
Table 7
| Three Months Ended | Six Months Ended | |||||||
| June 30 | June 30 | |||||||
| $ millions | $/Share | $ millions | $/Share | |||||
| Funds from operations – 2015 | 206.3 | 0.61 | 397.8 | 1.18 | ||||
| Volume variance | ||||||||
| Crude oil and liquids | 2.5 | 0.01 | (1.2 | ) | — | |||
| Natural gas | 10.9 | 0.03 | 20.7 | 0.06 | ||||
| Price variance | ||||||||
| Crude oil and liquids | (36.8 | ) | (0.11 | ) | (73.3 | ) | (0.22 | ) |
| Natural gas | (63.5 | ) | (0.19 | ) | (108.0 | ) | (0.33 | ) |
| Other Revenue | 0.1 | — | (0.4 | ) | — | |||
| Realized gain on risk management contracts | 14.6 | 0.04 | 38.3 | 0.11 | ||||
| Royalties | 3.9 | 0.01 | 16.0 | 0.05 | ||||
| Expenses | ||||||||
| Transportation | (0.1 | ) | — | 0.7 | — | |||
| Operating | 11.9 | 0.03 | 21.3 | 0.06 | ||||
| G&A | (4.2 | ) | (0.01 | ) | (25.1 | ) | (0.07 | ) |
| Interest | (0.2 | ) | — | (0.4 | ) | — | ||
| Current tax | (4.2 | ) | (0.01 | ) | 5.1 | 0.02 | ||
| Realized loss on foreign exchange | 0.5 | — | 0.3 | — | ||||
| Diluted shares | — | (0.01 | ) | — | (0.03 | ) | ||
| Funds from operations – 2016 | 141.7 | 0.40 | 291.8 | 0.83 | ||||
Funds from operations decreased by 31 per cent in the second quarter of 2016 to $141.7 million from $206.3 million generated in the second quarter of 2015. The decrease reflects lower revenue due primarily to significantly lower realized commodity prices and an increase in G&A and current tax expense in the second quarter of 2016 as compared to the second quarter of 2015. Increased production and realized gains on risk management contracts relative to the second quarter of the prior year along with lower royalties and operating costs partially offset the impact of the reduction in commodity prices.
For the six months ended June 30, 2016, funds from operations decreased by $106 million to $291.8 million from $397.8 million in the same period of 2015. This decrease reflects lower revenue net of royalties primarily associated with lower realized commodity prices and an increase in G&A, partially offset by increased realized gains on risk management contracts and natural gas production along with decreased operating costs and current taxes.
| ARC Resources Ltd. | 10 | |
Exhibit 4

Exhibit 4a

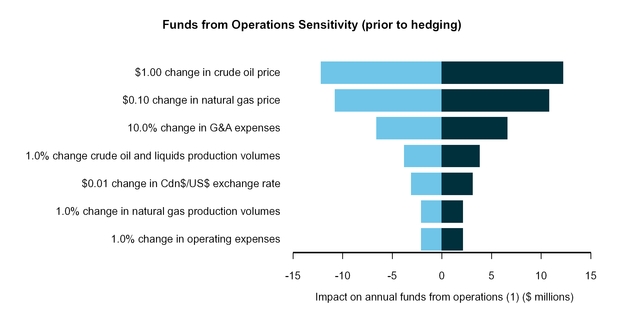
2016 Funds from Operations Sensitivity
Table 8 illustrates sensitivities of pre-hedged operating items to operational and business environment changes and the resulting impact on funds from operations per share:
Table 8
Impact on Annual Funds from Operations (6) | |||||
| Assumption | Change | $/Share | |||
Business Environment (1) | |||||
Crude oil price (US$ WTI/bbl) (2)(3) | 39.78 | 1.00 | 0.035 | ||
Natural gas price (Cdn$ AECO/Mcf) (2)(3) | 1.68 | 0.10 | 0.031 | ||
Cdn$/US$ exchange rate (2)(3)(4) | 1.33 | 0.01 | 0.009 | ||
Operational (5) | |||||
| Crude oil and liquids production volumes (bbl/d) | 41,191 | 1.0 | % | 0.011 | |
| Natural gas production volumes (MMcf/d) | 478.6 | 1.0 | % | 0.006 | |
| Operating expenses ($/boe) | 6.25 | 1.0 | % | 0.006 | |
| G&A expenses ($/boe) | 2.71 | 10.0 | % | 0.019 | |
| (1) | Calculations are performed independently and may not be indicative of actual results that would occur when multiple variables change at the same time. |
| (2) | Prices and rates are indicative of published prices for the first six months of 2016. See Table 13 of this MD&A for additional details. The calculated impact on funds from operations would only be applicable within a limited range of these amounts. |
| (3) | Analysis does not include the effect of risk management contracts. |
| (4) | Includes impact of foreign exchange on crude oil, condensate, and NGLs prices that are presented in US dollars. |
| (5) | Operational assumptions are based upon results for the six months ended June 30, 2016. |
| (6) | Refer to Note 9 "Capital Management" in the financial statements as at and for the three and six months ended June 30, 2016 and to the section entitled "Funds from Operations" contained within this MD&A. |
Exhibit 5
| (1) | Refer to Note 9 "Capital Management" in the financial statements as at and for the three and six months ended June 30, 2016 and to the section entitled "Funds from Operations" contained within this MD&A. |
| ARC Resources Ltd. | 11 | |
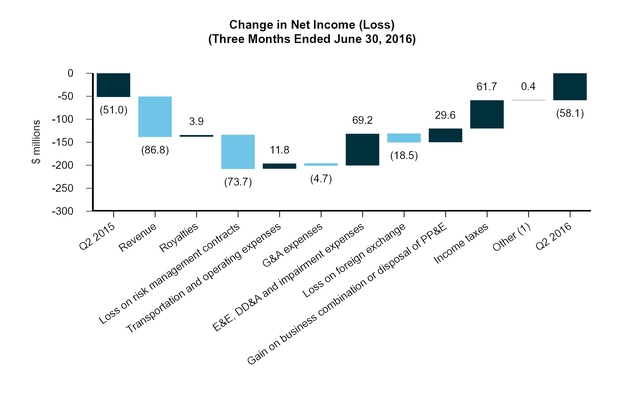
Net Income (Loss)
A net loss of $58.1 million (loss of $0.17 per share) was incurred in the second quarter of 2016, a $7.1 million ($0.02 per share) decrease compared to a net loss of $51 million (loss of $0.15 per share) in the second quarter of 2015. Lower netbacks primarily associated with lower realized commodity prices, coupled with increased losses on risk management contracts decreased net income, while lower E&E and DD&A expenses, a gain on business combination and a higher deferred income tax recovery served to partially offset the decrease.
Exhibit 6
| (1) | Includes gain or loss on short-term investments, accretion of ARO, and interest and financing charges. |
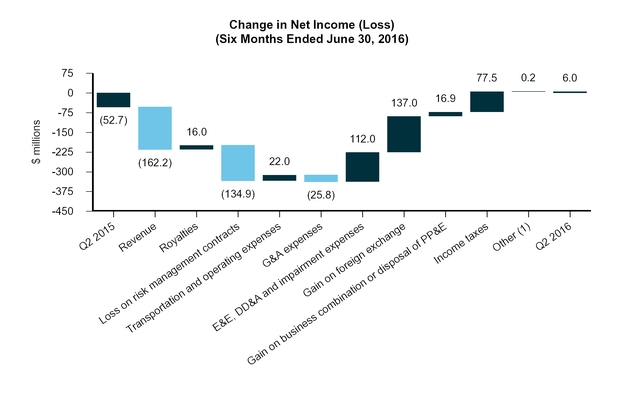
During the six months ended June 30, 2016, ARC incurred net income of $6 million (income of $0.02 per share), compared to a net loss of $52.7 million (loss of $0.16 per share) earned during the six months ended June 30, 2015. Lower operating expenses, reduced E&E, DD&A and impairment charges, increased foreign exchange gains, a gain on business combination and a higher deferred income tax recovery increased net income, while lower revenue net of royalties, increased losses on risk management contracts, higher G&A expenses, and a lower gain on disposal of petroleum and natural gas properties served to partially offset the increase.
| ARC Resources Ltd. | 12 | |
Exhibit 6a
| (1) | Includes gain or loss on short-term investments, accretion of ARO, and interest and financing charges. |
Production
Table 9
| Three Months Ended | Six Months Ended | |||||||||||
| June 30 | June 30 | |||||||||||
| Production | 2016 | 2015 | % Change | 2016 | 2015 | % Change | ||||||
| Light and medium crude oil (bbl/d) | 31,217 | 30,979 | 1 | 32,787 | 32,849 | — | ||||||
| Heavy crude oil (bbl/d) | 485 | 979 | (50 | ) | 490 | 1,045 | (53 | ) | ||||
| Condensate (bbl/d) | 3,733 | 3,139 | 19 | 3,587 | 3,363 | 7 | ||||||
| Natural gas (MMcf/d) | 467.5 | 426.0 | 10 | 478.6 | 442.7 | 8 | ||||||
| NGLs (bbl/d) | 4,336 | 3,795 | 14 | 4,327 | 4,053 | 7 | ||||||
| Total production (boe/d) | 117,695 | 109,900 | 7 | 120,959 | 115,098 | 5 | ||||||
| % Natural gas production | 66 | 65 | 2 | 66 | 64 | 3 | ||||||
| % Crude oil and liquids production | 34 | 35 | (3 | ) | 34 | 36 | (6 | ) | ||||
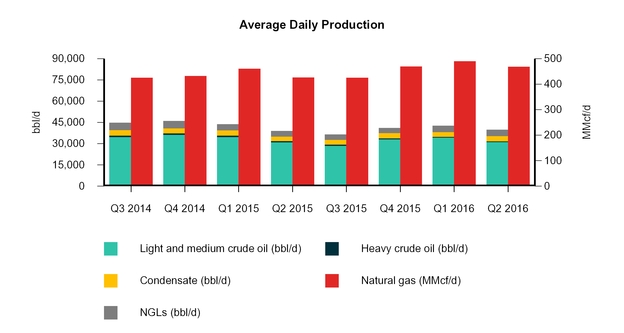
During the three and six months ended June 30, 2016, crude oil and liquids production remained relatively unchanged from the same periods in the prior year and reflects additional production at Tower following the crude oil battery expansion that was completed during the fourth quarter of 2015, offset by natural declines associated with reduced drilling activity as well as the disposition of certain non-core assets in southwest Saskatchewan in the third quarter of 2015 and in Manitoba in the fourth quarter of 2015 which had been producing approximately 500 boe per day and 1,300 boe per day prior to disposal, respectively.
| ARC Resources Ltd. | 13 | |
Natural gas production was 467.5 MMcf per day in the second quarter of 2016, an increase of ten per cent from the 426 MMcf per day produced in the second quarter of 2015. For the six months ended June 30, 2016, natural gas production was 478.6 MMcf per day, an increase of eight per cent from the 442.7 MMcf per day for the same period in the prior year. The increase in both periods is mainly attributed to production from new wells flowing through the Sunrise gas plant which was commissioned during the third quarter of 2015. The increase in natural gas production was partially offset by the disposition of certain non-core assets in South Central Alberta in the second quarter of 2015 and in the second quarter of 2016 which had been producing approximately 14.4 MMcf per day and 3.9 MMcf prior to disposal, respectively.
Exhibit 7
| ARC Resources Ltd. | 14 | |
During the second quarter of 2016, ARC drilled 10 gross (10 net) wells on operated properties consisting of four natural gas wells and six crude oil wells. For the six months ended June 30, 2016, ARC drilled 18 gross (18 net) wells on operated properties consisting of six crude oil wells, nine natural gas wells, two liquids-rich natural gas wells and one injection well.
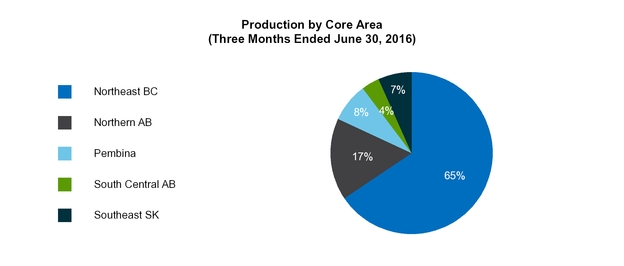
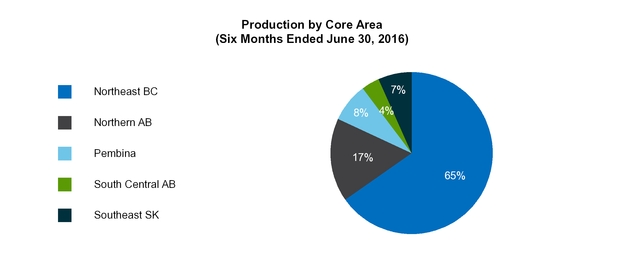
Table 10 summarizes ARC’s production by core area for the second quarter of 2016 and 2015:
Table 10
| Three Months Ended June 30, 2016 | ||||||||||
| Production | Total | Crude Oil | Condensate | Natural Gas | NGLs | |||||
Core Area (1) | (boe/d) | (bbl/d) | (bbl/d) | (MMcf/d) | (bbl/d) | |||||
| Northeast BC | 77,010 | 7,939 | 2,853 | 383.6 | 2,287 | |||||
| Northern AB | 19,597 | 6,517 | 637 | 66.4 | 1,365 | |||||
| Pembina | 8,905 | 6,365 | 161 | 11.7 | 424 | |||||
South Central AB (2) | 4,406 | 3,386 | 33 | 4.9 | 175 | |||||
Southeast SK (3) | 7,777 | 7,495 | 49 | 0.9 | 85 | |||||
| Total | 117,695 | 31,702 | 3,733 | 467.5 | 4,336 | |||||
| Three Months Ended June 30, 2015 | ||||||||||
| Production | Total | Crude Oil | Condensate | Natural Gas | NGLs | |||||
Core Area (1) | (boe/d) | (bbl/d) | (bbl/d) | (MMcf/d) | (bbl/d) | |||||
| Northeast BC | 61,241 | 2,524 | 2,182 | 329.8 | 1,555 | |||||
| Northern AB | 21,477 | 7,529 | 696 | 70.5 | 1,502 | |||||
| Pembina | 10,913 | 8,169 | 154 | 13.0 | 429 | |||||
South Central AB (2) | 6,202 | 3,970 | 58 | 11.7 | 228 | |||||
Southeast SK & MB (3) | 10,067 | 9,766 | 49 | 1.0 | 81 | |||||
| Total | 109,900 | 31,958 | 3,139 | 426.0 | 3,795 | |||||
| (1) | Provincial references: "AB" is Alberta, "BC" is British Columbia, "SK" is Saskatchewan, "MB" is Manitoba. |
| (2) | During the second and third quarters of 2015, ARC disposed of certain non-core assets in this district. These assets had been producing approximately 2,900 boe per day prior to disposal. An additional 700 boe per day of non-core assets were disposed from this district toward the end of the second quarter of 2016. |
| (3) | During the fourth quarter of 2015, ARC disposed of certain non-core assets in this district that had been producing approximately 1,300 boe per day prior to disposal. |
Exhibit 8
| ARC Resources Ltd. | 15 | |
Table 10a summarizes ARC’s production by core area for the six months ended June 30, 2016 and 2015:
Table 10a
| Six Months Ended June 30, 2016 | ||||||||||
| Production | Total | Crude Oil | Condensate | Natural Gas | NGLs | |||||
Core Area (1) | (boe/d) | (bbl/d) | (bbl/d) | (MMcf/d) | (bbl/d) | |||||
| Northeast BC | 78,958 | 8,573 | 2,700 | 392.5 | 2,259 | |||||
| Northern AB | 20,006 | 6,826 | 632 | 67.1 | 1,370 | |||||
| Pembina | 9,470 | 6,744 | 176 | 12.6 | 450 | |||||
South Central AB (2) | 4,591 | 3,484 | 27 | 5.5 | 169 | |||||
Southeast SK (3) | 7,934 | 7,650 | 52 | 0.9 | 79 | |||||
| Total | 120,959 | 33,277 | 3,587 | 478.6 | 4,327 | |||||
| Six Months Ended June 30, 2015 | ||||||||||
| Production | Total | Crude Oil | Condensate | Natural Gas | NGLs | |||||
Core Area (1) | (boe/d) | (bbl/d) | (bbl/d) | (MMcf/d) | (bbl/d) | |||||
| Northeast BC | 63,898 | 2,837 | 2,394 | 341.4 | 1,751 | |||||
| Northern AB | 21,897 | 7,965 | 694 | 70.2 | 1,531 | |||||
| Pembina | 11,536 | 8,729 | 167 | 13.1 | 459 | |||||
South Central AB (2) | 7,313 | 4,209 | 60 | 16.9 | 235 | |||||
Southeast SK & MB (3) | 10,454 | 10,154 | 48 | 1.1 | 77 | |||||
| Total | 115,098 | 33,894 | 3,363 | 442.7 | 4,053 | |||||
| (1) | Provincial references: "AB" is Alberta, "BC" is British Columbia, "SK" is Saskatchewan, "MB" is Manitoba. |
| (2) | During the second and third quarters of 2015, ARC disposed of certain non-core assets in this district. These assets had been producing approximately 2,900 boe per day prior to disposal. An additional 700 boe per day of non-core assets were disposed from this district toward the end of the second quarter of 2016. |
| (3) | During the fourth quarter of 2015, ARC disposed of certain non-core assets in this district that had been producing approximately 1,300 boe per day prior to disposal. |
Exhibit 8a
| ARC Resources Ltd. | 16 | |
Sales of Crude Oil, Natural Gas, Condensate, NGLs and Other Income
Sales revenue from crude oil, natural gas, condensate, NGLs and other income decreased by 27 per cent in the second quarter of 2016 compared to the same period in 2015. The decrease reflects lower average realized commodity prices for all products excluding NGLs in the second quarter of 2016 compared to the second quarter of 2015 and was partially offset by increased production volumes.
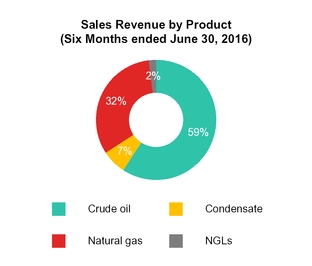
For the six months ended June 30, 2016, sales revenue from crude oil, natural gas, condensate, NGLs and other income decreased by 26 per cent compared to the same period in 2015. The decrease reflects lower average realized commodity prices for all products excluding NGLs in the six months ended June 30, 2016 as compared to the same period in 2015 and was partially offset by increased natural gas production volumes.
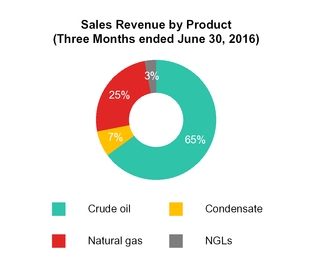
A breakdown of sales revenue by product is outlined in Table 11:
Table 11
| Three Months Ended | Six Months Ended | |||||||||||
| June 30 | June 30 | |||||||||||
Sales revenue by product ($ millions) | 2016 | 2015 | % Change | 2016 | 2015 | % Change | ||||||
| Crude oil | 152.4 | 187.6 | (19 | ) | 274.9 | 344.8 | (20 | ) | ||||
| Condensate | 17.3 | 18.5 | (6 | ) | 30.5 | 34.4 | (11 | ) | ||||
| Natural gas | 59.1 | 111.7 | (47 | ) | 150.6 | 237.8 | (37 | ) | ||||
| NGLs | 5.4 | 3.3 | 64 | 8.7 | 9.5 | (8 | ) | |||||
| Total sales revenue from crude oil, natural gas, condensate and NGLs | 234.2 | 321.1 | (27 | ) | 464.7 | 626.5 | (26 | ) | ||||
| Other income | 0.7 | 0.6 | 17 | 1.4 | 1.8 | (22 | ) | |||||
| Total sales revenue | 234.9 | 321.7 | (27 | ) | 466.1 | 628.3 | (26 | ) | ||||
While ARC’s production mix on a per boe basis is weighted more heavily to natural gas than to crude oil and liquids, ARC's revenue contribution is more heavily weighted to crude oil and liquids production as shown by the table below:
Table 12
| Three Months Ended | Six Months Ended | |||
| June 30 | June 30 | |||
| Revenue by Product Type | 2016 | 2015 | 2016 | 2015 |
| % of Total Revenue | % of Total Revenue | % of Total Revenue | % of Total Revenue | |
| Crude oil and liquids | 75 | 65 | 68 | 62 |
| Natural gas | 25 | 35 | 32 | 38 |
| Total sales revenue | 100 | 100 | 100 | 100 |
| ARC Resources Ltd. | 17 | |
Exhibit 9
Commodity Prices Prior to Hedging
Table 13
| Three Months Ended | Six Months Ended | |||||||||||
| June 30 | June 30 | |||||||||||
| 2016 | 2015 | % Change | 2016 | 2015 | % Change | |||||||
| Average Benchmark Prices | ||||||||||||
| AECO natural gas (Cdn$/Mcf) | 1.25 | 2.67 | (53 | ) | 1.68 | 2.81 | (40 | ) | ||||
| WTI crude oil (US$/bbl) | 45.64 | 57.95 | (21 | ) | 39.78 | 53.34 | (25 | ) | ||||
| Cdn$/US$ exchange rate | 1.29 | 1.23 | 5 | 1.33 | 1.24 | 7 | ||||||
| WTI crude oil (Cdn$/bbl) | 58.88 | 71.28 | (17 | ) | 52.91 | 66.14 | (20 | ) | ||||
| Edmonton Par (Cdn$/bbl) | 54.78 | 67.73 | (19 | ) | 47.84 | 59.83 | (20 | ) | ||||
| ARC Average Realized Prices Prior to Hedging | ||||||||||||
| Crude oil ($/bbl) | 52.80 | 64.49 | (18 | ) | 45.39 | 56.20 | (19 | ) | ||||
| Condensate ($/bbl) | 51.20 | 64.84 | (21 | ) | 46.82 | 56.49 | (17 | ) | ||||
| Natural gas ($/Mcf) | 1.39 | 2.88 | (52 | ) | 1.73 | 2.97 | (42 | ) | ||||
| NGLs ($/bbl) | 13.60 | 9.53 | 43 | 11.01 | 12.99 | (15 | ) | |||||
| Total average realized commodity price prior to other income and hedging ($/boe) | 21.87 | 32.10 | (32 | ) | 21.11 | 30.07 | (30 | ) | ||||
| Other income ($/boe) | 0.07 | 0.07 | — | 0.06 | 0.09 | (33 | ) | |||||
| Total average realized price prior to hedging ($/boe) | 21.94 | 32.17 | (32 | ) | 21.17 | 30.16 | (30 | ) | ||||
In the second quarter of 2016, WTI decreased 21 per cent to US$45.64 per barrel as compared to US$57.95 per barrel in the same period in 2015. Similarly, ARC’s realized crude oil price decreased by 18 per cent over the same time period, averaging $52.80 per barrel. During the second quarter of 2016, the differential between WTI and Edmonton posted prices widened to an average discount of US$3.13 per barrel compared to US$2.88 per barrel in the same period in 2015, while the average exchange rate for the Canadian dollar as compared to the US dollar weakened from $1.23 to $1.29. The weaker Canadian dollar served to partially mitigate the overall impact of the decrease in WTI on ARC's average realized prices.
For the six months ended June 30, 2016, ARC's realized crude oil price was 19 per cent lower as compared to the same period in 2015. This price decrease is primarily attributed to the 25 per cent decrease in WTI over the same time period, partially offset by the effect of a narrowed differential between WTI and Edmonton Par crude oil prices and a weaker Canadian dollar.
| ARC Resources Ltd. | 18 | |
ARC's realized natural gas price decreased by 52 per cent during the second quarter of 2016 as compared to the same period in 2015, averaging $1.39 per Mcf. For the six months ended June 30, 2016, ARC's realized natural gas price decreased by 42 per cent as compared to the same period in 2015. ARC's realized natural gas price is primarily benchmarked against the AECO monthly index, which was 53 and 40 per cent lower for the three and six months ended June 30, 2016 compared to the same periods in 2015, respectively. ARC's realized natural gas price was higher than the AECO monthly index price for the three and six months ended June 30, 2016 as a portion of ARC's production is sold at the AECO daily index and US Midwest pricing points which settled above the AECO monthly index during the second quarter of 2016.
Risk Management
ARC maintains a risk management program to reduce the volatility of revenues, increase the certainty of funds from operations, and to protect acquisition and development economics. ARC’s risk management program is governed by certain guidelines approved by the Board of Directors (the "Board"). These guidelines currently restrict risk management contracts to a maximum of 55 per cent of total forecast production where a specific commodity (crude oil or natural gas) cannot exceed a maximum of 70 per cent of forecast production for that commodity over the next two years, and with a maximum of 25 per cent of forecast natural gas production in risk management contracts beyond two years and up to five years. ARC’s risk management program guidelines allow for further risk management contracts on anticipated volumes associated with new production arising from specific capital projects and acquisitions or to further protect cash flows for a specific period with approval of the Board.
Gains and losses on risk management contracts are composed of both realized gains and losses, representing the portion of risk management contracts that have settled in cash during the period, and unrealized gains or losses that represent the change in the mark-to-market position of those contracts throughout the period. ARC does not employ hedge accounting for any of its risk management contracts currently in place. ARC considers all of its risk management contracts to be effective economic hedges of its underlying business transactions.
Table 14 summarizes the total gain or loss on risk management contracts for the second quarter of 2016 compared to the same period in 2015:
Table 14
Risk Management Contracts ($ millions) | Crude Oil & Liquids | Natural Gas | Power | Q2 2016 Total | Q2 2015 Total | |||||
Realized gain (loss) on contracts (1) | 14.0 | 51.9 | (0.5 | ) | 65.4 | 50.8 | ||||
Unrealized loss on contracts (2) | (58.4 | ) | (90.2 | ) | (0.9 | ) | (149.5 | ) | (61.2 | ) |
| Loss on risk management contracts | (44.4 | ) | (38.3 | ) | (1.4 | ) | (84.1 | ) | (10.4 | ) |
| (1) | Represents actual cash settlements under the respective contracts. |
| (2) | Represents the change in fair value of the contracts during the period. |
Table 14a summarizes the total gain or loss on risk management contracts for the six months ended June 30, 2016 compared to the same period in 2015:
Table 14a
Risk Management Contracts ($ millions) | Crude Oil & Liquids | Natural Gas | Power | 2016 YTD Total | 2015 YTD Total | |||||
Realized gain (loss) on contracts (1) | 40.0 | 94.8 | (1.1 | ) | 133.7 | 95.4 | ||||
Unrealized gain (loss) on contracts (2) | (67.5 | ) | (88.4 | ) | (0.8 | ) | (156.7 | ) | 16.5 | |
| Gain (loss) on risk management contracts | (27.5 | ) | 6.4 | (1.9 | ) | (23.0 | ) | 111.9 | ||
| (1) | Represents actual cash settlements under the respective contracts. |
| (2) | Represents the change in fair value of the contracts during the period. |
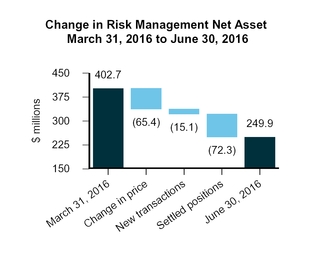
During the three and six months ended June 30, 2016, ARC recorded losses of $84.1 million and $23 million, respectively, on its risk management contracts. These losses comprised realized gains of $65.4 million and unrealized losses of $149.5 million for the second quarter and realized gains of $133.7 million and unrealized losses of $156.7 million for the six months ended June 30, 2016. The realized gains primarily reflect positive cash settlements received on crude oil swaps with an average price of $77.20 and crude oil collars with a floor of $70.00, on Henry Hub natural gas contracts with an average floor price of US$4.00/MMbtu, and on AECO basis swaps at an average ratio of 90.3 per cent.
ARC's second quarter 2016 unrealized losses on crude oil contracts are as a result of an increase in the forward curve as well as the settlement of positions during the period. During the same period, net unrealized losses on natural gas
| ARC Resources Ltd. | 19 | |
contracts reflected a higher forward curve for NYMEX Henry Hub and AECO prices in addition to settled positions, offset by a wider AECO basis.
ARC’s risk management contracts provide protection from natural gas prices for 2016 to 2020 and for crude oil for 2016 and 2017. Table 15 summarizes ARC’s average crude oil and natural gas hedged volumes as at the date of this MD&A. For a complete listing and terms of ARC’s risk management contracts at June 30, 2016, see Note 10 “Financial Instruments and Market Risk Management” in the financial statements as at and for the three and six months ended June 30, 2016.
Table 15
Hedge Positions Summary (1) | ||||||||||||||||||||
| As at July 28, 2016 | H2 2016 | 2017 | 2018 | 2019 | 2020 | |||||||||||||||
Crude Oil - WTI (2) | US$/bbl | bbl/day | US$/bbl | bbl/day | US$/bbl | bbl/day | US$/bbl | bbl/day | US$/bbl | bbl/day | ||||||||||
| Ceiling | 50.00 | 3,000 | 53.78 | 7,000 | — | — | — | — | — | — | ||||||||||
| Floor | 40.00 | 3,000 | 41.43 | 7,000 | — | — | — | — | — | — | ||||||||||
| Sold Floor | — | — | 30.00 | 4,000 | — | — | — | — | — | — | ||||||||||
| Swap | 42.10 | 2,000 | — | — | — | — | — | — | — | — | ||||||||||
Crude Oil - $CWTI (3) | Cdn$/bbl | bbl/day | Cdn$/bbl | bbl/day | Cdn$/bbl | bbl/day | Cdn$/bbl | bbl/day | Cdn$/bbl | bbl/day | ||||||||||
| Ceiling | 83.38 | 3,000 | 83.38 | 1,488 | — | — | — | — | — | — | ||||||||||
| Floor | 70.00 | 3,000 | 70.00 | 1,488 | — | — | — | — | — | — | ||||||||||
| Swap | 77.20 | 7,000 | — | — | — | — | — | — | — | — | ||||||||||
| Total Crude Oil Volumes Hedged (bbl/day) | 15,000 | 8,488 | — | — | — | |||||||||||||||
Crude Oil - MSW (Differential to WTI) (4) | US$/bbl | bbl/day | US$/bbl | bbl/day | US$/bbl | bbl/day | US$/bbl | bbl/day | US$/bbl | bbl/day | ||||||||||
| Swap | (3.72 | ) | 10,000 | (3.66 | ) | 5,000 | — | — | — | — | — | — | ||||||||
Natural Gas - NYMEX Henry Hub (5) | US$/MMBtu | MMBtu/day | US$/MMBtu | MMBtu/day | US$/MMBtu | MMBtu/day | US$/MMBtu | MMBtu/day | US$/MMBtu | MMBtu/day | ||||||||||
| Ceiling | 4.79 | 105,000 | 3.36 | 15,000 | 4.92 | 90,000 | 5.00 | 40,000 | — | — | ||||||||||
| Floor | 4.00 | 105,000 | 3.00 | 15,000 | 4.00 | 90,000 | 4.00 | 40,000 | — | — | ||||||||||
| Swap | 4.00 | 40,000 | 4.00 | 145,000 | — | — | — | — | — | — | ||||||||||
Natural Gas - AECO (6) | Cdn$/GJ | GJ/day | Cdn$/GJ | GJ/day | Cdn$/GJ | GJ/day | Cdn$/GJ | GJ/day | Cdn$/GJ | GJ/day | ||||||||||
| Ceiling | 2.93 | 9,946 | — | — | — | — | 3.30 | 10,000 | 3.60 | 30,000 | ||||||||||
| Floor | 2.50 | 9,946 | — | — | — | — | 3.00 | 10,000 | 3.08 | 30,000 | ||||||||||
| Swap | 2.99 | 30,000 | 2.64 | 60,000 | 2.96 | 40,000 | 3.16 | 20,000 | 3.35 | 30,000 | ||||||||||
| Total Natural Gas Volumes Hedged (MMbtu/day) | 182,861 | 216,869 | 127,913 | 68,435 | 56,869 | |||||||||||||||
| Natural Gas - AECO Basis | AECO/NYMEX | MMBtu/day | AECO/NYMEX | MMBtu/day | AECO/NYMEX | MMBtu/day | AECO/NYMEX | MMBtu/day | AECO/NYMEX | MMBtu/day | ||||||||||
| Swap (percentage of NYMEX) | 90.3 | 140,000 | 89.7 | 145,000 | 84.9 | 90,000 | 83.7 | 40,000 | — | — | ||||||||||
| Natural Gas - AECO Basis | US$/MMBtu | MMBtu/day | US$/MMBtu | MMBtu/day | US$/MMBtu | MMBtu/day | US$/MMBtu | MMBtu/day | US$/MMBtu | MMBtu/day | ||||||||||
| Swap (differential to NYMEX) | — | — | (0.81 | ) | 70,000 | (0.69 | ) | 45,000 | (0.60 | ) | 35,000 | (0.57 | ) | 35,000 | ||||||
| Total AECO Basis Volumes Hedged (MMBtu/day) | 140,000 | 215,000 | 135,000 | 75,000 | 35,000 | |||||||||||||||
| (1) | The prices and volumes in this table represent averages for several contracts representing different periods. The average price for the portfolio of options listed above does not have the same payoff profile as the individual option contracts. Viewing the average price of a group of options is purely for indicative purposes. All positions are financially settled against the benchmark prices disclosed in Note 10 “Financial Instruments and Market Risk Management” in the financial statements as at and for the three and six months ended June 30, 2016. |
| (2) | Crude oil prices referenced to WTI. |
| (3) | Crude oil prices referenced to WTI, multiplied by the Bank of Canada monthly average noon day rate. |
| (4) | MSW differential refers to the discount between WTI and the mixed sweet crude grade at Edmonton, calculated on a monthly weighted average basis in US$. |
| (5) | Natural gas prices referenced to NYMEX Henry Hub last day settlement. |
| (6) | Natural gas prices referenced to AECO 7(a) index. |
| ARC Resources Ltd. | 20 | |
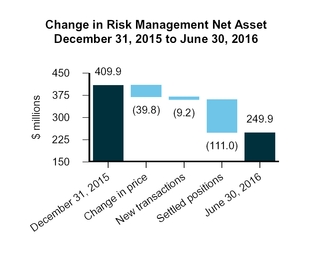
The fair value of ARC’s risk management contracts at June 30, 2016 was a net asset of $249.9 million, representing the expected market price to settle ARC’s contracts at the balance sheet date after any adjustments for credit risk. This may differ from what will eventually be settled in future periods.
Exhibit 10
Operating Netbacks
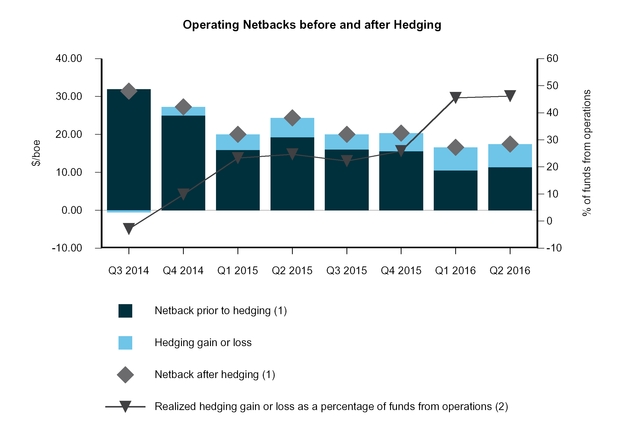
ARC’s 2016 second quarter and year-to-date operating netbacks prior to hedging were $11.37 per boe and $10.94 per boe representing decreases of 41 per cent and 38 per cent as compared to the same periods in 2015, respectively.
ARC’s 2016 second quarter and year-to-date operating netbacks including realized hedging gains and losses, were $17.47 per boe and $17.01 per boe representing decreases of 28 per cent and 23 per cent as compared to the same period in 2015, respectively.
| ARC Resources Ltd. | 21 | |
The components of operating netbacks for the second quarter of 2016 compared to the same period in 2015 are summarized in Table 16:
Table 16
Netbacks (1) | Light and Medium Crude Oil | Heavy Crude Oil | Condensate | Natural Gas | NGLs | Q2 2016 Total | Q2 2015 Total | |||||||
| ($/bbl) | ($/bbl) | ($/bbl) | ($/Mcf) | ($/bbl) | ($/boe) | ($/boe) | ||||||||
| Average sales price | 53.03 | 38.15 | 51.20 | 1.39 | 13.60 | 21.87 | 32.10 | |||||||
| Other income | — | — | — | — | — | 0.07 | 0.07 | |||||||
| Total sales | 53.03 | 38.15 | 51.20 | 1.39 | 13.60 | 21.94 | 32.17 | |||||||
| Royalties | (5.87 | ) | (1.65 | ) | (9.59 | ) | — | (2.48 | ) | (1.97 | ) | (2.50 | ) | |
| Transportation | (2.84 | ) | (0.76 | ) | (2.00 | ) | (0.28 | ) | (6.52 | ) | (2.19 | ) | (2.33 | ) |
Operating expenses (2) | (12.12 | ) | (13.89 | ) | (6.37 | ) | (0.68 | ) | (6.44 | ) | (6.41 | ) | (8.05 | ) |
| Netback prior to hedging | 32.20 | 21.85 | 33.24 | 0.43 | (1.84 | ) | 11.37 | 19.29 | ||||||
| Realized hedging gain | 4.71 | — | — | 1.22 | — | 6.10 | 5.08 | |||||||
| Netback after hedging | 36.91 | 21.85 | 33.24 | 1.65 | (1.84 | ) | 17.47 | 24.37 | ||||||
| % of total netback | 56 | 1 | 6 | 37 | — | 100 | 100 | |||||||
| (1) | Non-GAAP measure which may not be comparable to similar non-GAAP measures used by other entities. Refer to the section entitled "Non-GAAP Measures" contained within this MD&A. |
| (2) | Composed of direct costs incurred to operate crude oil and natural gas wells. A number of assumptions have been made in allocating these costs between light and medium crude oil, heavy crude oil, condensate, natural gas and NGLs production. |
The components of operating netbacks for the six months ended June 30, 2016 compared to the same period in 2015 are summarized in Table 16a:
Table 16a
Netbacks (1) | Light and Medium Crude Oil | Heavy Crude Oil | Condensate | Natural Gas | NGLs | 2016 YTD Total | 2015 YTD Total | |||||||
| ($/bbl) | ($/bbl) | ($/bbl) | ($/Mcf) | ($/bbl) | ($/boe) | ($/boe) | ||||||||
| Average sales price | 45.70 | 24.31 | 46.82 | 1.73 | 11.01 | 21.11 | 30.07 | |||||||
| Other income | — | — | — | — | — | 0.06 | 0.09 | |||||||
| Total sales | 45.70 | 24.31 | 46.82 | 1.73 | 11.01 | 21.17 | 30.16 | |||||||
| Royalties | (5.14 | ) | (1.24 | ) | (8.47 | ) | (0.02 | ) | (2.06 | ) | (1.79 | ) | (2.66 | ) |
| Transportation | (2.80 | ) | (0.78 | ) | (2.23 | ) | (0.29 | ) | (6.53 | ) | (2.19 | ) | (2.35 | ) |
Operating expenses (2) | (11.76 | ) | (14.06 | ) | (7.64 | ) | (0.64 | ) | (6.48 | ) | (6.25 | ) | (7.63 | ) |
| Netback prior to hedging | 26.00 | 8.23 | 28.48 | 0.78 | (4.06 | ) | 10.94 | 17.52 | ||||||
| Realized hedging gain | 6.51 | — | — | 1.09 | — | 6.07 | 4.58 | |||||||
| Netback after hedging | 32.51 | 8.23 | 28.48 | 1.87 | (4.06 | ) | 17.01 | 22.10 | ||||||
| % of total netback | 52 | — | 5 | 44 | (1 | ) | 100 | 100 | ||||||
| (1) | Non-GAAP measure which may not be comparable to similar non-GAAP measures used by other entities. Refer to the section entitled "Non-GAAP Measures" contained within this MD&A. |
| (2) | Composed of direct costs incurred to operate crude oil and natural gas wells. A number of assumptions have been made in allocating these costs between light and medium crude oil, heavy crude oil, condensate, natural gas and NGLs production. |
| ARC Resources Ltd. | 22 | |
Exhibit 11
| (1) | Non-GAAP measure which may not be comparable to similar non-GAAP measures used by other entities. Refer to the section entitled "Non-GAAP Measures" contained within this MD&A. |
| (2) | Refer to Note 9 "Capital Management" in the financial statements as at and for the three and six months ended June 30, 2016 and to the section entitled "Funds from Operations" contained within this MD&A. |
Royalties
ARC pays royalties to the respective provincial governments and landowners of the three western Canadian provinces in which it operates. Approximately 86 per cent of these royalties are Crown royalties. Each province that ARC operates in has established a separate and distinct royalty regime which impacts ARC’s average corporate royalty rate.
In British Columbia, two thirds of ARC’s royalty expense stems from production of crude oil. This has changed significantly from periods prior to 2016 when the majority of ARC’s royalty expense was attributed to the production of natural gas. This change in the composition of royalty expense is due to lower natural gas prices which have reduced ARC's natural gas royalties, combined with increased crude oil production from ARC's Tower field. Royalty rates for crude oil are based on commodity prices, well royalty classification and well productivity.
In Alberta, the majority of ARC’s royalties are related to crude oil production where royalty rates are based on reference prices, production levels and well depths. Similarly, most royalties remitted in Saskatchewan relate to crude oil production and royalty calculations are based on commodity prices, the classification of the product and well productivity.
Each province has various incentive programs in place to promote drilling by reducing the overall royalty expense for producers and offsetting gathering and processing costs. In most cases, the incentive period lasts for a finite period after which point the royalty rate usually increases depending on the production rate of the well and prevailing market commodity prices.
In 2016, the provincial government of Alberta announced the key highlights of the Modernized Royalty Framework ("MRF") that will be effective on January 1, 2017. These highlights include the replacement of royalty credits and holidays on conventional wells through a Drilling and Completion Cost Allowance to emulate a revenue minus cost framework,
| ARC Resources Ltd. | 23 | |
a post-payout royalty rate based on commodity prices, and the reduction of royalty rates for mature wells, with the intent of delivering a neutral internal rate of return for any given play compared to the current royalty framework. No changes will be made to the royalty structure of wells drilled prior to January 2017 for a ten year period from the royalty program's implementation date. Details of the MRF calibration formulas have been released and more specific information can be found on the provincial government's website.
For ARC, the economics of drilling in its Ante Creek Montney and Pembina Cardium plays, within expected price ranges, are relatively consistent with the previous Alberta Royalty Framework.
Total royalties as a percentage of pre-hedged commodity product sales revenue increased from 7.8 per cent ($2.50 per boe) in the second quarter of 2015 to 9 per cent ($1.97 per boe) in the second quarter of 2016. Total royalties decreased from $25 million in the second quarter of 2015 to $21.1 million in the second quarter of 2016. For the six months ended June 30, 2016 total royalties represented 8.5 per cent of pre-hedged commodity product sales ($1.79 per boe) as compared to 8.8 per cent ($2.66 per boe) for the same period in 2015. The decrease reflects the sliding scale effect of decreased commodity prices on royalty rates, as well as the increase in natural gas production volumes which have lower royalty rates as compared to the rates applied to crude oil and liquids production volumes.
Exhibit 12

Operating and Transportation Expenses
Operating expenses decreased $1.64 per boe to $6.41 per boe in the second quarter of 2016 compared to $8.05 per boe in the second quarter of 2015. On an absolute dollar basis, operating expenses have also decreased by $11.9 million or 15 per cent in the second quarter of 2016 as compared to the second quarter of 2015. For the six months ended June 30, 2016 operating expenses decreased by $21.3 million or $1.38 per boe compared to the prior year. The decrease in operating costs for the three and six months ended June 30, 2016 is mainly a result of the disposition of certain non-core assets in 2015, increased production volumes from new wells with relatively lower average operating costs, and diligent cost control efforts, including negotiating service cost decreases with many of ARC's suppliers throughout 2015 and into 2016. Additionally, electricity costs were lower in the second quarter of 2016 at an average Alberta Power Pool Rate of $14.99 per megawatt hour compared to an average of $57.25 per megawatt hour in the second quarter of 2015, further reducing operating costs year-over-year.
| ARC Resources Ltd. | 24 | |
Exhibit 13

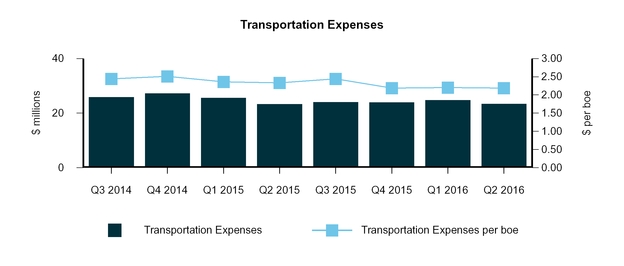
Transportation expenses were $2.19 per boe during the second quarter of 2016 ($2.19 per boe for the six months ended June 30, 2016) as compared to $2.33 per boe in the second quarter of 2015 ($2.35 per boe for the six months ended June 30, 2015). Transportation per boe was six per cent lower for the second quarter of 2016 and seven per cent lower for the six months ended June 30, 2016 compared to same periods in 2015. The decrease in transportation expense per boe is a result of reduced trucking costs at Parkland/Tower area, which became pipeline-connected for its crude oil and liquids volumes over the course of 2015 and early 2016 as well as increased volumes for the three and six months ended June 30, 2016 compared to the same period in the prior year.
Exhibit 14
G&A Expenses and Share-Based Compensation
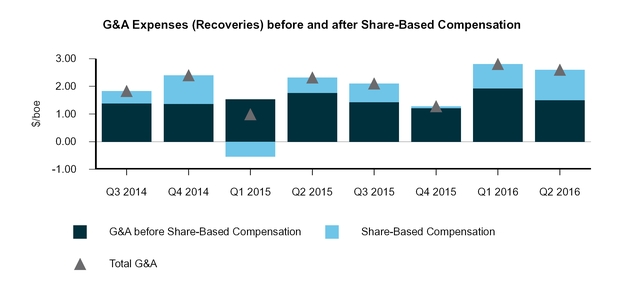
G&A, prior to share-based compensation expense and net of capitalized G&A and overhead recoveries on operated properties, decreased by eight per cent to $16.2 million in the second quarter of 2016 from $17.7 million in the second quarter of 2015. The overall decrease reflects lower compensation associated with a smaller workforce and reduced administrative spending, partially offset by lower capitalized G&A and overhead recoveries from reduced spending during the first quarter of 2016.
| ARC Resources Ltd. | 25 | |
For the six months ended June 30, 2016, ARC's G&A prior to share-based compensation expense and net of capitalized G&A and overhead recoveries on operated properties was $38.1 million, a $3.9 million increase from the same period in 2015. The increase reflects decreased capitalized G&A and overhead recoveries from partners associated with lower capital spending, partially offset by lower compensation and bonus expenses.
Table 17 is a breakdown of G&A and share-based compensation expenses:
Table 17
| Three Months Ended | Six Months Ended | |||||||||||
| June 30 | June 30 | |||||||||||
| G&A and Share-Based Compensation | 2016 | 2015 | % Change | 2016 | 2015 | % Change | ||||||
| ($ millions, except per boe) | ||||||||||||
G&A expenses before share-based compensation expenses and recoveries (1) | 22.4 | 25.0 | (10 | ) | 49.6 | 52.2 | (5 | ) | ||||
| Capitalized G&A and overhead recoveries | (6.2 | ) | (7.3 | ) | (15 | ) | (11.5 | ) | (18.0 | ) | (36 | ) |
| G&A expenses before share-based compensation expenses | 16.2 | 17.7 | (8 | ) | 38.1 | 34.2 | 11 | |||||
G&A – share-based compensation expenses (2) | 11.7 | 5.5 | (113 | ) | 21.6 | (0.3 | ) | 100 | ||||
| Total G&A | 27.9 | 23.2 | 20 | 59.7 | 33.9 | 76 | ||||||
| Total G&A per boe | 2.60 | 2.32 | 12 | 2.71 | 1.63 | 66 | ||||||
| (1) | Includes expenses recognized under the DSU Plan. |
| (2) | Comprises expenses recognized under the RSU and PSU, Share Option and LTRSA Plans. |
Exhibit 15
Share-Based Compensation Plans – Restricted Share Unit and Performance Share Unit Plan, Share Option Plan, Deferred Share Unit Plan, and Long-term Restricted Share Award Plan
Restricted Share Unit and Performance Share Unit Plan
The RSU and PSU Plan is designed to offer each eligible employee and officer (the “plan participants”) cash compensation in relation to the underlying value of a specified number of share units. The RSU and PSU Plan consists of RSUs for which the number of units is fixed and will vest over a period of three years and PSUs for which the number of units is variable and will vest at the end of three years.
Upon vesting, the plan participant is entitled to receive a cash payment based on the underlying value of the share units plus accrued dividends. The cash compensation issued upon vesting of the PSUs is dependent upon the total return performance of ARC compared to its peers. Total return is calculated as a sum of the change in the market price of the common shares in the period plus the amount of dividends in the period. A performance multiplier is applied to the PSUs
| ARC Resources Ltd. | 26 | |
based on the percentile rank of ARC’s total shareholder return compared to its peers. The performance multiplier ranges from zero if ARC’s performance ranks in the bottom quartile, to two for top quartile performance.
ARC recorded G&A expenses of $9.8 million during the second quarter of 2016 in accordance with the RSU and PSU Plan, as compared to expenses of $4.1 million during the second quarter of 2015. For the six months ended June 30, 2016, ARC recorded an expense related to the RSU and PSU Plan of $18.7 million, an increase of $21.2 million from six months ended June 30, 2015. Compensation charges for both the second quarter of 2016 and the six months ended June 30, 2016 as compared to the same periods of the prior year increased due to the valuation of awards at June 30, 2016 as ARC's share price increased from $16.70 per share outstanding at December 31, 2015 and $18.89 per share outstanding at March 31, 2016 to $22.11 at June 30, 2016.
During the six months ended June 30, 2016, ARC made cash payments of $11.7 million in respect of the RSU and PSU Plan ($14.4 million for the six months ended June 30, 2015). Of these payments, $9.1 million were in respect of amounts recorded to G&A expenses ($11 million for the six months ended June 30, 2015) and $2.6 million were in respect of amounts recorded to operating expenses and capitalized as PP&E and E&E assets ($3.4 million for the six months ended June 30, 2015). These amounts were accrued in prior periods.
Table 18 shows the changes to the RSU and PSU Plan during 2016:
Table 18
| RSU and PSU Plan (number of units, thousands) | RSUs | PSUs (1) | Total RSUs and PSUs |
| Balance, December 31, 2015 | 730 | 1,577 | 2,307 |
| Granted | 210 | 376 | 586 |
| Distributed | (139) | (207) | (346) |
| Forfeited | (97) | (86) | (183) |
| Balance, June 30, 2016 | 704 | 1,660 | 2,364 |
| (1) | Based on underlying units before any effect of the performance multiplier. |
The liability associated with the RSUs and PSUs granted is recognized in the consolidated statements of income (the "statements of income") over the vesting period while being adjusted each period for changes in the underlying share price, accrued dividends and the number of PSUs expected to be issued on vesting. In periods where substantial share price fluctuation occurs, ARC’s G&A expenses are subject to greater volatility.
Due to the variability in the future payments under the plan, ARC estimates that between $16.1 million and $92.9 million will be paid out in 2016 through 2019 based on the current share price, accrued dividends, and ARC’s market performance relative to its peers. Table 19 is a summary of the range of future expected payments under the RSU and PSU Plan based on variability of the performance multiplier and units outstanding under the RSU and PSU Plan as at June 30, 2016:
Table 19
| Value of RSU and PSU Plan as at | ||||||
| June 30, 2016 | Performance multiplier | |||||
| (units thousands and $ millions, except per share) | — | 1.0 | 2.0 | |||
| Estimated units to vest | ||||||
| RSUs | 728 | 728 | 728 | |||
| PSUs | — | 1,737 | 3,474 | |||
Total units (1) | 728 | 2,465 | 4,202 | |||
Share price (2) | 22.11 | 22.11 | 22.11 | |||
| Value of RSU and PSU Plan upon vesting | 16.1 | 54.5 | 92.9 | |||
| 2016 | 3.7 | 9.9 | 16.1 | |||
| 2017 | 6.4 | 16.3 | 26.2 | |||
| 2018 | 4.5 | 18.5 | 32.4 | |||
| 2019 | 1.5 | 9.8 | 18.2 | |||
| (1) | Includes additional estimated units to be issued under the RSU and PSU Plan for dividends accrued to date. |
| (2) | Per share outstanding. Values will fluctuate over the vesting period based on the volatility of the underlying share price. Assumes a future share price of $22.11, which is based on the closing share price at June 30, 2016. |
| ARC Resources Ltd. | 27 | |
Share Option Plan
Share options are granted to employees and consultants of ARC, vesting evenly on the fourth and fifth anniversaries of their respective grant dates, and have a maximum term of seven years. The option holder has the right to exercise the options at the original exercise price or at a reduced exercise price, equal to the exercise price at grant date less all dividends paid subsequent to the grant date and prior to the exercise date.
At June 30, 2016, ARC had four million share options outstanding under this plan, representing 1.1 per cent of outstanding shares, with a weighted average exercise price of $21.47 per share. At June 30, 2016, approximately 0.7 million share options were exercisable with a weighted average exercise price of $18.01 per share. Compensation expense related to share options of $1.2 million has been recorded during the second quarter of 2016 ($2.1 million for the six months ended June 30, 2016) compared to $0.7 million for the second quarter of 2015 ($1.5 million for the six months ended June 30, 2015) and is included within G&A expenses.
Deferred Share Unit Plan
ARC has a DSU Plan for its non-employee directors under which each director receives a minimum of 60 per cent of their total annual remuneration in the form of DSUs. Each DSU fully vests on the date of grant but is settled in cash only when the director has ceased to be a member of the Board. For the three and six months ended June 30, 2016, G&A expenses of $1.5 million and $2.8 million were recorded in relation to the DSU Plan (G&A expenses of $0.3 million and $nil in 2015).
Long-term Restricted Share Award Plan
ARC's LTRSA Plan awards shares of ARC to qualifying officers and employees and is intended to further align participant compensation with the interests of the Company and its shareholders over the long-term. LTRSA grants consist of restricted common shares that are awarded at the date of grant and a cash payment made equal to the estimated personal tax obligation associated with the total award. The restricted shares issued on the grant date of the award are held in trust until the vesting conditions have been met.
While in trust, the restricted shares earn dividends which are reinvested into ARC common shares via the stock dividend program and these stock dividends are also held in trust until vested. Each LTRSA has a 10 year term and vests evenly on the eighth, ninth, and tenth anniversaries of the grant date of the award. Restricted shares and any accrued dividends that are subject to forfeiture will be redeemed and cancelled by ARC.
Compensation expense associated with the cash payment is recognized at the fair value on the grant date, while expense associated with the restricted common shares is estimated as the fair value of the award equal to the previous five-day weighted average trading price of ARC shares on the grant date and is recognized over the vesting period.
At June 30, 2016, ARC had 0.2 million restricted shares outstanding under this plan. ARC recorded G&A expenses of $0.7 million relating to the cash payment under the LTRSA Plan during the three and six months ended June 30, 2016 and 2015.
Interest and Financing Charges
Interest and financing charges increased two per cent to $12.3 million in the second quarter of 2016 from $12.1 million in the second quarter of 2015. For the six months ended June 30, 2016, interest and financing charges were $25.4 million as compared to $25 million for the same period in 2015, an increase of two per cent.
At June 30, 2016, ARC had $1 billion of long-term debt outstanding, including a current portion of $34.3 million that is due for repayment within the next 12 months. ARC's debt balance is fixed at a weighted average interest rate of 4.36 per cent. Approximately 96 per cent (US$743.8 million) of ARC’s debt outstanding is denominated in US dollars.
Foreign Exchange Gains and Losses
ARC recorded a foreign exchange loss of $2.1 million in the second quarter of 2016 compared to a gain of $16.4 million in the second quarter of 2015. During the three months ended June 30, 2015, the value of the US dollar relative to the Canadian dollar decreased from $1.27 at March 31, 2015 to $1.25 at June 30, 2015, resulting in an unrealized gain on the revaluation of ARC's US dollar denominated debt. For the three months ended June 30, 2016, the value of the US dollar relative to the Canadian dollar remained relatively flat at $1.30 at March 31, 2016 and June 30, 2016.
| ARC Resources Ltd. | 28 | |
For the six months ended June 30, 2016, ARC recorded a foreign exchange gain of $65.3 million compared to a loss of $71.7 million for the same period in the prior year. During the six months ended June 30, 2015, the value of the US dollar relative to the Canadian dollar increased from $1.16 at December 31, 2014 to $1.25 at June 30, 2015, resulting in an unrealized loss on the revaluation of ARC's US dollar denominated debt. During the six months ended June 30, 2016, the value of the US dollar relative to the Canadian dollar decreased from $1.38 at December 31, 2015 to $1.30 at June 30, 2016, resulting in an unrealized gain on the revaluation of ARC's US dollar denominated debt.
Table 20 shows the various components of foreign exchange gains and losses:
Table 20
| Three Months Ended | Six Months Ended | |||||||||||
| June 30 | June 30 | |||||||||||
Foreign Exchange Gains and Losses ($ millions) | 2016 | 2015 | % Change | 2016 | 2015 | % Change | ||||||
| Unrealized gain (loss) on US denominated debt | (2.1 | ) | 16.9 | (112 | ) | 65.3 | (71.4 | ) | (191 | ) | ||
| Realized gain on US denominated transactions | — | (0.5 | ) | (100 | ) | — | (0.3 | ) | (100 | ) | ||
| Total foreign exchange gain (loss) | (2.1 | ) | 16.4 | (113 | ) | 65.3 | (71.7 | ) | (191 | ) | ||
Taxes
ARC recorded a current income tax expense of $6 million in the second quarter of 2016 ($1 million recovery for the six months ended June 30, 2016) compared to an expense of $1.8 million during the second quarter of 2015 ($4.1 million expense for the six months ended June 30, 2015). This increase in current tax expense for the second quarter of 2016 from the second quarter of 2015 reflects the recovery in commodity prices from Q1 2016. The decrease in current tax expense for the six months ended June 30, 2016 from the same period of the prior year relates primarily to decreased commodity prices.
During the second quarter of 2016, a deferred income tax recovery of $40.8 million was recorded ($34.3 million recovery for the six months ended June 30, 2016) compared to an expense of $25.1 million in the second quarter of 2015 ($38.1 million expense for the six months ended June 30, 2015). For the three and six months ended June 30, 2016 as compared to the three and six months ended June 30, 2015, ARC’s decrease in deferred tax expense primarily relates to unrealized losses recorded on risk management contracts in 2016 and a net increase to ARO as compared to the 2015 period.
The income tax pools (detailed in Table 21) are deductible at various rates and annual deductions associated with the initial tax pools will decline over time.
Table 21
Income Tax Pool Type ($ millions) | June 30, 2016 | Annual Deductibility | ||
| Canadian oil and gas property expense | 679.2 | 10% declining balance | ||
| Canadian development expense | 790.2 | 30% declining balance | ||
| Canadian exploration expense | — | 100 | % | |
| Undepreciated capital cost | 783.9 | Primarily 25% declining balance | ||
| Other | 17.9 | Various rates, 7% declining balance to 20% | ||
| Total federal tax pools | 2,271.2 | |||
| Additional Alberta tax pools | 6.5 | Various rates, 25% declining balance to 100% | ||
DD&A Expense and Impairment Charges
ARC records DD&A expense on its PP&E over the individual useful lives of the assets employing the unit of production method using proved plus probable reserves and associated estimated future development capital required for its crude oil and natural gas assets, and a straight-line method for its corporate administrative assets. Assets in the E&E phase are not amortized. For the three and six months ended June 30, 2016, ARC recorded DD&A expense of $125.6 million and $259.8 million as compared to $152.5 million and $317.8 million for the three and six months ended June 30, 2015, respectively. The decrease in the DD&A rate before impairment per boe for the three and six months ended June 30, 2016 reflects the effect of a lower depletable base as result of reduced costs of finding and development of reserves and $469.6 million of impairment charges recorded during the year ended December 31, 2015.
| ARC Resources Ltd. | 29 | |
Impairment is recognized when the carrying value of an asset or group of assets exceeds its recoverable amount, defined as the higher of its value in use or fair value less costs of disposal. Any asset impairment that is recorded is recoverable to its original value less any associated DD&A expense should there be indicators that the recoverable amount of the asset has increased in value since the time of recording the initial impairment. For the six months ended June 30, 2016, an impairment charge of $0.4 million was recognized associated with the disposition of non-core assets in the southern Alberta district, offset by a recovery of impairment recognized on the re-measurement of a pre-acquisition working interest as a result of the acquisition of assets in the Pembina district. For the six months ended June 30, 2015, an impairment charge of $11.7 million was recognized associated with non-core assets located in the southern Alberta district that were disposed in the second quarter of 2015. As future commodity prices remain volatile, impairment charges or recoveries could be recorded in future periods.
A breakdown of DD&A expense and impairment charges is summarized in Table 22:
Table 22
| Three Months Ended | Six Months Ended | |||||||||||
| June 30 | June 30 | |||||||||||
DD&A Expense and Impairment Charges ($ millions, except per boe amounts) | 2016 | 2015 | % Change | 2016 | 2015 | % Change | ||||||
| Depletion of crude oil and natural gas assets | 124.3 | 150.9 | (18 | ) | 257.1 | 314.6 | (18 | ) | ||||
| Depreciation of administrative assets | 1.3 | 1.6 | (19 | ) | 2.7 | 3.2 | (16 | ) | ||||
| Impairment (recovery) charges | 0.4 | (1.7 | ) | (124 | ) | 0.4 | 11.7 | (97 | ) | |||
| Total DD&A expense and impairment charges | 126.0 | 150.8 | (16 | ) | 260.2 | 329.5 | (21 | ) | ||||
| DD&A rate before impairment per boe | 11.73 | 15.25 | (23 | ) | 11.80 | 15.25 | (23 | ) | ||||
| DD&A and impairment rate per boe | 11.76 | 15.08 | (22 | ) | 11.82 | 15.82 | (25 | ) | ||||
Capital Expenditures, Acquisitions and Dispositions
Capital expenditures before acquisitions, dispositions or purchases of undeveloped land totaled $112.6 million in the second quarter of 2016 as compared to $98.4 million during the second quarter of 2015. This total includes development and production additions to PP&E of $103.6 million and additions to E&E assets of $9.0 million. PP&E expenditures include additions to crude oil and natural gas development and production assets and administrative assets. E&E expenditures include asset additions in areas that have been determined by Management to be in the E&E stage.
A breakdown of capital expenditures, acquisitions and dispositions is shown in Table 23:
Table 23
| Three Months Ended June 30 | ||||||||||||||
| 2016 | 2015 | |||||||||||||
Capital Expenditures ($ millions) | E&E | PP&E | Total | E&E | PP&E | Total | % Change | |||||||
| Geological and geophysical | 0.1 | 4.2 | 4.3 | 0.3 | 2.8 | 3.1 | 39 | |||||||
| Drilling and completions | 4.8 | 50.9 | 55.7 | 0.5 | 51.3 | 51.8 | 8 | |||||||
| Plant and facilities | 4.1 | 48.1 | 52.2 | 0.3 | 42.9 | 43.2 | 21 | |||||||
| Administrative assets | — | 0.4 | 0.4 | — | 0.3 | 0.3 | 33 | |||||||
| Total capital expenditures | 9.0 | 103.6 | 112.6 | 1.1 | 97.3 | 98.4 | 14 | |||||||
| Undeveloped land | — | — | — | — | 0.1 | 0.1 | (100 | ) | ||||||
| Total capital expenditures including undeveloped land purchases | 9.0 | 103.6 | 112.6 | 1.1 | 97.4 | 98.5 | 14 | |||||||
Acquisitions (1) | — | 111.6 | 111.6 | 14.1 | — | 14.1 | 100 | |||||||
Dispositions (2) | — | (3.0 | ) | (3.0 | ) | — | (14.9 | ) | (14.9 | ) | (80 | ) | ||
| Total capital expenditures, land purchases and net acquisitions and dispositions | 9.0 | 212.2 | 221.2 | 15.2 | 82.5 | 97.7 | 126 | |||||||
| (1) | Excludes nil and $18.1 million of non-cash petroleum and natural gas property transactions in the second quarter of 2016 and 2015, respectively. |
| (2) | Represents proceeds and adjustments to proceeds from divestitures. |
| ARC Resources Ltd. | 30 | |
For the six months ended June 30, 2016, capital expenditures before property acquisitions, dispositions or purchases of undeveloped land totaled $171.7 million as compared to $227.9 million during the same period of 2015. This total includes development and production additions to PP&E of $147.2 million and additions to E&E assets of $24.5 million.
Table 23a
| Six Months Ended June 30, 2016 | ||||||||||||||
| 2016 | 2015 | |||||||||||||
Capital Expenditures ($ millions) | E&E | PP&E | Total | E&E | PP&E | Total | % Change | |||||||
| Geological and geophysical | 0.3 | 6.8 | 7.1 | — | 5.4 | 5.4 | 31 | |||||||
| Drilling and completions | 15.8 | 63.1 | 78.9 | 0.5 | 134.3 | 134.8 | (41 | ) | ||||||
| Plant and facilities | 8.4 | 76.5 | 84.9 | 0.3 | 86.6 | 86.9 | (2 | ) | ||||||
| Administrative assets | 0.8 | 0.8 | — | 0.8 | 0.8 | — | ||||||||
| Total capital expenditures | 24.5 | 147.2 | 171.7 | 0.8 | 227.1 | 227.9 | (25 | ) | ||||||
| Undeveloped land | — | — | — | — | 1.5 | 1.5 | (100 | ) | ||||||
| Total capital expenditures including undeveloped land purchases | 24.5 | 147.2 | 171.7 | 0.8 | 228.6 | 229.4 | (25 | ) | ||||||
Acquisitions (1) | — | 126.7 | 126.7 | 14.1 | — | 14.1 | 100 | |||||||
Dispositions (2) | — | (3.0 | ) | (3.0 | ) | — | (25.9 | ) | (25.9 | ) | (88 | ) | ||
| Total capital expenditures, land purchases and net acquisitions and dispositions | 24.5 | 270.9 | 295.4 | 14.9 | 202.7 | 217.6 | 36 | |||||||
| (1) | Excludes nil and $28.7 million of non-cash petroleum and natural gas property transactions in the six months ended June 30, 2016 and 2015, respectively. |
| (2) | Represents proceeds and adjustments to proceeds from divestitures. |
During the second quarter of 2016, ARC divested of certain non-core shallow natural gas assets located in southern Alberta. The divested properties had associated natural gas production of approximately 650 boe per day.
At the end of the second quarter of 2016, ARC completed the acquisition of certain properties producing approximately 2,200 boe per day of mainly light, sweet crude oil in the Pembina area of Alberta for cash consideration of $111.5 million, subject to final adjustments. The major assets acquired consisted of additional working interest in properties where ARC already held a significant interest. The transaction was recorded as a business combination under IFRS. Refer to Note 4 "Business Combination" in the financial statements as at and for the three and six months ended June 30, 2016.
Asset Retirement Obligations and Reclamation Fund
At June 30, 2016, ARC has recorded ARO of $696.6 million ($573.2 million at December 31, 2015) for the future abandonment and reclamation of ARC’s properties. The estimated ARO includes assumptions in respect of actual costs to abandon wells or reclaim the property, the time frame in which such costs will be incurred, as well as annual inflation factors in order to calculate the undiscounted total future liability. The future liability has been discounted at a liability-specific risk-free interest rate of 1.7 per cent (2.2 per cent at December 31, 2015).
At the end of the second quarter of 2016, ARC recognized ARO of $13.9 million associated with the acquisition of certain properties in the Pembina area of Alberta. The acquired obligations were recognized on the date of acquisition at fair value and then discounted at a liability-specific risk-free interest rate of 1.7 per cent at June 30, 2016. The ARO revaluation of $35.4 million from the change in the discount rate was recorded as an increase to the liability, with a corresponding increase to the carrying amount of the related asset in PP&E.
Accretion charges of $3 million and $6.1 million for the three and six months ended June 30, 2016 ($3.2 million and $6.8 million for the same period in 2015), respectively, have been recognized in the statements of income to reflect the increase in ARO associated with the passage of time. Actual spending under ARC’s abandonment and reclamation program for the three and six months ended June 30, 2016 was $1.8 million and $3.9 million ($1.6 million and $3.6 million for the same period in 2015), respectively. For the three and six months ended June 30, 2016, acquisitions increased ARO by $12.7 million and $13.9 million ($nil for same periods in 2015), respectively.
In 2005, ARC established a restricted reclamation fund to finance obligations specifically associated with its Redwater property. Minimum contributions to this fund will be approximately $59 million in total over the next 39 years. The balance of this fund totaled $34.7 million at June 30, 2016 compared to $34.3 million at December 31, 2015. Under the terms of
| ARC Resources Ltd. | 31 | |
ARC’s investment policy, cash in the reclamation fund can only be invested in certain securities and require a minimum credit rating for investments of A or higher.
Environmental stewardship is a core value at ARC and abandonment and reclamation activities continue to be made in a prudent, responsible manner with the oversight of the Health, Safety and Environment Committee of the Board. Ongoing abandonment expenditures for all of ARC’s assets are funded entirely out of cash flow from operating activities. ARC’s Licensee Liability Rating is well within the Alberta Energy Regulator’s guidelines at this date.
Exhibit 16
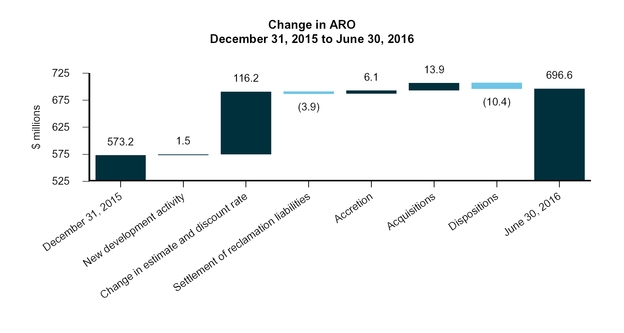
Capitalization, Financial Resources and Liquidity
ARC’s long-term goal is to fund current period reclamation expenditures, dividend payments and capital expenditures necessary for the replacement of production declines using funds from operations. Value-creating activities will be financed with a combination of funds from operations and other sources of capital.
ARC typically uses three markets to raise capital: equity, bank debt and long-term notes. Long-term notes are issued to large institutional investors normally with an average term of five to 12 years. The cost of this debt is based upon two factors: the current rate of long-term government bonds and ARC’s credit spread. ARC’s weighted average interest rate on its outstanding long-term notes is currently 4.36 per cent.
| ARC Resources Ltd. | 32 | |
A breakdown of ARC’s capital structure as at June 30, 2016 and December 31, 2015 is outlined in Table 24:
Table 24
Capital Structure and Liquidity ($ millions, except per cent and ratio amounts) | June 30, 2016 | December 31, 2015 | ||
Long-term debt (1) | 1,007.5 | 1,114.3 | ||
Working capital surplus (2) | (38.2 | ) | (129.2 | ) |
| Net debt | 969.3 | 985.1 | ||
Market capitalization (3) | 7,762.8 | 5,796.6 | ||
| Total capitalization | 8,732.1 | 6,781.7 | ||
| Net debt as a percentage of total capitalization (%) | 11.1 | 14.5 | ||
| Net debt to annualized funds from operations (ratio) | 1.7 | 1.3 | ||
| (1) | Includes a current portion of long-term debt of $34.3 million at June 30, 2016 and $57.9 million at December 31, 2015. |
| (2) | Working capital surplus or deficit is calculated as current assets less current liabilities as they appear on the condensed interim consolidated balance sheets (the "balance sheets"), and excludes current unrealized amounts pertaining to risk management contracts, assets held for sale and ARO contained within liabilities associated with assets held for sale, as well as the current portion of long-term debt and current portion of ARO. |
| (3) | Calculated using the total common shares outstanding at June 30, 2016 multiplied by the closing share price of $22.11 at June 30, 2016 (closing share price of $16.70 at December 31, 2015). |
Management intends to keep its net debt balance to a ratio of less than two times annualized funds from operations for temporary periods with a long-term strategy to keep its net debt balance to a ratio of between one to 1.5 times annualized funds from operations and less than 20 per cent of total market capitalization. This strategy has resulted in manageable debt levels to date and has positioned ARC to remain well within its debt covenants. Refer to Note 9 "Capital Management" in the financial statements as at and for the three and six months ended June 30, 2016.
ARC closed the quarter with a strong balance sheet with $969.3 million of net debt outstanding. With the acquisition of Pembina assets closing late in the second quarter of 2016, the net debt to 2016 annualized funds from operations ratio was 1.7 times and net debt was approximately 11 per cent of ARC's total capitalization at the end of the second quarter. Management expects the ratio to return to target levels of approximately 1.5 times by year-end as cash flows associated with the acquisition are realized throughout the second half of 2016.
Exhibit 17
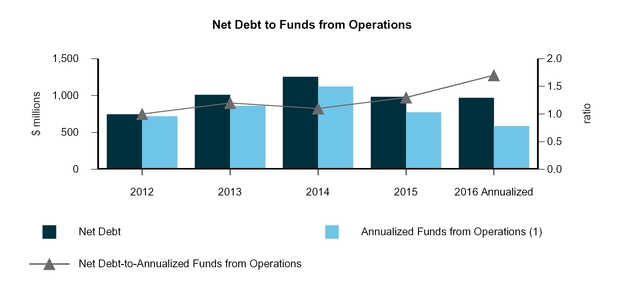
| (1) | Refer to Note 9 "Capital Management" in the financial statements as at and for the three and six months ended June 30, 2016 and to the section entitled "Funds from Operations” contained within this MD&A. |
| ARC Resources Ltd. | 33 | |
The following exhibits the balance of cash inflows and outflows over the past four years and for the year-to-date. In any period when cash outflows exceed inflows, ARC’s net debt balance will increase to cover the shortfall and will decrease in any period when inflows exceed outflows.
Exhibit 18
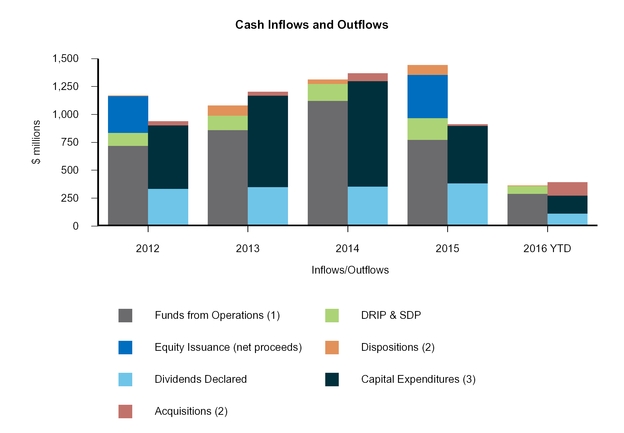
Table 25
| 2016 YTD | 2015 | 2014 | 2013 | 2012 | ||||||
| Cash Inflows | ||||||||||
Funds from operations (1) | 291.8 | 773.4 | 1,124.0 | 861.8 | 719.8 | |||||
| DRIP & SDP | 69.2 | 195.5 | 151.0 | 130.1 | 116.3 | |||||
| Equity issuance (net proceeds) | — | 386.1 | — | — | 330.7 | |||||
Dispositions (2) | 3.0 | 88.8 | 39.3 | 89.8 | 4.1 | |||||
| Cash Outflows | ||||||||||
| Dividends declared | 122.4 | 410.5 | 380.2 | 374.0 | 357.4 | |||||
Capital expenditures (3) | 171.5 | 547.9 | 1,007.6 | 874.2 | 607.7 | |||||
Acquisitions (2) | 126.7 | 14.4 | 73.5 | 36.4 | 36.5 | |||||
| (1) | Refer to Note 9 "Capital Management" in the financial statements as at and for the three and six months ended June 30, 2016 and to the section entitled "Funds from Operations" contained within this MD&A. |
| (2) | Excludes non-cash property transactions. |
| (3) | Excludes capital expenditures attributable to non-cash share options and asset retirement expenditures. |
At June 30, 2016, ARC had total available credit facilities of approximately $2.2 billion with debt of $1 billion currently outstanding. ARC’s long-term debt balance includes a current portion of $34.3 million at June 30, 2016 ($57.9 million at December 31, 2015), reflecting principal payments that are due to be paid within the next 12 months. ARC intends to finance these obligations by using cash on hand or drawing on its syndicated credit facility at the time the payments are due.
| ARC Resources Ltd. | 34 | |
ARC’s debt agreements contain a number of covenants, all of which were met as at June 30, 2016. These agreements are available at www.sedar.com. ARC calculates its covenants four times annually. The major financial covenants are described below:
Table 26
| Covenant Description | Estimated Position at June 30, 2016 (1) | |
| Long-term debt and letters of credit not to exceed three and a quarter times trailing twelve month net income before non-cash items, income taxes and interest expense | 1.4 times | |
| Long-term debt, letters of credit, and subordinated debt not to exceed four times trailing twelve month net income before non-cash items, income taxes and interest expense | 1.4 times | |
| Long-term debt and letters of credit not to exceed 50 per cent of the book value of shareholders’ equity and long-term debt, letters of credit and subordinated debt | 20 | % |
| (1) | Estimated position, subject to final approval. |
Shareholders’ Equity
At June 30, 2016, there were 351.1 million shares outstanding, an increase of four million shares compared to December 31, 2015. The four million shares issued are attributable to those issued to participants in the DRIP and SDP.
At June 30, 2016, ARC had four million share options outstanding under its Share Option Plan, representing 1.1 per cent of outstanding shares, with a weighted average exercise price of $21.47 per share. These options vest in equal parts on the fourth and fifth anniversaries of the grant date. At June 30, 2016, approximately 0.7 million share options were exercisable with a weighted average exercise price of $18.01 per share. For more information on the Share Option Plan, refer to the section entitled "Share Option Plan” contained within this MD&A.
At June 30, 2016, ARC had 0.2 million restricted shares outstanding under its LTRSA Plan. These awards vest evenly on the eighth, ninth and tenth anniversaries of the grant date. For more information on the restricted shares outstanding and held in trust under ARC's LTRSA Plan, refer to the section entitled "Long-term Restricted Share Award Plan” contained within this MD&A.
Dividends
In the second quarter of 2016, ARC declared dividends totaling $52.5 million ($0.15 per share outstanding) compared to $102.1 million ($0.30 per share outstanding) during the second quarter of 2015. ARC reduced its monthly dividend to $0.05 per share outstanding commencing with the February dividend payable March 15, 2016.
As a dividend-paying corporation, ARC declares monthly dividends to its shareholders. ARC continually assesses dividend levels in light of commodity prices, capital expenditure programs, and production volumes to ensure that dividends are in line with the long-term strategy and objectives of ARC as per the following guidelines:
| • | To maintain a dividend policy that, in normal times, in the opinion of Management and the Board, is sustainable after factoring in the impact of current commodity prices on funds from operations. ARC’s objective is to normalize the effect of volatility of commodity prices rather than to pass that volatility onto shareholders in the form of fluctuating monthly dividends. |
| • | To maintain ARC’s financial flexibility, by reviewing ARC’s level of debt to equity and debt to funds from operations. The use of funds from operations and proceeds from equity offerings to fund capital development activities reduces the need to use debt to finance these expenditures. |
ARC is focused on value creation and long term returns to shareholders, with the dividend being a key component of its business strategy. As a result of the reduction of the monthly dividend to $0.05 per share outstanding, ARC’s dividend as a percent of funds from operations has decreased from an average of 49 per cent in the second quarter of 2015 to an average of 37 per cent in the second quarter of 2016. ARC believes that it is currently positioned to sustain current dividend levels despite the volatile commodity price environment.
| ARC Resources Ltd. | 35 | |
Exhibit 19
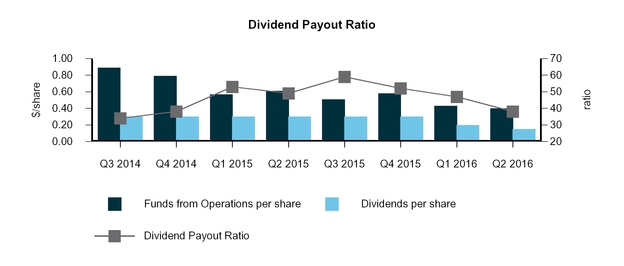
The actual amount of future monthly dividends is proposed by Management and is subject to the approval and discretion of the Board. The Board reviews future dividends in conjunction with their review of quarterly financial and operating results. Dividends are taxable to the shareholder irrespective of whether payment is received in cash or shares via the DRIP. In the case of shares issued via the SDP, dividends received are converted to a future capital gain to the recipient. Shareholders should consult their own tax advisors with respect to tax implications of dividends received in cash or via the DRIP or SDP in their particular circumstances.
On July 18, 2016, ARC confirmed that a dividend of $0.05 per common share designated as an eligible dividend will be paid on August 15, 2016 to shareholders of record on July 29, 2016 with an ex-dividend date of July 27, 2016.
Please refer to ARC’s website at www.arcresources.com for details of the estimated monthly dividend amounts and dividend dates for 2016.
Environmental Initiatives Impacting ARC
In the fourth quarter of 2015, the provincial government of Alberta released its Climate Leadership Plan which will impact all consumers and businesses that contribute to carbon emissions in Alberta. This plan includes imposing carbon pricing that is applied across all sectors, starting at $20 per tonne on January 1, 2017 and moving to $30 per tonne on January 1, 2018, the phase-out of coal-fired power generation by 2030, a cap on oil sands emissions production of 100 megatonnes, and a 45 per cent reduction in methane emissions by the crude oil and natural gas sector by 2025. The provincial government of Alberta included the proposed carbon pricing measures in the release of its 2016 budget in the second quarter of 2016.
ARC expects the Climate Leadership Plan to increase the cost of operating its properties located in Alberta and is currently evaluating the expected impact of this plan on its results of operations.
| ARC Resources Ltd. | 36 | |
Contractual Obligations and Commitments
The following is a summary of ARC’s contractual obligations and commitments as at June 30, 2016:
Table 27
| Payments Due by Period | ||||||||||
| 1 Year | 2-3 Years | 4-5 Years | Beyond 5 Years | Total | ||||||
Debt repayments (1) | 34.3 | 165.7 | 213.5 | 594.0 | 1,007.5 | |||||
Interest payments (2) | 43.6 | 78.3 | 61.0 | 54.5 | 237.4 | |||||
Reclamation fund contributions (3) | 3.2 | 6.1 | 5.6 | 44.3 | 59.2 | |||||
| Purchase commitments | 54.8 | 17.9 | 7.2 | 4.7 | 84.6 | |||||
| Transportation commitments | 75.9 | 129.0 | 85.7 | 214.2 | 504.8 | |||||
| Operating leases | 15.6 | 29.2 | 27.1 | 37.6 | 109.5 | |||||
Risk management contract premiums (4) | 5.2 | 3.4 | 0.3 | — | 8.9 | |||||
| Total contractual obligations and commitments | 232.6 | 429.6 | 400.4 | 949.3 | 2,011.9 | |||||
| (1) | Long-term and current portion of long-term debt. |
| (2) | Fixed interest payments on senior notes. |
| (3) | Contribution commitments to a restricted reclamation fund associated with the Redwater property. |
| (4) | Fixed premiums to be paid in future periods on certain commodity price risk management contracts. |
On June 29, 2016, ARC entered into a binding agreement to acquire an additional working interest in certain producing properties in the Pembina area of Alberta for cash consideration of approximately $35 million, subject to final adjustments. These assets produce approximately 800 barrels per day of light, sweet crude oil. The transaction is expected to close in August.
Subsequent to June 30, 2016, ARC entered into an additional natural gas transportation commitment for ten years totaling approximately $31.5 million.
Off-Balance Sheet Arrangements
ARC has certain lease agreements, all of which are reflected in the Contractual Obligations and Commitments table (Table 27), which were entered into in the normal course of operations. All leases have been treated as operating leases whereby the lease payments are included in operating expenses or G&A expenses depending on the nature of the lease. No asset or liability value has been assigned to these leases on the balance sheet as of June 30, 2016.
Critical Accounting Estimates
ARC has continuously refined and documented its management and internal reporting systems to ensure that accurate, timely, internal and external information is gathered and disseminated.
ARC’s financial and operating results incorporate certain estimates including:
| • | estimated revenues, royalties and operating expenses on production as at a specific reporting date but for which actual revenues and costs have not yet been received; |
| • | estimated capital expenditures on projects that are in progress; |
| • | estimated DD&A charges that are based on estimates of crude oil and natural gas reserves that ARC expects to recover in the future; |
| • | estimated fair values of financial instruments that are subject to fluctuation depending upon the underlying commodity prices, foreign exchange rates and interest rates, volatility curves and the risk of non-performance; |
| • | estimated value of ARO that is dependent upon estimates of future costs and timing of expenditures; |
| • | estimated fair value of business combinations; |
| • | estimated future recoverable value of PP&E, E&E and goodwill and any associated impairment charges or recoveries; and |
| ARC Resources Ltd. | 37 | |
| • | estimated compensation expense under ARC’s share-based compensation plans including the PSUs awarded under the RSU and PSU Plan that is based on an adjustment to the final number of PSU awards that eventually vest based on a performance multiplier, the Share Option Plan and the LTRSA Plan. |
ARC has hired individuals and consultants who have the skills required to make such estimates and ensures that individuals or departments with the most knowledge of the activity are responsible for the estimates. Further, past estimates are reviewed and compared to actual results, and actual results are compared to budgets in order to make more informed decisions on future estimates. For further information on the determination of certain estimates inherent in the financial statements, refer to Note 5 “Management Judgments and Estimation Uncertainty” and Note 11 "Impairment" in the audited consolidated financial statements as at and for the year ended December 31, 2015.
ARC’s leadership team’s mandate includes ongoing development of procedures, standards and systems to allow ARC staff to make the best decisions possible and ensuring those decisions are in compliance with ARC’s environmental, health and safety policies.
ASSESSMENT OF BUSINESS RISKS
The ARC management team is focused on long-term strategic planning and has identified the key risks, uncertainties and opportunities associated with ARC’s business that can impact the financial results. They include, but are not limited to:
| • | volatility of crude oil, natural gas, condensate and NGL prices; |
| • | refinancing and debt service; |
| • | access to capital markets; |
| • | retention of key personnel; |
| • | operational matters; |
| • | reserves and resources estimates; |
| • | depletion of reserves; |
| • | counterparty risk; |
| • | variations in interest rates and foreign exchange rates; |
| • | changes in income tax legislation; |
| • | changes in government royalty legislation; |
| • | environmental regulation and related impact on operations; |
| • | physical security of assets; |
| • | acquisitions; and |
| • | regulation of the crude oil and natural gas industry by various levels of government and governmental agencies. |
Additional information is available in ARC’s Annual Information Form that is filed on SEDAR at www.sedar.com.
PROJECT RISKS
ARC manages a variety of small and large projects and plans to continue with the development of several capital projects throughout 2016. Project delays may impact expected revenues from operations. Significant project cost overruns could make a project uneconomic. ARC's ability to execute projects and market crude oil and natural gas depends upon numerous factors beyond its control, including:
| • | availability of processing capacity; |
| • | availability and proximity of pipeline capacity; |
| • | availability of storage capacity; |
| ARC Resources Ltd. | 38 | |
| • | supply of and demand for crude oil and natural gas; |
| • | availability of alternative fuel sources; |
| • | effects of inclement weather; |
| • | availability of drilling and related equipment; |
| • | unexpected cost increases; |
| • | accidental events; |
| • | changes in regulations; and |
| • | availability and productivity of skilled labour. |
Because of these factors, ARC could be unable to execute projects on time, on budget or at all, and may not be able to effectively market the crude oil and natural gas that ARC produces.
Internal Controls over Financial Reporting
ARC is required to comply with National Instrument 52-109 “Certification of Disclosure in Issuers’ Annual and Interim Filings,” otherwise referred to as Canadian Sarbanes Oxley (“C-SOX”). The certification of interim filings for the interim period ended June 30, 2016 requires that ARC disclose in the interim MD&A any changes in ARC’s internal controls over financial reporting that occurred during the period that have materially affected, or are reasonably likely to materially affect, ARC’s internal controls over financial reporting. ARC confirms that no such changes were made to its internal controls over financial reporting during the three months ended June 30, 2016.
FINANCIAL REPORTING UPDATE
Newly Applied Accounting Policies
Business combinations are accounted for using the acquisition method under IFRS 3 Business Combinations. Management's determination of whether a transaction constitutes a business combination or an asset acquisition is determined based on the criteria in IFRS 3. The identifiable assets acquired and liabilities assumed in a business combination are measured at their fair values at the acquisition date. The ARO associated with the acquired property is subsequently re-measured at the end of the reporting period using a risk-free discount rate, with any changes recognized in ARO and PP&E on the balance sheet. The cost of an acquisition is measured as the fair value of the assets transferred, equity instruments issued, and liabilities incurred or assumed at the acquisition date. The excess of the acquisition cost over the fair value of the net assets acquired is recognized as goodwill. If the cost of the acquisition is less than the fair value of the net assets acquired, a gain on business combination is recognized immediately in the condensed interim consolidated statements of income (the "statements of income"). A deferred tax asset or liability arising from the acquired net assets is also recognized in a business combination. Any resulting goodwill or a gain resulting from a bargain purchase is not considered to be taxable income. Transaction costs associated with a business combination are expensed as incurred.
In a business combination achieved in stages whereby joint control does not exist or is not retained, any previously held equity interest by ARC in the acquiree is re-measured at its acquisition date fair value and any resulting gain or loss is recognized immediately in the statements of income. Obtaining control of a business that is a joint operation for which ARC previously held an interest immediately before the acquisition date (either as a joint operator or as a party to a joint arrangement) is considered to be a business combination achieved in stages whereby joint control is not retained.
Future Accounting Policy Changes
In April 2016, the IASB issued its final amendments to IFRS 15 Revenue from Contracts with Customers, which replaces IAS 18 Revenue, IAS 11 Construction Contracts, and related interpretations. The standard is required to be adopted either retrospectively or using a modified retrospective approach for annual periods beginning on or after January 1, 2018, with earlier adoption permitted. IFRS 15 will be applied by ARC on January 1, 2018 and the Company is currently evaluating the impact of the standard on ARC's financial statements.
| ARC Resources Ltd. | 39 | |
In July 2014, the IASB completed the final elements of IFRS 9 Financial Instruments. The standard supersedes earlier versions of IFRS 9 and completes the IASB’s project to replace IAS 39 Financial Instruments: Recognition and Measurement. IFRS 9, as amended, includes a principle-based approach for classification and measurement of financial assets, a single 'expected loss’ impairment model and a substantially-reformed approach to hedge accounting. The standard will come into effect for annual periods beginning on or after January 1, 2018, with earlier adoption permitted. IFRS 9 will be applied on a retrospective basis by ARC on January 1, 2018 and the Company is currently evaluating the impact of the standard on ARC's financial statements.
In January 2016, the IASB issued IFRS 16 Leases, which replaces IAS 17 Leases. For lessees applying IFRS 16, a single recognition and measurement model for leases would apply, with required recognition of assets and liabilities for most leases. The standard will come into effect for annual periods beginning on or after January 1, 2019, with earlier adoption permitted if the entity is also applying IFRS 15 Revenue from Contracts with Customers. The standard is required to be adopted either retrospectively or using a modified retrospective approach. IFRS 16 will be applied by ARC on January 1, 2019 and the Company is currently evaluating the impact of the standard on ARC's financial statements.
Non-GAAP Measures
Throughout this MD&A, the company uses the term operating netback (“netback”) to analyze operating performance. This non-GAAP measure does not have any standardized meaning prescribed by GAAP and therefore may not be comparable with the calculation of similar measures for other entities. ARC discloses netback both prior to realized hedging gains or losses and after the impacts of hedging are included. Realized gains or losses represent the portion of risk management contracts that have settled in cash during the period and disclosing this impact provides Management and investors with transparent measures that reflect how ARC's risk management program can impact netback metrics. Management feels that netback is a key industry benchmark and a measure of performance for ARC that provides investors with information that is commonly used by other crude oil and natural gas companies. This measurement assists Management and investors in evaluating operating results on a per boe basis to better analyze performance on a comparable basis. Netback is disclosed in Table 16 within this MD&A.
Forward-looking Information and Statements
This MD&A contains certain forward-looking information and statements within the meaning of applicable securities laws. The use of any of the words "expect," "anticipate," "continue," "estimate," "objective," "ongoing," "may," "will," "project," "should," "believe," "plans," "intends," "strategy," and similar expressions are intended to identify forward-looking information or statements. In particular, but without limiting the foregoing, this MD&A contains forward-looking information and statements pertaining to the following: ARC’s financial goals under the heading “About ARC Resources Ltd.," ARC’s view of future crude oil, natural gas, condensate and NGLs pricing under the heading “Economic Environment,” ARC’s guidance for 2016 under the heading “Annual Guidance and Financial Highlights,” ARC’s risk management plans for 2016 and beyond under the heading “Risk Management,” ARC's view on the impact of the government of Alberta's recently announced Modernized Royalty Framework ("MRF") on ARC's results of operations under the heading "Royalties," ARC’s view as to the estimated future payments under the RSU and PSU Plan under the heading “Share-Based Compensation Plans – Restricted Share Unit and Performance Share Unit Plan, Share Option Plan, Deferred Share Unit Plan, and Long-term Restricted Share Award Plan,” the financing information relating to raising capital under the heading "Capitalization, Financial Resources and Liquidity," ARC's plans in relation to future dividend levels under the heading "Dividends," ARC’s estimates of normal course obligations under the heading “Contractual Obligations and Commitments,” and a number of other matters, including the amount of future asset retirement obligations, future liquidity and financial capacity, future results from operations and operating metrics, future costs, expenses and royalty rates, future interest costs, and future development, exploration, acquisition and development activities (including drilling plans) and related capital expenditures.
The forward-looking information and statements contained in this MD&A reflect several material factors and expectations and assumptions of ARC including, without limitation: that ARC will continue to conduct its operations in a manner consistent with past operations; the general continuance of current industry conditions; the continuance of existing (and in certain circumstances, the implementation of proposed) tax, royalty and regulatory regimes; the accuracy of the estimates of ARC's reserves and resource volumes; certain commodity price and other cost assumptions; and the continued availability of adequate debt and equity financing and funds from operations to fund its planned expenditures. ARC believes the material factors, expectations and assumptions reflected in the forward-looking information and statements are reasonable, but no assurance can be given that these factors, expectations and assumptions will prove to be correct.
The forward-looking information and statements included in this MD&A are not guarantees of future performance and should not be unduly relied upon. Such information and statements involve known and unknown risks, uncertainties and
| ARC Resources Ltd. | 40 | |
other factors that may cause actual results or events to differ materially from those anticipated in such forward-looking information or statements including, without limitation: changes in commodity prices; changes in the demand for or supply of ARC's products; unanticipated operating results or production declines; changes in tax or environmental laws, royalty rates or other regulatory matters; changes in development plans of ARC or by third-party operators of ARC's properties, increased debt levels or debt service requirements; inaccurate estimation of ARC's crude oil and natural gas reserve and resource volumes; limited, unfavorable or a lack of access to capital markets; increased costs; a lack of adequate insurance coverage; the impact of competitors; and certain other risks detailed from time to time in ARC's public disclosure documents (including, without limitation, those risks identified in this MD&A and in ARC's Annual Information Form).
The forward-looking information and statements contained in this MD&A speak only as of the date of this MD&A, and none of ARC or its subsidiaries assumes any obligation to publicly update or revise them to reflect new events or circumstances, except as may be required pursuant to applicable laws.
| ARC Resources Ltd. | 41 | |
GLOSSARY
The following is a list of abbreviations that may be used in this MD&A:
Measurement
bbl barrel
bbl/d barrels per day
Mbbls thousand barrels
MMbbls million barrels
boe (1) barrels of oil equivalent
boe/d (1) barrels of oil equivalent per day
Mboe (1) thousands of barrels of oil equivalent
MMboe (1) millions of barrels of oil equivalent
Mcf thousand cubic feet
Mcf/d thousand cubic feet per day
MMcf million cubic feet
MMcf/d million cubic feet per day
Bcf billion cubic feet
MMbtu million British Thermal Units
GJ gigajoule
| (1) | ARC has adopted the standard of 6 Mcf:1 bbl when converting natural gas to boe. Boe may be misleading, particularly if used in isolation. A boe conversion ratio of six Mcf per barrel is based on an energy equivalency conversion method primarily applicable at the burner tip and does not represent a value equivalency at the wellhead. Given that the value ratio based on the current price of crude oil as compared to natural gas is significantly different than the energy equivalency of the 6:1 conversion ratio, utilizing the 6:1 conversion ratio may be misleading as an indication of value. |
Financial and Business Environment
ARO asset retirement obligations
CGU cash-generating unit
COGE Handbook The Canadian Oil and Gas Evaluation Handbook prepared jointly by the Society of Petroleum
Evaluation Engineers (Calgary chapter) and the Canadian Institute of Mining, Metallurgy &
Petroleum
DD&A depletion, depreciation and amortization
DRIP Dividend Reinvestment Program
DSU Deferred Share Unit
E&E exploration and evaluation
GAAP generally accepted accounting principles
G&A general and administrative
IAS International Accounting Standard
IASB International Accounting Standards Board
IFRS International Financial Reporting Standards
LTRSA Long-term Restricted Share Award
MSW Mixed Sweet Blend
NGLs natural gas liquids
NYMEX New York Mercantile Exchange
PP&E property, plant and equipment
PSU Performance Share Unit
RSU Restricted Share Unit
SDP Stock Dividend Program
WTI West Texas Intermediate
| ARC Resources Ltd. | 42 | |
QUARTERLY HISTORICAL REVIEW
| ($ millions, except per share amounts) | 2016 | 2015 | 2014 | |||||||||||||
| FINANCIAL | Q2 | Q1 | Q4 | Q3 | Q2 | Q1 | Q4 | Q3 | ||||||||
| Sales of crude oil, natural gas, condensate, NGLs and other income | 234.9 | 231.2 | 285.9 | 279.5 | 321.7 | 306.6 | 454.1 | 535.2 | ||||||||
| Per share, basic | 0.67 | 0.66 | 0.83 | 0.82 | 0.95 | 0.92 | 1.43 | 1.69 | ||||||||
| Per share, diluted | 0.67 | 0.66 | 0.83 | 0.82 | 0.94 | 0.92 | 1.42 | 1.68 | ||||||||
Funds from operations (1) | 141.7 | 150.1 | 200.7 | 174.9 | 206.3 | 191.5 | 251.7 | 284.2 | ||||||||
| Per share, basic | 0.40 | 0.43 | 0.58 | 0.51 | 0.61 | 0.57 | 0.79 | 0.90 | ||||||||
| Per share, diluted | 0.40 | 0.43 | 0.58 | 0.51 | 0.61 | 0.57 | 0.79 | 0.89 | ||||||||
| Net income (loss) | (58.1 | ) | 64.1 | (55.0 | ) | (235.0 | ) | (51.0 | ) | (1.7 | ) | 113.7 | 90.3 | |||
| Per share, basic | (0.17 | ) | 0.18 | (0.16 | ) | (0.69 | ) | (0.15 | ) | (0.01 | ) | 0.36 | 0.28 | |||
| Per share, diluted | (0.17 | ) | 0.18 | (0.16 | ) | (0.69 | ) | (0.15 | ) | (0.01 | ) | 0.36 | 0.28 | |||
| Dividends declared | 52.5 | 69.9 | 103.8 | 103.0 | 102.1 | 101.6 | 95.7 | 95.2 | ||||||||
Per share (2) | 0.15 | 0.20 | 0.30 | 0.30 | 0.30 | 0.30 | 0.30 | 0.30 | ||||||||
| Total assets | 5,891.1 | 5,893.7 | 5,932.2 | 6,072.4 | 6,346.0 | 6,588.8 | 6,325.5 | 6,095.5 | ||||||||
| Total liabilities | 2,547.0 | 2,466.1 | 2,543.7 | 2,578.3 | 2,565.7 | 2,704.2 | 2,773.7 | 2,603.5 | ||||||||
Net debt outstanding (3) | 969.3 | 868.4 | 985.1 | 981.1 | 878.1 | 950.5 | 1,255.9 | 1,152.8 | ||||||||
| Weighted average shares | 350.5 | 348.7 | 345.6 | 342.8 | 340.4 | 333.2 | 318.6 | 317.2 | ||||||||
| Weighted average shares, diluted | 350.5 | 348.9 | 345.6 | 342.8 | 340.4 | 333.2 | 319.1 | 317.8 | ||||||||
| Shares outstanding, end of period | 351.1 | 349.8 | 347.1 | 344.2 | 341.5 | 339.3 | 319.4 | 317.8 | ||||||||
| CAPITAL EXPENDITURES | ||||||||||||||||
| Geological and geophysical | 4.3 | 2.8 | 2.5 | 8.0 | 3.1 | 2.3 | 4.7 | 3.5 | ||||||||
| Drilling and completions | 55.7 | 23.2 | 108.5 | 117.9 | 51.8 | 83.0 | 164.4 | 154.9 | ||||||||
| Plant and facilities | 52.2 | 32.7 | 37.3 | 37.8 | 43.2 | 43.7 | 78.2 | 58.8 | ||||||||
| Administrative assets | 0.4 | 0.4 | 1.2 | 0.5 | 0.3 | 0.5 | 2.0 | 1.0 | ||||||||
| Total capital expenditures | 112.6 | 59.1 | 149.5 | 164.2 | 98.4 | 129.5 | 249.3 | 218.2 | ||||||||
| Undeveloped land | — | — | 4.6 | 0.6 | 0.1 | 1.4 | 18.0 | 21.9 | ||||||||
| Total capital expenditures including undeveloped land purchases | 112.6 | 59.1 | 154.1 | 164.8 | 98.5 | 130.9 | 267.3 | 240.1 | ||||||||
| Acquisitions | 111.6 | 15.1 | 0.3 | — | 14.1 | — | — | 37.3 | ||||||||
| Dispositions | (3.0 | ) | — | (42.2 | ) | (20.7 | ) | (14.9 | ) | (11.0 | ) | (2.4 | ) | (5.1 | ) | |
| Total capital expenditures, land purchases and net acquisitions and dispositions | 221.2 | 74.2 | 112.2 | 144.1 | 97.7 | 119.9 | 264.9 | 272.3 | ||||||||
| OPERATING | ||||||||||||||||
| Production | ||||||||||||||||
| Crude oil (bbl/d) | 31,702 | 34,852 | 33,899 | 29,397 | 31,958 | 35,851 | 37,442 | 35,871 | ||||||||
| Condensate (bbl/d) | 3,733 | 3,442 | 3,631 | 3,361 | 3,139 | 3,591 | 3,448 | 3,862 | ||||||||
| Natural gas (MMcf/d) | 467.5 | 489.7 | 469.1 | 425.1 | 426.0 | 459.6 | 432.1 | 424.5 | ||||||||
| NGLs (bbl/d) | 4,336 | 4,319 | 3,523 | 3,653 | 3,795 | 4,314 | 5,075 | 5,056 | ||||||||
| Total (boe/d) | 117,695 | 124,224 | 119,243 | 107,261 | 109,900 | 120,354 | 117,986 | 115,530 | ||||||||
| Average realized prices, prior to hedging | ||||||||||||||||
| Crude oil ($/bbl) | 52.80 | 38.64 | 49.24 | 52.43 | 64.49 | 48.73 | 72.49 | 93.34 | ||||||||
| Condensate ($/bbl) | 51.20 | 42.07 | 49.80 | 53.00 | 64.84 | 49.12 | 74.04 | 95.55 | ||||||||
| Natural gas ($/Mcf) | 1.39 | 2.05 | 2.59 | 3.03 | 2.88 | 3.05 | 4.15 | 4.46 | ||||||||
| NGLs ($/bbl) | 13.60 | 8.42 | 10.73 | 5.68 | 9.53 | 16.07 | 32.69 | 39.61 | ||||||||
| Oil equivalent ($/boe) | 21.87 | 20.39 | 26.01 | 28.22 | 32.10 | 28.20 | 41.78 | 50.28 | ||||||||
| TRADING STATISTICS | ||||||||||||||||
| ($, based on intra-day trading) | ||||||||||||||||
| High | 23.35 | 20.16 | 22.49 | 21.98 | 25.60 | 25.87 | 29.85 | 32.60 | ||||||||
| Low | 17.43 | 14.43 | 15.39 | 15.57 | 21.01 | 20.75 | 22.70 | 28.54 | ||||||||
| Close | 22.11 | 18.89 | 16.70 | 17.64 | 21.40 | 21.76 | 25.16 | 29.55 | ||||||||
| Average daily volume (thousands) | 1,869 | 2,394 | 2,224 | 1,736 | 1,424 | 1,944 | 1,886 | 1,205 | ||||||||
| (1) | Refer to Note 9 "Capital Management" in the financial statements as at and for the three and six months ended June 30, 2016 and to the section entitled "Funds from Operations" contained within this MD&A. |
| (2) | Dividends per share are based on the number of shares outstanding at each dividend record date. |
| (3) | Refer to Note 9 "Capital Management" in the financial statements as at and for the three and six months ended June 30, 2016 and to the section entitled "Capitalization, Financial Resources and Liquidity" contained within this MD&A. |
| ARC Resources Ltd. | 43 | |
| ARC RESOURCES LTD. | |||||
CONDENSED INTERIM CONSOLIDATED BALANCE SHEETS (unaudited) | |||||
| As at | |||||
| (Cdn$ millions) | June 30, 2016 | December 31, 2015 | |||
| ASSETS | |||||
| Current assets | |||||
| Cash and cash equivalents | 58.6 | 167.3 | |||
| Short-term investment | 3.6 | 3.2 | |||
| Accounts receivable | 122.9 | 116.6 | |||
| Prepaid expenses | 15.2 | 14.3 | |||
| Risk management contracts (Note 10) | 115.5 | 207.5 | |||
| 315.8 | 508.9 | ||||
| Reclamation fund | 34.7 | 34.3 | |||
| Risk management contracts (Note 10) | 146.2 | 204.7 | |||
| Exploration and evaluation assets (Note 5) | 299.9 | 276.4 | |||
| Property, plant and equipment (Note 6) | 4,846.3 | 4,659.7 | |||
| Goodwill | 248.2 | 248.2 | |||
| Total assets | 5,891.1 | 5,932.2 | |||
| LIABILITIES | |||||
| Current liabilities | |||||
| Accounts payable and accrued liabilities | 144.5 | 137.5 | |||
| Current portion of long-term debt (Note 7) | 34.3 | 57.9 | |||
| Current portion of asset retirement obligations (Note 8) | 18.0 | 18.0 | |||
| Dividends payable (Note 11) | 17.6 | 34.7 | |||
| Risk management contracts (Note 10) | 7.6 | 1.6 | |||
| 222.0 | 249.7 | ||||
| Risk management contracts (Note 10) | 4.2 | 0.7 | |||
| Long-term debt (Note 7) | 973.2 | 1,056.4 | |||
| Long-term incentive compensation liability (Note 12) | 26.8 | 19.5 | |||
| Other deferred liabilities | 13.2 | 14.1 | |||
| Asset retirement obligations (Note 8) | 678.6 | 555.2 | |||
| Deferred taxes | 629.0 | 648.1 | |||
| Total liabilities | 2,547.0 | 2,543.7 | |||
| Commitments and contingencies (Note 13) | |||||
| SHAREHOLDERS’ EQUITY | |||||
| Shareholders’ capital | 4,606.3 | 4,536.9 | |||
| Contributed surplus | 14.9 | 12.6 | |||
| Deficit | (1,277.5 | ) | (1,161.1 | ) | |
| Accumulated other comprehensive income | 0.4 | 0.1 | |||
| Total shareholders’ equity | 3,344.1 | 3,388.5 | |||
| Total liabilities and shareholders’ equity | 5,891.1 | 5,932.2 | |||
See accompanying notes to the condensed interim consolidated financial statements.
| ARC Resources Ltd. | 44 | |
| ARC RESOURCES LTD. | |||||||||||
CONDENSED INTERIM CONSOLIDATED STATEMENTS OF INCOME (unaudited) | |||||||||||
| For the three and six months ended June 30 | |||||||||||
| Three Months Ended | Six Months Ended | ||||||||||
| (Cdn$ millions, except per share amounts) | 2016 | 2015 | 2016 | 2015 | |||||||
| REVENUE | |||||||||||
| Sales of crude oil, natural gas, condensate, natural gas liquids and other income | 234.9 | 321.7 | 466.1 | 628.3 | |||||||
| Royalties | (21.1 | ) | (25.0 | ) | (39.4 | ) | (55.4 | ) | |||
| 213.8 | 296.7 | 426.7 | 572.9 | ||||||||
Gain (loss) on risk management contracts (Note 10) | (84.1 | ) | (10.4 | ) | (23.0 | ) | 111.9 | ||||
| 129.7 | 286.3 | 403.7 | 684.8 | ||||||||
| EXPENSES | |||||||||||
| Transportation | 23.4 | 23.3 | 48.2 | 48.9 | |||||||
| Operating | 68.6 | 80.5 | 137.6 | 158.9 | |||||||
| Exploration and evaluation expenses (Note 5) | — | 44.4 | 1.7 | 44.4 | |||||||
| General and administrative | 27.9 | 23.2 | 59.7 | 33.9 | |||||||
| Interest and financing charges | 12.3 | 12.1 | 25.4 | 25.0 | |||||||
| Accretion of asset retirement obligations (Note 8) | 3.0 | 3.2 | 6.1 | 6.8 | |||||||
| Depletion, depreciation, amortization and impairment (Note 6) | 126.0 | 150.8 | 260.2 | 329.5 | |||||||
| Loss (gain) on foreign exchange | 2.1 | (16.4 | ) | (65.3 | ) | 71.7 | |||||
| Gain on short-term investment | (0.5 | ) | (0.1 | ) | (0.4 | ) | (0.5 | ) | |||
| Gain on business combination (Note 4) | (40.2 | ) | — | (40.2 | ) | — | |||||
| Gain on disposal of petroleum and natural gas properties | — | (10.6 | ) | — | (23.3 | ) | |||||
| 222.6 | 310.4 | 433.0 | 695.3 | ||||||||
| Provision for (recovery of) income taxes | |||||||||||
| Current | 6.0 | 1.8 | (1.0 | ) | 4.1 | ||||||
| Deferred | (40.8 | ) | 25.1 | (34.3 | ) | 38.1 | |||||
| (34.8 | ) | 26.9 | (35.3 | ) | 42.2 | ||||||
| Net income (loss) | (58.1 | ) | (51.0 | ) | 6.0 | (52.7 | ) | ||||
| Net income (loss) per share (Note 11) | |||||||||||
| Basic | (0.17 | ) | (0.15 | ) | 0.02 | (0.16 | ) | ||||
| Diluted | (0.17 | ) | (0.15 | ) | 0.02 | (0.16 | ) | ||||
See accompanying notes to the condensed interim consolidated financial statements.
| ARC Resources Ltd. | 45 | |
| ARC RESOURCES LTD. | |||||||||||
CONDENSED INTERIM CONSOLIDATED STATEMENTS OF COMPREHENSIVE INCOME (unaudited) | |||||||||||
| For the three and six months ended June 30 | |||||||||||
| Three Months Ended | Six Months Ended | ||||||||||
| (Cdn$ millions) | 2016 | 2015 | 2016 | 2015 | |||||||
| Net income (loss) | (58.1 | ) | (51.0 | ) | 6.0 | (52.7 | ) | ||||
| Other comprehensive income (loss) | |||||||||||
| Items that may be reclassified into earnings, net of tax: | |||||||||||
| Net unrealized gain (loss) on reclamation fund investments | 0.2 | (0.1 | ) | 0.3 | 0.2 | ||||||
| Other comprehensive income (loss) | 0.2 | (0.1 | ) | 0.3 | 0.2 | ||||||
| Comprehensive income (loss) | (57.9 | ) | (51.1 | ) | 6.3 | (52.5 | ) | ||||
See accompanying notes to the condensed interim consolidated financial statements.
| ARC Resources Ltd. | 46 | |
| ARC RESOURCES LTD. | ||||||||||||||
CONDENSED INTERIM CONSOLIDATED STATEMENTS OF CHANGES IN SHAREHOLDERS' EQUITY (unaudited) | ||||||||||||||
| For the six months ended June 30 | ||||||||||||||
| (Cdn$ millions) | Shareholders’ Capital (Note 11) | Contributed Surplus | Deficit | Accumulated other comprehensive income | Total Shareholders’ Equity | |||||||||
| December 31, 2014 | 3,951.1 | 8.6 | (407.9 | ) | — | 3,551.8 | ||||||||
| Net loss | — | — | (52.7 | ) | — | (52.7 | ) | |||||||
| Other comprehensive income | — | — | — | 0.2 | 0.2 | |||||||||
| Total comprehensive income (loss) | — | — | (52.7 | ) | 0.2 | (52.5 | ) | |||||||
| Shares issued for cash | 402.7 | — | — | — | 402.7 | |||||||||
| Shares issued pursuant to the dividend reinvestment program | 70.6 | — | — | — | 70.6 | |||||||||
| Shares issued pursuant to the stock dividend program | 22.3 | — | — | — | 22.3 | |||||||||
| Cancellation of shares and return of accrued dividends | (0.1 | ) | 0.1 | — | — | — | ||||||||
Share issue costs (1) | (12.5 | ) | — | — | — | (12.5 | ) | |||||||
| Recognized under share-based compensation plans (Note 12) | — | 1.6 | — | — | 1.6 | |||||||||
| Dividends declared | — | — | (203.7 | ) | — | (203.7 | ) | |||||||
| June 30, 2015 | 4,434.1 | 10.3 | (664.3 | ) | 0.2 | 3,780.3 | ||||||||
| December 31, 2015 | 4,536.9 | 12.6 | (1,161.1 | ) | 0.1 | 3,388.5 | ||||||||
| Net income | — | — | 6.0 | — | 6.0 | |||||||||
| Other comprehensive income | — | — | — | 0.3 | 0.3 | |||||||||
| Total comprehensive income | — | — | 6.0 | 0.3 | 6.3 | |||||||||
| Shares issued for cash on exercise of stock options | 0.2 | — | — | — | 0.2 | |||||||||
| Shares issued pursuant to the dividend reinvestment program | 52.2 | — | — | — | 52.2 | |||||||||
| Shares issued pursuant to the stock dividend program | 17.0 | — | — | — | 17.0 | |||||||||
| Share issuance costs | (0.1 | ) | — | — | — | (0.1 | ) | |||||||
| Recognized under share-based compensation plans (Note 12) | — | 2.4 | — | — | 2.4 | |||||||||
| Contributed surplus transferred on exercise of share options (Note 12) | 0.1 | (0.1 | ) | — | — | — | ||||||||
| Dividends declared | — | — | (122.4 | ) | — | (122.4 | ) | |||||||
| June 30, 2016 | 4,606.3 | 14.9 | (1,277.5 | ) | 0.4 | 3,344.1 | ||||||||
| (1) | Amount is net of deferred tax of $4.2 million. |
See accompanying notes to the condensed interim consolidated financial statements.
| ARC Resources Ltd. | 47 | |
| ARC RESOURCES LTD. | |||||||||||
CONDENSED INTERIM CONSOLIDATED STATEMENTS OF CASH FLOWS (unaudited) | |||||||||||
| For the three and six months ended June 30 | |||||||||||
| Three Months Ended | Six Months Ended | ||||||||||
| (Cdn$ millions) | 2016 | 2015 | 2016 | 2015 | |||||||
| CASH FLOW FROM OPERATING ACTIVITIES | |||||||||||
| Net income (loss) | (58.1 | ) | (51.0 | ) | 6.0 | (52.7 | ) | ||||
| Add items not involving cash: | |||||||||||
| Unrealized loss (gain) on risk management contracts | 149.5 | 61.2 | 156.7 | (16.5 | ) | ||||||
| Accretion of asset retirement obligations (Note 8) | 3.0 | 3.2 | 6.1 | 6.8 | |||||||
| Depletion, depreciation, amortization and impairment (Note 6) | 126.0 | 150.8 | 260.2 | 329.5 | |||||||
| Exploration and evaluation expenses (Note 5) | — | 44.4 | 1.7 | 44.4 | |||||||
| Unrealized loss (gain) on foreign exchange | 2.1 | (16.9 | ) | (65.3 | ) | 71.4 | |||||
| Gain on business combination (Note 4) | (40.2 | ) | — | (40.2 | ) | — | |||||
| Gain on disposal of petroleum and natural gas properties | — | (10.6 | ) | — | (23.3 | ) | |||||
| Deferred tax expense (recovery) | (40.8 | ) | 25.1 | (34.3 | ) | 38.1 | |||||
| Other (Note 14) | 0.2 | 0.1 | 0.9 | 0.1 | |||||||
| Net change in other liabilities (Note 14) | 7.8 | 1.7 | 6.7 | (9.9 | ) | ||||||
| Change in non-cash working capital (Note 14) | 11.5 | (5.9 | ) | 15.2 | (40.1 | ) | |||||
| 161.0 | 202.1 | 313.7 | 347.8 | ||||||||
| CASH FLOW FROM (USED IN) FINANCING ACTIVITIES | |||||||||||
| Repayment of long-term debt under revolving credit facilities, net | — | — | — | (83.8 | ) | ||||||
| Repayment of senior notes | (29.2 | ) | (28.4 | ) | (42.5 | ) | (40.9 | ) | |||
| Issuance of common shares | 0.2 | — | 0.2 | 402.7 | |||||||
| Share issuance costs | (0.1 | ) | (0.1 | ) | (0.1 | ) | (16.7 | ) | |||
| Cash dividends paid | (27.0 | ) | (53.9 | ) | (70.3 | ) | (108.8 | ) | |||
| (56.1 | ) | (82.4 | ) | (112.7 | ) | 152.5 | |||||
| CASH FLOW USED IN INVESTING ACTIVITIES | |||||||||||
| Acquisition of petroleum and natural gas properties (Notes 4, 6) | (111.6 | ) | (14.1 | ) | (126.7 | ) | (14.1 | ) | |||
| Disposal of petroleum and natural gas properties | 3.0 | 14.9 | 3.0 | 25.9 | |||||||
| Property, plant and equipment development expenditures (Note 6) | (103.5 | ) | (97.4 | ) | (147.0 | ) | (228.5 | ) | |||
| Exploration and evaluation asset expenditures (Note 5) | (9.0 | ) | (1.1 | ) | (24.5 | ) | (0.8 | ) | |||
| Net reclamation fund withdrawals | (1.0 | ) | (1.0 | ) | (0.1 | ) | 3.0 | ||||
| Change in non-cash working capital (Note 14) | 10.3 | 10.4 | (14.4 | ) | (70.9 | ) | |||||
| (211.8 | ) | (88.3 | ) | (309.7 | ) | (285.4 | ) | ||||
| INCREASE (DECREASE) IN CASH AND CASH EQUIVALENTS | (106.9 | ) | 31.4 | (108.7 | ) | 214.9 | |||||
| CASH AND CASH EQUIVALENTS, BEGINNING OF PERIOD | 165.5 | 190.6 | 167.3 | 7.1 | |||||||
| CASH AND CASH EQUIVALENTS, END OF PERIOD | 58.6 | 222.0 | 58.6 | 222.0 | |||||||
| The following are included in cash flow from operating activities: | |||||||||||
| Income taxes paid in cash | — | 4.5 | — | 42.1 | |||||||
| Interest paid in cash | 9.3 | 10.0 | 25.6 | 25.8 | |||||||
| ARC Resources Ltd. | 48 | |
NOTES TO THE CONDENSED INTERIM CONSOLIDATED FINANCIAL STATEMENTS (unaudited)
June 30, 2016 and 2015
| 1. | STRUCTURE OF THE BUSINESS |
The principal undertakings of ARC Resources Ltd. and its subsidiaries (collectively the “Company” or “ARC”) are to carry on the business of acquiring, developing and holding interests in petroleum and natural gas properties and assets.
ARC was incorporated in Alberta, Canada and the Company’s registered office and principal place of business is located at 1200, 308 – 4th Avenue SW, Calgary, Alberta, Canada T2P 0H7.
| 2. | BASIS OF PREPARATION |
These condensed interim consolidated financial statements (the “financial statements”) have been prepared in accordance with International Accounting Standard ("IAS") 34 Interim Financial Reporting using accounting policies consistent with International Financial Reporting Standards (“IFRS”) as issued by the International Accounting Standards Board ("IASB"). These financial statements are condensed as they do not include all of the information required by IFRS for annual financial statements and therefore should be read in conjunction with ARC's audited consolidated financial statements for the year ended December 31, 2015. All financial information is reported in millions of Canadian dollars ("Cdn$"), unless otherwise noted. References to “US$” are to United States dollars.
The financial statements have been prepared on a historical cost basis, except as detailed in the accounting policies disclosed in Note 3 "Summary of Accounting Policies" of ARC's audited consolidated financial statements for the year ended December 31, 2015. All accounting policies and methods of computation followed in the preparation of these financial statements are consistent with those of the previous financial year, except as noted in Note 3 "Accounting Policies." There have been no significant changes to the use of estimates or judgments since December 31, 2015.
At December 31, 2015, the financial statements included the accounts of ARC and its wholly owned subsidiaries, including ARC Resources General Partnership (the "partnership") and 1504793 Alberta Ltd. Effective March 1, 2016, ARC wound up 1504793 Alberta Ltd. resulting in the dissolution of the partnership. All transactions were executed on a tax deferred basis.
All inter-entity transactions have been eliminated upon consolidation between ARC and its subsidiaries in these financial statements. ARC's operations are viewed as a single operating segment by the chief operating decision maker of the Company for the purpose of resource allocation and assessing performance.
These financial statements were authorized for issue by the Board of Directors on July 28, 2016.
| ARC Resources Ltd. | 49 | |
| 3. | ACCOUNTING POLICIES |
Newly Applied Accounting Policies
Business combinations are accounted for using the acquisition method under IFRS 3 Business Combinations. Management's determination of whether a transaction constitutes a business combination or an asset acquisition is determined based on the criteria in IFRS 3. The identifiable assets acquired and liabilities assumed in a business combination are measured at their fair values at the acquisition date. The asset retirement obligation ("ARO") associated with the acquired property is subsequently re-measured at the end of the reporting period using a risk-free discount rate, with any changes recognized in ARO and property, plant and equipment ("PP&E") on the balance sheet. The cost of an acquisition is measured as the fair value of the assets transferred, equity instruments issued, and liabilities incurred or assumed at the acquisition date. The excess of the acquisition cost over the fair value of the net assets acquired is recognized as goodwill. If the cost of the acquisition is less than the fair value of the net assets acquired, a gain on business combination is recognized immediately in the condensed interim consolidated statements of income (the "statements of income"). A deferred tax asset or liability arising from the acquired net assets is also recognized in a business combination. Any resulting goodwill or a gain resulting from a bargain purchase is not considered to be taxable income. Transaction costs associated with a business combination are expensed as incurred.
In a business combination achieved in stages whereby joint control does not exist or is not retained, any previously held equity interest by ARC in the acquiree is re-measured at its acquisition date fair value and any resulting gain or loss is recognized immediately in the statements of income. Obtaining control of a business that is a joint operation for which ARC previously held an interest immediately before the acquisition date (either as a joint operator or as a party to a joint arrangement) is considered to be a business combination achieved in stages whereby joint control is not retained.
Future Accounting Policy Changes
In April 2016, the IASB issued its final amendments to IFRS 15 Revenue from Contracts with Customers, which replaces IAS 18 Revenue, IAS 11 Construction Contracts, and related interpretations. The standard is required to be adopted either retrospectively or using a modified retrospective approach for annual periods beginning on or after January 1, 2018, with earlier adoption permitted. IFRS 15 will be applied by ARC on January 1, 2018 and the Company is currently evaluating the impact of the standard on ARC's financial statements.
In July 2014, the IASB completed the final elements of IFRS 9 Financial Instruments. The standard supersedes earlier versions of IFRS 9 and completes the IASB’s project to replace IAS 39 Financial Instruments: Recognition and Measurement. IFRS 9, as amended, includes a principle-based approach for classification and measurement of financial assets, a single 'expected loss’ impairment model and a substantially-reformed approach to hedge accounting. The standard will come into effect for annual periods beginning on or after January 1, 2018, with earlier adoption permitted. IFRS 9 will be applied on a retrospective basis by ARC on January 1, 2018 and the Company is currently evaluating the impact of the standard on ARC's financial statements.
In January 2016, the IASB issued IFRS 16 Leases, which replaces IAS 17 Leases. For lessees applying IFRS 16, a single recognition and measurement model for leases would apply, with required recognition of assets and liabilities for most leases. The standard will come into effect for annual periods beginning on or after January 1, 2019, with earlier adoption permitted if the entity is also applying IFRS 15 Revenue from Contracts with Customers. The standard is required to be adopted either retrospectively or using a modified retrospective approach. IFRS 16 will be applied by ARC on January 1, 2019 and the Company is currently evaluating the impact of the standard on ARC's financial statements.
| ARC Resources Ltd. | 50 | |
| 4. | BUSINESS COMBINATION |
On June 28, 2016, ARC completed the acquisition of certain properties producing mainly light, sweet crude oil in the Pembina area of Alberta. The major assets acquired consisted of additional working interest in properties where ARC already held a significant interest. The transaction was recorded as a business combination under IFRS 3. Refer to the section entitled "Newly Applied Accounting Policies" in Note 3 "Accounting Policies."
Determination of the fair value of PP&E acquired in a business combination requires Management to make assumptions and estimates about future events. The fair value of crude oil and natural gas interests is estimated with reference to the discounted cash flows expected to be derived from crude oil and natural gas production. These assumptions and estimates generally require judgment and include estimates of reserves acquired, liabilities assumed, forecast benchmark commodity prices, and discount rates. Changes in any of the assumptions or estimates used in determining the fair value of acquired assets and liabilities could impact the amounts assigned to the net assets acquired, goodwill or gain on business combination.
The preliminary estimates of the net assets acquired and gain on business combination disclosed below are based on information that existed at the time of the preparation of these financial statements. Subsequent amendments may be made to these amounts as the estimates are finalized. The pro-forma information provided below is not necessarily indicative of the actual results that would have been achieved if the acquisition date for the business combination had been as of the beginning of the annual reporting period.
| Net assets acquired | ||
| Development and production assets | 174.2 | |
| Asset retirement obligations | (12.7 | ) |
| Deferred income tax | (13.3 | ) |
| Total identifiable net assets | 148.2 | |
| Gain on business combination | (36.7 | ) |
| Total net assets acquired, net of gain on business combination | 111.5 | |
| Consideration paid | ||
| Cash consideration | 111.5 | |
The gain on business combination arose as a result of the strategic nature of the divestiture by the seller combined with ARC's established leadership position in the acquired assets. If the transaction had taken place on January 1, 2016, it is estimated that the assets acquired would have contributed incremental revenues net of royalties and net income of $15.4 million and $1.4 million, respectively, for the six months ended June 30, 2016.
For the assets that ARC held a prior working interest in and acquired control of as a result of the transaction, the pre-acquisition working interest was re-measured to a fair value of $127.8 million, resulting in an increase in PP&E of $7 million, which was composed of a recovery of impairment of $1.6 million, an additional gain on business combination of $3.5 million, and a deferred tax liability of $1.9 million.
| 5. | EXPLORATION AND EVALUATION ("E&E") ASSETS |
| Carrying amount | ||
| Balance, December 31, 2015 | 276.4 | |
| Additions | 24.5 | |
| E&E expenses | (1.7 | ) |
| Change in asset retirement cost | 0.7 | |
| Balance, June 30, 2016 | 299.9 | |
ARC has certain E&E properties that have sales of petroleum products associated with production from test wells.
For the three months ended June 30, 2016 and 2015, these operating results have been recognized in the statements of income and comprised sales of crude oil, natural gas, condensate and natural gas liquids of $3.4 million and $1.7 million, royalties of $0.3 million and $nil, operating expenses of $1.2 million and $0.7 million, and transportation expenses of $0.3 million and $0.3 million, respectively.
| ARC Resources Ltd. | 51 | |
For the six months ended June 30, 2016 and 2015, these operating results have been recognized in the statements of income and comprised sales of crude oil, natural gas, condensate and natural gas liquids of $4.2 million and $4.1 million, royalties of $0.4 million and $0.1 million, operating expenses of $2 million and $2.8 million, and transportation expenses of $0.4 million and $0.7 million, respectively. All operating cash flows associated with E&E assets for the three and six months ended June 30, 2016 and 2015 are reflected in cash flow from operating activities.
| 6. | PROPERTY, PLANT AND EQUIPMENT |
| Cost | Development and Production Assets | Administrative Assets | Total | |||||
| Balance, December 31, 2015 | 7,981.2 | 63.9 | 8,045.1 | |||||
| Additions | 146.4 | 0.8 | 147.2 | |||||
| Acquisitions | 181.9 | — | 181.9 | |||||
| Change in asset retirement cost | 130.9 | — | 130.9 | |||||
| Dispositions | (61.5 | ) | — | (61.5 | ) | |||
| Balance, June 30, 2016 | 8,378.9 | 64.7 | 8,443.6 | |||||
| Accumulated depletion, depreciation, amortization ("DD&A") and impairment | ||||||||
| Balance, December 31, 2015 | (3,351.2 | ) | (34.2 | ) | (3,385.4 | ) | ||
| DD&A and impairment | (257.5 | ) | (2.7 | ) | (260.2 | ) | ||
| Accumulated depletion and impairment associated with dispositions | 48.0 | — | 48.0 | |||||
| Inventory depletion | 0.3 | — | 0.3 | |||||
| Balance, June 30, 2016 | (3,560.4 | ) | (36.9 | ) | (3,597.3 | ) | ||
| Carrying amounts | ||||||||
| Balance, December 31, 2015 | 4,630.0 | 29.7 | 4,659.7 | |||||
| Balance, June 30, 2016 | 4,818.5 | 27.8 | 4,846.3 | |||||
For the three and six months ended June 30, 2016, $5.7 million and $10.1 million of direct and incremental general and administrative ("G&A") expenses were capitalized to PP&E ($5.1 million and $12.8 million for the three and six months ended June 30, 2015), respectively.
| ARC Resources Ltd. | 52 | |
| 7. | LONG-TERM DEBT |
| U.S. $ Denominated | Canadian $ Amount | ||||||||||
June 30, 2016 | December 31, 2015 | June 30, 2016 | December 31, 2015 | ||||||||
| Senior notes | |||||||||||
| Master Shelf Agreement | |||||||||||
| 5.42% US$ note | 18.8 | 18.8 | 24.4 | 26.0 | |||||||
| 4.98% US$ note | 30.0 | 40.0 | 39.0 | 55.4 | |||||||
| 3.72% US$ note | 150.0 | 150.0 | 195.1 | 207.6 | |||||||
| 2004 note issuance | |||||||||||
| 5.10% US$ note | — | 4.8 | — | 6.6 | |||||||
| 2009 note issuance | |||||||||||
| 7.19% US$ note | — | 13.5 | — | 18.7 | |||||||
| 8.21% US$ note | 35.0 | 35.0 | 45.5 | 48.4 | |||||||
| 6.50% Cdn$ note | — | — | — | 5.8 | |||||||
| 2010 note issuance | |||||||||||
| 5.36% US$ note | 150.0 | 150.0 | 195.1 | 207.6 | |||||||
| 2012 note issuance | |||||||||||
| 3.31% US$ note | 60.0 | 60.0 | 78.1 | 83.0 | |||||||
| 3.81% US$ note | 300.0 | 300.0 | 390.3 | 415.2 | |||||||
| 4.49% Cdn$ note | — | — | 40.0 | 40.0 | |||||||
| Total long-term debt outstanding | 743.8 | 772.1 | 1,007.5 | 1,114.3 | |||||||
| Long-term debt due within one year | 34.3 | 57.9 | |||||||||
| Long-term debt due beyond one year | 973.2 | 1,056.4 | |||||||||
At June 30, 2016, the fair value of all senior notes is $1,023.4 million ($1,086.4 million as at December 31, 2015), compared to a carrying value of $1,007.5 million ($1,114.3 million as at December 31, 2015).
| ARC Resources Ltd. | 53 | |
| 8. | ASSET RETIREMENT OBLIGATIONS ("ARO") |
ARC has estimated the net present value of its total ARO to be $696.6 million as at June 30, 2016 ($573.2 million at December 31, 2015) based on a total future undiscounted liability of $1.3 billion ($1.2 billion at December 31, 2015).
| Six Months Ended June 30, 2016 | Year Ended December 31, 2015 | ||||
| Balance, beginning of period | 573.2 | 616.1 | |||
| Increase in liabilities relating to development activities | 1.5 | 5.3 | |||
Increase in liabilities relating to change in estimates and discount rate (1) | 80.8 | 32.4 | |||
| Settlement of obligations | (3.9 | ) | (12.3 | ) | |
| Accretion | 6.1 | 13.4 | |||
| Acquisitions | 13.9 | — | |||
Revaluation of obligations acquired in business combination (2) | 35.4 | — | |||
| Dispositions | (10.4 | ) | (81.7 | ) | |
| Balance, end of period | 696.6 | 573.2 | |||
| Expected to be incurred within one year | 18.0 | 18.0 | |||
| Expected to be incurred beyond one year | 678.6 | 555.2 | |||
| (1) | Relates to changes in discount rate and anticipated settlement dates of ARO. |
| (2) | Relates to the revaluation of obligations acquired in a business combination at the end of the period using the risk-free discount rate. At the date of acquisition, the acquired ARO is recognized at fair value. |
The Bank of Canada's long-term risk-free bond rate of 1.7 per cent (2.2 per cent at December 31, 2015) and an inflation rate of 2 per cent (2 per cent at December 31, 2015) were used to calculate the present value of ARO at June 30, 2016.
| 9. | CAPITAL MANAGEMENT |
ARC manages its capital structure and makes adjustments to it in response to changes in economic conditions and the risk characteristics of the underlying assets. ARC is able to change its capital structure by issuing new shares, new debt or changing its dividend policy.
ARC’s objective when managing its capital is to maintain a conservative structure that will allow it to:
| • | fund its development and exploration program; |
| • | provide financial flexibility to execute on strategic opportunities; and |
| • | maintain a dividend policy that, in normal times, in the opinion of Management and the Board of Directors, is sustainable. |
ARC manages the following capital:
| • | common shares; and |
| • | net debt. |
When evaluating ARC’s capital structure, Management intends to keep its net debt balance to a ratio of less than two times annualized funds from operations for temporary periods with a long-term strategy to keep its net debt balance to a ratio of between one to 1.5 times annualized funds from operations and less than 20 per cent of total market capitalization.
| ARC Resources Ltd. | 54 | |
Funds from Operations
ARC considers funds from operations to be a key measure of operating performance as it demonstrates ARC’s ability to generate the necessary funds to fund sustaining capital and future growth through capital investment and to repay debt. Management believes that such a measure provides an insightful assessment of ARC’s operations on a continuing basis by eliminating certain non-cash charges and charges that are nonrecurring. Funds from operations is not a standardized measure and therefore may not be comparable with the calculation of similar measures for other entities.
Funds from operations for the three and six months ended June 30, 2016 and 2015 is calculated as follows:
| Three Months Ended June 30 | Six Months Ended June 30 | ||||||||
| 2016 | 2015 | 2016 | 2015 | ||||||
| Cash flow from operating activities | 161.0 | 202.1 | 313.7 | 347.8 | |||||
| Net change in other liabilities (Note 14) | (7.8 | ) | (1.7 | ) | (6.7 | ) | 9.9 | ||
| Change in non-cash working capital (Note 14) | (11.5 | ) | 5.9 | (15.2 | ) | 40.1 | |||
Funds from operations (1) | 141.7 | 206.3 | 291.8 | 397.8 | |||||
| (1) | When applicable, funds from operations is further adjusted to include any portion of unrealized gains and losses on risk management contracts settled annually that relate to current period production. This adjustment was not applicable for the three and six months ended June 30, 2016 and 2015. |
Net Debt and Total Capitalization
Net debt is used by Management as a key measure to assess the Company's liquidity. Total capitalization is used by Management and ARC's investors in analyzing the Company's balance sheet strength and liquidity.
| June 30, 2016 | June 30, 2015 | ||||
Long-term debt (1) | 1,007.5 | 1,020.6 | |||
| Accounts payable and accrued liabilities | 144.5 | 204.0 | |||
| Dividends payable | 17.6 | 34.1 | |||
| Cash and cash equivalents, accounts receivable, prepaid expenses and short-term investment | (200.3 | ) | (380.6 | ) | |
| Net debt | 969.3 | 878.1 | |||
Shares outstanding (millions) (2) | 351.1 | 341.5 | |||
Share price ($) (3) | 22.11 | 21.40 | |||
| Market capitalization | 7,762.8 | 7,308.1 | |||
| Net debt obligations | 969.3 | 878.1 | |||
| Total capitalization | 8,732.1 | 8,186.2 | |||
| Net debt as a percentage of total capitalization (%) | 11.1 | 10.7 | |||
Net debt to annualized funds from operations (ratio) (4) | 1.7 | 1.1 | |||
| (1) | Includes current portion of long-term debt at June 30, 2016 and 2015 of $34.3 million and $52.8 million, respectively. |
| (2) | Basic shares outstanding as at June 30, 2016 and 2015, respectively. |
| (3) | TSX closing price as at June 30, 2016 and 2015, respectively. |
| (4) | Annualized funds from operations is calculated by dividing year-to-date funds from operations by the number of days in the same period and then multiplying the quotient by the number of days in the year. Annualized funds from operations is $586.8 million and $802.2 million for the six months ended June 30, 2016 and 2015, respectively. |
| ARC Resources Ltd. | 55 | |
| 10. | FINANCIAL INSTRUMENTS AND MARKET RISK MANAGEMENT |
Financial Instruments
ARC's financial instruments include cash and cash equivalents, short-term investment, accounts receivable, risk management contracts, reclamation fund assets, accounts payable and accrued liabilities, dividends payable, long-term debt, and long-term incentive compensation liability.
ARC’s financial instruments that are carried at fair value on the condensed interim consolidated balance sheets (the "balance sheets") include cash and cash equivalents, short-term investment, risk management contracts, and reclamation fund assets. The fair value of long-term debt is disclosed in Note 7. To estimate the fair value of these instruments, ARC uses quoted market prices when available, or third-party models and valuation methodologies that use observable market data. Fair value is measured using the assumptions that market participants would use, including transaction-specific details and non-performance risk.
All financial assets and liabilities for which fair value is measured or disclosed in the financial statements are further categorized using a three-level hierarchy that reflects the significance of the lowest level of inputs used in determining fair value:
| • | Level 1 – Quoted prices are available in active markets for identical assets or liabilities as of the reporting date. Active markets are those in which transactions occur in sufficient frequency and volume to provide pricing information on an ongoing basis. |
| • | Level 2 – Pricing inputs are other than quoted prices in active markets included in Level 1. Prices in Level 2 are either directly or indirectly observable as of the reporting date. Level 2 valuations are based on inputs, including quoted forward prices for commodities, time value and volatility factors, which can be substantially observed or corroborated in the marketplace. |
| • | Level 3 – Valuations in this level are those with inputs for the asset or liability that are not based on observable market data. |
All of ARC’s financial instruments carried at fair value are transacted in active markets. ARC’s cash and cash equivalents, short-term investment, and reclamation fund assets are classified as Level 1 measurements and its risk management contracts and fair value disclosure for its long-term debt are classified as Level 2 measurements. ARC does not have any financial instruments classified as Level 3.
ARC determines whether transfers have occurred between levels in the hierarchy by reassessing its hierarchy classifications at each reporting date based on the lowest level input that is significant to the fair value measurement as a whole. There were no transfers between levels in the hierarchy in the six months ended June 30, 2016 or 2015.
The carrying values of ARC's accounts receivable, accounts payable and accrued liabilities, dividends payable, and long-term incentive compensation liability approximate their fair values.
Financial Assets and Financial Liabilities Subject to Offsetting
ARC's risk management contracts are subject to master netting agreements that create a legally enforceable right to offset by counterparty the related financial assets and financial liabilities on the Company's balance sheets in all circumstances. ARC manages these contracts on the basis of its net exposure to market risks and therefore measures their fair value consistently with how market participants would price the net risk exposure at the reporting date under current market conditions.
| ARC Resources Ltd. | 56 | |
The following is a summary of ARC's financial assets and financial liabilities that are subject to offsetting as at June 30, 2016 and December 31, 2015:
| Gross Amounts of Recognized Financial Assets (Liabilities) | Gross Amounts of Recognized Financial Assets (Liabilities) Offset in Balance Sheet | Net Amounts of Financial Assets (Liabilities) Recognized in Balance Sheet Prior to Credit Risk Adjustment | Credit Risk Adjustment | Net Amounts of Financial Assets (Liabilities) Recognized in Balance Sheet | ||||||
| As at June 30, 2016 | ||||||||||
| Risk management contracts | ||||||||||
| Current asset | 137.1 | (20.5 | ) | 116.6 | (1.1 | ) | 115.5 | |||
| Long-term asset | 164.3 | (16.8 | ) | 147.5 | (1.3 | ) | 146.2 | |||
| Current liability | (28.2 | ) | 20.5 | (7.7 | ) | 0.1 | (7.6 | ) | ||
| Long-term liability | (21.0 | ) | 16.8 | (4.2 | ) | — | (4.2 | ) | ||
| Net position | 252.2 | — | 252.2 | (2.3 | ) | 249.9 | ||||
| As at December 31, 2015 | ||||||||||
| Risk management contracts | ||||||||||
| Current asset | 214.3 | (5.0 | ) | 209.3 | (1.8 | ) | 207.5 | |||
| Long-term asset | 210.0 | (3.5 | ) | 206.5 | (1.8 | ) | 204.7 | |||
| Current liability | (6.6 | ) | 5.0 | (1.6 | ) | — | (1.6 | ) | ||
| Long-term liability | (4.2 | ) | 3.5 | (0.7 | ) | — | (0.7 | ) | ||
| Net position | 413.5 | — | 413.5 | (3.6 | ) | 409.9 | ||||
Risk Management Contracts
The following is a summary of all risk management contracts in place, excluding premiums, as at June 30, 2016. Risk management contract premiums have been disclosed as commitments in Note 13.
Financial WTI Crude Oil Contracts (1) | |||||||||||
| Volume | Sold Swap | Bought Put | Sold Call | Sold Put | |||||||
| Term | Contract | bbl/d | US$/bbl | US$/bbl | US$/bbl | US$/bbl | |||||
| 1-Jul-16 | 31-Dec-16 | Swap | 2,000 | 42.10 | — | — | — | ||||
| 1-Jul-16 | 31-Dec-16 | Collar | 3,000 | — | 40.00 | 50.00 | — | ||||
| 1-Jan-17 | 31-Dec-17 | Collar | 3,000 | — | 40.00 | 50.00 | — | ||||
| 1-Jan-17 | 31-Dec-17 | 3-Way | 4,000 | — | 42.50 | 56.62 | 30.00 | ||||
| (1) | Settled on the monthly average price. |
Financial Cdn$ WTI Crude Oil Contracts (2) | |||||||||
| Volume | Sold Swap | Bought Put | Sold Call | ||||||
| Term | Contract | bbl/d | Cdn$/bbl | Cdn$/bbl | Cdn$/bbl | ||||
| 1-Jul-16 | 31-Dec-16 | Swap | 7,000 | 77.20 | — | — | |||
| 1-Jul-16 | 30-Jun-17 | Collar | 3,000 | — | 70.00 | 83.38 | |||
| (2) | Settled on the monthly average price (monthly average US$/bbl multiplied by the Bank of Canada monthly average noon day rate). |
Financial MSW Crude Oil Contracts (3) | |||||
| Volume | Sold Swap | ||||
| Term | Contract | bbl/d | US$/bbl | ||
| 1-Jul-16 | 31-Dec-16 | Swap | 10,000 | (3.72 | ) |
| 1-Jan-17 | 31-Dec-17 | Swap | 4,000 | (3.66 | ) |
| (3) | Settled on the monthly average Mixed Sweet Blend ("MSW") Differential to WTI. The MSW differential refers to the discount between WTI and the mixed sweet crude grade at Edmonton, calculated on a monthly weighted average basis. |
| ARC Resources Ltd. | 57 | |
Financial NYMEX Henry Hub Natural Gas Contracts (4) | |||||||||
| Volume | Sold Swap | Bought Put | Sold Call | ||||||
| Term | Contract | MMbtu/d | US$/MMbtu | US$/MMbtu | US$/MMbtu | ||||
| 1-Jul-16 | 31-Dec-16 | Swap | 40,000 | 4.00 | — | — | |||
| 1-Jul-16 | 31-Dec-16 | Collar | 105,000 | — | 4.00 | 4.79 | |||
| 1-Jan-17 | 31-Dec-17 | Swap | 145,000 | 4.00 | — | — | |||
| 1-Jan-17 | 31-Dec-17 | Collar | 10,000 | — | 3.00 | 3.35 | |||
| 1-Jan-18 | 31-Dec-18 | Collar | 80,000 | — | 4.00 | 4.91 | |||
| 1-Jan-18 | 31-Dec-19 | Collar | 10,000 | — | 4.00 | 5.00 | |||
| 1-Jan-19 | 31-Dec-19 | Collar | 30,000 | — | 4.00 | 5.00 | |||
| (4) | NYMEX Henry Hub "Last Day" Settlement. |
Financial AECO Natural Gas Contracts (5) | |||||||||
| Volume | Sold Swap | Bought Put | Sold Call | ||||||
| Term | Contract | GJ/d | Cdn$/GJ | Cdn$/GJ | Cdn$/GJ | ||||
| 1-Jul-16 | 31-Dec-16 | Swap | 30,000 | 2.99 | — | — | |||
| 1-Jan-17 | 31-Dec-17 | Swap | 50,000 | 2.61 | — | — | |||
| 1-Jan-18 | 31-Dec-18 | Swap | 40,000 | 2.96 | — | — | |||
| 1-Jan-19 | 31-Dec-19 | Swap | 20,000 | 3.16 | — | — | |||
| 1-Jan-19 | 31-Dec-19 | Collar | 10,000 | — | 3.00 | 3.30 | |||
| 1-Jan-20 | 31-Dec-20 | Swap | 30,000 | 3.35 | — | — | |||
| 1-Jan-20 | 31-Dec-20 | Collar | 30,000 | — | 3.08 | 3.60 | |||
| (5) | AECO Monthly (7a) index Cdn$/GJ. |
Financial AECO Basis Ratio Swap Contracts (6) | ||||
| Volume | Sold Swap | |||
| Term | Contract | MMbtu/d | AECO/NYMEX % | |
| 1-Jul-16 | 31-Dec-16 | Swap | 10,000 | 88.4 |
| 1-Jul-16 | 31-Dec-17 | Swap | 110,000 | 90.6 |
| 1-Jul-16 | 30-Jun-18 | Swap | 20,000 | 89.9 |
| 1-Jan-17 | 31-Dec-17 | Swap | 10,000 | 86.1 |
| 1-Jan-17 | 31-Dec-18 | Swap | 5,000 | 77.0 |
| 1-Jan-18 | 31-Dec-18 | Swap | 45,000 | 81.9 |
| 1-Jan-18 | 30-Jun-19 | Swap | 20,000 | 90.8 |
| 1-Jul-18 | 31-Dec-18 | Swap | 20,000 | 85.4 |
| 1-Jan-19 | 31-Dec-19 | Swap | 20,000 | 81.7 |
| 1-Jul-19 | 31-Dec-19 | Swap | 20,000 | 80.7 |
| (6) | ARC receives NYMEX price based on Last Day settlement multiplied by AECO/NYMEX US$/MMbtu ratio; ARC pays AECO Monthly (7a) index US$/MMbtu. |
Financial AECO Basis Fixed Price Swap Contracts (7) | ||||
| Volume | Sold Swap | |||
| Term | Contract | MMbtu/d | US$/MMbtu | |
| 1-Jan-17 | 31-Dec-17 | Swap | 65,000 | (0.83) |
| 1-Jan-17 | 31-Dec-18 | Swap | 5,000 | (0.64) |
| 1-Jan-18 | 31-Dec-18 | Swap | 40,000 | (0.70) |
| 1-Jan-19 | 31-Dec-19 | Swap | 35,000 | (0.60) |
| 1-Jan-20 | 31-Dec-20 | Swap | 35,000 | (0.57) |
| (7) | ARC receives NYMEX price based on Last Day settlement less AECO fixed price differential; ARC pays AECO (7a) monthly index US$/MMbtu. |
| ARC Resources Ltd. | 58 | |
Financial Electricity Heat Rate Contracts (8) | ||||
| Volume | Heat Rate | |||
| Term | Contract | MWh | GJ/MWh | |
| 1-Jul-16 | 31-Dec-17 | Heat Rate Swap | 20 | 13.71 |
| (8) | ARC pays AECO Monthly (5a) x Heat Rate; ARC receives floating AESO Power Price (monthly average 24x7) Cdn$/MWh. |
Financial Electricity Contracts (9) | ||||
| Volume | Bought Swap | |||
| Term | Contract | MWh | Cdn$/MWh | |
| 1-Jul-16 | 31-Dec-16 | Fixed Rate Swap | 5 | 51.00 |
| (9) | AESO Power Price (monthly average 24x7) Cdn$/MWh. |
| 11. | SHAREHOLDERS’ CAPITAL |
| (thousands of shares) | Six Months Ended June 30, 2016 | Year Ended December 31, 2015 | ||||
| Common shares, beginning of period | 347,084 | 319,439 | ||||
| Equity offering | — | 17,859 | ||||
Restricted shares issued pursuant to the LTRSA (1) Plan | 96 | 100 | ||||
| Forfeited restricted shares pursuant to the LTRSA Plan | (3 | ) | (7 | ) | ||
| Unvested restricted shares held in trust pursuant to the LTRSA Plan | (93 | ) | (93 | ) | ||
| Dividend reinvestment program | 3,015 | 7,563 | ||||
| Stock dividend program | 989 | 2,224 | ||||
| Issued on exercise of share options | 11 | — | — | |||
| Cancelled shares | — | (1 | ) | |||
| Common shares, end of period | 351,099 | 347,084 | ||||
| (1) | Long-term Restricted Share Award. |
Net income (loss) per common share has been determined based on the following:
| Three Months Ended June 30 | Six Months Ended June 30 | |||||||||||
| (thousands of shares) | 2016 | 2015 | 2016 | 2015 | ||||||||
| Weighted average common shares | 350,459 | 340,418 | 349,570 | 349,570 | 336,850 | 336,850 | ||||||
Dilutive impact of share-based compensation (1) | — | — | 254 | 254 | — | — | ||||||
| Weighted average common shares - diluted | 350,459 | 340,418 | 349,824 | 349,824 | 336,850 | 336,850 | ||||||
| (1) | Excludes impact of four million weighted average common shares related to share options and 0.2 million weighted average common shares related to LTRSAs that were anti-dilutive for the three months ended June 30, 2016 and 3.2 million weighted average common shares related to share options that were anti-dilutive for the six months ended June 30, 2016 (3.4 million weighted average common shares related to share options and 0.1 million weighted average common shares related to LTRSAs for the three and six months ended June 30, 2015). |
Dividends declared for the three and six months ended June 30, 2016 were $0.15 and $0.35 per common share, respectively ($0.30 and $0.60 for the three and six months ended June 30, 2015).
On July 18, 2016, the Board of Directors declared a dividend of $0.05 per common share, payable in cash or common shares under the Stock Dividend Program, to shareholders of record on July 29, 2016. The dividend payment date is August 15, 2016. Of the $17.6 million in dividends payable at June 30, 2016, $1.6 million is payable in common shares under the Stock Dividend Program ($4.5 million at December 31, 2015).
| ARC Resources Ltd. | 59 | |
| 12. | SHARE-BASED COMPENSATION PLANS |
Long-term Incentive Plans
The following table summarizes the Restricted Share Unit ("RSU"), Performance Share Unit ("PSU") and Deferred Share Unit ("DSU") movement for the six months ended June 30, 2016:
| (number of units, thousands) | RSUs | PSUs (1) | DSUs | |||||
| Balance, December 31, 2015 | 730 | 1,577 | 317 | |||||
| Granted | 210 | 376 | 53 | |||||
| Distributed | (139 | ) | (207 | ) | — | |||
| Forfeited | (97 | ) | (86 | ) | — | |||
| Balance, June 30, 2016 | 704 | 1,660 | 370 | |||||
| (1) | Based on underlying units before any effect of the performance multiplier. |
Compensation charges (recoveries) relating to the RSU and PSU Plan and DSU Plan can be reconciled as follows:
| Three Months Ended June 30 | Six Months Ended June 30 | ||||||||
| 2016 | 2015 | 2016 | 2015 | ||||||
| G&A expenses (recoveries) | 11.5 | 4.4 | 21.6 | (2.3 | ) | ||||
| Operating expense | 1.3 | 0.3 | 2.7 | 0.5 | |||||
| PP&E | 1.3 | 0.6 | 2.1 | 0.1 | |||||
| Total compensation charges (recoveries) | 14.1 | 5.3 | 26.4 | (1.7 | ) | ||||
| Cash payments | — | — | 11.7 | 14.4 | |||||
At June 30, 2016, $27.5 million of compensation amounts payable were included in accounts payable and accrued liabilities on the balance sheet ($20 million at December 31, 2015) and $26.8 million was included in the long-term incentive compensation liability ($19.5 million at December 31, 2015). A recoverable amount of $0.5 million was included in accounts receivable at June 30, 2016 ($0.3 million at December 31, 2015).
Share Option Plan
The changes in total share options outstanding and related weighted average exercise prices for the six months ended June 30, 2016 were as follows:
Share Options (number of units, thousands) | Weighted Average Exercise Price ($) | ||||
| Balance, December 31, 2015 | 3,221 | 21.95 | |||
| Granted | 955 | 21.13 | |||
| Exercised | (11 | ) | 15.60 | ||
| Forfeited | (155 | ) | 21.62 | ||
| Balance, June 30, 2016 | 4,010 | 21.47 | |||
| Exercisable, June 30, 2016 | 707 | 18.01 | |||
The following table summarizes information regarding share options outstanding at June 30, 2016:
| Range of exercise price per common share ($) | Number of share options outstanding (thousands) | Weighted average exercise price per share for options outstanding ($) | Weighted average remaining term (years) | Number of share options exercisable (thousands) | Weighted average exercise price per share for options exercisable ($) | |||||
| 15.60 - 20.00 | 796 | 15.60 | 2.98 | 393 | 15.60 | |||||
| 20.01 - 25.00 | 2,732 | 21.55 | 5.45 | 314 | 21.01 | |||||
| 25.01 - 30.74 | 482 | 30.74 | 4.97 | — | — | |||||
| Total | 4,010 | 21.47 | 4.90 | 707 | 18.01 | |||||
| ARC Resources Ltd. | 60 | |
ARC estimates the fair value of share options granted on the date of grant using a binomial-lattice option pricing model. The following assumptions were used to arrive at the estimated fair value of the share options at their grant date:
| Six Months Ended June 30, 2016 | Six Months Ended June 30, 2015 | |||
| Grant date share price ($) | 21.13 | 21.86 | ||
Exercise price ($) (1) | 21.13 | 21.86 | ||
| Expected annual dividends ($) | 0.60 | 1.20 | ||
Expected volatility (%) (2) | 33.00 | 37.00 | ||
| Risk-free interest rate (%) | 0.88 | 1.40 | ||
Expected life of share option (3) | 5.5 to 6 years | 5.5 to 6 years | ||
| Fair value per share option ($) | 3.70 | 5.68 | ||
| (1) | Exercise price is reduced monthly by the amount of dividend declared. |
| (2) | Expected volatility is determined by the average price volatility of the common shares/trust units over the past seven years. |
| (3) | Expected life of the share option is calculated as the mid-point between vesting date and expiry. |
ARC recorded compensation expense of $1.2 million and $2.1 million relating to the share option plan for the three and six months ended June 30, 2016 ($0.7 million and $1.5 million for the three and six months ended June 30, 2015). During the three and six months ended June 30, 2016, $0.1 million and $0.2 million of share option compensation charges were capitalized to PP&E ($nil and $0.1 million for the three and six months ended June 30, 2015).
LTRSA Plan
The changes in total LTRSA outstanding and related fair value per restricted share for the six months ended June 30, 2016 were as follows:
| LTRSA (number of units, thousands) | Fair Value per Restricted Share ($) | ||||
| Balance, December 31, 2015 | 93 | 21.54 | |||
| Granted | 94 | 21.13 | |||
| Forfeited | (3 | ) | 21.86 | ||
| Balance, June 30, 2016 | 184 | 21.33 | |||
ARC recorded G&A expenses of $0.7 million relating to the cash payment under the LTRSA Plan during the three and six months ended June 30, 2016 and 2015. At June 30, 2016, $0.7 million of compensation amounts payable were included in accounts payable and accrued liabilities on the balance sheet ($nil at December 31, 2015).
| ARC Resources Ltd. | 61 | |
| 13. | COMMITMENTS AND CONTINGENCIES |
The following is a summary of ARC’s contractual obligations and commitments as at June 30, 2016:
| Payments Due by Period | ||||||||||
| 1 Year | 2-3 Years | 4-5 Years | Beyond 5 Years | Total | ||||||
Debt repayments (1) | 34.3 | 165.7 | 213.5 | 594.0 | 1,007.5 | |||||
Interest payments (2) | 43.6 | 78.3 | 61.0 | 54.5 | 237.4 | |||||
Reclamation fund contributions (3) | 3.2 | 6.1 | 5.6 | 44.3 | 59.2 | |||||
| Purchase commitments | 54.8 | 17.9 | 7.2 | 4.7 | 84.6 | |||||
| Transportation commitments | 75.9 | 129.0 | 85.7 | 214.2 | 504.8 | |||||
| Operating leases | 15.6 | 29.2 | 27.1 | 37.6 | 109.5 | |||||
Risk management contract premiums (4) | 5.2 | 3.4 | 0.3 | — | 8.9 | |||||
| Total contractual obligations and commitments | 232.6 | 429.6 | 400.4 | 949.3 | 2,011.9 | |||||
| (1) | Long-term and current portion of long-term debt. |
| (2) | Fixed interest payments on senior notes. |
| (3) | Contribution commitments to a restricted reclamation fund associated with the Redwater property. |
| (4) | Fixed premiums to be paid in future periods on certain commodity price risk management contracts. |
On June 29, 2016, ARC entered into a binding agreement to acquire an additional working interest in certain producing properties in the Pembina area of Alberta for cash consideration of approximately $35 million, subject to final adjustments. These assets produce approximately 800 barrels per day of light, sweet crude oil. The transaction is expected to close in August.
Subsequent to June 30, 2016, ARC entered into an additional gas transportation commitment for ten years totaling approximately $31.5 million.
| ARC Resources Ltd. | 62 | |
| 14. | SUPPLEMENTAL DISCLOSURES |
Presentation in the Statements of Income
ARC’s statements of income are prepared primarily by nature of item, with the exception of employee compensation expenses which are included in both operating and G&A expense line items.
The following table details the amount of total employee compensation expenses included in operating and G&A expense line items in the statements of income:
| Three Months Ended June 30 | Six Months Ended June 30 | ||||||||
| 2016 | 2015 | 2016 | 2015 | ||||||
| Operating | 8.5 | 9.2 | 18.2 | 18.5 | |||||
| G&A | 22.7 | 18.5 | 47.9 | 28.5 | |||||
| Total employee compensation expenses | 31.2 | 27.7 | 66.1 | 47.0 | |||||
Cash Flow Statement Presentation
The following tables provide a detailed breakdown of certain line items contained within cash flow from operating activities:
| Three Months Ended June 30 | Six Months Ended June 30 | ||||||||
| Change in Non-Cash Working Capital | 2016 | 2015 | 2016 | 2015 | |||||
| Accounts receivable | (2.4 | ) | (0.6 | ) | (6.5 | ) | 29.7 | ||
| Accounts payable and accrued liabilities | 25.7 | 9.6 | 8.2 | (135.8 | ) | ||||
| Prepaid expenses | (1.5 | ) | (4.5 | ) | (0.9 | ) | (4.9 | ) | |
| Total | 21.8 | 4.5 | 0.8 | (111.0 | ) | ||||
| Relating to: | |||||||||
| Operating activities | 11.5 | (5.9 | ) | 15.2 | (40.1 | ) | |||
| Investing activities | 10.3 | 10.4 | (14.4 | ) | (70.9 | ) | |||
| Total change in non-cash working capital | 21.8 | 4.5 | 0.8 | (111.0 | ) | ||||
| Three Months Ended June 30 | Six Months Ended June 30 | ||||||||
| Other Non-Cash Items | 2016 | 2015 | 2016 | 2015 | |||||
| Non-cash lease inducement | (0.5 | ) | (0.5 | ) | (0.9 | ) | (0.9 | ) | |
| Gain on short-term investment | (0.5 | ) | (0.1 | ) | (0.4 | ) | (0.5 | ) | |
| Share-based compensation expense | 1.2 | 0.7 | 2.2 | 1.5 | |||||
| Total other non-cash items | 0.2 | 0.1 | 0.9 | 0.1 | |||||
| Three Months Ended June 30 | Six Months Ended June 30 | ||||||||
| Net Change in Other Liabilities | 2016 | 2015 | 2016 | 2015 | |||||
| Long-term incentive compensation liability | 6.3 | 3.5 | 7.3 | (6.1 | ) | ||||
| Risk management contracts | 3.3 | (0.2 | ) | 3.3 | (0.2 | ) | |||
| ARO | (1.8 | ) | (1.6 | ) | (3.9 | ) | (3.6 | ) | |
| Total net change in other liabilities | 7.8 | 1.7 | 6.7 | (9.9 | ) | ||||
| ARC Resources Ltd. | 63 | |