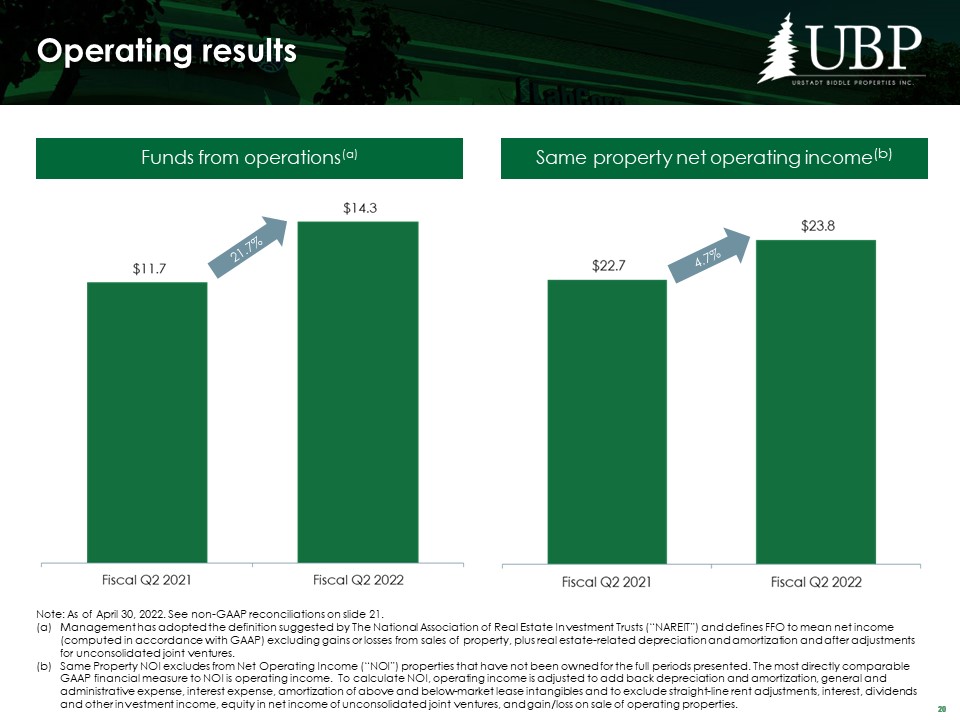
Reconciliation of Net Income Available to Common and Class A Common Stockholders to Funds From Operations Six Months Ended April 30, Three Months Ended April 30, 2022 2021 2022 2021 Net Income Applicable to Common / Class A Stockholders $12,506 $9,100 $7,109 $4,621 Real property depreciation 11,622 11,461 5,884 5,759 Amortization of tenant improvements and allowances 2,123 2,352 1,132 1,037 Amortization of deferred leasing costs 936 846 539 370 Depreciation and amortization on unconsolidated JV 746 750 371 375 (Gain)/loss on sale of property (768) (406) (766) (434) FFO Applicable to Common / Class A Stockholders $27,165 $24,103 $14,269 $11,728 Funds from Operations (Diluted) Per Share: Common $0.64 $0.56 $0.33 $0.27 Class A Common $0.70 $0.63 $0.37 $0.31 Weighted Average Number of Shares Outstanding (Diluted): Common and Common Equivalent 9,751 9,498 9,793 9,603 Class A Common and Class A Common Equivalent 29,800 29,667 29,831 29,764 Non-GAAP Reconciliations Same Property Operating Results: Six Months Ended April 30, Three Months Ended April 30, 2022 2021 Δ 2022 2021 Δ Number of Properties 72 72 Revenue: Base Rent $49,601 $49,924 (1%) $25,053 $25,759 (3%) Uncollectable amounts in lease income-same property (152) (1,379) (89%) (39) (725) (95%) ASC Topic 842 cash-basis lease income reversal-same property (10) (1,855) (99%) 49 (856) (106%) Recoveries from tenants 17,429 18,612 (6%) 8,158 8,767 (7%) Other property income 1,130 226 400% 794 178 346% 67,998 65,528 4% 34,015 33,123 3% Expenses: Property operating 7,802 7,720 1% 3,997 3,920 2% Property taxes 11,677 11,698 (0%) 5,768 5,872 (2%) Other non-recoverable operating expenses 962 1,016 (5%) 466 618 (25%) 20,441 20,434 - 10,231 10,410 (2%) Same Property Net Operating Income 47,557 45,094 5% 23,784 22,713 5% Reconciliation of Same Property NOI to Most Directly Comparable GAAP Measure: Six Months Ended April 30, Three Months Ended April 30, 2022 2021 Δ 2022 2021 Δ Other reconciling items: Other non same-property NOI 750 750 754 351 Other Interest income 286 231 161 123 Other Dividend Income - - - - Consolidated lease termination income 60 704 32 - Consolidated amortization of above and below market leases 396 289 222 179 Consolidated straight line rent income (55) (2,331) (60) (1,763) Equity in net income of unconsolidated JV 590 660 323 310 Taxable REIT subsidiary income/(loss) (135) 254 (321) (126) Solar income/(loss) (292) (247) (81) (93) Storage income/(loss) 1,001 445 475 192 Unrealized holding gains during the periods - - - - Gain on sale of marketable securities - - - - Interest expense (6,564) (6,733) (3,262) (3,341) General and administrative expenses (5,188) (4,737) (2,508) (2,093) Uncollectable amounts in lease income (152) (1,379) (39) (725) Uncollectable amounts in lease income-same property 152 1,379 39 725 ASC Topic 842 cash-basis lease income reversal (10) (1,892) 77 (893) ASC Topic 842 cash-basis lease income reversal-same property 10 1,855 (49) 856 Directors fees and expenses (201) (198) (94) (89) Depreciation and amortization (14,716) (14,710) (7,572) (7,192) Adjustment for intercompany expenses and other (3,112) (2,078) (1,223) (610) Total other -net ($27,180) ($27,738) ($13,126) (14,189) Income from continuing operations 20,377 17,356 17% 10,658 8,524 25% Gain (loss) on sale of real estate 768 406 766 434 Net income $21,145 $17,762 19% $11,424 8,958 28% Net income attributable to noncontrolling interests (1,814) (1,837) (903) (925) Net income attributable to Urstadt Biddle Properties Inc. $19,331 $15,925 21% $10,521 8,033 31% Same Property Operating Expense Ratio 89.5% 95.8% (6%) 83.5% 89.5% (6%) Note: Dollars in thousands.


