Subject: Golden Chest Underground Reserves at Year End 2021
Introduction
This memo documents the procedures carried out to produce a block model for the Golden Chest Underground, and the subsequent calculation of reserves for the Golden Chest at year end 2021. Block procedure will be described in the following sections as well as the selected parameters for definitions as proven or probable reserves. Definitions for proven and probable reserves will be taken from SK 1300.
(1)
Mineral reserve is an estimate of tonnage and grade or quality of indicated and measured mineral resources that, in the opinion of the qualified person, can be the basis of an economically viable project. More specifically, it is the economically mineable part of a measured or indicated mineral resource, which includes diluting materials and allowances for losses that may occur when the material is mined or extracted.
(2)
Proven mineral reserve is the economically mineable part of a measured mineral resource and can only result from conversion of a measured mineral resource.
(3)
Probable mineral reserve is the economically mineable part of an indicated and, in some cases, a measured mineral resource.
Methods
Block Modeling Procedure
For the purpose of modeling reserves at the Golden Chest, all available sample data were used. The underground reserves calculated are entirely in the Skookum shoot where sample density and mining experience gave enough confidence that grades could be reasonably predicted. The composite database consisted of 1,452 muck sample composites on 2.7-meter centers (each round is sampled by a miner), 993 jackleg longhole samples on 1.22 meter centers, and 6,670 drill hole composites composited on 3-meter centers using a run length method.
The hangingwall of the Idaho fault was cut from the block mode, as all current mining activities at the Golden Chest take place in the footwall of the Idaho fault.
Block modeling parameters were selected as follows.
Table 1. Block Modeling Parameters for Reserves Calculation
Block Modeling Parameters
Parameter
Value
Reasoning
Block Model
Name
GCUG_LR_25m_25m_5m
Modeling Method
Inverse Distance Squared
Mining Experience
Block Size
3m
Block Size
Search Region
Bearing
15 deg azimuth
Observed Strike of the Vein
Plunge
0.0
Dip
45 deg West
Observed Dip of the Vein
Major Axis
25 m
Mining Experience and
Within Micon Maximum Search Radius
Semi-Major Axis
25 m
Mining Experience and
Within Micon Maximum Search Radius
Minor Axis
5 m
Micon Search Radius
Sample Counts
Minimum per Block
2
Based on exploratory stats
Maximum per Block
6
Based on exploratory stats
Database
Filtering
IDVN Shape
Modeling Domain
Block Options
Cut above IDFLT
Mining Experience
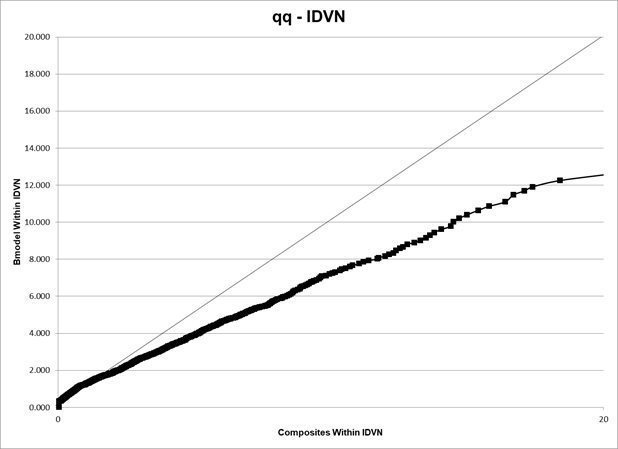
After the block model was created general statistics, histograms, and a QQ plot of the composite database versus the block model were evaluated to gage the effectiveness of the block modeling parameters.
Mineable Reserve Block Definition
Using the block model, a 3.0 gram per tonne (gpt) grade shell was applied to define the stope blocks. A cutoff of 3.0 grams per tonne was chosen as the stope go/no-go cutoff based on the parameters in Table 2.
Table 2. Stope go/no go cutoff parameters
Mining Cost
92.25
$/tonne
Milling Cost
35
$/tonne
Hauling Cost
13
$/tonne
Smelter Recovery
91
%
Mill Recovery
93
%
Gold Price (3 year trailing average)
1650
$/oz
Gold Price (3 year trailing average)
53.05
$/gram
The three-year trailing average gold price was calculated for 2021, 2020 and 2019. Using the above listed economic parameters, a 2.0 gpt in-stope cutoff was calculated. After a stope has been established any given round must assay 2 gpt to be selected as ore. The ore grades reported are for all tonnes above a 2.0 gpt cutoff.
After grade shells were created at 3.0 grams per tonne, mining shapes with accesses were designed to evaluate the selected stope blocks for economic feasibility and the effect of internal dilution. The levels selected with reserves are the 888 sublevel, the 842 sublevel, the 830 sublevel, the 818 sublevel, and the 851 Blowout Zone (BZ). Mining shapes are cut and fill stopes with a 3m by 3m nominal cross section dimension, with the top half (1.5m) of the hangingwall rib cut at the fault dip of 45 degrees.
Modifying Factors
Idaho Strategic Resources company currently produces approximately 16,000 tonnes of underground ore a year and ships that ore to the New Jersey Mill for flotation concentration. The concentrate has been sold to various smelters around the world since 2016. All relevant permits are in place and underground production is ongoing. Mining, milling, and smelting costs are well known and used throughout this analysis.
Results
Block model summary statistics showed an acceptable correlation to the composite database. The block modeling method selected (ID2) has a tendency to “smooth” grade values. This smoothing can be seen in the QQ plot where the composite database has a higher percentage of samples in the higher-grade regions. It is also reflected in the distribution curve, and general statistics of the composite database and the block model. This is a commonly mentioned effect of ID2 estimation which is used in narrow vein system modeling. The effect of grade smoothing on the block model leads to a conservative estimate of the grade of the material in the reserves. Constraining reserves to valid stope shapes also ensures that the tonnage calculated is in line with current mining practices at the Golden Chest and that dilution is accounted for.
Figure 1. Quantile-Quantile Plot of Composites vs. Block Model showing the skewing of higher-grade samples within the population of the composite database.
Figure 2. Distribution of the composite database and the block model within the IDVN in the Skookum Shoot
Table 3. General statistics summary
Parameters
Composite Database: gcmug_combomujdh_12212020.cop
Block Model: GCUG_LR_25m_25m_5m
Samples
1,739
24650
Average Grade (gpt)
2.74
2.26
Standard Deviation
4.59
2.47
Variance:
21.11
6.11
Median
1.17
1.37
Stope scheduling was carried out in Excel using current production rates and cost information from the Golden Chest Underground operation. After scheduling the projected cash flows were discounted using a 7% discount rate and evaluated for profitability. All of the levels included in this reserve calculation showed economic viability. Some tonnes in the mining shapes fell outside the defined boundaries of the block model. These tonnes accounted for 6% of the total mass of all stope tonnes. They were assigned the average grade of all tonnes estimated in a stope, ore and waste, and if the estimated grade was above the 2 gpt in stope cutoff, they were added to the ore tonnes.
Table 4. Parameters used for scheduling and cash flow analysis
Parameter
Value
Unit
Development Cost
55
$/tonne
Stope Mining Cost
95
$/tonne
Ore Hauling Cost
12.5
$/tonne
Milling Cost
31
$/tonne
Mill Recovery
93
%
Smelter Payment Factor
91
%
Gold Price
1650 (53.05)
$/troy oz ($/gram)
Discount Rate
7
%
Stope Mining Rate (Backfill Included)
1150
Tonnes/month
Main Access Ramp Mining Rate
900
Tonnes/month
Stope Access Mining Rate
1200
Tonnes/month
Table 5. Reserve Summary by level
Level
Reserve
Grade (gpt)
Reserve
Tonnes
Months To Mine
@ Current Rate
Total Discounted
Cash Flow 7% per annum (USD)
Undiscounted Margin
@ 1650 per troy oz (%)
830
4.98
12,500
13
864,000
33
842
9.81
800
1
234,000
69
BZ
5.38
4,100
7
299,000
31
888
3.82
8,200
12
163,000
12
818
4.98
13,100
21
381,000
15
Total
4.87
38,700
N/A
N/A
N/A
Conclusion
Due to the extensive mining experience gained at the Golden Chest, and the large volume of samples taken from underground mining and diamond drilling, the Golden Chest can report 38,700 tonnes of 4.87 gpt proven reserves at the end of 2021
We use cookies on this site to provide a more responsive and personalized service. Continuing to browse, clicking I Agree, or closing this banner indicates agreement. See our Cookie Policy for more information.