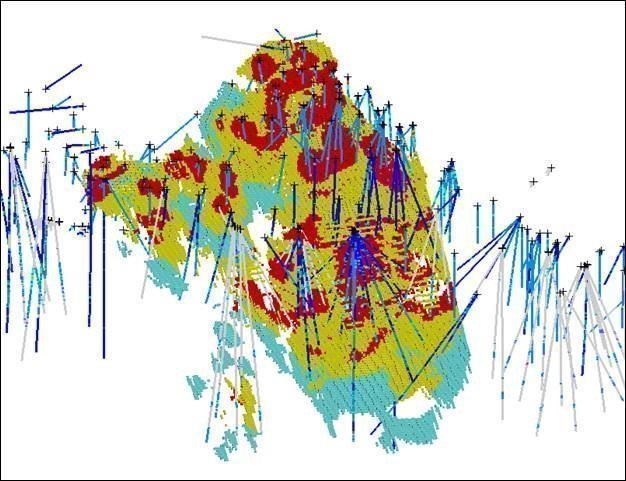
Figure 11‑12 Visual Validation Slice of the Paymaster Zone Idaho and Jumbo Veins
11-19
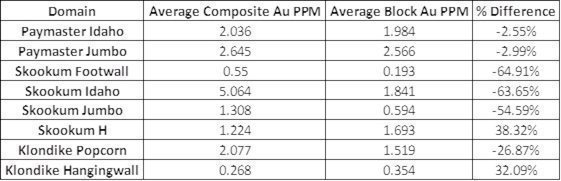
Figure 11‑13 Comparison of Composite Means versus Block Means by Domain
11-20
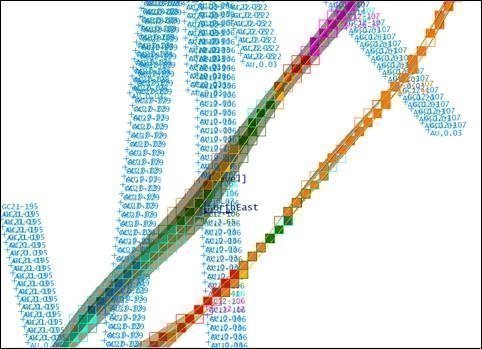
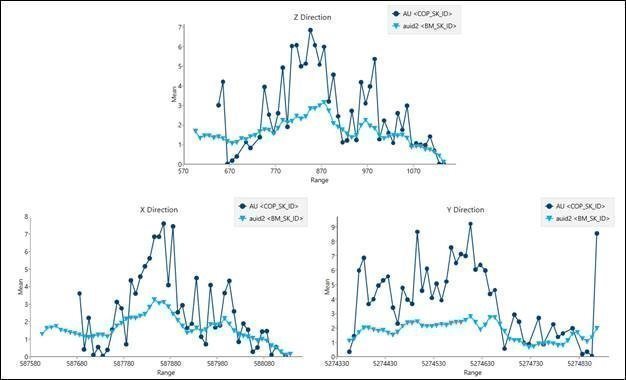
Figure 11‑14 Swath Plot of Paymaster Jumbo Vein. Composites (Dark Blue) versus Blocks (Light Blue)
11-21
Figure 11‑15 Swath Plot of Paymaster Idaho Vein. Composites (Dark Blue) versus Blocks (Light Blue)
11-21
Figure 11‑16 Swath Plot of Skookum Idaho Vein. Composites (Dark Blue) versus Blocks (Light Blue)
11-21
Figure 11‑17 Swath Plot of Skookum Jumbo Vein. Composites (Dark Blue) versus Blocks (Light Blue)
11-22
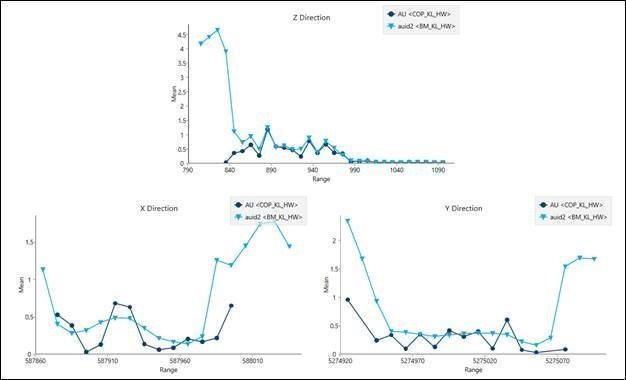
Figure 11‑18 Swath Plot of Skookum H Vein. Composites (Dark Blue) versus Blocks (Light Blue)
11-22
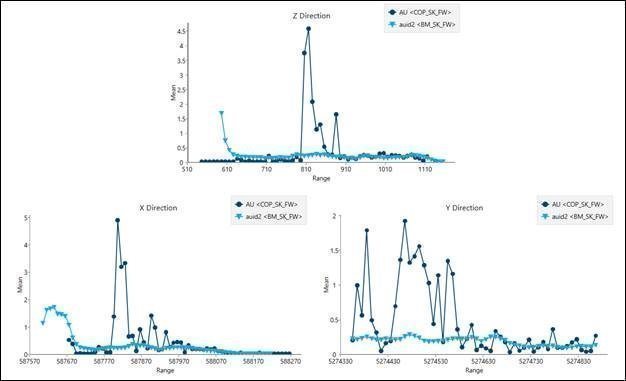
Figure 11‑19 Swath Plot of Skookum Footwall. Composites (Dark Blue) versus Blocks (Light Blue)
11-23
Figure 11‑20 Swath Plot of Klondike Popcorn Vein. Composites (Dark Blue) versus Blocks (Light Blue)
11-23
Figure 11‑21 Swath Plot of Klondike Popcorn Vein. Composites (Dark Blue) versus Blocks (Light Blue)
11-24
Figure 13‑1 map showing outline
13-1
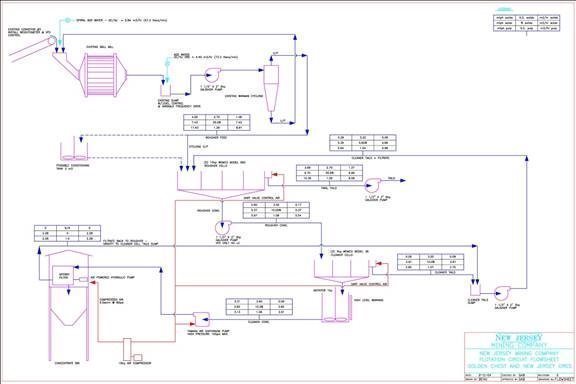
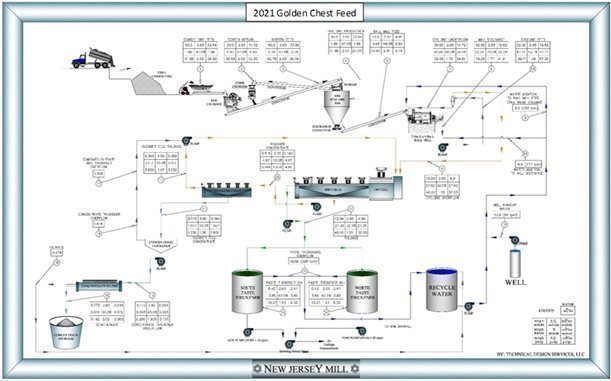
Figure 14‑1 New Jersey Mill Flowsheet
14-2
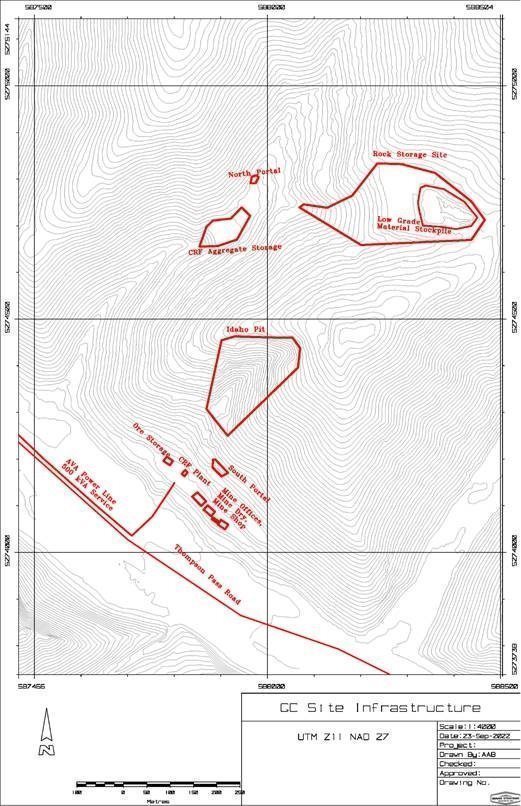
Figure 15‑1 Infrastructure Layout.
15-2
Figure 19‑1 Sensitivity analysis of Golden Chest underground reserves
19-2
Figure 20‑1 Map of Adjacent Properties
20-2
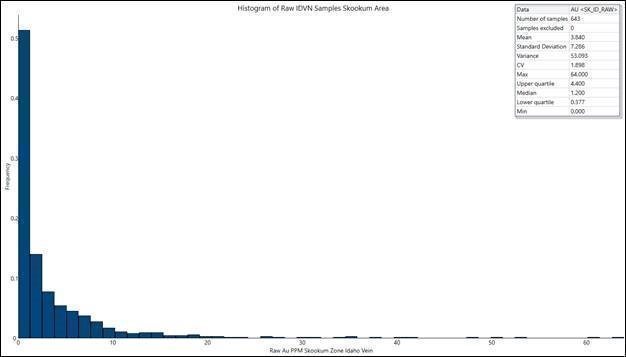
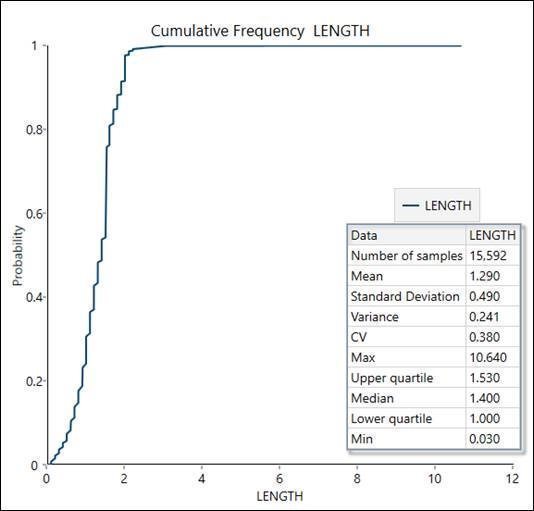
Figure 27‑1 Skookum Area Jumbo Vein Histogram and Raw Statistics
27-2
Figure 27‑2 Skookum Area H Vein Histogram and Raw Statistics
27-2
Figure 27‑3 Skookum Area Footwall Quartzite Histogram and Raw Statistics
27-3
Figure 27‑4 Paymaster Area Idaho Vein Histogram and Raw Statistics
27-3
Figure 27‑5 Paymaster Area Jumbo Vein Histogram and Raw Statistics
27-4
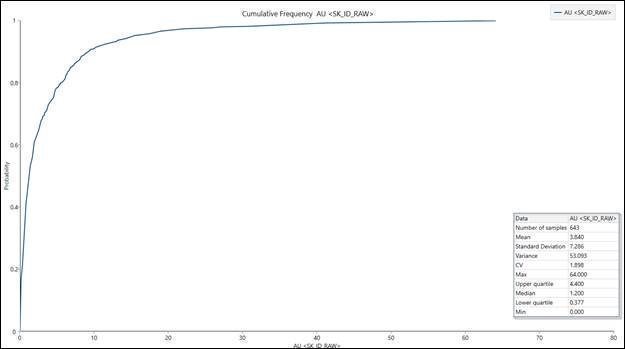
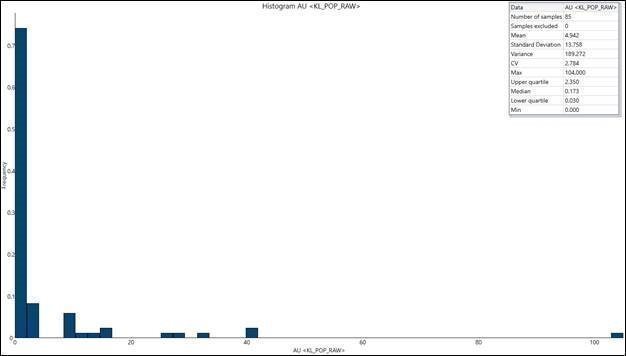
Figure 27‑6 Klondike Area Popcorn Vein Histogram and Raw Statistics
27-4
Figure 27‑7 Klondike Area Hangingwall Histogram and Raw Statistics
27-5
Figure 28‑1 Skookum Area Jumbo Vein Experimental Variogram with Modeled Variogram
28-6
1 -8
Figure 28‑2 Skookum Area H Vein Experimental Variogram with Modeled Variogram
28-6
Figure 28‑3 Skookum Zone Footwall Domain Experimental Variogram and Modeled Variogram
28-7
Figure 28‑4 Paymaster Area Idaho Vein Experimental Variogram with Modeled Variogrom
28-7
Figure 28‑5 Paymaster Area Jumbo Vein Experimental Variogram with Modeled Variogram
28-8
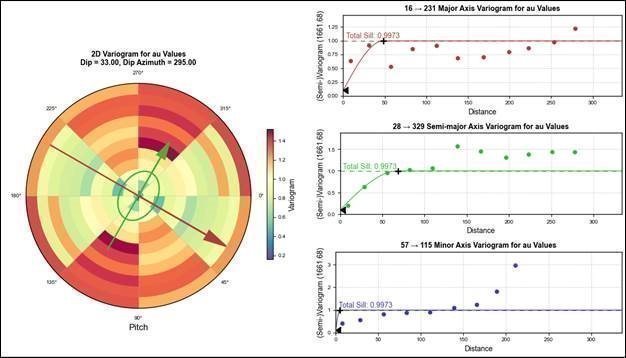
Figure 28‑6 Klondike Hangingwall Experimental Variogram with Modeled Variogram
28-8
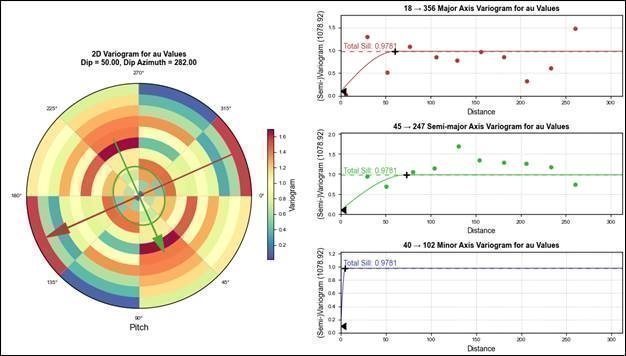
Figure 28‑7 Klondike Zone Popcorn Vein Experimental Variogram with Modeled Variogram
28-9
Figure 29‑1 Grade Tonne Curve for the Skookum Zone Underground Resource
29-10
Figure 29‑2 Grade Tonne Curve for the Paymaster Zone
29-10
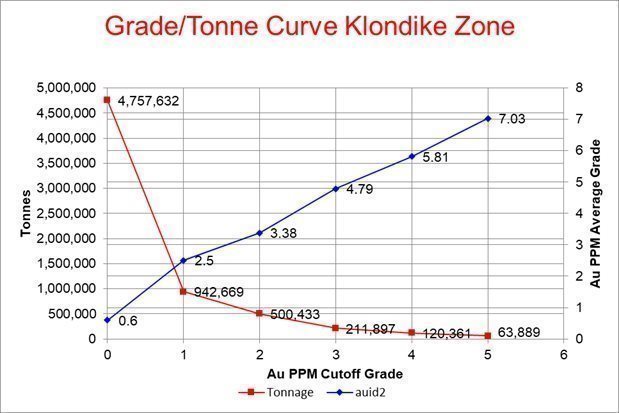
Figure 29‑3 Grade Tonne Curve for the Klondike Zone
29-11
1 -9
1.0 EXECUTIVE SUMMARY
1.1 Summary
This Technical Report Summary (TRS) on the Golden Chest Mine, Idaho (Golden Chest, property, or mine) has been prepared for Idaho Strategic Resources, Inc. (IDR) by the Qualified Persons (QP’s) Grant A. Brackebusch, P.E. and Robert J. Morgan, PG, PLS. Both are employees of IDR. Brackebusch is the Vice President of Operations and Morgan is the Vice President of Exploration.
The purpose of this report is to disclose Mineral Reserves and Mineral Resources at the Golden Chest Mine as of December 31, 2022.
IDR is listed on the NYSE and currently reports Mineral Reserves in its Annual Report on Form 10K with the United States Securities and Exchange Commission (SEC). This TRS conforms to SEC’s Modernized Property Disclosure Requirements for Mining Registrants as described in Subpart 229.1300 of Regulation S-K, Disclosure by Registrants Engaged in Mining Operations (S-K 1300) and Item 601 (b)(96) Technical Report Summary.
The Golden Chest mine is narrow vein underground gold mine located in Murray, Idaho, which produces approximately 40,000 tonnes of ore annually to feed the New Jersey Mill (NJ Mill) in Kellogg, Idaho. The Golden Chest has operated continually since 2016. The NJ Mill produces a bulk sulfide flotation concentrate which is shipped to overseas smelters.
1.1.1 Conclusions
The QP’s offer the following interpretations and conclusions by area.
Geology and Mineral Resources
·
The Company has completed a Mineral Resource Estimate for the year ending December 31, 2022, which has been reviewed and accepted by the QP’s. Measured and Indicated Resources at the Golden Chest Mine total 1,095,748 tonnes at a grade of 4.41 gpt gold with Inferred Resources totaling 753,502 tonnes at a grade of 3.44 gpt gold. The Mineral Resources are exclusive of Mineral Reserves.
·
Core sampling is supervised by professional geologist and sampling procedures meet industry best practices.
·
The sample preparation, security, and analytical procedures for core samples were consistent with generally accepted industry best practices.
·
The QA/QC procedures for core samples are consistent with generally accepted industry standards. However, a persistent, low bias in assay results was found in the 3 gpt standard.
·
Blanks and standards are not currently included with round samples from the stope rounds. Blanks and standards should be included with round samples on a weekly basis.
·
The QP’s review of database validation yielded no deficient procedures or data. The sample database is valid for reserve and resource calculations.
1 -0
Mining and Mineral Reserves
·
The Mineral Reserve estimate of has been reviewed by the QP’s and found to be in accordance with the definitions for Mineral Reserves in S-K 1300. Mineral Reserves at December 31, 2022, are 53,754 tonnes at an average grade of 4.73 gpt gold using a gold price of $1,800 per troy ounce.
·
The Mineral Reserves are all within the Skookum Shoot area near existing infrastructure and near previously mined areas where sample data is dense enough for Proven and Probable classification.
·
Mineral Reserves are prepared by qualified personnel with appropriate supervision using industry-standard mining software.
·
The QP’s believe the use of a trailing three-year average gold price is appropriate and consistent with generally accepted practices within the mining industry.
·
The mining method at the Golden Chest is underhand cut-and-fill utilizing cemented rock fill (CRF) in the stopes.
·
The mining method is appropriate for this type of vein deposit and the ground conditions with minimum widths of 2.5 m and an average stope width of 3.0 m.
·
The Mineral Reserve is based on the underhand cut-and-fill mining method.
·
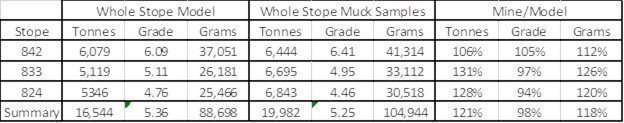
Block model versus round sample reconciliation shows the block model accurately predicts gold grade within 2%. A reconciliation of the block model and mine versus the mill feed should completed.
·
Dilution is accounted for in the Mineral Reserve estimate and extraction is assumed to be 100%.
·
The ground support plan with the use of Swellex-bolts in conjunction with CRF has improved geotechnical stope stability.
·
The mine uses 1.5 m3 rubber-tired LHDs along with diesel-hydraulic drill jumbos and a 22-tonne underground dump truck.
·
Life-of-mine (LOM) plans should be completed once an updated Mineral Resource estimate is completed. Mining equipment, infrastructure, and mineral processing requirements could be determined once an LOM plan is completed.
1 -1
Mineral Processing
·
Material is shipped from the Golden Chest Mine in Murray, Idaho to the New Jersey Mill in Kellogg, Idaho for processing using highway dump trucks with pups.
·
The New Jersey Mill operates as a bulk flotation plant at a rate of approximately 40,000 tonnes per year to produce a bulk-sulfide concentrate for sale to copper smelters in Asia.
·
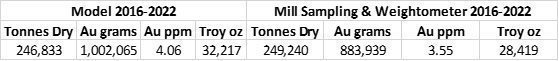
The mill has processed nearly 249,240 tonnes of material from the Golden Chest open pit and underground and achieved gold recovery of 89.7% with an average concentrate grade of 247 gpt gold.
·
The mill has achieved higher gold recovery of 93% for straight underground material. This is appropriate gold recovery to use for underground Mineral Reserve estimates.
·
Previous campaigns of processing material from the Golden Chest at the 100 tpd New Jersey Mill from 2005 to 2009 provided metallurgical testing information at a bulk-sample scale.
·
RDI performed metallurgical testing evaluating gravity, flotation, and cyanidation processes using core samples from the Skookum Shoot.
·
The New Jersey Mill utilizes the novel process of paste tailings disposal and recycles process water to minimize its impact on the environment.
Infrastructure
·
The Golden Chest Mine is accessible all year round via a paved highway known as Forest Highway 9 and has all the necessary infrastructure to mine at the current rate.
·
An increase in the current mining rate would require an upgrade to the electrical power line to the mine.
Environment
·
The Golden Chest Mine and New Jersey Mill have all the necessary environmental permits to operate.
·
The Company has posted bonds to cover the cost of reclamation at both the Golden Chest and New Jersey Mill.
·
The Company promotes a “We Live Here” philosophy which encourages a commitment to the environment because employees and management all live and recreate in the local area. Local hiring and buying are also encouraged under this philosophy.
1.1.2 Recommendations
The QP’s offer the following recommendations by area.
Geology and Mineral Resources
1.
The 3 gpt standard assays should be investigated to determine if a cause for the low bias can be found.
2.
Blanks and standards should be included with the round samples on a weekly basis.
3.
Follow-up or closeout assays around a vein intercept should be checked on a regular basis to ensure that they have been added to the sample database to avoid inaccuracies in compositing.
1 -2
Mining and Mineral Reserves
1.
Add the reconciliation of mill tonnes and grade to the block model reconciliation exercise.
2.
The use of the mechanical bolter in the stopes should be implemented into the stope design to pursue increased efficiency and safety in the installation of ground support.
3.
Study the addition of a paste backfill system for the potential to reduce operating costs.
Mineral Processing
1.
Hire a metallurgical consultant to perform a plant audit of the mill to help optimize operational parameters to maximize net smelter return.
2.
Complete mineralogic study of concentrate to define mineralogic components of concentrate.
Environment
1.
Consider hiring a full-time environmental professional or environmental contractor as the scope of operations has increased.
2.
Make plans to drill three groundwater monitoring wells at the Golden Chest Mine.
1.2 Economic Analysis
1.2.1 Economic Criteria
IDR completed a 16-month cash flow analysis for the Mineral Reserve estimation as it prefers to use sample information from mining previous levels to increase the confidence in grade estimation which produces a more accurate estimate in a narrow vein gold deposit.
1.2.2 Physical Parameters
·
Total mill feed processed: 53,754 tonnes
·
Average processing rate: 185 metric tonnes per shift
Table 1‑1 Golden Chest Projected Production for One Year
Commodity
Head Grade
Mill % Recovery
Mill Recovered Au Grams
Au
4.73
93
236,458
1.2.3 Revenue Parameters
·
Gold price used in the economic analysis is a constant $1,800 per troy ounce representing a 3-year trailing average (2020, 2021, 2022).
·
Constant smelter payment factor of 91%
·
Constant Net of Smelter Royalty (NSR) of 2%
1.2.4 Operating and Capital Costs
·
Constant Net of Smelter Royalty (NSR) of 2%
·
Constant Ore haulage cost of $13.90 per tonne
1 -3
·
Constant milling cost of $37.50 per tonne
·
Constant ore mining with fill of $120 per tonne
·
Constant development cost of $65 per tonne
·
Sustaining capital of $1,082,000 for mine equipment and $70,000 for mill infrastructure
·
Mine life of 1.3 years
1.2.5 Taxes and Royalties
Idaho Strategic Resources pays property tax in Shoshone County and occasionally a Net Profit Tax to Shoshone county. No income tax is anticipated to be payable in the next year as IDR has a substantial corporate tax loss carryforward.
The current production zone is subject to a 2% NSR royalty payable to Marathon Gold Corp. which is included in the estimate. Property taxes and net profit tax paid to Shoshone County are minor compared to the 2% NSR and are neglected in the analysis.
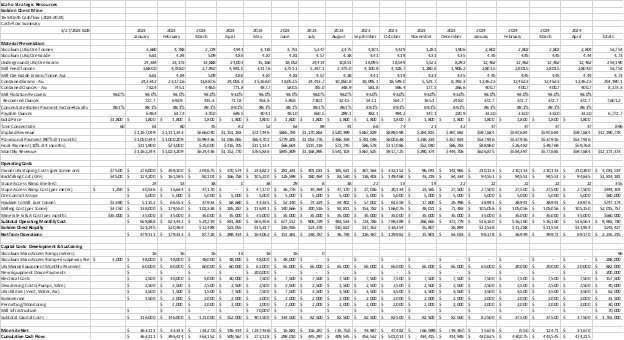
1.2.6 Cash Flow
The results of this analysis indicate a positive cash flow of approximately $474,000 at the base case. Capital requirements are paid within the year and the positive cash flow indicates economic viability at the base case $1,800 per troy ounce gold price. See Table 19-2 for more detail.
1.2.7 Sensitivity
The sensitivity analysis found that gold mill recovery, smelter payment factor, gold grade, and gold price are the most sensitive variables in the estimate.
1.3 Technical Summary
1.3.1 Property Description
The Golden Chest Mine’s production operations are located 2.4 km east of Murray, Idaho along Forest Highway 9. The mine is an underground cut and fill gold property exploiting a narrow, quartz vein system. The Golden Chest produces about 40,000 tonnes of ore annually utilizing underhand cut and fill. The ore is processed at the New Jersey Mill in Kellogg, Idaho to produce a bulk-sulfide concentrate for sale to smelters in Asia. The rest of the project lies immediately northwest, north, and northeast of the town of Murray, ID.
1.3.2 Land Tenure
The Company owns 100% of the Golden Chest mine and the core land position is comprised of both patented 157 hectares (387 acres) and unpatented claims 563 hectares (1,390 acres) subject to a 2% Net Smelter Royalty (NSR). The Company owns an additional 378 hectares (935 acres) of patented land and 1,178 hectares (2,910 acres) of unpatented claims, immediately north and west of Murray, that are not subject to any NSR.
1.3.3 History
The Golden Chest Mine is the oldest lode gold mine in the Coeur d’Alene District. Historic reports peg the estimated production of the Golden Chest at 65,000 ounces of gold produced before 1940. Since 1940 gold production is estimated to be approximately 30,000 ounces with this production occurring after 2004.
1 -4
1.3.4 Geologic Setting, Mineralization, and Deposit
The Golden Chest is considered an orogenic gold deposit with gold mineralization hosted in a quartz vein near a major local fault. The primary geological control to mineralization at the Golden Chest is the Idaho Fault and gold mineralization usually occurs within 50 meters of the fault. The deposit is hosted by the Prichard Formation which is the oldest member of the Belt Supergroup.
1.3.5 Exploration
Currently IDR is conducting exploratory core drilling on the property with the aim to increase the Mineral Resource and help define the Mineral Reserve.
1.3.6 Mineral Resource Estimate
The Company has completed a Mineral Resource Estimate for the year ending December 31, 2022. Measured and Indicated Resources at the Golden Chest Mine total 1,095,748 tonnes at a grade of 4.41 gpt gold with Inferred resources totaling 753,502 tonnes at a grade of 3.44 gpt gold. Mineral Resources are exclusive of the Mineral Reserves.
1.3.7 Mineral Reserve Estimate
Mineral Reserve estimates, prepared by IDR and reviewed and accepted by the QP’s, have been classified in accordance with the definitions for Mineral Reserves in S-K 1300 and are estimated to be 53,754 tonnes at a grade of 4.73 gpt gold.
1.3.8 Mining Methods
The Golden Chest Mine is accessed by a decline ramp 4.5 m by 4.0 m in cross-section. A northern ramp provides for an escapeway and secondary escape. The vein is mined by underhand cut and fill utilizing cemented rock fill (CRF) as backfill. Ore and waste are transported to the surface via the main ramp with a 22-tonne haul truck.
1.3.9 Mineral Processing
The New Jersey Mill located 3 km east of Kellogg, Idaho has processed material from the Golden Chest since 2017 from both open pit and underground sources at a rate of about 300 tpd for 3.5 days per week. The New Jersey Mill uses a conventional bulk sulfide flotation flowsheet utilizing crushing, grinding, flotation, and paste tailings disposal. Concentrate is shipped to copper smelters in Asia.
1.3.10 Infrastructure
The Golden Chest mining operations have been ongoing since 2012 and infrastructure at the site includes 1,750 meters of underground ramp, electrical service, a core shed, a mine dry, and a shop building. Year-round access to the mine is provided by Forest Highway 9 which is maintained by Shoshone County.
1.3.11 Market Studies
The Golden Chest produces a bulk sulfide concentrate sold to copper smelters in Asia through a concentrate broker and has sold concentrate in this fashion since 2016.
1 - 5
1.3.12 Environmental Permitting
The Golden Chest Mine and New Jersey Mill have all the necessary environmental permits to operate. The NJ Mill utilizes a unique tailings disposal method known as paste tailings disposal that allows process water recycling and prevents the discharge of process water to surface waters of the US.
1 - 6
2.0 INTRODUCTION
This Technical Report Summary (TRS) on the Golden Chest Mine (Golden Chest, property, or mine) has been prepared for Idaho Strategic Resources, Inc. (IDR) by the Qualified Persons (QP’s) Grant A. Brackebusch, P.E. and Robert J. Morgan, PG, PLS. Both are employees of IDR. Brackebusch is the Vice President of Operations and Morgan is the Vice President of Exploration.
The purpose of this report is to disclose Mineral Reserves and Resources at the Golden Chest Mine as of December 31, 2022. This is the first update of the TRS completed for the Golden Chest Mine.
Idaho Strategic Resources, Inc. (IDR) is listed on the NYSE and currently reports Mineral Reserves and Resources in its Annual Report on Form 10K with the United States Securities and Exchange Commission (SEC). This TRS conforms to SEC’s Modernized Property Disclosure Requirements for Mining Registrants as described in Subpart 229.1300 of Regulation S-K, Disclosure by Registrants Engaged in Mining Operations (S-K 1300) and Item 601 (b)(96) Technical Report Summary.
2.1 Site Visit
Both QP’s are employees of IDR and spend a significant portion of their time at the mine and the mill so a site visit is unnecessary.
2.2 Sources of Information
During preparation of this report discussions were held with the following personnel.
Rick Alexander
Mill Lead Operator, IDR
Andrew Brackebusch, EIT
Golden Chest Mine Engineer, IDR
John Etienne
Chief Geologist, IDR
John Ferguson
Company Accountant, IDR
Kelly Gallogly
Golden Chest Mine Geologist, IDR
Rebecca Goddard
Exploration Geologist, IDR
Chandler Harris
Contract Geologist, Tamarack Geologic Services
Matt Williams
Golden Chest Mine Foreman, IDR
Jared Williams
Golden Chest Mine Foreman, IDR
Mike Leeling
Golden Chest Mine Foreman, IDR
Other sources of information can be found in Section 24.0 References.
2 - 1
2.3 List of Abbreviations
Table 2‑1 - List of Abbreviations
Term
Abbreviation
Acres
ac
Ammonium Nitrate/Fuel Oil
ANFO
Bureau of Land Management
BLM
Canadian National Instrument 43-101
NI 43-101
Centimeter
cm
Concentrate Leach Plant
CLP
Cemented Rock Fill
CRF
Cubic meter(s)
m3
Cubic meters per hour
m3/hr
Cyanide
CN
Meters
m
Degrees Celsius
oC
Direct Current
DC
Environmental Protection Agency
EPA
Fire assay
FA
Diameter
dia.
Global positioning system
GPS
Gram(s)
g
Grams per tonne
gpt, g/t
Grams per tonne of gold
g/t Au
Gold
Au
Golden Chest Limited Liability Company
GCLLC
Hectare(s)
ha
Hour
hr
Idaho Department of Environmental Quality
IDEQ
Idaho Strategic Resources, Inc.
IDR
Juniper Mining Company
JMC
Kilogram
kg
Kilograms per tonne
kg/tonne
Kilometer(s)
km
Kilowatt
kW
Kilowatt Hour
kWh
Load-Haul-Dump loader
LHD
Main Access Ramp
MAR
Meter(s)
m
Meters above sea level
masl
Micron(s)
μm
Millimetre(s)
mm
Million
M
Million years old
Ma
Minute(s)
min
Net Smelter Royalty
NSR
North American Datum
NAD
2 - 2
Term
Abbreviation
Ounces per tonne
opt
Parts per million
ppm
Professional Geologist
PG
Professional Land Surveyor
PLS
Professional Engineer
PE
Quality Assurance
QA
Quality Assurance/Quality Control
QA/QC
Quality Control
QC
Qualified Person
QP
Reduced Intrusion-Related Gold System
RIRGS
Second
s
Small Mine Development
SMD
Sodium cyanide
NaCN
Tonne(s)
t
Tonnes per Day
tpd
Tonnes per hour
t/h
United States
US
United States Dollars
USD$
Universal Transverse Mercator
UTM
2 - 3
3.0 PROPERTY DESCRIPTION
3.1 Location
The Golden Chest Mine (mine) has an area of 1,740 hectares (ha) (4,300 acres) and is located in Shoshone County, Idaho, United States. The mine is approximately centered at Latitude 47o37’14” North and Longitude 115o49’43” West (Figure 3-1). The mine is approximately 2.4 kilometers (km) east of the small town of Murray, Idaho and 115 km east of the city of Coeur d’ Alene, Idaho.
The New Jersey Mill (Mill) is located in Shoshone County, Idaho, United States approximately at Latitude 47o31’50” North and Longitude 116o04’38” West (Figure 3-1). The Mill is located approximately 21 km south of the town of Murray, Idaho and 3 km east of the city of Kellogg, Idaho.
Figure 3‑1 Golden Chest Mine and New Jersey Mill Location Map
3.2 Ownership and Holdings
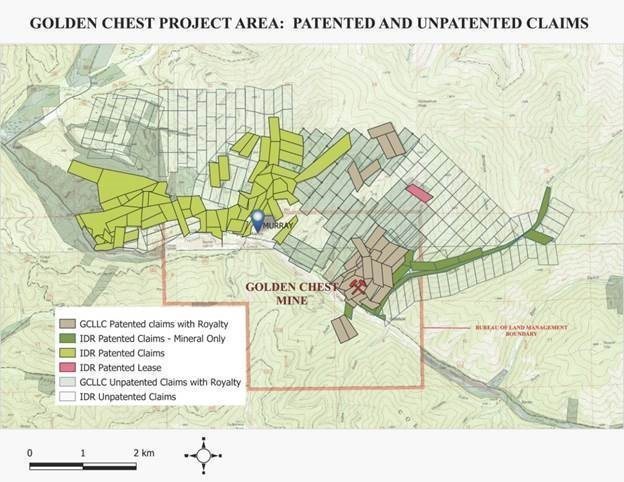
The Golden Chest Mine is composed of patented and unpatented claims (Figure 3-2). The land position consists of 86 patented mining claims (Table 3-1) covering approximately 535 hectares (ha) (1,322 acres) and 217 unpatented claims covering a total of approximately 1,740 ha (4,300 acres).
3 - 1
Figure 3‑2 Patented and unpatented claim locations
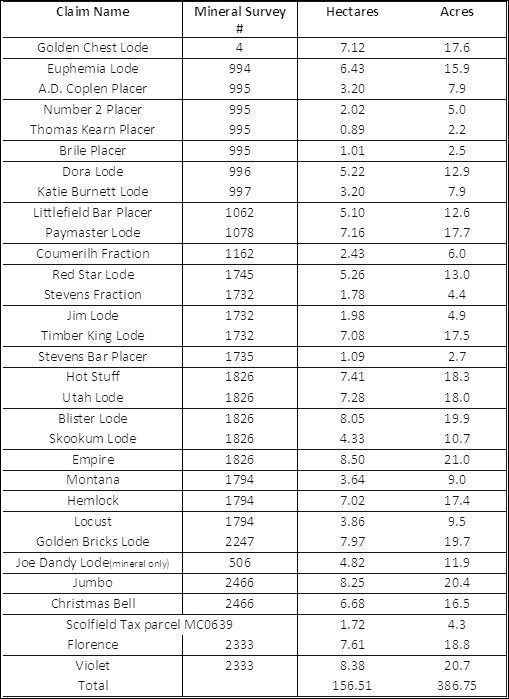
The core of the Golden Chest Mine is a contiguous group of 31 patented claims where all modern mining has taken place to date. The Company owns the rights to both the surface and subsurface mineral on all patented claims directly and through it’s 100% held subsidiary Golden Chest LLC (GCLLC), excluding the Joe Dandy Claim where IDR owns only the subsurface mineral rights. As these patented claims are considered private lots, legal access is allowed. Property taxes on patented claims are assessed by Shoshone County each year and IDR has paid the taxes in full. Table 3-1 below lists the patented claims that form the core of the Golden Chest Mine. Table 3-2 lists the patented claims outside of the core of the Golden Chest Site.
3 - 2
Table 3‑1 List of patented claims at the Golden Chest Mine, as of December 31, 2022
3 - 3
Table 3‑2 List of patented claims outside the core of the Golden Chest Mine, as of December 31, 2022
Claim Name
Mineral Survey #
Hectares
Acres
Ivah
2467
8.41
20.8
Selma
2467
8.40
20.8
Happy Jack
2467
8.40
20.8
Dream Gulch
1196
8.16
20.2
Niagara
1306
2.61
6.4
Grandchamp
1772
7.67
18.9
Hornet
1772
5.55
13.7
Golden King
18
4.75
11.7
Skookum
19
3.84
9.5
Grouse
20
6.86
17.0
Chas Long
778
1.59
3.9
Dixie
778
1.80
4.5
Nelson
1027
1.66
4.1
Kennedy
1027
0.96
2.4
Accident #2
1744
7.34
18.1
Accident #3
1744
7.85
19.4
No. 1
1744
7.77
19.2
Gilbert
1744
7.00
17.3
Shields Fraction
1744
6.83
16.9
Confidence
1744
7.98
19.7
Highland
1762
39.77
98.3
Highland Extension
1762
15.75
38.9
New Era
778
0.51
1.3
Lots 3,4,5,6
Former Gov't lot
1.76
4.3
Complete
1786
26.87
66.4
Deep Rim
1157
2.61
6.4
Wedge
1157
5.97
14.7
Minnie Lee
1157
3.02
7.5
Ninety Five
1157
2.47
6.1
Summit
1157
3.09
7.6
Gold Dust
1744
5.69
14.1
Bed Rock
1157
5.99
14.8
Wolf
9
3.09
7.6
Snow Bird
1738
7.68
19.0
McCormick
1772
6.74
16.7
Davison Tax Parcel MC0637
0.78
1.9
LeFaivre
1772
5.41
13.4
3 - 4
4th of July
1739
28.19
69.7
Dandy
1739
7.52
18.6
Claim Name (Cont.)
Mineral Survey #
Hectares
Acres
Burr, Stokes & Bidwell
1739
6.45
15.9
Park
1739
6.44
15.9
Cora Amended
1064
1.46
3.6
Alder No. 1
1769
5.41
13.4
Big Ledge
2252
6.62
16.3
Lady Elgin
1769
3.77
9.3
Lucky Dog
1769
7.17
17.7
Kentucky
1769
6.82
16.9
Blue Bird
1769
2.51
6.2
small wedge N of BlueBird
Former Gov't lot
0.21
0.5
Lots 10,11,12
Former Gov't lots
15.82
39.1
Evans
1769
7.56
18.7
Ida
1769
5.86
14.5
Vivian
549
6.14
15.2
Cahan
1772
3.88
9.6
Badger
894
4.05
10.0
Total
378.49
935.27
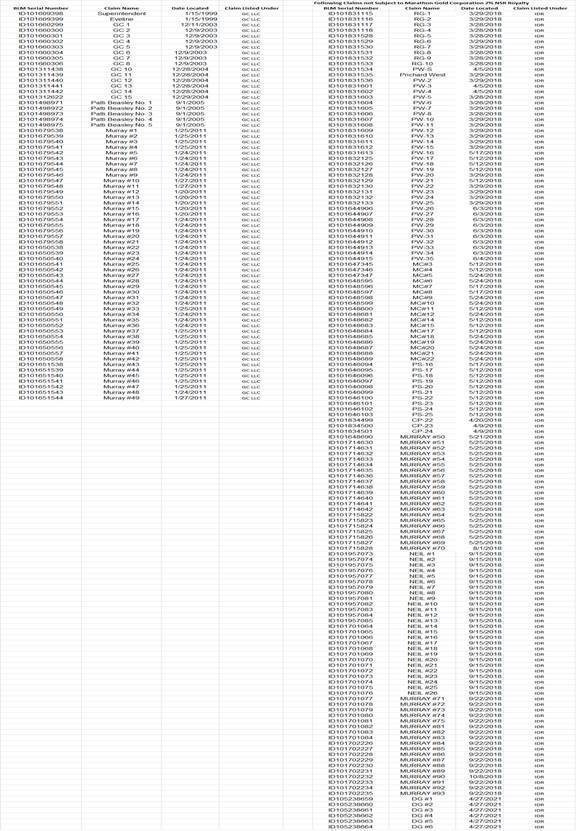
IDR currently maintains 217 unpatented mining claims covering 1,740 ha (4,300 acres). The claims have been filed with the United States Bureau of Land Management (BLM) agency and at the Shoshone County Courthouse. Annual maintenance fees are paid to the BLM by September 1, and the Golden Chest unpatented claim fees have been paid and are in good standing. The unpatented mining claims are located on parcels of public land from which the claimant owns the mineral rights, however, no surface land ownership is conveyed.
3 - 5
Table 3‑3 List of Unpatented Claims at the Golden Chest Property
3 - 6
3.3 Royalty
The Company owns 100% of the Golden Chest mine and the core land position is comprised of both patented (157 hectares [387 acres]) and unpatented claims (563 hectares [1,390 acres]) subject to a 2% Net Smelter Royalty (NSR) payable to Marathon Gold Corp. on a quarterly basis.
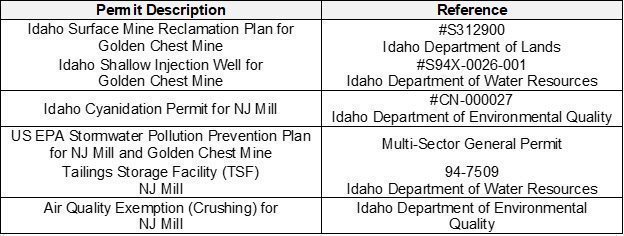
3.4 Permit Requirements
The Golden Chest Mine and New Jersey Mill have all the required environmental permits to operate currently and into the foreseeable. Some permits may require modification if operating conditions change, but typically these changes can be completed without impeding the mining operation. A summary of the permits held by the Company are found in Table 3-4.
Table 3‑4 Permit Descriptions
3.5 Encumbrances and Other Risks
As mentioned earlier, IDR does not own the surface of the Joe Dandy claim, however the deed for the claim contains language granting the owner of the mineral rights the ability to work and operate on the claim to mine the quartz lode. The Company is not aware of any significant factors or risks that may affect access, title, or the right or ability to perform work on the property.
3 - 7
4.0 ACCESSIBILITY, CLIMATE, LOCAL RESOURCES, INFRASTRUCTURE AND PHSYIOGRAPHY
4.1 Accessibility
The Golden Chest Mine is accessible year-round via a paved road known as Forest Highway 9 - a distance of 56 kilometers (35 miles) from Kingston, Idaho. At Kingston, Forest Highway 9 merges with US Interstate 90 for easy access to the local communities of Kellogg, Wallace, and Coeur d’Alene.
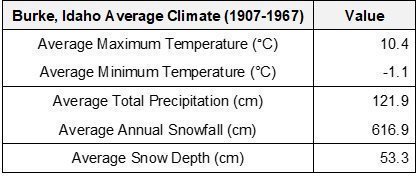
4.2 Climate
The Golden Chest is located in northern Idaho, which has a mountain climate typical for temperate regions in the mid-latitudes that are influenced by both polar and tropical air masses typified by wet, cold winters and short, dry summers.
The nearest climate records are found from Burke, Idaho (1907-1967) which is located approximately 10 km south of the mine at a slightly higher elevation.
Table 4‑1 Average Climate for Burke, ID 10km South of Golden Chest
Average annual precipitation is 121.9 cm, falling mainly in winter. Average annual snowfall is 616.9 cm and may occur in spring and fall as well as in winter.
During the winter, IDR is able to operate all season by plowing snow from the mine roads and utilizing tire chains on equipment when necessary. Forest Highway 9 is maintained all winter by Shoshone County.
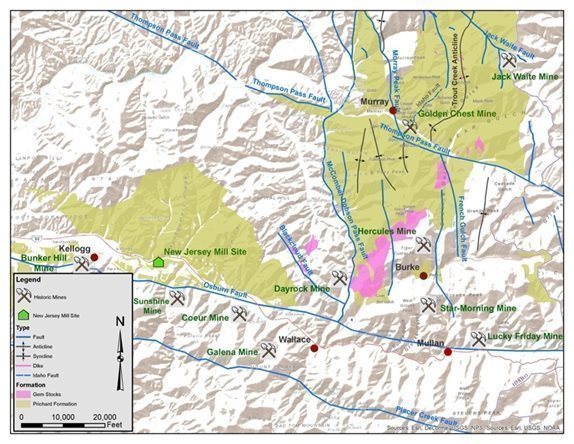
4.3 Local Resources and Infrastructure
The Golden Chest Mine benefits from local human resources and services in the towns of Murray, Wallace, and Kellogg, Idaho which are located 2.4 km west, 18 km south, and 24 km southwest respectively of the mine. Wallace, with a population of 1076 people at the 2020 census, is the county seat of Shoshone County.
The area has a long mining heritage as gold was discovered in Murray in 1882 and mining has continued to the present - mostly south of the Golden Chest in the Silver Valley. Current underground mining in the area is conducted by Hecla at the Lucky Friday Mine and Americas Gold and Silver Corporation at the Galena Mine. These historic and modern mining operations have resulted in an area that is familiar with and is equipped to support the mining industry. Experienced mining personnel and small business support are available.
4 - 1
4.4 Physiography and Environment
The topography of the mine area consists mainly of steep, mountainous terrain, which is primarily covered in mixed coniferous forest, except where recently burned. The mine is characterized by high relief, with elevations ranging from 880 meters above sea level (masl) at the Prichard Creek valley bottom to 1,220 masl on the ridges at the north end of the mine’s patented claim group.
The drainage pattern around the mine consists of dendritic perennial and intermittent watercourses that drain generally southwest. The dominant watercourses of the area are the North Fork of the Coeur d’ Alene River and Prichard Creek. The area is characterized by incised streams bounded by long steep ridges.
Timber consists mostly of pine, fir, cedar, and hemlock. Elk, deer and moose are the most common large mammals in the area. Other reported mammals in the surrounding area are black bear, wolf, and mountain lion. There are no known protected species within the mine area.
4 - 2
5.0 HISTORY
5.1 Location of District
The Golden Chest Mine is the oldest lode gold mine in the Coeur d’Alene District. The area commonly known as the Coeur d'Alene Mining District, has been subdivided for purposes of record and administration into a number of local mining districts. All of these subdivided local mining districts are in Shoshone County, Idaho. The Golden Chest Mine is more specifically located in the Summit Mining District within the Murray Gold Belt region of the greater Coeur d’Alene Mining District.
5.2 Historic Gold Mining
The first discovery of gold in the Coeur d’Alene District was made along the South Fork of the Coeur d’Alene River by Thomas Irwin in 1879. A.J. Prichard initiated the first active mining in 1882 when he staked out a number of placer claims for himself and his friends near the present site of Murray. The first lode claim in the district, the Paymaster, was located in September of 1883 and is now part of the Golden Chest.
By the end of 1883 and early in 1884, several mines were developed along Prichard Creek; the Mother Lode, Daddy, and Treasure Box mines on the creek’s south side, and the Golden Chest on the north side. By 1885, Murray had a population of about 1,500 with the Golden Chest and its 20-stamp mill employing 25 to 30 men. However, by 1886, with the discovery of the enormous lead-silver deposits at Bunker Hill, the scene of most mining activity had shifted to the South Fork of the Coeur d’Alene River near Kellogg. The Buckskin and King mines, on the Company’s land package northwest of Murray, were also active in the 1890’s. No gold production records from these two properties are known. The mining of lode quartz-gold veins had essentially ceased by 1900.
Prior to 1910, the Katie-Dora and Klondike Ore Shoots were accessed from the Katie #2, Katie #3, Martin, and Pettit Levels. After consolidation of the properties in 1910, the Idaho #3 level was completed at a lower elevation to access the deeper levels of the Katie-Dora and Klondike zones. Starting in late 1915, the Golden Chest was reopened as a source of tungsten (scheelite) for high-speed steels used in cutting tools designed for armament production in the First World War. The Anchor Mine, on Company ground north of Murray, was actively producing lead, silver, and zinc during the same time period.
During the Depression, placer mining was considerably revived, and in 1933 and 1934 the Golden Chest was again active. Only a small amount of work was in progress and most of the historic underground gold mining was complete when P. Shenon, of the Idaho Bureau of Mines and Geology, visited the Golden Chest in 1935. Shenon reported that underground maps displayed over 4,000 m of drifts and crosscuts.
Historic reports peg the estimated production of the Golden Chest at 65,000 ounces of gold produced before 1940. The first documented drilling program on the Golden Chest Mine was conducted between 1969 and 1973 by Golden Chest Incorporated (GCI). Drill tests by GCI included four underground holes and one surface diamond drill hole totaling 385 m. The surface hole intersected an 18 m zone containing multiple, low-grade gold-bearing quartz veins.
Newmont Exploration Limited (NEL) conducted exploration activities including mapping, sampling and drilling between 1987 and 1990. In 1987 and 1988, Newmont completed six core drill holes with depths to 175 m. In 1988 and 1989, an additional 29 reverse-circulation holes, with depths up to 130 m, were completed on the property. Newmont dropped the property in 1990, due to the property not fulfilling their requirements for an open pit resource.
5 - 1
5.3 Historical Mineral Resource Estimates
Newmont Exploration Limited (NEL) evaluated the Golden Chest for bulk mineable potential between 1987 and 1990. Newmont drilled six core holes totaling 734 total meters; and 29 reverse-circulation holes totaling 2,659 total meters. This work resulted in a mineral resource estimate as follows:
·
Potential Open Pit Resource: 4,758,852 short tons grading 0.049 ounces per ton (opt) Au for 230,278 ounces of gold at cut-off grade of 0.02 opt Au.
Since these “resources” are historical in nature, they cannot be relied upon. It is unlikely that these resource numbers conform to current SK 1300 criteria or to Society of Mining Metallurgy and Exploration (SME) standards, and most importantly they have not been verified to determine their relevance or reliability. However, they have been included into this section for illustrative purposes only and should not be disclosed out of context.
5.4 New Jersey Mining Company (IDR 2003-2012)
IDR leased the Golden Chest in 2003 and began a core drilling program to confirm several of Newmont’s favorable drill intercepts. Confirmatory core drilling results led to enough validation to begin a new portal (North Portal) in late 2004. Between 2004 and 2008, a 440 m spiral ramp was developed from the surface down to the historic Idaho #3 Level.
Between 2004 and 2012, small-scale mining by IDR from the North Portal access extracted a total of 8,400 tonnes of material grading 6.90 gpt Au, with a total of 1,705 ounces (oz) of gold recovered.
5.5 Golden Chest LLC (2010-2015)
The Golden Chest Limited Liability Company (GCLLC) was formed in December 2010 by a joint venture agreement between IDR and Marathon Gold USA. GCLLC began an intense surface drilling program; drilling 106 core holes in 2011 and 45 core holes in 2012 totaling over 18,000 meters.
5.6 Micon NI 43-101 (2011 and 2012)
Marathon Gold Corporation, a Canadian company and parent company to Marathon Gold USA required an independent NI 43-101 Technical Report in order to support regulatory disclosures leading to the “Micon Technical Report on the Initial Resource Estimate at the Golden Chest Property, Idaho, United States, effective date December 31, 2011”. Continued work the next year led to the development of an updated, second technical report by Micon in 2012. The updated 2012 NI 43-101 technical report included an overall mineral resource 254,000 oz gold in the Measured and Indicated categories and 223,000 oz gold in the Inferred category @ 0.4 gpt gold cut-off. The Micon 2012 report also included an open pit resource estimate with 4.63-million tonnes grading 1.71 grams per ton (gpt) gold and totaling 223,000 ounces (oz) of gold in the “Measured” and “Indicated” categories.
5.7 Juniper Mining Company (2013)
In September of 2013, Juniper Mining Company leased from GCLLC a section along the Idaho Fault known as the Skookum Shoot. Juniper conducted confirmation drilling, consisting of 16 surface core holes, to verify previous drilling results and by 2014 started construction of the South Portal and associated access ramp. Underground mining, using underhand cut and fill method was conducted from November 2014 through September 2015. Juniper accomplished about 1,000 meters of underground development after investing approximately $7 to $9 million. Other work included 889 face chip samples, 729 round samples, and 734 jackleg probe hole cuttings samples. IDR processed the Golden Chest material at its New Jersey Mill during the Juniper Lease, earning cash from milling fees and its share of a 2% net smelter return (NSR) royalty on gold production. Juniper mined 40,840 dry metric tonnes of ore at an average grade of 6.70 gpt gold, resulting in production of approximately 8,000 oz of gold.
5 - 2
In September 2015, Juniper ceased operations and terminated their lease, forfeiting the remaining mineralized material and mine infrastructure returning the property to GCLLC.
5.8 Idaho Strategic Resources (2016-Present)
In August 2016, Idaho Strategic Resources (IDR), formerly known as New Jersey Mining Company, began to re-open the mine, starting with open pit mining on the Idaho Vein (Idaho Pit) and de-watering of the underground workings. Through June 2022, open pit mining was coincident with underground mining.
5 - 3
6.0 GEOLOGICAL SETTING, MINERALIZATION, AND DEPOSIT
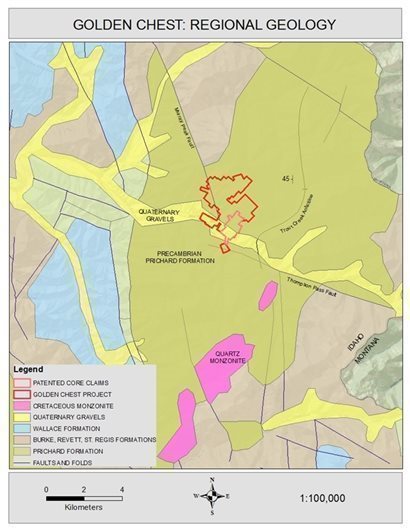
6.1 Regional Geology
The Golden Chest Mine lies within the Northern Thrust Belt geologic province of Idaho (Figure 6-1). The Northern Thrust Belt is characterized by a set of north-west trending thrust faults which cut through the Mesoproterozoic metamorphic and sedimentary rocks of the Belt Supergroup.
Figure 6‑1 Geologic Provinces of Idaho (Idaho State University 2017)
6.1.1 Belt Supergroup
The Belt Supergroup consists of a thick sequence of marine basin sediments that were deposited 1470-1400 million years ago (Ma). In the mine region, the Belt Supergroup is comprised of four major groups, from oldest to youngest:
1) The Lower Belt Group, which is composed of a single formation (Prichard) with eight members, and is composed of thin to thick bedded argillite, siltite, and quartzite.
2) The Ravalli Group, which is composed of three formations and is dominated by quartzite lithologies.
3) The Middle Belt Carbonate Group (in the mine area, consists of the Wallace Formation) which is dominated by limestone and dolomitic quartzites.
4) The Missoula Group which consisting of interbedded quartzite and argillite (Table 6-1).
6 - 1
Table 6‑1 Belt Supergroup Stratigraphy in the Mine Region (modified after Gott 1980)
Most of historic production in the Coeur d’Alene Mining District has been from the Ravalli and Lower Belt Groups. The host rock lithology at the Golden Chest is the Prichard Formation of the Lower Belt Group.
6.2 Local Geology
6.2.1 Lithology
Prichard Formation
The area surrounding Murray, Idaho is dominated by the lithologies of the Prichard Formation (Figure 6-3) which comprises the Lower Belt Group of the Belt Supergroup. The Prichard Formation is made up of a series of weakly metamorphosed, marine basin sediments consisting of siltite, argillite and quartzite. The sediments were deposited by underwater landslides in an active shelf environment creating turbidite sequences. The turbidites are composed of graded couplets consisting of a dark argillite layer and a light siltite layer. The quartzite beds are often discontinuous lenses that suggest deposition in narrow sub-marine channels. In the Murray area, the total thickness of the Prichard Formation is greater than 2740 m (Hosterman 1956). The entire Prichard Formation has been weakly metamorphosed to lower greenschist facies, which is manifested by the presence of low temperature minerals such as chlorite and a weak schistose texture.
Gem Stocks
Locally, the largest group of named igneous intrusives is called the Gem Stocks (Figure 6-3). The Murray Stocks, discussed in Section 6.3, are a smaller associated subset of the Gem Stocks. The Gem Stocks are zoned, monzonitic to syenitic intrusions. Base and precious metals were mined from veins at stock margins in the late 1800’s to mid-1900. The intrusions are small in areal extent but are known from mining to become larger with depth. Age dates for the Gem Stocks vary, but most range in age between 94 to 118 Ma, with a suggested emplacement age of 100 Ma.
6 - 2
The Gem and Murray stocks precede the emplacement of the Idaho Batholith and represent numerous intrusive events along their northeast-southwest trend. This is evidenced by the most mafic portion of the stocks being at the southwestern end of the string of intrusions, while the most felsic portion is at the northeastern end near Murray. The Bitterroot lobe of the Idaho Batholith was intruded during regional compression in Cretaceous time; (95 to 70 Ma).
Figure 6‑3 Prichard Formation (Green), Gem Stocks (Pink), Major Fault Lineaments (Blue) and Trout Creek Anticline (Black).
6.2.2 Structure
Thompson Pass Fault
The Thompson Pass Fault is the largest geologic structure in the Murray area (Figure 6-3). This fault is considered the northern boundary that defines the Lewis and Clark Line in the region. The Lewis and Clark Line is a zone of nearly vertical normal, reverse and strike-slip faults that represents a fundamental break in the crust along which intermittent movement has occurred from Proterozoic time (2,500 Ma) to the present. The Lewis and Clark Line includes the Thompson Pass Fault as the north boundary, the Osburn Fault in the center, and the Placer Creek Fault as the south boundary. Near the mine, the Thompson Pass Fault strikes northwesterly, has a near vertical dip and strong right-lateral, strike-slip displacement.
6 - 3
Trout Creek Anticline
The Trout Creek Anticline is the next largest structural feature in the Murray area after the Thompson Pass Fault. The northerly-trending Trout Creek Anticline is truncated on its southern end by the Thompson Pass Fault. The Trout Creek Anticline is an asymmetric upright fold, with the eastern limb dipping more steeply than the western limb. The western limb dips west at about 45 degrees. The Golden Chest mine is located on the western limb of the Trout Creek Anticline (Figure 6.4). The Idaho Fault is the major fault in the mine workings and is conformable to the western limb and has the same dip.
Murray Peak Fault
Another major structural feature in the local area is the Murray Peak Fault (Figure 6.4). This fault is a northerly trending, high-angle reverse fault which primarily dips steeply to the west at 70° to 85°. Like the Trout Creek Anticline, the Murray Peak Fault is truncated at its southern end by the Thompson Pass Fault. The Murray Peak Fault is the dominant feature in the Alder Gulch area of The Project.
Figure 6‑4 Regional Geologic Map
6 - 4
6.3 Property Geology
6.3.1 Lithology
The Golden Chest mine has five fundamental rock types; three are sedimentary in origin and two are igneous. The sedimentary rocks are composed of siltite, argillite and quartzite; or any combination of these three rock types. The two types of igneous rocks are both intrusive; quartz monzonite and lamprophyre.
Siltite, Argillite and Quartzite
The mine host rocks are composed of siltite, argillite and quartzite, which belong to the Prichard Formation in the Lower Belt Group. The nomenclature for the Prichard Formation as used by IDR has been adapted from Cressman (1989). This adaptation of the Prichard describes and divides the rock units into informal members of the formation starting from older to younger, and these members are identified with nomenclatures of A through H (eight members in total). At the mine, the two youngest members of the Prichard are represented, Members G and H (Figure 6-5).
Member G is characterized by lenses of quartzite interbedded with siltite and argillite. This rock unit forms the footwall of the Idaho Fault. The thickness of Member G can range in thickness from 10 to more than 1000 m.
Member H, which lies stratigraphically above Member G, is dominated by dark gray argillites and light gray siltites with minor quartzites. This rock unit forms the hanging wall of the Idaho Fault. Bedding is dominantly planar. The thickness of Member H is from 600 to 750 m.
Quartz Monzonite
The intrusive rocks at the mine are dominantly quartz monzonite, which are related to the Murray Stocks. The Murray Stocks are a subset to the Gem Stocks and share the same Cretaceous age. Surface exposures of quartz monzonite are limited to the southern end of the mine, and in one prospect on the west side of Buckskin Gulch, immediately northwest of Murray. The quartz monzonite is more often seen in drill core as either a sill occupying the Idaho Fault or as a dike in its hanging wall.
The quartz monzonite is composed of approximately 40% quartz, 40% potassium feldspar and 20% plagioclase. It is mostly observed as grey-colored and equigranular, although porphyritic phases are also found in drill core at the southern end of the mine. When porphyritic, the quartz monzonite contains abundant, light pink potassium feldspar phenocrysts. Minor purple fluorite in thin quartz veinlets has been observed in some drill core. Some occurrences of the monzonite contain xenolithic clasts of granitic-looking rock, altered sediments, or fragments of vein quartz.
Lamprophyres
There are several generations of lamprophyre dikes and sills. The lamprophyre dikes or sills are usually narrow with widths less than 1 m and are composed of a fine-grained groundmass with visible phenocrysts of black hornblende, biotite, or pyroxene.
6 - 5
Figure 6‑5 Mine Geologic Map
Lamprophyre dikes can contain xenoliths of gold-bearing quartz vein material, indicating that at least some of these dikes and sills postdate mineralization. Marvin et al (1984) indicate ages of 68.8 ± 2.0 Ma to 58.8 ± 1.5 Ma for lamprophyre dikes in the area.
6.3.2 Structure
The mine lies at or near the intersection of several structural features including the Thompson Pass Fault, Trout Creek Anticline, Murray Peak Fault and the Idaho Fault. This complexity forms a structural knot that has prepared the ground by providing channels for the hydrothermal fluids required to form the quartz-gold veins.
6 - 6
Idaho Fault
The primary structure at the Golden Chest Mine is the Idaho Fault. The Idaho Fault is interpreted as a moderate-angle, reverse fault that has exploited a lithologic boundary in the Prichard Formation.
The Idaho Fault occurs in the west limb of the Trout Creek Anticline, on a smaller scale secondary (parasitic) fold that plunges to the north-northwest. The strike of the Idaho Fault and the fold axis of the Trout Creek Anticline are sub-parallel (Figure 6-3). Bedding above and below the Idaho Fault may be parallel to it or intersecting at angles, dependent on location along the secondary fold.
Locally the Idaho Fault displays both cataclastic and mylonitic textures, indicating the fault has been active more than once. Multiple parallel gouge zones may occur across a relatively narrow cross-section. Fault slickensides can show dip-slip, strike-slip and oblique-slip movement.
Murray Peak Fault
In the west-central part of the project, the Murray Peak Fault is the primary structure cutting across the geology. This Fault has been described as a north-northwest striking, steeply west-dipping, reverse fault. Relative offset appears to increase to the north of Murray. A persistent, weakly mineralized structure of unknown origin appears to parallel the Murray Peak Fault a short distance to the west.
Minor Faults (North West Striking)
Since IDR re-started the mine in 2016, a series of northwest striking, steeply south dipping faults have been identified in both the hanging and footwalls of the Idaho Fault. Relative movement along these faults has been difficult to determine as there are no readily identifiable marker units in the Prichard Formation. These faults have been noted to offset or terminate veins.
Minor Faults (West Striking)
In the west-central part of the project, East-West striking faults have been noted in old prospect adits and trenches. These faults are near vertical in dip and can have numerous gouge seams within a broader zone of parallel structures. Relative movement along these faults has been difficult to determine as there are no readily identifiable marker units in the Prichard Formation.
6.4 Mineralization and Alteration
The primary geological control to mineralization at the Golden Chest is the Idaho Fault. The Idaho Fault separates the hanging wall (Prichard Formation-Member H) from its footwall (Prichard Formation-Member G).
The Idaho Fault acted as the conduit for the mineralizing fluids that produced most of the veins at the Golden Chest Mine. The veins are generally stratiform and conformable to the Idaho Fault and are centered along the Idaho Fault to form a sub-parallel, stacked vein set.
The alteration is generally weak and mostly occurs immediately adjacent to the veins. Silica, chlorite, pyrite, carbonates, and minor sericite are the primary alteration components seen.
The Minor Faults (Northwest Striking) have been seen to influence grade and tonnage in individual veins as they have been mined. The exact mechanism of control has yet to be determined.
The Minor Faults (West Striking) seem to be associated with numerous small quartz veins and igneous sills and dikes. However, the nature of this association has not been determined.
6 - 7
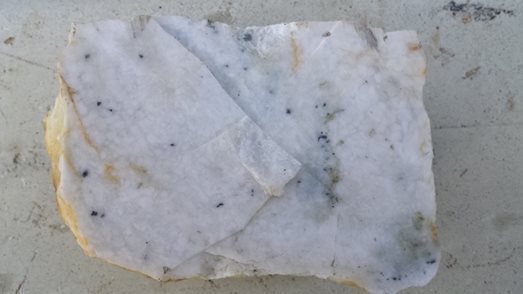
6.4.1 Vein Types
There are three main types of quartz-gold veins found at the mine; banded, brecciated and massive. Most of the gold production and best grades come from the banded quartz veins. The banded veins consist of thin, sub-parallel shear surfaces that result from compression. The bands are composed of quartz, fine sulfides and phyllosilicate septa (derived from wall rock). A banded vein example is shown in Figure 6-6 with visible gold grains circled in red.
Figure 6‑6 Banded Vein Example
Many of the veins at the mine are brecciated. Both the breccia clasts and matrix can be mineralized in this vein type. Brecciation events have modified or destroyed the textures of both the banded and massive vein types. A brecciated vein example is shown in Figure 6-7.
Figure 6‑7 Brecciated Vein Example
6 - 8
Massive quartz veins are characterized by a lack of banding or brecciation. They are also distinguished by a general lack of sulfides. The massive veins can have good gold values, but usually not as rich as the banded or brecciated veins. A massive vein example is shown in Figure 6-8.
Figure 6‑8 Massive Vein Example
6.4.2 Vein Names and Locations
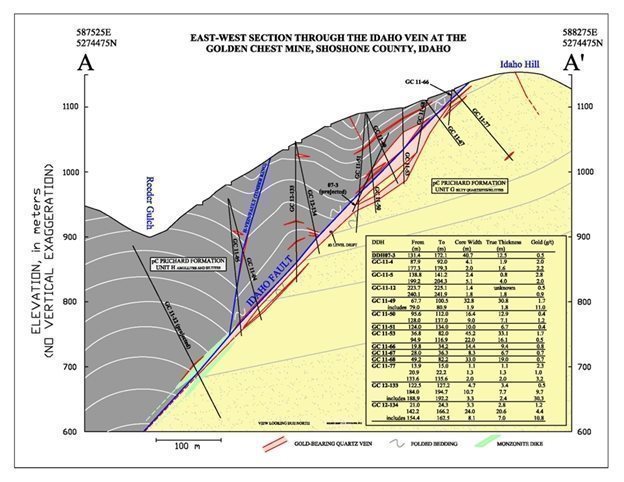
Most of the veins recognized at the mine are along or near the Idaho Fault. Both the veins and fault dip moderately to the west at approximately 45 degrees. An example vertical cross-section is shown in Figure 6-9 below.
Veins are found in both the hanging wall and the footwall of the Idaho Fault, and they are concentrated within 100 meters of the fault. Vein density increases with proximity to the Idaho Fault with the most abundant veining occurring within 50 meters of the fault. The historical workings at the mine appear to target veins that are generally within 25 meters of the Idaho Fault.
The “Idaho Vein” is the name given to the quartz vein found in the immediate footwall of the Idaho Fault.
There have been discrepancies in identifying the different veins throughout the years, because the veins pinch, swell, and split along strike. Because of this, the correlating of veins between mining levels or even along strike is difficult.
6 - 9
Figure 6‑9 Vertical Cross-Section of Vein Location
6.4.3 Lithologic Control of Veins
The two main lithological controls for veining at the Golden Chest are:
·
Rheological: brittle-ductile contrast
·
Permeability and porosity
Most of the veins at the mine are preferentially found in areas of rheological contrast. Vein development is at its strongest when brittle units, like quartzite and blocky siltite, are in contact with the more ductile laminated siltite-argillite beds.
The permeability and porosity of the lithologic units at the Golden Chest is largely related to grain size. The fine-grained units act as aquitards to hydrothermal fluids while the coarser, more permeable units accommodate and hold the hydrothermal fluids. The quartzite units of the Prichard Formation are more permeable and porous than the surrounding siltite-argillites and are more susceptible to hosting widespread silica-flooding and silicification.
At the mine, the hanging wall to the Idaho Fault is mainly composed of thinly laminated siltite-argillite, with almost no quartzite beds, and these rocks are not as susceptible to silicification. However, the footwall lithologies of the Idaho Fault are primarily light grey, fine-grained quartzites and blocky siltites and these units are very susceptible to pervasive silicification.
6 - 10
6.4.4 Vein Mineralization
Gold mineralization at the Golden Chest is mostly associated with the sulfide minerals pyrite, galena, sphalerite, and chalcopyrite. Less commonly, gold can be found adjacent to arsenopyrite or scheelite. Both the mineralogy of ore and gangue are shown below.
Commonly, native gold is seen as intergrowths associated with pyrite, galena, sphalerite, and chalcopyrite. Gold mineralization occurs along the grain boundaries or inside clusters of these sulfides (Figure 6-10).
Figure 6‑10 Gold-Sphalerite-Galena-Pyrite-Quartz Vein from the 941 Level
Five petrographic studies have been conducted on vein samples from the Golden Chest Mine. The vein samples in each study were from different locations and do not show the same features. Hausen (1987) was contracted by Newmont to examine some samples of banded quartz vein material. He concluded the sulfides and quartz were epigenetic, or the mineralization is of a later age than the enclosing rocks.
Twenty-two years later, Gammons (2009) concluded the gold mineralization was late and associated with galena and chalcopyrite, but not sphalerite. Gammons determined the ore minerals as pyrite, galena, sphalerite (with chalcopyrite rims), chalcopyrite, and gold, in order of decreasing abundance. Additionally, he noted that most of the gold grains are in the 50 micron size range, and should be easy to mill or leach since they mostly occur on cracks in pyrite.
A petrographic analysis done by Ross (2010) determined the vein material at the Golden Chest is well-banded due to a combination of multi-phase mineralogical and tectonic layering. She described the banded vein quartz mineralogy as consisting of white to pale grey semi-translucent quartz, with dark septa of altered wall rock and thin sulfide-rich bands. The tectonic layering was described as hairline slip surfaces and stylolitic bands of pyrite and phyllosilicates.
6 - 11
Juniper Mining Company also conducted a mineralogical investigation as part of their metallurgical testing. The study showed the gold to be mostly found in association with pyrite and galena and the majority of gold grain sizes are in the 2 to 10 micron range.
Brown (2019) noted that the gold grains vary in size (< 1 to 100 µm), but typically were easy to identify in polished sections (Brown, 2019). He also saw gold having a strong correlation with galena, with the galena and gold often found along fractures and cracks cutting pyrite and milky quartz. Brown also noted gold occurring in grains by itself or with chalcopyrite.
Scheelite
Scheelite is found in many areas of the mine and the Golden Chest was a producer of tungsten during World War I. Frequently scheelite can be found with gold as a common subordinate mineral in orogenic gold systems. At the Golden Chest, scheelite is typically found in relatively pure masses within quartz veins.
6.4.5 Wall Rock Alteration
The wall rocks at the Golden Chest display weak alteration, which is usually confined to the area proximal to the gold-quartz veins. The alteration is in part dictated by the permeability/porosity of the lithologies. Adjacent to the gold-bearing quartz veins, chlorite/biotite, ankerite, sericite, potassium feldspar and silicic hydrothermal alteration minerals were the alteration minerals noted by Brown (2019). Barren pyrite also occurs in this alteration package. Earthy hematite has also been observed.
Generally, the hanging wall rocks of the Idaho Fault display a lack of widespread alteration, due to the tight impermeable mineralogy of the siltite-argillite units. In most cases, hanging wall alteration is chloritic and is localized within 10 meters (33 feet) of Idaho Fault or the veins.
Footwall rocks, on the other hand, can display three types of alteration: sericitic, chloritic and silicification. Alteration within the footwall can be widespread and is related to rock permeability and porosity. Areas containing quartzite lithologies are particularly susceptible, and are often subject to pervasive, passive silica flooding.
The intrusive rocks may show substantial argillic and sericite alteration, especially near faults. Some propylitic alteration has been noted, characterized by veinlets of epidote in the monzonite.
6.5 Deposit Type
The Golden Chest deposit is recognized as an “intrusive related” orogenic gold-quartz vein system by IDR geologists. However, recently there has been the suggestion that the Golden Chest deposit type could be a Reduced Intrusion-Related Gold System (RIRGS). The RIRGS deposit classification is already mired in confusion over nomenclature. It should be remembered that each ore deposit has its own specific and unique characteristics and not all deposits exhibit all characteristics of any particular classification. Deposit models are sets of guidelines, not absolute parameters. No one model will describe multiple deposits, one model describes one deposit. That being said, there is considerable overlap between the two deposit model types and the Golden Chest deposit has characteristics of both orogenic and RIRGS model types. This report will continue to use the orogenic deposit classification for the Golden Chest.
6 - 12
6.5.1 Orogenic
Before 1998, the term mesothermal was used for orogenic gold-quartz vein systems. Other synonyms for this type of vein are shear-hosted lode gold, low-sulfide gold-quartz veins and California Mother Lode veins. These “mesothermal” or orogenic deposits are associated with regionally metamorphosed terranes of all ages. Some of the largest gold deposits in the world are associated with orogenic vein systems. World class orebodies are generally 2 to 10 kilometers (km) long, 1 km wide, and are mined down-dip to depths of 2 to 3 km. This deposit type is responsible for a significant portion of the world’s gold production.
Orogenic vein deposits usually form within fault systems produced by regional compression or transpression (strike-slip movement). These compressional events are often associated with the collision, docking and subduction of exotic terranes. The majority of orogenic gold deposits are located within second- and third-order structures near first-order, deep-crustal fault zones. Ore forms as vein fill along second- and third-order shears and fault structures. Fluid migration along these fault structures is driven by episodes of major pressure fluctuations during seismic events. Gold is usually deposited at crustal levels within and near the brittle-ductile transition zone at depths of 6-12 kilometers, pressures between 1 to 3 kilobars and temperatures from 200° to 400° Celsius.
6.5.2 Age and Genesis
The genesis of the gold mineralization at the Golden Chest is interpreted to be related to the movement of mineralizing fluids, derived from cooling plutons, up shear zones. Hershey (1916) also believed that gold mineralization was related to the intrusive events, while the Ag-Pb-Zn mineralization was remobilized and leached from the Prichard Formation.
The North America Cordillera gold veins are often post-Middle Jurassic and appear to form immediately after accretion of oceanic terranes to the continental margin. The Golden Chest may be related to similar gold vein systems in British Columbia where deposits are mainly Middle Jurassic, ~ 165-170 Ma and Late Cretaceous ~ 95 Ma.
Mineralization age estimates are debatable, but it is possible that there was more than one gold mineralizing event. This Report suggests an age of 94 Ma for the gold mineralizing event at the Golden Chest. This age estimate is based on cross-cutting relationships with the quartz monzonite intrusive and coincides with the end of the Murray Stock emplacement and predates the Idaho Batholith activity.
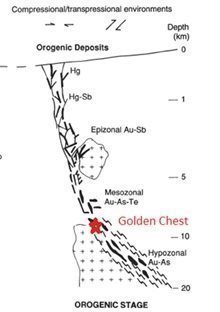
Intrusive-related orogenic systems are characterized by intrusive rocks emplaced along a fault structure. Figure 6-11 below, displays the position of the Golden Chest Mine in relation to the intrusive and the Idaho Fault. In the case of the Golden Chest, the gold mineralization is interpreted to be primary mineralization resulting from the felsic igneous intrusive. The Thompson Pass Fault is considered to represent the first-order deep crustal fault with the Idaho Fault being a second-order fault. This association is indicative of intrusive related orogenic systems because the first-order fault provides the deep plumbing, and the second-order faults provide the extensional setting.
6 - 13
Other similarities between intrusive related orogenic deposits and the Golden Chest Mine:
1) Precambrian turbidite host rocks
2) compressional geologic environments with reverse fault movement;
3) strong structural control
4) epigenetic banded veins
5) quartz-dominant vein system with ≤ 3-5% sulfide minerals
6) a general lack of widespread alteration
7) continuity at depth
Figure 6‑11 Intrusive Related Orogenic Model (modified after Groves et al. 1998)
6 - 14
7.0 EXPLORATION
For the year 2022, the primary form of exploration work completed on the property was diamond core drilling.
Figure 7‑1 Planview of Golden Chest Drill Traces
7 - 1
7.1 Drilling
7.1.1 Vertical Continuity
In 2022, 32 core holes, totaling 6,353 m, were drilled from the surface. The geologic targets for the drilling were the Klondike, Paymaster, and Skookum mineral regions at the Golden Chest mine as well as some of the East-West fault structures immediately northwest of Murray. Mineral Resources have been calculated for the Klondike, Paymaster, and Skookum zones using information from this drilling in 2022. Mineral Reserves have been calculated in the Skookum Zone. More information on Resources and Reserves can be found in sections 11 and 12.
The drilling was carried out by IDR’s in-house drill rig using a Hagby 1000 machine, and a contractor, Ruen Drilling, of Clark Fork, Idaho, using a Boart Longyear LF70 and LF90 drills. Core sizes drilled were NQ2 (5.08 cm) and HQ (6.36 cm). Drilling was fanned from prepared drill pads.
All holes are cemented from the bottom of the hole to 30 m above any important mineralized zones. Above the cement, the holes are grouted.
The drillers place the core in waxed cardboard boxes which are then stacked on pallets and strapped down prior to transport, then taken by either drillers or geologic staff, to the logging facility, which is located near the mine offices.
Upon receipt of the core at the logging facility, the boxes are laid out in order on the benches. They are then examined to ensure correct block meterages and core orientation. Zones of core loss are noted, and geotechnical logging is conducted. This includes measurement of recovery and rock quality designation (RQD).
Logging is conducted by IDR geologists. Data is digitally captured on notebook computers using Microsoft Excel.
The core is then logged for lithology and mineralogy, as well as sedimentary structures, veins, faults, and other structural features. Following this, a third logging pass is made noting type, style, and intensity of alteration. During the logging process, features of note are marked with colored pencil so as to be visible in the core photos.
The core is then wetted and photographed using a camera and lighting which provides uniform digital images. In addition to the notations on the core for geological information, the sample boundaries and numbers are also marked to allow for easier validation of the assay results using the core photos.
7.1.2 Drill Hole Surveys
Hole locations and orientations are marked for the drillers by the supervising geologist. Once the drill is on site and ready to begin drilling, a double check of the rig orientation is made by the supervising geologist. The hole is surveyed using a Flexit Single-Shot downhole survey tool. The first measurement is made at 30 m depth and every 30 m increment in depth as the hole is drilled.
The Flexit Single-shot azimuth measurements are based on magnetics, and susceptible to interference from steel objects. Taking a reading 30 m down the hole reduces the chance that the instrument will be influenced by any iron objects on or near surface at the drill site. The Single-shot instrument also records the magnetic field strength which is used to derive average field strength for help in assessing individual orientation readings. If an obviously spurious measurement is recorded, it is discarded and replaced with a second instrument survey reading collected at the same depth.
7 - 2
The survey data is recorded on paper and forwarded to the supervising geologist for entry into Microsoft Excel software. The surveyed holes are checked on screen using Seequent Leapfrog or Maptek Vulcan software to confirm that they were oriented as planned and in the correct location.
The hole collar locations are picked up by the mine surveyors using a RTK iGAGE-8 base and rover GPS. This is to provide a means for gauging the accuracy of the downhole surveys, and to note any general trends in hole deviation.
7.1.3 Drill Hole Sampling
On completion of the logging, the core is marked for sampling. Samples range in length from a minimum of 0.1 m to a maximum of 1.6 m with breaks made based on changes in estimated grade or mineralization style or lithological changes. Tags are placed in the boxes for each sample.
The core marked for sampling is cut in half longitudinally with a standard wet tile saw. The cut pieces are placed back in the core box in their original location and orientation.
Sample tag books are filled out with hole ID, location, from and to information, and a tag is placed in the sample bag. The sampled intervals are recorded in the Microsoft Excel core log and then checked using a validation routine in Seequent Leapfrog or Maptek Vulcan software to confirm that there are no overlaps or accidental gaps. Approximately 1200 drill core samples were collected.
Assay Quality Assurance/Quality Control (QA/QC) samples consisting of either a blank or standard inserted into the sample sequence every 10 samples. These are also recorded in the database. The lab, American Analytical Services, Inc., Osburn, Idaho, also conducts internal QA/QC involving duplicate pulps and rejects.
Samples are collected by taking one half of the cut core and placing it into polyester bags which are then put into a vehicle and driven by an IDR employee to American Analytical Services, Inc., Osburn, Idaho. The shipping list is generated in Microsoft Excel and placed with the shipment along with a lab-required Chain of Custody form.
In the QP’s opinion, the drilling, core handling, logging, and sampling at Golden Chest is being conducted according to common industry practice, in a manner appropriate for the deposit type and mineralization style.
7.3 Hydrogeology Data
Hydrogeology data is not currently collected from the Golden Chest drill holes.
7 - 3
8.0 SAMPLE PREPARATION, ANALYSES, AND SECURITY
8.1 Laboratory Accreditation and Certification
The laboratory used by IDR for sample preparation and analyses is:
American Analytical Services, Inc.,
59148 Silver Valley Rd,
Osburn, ID 83849
+1 (208) 752-1034
American Analytical is ISO 17025 Certified for Mineral and Ore Chemical Testing. Fire assaying is the only method used to quantify gold in core samples and round samples. Occasionally Atomic Absorptions (AA) is use for multi-element analysis.
American Analytical (AAS) is independent of the parties involved in the Golden Chest Mine.
8.2 Sample Quality Assurance and Quality Control (QA/QC)
IDR’s QA/QC program has been in place since the GCLCC joint venture in 2011. The QA/QC program consists of inserting blanks and commercially certified standards into the sample stream. A blank or a standard is inserted into the sample sequence at least every 10 samples. All standards are commercially certified and have been prepared in advance by accredited labs.
8.2.1 Blanks
The QP’s reviewed the results of blank assay and only 2 of 241 samples returned an assay greater than the detection limit for fire assay, < 0.060 gpt gold. These are acceptable results.
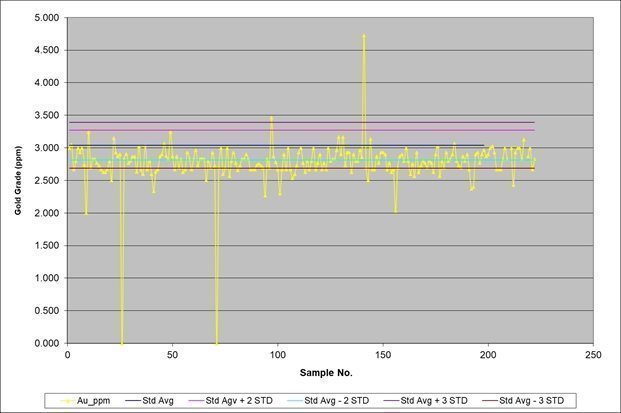
8.2.2 Standard - 3 gpt
A review of the assay results from the 3 gpt gold standard was conducted by the QP’s. The results are presented below in Figure 8-1.
8 - 4
Figure 8‑1 Drill Sampling 3 gpt Standard QA/QC Tracking
A review of the 3 gpt standard shows an assay bias to the low side as 27.5% of the assays are below three standard deviations (2.69 gpt) and only 0.92% of the assays exceed three standard deviations (3.39 gpt). The average assay for the 3 gpt standard is 2.80 gpt which is right at minus two standard deviations.
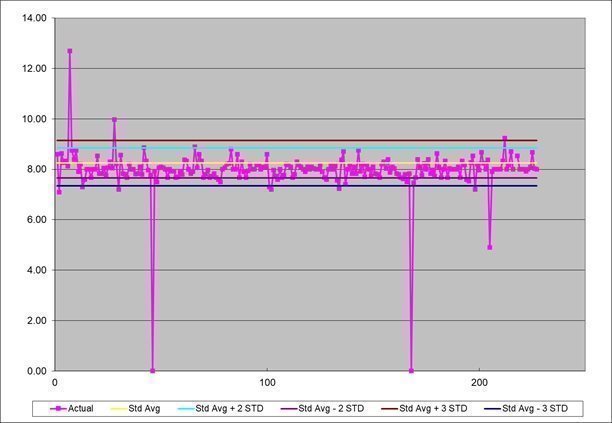
8.2.3 Standard - 8 gpt
A review of the assay results from the 8 gpt gold standard was conducted by the QP’s. The results are presented below.
The assay results for the 8 gpt standard show good dispersion around the mean with only 13 of 226 results (5.75%) outside of three standard deviations. These are acceptable results.
8.3 Sample Preparation
Once the geologist has completed their detailed logging they delineate sample intervals, and the core technicians saw the core longitudinally in half with a diamond blade saw, cleaning the blade between sample intervals. The right half of the core is placed in a sample bag. A tag with a unique sample identification (ID) number is placed inside each sample bag before it is sealed. This sample ID number is also written on the outside of the sample bag. This same sample ID is tagged into the core box at the respective interval and the remaining core half is reserved in the core box for future reference. Generally, samples of 1 m in length are taken; however, in areas of particular interest, sample size can be reduced as low as 0.1 m. In zones with anticipated weak mineralization the sample interval can be extended to the maximum distance between run blocks (1.6m).
8.4 Sample Analysis
For all the samples processed by AAS on behalf of GCLLC/IDR, the following methods were used to obtain a fire assay for gold. Samples received at the American Analytical are sorted and coded. They are then placed in the sample drying room and dried at 60°C. After drying, samples are crushed and split in the sample preparation room. After splitting, samples (30 grams each) are sent to the fire assay area and numbered in order. The sample is carefully mixed with the necessary reagents, dominantly litharge, in a fire clay crucible. The mixture is then heated to 760°C for 20 minutes, and finished at temperature 1,038°C, with the entire fusion process lasting sixty minutes. The crucibles are then removed from the assay furnace and the molten slag (lighter material) is carefully poured from the crucible into a mold, leaving a lead button at the base of the mold. The lead button is then placed in a preheated cupel which absorbs the lead when cupelled at 950°C to recover the doré bead containing both gold and silver. The entire doré bead is placed in nitric acid where the silver goes into solution and the gold remains in the bottom of the cup. The gold bead is then weighed to the thousandth of milligram accuracy on a micro-balance.
8 - 6
8.5 Security
All drill samples are collected from the rig daily by Mine staff and transported to the locked and secure Mine Office/Core Shed building. Sample security has relied upon the fact that the samples were always attended or locked in appropriate sample storage areas. Samples remain within the custody of staff up to the moment the samples are delivered to the laboratory at which time AAS assumes custody. Chain of custody procedures include filling out sample submittal forms that are sent to the laboratory with sample shipments to make certain that all samples are received by the laboratory.
All drill core is stored in locked and secure facilities, either the Mine Office/Core Shed building (Figure 8-3) or in locked Connex containers.
Figure 8‑3 Mine Office/Core Shed Building
8.6 QP Comments on Sample Collection, Preparation, QA/QC, Analysis and Security
The sampling methods are acceptable, meet industry standard practices, and are adequate for mineral resource and mineral reserve estimation and mine planning purposes, based on the following:
·
Sampling was conducted by appropriately qualified personnel under direct supervision of appropriately qualified geologists.
·
Sample collection procedures used meet industry best practices.
·
Sample preparation procedures meet industry best practices.
·
QA/QC results produce acceptable results. However, the low bias in the 3 gpt standard would tend to underestimate gold content. The 3 gpt data should be investigated in consultation with the laboratory, and another source of standard material should be found.
·
Security procedures are consistent with industry standards.
8 - 7
9.0 DATA VERIFICATION
9.1 Database Procedures
Drilling, chip sampling, and round sampling data are captured and stored using Maptek’s Vulcan software. Photographic information is stored in drillhole specific folders on the IDR’s mine server which is backed up with a physical copy and stored at a secure location periodically. Drillhole logs are completed using Microsoft Excel and are only accessible by mine technical staff and timestamped at the last time of change. Geologic interpretation and solid modeling are accomplished using Leapfrog. Survey volumes, block modeling, and estimation of Mineral Reserves is accomplished using Maptek’s Vulcan.
On completion of a downhole survey, the data is input into Maptek’s Vulcan and reviewed in 3D on screen to check for major inconsistencies. On the fly dip and azimuth information is available to the exploration geologists at the drill rig to compare to previous surveys. If a dip and azimuth measurement is in question the survey at the prescribed hole depth will be taken again.
Core assay results are sent from the lab as PDF and comma-delimited (CSV) files. These values are input into the master drill log completed by each core logging geologist and checked by engineering staff before input into the drill hole database.
As the Golden Chest is an orogenic gold system there is a visual difference between the mineralized quartz and wall rock. The core photos are checked against assays that are suspect to verify mineralized zones. The Idaho Vein intercepts can usually be planned to within one to two meters using three-dimensional vein solids.
Once data are checked against core photos and input into Vulcan’s Maptek, a readout of missing and overlapping intervals can be checked for inconsistencies in the drill hole data input by core logging geologists.
Data is stored at the mine site and backed up to a separate server stored at the corporate office quarterly.
9.2 Validation Procedures
For the preparation of this report 20% of the drill hole logs completed in 2021 were checked for inaccuracies. Assay values in the Vulcan database were checked against the geologist’s core logs and then again against the assay sheets from the lab. No issues were found comparing the Vulcan database to geologist’s logs, and then again to laboratory forms. Of the 6 holes (21-183,185,193,197,202, and 205) totaling 302 assays 13 non-detect close out samples were found to be unentered into the Vulcan database. These samples verify that the sampled interval is “closed out” by an assayed non-detect gold value, but do not influence composite evaluation, as a missing or unsampled length is characterized as zero grade when compositing. These were corrected prior to the writing of this 2022 report. No issues with assay entry were found in 2022 holes.
Checking Vulcan for overlapping sample intervals yielded no overlapping portions of the drill hole database.
9- 8
The visual inspection of vein wireframes and drill hole in three-dimensions yielded similar results. Surveyed mining voids were captured by drill hole traces. Some drill holes have been surveyed by the underground surveying crew in stopes. The drill hole trace and underground survey points usually align within one to two meters. One note is that data taken by Juniper Mining Company (JMC) in the form of round samples had to be corrected for an inappropriate coordinate system. JMC created a local mine grid inadvertently by truncating Northings and Eastings to exclude the ten-thousands place. This created a mine grid not comparable to the UTM coordinates used by IDR and caused a twisting effect around the arbitrary origin. A correction was applied to JMC data to account for the inappropriate flattening of a UTM zone by truncation.
After evaluating the sampling database for length distributions a few outliers were evaluated for further investigation. A 10 m sample interval was found in a 2011 hole. This was evaluated and found that it was a mis-typed number. The interval was in a long section of continuous sampling and was outside the vein solids and had no impact on resource or reserve grade. The next 4 largest sample intervals were evaluated for validity and it was found that they were in regions with poor recovery and the only option the geology team had was to sample between run blocks. These were relatively short sections of approximately 4 meters. They were areas outside of the vein shapes and did not impact the estimation. Small sampling lengths were evaluated for validity as well. The current standard at IDR is to sample no less than 0.1 m. The majority of the samples that were less than 0.1 m were taken prior to this standard. One sample from the 2022 database was smaller than the 0.1 m standard, but was a distinct bed of interest and was sampled as such.
9.2.1 Micon Historic Database Validation
Micon carried out data verification as a part of its 2012 NI 43-101 resource estimation at the Golden Chest. Micon re-analyzed sample pulps from 6 historical holes. New assays showed 99% correlation with previous assays. Micon’s database validation consisted of the following steps:
·
Checking for any non-conforming assay information such as duplicate samples and missing sample numbers.
·
Verifying collar elevations against survey information for each drill hole.
·
Verifying collar coordinates against survey information for each drill hole.
·
Verifying the dip and azimuth against survey information for each drill hole.
·
Comparing the database assays and intervals against the original assay certificates and drill logs.
Micon’s comments were, “On the whole the database was found to be in good shape. A few minor adjustments to drill hole collar elevations were made where road cuttings had reduced the elevations by about 2 to 3 m.” Micon’s drillhole database validation exercise covered holes drilled from 2004 through 2012. These holes are a part of the current reserve. Micon’s validation is taken as another indicator that the drill hole database is well managed and validated acceptably.
9.3 Validation Limitations and QP Comments
In the QP’s opinion the validation exercises undertaken are sufficient to justify the current Resources and Reserves at the Golden Chest by IDR. There is no evidence to date that suggests an issue with the practices in database management at the Golden Chest. The databases are managed in a secure area using modern, commonly used software by trained staff. The staff are experienced in the nuances of narrow vein mining and treat the model with their experience in mind. In the QP’s opinion the database is properly maintained and appropriate for use in the estimation of Resources and Reserves.
9- 9
10.0 MINERAL PROCESSING AND METALLURGICAL TESTING
The New Jersey Mill located 3 km east of Kellogg, Idaho has processed material from the Golden Chest since 2017 from both open pit and underground sources. See Figure 10-1. The New Jersey Mill originally started as 100 tpd flotation plant but was expanded to a nameplate capacity of 360 tpd in 2012. For the purposes of this section, the processing of Golden Chest material during the 100 tpd era will be treated as metallurgical testing. A laboratory test program using drill core from the Golden Chest to evaluate gravity, flotation, and cyanidation methods for the recovery of gold is also discussed.
Figure 10‑1 Aerial View of New Jersey Mill
10.1 New Jersey Mill 100 TPD Metallurgical Testing
During the period from 2005 through 2009, IDR processed just over 8,300 tonnes of material grading 6.9 gpt gold and achieved a gold recovery of 94%. A flowsheet of the 100 tpd mill is shown below in Figure 10-2.
In general, the process included a crushing circuit, a grinding circuit, a flotation circuit, and a tailings disposal circuit. A bulk sulfide concentrate was made using rougher flotation cells followed by a single stage of cleaner cells. A neutral pH was maintained in the flotation circuit. Concentrate grades ranged from 100 gpt to 400 gpt gold depending upon the gold grade of the feed. Concentrates were sold to smelters through a broker and sold directly to Nevada Gold Mines Goldstrike facility in Carlin, Nevada.
10 - 1
Figure 10‑2 New Jersey Mill 100 TPD Flowsheet
The Golden Chest material processed during this time was sourced from underground mining of veins in the Klondike Shoot area, located in the northern portion of the mine. Gold mineralization was associated with structurally controlled faults, quartz veins and silica-flooding. Visible gold was relatively rare and gold mineralization was associated with pyrite, galena, chalcopyrite, and sphalerite. The mineralization had relatively low levels of sulfides, approximately 1% to 5%, and the ore processed was reasonably representative of the mineral deposit.
Deleterious elements in the concentrate were below smelter penalty levels, with arsenic quantities at 1,000 ppm, while lead and zinc were 2,000 ppm each. Iron and sulfur were the primary components of the concentrate at 33% and 38%, respectively. The concentrate is amenable to cyanide leaching.
The Company operated a Concentrate Leach Plant (CLP) and leached total of 78 tonnes (t) of Golden Chest flotation concentrates using an agitated tank leach followed by electrowinning. The head grade of the concentrate was 122 gpt Au and a gold recovery of 86.6% was achieved in the CLP. Low recovery and long leaching times were due to poor agitation in the leach tanks during this testing period. The Company completed a 6-tonne batch test leaching Golden Chest concentrate in 2016 with increased agitation power which resulted in 95% gold recovery in 72 hours.
10.2 Resource Development Inc. Metallurgical Testing
Resource Development Inc. (RDI) of Wheat Ridge, Colorado conducted preliminary metallurgical test work on core sample splits from the confirmation drilling in the Skookum Shoot in 2014. The mineralogy of the material from the Skookum Shoot is representative of the typical mineralized material at the Golden Chest. RDI’s program consisted of gravity, flotation, and cyanidation tests.
10 - 2
RDI completed three gravity concentration tests, using 1 kg of material per test. Each test consisted of a different grind size: 48 mesh, 65 mesh and 100 mesh. Overall gold recovery ranged from 31% to 37% with final concentrate grades ranging from 277 to 323 gpt Au.
RDI completed seven flotation tests, using 1 kg of material per test. The tests consisted of rougher flotation only with no cleaner flotation tests. The samples were ground in a rod mill at 50% solids to produce three different grind sizes (P80): 65, 100 and 150 mesh. Flotation reagents and retention times were also varied as part of the testing. Results of the flotation tests are presented in the table below.
Table 10‑1 RDI Flotation Test Results
The highest recovery test consisted of a 9-minute flotation time, the finest grind (150 mesh) and used the reagent Aeroflot 208.
RDI also completed three cyanide bottle roll tests on whole ore, using 1 kg of whole ore from core sample rejects. Each sample was ground in a laboratory rod mill at 40% solids and the target grind size was varied in each test. The three grind sizes (P80) were 65 mesh, 100 mesh and 200 mesh. The leach time was fixed at 72 hours and solution samples were taken for gold assay at 6, 24, 48 and 72 hours.
Gold recovery ranged from 85.9% to 94.4% in the three tests with the 100 mesh test achieving the best recovery in 48 hours and the lowest recovery was the 200 mesh grind. Cyanide consumption ranged from 0.30 kg/tonne to 1.57 kg/tonne with the finest grind of 200 mesh consuming the most cyanide. RDI reported the Golden Chest material was, “very amenable to cyanide leaching” and that a nominal 100 mesh grind was ideal.
10 - 3
11.0 MINERAL RESOURCE ESTIMATES
11.1 Summary
Table 11-1 lists the Mineral Resource estimate for the Golden Chest mine. Mineral Resources have been classified in accordance with the definitions for Mineral Resources in S-K 1300. Open pit optimization was carried out for the area of the Skookum Zone where mineralization is near surface and the open pit resources are reported in Table 11-2. The Skookum Zone open pit resources are included in the summary table 11-1 and are split out in 11-2 to illustrate this potential surface resource on its own.
Table 11‑1 2022 Golden Chest Mineral Resources
Measured
Zone
Tonnage
Au Grams
Au gpt
Au Troy Oz.
Paymaster
40,569
193,928
4.78
6,235
Skookum
281,750
1,315,924
4.67
42,308
Klondike
81,405
336,099
4.13
10,806
Combined
403,724
1,845,950
4.57
59,349
Indicated
Zone
Tonnage
Au Grams
Au gpt
Au Troy Oz.
Paymaster
190,398
898,911
4.72
28,901
Skookum
350,200
1,453,188
4.15
46,721
Klondike
151,426
635,249
4.20
20,424
Combined
692,024
2,987,347
4.32
96,045
Total Measured + Indicated
Zone
Tonnage
Au Grams
Au gpt
Au Troy Oz.
M+I
1,095,748
4,833,298
4.41
155,394
Inferred
Zone
Tonnage
Au Grams
Au gpt
Au Troy Oz.
Paymaster
322,352
1,211,701
3.76
38,957
Skookum
163,548
665,134
4.07
21,385
Klondike
267,602
718,667
2.69
23,106
Combined
753,502
2,595,502
3.44
83,447
11 -1
Skookum OP Resource
Tonnes
Au Grams
Au gpt
Au Troy Oz
Measured
70,477
245,779
3.49
7,902
Indicated
29,121
98,190
3.37
3,157
Inferred
18,102
71,907
3.97
2,312
M+I
99,598
343,969
3.45
11,059
Total
117,700
415,876
3.53
13,371
Table 11‑2 Skookum Open Pit Resource (Included in the overall resource reported in table 11-1)
Notes:
1. Classification of Mineral Resources is in accordance with the S-K classification system.
2. Mineral Resources were estimated by IDR staff and reviewed and accepted by the QP.
3. Mineral Resources are exclusives of Mineral Reserves in the Skookum Zone, whereas there are no Mineral Reserves currently at the Paymaster or Klondike Zones.
4. Mineral Resources that are not Mineral Reserves do not have demonstrated economic viability.
5. Revenues produced at the Golden Chest are subject to a 2% NSR Royalty.
6. Bulk density was calculated based on laboratory testing of representative vein samples and applied to the vein shapes.
7. Mineral Resources are estimated at 2 grams per tonne (PPM) for each of the zones underground the Skookum Zone Surface Portion of the resource was optimized using Vulcan pit optimizer with open pit mining costs from the operation and results in a surface resource with a cut-off grade of 1.4 gpt.
8. Cutoff values used were calculated using the three year trailing average gold price of $1800 USD/Troy Oz.
9. Numbers may not add due to rounding.
The QP is of the opinion that with consideration of the recommendations summarized in Sections 1.0 and 23.0 of this TRS, any issues relating to all relevant technical and economic factors likely to influence the prospect of economic extraction can be resolved with further work.
11.2 Estimation of Veins at the Golden Chest
11.2.1 General Methodology
Three areas of the Golden Chest property were modelled for resources. These areas from north to south on the property are the Klondike, Skookum, and Paymaster areas. Individual models were created for each of area to aid with vein solid creation and to honor interpretation of geologic vein continuity along strike across the property. Six individual veins were modeled and two other domains, not associated with veins were modelled. Each of these individual domains are listed below in table 11-3.
11 -2
Table 11‑3 Golden Chest 2022 Resource Model Domains
Domains included in the Golden Chest 2022 Resource Model
Domain Name
Block Model/Area
Jumbo Vein
Paymaster
Idaho Vein
Paymaster
H Vein
Skookum
Jumbo Vein
Skookum
Idaho Vein
Skookum
Idaho Vein Footwall (Unit G Quartzite)
Skookum
Popcorn Vein
Klondike
Klondike Hangingwall
Klondike
Grades were assigned to blocks in each individual model by inverse distance squared (ID2) weighting. Blocks within the vein domains were constrained by vein wireframe solids. Vein solids were forced to a 3-meter minimum horizontal width and compositing was completed within this shape using a run-length compositing method. This method accounts for mining widths and dilution associated with a minimum width by including minimum projected mining widths as the basis for compositing, and appropriately diluting smaller intervals to projected mining widths. Wireframes were completed using Leapfrog Geo. Idaho Strategic geologists coded each vein intercept in the drillhole database and solids were created using the coded database. Wireframes were then exported to Vulcan for grade estimation. Leapfrog and Vulcan are both off-the-shelf mining software packages that are common to the mining industry.
Composite values are diluted to mining widths by the 3-meter minimum horizontal width vein envelope. The result is a diluted block model of 3-meter by 3-meter blocks that honors minimum mining widths.
The Mineral Resources reported here are derived from block model estimates as of December 31, 2022. Mineral Resources are reported exclusive of Mineral Reserves. Cutoff grade versus tonnage curves for each zone can be found in Appendix 3.
11.2.2 Resource Database
The Golden Chest drill-hole database consists of 338 diamond and RC drill holes. Of the 338 total holes 29 are RVC and 309 are core holes. All IDR collected round samples from mining were included in the resource estimate for the Skookum area. There are 1,051 round samples in the IDR resource for the Skookum area representing all mining completed from 2018 through 2022 by IDR. The round samples represent a diluted to mining width sample just as the composites from the drill hole database do. Round samples are placed in space by using the surveyed stopes to create a centerline beginning at the surveyed stope intersection. They are then composited to 3-meter lengths for input into the resource estimate. The cut-off date for the resource database was all core holes drilled in 2022 and round samples through December 31, 2022.
11 -3
Table 11‑4 Summary of Samples from the Golden Chest
Sample Type
Number of Samples
Average Sample Length (m)
Total Length (m)
Core Holes
14,220
1.3
43,000
RVC Holes
1,743
1.6
2,660
Round Samples
1,051
2.7
2,840
11.2.3 Geological Modelling
There are four distinct veins modelled at the Golden Chest. They are narrow structures generally striking between 5 degrees NNE and 30 degrees NNE. The dips are generally 45 degrees to the west with the exception being the H-Vein in the hangingwall of the Idaho Fault which dips 72-75 degrees to the west. Mineral Resources are reported for each of the four veins and two non-vein domains. Mineral Reserves are reported only for the Idaho Vein in the Skookum area of the Golden Chest.
Solid models for each of these veins was created using Leapfrog Geo and Vulcan was used for block modelling. The block model extents were selected to aid in modelling veins by their distance into the hangingwall or footwall of the Idaho Fault.
Figure 11‑1 All Vein Models 3D with Drill Traces Looking East
11.2.4 Exploratory Data Analysis
Core, RVC, and round samples from the Skookum were used for estimation. In the Klondike and Paymaster areas there is no production data, therefore RVC and core drilling samples were used exclusively in the Paymaster and Klondike areas.
11 -4
The figure below shows raw statistics and histogram for the Skookum Idaho vein domain, statistics and graphs for the other domains can be found in Appendix 1.
Figure 11‑2 Histogram and General Statistics of the Skookum Area Idaho Vein
Statistical analysis of each of the domains shows the typical lognormal, positively skewed distribution found with most precious metal deposits. The Idaho Vein in the Skookum area shows the smoothest of the vein distributions as it is the most heavily sampled.
11.2.5 Grade Capping
The raw data Cumulative Distribution Function (CDF) for the Idaho Vein flattens significantly after 40 ppm Au and this has been a historic capping number for the deposit, which is shown to still be reasonable. Because of the variety in sample lengths in the raw database it was decided not to cap until after grade estimation, where data was based at the same support, at 40 Au ppm. This was supported as well by mining experience in the Skookum where round sample maximums reached the upper 30 gpt range but rarely exceeded 40 gpt. Therefore, it was decided that a reasonable approach to grade capping was to cap blocks at 40 gpt after estimation as the block model honored minimum reasonable mining widths. After estimation, no blocks were capped and the maximums as well as general statistics of each block model can be found below in Figure 11-4.
11 -5
Figure 11‑3 CDF of the Raw Idaho Vein Samples in the Skookum area.
Figure 11‑4 General Statistics of each Zone’s Block Model Filtered by Blocks Estimated
11 -6
Figure 11‑5 General Statistics of All Idaho Strategic Round Samples
Figure 11‑6 CDF of Idaho Strategic Round Samples
11 -7
11.2.6 Compositing
Compositing is necessary to place all of the sampling information on the same level of support, i.e. lengths. Sample lengths in the Golden Chest database ranged from 0.3 to 10.64 meters. Although a minimum sample size protocol of 3 m below contacts of interest is in place, core loggers may break the 3 m of continuous sampling around areas of interest into smaller sections if different zones of interest are identified. The Cumulative Frequency chart below shows that approximately 99% of the samples fall between 0.1 m and 2 m as 0.1 m is the minimum length sample after minimum sampling protocols were established.
Figure 11‑7 Cumulative Frequency Chart of Sampling Lengths in the Golden Chest Database
11 -8
Figure 11‑8 Histogram of Sample Lengths for the Golden Chest Database
Veins at the Golden Chest are relatively narrow and vary in width along the dip and strike of the vein. Compositing was carried out using Vulcan’s geologic break function which breaks a run length composite along the hangingwall of the defined feature and a 3 m composite is formed. If the angle between the structure and the drill hole create a run length longer than 3 m, composites less than 1.5 m are appended onto the 3 m composite. Run lengths greater than 1.5 m and adjacent to a 3 m composite are added as an individual composite. If the shape and the drill hole intersect such that the run length is less than 3 m the entire width is taken as a composite. Narrow high-grade intercepts are avoided by forcing the vein shape to a 3 m minimum horizontal width and applying zero grade to all unsampled or zero recovery sections within the minimum width vein shape. Below is a histogram of the compositing lengths showing composite lengths generated. The resulting composites range in length from 0.2 m to 3.99 m with approximately 85% falling between 2.9 m and 3.0 m.
11 -9
Figure 11‑9 Histogram of Skookum area composite lengths for the Idaho Vein
11.2.7 Geostatistics
Search parameters for the estimation were derived through variogram analyses of each domain. It was generally found that at a range of 55 m to 60 m in each of the domains that the sill was reached. It was therefore decided to estimate the blocks in two passes which essentially resulted in estimating what would become Measured and Indicated resources first, and then to leave those blocks out of a second estimation pass with increased search radius to estimate inferred blocks. Each of the variograms showed generally the same ranges up-dip and along strike for each of the domains investigated. The width of the search ellipse was set at 6 m, or approximately two times the horizontal mining width to include samples in areas where the vein changed dip or strike significantly for a short period and then resumed the average dip and strike. The Nugget was estimated from downhole variograms. The results for the Idaho Vein experimental and model variograms are shown below. The remaining domain variograms can be found in Appendix 2. Each of the variograms is oriented in the plane of the vein and rotated to the plane of least variability within the domain along that plane. It was noted that in the majority of the vein domains the ellipsoid could be reasonably considered valid as a 50 m range around a given data point in the plane of the vein.
11 -10
Figure 11‑10 Skookum Zone Idaho Vein variogram model with pair counts. Major and minor axis illustrate ranges in the 55-60 meter range
11.2.8 Block Model Geometry
The Golden Chest Block Models were created in Maptek’s Vulcan software which is an off-the-shelf mining software. The model was not rotated, and three contiguous models were created to model each of the sub-parallel veins in the areas where the data was the densest and it was clear which structures were related to each other.
11 -11
Table 11‑5 Model Extents for each Zone in the Golden Chest Northings, Eastings, and Elevations are UTM NAD27 Z11 Coordinates
Paymaster Zone Model Extents
Start N
End N
5,274,351
5,274,870
Start E
End E
587,500
588,352
Start Z
End Z
525
1152
Skookum Zone Model Extents
Start N
End N
5,274,351
5,274,870
Start E
End E
587,500
588,352
Start Z
End Z
525
1152
Klondike Zone Model Extents
Start N
End N
5,274,870
5,275,212
Start E
End E
587,500
588,352
Start Z
End Z
525
1152
11 -12
Table 11‑6 Block Model Variables and Descriptions
Block Model Variables
Variable
Description
air
Value of 1 for blocks above topography, used in pit optimization
aniavgdist
Anisotropic average distance to samples used to estimate a block
anidist
Anisotropic distance to the closest sample used to estimate a block
auid2
ID2 estimated gold grade PPM (gpt)
awtavgdist
Anisotropic weighted average distance to samples
cartavgdist
Cartesian average distance to samples
cwtavgdist
Cartesian weighted average distance to samples
density
Rock density
dhnum
Number of drill holes used to estimate a block
indicated
Indicated category
inferred
Inferred category
klgg0-5
Processing scenarios for open pit optimization
measured
Measured category
pass1
Estimated on the first pass
pass2
Estimated on the second pass
passcount
Number of passes
pit22
Optimal pit at 2022 inputs
pit220-225
Nested pits at varying revenue factors (gold prices)
sampdist
Distance to the nearest sample
sampgrade
Grade of the nearest sample
volume
Volume of a block
xcentre
Easting of the block centroid
xlength
Length of a block in the Easting direction
xworld
Easting in world coordinates
ycentre
Northing of the block centroid
ylength
Length of a block in the Northing direction
yworld
Northing in world coordinates
zcentre
Elevation of the block centroid
zlength
Length of a block in the vertical direction
zworld
Elevation in world coordinates
11.2.9 Search and Interpolation Parameters
Gold grades are estimated into blocks using the Inverse Distance Squared weighting method (ID2). The grade interpolation was carried out in two passes of increasing search radius. Search ellipsoids are oriented in a best-fit method in the plane of each vein domain. In the footwall quartzite domain where broad zones of low-grade mineralization are more prevalent an isotropic search range was used with ranges taken from the variogram analysis. Search ellipsoid information can be found in Table 11-7.
11 -13
Table 11‑7 Search Ellipsoid parameters by zone.
Zone and Domain
Pass 1 Search Radius
Pass 2 Search Radius
Geometry
Skookum Idaho Vein
50m x 50m x 6m
150m x 150m x 6m
Best Fit in Vein Plane
Skookum Jumbo Vein
50m x 50m x 6m
150m x 150m x 6m
Best Fit in Vein Plane
Skookum H Vein
50m x 50m x 6m
150m x 150m x 6m
Best Fit in Vein Plane
Skookum Footwall
50m x 50m x 50m
N/A
Isotropic
Paymaster Idaho Vein
50m x 50m x 6m
150m x 150m x 6m
Best Fit in Vein Plane
Paymaster Jumbo Vein
50m x 50m x 6m
150m x 150m x 6m
Best Fit in Vein Plane
Klondike Popcorn Vein
50m x 50m x 6m
150m x 150m x 6m
Best Fit in Vein Plane
Klondike Hanginwall
25m x 25x x 3m
N/A
Best Fit in Stockwork Plane
For all vein domains the search parameters remained the same as supported by geostatistical analysis. Company engineers felt that this was a prudent approach by limiting the first pass to 50m radius and shortening the search radius in the Klondike Hangingwall where the drill spacing is not dense enough and more step-out drilling is necessary to evaluate the potential of the Klondike Hangingwall. The quartzite zone was modeled isotropically. Geologically the Skookum Zone quartzite seems to have been a permeable host for depositional fluids and wider low-grade zones can be seen “bleeding” into the footwall of the Skookum zone.
11 -14
Table 11‑8 Estimation Parameters
Zone and Domain
Pass
Min Samples
Max Samples
Max. Samples per Drillhole
Min. Drillhole
Max. Drillhole
Skookum Idaho Vein
1
2
5
2
2
10
Skookum Idaho Vein
2
2
6
2
2
10
Skookum Jumbo Vein
1
2
5
2
2
10
Skookum Jumbo Vein
2
2
6
2
2
10
Skookum H Vein
1
2
5
2
2
10
Skookum H Vein
2
2
6
2
2
10
Skookum Footwall
1
2
5
2
2
10
Paymaster Idaho Vein
1
2
5
2
2
10
Paymaster Idaho Vein
2
2
6
2
2
10
Paymaster Jumbo Vein
1
2
5
2
2
10
Paymaster Jumbo Vein
2
2
6
2
2
10
Klondike Popcorn Vein
1
2
5
2
2
10
Klondike Popcorn Vein
2
2
6
2
2
10
Klondike Hanginwall
1
2
5
2
2
10
The minimum number of drillholes constraint was used to estimate only those blocks which would fall into the Inferred category as the lowest confidence blocks. A majority of the Inferred blocks were estimated in Pass 2 while the vast majority of Measured and Indicated blocks were estimated in Pass 1. Only blocks whose centroid was in the wireframe of the domain were estimated. This resulted in some areas where the block model alignment and vein orientations didn’t line up having un-estimated blocks which were mostly in the volume but with centroids outside the boundary. This was relatively rare as the strike of the veins is generally near North, and seen as a conservative factor, where vein widths reach their minimum and blocks may be pinched out of the estimation. An area of future work would be to evaluate the effects of rotated block models which are aligned in the plane of the vein. Another method to investigate would be a sub-blocked model to fill in the resolution of the vein shape. These methods were considered less conservative for a first pass and were left for further work.
11 -15
11.2.10 Density
A rock density of 2.65 tonnes per meter cubed was used for the entire block model which was derived from samples taken over the life of the project by various geotechnical and geochemical laboratories.
11.2.11 Classification
SK-1300 Mineral Resources and Mineral Reserves must be classified according to the definitions of the Committee for Mineral Reserves International Reporting Standards (CRIRSCO). The definitions for Mineral Resources, Reserves, and their respective classifications are as follows.
1. Mineral Resource- A Mineral Resource is a concentration or occurrence of solid material of economic interest in or on the Earth’s crust in such form, grade or quality and quantity that there are reasonable prospects for eventual economic extraction. The location, quantity, grade or quality, continuity and other geological characteristics of a Mineral Resource are known, estimated or interpreted from specific geological evidence and knowledge, including sampling.
2. Measured Mineral Resource- A Measured Mineral Resource is that part of a Mineral Resource for which quantity, grade or quality, densities, shape, and physical characteristics are estimated with confidence sufficient to allow the application of Modifying Factors to support detailed mine planning and final evaluation of the economic viability of the deposit. Geological evidence is derived from detailed and reliable exploration, sampling and testing and is sufficient to confirm geological and grade or quality continuity between points of observation. A Measured Mineral Resource has a higher level of confidence than that applying to either an Indicated Mineral Resource or an Inferred Mineral Resource. It may be converted to a Proved Mineral Reserve or to a Probable Mineral Reserve.
3. Indicated Mineral Resource- An Indicated Mineral Resource is that part of a Mineral Resource for which quantity, grade or quality, densities, shape and physical characteristics are estimated with sufficient confidence to allow the application of Modifying Factors in sufficient detail to support mine planning and evaluation of the economic viability of the deposit. Geological evidence is derived from adequately detailed and reliable exploration, sampling and testing and is sufficient to assume geological and grade or quality continuity between points of observation. An Indicated Mineral Resource has a lower level of confidence than that applying to a Measured Mineral Resource and may only be converted to a Probable Mineral Reserve.
4. Inferred Mineral Resource- An Inferred Mineral Resource is that part of a Mineral Resource for which quantity and grade or quality are estimated on the basis of limited geological evidence and sampling. Geological evidence is sufficient to imply but not verify geological and grade or quality continuity. An Inferred Resource has a lower level of confidence than that applying to an Indicated Mineral Resource and must not be converted to a Mineral Reserve. It is reasonably expected that the majority of Inferred Mineral Resources could be upgraded to Indicated Mineral Resources with continued exploration.
Idaho Strategic personnel believe that by limiting the first pass radius to 50 m, which is based on the variogram range, and only estimating blocks where two drill holes are within the search radius, combined with limiting blocks to the created vein wireframes, the Golden Chest resource represents a conservative model which utilizes modern industry best practices to reach a reasonable estimate of resources at the Golden Chest. Golden Chest Resources are classified in the table below.
11 -16
Golden Chest Resource Classification
Measured
3 drillholes within 25 meters of the block used in the estimation
Indicated
2 drillholes within 50 meters of the block used in the estimation
Inferred
2 drillholes used in the estimation, distance to drill holes up to 150 meters
The resource classification is in line with historic classifications completed at the Golden Chest and is considered reasonable based on Idaho Strategic Resources mining experience. Isolated Islands of the resource that are Measured or Indicated were evaluated for downgrading. After a grade shell review they fell below the 2 gram per tonne cutoff the resource was based on and where therefore already excluded from the resource model.
11 -17
11.2.12 Cut-off Grade
Cut-off grades for the Golden Chest Resource were calculated using the 2022 mining costs at the Golden Chest for both underground and surface operations during the year 2022.
Surface Mining Cut-off
Variable
Value
Unit
Waste Mining
3.25
$/tonne
Ore Mining
4.15
$/tonne
Mill Haul Cost
13.9
$/ore tonne
Milling Cost
37.5
$/ore tonne
G&A
6
$/tonne
Metallurgical Recovery
85
%
Smelter Recovery (Payment)
89
%
Royalty
2
%
Gold Price
1800
$/troy ounce
In-Pit Cutoff (Mining Cost Sunk)
1.43
Au grams/tonne
PushBack Cutoff (Mining Decision)
1.92
Au grams/tonne
Underground Mining Cut-off
Variable
Value
Unit
Mining Cost *G&A included
75
$/tonne
Backfill Cost
45
$/tonne
Mill Haul Cost
13.9
$/ore tonne
Milling Cost
37.5
$/ore tonne
Metallurgical Recovery
93
%
Smelter Recovery (Payment
91
%
Royalty
2
%
Gold Price
1800
$/troy ounce
In-Stope Cutoff (Mining Cost Sunk)
2.03
Au grams/tonne
Go/No-Go (Mining Decision)
3.61
Au grams/tonne
Table 11‑10 Cutoff calculation Inputs and results
11.2.13 Validation
Block models were validated using the following methods:
·
Visual inspection of block model versus composites as a section view
·
Comparison of composite and block means and Q-Q plots
·
Swath plots (Drift Analysis)
11.2.13.1 Visual Inspection of Block Model vs. Composites
Visual inspection of the block model was carried out by cutting sections of the finalized model and geologic shapes and comparing block grades near to composite values and their respective values using a color scale. An example section is shown in the figure below.
11 -18
Figure 11‑12 Visual Validation Slice of the Paymaster Zone Idaho and Jumbo Veins
Visual validation showed reasonable agreement between composite values and blocks where the data was dense enough to project blocks.
11.2.13.2 Comparison of Composite and Block Means
Evaluation of composite mean grades versus block mean grades for each of the domains yields the expected result of generally lower grades in the blocks as they are smoothed by the estimation process. One thing noted is the generally large difference seen in the Skookum composites compared to Skookum Blocks. This is in part due to areas of the Skookum where holes that are waiting to be logged, or after a cursory look the Idaho Strategic geology department decided to prioritize other holes to be logged. Holes with surveys in the database that have yet to been logged are taken in the estimation as having 0.030 PPM grade, halfway between zero and detection limits of the assay lab. This would tend to shift the block mean down compared to the composite mean, as the unsampled composites are not considered in the mean as their composite value is -99 by default. The Skookum H vein shows a 38% potential over estimation of grade compared to composite mean. This 38% difference is not considered a fatal flaw as the difference between the two is less than 0.5 ppm. There are a fair number of H vein Skookum Zone intercepts that have high grade intercepts and their influence should be investigated in further estimations.
11 -19
Figure 11‑13 Comparison of Composite Means versus Block Means by Domain
11.2.13.3 Swath Plots (Drift Analysis)
Swath plots were created for each of the model domains to compare block model grades by location to composite grades. The ID2 estimation tends to “smooth” or potentially underestimate grade in some areas of the deposit. In other areas the block model smooths the lower composite grades at a location to slightly higher grades. The underestimation of block grades compared to composite values is viewed to be more prominent as the average distance that the block model curve is below the composite peaks is larger than the distance the block model curve is above the composite lows, see figure 11-14 below. This is supported generally by comparison of mean grades of composites and blocks. This is considered an area of further work and presents an opportunity for fine tuning the model. Another estimation technique such as Ordinary Kriging (OK) should be undertaken to evaluate its ability to improve the current estimation techniques.
Figure 11‑14 Swath Plot of Paymaster Jumbo Vein. Composites (Dark Blue) versus Blocks (Light Blue)
11 -20
Figure 11‑15 Swath Plot of Paymaster Idaho Vein. Composites (Dark Blue) versus Blocks (Light Blue)
Figure 11‑16 Swath Plot of Skookum Idaho Vein. Composites (Dark Blue) versus Blocks (Light Blue)
11 -21
Figure 11‑17 Swath Plot of Skookum Jumbo Vein. Composites (Dark Blue) versus Blocks (Light Blue)
Figure 11‑18 Swath Plot of Skookum H Vein. Composites (Dark Blue) versus Blocks (Light Blue)
11 -22
Figure 11‑19 Swath Plot of Skookum Footwall. Composites (Dark Blue) versus Blocks (Light Blue)
Figure 11‑20 Swath Plot of Klondike Popcorn Vein. Composites (Dark Blue) versus Blocks (Light Blue)
11 -23
Figure 11‑21 Swath Plot of Klondike Popcorn Vein. Composites (Dark Blue) versus Blocks (Light Blue)
The QP’s have reviewed the methodology used to calculate Mineral Resources and believe the Company’s estimate of Mineral Resources is acceptable and complies with SK-1300.
11 -24
12.0 MINERAL RESERVE ESTIMATES
12.1 Summary
The current Mineral Reserve estimates prepared by Idaho Strategic personnel and reviewed by the QP are reported as of December 31, 2022. Reserves are reported only for the Skookum area in the Idaho Vein domain. Exploration and pre-production studies will be carried out to evaluate the potential inclusion of other areas in the Mineral Reserve.
Table 12‑1 Golden Chest Underground Proven and Probable Reserves at December 31st, 2022
Proven
Level
Tonnes
Au PPM
Au Grams
Au Troy Oz
888
7,150
3.92
28,028
901
BZ
4,056
5.38
21,821
702
830 Through 782 Levels
20,833
4.32
90,065
2,896
Sum Proven
32,039
4.37
139,914
4,499
Probable
Level
Tonnes
Au PPM
Au Grams
Au Troy Oz
830 Through 782 Levels
21,715
5.26
114,298
3,675
Proven and Probable
Level
Tonnes
Au PPM
Au Grams
Au Troy Oz
All Levels
53,754
4.73
254,212
8,173
Notes:
1. Classification of Mineral Reserves is in accordance with S-K 1300 classification system.
2. Mineral Reserves were estimated by Idaho Strategic Resources and reviewed and accepted by the QP.
3. Mineral Reserves are 100% attributable to Idaho Strategic Resources.
4. Mineral Reserves are estimated at a cutoff of 2 Au PPM (grams/tonne).
5. Mineral Reserves are estimated using a 3-year trailing average gold price of $1800/troy ounce.
6. An average mining width of 3 m was used for the Reserves reporting.
7. The model was designed as fully diluted so block values report directly from the Resource Model
8. Numbers may not add due to rounding.
12.2 Conversion to Mineral Reserves
The mining method evaluated in this estimate is the Underhand Cut and Fill method. Minimum dimensions vary by stope and are discussed in more detail in section 12.
To accurately model projected mining grades within the reserve estimate, actual mine round samples are input into the model composites. The minimum block size for the reserve model represents the average mining width (3 m) to create a fully diluted block model that represents the grade of mining each block. The drill hole data is composited using a 3 m run length method to represent a minimum mining width and create a fully diluted model and including actual mining data.
12 - 1
Three-dimensional stope shapes are created using Maptek’s Vulcan software to estimate the tonnage of stopes using the designed profile, using a 3.6 gpt grade shell as design guidance. If an area of waste is included in a potential stope grade shell it is evaluated on a cost/benefit basis as whether to mine through it to reach higher grades or end the stope. The 3.6 gpt grade shell is chosen because that is the 2022 go/no-go cut-off (i.e., doesn’t have to be mined to reach higher grade material). Once a stope length has been determined, the decision to mine has been made, all material above the in-stope cut-off is considered ore. The in-stope cut-off for 2022 is 2.0 gpt and represents the situation where the material must be mined to reach higher grades and as such the mining cost is a sunk cost. Stope development (MAR, attack ramps, muck bays, sumps, etc) is designed by level to evaluate each sublevel’s ability to payback its share of the necessary development.
12.3 Cut-Off Grade
Two cut-off grades are used for stope planning, the go/no-go cut-off and the in-stope cut-off. The go/no-go cut-off represents any material that has the potential to be mined but does not have to be mined as part of the operational plan. The go/no-go cut-off is used for initial stope planning as any given stope or sublevel does not have to be mined and should only be mined if it is economic. The go/no-go cut-off is equation is presented in Equation 1.
Equation 1 go/no-go cut-off
Table 12‑2 Go/No-Go Cut-off Parameters
The backfill costs are included in the mining cost in Table 12-2. This formula yields a value of 3.61 gpt for the cut-off and was rounded down to 3.6 gpt for a more natural break.
The in-stope cut-off is used when material in a defined stope must be mined to reach higher grades. In this scenario the mining cost is considered sunk and is omitted from Equation 1 as the cost was incurred regardless of the ore/waste determination at the face. Evaluating equation 1 omitting mining cost yields a value of 2.03 gpt which was rounded to 2.0 gpt.
12 - 2
12.4 Dilution
Dilution is accounted for in the reserve blocks by compositing drill holes to 3 m run-lengths and including all round sampling in the reserve model. This method takes into account the minimum mining width and allows for an acceptable estimate of mining performance. Dilution is also checked operationally by periodically channel sampling only the vein in a heading and comparing it to the corresponding round sample. This method does not account for any vein pinching or swelling in the rock that was blasted in each round but shows a good correlation to theoretically calculated dilution values. Table 12-3 shows the calculated dilution and theoretical dilution for two planned stopes that were mined near the 2020 reserve. They show the impact that vein thickness has on any given cut and the ability of the mining crews to maintain minimum width and minimize dilution. The calculated values vary widely from cut to cut and with vein thickness as is to be expected but show a good correlation over the length weighted average thickness. Grade control geologists monitor the adherence to the planned dilution and offer support and guidance as needed when a stope is being mined.
Table 12‑3 Calculated Dilution vs. Average Theoretical Dilution
12.5 Extraction
The extraction rate for this mining method assumes 100% based on the fully diluted model, and the cutting of each planned stope to its design dimensions. This has shown reasonable correlation from modeled to mined results and is a common value for the underhand cut and fill mining method.
12.6 Reconciliation
A model to mine reconciliation is provided below to illustrate the planned versus actual results of the mining of stopes that were a portion of the 2020 reserve.
Table 12‑4 Planned vs. actual for stopes that were a part of the 2020 reserve and have been mined out.
12 - 3
These stopes were a portion of the 2020 reserves and Table 12-4 shows the planned grade of the entire stope vs the calculated grade of length weighted averaging the round samples taken for each round. The table does not necessarily represent ore tonnes as the whole planned stope is compared to the whole sampled stope to evaluate model efficiency. Ore and waste decisions are made round by round underground by the value of each individual round sample. Overall, the model shows good correlation to mining results. Total tonnage shipped is larger than planned most likely due to the mining a few exploration rounds near the end of each planned stope. It is operational procedure to mine two to five rounds beyond the planned end of the stopes to increase geologic certainty along strike and possibly find more ore.
After the QP’s recommendation in a previous report, a model to mill reconciliation was carried out for the total mined tonnage from the Golden Chest starting with Juniper Mining’s lease in 2015. The reconciliation includes the surface mining completed by Idaho Strategic Resources from 2017 through 2022.
Table 12‑5 Project Reconciliation
Estimated grams from the model are 14% more than mill grams. Mill grams were calculated using the ball mill feed grams. It is possible that gold traps in the mill such as the bottom of the concentrate thickener and ball mill cleanout grams make up some of this difference. Another factor that makes model to mill reconciliation more complicated is the mixing of the underground and open pit ores at the mill. It is recommended that an underground only reconciliation be completed in the next year and the head grade at the mill should be calculated from tails sampling, ball mill cleanouts, and concentrate sales to continue to evaluate the block model against the mill feed.
The QP’s have reviewed the Mineral Reserve calculation methodology and believe the Company’s estimates are in accordance with industry-standard practices and comply with SK-1300.
12 - 4
13.0 MINING METHODS
Figure 13‑1 map showing outline
13.1 Mining Operations - Underground
The entirety of modern mining at the Golden Chest has taken place in the Skookum Shoot. The Idaho Vein, within the Skookum Shoot, has been mined successfully using the Underhand Cut and Fill method since 2015 when Juniper Mining Company leased the property. Juniper Mining Company contracted Small Mines Development (SMD) to drive the main access ramp (MAR) and to mine during the lease period.
The Golden Chest is a ramp access mine that was developed as a modern rubber-tire operation. All material is transported to the surface via two underground haul trucks and occasionally a 4.6 m3 load-haul-dump underground loader (LHD). Stope rounds are transported to bays using 1.5 m3 LHD’s. Drilling advance of stope rounds is accomplished with two Tamrock Quasar single boom jumbo drills. An electric over hydraulic twin boom jumbo drill and small section (2.7 m by 2.7 m) bolting machine have been procured to further increase operational efficiencies. The main ramp has a width and height of 4 m by 4.6 m respectively. All ventilation/secondary escape raises are mined 3 m by 3 m. Stope dimensions are 3 m by 3 m.
As of December 2022, the majority of the planned underground tonnage will be mined from the 830, 818, 806, and 794 sublevels which represent 100% of the planned underground production in 2023 and are a majority of the current reserve. General mine design parameters are as follows:
·
Minimum stope cut-off grade to make a mining decision (go/no-go cut-off) is 3.6 gpt.
·
In-stope cut-off is 2.0 gpt.
·
Underground Yearly Production Target 2022: 40,000 ore tonnes.
·
2 Underground crews work 7 days on and 7 days off 11 hours per day 365 days per year.
·
Mill crews work two twelve hour shifts 4 days per week year-round.
·
Attack ramp access to the orebody is a 30 m minimum distance into the Idaho Fault footwall.
·
MAR dimensions: 4 m wide by 4.6 m tall.
·
Sublevel spacing: 12 m
·
Stope dimensions: 3 m by 3 m
·
Minimum mining width: 2.4 m
·
Ventilation drift/raise dimensions: 3 m by 3 m
13 - 1
The current reserves at the Golden Chest represent a mine life approximately 1.3 years of milling throughput. The current deepest intercept on the Skookum Shoot is drill hole GC 12-121 which intercepted 2 m true thickness grading 4.94 gpt. GC 12-121 intercepted the IDVN structure at the 652 m elevation, which is 175 meters vertically lower than current mining operations. It is The Company’s opinion that the Skookum Shoot may provide a longer life of mine than the current reserves reported. More drilling to further define the structure is necessary to achieve the geologic certainty necessary to make longer term determinations of mine life.
The H-Vein structure and its associated resource intersects the Idaho Vein structure down dip of current workings. As mining progresses deeper, there may be an opportunity to begin bulk sampling of the H-Vein as the workings move toward it.
The Jumbo Vein structure has future potential up dip which is part of the Open Pit Resource in the Skookum area. There is potential that some of these areas in the Jumbo vein area are economic as small underground areas as well.
13.1.1 Cut and Fill Method, Skookum Shoot
The cut and fill method is the dominant mining method at the Golden Chest. Sublevels are accessed from the MAR which is designed to be at least 30 m from the Idaho Vein structure at all times. Each sublevel consists of 4 stopes that are generally 3 m wide and 3 m high that are accessed via attack ramps that are oriented perpendicular to the strike of the Idaho Vein. The primary cut on a sublevel starts with the highest in elevation and proceeds underhand until the sublevel is mined out. To maintain stope vertical spacing an overhand cut, or pillar cut, is occasionally taken between cement rock filled (CRF) stopes (i.e., CRF above and below). The stope accesses are designed to split the strike length of the Skookum Shoot in half as nearly as possible given ramp design constraints. After a level is mined out, CRF is placed in the mined-out stope via LHD and truck and allowed to cure until sufficient strength is achieved to resume mining beneath. Each round taken has a round sample taken by miners. The round sample is taken by digging into the muck pile with a 2-yard mucker and sampling periodically up the muck pile face in three separate portions. Material routing decisions are made based on round sample assay results.
13.1.2 Skookum Shoot Area
The entirety of the Mineral Reserve at the Golden Chest is contained within the Skookum Shoot where mining experience and core hole sample density is high enough to define a Reserve within the Golden Chest Resource. The Skookum Shoot area is comprised of the Idaho Vein which varies in width from 1 m to 6 m in select locations. Average vein width is approximately 1.5 m. The Idaho Vein strikes 15 degrees northeast and dips 45 degrees to the west. Cut and fill stopes progress underhand. In areas where the vein exceeds 3.5 m in width, a second drift and fill cut is mined adjacent to the first cut. The first cut is jammed tight with CRF to aide in hangingwall stability. Mining dilution in the Skookum Shoot is evaluated periodically by grade control geologists by sampling vein true widths and comparing them to round samples taken for each round by the miners. See Table 13-1 below for cuts near current mining activities and their associated dilution factors compared to the theoretical dilution factor. On a cut-by-cut basis the dilution factor trends above and below the theoretical average, but in general the trend matches well with what would be expected from theoretical dilution calculation.
13 - 2
Table 13‑1 Calculated Vs. Theoretical Dilution Factors
13.2 Ground Stability
The Idaho Vein is directly associated with the Idaho Fault that bounds Units G and H of the Prichard formation at the Golden Chest. The Idaho Vein lies directly below the Idaho Fault which varies in thickness from 0.1 m to 0.5 m. The Idaho Fault and the adjacent faulted zone are a driving parameter in ground support design. Idaho Strategic Resources plans stope support standards and design considerations based on known fault thicknesses and mining experience. Each stope is designated a type and supported accordingly utilizing Swellex and Split-Set bolts of varying lengths according to ground conditions. Welded wire mesh, 2.7 m support mats, and CRF are also utilized as primary and secondary ground support depending on stope design. Bolt QA/QC consists of regular bolt pull testing to confirm manufacturer specifications and installation practice adherence. As a progressive approach to mechanize the installation of ground supports a mechanized bolter designed for openings as small as 2.7 m was budgeted for 2022. This should increase employee safety and improve support installation efficiency.
The MAR is excavated in the competent quartzite of Prichard Unit G and effectively supported with the use of Split-Set bolts of varying lengths and Swellex inflatable bolts where necessary. The MAR utilizes welded wire mesh to increase safety on the skin of the opening. The bolter mentioned previously is also available for use in the MAR to improve employee safety and increase bolt installation efficiency.
13.2.1 Operating Practices
Idaho Strategic Resources implements the following practices to ensure that its support practices are in line with industry practices and practical knowledge gained from historic mining:
·
Minimize stope mining time and fill time.
·
Maintaining a minimum distance of 30 m for the MAR for long term stability.
·
Utilize CRF and underhand method wherever possible to improve stability of individual cuts.
·
Utilization of Swellex bolts in hangingwall of stopes where bond strength is a critical parameter.
·
Proactive long Swellex support in areas with long spans to ensure long-term stability.
·
Minimize Idaho Fault exposure by leaving an ore remnant along the hangingwall in stopes.
·
Minimize Idaho Fault exposure by adherence to stope height and level design.
13 - 3
The Golden Chest ground support measures are the result of extensive experience at the Golden Chest and careful planning of stope design requirements. The typical stope sizes and the utilization of underhand cut and fill reflect conservative, commonly accepted design principles that take into account the nature of the specific ground at the Golden Chest.
13.3 Underground Development
The Golden Chest has two portals to access underground workings. The main haulage for material out of the mine is the South Portal. The South Portal also serves as the ventilation intake. It was driven in 2015. The North Portal was driven in 2004 and serves as the mine’s ventilation exhaust.
Development openings are designed to meet equipment and ventilation requirements with potential future production in mind. All main haulage ramps have dimensions of 4 m wide by 4.6 m tall. The North Ramp is the secondary escape/ventilation exhaust and is 3 m wide by 3 m tall. It is accessible to secondary equipment via the North Portal.
13.3.1 Ground Support
Both the North and South Ramps are driven in Unit G of the Prichard formation which is a massive quartzite with favorable tunneling conditions. Ground support is carried out using Split-Set bolts and welded wire mesh. Proactive, extra-length support in the form of single run or connectable Swellex bolts is carried out at intersections and in other larger span areas to promote long-term stability.
13.3.2 Development Performance
Initial mining by IDR took advantage of completed development done by Juniper Mining Company. IDR has hired the necessary development crews and acquired the necessary equipment to complete the needed development during 2023. IDR is on track to complete development in the planned time frame for 2023.
Table 13‑2 Development by year and Company
13.4 Backfill
IDR has utilized Cemented Rock Fill (CRF) at the Golden Chest to provide geotechnical stability and enable efficient extraction of the orebody. The CRF is mixed at the company’s on-site surface plant and placed underground with underground trucks and LHD’s. QA/QC of the CRF is completed on at least a daily basis and more regularly if weather conditions change. QA/QC consists of cement grout pulp density determinations by the operator using a Marcy Scale, slump cone tests, and CRF unconfined compressive strength (UCS) testing is done on site as well. The automated CRF plant allows for a consistent product with QA/QC oversight from plant operators. The UCS results of specific days are tested at 7 and 28 days and tracked to ensure long term quality for backfill.
13 - 4
13.5 Mine Equipment
The mine equipment fleet has been expanded in the previous years to allow for expanded production. At this time there is a sufficient fleet of equipment on-site and the necessary maintenance crews to care for it. Major equipment is summarized below.
Mine Infrastructure is contained entirely on IDR patented mining claims at the Golden Chest. The majority of the infrastructure is in place on the area of the mine immediately below the South Portal entrance to the mine. The mine infrastructure includes 500 kVA 3-phase electrical service, North and South ramps, ore bin, backfill plant, mine offices, and a mine shop. All milling infrastructure is located offsite at the New Jersey Mill in Kellogg, Idaho.
13.7 Open Pit Mining Operations
Three small open pits have been mined at the Golden Chest. There are no open pit Reserves at the Golden Chest. The largest of the mined pits was the Idaho Pit. The Idaho Pit was mined in 34 months from August 2016 to June 2020. All the material from this campaign of Golden Chest mining was shipped to the New Jersey mill in Kellogg, Idaho for processing using primarily flotation to produce a bulk sulfide concentrate that was marketed to Japan and South Korea. Occasional gold dore’ was produced from cleanouts of the ball mill liners where gold tends to collect. Mill statistics for this Idaho Pit campaign are summarized below.
The New Jersey Mill located 3 km east of Kellogg, Idaho has processed material from the Golden Chest since 2017 from both open pit and underground sources at a rate of about 300 tpd. The New Jersey Mill uses a conventional bulk sulfide flotation flowsheet utilizing crushing, grinding, flotation, and paste tailings disposal. The flowsheet is depicted below in Figure 14-1.
14.1 Crushing Circuit
Ore is delivered from the Golden Chest to the stockpile pad at the New Jersey Mill by truck and pup trailers with an average payload of 30 dry metric tonnes. The ore is stockpiled with a 3 m3 front-end loader and fed to belt feeder that conveys the material to a jaw crusher where it’s crushed to pass about 10 cm. The material is then fed to a screen equipped with 1.25 cm openings. The fine material passes into the fine ore bin and the oversize material is conveyed back to a Metso HP 100 cone crusher for further crushing. Discharge from the cone crusher is fed back onto the screen feed belt so all material discharged into the fine ore bin must pass 1.25 cm.
14.2 Grinding Circuit
Ore is discharged from the fine ore bin at a rate of about 12 tonnes per hour by a conveyor that feeds a 2.5 m by 4.0 m ball mill. Lime is added on the ball mill feed conveyor to increase the pH to 10.0 in the flotation circuit. Water and a flotation collector reagent are added to the ball mill feed. The ball mill discharges into a sump where more water is added before the slurry is pumped to a hydro-cyclone that controls the grind achieved by the ball mill. Cyclone overflow is delivered to the flotation circuit and coarse particles report to the cyclone underflow which is routed back to the ball mill for regrinding.
14.3 Flotation Circuit
Cyclone overflow is piped to a trash screen at the head end of the rougher flotation circuit. Flotation reagents including Aerofloat 208, potassium amyl xanthate, and MIBC are introduced into the rougher feed. Rougher flotation consists of a single Wemco 144 cell followed by in series by the scavenger cells which are bank of five Wemco 66D cells. All rougher concentrate and scavenger concentrate reports to the cleaner circuit which consists of two banks of three Wemco 40 cells operated in series. Concentrate from the second bank of cleaner cells is the final concentrate. The concentrate is thickened and pumped to a plate-and-frame filter where it’s dried to about 6% moisture and dropped into 2-tonne supersacks ready for delivery to a copper smelter in Japan.
14.4 Tailings Circuit
Tailings from the scavenger circuit is pumped to two 4-meter diameter deep cone thickeners (DCT) operated in parallel. Flocculant is added to the feed to promote settlement of solids. The pulp density of the feed is approximately 32% solids and the underflow from the DCT’s ranges from 60% to 66% solids. Underflow is pumped using peristaltic hose pumps into the hopper of a positive displacement piston pump which generates enough pressure to deliver the paste tailings to the tailings storage facility (TSF). Clear overflow water is piped to a storage tank and recycled back through the process. Makeup water for the process is sourced from a groundwater well adjacent to the mill. The Company received a “Pollution Prevention Champion” award from the Idaho Department of Environmental Quality for its paste tailings process because of the water savings compared to conventional tailings disposal. Water is not discharged from the TSF to surface waters of the USA, but land applied to the TSF footprint.
14 -1
Figure 14‑1 New Jersey Mill Flowsheet
14.5 Mill Production
Mill production and recovery for the period from 2016 through December 31, 2022, are summarized in the table below. During this period only material from the Golden Chest was processed. The material was mined from a combination of open pits and the underground mine. Approximately 76% of the mill feed was from the open pit source and the remainder from the underground.
Table 14‑1 Mill Production Summary
Parameter
Value
Tonnes Processed (dry metric tonnes)
249,240
Head Grade (gpt Au)
3.55
Tailings Grade
0.434
Concentrate Grade
247
Tonnes Concentrate (dry metric tonnes)
2,975
Gold Recovery
89.7%
Gold recovery was lower for open pit material because the sulfides were partially oxidized which reduces recovery in the flotation circuit. The QP has observed that unoxidized, underground material has exhibited an average gold recovery of 93% and believes this is an appropriate recovery to use for resource and reserve calculations for underground mining.
14 -2
14.6 Mill Workforce
The mill workforce is comprised of two crusher operators and six flotation operators for a total workforce of 8 individuals. The mill currently operates on a four-day week so milling capacity could be increased by adding personnel to get to a seven-day week.
14 -3
15.0 INFRASTRUCTURE
The Golden Chest mining operations have been ongoing since 2012 and infrastructure at the site has been well developed to this point. Infrastructure includes a core shed, mine dry, and a shop building situated on the dump of the old No. 3 Level. See Figure 15-1. Year-round access to the mine is provided by Forest Highway 9 which is maintained by Shoshone County. Mine water supply is provided from historic underground workings and power is provided by an overhead transmission line from Wallace.
15.1 Roads and Logistics
The Golden Chest is approximately 64 km (40 mi) from Kellogg, Idaho via paved roads maintained by the State of Idaho and Shoshone County. On site access to the mine is provided by a network of dirt and gravel roads that IDR maintains. The on-site roads are graded yearly or as necessary and designed for year-round use. Snow maintenance on site is completed by IDR staff.
15 -1
15.2 Mine Layout
Figure 15‑1 Infrastructure Layout.
15 -2
15.2.1 Waste Rock Storage
The Golden Chest has two areas for development rock storage. The backfill aggregate stockpile and the rock storage site (RSS). The Rock Storage Site was designed for Idaho Pit waste rock and has been undergoing concurrent reclamation. Reclamation includes regrading to a 2:1 slope and revegetation with natural flora. Approximately 3,000 trees were planted on the RSS in 2022.
The backfill aggregate storage consists of underground development rock that is screened to backfilling requirements and then placed underground as CRF.
15.2.2 Tailings Disposal
Paste tailings facilities are located at the New Jersey Mill in Kellogg, Idaho. The Golden Chest was recognized in 2015 by the Idaho Department of Environmental Quality as a Pollution Prevention Champion with an associated award for the paste tailings technology. Associated details about tailings infrastructure can be found in Section 14 of this report.
15.2.3 Power
The Golden Chest is serviced by Avista (AVA) grid power in an amount not to exceed 500 kVA. This supply is sufficient for current operations and some mining expansion but would need to be increased to expand production if future reserves justified an on-site milling operation.
15 -3
16.0 MARKET STUDIES
16.1 Market Overview
The Golden Chest ore is milled at the New Jersey Mill in Kellogg, Idaho to produce a bulk-sulfide flotation concentrate which is primarily composed of iron sulfide (pyrite). The flotation concentrate usually contains about 250 gpt gold and 80 gpt silver, and the Company is paid for both metals, though silver is a minor component of sales. On occasion the ball mill will be cleaned out and a gold-gravity concentrate will be reduced to a dore’ bullion and sold to a US-based gold refinery.
The annual global gold supply is about 160 million ounces, so the Company is a minor producer of gold. The Company’s flotation concentrate is typically shipped to copper smelters in Asia where the pyrite helps fuel the smelting process and is also desirable because of its high gold content. Most marketing effort is spent finding a smelter that finds the concentrate suitable for its process and will buy it. The Company has contracted with a concentrate broker, H&H Metals Corp., to facilitate the marketing of its flotation concentrate since 2016.
16.2 Commodity Price Projections
The Company uses a trailing three-year average gold price to calculate Mineral Reserves and Resources. For the Mineral Reserves and Resources at the year ending December 31, 2022, the Company used a gold price of $1,800 per troy ounce. Silver is ignored in the reserve calculations. The Company’s QP’s believe the use of a three-year trailing average gold price is reasonable for the 2022 Mineral Reserves and Resources given current world economic trends and gold market fundamentals.
16.3 Contracts
As mentioned above, a concentrate broker, H&H Metals Corp. (H&H), is contracted with the Company to facilitate concentrate sales to smelters in Asia, primarily. H&H is an unaffiliated party and provides a provisional payment equal to 90% of the expected net smelter return once 10 wet metric tonnes of concentrate are produced and sampled. A final settlement is made once the concentrate has been delivered to the smelter, sampled, and assays have been traded between the parties. The H&H contract deducts fees for treatment charges, refining fees, transportation, and sampling costs. Additionally, penalties may be assessed for lead and zinc over 2% individually, and excessive moisture greater than 10%.
On occasion, the Company may enter hedging contracts to lock in the gold price on flotation concentrate produced and for which it has received a provisional payment. H&H provides the hedging as part of their service to the Company.
IDR employees perform the mining and mill duties, but the Company also contracts with a local general contractor for ore haulage to the New Jersey mill, and other associated earthwork. This contracted work is usually performed for an hourly rate competitive with local market conditions.
16 - 1
17.0 ENVIRONMENTAL STUDIES, PERMITTING, AND PLANS, NEGOTIATIONS, OR AGREEMENTS WITH LOCAL INDIVIDUALS OR GROUPS
17.1 Environmental Studies and Permitting
The Golden Chest Mine and New Jersey Mill are both located on private land and although no comprehensive baseline environmental impact study has been completed, all the required permits to operate have been obtained and are detailed below. Each permit application addresses the potential environmental impact of the operation, has plans for monitoring, and presents a reclamation or closure plan. A summary of the permits held by the Company for mining at the Golden Chest are summarized in the table below.
Table 17‑1 Environmental Permits
17.2 Surface Mine Permit
The Golden Chest has a surface mining permit and reclamation plan from the Idaho Department of Lands (IDL) to allow operating an open pit mine. The plan presents a design for a rock storage site, addresses open pit slope stability, water monitoring activity, and Best Management Practices (BMP’s) to control runoff and mitigate the impact of the surface mining operation. The reclamation plan includes re-sloping the waste rock site to a 2 to 1 slope, placing a topsoil cover and reseeding. Mitigation plans for potential acid rock drainage are also included and a post-closure monitoring period of five years is part of the plan. A cash bond of $103,000 which is the estimated reclamation cost was posted with IDL. Water is monitored for pH and metals at five different surface monitoring sites on a quarterly basis under a Quality Assurance Project Plan (QAPP) and results are submitted to the Idaho Department of Environmental Quality (IDEQ).
Surface disturbance associated with the underground mine is permitted under the surface mining plan and discharge water from the underground is land applied under an exemption from permitting by the IDEQ or pumped to the shallow injection well site permitted with the Idaho Department of Water Resources (IDWR).
17- 1
17.3 Tailings Storage Facility (TSF) Permit
The NJ Mill utilizes a unique tailings disposal technique known as paste tailing disposal which recycles process water and minimizes water stored in the TSF by thickening tailings and discharging to the TSF at high pulp densities. This greatly simplifies the permitting as there is no discharge of water to surface waters of the US.
An engineered plan for the expansion of the existing NJ Mill TSF was completed by a third-party engineering firm and submitted to the Idaho Department of Water Resources (IDWR) in 2021. IDWR approved the plans for construction in 2022. The TSF expansion plan calls for a downstream buttress to increase post-earthquake stability and creates enough storage volume for at least four years of operations. A cash bond of $117,000 was posted with the IDWR which is the estimated reclamation cost. A post closure plan calls for capping the tailings with clean fill and seeding with grass and conifer trees. A five-year post closure monitoring period is part of the TSF expansion plan.
17.4 Cyanidation Permit
The NJ Mill holds an Idaho cyanidation permit from the IDEQ that was originally planned for a concentrate leach circuit. Approximately 130 tonnes of concentrate were leached before the Company decided to submit a closure plan to the IDEQ since the process was deemed unnecessary. Estimated closure costs related to the cyanidation plan are $25,000 which was posted with the IDEQ in the form of a certificate of deposit. The closure plan is currently under review by the IDEQ and a water monitoring program that includes monitoring three groundwater wells and three surface water sites will continue for five years past the closure date of the TSF.
17.5 Stormwater Permits
Both the mine and the mill hold US EPA Multi-Sector General Stormwater Permits. A series of BMP’s such as straw wattles, silt fences, sumps, and ditches are used to mitigate erosion and the impact of stormwater runoff from the mine and mill. BMP’s are monitored quarterly concurrent with water sampling.
17.6 Community and Social Aspects
As stated on the Company’s website, “Idaho Strategic Resources’ corporate philosophy is a direct reflection of the personal motivations and individual belief systems of our employees and preferred contractors. We live, work, and raise families in the extended communities where we operate, thus we have a deep-seated desire to protect our neighborhoods and environment for future generations. We are committed to preserving the best elements of our history while remaining open to opportunities to restore and protect our environment. Idaho Strategic Resources promotes a policy of “We Live Here” when it comes to relationships with the community.” The Company’s hiring practice of employing local employees where a low turnover rate is observed and procuring supplies and services from local vendors demonstrates the Company’s commitment to the local community in the opinion of the QP.
17.7 Comments on Environmental Permitting and Monitoring
The QP believes the Company’s operations are adequate and in compliance with the appropriate environmental regulations. Current permitting and monitoring tasks are handled by the engineering and geology staff. The scope of operations has increased enough that hiring an environmental professional is recommended. Another QP recommendation would be to drill at least three groundwater monitoring wells at the Golden Chest so that the mine’s potential impact on groundwater can be monitored.
17- 2
18.0 CAPITAL AND OPERATING COSTS
18.1 Capital Costs
Capital costs for the Golden Chest are comprised of development costs for the MAR, capital for mining equipment, and mill capital. All dollar amounts are presented in U.S. dollars (USD).
This development consists of MAR meterage/tonnage, attack ramp meterage/tonnage, ventilation raise meterage/tonnage, and ancillary development meterage/tonnage (sumps, muck bays, laydown cut outs and other ancillary excavations). If specific equipment or infrastructure is required to reach a stope block, then it is included in the capital for that specific stope block. Development cost estimates for each reserve sublevel are shown below. Attack ramp costs are included in the table below although only the MAR costs are capitalized. Development costs shown below are used to evaluate the cash flow of each Reserve block
Table 18‑1 Capital Cost Estimates Associated with Reserves
The capital development costs outlined in table 18-1 consist entirely of development costs to reach the sublevel associated. All of the equipment and necessary infrastructure and personnel necessary to access the orebody on these sublevels is in place at the mine currently. The development costs are derived from actual costs from mining and are considered to be within plus or minus (+/-) 15%.
Capital costs shown for each block will not necessarily occur in 2023. Some development may have already occurred, and some levels may be left idle depending on management’s mining decisions. The purpose of attributing development costs to each block is to illustrate the economic prospects of each block to pay back its attributable development.
Mining equipment capital costs are estimated at $65,000 per month based on current equipment demands. With a $200,000 down payment and a decrease in mining equipment costs at the end of the 16-month period simulating a ramp down period if no new reserves are identified. This approach is conservative in that it assumes that no new reserve tonnes are identified, although new reserves have been identified in prior years.
Mill capital costs are estimated to be $70,000 for this plan which does not consider the Phase 6 mill impoundment lift which would be completed as more Reserves are identified.
18 - 1
18.2 Operating Costs
Operating costs used for the definition of reserves at year end 2022 are based on the previous year’s calculated costs per tonne with adjustments for the projected years mill feed source. Operating costs for the Golden Chest are based on actual cost information from the mining operation and represent accuracies of +/-15%. A table of operating costs is shown below. Management and General and Administrative costs attributable to the operation are included in the operating costs per tonne.
Table 18‑2 2021 Annual costs per tonne and mine planning/reserve costs used
18 - 2
19.0 ECONOMIC ANALYSIS
19.1 Economic Criteria
Underground Mineral Reserves represent approximately 16 months of mill feed at the New Jersey Mill. Idaho Strategic Resources prefers this conservative approach to reserve estimation due to the nature of narrow vein mining. Additional Reserves may or may not be defined by future mining and drilling operations. For the purpose of this economic analysis only the currently defined Reserves are included. Economic analysis was carried out as if the mill feed was strictly underground and no open pit material was milled at the New Jersey Mill. Currently some open pit material is milled at the New Jersey Mill which offsets underground feed tonnage. The open pit material is not part of any Mineral Reserve at the Golden Chest.
Each sublevel within the Golden Chest is evaluated for economic viability based on the ability of the sublevel to payback its investment requirements. If this criterion is met, then the material is placed in the Reserves to estimate annual cash flow. Current underground Reserves represent approximately 16 months of tonnage as such the discount rate was ignored because of the negligible effect of discounting annually over 16 months.
19.1.1 Physicals
·
Total mill feed processed: 53,754 tonnes
·
Average processing rate: 185 tonnes per shift
Table 19‑1 Underground reserve scenario production summary.
Commodity
Head Grade (gpt)
Mill % Recovery
Mill Recovered Au Troy Oz.
Au
4.73
93
8,173
19.1.2 Estimation Parameters
·
Gold price used in the economic analysis is a constant $1800 per troy ounce representing a 3-year trailing average (2022,2021,2020).
·
Constant smelter payment factor of 91%
·
Constant Net of Smelter Royalty (NSR) of 2%
·
Constant Ore haulage cost of $13.90 per tonne
·
Constant milling cost of $37.50 per tonne
·
Constant ore mining with fill of $120 per tonne
·
Constant development cost of $65 per tonne
·
Reserve life of 16 months
·
Capital costs of $1,761,000 for the 16-month period including ramp development, mine equipment, mill infrastructure, and sustaining capital.
19.1.3 Taxation and Royalties
Idaho Strategic Resources pays property tax in Shoshone County and occasionally a Net Profit Tax to Shoshone county. No income tax is anticipated to be payable in the next year. Idaho Strategic will use existing net operating losses to generate zero annual taxable income through the next year.
19 -1
The current production zone is subject to a 2% NSR royalty payable to Marathon Gold Corp. which is included in the estimate. Property taxes and net profit taxes paid to Shoshone County are minor compared to the 2% NSR and are neglected in this analysis.
19.2 Cash Flow Analysis
Cash flow analysis of the Golden Chest Mineral Reserves is presented below. The cash flow considers mill feed, grade, and tonnes, as well as associated operating and capital costs discussed in previous sections. No discounting of the cash flow was performed as the scheduled Reserves represent approximately 16 months of milling and there is a negligible effect of discounting a 16-month cash flow on an annual basis.
The results of this analysis indicate a positive cash flow of approximately $474,000 over 16 months at the base case. Capital requirements are paid within the year and the positive cash flow indicates economic viability at the base case $1800 per troy ounce gold price.
Table 19‑2 Table of Golden Chest underground reserve cash flows.
19.3 Sensitivity Analysis
The Golden Chest underground reserve’s annual cash flow was evaluated for its sensitivity to the following variables.
·
Metal grade
·
Metal recovery
·
Metal price
·
Operating costs
·
Capital costs
19 -2
Figure 19‑1 Sensitivity analysis of Golden Chest underground reserves
All relationships between a single variable and the cash flow are linear and can be interpolated further to estimate further variances from the base case.
The sensitivity analysis illustrates a commonly found sensitivity to metal prices and recoveries. Milling recovery, smelter payment, grade, and gold price show an exact relationship with each other, and are the most sensitive variables in the estimate. The operating costs are the second most sensitive variable which is to be expected as the ore tonnage represents a majority of the tonnes in the schedule.
19 -3
20.0 ADJACENT PROPERTIES
Like other long lived mining districts, there are abundant patented and unpatented claims in the area. Two notable, large claim groups; the Mother Lode and Butte Gulch, are immediately adjacent to the mine. IDR patented and unpatented land, adjacent patented land and historic mining prospects are shown in Figure 20-1.
The Mother Lode claim block consists of 6 patented claims and 26 unpatented claims. The claim block is currently owned by Mother Lode Gold Mines, Inc. (William Campbell, Spokane, Washington, USA). The Mother Lode claim block lies on the south side of Prichard Creek, and to the southwest of the mine. When Newmont Exploration Limited was exploring at the Golden Chest (1987-1990), they had extended their mine boundary to include the Mother Lode property due to it containing similar geology. Some drilling was completed before the Mother Lode was returned to its owner. Total historical gold production from the Mother Lode mine is unknown, but is probably greater than 25,000 oz (Shenon, 1938). Most of this production occurred before 1917.
The Butte Gulch patented claim group adjoins the east side of the mine. The Butte Gulch property was part of the Golden Chest land package until the early 1990’s, when it was divided. In 2019, IDR purchased the mineral rights to the Butte Gulch patented claim group. The surface rights of the Butte Gulch property are owned by Bell Run Properties LLC (Thomas Lanager, Curwensville, PA, USA). Butte Gulch was placer mined during the original Murray gold rush and has been reworked several times since, with the latest work occurring in the 2020’s.
20- 1
Figure 20‑1 Map of Adjacent Properties
20 - 2
21.0 OTHER RELEVANT DATA AND INFORMATION
No additional information or explanation is necessary to make this TRS understandable and not misleading.
21- 1
22.0 INTERPRETATION AND CONCLUSIONS
The QP’s offer the following interpretations and conclusions by area.
22.1 Geology and Mineral Resources
·
The Company has completed a Mineral Resource Estimate for the year ending December 31, 2022 and the QP’s have reviewed the estimate and find it to be consistent SK-1300. Measured and Indicated resources at the Golden Chest Mine total 1,095,748 tonnes at a grade of 4.41 gpt gold with Inferred resources totaling 753,502 tonnes at a grade of 3.44 gpt gold The Mineral Resources are exclusive of the Mineral Reserves.
·
Core sampling is supervised by professional geologist and sampling procedures meet industry best practices.
·
The sample preparation, security, and analytical procedures for core samples were consistent with generally accepted industry best practices.
·
The QA/QC procedures for core samples are consistent with generally accepted industry standards. However, a persistent, low bias in assay results was found in the 3 gpt standard.
·
Blanks and standards are not currently included with round samples from the stope rounds. Blanks and standards should be included with round samples on a weekly basis.
·
The QP’s review of database validation yielded no deficient procedures or data. The sample database is valid for reserve and resource calculations.
22.2 Mining and Mineral Reserves
·
The Mineral Reserve estimate of has been reviewed by the QP’s and found to be in accordance with the definitions for Mineral Reserves in S-K 1300. Mineral Reserves at December 31, 2022 are 53,754 tonnes at an average grade of 4.73 gpt gold using a gold price of $1,800 per troy ounce.
·
The Mineral Reserves are all within the Skookum Shoot area near existing infrastructure and near previously mined areas where sample data is dense enough for Proven and Probable classification.
·
Mineral Reserves are prepared by qualified personnel with appropriate supervision using industry-standard mining software.
·
The QP’s believe the use of a trailing three-year average gold price is appropriate and consistent with generally accepted practices within the mining industry.
·
The mining method at the Golden Chest is underhand cut-and-fill utilizing cemented rock fill (CRF) in the stopes.
·
The mining method is appropriate for this type of vein deposit and the ground conditions with minimum widths of 2.5 m and an average stope width of 3.0 m.
·
The Mineral Reserve is based on the underhand cut-and-fill mining method.
·
Block model versus round sample reconciliation shows the block model accurately predicts gold grade within 2%. Another reconciliation of the block model versus the mill feed should completed once mill feed is straigh underground material.
·
Dilution is accounted for in the Mineral Reserve estimate and extraction is assumed to be 100%.
·
The ground support plan with the use of Swellex-bolts in conjunction with CRF has improved geotechnical stope stability.
·
The mine uses 1.5 m3 rubber-tired LHDs along with diesel-hydraulic drill jumbos and a 22-tonne underground dump truck.
·
Life-of-mine (LOM) plans should be completed. Mining equipment, infrastructure, and mineral processing requirements could be determined once an LOM plan is completed.
22 - 1
22.3 Mineral Processing
·
Material is shipped from the Golden Chest Mine in Murray, Idaho to the New Jersey Mill in Kellogg, Idaho for processing using highway dump trucks with pups.
·
The New Jersey Mill operates as a bulk flotation plant at a rate of approximately 40,000 tonnes per year to produce a bulk-sulfide concentrate for sale to copper smelters in Asia.
·
The mill has processed nearly 249,240 tonnes of material from the Golden Chest open pit and underground and achieved gold recovery of 89.7% with an average concentrate grade of 247 gpt gold.
·
The mill has achieved higher gold recovery of 93% for straight underground material. This is appropriate gold recovery to use for underground Mineral Reserve estimates.
·
Previous campaigns of processing material from the Golden Chest at the 100 tpd New Jersey Mill from 2005 to 2009 provided metallurgical testing information at a bulk-sample scale.
·
RDI performed metallurgical testing evaluating gravity, flotation, and cyanidation processes using core samples from the Skookum Shoot.
·
The New Jersey Mill utilizes the novel process of paste tailings disposal and recycles process water to minimize its impact on the environment.
22.4 Infrastructure
·
The Golden Chest Mine is accessible all year round via a paved highway known as Forest Highway 9 and has all the necessary infrastructure to mine at the current rate.
·
An increase in the current mining rate would require an upgrade to the electrical power line to the mine.
22.5 Environment
·
The Golden Chest Mine and New Jersey Mill have all the necessary environmental permits to operate.
·
The Company has posted bonds to cover the cost of reclamation at both the Golden Chest and New Jersey Mill.
·
The Company promotes a “We Live Here” philosophy which encourages a commitment to the environment because employees and management all live and recreate in the local area. Local hiring and buying are also encouraged under this philosophy.
22 - 2
23.0 RECOMMENDATIONS
The QP’s offer the following recommendations by area.
23.1 Geology and Mineral Resources
1. The 3 gpt standard assays should be investigated to determine if a cause for the low bias can be found.
2. Blanks and standards should be included with the round samples on a weekly basis.
3. Follow-up or closeout assays around a vein intercept should be checked on a regular basis that they have been added to the sample database to avoid inaccuracies in compositing.
23.2 Mining and Mineral Reserves
4. Continue to perform the reconciliation of mill tonnes and grade to the block model reconciliation exercise.
5. The use of the mechanical bolter in the stopes should be implemented into the stope design to pursue increased efficiency and safety in the installation of ground support.
6. Study the addition of a paste backfill system for the potential to reduce operating costs.
23.3 Mineral Processing
7. Hire a metallurgical consultant to perform a plant audit of the mill to help optimize operational parameters to maximize net smelter return.
8. Complete mineralogic study of concentrate to define mineralogic components of concentrate.
23.4 Environmental
9. Consider hiring a full-time environmental professional or environmental contractor as the scope of operations has increased.
10. Make plans to drill three groundwater monitoring wells at the Golden Chest Mine.
23 - 1
24.0 REFERENCES
Ash, C., and Alldrick, D., 1996: Au-quartz Veins, in Selected British Columbia Mineral Deposit Profiles, Volume 2 - Metallic Deposits, Lefebure, D.V. and Hõy, T, Editors, British Columbia Ministry of Employment and Investment, Open File 1996-13, pages 53-56.
Brown, Alexander, 2019, The Geology and Geochemistry of the Golden Chest Gold Deposit, Murray, Idaho: unpublished Master Thesis, Montana Tech, Butte, MT, 135 p
Cressman, E.R., 1989, Reconnaissance Stratigraphy of Prichard Formation (Middle Proterozoic) and the Early Development of the Belt Basin, Washington, Idaho, and Montana. U.S. Geological Survey Professional Paper 1490, 80 p.
Gammons, C., 2009. Professor, Dept. of Geological Engineering. Montana Tech of The University of Montana. E-mail communication.
Goldbarb, R.J., Baker, Timothy, Dubé, Benoît, Groves, D.I., Hart, C.J.R., and Gosselin, Patrice, 2005, Distribution, Character, and Genesis of Gold Deposits in Metamorphic Terrances: Economic Geology 100th Anniversary Volume, pp. 407-450
Gott, G.B., and Cathrall, J.B., 1980, Geochemical-Exploration Studies in the Coeur d’Alene District, Idaho and Montana: U.S. Geological Survey Professional Paper 1116, 63 p.
Groves, D.I., Goldfarb, R.J., Gebre-Mariam, M., Hagemann, S.G., and Robert, F., 1998, Orogenic gold deposits: A proposed classification in the context of their crustal distribution and relationship to other gold deposit types: Ore Geology Reviews 13, p.7-27, published by Elsevier Science B.V.
Hart, C.J.R., 2005, Classifying, Distinguishing and Exploring for Intrusion‐Related Gold Systems. Canadian Institute of Mining - Geological Society “The Gangue” Issue 87, October 2005.
Hausen, 1987, Newmont Golden Chest petrographic work, private report.
Hershey, O. H., 1916, Origin and distribution of ore in the Coeur d’Alene: Mineral Science Press, book 21, shelf, 7.
Hobbs, S.W., Griggs, A.B., Wallace, R.E., and Campbell, A.B., 1965, Geology of the Coeur d’ Alene district, Shoshone County, Idaho: U.S. Geological Survey Professional Paper 478, 139 p.
Hosterman, J.W., 1956, Geology of the Murray Area, Shoshone County, Idaho: U.S. Geological Survey Bulletin 1027-P, p. 725-748.
Idaho State University, 2017, Digital Geology of Idaho: http://geology.isu.edu/Digital_Geology_Idaho/
Lewis, R.S., T.H. Kiilsgaard, E.H. Bennett, and W.E. Hall, 1987, Lithologic and chemical characteristics of the central and southeastern part of the southern lobe of the Idaho Batholith, in T.B. Vallier and H.C. Brooks, editors, Geology of the Blue Mountains Region of Oregon, Idaho, and Washington: The Idaho Batholith and its Border Zone: US Geological Survey Professional Paper 1436, p. 151-196.
24 - 1
Lindgren, W., 1933. Mineral Deposits. McGraw Hill, New York and London, 930 p.
Marvin, R.F., Zartman, R.E., Obradovich, J.D., and Harrison, J.E., 1984, Geochronometric and lead isotope data on samples from the Wallace 1 x 2 quadrangle, Montana and Idaho: U.S. Geological Survey Miscellaneous Field Studies Map MF-1354-G, 1 plate.
McLachin, R., 2016, Geological Society of America (GSA) poster at 68th annual meeting, GSA Rocky Mountain Section, Moscow, Idaho, May, 2016. https://gsa.confex.com/gsa/2016RM/webprogram/Paper276190.html.
Mitchell, V.E., Reed, S.L., and Larsen, J, 2021, Digital Geology of Idaho website, https://digitalgeology.aws.cose.isu.edu/Digital_Geology_Idaho/Module7/mod7.htm
Mulholland, P., 2015, Juniper Mining Company, , final Mine report.
Murahwi, C., San Martin, A. J., and Gowans, R., 2011: Technical Report on the Initial Resource Estimate for the Golden Chest Property, Idaho, United States, effective date December 31, 2011.
Murahwi, C., San Martin, A. J., and Gowans, R., 2012: Golden Chest Property, Idaho, United States 43-101F1 Technical Report, effective date December 31, 2012.
Randall, T., 2014, Metallurgical Testing of Juniper Samples, Golden Chest Mine-Idaho. Resource Development Incorporated (RDI), Wheat Ridge, CO.
Ross, Katherina, 2010, in Rhys, David, 2010, Review of structural setting and potential of gold prospects on the Toboggan Mine, Idaho. Newmont Exploration private report
Rowe, J.E., 1908, The Coeur d’Alene Mining District, Idaho, The Mining World, December 5, 1908.
Ransome, Frederick L. and Calkins, Frank C., 1908, Geology and Ore Deposits of the Coeur d ’Alene District, Idaho, USGS Professional Paper 62.
Schalck, D.K., 1989, The geology and alteration of the Gem stocks, Shoshone County, Idaho, in V.E. Chamberlain, R.M. Breckenridge, and Bill Bonichsen, editors, Guidebook to the Geology of Northern and Western Idaho and Surrounding Area: Idaho Geological Survey Bulletin 28, p. 125-135.
Shenon, P.J., 1938, Geology and Ore Deposits Near Murray, Idaho. Idaho Bureau of Mines and Geology Pamphlet 47, 44 p.
Sillitoe, R.H. 1991, Intrusion-related gold deposits. In: Foster, R.P. (ed.), Metallogeny and Exploration of Gold. Blackie and Sons, Glasgow, p. 165-209.
24 - 2
25.0 RELIANCE ON INFORMATION PROVIDED BY THE REGISTRANT
This TRS has been prepared by the QP’s for IDR. The QP’s are employees of IDR, and they are Grant A. Brackebusch, P.E. (Vice President - Operations), and Robert J. Morgan, PG PLS (Vice President - Exploration).
The information, conclusions, opinions, and estimates contained herein are based on
·
Information available to the QP’s at the time of the writing of this TRS,
·
Assumptions, conditions, and qualifications as set forth in this TRS,
·
And data, reports provided by IDR and third-party sources.
The QP’s relied on information provided by IDR’s legal counsel regarding the mineral rights on the Joe Dandy patented claim. The QP’s consider this reasonable as the legal counsel is an attorney with experience with mining law.
The QP’s relied on tax information from the Company’s tax accountant regarding the size of a tax loss carryover for the Company so that taxes can be ignored on the economic analysis of Mineral Reserves. The QP’s consider this reasonable at the tax accountant has experience in tax preparation.
The QP’s believe they have taken the steps, in their professional opinion, to assure the information used to prepare this report is valid.
25 - 1
26.0 DATE AND SIGNATURE PAGE
This report titled “Technical Report Summary on the Golden Chest Mine, Idaho” with an effective date of December 31, 2022, was prepared and signed by:
Grant A. Brackebusch, P.E.
Vice President - Operations, Idaho Strategic Resources, Inc.
Dated: March 27, 2023
Robert J. Morgan, PG, PLS
Vice President - Exploration, Idaho Strategic Resources, Inc.
Dated: March 27, 2023
26 - 1
27.0 Appendix 1 General Statistics and Histograms for All Domains
Figure 27‑1 Skookum Area Jumbo Vein Histogram and Raw Statistics
Figure 27‑2 Skookum Area H Vein Histogram and Raw Statistics
27 - 2
Figure 27‑3 Skookum Area Footwall Quartzite Histogram and Raw Statistics
Figure 27‑4 Paymaster Area Idaho Vein Histogram and Raw Statistics
27 - 3
Figure 27‑5 Paymaster Area Jumbo Vein Histogram and Raw Statistics
Figure 27‑6 Klondike Area Popcorn Vein Histogram and Raw Statistics
27 - 4
Figure 27‑7 Klondike Area Hangingwall Histogram and Raw Statistics
27 - 5
28.0 Appendix 2 Variography for Golden Chest Domains
Figure 28‑1 Skookum Area Jumbo Vein Experimental Variogram with Modeled Variogram
Figure 28‑2 Skookum Area H Vein Experimental Variogram with Modeled Variogram
28 - 6
Figure 28‑3 Skookum Zone Footwall Domain Experimental Variogram and Modeled Variogram
Figure 28‑4 Paymaster Area Idaho Vein Experimental Variogram with Modeled Variogrom
28 - 7
Figure 28‑5 Paymaster Area Jumbo Vein Experimental Variogram with Modeled Variogram
Figure 28‑6 Klondike Hangingwall Experimental Variogram with Modeled Variogram
28 - 8
Figure 28‑7 Klondike Zone Popcorn Vein Experimental Variogram with Modeled Variogram
28 - 9
29.0 Appendix 3 Grade Tonnage Curves for Each Zone
Figure 29‑1 Grade Tonne Curve for the Skookum Zone Underground Resource
Figure 29‑2 Grade Tonne Curve for the Paymaster Zone
29 - 10
Figure 29‑3 Grade Tonne Curve for the Klondike Zone
29 - 11
We use cookies on this site to provide a more responsive and personalized service. Continuing to browse, clicking I Agree, or closing this banner indicates agreement. See our Cookie Policy for more information.