Exhibit 99.1
|
| Canadian National Instrument 43-101 Technical Report |
| in Support of the Preliminary Assessment on the |
| Development of the Los Azules Project, San Juan |
| Province, Argentina |
| |
| Effective Date: March 19, 2009 |
| |
| Prepared for: | Prepared by: |
| |
| Minera Andes, Inc. | Samuel Engineering, Inc. |
| 111 East Magnesium Road, Suite A | 8450 East Crescent Parkway, Suite 200 |
| Spokane, Washington 99208 USA | Greenwood Village, Colorado 80111 USA |
| |
| Qualified Persons (Contributors) |
| |
| Randolph P. Schneider, MAusIMM | William L. Rose, P.E. |
| Robert Sim, P.Geo | Scott Elfen, P.E. |
| Bruce Davis, PhD., FAusIMM | |
Exhibit 99.1

| 
|
| | | |
| Table of Contents |
| |
| 3.0 | SUMMARY | 1 |
| 3.1 | OVERVIEW OF THE STUDY | 2 |
| 3.2 | PROPERTY DESCRIPTION AND OWNERSHIP, LOCATION, INFRASTRUCTURE AND HISTORY | 2 |
| 3.2.1 | Property Description and Ownership | 2 |
| 3.2.2 | Property Location | 4 |
| 3.2.3 | Infrastructure | 4 |
| 3.2.4 | Property History | 4 |
| 3.3 | GEOLOGY AND RESOURCES | 5 |
| 3.3.1 | Regional Geology | 5 |
| 3.3.2 | Property Geology | 5 |
| 3.3.3 | Resources | 5 |
| 3.3.4 | Resource Classification | 6 |
| 3.3.5 | Resources within Designed Pit Phases | 7 |
| 3.4 | METALLURGY | 8 |
| 3.5 | PROCESS | 8 |
| 3.5.1 | Process Description | 8 |
| 3.5.2 | Process Block Flow Diagram | 10 |
| 3.5.3 | Basic Process Design Criteria | 11 |
| 3.6 | TAILINGS STORAGE FACILITY (“TSF”) | 12 |
| 3.7 | WASTE ROCK DISPOSAL FACILITY (“WRDF”) | 12 |
| 3.8 | MINE PLAN | 13 |
| 3.9 | OPERATING COSTS | 15 |
| 3.10 | CAPITAL COSTS | 16 |
| 3.11 | PROJECT ECONOMICS | 17 |
| 3.12 | CONCLUSIONS & RECOMMENDATIONS | 19 |
| 4.0 | INTRODUCTION | 20 |
| 4.1 | PURPOSE OF TECHNICAL REPORT | 21 |
| 4.2 | SOURCES OF INFORMATION | 21 |
| 4.3 | SITE VISIT | 23 |
| 5.0 | RELIANCE ON OTHER EXPERTS | 24 |
| 5.1 | RELIANCE ON OTHER EXPERTS | 25 |
| 5.2 | PREVIOUS TECHNICAL REPORTS | 25 |
| 6.0 | PROPERTY DESCRIPTION AND LOCATION | 26 |
| 6.1 | LOCATION | 28 |
| 6.2 | PROPERTY AND TITLE IN ARGENTINA | 28 |
| 6.2.1 | Cateo | 28 |
| 6.2.2 | Mina | 29 |
| 6.2.3 | Estaca Minas | 30 |
| 6.2.4 | Provincial Reserve Areas | 30 |
| 6.3 | OWNERSHIP OF THE LOS AZULES PROJECT | 30 |
| 6.4 | TERMS OF LOS AZULES OPTION AGREEMENT AND UNDERLYING AGREEMENTS | 34 |
Los Azules Preliminary Assessment Technical Report
SE Project No. 8019-01
i
Exhibit 99.1
|
|
| | | |
| 6.5 | ENVIRONMENTAL BASELINE STUDIES | 35 |
| 6.5.1 | Physical components | 35 |
| 6.5.2 | Biological components | 36 |
| 6.6 | ENVIRONMENTAL LIABILITIES | 37 |
| 6.6.1 | Veranadas | 37 |
| 6.6.2 | Existing Exploration Roads | 37 |
| 6.7 | PERMITTING REQUIREMENTS | 38 |
| 6.7.1 | Exploration and Prospecting Requirements | 38 |
| 6.7.2 | Requirements to Proceed to Prefeasibility Study Phase | 38 |
| 6.8 | PERMITTING REGULATIONS | 38 |
| 6.8.1 | Environmental Regulation | 38 |
| 6.8.2 | Mine Regulation | 39 |
| 6.8.3 | Hazardous Waste and Health and Safety Regulation | 39 |
| 7.0 | ACCESSIBILITY, CLIMATE, LOCAL RESOURCES, INFRASTRUCTURE AND PHYSIOGRAPHY | 42 |
| 7.1 | ACCESSIBILITY | 43 |
| 7.1.1 | General | 43 |
| 7.1.2 | Surface Rights | 43 |
| 7.2 | CLIMATE | 43 |
| 7.3 | LOCAL RESOURCES AND INFRASTRUCTURE | 46 |
| 7.3.1 | Proximity of Property to Population Centers | 46 |
| 7.3.2 | Power | 47 |
| 7.4 | PHYSIOGRAPHY | 51 |
| 8.0 | HISTORY | 52 |
| 8.1 | PROPERTY HISTORY | 53 |
| 9.0 | GEOLOGICAL SETTING | 54 |
| 9.1 | REGIONAL GEOLOGY | 55 |
| 9.1.1 | Pre-Jurassic Basement | 55 |
| 9.1.2 | Mesozoic Sequence | 55 |
| 9.1.3 | Cenozoic Sequence | 55 |
| 9.1.4 | Quaternary | 58 |
| 9.2 | PROPERTY GEOLOGY | 58 |
| 9.2.1 | Lithology | 60 |
| 9.2.2 | Alteration | 63 |
| 10.0 | DEPOSIT TYPES | 66 |
| 10.1 | INTRODUCTION | 67 |
| 10.2 | TYPICAL PORPHYRY COPPER SYSTEM | 67 |
| 10.3 | LOS AZULES DEPOSIT | 69 |
| 11.0 | MINERALIZATION | 71 |
| 12.0 | EXPLORATION | 74 |
| 12.1 | EXPLORATION HISTORY | 75 |
| 12.2 | SUBSEQUENT EXPLORATION | 76 |
Los Azules Preliminary Assessment Technical Report
SE Project No. 8019-01
ii
Exhibit 99.1
|
|
| | | |
| 13.0 | DRILLING | 77 |
| 13.1 | DRILLING HISTORY | 78 |
| 13.2 | CURRENT DRILLING | 79 |
| 14.0 | SAMPLING METHOD AND APPROACH | 82 |
| 15.0 | SAMPLE PREPARATION, ANALYSIS AND SECURITY | 84 |
| 15.1 | INTRODUCTION | 85 |
| 15.2 | SAMPLE PREPARATION | 85 |
| 15.2.1 | Core Sampling | 86 |
| 15.2.2 | QC Sample Insertion | 86 |
| 15.2.3 | Chain of Custody | 86 |
| 15.3 | SAMPLE CONTROL STANDARDS | 87 |
| 15.3.1 | Sample Standards | 87 |
| 15.3.2 | Control Sample Performance | 88 |
| 15.3.3 | Blank Sample Performance | 92 |
| 15.3.4 | Coarse Duplicate Sample Performance | 92 |
| 15.3.5 | Pulp Duplicate Sample Performance | 92 |
| 15.4 | CONCLUSIONS | 94 |
| 16.0 | DATA VERIFICATION | 95 |
| 16.1 | VERIFICATION OF GEOLOGIC DATA | 96 |
| 16.1.1 | Database Verification | 96 |
| 16.1.2 | Site Visit Validation | 97 |
| 16.1.3 | Conclusions | 97 |
| 16.2 | VERIFICATION OF ANALYTICAL DATA | 97 |
| 17.0 | ADJACENT PROPERTIES | 98 |
| 18.0 | MINERAL PROCESSING AND METALLURGICAL TESTING | 100 |
| 18.1 | INTRODUCTION | 101 |
| 18.2 | REVIEW OF METALLURGICAL TEST WORK | 101 |
| 18.2.1 | Summary | 101 |
| 18.2.2 | Bottle Roll Leaching Tests | 101 |
| 18.2.3 | Grinding | 101 |
| 18.2.4 | Flotation | 102 |
| 18.3 | PROCESS INTRODUCTION | 103 |
| 18.4 | PROCESS FLOWSHEET DEVELOPMENT | 103 |
| 18.5 | PROCESS PLANT SITING CONSIDERATIONS | 103 |
| 18.6 | PROCESS BLOCK FLOW DIAGRAM | 105 |
| 18.7 | PROCESS DESCRIPTION | 106 |
| 18.7.1 | Crushing and Coarse Ore Stockpile | 106 |
| 18.7.2 | Grinding | 106 |
| 18.7.3 | Flotation and Regrind | 106 |
| 18.7.4 | Concentrate Thickening | 107 |
| 18.7.5 | Concentrate Transportation | 107 |
| 18.7.6 | Concentrate Filtration and Storage | 108 |
| 18.7.7 | Filtrate Handling | 108 |
| 18.7.8 | Tailings | 110 |
Los Azules Preliminary Assessment Technical Report
SE Project No. 8019-01
iii
Exhibit 99.1
|
|
| | | |
| 18.7.9 | Reagents | 111 |
| 18.7.10 | Water Treatment, Dust and Emissions Control | 111 |
| 18.7.11 | Process Design Criteria | 111 |
| 19.0 | MINERAL RESOURCE ESTIMATE | 122 |
| 19.1 | INTRODUCTION | 123 |
| 19.2 | GEOLOGIC MODEL, DOMAINS AND CODING | 123 |
| 19.3 | DATABASE | 125 |
| 19.4 | COMPOSITING | 126 |
| 19.5 | STATISTICAL DATA ANALYSIS | 127 |
| 19.5.1 | Basic Statistics by Domain | 127 |
| 19.5.2 | Contact Profiles | 127 |
| 19.5.3 | Conclusions and Modeling Implications | 128 |
| 19.5.4 | Secondary Elements | 131 |
| 19.6 | BULK DENSITY DATA | 132 |
| 19.7 | EVALUATION OF OUTLIER GRADES | 132 |
| 19.8 | VARIOGRAPHY | 132 |
| 19.9 | THREE-DIMENSIONAL MODEL | 133 |
| 19.10 | PROBABILITY SHELL | 134 |
| 19.11 | INTERPOLATION PARAMETERS | 134 |
| 19.12 | VALIDATION | 137 |
| 19.12.1 Visual Inspection | 137 |
| 19.12.2 Model Checks for Change of Support | 137 |
| 19.12.3 Comparison of Interpolation Methods | 138 |
| 19.12.4 Swath Plots (Drift Analysis) | 139 |
| 19.13 | RESOURCE CLASSIFICATION | 139 |
| 19.14 | MINERAL RESOURCES | 143 |
| 19.15 | PIT LIMIT ANALYSIS | 143 |
| 19.16 | PIT DESIGN | 146 |
| 19.17 | MINERAL RESOURCES WITHIN DESIGNED PIT/PHASES | 146 |
| 20.0 | OTHER RELEVANT DATA AND INFORMATION | 148 |
| 20.1 | MINING OPERATIONS | 149 |
| 20.1.1 | Mine Production Schedule | 149 |
| 20.1.2 | Mine Equipment Selection and Fleet Requirements | 153 |
| 20.1.3 | Mine Personnel | 154 |
| 20.2 | INFRASTRUCTURE | 159 |
| 20.2.1 | Mine Access Road | 159 |
| 20.2.2 | Waste Rock Disposal Facility (“WRDF”) | 163 |
| 20.2.3 | Tailings Storage Facility (“TSF”) | 167 |
| 20.2.4 | Mancamp Facilities | 173 |
| 20.2.5 | Employee Housing and Transportation | 173 |
| 20.2.6 | Water Supply | 173 |
| 20.3 | RECLAMATION AND MINE CLOSURE | 182 |
| 20.4 | SEISMICITY | 183 |
| 20.5 | RECOVERIES | 186 |
| 20.6 | MARKETS | 186 |
| 20.7 | CONTRACTS | 186 |
Los Azules Preliminary Assessment Technical Report
SE Project No. 8019-01
iv
Exhibit 99.1
| | | |
| 20.8 | CAPITAL COSTS | 186 |
| 20.8.1 | Objective and Summary | 186 |
| 20.8.2 | Accuracy | 188 |
| 20.8.3 | Currency | 188 |
| 20.8.4 | Scope | 189 |
| 20.8.5 | Exclusions | 189 |
| 20.8.6 | Estimating Methodology | 190 |
| 20.8.7 | General Risk Factors | 193 |
| 20.8.8 | Estimate Cost by Area | 194 |
| 20.9 | OPERATING COSTS | 194 |
| 20.9.1 | Mining Costs | 194 |
| 20.9.2 | Process and G&A Costs | 196 |
| | |
| 20.10 ECONOMIC ANALYSIS | 196 |
| 20.10.1 Introduction | 196 |
| 20.10.2 Model Inputs | 197 |
| 20.11 MINE LIFE AND CAPITAL PAYBACK | 204 |
| 21.0 | INTERPRETATION AND CONCLUSIONS | 205 |
| 21.1 | INTERPRETATIONS AND CONCLUSIONS | 206 |
| 22.0 | RECOMMENDATIONS | 209 |
| 22.1 | GEOLOGY, GEOCHEMISTRY, AND GEOCHRONOLOGY | 210 |
| 22.2 | GEOTECHNICAL | 213 |
| 22.3 | MINING | 213 |
| 22.4 | RECLAMATION AND MINE CLOSURE | 213 |
| 22.5 | SAMPLE PREPARATION, ANALYSIS AND SECURITY | 214 |
| 22.6 | ENVIRONMENTAL | 214 |
| 22.7 | HYDROGEOLOGICAL AND HYDROLOGIC | 215 |
| 22.8 | WATER DISPOSAL ALTERNATIVES | 216 |
| 22.9 | SOCIAL | 216 |
| 22.10 GENERAL PROJECT RECOMMENDATIONS | 216 |
| 23.0 | REFERENCES | 217 |
| 23.1 | REFERENCES | 218 |
| 23.2 | GLOSSARY | 218 |
| 23.3 | LIST OF ABBREVIATIONS | 224 |
| 23.4 | MEASUREMENT UNITS AND SYMBOLS | 226 |
| 24.0 | DATE AND SIGNATURE PAGE | 231 |
| 25.0 | ADDITIONAL REQUIREMENTS FOR TECHNICAL REPORTS ON DEVELOPMENT PROPERTIES AND PRODUCTION PROPERTIES | 233 |
| 25.1 | ADDITIONAL INFORMATION | 234 |
| 26.0 | ILLUSTRATIONS | 235 |
Los Azules Preliminary Assessment Technical Report
SE Project No. 8019-01
v
Exhibit 99.1
|
|
| |
| List of Figures |
| |
| Figure 3.1 – Project Location | 3 |
| Figure 3.2 – Process Block Flow Diagram | 10 |
| Figure 3.3 – General Arrangement Plan | 13 |
| Figure 3.5 – Foreign Currency Conversion Rates | 17 |
| Figure 6.1 - Project Location | 27 |
| Figure 9.1 – Regional Geomorphology | 56 |
| Figure 9.2 – Regional Geology | 57 |
| Figure 9.3 – Local Geology and Structure | 59 |
| Figure 9.4 – Lithology Plan View at 3600 masl | 62 |
| Figure 9.5 – Alteration Plan View at 3600 masl | 64 |
| Figure 9.6 – Representative Cross Section (N6558600) | 65 |
| Figure 10.1 – Typical Porphyry Copper Deposit | 68 |
| Figure 11.1 – Mineralization Plan View 3600 masl | 73 |
| Figure 13.1 – Drill Hole Locations | 80 |
| Figure 15.1 – Copper Sample Control (Std01, Std03) Performance Charts | 89 |
| Figure 15.2 – Copper and Gold Sample Control (Std6, Std20) Performance Charts | 90 |
| Figure 15.3 – Gold Sample Control (Std6, Std7) Performance Charts | 91 |
| Figure 15.4 – Copper and Gold Blank Sample Control Performance Charts | 93 |
| Figure 18.1 – Mine Site General Arrangement Plan | 104 |
| Figure 18.2 – Process Block Flow Diagram | 105 |
| Figure 18.3 – Concentrate Pipeline from Los Azules Mine Site to the Port facility | 108 |
| Figure 18.4 – Potential Concentrate Water Evaporation Sites | 109 |
| Figure 19.1 – Mineral Zone Domains | 124 |
| Figure 19.3 – Boxplot Cu by Mineral Zone | 129 |
| Figure 19.4 – Contact Profile for Rock Types | 130 |
Los Azules Preliminary Assessment Technical Report
SE Project No. 8019-01
vi
Exhibit 99.1
|
|
| |
| Figure 19.5 – Contact Profile for Mineral Zones | 131 |
| Figure 19.6 – Probability Plot TCu% in SS and PR Zone | 135 |
| Figure 19.7 – Isometric View Of Probability Shell in SS + PR Zone | 136 |
| Figure 19.8 – Recovered Copper (20x20x15 SMU) | 138 |
| Figure 19.9 – Comparison of OK, ID, NN Models | 140 |
| Figure 19.10 – East-West Swath | 140 |
| Figure 19.11 – North-South Swath | 141 |
| Figure 19.12 – Vertical Swath | 141 |
| Figure 19.13 – Volume Classified as Inferred Resources within SS + PR Domains | 142 |
| Figure 19.14 – Inferred Resources Above 0.3% Cu Cutoff Grade | 142 |
| Figure 20.1 – ROM Mineralized Material Source and Mill Feed Copper Grade | 151 |
| Figure 20.2 – Strip Ratio and Mill Feed Copper Grade | 152 |
| Figure 20.3 – Mine Personnel Requirements | 158 |
| Figure 20.4 – Potential Mine Access Routes | 159 |
| Figure 20.5 – Typical Cut Cross Section | 162 |
| Figure 20.6 – Typical Cut and Fill Cross Section | 162 |
| Figure 20.7 – Typical Fill Section | 162 |
| Figure 20.8 – General Arrangement Plan | 163 |
| Figure 20.9 – TSF and WRDF Siting Map | 168 |
| Figure 20.10 – General Initial Facility Arrangement | 170 |
| Figure 20.11 – General Ultimate Facility Arrangement | 170 |
| Figure 20.12 – Groundwater Levels on Los Azules Site | 175 |
| Figure 20.13 – Relationship of Groundwater Depth to Surface Elevation | 176 |
| Figure 20.14 – Cross Section of Los Azules Site | 177 |
| Figure 20.15 – Site Water Balance | 180 |
| Figure 20.16 – Location of the 1992 Earthquake Epicenter | 184 |
Los Azules Preliminary Assessment Technical Report
SE Project No. 8019-01
vii
Exhibit 99.1
| |
| Figure 20.17 – Western Argentina Seismic Hazard Map (Peak Ground Ac3celeration in m/s2with 10% Probability of Exceedance in 50 Years) | 185 |
| Figure 20.18 – Foreign Currency Conversion Rates | 188 |
| Figure 20.20 – C1 Cash Costs (Net of By-Product Credits) | 201 |
| Figure 20.21 – Copper Metal Price Sensitivity | 203 |
| Figure 20.22 – Project Sensitivity Analysis | 204 |
| Figure 26.1 – Mining Phase 1 | 236 |
| Figure 26.2 – Mining Phase 2 | 237 |
| Figure 26.3 – Mining Phase 3 | 238 |
| Figure 26.4 – Mining Phase 4 | 239 |
| Figure 26.5 – Mining Phase 5 | 240 |
| Figure 26.6 – Mining Phase 6 (Ultimate Pit) | 241 |
| Figure 26.7 – Simplified Process Flow Diagram | 242 |
| Figure 26.8 – Work Breakdown Structure (WBS) – Page 1 | 243 |
| Figure 26.9 – Work Breakdown Structure (WBS) – Page 2 | 244 |
| Figure 26.10 – Work Breakdown Structure (WBS) – Page 3 | 245 |
| Figure 26.11 – Pro Forma Cash Flow | 246 |
Los Azules Preliminary Assessment Technical Report
SE Project No. 8019-01
viii
Exhibit 99.1
|
|
| |
| List of Tables |
| |
| Table 3.1 Inferred Mineral Resources | 6 |
| Table 3.2 Inferred Mineral Resources Contained Within Designed Pit / Phases | 7 |
| Table 3.3 Locked-Cycle Test Work Results | 8 |
| Table 3.4 Basic Design Criteria | 11 |
| Table 3.6 LoM Operating Cost Summary | 15 |
| Table 3.7 LoM Capital Cost Summary | 16 |
| Table 3.8 Production, Metal Prices, Royalties and Smelting-Refining (“TC-RC”) Terms | 18 |
| Table 3.9 Concentrate Productions & Payable Metals | 19 |
| Table 4.1 List of Contributing Authors | 22 |
| Table 6.1 Los Azules Property Claim Status | 31 |
| Table 6.2 MIM Property Claim Status | 32 |
| Table 6.3 List of Main Permits by Stages of the Life of Mine | 40 |
| Table 7.2 Site Climate Data | 45 |
| Table 7.3 Neighboring Projects | 49 |
| Table 7.4 Estimated Cost of Power Supply Components | 49 |
| Table 7.5 Estimated Cost of Power Supply Options | 50 |
| Table 13.1 Exploration Drilling by Year and by Company | 78 |
| Table 13.2 Significant Drilling Results | 81 |
| Table 15.1 Sample Control Standards (2006 – 2007) | 87 |
| Table 18.1 Locked-Cycle Test Work Results | 102 |
| Table 18.2 Evaporation Site Location | 109 |
| Table 19.1 Mineral Zone Domains and Coding | 125 |
| Table 19.2 Mineral Zone Domains and Coding | 128 |
| Table 19.3 Variogram Parameters for Copper | 133 |
| Table 19.4 Block Model Limits | 133 |
Los Azules Preliminary Assessment Technical Report
SE Project No. 8019-01
ix
Exhibit 99.1
|
|
| |
| Table 19.5 Interpolation Parameters for Copper | 136 |
| Table 19.6 Inferred Mineral Resources | 143 |
| Table 19.7 Base Case Economic Parameters | 144 |
| Table 19.8 Floating Cone Results | 145 |
| Table 19.9 Open Pit Design Parameters | 146 |
| Table 19.10 Inferred Mineral Resources Contained Within Designed Pit / Phases | 147 |
| Table 20.1 Mine Production Scheduling Parameters | 149 |
| Table 20.2 Mine Production Schedule Based on Inferred Mineral Resources | 150 |
| Table 20.3 Major Mining Equipment Fleet Requirements | 155 |
| Table 20.4 Mine Personnel Requirements | 156 |
| Table 20.5 Main Access Road Design Criteria | 161 |
| Table 20.6 Acid Generation Potential Testing Sample Points | 165 |
| Table 20.7 Acid Generation Potential Testwork Parameters of Interest – ABA Testing Program | 166 |
| Table 20.8 Classification of ABA Test Results | 166 |
| Table 20.9 TSF Design Criteria | 169 |
| Table 20.10 Tailings – Comparative Analysis of Important ARD and Leaching Parameters | 172 |
| Table 20.11 Specific Hydraulic Yields – San Juan River Basin | 174 |
| Table 20.12 Preproduction Capital Cost Estimate Summary | 187 |
| Table 20.13 Summary of Mine Capital Expenditures | 195 |
| Table 20.14 Production, Metal Prices, Royalties and Smelting-Refining (“TC-RC”) Terms | 197 |
| Table 20.15 Concentrate Productions & Payable Metals | 198 |
| Table 20.16 LoM Capital Cost Summary | 199 |
| Table 20.17 LoM Operating Cost Summary | 200 |
| Table 20.18 Project Economic Summary | 202 |
| Table 21.1 Budget Estimate for Work Plan | 207 |
Los Azules Preliminary Assessment Technical Report
SE Project No. 8019-01
x
Exhibit 99.1
| Table 23.1 SI Base Units | 226 |
| Table 23.2 Permitted Base Units | 226 |
| Table 23.3 SI Prefixes | 227 |
| Table 23.4 Derived SI Units of Special Name | 228 |
| Table 23.5 Units in Use | 228 |
| Table 23.6 Common Derived Units (Select List Only) | 229 |
| Table 23.7 Abbreviations of Other Terms | 230 |
Los Azules Preliminary Assessment Technical Report
SE Project No. 8019-01
xi
Exhibit 99.1
3.0
Summary
Los Azules Preliminary Assessment Technical Report
SE Project No. 8019-01
1
3.1
Overview of the Study
Minera Andes, Inc. (“MAI”) commissioned a Preliminary Assessment (“PA”) for its Los Azules project in 2008. The PA was prepared to define the overall scope of the Los Azules project, perform preliminary mine planning, report on metallurgical testwork and process design, estimate capital and operating costs and estimate the economics of developing the project as an open pit mine and mill facility. All monetary amounts presented in this report are in US$ unless specified otherwise.
The results of the PA were announced by MAI by way of news release dated February 5, 2009. This technical report has been prepared pursuant to section 4.2(j)(i) of National Instrument 43-101 “Standards of Disclosure for Mineral Projects” (“NI 43-101”) and in accordance with NI 43-101F1.
As a result, this report discloses a preliminary assessment that includes inferred mineral resources. Inferred mineral resources are considered too speculative geologically to have the economic considerations applied to them that would enable them to be categorized as mineral reserves, and there is no certainty that the preliminary assessment will be realized. The basis for the preliminary statements and the qualifications and assumptions made by the authors of this report are set out herein.
3.2
Property Description and Ownership, Location, Infrastructure and History
3.2.1
Property Description and Ownership
The Los Azules project is located near 31° 13' 30" south latitude and 70° 13' 50" west longitude in the western portion of San Juan Province, Calingasta Department, adjacent to the Argentina/Chilean border as shown in Figure 3.1.
The Los Azules project is about 20,612 ha (50,933 acres) and was discovered by MAI geologists through regional exploration in the Andes. The project is situated between two prolific mineral belts and is held by two “Manefestaciones de Discubrimiento”.
The project’s mineralized area straddles property currently held by Xstrata Copper to the north and MAI to the south. MAI has held the southern portion of the property since 1994. Xstrata Copper and MAI have entered into an Option and Joint Venture Agreement dated November 2, 2007 governing exploration of the properties held by each of them comprising the Los Azules project (the “Los Azules Option Agreement”).
The hydrothermal system at Los Azules is an altered area approximately 8 km (N-S) by 5 km (E-W) surrounding a core mineralized porphyry target that is about 3 km by 1 km in size. Initial exploration efforts have been typical for a porphyry type deposit and have used a hole spacing of 400 m (N-S) and 200 m (E-W). Now that mineralization has been confirmed, MAI is continuing to infill drill the grid spacing in order to upgrade the mineral resource estimate from an Inferred status to an Indicated and Measured status in preparation for a Prefeasibility Study.
Los Azules Preliminary Assessment Technical Report
SE Project No. 8019-01
2
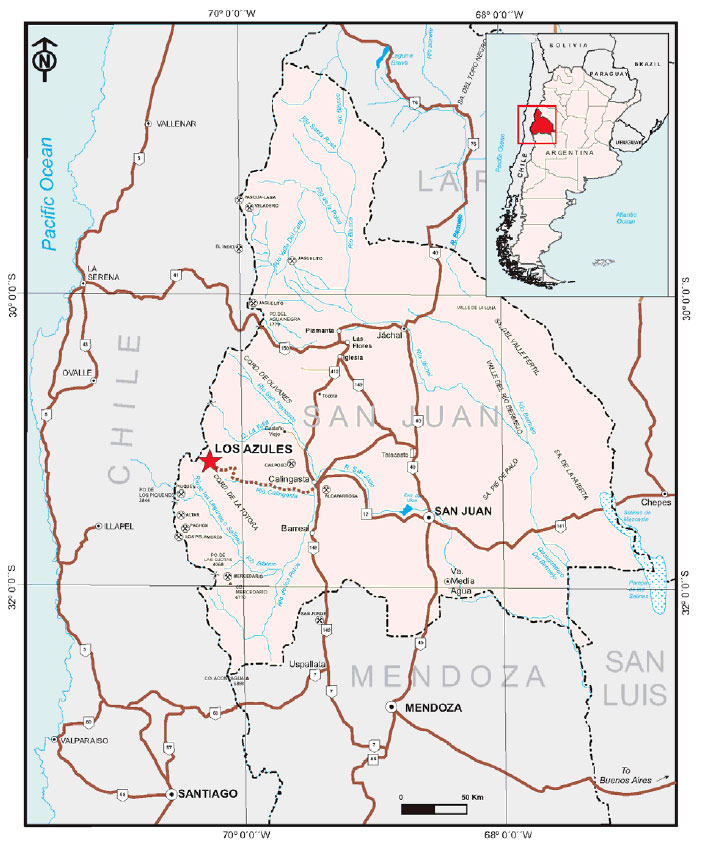
Figure 3.1 – Project Location
Los Azules Preliminary Assessment Technical Report
SE Project No. 8019-01
3
3.2.2
Property Location
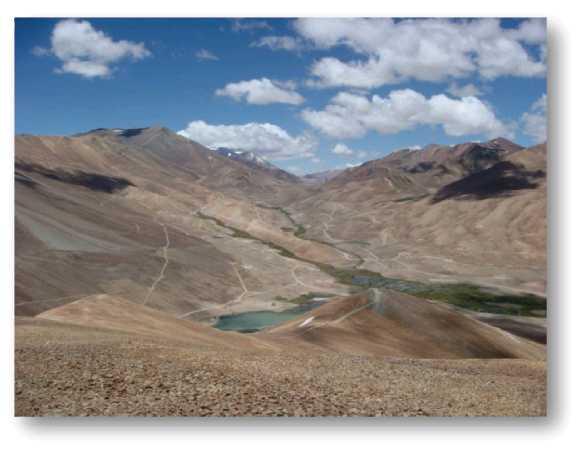
The Los Azules project is west and slightly north of the town Calingasta, in the San Juan Province of Argentina. The project site is accessed by 120 km of unimproved dirt road with eight river crossings and two mountain passes (both above 4,100 m elevation). Calingasta is located west of the city of San Juan along Route 12.
At the Los Azules project, elevation ranges between 3,500 m and 4,500 m above mean sea level. The climate is tundra-like (semiarid/cold) with abundant snowfall during winter and temperatures as low as -30°C. Frequent northwesterly winds can approach 120 km/hr.
Exploration work typically commences in November and terminates in early April.
3.2.3
Infrastructure
The Los Azules project area is quite remote and therefore, no infrastructure is present. In addition, there are no nearby towns and/or settlements. Exploration operations are carried by means of a man-camp near the project area.
The Calingasta substation is the nearest source of power to the Los Azules project; however, it is isolated from the provincial network. Power supply to the region is currently satisfied by means of local hydro or thermal generation.
The San Juan provincial government is planning to expand the existing 500 kV network, by among other things, building new 500/220 kV El Rodeo and Calingasta substations. In addition, a 500/220 kV San Juan substation, a 165 km San Juan to El Rodeo transmission line (“TL”) and a 160 km El Rodeo to Calingasta TL will also be constructed. Finally, the existing Gran Mendoza to San Juan TL will need to be upgraded from 220 kV to 500 kV.
3.2.4
Property History
On June 21, 2000 Battle Mountain Gold Corporation (“BMGC”) merged with Newmont Mining Corporation (“NMC”). Prior to the merger, BMGC explored a block of claims on the Chile-Argentine border and discovered a large hydrothermal alteration zone associated with dacite porphyry intrusions and stockwork structural zones, which was drilled with reverse circulation holes during 1998 and 1999. This discovery led to the recognition that the suggested porphyry copper-gold deposit area was not entirely contained within the lands controlled by BMGC. The merger with NMC failed and the BMGC properties were subsequently acquired by Sr. Bosque and Solitario Argentina S.A. (“SASA”) and later by MIM Argentina S.A. (“MIM”). Xstrata succeeded MIM and in 2007, signed an agreement with MASA optioning of the Los Azules lands now held by MAI (Section 6.4).
Los Azules Preliminary Assessment Technical Report
SE Project No. 8019-01
4
3.3
Geology and Resources
3.3.1
Regional Geology
The property is located in a geological province known as the Cordillera Frontal, a mountainous region situated between the Pre-Cordillera and the Cordillera Principal. This region, located along the western side of Argentina and adjacent to the Chilean border, covers the provinces of Catamarca, La Rioja, San Juan and Mendoza between latitude 21°00’ south and 36°46’ south.
During Middle to Lower Miocene times, active volcanism resulted in a geographically broad distribution of porphyry-type copper-gold epithermal gold-silver deposits over 250 km wide zone from the Andean Cordillera through the Pampean ranges.
3.3.2
Property Geology
The Los Azules project is based on a NNW-SSW-trending ridge (“La Ballena”) that exists at the southern end of a hydrothermally altered system approximately 8 km long (N-S) by 5 km wide (E-W), which surrounds a core mineralized porphyry target that is about 3 km long by 1 km wide.
Previous work recognizes two principal geological groups at Los Azules: an upper volcanic suite and a lower intrusive complex. The volcanic suite comprises a basal rhyolitic unit overlain by dacitic pyroclastics and andesitic flows. The lower suite is described as diorite-tonalite in composition with a dacite porphyry core. In addition, a rhyolitic-dacitic pyroclastic and volcaniclastic suite, interpreted to be part of the Choiyoi Group (Permian- Triassic) form the known basement rocks in the Los Azules area.
3.3.3
Resources
There appears to have been a very minor degree of near-surface remobilization of copper due to acidic fluids created from the breakdown of pyrite in this reducing environment. These mechanisms are well documented in relation to many porphyry copper deposits, often developing a high-grade blanket of “supergene” enrichment, which is overlain by a “leach” cap and is essentially void of contained metals. It is apparent that both of these types of mineralization zones (“Minzone”) have been developed at Los Azules and are underlain by primary sulfide mineralization comprised of pyrite, chalcopyrite and bornite.
Separate domains have been interpreted for overburden (“OVB”), leached (“LX”) and supergene (“SS”) zones using a combination of mineral zone logging (visual observation of enrichment minerals such as chalcocite and/or covellite) and assay grades. In many areas, the base of the SS zone is defined at the interval where the ratio of cyanide soluble copper (“CSCu”) to total copper (“TCu”) is greater than 60 percent. Soluble copper assay data is not present in all drill holes and hence, visual observation is utilized in these cases.
Los Azules Preliminary Assessment Technical Report
SE Project No. 8019-01
5
Overburden is thickest in the valley floor and thins as the slopes steepen to the west and east. Thicknesses are variable and range up to 100 m in some locations but average approximately 60 m in thickness above the zone of mineralization. The Leached zone is also locally variable in thickness from non-existent in some drill holes to almost 200 m thick in others. The average thickness of the Leach zone above the deposit is approximately 40 m. The underlying Supergene zone is also somewhat variable with thicknesses ranging from zero to over 250 m with an average of approximately 70 m.
3.3.4
Resource Classification
The mineral resources at the Los Azules deposit have been classified in accordance with the CIM definition standards for mineral resources and mineral reserves (CIM, 2005). At this stage of the project, the relative number and density of drill holes does not support the classification of resources in the measured or indicated categories. The classification parameters for inferred resources are defined in relation to the distance to sample data and are intended to encompass zones of reasonably continuous mineralization.
Inferred Mineral Resources are blocks in the supergene and primary domains which are a maximum distance of 200 m from a drill hole.
The Los Azules mineral resources are summarized in Table 3.1 at a series of copper cutoff grades. These cutoff grades are presented for comparison purposes only. In order to comply with CIM definitions regarding selection of a “base case”, a base case was selected at a cutoff grade of 0.35% copper, which is consistent with other operations exhibiting similar characteristics, potential scale of operation and location.
| | |
Table 3.1
Inferred Mineral Resources |
Cutoff Grade (TCu%) | Million Tonnes | TCu% |
0.30 | 1,171 | 0.50 |
0.35 | 922 | 0.55 |
0.40 | 727 | 0.60 |
0.50 | 451 | 0.69 |
0.60 | 273 | 0.78 |
0.70 | 161 | 0.87 |
0.80 | 93 | 0.97 |
Note: Mineral Resources do not have demonstrated economic viability. |
There are no known factors related to environmental, permitting, legal, title, taxation, socioeconomic, marketing or political issues which could materially affect the mineral resource.
Los Azules Preliminary Assessment Technical Report
SE Project No. 8019-01
6
3.3.5
Resources within Designed Pit Phases
Inferred mineral resources contained within each of the mining phases were based on an internal cutoff grade of 0.22% Cu. No dilution has been included in the estimates of mineral resources beyond that incorporated into the block model grades. Tonnages were based on an in-situ material density of 2.45 t/m3. An extraction rate of 100% was applied to the model tonnage estimates. Table 3.2 summarizes the estimated tonnage and grade of contained inferred mineral resources by mining phase.
| | | | | | | | |
Table 3.2
Inferred Mineral Resources Contained Within Designed Pit / Phases |
Phase | Mineral Resources* (>= 0.22% Cu Cutoff) | Waste (Million t) | Total (Million t) | Strip Ratio |
(Million t) | Cu (%) | Mo (%) | Au (g/t) | Ag (g/t) |
1 | 59 | 0.83 | 0.003 | 0.08 | 2.13 | 148 | 207 | 2.52 |
2 | 100 | 0.60 | 0.004 | 0.05 | 1.66 | 124 | 224 | 1.24 |
3 | 125 | 0.55 | 0.004 | 0.06 | 1.85 | 141 | 266 | 1.13 |
4 | 257 | 0.45 | 0.003 | 0.05 | 1.36 | 324 | 582 | 1.26 |
5 | 150 | 0.51 | 0.002 | 0.05 | 1.95 | 300 | 450 | 1.99 |
6 | 152 | 0.42 | 0.002 | 0.04 | 1.65 | 236 | 387 | 1.55 |
Total | 843 | 0.51 | 0.003 | 0.05 | 1.68 | 1,273 | 2,116 | 1.51 |
Inferred mineral resources have a great amount of uncertainty as to their existence and as to whether they can be mined legally or economically. It cannot be assumed that all or any part of inferred mineral resources will ever be upgraded to a higher category. |
The designed Los Azules ultimate pit is nearly six percent larger than the base case floating cone pit shell, which is within acceptable limits. This slight expansion is due to pit wall smoothing and the inclusion of haulage ramps within the pit design.
The ultimate pit contains approximately 843 million tonnes of potentially economic inferred mineral resources (above a 0.22% Cu internal cutoff) grading 0.51% Cu and has an estimated stripping ratio of about 1.5:1 (tonnes waste per tonne of mineralized material). Contained metal is estimated at 9.5 billion pounds of copper, 56 million pounds of molybdenum (molybdenum recovery is not being considered at the time of this report), 1.5 million troy ounces of gold and 46 million troy ounces of silver. Of the 843 million tonnes of inferred mineral resources, about 402 million tonnes are secondary sulfides grading 0.55% Cu and 441 million tonnes are primary sulfides grading 0.48% Cu.
This Technical Report supports a preliminary assessment within the meaning of NI 43-101 which includes inferred mineral resources that are considered too speculative geologically to have the economic considerations applied to them that would enable them to be categorized as mineral reserves.
Los Azules Preliminary Assessment Technical Report
SE Project No. 8019-01
7
3.4
Metallurgy
The scope of the metallurgical testing program was to determine the flotation response of Los Azules mineralized material samples and provide data for the design of the grinding and flotation circuits.
The metallurgical testwork indicated the flotation response on the samples tested are typical of ore deposits for the recovery of copper, gold and silver. Two composites and 16 drill core samples were sent to CH Plenge & Cia. for the metallurgical test work. Composite No. 1 is a secondary strong enrichment composite with 17% of the copper in chalcopyrite, while composite No. 2 is a primary weak enrichment composite with 49% of the copper in chalcopyrite. A small amount of high grade sample (No. 3) of primary sulfide with 75% of the copper in chalcopyrite was also sent to Plenge for metallurgical test work and it was confirmed that the high grade sample responded well to copper recovery by flotation.
Locked-cycle tests were performed on each of the two composites and Sample 3. The results of the locked-cycle tests are shown in Table 3.3.
| | | | | | |
Table 3.3
Locked-Cycle Test Work Results |
Composite | Concentrate Assay | Metal Recoveries (%) |
Copper (%) | Silver (g/t) | Gold (g/t) | Copper | Silver | Gold |
1 – Strong Enrichment | 35 | 101 | 2.7 | 94.1 | 70 | 56 |
2 – Weak Enrichment | 31 | 80 | 3.9 | 94.7 | 62 | 66 |
Sample 3 – High-grade Primary Sulfide | 34 | 84 | 2.4 | 95.1 | 83 | 74 |
These results were factored for use in the process design to relate laboratory results to expected industry capabilities. In this, composite No. 1 concentrate is 34% copper with 92% copper recovery, composite No. 2 is 30% copper with 93% copper recovery and sample No. 3 is 33% copper with 93% copper recovery. From the results of these two composites and sample a weighted final concentrate copper grade of 30.8% copper and a recovery of 92.8% copper were applied to the process design.
3.5
Process
3.5.1
Process Description
The process flow sheet (Figure 26.7) and the process block flow diagram (Figure 3.2) show a plant design representative of a conventional flotation concentrator.
The Los Azules concentrator will have an annual throughput of 36,000,000 tonnes, based on an average daily throughput of 100,000 tonnes and 360 operating days per annum. The concentrator on site will include a comminution circuit followed by a flotation circuit and a copper circuit with thickener, filtration and concentrate load out and shipping. Tailings thickener, tailings storage, and water reclaim are part of the tailings storage facilities (“TSF”). This circuit will have a design capacity of 108,696 tonnes per day (“tpd”) and the aforementioned nominal capacity of 100,000 tpd.
Los Azules Preliminary Assessment Technical Report
SE Project No. 8019-01
8
The 1524 mm x 2794 mm (60 inch x 110 inch) primary gyratory crusher will produce a 175 mm (7 inch) feed which will be conveyed to a coarse material stockpile with a live capacity of 100,000 tonnes. Material from the stockpile is reclaimed and transported by conveyor to two (2) parallel grinding lines.
Each grinding line is comprised of one (1) 12.2 m diameter x 6.7 m long (40 ft x 22 ft) semi-autogenous grinding (“SAG”) mill powered by an 25 MW gearless drive, and one (1) 7.6 m diameter x 11.3 m long (25 ft x 37 ft) ball mill powered by a 15 MW dual pinion drive. The two (2) SAG mills discharge through trommel screens and the screens oversize (“critical”) report to two (2) 5.36 m x 3.87 m (17.6 ft x 12.7 ft) pebble crushers, each driven by a 1.0 MW motor, before returning to the SAG mills. Cyclone classification is employed to produce the required particle size distribution at P80 of 125 microns (“µm”).
This overflow will be fed to two (2) rougher flotation circuits. Tailings from the rougher flotation circuits will be combined and sent to two (2) scavenger flotation banks, while the concentrate from the scavenger circuit will be combined with the rougher concentrate and both will report to a regrind circuit, and the tails will report to the tailings thickener.
The combined rougher and scavenger concentrates are reduced to a P80 of 30 µm in six (6) 1,250 hp tower mills before being pumped to the 3-stage cleaner circuit.
The 1st cleaner underflow is transferred to the cleaner/scavenger flotation circuit and the reclaimed concentrate is sent back to the regrind circuit. The tailings from the cleaner/scavenger are then joined by the rougher and scavenger flotation tailings and transferred to two (2) 80 m (263 ft) diameter tailings thickeners.
The concentrate from the 1st cleaner flotation cells transfers to the 2nd cleaner flotation circuit. Tails from the 2nd cleaner circuit will be sent back to the 1st cleaner circuit. Concentrate from the 2nd cleaner will report to the 3rd cleaner flotation circuit.
Tails from the 3rd cleaner circuit report back to 2nd cleaner flotation. Concentrate from the 3rd cleaner reports to the copper concentrate thickener.
Final copper concentrate at 25% solids from the 3rd cleaner flotation concentrate stream will be thickened to 60% solids in one (1) 45 m (148 ft) diameter thickener. The copper concentrate thickener overflow reports back to the process water tank for reuse, while the thickened copper concentrate will be pumped via pipeline to the port facility of Coquimbo, Chile, which houses three (3) vertical pressure type dewatering filters. The filter cake containing 8% moisture reports to the covered copper concentrate stockpile for loading by a front-end loader to copper concentrate transport ships destined for smelters in the Orient. The filtrate will be pumped to an evaporation pond for final disposal.
Los Azules Preliminary Assessment Technical Report
SE Project No. 8019-01
9
3.5.2
Process Block Flow Diagram
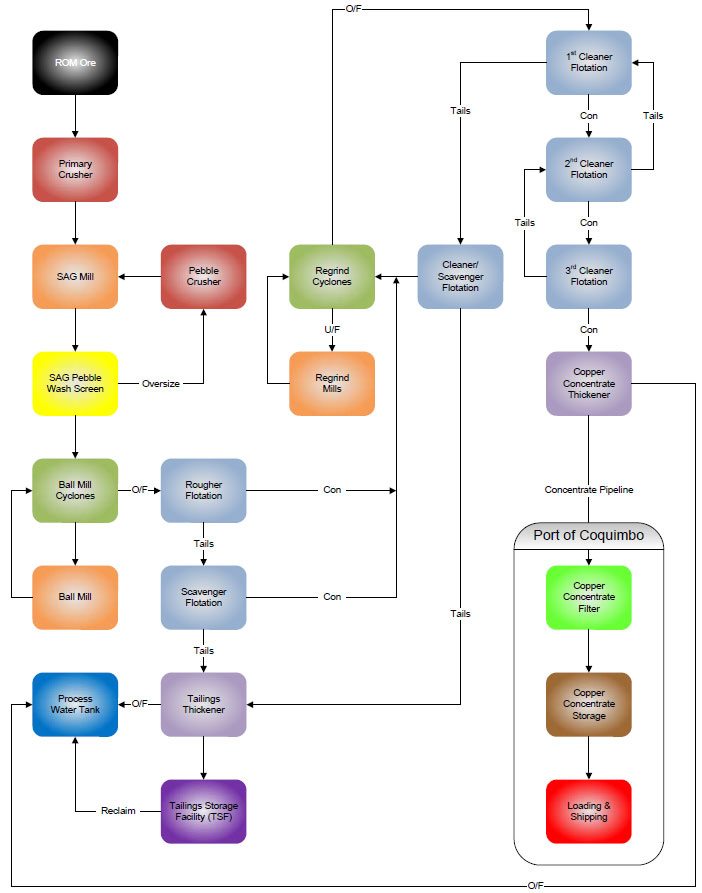
Figure 3.2 – Process Block Flow Diagram
Los Azules Preliminary Assessment Technical Report
SE Project No. 8019-01
10
3.5.3
Basic Process Design Criteria
Table 3.4 shows the design criteria used to establish the process for a 100,000 tonnes per day operation process facility.
| | | |
Table 3.4
Basic Design Criteria |
| Units | Design | Source |
General Site Information |
Location | | | |
Latitude - Approximate | angular | S31o13' 30" | Rojas y Asociados |
Longitude - Approximate | angular | W70o13' 50" | Rojas y Asociados |
Elevation | | | |
Minimum | masl | 3,650 | Minera Andes |
Maximum | masl | 3,900 | Minera Andes |
Ambient Air Temperature | | | |
Minimum | °C | -20o | Minera Andes |
Maximum | °C | 25o | Minera Andes |
Average Annual Precipitation | mm/y | 380 | Vector Engineering |
General Project Information |
Mineable Resource to Mill | tonnes (“t”) | 842,894,000 | WLR |
Estimated Project Life @ 100,000 tpd | y | 23.6 | Samuel Engineering |
Copper Grading | % | 0.51 | Minera Andes |
Gold Grading | g/t | 0.05 | Minera Andes |
Silver Grading | g/t | 1.68 | Minera Andes |
Operating Schedule | | | |
Hours per Day | h | 24 | Samuel Engineering |
Days per Year | d | 360 | Samuel Engineering |
Hours per Year | h | 8,640 | Samuel Engineering |
Plant Capacity | dmtpd | 100,000 | Samuel Engineering |
Based on a 92% grinding circuit operating time | dmtpd | 108,696 | Samuel Engineering |
Based on a 92% grinding circuit operating time | dmtph | 4,529 | Samuel Engineering |
Annual Mineralized Material Processed per Year | t | 36,000,000 | Samuel Engineering |
Copper Concentrate Production |
Copper Recovery to Copper Concentrate | % | 92.8 | Plenge/Samuel Engineering |
Copper Grade in Copper Concentrate | % | 30.8 | Plenge/Samuel Engineering |
Copper Concentrate Production | dmtph | 116 | Samuel Engineering |
Copper Concentrate Production | dmtpy | 1,002,146 | Samuel Engineering |
Los Azules Preliminary Assessment Technical Report
SE Project No. 8019-01
11
3.6
Tailings Storage Facility (“TSF”)
The mine plan estimates mine life at approximately 24 years with a production rate of approximately 100,000 tpd. It is estimated that approximately 98% of mineralized material fed into the process plant will be discharged as gangue (tailings) and co-disposed of into the TSF and waste rock disposal facility (“WRDF”). Current estimates show that approximately 80% [663 million tonnes (dry)] of the tailings will enter the TSF, while the remaining 20% [166 million tonnes (dry)] will be diverted to the WRDF. At an estimated average dry density of 1.3 tonnes/m3, this equates to approximately 510 million m3 placed in the TSF and 128 million m3 placed in the WRDF.
Tailings will be discharged by gravity from the process plant into the impoundment as slurry, a mixture of pulverized rock and water, estimated to contain 55% solids. In addition to the tailings, the TSF will hold ponded water which includes water that separates from the tailings slurry, incident rainfall, rainfall runoff from the surrounding catchment and water pumped into the TSF from other sources such as pit dewatering.
3.7
Waste Rock Disposal Facility (“WRDF”)
During 24 years of mining operations, it is calculated that approximately 1,272.7 million tonnes of waste rock will be generated from the open pit.
The WRDF will be located immediately west and downstream of the pit in Los Azules Valley and extend into the confluences with Embarrada Valley, and the Salinas Valley. It will ultimately buttress the TSF embankment located in the Embarrada Valley. Approximately 236 million tonnes of waste rock will be placed in the northern end of the pit. In-pit waste disposal will start in Year 16 of operation based on the current mine plan.
The total capacity of the WRDF is reduced by 389 million tonnes due to requirements for the construction of the TSF embankment and in-pit filling operations.
Figure 3.3 shows the general arrangement of the Los Azules project site components.
Los Azules Preliminary Assessment Technical Report
SE Project No. 8019-01
12
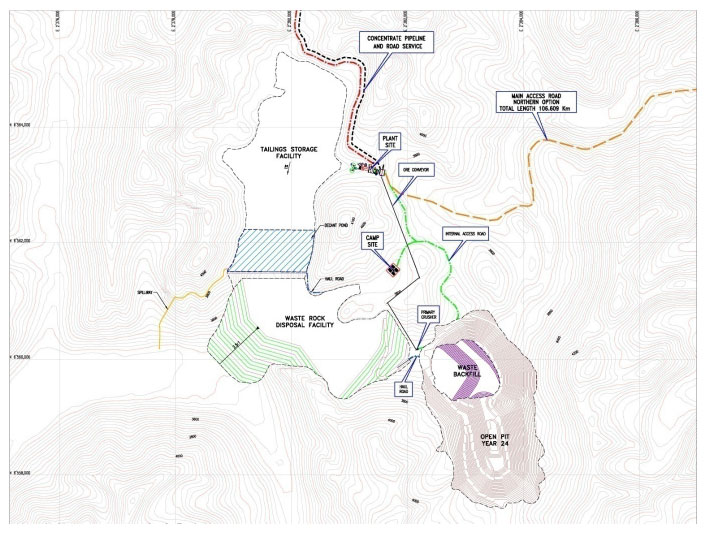
Figure 3.3 – General Arrangement Plan
3.8
Mine Plan
An allowance of five days per annum was made for weather delays and/or shutdowns for holidays. Otherwise, pit operations would be scheduled around the clock. Mineralized material feed for the first year of concentrator operations was limited to 29.55 million tonnes to account for a gradual ramp-up of milling rates during the first seven months after startup.
Only primary and secondary sulfide mineral resources above a 0.22% Cu cutoff were considered as mineralized material for purposes of developing the mine production schedule. Advanced stripping needed to maintain adequate mineralized material exposure was estimated for the above milling rates. A proprietary scheduling program sequenced the necessary material by bench, by phase, for each time period. Mining phases were processed in order, from the upper most benches downward. Concurrent phase mining was allowed for advanced stripping purposes, subject to the restriction that previous phases cannot be undercut by subsequent pushbacks. Table 3.5 summarizes the resulting mine production schedule.
Los Azules Preliminary Assessment Technical Report
SE Project No. 8019-01
13
|
|
| | | | | | | | |
Table 3.5
Mine Production Schedule Based on Inferred Mineral Resources |
Time Period | Mineral Resources* (>= 0.22% Cu Cutoff) | Waste (Million t) | Total (Million t) | Strip Ratio |
(Million t) | Cu (%) | Mo (%) | Au (g/t) | Ag (g/t) |
PP | 2.874 | 0.67 | 0.002 | 0.080 | 2.67 | 147.397 | 150.271 | 51.29 |
Y1* | 29.55 | 0.86 | 0.003 | 0.079 | 2.59 | 63.65 | 93.2 | 2.15 |
Y2 | 36.0 | 0.74 | 0.004 | 0.071 | 1.60 | 57.2 | 93.2 | 1.59 |
Y3 | 36.0 | 0.56 | 0.002 | 0.047 | 1.38 | 57.2 | 93.2 | 1.59 |
Y4 | 36.0 | 0.60 | 0.005 | 0.052 | 1.44 | 57.2 | 93.2 | 1.59 |
Y5 | 36.0 | 0.61 | 0.005 | 0.057 | 2.10 | 57.2 | 93.2 | 1.59 |
Y6 | 36.0 | 0.56 | 0.003 | 0.057 | 1.69 | 57.2 | 93.2 | 1.59 |
Y7 | 36.0 | 0.55 | 0.004 | 0.076 | 1.59 | 57.2 | 93.2 | 1.59 |
Y8 | 36.0 | 0.55 | 0.004 | 0.065 | 2.35 | 57.2 | 93.2 | 1.59 |
Y9 | 36.0 | 0.44 | 0.003 | 0.039 | 1.26 | 57.2 | 93.2 | 1.59 |
Y10 | 36.0 | 0.41 | 0.002 | 0.033 | 1.12 | 52.6 | 88.6 | 1.46 |
Y11 | 36.0 | 0.40 | 0.003 | 0.047 | 1.15 | 52.6 | 88.6 | 1.46 |
Y12 | 36.0 | 0.41 | 0.003 | 0.054 | 1.32 | 52.6 | 88.6 | 1.46 |
Y13 | 36.0 | 0.60 | 0.004 | 0.066 | 1.87 | 52.6 | 88.6 | 1.46 |
Y14 | 36.0 | 0.47 | 0.003 | 0.053 | 1.72 | 52.6 | 88.6 | 1.46 |
Y15 | 36.0 | 0.46 | 0.004 | 0.058 | 1.45 | 52.6 | 88.6 | 1.46 |
Y16 | 36.0 | 0.47 | 0.003 | 0.060 | 2.27 | 52.6 | 88.6 | 1.46 |
Y17 | 36.0 | 0.57 | 0.002 | 0.058 | 1.57 | 52.6 | 88.6 | 1.46 |
Y18 | 36.0 | 0.51 | 0.002 | 0.053 | 1.85 | 52.6 | 88.6 | 1.46 |
Y19 | 36.0 | 0.44 | 0.002 | 0.046 | 1.83 | 52.6 | 88.6 | 1.46 |
Y20 | 36.0 | 0.45 | 0.002 | 0.045 | 1.90 | 51.627 | 87.627 | 1.43 |
Y21 | 36.0 | 0.40 | 0.002 | 0.044 | 1.52 | 14.07 | 50.07 | 0.39 |
Y22 | 36.0 | 0.37 | 0.002 | 0.046 | 1.67 | 5.749 | 41.749 | 0.16 |
Y23 | 36.0 | 0.45 | 0.002 | 0.045 | 1.69 | 3.126 | 39.126 | 0.09 |
Y24 | 21.344 | 0.52 | 0.001 | 0.043 | 1.49 | 3.522 | 24.866 | 0.17 |
Total | 845.767 | 0.51 | 0.003 | 0.050 | 1.68 | 1,272.743 | 2,118.51 | 1.50 |
* Includes rehandling 2.874 million t of stockpiled ROM mineralized material during Year 1. |
Mineralized material feed to the mills would total 842,894 kt over the life of the mine, which is projected at 23.6 years. About 2,874 kt of run-of-mine (“ROM”) mineralized material stockpiled during preproduction stripping would be reclaimed and hauled to the primary crusher during Year 1.
Los Azules Preliminary Assessment Technical Report
SE Project No. 8019-01
14
Peak material handling rates from Years 2-9 would average nearly 259,000 tpd, before settling back to about 246,000 tpd from Year 10 through late Year 20. Over 150 million tonnes of waste rock and mineralized material would be stripped during preproduction to expose sufficient mineralized material for the concentrator startup. Preproduction stripping operations would last approximately two years.
A rotating, four-crew system would be used to staff mine operations and maintenance craft labor positions. These crews would work 12-hour shifts. Peak manpower levels of 595 are projected for Years 12-14.
3.9
Operating Costs
The total life-of-mine (“LoM”) operating cost is estimated at $6.40 billion, or $7.59/t mineralized material as summarized in Table 3.6. Figure 3.4 shows the percentage of each operating cost component.
| | |
Table 3.6
LoM Operating Cost Summary |
Description | LoM Cost ($000s) | LoM Cost/t Mineralized Material ($) |
Mining | 2,367,702 | 2.81 |
Processing | 3,308,494 | 3.92 |
General & Administrative | 603,857 | 0.72 |
Mine Reclamation / Closure | 116,106 | 0.14 |
LoM Operating Cost | 6,396,159 | 7.59 |
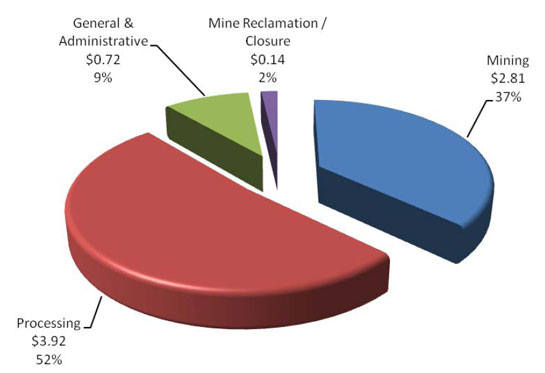
Figure 3.4 – LoM Operating Costs per Tonne Mineralized Material
Los Azules Preliminary Assessment Technical Report
SE Project No. 8019-01
15
3.10
Capital Costs
The total capital cost is estimated at $3.49B, being comprised of $2.75B during preproduction, $39.0M for working capital, and $704M in sustaining capital over the LoM. The estimate is summarized in Table 3.7.
| | |
Table 3.7
LoM Capital Cost Summary |
Description | Units | LoM Cost |
Mine Area Facilities | $000s | 31,332 |
Mineralized Material Storage, Handling and Crushing | $000s | 111,870 |
Grinding and Concentrating | $000s | 318,141 |
Tailings | $000s | 68,487 |
Concentrate Transport | $000s | 144,357 |
Port Concentrate Handling Facilities | $000s | 81,687 |
Utilities | $000s | 49,229 |
Off-site Infrastructure | $000s | 178,052 |
Site Development | $000s | 135,160 |
Contracted Indirects | $000s | 486,333 |
Owner Directs | $000s | 414,758 |
Owner Indirects | $000s | 186,970 |
Freight, Duties & Taxes | $000s | 119,628 |
Contingency | $000s | 421,630 |
Total Preproduction Capital | $000s | 2,747,634 |
Sustaining | $000s | 703,549 |
Working Capital | $000s | 39,021 |
Total LoM Capital | $000s | 3,490,204 |
The accuracy target for this capital cost estimate is intended to be plus or minus 35%. Most of the costs have been derived using a recently completed estimate for a similar plant, located in the Peruvian Andes, and making adjustment for project specific requirements and differences.
The costs presented in this document are based on estimates prepared as of December 2008 and no provision has been included to offset future escalation in prices.
Where source information was provided in other currencies, these amounts have been converted at rates shown in Figure 3.5.
Los Azules Preliminary Assessment Technical Report
SE Project No. 8019-01
16
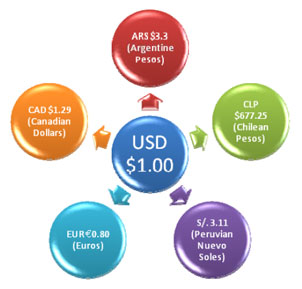
Figure 3.5 – Foreign Currency Conversion Rates
The rate of foreign currency exchange could have a serious impact on the value of labor and materials obtained in the local market (including freight, duties, and taxes). In addition, the value of the U.S. dollar against other world currencies could also influence future project cost if equipment is purchased in Europe or elsewhere. No funds have been allocated in the estimate to offset potential future currency fluctuations.
3.11
Project Economics
The PA set out herein is preliminary in nature and includes inferred mineral resources that are considered too speculative geologically to have the economic considerations applied to them that would enable them to be categorized as mineral reserves. There is no certainty that the PA will be realized.
The project before-tax pro forma cash flow (Figure 26.11) shows an 10.8% IRR and a $496 million NPV at an 8% discount rate.
The pro forma cash flow used the following conventional methodology:
·
unleveraged 100% equity basis (no project financing or debt);
·
stand-alone project basis;
·
no export retentions;
·
before-tax determination of project economics;
·
annual cash flows discounted on end of year basis;
·
costs in third quarter 2008 U.S. Dollars (US$); and
·
no employee profit sharing.
The general parameters used in the economic analysis are shown in Table 3.8. The preproduction period is estimated at four years including one year for preparation of a feasibility study and three years for project development and construction.
Los Azules Preliminary Assessment Technical Report
SE Project No. 8019-01
17
| |
Table 3.8
Production, Metal Prices, Royalties and Smelting-Refining (“TC-RC”) Terms |
Parameter | Data |
General |
Estimate Basis | Third quarter 2008 |
Preproduction Period | Three years |
Mine Production Life | 23.6 years |
Inferred Mineral Resources (Contained within Designed Pit) | 842,894,000 t |
Annual Mineralized Material Production Capacity | 36,000,000 t |
Market Prices |
Copper Price | $1.90/lb |
Gold Price | $750.00/oz |
Silver Price | $12.00/oz |
Royalties |
San Juan Province | 3.00% |
Xstrata Land Agreements | 0.00% |
Transportation, Smelting, and Refining Charges and Terms |
Copper Concentrate Transportation – Ocean Shipping | $55/wmt Cu conc. |
Copper Concentrate Treatment Charge | $70/dmt conc. |
Copper Refining Charge | $0.075/lb (payable) |
Gold Refining Charge | $5.00/oz (payable) |
Silver Refining Charge | $0.45/oz (payable) |
Copper Payfor | 96.5% |
Gold Payfor (net of deductions) | 54.9% |
Silver Payfor (net of deductions) | 59.4% |
Los Azules Preliminary Assessment Technical Report
SE Project No. 8019-01
18
Table 3.9 summarizes the LoM concentrate productions and payable metals.
| | |
Table 3.9
Concentrate Productions & Payable Metals |
Description | Units | Value |
Copper Concentrate |
Copper Concentrate | t | 12,542,753 |
Copper Concentrate Grade | % | 31.9 |
Contained Copper | t | 4,002,595 |
Gold Content | g/t | 2.22 |
Contained Gold | oz | 895,231 |
Silver Content | g/t | 74.0 |
Contained Silver | oz | 29,827,136 |
Payable Metals |
Copper | t | 3,856,672 |
Gold | oz | 491,233 |
Silver | oz | 17,702,746 |
The Los Azules Project is at the exploration stage of investigation; consequently, this study is at the scoping level of accuracy, preliminary in nature, and includes inferred mineral resources in the conceptual mine plan and the mine production schedule. Inferred mineral resources are considered too speculative geologically to have the economic considerations applied to them that would enable them to be categorized as mineral reserves under the standards set forth in NI 43-101. There is no certainty that the preliminary assessment will be realized. |
3.12
Conclusions & Recommendations
The total project capital cost is estimated at $3.49 billion, being comprised of $2.75 billion during preproduction, $39.0 million for working capital, and $704 million in sustaining capital over the LoM. The total LoM operating cost is estimated at $6.40 billion, or $7.59/t mineralized material.
The project before-tax pro forma cash flow shows an 10.8% IRR and a $496 million NPV at an 8% discount rate.
The deposit is open-ended, and further drilling will be required to fully define the limits of the mineralization, especially along strike to the north and at depth.
The deposit requires further drilling to achieve the drill hole density required to support an indicated resource prior to a prefeasibility study.
A review of alternatives to reduce capital and operating costs at the prefeasibility stage of the project would provide opportunities to improve project economics.
A detailed list of additional recommendations for future work and studies can be found in Section 22.0 of this report.
Los Azules Preliminary Assessment Technical Report
SE Project No. 8019-01
19
4.0
Introduction
Los Azules Preliminary Assessment Technical Report
SE Project No. 8019-01
20
4.1
Purpose of Technical Report
Minera Andes, Inc. (“MAI”) commissioned a Preliminary Assessment (“PA”) for its Los Azules project in 2008. The scope of the study was to assist management of MAI in making decisions with respect to the potential development of the Los Azules project. The PA was prepared to define the overall scope of the Los Azules project, perform preliminary mine planning, report on metallurgical test work and process design, estimate capital and operating costs and determine the economics to develop the project as an open pit mine and mill facility.
The results of the PA were announced by MAI in a press release dated February 5, 2009. As a result, this report was prepared pursuant to Section 4.2(j)(i) of National Instrument 43-101 under the direction of Randolph P. Schneider, MAusIMM, Project Manager, SE, as an independent “Qualified Person” as defined in the Instrument.
This report is intended to be read as a whole, and sections should not be read or relied upon out of context. This report contains the expression of the professional opinions of the contributors to this report and other consultants, based upon information available at the time of preparation. The quality of the information, conclusions and estimates contained herein is consistent with the intended level of accuracy as set out in this report, as well as the circumstances and constraints under which the report was prepared which are also set out herein.
4.2
Sources of Information
This report is the product of technical contributions from the consultants listed below and in Table 4.1:
·
Randolph P. Schneider, MAusIMM – IQP, Study Manager, Samuel Engineering, Inc.
·
Robert Sim, P.Geo – QP, Consulting Geologist, SIM Geological, Inc.
·
Bruce Davis, PhD, FAusIMM – QP, Consulting Geostatistician, BD Resource Consulting, Inc.
·
William L. Rose, P.E. – QP, Consulting Mining Engineer, WLR Consulting, Inc.
·
Scott C. Elfen, P.E. – QP, Consulting Civil Engineer, Vector Perú S.A.C.
·
Kenneth Rippere – Geotechnical Consultant
MAI contracted MTB Project Management Professionals, Inc. (“MTB”) to be the project manager and Samuel Engineering, Inc. (“SE”) to produce the PA. MTB contributed to infrastructure, and capital and operating costs; WLR Consulting contributed mineral reserve, mining and production schedule estimates, and mining capital and operating costs; Kenneth Rippere performed the geotechnical review and analysis of pit slopes; CH Plenge & Cia. performed metallurgical testwork; SE contributed the process engineering, capital and operating costs, and the cash flow modeling and valuation; and Vector Engineering was responsible for tailings and waste rock with associated capital and operating costs, and baseline environmental and socioeconomic studies.
Los Azules Preliminary Assessment Technical Report
SE Project No. 8019-01
21
|
|
| | | |
Table 4.1
List of Contributing Authors |
Section No. | Section Name | Company | Responsible Party |
1 | Title Page | SE | Randolph P. Schneider, MAusIMM |
2 | Table of Contents | SE | Randolph P. Schneider, MAusIMM |
3 | Summary | SE | Randolph P. Schneider, MAusIMM |
4 | Introduction | SE | Randolph P. Schneider, MAusIMM |
5 | Reliance on Other Experts | SE | Randolph P. Schneider, MAusIMM |
6 | Property Description and Location | SE VEC | Randolph P. Schneider, MAusIMM Scott C. Elfen, P.E. |
7 | Accessibility, Climate, Local Resources, Infrastructure, and Physiography | SE VEC | Randolph P. Schneider, MAusIMM Scott C. Elfen, P.E. |
8 | History | SE | Randolph P. Schneider, MAusIMM |
9 | Geological Setting | SE | Randolph P. Schneider, MAusIMM |
10 | Deposit Types | SE | Randolph P. Schneider, MAusIMM |
11 | Mineralization | SE | Randolph P. Schneider, MAusIMM |
12 | Exploration | SE | Randolph P. Schneider, MAusIMM |
13 | Drilling | SE | Randolph P. Schneider, MAusIMM |
14 | Sampling Method and Approach | SE | Randolph P. Schneider, MAusIMM |
15 | Sample Preparation, Analysis and Security | SIM BDRC | Robert Sim, P.Geo Bruce Davis, PhD, FAusIMM |
16 | Data Verification | SE SIM | Randolph P. Schneider, MAusIMM Robert Sim, P.Geo |
17 | Adjacent Properties | SE | Randolph P. Schneider, MAusIMM |
18 | Mineral Processing and Metallurgical Testing | SE VEC | Randolph P. Schneider, MAusIMM Scott C. Elfen, P.E. |
19 | Mineral Resource Estimate | SIM BDRC WLR | Robert Sim, P.Geo Bruce Davis, PhD, FAusIMM William L. Rose, P.E. |
20 | Other Relevant Data and Information | ALL | ALL |
21 | Interpretations and Conclusions | ALL | ALL |
22 | Recommendations | ALL | ALL |
23 | References | ALL | ALL |
24 | Date and Signature Pages | ALL | ALL |
25 | Additional Requirements for Technical Reports on Development Properties and Production Properties | SE | Randolph P. Schneider, MAusIMM |
26 | Illustrations | SE WLR | Randolph P. Schneider, MAusIMM William L. Rose, P.E. |
Abbreviations: ALL – All QP Contributors; BDRC – BD Resource Consulting; MAI – Minera Andes, Inc. (Client); MTB – MTB Project Management Professionals, Inc.;
SE – Samuel Engineering, Inc.; SIM – SIM Geological, Inc.; VEC – Vector Engineering, Inc.; WLR – WLR Consulting, Inc. |
Los Azules Preliminary Assessment Technical Report
SE Project No. 8019-01
22
4.3
Site Visit
Randolph P. Schneider, MAusIMM, Project Manager, Mining & Minerals, of Samuel Engineering visited the project site February 19-21, 2008. The primary focus of the site visit was to evaluate site layout options for the mine shop, primary crusher, conveyor, mill site, tailings pond, waste rock, and topsoil material. In addition, observe first-hand the project site and drilling activities and to talk with various site personnel.
Robert Sim, P.Geo, of SIM Geological, Inc. visited the project site from March 30 to April 1, 2008 to observe first-hand the project site, observe drilling/sampling/logging practices, and to examine available drill core. In addition, available reports, cross sections, geologic interpretations and other relevant geologic data were reviewed and discussed with Minera Andes geology personnel.
Scott C. Elfen, General Manager, of Vector Perú S.A.C. visited the project site on February 21, 2008. The primary focus of the site visit was to observe first-hand the project site and gain an understanding of potential siting facility issues from a geotechnical and hydrology design point for the general infrastructure, open pit, tailings storage facility, waste rock disposal facility, access road, and pipeline corridor.
Bruce Davis, PhD, FAusIMM, of BD Resource Consulting, has not visited the project site since it is not necessary to do so in order to apply geostatistical analysis and co-develop the resource estimate along with Robert Sim.
William L. Rose, P.E. of WLR Consulting, Inc., has not visited the project site since the mine plan and mine production schedule were developed exclusively from the resource estimate provided by Robert Sim and Bruce Davis.
Los Azules Preliminary Assessment Technical Report
SE Project No. 8019-01
23
5.0
Reliance on Other Experts
Los Azules Preliminary Assessment Technical Report
SE Project No. 8019-01
24
5.1
Reliance on Other Experts
The contributors to this report have, in the preparation of Sections 6.2 and 6.3 of this report, relied upon an opinion on current validity of the Los Azules mineral concessions held by Minera Andes, Inc. (“MAI”) expressed by the Argentinean lawyer, Mr. Jose Maria Sayavedra, on behalf of MAI, in a letter dated January 14, 2009. Samuel Engineering, Inc. (“SE”) has not conducted a legal review of the land ownership or property boundaries and is relying on the legal opinion of Mr. Sayavedra. Each of the contributors to this report hereby disclaims liability for Sections 6.2 and 6.3 of this report as they relate to title.
Randolph Schneider, the Study Manager, has not conducted an independent verification of geologic data used in the mineral resource estimate and is relying upon information provided by Robert Sim, P.Geo in the preparation of Section 16.0.
5.2
Previous Technical Reports
Information set out in Sections 6 to 17 of this report can be found in the report titled, “Los Azules Copper Project, San Juan Province, Argentina” prepared by Donald B. Tschabrun, MAusIMM, Tetra Tech, Golden, CO, USA with a revised date of January 8, 2009. Section 6.4 was updated by the title opinion presented in Section 5.1 above.
Information forming the basis of Section 9.0 can be found in the report titled, “Technical Report – Los Azules – February 2008”, prepared by Nivaldo Rojas of Rojas y Asociados, Mendoza, Argentina. This report was also used to prepare the Tetra Tech report above.
Information set out in Section 7.3.2 of this report can be found in the report titled, “Los Azules Mining Project Pre-Feasibility Study – Electric Energy Supply Study”, prepared by SIEye and HGF & Asociados.
Los Azules Preliminary Assessment Technical Report
SE Project No. 8019-01
25
6.0
Property Description and Location
Los Azules Preliminary Assessment Technical Report
SE Project No. 8019-01
26
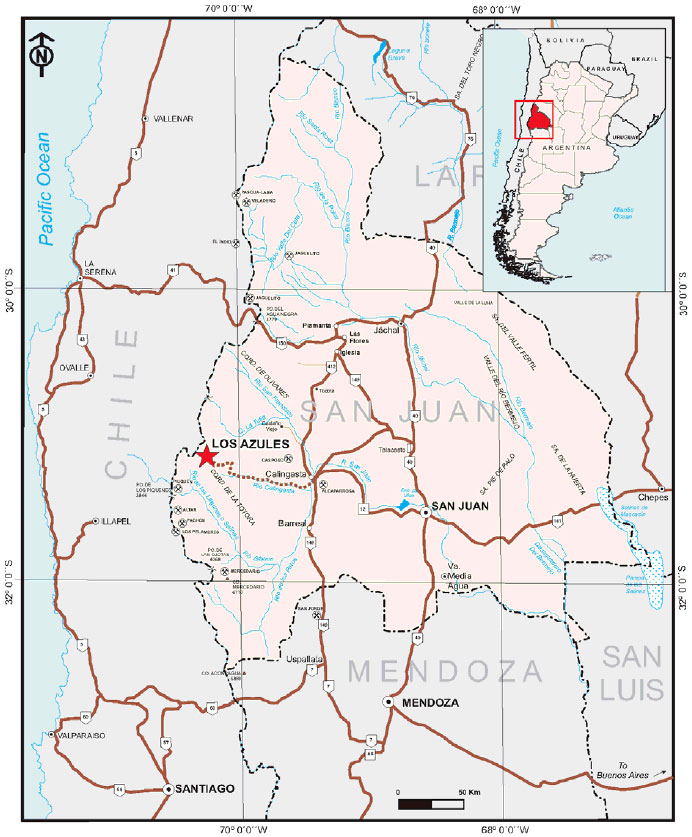
Figure 6.1 - Project Location
Los Azules Preliminary Assessment Technical Report
SE Project No. 8019-01
27
6.1
Location
The Los Azules project is located in the Frontal Cordillera of Argentina near 31° 13' 30" south latitude and 70° 13' 50" west longitude in the western portion of San Juan Province, Calingasta Department, adjacent to the Argentina/Chilean border as shown in Figure 6.1. Elevation ranges from 2,500 m to 5,500 m with moderate to high relief.
The Los Azules project is about 20,612 ha (50,933 acres) and was discovered by Minera Andes, Inc. (“MAI”) geologists through regional exploration in the Andes. The project is situated in Argentina near the Argentina/Chile border between two prolific mineral belts that straddle the border. To the north of the property, the El Indio gold belt is host to multi-million ounces of gold, and includes significant gold discoveries such as Veladero, Sancarron, Pascua and El Indio-El Tambo. The property lies in a belt of porphyry copper prospects such as El Pachón (Xstrata), El Altar (Rio Tinto), Los Piuquenes (Rio Tinto) and Rincones de Araya (Tenke).
The project’s mineralized area straddles property currently held by Xstrata Copper to the north and MAI to the south. MAI has held the southern portion of the property since 1994. The northern portion of the property has been held and explored by Battle Mountain Gold Corporation (“BMGC”) from 1994 - 1999 and by Mount Isa Mines (“MIM”), now Xstrata Copper, from 2004 to the present time.
The hydrothermal system at Los Azules is an altered area approximately 8 km (N-S) by 5 km (E-W) surrounding a core mineralized porphyry target that is about 3 km by 1 km in size.
Aerial photographic analysis and global positioning were utilized to locate the property boundaries.
6.2
Property and Title in Argentina
The laws, procedures and terminology regarding mineral title in Argentina differ considerably from those in the United States and in Canada. Mineral rights in Argentina are separate from surface ownership and are owned and administered by the provincial governments. The following summarizes some of the Argentinean mining law terminology in order to aid in understanding the MAI land holdings in Argentina.
6.2.1
Cateo
A cateo is an exploration concession which does not permit mining but gives the owner a preferential right to a mining concession for the same area. Cateos are measured in 500 ha unit areas. A cateo cannot exceed 20 units (10,000 ha). No person may hold more than 400 units in a single province. The term of a cateo is based on its area: 150 days for the first unit (500 ha) and an additional 50 days for each unit thereafter. After a period of 300 days, 50% of the area over four units (2,000 ha) must be dropped. At 700 days, 50% of the area remaining must be dropped. At each stage the land can be converted to one or more “Manifestaciones de Discubrimiento” (“MD”).Time extensions may be granted to allow for bad weather and difficult access. Cateos are identified by a file number or "expediente" number.
Los Azules Preliminary Assessment Technical Report
SE Project No. 8019-01
28
Cateos are awarded by the following process:
·
Application for a cateo covering a designated area. The application describes a minimum work program for exploration;
·
Approval by the province and formal placement on the official map or graphic register;
·
Publication in the provincial official bulletin;
·
A period following publication for third parties to oppose the claim;
·
Awarding of the cateo.
The length of this process varies depending on the province, and commonly takes up to two years. Accordingly, cateo status is divided into those that are in the application process and those that have been awarded. If two companies apply for cateos on the same land, the first to apply has the superior right. During the application period, the first applicant has rights to any mineral discoveries made by third parties in the cateo without its prior consent. While it is theoretically possible for a junior applicant to be awarded a cateo, because applications can be denied, MAI knows of no instances where this has happened.
Applicants for cateos may be allowed to explore on the land pending formal award of the cateo, with the approval of the surface owner of the land. The time period after which the owner of a cateo must reduce the quantity of land held does not begin to run until 30 days after a cateo is formally awarded.
The mining act requires that a canon fee of ARS$400 be paid upon application for the cateo. This is paid only once.
6.2.2
Mina
To convert an exploration concession to a mining concession, some or all of the area of a cateo must be converted to a mina. Minas are mining concessions which permit mining on a commercial basis. The area of a mina is measured in "pertenencias". Each mina may consist of two or more pertenencias. "Common pertenencias" are six ha and "disseminated pertenencias" are 100 ha (relating to disseminated deposits of metals rather than discrete veins). Once granted, minas have an indefinite term assuming exploration development or mining is in progress. An annual canon fee of ARS$800 per pertenencia is payable to the province.
Minas are obtained by the following process:
·
Declaration of MD, in which a point within a cateo is nominated as a discovery point. The MD is used as a basis for location of pertenencias of the sizes described above. MDs do not have a definite area until pertenencias are proposed. Within a period following designation of a MD, the claimant may do further exploration, if necessary, to determine the size and shape of the mineralized material.
·
Survey (mensura) of the mina. Following a publication and opposition period and approval by the province, a formal survey of the pertenencias (together forming the mina) is completed before the granting of a mina. The status of a surveyed mina provides the highest degree of mineral land tenure and rights in Argentina.
Los Azules Preliminary Assessment Technical Report
SE Project No. 8019-01
29
6.2.3
Estaca Minas
These are six-hectare extensions to existing surveyed minas that were granted under previous versions of the mining code. Estaca minas are equivalent to minas. New Estaca minas were eliminated from the mining code in August 1996.
6.2.4
Provincial Reserve Areas
Provinces are allowed to withdraw areas from the normal cateo/mina process. These lands may be held directly by the province or assigned to provincial companies for study or exploration and development.
All mineral rights described above are considered forms of real property and can be sold, leased or assigned to third parties on a commercial basis. Cateos and minas can be forfeited if minimum work requirements are not performed or if annual payments are not made. Generally, notice and an opportunity to cure defaults is provided to the owner of such rights.
Grants of mining rights, including water rights, are subject to the rights of prior users. Further, the mining code contains environmental and safety provisions administered by the provinces. Prior to conducting operations, miners must submit an environmental impact report to the provincial government describing the proposed operation and the methods to be used to prevent undue environmental damage. The environmental impact report must be updated biennially, with a report on the results of the protection measures taken. If protection measures are deemed inadequate, additional environmental protection may be required. Mine operators are liable for environmental damage. Violators of environmental standards may be caused to shut down mining operations.
6.3
Ownership of the Los Azules Project
The Los Azules project is comprised of properties owned by Minera Andes S.A. (“MASA”) and Andes Corporacion Minera S.A. (“ACMSA”), both affiliates of Minera Andes (the “MASA Properties”) and adjoining properties owned by Xstrata Copper, one of the commodity business units within Xstrata plc (London Stock Exchange: XTA.L and Zurich Stock Exchange: XTRZn.S), through Mount Isa Mines Argentina Exploraciones S.A. (“MIM” and the “MIM Properties”).
Both the MASA Properties and the MIM Properties are subject to the terms of the Los Azules Option Agreement (described in Section 6.4).
In 1994, MASA was granted the Cordon de Los Azules Cateo 545.957-D-94. This cateo was divided and converted into two MDs on October 17, 1998, known as Azul 1 and Azul 2. These MDs cover part of the southern portion of the Los Azules project. MASA owns a 100% interest in its lands that make up the Azul 1 and Azul 2 MDs, subject to the terms of the Los Azules Option Agreement.
Los Azules Preliminary Assessment Technical Report
SE Project No. 8019-01
30
Additional Peripheral Land Holdings (“PLH”) consisting of cateo applications and MDs were acquired by MASA and ACMSA from 2006 to 2008 (see Table 6.1). MASA and ACMSA have acquired cateo applications, applied for cateos, and filed MDs for the rights to acquire a 100% interest in the lands that make up the PLH subject to the terms of the Los Azules Option Agreement. Some of the lands that make up the PLH are in the process of being perfected including being registered, surveyed and some lands may overlap other lands. These factors may potentially change which lands and the size of the lands that will be awarded the MASA or ACMSA, as applicable.
An amendment or other acknowledgement is being prepared to formally include the PLH registered to MASA and ACMSA under the terms of the Los Azules Option Agreement.
Table 6.1 shows the current land status of the MASA Properties.
| | |
Table 6.1
MASA Property Claim Status |
Name | File Number | Hectares (ha) |
Principal Land Holdings |
Azul 1 (“MD”) | 520-0279-M98 | 2,054.2 |
Azul 2 (“MD”) | 520-0280-M98 | 1,320.0 |
Peripheral Land Holdings |
No name (Cateo application) | 546.189-R-94 | 5,697.50 |
No name (Cateo application) | 546.177-A-94 | 5,954.15 |
No name (Cateo application) | 1124.277-A-07 | 1,860.91 |
Azul 3 (“MD”) | 1124.121-A-06 | 166.76 |
Azul Este (“MD”) | 1124.186-A-07 | 2,372.50 |
Azul Norte (“MD”) | 1124.668-M-07 | 131.94 |
Azul 4 (“MD”) | 1124.473-M-08 | 1,054 |
MIM owns a 100% interest in its lands that make up the MIM Properties, subject to the terms of the Los Azules Option Agreement and the two underlying option agreements described in Section 6.4.
Los Azules Preliminary Assessment Technical Report
SE Project No. 8019-01
31
Table 6.2 shows the current land status of the MIM Properties.
| | |
Table 6.2
MIM Property Claim Status |
Name | File Number | Estimated Hectares (ha) |
Escorpio I | 153-C-1996 | 170 |
Escorpio II | 0154-C-96 | 1,997 |
Escorpio III | 0155-C-96 | 199 |
Totora | 414.1324-C-05 | 492 |
Totora II | 0496-C-99 | 1,570 |
| 425.363-C-02 | 365 |
Mercedes | 0644-M-96 | 930 |
The red line in Figure 6.2 represents the extent of the inferred resource.
Los Azules Preliminary Assessment Technical Report
SE Project No. 8019-01
32
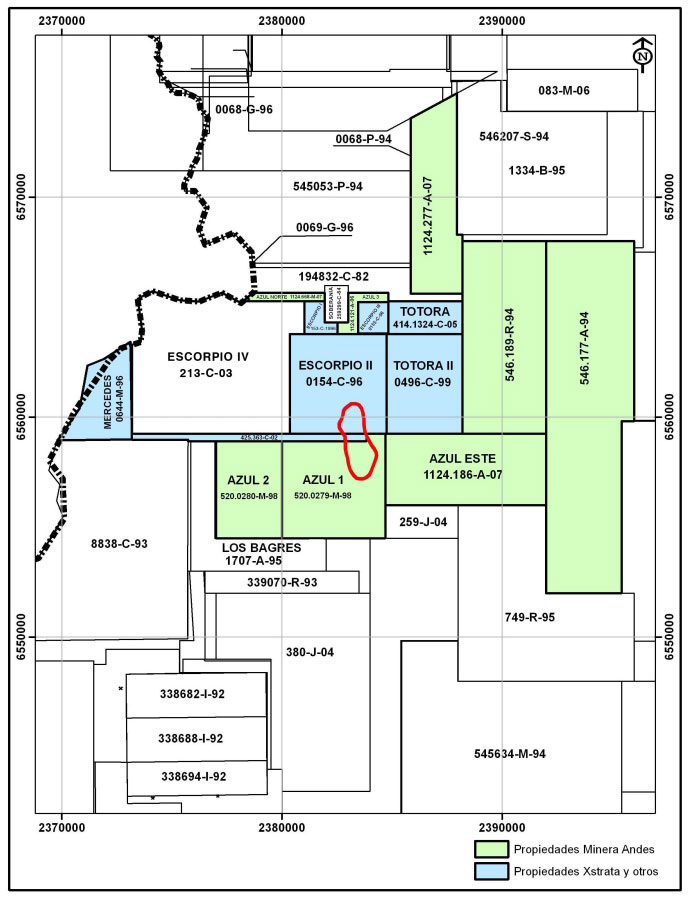
Figure 6.2 - Property Claims Map
Los Azules Preliminary Assessment Technical Report
SE Project No. 8019-01
33
6.4
Terms of Los Azules Option Agreement and Underlying Agreements
On November 2, 2007, Minera Andes and MASA entered into the Los Azules Option Agreement with Xstrata Copper, through Xstrata Queensland Limited and MIM, in respect of the MASA Properties and the adjoining MIM Properties. Under the Los Azules Option Agreement, MASA has an option, exercisable until November 24, 2010 to acquire a 100% interest in the MIM Properties (the “MASA Option”). If MASA exercises the MASA Option, MIM has the option to back-in to the Combined Property for a 51% interest.
In order to exercise the MASA Option, MASA must incur US$1 million in expenditures on the MIM Properties, deliver to MIM an independent scoping study and technical report in respect of the Combined Property (the “Los Azules Preliminary Assessment”) and deliver a notice of exercise.
On exercise of the MASA Option, MIM is required to transfer to MIM Property to MASA. However, if in the opinion of MIM, the Los Azules Preliminary Assessment shows the potential to economically produce 100,000 tonnes (224 million pounds) of contained copper per year for 10 years or more then MIM has the right to earn a 51% interest in the Combined Property (the “Back-in Right”). To satisfy the conditions of the Back-in Right, MIM must assume control and responsibility for the Combined Property, make a cash payment to Minera Andes of three times MASA’s and it’s affiliates’ direct expenditures incurred and paid on the Combined Property after the 25th of November 2005 and complete a bankable feasibility study within five years of its election to exercise the Back-in Right. In the event that the Los Azules Preliminary Assessment does not, in MIM’s opinion, meet the criterion contemplated above, MIM’s interest is r educed to a right of first refusal on a sale of the Combined Property, or any part thereof. All lands that comprise the Combined Property’s mineral applications are subject to a provincial mouth of mine royalty of between zero and 3%. This royalty will be negotiated with the province of San Juan as the project advances.
The MIM Properties are subject to two underlying agreements. The first agreement covering approximately 1,400 ha has one remaining payment totaling US$500,000, due when a bankable feasibility study is complete. The purchase option to acquire a 100% interest in these lands has been exercised. The second agreement between MIM and Solitario Argentina S.A. (“SASA”), covering the remainder of the MIM lands has had all payments made, and a US$1,000,000 work commitment completed, and is subject to a 25% buy back clause if a feasibility study is completed within three years (36 months) of MIM exercising the option to acquire the property. The option was exercised on April 23, 2007. If SASA buys back five percent or less, or if SASA buys back greater than 5%, but its interest is subsequently diluted to 5% or less, its interest will convert to a one percent net smelter royalty (“NSR”).
Los Azules Preliminary Assessment Technical Report
SE Project No. 8019-01
34
SASA together with its parent, TNR Gold Corp., has commenced an action in the Supreme Court of British Columbia against MIM seeking amongst other things, rectification of its agreement with MIM to eliminate the 36 month restriction referred to above, or alternatively, a declaration that the 36 month restriction is not enforceable. MIM is defending the claim, however, the outcome of this Court action is not certain. If SASA were to be successful, the interest of MIM in those properties (and, if MASA exercises its option, MASA’s resulting interest therein) may be diluted by SASA by as much as 25% in the event that a feasibility study is completed on any part of those properties at any time.
In the same Court action, SASA is seeking a declaration that the property referred to as “Escorpio IV” in Figure 6.2 was not included in the option granted to MIM and that MIM has no interest in that property. MIM has filed a Counterclaim against SASA and TNR Gold Corp. seeking amongst other things, a declaration from the Court that Escorpio IV forms part of the property that was optioned to MIM and an order for SASA and/or TNR Gold Corp. to convey a 100% interest in Escorpio IV to MIM. The outcome of this action is not certain. If MIM is successful in its claims, Escorpio IV will be included in the MIM Properties to be acquired by MAI. If MIM is not successful, Escorpio IV will be excluded.
6.5
Environmental Baseline Studies
There are no registered historical or other environmental impact assessments for the Los Azules property; therefore, Minera Andes S.A. commissioned Vector Argentina S.A. to carry out environmental baseline studies for the prospection phase of the Los Azules project. Baseline studies were developed by local professionals in 2006 and 2007. Studies describe physical and environmental aspects of the project area, which includes a brief description of:
·
Physical Components
○
Hydrology
○
Climate
·
Biological Components
○
Terrestrial and aquatic flora and fauna
○
Hydrobiology
6.5.1
Physical components
6.5.1.1
Hydrology
Estimates of climatic conditions in the area of the project present low precipitation rates in the form of snow covered mountains, strong winds, high rates of evaporation and subzero temperatures.
The hydrological baseline study demonstrates that certain elements in the water are present in quantities higher than those allowed by the current regulations for drinking water and/or for the protection of aquatic life. Such elements include Aluminum, Antimony, Arsenic, Boron, Zinc, Copper and Mercury. These parameters must be continuously evaluated and controlled to prevent impacts on the communities and the environment in the area of the mining project.
Los Azules Preliminary Assessment Technical Report
SE Project No. 8019-01
35
6.5.1.2
Climate
The project’s zone is located at great altitude within a rocky and dry environment that is typical of the mountain region of the Andes Australes. During most of the year, low rainfall, mainly in the form of snowfall, is registered along with strong winds, high-evaporation rates and temperatures below zero. Winds and storms have a predominant northwest-southeast direction.
The dry season (summer) takes place approximately between October and March although short-lasting and highly-intense electric storms occur during this period.
The wet season (winter) takes place approximately between April and September and most of the precipitation occurs in the form of snow. This area is influenced by the “El Niño” cycles and generally, after a wet “El Niño” year, several dry years follow. The zone also presents great daytime changes in temperature, besides the seasonal variations.
Climatic conditions change with altitude. The average annual temperature decreases approximately 0.8°C for every 100 meters of altitude increase. Precipitation generally increases with altitude and gradually changes from rain into snow.
Evaporation is high, with an approximate average potential of 1,400 mm/per year. In the higher zones, extreme floods are commonly caused by the runoff generated from short-lasting and highly-intense rainfall, and extreme long-lasting snow melting, or a combination of both processes. Extreme rainfall is generally characterized by great maximum flows, which take relatively short times to reach their peak and have lower volumes. On the other hand, extreme snow-melting events generally have lower maximum flows but take extended periods of time to reach their maximum and significantly higher volume. For the hydrologic and hydraulic design of the Los Azules Project’s zone, the most conservative hydrologic situation would be a combination of both processes, where, an extreme rainfall event coincides with an extreme snow-melting event resulting from an “El Niño” year with great snow accumulation.
Estimates on climate and other parameters have been obtained from data of nearby projects, as there are no registries of the zone available; therefore, subsequent studies with data from the area are necessary. Long-term monitoring should be taken into consideration by installing a continuous-recording meteorological station in the project area, in such manner that the information obtained can be used in the baseline studies for the mining permits.
6.5.2
Biological components
The baseline study of biological components reported 50 biological species (28 plants and 22 animals) associated with terrestrial (eg. wetland, scrubland, rocky outcrops) and/or aquatic habitats of Puna ecosystems. Of these, three species of registered mammals (Lama guanicoe, Pseudalopex culpaeus and Abrothrix andinus) are classified as important for conservation. Preliminary data taken in this study must be complemented by further biotic evaluations to determine species diversity and relative abundance, and to confirm the presence of other endangered or endemic species. Biological studies also reveal diverse communities of plankton and benton in nearby streams and lakes, which must continue to be monitored in subsequent studies.
Los Azules Preliminary Assessment Technical Report
SE Project No. 8019-01
36
Parameters dealt with in the baseline studies must be compared to the Project Description in order to elaborate proper mitigation measures and ensure successful development of the project.
6.6
Environmental Liabilities
At the present time, there are no significant environmental issues at the project site, as it is an exploration project. Reclamation activities are comprised of re-grading the drill pad sites.
In February 2007, MAI had deployed an environmental group (Vector Argentina S.A.) from Mendoza to commence an initial baseline study which includes a water sampling program within the primary target area, as well as surrounding areas and downstream of the mancamp.
6.6.1
Veranadas
The principal liabilities correspond to the impact on the fertile lands (wetlands) in the high areas by the Veranadas (seasonal livestock farming in the summer at high altitudes) which come primarily from Chile.
These Veranadas with large animal loads (goats) and little foraging resources have affected:
·
The vegetation coverage on the fertile lands;
·
The replacement by the communities;
·
The erosion of the borders of streams and fertile land; and
·
The loss of drainage capacity from these fertile lands due to trampling and compacting.
Livestock farming and the way that it has been systematized implies a large animal load on limited foraging resources (intermountain fertile lands). Overpasturing and trampling by the livestock give rise to replacement communities and the sudden reduction of the surface of fertile lands. At the same time, areas without vegetation are seen on the mountainsides and fertile lands that evidence particularly intense grazing in the area. These livestock practices imply the reduction of biomass, erosion and soil loss.
6.6.2
Existing Exploration Roads
Additionally, there are previous exploration roads (including drilling platforms) to the Xstrata/Minera Andes properties.
These are the two principal liabilities in the Los Azules area which have intensified during Vector’s last visits in 2007-08. The over-pastured fertile lands and the access roads are the principal impacts visible in the prospection area.
Los Azules Preliminary Assessment Technical Report
SE Project No. 8019-01
37
6.7
Permitting Requirements
When considering project permitting, the Argentine legislation differentiates between prospecting and exploration activities. It is understood that exploration activities include sampling and site mapping, whereas prospecting activities include drilling.
All permits required for prospecting have been obtained and are kept current, including all necessary environmental and water usage permits.
6.7.1
Exploration and Prospecting Requirements
It is required to obtain an Environmental Impact Declaration (“Declaracion de Impacto Ambiental” in Spanish) from the National Mining Secretariat. For the prospecting stage, it is also required to obtain an Environmental Impact Report (“Informe de Impacto Ambiental” in Spanish) from the San Juan Mining Department. This report has to include the following assessments:
·
Integrated diagnosis: baseline studies of the project area (biological, physical, chemical, and ecological);
·
Human environment assessment: socio-economic-cultural assessment;
·
Evaluation of technical proposal: location, general description, stages, lifetime, exploitation plan, emissions and wastes, energy, infrastructure, etc; and
·
Impact assessment: positive and negative impacts on the project area, mitigation measures and methods, restoration, and re-composition.
6.7.2
Requirements to Proceed to Prefeasibility Study Phase
An “Environmental Impact Report” will be required for this stage as well. This report has to be updated biannually and would include a report on the previous activities carried out in the project area.
6.8
Permitting Regulations
There are four main legal requirements sections that the project should consider during its different stages of development: environmental regulations, mining regulations, hazardous waste regulation, and the regulation of health and safety.
6.8.1
Environmental Regulation
The National Argentinean authority is in charge of setting the basis for environmental protection, whereas provincial authorities must establish local rules and supervise the fulfillment of all environmental regulations. One relevant topic is the requirement of an Environmental Impact Assessment. The Environmental Federal Council (COFEMA, as per the acronym in Spanish) is in charge of enforcing these regulations and establishing risk levels. In the province of San Juan, provincial authorities must guarantee sustainable development through the implementation of sustainable development principles, the design of an environmental education plan and the incorporation of a Provincial Environment Council and Provincial Environment Fund.
Los Azules Preliminary Assessment Technical Report
SE Project No. 8019-01
38
6.8.2
Mine Regulation
The acquisition, exploitation, and use of minerals are regulated by National Law 1919 and Provincial Law 7199. The province of San Juan signed National Law 24585, environmental protection for mining activities.
For prospecting activities, an Environmental Impact Report (“EIR”) is needed (refer to Section 6.7.1).
Once the EIR has been submitted, the Mining Department has 60 days to evaluate and approve, or reject the EIR. If approved, the Mining Department will grant an Environmental Impact Statement (“EIS”) that must be updated biannually. The EIS allows the Environmental Quality Certificate to be obtained; however, this certificate is not mandatory.
Finally, the Federal Mining Agreement sets forth that an Environmental Impact Assessment must be presented for each phase: prospecting, exploration, industrialization, storage, transportation andmarketing of minerals.
6.8.3
Hazardous Waste and Health and Safety Regulation
Other regulations to be completed for the Los Azules Project are related to Hazardous Waste regulations set forth in National Law 24051, adopted by the province of San Juan. This law regulates the generation, handling, transportation, treatment and disposal of hazardous waste materials.
For the Health and Safety framework, the mining company must hire an Occupational Hazard Insurer (ART, as per the acronym in Spanish) in order to identify and evaluate occupational hazards and to design Preventive and Emergency Programs. For the mining sector, companies must give priority to riskier occupational activities and employee training.
Table 6.3 presents a list of the main permits required by stages for the Los Azules Project.
Los Azules Preliminary Assessment Technical Report
SE Project No. 8019-01
39
| | | | | | | |
Table 6.3
List of Main Permits by Stages of the Life of Mine |
Exploration | Construction | Operation | Closure |
Environmental Impact Report for prospecting activities | | | | | | | |
| Environmental Impact Report for exploration activities | | | | | | |
| | Environmental Impact Assessment | | | | | |
For Hazardous Waste Treatment Plants: | | | | | | | |
Inscription in Property Registry | | | | | | | |
Industrial Certification | | | | | | | |
Environmental Impact Assessment | | | | | | | |
| | | | Inscription of Hazardous Waste Generators & Operators | | | |
| | | | | Manifest | | |
| | | | | Carriers’ authorization | | |
| | | | Environmental Impact Assessment for Mining Secretariat | | | |
| | | | Income tax stability regime | | | |
| | | | | | | |
Los Azules Preliminary Assessment Technical Report
SE Project No. 8019-01
40
| | | | | | | |
Table 6.3
List of Main Permits by Stages of the Life of Mine |
Exploration | Construction | Operation | Closure |
| | San Juan Mining Department report on water use | | | | | |
| | | Water concession | | | | |
| | | Certification for building & operating energy plants | | | | |
| | | Authorization of sources of pollution | | | | |
ART Agreement | | | | | | | |
| Registry of ART Agreement | | | | | | |
| | | Health & Safety Plan: | | | | |
| | | Safe access entrance measures for the site of operations must be built and maintained | | | | |
| | | Analysis of drinking water and sewage services, housing, and goods supply | | | | |
| | | First aid services | | | | |
| | | Fire prevention plan | | | | |
| | | Procedures for handling equipment, installing energy equipment, transporting personnel and materials | | | | |
| | | | | | Design of Closure Plan | Closure activities |
Los Azules Preliminary Assessment Technical Report
SE Project No. 8019-01
41
7.0
Accessibility, Climate, Local Resources, Infrastructure and Physiography
Los Azules Preliminary Assessment Technical Report
SE Project No. 8019-01
42
7.1
Accessibility
7.1.1
General
The Los Azules porphyry copper deposit is some 6 km to the southeast of the nearest Chilean-Argentina frontier. The project is west and slightly north of Calingasta, accessed by 120 km of unimproved dirt road with eight river crossings and two mountain passes (both above 4,100 m elevation) in the Cordillera de la Totora, in the San Juan Province of Argentina. Calingasta is located west of the city of San Juan along Route 12. The last 95 km of dirt road to the project was constructed by Battle Mountain Gold, prior to which, access was by mules.
7.1.2
Surface Rights
Within Argentina, mineral rights supercede the overlying surface rights and the holder of the latter is unable to impede access to, the exploration or extraction of underlying mineralization. Fair compensation is provided to the surface rights holder for usage of the land in conjunction with the mining operations, the proposed tailings storage facility (“TSF”) and waste rock disposal facility (“WRDF”), the processing plant and man camp. To date, no contact has been made with corporate or individual surface rights holders in the project area.
7.2
Climate
At the Los Azules project, the elevation ranges between 3,500 m and 4,500 m above mean sea level. The climate is tundra-like (semiarid/cold) with abundant snowfall during winter and temperatures as low as -30°C. Frequent northwesterly winds can approach 120 km/hr.
Exploration work typically commences in November and terminates in early April.
The principle meteorological parameters considered in the study were precipitation, temperature, and evaporation. Monthly data sets were obtained from meteorological stations close to the project area, in the San Juan province, between 1,550 and 3,600 masl elevation. The available period of record for meteorological data from these stations is 1967 through 1994. Table 7.1 lists the meteorological stations used in the study.
Los Azules Preliminary Assessment Technical Report
SE Project No. 8019-01
43
| | | | | |
Table 7.1
Meteorological Stations |
Station Number | Station Name | Location | Annual Precipitation (mm) |
Latitude (S) | Longitude (W) | Elevation (masl) |
SJ 1702 | Angualasto | 30°03’30” | 69°01’00” | 1,650 | 44.2 |
SJ 1703 | Tudcum | 30°11’00” | 69°16’20” | 1,920 | 77.1 |
SJ 1705 | Rodeo | 30°12’30” | 69°07’40” | 1,550 | 52 |
SJ 1707 | Las Flores | 30°18’30” | 69°13’10” | 1,850 | 76.1 |
SJ 1709 | Colaguil | 30°02’00” | 69°17’00” | 1,980 | 86 |
SJ 1710 | Bauchazeta | 30°10’40” | 69°27’30” | 2,620 | 226.1 |
SJ 1711 | Junta de Las Aguas | 30°19’40” | 69°25’20” | 2,410 | 144 |
--- | Pachón Project | 31°42’15” | 70°15’53” | 3,600 | --- |
The following sources of data and references were used to process the climate data:
·
Balance Hídrico de la República de Argentina - INC y TH, 1994, S.N.I.M., 2001;
·
Sistema Nacional de Información Hídrica / Estadística Hidrológica – República de Argentina;
·
Provincia de San Juan - Clima y meteorología. Estudios Ambientales de Base - Secretaría de Minería de la Nación, República de Argentina;
·
Balance Hídrico de Chile – Dirección General de Aguas, 1987;
·
Veladero Project, technical and economic evaluation – Rev. 1, Volume III of IV: Valley fill heap leach facility design - Golder Associates Inc. (September, 2002);
·
Ingeniería de detalle, sistema de lixiviación fase 2 - Mina Veladero. San Juan. Argentina (Revisión A). VECTOR Argentina S.A. (Setiembre, 2006); and
·
Estudio de Línea Base – Hidrología, proyecto Los Azules (San Juan , Argentina). VECTOR Argentina S.A. (Noviembre, 2006).
Seven meteorological stations located in the San Juan River catchment basin were used to make a correlation between annual precipitation and altitude. There is a strong correlation between altitude and precipitation (correlation coefficient of 0.92). This relationship was used to estimate an average annual precipitation to be 379.8 mm for the average altitude present at the project site (3,800 masl). This result agrees with that presented in the national map of precipitation isohyets, created with data from 1965-1982, that presents an annual average of 350 mm (Balance Hídrico de la República Argentina, 2001). The precipitation usually falls between April and October.
The monthly distribution of precipitation (for an average year) was determined using the met station Bauchazeta, located 98 km northeast of the project site. This site has a period of record of 16 years. This distribution is applied to the estimated annual precipitation for the project area in Table 7.2.
Los Azules Preliminary Assessment Technical Report
SE Project No. 8019-01
44
Snow accounts for a majority of the precipitation on site. The mine camp Valle de Rio Pachón, located between 3,500 and 3,800 masl has snow pack data between 1973 and 1974. The monthly snow pack average is 34 cm and the annual average is 2.37 m. The meteorological data of San Juan at the meteorological station Nivologica in the Arroyo Pantanosa valley (at the foot of the project area) was not consulted.
| | | | | | | |
Table 7.2
Site Climate Data |
Month | Precipitation (mm) | Pan Evaporation (mm) | Temperature (°C) |
Average | Maximum | Minimum | Average | Maximum | Minimum |
January | 80.6 | 138.7 | 42.7 | 165.4 | 7.8 | 15.7 | -0.2 |
February | 84.4 | 145.3 | 44.8 | 149.4 | 7.1 | 15.4 | -1.3 |
March | 36.3 | 62.5 | 19.3 | 129.1 | 6 | 13 | -1 |
April | 6.9 | 11.9 | 3.7 | 96.2 | 4.5 | 12 | -3 |
May | 7.4 | 12.8 | 3.9 | 80.4 | 1.2 | 7.4 | -5.1 |
June | 8.4 | 14.4 | 4.5 | 58.3 | -5.5 | 0 | -11 |
July | 23.1 | 39.7 | 12.2 | 63.3 | -4.2 | 2.6 | -11 |
August | 26.6 | 45.8 | 14.1 | 81.6 | -4.3 | 2.5 | -11 |
September | 14.5 | 24.9 | 7.7 | 106.3 | -2.5 | 4 | -9 |
October | 10.6 | 18.3 | 5.6 | 139.4 | -2.5 | 4.2 | -9.2 |
November | 35.2 | 60.5 | 18.6 | 160.3 | 0.05 | 7 | -6.9 |
December | 45.8 | 78.9 | 24.3 | 170.3 | 2.8 | 9.5 | -4 |
Annual | 379.8 | 653.7 | 201.4 | 1400 | 0.86 | 7.8 | -6.1 |
The site is characterized by very cold temperatures. Project temperatures were estimated using the meteorological station at the mine camp in Valle de Rio Pachón (1968-1975).
The Pachón camp is located at 3,600 masl approximately 100 km to the south of Los Azules within the same regional catchment basin. The monthly average temperature is 0.86°C, the monthly maximum average temperature is 7.8°C and the monthly minimum average temperature is -6.1°C. Recent records in 1997 show the severity of the winter months with average monthly temperatures between June and August recorded to be -11.0°C with winds reaching 120 km/h predominantly from the W and NW.
The project’s close proximity to the Chilean border allowed the use of the Chilean evaporation isocontour maps to estimate a Class A pan evaporation of 1,400 mm for the project area (Balance Hídrico de Chile, 1987).
The monthly distribution of evaporation was estimated using average year monthly records (1969-1989) from the meteorological station Rodeo. This station is located 139 km northeast of the project at an altitude of 1,620 masl. Table 7.2 shows this monthly variation in pan evaporation for the project area. Potential evaporation was estimated to be 70% of this pan evaporation and exceeds the precipitation in every month.
Los Azules Preliminary Assessment Technical Report
SE Project No. 8019-01
45
Due to the climatic conditions which cause a majority of precipitation to remain frozen on the ground surface for long periods of time, with gradual release of water during snowmelt, groundwater recharge could be as high as 30 to 50% of annual precipitation. This estimate is made from past experience working on hydrologic studies in similar environments.
7.3
Local Resources and Infrastructure
The Los Azules project area is quite remote and therefore, no infrastructure is present. In addition, there are no nearby towns and/or settlements. The exploration operations are carried by means of a man-camp near the project area.
7.3.1
Proximity of Property to Population Centers
7.3.1.1
Population
The population of the department of Calingasta is 8,176 inhabitants (INDEC, Census 2001) and 8,456 inhabitants estimated for 2005 (Calingasta Municipality) with a density of 0.4 inhabitants per km2.
The population of the town of Villa Calingasta is 2,039 inhabitants (INDEC, Census 2001).
7.3.1.2
Size
The size is difficult to estimate. The town of Villa Calingasta extends along the valleys of the Calingasta and San Juan rivers, forming a small urban nucleus and a village of dispersed farmers included in the same town.
The urban and rural areas together occupy around 6 km2, while the urban area alone occupies only 0.5 km2.
7.3.1.3
Available Resources
Historically, Villa Calingasta was a mining town that exploited aluminum. Today there is a UNDP program to remedy the liabilities of this time.
The principal activity of the area is agriculture with fruit trees (apple and walnut) forming 36% of the activity. Other lesser activities are the following:
·
Timber and vegetables;
·
Wood manufacturing activities;
·
Cider manufacturing;
·
Tourism (hotels, restaurants);
·
Commercial activities (shops); and
·
Public service (health, safety, education).
The censuses do not show that nearby projects (Casposo of Intrepid, Pachón of Xstrata, Los Azules of Minera Andes, Altar of Peregrine, and a project owed by Rio Doce) have increased considerably the population associated with mining.
Los Azules Preliminary Assessment Technical Report
SE Project No. 8019-01
46
7.3.1.4
Workers Available for the Mining Project
Based on the INDEC 2001 census, there are 2,221 employees in the entire department; the rest are self-employed. Of those that are employed:
·
31% work in public administration;
·
14% in education;
·
5% in domestic service;
·
5.6% in commerce;
·
2.5% in mines and quarries;
·
1.4% in hotel/restaurant industry;
·
1.2% in electricity and gas; and
·
0.3% in financial services.
The remaining approximately 6,000 persons, who are self-employed, work mainly in agriculture, which has decreased by 45% since the 1970s. These people form a potential worker pool for the project.
7.3.2
Power
7.3.2.1
Present Situation
The Calingasta substation is the nearest source of power to the Los Azules project; however, it is isolated from the provincial network. Power supply to the region is currently satisfied by means of local hydro or thermal generation.
7.3.2.2
San Juan Province Official Network Expansion to Connect New Projects
The San Juan provincial government is planning to expand the existing 500 kV network based on the assumption that all mining projects placed on the west side of the province will be connected to the new 500/220 kV El Rodeo and Calingasta substations. In addition to the construction of these new substations, the 500/220 kV San Juan substation, a 165 km San Juan to El Rodeo transmission line (“TL”) and a 160 km El Rodeo to Calingasta TL will also have to be constructed. Finally, the existing Gran Mendoza to San Juan TL will need to be upgraded from 220 kV to 500 kV. The 500 kV TL that will connect the future San Juan, Rodeo and La Rioja 500 kV substations is called the “Linea Minera II” (the Mining Line II) and is a national project under the regime of the Secretaria de Energía de la Nacion (Federal Department of Energy).
According to an agreement signed between Barrick and the province of San Juan, the Pascua Lama and Veladero projects located in the northwest side of the province are to be connected to the grid through the Rodeo substation; however, the agreement is presently on hold due to the retention taxes applied to mining operations by the federal government. A similar agreement is being considered by El Pachón, located southwest of the province, which would connect the project to the grid through a 220 kV double circuit TL connected to the Calingasta substation, subject to the same retention tax situation.
Los Azules Preliminary Assessment Technical Report
SE Project No. 8019-01
47
The 500 kV TL that will connect the future Rodeo and Calingasta 500 kV substations is a new venture developed by the Province of San Juan through the Ente Regulador Provincial de Electricidad – EPRE (Provincial Electric Regulatory Entity). At present, the project is in the engineering stage and it is being designed to initially operate at 132 kV to connect the 6 MW Casposo project and local sites like Tamberias and Barrial. It is planned to start the construction process by a call for tenders in the 1Q of 2009 and be put into operation in 2010. Confirmation of the feasibility of Los Azules may alter the configuration.
Three options for providing power to the Los Azules project merit consideration and are discussed next. The financials associated with the three options are presented in Table 7.3, Table 7.4, and Table 7.5.
7.3.2.3
Links to the SADI (Argentinean Interconnected System)
Alternative 1 – 132 kV Double Circuit TL E.T. Calingasta – E.T. Los Azules:
Based on the aforementioned Ente Regulador Provincial de Electricidad venture, there may be an opportunity to cost-share a portion of the infrastructure required to provide power to the Los Azules and neighboring projects. This alternative includes a 132 kV double circuit TL linking the future 500/220 kV Calingasta substation to the Los Azules project site. The 110 km TL route would follow the project access road.
Alternative 2 – 220 kV Single Circuit TL E.T. Calingasta – E.T. Los Azules:
Like Alternative 1, this alternative has an opportunity to cost-share the common infrastructure. This alternative utilizes a 220 kV single circuit TL connecting the future 220 kV Calingasta substation to the Los Azules project site. Like Alternative 1, the 110 km TL route would shadow the project access road. In this alternative, the 500/220 kV 300 MVA power transformer, which is already designed for the El Pachón project, would be used to provide power to both projects.
Alternative 3 – 220 kV Double Circuit TL E.T. Cañada Honda – E.T. Los Azules:
Entails a 220 kV double circuit TL joining the Los Azules project to the proposed future 220 kV Canada Honda substation located 283 km away. This solution is independent of the governmental expansion plans; therefore, the investment costs would be shouldered entirely by the project in order to ensure its power supply by this means. This option would involve the construction of a new 220 kV substation, named Cañada Honda to be located 60 km south of the city of San Juan; which would be connected to the existing 220 kV Cruz de Piedra to San JuanTL. A new 283 km 220 kV TL from this new Cañada Honda substation to Los Azules would need to be built for tie-in.
Los Azules Preliminary Assessment Technical Report
SE Project No. 8019-01
48
| | |
Table 7.3
Neighboring Projects |
Mining Project | Demand (MW) | Percentage of Total Demand (Participation) |
Casposo | 7 | 2.9% |
El Pachón | 110 | 45.5% |
Los Azules | 120 | 49.6% |
Altar | 5 | 2.1% |
Totals | 242 | 100.0% |
| | | | | |
Table 7.4
Estimated Cost of Power Supply Components |
Required Improvements | km | Cost | Cost/km | Los Azules Participation Cost |
No Gov’t Participation | 70% Gov’t Participation |
Substations |
500 kV San Juan Substation | | $73,000,000 | | $36,198,347 | $10,859,504 |
500/220 kV Rodeo Substation |
500/220 kV Calingasta Substation | | $37,000,000 | | $18,347,107 | $5,504,132 |
500/220/132 kV Calingasta Substation | | $42,000,000 | | $20,826,446 | $6,247,934 |
132 kV Los Azules Substation | | $5,000,000 | | | |
220 kV Los Azules Substation | | $9,000,000 | | | |
220 kV Cañada Honda Substation | | $4,000,000 | | | |
Transmission Lines |
500 kV San Juan – Rodeo TL | 165 | $54,450,000 | $330,000 | $27,000,000 | $8,100,000 |
500 kV Rodeo – Calingasta TL | 115 | $37,950,000 | $330,000 | $18,818,182 | $5,645,455 |
132 kV Double Circuit Calingasta – Los Azules TL | 110 | $27,500,000 | $250,000 | | |
220 kV Single Circuit Calingasta – Los Azules TL | 110 | $33,000,000 | $300,000 | | |
220 kV Double Circuit Cañada Honda – Los Azules TL | 283 | $96,781,870 | $341,985 | | |
Notes: Shaded cells denote components that may be eligible for government subsidization based on published government infrastructure expansion programs |
Los Azules Preliminary Assessment Technical Report
SE Project No. 8019-01
49
|
|
| | | | | | |
Table 7.5
Estimated Cost of Power Supply Options |
Required Improvements | km | Alternative 1 (132 kV Double) | Alternative 2 (220 kV Single) | Alternative 3 (220 kV Double) |
No Gov’t Participation | 70% Gov’t Participation | No Gov’t Participation | 70% Gov’t Participation |
Substations |
500 kV San Juan Substation | | $36,198,347 | $10,859,504 | $36,198,347 | $10,859,504 | |
500/220 kV Rodeo Substation |
500/220 kV Calingasta Substation | | | | $18,347,107 | $5,504,132 | |
500/220/132 kV Calingasta Substation | | $20,826,446 | $6,247,934 | | | |
132 kV Los Azules Substation | | $5,000,000 | $5,000,000 | | | |
220 kV Los Azules Substation | | | | $9,000,000 | $9,000,000 | $9,000,000 |
220 kV Cañada Honda Substation | | | | | | $4,000,000 |
Transmission Lines |
500 kV San Juan – Rodeo TL | 165 | $27,000,000 | $8,100,000 | $27,000,000 | $8,100,000 | |
500 kV Rodeo – Calingasta TL | 115 | $18,818,182 | $5,645,455 | $18,818,182 | $5,645,455 | |
132 kV Double Circuit Calingasta – Los Azules TL | 110 | $27,500,000 | $27,500,000 | | | |
220 kV Single Circuit Calingasta – Los Azules TL | 110 | | | $33,000,000 | $33,000,000 | |
220 kV Double Circuit Cañada Honda – Los Azules TL | 283 | | | | | $96,781,870 |
Total Cost | | $135,342,975 | $63,352,893 | $142,363,636 | $72,109,091 | $109,781,870 |
Notes: Shaded cells denote components that may be eligible for government subsidization based on published government infrastructure expansion programs |
7.3.2.4
Cost of Energy
A recent energy study commissioned by Minera Andes estimates an energy cost of approximately US$65 per MWh at the substation. Accounting for line losses and annual O&M expenses, the estimated energy cost rises to approximately US$70 per MWh at the mine site.
Los Azules Preliminary Assessment Technical Report
SE Project No. 8019-01
50
7.4
Physiography
The project is centered on La Ballena (English translation: the whale), a low NNW-SSE-trending ridge located on the property. The property is rugged and ranges in elevation from 3,500 m to nearly 4,500 m. Vegetation is sparse and is virtually absent at higher elevations.
Long, narrow lakes occupy the valley floors on either side of La Ballena. These lakes are fed by snowmelt, but apparently reflect the groundwater regime as well, with standing water levels at about 3,600 m in elevation. Springs are noted at about 3,790 m in elevation upstream of the lake along the west side of La Ballena. Groundwater-fed springs and lakes are also noted around the range to the west between 3,800 and 3,900 m in elevation and along the eastern flank of Cordillera de la Totora. These lakes then feed the westerly flowing Rio La Embarrada, which is joined by the Rio Frio to the west before turning south into the Rio de las Salinas, a main tributary to the San Juan River.
Deposits of glacial debris (morainal materials) and scree mantle much of the deposit and adjacent mountainsides. In the target area, these materials locally exceed 60 m in thickness, but on La Ballena the cover is often 10 m or less.
Los Azules Preliminary Assessment Technical Report
SE Project No. 8019-01
51
8.0
History
Los Azules Preliminary Assessment Technical Report
SE Project No. 8019-01
52
8.1
Property History
In 1994, Minera Andes, Inc. (“MAI”), through its subsidiary Minera Andes S.A. (“MASA”), acquired lands in the southern portion of the Los Azules area. Battle Mountain Gold Company (“BMGC”), acquired lands immediately to the north through an option from Solitario Argentina S.A. (“SASA”). For the next couple of years, both companies independently explored for gold on their respective land holdings.
In 1998, a new access road was constructed by BMGC while it conducted airborne geophysical surveys, mapping, trenching and drilled several reverse circulation (“RC”) holes. A large hydrothermal alteration zone associated with dacite porphyry intrusions and stockwork structural zones was recognized in the Los Azules project area, and MAI signed a Letter of Intent with BMGC to form a joint venture to explore the combined land package.
In 1999, MAI and BMGC signed a definitive joint venture agreement. BMGC subsequently drilled additional RC holes and significant porphyry copper mineralization was intersected close to the property boundary; however, no drilling was done on the MASA properties.
In 2000, BMGC merged with Newmont Mining Corporation (“NMC”). No further work was done by BMGC/NMC and the joint venture was allowed to dissolve without BMGC earning any interest in the MASA or SASA lands. At this time, capitalizing on a surveying error, Sr. Bosque acquired a small strip of land between the MASA and SASA lands.
In 2003, MIM Argentina S.A. (“MIM”) optioned the Sr. Bosque and SASA lands and began exploration work. Independently MASA began exploration on its own lands at Los Azules.
In 2005, a Letter of Intent was drafted between MAI and Xstrata Copper (successor to MIM) for earn-in rights on the combined land package. More exploration occurred over the next couple of years.
In 2007, a definitive Option agreement (Section 6.4) was signed between MASA and Xstrata Copper.
Los Azules Preliminary Assessment Technical Report
SE Project No. 8019-01
53
9.0
Geological Setting
Los Azules Preliminary Assessment Technical Report
SE Project No. 8019-01
54
9.1
Regional Geology
The property is located in a geological province known as the Cordillera Frontal, a mountainous region situated between the Pre-Cordillera and the Cordillera Principal (Figure 9.1). This region, located along the western side of Argentina and adjacent to the Chilean border, covers the provinces of Catamarca, La Rioja, San Juan and Mendoza near latitude 21° 00’ south and 36° 46’ south.
During Middle to Lower Miocene times, active volcanism resulted in a geographically broad distribution of porphyry-type copper-gold epithermal gold-silver deposits over 250 km wide zone from the Andean Cordillera through the Pampean ranges. In Chile, the well known Maricunga and El Indio gold belts were formed during the same time. Equivalent occurrences in Argentina include Laguna Verde, Cerro Delta, Veladero and Pascua Lama. Middle to late Tertiary volcanism was extensive and episodic. Tertiary metallic deposits are considered to be associated with subduction-related crustal shortening and resultant magmatic activity, or more likely, with a back-arc crustal extension tectonic regime. It culminated in development of multiple, superimposed calderas and associated epithermal gold-silver copper deposits.
There are three main rock groups according to Battle Mountain Gold Corporation (“BMGC”) (1999): 1) pre-Jurassic basement, 2) Mesozoic sequence, and 3) Cenozoic sequence (refer to Figure 9.2). Subvolcanic and plutonic intrusive rocks are found in all of these units.
9.1.1
Pre-Jurassic Basement
This group is composed of sedimentary clastic deposits, mainly lithic-feldspathic sandstone with minor breccias, black shales and arkose interlayered with volcanicpyroclastic rocks which have been intruded by Permian Granites. This group is discordantly overlain by a thick sequence of volcanic-sedimentary rocks with a basal section of andesites and dacite and an upper section of rhyolites, locally intruded by Triassic granitic rocks (Choiyoi Group) of Permian-Triassic age.
9.1.2
Mesozoic Sequence
During the Mesozoic, an important sedimentary hiatus is noted in the Frontal Cordillera. In the Cordillera Principal towards the southwest, some Mesozoic outcrops have been identified. These are represented by La Manga Formation (calcareous rocks) of Middle Jurassic age; Tordillos Formation (Conglomerates and sandstone) of Upper Jurassic age; Jurassic Formation (volcanic and Pyroclastic rocks) of Upper Cretaceous age and Cristo Redentor Formation (pyroclastic and volcaniclastic sequence) of Upper Cretaceous age.
9.1.3
Cenozoic Sequence
This group is composed of interlayered volcanic and volcaniclastic rocks which have been intruded by granodiorite to diorite stocks, dykes, and sills. The sequence is intruded by numerous Oligocene and Miocene igneous rocks (diorites, quartz diorites, and andesites) that belong to the Rio Grande Super Unit and Infiernillo Unit. The intrusive episode is responsible for the conspicuous hydrothermal alteration and mineralization (both disseminated and vein type).
Los Azules Preliminary Assessment Technical Report
SE Project No. 8019-01
55
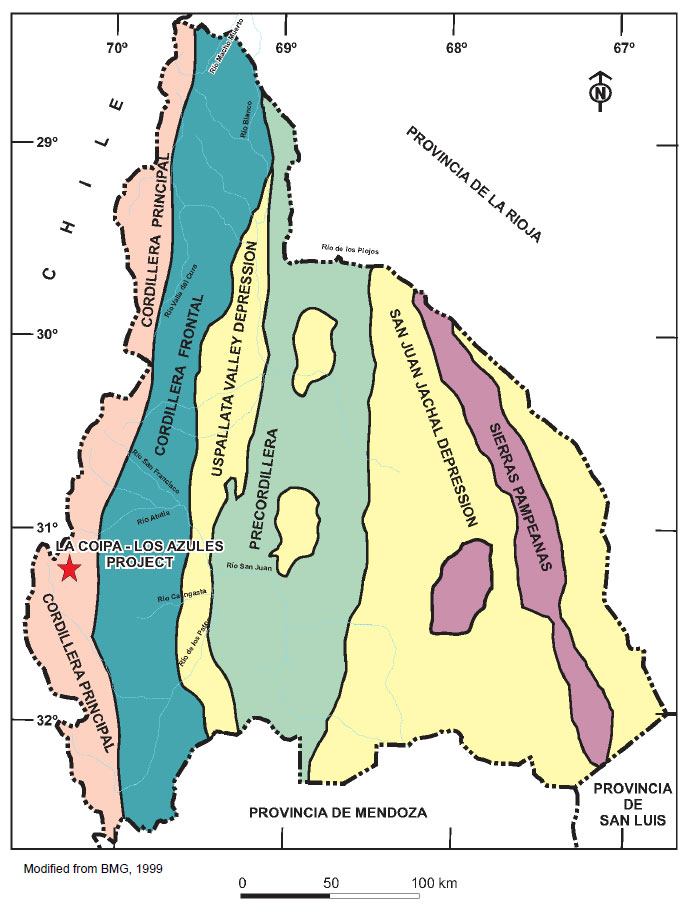
Figure 9.1 – Regional Geomorphology
Los Azules Preliminary Assessment Technical Report
SE Project No. 8019-01
56
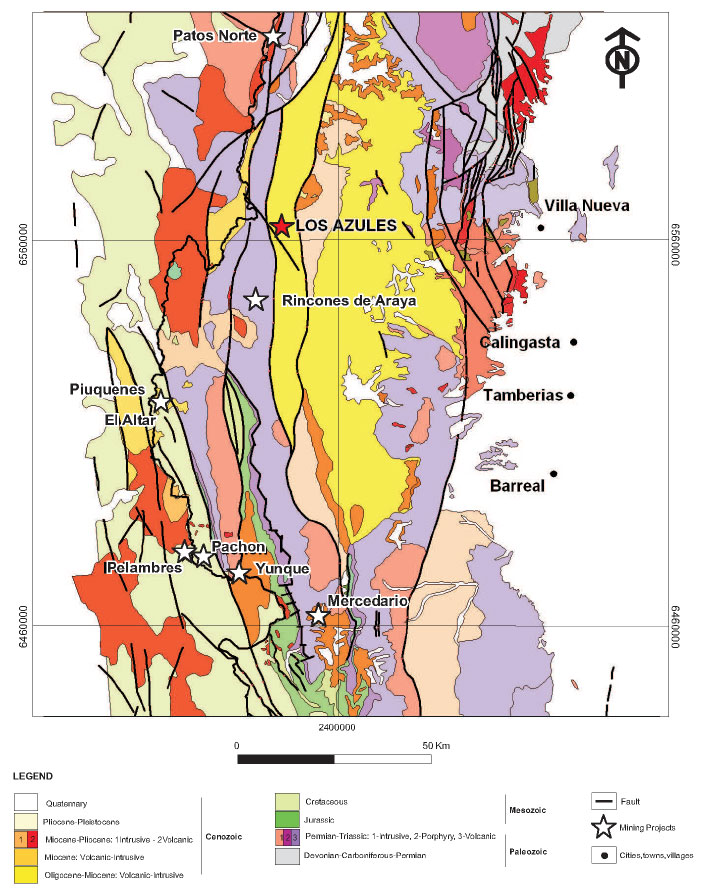
Figure 9.2 – Regional Geology
Los Azules Preliminary Assessment Technical Report
SE Project No. 8019-01
57
9.1.4
Quaternary
This group is composed principally of glacial and fluvial glacier deposits. There are extensive areas of gravels and unconsolidated sand within the quaternary cover.
A tectonic-stratigraphic order has been established in the Andean Region that defies the cyclical nature of the deformation history according to BMGC (1999). All the units are separated by discordance of different magnitudes. These rocks are controlled by Andean Orogenic Cycle. Deformation is concentrated in north-south oriented bands and the principal structures are large vertical faults.
The main structural features have been created generally by over thrusting that at a local level, formed folds and developed reverse high angle faults that dip either east or west. The general north-south trend of the structural trends is often intersected by a secondary north-northwest structural trend. The junctions of these structural trends have provided the locus for the emplacement of subvolcanic bodies and channelways that permitted the flow of hydrothermal solutions that generated the surface alteration.
9.2
Property Geology
The Los Azules project is based on a NNW-SSW-trending ridge (La Ballena) that exists at the southern end of a hydrothermally altered system approximately 8 km long (N-S) by 5 km wide (E-W), which surrounds a core mineralized porphyry target that is about 3 km long by 1 km wide. The target straddles the Minera Andes, Inc. (“MAI”) property boundary where drilling on the adjacent property by BMGC (north of MAI’s property) has revealed copper grades and thicknesses that increase toward the MAI ground.
Previous work recognizes two principal geological groups at Los Azules: an upper volcanic suite and a lower intrusive complex as shown in Figure 9.3. The volcanic suite comprises a basal rhyolitic unit overlain by dacitic pyroclastics and andesitic flows. The lower suite is described as diorite-tonalite in composition with a dacite porphyry core. In addition, a rhyolitic-dacitic pyroclastic and volcaniclastic suite, interpreted to be part of the Choiyoi Group (Permian- Triassic) form the known basement rocks in the Los Azules area. Figure 9.3 through Figure 9.6 illustrate the plan map and typical cross section of the interpreted geology, which is based on surface mapping and drilling.
The existence of eroded volcanic cones allows one to distinguish two types of processes. One related with the eruption of volcanic material (pyroclastic, welded tuff) and other one with the emplacement of the porphyry rocks. Each process causes a different style of mineralization and alteration. The erupted material includes rhyolitic, red color volcaniclastic rocks and breccias (Pliocene) with some calcite and epidote veining common.
A dacitic pyroclastic flow lies over this sequence, associated with porphyritic intercalations of rhyolite and fine-grained dacitic flows. Andesites and dacites flows are exposed towards the (Figure 9.3) upper part of the volcanic cone.
The andesites are dark green, magnetite rich with epidote veinlets. The intrusive rock is a porphyritic granodiorite to quartz diorite (Lower Miocene) with late NNW orientated dacite porphyry dike like bodies, mapped along La Ballena ridge. The porphyry name may change depending on the abundance of feldspar and quartz.
Los Azules Preliminary Assessment Technical Report
SE Project No. 8019-01
58

Figure 9.3 – Local Geology and Structure
Los Azules Preliminary Assessment Technical Report
SE Project No. 8019-01
59
The longitudinal section infer the distribution of the dacite porphyry intruding the dioritic porphyry (granodorite porphyry). In some drill holes hydrothermal breccias can be observed. They are covered by fluvio-glacial and colluvium deposits. The drill cores display moderate silicification, quartz veins and veinlets, along with the formation of quartz stockworks.
West of La Ballena hill, a sequence of light to reddish colored felsic volcanic rocks outcrops, which corresponds to a rhyolite volcaniclastic and rhyolite breccias, related to different volcanic cones. Calcite and epidote veining stained by hematite give this unit its distinctive red color. On the Xstrata property to the north the dacite porphyry intrudes the diorite to granodiorite porphyry. The contact is an intrusive one with a breccia zone near the borders. The clasts are mixed: dacite porphyry varying to diorite-granodiorite porphyry. It is an assimilation process from the dacite porphyry towards the diorite-granodiorite porphyry.
9.2.1
Lithology
9.2.1.1
Hydrostratigraphic Units
The project site lies just to the east of the continental divide. The region is defined by large scale Triassic and Tertiary volcanic activity. Although no complete surficial geologic map has been compiled to date, available information on the site geology suggests the presence of at least three major hydrostratigraphic units (Figure 9.3):
·
Upper volcanics;
·
Lower porphyritic intrusives; and
·
Unconsolidated sediments.
Previous work recognizes two principal geological groups at Los Azules: an upper volcanics and lower intrusive (Figure 9.4). Active erosion removed the upper portion of the volcanic edifices, exposing underlying subvolcanic porphyries and portions of the magmatic basement. The volcanic suite comprises a basal rhyolitic unit overlain by dacitic pyroclastics and andesitic flows. It is interpreted to be part of the Choiyoi Group (Permian-Triassic) that form the known basement rocks in the Los Azules area.
The lower intrusive suite is described as diorite-tonalite in composition with a granodiorite to quartz diorite porphyry core (Lower Miocene). Late north-northwest orientated dacite porphyry dykes are mapped as part of these intrusives along La Ballena ridge. This large system of dykes have been identified as individual dykes, a few meters wide, sharply dipping and in-line with fault structures.
The granitic rock suite, veinlet and fracture stockworks, breccia bodies, and thermal and hydrothermal alteration are all part of one system closely related in age, which is referred to as the porphyry system. The porphyry name may change depending on the abundance of feldspar and quartz.
Through correspondence with project personnel and review of core photos, it has been observed that these lithologies appear to be very hard rock that has been highly fractured to depths of up to 300 m. Four of the most recently drilled holes had an averaged fracture count of 4.2 per meter. Fractures in these two pervasive units are caused by the presence of numerous faults as well as pressure release from geologic uplift and weathering.
Los Azules Preliminary Assessment Technical Report
SE Project No. 8019-01
60
Although no test information is available, these materials are estimated to have permeability values on the order of 5 x 10⁻⁵ to 5 x 10⁻⁶ cm/sec and a drainable porosity of 0.005 to 0.01. Permeability and porosity of the bedrock is highly dependent upon fractures and fracture connectivity as the rock matrix is inherently of extremely low permeability and porosity.
The unconsolidated sediments are most likely comprised of material eroded from the volcanic peaks of the Permo-Triassic volcanic rocks of the Choiyoi Formation. Thickness of the unconsolidated sediment cover ranges between about 60 and 85 m in the quebrada bottoms and to as shallow as 10 m along La Bellena ridge. In some boreholes the thickness was difficult to determine because the bedrock was so highly fractured near the contact. When highly fractured bedrock cannot be differentiated from the overlying unconsolidated sediments, the sediments can be assumed to be coarse grained.
The permeability of the surface sediments has not been tested and no reverse circulation production estimates have been made while drilling through them. Their coarseness and most likely low percentage in fine grains due to the hardness of the source rock allow for an estimation of bulk permeability to be between 10-3 and 10-2 cm/sec.
Two kilometers downstream of the mineralization target, the Rio Salinas appears to flow through a relatively wide alluvial filled valley. This alluvial deposit, that begins at the confluence of Quebrada Salinas (site of the proposed TSF), Quebrada Los Azules and Quebrada La Embarrada (site of the proposed waste rock disposal facility), is about 800 m wide and extends downstream for well over 5 km. Depending upon the saturated thickness and permeability, the deposit could potentially form a significant aquifer.
9.2.1.2
Geologic Structures
The occurrence of a well developed north-northwest structural corridor in terms of regional geology favored the emplacement of at least three aligned, probably connected, shallow intrusive-volcanic centers over the Permo-Triassic basement at the Los Azules site.
Most faults at the project follow this regional trend and generally dip at about 80 degrees while trending north-northwest. These faults define the geomorphologic expression of Quebrada Las Vegas. This fault system has been described as a series of en echelon strike slip faults with potentially significant inferred movement along them (personnel correspondence Lukas Zurcher; Project Geologist) (Figure 9.3).
Other fault systems with strikes of east-northeast, northeast, and northwest are present in the deposit area. Quebrada Los Azules and Quebrada de Lagunas are both geomorphological expressions of these other fault systems.
Los Azules Preliminary Assessment Technical Report
SE Project No. 8019-01
61

Figure 9.4 – Lithology Plan View at 3600 masl
Los Azules Preliminary Assessment Technical Report
SE Project No. 8019-01
62
9.2.2
Alteration
Dacite porphyries and minor breccias accompanying diorite porphyry dominate the geology of the area. This is reflected in the drill holes, where dacite porphyry is the principal rock type including veins and stockwork mineralization.
Drill hole loggings and previous surface mapping marks Los Azules area as coherent with a porphyry copper system in close connection with the high sulphidation system (epithermal), observed on the summits of the range mountain, located east. On the MIM Properties, well defined Rhyolitic clay-silica altered lithocap is preserved on the higher ridges.
The alteration in outcrop is dominantly phyllic and often overprints hypogene potassic alteration (Figure 9.5). Silicification is strongly developed within the dacite porphyry, as stockwork veinlets, veins, and is often pervasive, as well. Most the rocks affected by alteration exhibit pyrite and associated specularite. Phyllic alteration is structurally controlled and characterized by strong to pervasive sericite and quartz, and generally, texturally destructive. Westward, propylitic alteration occurs as haloes outward from the mineralized system. The propylitic alteration is associated with chlorite, epidote, quartz, and calcite.
The drill holes reveal strong to moderate sericitic (phyllic) alteration; less argillic alteration, comprising mixed sericitic and kaolinitic clays. This alteration is developed in connection with fault zones or structures. Kaolinitic alteration seems to be more supergene in origin. The phyllic alteration partially replaces early potassic alteration in the upper part of the hydrothermal system. Tourmaline veins and dissemination are associated with the phyllic alteration.
Silicification textures range from fine grain to saccharoidal, suggesting quartz recrystallization.
Variable amounts of chlorite replace remnant hydrothermal biotite, where the superimposed phyllic alteration becomes weaker. The phyllic alteration has an irregular distribution, spatially associated with fault zones. These zones allowed acid solutions to descend to lower levels.
Drill hole logging reveals that argillic alteration is associated with the faults zones. Frequently the surrounding rock is strongly altered to kaolinite.
Los Azules Preliminary Assessment Technical Report
SE Project No. 8019-01
63
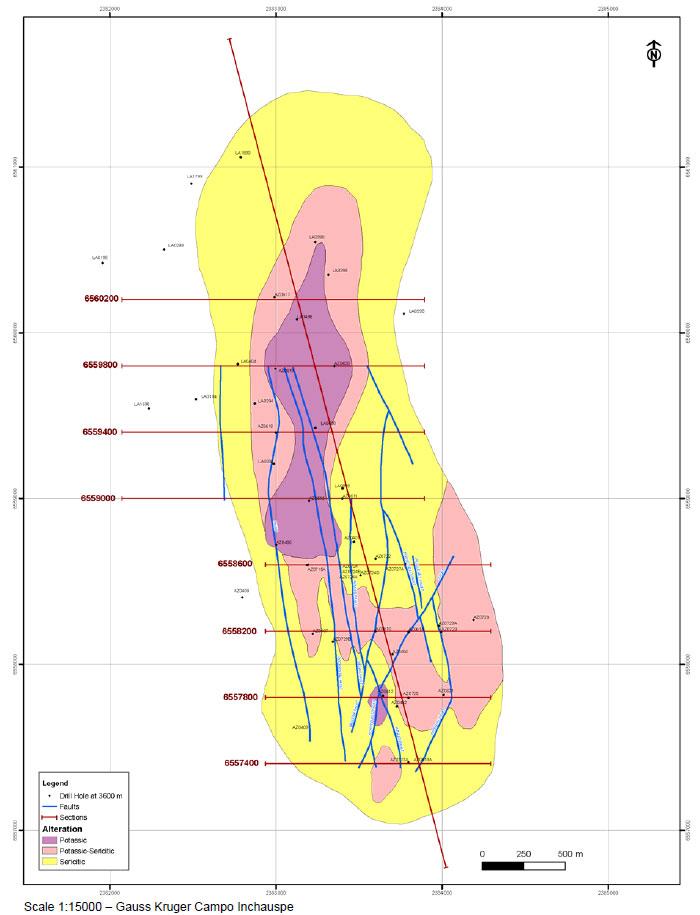
Figure 9.5 – Alteration Plan View at 3600 masl
Los Azules Preliminary Assessment Technical Report
SE Project No. 8019-01
64
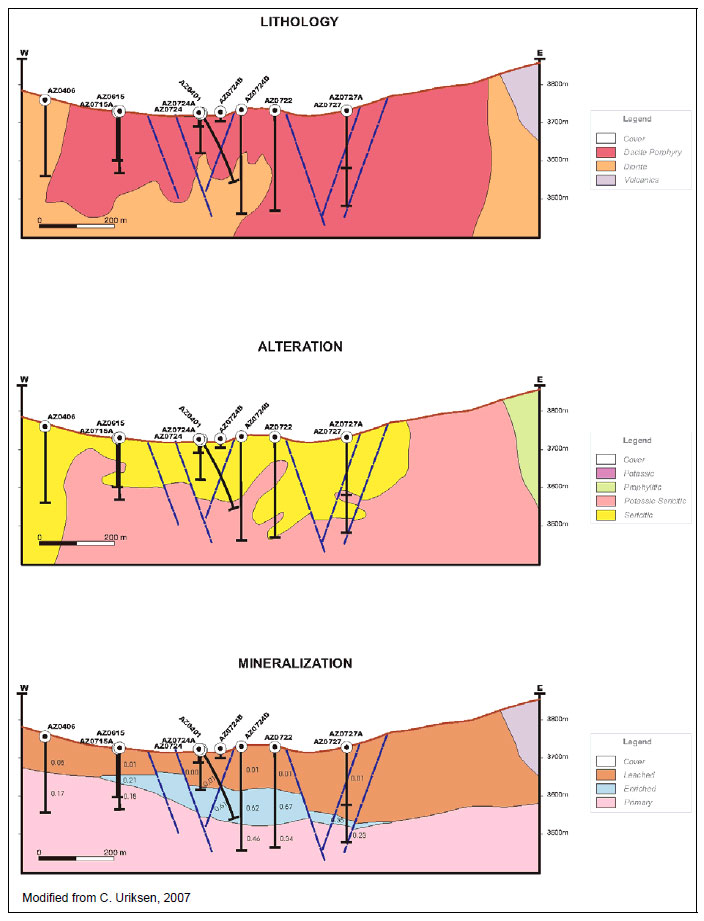
Figure 9.6 – Representative Cross Section (N6558600)
Los Azules Preliminary Assessment Technical Report
SE Project No. 8019-01
65
10.0
Deposit Types
Los Azules Preliminary Assessment Technical Report
SE Project No. 8019-01
66
10.1
Introduction
The Los Azules deposit demonstrates the characteristics of a porphyry copper system typical of other North and South American porphyry copper systems that have been well documented. The area’s structural preparation in addition to the intrusive granodiorite to quartz diorite porphyry likely formed the conduit for hydrothermal solutions to transport and deposit the initial mineralization.
10.2
Typical Porphyry Copper System
Porphyry deposits form a diverse but genetically related group that is closely associated with intrusive granitic bodies which were emplaced relatively near the surface. Normally, the granitoid rocks exhibit a porphyritic texture in which some minerals form large regular crystals within a matrix of smaller grains. The primary mineralization is dispersed chiefly in veinlet and fracture stockworks that have been demonstrated to have formed during, but relatively late, in the processes of emplacement and consolidation of the related intrusions. The bulk of the primary metallic sulfide minerals may be contained within the intrusion, straddle the contact, or be entirely external but adjacent to it. Whatever the case, the distributions of mineralization and hydrothermal alteration normally form symmetrical patterns that reflect the shape of the intrusion (see Figure 10.1). The granitic rock suite, veinlet and fracture stockworks, breccia bodies, and thermal and hydrothermal alte ration are all part of one system closely related in age referred to as the porphyry system.
Porphyry deposits are primarily sources of copper and molybdenum. Some deposits contain only copper, some only molybdenum, many contain copper and molybdenum in a ratio not very different from their ratio of crustal abundance (copper - 70 ppm; molybdenum - 2 ppm), and a few have molybdenum-to-copper ratios that are greatly in excess of their crustal abundance. The factor required to raise concentrations from the average abundance of crustal rocks to ore grades ranges from about 150 times in the case of copper to about 1000 times for molybdenum.
Significant by-product metals other than molybdenum include gold, silver, rhenium, uranium, tungsten and tin, of which the last two may form the principal metal in deposits. A few other metals could theoretically form primary deposits in a porphyry system and metals normally present in trace amounts can occasionally be unusually abundant such as abnormal amounts of bismuth, arsenic, tin, and cobalt. Lead, zinc, and antimony occur prominently in peripheral veins and trace-element haloes surrounding most porphyry deposits and in late veins within mineralized zones. However, parameters of physical chemistry in porphyry systems, such as temperature and pressure, together with those of space, such as the increasing degree of dispersal with distance from source, and the economics of metal prices make it unlikely that lead, zinc or antimony porphyry deposits exist that can be exploited in the foreseeable future.
Los Azules Preliminary Assessment Technical Report
SE Project No. 8019-01
67

Figure 10.1 – Typical Porphyry Copper Deposit
Los Azules Preliminary Assessment Technical Report
SE Project No. 8019-01
68
The source of metals in porphyry deposits is still a matter of vigorous scientific debate, but most geologists subscribe to one or more of the following three schools of thought:
1.
Metals have been concentrated through partial melting of peridotitic rocks of the earth's upper mantle to form basaltic magma which evolves toward quartz, water, and metal-rich, late-crystallizing granitic rocks.
2.
Metals have been concentrated by partial melting of some combination of basaltic oceanic crust and an encumbant load of saline water-laden and metalbearing sediments where these have been carried beneath the continental margin or volcanic island arc (subduction) in the descending plate during the process of ocean-floor spreading and continental drift. Magma generated by the resultant heating then evolved as in (1) during the process of ascent and emplacement into the upper crust.
3.
Metals have been leached and concentrated from neighboring host rocks through the influence of a circulating water cell generated by the introduction of a hot granitic body into cooler host rocks that are saturated with saline connate (entrapped) water.
Although porphyry deposits were exploited mostly in the western United States and Chile during the first half of the 20th century, they have been found in the past 50 years to be very widely distributed around the world, principally within linear mountain belts of Mesozoic and Cenozoic age. Within these belts, they occur most commonly in terrains displaying both orogenic volcanic rocks and granitic bodies emplaced near surface. Viewed in greater detail, their distribution is apparently controlled by factors such as distance from subduction zones of convergent crustal plate margins, distribution of faults transverse to the mountain belts, total thickness of the crust, and the chance results of erosion or burial.
10.3
Los Azules Deposit
The hydrothermal system at Los Azules is characterized by porphyry copper, and to a lesser extent gold, mezothermal mineralization that has been emplaced in a sequence of intermediate to felsic volcanic rocks. Many sub-volcanic domes have intruded these volcanic rocks. The dominant structural trend in the area is (NW-SE), with structures associated with this trend controlling the emplacement of the sub-volcanic bodies and veins. Secondary structures tend to trend either (N-S) and/or (NE-SW).
The area of visible alteration appears to cover an area of some 8 km (N-S) by 5 km (E-W). At the core of this alteration halo, the porphyry mineralization has an extension of some 3 km by 1 km. The most obvious and extensive alteration within the area is comprised of moderate to strong quartz-sericite and argillic alteration with local concentrations of tourmaline. Potassic alteration is also present throughout most of the deposit and is represented by K-feldspar and biotite of hydrothermal origin. Retrograde chlorite replaces hydrothermal biotite. Propylitic alteration associated with pyrite-calcite epidote occurs in the external halo. The highest part of the alteration system is characterized by strong acid leaching.
Los Azules Preliminary Assessment Technical Report
SE Project No. 8019-01
69
Superimposed on this system is the effect of weathering and oxidation on near-surface rocks as oxygen-rich rainfall percolated downward through the rockmass to the water table, or phreatic surface. This effect is supergene alteration and accounts for the oxidation and enriched zone where copper ions carried in solution precipitate out as chalcocite (and other minerals) when the percolating waters reached the reducing conditions below the water table. At Los Azules, the enriched blanket is encountered between 85 m and 170 m below ground surface. Whether or not this reflects the current groundwater regime is unknown.
The rock descriptions are based on observations from drill core and surface samples as no petrographic work has been done to date. The texture of the intrusive varies from fine-grained, equigranular to porphyritic, with feldspar phenocrysts in an aphanitic groundmass. The majority of the logging was performed by one geologist (Carlos Ulriksen of Rojas and Associates, an Argentine firm responsible for overseeing drilling, drill core splitting, and geologic logging during the 2004 and 2006 field seasons). Although the logging in 2006 was performed by other geologists, Carlos relogged the core to maintain consistency. On site project management during the 2007 field season and the current 2008 field season has been and is currently being handled by Diego Gordillo, a Minera Andes geologist, with assistance from other geologists and staff of Rojas and Associates.
Los Azules Preliminary Assessment Technical Report
SE Project No. 8019-01
70
11.0
Mineralization
Los Azules Preliminary Assessment Technical Report
SE Project No. 8019-01
71
Mineralization at the Los Azules deposit consists of various copper sulfide minerals in two main zones, which consist of the supergene and primary zones. The leached cap zone above the secondary or supergene enrichment zone is void of copper oxide minerals as none have been noted from surface or drill core observations. The upper part of the drill holes generally show a restricted leach zone less than 50 m in depth, but occasionally reach 140 m in depth, represented by limonites, mainly goethite and hematite. Most of the leached zone is by way of pyrite vein oxidation, yielding limonites (mainly goethite). The extension of the alteration halo is only centimeters, on both sides of the vein.
Minerals in the supergene enrichment zone are comprised of chalcocite replacing chalcopyrite and to a lesser extent pyrite. The supergene zone varies considerably in thickness from 40 m to well over 200 m, as some holes bottomed in copper mineralization.
Mineralization in the primary zone is comprised of chalcopyrite and pyrite with minor amounts of bornite and covellite (Figure 11.1). Although it was not always possible to visually pick the contact between the supergene and primary zone, an attempt was made to pick the zone based on the ratio of copper grade from the sequential chemical copper analysis. When the ratio of cyanide soluble copper to total copper fell below 50%, the zone was considered within the primary zone rather than secondary zone. As the project continues, further review of this determination will be required as the depth to heap-leachable copper will be necessary to determine economic verses non-economic grade copper.
Mineralization controls consist of the extensive stockworks, veining, and faulting as noted in the drill core. Faulting is extreme as evident by the significant rubblization of the majority of core holes. Mr. Ken Rippere, a geotechnical consultant hired by Minera Andes, Inc. (“MAI”), also noted that faulting and brecciation are extreme. In addition, Mr Rippere noted that the oxide cap is generally of better quality than the underlying sulfides and at this time, the anomalous condition has not been explained.
The drill hole spacing of 400 m (N-S) by 200 m (E-W) appears to indicate that the copper porphyry system is continuous from drill hole to drill hole. Locally the mineralized porphyry target appears to extend about 3 km (N-S) by 1 km (E-W).
Los Azules Preliminary Assessment Technical Report
SE Project No. 8019-01
72
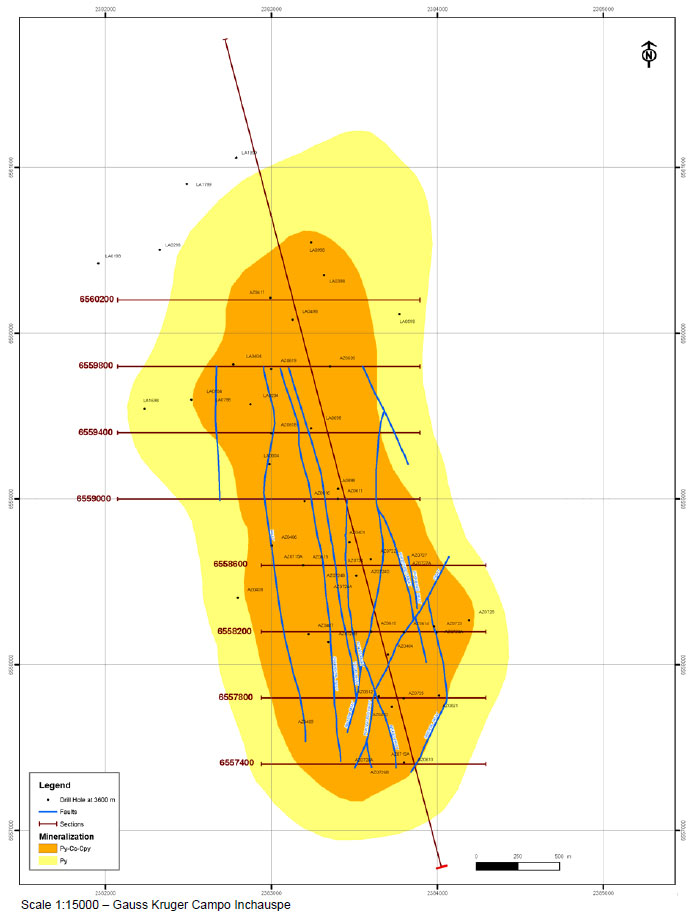
Figure 11.1 – Mineralization Plan View 3600 masl
Los Azules Preliminary Assessment Technical Report
SE Project No. 8019-01
73
12.0
Exploration
Los Azules Preliminary Assessment Technical Report
SE Project No. 8019-01
74
12.1
Exploration History
No formal records of previous exploration in the project area exist prior to 1980. Evidence of prospecting (small trenches or pits) exists on some of the cateos.
All survey work (primarily drill hole collar surveys) has been performed by Ingeniero Agrimensur Jose Hurtado, a local contractor registered with the province of Mendoza with AFIP: Matricula #1498, Colegio Agrimensura de Mendoza. Jose and Associates have done, or checked, all survey work reported to date at Los Azules.
According to Battle Mountain Gold Corporation and its operating subsidiaries (collectively known as “BMGC”) (1999) the high Cordillera of San Juan, especially the Los Azules range (also known as the Valle de Los Patos Norte) was not effectively explored prior to the 1980's. The only important project active was the Cu-Mo porphyry at El Pachón, some 100 km south of Los Azules.
Exploration activities documented by BMGC included the following:
·
At the end of the 1970's, airborne reconnaissance and reconnaissance mapping surveys detected a series of color anomalies that might correspond to porphyry copper systems. These areas were located some 20 km south of the Paso de La Coipa-Los Azules range.
·
During the summer field season of 1985 and 1986, reconnaissance geological mapping, and surface geochemical sampling in the vicinity of some of these color anomalies returned various anomalous values of arsenic, silver and copper in the region of Rincones de Araya and La Coipa.
·
In 1994, subsequent to a TM imagery study, BMGC asked for an exploration cateo in the "Los Azules" region. BMGC also optioned properties owned by Solitario Argentina S.A. (“SASA”) (now TNR Resources). In March 1995, BMGC initiated work in the sector of Quebrada La Embarrada along the Paso de La Coipa and Cordon de Los Azules west of Cordillera La Tortora. This work defined several zones of alteration and the presence of extrusive volcanic rocks and porphyries. Some chip samples returned values ranging from 0.3 to 0.5 g Au/t and up to 41 g Ag/t associated with anomalous copper values.
·
In December 1995, a detailed geological and prospecting campaign confirmed the presence of porphyritic intrusive rocks and hydrothermal veins. During the summer season of 1996/1997, BMGC decided that an access road should be established.
·
In 1997 and early 1998, BMGC constructed a new road for a total distance of about 95 km.
·
During March 1998, BMGC completed an airborne survey, detailed geological mapping, rock chip sampling, trenching and ten (10) widely spaced reverse circulation (“RC”) drill holes (total 2,167 m). These holes confirmed the presence of porphyry copper - gold mineralization in the east central portion of the property.
·
During the 1998/1999 field season, an additional fourteen (14) RC holes totaling 3,490 m were drilled in the northern portion of the Los Azules option (Escorpio II, Manifestacion #0154-F-28) and three (3) holes totaling 836 m were completed on the "La Coipa" property (Paso de La Coipa, Cateo # 545940-B-94), approximately 10 km west of the Los Azules property and immediately adjacent to the international border with Chile.
Los Azules Preliminary Assessment Technical Report
SE Project No. 8019-01
75
12.2
Subsequent Exploration
The San Juan Province project is a regional reconnaissance program, focused on epithermal gold and gold-copper porphyry targets in the eastern cordillera. All of the lands were acquired based on the results of satellite image analysis. Preliminary field examination, including rock chip sampling and property-wide stream sediment sampling, has been completed on all properties.
Minera Andes, Inc. (“MAI”) geologists discovered the Los Azules property through regional exploration and prospecting using Landsat imaging, mapping and sampling. The acquired land position covers approximately half of a large area of hydrothermal alteration typically associated with mineralized systems. Exploration drilling in 1998 within the northern property boundary by BMGC encountered significant copper intervals.
BMGC also completed an airborne magnetics survey over the entire Los Azules target area. This work also validates the porphyry target on the MAI ground. The base of information for Los Azules is taken primarily from an unsigned "Battle Mountain Gold" report, titled "Los Azules Project", Final Report, dated September 1999, by Battle Mountain Canada Ltd., San Juan, Argentina and includes drilling data presented on Los Azules along with some of the technical information provided to MAI by BMGC under the terms of a joint venture agreement.
In December 2003, MAI initiated an exploration program at Los Azules, including geologic mapping and sampling, ground magnetic and induced polarization geophysical surveys and core drilling. In May of 2004 MAI reported the discovery of a large, enriched (chalcocite) copper in an area defined by geology, MIMDAS deep penetration IP and magnetic geophysical surveys. The mineralized area is approximately 1,500 m by 2,000 m.
Nine reconnaissance core holes totaling 2,050 m were drilled in the campaign to depths of between 154 to 330 m. The primary focus of the drilling was to test the extension of known leachable (chalcocite) copper mineralization identified on the adjacent property. MAI's drilling tested a deep penetrating IP chargeability high anomaly as well as a well-defined magnetic low on its eastern flank. Drilling at Los Azules encountered features typical of many porphyry copper systems. In the discovery zone, strongly leached cap rock extended from 65 to 161 m depth followed by an enriched zone of secondary copper mineralization (chalcocite) overlying a zone of mixed secondary and primary (chalcopyrite) copper mineralization. The mineralization in MAI’s drilling was consistent with the mineralization observed in a prior hole drilled by BMGC some 220 m north of MAI's property, which contained a 117-m weighted average interval of 0.61% copper in the enriched zone.
Los Azules Preliminary Assessment Technical Report
SE Project No. 8019-01
76
13.0
Drilling
Los Azules Preliminary Assessment Technical Report
SE Project No. 8019-01
77
13.1
Drilling History
Drilling has been completed using both reverse circulation (“RC”) and diamond core (“core”) methods. The 1998 and 1999 drilling programs were completed by Battle Mountain Gold Corporation (“BMGC”). The remaining drilling programs have been completed by Minera Andes, Inc. (“MAI”) and Mount Isa Mines (“MIM”) - now Xstrata Copper, prior to the initial Option and Joint Venture Agreements between the two companies. Table 13.1 details the drilling to date by year and by company.
| | | |
Table 13.1
Exploration Drilling by Year and by Company |
Year | Company | No. of Holes | Meters Drilled |
1998 | Battle Mountain Gold Corporation (BMGC) | 16 | 3,614 |
1999 | Battle Mountain Gold Corporation (BMGC) | 8 | 2,067 |
2004 | Xstrata Copper (MIM) | 4 | 864 |
2004 | Minera Andes (MAI) | 9 | 2,064 |
2006 | Minera Andes (MAI) | 12 | 2,953 |
2007 | Minera Andes (MAI) | 18 | 3,783 |
2008 | Minera Andes (MAI) | 16 | 4,836 |
Total | | 83 | 20,181 |
Los Azules Preliminary Assessment Technical Report
SE Project No. 8019-01
78
13.2
Current Drilling
Holes MAI drilled during the 2008 campaign were intended to continue infilling the grid spacing of 400 m (N-S) and 200 m (E-W). During the 2008 campaign, 16 additional holes were drilled totaling 4,836 m, thereby bringing the total number of holes drilled on the project to 83.
The drilling program further tested the grade and the mineralized extension of supergene leachable copper (chalcocite), identified in prior drill campaigns on MAI’s and Xstrata’s property (the Xstrata property is the same land package explored by BMGC and Xstrata’s predecessor company, MIM). Overall, geology from the holes indicates a uniform sequence of dacite porphyry intruding diorite porphyry (granodiorite porphyry). The mineralization and alteration distribution, with respect to the rock type, indicate a lithological control on the disposition of the quartz veins and associated stockwork zones.
The drill locations completed through the 2008 drilling campaign within the Minera Andes area and Xstrata ground are shown on Figure 13.1. The most encouraging results containing significant copper intervals gathered from MAI’s various drilling campaigns are summarized in Table 13.2.
Drilling on the property begins with UDR diamond core rigs using a tricone bit to pass through surface talus or gravels where possible. Core drilling commenced with HQ size drill steel, narrowing to NQ size as necessary to reach depths of 300 to 350 m or until the drill passes through the supergene enrichment zone. Some PQ drill core has been recovered from the site as well. Several holes have bottomed in mineralization, either because the hole diameter has been reduced to the point that no smaller bits are available or the drill gets stuck or water circulation is lost as there appears to be significant fracturing in many parts of the deposit.
Current estimates indicate that the width of mineralization varies from a minimum of 400 m to a maximum of over 1 km. The length of the mineralization exceeds 3 km. As stated before, the true depth of mineralization is unknown; however, it is greater than 700 m below the current surface. Enriched secondary mineralization occurs as a horizontal layer starting 60 to 170 m below the current surface and varies from 40 to more than 200 m in thickness.
Drill hole recovery and RQD data is logged at the drill site by an MAI employee. The cuttings or core are transported to the man-camp for splitting and sample gathering. The core is identified by hole number and interval and photographed as whole core. The core is then split using a pneumatic core splitter, bagged, tagged, and prepared for transportation to Mendoza for continued sample preparation at the ACME lab.
Multiple drilling contractors have worked the project since MAI started drilling the deposit. The most recent group is Major from the city of San Juan, just north of Mendoza. In addition to its own geologists, MAI used the geologic consulting services of Rojas y Asociados of Mendoza, Argentina from time to time.
Los Azules Preliminary Assessment Technical Report
SE Project No. 8019-01
79
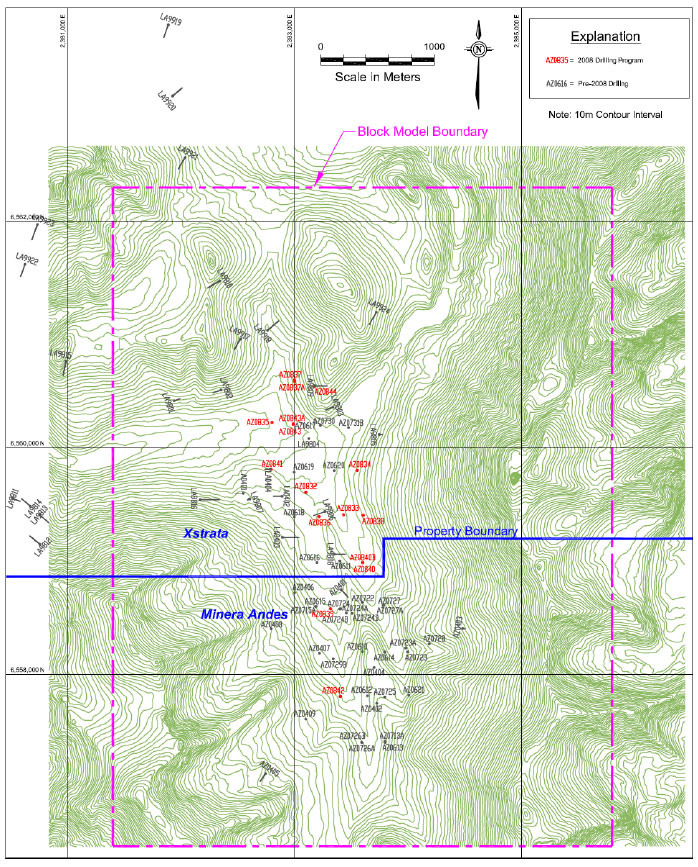
Figure 13.1 - Drill Hole Locations
Los Azules Preliminary Assessment Technical Report
SE Project No. 8019-01
80
| | | | | |
Table 13.2
Significant Drilling Results |
Drill Hole ID | TD (m) | Intersection | Interval (m) | Total Copper (%) |
From (m) | To (m) |
AZ0401 Includes | 195 | 130.0 150.0 | 195.0 192.0 | 65.0 42.0 | 0.62 0.82 |
AZ0402 Includes Includes | 330.5 | 164.0 164.0 230.0 | 304.0 190.0 304.0 | 140.0 26.0 74.0 | 0.38 0.47 0.42 |
AZ0404 Includes Includes | 300.8 | 162.0 162.0 236.0 | 282.0 202.0 282.0 | 120.0 40.0 46.0 | 0.54 0.59 0.64 |
AZ0407 Includes | 168.8 | 96.0 126.0 | 152.0 152.0 | 56.0 26.0 | 0.44 0.58 |
AZ0610 | 261.35 | 174.0 | 261.35 | 87.35 | 0.83 |
AZ0611 | 270.7 | 112.0 | 270.7 | 158.7 | 0.51 |
AZ0614 Includes | 224.55 | 132.0 136.0 | 180.0 158.0 | 48.0 22.0 | 1.13 1.40 |
AZ0617 Includes | 183.5 | 66.0 66.0 | 183.5 124.0 | 117.5 58.0 | 0.63 0.84 |
AZ0619 Includes Includes | 299.4 | 78.25 78.25 134.0 | 299.4 116.0 146.0 | 221.15 37.75 12.0 | 1.62 2.22 3.94 |
AZ0620 Includes | 253.3 | 80.0 80.0 | 226.0 106.0 | 146.0 26.0 | 1.10 1.54 |
AZ0722 | 271.2 | 119.0 | 155.0 | 36.0 | 0.99 |
AZ0724D | 278.2 | 124.0 | 160.0 | 36.0 | 0.79 |
AZ0729B Includes | 226.85 | 130.0 172.0 | 214.0 204.0 | 84.0 32.0 | 0.73 0.94 |
AZ0730 Includes | 342.6 | 123 140 | 323.8 253 | 200.8 113 | 0.89 1.04 |
AZ0832 | 420.0 | 80 | 140 | 60 | 0.78 |
AZ0833 | 387.8 | 73 | 313 | 240 | 0.94 |
AZ0837A | 540.95 | 326 | 516 | 190 | 0.82 |
AZ0841 | 400.15 | 241 | 285 | 44 | 1.83 |
Los Azules Preliminary Assessment Technical Report
SE Project No. 8019-01
81
14.0
Sampling Method and Approach
Los Azules Preliminary Assessment Technical Report
SE Project No. 8019-01
82
The drilling programs that have occurred on the Los Azules property since 1998 have used both reverse circulation (“RC”) and diamond core (“core”) equipment. All holes drilled by Battle Mountain Gold Corporation (“BMGC”) in 1998 and 1999 were RC type. Mount Isa Mines (“MIM”), now Xstrata Copper, drilled three RC holes and one core hole in 2004. Since 2004, Minera Andes, Inc. (“MAI”) has exclusively used core drilling techniques.
Sample preparation begins at the man camp where the core is labeled and photographed as whole core. The core is split using a pneumatic core splitter. Core that is not whole or is significantly rubblized is passed through a riffle splitter in order to obtain a reasonable sample. One half the core of 2 m sample length is placed in plastic sample bags and tagged accordingly. Both the sample bag and tag are marked with a sample number such that an inventory of samples prepared can be recorded by Minera Andes, Inc. (“MAI”) and checked against an inventory prepared by the lab receiving the samples.
The samples were sent initially to the Alex Stewart lab in Mendoza, and later to the ACME lab in Mendoza, for sample preparation and assaying duplicates. The analytical lab of ACME in Chile, runs total copper on all samples. Any interval that is greater than 0.20% total copper is run through the sequence of copper analyses, which consists of acid soluble copper, cyanide soluble copper and residual copper.
MAI has developed its own in-house reference standards for soluble copper. These samples are included in the normal sample runs submitted to the labs.
Both laboratories utilized by MAI have internal quality control samples used in each batch of sampled material provide by MAI. Each assay certificate lists the drill sample results, plus the lab’s internal sample control results that consist of its own duplicates, blank and reference standard pulp with each batch assayed for its internal quality control on precision, instrument drift, and accuracy in order to determine if there are any sampling issues for that particular run. Anomalously high values within batches are verified by re-assay as a matter of routine.
Reporting of assay results from the laboratory is transferred to MAI in electronic format (both Excel files and PDF format). Complete and final assays are prepared by the labs in PDF format with the lab certification results included with each batch.
Drill core recovery is recorded at the drill site and ranges from zero to 100 percent. Drill core recovery averages 78 percent from the supergene and primary mineral zones.
For exploration projects, NI 43-101 requires that some core be retained for future examination and verification. All core from the project is transferred to Mendoza and stored in a secured and well organized manner in a local warehouse within three blocks from MAI’s office.
Los Azules Preliminary Assessment Technical Report
SE Project No. 8019-01
83
15.0
Sample Preparation, Analysis and Security
Los Azules Preliminary Assessment Technical Report
SE Project No. 8019-01
84
15.1
Introduction
Robert Sim of Sim Geological Inc. visited the Los Azules property during the period of March 30 and 31, 2008. During his visit, Mr. Sim reviewed the geology of the project with Minera Andes, Inc. (“MAI”) site geology personnel. The results of the recent drilling program were discussed and select intervals from a series of drill holes were reviewed. A series of surface exposures were visited at the deposit site. Two active drill sites were visited (AZ-08-40B and AZ-08-43) and a series of (completed) drill holes collars were observed.
Time was spent reviewing the sampling procedures and QA/QC practices used during the drilling program. The sampling practices were found to adhere to accepted industry standards. Standard reference material is prepared by Alex Stewart from local source rocks and sent to a series of labs for round robin testing. Blank material is made from “barren” quartz with a small portion of leached material “to add some color” (i.e. in an attempt to appear anonymous in the sample string). As discussed later in the section, this material is not completely sterile and another source of blank material is recommended for future QA/QC programs. “Coarse” duplicates taken at site are actually core duplicates obtained from quarter core splits. Actual coarse material splits are recommended as a check of the crushing stage of sample preparation.
Robert Sim also visited Mineral Andes office and core storage facility in Mendoza on April 2, 2008. Drill core was observed from a series of random intervals and comparisons made between the assay results and the visual presence of copper bearing minerals. The assay results were confirmed by visual observations and checking against original assay certificates.
15.2
Sample Preparation
Drill hole samples are bagged and numbered when split. Subsequently 5 to 6 samples are placed in sacks containing approximately 25 kg. These sacks are closed with numbered bag ties. The sacks are not opened until they reach the laboratory where the bag tie number is recorded by laboratory personnel. Samples are transported by project personnel from the project to the laboratory.
During the 2004 and 2006 field season, sample pulps were prepared by Alex Stewart and shipped to the ALS Chemex laboratory in Chile for analysis. For the 2007 field season, and initially during the 2008 field season, samples were taken to the Alex Stewart Laboratory in Mendoza for sample preparation. Due to the heavy seasonal work load at this laboratory some problems occurred when transporting pulps from the Alex Stewart laboratory to ACME Analytical Laboratories in Mendoza for analysis. In particular, there was one instance where blanks and standards were not inserted into the numbered sequence of pulps when sent to ACME. Subsequently, field samples were taken directly to the ACME laboratory in Mendoza which only does sample preparation work. Sample pulps prepared at Alex Stewart, and later at the ACME laboratory in Mendoza, were shipped by ACME to ACME’s analytical laboratory in Santiago, Chile.
ALS Chemex, Alex Stewart, and ACME are all ISO 9001:2000 certified.
Los Azules Preliminary Assessment Technical Report
SE Project No. 8019-01
85
The sample preparation protocol consists of samples being dried at 60ºC until the desired moisture content is achieved. The entire sample is crushed to 85% passing 10 mesh (2 mm). The crusher is cleaned with high pressure air after every sample. The entire sample is then run through a Jones or riffle splitter to obtain 500 g. Rejects are retained.
The 500 g sample is pulverized in a ring-and-puck pulverizer to 95% passing 150 mesh (65 microns). The particle size of the samples is checked by screening random samples. The pulverizer is cleaned after every sample with high pressure air.
A 150 gram split of the pulp is placed in a pulp envelope numbered and sent to the assay lab. The remainder of the 500 gram pulp sample is saved as a pulp reject. These pulp rejects have been used for later check analysis at the Alex Stewart Laboratory in Mendoza.
15.2.1
Core Sampling
RQD measurements and core recovery are measured at the drill rig by Minera Andes personnel prior to the core being boxed. The core is placed in core boxes by the drill crew and is systematically logged by the geology staff at the core shed almost as soon as it becomes available. Core boxes are marked by the geologist every 2 m for sampling. Subsequently the core is photographed three boxes at a time by the sampling staff. Core is cut with a pneumatic splitter in order to minimize loss of sooty chalcocite, which could be lost by washing during cutting by diamond saw.
Alternating core halves are selected for assay. No particular scrutiny that might bias the results is applied to the alternating halves selected. The core inventory system is scrupulously maintained. The sample is bagged immediately after splitting. A lab generated sample ticket is inserted with the sample, and a second ticket is stapled into the throat of the bag. Nylon cable ties are used to seal the bags. The bags are then weighed and 5 to 6 sample bags are sealed in a larger rip-stop-mesh sack. The sacks are sealed with a larger cable tie labeled SECURED with a number attached. Samples are shipped at least once a week.
15.2.2
QC Sample Insertion
The sampling staff insert standards as specified in the quality sample handling procedure memo. There was every indication that the procedure was being strictly followed and QC sample coverage was adequate for the drilling.
Duplicate samples were taken every 40 to 45 samples by quartering the assay core splits. Blank material was inserted at the rate of one in every 40 to 45 samples.
15.2.3
Chain of Custody
The chain of custody has been outlined in the previous sections. It appears that any tampering with individual bags or the ties would be immediately evident when the samples arrived at the lab. Any tampering with the larger bags would also be apparent on arrival at the lab. Documentation was provided such that that it would be difficult for a mix up in the samples to occur either during shipment or at the lab.
Los Azules Preliminary Assessment Technical Report
SE Project No. 8019-01
86
All procedures were being carefully attended to and meet or exceeded industry standards for collection, handling and transport of drill core samples.
15.3
Sample Control Standards
Control samples consist of blanks, duplicates and reference standard samples in addition to submitting an appropriate number of check samples to outside, independent laboratories to assure assaying accuracy. Blank samples test for contamination; duplicates test for contamination, precision and intra-sample grade variance; and reference standards test for assay precision and accuracy.
15.3.1
Sample Standards
Control standards and blanks used during the 2007 and 2008 field season were prepared using composites of course rejects from the 2006 field season. Color was added to the blanks by adding a small amount of course reject from the leached horizon of the deposit. Six composites were prepared with distinct copper and gold contents as shown in Table 15.1.
| | | | |
Table 15.1
Sample Control Standards (2006 – 2007) |
Sample | Total Cu% | Standard Deviation | Au (ppm) | Standard Deviation |
STD B | 0.0047 | 0.0003 | 0.0500 | 0.002 |
STD 01 | 0.1096 | 0.0047 | 0.0470 | 0.0038 |
STD 03 | 0.3135 | 0.0146 | 0.0330 | 0.0164 |
STD 06 | 0.5300 | 0.0167 | 0.0260 | 0.0029 |
STD 08 | 0.8830 | 0.0202 | 0.0680 | 0.0021 |
STD 20 | 1.9540 | 0.0339 | 0.0670 | 0.0075 |
Note: Values were obtained from statistical analysis received from Alex Stewart. |
15.3.1.1
Method of Sample Selection
Each sample was taken from several drill holes at various depths within the deposit. Each sample contained material from 10 course reject samples with total copper values similar to the expected standard value. For each course reject sample, approximately 2 kg of material was included in the composite sample giving a sample of approximately 20 kg, which was later homogenized at the laboratory. Blanks were made by adding a small amount of leached cap material to white silica from the laboratory.
15.3.1.2
Laboratory
The composite samples were sent to the Alex Stewart Laboratory where they were homogenized, pulverized and split into 200 gram pulps. This resulted in 100 pulps per composite. Approximately 10 percent of these pulps were separated for analysis at each of four laboratories. Alex Stewart then sent these samples to the four independent laboratories including their own. This resulted in 40 samples from each composite being sent out for analysis.
MAI received approximately 60 pulps per composite for use later as control samples. Blanks were handled in the same manner; however, MAI requested that they receive 200 pulps after check analysis.
Los Azules Preliminary Assessment Technical Report
SE Project No. 8019-01
87
15.3.2
Control Sample Performance
The performance of standard reference material (“SRM” or “standards”) is evaluated using the criterion that ninety percent of the results must fall within ±10% of the accepted value for the assay process to be in control. Results are presented using statistical process control charts. In the chart the average value appears as a black horizontal line (middle line) and the certified value of the standard is listed near the average value line. Control limits at ±10% of the accepted value appear as red lines above and below the black line showing the accepted value. The assay values for the standard appear on the chart as green triangles.
15.3.2.1
Copper
Results for the copper standard Std01, shown in Figure 15.1, fall within the control limits above the prescribed rate. There is one value exceeding the upper control limit that may be a random event. The very low value is likely due to a sample swap.
The values from copper standards, Std03, Std06, Std08, Std20, fall within control limits more frequently than the prescribed rate. The results shown for Std03 (Figure 15.1) are typical.
Other copper standards tend to be of sufficiently low grade that detection limit effects influence the precision. Values do not fall within control limits at the prescribed rate. The graph for Std06 (Figure 15.2) shows typical results. These “standards” cannot be used to establish assay precision. The assay process is not sufficiently precise at these grade levels to detect anything other than gross errors such as the very low value as seen on the graph. The validity of the copper assay process is established by the standard suite: Std01 – Std20.
15.3.2.2
Gold
Most gold “standards” exhibit the same characteristics as the low copper “standards”. Values do not fall within control limits at the prescribed rate. The graph for Std20 shows typical results. These “standards” cannot be used to establish assay precision. The assay process is not sufficiently precise at these grade levels to detect any but gross errors.
Validity of the gold assay process is established by results from Std6 and Std7 as shown in Figure 15.3. Values outside the control limits shown in Figure 15.3 should be checked in order to eliminate swap errors or other data handling errors.
Results for all standards fall within control limits more frequently than the prescribed rate. Thus, there is no indication of systematic assaying problems in either the copper or gold values.
Los Azules Preliminary Assessment Technical Report
SE Project No. 8019-01
88
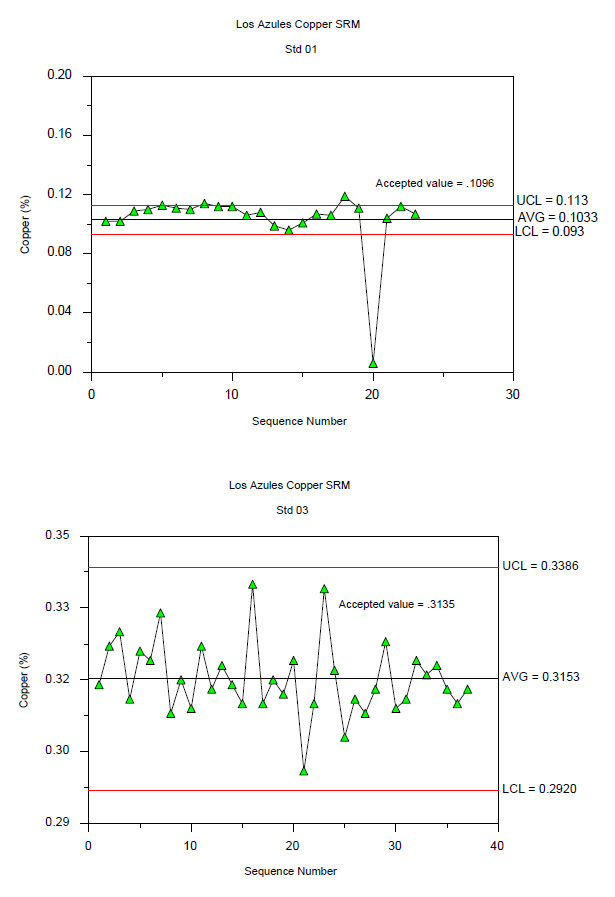
Figure 15.1 – Copper Sample Control (Std01, Std03) Performance Charts
Los Azules Preliminary Assessment Technical Report
SE Project No. 8019-01
89
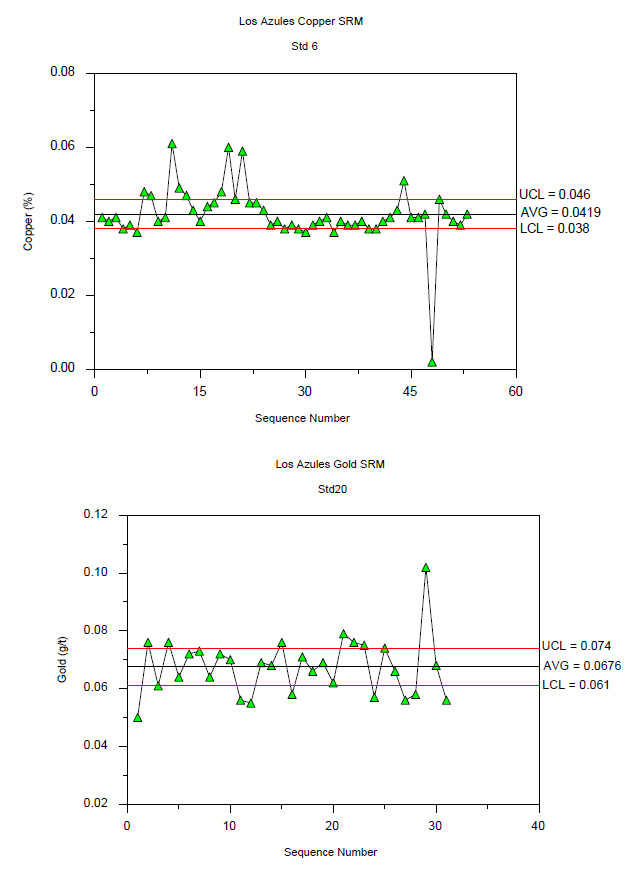
Figure 15.2 – Copper and Gold Sample Control (Std6, Std20) Performance Charts
Los Azules Preliminary Assessment Technical Report
SE Project No. 8019-01
90
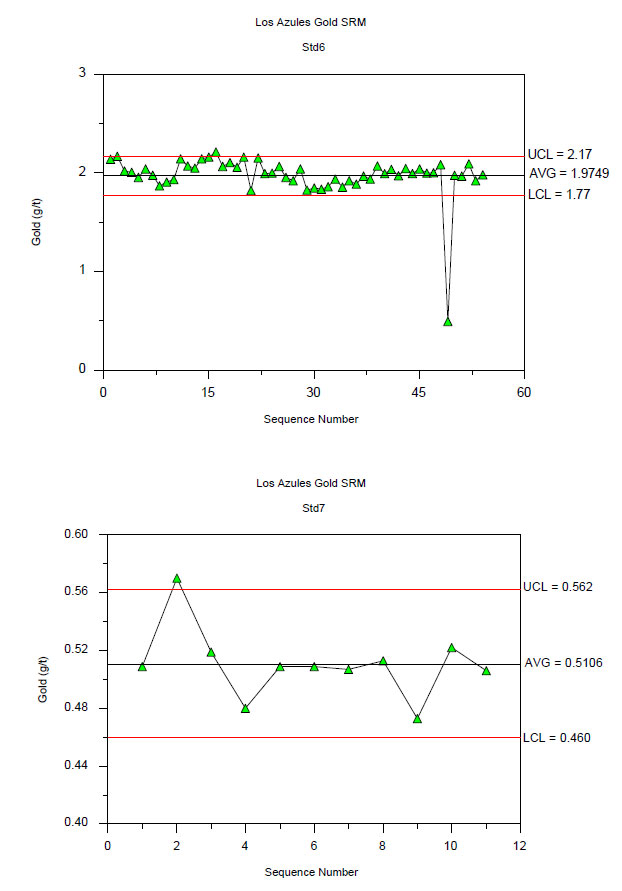
Figure 15.3 – Gold Sample Control (Std6, Std7) Performance Charts
Los Azules Preliminary Assessment Technical Report
SE Project No. 8019-01
91
15.3.3
Blank Sample Performance
It appears that the material being used to prepare blank samples is mineralized. This is due to the inclusion of leached core crushed reject in the quartz sand used to prepare the blanks prior to the 2006 field season. The charts in Figure 15.4 show that copper and gold each have problems. Contamination cannot be ruled out on the basis of these blank results. Silica sand, such as swimming pool filter sand, is preferred as blank material rather than mixing of leached cap core reject with the quartz sand. The inclusion of leached cap core reject material can produce too many false positives to be a valuable control. In order to establish that these blank results are not due to contamination, a suite of twenty samples from this blank material should be prepped and assayed as a batch. This should be enough to show there is occasional mineralization in the sample. It should be noted that these samples were treated by Alex Stewart in the same manner as the copper bearing standards and were analyzed by four separate labs.
15.3.4
Coarse Duplicate Sample Performance
Duplicate samples of coarse reject material are assayed to check the sample preparation protocol. If the protocol is adequate, ninety percent of the duplicate pairs of assays should fall within ±30% of each other. Although no coarse reject duplicates were available during this review, MAI is in the process of preparing these samples for future evaluation.
15.3.5
Pulp Duplicate Sample Performance
Duplicate samples of pulp (or the final sample product) material are assayed as another check on assay accuracy and precision. Although no pulp duplicates were available during this review, MAI is in the process of preparing these samples for future evaluation.
Los Azules Preliminary Assessment Technical Report
SE Project No. 8019-01
92
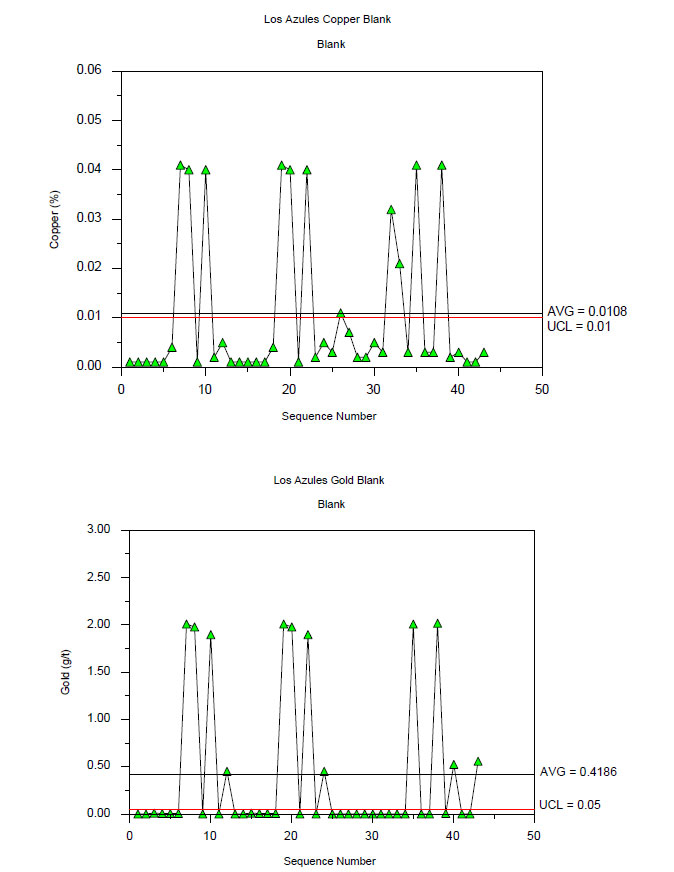
Figure 15.4 – Copper and Gold Blank Sample Control Performance Charts
Los Azules Preliminary Assessment Technical Report
SE Project No. 8019-01
93
15.4
Conclusions
Results from the SRM analysis indicate that the copper and gold assay processes are under sufficient control to produce reliable sample assay data for resource estimation and release of drill hole assay results. However, some standards are inadequate and should be eliminated from the QC database. Blank results suggest mineralized blank material that should be replaced. Coarse reject duplicates and pulp duplicates need to be appropriately paired for evaluation, which MAI is in the process of preparing for future evaluation.
Although there are some minor deficiencies in the current QC program that need remediation, the Los Azules sampling and assaying program appears to be producing sample information that meets industry standards for copper and gold accuracy and reliability. The assay results are sufficiently accurate and precise for use in resource estimation and the release of drill hole results on a hole by hole basis.
Los Azules Preliminary Assessment Technical Report
SE Project No. 8019-01
94
16.0
Data Verification
Los Azules Preliminary Assessment Technical Report
SE Project No. 8019-01
95
16.1
Verification of Geologic Data
16.1.1
Database Verification
A review of the database was conducted in order to verify the integrity of the contained data. Of the 83 holes used in the resource estimation, 8 holes were randomly selected and the data was sent to independent consultant Nivaldo Rojas of Rojas and Associates in Mendoza, Argentina (all of the original data is retained in Mendoza). The contained information, including collar locations, down-hole survey data, geology codes and assay values were verified back to the original source. The collar location and directional data was traced back to the original Survey sheets. The Geology data was traced back to the original drill logs and the assay data was compared to the original assay certificates.
There were no errors found in the drill hole collar locations and survey data.
A string of errors were found in hole AZ0841 between 245-283 m. Initial samples from this interval were reanalyzed because there were questions regarding the standards inserted with this batch. The reanalysis essentially confirmed (reproduced) the results from the initial analysis. However, the results from the reanalysis have been inserted into the database, replacing the original results. Typically, re-analysis of sample data is conducted for validation purposes and, upon confirmation, the original assay results are retained in the final database. Since both sets of data here are similar, the replacement of the original assay results is not deemed significant in relation to the validity of the database.
Other than the discrepancy described above, there were only two actual assay value errors noted in the database.
Several soluble copper analysis results were pending when the database was closed for modeling in May 2008. This represents only a handful of intervals and their absence does not significantly affect the interpretation of the mineral zone domains in the geology model.
There are numerous differences in geology codes identified between the dumped data file and the source data. These discrepancies stem from changes made to the geology database resulting from an ongoing relogging program. The development of the geology model at Los Azules is an evolving process which stems from the standardization of the geology database. The geology has not been utilized in the generation of the current resource model. These “errors” are not considered significant at this stage of the project and do not affect the resource estimation.
Other than the two actual assay value errors identified in the validation exercise, all other errors are the result of either the inclusion of additional data not available in May 2008 or due to changes in the geology database due to the ongoing relogging program. The results the data verification indicate that the database is sound and reliable for the purposes of resource estimation.
Los Azules Preliminary Assessment Technical Report
SE Project No. 8019-01
96
16.1.2
Site Visit Validation
Robert Sim visited the Los Azules site between March 31 and April 1, 2008. A series of randomly selected drill hole intervals from the 2008 drilling program were reviewed and in all cases, the type and content of copper minerals observed support the assay results obtained. It should be noted that during the period of April 2-3, 2008, Robert Sim visited MAI’s core storage facility in Mendoza and similar comparisons between visual/assay copper grades on a random series of older (pre-2008) drill holes. There were no discrepancies noted during this test.
On March 31, 2008, Robert Sim visited numerous drill site locations on the Los Azules property. The locations of these drill hole collars match the survey and topographic information in the database. Drilling activities, conducted by Major Drilling Inc., were observed in hole AZ-08-40B which was at a depth of 198 meters at that time. Drilling activities, by Advicer Drilling, were also observed on hole AZ-08-43.
The drill core handling and sampling procedures following on the property were also observed and discussed during the site visit. These practices follow accepted industry standards.
16.1.3
Conclusions
Observations during the site visit confirm the physical presence of the drilling activities completed on the deposit and the sampling procedures have been followed according to accepted industry standards. Observations of the contained mineralogy in the rocks support the assay results and these, as described in Section 15.0, have been monitored through an appropriate QA/QC program.
The results the data verification indicate that the database is sound and reliable for the purposes of resource estimation.
16.2
Verification of Analytical Data
Minera Andes, Inc. (“MAI”) receives all assay data in electronic format directly from ACME, as well as the other commercial assay labs, and combines that data with the drill hole survey data and the geologic data as logged by MAI geologists. No entry errors or inconsistencies have been found in MAI’s database.
Los Azules Preliminary Assessment Technical Report
SE Project No. 8019-01
97
17.0
Adjacent Properties
Los Azules Preliminary Assessment Technical Report
SE Project No. 8019-01
98
Not Used. There is no information regarding adjacent properties discussed in this report.
Los Azules Preliminary Assessment Technical Report
SE Project No. 8019-01
99
18.0
Mineral Processing and Metallurgical Testing
Los Azules Preliminary Assessment Technical Report
SE Project No. 8019-01
100
18.1
Introduction
Randolph P. Schneider, MAusIMM, of Samuel Engineering, Inc., (“SE”) of Greenwood Village, Colorado, was retained by Minera Andes S.A. to manage metallurgical testwork, provide scoping-level engineering and design for the process facilities, and calculate scoping-level capital and operating cost estimates for the mineralized material processing operation.
The throughput for the process plant will be 100,000 tonnes per day (“tpd”) via a conventional crushing, SABC grinding circuit, flotation and dewatering to produce an average of 531,000 tonnes of 31.9% copper concentrate per annum. The concentrate will be delivered by pipeline to the port facility of Coquimbo, Chile.
18.2
Review of Metallurgical Test Work
18.2.1
Summary
The scope of the metallurgical testing program for the Los Azules Copper Project Preliminary Assessment (“PA”) was to determine the flotation response of Los Azules mineralized material samples and provide data for the design of the grinding and flotation circuits.
The PA metallurgical test work (Los Azules Copper Project Metallurgical Investigation No. 6976-6991 / 7026-7028, July and September 2008) indicated the flotation response on the samples tested are typical of ore deposits for the recovery of copper, gold and silver. Two composites and 16 drill core samples were sent to Plenge for the metallurgical test work. Composite No. 1 is a secondary strong enrichment composite with 17% of the copper in chalcopyrite, while composite No. 2 is a primary weak enrichment composite with 49% of the copper in chalcopyrite. A small amount of high grade sample (No. 3) of primary sulfide with 75% of the copper in chalcopyrite was also sent to Plenge for metallurgical test work and it was confirmed that the high grade sample responded well to copper recovery by flotation.
18.2.2
Bottle Roll Leaching Tests
Based on the results from a total of 4 bottle roll tests on samples No. 1 and 2, the potential copper extractions are 76% and 44% assuming that 90% of the copper soluble in acid and cyanide will leach, but 5% of the chalcopyrite will leach. The tests were performed at 10 and 50 g/L sulfuric acid (H2SO4) concentration and the acid consumption during the tests showed a reasonable sensitivity to the acid concentration.
18.2.3
Grinding
Bond BMI were determined for composites No. 1 and 2 by Plenge to be 12.5 kW-h/t and 13.7 kW-h/t. The values for this work index suggest a mineralized material of medium hardness.
Los Azules Preliminary Assessment Technical Report
SE Project No. 8019-01
101
18.2.4
Flotation
18.2.4.1
Baseline Variability
Kinetic reagent selection flotation tests were first performed on composites No. 1 and 2 with eight different collectors to settle on primary collector A-3477 and secondary collector Z-14 for further testing with varying grind size and pH. Kinetic reagent selection flotation tests were also performed on sample No. 3. The collectors found to be the most effective and used for further testing were C-4920 as a primary collector and Z-14 as a secondary.
A set of four kinetic reagent flotation tests were performed on composites No. 1 and 2 to determine a primary grind size. Results indicate that the copper and gold recoveries decrease with an increase in grind size; therefore, 80% passing product size (P80) of 125 microns (“µm”) was chosen. Grind size optimization testing was done on sample No. 3 and it was also found that recovery decreases with an increase of grind size.
Additional tests were performed to determine the optimal rougher pH. Composite No. 1 responded well at a pH of 9, while Composite No. 2 yielded improved recoveries at a pH of 10. Sample No. 3 received the best results with a pH of 11. Since composite No. 2 is the dominant mineralized material type, a pH of 10 will be used in the rougher.
Through process optimization testing it was discovered that the composites require a regrind between 37 µm and 25 µm; therefore, a nominal regrind P80 of 30 µm was chosen.
Various depressants were tested for pyrite depression and it was noted that cyanide and sodium bisulfite reagents had no effect on controlling pyrite.
The variability tests were based against results for rougher flotation.
18.2.4.2
Locked-Cycle Tests
Locked-cycle tests were performed on each of the two composites and Sample 3. The results of the locked-cycle tests are shown in Table 18.1.
| | | | | | |
Table 18.1
Locked-Cycle Test Work Results |
Composite | Concentrate Assay | Metal Recoveries (%) |
Copper (%) | Silver (g/t) | Gold (g/t) | Copper | Silver | Gold |
1 – Strong Enrichment | 35 | 101 | 2.7 | 94.1 | 70 | 56 |
2 – Weak Enrichment | 31 | 80 | 3.9 | 94.7 | 62 | 66 |
Sample 3 – High-grade Primary Sulfide | 34 | 84 | 2.4 | 95.1 | 83 | 74 |
These results were factored for use in the process design to relate laboratory results to expected industry capabilities. In this, composite No. 1 concentrate is 34% copper with 92% copper recovery, composite No. 2 is 30% copper with 93% copper recovery and sample No. 3 is 33% copper with 93% copper recovery. From the results of these two composites and sample a weighted final concentrate copper grade of 30.8% copper and a recovery of 92.8% copper were applied to the process design.
Los Azules Preliminary Assessment Technical Report
SE Project No. 8019-01
102
18.3
Process Introduction
The Los Azules concentrator is a conventional copper flotation circuit with an annual throughput of 36,000,000 tonnes, based on an average daily throughput of 100,000 tonnes and 360 operating days per annum. The concentrator will be constructed on-site and will include an SABC comminution circuit followed by a flotation circuit and a copper circuit with thickener, concentrate pipeline, filtration and concentrate load out and shipping. Tailings thickener, tailings storage, and water reclaim are part of the tailings storage facilities (“TSF”). This circuit will have a design capacity of 108,696 tonnes per day (“tpd”) and the aforementioned nominal capacity of 100,000 tpd assuming a 92% mechanical availability.
18.4
Process Flowsheet Development
The process flowsheet (Figure 26.7) and the process block flow diagram (Figure 18.2) were used as the design basis in this report and represent a typical copper porphyry deposit mineral processing plant and may be subject to change in future studies as more metallurgical testwork results become available.
18.5
Process Plant Siting Considerations
Considerations dictating the location of the process plant and ancillary facilities include:
·
Preference for gravity handling of tailings between the process plant and the tailings storage facility (“TSF”);
·
Favorable topography allowing gravity flow within and between process facilities and to minimize mass earthworks;
·
Potential environmental and social impacts;
·
Proximity to the mine thus minimizing mineralized material transportation cost;
·
Proximity to reclaim water from tailings;
·
Preference of fresh water sources; and
·
Plant elevation above sea level.
Preference for gravity handling of tailings to the TSF was given primary consideration in locating the concentrator plant due to the high cost of operating a pumped system and potential environmental impact of a pressurized line. This parameter therefore dictated that the plant be at a higher elevation than the TSF for at least a majority of operational duration.
Next in importance is minimizing mineralized material transportation distance from the mine to the process plant. The primary crusher will be located as close to the mine as possible (i.e pit rim configuration) in order to minimize truck haulage distance, thereby dictating conveyance of crushed mineralized material to the concentrator. The ancillary facilities are located in relation to the main facilities for purposes of convenience (ex. the truck shop adjacent to the pit and the primary crusher), or isolation (ex. permanent camp located to minimize plant noise impact).
Los Azules Preliminary Assessment Technical Report
SE Project No. 8019-01
103
The fresh water source is comprised of four wells, located approximately 11 km from the plant site. Reclaim water will be pumped from a floating barge within the TSF. Figure 18.1 shows the proposed process plant, man camp, access road, concentrate pipeline, waste rock disposal facility (“WRDF”), and TSF locations.
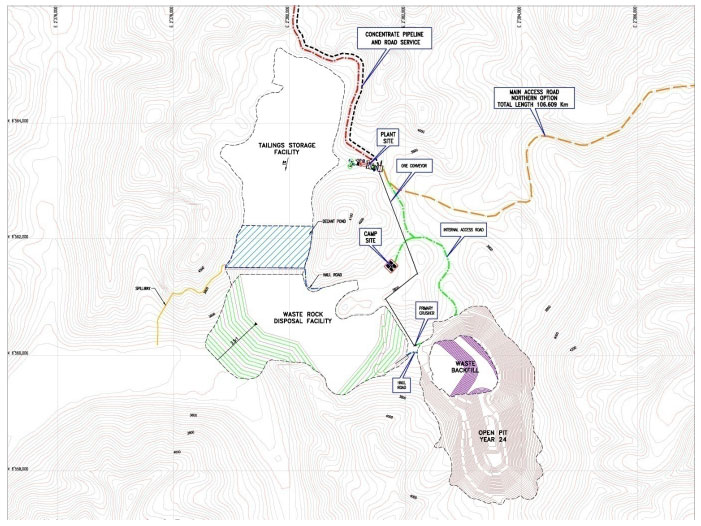
Figure 18.1 – Mine Site General Arrangement Plan
Los Azules Preliminary Assessment Technical Report
SE Project No. 8019-01
104
18.6
Process Block Flow Diagram
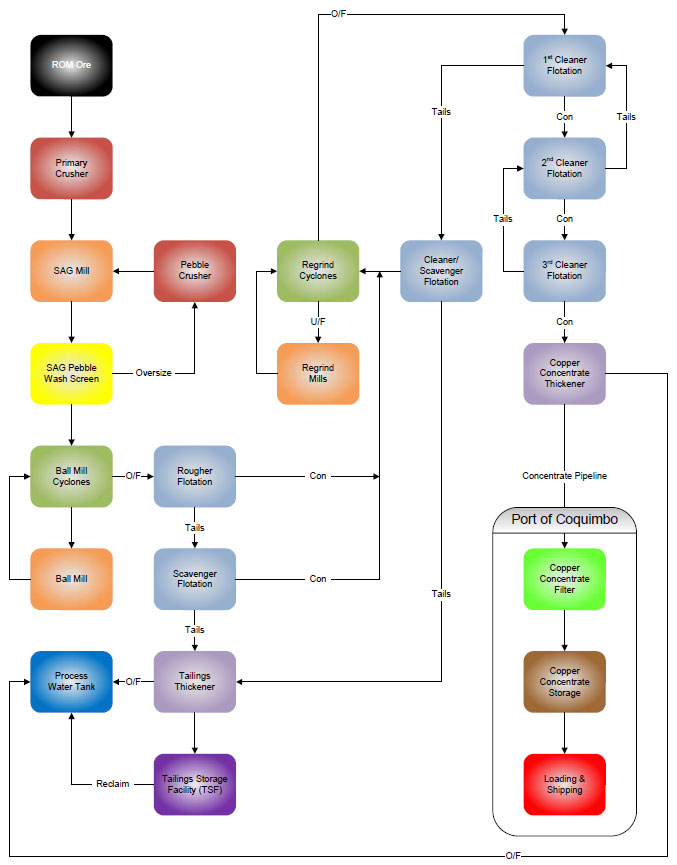
Figure 18.2 – Process Block Flow Diagram
Los Azules Preliminary Assessment Technical Report
SE Project No. 8019-01
105
18.7
Process Description
18.7.1
Crushing and Coarse Ore Stockpile
The primary crushing station is such that run-of-mine material will be transported and dumped from 240 tonne haul trucks. The dump pocket is a double dump design allowing two trucks to stage prior to feeding the crusher. The 1,524 mm x 2,794 mm (60 inch x 110 inch) primary gyratory crusher will discharge to a cavity with a capacity of one and a half trucks, producing a 175 mm (7 inch) feed for the grinding circuit.
The crushed material is conveyed to a coarse material stockpile with a live capacity of 100,000 tonnes.
18.7.2
Grinding
Material from the coarse ore stockpile is reclaimed via four (4) of six (6) sub-grade reclaim feeders and transported by conveyor to two (2) parallel grinding lines. Each grinding line is comprised of one (1) 12.2 m diameter x 6.7 m long (40 ft x 22 ft) semi-autogenous grinding (“SAG”) mill powered by a 25 MW gearless drive, and one (1) 7.6 m diameter x 11.3 m long (25 ft x 37 ft) ball mill powered by a 15 MW dual pinion drive.
The two (2) SAG mills discharge through trommel screens and the screens oversize (critical size) report to two (2) 5.36 m x 3.87 m (17.6 ft x 12.7 ft) pebble crushers, each driven by a 1.0 MW motor, before returning to the SAG mills. Cyclone classification is employed to produce the required particle size distribution at P80 of 125 microns (“µm”). This overflow will be fed to the rougher flotation circuit.
18.7.3
Flotation and Regrind
The cyclone overflow from the grinding lines will be combined and then redistributed between two (2) rougher flotation circuits. Each rougher flotation cell bank will consist of six (6) 300 m3 tank cells providing sixteen (16) minutes of residence time. The rougher concentrate will report to a regrind circuit prior to entering the cleaner circuit.
Tailings from the rougher flotation circuits will be combined and sent to two (2) scavenger flotation banks, each consisting of three (3) 300 m3 tank cells with an eight (8) minute residence time. Concentrate from the scavenger circuit will combined with the rougher concentrate and will report to the aforementioned regrind circuit, while the tails will report to the tailings thickener.
The combined rougher and scavenger concentrates are reduced to a P80 of 30 µm in six (6) 1,250 hp tower mills before being pumped to the cleaner circuit. Cyclone classification is again employed to produce to desired particle size distribution to the cleaner circuit.
The 1st cleaner flotation circuit consists of eight (8) 5.49 m dia. x 10.97 m tall (18 ft x 36 ft) column type float cells having a volume (with froth factor) of 260 m3 each and a seventeen (17) minute residence time.
Los Azules Preliminary Assessment Technical Report
SE Project No. 8019-01
106
The 1st cleaner underflow is transferred to the cleaner/scavenger flotation circuit which consists of six (6), 200 m3 tank cells. After a fourteen (14) minute residence time in the scavenger cells, the reclaimed concentrate is sent back to the regrind circuit. The tailings from the cleaner/scavenger cells are then joined by the rougher and scavenger flotation tailings and transferred to two (2) 80 m (263 ft) diameter tailings thickeners.
The concentrate from the 1st cleaner flotation cells transfers to the 2nd cleaner flotation circuit consisting of five (5) 5.49 m x 10.97 m column type cleaner cells having a volume (with froth factor) of 260 m3 each. The residence time in this circuit is eighteen (18) minutes. Tails from the 2nd cleaner circuit will be sent back to the 1st cleaner circuit. Concentrate from the 2nd cleaner will report to the 3rd cleaner flotation circuit.
The 3rd cleaner flotation feed circuit consists of two (2) 5.49 m x 10.97 m flotation columns having a volume (with froth factor) of 260 m3 and a residence time of twenty-four (24) minutes. Tails from the 3rd cleaner circuit reports back to 2nd cleaner flotation. Concentrate from the 3rd cleaner reports to the copper concentrate thickener.
18.7.4
Concentrate Thickening
Final copper concentrate at 25% solids from the 3rd cleaner flotation concentrate stream will be thickened to 60% solids in one (1) 45 m (148 ft) diameter thickener.
18.7.5
Concentrate Transportation
Concentrate slurry is planned to be piped from the Los Azules mining operation 261 km to the Coquimbo, Chile port facility (Figure 18.3). An average pipeline flow of 80 m3/hr is estimated to be required to transport the solid concentrate. Treatment of this water will be conducted only if deemed necessary upon separation from the concentrate.
Los Azules Preliminary Assessment Technical Report
SE Project No. 8019-01
107
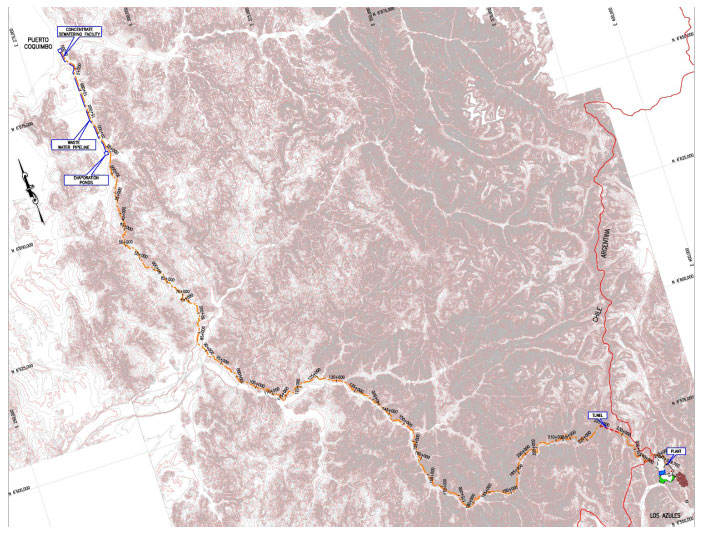
Figure 18.3 – Concentrate Pipeline from Los Azules Mine Site to the Port facility
18.7.6
Concentrate Filtration and Storage
A filter plant, containing three (3) vertical pressure type dewatering filters will be located at the port facilities where the copper concentrate will be dewatered and stored. The copper concentrate filter cake containing 8% moisture reports to the covered copper concentrate stockpile for loading via a front-end loader to transport ships. A ship loading facility will also be constructed at the port to facilitate exportation of the concentrate to the smelter.
18.7.7
Filtrate Handling
Concentrate pipeline water is expected to be separated from the concentrate at the port of Coquimbo. It has been deemed cost prohibitive to pump the concentrate water back to site over the 200 km and over 4,000 m change in elevation. Three potential areas for land applied water disposal have therefore been identified near the town of Coquimbo. Evaporation was chosen as the disposal method of this study because of its potential for relatively low operational and environmental costs.
A scoping level water balance was completed to size evaporation ponds for pipeline water disposal. This estimate will be refined in the future as the project is advanced and an exact disposal location is selected.
Los Azules Preliminary Assessment Technical Report
SE Project No. 8019-01
108
Three water disposal site options were identified in unpopulated areas south of Coquimbo where permitting and land acquisition will present less obstacles. Figure 18.4 shows an aerial view of the three sites, A, B and C that are respectively 15, 19 and 32 km south of Coquimbo.
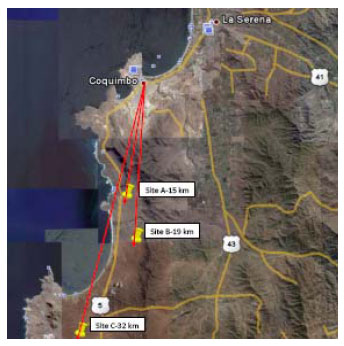
Figure 18.4 – Potential Concentrate Water Evaporation Sites
Average monthly precipitation and pan evaporation data are from La Serena weather station, one of the national meteorological stations in Chile (Dirección General de Aguas, 1987). The station is located at 142 masl at Latitude 29º 54´ 00´´ S and Longitude
71º 12´ 00´´ W approximately 11.1 km North of Coquimbo. Table 18.2 gives the relative distance between the weather station and the three water disposal site options.
| | | | |
Table 18.2
Evaporation Site Location |
Site | Elevation (masl) | Latitude | Longitude | Distance to La Serena (km) |
A | 53 | 30°06’00” S | 71°21’19” W | 24.3 |
B | 106 | 30°09’10” S | 71°21’35” W | 28.6 |
C | 110 | 30°14’44” S | 71°24’55” W | 41.2 |
The water balance uses a pan evaporation coefficient (0.7) and salinity correction factors (0.9) to convert pan evaporation data to potential evaporation. Although the ponds are relatively extensive which reduces evaporation, they are shallow which increases evaporation and therefore no shape factor has been applied. The conservative salinity correction factor used of 0.9 corresponds to a storage pond concentration of 17% sodium chloride by weight (INEEL, 2001).
Los Azules Preliminary Assessment Technical Report
SE Project No. 8019-01
109
Pan evaporation data was therefore converted to a potential evaporation approximation using the equation:
Estimated Potential Evaporation = Measured Pan Evaporation X 0.7 X 0.9
The water balance considers two inputs: precipitation, and concentrate pipeline water. The single output in the balance is evaporation. Although the climate will vary slightly between the different evaporation sites and the weather station, equal values corresponding to the weather station records were used for all three sites. Average year values of precipitation and evaporation are estimated to be 79.9 mm and 1,197.0 mm respectively. Estimates of water surpluses and deficits within the evaporation ponds on a monthly and annual basis were made.
Water balance occurs with a pond area of approximately 1 km2 (104 ha). It would be recommended to build multiple ponds in order to arrive at the estimated total evaporative surface area. Multiple ponds would allow maintenance to be performed on individual ponds without the need to shut down piping operations. Storage considerations for peak rainfall events and seasonal rainfall fluctuations will need to be made in the design of the evaporation ponds.
The following studies are recommended for further evaluation of water disposal alternatives:
·
Evaluate land availability for water disposal near port site;
·
Design a field program for testing physical and chemical soil properties; and
·
Evaluate potential environmental impacts at water disposal site.
18.7.8
Tailings
Vector Perú S.A.C was retained by MAI to site waste material storage facilities, which includes the TSF, and to provide a scoping-level design for the TSF.
The mine plan estimates the mine life to be approximately 24 years with a production rate of approximately 100,000 tpd. Following the concentration process, it is estimated that approximately 98% of mineralized material will be discharged into a TSF as waste. During the scoping study it was also decided to utilize co-disposal in the WRDF to reduce storage requirements for the TSF thereby reducing capital and sustaining costs. Current estimates require that the ultimate TSF capacity is approximately 663 million tonnes (dry); while 166 million tonnes of tailings will be diverted to the WRDF. At an estimated average dry density of 1.3 tonnes/m3, this is equivalent to approximately 510 million m3 storage requirement for the TSF.
Tailings will be discharged by gravity from the process plant located above the TSF on the east side of the impoundment as slurry, a mixture of pulverized rock and water, with an estimated 55% solids content by weight. In addition to the tailings, the TSF will store water, including water that separates from the tailings slurry, incident rainfall, rainfall runoff from the surrounding catchment and process make-up water pumped into the TSF from other sources such as the pit dewatering.
See Sections 20.2.2 and 20.2.3 for additional information regarding the WRDF and TSF.
Los Azules Preliminary Assessment Technical Report
SE Project No. 8019-01
110
18.7.9
Reagents
The Reagents to be used include:
·
Lime
·
Collector
·
Primary: A-3477
·
Secondary: Z-14
·
Frother
·
Dow250
·
Flocculant
18.7.10
Water Treatment, Dust and Emissions Control
Further studies are required to evaluate the impacts of the mine on downstream water quality. Generally it is anticipated that water recovered from TSF embankment and WRDF underdrain collection systems and the pit will be used for process make-up water and/or treated if required for discharge to the Rio Salinas. Similarly, sewage water will be treated and either reused or appropriately disposed of.
A vigorous program of downstream water monitoring will be maintained to ensure that water downstream of the operation meets water quality objectives developed for the site, based on Argentinean regulatory requirements.
Waste water from the concentrate pipeline will be discharged to evaporation ponds located near Coquimbo.
Mining operations and vehicle movements along site roads are anticipated to create dust during the dry season. Dust will be mitigated through the use of watering trucks as necessary. Fresh water will be used for dust control. Vehicles will be equipped as necessary with emissions controls consistent with local requirements.
Dust generated by the crushing and conveying operations will be controlled by a combination of dust suppression and dust collection systems. Emissions from all other process operations and process equipment, such as generators, will be controlled by other process equipment or process operations specified during detailed design studies.
18.7.11
Process Design Criteria
The following pages represent the design criteria used to establish the process for a 100,000 tonnes per day operation process facility.
Los Azules Preliminary Assessment Technical Report
SE Project No. 8019-01
111
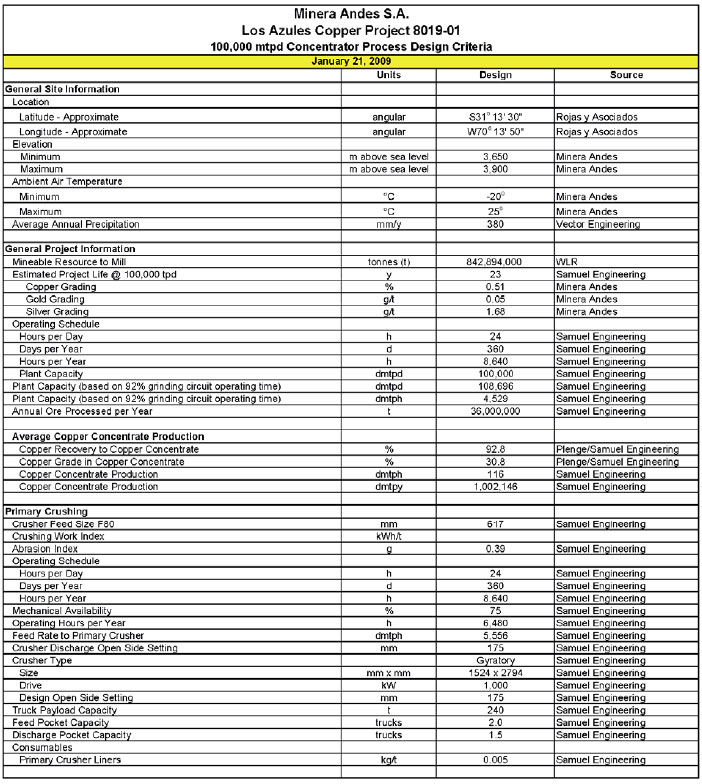
Los Azules Preliminary Assessment Technical Report
SE Project No. 8019-01
112
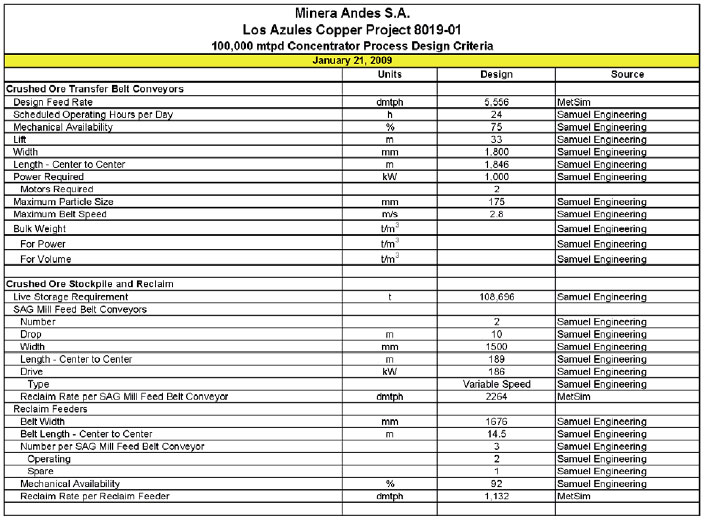
Los Azules Preliminary Assessment Technical Report
SE Project No. 8019-01
113
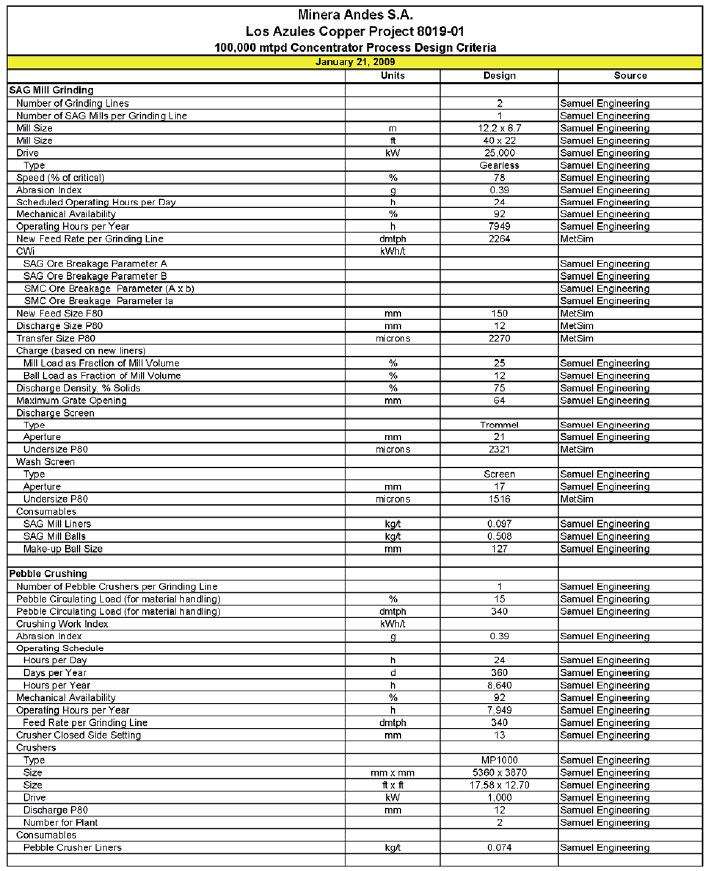
Los Azules Preliminary Assessment Technical Report
SE Project No. 8019-01
114
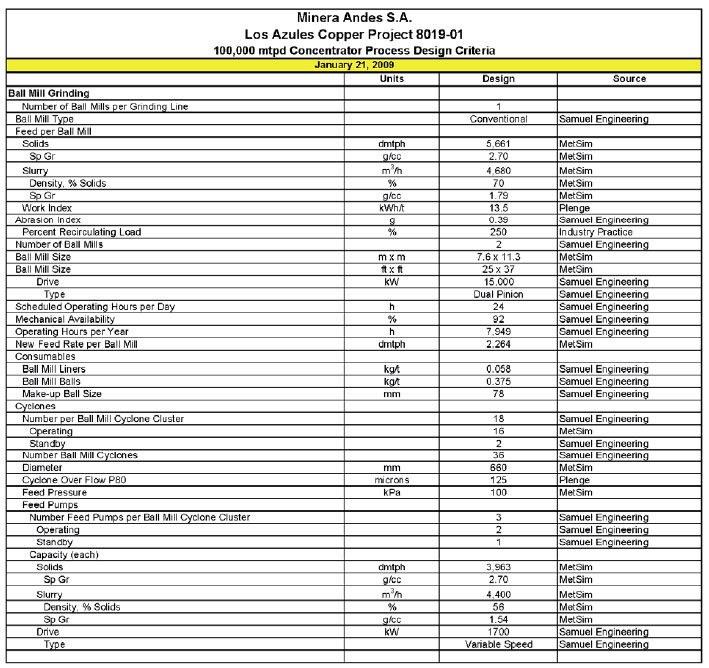
Los Azules Preliminary Assessment Technical Report
SE Project No. 8019-01
115
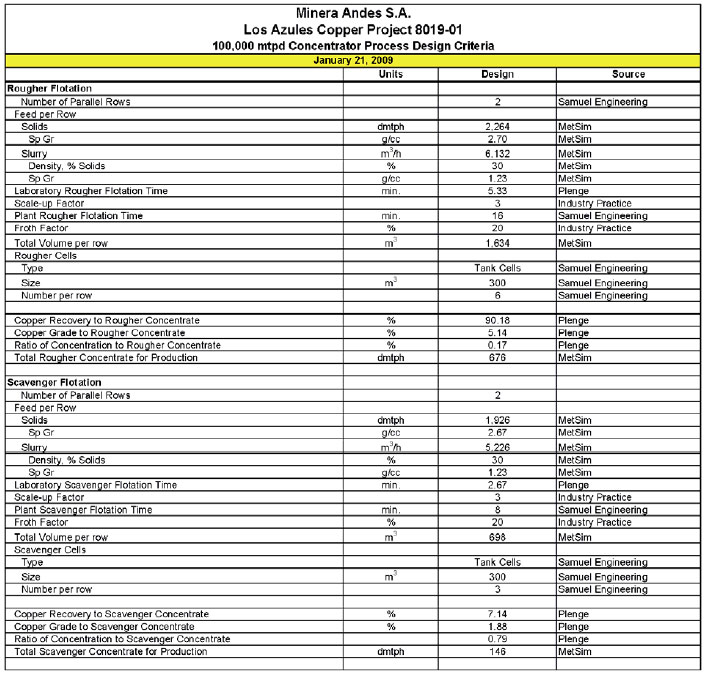
Los Azules Preliminary Assessment Technical Report
SE Project No. 8019-01
116
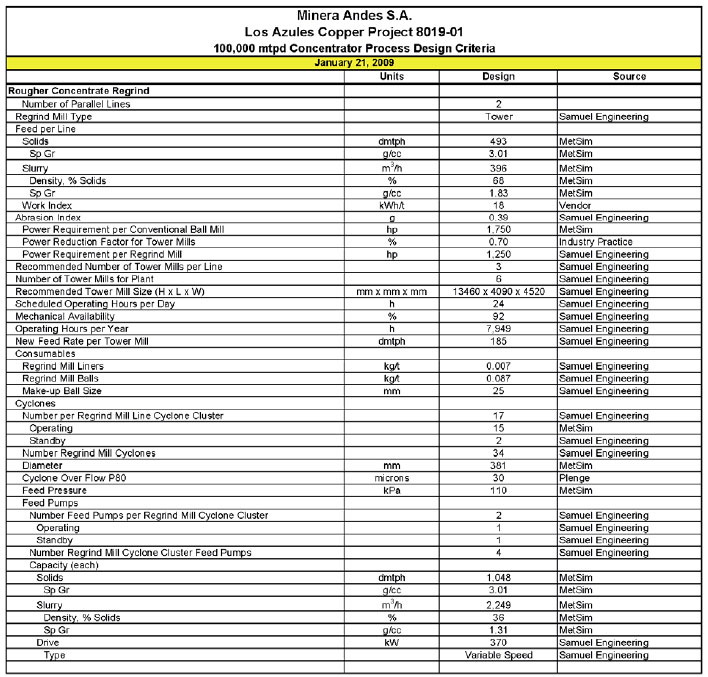
Los Azules Preliminary Assessment Technical Report
SE Project No. 8019-01
117
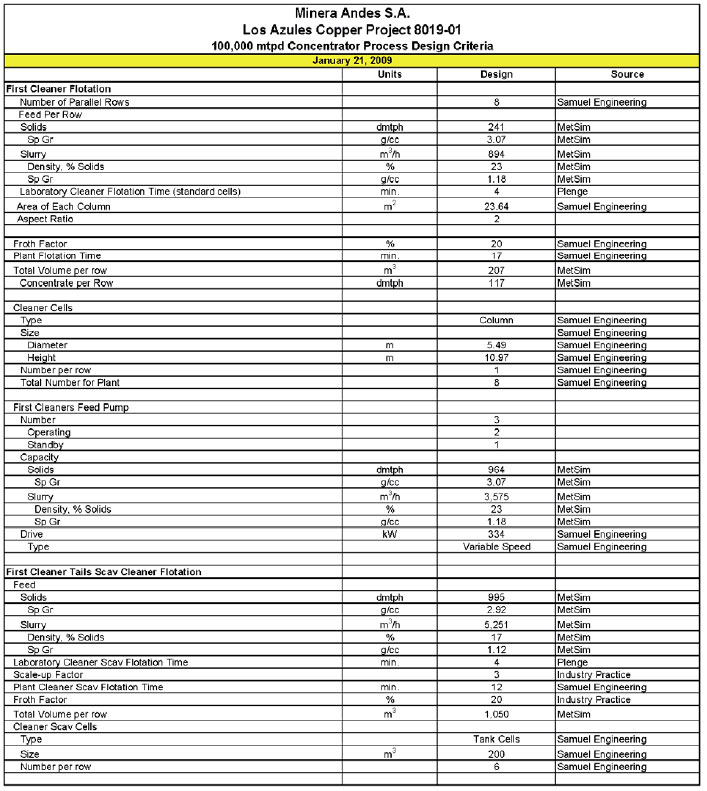
Los Azules Preliminary Assessment Technical Report
SE Project No. 8019-01
118
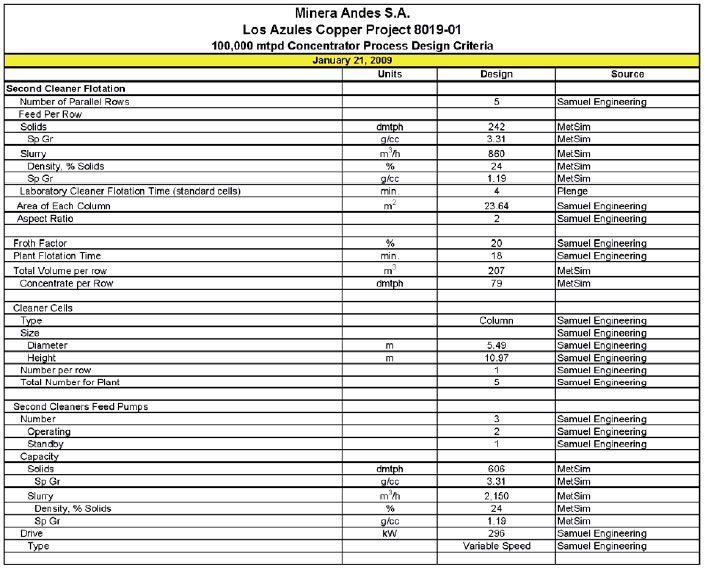
Los Azules Preliminary Assessment Technical Report
SE Project No. 8019-01
119
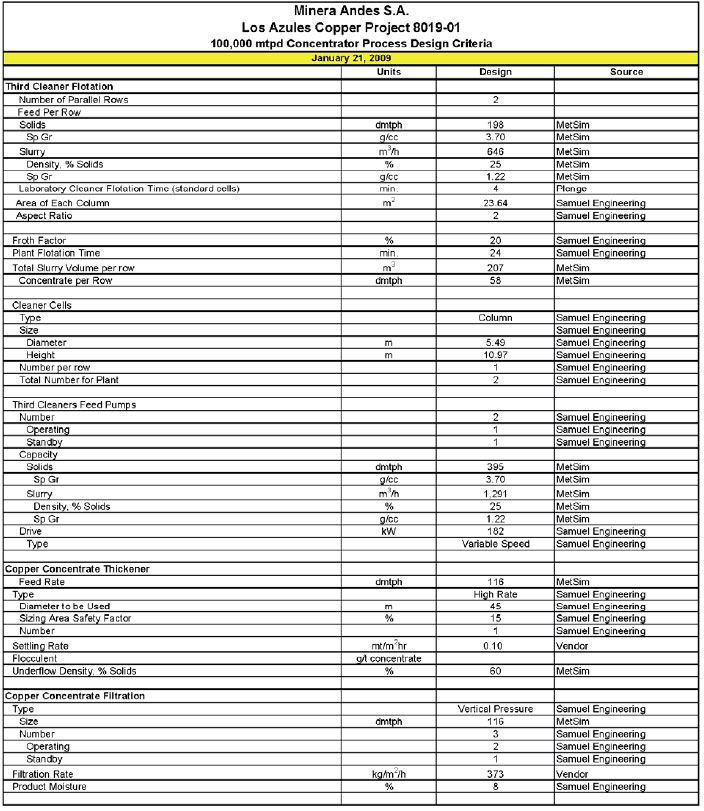
Los Azules Preliminary Assessment Technical Report
SE Project No. 8019-01
120
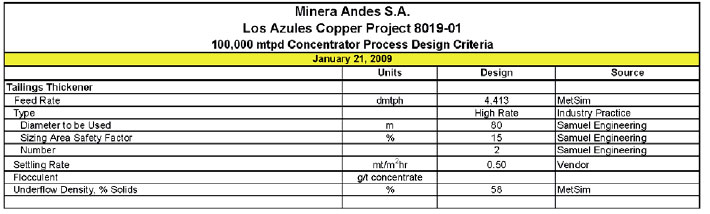
Los Azules Preliminary Assessment Technical Report
SE Project No. 8019-01
121
19.0
Mineral Resource Estimate
Los Azules Preliminary Assessment Technical Report
SE Project No. 8019-01
122
19.1
Introduction
The mineral resource estimate was prepared under the direction of Robert Sim, P.Geo with the assistance of Bruce Davis, FAusIMM. Mr. Sim and Mr. Davis are each an independent Qualified Person within the meaning of NI 43-101 for the purposes of mineral resource estimates contained in this report. Estimations are made from 3-dimensional block models based on geostatistical applications using commercial mine planning software (MineSight® v4.00.04). The project limits area is based in the UTM coordinate system using a nominal block size of 20 x 20 m in plan and 15 m in height. The primary orientation of the drilling and the subsequent geologic interpretation has been conducted using a series of vertical
(E-W) oriented cross sections spaced on 400 m intervals (N-S) within the deposit. Drill holes are nominally spaced at 200 m intervals along the (E-W) section. Some drilling has been completed on the intermediate (N-S) intervals to infill the (N-S) interval on a 200 m spacing.
The resource estimate has been generated from drill hole sample assay results and the interpretation of a geologic model which relates to the spatial distribution of copper in the deposit. Interpolation characteristics have been defined based on the geology, drill hole spacing and geostatistical analysis of the data. The resources have been classified by their proximity to the sample locations and are reported, as required by NI 43-101, according to the CIM standards on Mineral Resources and Reserves.
With the mineral resource defined, William L. Rose of WLR Consulting established the mine plan (See Section 20.1) subsequent to developing of the Pit Limit Analysis (Section 19.15), Pit Design (Section 19.16) and Mineral Resources Within Designed Pit/Phases (Section 19.17). Mr. Rose is a registered Professional Engineer in the states of Arizona and Colorado and is an independent Qualified Person within the meaning of NI 43-101.
19.2
Geologic Model, Domains and Coding
The geologic model for the Los Azules model is currently evolving with the addition of new information and as a result of the re-logging of previous drill holes by Minera Andes, Inc. (“MAI”) personnel. Host dioritic rocks have been intruded by compositionally similar but texturally porphritic dioritic rocks which has resulted in the introduction of porphyry-style copper mineralization. Copper is present in both the host diorites and in the younger intrusive porphyritic phases, often associated with gradational zones of brecciation and silica stockwork near the contacts. There are late stage, post mineral dacite dykes present but these are rare and tend to be less than 3 m in thickness. There does not appear to be a distinct relationship between rock type and mineralization and, therefore, a lithology-type geologic model has not been generated for resource modeling purposes.
There appears to have been a very minor degree of near-surface remobilization of copper due to acidic fluids created from the breakdown of pyrite in this reducing environment. These mechanisms are well documented in relation to many porphyry copper deposits, often developing a high-grade blanket of “supergene” enrichment, which is overlain by a “leach” cap and is essentially void of contained metals. It is apparent that both of these types of mineralization zones (Minzone) have been developed at Los Azules and are underlain by primary sulfide mineralization comprised of pyrite, chalcopyrite and bornite.
Los Azules Preliminary Assessment Technical Report
SE Project No. 8019-01
123
Separate domains have been interpreted for overburden (“OVB”), leached (“LX”) and supergene (“SS”) zones using a combination of mineral zone logging (visual observation of enrichment minerals such as chalcocite and/or covellite) and assay grades. In many areas, the base of the SS zone is defined at the interval where the ratio of cyanide soluble copper (“CSCu”) to total copper (“TCu”) is greater than 60 percent. Soluble copper assay data is not present in all drill holes and hence, visual observation is utilized in these cases.
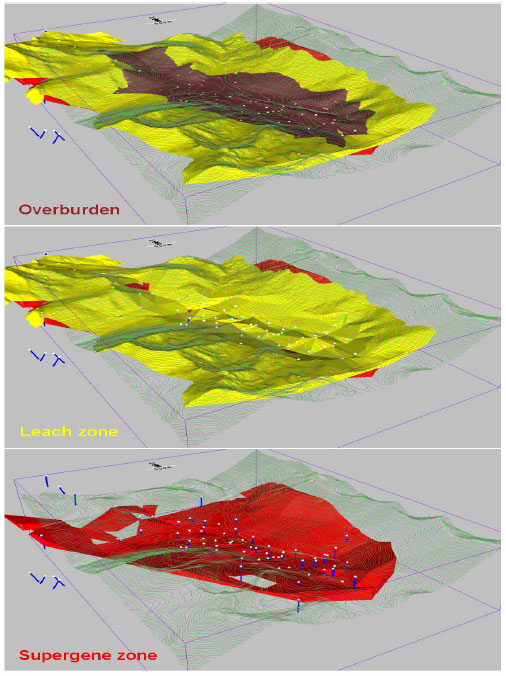
Figure 19.1 - Mineral Zone Domains
Los Azules Preliminary Assessment Technical Report
SE Project No. 8019-01
124
| | |
Table 19.1
Mineral Zone Domains and Coding |
Domain | Minzone Code | Comments |
Overburden (OVB) | 1 | Surface soil and gravels. |
Leach (LX) | 2 | Rock in which the majority of sulphide mineralization has been leached. |
Supergene (SS) | 3 | Zones where enrichment mineralogy is present (chalcocite and/or covellite). |
Primary (PR) | 4 | Hypogene sulphide mineralogy (pyrite, chalcopyrite, bornite). |
Drill hole intervals below the SS domain have been coded as primary (“PR”) zone. The Minzone domains are summarized in Table 19.1 and shown in Figure 19.1.
Overburden is thickest in the valley floor and thins as the slopes steepen to the west and east. Thicknesses are variable and range up to 100 m in some locations but average approximately 60 m in thickness above the zone of mineralization. The LX zone is also locally variable in thickness from non-existent in some drill holes to almost 200 m thick in others. The average thickness of the LX zone above the deposit is approximately 40 m. The underlying SS zone is also somewhat variable with thicknesses ranging from zero to over 250 m with an average of approximately 70 m.
The distribution of alteration assemblages encountered in drilling is currently being evaluated by MAI personnel and re-logging of drill core is required in some areas in order to bring more consistency to the information. The current status suggests that there are several types of alteration present in the deposit area and these tend to occur as diffuse, overlapping domains which are not specifically related to the type or content of mineralization present. As a result, alteration domains have not been utilized in the development of the grade model.
19.3
Database
The drill hole database was provided by MAI personnel on June 24, 2008 in the form of an Excel spreadsheet file. There are a total of 83 drill holes in the database with a total length drilled of 20,181 m. Most of the drilling occurs over an area measuring approximately 4,500 m (N-S) by 2,000 m (E-W). There are 10 holes in the database that test for north and west extensions of the mineralized zone and probably have very little, if any, influence on the grades in the resource model.
The drill holes are spaced on 400-meter intervals along (N-S) sections and from 100- to 200-meter intervals along the (E-W) sections. Several drill holes have been completed on some of the intermediate (200 m) (N-S) sections. The majority of holes are vertical but approximately one third of the drill holes are inclined ranging from 82 to 50 degrees from horizontal.
There are a total of 10,919 samples in the database that have been analyzed for total copper (TCu%). The primary sample length is 2 m with sample intervals ranging from 0.1 to 12.55 m in length; although in the early stages of the project, sample interval was taken on 1 m intervals.
Los Azules Preliminary Assessment Technical Report
SE Project No. 8019-01
125
Any interval that is greater than 0.20% TCu is run through the sequence of copper analyses, which consists of acid soluble copper (“ASCu”), cyanide soluble copper and residual copper. A total of 35 drill holes have some portion of the sample intervals analyzed for sequential copper analysis. The cyanide soluble assays provide information in identifying the base of the supergene horizon. The ASCu and CSCu assay values have not been validated with a QA/QC program, however, these values have been estimated in the block model for informational purposes.
The assay database also contains assay values for gold, silver, arsenic, molybdenum, lead and zinc. Although these elements have not been verified with certified standards, the grades tend to be relatively low. The grades of these additional elements have not been estimated in the block model and are intended to provide additional information for internal use by MAI.
Copper assay values recorded in the database at less than the detection limit for total copper (i.e. <0.01) have been assigned at one half the detection limit value.
Drill hole recoveries are locally poor due to the blocky ground conditions that than are common in the area. The average core recovery for the sample intervals in the SS and PR domains is 78 percent with 77 percent of the intervals having recoveries exceeding 60 percent. There is no correlation between copper grade and recovery. There have been no adjustments or exclusions of data in relation to recoveries prior to block grade estimations.
The geologic information is derived primarily through observations during logging and includes lithology and mineral zone type.
19.4
Compositing
Compositing of drill hole samples was carried out in order to standardize the database for further statistical evaluation. Although the majority of sample intervals are on 2 m, this step eliminates any effect related to the sample length that may exist in the data.
In order to retain the original characteristics of the underlying data, a composite length of 2 m was selected which reflects the average original sample length. The generation of longer composites results in some degree of smoothing which could mask certain features of the data. The majority of the samples have been taken at 2 m intervals; although in the early stages of the project, sample interval was taken on 1 m intervals. A 2 m composite sample length was selected for statistical evaluation and for use in grade estimations in the block model.
Drill hole composites are length-weighted and have been generated “down-the-hole” meaning that composites begin at the top of each hole and are generated at 2 m intervals down the length of the hole. The contacts of the Minzone domains were honored during compositing of drill holes. Several holes were randomly selected and the composited values were checked for accuracy. No errors were found.
Los Azules Preliminary Assessment Technical Report
SE Project No. 8019-01
126
19.5
Statistical Data Analysis
Data analysis involves the statistical evaluation of assay values in order to quantify the characteristics of the assay data.
One of the main purposes of this exercise is to determine if there is evidence of spatial distinctions in grade, which may require the separation and isolation of domains during interpolation. The application of separate domains prevents unwanted mixing of data during grade interpolation producing a grade model that better reflects the unique properties of the deposit. However, applying domain boundaries in areas where the data is not statistically unique may impose a bias in the distribution of grades in the model.
A domain boundary, which segregates the data during interpolation, is typically applied if the average grade in one domain is significantly different from that of another domain. A boundary may also be applied where evidence exists that suggests a significant change in the grade distribution across the contact.
19.5.1
Basic Statistics by Domain
Basic statistics for the distribution of copper have been generated by rock type and by mineral zone (Minzone) type. The results are presented in a series of boxplots in Figure 19.2 and Figure 19.3.
The distributions by rock type show similar properties in the three main domains: diorite (“DIOR”), feldspar porphyry (“PF”) and breccia (“BX”). The remaining rock types, which contain a statistically insignificant number of samples, tend to be much lower in grade. Copper distribution by Minzone-type indicates that the supergene zone is higher grade than the primary zone. The leach zone contains very little copper.
19.5.2
Contact Profiles
The nature of grade trends between two domains is evaluated using the contact profile which graphically displays the average grades at increasing distances from the contact boundary. Contact profiles which show a marked difference in grade across a domain boundary, are an indication that the two data sets should be isolated during interpolation. Conversely, if there is a more gradual change in grade across a contact, the introduction of a “hard” boundary (i.e. segregation during interpolation) may result in much different trends in the grade model. In this case the change in grade between domains in the model is often more abrupt than the trends seen in the raw data. A flat contact profile indicates no grade changes across the boundary. In the case of a flat profile, “hard” or “soft” domain boundaries will produce similar results in the model.
Contact profiles were generated to evaluate the change in copper grade across the main rock and Minzone domain boundaries. Figure 19.4 shows no significant change in grade across the contact between the two main rock types: DIOR and PF. Figure 19.5 shows a gradational change in grade between the supergene and primary Minzone domains, which suggests that a “hard” boundary should not be used during block grade interpolation.
Los Azules Preliminary Assessment Technical Report
SE Project No. 8019-01
127
19.5.3
Conclusions and Modeling Implications
Results of the statistical analysis indicate that there are no distinct properties in the distribution of copper based on the rock types. There is a significant difference between the leach zone and the underlying supergene and primary domains, which indicates that this domain should be segregated during modeling.
Although the overall grades differ between the supergene and primary zones, the change in grade between these domains is more transitional indicating that they should not be separated during block grade interpolation.
The interpolation domains are summarized in Table 19.2
| | |
Table 19.2
Mineral Zone Domains and Coding |
Domain | DOMN Code # | Comments |
Overburden | 1 | Surface soil and gravels. No grade estimates conducted. |
Leach | 2 | Leached zone. |
Supergene & Primary | 3 | Supergene and Primary zones. |

Figure 19.2 - Boxplot Cu by Rock
Los Azules Preliminary Assessment Technical Report
SE Project No. 8019-01
128
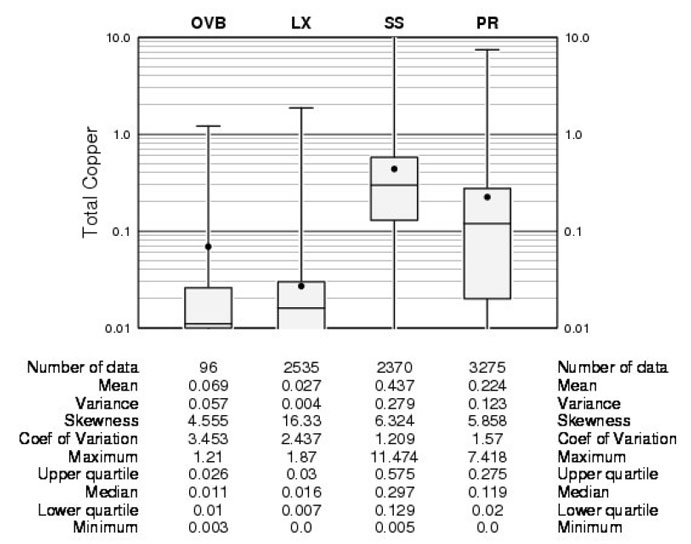
Figure 19.3 - Boxplot Cu by Mineral Zone
Los Azules Preliminary Assessment Technical Report
SE Project No. 8019-01
129
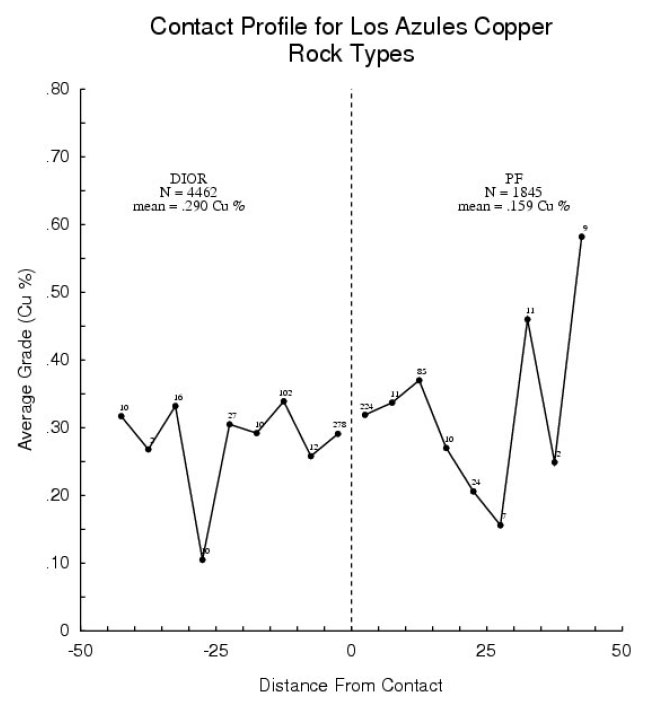
Figure 19.4 - Contact Profile for Rock Types
Los Azules Preliminary Assessment Technical Report
SE Project No. 8019-01
130
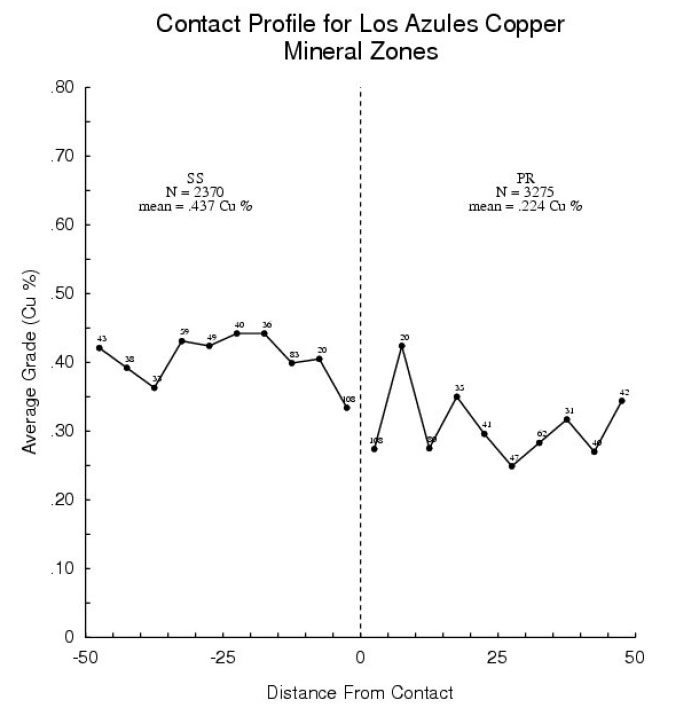
Figure 19.5 - Contact Profile for Mineral Zones
19.5.4
Secondary Elements
The statistical properties of the minor or secondary elements (gold, silver, arsenic and molybdenum) were reviewed by rock type and Minzone domain. No distinct trends were identified.
Los Azules Preliminary Assessment Technical Report
SE Project No. 8019-01
131
19.6
Bulk Density Data
Measurements for bulk density have been conducted by MAI personnel on a series of samples of drill core using the water displacement method. Solid pieces of drill core, measuring 10-15 cm in length, were weighed in air and again while submerged in water. The drill core was not sealed in paraffin as very little vuggy rock was encountered in the drilling. The bulk density is calculated using the following formula:
Bulk density = weight in air / (weight in air – weight in water)
A total of 95 samples have been tested for density with values ranging from 2.22 to 2.74 tonnes/m3, with a mean of 2.45 tonnes/m3. Average densities have been reviewed by rock type and mineral zone type and, based on the currently and somewhat limited data, the primary Minzone is slightly heavier than the supergene and oxide Minzones. An average bulk density value of 2.45 tonnes/m3 has been used to calculate resource tonnages. More extensive density testing is recommended.
19.7
Evaluation of Outlier Grades
Histograms and probability plots of the distribution of copper in the supergene and primary domains were reviewed in order to identify the existence of anomalous outlier grades in the composite database. In addition, a decile analysis of the data was also conducted in order to quantify the distribution of contained copper metal with respect to the sample density.
The analysis showed that composites above 2.5% Cu were potentially anomalous. Review of the physical location of these samples show that the majority occurs within one area in the northern part of the deposit. It was determined that high-grade intervals would be cut to a grade of 4% Cu and an “outlier limitation” would be used during block grade interpolation. Outlier samples above 2.5% Cu were limited to a maximum influence distance of 40 m during block grade interpolation. These steps have produced a 3% reduction in estimated contained copper metal in the deposit.
Similar evaluation of ASCu, CSCu and the secondary elements was conducted and appropriate measures taken to control potentially anomalous grades during grade interpolation.
19.8
Variography
The semi-variogram is a common function used to measure the spatial variability within a deposit. The degree of spatial variability in a mineral deposit depends on both the distance and direction between points of comparison. Typically, the variability between samples increases as the distance between samples increases. If the degree of variability is related to the direction of comparison, then the deposit is said to exhibit anisotropic tendencies, which can be emulated with a search ellipse.
The components of the variogram include the nugget, sill and range. Often times, samples compared over very short distances (even samples compared from the same location) show some degree of variability. As a result, the curve of the variogram begins at some point on the y-axis above the origin, which is referred to as the “nugget”.
Los Azules Preliminary Assessment Technical Report
SE Project No. 8019-01
132
The nugget is a measure of not only the natural variability of the data over very short distances but also a measure of the variability that can be introduced due to errors during sample collection, preparation and assaying.
The amount of variability between samples typically increases as the distance between the samples becomes greater. Eventually, the degree of variability between samples reaches a constant, maximum value. This is called the “sill” and the distance between samples where this occurs is referred to as the “range”.
The spatial evaluation of the data in this report has been conducted using a correlogram rather than the traditional variogram. The correlogram is normalized to the variance of the data and is less sensitive to outlier values, generally giving better results.
Variograms were generated using the commercial software package Sage 2001© developed by Isaacs & Co. Multidirectional variograms were generated for composited copper samples located within the combined supergene and primary domains. The results are summarized in Table 19.3.
| | | | | | | | | |
Table 19.3
Variogram Parameters for Copper |
Zone | Nugget | S1 | S2 | 1st Structure | 2nd Structure |
Range (m) | AZ | Dip | Range (m) | AZ | Dip |
Supergene & Primary | 0.150 | 0.460 | 0.390 | 321 | 130 | 22 | 2,924 | 340 | -12 |
Spherical | 192 | 9 | 51 | 638 | 56 | 51 |
24 | 233 | 30 | 547 | 79 | -36 |
Note: Correlograms conducted on 2 m drill hole composite data. |
19.9
Three-Dimensional Model
A block model was developed using MineSight® software with the dimensions defined in Table 19.4. The selection of a nominal block size measuring 20 x 20 m in plan and 15 m in height is considered appropriate with respect to the current drill hole spacing as well as the selective mining unit (“SMU”) size typical of an operation of this type and scale.
| | | | |
Table 19.4
Block Model Limits |
Direction | Minimum | Maximum | Block Size (m) | # Blocks |
East | 2,381,100 | 2,385,500 | 20 | 220 |
North | 6,556,480 | 6,562,300 | 20 | 291 |
Elevation | 3,010 | 4,390 | 15 | 92 |
Blocks in the model have been coded on a majority basis with the Minzone domains. During this stage, blocks along a domain boundary are coded if greater than 50 percent of the block occurs within the boundaries of that domain.
Los Azules Preliminary Assessment Technical Report
SE Project No. 8019-01
133
The proportion of blocks that occur below the bedrock and topographic surfaces are also calculated and stored within the model as individual percentages. These values are utilized as a weighting factor in determining the resource tonnages for the deposit.
19.10
Probability Shell
In the absence of a domain boundary or drill holes which sufficiently limit the lateral extent of the mineralization in the deposit, a probability shell has been generated representing the area where copper mineralization is likely to occur. Figure 19.6 shows a cumulative log-probability plot of the composited copper data within the combined SS and PR domains. The inflection at a grade of 0.1% TCu occurs at the 35th percentile of the distribution and indicates a reasonable point to divide the distribution into less well mineralized and more strongly mineralized portions. Indicator values were assigned at this grade threshold (a value of “1” assigned to composites >0.1% TCu and “0” to intervals <0.1% TCu) and an indicator variogram was generated from the indicator values. Ordinary kriging was used to estimate probability values in blocks. The results were compared to the original TCu grades in drilling and it was decided that a 50 percent pro bability threshold formed a reasonable division of the data. In other words, there is greater than a 50 percent chance that blocks within the shell will exceed 0.1% TCu.
The original probability shell was used as a guide in producing a series of simplified limits on plans spaced at 50 m intervals. These were linked to form a solid 3-dimensional domain which has been clipped at the contact between the LX and SS+PR domains. The resulting probability shell domain is shown in Figure 19.7.
Composited drill hole samples and blocks in the model have been assigned unique code values representing whether the sample or block is inside or outside of the probability shell. These are then matched during block grade interpolation.
19.11
Interpolation Parameters
The block model grades for copper have been estimated using Ordinary Kriging (“OK”). The results of the OK estimation were compared with the Hermitian (Herco) polynomial change of support model (also referred to as the Discrete Gaussian correction). This method is described in more detail in Section 19.12.2.
The Los Azules OK model has been generated with a relatively limited number of samples in order to match the change in support or Herco grade distribution. This approach reduces the amount of smoothing (averaging) in the model and, while there may be some uncertainty on a localized scale, this approach produces reliable estimates of the recoverable grade and tonnage for the overall deposit.
All grade estimations use length-weighted composite drill hole data. The data is not mixed across the probability shell boundary and the variogram parameters listed in Table 19.3 are used both inside and outside of the probability shell. The interpolation parameters are summarized by domain in Table 19.5.
Los Azules Preliminary Assessment Technical Report
SE Project No. 8019-01
134
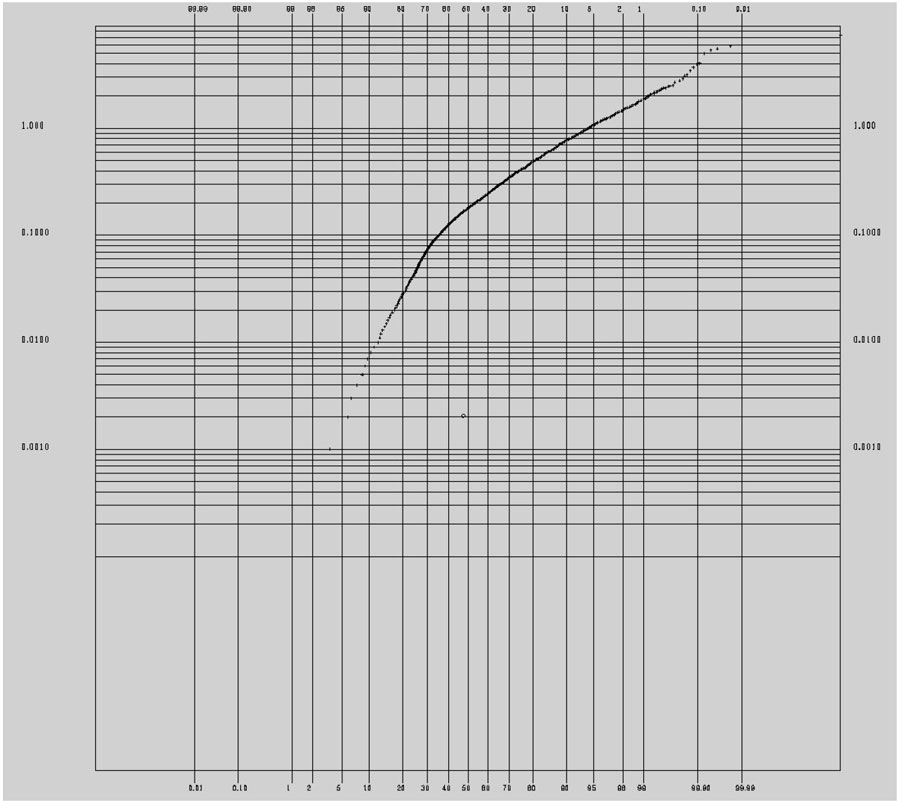
Figure 19.6 - Probability Plot TCu% in SS and PR Zone
Los Azules Preliminary Assessment Technical Report
SE Project No. 8019-01
135
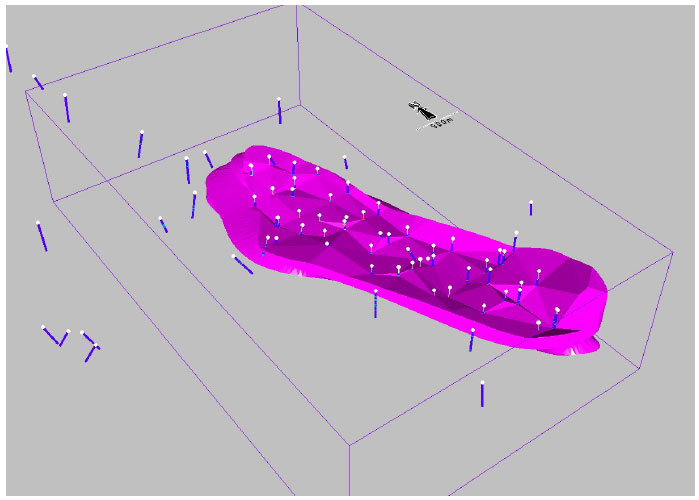
Figure 19.7 - Isometric View Of Probability Shell in SS + PR Zone
| | | | | | | |
Table 19.5
Interpolation Parameters for Copper |
Interpolation Domain | Search Ellipse Range (m) | # Composites | Other |
X | Y | Z | Min/Block | Max/Block | Max/hole |
In/out >0.1% TCu probability shell in SS+PR zones | 1,000 | 1,000 | 100 | 7 | 21 | 7 | 1 DH per quadrant |
The grade of all secondary elements has been estimated using the inverse distance weighting (“ID”) estimation method. Estimates for gold, silver, arsenic and molybdenum are conducted in the combined LX+SS+PR domains. Estimates for ASCu have been conducted in the combined SS+PR domains. Estimates for CSCu use hard boundary rules between the SS and PR domains during interpolation.
Los Azules Preliminary Assessment Technical Report
SE Project No. 8019-01
136
19.12
Validation
The results of the modeling process were validated through several methods. These consist of a thorough visual review of the model grades in relation to the underlying drill hole sample grades, comparisons with the change of support model, comparisons with other estimation methods and grade distribution comparisons using swath plots.
19.12.1
Visual Inspection
Detailed visual inspection of the block model has been conducted in both section and plan to ensure the desired results following interpolation. This includes confirmation of the proper coding of blocks within the respective domains and below the topographic surface. The distribution of block grades were also compared relative to the drill hole samples in order to ensure the proper representation in the model.
19.12.2
Model Checks for Change of Support
The relative degree of smoothing in the block model estimates were evaluated using the Discrete Gaussian or Hermitian Polynomial Change of Support method (described by Journel and Huijbregts, Mining Geostatistics, 1978). Using this method, the distribution of the hypothetical block grades can be directly compared to the estimated (OK) model through the use of pseudo-grade/tonnage curves. Adjustments are made to the block model interpolation parameters until an acceptable match is made with the Herco distribution. In general, the estimated model should be slightly higher in tonnage and slightly lower in grade when compared to the Herco distribution at the projected cutoff grade. These differences account for selectivity and other potential mineralized material-handling issues which commonly occur during mining.
The Herco (Hermitian correction) distribution is derived from the declustered composite grades which have been adjusted to account for the change in support as one goes from smaller drill hole composite samples to the large blocks in the model. The transformation results in a less skewed distribution but with the same mean as the original declustered samples.
The distribution for the OK and ID models, shown in Figure 19.8, show a desired degree of correlation with the Herco results.
Los Azules Preliminary Assessment Technical Report
SE Project No. 8019-01
137
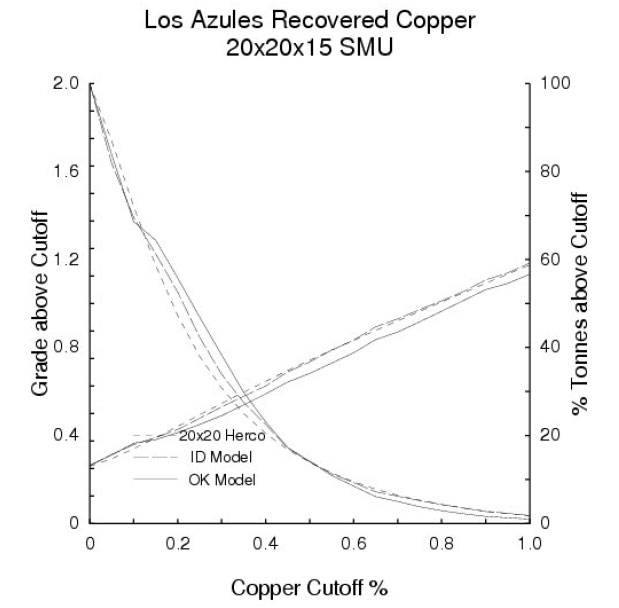
Figure 19.8 - Recovered Copper (20x20x15 SMU)
19.12.3
Comparison of Interpolation Methods
For comparison purposes, additional copper models were generated using both the inverse distance weighted (“ID”) and nearest neighbor (“NN”) interpolation methods. (Note: the NN model was estimated using data composited to 15 m intervals). The results of these models are compared to the OK models at a series of cutoff grades in the grade-tonnage graph shown in Figure 19.9. Note that this comparison is limited to blocks located within the plus 0.1% Cu probability shell. In general, there is a reasonable correlation between these models. Reproduction of the grade model using different methods tends to increase the confidence in the overall resource.
Los Azules Preliminary Assessment Technical Report
SE Project No. 8019-01
138
19.12.4
Swath Plots (Drift Analysis)
A swath plot is a graphical display of the grade distribution derived from a series of bands, or swaths, generated in several directions through the deposit. Grade variations from the OK model are compared using the swath plot to the distribution derived from the declustered NN grade model.
On a local scale, the NN model does not provide reliable estimations of grade, however, on a much large scale, it represents an unbiased estimation of the grade distribution based on the underlying data. Therefore, if the OK model is unbiased, the grade trends may show local fluctuations on a swath plot but the overall trend should be similar to the NN distribution of grade.
Swath plots have been generated in three orthogonal directions for distribution of copper in the Los Azules deposit. Examples in the (E-W), (N-S) and vertical directions are shown in Figure 19.10 through Figure 19.12.
The results of the ID model have been included in the Swath plots for comparison purposes. There is reasonable correspondence between the models in each of these areas. The degree of smoothing in the OK model is evident in the peaks and valleys shown in the swath plots. Deviations tend to occur for two reasons: First, reduced tonnages near the edges of the deposit tend to accentuate the differences in grade between models; Second, differences in grade become more apparent in the lower-grade areas. These low-grade areas typically occur near the flanks of the deposit where the drilling density is less.
19.13
Resource Classification
The mineral resources at the Los Azules deposit have been classified in accordance with the CIM definition standards for mineral resources and mineral reserves (CIM, 2005). At this stage of the project, the relative number and density of drill holes does not support the classification of resources in the measured or indicated categories. The classification parameters for inferred resources are defined in relation to the distance to sample data and are intended to encompass zones of reasonably continuous mineralization.
Inferred Mineral Resources are blocks in the supergene and primary domains which are a maximum distance of 200 m from a drill hole.
The distance limit for Inferred resources was tested using an indicator variogram generated at a grade threshold of 0.35% TCu, which is intended to represent the potential cutoff grade of a deposit of this type, size and location. The ranges in this indicator variogram all exceed a distance of 200 m. The distribution of blocks which meet the criteria defined for Inferred mineral resources are shown in Figure 19.13 and Figure 19.14.
Los Azules Preliminary Assessment Technical Report
SE Project No. 8019-01
139

Figure 19.9 - Comparison of OK, ID, NN Models

Figure 19.10 - East-West Swath
Los Azules Preliminary Assessment Technical Report
SE Project No. 8019-01
140
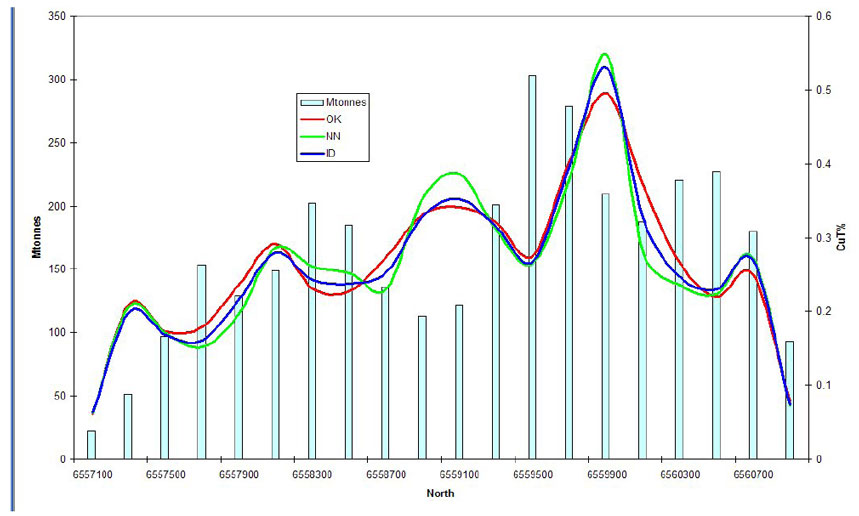
Figure 19.11 - North-South Swath
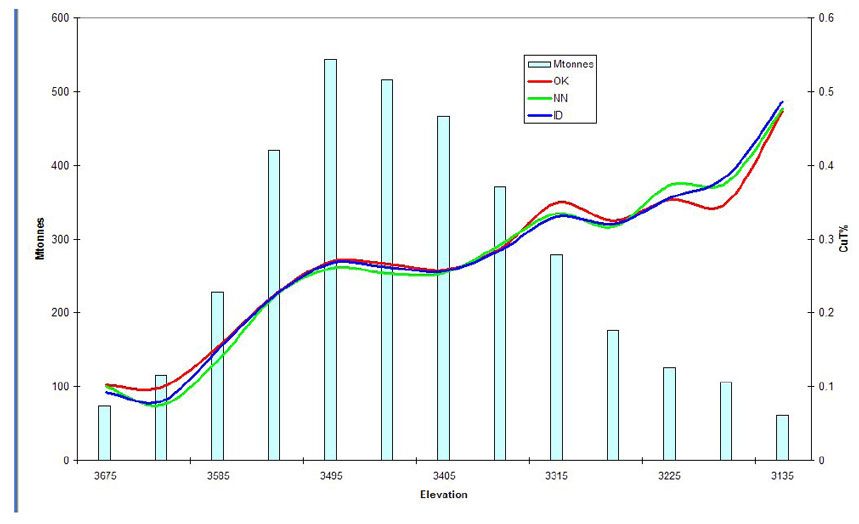
Figure 19.12 - Vertical Swath
Los Azules Preliminary Assessment Technical Report
SE Project No. 8019-01
141
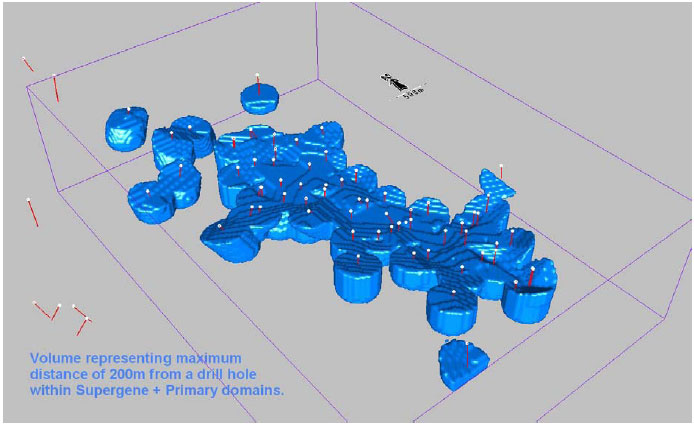
Figure 19.13 - Volume Classified as Inferred Resources within SS + PR Domains
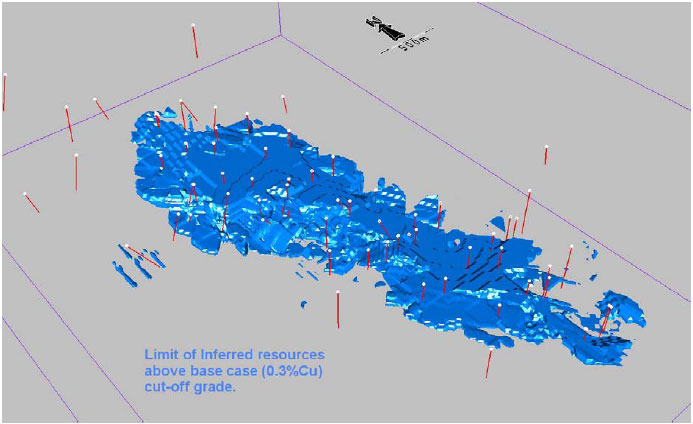
Figure 19.14 - Inferred Resources Above 0.3% Cu Cutoff Grade
Los Azules Preliminary Assessment Technical Report
SE Project No. 8019-01
142
19.14
Mineral Resources
The Los Azules mineral resources are summarized in Table 19.6 at a series of copper cutoff grades for comparison purposes. In order to comply with CIM definitions regarding selection of a “base case”, a base case was selected at a cutoff grade of 0.35% copper, which is consistent with other operations exhibiting similar characteristics, potential scale of operation and location.
Although the CIM definitions state that the mineral resource must show reasonable prospects for economic viability, the definitions further state that due to the uncertainty of Inferred mineral resources, confidence in the estimate is insufficient to allow meaningful application of technical and economic parameters at this time.
| | |
Table 19.6
Inferred Mineral Resources |
Cutoff Grade (TCu%) | Million Tonnes | TCu% |
0.30 | 1,171 | 0.50 |
0.35 | 922 | 0.55 |
0.40 | 727 | 0.60 |
0.50 | 451 | 0.69 |
0.60 | 273 | 0.78 |
0.70 | 161 | 0.87 |
0.80 | 93 | 0.97 |
Note: Mineral Resources that are not mineral reserves do not have demonstrated economic viability. |
There are no known factors related to environmental, permitting, legal, title, taxation, socioeconomic, marketing or political issues which could materially affect the mineral resource.
19.15
Pit Limit Analysis
For purposes of a preliminary assessment (“PA”) of the Los Azules project, Floating Cone (“FC”) evaluations of potentially economic pit limits were conducted using the deposit model and mineral resources described earlier in this section. Table 19.7 summarizes the base case economic and recovery parameters used in these evaluations. All prices and costs are in third quarter 2008 U.S. dollars.
Los Azules Preliminary Assessment Technical Report
SE Project No. 8019-01
143
| |
Table 19.7
Base Case Economic Parameters |
Metal Price | $1.50 / lb Cu |
Concentrator Cu Recovery | 89.0% |
Cu Payable (Smelting Terms) | 96.5% |
Freight, Smelting & Refining Costs | $0.35 / lb Cu |
Mineralized Material Mining Cost | $1.00 / t |
Waste Mining Cost | $1.25 / t |
Mineralized Material Processing Cost | $4.39 / t Mineralized Material |
General & Administration Cost | $0.65 / t Mineralized Material |
In the FC study, only copper was used to generate revenues. While some gold, silver and molybdenum is present in the deposit, no by-product credits for other metals were considered in the pit limit analyses. Furthermore, oxide mineralization was treated as waste rock at this time; only primary and secondary sulfide mineral resources were considered as potential ore.
Two basic geologic zones were differentiated for geotechnical purposes in the FC evaluations and open pit design: alluvium/overburden and unweathered rock. Alluvium in the model consists of gravels and talus. Underlying rock zones are generally well fractured. Significant groundwater is present in many areas, adversely affecting pit slope angles. Overall slope angles in the FC study were 28° in the alluvium/overburden zones and 37° in rock. These angles include provisions for internal ramps.
The results of the FC pit limit analyses are presented in Table 19.8. A total of nine runs were conducted to test sensitivities to a range of prices and to determine the best open pit development sequence. All of the mineral resources presented in Table 19.8 are classified as inferred and should not be considered to be mineral reserves as defined in Canadian NI 43-101. Tonnages are based on an in-situ density of 2.45 t/m3. The base case, at $1.50/lb Cu, is highlighted in bold typeface.
Los Azules Preliminary Assessment Technical Report
SE Project No. 8019-01
144
| | | | | | |
Table 19.8
Floating Cone Results |
Cu Price US$ / lb | Cutoff % Cu | Mineral Resources* | Waste (Million t) | Total (Million t) | Strip Ratio |
( Million t) | % Cu |
2.00 | 0.15 | 1,273 | 0.43 | 1,655 | 2,928 | 1.30 |
1.75 | 0.18 | 1,059 | 0.47 | 1,436 | 2,495 | 1.36 |
1.50 | 0.22 | 799 | 0.52 | 1,202 | 2,001 | 1.50 |
1.40 | 0.24 | 692 | 0.55 | 1,082 | 1,774 | 1.56 |
1.25 | 0.28 | 354 | 0.63 | 526 | 880 | 1.49 |
1.15 | 0.32 | 293 | 0.66 | 449 | 742 | 1.53 |
1.00 | 0.39 | 166 | 0.73 | 273 | 439 | 1.65 |
0.95 | 0.42 | 88 | 0.79 | 162 | 250 | 1.85 |
0.90 | 0.46 | 0 | 0.00 | 0 | 0 | N/A |
At a copper price of $0.90 / lb, no floating cone pit shell is generated using the base case costs and recoveries. This is due to a thick alluvial cover over a high grade zone in the northern portions of the deposit. At a $1.50 / lb Cu price, potentially economic mineral resources total about 800 million tonnes grading 0.52% Cu. None of the mineral resources presented in Table 19.8 are classified as measured or indicated because of the early stage of exploration of this deposit; everything listed above is inferred. Inferred mineral resources are considered too speculative geologically to have the economic considerations applied to them that would enable them to be categorized as mineral reserves. There is no certainty that this preliminary assessment will be realized.
There may be some potential to increase pit slope angles in future evaluations of the project. To quantify potential benefits, an additional floating cone evaluation was conducted using 4° steeper slopes for all rock zones – increasing to 32° in alluvium/overburden and 41° overall in unweathered rock. The analysis used the base case recoveries, costs and copper price of $1.50/lb. The resulting floating cone pit shell contains about 905 million tonnes of inferred mineral resources grading 0.51% Cu above an internal cutoff of 0.22% Cu, with a stripping ratio of 1.23:1 (tonnes waste per tonne of ore). The pit shape is similar to the base case shell, but the pit crests do not extend as far and the pit toes recover more ore-grade mineral resources. The difference in stripping ratios, 1.23 versus 1.50 for the base case, suggests a potential 18% reduction in waste stripping and an 11% reduction in total material move ment for a given quantity of ore. While further optimization potential exists for future studies, all of the mine plans in the remainder of this report are based on the flatter, more conservative slope angles.
Los Azules Preliminary Assessment Technical Report
SE Project No. 8019-01
145
19.16
Pit Design
A preliminary Los Azules ultimate pit was designed using the base case FC shell generated at a copper price of $1.50 / lb. In addition to the economic parameters listed in Table 19.7 that define potentially economic mineral resources, the geotechnical and operational parameters listed in Table 19.9 were incorporated into the design of the preliminary ultimate pit and internal mining phases to reflect the use of large-scale, open pit mining equipment.
| |
Table 19.9
Open Pit Design Parameters |
Parameter | Value |
Interramp Slope Angles: | |
Alluvium / Overburden | 28° |
Rock | 40° |
Bench Height | 15 m |
Vertical Interval Between Catch Benches | 15 m |
Catch Bench Widths: | |
Alluvium / Overburden | 21.2 m |
Rock | 10.9 m |
Ramp Width | 40 m |
Maximum Ramp Gradient | 10% |
In addition to the ultimate pit, five internal mining phases, or pushbacks, were also designed for purposes of estimating preproduction stripping requirements and developing a mine production schedule for the preliminary assessment. Generally, minimum pushback widths are over 90-100 m, but there were a several areas where pushback widths are only 75-80 m – still adequate for 38 m3 electric shovels and 228-t off-highway haulage trucks.
The mining phases and ultimate pit layouts are illustrated in Figure 26.1 through Figure 26.6. In each of the phase/pit designs, there are two exit points: a northwest exit for mineralized material haulage to the primary crusher and waste rock haulage to the proposed tailings dam and waste rock storage facilities (located to the northwest and west of the open pit, respectively). A southern pit exit was also provided for a southern crusher and concentrator option.
19.17
Mineral Resources Within Designed Pit/Phases
Inferred mineral resources contained within each of the mining phases were based on an internal cutoff grade of 0.22% Cu (derived from the base case parameters listed in Table 19.7). No dilution has been included in the estimates of mineral resources beyond that incorporated into the block model grades. Tonnages were based on an in-situ material density of 2.45 t/m3. An extraction rate of 100% was applied to the model tonnage estimates. Table 19.10 summarizes the estimated tonnage and grade of contained inferred mineral resources by mining phase.
Los Azules Preliminary Assessment Technical Report
SE Project No. 8019-01
146
| | | | | | | | |
Table 19.10
Inferred Mineral Resources Contained Within Designed Pit / Phases |
Phase | Mineral Resources* (>= 0.22% Cu Cutoff) | Waste (Million t) | Total (Million t) | Strip Ratio |
(Million t) | Cu (%) | Mo (%) | Au (g/t) | Ag (g/t) |
1 | 59 | 0.83 | 0.003 | 0.08 | 2.13 | 148 | 207 | 2.52 |
2 | 100 | 0.60 | 0.004 | 0.05 | 1.66 | 124 | 224 | 1.24 |
3 | 125 | 0.55 | 0.004 | 0.06 | 1.85 | 141 | 266 | 1.13 |
4 | 257 | 0.45 | 0.003 | 0.05 | 1.36 | 324 | 582 | 1.26 |
5 | 150 | 0.51 | 0.002 | 0.05 | 1.95 | 300 | 450 | 1.99 |
6 | 152 | 0.42 | 0.002 | 0.04 | 1.65 | 236 | 387 | 1.55 |
Total | 843 | 0.51 | 0.003 | 0.05 | 1.68 | 1,273 | 2,116 | 1.51 |
Mineral resources that are not mineral reserves do not have demonstrated economic viability. |
The designed Los Azules ultimate pit is nearly six percent larger than the base case floating cone pit shell, which is within acceptable limits. This slight expansion is due to pit wall smoothing and the inclusion of haulage ramps within the pit design.
The ultimate pit contains approximately 843 million tonnes of potentially economic inferred mineral resources (above a 0.22% Cu internal cutoff) grading 0.51% Cu and has an estimated stripping ratio of about 1.5:1 (tonnes waste per tonne of mineralized material). Contained metal is estimated at 9.5 billion pounds of copper, 56 million pounds of molybdenum (molybdenum recovery is not being considered at the time of this report), 1.5 million troy ounces of gold and 46 million troy ounces of silver. Of the 843 million tonnes of inferred mineral resources, about 402 million tonnes are secondary sulfides grading 0.55% Cu and 441 million tonnes are primary sulfides grading 0.48% Cu.
All of the mineral resource estimates contained within the designed mining phases presented in Table 19.10 are sensitive to metal prices, metallurgical recoveries and project operating costs and may materially change with different metallurgical and economic parameters. Potential variations in such mineral resource estimates are indicated by the price sensitivities presented in Table 19.8. Other than the sensitivities described above, there are presently no known environmental, permitting, legal, title, taxation, socio-economic, marketing, political or other relevant issues that may materially affect the mineral resource estimates presented in this report.
The Los Azules project is in the early stages of exploration; consequently, this Technical Report is at a scoping level of accuracy and includes inferred mineral resources in the estimation of the mine production schedule (see Section 20.1). This Technical Report is a preliminary assessment within the meaning of NI 43-101 and is preliminary in nature. It includes inferred mineral resources that are considered too speculative geologically to have the economic considerations applied to them that would enable them to be categorized as mineral reserves, and there is no certainty that the preliminary assessment will be realized.
Los Azules Preliminary Assessment Technical Report
SE Project No. 8019-01
147
20.0
Other Relevant Data and Information
Los Azules Preliminary Assessment Technical Report
SE Project No. 8019-01
148
20.1
Mining Operations
20.1.1
Mine Production Schedule
A preliminary mine production schedule for the Los Azules project was developed from the estimates of inferred mineral resources contained within each mining phase described in Sections 19.16 and 19.17. A proprietary scheduling program was used to simulate open pit mining for a mineralized material processing rate of 100,000 tpd. Table 20.1 summarizes the parameters used to generate the mine production schedule and, subsequently, to estimate mine equipment and manpower requirements.
| |
Table 20.1
Mine Production Scheduling Parameters |
Parameter | Value |
Annual Mineralized Material Production Rate | 36.0 million tonnes |
Daily Milling Rate | 100,000 tonnes per day |
Mine Operating Hours per Shift | 12 |
Mine Operating Shifts per Day | 2 |
Mine Operating Days per Week | 7 |
Scheduled Mine Operating Days per Year | 360 |
Typical Number of Mine Crews | 4 |
An allowance of five days per annum was made for weather delays and/or shutdowns for holidays. Otherwise, pit operations would be scheduled around the clock. Mineralized material feed for the first year of concentrator operations was limited to 29.55 million tonnes to account for a gradual ramp-up of milling rates during the first seven months after startup.
Only primary and secondary sulfide mineral resources above a 0.22% Cu cutoff were considered as mineralized material for purposes of developing the mine production schedule for the preliminary assessment. Advanced stripping needed to maintain adequate mineralized material exposure was estimated for the above milling rates. The scheduling program sequenced the necessary material by bench, by phase, for each time period. Mining phases were processed in order, from the upper most benches downward. Concurrent phase mining was allowed for advanced stripping purposes, subject to the restriction that previous phases cannot be undercut by subsequent pushbacks. Table 20.2 summarizes the resulting mine production schedule for the Los Azules project preliminary assessment.
Figure 20.1 and Figure 20.2 show the relationship between the ROM Mineralized Material and Strip Ratio to the Mill Feed Copper Grade respectively.
Los Azules Preliminary Assessment Technical Report
SE Project No. 8019-01
149
|
|
| | | | | | | | |
Table 20.2
Mine Production Schedule Based on Inferred Mineral Resources |
Time Period | Mineral Resources* (>= 0.22% Cu Cutoff) | Waste (Million t) | Total (Million t) | Strip Ratio |
(Million t) | Cu (%) | Mo (%) | Au (g/t) | Ag (g/t) |
PP | 2.874 | 0.67 | 0.002 | 0.080 | 2.67 | 147.397 | 150.271 | 51.29 |
Y1* | 29.55 | 0.86 | 0.003 | 0.079 | 2.59 | 63.65 | 93.2 | 2.15 |
Y2 | 36.0 | 0.74 | 0.004 | 0.071 | 1.60 | 57.2 | 93.2 | 1.59 |
Y3 | 36.0 | 0.56 | 0.002 | 0.047 | 1.38 | 57.2 | 93.2 | 1.59 |
Y4 | 36.0 | 0.60 | 0.005 | 0.052 | 1.44 | 57.2 | 93.2 | 1.59 |
Y5 | 36.0 | 0.61 | 0.005 | 0.057 | 2.10 | 57.2 | 93.2 | 1.59 |
Y6 | 36.0 | 0.56 | 0.003 | 0.057 | 1.69 | 57.2 | 93.2 | 1.59 |
Y7 | 36.0 | 0.55 | 0.004 | 0.076 | 1.59 | 57.2 | 93.2 | 1.59 |
Y8 | 36.0 | 0.55 | 0.004 | 0.065 | 2.35 | 57.2 | 93.2 | 1.59 |
Y9 | 36.0 | 0.44 | 0.003 | 0.039 | 1.26 | 57.2 | 93.2 | 1.59 |
Y10 | 36.0 | 0.41 | 0.002 | 0.033 | 1.12 | 52.6 | 88.6 | 1.46 |
Y11 | 36.0 | 0.40 | 0.003 | 0.047 | 1.15 | 52.6 | 88.6 | 1.46 |
Y12 | 36.0 | 0.41 | 0.003 | 0.054 | 1.32 | 52.6 | 88.6 | 1.46 |
Y13 | 36.0 | 0.60 | 0.004 | 0.066 | 1.87 | 52.6 | 88.6 | 1.46 |
Y14 | 36.0 | 0.47 | 0.003 | 0.053 | 1.72 | 52.6 | 88.6 | 1.46 |
Y15 | 36.0 | 0.46 | 0.004 | 0.058 | 1.45 | 52.6 | 88.6 | 1.46 |
Y16 | 36.0 | 0.47 | 0.003 | 0.060 | 2.27 | 52.6 | 88.6 | 1.46 |
Y17 | 36.0 | 0.57 | 0.002 | 0.058 | 1.57 | 52.6 | 88.6 | 1.46 |
Y18 | 36.0 | 0.51 | 0.002 | 0.053 | 1.85 | 52.6 | 88.6 | 1.46 |
Y19 | 36.0 | 0.44 | 0.002 | 0.046 | 1.83 | 52.6 | 88.6 | 1.46 |
Y20 | 36.0 | 0.45 | 0.002 | 0.045 | 1.90 | 51.627 | 87.627 | 1.43 |
Y21 | 36.0 | 0.40 | 0.002 | 0.044 | 1.52 | 14.07 | 50.07 | 0.39 |
Y22 | 36.0 | 0.37 | 0.002 | 0.046 | 1.67 | 5.749 | 41.749 | 0.16 |
Y23 | 36.0 | 0.45 | 0.002 | 0.045 | 1.69 | 3.126 | 39.126 | 0.09 |
Y24 | 21.344 | 0.52 | 0.001 | 0.043 | 1.49 | 3.522 | 24.866 | 0.17 |
Total | 845.767 | 0.51 | 0.003 | 0.050 | 1.68 | 1,272.743 | 2,118.51 | 1.50 |
* Includes rehandling 2.874 million t of stockpiled ROM mineralized material during Year 1. Inferred mineral resources have a great amount of uncertainty as to their existence and as to whether they can be mined legally or economically. It cannot be assumed that all or any part of inferred mineral resources will ever be upgraded to a higher category. |
Los Azules Preliminary Assessment Technical Report
SE Project No. 8019-01
150
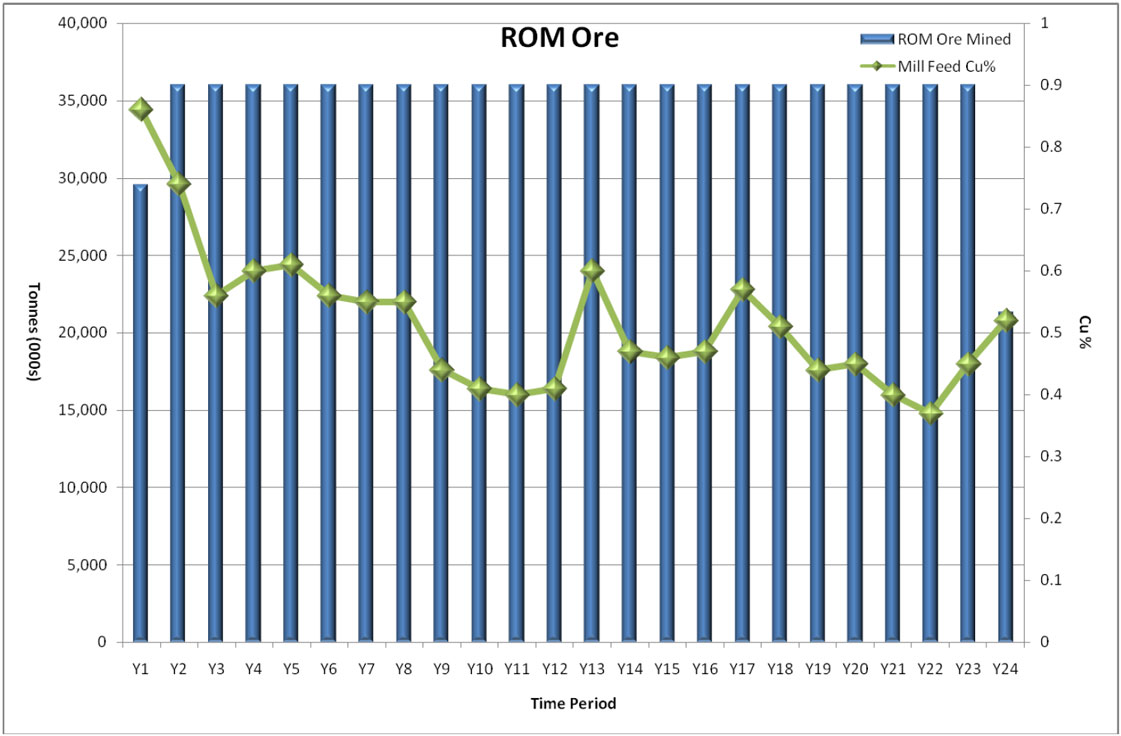
Figure 20.1 – ROM Mineralized Material Source and Mill Feed Copper Grade
Los Azules Preliminary Assessment Technical Report
SE Project No. 8019-01
151
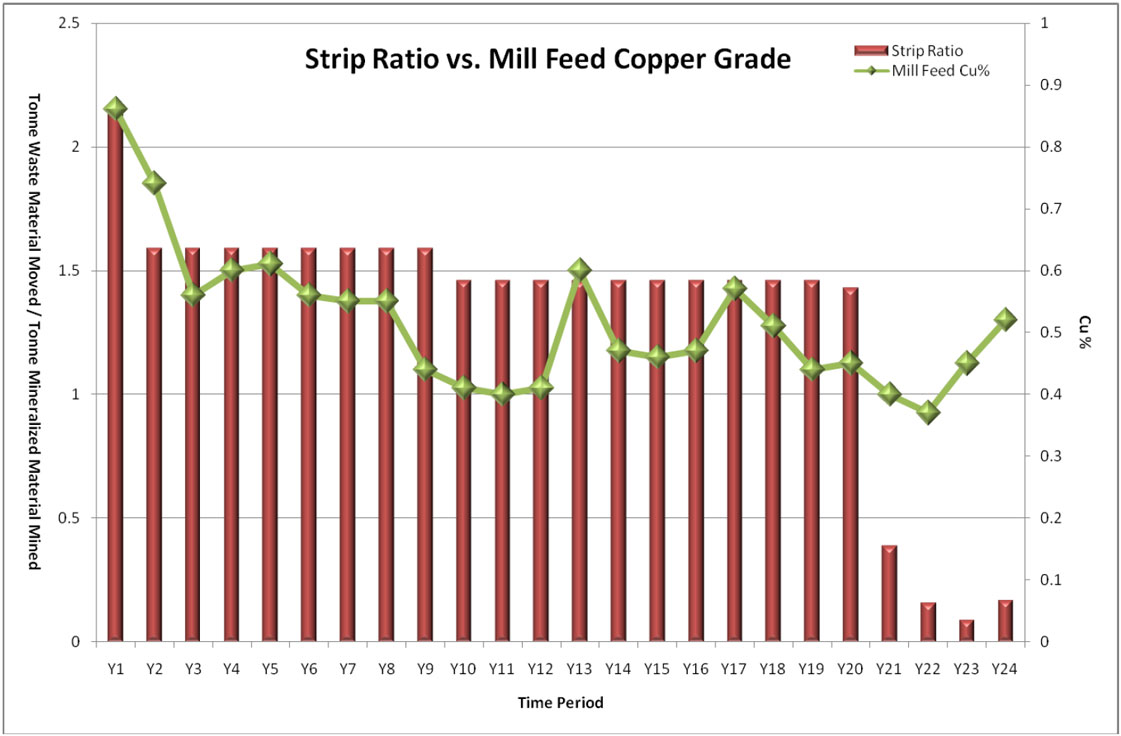
Figure 20.2 – Strip Ratio and Mill Feed Copper Grade
Los Azules Preliminary Assessment Technical Report
SE Project No. 8019-01
152
Mineralized material feed to the mills would total 842.894 million tonnes over the life of the mine, which is projected at 23.6 years. About 2.874 million tonnes of run-of-mine (“ROM”) mineralized material stockpiled during preproduction stripping would be reclaimed and hauled to the primary crusher during Year 1.
Peak material handling rates from Years 2-9 would average nearly 259,000 tpd, before settling back to about 246,000 tpd from Year 10 through late Year 20. Over 150 million tonnes of waste rock and mineralized material would be stripped during a two-year preproduction period to expose sufficient mineralized material for the concentrator startup.
20.1.2
Mine Equipment Selection and Fleet Requirements
For purposes of this preliminary assessment, open pit mining would be conducted from 15 m benches using large scale equipment, including: 351 mm diameter rotary blasthole drills (electric), 38 m3 cable shovels (electric), 25 m3 front-end loaders, 228-t off-highway haulage trucks, 635 and 435 kW crawler dozers, 335 kW rubber-tired dozers, 200 kW motor graders and 135,000 liter water trucks. A vibratory compactor will also be used for tailings dam construction and a 165 kW motor grader will be needed for road maintenance around the concentrator area and on other small vehicle roads. With the exception of the blasthole drills and shovels, all major mining equipment would be diesel powered.
The operating parameters presented in Table 20.1 and the production schedule listed in Table 20.2 were used to estimate mine equipment and manpower requirements. Essentially, the mine would be scheduled for continuous operations using four rotating crews, each working 12-hour shifts. Preproduction stripping operations would last approximately two years.
Mineralized material would be hauled to a primary crusher located about 200-240 m northwest of the ultimate pit rim. The crushed mineralized material would then be transported by a series of overland conveyors to a concentrator location about 2.7 km north-northwest of the open pit. This crusher placement is intended to minimize truck haulage distances for mineralized material and consequent costs.
Waste rock haulage would be directed to one of three sites: a tailings dam located about 2.5 km (straight line) west-northwest of the ultimate pit’s northwest exit, a waste rock disposal facility (“WRDF”) located immediately west of the pit and south of the tailings dam, and a backfill area in the northern portion of the ultimate pit (Phase 4) that will become available at the beginning of Year 17. The tailings dam and WRDF are the nearest available locations for significant storage of tailings and waste rock. Should the project proceed to the next level of study, condemnation drilling should be conducted in both the tailings and waste rock storage areas. Haulage profiles to the external waste rock storage sites (from in-pit loading points) would generally range between 4 and 6 km, which would decrease to about 3-5 km during backfilling in Years 17-24. About 360 million tonnes of waste rock would be used for construction of the tailings dam. The WRDF, as presently designed, has the capacity to store up to about 1.2 billion tonnes of combined waste rock and intermixed tailings. About 236 million tonnes would be placed into the backfill.
The tailings dam crest would reach an elevation of about 3,817 m and the WRDF would crest at 3,730 m. The ultimate pit’s northwest exit elevation would be about 3,580 m. The upper crest of the backfill would be at 3,550 m.
Los Azules Preliminary Assessment Technical Report
SE Project No. 8019-01
153
Equipment productivities were derived from an average in-situ bulk density of 2.45 t/m3. A 40% swell yields a loose density of 1.75 t/m3, which was used in unit productivity calculations for loading and hauling equipment.
Rotary blasthole drill productivities were estimated at nearly 42,000 tonnes per shift using a blasthole pattern of 11 m by 11 m, with 3 m of subgrade drilling, and a powder factor of 0.16 kg per tonne of rock. Drill penetration rates of 20 m per hour were assumed. A little over three operating drills will be required at any given time, with a fleet of five required to cover down time and scheduling losses. Two crawler-type percussion drills will also be needed for secondary breakage and road construction.
Four 60 t (38-m3) cable shovels would be needed for primary loading, three of which operating at any given time. Shovel productivity was estimated at about 44,000 tonnes per shift. A 25 m3 front-end loader would provide backup capability and would be used for bench toe cleanup work, berm maintenance, sump construction and other miscellaneous loading requirements.
Outbound mineralized material haulage profiles would range from 1.0 to over 4.6 km, while waste profiles vary between 2.7 and 7.7 km (typically around 4-6 km). Truck productivities average about 5,000 tonnes per shift over the life of the mine and generally decline through Year 15 due to increasing pit depth and longer waste hauls. With utilizations typically ranging between 72 and 77%, truck fleet requirements peak at 44 units during Years 13-15. An initial fleet of 20 trucks was estimated for the preproduction stripping period.
Auxiliary equipment for roads and WRDF maintenance, tailings dam construction and other support operations would include: two 635 kW crawler dozers, five 435 kW crawler dozers, one 30 t vibratory compactor, three 335 kW rubber-tired dozers, five 200 kW motor graders, one 165 kW motor grader and three 135,000 liter (146 t) off-highway water trucks. Table 20.3 summarizes the major mine equipment requirements for the Los Azules project.
20.1.3
Mine Personnel
A rotating, four-crew system would be used to staff mine operations and maintenance craft labor positions. These crews would work 12-hour shifts. Table 20.4 summarizes the mine personnel requirements, including supervision and technical staff. A seven percent allowance is included in the craft labor levels for vacation, sickness and absenteeism coverage. Three expatriates were assumed for senior management and technical positions over the long term. All remaining personnel would consist of Argentine or other South American workers. Peak manpower levels of 553 are projected for Years 14-15. Figure 20.3 shows the relationship of personnel required to the total amount of material moved.
Los Azules Preliminary Assessment Technical Report
SE Project No. 8019-01
154
| | | | | | | | | | | | | | | | | | | | | | | | | |
Table 20.3
Major Mining Equipment Fleet Requirements |
Equipment | PP | Y1 | Y2 | Y3 | Y4 | Y5 | Y6 | Y7 | Y8 | Y9 | Y10 | Y11 | Y12 | Y13 | Y14 | Y15 | Y16 | Y17 | Y18 | Y19 | Y20 | Y21 | Y22 | Y23 | Y24 |
Crawler Drills, 311 mm | 5 | 5 | 5 | 5 | 5 | 5 | 5 | 5 | 5 | 5 | 5 | 5 | 5 | 5 | 5 | 5 | 5 | 5 | 5 | 5 | 5 | 4 | 3 | 3 | 3 |
Cable Shovels, 38 m3 | 3 | 4 | 4 | 4 | 4 | 4 | 4 | 4 | 4 | 4 | 4 | 4 | 4 | 4 | 4 | 4 | 4 | 4 | 4 | 4 | 4 | 2 | 2 | 2 | 2 |
Loaders, 25 m3 | 1 | 1 | 1 | 1 | 1 | 1 | 1 | 1 | 1 | 1 | 1 | 1 | 1 | 1 | 1 | 1 | 1 | 1 | 1 | 1 | 1 | 1 | 1 | 1 | 1 |
Trucks, 228 ton | 20 | 25 | 27 | 35 | 35 | 35 | 35 | 35 | 38 | 38 | 39 | 39 | 43 | 44 | 44 | 44 | 38 | 38 | 38 | 38 | 32 | 23 | 23 | 23 | 23 |
Secondary Drills, 89 mm | 2 | 2 | 2 | 2 | 2 | 2 | 2 | 2 | 2 | 2 | 2 | 2 | 2 | 2 | 2 | 2 | 2 | 2 | 2 | 2 | 2 | 2 | 2 | 2 | 2 |
Dozers, 635 kW | 2 | 2 | 2 | 2 | 2 | 2 | 2 | 2 | 2 | 2 | 2 | 2 | 2 | 2 | 2 | 2 | 2 | 2 | 2 | 2 | 2 | 2 | 2 | 2 | 2 |
Dozers, 435 kW | 5 | 5 | 5 | 5 | 5 | 5 | 5 | 5 | 5 | 5 | 5 | 5 | 5 | 5 | 5 | 5 | 5 | 5 | 5 | 5 | 5 | 4 | 4 | 4 | 4 |
Vibratory Compactor, 30 t | 1 | 1 | 1 | 1 | 1 | 1 | 1 | 1 | 1 | 1 | 1 | 1 | 1 | 1 | 1 | 1 | | | | | | | | | |
R.T. Dozers, 335 kW | 3 | 3 | 3 | 3 | 3 | 3 | 3 | 3 | 3 | 3 | 3 | 3 | 3 | 3 | 3 | 3 | 3 | 3 | 3 | 3 | 3 | 2 | 2 | 2 | 2 |
Graders, 200 kW | 5 | 5 | 5 | 5 | 5 | 5 | 5 | 5 | 5 | 5 | 5 | 5 | 5 | 5 | 5 | 5 | 5 | 5 | 5 | 5 | 5 | 4 | 3 | 3 | 3 |
Graders, 165 kW | 1 | 1 | 1 | 1 | 1 | 1 | 1 | 1 | 1 | 1 | 1 | 1 | 1 | 1 | 1 | 1 | 1 | 1 | 1 | 1 | 1 | 1 | 1 | 1 | 1 |
Water Truck, 135,000 liter | 3 | 3 | 3 | 3 | 3 | 3 | 3 | 3 | 3 | 3 | 3 | 3 | 3 | 3 | 3 | 3 | 3 | 3 | 3 | 3 | 3 | 3 | 3 | 3 | 3 |
Los Azules Preliminary Assessment Technical Report
SE Project No. 8019-01
155
|
|
| | | | | | | | | | | | | | | | | | | | | | | | | |
Table 20.4
Mine Personnel Requirements |
Position | PP | Y1 | Y2 | Y3 | Y4 | Y5 | Y6 | Y7 | Y8 | Y9 | Y10 | Y11 | Y12 | Y13 | Y14 | Y15 | Y16 | Y17 | Y18 | Y19 | Y20 | Y21 | Y22 | Y23 | Y24 |
| | | | | | | | | | | | | | | | | | | | | | | | | |
Operations: | | | | | | | | | | | | | | | | | | | | | | | | | |
Driller, Blasthole | 12 | 16 | 16 | 16 | 16 | 16 | 16 | 16 | 16 | 16 | 12 | 12 | 12 | 12 | 12 | 12 | 12 | 12 | 12 | 12 | 12 | 8 | 8 | 8 | 8 |
Driller, Secondary / Pioneer | 4 | 4 | 4 | 4 | 4 | 4 | 4 | 4 | 4 | 4 | 4 | 4 | 4 | 4 | 4 | 4 | 4 | 4 | 4 | 4 | 4 | 2 | 2 | 2 | 2 |
Blaster | 2 | 2 | 2 | 2 | 2 | 2 | 2 | 2 | 2 | 2 | 2 | 2 | 2 | 2 | 2 | 2 | 2 | 2 | 2 | 2 | 2 | 1 | 1 | 1 | 1 |
Blasting Helper | 8 | 8 | 8 | 8 | 8 | 8 | 8 | 8 | 8 | 8 | 8 | 8 | 8 | 8 | 8 | 8 | 8 | 8 | 8 | 8 | 8 | 4 | 4 | 4 | 4 |
Shovel / Loader Operator | 12 | 16 | 16 | 16 | 16 | 16 | 16 | 16 | 16 | 16 | 16 | 16 | 16 | 16 | 16 | 12 | 12 | 12 | 12 | 12 | 12 | 8 | 8 | 8 | 8 |
Truck Driver | 60 | 76 | 84 | 112 | 92 | 104 | 96 | 104 | 108 | 104 | 112 | 120 | 124 | 128 | 128 | 132 | 92 | 100 | 104 | 104 | 76 | 52 | 52 | 56 | 60 |
Track Dozer Operator | 20 | 20 | 20 | 20 | 20 | 20 | 20 | 20 | 20 | 20 | 20 | 20 | 20 | 20 | 20 | 20 | 20 | 20 | 20 | 20 | 20 | 16 | 14 | 14 | 14 |
R.T. Dozer / Compactor Operator | 10 | 10 | 10 | 10 | 10 | 10 | 10 | 10 | 10 | 10 | 10 | 10 | 10 | 10 | 10 | 10 | 8 | 8 | 8 | 8 | 8 | 4 | 4 | 4 | 4 |
Grader Operator | 18 | 18 | 18 | 18 | 18 | 18 | 18 | 18 | 18 | 18 | 18 | 18 | 18 | 18 | 18 | 18 | 18 | 18 | 18 | 18 | 18 | 14 | 10 | 10 | 10 |
Water Truck Driver | 10 | 10 | 10 | 10 | 10 | 10 | 10 | 10 | 10 | 10 | 10 | 10 | 10 | 10 | 10 | 10 | 10 | 10 | 10 | 10 | 10 | 8 | 6 | 6 | 6 |
Aggregate Plant / Small Equipment Operator | 16 | 16 | 16 | 16 | 16 | 16 | 16 | 16 | 16 | 16 | 16 | 16 | 16 | 16 | 16 | 16 | 16 | 16 | 16 | 16 | 16 | 8 | 8 | 8 | 8 |
Laborer / Trainee | 28 | 28 | 28 | 28 | 28 | 28 | 28 | 28 | 28 | 28 | 28 | 28 | 28 | 28 | 28 | 28 | 28 | 28 | 28 | 28 | 28 | 20 | 16 | 16 | 16 |
VSA Operator | 10 | 12 | 12 | 14 | 13 | 14 | 13 | 14 | 14 | 14 | 14 | 15 | 15 | 15 | 15 | 15 | 12 | 13 | 13 | 13 | 11 | 8 | 7 | 7 | 8 |
VSA Laborer / Trainee | 4 | 4 | 4 | 4 | 4 | 4 | 4 | 4 | 4 | 4 | 4 | 4 | 4 | 4 | 4 | 4 | 4 | 4 | 4 | 4 | 4 | 2 | 2 | 2 | 2 |
Operations Total: | 214 | 240 | 248 | 278 | 257 | 270 | 261 | 270 | 274 | 270 | 274 | 283 | 287 | 291 | 291 | 291 | 246 | 255 | 259 | 259 | 229 | 155 | 142 | 146 | 151 |
| | | | | | | | | | | | | | | | | | | | | | | | | |
Maintenance: | | | | | | | | | | | | | | | | | | | | | | | | | |
Heavy Equipment Mechanic | 42 | 46 | 48 | 60 | 52 | 58 | 52 | 58 | 60 | 60 | 60 | 64 | 68 | 68 | 72 | 72 | 48 | 56 | 60 | 60 | 40 | 28 | 28 | 28 | 28 |
Welder / Mechanic | 18 | 22 | 24 | 28 | 22 | 24 | 24 | 24 | 24 | 24 | 28 | 28 | 28 | 28 | 28 | 28 | 24 | 20 | 20 | 20 | 16 | 12 | 12 | 12 | 12 |
Electrician / Instrument | 12 | 16 | 16 | 16 | 16 | 16 | 16 | 16 | 16 | 16 | 16 | 16 | 16 | 16 | 16 | 16 | 16 | 16 | 16 | 16 | 16 | 12 | 8 | 8 | 8 |
Lubeman / PM Mechanic | 12 | 16 | 16 | 16 | 16 | 16 | 16 | 16 | 16 | 16 | 16 | 16 | 16 | 16 | 16 | 16 | 16 | 16 | 16 | 16 | 16 | 8 | 8 | 8 | 8 |
Tireman | 8 | 12 | 12 | 16 | 16 | 16 | 16 | 16 | 16 | 16 | 16 | 16 | 16 | 16 | 16 | 16 | 16 | 16 | 16 | 16 | 16 | 8 | 8 | 8 | 8 |
Machinist | 4 | 4 | 4 | 4 | 4 | 4 | 4 | 4 | 4 | 4 | 4 | 4 | 4 | 4 | 4 | 4 | 4 | 4 | 4 | 4 | 4 | 4 | 4 | 4 | 4 |
Carpenter / Utilityman | 6 | 6 | 6 | 6 | 6 | 6 | 6 | 6 | 6 | 6 | 6 | 6 | 6 | 6 | 6 | 6 | 6 | 6 | 6 | 6 | 6 | 6 | 8 | 8 | 8 |
Laborer / Trainee | 24 | 24 | 24 | 24 | 24 | 24 | 24 | 24 | 24 | 24 | 24 | 24 | 24 | 24 | 24 | 24 | 24 | 24 | 24 | 24 | 24 | 20 | 12 | 12 | 12 |
VSA Mechanic | 7 | 8 | 8 | 10 | 9 | 9 | 9 | 9 | 10 | 10 | 10 | 10 | 10 | 10 | 11 | 11 | 9 | 9 | 9 | 9 | 8 | 5 | 5 | 5 | 5 |
VSA Laborer | 2 | 2 | 2 | 2 | 2 | 2 | 2 | 2 | 2 | 2 | 2 | 2 | 2 | 2 | 2 | 2 | 2 | 2 | 2 | 2 | 2 | 2 | 1 | 1 | 1 |
Maintenance Total: | 135 | 156 | 160 | 182 | 167 | 175 | 169 | 175 | 178 | 178 | 182 | 186 | 190 | 190 | 195 | 195 | 165 | 169 | 173 | 173 | 148 | 105 | 94 | 94 | 94 |
Los Azules Preliminary Assessment Technical Report
SE Project No. 8019-01
156
|
|
| | | | | | | | | | | | | | | | | | | | | | | | | |
Table 20.4
Mine Personnel Requirements |
Position | PP | Y1 | Y2 | Y3 | Y4 | Y5 | Y6 | Y7 | Y8 | Y9 | Y10 | Y11 | Y12 | Y13 | Y14 | Y15 | Y16 | Y17 | Y18 | Y19 | Y20 | Y21 | Y22 | Y23 | Y24 |
| | | | | | | | | | | | | | | | | | | | | | | | | |
Supervision & Technical: | | | | | | | | | | | | | | | | | | | | | | | | | |
Mine Superintendent (Expatriot) | 1 | 1 | 1 | 1 | 1 | 1 | 1 | 1 | 1 | 1 | 1 | 1 | 1 | 1 | 1 | 1 | 1 | 1 | 1 | 1 | 1 | 1 | 1 | 1 | 1 |
General Mine Foreman | 1 | 1 | 1 | 1 | 1 | 1 | 1 | 1 | 1 | 1 | 1 | 1 | 1 | 1 | 1 | 1 | 1 | 1 | 1 | 1 | 1 | 1 | 1 | 1 | 1 |
Drill & Blast Foreman | 2 | 2 | 2 | 2 | 2 | 2 | 2 | 2 | 2 | 2 | 2 | 2 | 2 | 2 | 2 | 2 | 2 | 2 | 2 | 2 | 2 | 1 | 1 | 1 | 1 |
Mine Shift Foreman | 12 | 12 | 12 | 12 | 12 | 12 | 12 | 12 | 12 | 12 | 12 | 12 | 12 | 12 | 12 | 12 | 12 | 12 | 12 | 12 | 12 | 8 | 8 | 8 | 8 |
Maintenance General Foreman (Expatriot) | 1 | 1 | 1 | 1 | 1 | 1 | 1 | 1 | 1 | 1 | 1 | 1 | 1 | 1 | 1 | 1 | 1 | 1 | 1 | 1 | 1 | 1 | 1 | 1 | 1 |
Truck Shop Foreman | 1 | 1 | 1 | 1 | 1 | 1 | 1 | 1 | 1 | 1 | 1 | 1 | 1 | 1 | 1 | 1 | 1 | 1 | 1 | 1 | 1 | 1 | 1 | 1 | 1 |
Maintenance Planner | 2 | 2 | 2 | 2 | 2 | 2 | 2 | 2 | 2 | 2 | 2 | 2 | 2 | 2 | 2 | 2 | 2 | 2 | 2 | 2 | 2 | 1 | 1 | 1 | 1 |
Maintenance Shift Foreman | 12 | 12 | 12 | 12 | 12 | 12 | 12 | 12 | 12 | 12 | 12 | 12 | 12 | 12 | 12 | 12 | 12 | 12 | 12 | 12 | 12 | 8 | 8 | 8 | 8 |
Chief Engineer (Expatriot) | 1 | 1 | 1 | 1 | 1 | 1 | 1 | 1 | 1 | 1 | 1 | 1 | 1 | 1 | 1 | 1 | 1 | 1 | 1 | 1 | 1 | 1 | 1 | 1 | 1 |
Senior Mining Engineer | 1 | 1 | 1 | 1 | 1 | 1 | 1 | 1 | 1 | 1 | 1 | 1 | 1 | 1 | 1 | 1 | 1 | 1 | 1 | 1 | 1 | 1 | 1 | 1 | 1 |
Mine Planning Engineer | 2 | 2 | 2 | 2 | 2 | 2 | 2 | 2 | 2 | 2 | 2 | 2 | 2 | 2 | 2 | 2 | 2 | 2 | 2 | 2 | 2 | 1 | 1 | 1 | 1 |
Mineralized Material Control Engineer | 2 | 2 | 2 | 2 | 2 | 2 | 2 | 2 | 2 | 2 | 2 | 2 | 2 | 2 | 2 | 2 | 2 | 2 | 2 | 2 | 2 | 1 | 1 | 1 | 1 |
Dispatch Supervisor | 4 | 4 | 4 | 4 | 4 | 4 | 4 | 4 | 4 | 4 | 4 | 4 | 4 | 4 | 4 | 4 | 4 | 4 | 4 | 4 | 4 | 4 | 4 | 4 | 4 |
Geotechnical Engineer | 1 | 1 | 1 | 1 | 1 | 1 | 1 | 1 | 1 | 1 | 1 | 1 | 1 | 1 | 1 | 1 | 1 | 1 | 1 | 1 | 1 | 1 | 1 | 1 | 1 |
Senior Mine Geologist | 1 | 1 | 1 | 1 | 1 | 1 | 1 | 1 | 1 | 1 | 1 | 1 | 1 | 1 | 1 | 1 | 1 | 1 | 1 | 1 | 1 | 1 | 1 | 1 | 1 |
Mine Geologist | 3 | 3 | 3 | 3 | 3 | 3 | 3 | 3 | 3 | 3 | 3 | 3 | 3 | 3 | 3 | 3 | 3 | 3 | 3 | 3 | 3 | 2 | 2 | 2 | 2 |
Surveyor | 2 | 2 | 2 | 2 | 2 | 2 | 2 | 2 | 2 | 2 | 2 | 2 | 2 | 2 | 2 | 2 | 2 | 2 | 2 | 2 | 2 | 1 | 1 | 1 | 1 |
Rodman | 2 | 2 | 2 | 2 | 2 | 2 | 2 | 2 | 2 | 2 | 2 | 2 | 2 | 2 | 2 | 2 | 2 | 2 | 2 | 2 | 2 | 1 | 1 | 1 | 1 |
Engineering Tech / Mineralized Material Control | 12 | 12 | 12 | 12 | 12 | 12 | 12 | 12 | 12 | 12 | 12 | 12 | 12 | 12 | 12 | 12 | 12 | 12 | 12 | 12 | 12 | 8 | 6 | 6 | 4 |
Secretary / Clerk | 4 | 4 | 4 | 4 | 4 | 4 | 4 | 4 | 4 | 4 | 4 | 4 | 4 | 4 | 4 | 4 | 4 | 4 | 4 | 4 | 4 | 3 | 3 | 3 | 3 |
Supervision & Technical Total: | 67 | 67 | 67 | 67 | 67 | 67 | 67 | 67 | 67 | 67 | 67 | 67 | 67 | 67 | 67 | 67 | 67 | 67 | 67 | 67 | 66 | 47 | 45 | 45 | 43 |
| | | | | | | | | | | | | | | | | | | | | | | | | |
Mining Personnel Total: | 416 | 463 | 475 | 527 | 491 | 512 | 497 | 512 | 519 | 515 | 523 | 536 | 544 | 548 | 553 | 553 | 478 | 491 | 499 | 499 | 443 | 307 | 281 | 285 | 288 |
Los Azules Preliminary Assessment Technical Report
SE Project No. 8019-01
157
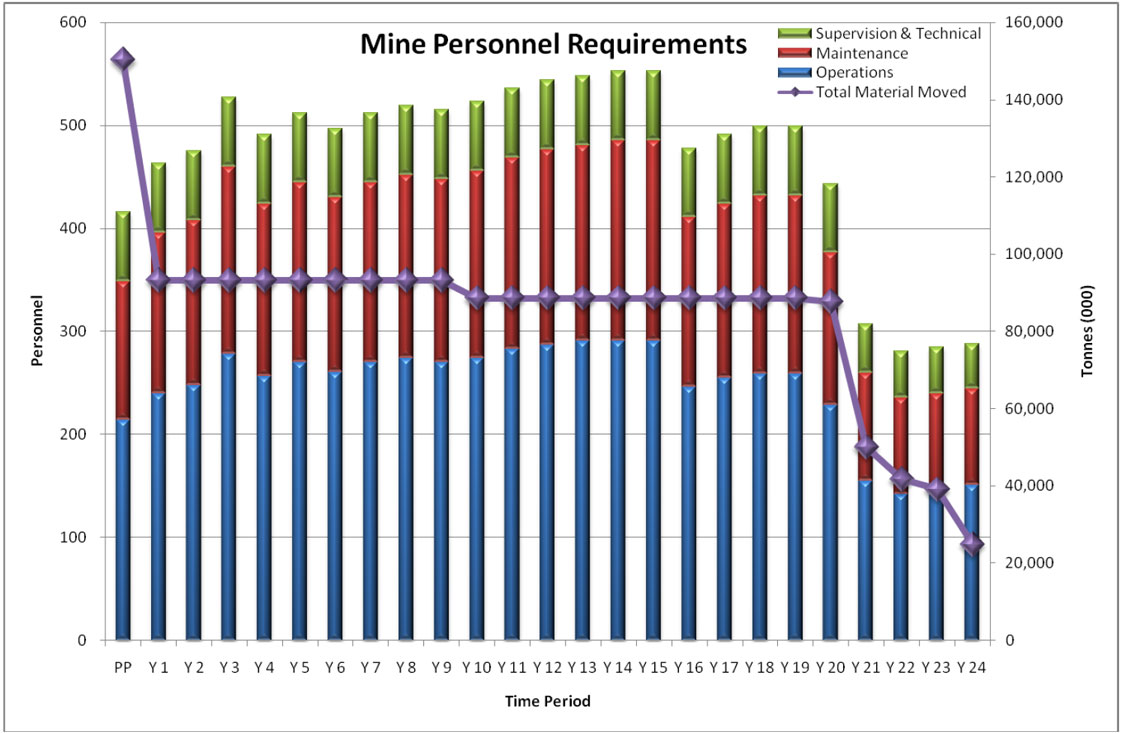
Figure 20.3 – Mine Personnel Requirements
Los Azules Preliminary Assessment Technical Report
SE Project No. 8019-01
158
20.2
Infrastructure
20.2.1
Mine Access Road
The Los Azules project is located near the border of Chile in an isolated section of the Argentinean Andes at an elevation ranging from 3,500 to 4,500 masl. The key access issue for the project throughout the year is road closures due to snow and high stream flows in the spring. The snowline is at an approximate elevation of 3,000 masl. Presently, Minera Andes is able to access the property approximately 5 months out of the year with snow removal along the existing central road after the snow fall season.
San Juan is a major regional center serviced by an airport and highways. An existing highway extends from San Juan to a wide valley in which the communities of Villa Nuevo, Calingasta, and Villa Pituil are located. Three mine access roads were analyzed for this study: northern route, central (existing) route, and southern route (Figure 20.4).
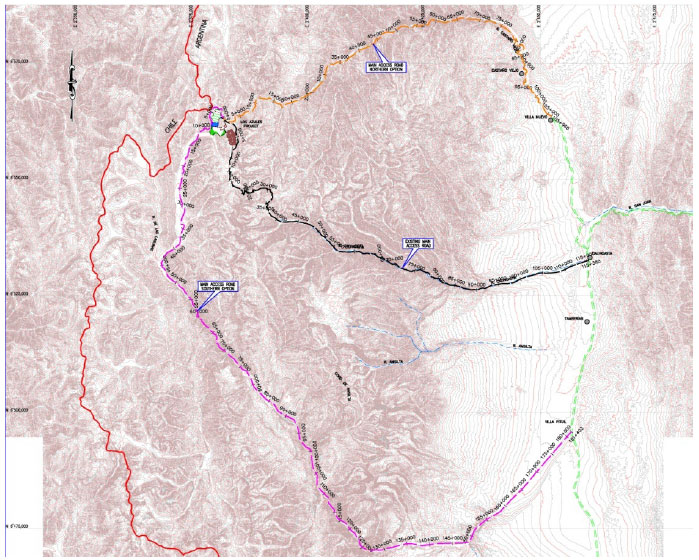
Figure 20.4 – Potential Mine Access Routes
Los Azules Preliminary Assessment Technical Report
SE Project No. 8019-01
159
Both a geotechnical and geological risk investigation were not performed for this study because of the short seasonal access and because of the level of study. Therefore, road alignments and cut and fill estimates were based on very broad assumptions. The routes developed generally represent shortest probable alignments to existing roads, following valley alignments through the mountainous terrain. Geotechnical characteristics and hazard assessments should be included in future studies of Mine Access Road alignments to identify more cost effective routes.
20.2.1.1
Northern Access
The northern route goes from the project site to the small community of Villa Nuevo. This route is approximately 106 kilometers, which follows major valleys north of the project down to Villa Nuevo were the existing road infrastructure does not need improvement. This road does not follow any existing roads. Seventy-five of the one hundred and six kilometers would be constructed along valleys with moderate to steep terrain and remainder along flat to moderate terrain. Approximately 12 kilometers of this access is located above the snowline and requires snow removal operations.
20.2.1.2
Central Route (Existing Route)
The central route goes from the project site to the small community of Calingasta. The existing road was developed to access mining properties, all in study phases, in the area. This route is approximately 115 kilometers and also follows major valleys, over the majority of the alignment, to the east of the project. The existing road also has several stream crossings and traverses two major mountain passes that are over 4,000 masl. Approximately sixty kilometers of the road are above the snowline which creates an access problem during the winter months, requiring snow removal operations. The majority of the road is along moderate to steep terrain.
20.2.1.3
Southern Route
The southern route goes from the project site to the small community of Villa Pituil. This route is approximately 181 kilometers and approximately 75 kilometers might have a shared use with another Argentinean mine to the south of Los Azules. At this stage Vector has assumed no joint venture for this analysis. This route follows major valleys south of the project down to Villa Pituil where the existing road infrastructure does not need improvement. There are existing roads along a major portion of this alignment. Approximately one hundred and thirteen kilometers are in relatively flat terrain and the remainder is in moderate to steep terrain with seventy-five kilometers above the snowline, requiring snow removal operations.
20.2.1.4
Access Road Design Criteria
For the purposes of this study Vector developed the design criteria based on a number of assumptions including traffic volume, vehicle type, and road surface. For instance, it has been assumed that the Mine Access Road will be a gravel road approximately 7.0 m wide (not including a safety berm). The general assumptions are included in Table 20.5.
Los Azules Preliminary Assessment Technical Report
SE Project No. 8019-01
160
| | |
Table 20.5
Main Access Road Design Criteria |
Description | Units | Design Criteria |
Fill Slope | z:1 | 1.5 |
Cut Slope | z:1 | 0.5 - 11 |
Road Width (Including Shoulders) | m | 7 |
Shoulder Width | m | 1 |
Diversion Channel Width | m | 1.5 |
Diversion Channel Depth | m | 0.5 |
Maximum Incline | % | 10 |
Maximum Radius | m | 30 |
Maximum Speed | kph | 30 |
1 - Depends on assumed soil and rock conditions |
Based on the terrain, alignments, and design critiera for the three potential mine access roads a preliminary economic tradeoff was performed. Both the Central and Southern routes were discarded due to their capital and operating costs based on length and terrain and high altitude crossings likely to be prone to significant snowfalls and snow removal operations. The central route was also discarded because of the significant potential to be prone to avalanche issues above the road due to the steep terrain along the alignment. This requires the addition of avalanche control operations. Therefore, for the PA the northern route was used for the economic evaluation.
Typical Main Access Road cross sections are shown in Figure 20.5 to Figure 20.7.
Los Azules Preliminary Assessment Technical Report
SE Project No. 8019-01
161
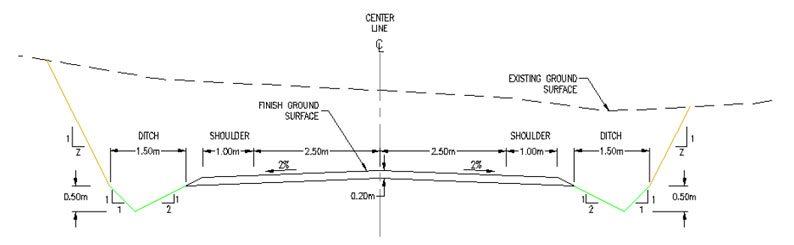
Figure 20.5 - Typical Cut Cross Section
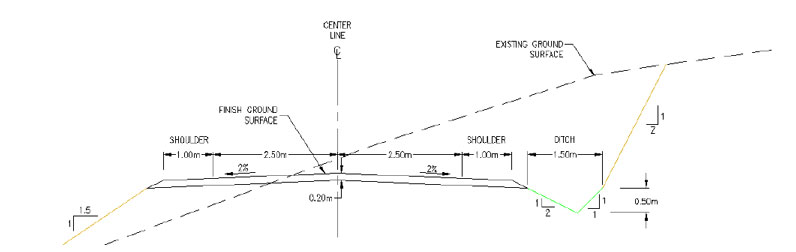
Figure 20.6 - Typical Cut and Fill Cross Section
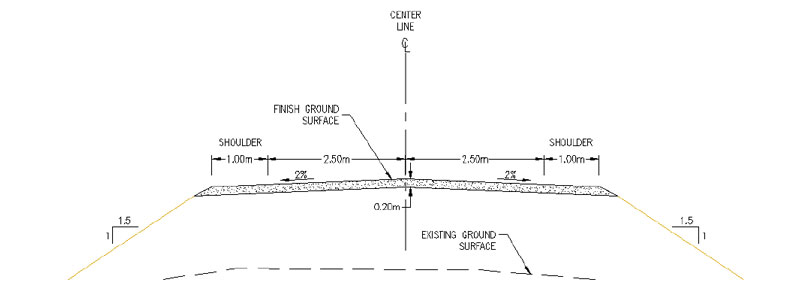
Figure 20.7 - Typical Fill Section
Los Azules Preliminary Assessment Technical Report
SE Project No. 8019-01
162
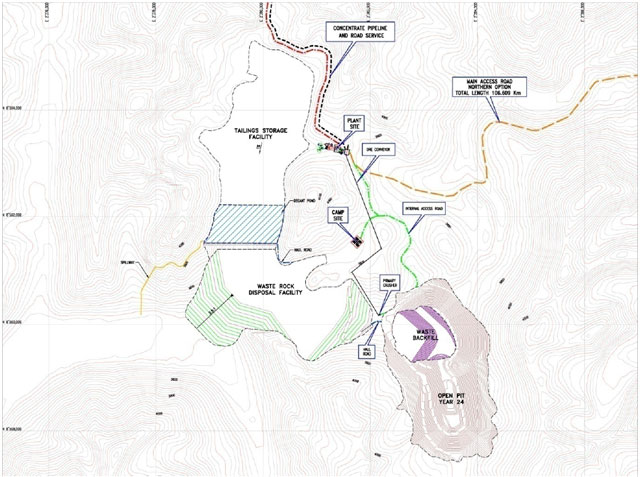
Figure 20.8 – General Arrangement Plan
20.2.2
Waste Rock Disposal Facility (“WRDF”)
20.2.2.1
WRDF Design
Two options were developed for the WRDF. Refer to Figure 20.9 for the location of each alternative. Option 1 is located in La Embarrada, Valley approximately 6 km (centroid distance) north northwest of the pit. Option 2 is located 4 km (centroid distance) west of the pit in Los Azules Valley and extends into the junctions of La Embarrada and the Rio Salinas Valleys. The distance separating the upstream toe of the waste rock facility and the crest of the pit is approximately 250 meters. In Option 2, the WRDF buttresses the Option 2 TSF embankment. A third option was identified in the late stages of study which included the disposal of approximately 236 million tonnes of waste rock in the northern end of the pit, i.e. in-pit fill to reduce haul distances and costs. Waste rock disposal in the pit will start after Year-16 of operation, based on the current mine plan.
In addition, capacities of the WRDF for both options were reduced by the requirements for the construction of the TSF embankment and the in-pit filling.
Los Azules Preliminary Assessment Technical Report
SE Project No. 8019-01
163
With the diversion of waste rock to the tailings embankment and the in-pit fill (in later operations) an economic tradeoff was performed on the two options. The difference in capital and sustaining capital costs between the two options was not significant to swing it to either option. The driving economic factor determining the choice of facilities to use for the disposal of waste rock came down to mine operations capital and operating cost for hauling the waste to a facility. The average difference in haul distances between Option 1 and Option 2 was approximately 3 kilometers with Option 2 being the shorter haul. This translates into a reduction in mine operations cost per tonne and the number of haul trucks required. Therefore, Option 2 was used in the PA economic analysis.
For the design and operation of the WRDF, refer to Figure 20.9:
·
The WRDF to be stacked in 10 to 15 meter high lifts at angle of repose;
·
Benches installed between lifts to create an overall slope of 2.5H:1V for stability and to facilitate closure;
·
WRDF haul roads 50 meters wide with a maximum grade of 10 percent. Any curves will have a minimum radius of 75 meters;
·
The waste rock will be stacked to maintain access to the TSF embankment for its construction;
·
An underdrain and pond collection system will be installed to collect any water from the WRDF;
·
Diversion canals will be installed around the facility to reduce on-run into the WRDF; and
·
Tailing disposal within the WRDF will be at a ratio of 6.5:1 (waste rock : tailings)
Typical impact mitigation measures proposed include:
·
Staged expansion of WRDF over undisturbed areas within the footprint;
·
Progressive rehabilitation of final surfaces when available; and
·
Incorporate staged installation of the underdrain system.
The benches and platforms developed will be sloped to promote drainage to surface diversion works along the flanks of the facility. Diverted surface water runoff will be collected in one of several surface water collection ponds for monitoring and for treatment as required. Alternatively, the collected water could be pumped into the TSF as process make-up water. Additional ponds will be added as the WRDF advances down the valley.
An underdrain collection system is incorporated to manage the development of unfavorable pore pressures in the base of the facility and to collect seepage for monitoring. The underdrain system consists of a series of gravel filter drains connected to the headers in a semi-herringbone configuration. Any seepage will be collected and directed to an underdrain collection pond. This pond will be relocated at designated intervals as the WRDF advances down the valley. As with diverted surface water, the collected seepage from the WRDF can be treated or pumped into the TSF, if required.
Los Azules Preliminary Assessment Technical Report
SE Project No. 8019-01
164
Since Option 2 is placed immediately downstream of the pit and pit will alter existing drainage characteristics, it is likely that specific surface water and groundwater management features will be required to mitigate environmental impacts. The nature and number of these features will depend on the findings of future studies, but may include a diversion tunnel, diversion culverts, diversion underdrains, and/or a partial low permeability liner on the upstream face to reduce infiltration into the WRDF if water is expected to pond upstream.
Future environmental, geotechnical and waste characterization studies may determine that additional design elements be incorporated in the WRDF. In particular, ARD characterization of waste material has not yet been adequately undertaken (refer to Section 20.2.2).
Apart from reducing the size of the WRDF, in-pit disposal will potentially assist in management of ARD generation. If it is determined that sections of the pit walls will generate ARD an inert waste cover could reduce ARD generation. A pit lake post-closure would have a similar reducing effect on the pit walls and any waste in the pit.
20.2.2.2
WRDF Acid Generation Potential (“AGP”)
Six surface rock outcrop samples underwent acid base accounting (“ABA”) analysis by ALS Environmental. The date of the analyses and sampling is not known. The ABA test is a series of laboratory chemical analyses used in quantitative prediction of the potential for the material being sampled to generate low pH drainage and – by inference – its potential to leach metals.
The six samples were selected from along the banks of the river in the area of the mineralization, as detailed in Table 20.6:
| | | | |
Table 20.6
Acid Generation Potential Testing Sample Points |
Sample No. | Sample Point | Coordinates |
X | Y | Z |
LAS 1 | Portillo Area Norte – Los Azules E | 6560212 | 2382216 | 3573 |
LAS 2 | Lado Este C° La Ballena | 6557981 | 2384167 | 3860 |
LAS 3 | Ladera Oeste C° La Ballena, sector Sur | 6557385 | 2383802 | 3806 |
LAS 4 | Sector Medio ladera Oeste C° La Ballena | 6557748 | 2383734 | 3799 |
LAS 5 | Sector Norte ladera C° La Ballena | 6558206 | 2383600 | 3770 |
LAS 6 | Ladera Oeste C° La Ballena, fin sector Norte | 6559063 | 2383352 | 3677 |
The results of this testwork are shown in Table 20.7:
Los Azules Preliminary Assessment Technical Report
SE Project No. 8019-01
165
| | | | | | | |
Table 20.7
Acid Generation Potential Testwork Parameters of Interest – ABA Testing Program |
Sample No. | Total S (%) | Sulfide S (%) | Paste pH | AGP (kg CaCO3/1,000 kg) | ANP (kg CaCO3/1,000 kg) | NNP (kg CaCO3/1,000 kg) | ANP/AGP Ratio |
LAS 1 | 1.4 | 0.52 | 4.47 | -44 | 3.8 | -40.2 | 0.1 |
LAS 2 | 1.49 | 0.83 | 4.93 | -47 | 4.3 | -42.7 | 0.1 |
LAS 3 | 0.32 | 0.06 | 6.25 | -10 | 3.3 | -6.7 | 0.3 |
LAS 4 | 0.75 | 0.22 | 4.85 | -23 | 3.1 | -19.9 | 0.1 |
LAS 5 | 0.78 | <0.01 | 6.18 | -24 | 3.1 | -20.9 | 0.1 |
LAS 6 | 0.29 | 0.06 | 6.99 | -9 | 2.6 | -6.4 | 0.3 |
Total S = Total Sulfur, Sulfide S = Sulfide Sulfur, AGP = Acid Generation Potential, ANP = Acid Neutralizing Potential, NNP = Net Neutralizing Potential (AGP – ANP) |
Commonly, these results are interpreted on the basis of the differences and the ratio between the ANP and AGP values and are presented graphically. These two classifications of ABA are elucidated in Table 20.8:
| | | |
Table 20.8
Classification of ABA Test Results |
Parameter | Color | Range | Description |
ANP/AGP* | # | 4 < ANP/AGP | Presents no potential for the generation of acidity |
# | 2 < ANP/AGP < 4 | Presents an improbable potential for the generation of acidity |
# | 1 < ANP/AGP < 2 | Moderate potential for the generation of acidity |
# | ANP/AGP < 1 | High potential for the generation of acidity |
NNP | # | 20 < NNP | No potential for the generation of acidity |
# | -20 < NNP < 20 | Indeterminate potential for the generation of acidity |
# | -20 < NNP | Has potential to generate acidity |
* For very low values of ANP and AGP, and where AGP tends to zero, this parameter becomes unstable as a predictive tool |
Based on the NNP classification, three of the samples (LAS 1, LAS 2 and LAS 5) have a “high potential for the generation of acidity”, and the other three samples (LAS 3, LAS 4 and LAS 6) have an “indeterminate potential for the generation of acidity”.
Based on the ANP/AGP ratio classification, all six samples show a “high potential for the generation of acidity”.
Based on the ratios of the total sulfur to sulfide sulfur, all the samples appear to have been highly oxidized, which is normal for samples collected from a natural surface environment. High residual sulfide sulfur of between 0.5 and 1.0% is still present in samples LAS 1 and LAS 2 with resultant low pH values. pH values below 5 are considered to be acidic in these tests.
The relationship between these samples and the mineralized material deposit or possible waste rock material that might be produced from this mineralized material deposit is not known.
Los Azules Preliminary Assessment Technical Report
SE Project No. 8019-01
166
It is unclear if the samples previously tested are waste or ore; therefore, it is recommended that a waste rock sampling program consisting of a full static testing program (ABA, WRA, SPLP leach testing and petrographic analysis), as well as a kinetic cell program, be carried out on representative samples of the various combinations of lithologies, alteration overprints and sulfur contents in order to better understand any acid-generating and metals leaching potential of the mineralized material bodies waste rock materials. The majority of the samples could be gathered from the existing core for the project with some test pit samples.
20.2.3
Tailings Storage Facility (“TSF”)
20.2.3.1
TSF Siting
During the preliminary assessment a siting study was carried out for possible tailings storage facility locations based on the current mine plan tailings production. The TSF sites were chosen on the basis of the following factors:
·
The required storage capacity could be developed in one facility for the life of the project to facilitate management of the waste and mitigate potential environmental impact;
·
The TSF in close proximity to the pit and plant without inhibiting the operation or siting of the these facilites;
·
The TSF is located at the upstream end of a catchment area, reducing the volume of rainfall runoff reporting to the TSF compared to locations further downstream, resulting in reduced volumes of water coming into contact with the tailings that will require monitoring and potential management;
·
The preferred location of the TSF is in the same watershed as the pit and waste rock disposal facility to minimize the environmental impacts in the area;
·
The topography and geology favors construction of a single, efficient embankment; and
·
The TSF is not upstream of critical mining structures (other than incidental structures such as roads).
In the intial phase of the study 2 sites were identified based on the siting criteria (refer to Figure 20.9):
·
Option 1 – located in the Salinas Valley approximately 4 kilometers west southwest of the pit; and
·
Option 2 – located in the Embarrada Valley approximately 5 kilometers west northwest of the pit.
In the initial stage of the development of the project, the team was considering using the Salinas Valley (Option 1) to dispose of tailings because of the favorable geometry of the valley, i.e. a smaller embankment, lower capital, to contain the tailing because the mouth of the valley is narrower than the Embarrada Valley. However, because of capital and operating costs issues for the plant associated with this TSF, it was decided to abandon this option and use Option 2, Embarrada Valley (refer to Figure 20.10).
Los Azules Preliminary Assessment Technical Report
SE Project No. 8019-01
167
Also during the study it was decided to utilize co-disposal techniques, i.e. the disposal of tailings within the waste rock, to reduce the volume requirements of the TSF and thus reduce capital and sustainable capital costs for this facility. Based on the mine plan approximately 20% of the tailings can be co-disposed of with the waste rock. This equates to a reduction from 829 million tonnes required for the ultimate TSF to 663 million tonnes.
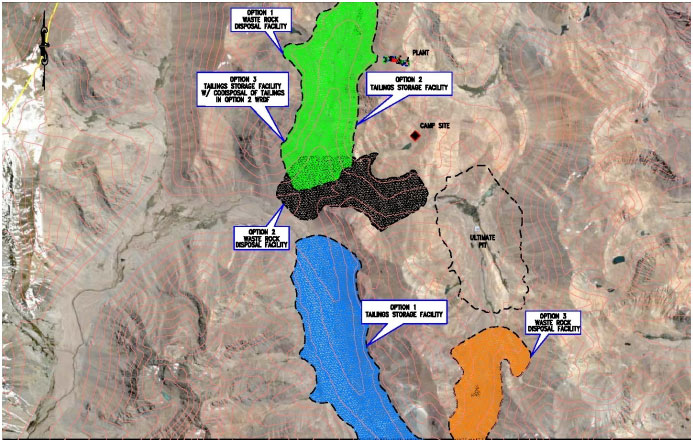
Figure 20.9 – TSF and WRDF Siting Map
20.2.3.2
TSF Design
The design criteria adopted for the TSF are summarized in Table 20.9. It is proposed to construct the TSF embankment continuously during the life of the project. For the purposes of this study, only years 1, 5, 10, 15, and 24 (ultimate) stages have been assessed along with co-disposal of approximately 20 percent of the tailings in the WRDF. Staging of the embankment should be looked at in more detail, on a yearly basis, in future studies.
Los Azules Preliminary Assessment Technical Report
SE Project No. 8019-01
168
|
|
| |
Table 20.9
TSF Design Criteria |
Description | Criteria |
Year 1 Cumulative Tailings | 22.0 million tonnes / 16.9 million m3 |
Year 5 Cumulative Tailings | 127.9 million tonnes / 98.4 million m3 |
Year 10 Cumulative Tailings | 261.0 million tonnes / 200.8 million m3 |
Year 15 Cumulative Tailings | 396.9 million tonnes / 305.3 million m3 |
Year 24 Cumulative Tailings | 655.7 million tonnes / 504.4 million m3 |
Average Consolidated Tailings Dry Density | 1.3 tonnes / m3 |
Average Tailings Beach Angle | 1% |
Water Storage Requirement – Decant Pond Capacity | 1.2 million m3 – Maximum monthly (no spill) storage requirement from water balance for 1:20 AEP annual rainfall, including supplements for make-up water demand and 100-yr 24-hr storm (excluding fresh water demand) |
Freeboard | 2 m (above combined storage requirements) |
Spillway | Pass PMF |
Embankment Slope | 2:1 (H:V) upstream and 2.5:1 (H:V) downstream |
Shell Materials | Waste rock from the pit |
Seepage Barrier | Upstream face – composite (filter, low permeability soil liner, and geomembrane) |
Underdrain | Consisting of gravel and pipes |
The design was developed using available topography comprised of 25 meter contours. Therefore, based on the final location of the TSF, infrastructure, and design critiera the initial and ultimate facility are shown in Figure 20.10 and Figure 20.11, respectively.
Los Azules Preliminary Assessment Technical Report
SE Project No. 8019-01
169
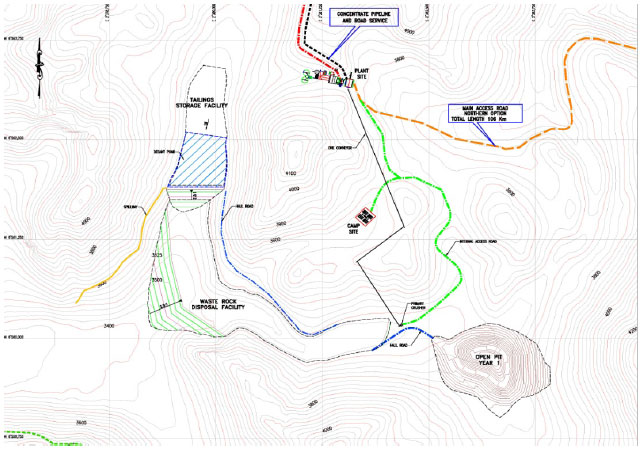
Figure 20.10 – General Initial Facility Arrangement
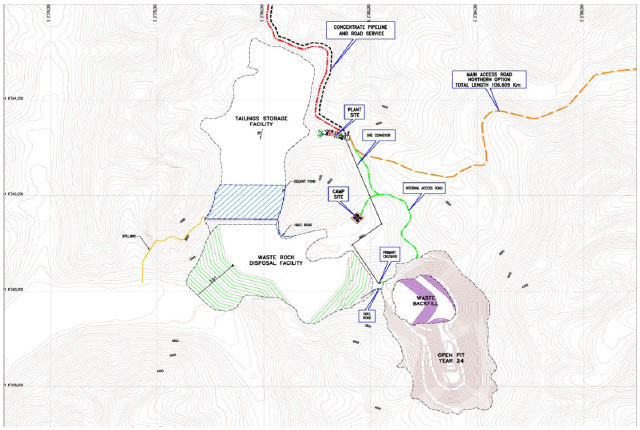
Figure 20.11 – General Ultimate Facility Arrangement
Los Azules Preliminary Assessment Technical Report
SE Project No. 8019-01
170
The TSF design water balance developed for the additional water storage requirement is generally based on the same assumptions and water requirements described in Section 20.2.6 for the sitewide water balance, except that instead of average annual precipitation, the 1:20 AEP annual precipitation has been adopted. The water balance assumes that catchment runoff is not diverted around the TSF. It is also assumed that the contact make-up water requirement (pumped at a constant rate throughout the year) is stored in the TSF, start-up mineral processing requirements are not subtracted from the TSF, and the initial TSF decant pond contains approximately 200,000 m3 of water to offset what was estimated to be the potential water deficit in October. In future studies, it will be required to review and consider specific Argentine regulatory requirements.
Two alternative approaches to TSF management were considered during the early stage of the study. Option 1 incorporates a TSF decant pond adjacent to the embankment. Option 2 incorporates a decant pond at the upstream end of the catchment. Option 1 presents possible advantages and disadvantages over Option 2, including:
Advantages of Option 1
·
Reduced embankment volume (approximately 30 % less volume);
·
Reduced upstream face liner area on the TSF embankment;
·
Static decant pump location; and
·
Facilitates proposed closure plan (if adopted in later years of operation).
Disadvantages of Option 1
·
Increased risk of instability in the advent of a significant upstream face liner breach;
·
Emergency spillway requirement for risk mitigation (may not be required for Option 2),
·
Higher likelihood of discharge treatment required during operation; and
·
Additional tailings discharge spigot management.
It was decided to utilize Option 1 tailings discharge scheme with the slight modification of discharging a small portion of tailings off the embankment to reduce the depth of ponded water against the upstream dam face.
The tailings embankment is expected to be a classic rock fill dam (constructed of waste rock from the pit). For the purposes of this study, upstream and downstream slopes of 2H:1V and 2.5H:1V respectively have been adopted based on similar projects in seismic areas. Future geotechnical studies will be required to determine appropriate embankment geometry for site specific conditions.
Until more substantial environmental, hydrogeological, geotechnical and waste characterization assessments are completed, it has been assumed that specific engineered measures be taken to contain the tailings liquor. These measures and related assumptions include:
·
An upstream face composite liner system will be required, comprised of a low permeability soil-liner (assumed to be 4 m thick) and 2.0 mm thick HDPE SST geomembrane;
Los Azules Preliminary Assessment Technical Report
SE Project No. 8019-01
171
·
A foundation grout curtain will be installed, in order to reduce seepage and potential piping in the TSF - it has also been assumed that the foundation will be stripped of unsuitable materials to a level 1.5 m below the existing ground surface along the base of the valley and that a grout curtain will extend 50 m below this level; and
·
Underdrain collection systems will be installed beneath the TSF embankment, serving to reduce the potential for development of high pore pressures within the embankment that could subsequently reduce stability, and serving to monitor and, if necessary, collect TSF embankment seepage for return to the TSF or treatment.
It is possible that future studies may show that one or more of these measures are not required, however this is unlikely based on experience at similar sites.
Even though an allowance for seismic design was included, future work should specify and design the facilities for an actual maximum design earthquake (“MDE”).
An access road will be constructed along the eastern side of the TSF from the plant site to tailings discharge points. The tailings discharge pipeline and reclaim water pipeline will be placed along the access road. The tailings will be distributed along the face of the tailings dam and/or around the northern end of the facility. The decant pond locations will be managed by tailings discharge operation to keep it near the embankment.
20.2.3.3
Tailings AGP
ABA tests were carried out on two tailings samples. Results of the metallurgical testing process indicate this material has low sulfide content (<0.04%) and an average Net Neutralization Potential (“NNP”) of 5.9 tonnes CaCO3/1,000 tonnes of tailings.
According to Table 20.8 the average NNP for the tailings samples (5.9 tonnes CaCO3/1,000 tonnes of tailings) can be classified as having undetermined potential for acid generation
(-20<NNP<20). It would be necessary to add a minimum of 14.1 tonnes CaCO3/1,000 tonnes of tailings to it, for it to fall within the range of no potential for acid generation.
Table 20.10 shows a comparative analysis of the significant parameters of the tailings samples. From the WRA tests, metals presenting values that are very different from other sample’s values have been identified as metals of interest; while for the short-term SPLP leaching tests, elements with values above the detection limits are the ones considered critical.
| | | | | | |
Table 20.10
Tailings – Comparative Analysis of Important ARD and Leaching Parameters |
Source | AGP | ANP | NNP | Minor Metal Content | SPLP Metals Leaching | “Significant Metals” |
Tailings | 1.1 | 7 | 5.9 | Ba, Cr, Cu, La, Mn, Ni, P, Pb, Rb, Sr, and Zn | Al, Ca, Fe, Mg, Si, Na, and Sr | Fe, Ca, Cr, Cu, Mg, Mn, P, Pb, and Sr |
Los Azules Preliminary Assessment Technical Report
SE Project No. 8019-01
172
Based on the NNPs’ regression analyses versus sulfide concentration of both tailings samples, it can be stated that these two variables are inversely proportional (the higher the concentration of sulfide the lower the NNP). The average ANP is 7 tonnes CaCO3/1,000 tonnes of tailings at a pH between 7.9 and 8.4 (moderately alkaline). From the NNP and ANP/AGP indicators it can be inferred that the samples present an uncertain potential to generate acidity; nevertheless, the relation between the average ANP and AGP is 7:1.
The leaching potential of the metals present in the tailings is a very important aspect to be taken into consideration for any effluents emanating from the tailings dam. Metals possibly sensitive to leaching are the ones indicated as “significant metals” in Table 20.10. The presence of Ca and Mg is beneficial as both elements are a buffering source for the acidity of the samples.
Since tailings are generated by processing the open-pit mineralized material, these minerals are likely to be oxidized.
20.2.4
Mancamp Facilities
Given the remote location of the project a permanent mancamp facility will be provided onsite. It is assumed to contain facilities for 500-600 individuals at any given time. The mancamp will also contain meals and recreation facilities. An outside contractor will provide meal and housekeeping services.
20.2.5
Employee Housing and Transportation
It is assumed that all employees will be contained in the mancamp so transportation will be provided by bus and truck to deliver employees to the various locations of work. Supervisors and Management will have an assigned vehicle and others will be transported by bus.
20.2.6
Water Supply
The objective of the water supply study was to analyze the water demand of the project with respect to local climate and hydrologic and hydrogeological conditions. The fresh water source is for drinking water, make-up water, etc. is comprised of four wells, located approximately 11 km from the plant site.
20.2.6.1
Hydrological Setting
The Los Azules mining project is located in the department of Calingasta, San Juan province, Argentina, just a few kilometers east and inside of the Rio Blanco drainage basin boundary which is also the national border of Chile. The project area is located within the rectangle with UTM coordinates (Campo Inchauspe 69 system): 2,388,588 to 2,370,702 E and 6,556,418 to 6,565,413 N. The project is located at the headwaters of Rio Salinas which flows as part of the Atlantic Ocean catchment basin into the Rio Blanco and further down stream into the Rio San Juan. Rio San Juan enters Los Altos Lake at the junction of the provincial boundaries of San Juan, San Luis and Mendoza.
The site elevations in the project vicinity range from a high of 4,720 masl at the southeast side of Las Vegas Valley to about 3380 masl at the confluence of Los Azules Valley, La Embarrada and Rio Salinas.
Los Azules Preliminary Assessment Technical Report
SE Project No. 8019-01
173
20.2.6.2
Hydrologic Conditions
To estimate the surface runoff in the project area with no available measurements taken on site, hydrometric flow station information was analyzed from lower elevations in the San Juan River basin. Table 20.11 shows the average, maximum and minimum hydraulic yield from 5 sub-catchments located on Rio Blanco, Rio De Los Patos, Rio Castano, and two on Rio San Juan. Average annual flow, area of catchment, and elevation of each monitoring station are also presented in Table 20.11.
| | | | | | | | | |
Table 20.11
Specific Hydraulic Yields – San Juan River Basin |
Gauge Station ID | River | Elevation (masl) | Catchment Area (km2) | Flowrate (m3/s) | Specific Yield (L/s·km2) |
Avg | Max | Min | Avg | Max | Min |
1205 | De Los Patos | 1,950 | 3,710 | 18.99 | 49.61 | 5.41 | 5.1 | 13.4 | 1.5 |
1201 | Blanco | 1,925 | 4,790 | 23.54 | 87.37 | 5.34 | 4.9 | 18.2 | 1.1 |
1202 | Castaño | 1,650 | 5,280 | 10.53 | 27.35 | 3.58 | 2.0 | 5.2 | 0.7 |
1211 | San Juan – 2 | 1,310 | 18,348 | 56.14 | 114.8 | 19.98 | 3.1 | 6.3 | 1.1 |
1208 | San Juan – 1 | 945 | 25,670 | 65.23 | 224.2 | 19.82 | 2.5 | 8.7 | 0.8 |
To assign a representative hydraulic yield to the project area, the catchment with the most similar geographic characteristics was chosen. The ‘Los Patos’ catchment has the highest average elevation, a small total area and most closely resembles the project area’s geomorphologic structures.
The average hydraulic yield for Los Patos for the dry season (winter) months (May through September) is 2.30 L/s·km2 and the average annual specific yield is 5.12 L/s·km2.
A factor of 0.993 was used to scale the specific yield to the project site. This correlation estimates an annual average yield of 5.48 L/s·km2 (46% of annual site precipitation) and a minimum of 2.46 L/s·km2 (20% of annual site precipitation) for the project area.
Runoff
Seasonal temperatures are assumed to have the greatest influence on the proportionate and temporal contributions of total precipitation (snow and rain) to surface water runoff within the project area. This is because during the winter, when temperatures are below freezing, a majority of the precipitation falls as snow. This snow however does not have the opportunity to contribute to surface water runoff until it is melted by higher temperatures.
There is a correlation between temperature and surface runoff in the Rio Blanco catchment (project area). That is to say maximum surface runoff occurs during the warmest months when snow melt occurs and minimum surface runoff occurs during the coldest months (June through November).
Los Azules Preliminary Assessment Technical Report
SE Project No. 8019-01
174
Groundwater Presence
Water levels on site have been determined through field reconnaissance, drilling observations and satellite photography. These methods of analysis have determined that a majority of the water present on site is stored as groundwater. Measured water level elevations are shown in plan and cross section view in Figure 20.12, Figure 20.13, and Figure 20.14.
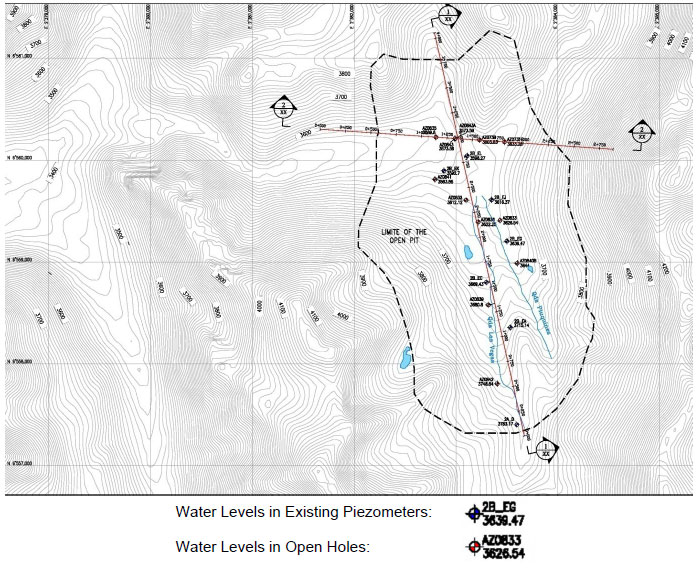
Figure 20.12 – Groundwater Levels on Los Azules Site
Long, narrow lakes occupy the valley floors on either side of La Ballena. These lakes are fed by snowmelt and groundwater discharge. Standing water level in these lakes is about 3,600 m in elevation. Springs are noted at about 3,790 m in elevation upstream of the lake along the west side of La Ballena. A large groundwater fed lake and springs are also present between 3,800 and 3,900 m in elevation, on the western wall of Qda Vegas, at the base of a large cirque just south of Cerro Sur (Tetra Tech, 2008, personal correspondence, Ken Rippere; Project Geotechnical Specialist).
Los Azules Preliminary Assessment Technical Report
SE Project No. 8019-01
175
Depth to groundwater ranges between 0 and 34 mbgs. As shown in Figure 20.13, the water depth decreases with increasing elevation. This water level trend could be explained by a few different hydrogeologic models.
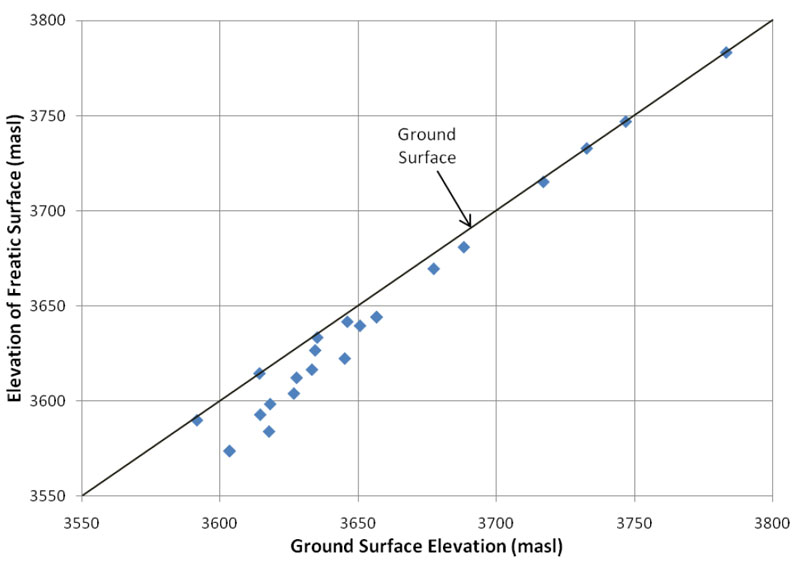
Figure 20.13 – Relationship of Groundwater Depth to Surface Elevation
One explanation is that low permeability fault gouge and/or dykes are creating barriers to lateral groundwater flow and produce higher water levels in the valley walls where these lower permeability structures outcrop. If this scenario is true, it can also explain the presence of high altitude groundwater fed springs and lakes.
Los Azules Preliminary Assessment Technical Report
SE Project No. 8019-01
176
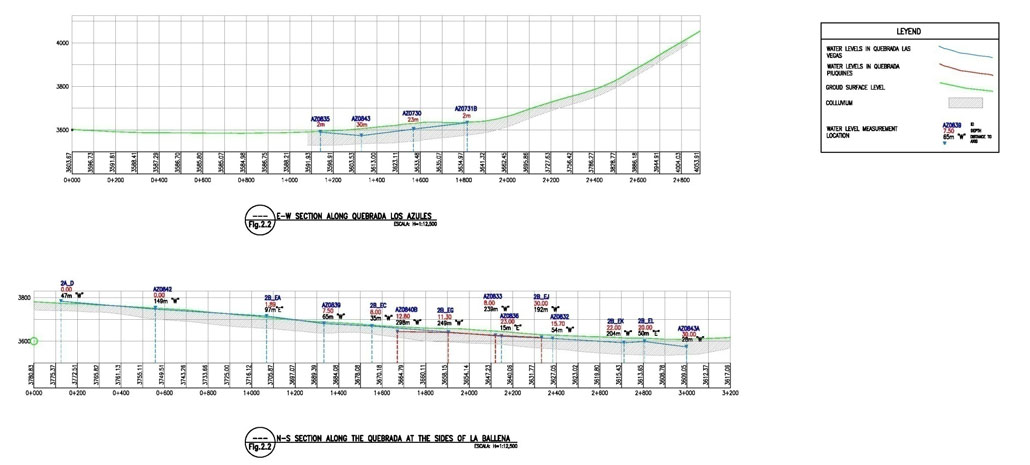
Figure 20.14 – Cross Section of Los Azules Site
Los Azules Preliminary Assessment Technical Report
SE Project No. 8019-01
177
If the fault systems that define and parallel the valley floors are high permeability zones, especially in comparison to less fractured bedrock along the valley sides, then the fault system may effectively act as a lateral drain, lowering water levels in the valley bottom. This direct interaction between faults and groundwater level may exist within drill hole AZ08040B where the Occidental fault, the only fault to cross La Ballena ridge between Quebrada Las Vegas and Quebrada Piuquines, intersects the Piuquines fault. The depth to water at this point (12.8 m) is greater than both its upslope neighbor (8 m) and its down slope neighbor (11.3 m), both of which do not intercept mapped fault structures.
Groundwater is found at ground surface in the bottom of the upper portion of Quebrada Las Vegas and this discharge creates a surface flow and supports vegetation along the quebrada bottom. However, in the lower portion of Quebrada Las Vegas groundwater is found at up to 20 or 30 m below ground surface, despite the presence of several small lakes. This indicates perched water conditions in this area.
Pit Dewatering
Given the highly fractured bedrock regime, large quantities of groundwater could be produced through pit dewatering. Based on an estimated permeability of 5 x 10⁻⁵ to 5 x 10⁻⁶ cm/sec, a specific yield (drainable porosity) of 0.005 to 0.01, and a radius of influence of 1.5 to 3 times the pit radius, a simple radial flow model of pit dewatering indicates that estimated groundwater inflow to the final open pit will be between 50 and 1,500 L/s. Field investigations will be required to determine expected pit inflows during mining.
20.2.6.3
Water Demands
The water demand for processing 100,000 metric tonnes of mineralized material daily through the concentrator throughout the proposed mine life at the Los Azules project was estimated using a water balance to be approximately 867 m3/hr (241 L/s). This includes both fresh water requirements and water reclaimed from the TSF, pit or WRDF (contact water). Water demand for mining operations can be grouped into two general areas:
·
Supporting infrastructure; and
·
Mineralized material processing and concentrate pipeline.
Infrastructure
Water demands for supporting infrastructures are outputs (sinks) in the site wide water balance and are estimated to be 27 m3/hr (2 m3/hr for mine camp and offices, 11 m3/hr for shops, 5 m3/hr for drilling and 9 m3/hr for dust control). These estimates, except drilling quantity, were provided by Samuel Engineering Inc. It has been assumed that this water will be recovered from fresh water sources such as groundwater recovery wells installed along Rio Salinas alluvial aquifer, downstream of the confluences, and not from the TSF or WRDF.
Los Azules Preliminary Assessment Technical Report
SE Project No. 8019-01
178
Mineralized Material Processing and Concentrate Pipeline
The water requirements for mineralized material processing and the concentrate pipeline are provided by:
·
Fresh water supply source(s);
·
Water from the TSF, pit or WRDF (contact water); and
·
Mineralized material moisture content.
The total water demand for mineralized material processing, assuming the mineralized material contains 5% water by weight, was estimated by Samuel Engineering to be 2,826 m3/hr (2,449 m3/hr general process water requirement, 56 m3/hr cooling systems, 117 m3/hr seal water, 111 m3/hr reagents, 2 m3/hr samplers/analyzers, 56 m3/hr labs, 30 m3/hr pipeline pump seal water, 5 m3/hr dust suppression). Excluding the general process water requirement, it has been assumed that the remaining demand of 377 m3/hr is to be recovered from fresh water sources (fresh process water).
Mineral is estimated to be 2% of gross mineralized material tonnage (100,000 tonnes/day) and mineral concentrate is planned to be piped to a port facility over 200 km from the site. The water demand for the concentrate pipeline of 80 m3/hr was estimated using a factor for gross daily mineralized material tonnage applied to a similar project.
The available reclaim water from the TSF was estimated using a spreadsheet water balance model. The TSF water balance is based on the following input parameters:
·
Average annual precipitation of 379.8 mm;
·
Mineralized material processing rate of 100,000 metric tonnes/day;
·
98% of plant tonnage reports as tailings;
·
80% of the tailings report to the TSF and 20% to the WRDF;
·
55% solids content by weight in tailings discharge;
·
In-place settled tailings porosity of 40%;
·
Annual evaporation of 1400 mm;
·
Total watershed area reporting to tailings of 1,350 ha (no runoff diversion); and
·
Total startup tailings area of 72.9 ha.
The water balance assumes that the TSF is used to manage seasonal variations in available reclaim water (no spillway discharge). Without supplementation the TSF water balance estimates that, for average rainfall, an average reclaim of 1,537 m3/hr will be available.
The resultant site wide annual water balance is summarized in Figure 20.15.
Los Azules Preliminary Assessment Technical Report
SE Project No. 8019-01
179
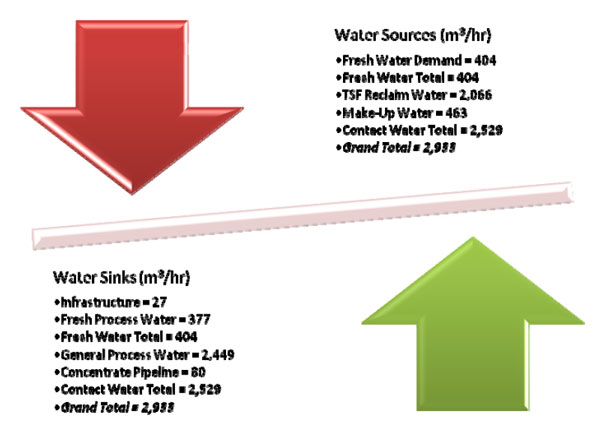
Figure 20.15 – Site Water Balance
The resultant average annual site wide fresh water demand is 404 m3/hr (112 L/s). The resultant average annual site wide contact make-up water demand is 992 m3/hr (275 L/s). The total water demand is estimated to be 1,396 m3/hr (388 L/s).
20.2.6.4
Water Sources
Excluding the TSF, potential sources for water demands and general project use include:
·
Groundwater from unconsolidated sediments along the Salinas River;
·
Groundwater inflows to the open pit;
·
Permeable fault zones in bedrock; and
·
Surface water flows from the Salinas River.
Pit dewatering estimates for the final open pit (Section 20.2.6.2) range from 50 to 1,500 L/s and therefore could potentially provide all or a significant part of the total contact make-up water demand of approximately 275 L/s. It is possible that, with treatment, pit water could be used to meet some or all of the fresh water demand of 112 L/s also. However, pit inflows could be lower during the initial stages of mining therefore alternative sources may be required, and treatment may not prove to be the most economical alternative for fresh water supply. Field investigations are required to enable a better estimate of bedrock and unconsolidated sediment yields and water quality.
Los Azules Preliminary Assessment Technical Report
SE Project No. 8019-01
180
As discussed previously in Section 9.2.1.1, the Salinas River valley is expected to contain a significant thickness of Quaternary sediments approximately 2 km to the west of the project site. It is assumed that these sediments will be very similar to those found in quebradas Los Azules, Las Vegas and Piuquines and will be generally coarse-grained and permeable. Based on an aquifer area of 800 m by 5 km and assuming a saturated aquifer thickness of 40 to 60 m with a specific yield (drainable porosity) of 0.2, the total groundwater storage would be about 30 to 50 million m3. This is equivalent to a total annual flow of 950 to 1,580 L/s.
The aquifer receives recharge from the Salinas River, direct recharge, and groundwater inflow from the valley sides. Direct recharge is roughly estimated at about 500,000 m3/yr to 1,000,000 m3/yr or an annual flow of about 16 to 32 L/s, so it is likely that pumping of the alluvial aquifer would reduce flow in the neighboring river. Individual wells could be expected to yield on the order of 5 to 20 L/s based on an estimated permeability of 10-3 cm/sec, so maximum supply from the aquifer is estimated to be on the order of 50 to 200 L/s. Additional testing would be required to evaluate aquifer thickness, permeability, and specific yield.
Surface water flow in the Salinas River or further downstream in the catchment basin could also be captured to provide water for mine operations. Surface water could be captured by pumping of the adjacent alluvial aquifer using an infiltration gallery or wells as has been done for other mining projects in Argentina.
No existing water rights are thought to be present at the altitudes at which the project exists, although downstream users may already have claim to the existing flow. To gain water rights a study of the downstream users would need to be carried out. Beginning in the year 2009 groundwater permitting requirements are going to be made the same as those for surface water.
Title VI: Articles 110 to 116 of Argentine law define the water rights regarding mining. The national mining authority has the first right to grant permissions of water use.
All seeps and artesian flow must be declared to the government within 20 days of their discovery within the project limits. Water concessions are granted for 5 years and can be extended as long as operations continue.
20.2.6.5
Summary
Based on the evaluation of water supply/demand requirements for the project, an annual average water supply of 1,396 m3/hr (388 L/s) is anticipated. Based on preliminary evaluations, it is possible that this demand could be met from pit dewatering and pumping of the alluvial aquifer in the Salinas River valley. A combination of these two supply sources is expected to be necessary during the initial years due to the possibility of lower pit dewatering volumes. Further studies are required to evaluate the amount of water supply that could be obtained from these two sources, support permitting of water rights, and evaluate any potential impacts on downstream users.
Los Azules Preliminary Assessment Technical Report
SE Project No. 8019-01
181
20.3
Reclamation and Mine Closure
A risk assessment and closure plan will be developed during future studies, in conjunction with development of post-closure sustainable land use strategies. Typical objectives of mine closure and rehabilitation activities include:
·
Protection of the environment, safety and public health by rehabilitating disturbed areas, returning them to stable conditions for future land use, compatible with conditions prior to the mine development;
·
Re-establish drainages and water access to nearby villages and towns, while fulfilling long-term quality and quantity objectives;
·
Revegetating the land, where appropriate, until a sustainable condition is achieved, using appropriate and native-plant species;
·
Mitigation of air quality impacts;
·
Mitigation of the need for long term, active care and maintenance of the site;
·
Meet, or exceed, local and international closure requirements; and
·
Transfer of infrastructure to the benefit of local communities.
It is not possible to prescribe detailed reclamation and closure measures at this stage, however, some typical approaches adopted to mitigate environmental impacts for similar projects include:
·
Stabilizing the walls of the open pit, developing a pit lake, providing overflow drainage and covering Acid Rock Drainage (“ARD”) generation sections of the mine wall in limestone – during development of the pit lake which may take several years, lime treatment of the pit water may be required to manage any ARD generation;
·
Tailings deposition will be managed prior to closure so that the tailings surface landform will be free draining – this approach is driven by relatively low rainfall and high evaporation rates that would make long term establishment of a pond over the TSF (and subsequently maintain saturation of any ARD producing materials in the tailings) unlikely;
·
When tailings deposition ceases, the decant pond will be drained, the tailings liquor treated prior to discharge, the surface of tailings will be allowed to dry and gain strength, and then the surface of the tailings will be covered - the final tailings profile could be managed and shaped to promote flow paths along the western edge of the closed TSF (without significant tailings rehandling) and downstream to the Rio Salinas via a post-closure spillway;
·
The downstream face of the TSF embankment will be treated as necessary to manage stability and erosion, and inspections undertaken to monitor for any signs of instability;
·
Final slopes of the WRDF, topsoil and unsuitable material stockpiles are shaped to stable and free draining slopes to facilitate installation of a cover system and revegetation where appropriate - progressive rehabilitation promoted on final surfaces during operations;
·
Surface water and groundwater monitoring will be carried out at locations around the TSF and WRDF during post-closure to demonstrate performance of the closure strategies;
Los Azules Preliminary Assessment Technical Report
SE Project No. 8019-01
182
·
Decommissioning, demolition and removal of plant, pipelines, conveyors and buildings, regrading or covering of disturbed areas, and revegetation where appropriate;
·
All haul roads will be ripped to alleviate compaction, revegetated where appropriate, and culverts will be decommissioned;
·
Assuming it provides benefit to local communities, the Mine Access Road will not be decommissioned.
·
Closure planning should identify materials that should be stockpiled during construction activities, for closure and progressive closure construction of cover systems. For the PA Vector utilized similar size project and mineralization to develop a preliminary closure cost estimate. The cost estimate is based on scaling project facility to other similar project facilities with known costs. This estimate is sufficient for this level of study. As discussed above a more detailed understanding of the facilities and their potential impact is required to develop a comprehensive closure plan and close estimate that can be developed in future phases.
20.4
Seismicity
Although general seismic design parameters, based on past projects, were incorporated into the design of the TSF and WRDF the Maximum Design Earthquake (“MDE”) and stability analyses for these facilities were not performed for this level of study. However, a summary of the regional seismicity is presented below. The Los Azules project is located in the Andes, near the border with Chile, in one of the most seismically active regions on Earth, part of the Circum-Pacific Belt. The large scale regional tectonic framework is governed by the interaction of the Nazca and South American plates. The main tectonic features in this region, namely the Andes and the Peru-Chile Oceanic trench, are related to the high seismic activity, and are a result of the two converging plates. The most notable result of this collision is the contemporary orogenic process constituted by the Andes formation.
In the region of the project, big earthquakes have occurred in the past, most associated with the subduction mechanism. One of the most severe earthquakes, magnitude 8.5, occurred on November 11, 1922 in the southern part of Atacama Province in central Chile, northwest of the neighboring Argentinean province of San Juan. Locally in Chile, the tsunami caused extensive damage at Coquimbo (refer to Figure 20.16). Several hundred lives were lost with enormous property damage. The period of oscillations was 20 minutes, and the height of the tsunami was 2.1 m.
Los Azules Preliminary Assessment Technical Report
SE Project No. 8019-01
183
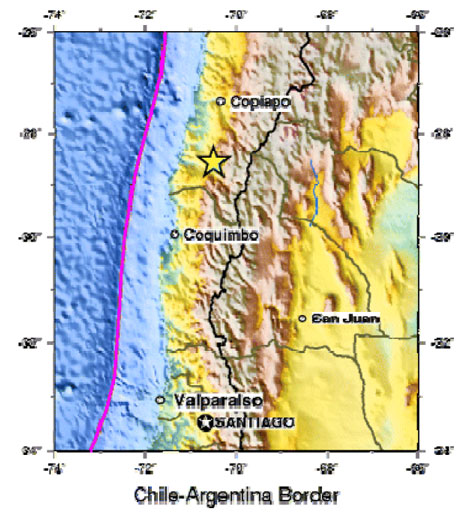
Figure 20.16 – Location of the 1992 Earthquake Epicenter
The greatest magnitude earthquake (8 in Richter scale) in the history of Argentina occurred on October 27, 1894 with an epicenter northwest of the San Juan province. However, the most destructive earthquake occurred on March 20, 1861 in Mendoza, causing the death of 6,000 people from a population of 18,000. More recently, the January 15, 1944 earthquake destroyed the city of San Juan, killing 10,000 people.
The seismic zonation of Argentina (INPRES), has divided the territory in five zones, where the highest seismicity is concentrated in the northwest and centralwest sections of the country, involving the Mendoza and San Juan provinces. The Los Azules project is located in the San Juan province, near the border with Chile.
According to the seismic hazard map of USGS for Chile and Argentina, for the location of the Los Azules project, approximately at 31.23º South Latitude and 70.23º West Longitude, the peak ground acceleration for a 475-year return period event, which corresponds to a 10% probability of exceedance in a 50 year time period, is in the range of 0.33g to 0.41g (Refer to Figure 20.17).
Considering the high seismicity observed in the project area, it is recommended that a site-specific seismic hazard study be performed (for use in designing facilities) that includes a review of the historical and instrumental seismicity, the regional tectonic features and the definition of seismic sources with their respective recurrence.
Los Azules Preliminary Assessment Technical Report
SE Project No. 8019-01
184
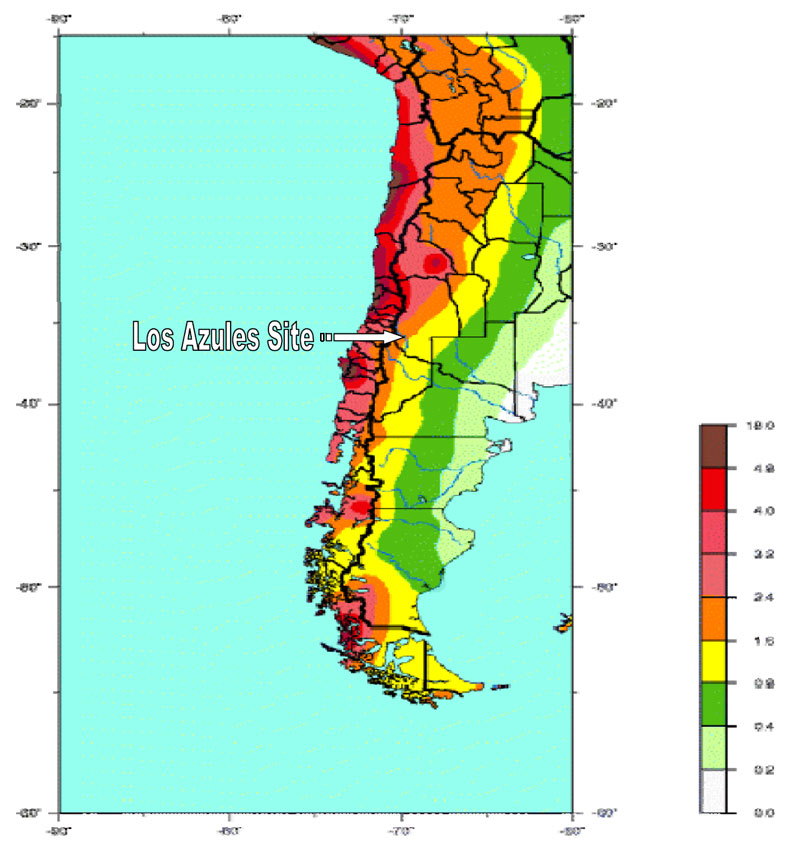
Figure 20.17 – Western Argentina Seismic Hazard Map (Peak Ground Acceleration in m/s2 with 10% Probability of Exceedance in 50 Years)
Los Azules Preliminary Assessment Technical Report
SE Project No. 8019-01
185
20.5
Recoveries
Refer to Section 18.2.4.2 for information regarding metal recoveries.
20.6
Markets
MTB engaged H&H Metals Corp. (H&H) of White Plains, New York to conduct a market study for the Los Azules Project concentrate. China is the assumed destination for the concentrate. At the time of the study, the world economy was contracting and metals prices along with shipping and concentrate treatment charges were declining, as reflected in the predictions.
SE provided H&H with a LOM production schedule and laboratory analysis for copper concentrate. H&H was advised that Coquimbo, Peru would be the loadout port. Freight rates to a main Chinese port utilizing Handymax vessels would be $55/wmt with the existing 600-tph loadout capability at Coquimbo and $60.00/bbl oil.
H&H predicted metals prices of $1.70/lb copper, $750/oz gold and $12/oz silver for 2011-2015. Other current market projections were also reviewed for input to the economic evaluation, and LOM average prices of $1.90/lb copper, $750/oz gold and $12/oz silver have been used.
H&H estimated concentrate treatment and copper refining charges at $70/t and $0.075/lb respectively. These terms have been used for the LOM average charges in the economic evaluation. Los Azules concentrate is described as a clean concentrate that contains less than the 0.25% arsenic content that triggers a penalty, and no other elements at a level that would be penalized. Payment terms are typically 90-95% upon arrival at destination.
20.7
Contracts
To the best knowledge of Samuel Engineering at this time, Minera Andes, Inc. has not entered into any contracts for its potential concentrate products.
20.8
Capital Costs
20.8.1
Objective and Summary
Samuel Engineering (“SE”) developed a scoping level capital cost estimate for the metallurgical process and associated facilities for the Los Azules Project. A greenfield plant capable of processing 100,000 metric tonnes per day (“mtpd”) of copper-bearing material. The key objectives of the scoping study estimate and overall study are to:
·
Assess the economic evaluation of the project (rough order of magnitude);
·
Support the identification and assessment of the processes and facilities that will provide the most favorable return on investment;
·
Provide guidance and direction for the next phase of more detailed studies; and
·
Assist with raising funds for further project development.
Los Azules Preliminary Assessment Technical Report
SE Project No. 8019-01
186
The estimated capital cost to design, procure, construct and commission Los Azules processing facilities is approximately $2.75B. This preproduction cost estimate is summarized in Table 20.12:
| |
Table 20.12
Preproduction Capital Cost Estimate Summary |
Area | Cost ($000’s) |
Contracted Direct Costs: | |
0100: Mine Facilities | 31,332 |
0200: Crushing, Conveying & Reclaim | 111,870 |
0300: Grinding & Concentrating | 318,141 |
0400: Tailings | 68,487 |
0500: Concentrate Filtration & Loadout | 144,357 |
0600: Port Concentrate Handling Facilities | 81,687 |
0700: Utilities | 49,229 |
0810: Site Access Road | 44,688 |
0820: Powerline | 133,364 |
0900: General Site & Ancillary Buildings | 135,160 |
Total Contracted Direct Costs: | 1,118,315 |
Contracted Indirect Costs: | |
1200: Construction Indirects | 263,973 |
1300: EPCM | 166,262 |
1400: Construction & Start-Up Support | 19,217 |
1500: Spare Parts & Initial Fills | 36,881 |
Total Contracted Indirect Costs: | 486,333 |
Total Contracted Costs: | 1,604,649 |
Owner’s Cost: | |
2000: Owner’s Direct Cost | 396,362 |
2000: Owner’s Indirect Cost | 205,366 |
Total Owner’s Costs: | 601,728 |
Subtotal Capital Costs: | 2,206,376 |
Additional Costs: | |
9510: Freight, Duties & Taxes | 119,628 |
9800: Contingency | 421,630 |
Total Additional Costs: | 541,258 |
Total Preproduction Capital Cost: | 2,747,634 |
Los Azules Preliminary Assessment Technical Report
SE Project No. 8019-01
187
20.8.2
Accuracy
The accuracy target for this capital cost estimate is intended to be plus or minus 35%. Most of the costs have been derived using a recently completed estimate for a similar plant, located in the Peruvian Andes, and making adjustment for project specific requirements and differences.
The estimate is not sufficient for final decision making. However, it will help to further evaluate the project’s viability with respect to capital cost by establishing parameters from which further financial analysis and courses of action can be based.
20.8.3
Currency
The costs presented in this document are based on an estimate prepared in the third quarter of 2008. And while it appears there may be some decline in the cost of materials and components for construction in the fourth quarter, there is currently little data available to quantify any change. Furthermore, the prices for construction materials had been rising thru September. The “Producer Price Index (US) for materials and components for construction climbed 16.9-percent SAAR for the 3 months ended in September...”
However, because of the large number of South American mining projects currently underway, there is upward pressure on construction services costs due to competition for competent skilled labor by construction companies, over-booked fabrication shops and over-booked EPCM companies.
Therefore, no adjustment, either up or down, has been made for costs between third and fourth quarter 2008, and no provision has been included to offset future escalation. The estimate is expressed in United States dollars.
Where source information was provided in other currencies, these amounts have been converted at rates shown in Figure 20.18.
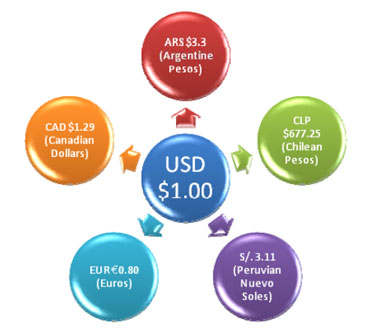
Figure 20.18 – Foreign Currency Conversion Rates
Los Azules Preliminary Assessment Technical Report
SE Project No. 8019-01
188
Since US Dollars were used in the base estimate, no adjustment has been made to convert from Peruvian to Argentine Pesos.
The rate of foreign currency exchange could have a serious impact on the value of labor and materials obtained in the local market (including freight, duties, and taxes). In addition, the value of the dollar against other world currencies could also influence future project cost if equipment is purchased in Europe or elsewhere. No funds have been allocated in the estimate to offset potential future currency fluctuations.
20.8.4
Scope
The scope of facilities addressed by the estimate are those relating to the development of the mine, concentrator facilities, on-site ancillary facilities and infrastructure, off-site infrastructure (access roads, concentrate pipeline, handling facilities, and power lines), tailings impoundment and owner’s cost.
The estimate is based on the scope of work as outlined in the facilities description and Work Breakdown Structure (“WBS”) included herein, and as defined by the following:
·
Process design criteria;
·
Simplified process flow diagram;
·
Preliminary equipment list;
·
Plot plans and general arrangement (“GA”) drawing; and
·
In-house historical data and published database information.
Supporting data for the capital cost estimate was provided by WLR Consulting, Inc. (“WLR”) who provided costs for the mining equipment as well as the pre-production mining; and Vector Peru S.A. which provided costs for the tailings storage facility (“TSF”), waste rock disposal facility (“WRDF”), and access road.
20.8.5
Exclusions
Items not included in the capital estimate are:
·
Sunk costs;
·
Exploration cost;
·
Permitting cost;
·
License and royalty fees;
·
Allowance for special incentives (schedule, safety, etc);
·
Demolition of existing facilities;
·
Disposal / clean-up of hazardous materials;
·
Escalation beyond fourth-quarter 2008;
·
Value Added Tax (“VAT” or “IGV”);
·
Foreign currency exchange rate fluctuations;
·
Interest;
·
Financing cost; and
·
Risk due to political upheaval, government policy changes, labor disputes, permitting delays, weather delays or any other force majeure occurrences.
Los Azules Preliminary Assessment Technical Report
SE Project No. 8019-01
189
20.8.6
Estimating Methodology
20.8.6.1
Direct Costs
The capital cost estimate for the facilities has been derived by applying stochastic estimating methods (including capacity factoring, Lang factors and parametric models) to a better defined cost estimate of a similar facility.
The estimate being used for the basis of comparison is from a feasibility study prepared in September 2008 for a 90,000 MTPD copper concentrator located at high altitude in Perú.
Adjustments and factors have been applied to the comparable estimate for project specific requirements and differences between the base project and Los Azules, and include:
1.
All Areas: Adjust plant capacity to 100,000 MTPD (versus 90,000 MTPD)
2.
All Areas: Adjust for a colder climate at 31 degrees latitude (versus 7 degrees)
3.
WBS 0111: Customize the initial mine haul road cost for Los Azules
4.
WBS 0160: Add cost for a waste rock disposal facility at Los Azules
5.
WBS 0181: Enlarge truckshop to accommodate 228T haul trucks (versus 186T)
6.
WBS 0181: Enlarge truckshop to accommodate larger fleet of trucks
7.
WBS 0181a: Add an allowance for an indoor truck tire shop
8.
WBS 0210: Shorten coarse ore conveyor (CV-001); 1.1 km vs 1.8 km
9.
WBS 0220: Lengthen coarse ore conveyor (CV-002); 2.6 km vs 0.98 km
10.
WBS 0220a: Add coarse ore conveyor (CV-003); 1.9 km
11.
WBS 0240: Remove 2-reclaim feeders and associated chutes
12.
WBS 0315: Remove 2-pebble transfer conveyors and associated chutes
13.
WBS 0320: Reduce quantity of rougher cells; add scavenger cells; increase quantity of cleaner columns, and add 3rd stage cleaner columns
14.
WBS 0330: Add 2-regrind mills and associated recycle pumps
15.
WBS 0340: Remove the molybdenum circuit
16.
WBS 0360: Remove the molybdenum circuit
17.
WBS 0370: Remove NaSH system
18.
WBS 0370: Remove the nitrogen generator
19.
WBS 0370: Remove collector
20.
WBS 0370: Remove NaCN system
21.
WBS 0410: Revise 2-tailings thickeners to 80 m dia. (capacity factor only)
22.
WBS 0440: Customize TSF for Los Azules site (Option 3 adopted)
23.
WBS 0460: Remove 3rd stage reclaim water pumps
24.
WBS 0510: Revise Cu concentrate thickener to 45 m dia (capacity factor only)
25.
WBS 0530: Adjust concentrate pipeline length to 230 km (versus 200 km)
26.
WBS 0640: Add a 24 km waste water pipeline to evaporation ponds
27.
WBS 0711: Replace a fresh water supply river dam with 4-drilled wells
28.
WBS 0713: Remove 15-fresh water supply pumps
29.
WBS 0713: Adjust fresh water pipeline from 16 km to 11 km
30.
WBS 0810: Customize access road for Los Azules (Villa Nuevo route adopted)
31.
WBS 0820: Add substations and 390 km of O/H lines for incoming 220 kV power.
32.
WBS 0725: Add allowance for insulation and heat tracing at higher latitude/altitude.
33.
WBS 1440: Adjust power cost to 7¢/kW-hr (vs 5.89¢/kW-hr)
34.
WBS 2010: Customize mining equipment needs for Los Azules
35.
WBS 2015: Customize preproduction mine development for Los Azules
Los Azules Preliminary Assessment Technical Report
SE Project No. 8019-01
190
In plant areas where equipment changes (additions/deletions) from the base estimate have been identified, the equipment values have been modified accordingly and the total new cost for mechanical equipment was then used for developing the remaining direct costs for the facility using the same ratios from the original estimate.
20.8.6.2
Contracted Indirect Costs
In general, indirect costs are based on either the mechanical equipment cost or the total direct cost depending upon which is most appropriate. Percentages from the base project have again been re-applied to the revised Los Azules numbers to develop reasonable values for the following:
Contractor Indirects
Contractor indirects include mancamp, construction equipment, supervision, safety, subsistence, temporary facilities, warehousing, mob/demob, surveying, quality assurance, weather protection, waste removal, cleanup, temporary utilities, bonds, insurances, vehicles and maintenance.
Contractor indirect costs have been adjusted for Los Azules by using the same percentages as the original estimate based on the adjustments made to the direct costs.
EPCM Services
Engineering, procurement and construction management services for the process plant, concentrate pipeline, tailings dam and access roads have been updated using the same percentages as the baseline estimate, incorporating the adjustments made to the direct costs.
EPCM for the powerline is assumed to be included with the powerline cost in (WBS 820) and EPCM for the port is assumed to be included with the allowance for the port (WBS 630).
Construction and Start-up Support
Start-up support services include vendor representatives, pre-operations testing, commissioning support and start-up power required prior to operations.
Vendor representative assistance for both start-up and commissioning is included for equipment installation and start-up supervision for specialized equipment.
In addition to vendor reps, pre-commissioning and commissioning services will be required to start-up the plant; there will be process, mechanical and electrical supervision, craft labor and utility power required for start-up.
All support costs have been adjusted based on plant capacity alone except for the power cost which has also been adjusted for the cost per kilowatt-hour ($0.0589/kw-hr to $0.07/kw-hr).
Los Azules Preliminary Assessment Technical Report
SE Project No. 8019-01
191
Spare Parts and Initial Fills
An allowance has been made for spare parts required for start-up and commissioning of the project, as well as first year spares and critical uninstalled spare pumps (capital spares are not included).
Initial fills for the concentrator include grinding media for the mills, flocculent and other reagents, water treatment chemicals, and lubricants. The cost has been adjusted for the slightly larger plant based simply on capacity.
20.8.6.3
Owner’s Costs
Mining equipment and pre-production mine development capital costs have been provided by WLR. The costs have been built-up from prestripping tonnages and the equipment fleet and manpower required for the mining operations. Budgetary and historical pricing has been applied to an equipment fleet schedule as well as to a unit operations schedule to obtain total cost.
Some project specific adjustments have been made for land acquisition and right-of way costs (WBS 2170). The minesite and plantsite area land purchase is based on the factors used for the slightly larger plant. But the right-of way costs for the access road, powerline, concentrate pipeline and fresh water pipeline are all based on the ratio of the old length versus the new lengths.
All other Owners’ costs have been adjusted using the same percentage of project direct costs that were observed in the base estimate.
20.8.6.4
Freight, Duties & Taxes
The value of freight and import duties for the delivery of equipment and materials to the jobsite is based on a percentage of direct cost.
Freight cost includes export packaging, inland freight to port of export, ocean freight, port charges, customs agent fees, customs warehouse charges, border crossings and inland freight to site.
Some material and equipment can be purchased in-country while others will be purchased outside of Argentina (Chile, Brazil, Peru or off-shore) resulting in additional duties and charges. Import duties of 5%-12% will be charged on any goods imported into the country. This range is similar to import duties charged in Peru. Therefore the same overall percentage as that seen on the baseline project for freight and duties has been applied.
Los Azules Preliminary Assessment Technical Report
SE Project No. 8019-01
192
20.8.6.5
Value Added Tax
VAT is Argentina’s main consumption tax, which is levied at a rate of 21% on most goods and services. The same general rate applies to imports, habitual or otherwise, made by any individual or legal entity.
Exporters are exempt from VAT and are entitled to reimbursement of VAT on purchases of goods and services that they use as part of their export activity. In the case of acquisitions of fixed assets, there is also a mechanism for recovering the tax credit.
Since VAT is recoverable, it has not been included in the capital cost estimate, however, it will affect cashflow. Since the economic model is a before-tax determination, VAT has not been considered.
The tax system in Argentina is complex and subject to frequent changes. The Owner should engage a tax expert to review the Project at the earliest stage possible and identify the best methods of conducting business to minimize tax exposure.
20.8.6.6
Contingency
Contingency has been allocated on an area-by-area basis using the best judgment of the project team (who was also familiar with the development and content of the base case estimate). The overall average contingency of 18.2% of the direct and indirect cost subtotal in recognition of the degree of detail on which the costs are based.
Contingency is an allowance included in the capital cost to cover unforeseeable costs within the project’s scope of work, but which cannot be explicitly defined or described at the time of the estimate due to lack of information. It is assumed that contingency will be spent; however it is not intended to cover scope changes or project exclusions.
20.8.7
General Risk Factors
In recent weeks, the world’s business environment has changed substantially and continues to change rapidly. Many factors are currently evolving that will no doubt have an impact, one way or another, on Los Azules, including:
·
extreme commodity price volatility;
·
global inflation;
·
shrunken industry suppliers;
·
a growing shortage of skilled labor;
·
overloaded EPCM firms;
·
quick currency exchange rate swings;
·
project cancellations;
·
mass portfolio liquidations; and
·
limited access to capital.
Given the current volatility in the marketplace, there may be cost saving opportunities to be had by remaining flexible on the schedule and execution plan.
Los Azules Preliminary Assessment Technical Report
SE Project No. 8019-01
193
While some factors (such as commodity price volatility) may have a positive effect on capital and operating cost, it could at the same time, have a detrimental effect on the sale price of products, and thereby negating any benefit over the life of the Project. All ramifications need to be assessed.
The current volatility in the rates of foreign currency exchange could also have a serious impact on the value of labor and materials (including freight, duties and taxes). No additional funds have been allocated in the estimate to offset any currency fluctuations.
Other potential risks include government policy changes, labor disputes, permitting delays, weather delays or any other force majeure occurrences.
No allowance is made in the capital cost for any of the risk items discussed.
Please note that the costs provided herein are dependent upon the various underlying assumptions, inclusions, and exclusions utilized in developing them. Actual costs differ, and can be significantly affected by factors such as changes in the external environment, the manner in which the project is implemented, and other factors which impact the estimate basis or otherwise affect the project. Accuracy ranges are only projections based upon cost estimating methods and are not a guarantee of actual project costs.
20.8.8
Estimate Cost by Area
The estimate by cost center as defined by the Project Work Breakdown Structure is shown in Figure 26.8, Figure 26.9, and Figure 26.10.
20.9
Operating Costs
20.9.1
Mining Costs
Los Azules mining cost estimates are in third quarter 2008 U.S. dollars and exclude taxes and duties. No inflationary escalation factors have been applied to the cost projections beyond this time frame. All cost estimates for this preliminary assessment should be considered scoping level in accuracy (i.e., ±30-40%).
20.9.1.1
Mine Capital Estimates
Mine equipment unit prices were derived from recent (2008) vendor quotations for a similarly sized project in South America and include provisions for freight, insurance and assembly. Sustaining capital was also included in the estimates, accounting for fleet expansions where necessary and replacements of aging units. Costs were estimated for ancillary equipment, which includes: explosives storage and handling, small excavating and transport equipment, a portable aggregate crushing and screening plant, electric power servicing trucks, all-terrain cranes, fuel/lube trucks, mechanic field trucks, tire handling equipment, forklifts, light plants and assorted light vehicles. Allowances were made for shop equipment, pit water handling systems, a truck dispatch system, radio communications, office equipment and software, initial mine haul road construction, spare parts and supplies inventories, contingency and salvage value at the end of mining.
Los Azules Preliminary Assessment Technical Report
SE Project No. 8019-01
194
Table 20.13 summarizes the mine capital expenditures over the life of the Los Azules project, including the preproduction stripping costs for 150 million tonnes of material.
| |
Table 20.13
Summary of Mine Capital Expenditures |
Cost Description | US $ (000) |
Initial equipment purchases (until mill startup) | 231,000 |
Initial mine haul road construction | 10,000 |
Preproduction stripping | 155,000 |
Spares inventory | 14,000 |
Contingency | 20,000 |
Sustaining equipment purchases (LOM) | 337,000 |
Spares recovery and equipment salvage | (36,000) |
Total Mine Capital | 731,000 |
Mine capital expenditures through the preproduction development period are projected at $429 million. This excludes working capital for mine operations.
The above capital costs exclude the truck shop, wash barn, tire shop, fuel and lubricant storage and pumping systems, mine offices, pit dewatering and power distribution systems. These are included in the mine facilities capital estimates presented in Section 20.8 of this report.
20.9.1.2
Mine Operating Cost Estimates
Los Azules mine operating cost estimates cover: pit operations (i.e., drilling, blasting, loading and hauling); placement of waste rock in tailings dam and the WRSF; spreading and compaction of tailings dam fills; construction of internal haul roads, sumps and safety berms; maintenance of all mine roads and safety berms; operating and maintenance labor; mine department supervision and technical services; crushing waste rock to supply aggregate for road surfacing and blasthole stemming; and other earthworks as may be required for day to day mining operations. Exploration costs are not included in the operating cost estimates presented in this section. The mine production schedule presented in Table 20.2 and equipment unit productivity estimates were used to calculate operating shifts and manpower requirements, which in turn were used to derive mine operating costs.
Unit operating costs for major equipment incorporate vendor estimates of fuel and lubricant consumption. Up-to-date industry cost estimation guides (InfoMine’s Mining Cost Service and Equipment Watch’s Cost Reference Guide) and industry contacts, were used to estimate hourly operating costs, which were subsequently adjusted for local labor rates and supply costs. The mining cost estimates were based on energy prices of $0.80/liter for diesel fuel, $0.070/kWh for electric power and $0.67/kg for ammonium nitrate prills (in bulk).
Mine operating and maintenance labor rates range between $5.80 and $7.91 per hour, which are commensurate with similar South American operations. Fringe benefits were estimated at 53% of the base labor costs. Overtime, paid at 1.5 times the base rate, was projected at 5% and 10% for operating and maintenance personnel, respectively.
Los Azules Preliminary Assessment Technical Report
SE Project No. 8019-01
195
Over the life of the project, mine operating costs for Los Azules are projected at $2.37 billion, typically averaging from $103 million to $113 million per year. This equates to about $1.20 per tonne of material mined. Approximately 50% of the total mining cost would be for haulage.
20.9.2
Process and G&A Costs
Labor costs were estimated by first developing a manpower schedule for salaried personnel and operating and maintenance personnel in the manner of a typical South American mining operation. Current labor rates were obtained from Argentina.
Power costs were determined first by estimating the running time and power draw for equipment on the mechanical equipment list. A cost of $0.070 per kWh was then applied, which represents the cost both for the power generation and transmission. An allowance was also included for associated electrical power requirements for infrastructure and ancillary facilities.
The Plenge metallurgical test report identified the reagent consumption for the two mineralized material composites. All reagent consumptions except lime were reduced to 65% of the lab quantities. Grinding steel consumptions are based on historical data. Consumable costs are based on current South American information and have been fully burdened with freight, duties and taxes.
An estimate of maintenance supplies was made by adding 5% to the operating costs. Miscellaneous operating supplies (fuel, lubricants, etc.) were estimated by applying a one percent factor to the operating costs.
Other G&A estimates were factored from a recent Peruvian feasibility study for a similar copper project.
20.10
Economic Analysis
20.10.1
Introduction
SE has prepared a pro forma cash flow (Figure 26.11) using conventional methodology as follows:
·
unleveraged 100% equity basis (no project financing or debt);
·
stand-alone project basis;
·
no export retentions;
·
before-tax determination of project economics;
·
annual cash flows discounted on end of year basis;
·
costs in third quarter 2008 U.S. Dollars (US$); and
·
no employee profit sharing.
Technical and cost inputs for the economic model were provided to SE by MTB.
Los Azules Preliminary Assessment Technical Report
SE Project No. 8019-01
196
The Los Azules Project is at the exploration stage of investigation; consequently, this study is at the scoping level of accuracy, preliminary in nature, and includes inferred mineral resources in the conceptual mine plan and the mine production schedule. Inferred mineral resources are considered too speculative geologically to have the economic considerations applied to them that would enable them to be categorized as mineral reserves under the standards set forth in NI 43-101. There is no certainty that the preliminary assessment will be realized.
20.10.2
Model Inputs
SE’s technical-economic inputs are summarized in the following sections.
20.10.2.1
General Criteria
General parameters used in the economic analysis are shown in Table 20.14. The analysis is based on third quarter 2008 US$. The preproduction period is estimated at four years including one year for preparation of a feasibility study and three years for project development and construction.
| |
Table 20.14
Production, Metal Prices, Royalties and Smelting-Refining (“TC-RC”) Terms |
Parameter | Data |
General |
Estimate Basis | Third quarter 2008 |
Preproduction Period | Three years |
Mine Production Life | 23.6 years |
Inferred Mineral Resources (Contained within Designed Pit) | 842,894,000 t |
Annual Mineralized Material Production Capacity | 36,000,000 t |
Market Prices |
Copper Price | $1.90/lb |
Gold Price | $750.00/oz |
Silver Price | $12.00/oz |
Royalties |
San Juan Province | 3.00% |
Transportation, Smelting, and Refining Charges and Terms |
Copper Concentrate Transportation – Ocean Shipping | $55/wmt Cu conc. |
Copper Concentrate Treatment Charge | $70/dmt conc. |
Copper Refining Charge | $0.075/lb (payable) |
Gold Refining Charge | $5.00/oz (payable) |
Silver Refining Charge | $0.45/oz (payable) |
Copper Payfor | 96.5% |
Gold Payfor (net of deductions) | 54.9% |
Silver Payfor (net of deductions) | 59.4% |
Los Azules Preliminary Assessment Technical Report
SE Project No. 8019-01
197
20.10.2.2
Concentrate Productions and Payable Metals
Table 20.15 summarizes the life-of-mine (“LoM”) concentrate productions and payable metals.
| | |
Table 20.15
Concentrate Productions & Payable Metals |
Description | Units | Value |
Copper Concentrate |
Copper Concentrate | t | 12,542,753 |
Copper Concentrate Grade | % | 31.9 |
Contained Copper | t | 4,002,595 |
Gold Content | g/t | 2.22 |
Contained Gold | oz | 895,231 |
Silver Content | g/t | 74.0 |
Contained Silver | oz | 29,827,136 |
Payable Metals |
Copper | t | 3,856,672 |
Gold | oz | 491,233 |
Silver | oz | 17,702,746 |
The Los Azules Project is at the exploration stage of investigation; consequently, this study is at the scoping level of accuracy, preliminary in nature, and includes inferred mineral resources in the conceptual mine plan and the mine production schedule. Inferred mineral resources are considered too speculative geologically to have the economic considerations applied to them that would enable them to be categorized as mineral reserves under the standards set forth in NI 43-101. There is no certainty that the preliminary assessment will be realized. |
Los Azules Preliminary Assessment Technical Report
SE Project No. 8019-01
198
20.10.2.3
Capital Costs
The total capital cost is estimated at $3.49B, being comprised of $2.75B during preproduction, $39.0M for working capital, and $704M in sustaining capital over the LoM. Table 20.16 summarizes the LoM capital cost.
| | |
Table 20.16
LoM Capital Cost Summary |
Description | Units | LoM Cost |
Mine Area Facilities | $000s | 31,332 |
Mineralized Material Storage, Handling and Crushing | $000s | 111,870 |
Grinding and Concentrating | $000s | 318,141 |
Tailings | $000s | 68,487 |
Concentrate Transport | $000s | 144,357 |
Port Concentrate Handling Facilities | $000s | 81,687 |
Utilities | $000s | 49,229 |
Off-site Infrastructure | $000s | 178,052 |
Site Development | $000s | 135,160 |
Contracted Indirects | $000s | 486,333 |
Owner Directs | $000s | 414,758 |
Owner Indirects | $000s | 186,970 |
Freight, Duties & Taxes | $000s | 119,628 |
Contingency | $000s | 421,630 |
Total Preproduction Capital | $000s | 2,747,634 |
Sustaining | $000s | 703,549 |
Working Capital | $000s | 39,021 |
Total LoM Capital | $000s | 3,490,204 |
Los Azules Preliminary Assessment Technical Report
SE Project No. 8019-01
199
20.10.2.4
Operating Costs
The total LoM operating cost is estimated at $6.40 billion, or $7.59/t mineralized material as summarized in Table 20.17. Figure 20.19 shows the percentage of each LoM operating cost component.
| | |
Table 20.17
LoM Operating Cost Summary |
Description | LoM Cost ($000s) | LoM Cost/t Mineralized Material ($) |
Mining | 2,367,702 | 2.81 |
Processing | 3,308,494 | 3.92 |
General & Administrative | 603,857 | 0.72 |
Mine Reclamation / Closure | 116,106 | 0.14 |
LoM Operating Cost | 6,396,159 | 7.59 |
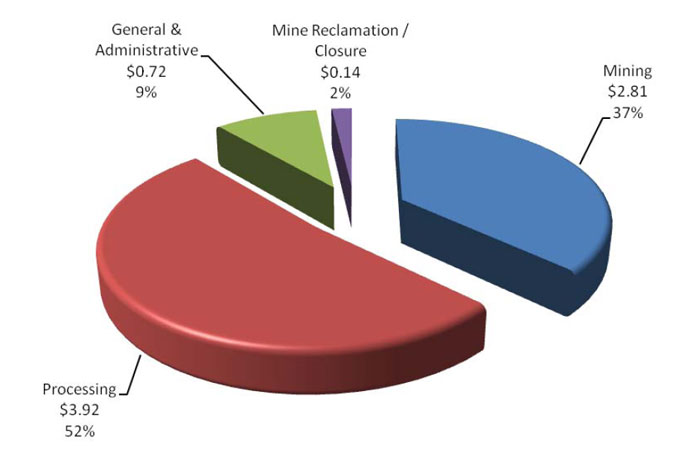
Figure 20.19 – LoM Operating Costs per Tonne Mineralized Material
Los Azules Preliminary Assessment Technical Report
SE Project No. 8019-01
200
20.10.2.5
C1 Cash Costs
C1 cash costs are shown in Figure 20.20.
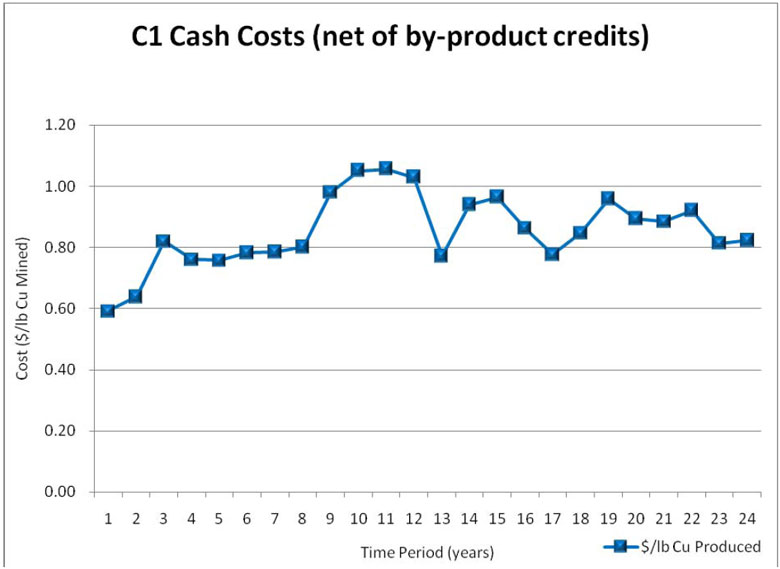
Figure 20.20 – C1 Cash Costs (Net of By-Product Credits)
Los Azules Preliminary Assessment Technical Report
SE Project No. 8019-01
201
20.10.2.6
Technical Economic Results
The project’s LoM cash flow results are summarized in Table 20.18. The Los Azules project is at the exploration stage of investigation; consequently, this study is at the scoping level of accuracy, preliminary in nature, and includes inferred mineral resources in the conceptual mine plan and the mine production schedule. Inferred mineral resources are considered too speculative geologically to have the economic considerations applied to them that would enable them to be categorized as mineral reserves under the standards set forth in Canadian National Instrument 43-101. There is no certainty that the preliminary assessment will be realized.
| | |
Table 20.18
Project Economic Summary |
Description | Units | Value |
Gross Revenue | $000s | 16,735,615 |
Less Transportation, TC and RC Costs | $000s | (2,269,825) |
Net Smelter Return | $000s | 14,465,790 |
Less Royalties & Retentions | $000s | 0 |
Gross Income from Mining | $000s | 14,465,790 |
Less Operating Costs | $000s | (6,396,159) |
Net Profit Before Depreciation/Amortization | $000s | 8,069,631 |
Less Depreciation/Amortization | $000s | (3,451,183) |
Less Net Profits Royalty | $000s | 0 |
Net Profit Before Taxes | $000s | 4,618,447 |
Plus Add-back Non-Cash Depreciation/Amortization | $000s | 3,451,183 |
Less Capital Costs | $000s | (3,451,183) |
Less Working Capital | $000s | (39,021) |
Plus Recapture Working Capital/Spares/First Fills | $000s | 75,902 |
Plus Salvage Value | $000s | 35,992 |
Cash Flow | $000s | 4,691,321 |
IRR | % | 10.8 |
NPV @ 5% | $000s | 1,398,569 |
NPV @ 8% | $000s | 496,036 |
NPV @ 10% | $000s | 112,852 |
NPV @ 15% | $000s | (427,767) |
20.10.2.7
Sensitivity Analysis
Figure 20.21 shows the sensitivity of the base case NPV and IRR to changes in the copper price (8% real discount rate).
Los Azules Preliminary Assessment Technical Report
SE Project No. 8019-01
202
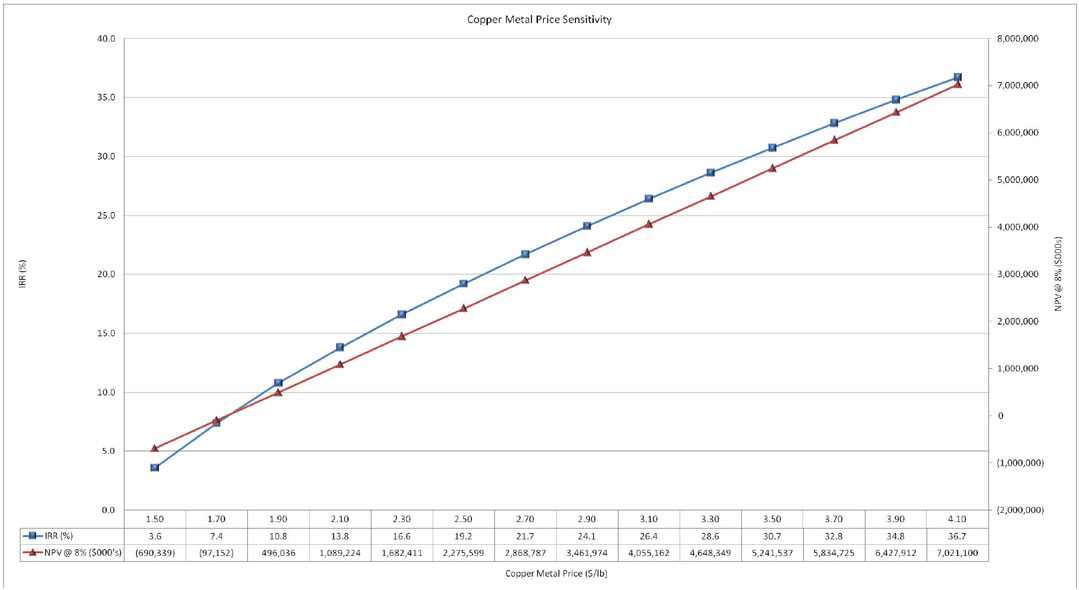
Figure 20.21 – Copper Metal Price Sensitivity
Los Azules Preliminary Assessment Technical Report
SE Project No. 8019-01
203
Figure 20.22 shows the results of sensitivity analysis to the following key project variables:
·
metal prices;
·
copper mineralized material grade;
·
production;
·
operating costs; and
·
capital costs.
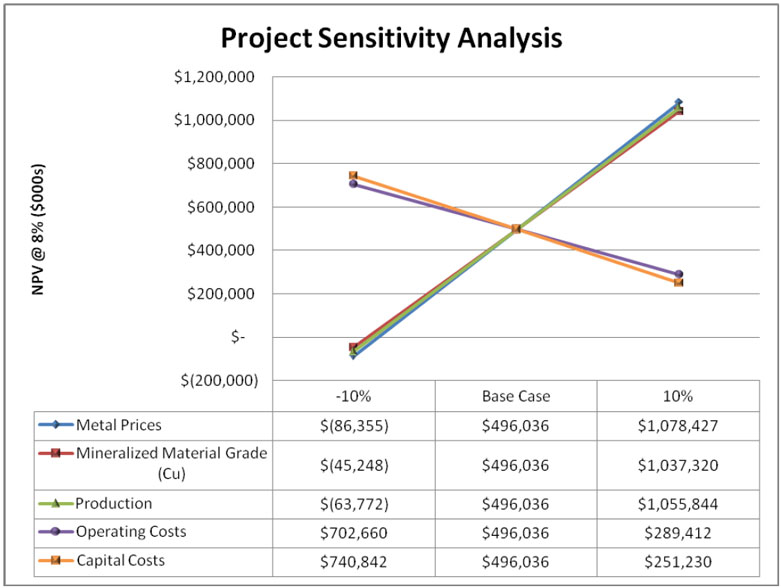
Figure 20.22 – Project Sensitivity Analysis
The sensitivity shows that the project is sensitive to production rate, mineralized material grade, and metal prices. Operating and capital costs changes have a lower impact on the project NPV than the former variables. A pro forma cash flow is shown in Figure 26.11.
20.11
Mine Life and Capital Payback
The operating life of the Azules project is estimated at 23.6 years assuming a concentrator mineralized material processing rate of 100,000 tpd. This excludes a two-year preproduction stripping period. At this processing rate, the capital payback period is projected to be 6.4 years.
Los Azules Preliminary Assessment Technical Report
SE Project No. 8019-01
204
21.0
Interpretation and Conclusions
Los Azules Preliminary Assessment Technical Report
SE Project No. 8019-01
205
21.1
Interpretations and Conclusions
This prelimary assessment met the goals as described in Section 3.1: 1) define the overall scope of the Los Azules project, 2) perform preliminary mine planning, 3) report on metallurgical testwork and process design, 4) estimate capital and operating costs, and 5) estimate the economics of developing the project as an open pit mine and mill facility.
The hydrothermal system at Los Azules is characterized by porphyry copper, and to a lesser extent gold, mezothermal mineralization that has been emplaced in a sequence of intermediate to felsic volcanic rocks. Many sub-volcanic domes have intruded these volcanic rocks. The dominant structural trend in the area is (NW-SE), with structures associated with this trend controlling the emplacement of the sub-volcanic bodies and veins. Secondary structures tend to trend either (N-S) and/or (NE-SW).
The area of visible alteration appears to cover an area of some 8 km (N-S) by 5 km (E-W). At the core of this alteration halo, the porphyry mineralization has an extension of some 3 km by 1 km. The most obvious and extensive alteration within the area is comprised of moderate to strong quartz-sericite and argillic alteration with local concentrations of tourmaline. Potassic alteration is also present throughout most of the deposit and is represented by K-feldspar and biotite of hydrothermal origin. Retrograde chlorite replaces hydrothermal biotite. Propylitic alteration associated with pyrite-calcite epidote occurs in the external halo. The highest part of the alteration system is characterized by strong acid leaching.
Superimposed on this system is the effect of weathering and oxidation on near-surface rocks as oxygen-rich rainfall percolated downward through the rockmass to the water table, or phreatic surface. This effect is supergene alteration and accounts for the oxidation and enriched zone where copper ions carried in solution precipitate out as chalcocite (and other minerals) when the percolating waters reached the reducing conditions below the water table. At Los Azules, the enriched blanket is encountered between 85 m and 170 m below ground surface. Whether or not this reflects the current groundwater regime is unknown.
The Los Azules deposit is typical of porphyry copper deposits with supergene ore overlying primary sulfide ore. Recovery of copper from flotation conforms to industry expectations from both ore types. Gold and silver recovery contributes to the value of the concentrate. Molybdenum is present in the deposit but not in economically recoverable quantities.
In December 2003, Minera Andes, Inc. (“MAI”) initiated an exploration program at Los Azules, including geologic mapping and sampling, ground magnetic and induced polarization geophysical surveys and core drilling. In May of 2004 MAI reported the discovery of a large, enriched (chalcocite) copper in an area defined by geology, MIMDAS deep penetration IP and magnetic geophysical surveys. The mineralized area is approximately 1,500 m by 2,000 m. The drill holes to date have not defined the depth of the deposit.
Holes drilled during the 2008 campaign were intended to continue infilling the grid spacing of 400 m (N-S) and 200 m (E-W). During the 2008 campaign, MAI drilled 16 holes totaling 4,836 m bringing the total number of holes drilled on the project to 83.
Los Azules Preliminary Assessment Technical Report
SE Project No. 8019-01
206
The deposit is open–ended, with the majority of the remaining potential at depth below current drilling and to the north at depth, and further drilling will be required to fully define the limits of the mineralization, especially along strike to the north and at depth. The deposit requires further drilling to achieve the drill hole density required to support an indicated resource prior to a prefeasibility study. The estimated cost of this program is listed in Table 21.1.
| |
Table 21.1
Budget Estimate for Work Plan |
Description | Total Cost US$ |
Property Payments | $1,255,000 |
Metallurgical Sampling and Testing | $75,000 |
Pit Slope / Geotechnical Studies | $25,000 |
Environmental Monitoring – Ongoing | $50,000 |
Infill & Step-Out Drilling, Including Support and Logistics | $7,742,000 |
Total | $9,147,000 |
The ultimate pit contains approximately 843 million tonnes of potentially economic inferred mineral resources (above a 0.22% Cu internal cutoff) grading 0.51% Cu and has an estimated stripping ratio of about 1.5:1 (tonnes waste per tonne of ore). Contained metal is estimated at 9.5 billion pounds of copper, 56 million pounds of molybdenum (molybdenum recovery is not being considered at the time of this report), 1.5 million troy ounces of gold and 46 million troy ounces of silver. Of the 843 million tonnes of inferred mineral resources, about 402 million tonnes are secondary sulfides grading 0.55% Cu and 441 million tonnes are primary sulfides grading 0.48% Cu.
Only primary and secondary sulfide mineral resources above a 0.22% Cu cutoff were considered as ore for purposes of developing the mine production schedule for the preliminary assessment. Advanced stripping needed to maintain adequate ore exposure was estimated for the 36-million tpy milling rate. The scheduling program sequenced the necessary material by bench, by phase, for each time period. Mining phases were processed in order, from the upper most benches downward. Concurrent phase mining was allowed for advanced stripping purposes, subject to the restriction that previous phases cannot be undercut by subsequent pushbacks.
Mineralized material feed to the mills would total 842.894 million tonnes over the life of the mine, which is projected at 23.6 years. About 2.874 million tonnes of run-of-mine (“ROM”) mineralized material stockpiled during preproduction stripping would be reclaimed and hauled to the primary crusher during Year 1.
Peak material handling rates from Years 2-9 would average nearly 259,000 tpd, before settling back to about 246,000 tpd from Year 10 through late Year 20. Over 150 million tonnes of waste rock and ore would be stripped during preproduction to expose sufficient ore for the concentrator startup.
Los Azules Preliminary Assessment Technical Report
SE Project No. 8019-01
207
The metallurgical test work indicated the flotation response on the samples tested are typical of ore deposits for the recovery of copper, gold and silver. Two composites and 16 drill core samples were sent for the metallurgical test work. Composite No. 1 is a secondary strong enrichment composite with 17% of the copper in chalcopyrite, while composite No. 2 is a primary weak enrichment composite with 49% of the copper in chalcopyrite. A high-grade sample of primary sulfide with 75% of the copper in chalcopyrite was also sent for metallurgical test work and it was confirmed that the high-grade sample responded well to copper recovery by flotation.
Locked-cycle tests were performed on each of the two composites. Results were adjusted for expectations in an industrial plant: Composite No. 1 concentrate is 34% copper with 92% copper recovery and composite No. 2 is 30% copper with 93% copper recovery. From the results of these two samples a weighted final concentrate copper grade of 30.8% copper and a recovery of 92.8% copper were applied to the process design. Metallurgical testwork on a high-grade sample at depth resulted in recovery consistent with the primary sulfide ore composite.
The Los Azules concentrator would have an annual throughput of 36,000,000 tonnes, based on an average daily throughput of 100,000 tonnes and 360 operating days per annum. The concentrator would be constructed on site which would include a comminution circuit followed by a flotation circuit and a copper circuit with thickener. A concentrate pipeline, filtration and concentrate load out and shipping will be located offsite. Tailings thickener, tailings storage, and water reclaim are part of the tailings storage facilities (“TSF”). This circuit would have a design capacity of 108,696 tonnes per day (“tpd”) and the aforementioned nominal capacity of 100,000 tpd.
The throughput for the process plant will be 100,000 tpd via a conventional crushing, SABC grinding circuit, flotation and dewatering to produce an average of 531,000 tonnes of 31.9% copper concentrate per annum. The concentrate would be delivered by pipeline to the port facility of Coquimbo, Chile for ocean shipment to a smelter.
The total project capital cost is estimated at $3.49 billion, being comprised of $2.75 billion during preproduction (including feasibility study preparation), $39.0 million for working capital, and $704 million in sustaining capital over the LoM. The total LoM operating cost is estimated at $6.40 billion, or $7.59/t ore.
The project before-tax pro forma cash flow shows a 10.8% IRR and a $496 million NPV at an 8% discount rate.
A review of alternatives to reduce capital and operating costs at the prefeasibility stage of the project would provide opportunities to improve project economics.
Los Azules Preliminary Assessment Technical Report
SE Project No. 8019-01
208
22.0
Recommendations
Los Azules Preliminary Assessment Technical Report
SE Project No. 8019-01
209
22.1
Geology, Geochemistry, and Geochronology
In order to augment the resource base, upgrade the geologic model, and transform inferred to indicated resources at Los Azules, ongoing geologic efforts to better define lithologic, structural, alteration, and timing controls on mineralization should continue. As new information is gathered, these recommendations should regularly be re-evaluated and revised. These recommendations can be used to guide exploration on the property, especially in areas in and around the current resource base where the boundaries of the copper mineralization have not been defined.
Recommended action items to be performed concurrent with further drilling include at an estimated cost of $120,000:
·
Detailed (1:500) outcrop mapping to:
○
Continue delimiting attitudes and volumes of identified and yet to be identified porphyry dikes;
○
Continue determining pre-, syn-, and post-mineral structural mineralized material controls (Zürcher, 2008a);
○
Continue identifying the distribution of alteration-mineralization zoning in both space and relative time;
○
More outcrop should be exposed through additional trenching and expansion of road cuts over the deposit area. To achieve better coverage, work should focus on the eastern, western, and northern sectors (Zürcher, 2008a; Zürcher et al., 2008); and
○
Knowledge gained to date on the distribution of alteration and mineralized material minerals suggests that there is systematic zoning. Once better documented, this zoning should prove helpful in vectoring in on mineralized material extensions.
·
Semi-detailed (1:2,000) mapping of the volcanic-intrusive contact, where exposed, along the crests surrounding the deposit (Zürcher, 2008a) to:
○
Detect faults that project onto the deposit area and may have displaced the orebody;
○
Measure fault throws based on footwall-hangingwall separation of volcanic units (Zürcher et al., 2008). This cannot be done effectively over the deposit area, where the ground is intensely fractured and almost completely covered by talus and/or glacial deposits;
○
Locate andesite (as well as additional porphyry) dikes that cut the volcanic section and measure their attitudes to further determine mineralized material controls and potential mineralization extensions (Zürcher, 2008b); and
○
Andesite dikes commonly occupy the same directions than mineralized porphyries. Thus, they can be used to constrain the attitude of porphyry dikes (and mineralization) that potentially may be present below along the structural plane.
Los Azules Preliminary Assessment Technical Report
SE Project No. 8019-01
210
·
Completion of re-logging campaign of existing diamond drill core (Zürcher et al., 2008) to:
○
Continue building on the internally consistent database that serves to regularly revise and upgrade the geologic model;
○
Geologic staff has been trained to insure that consistent, systematic, and reproducible observations are made during both surface mapping and core logging. These staff should mentor any new geologists involved;
○
Seamless drillhole log-to-surface correlations should be possible and attempted going forward;
○
Continue updating existing lithology-structure-alteration-mineralization (E-W) sections and complementing these with (N-S) sections and plan views (Zürcher et al., 2008);
○
Knowledge of zoning of alteration and mineralized material minerals should prove helpful in vectoring in on mineralized material extensions; and
○
To date, no systematic effort has been conducted at Los Azules in differentiating quartz veins and measuring their abundances. Given that in other porphyry systems quartz vein densities correlate well with copper grade, this task should be incorporated into the logging protocol.
·
Collection, preparation, and analysis of petrographic samples to:
○
Further recognize the characteristics of mineralized material mineralogy and its distribution with samples representative of all mineralized material zones (Zürcher, 2008a; Zürcher et al., 2008);
○
Quantification of pyrite (and iron oxide) versus copper sulfide ratios, as well as their textural relations, should provide valuable information for constraining processing parameters;
○
The sulfide host mineral(s) of gold and silver need to be identified to insure adequate recovery of these two potential by-product metals (this may have to be complemented with electron microprobe or SIMS analyses). Preliminary statistical principal component analyses show that gold and silver are hosted by different minerals; and
○
Further establish relative cross-cutting relations that will support timing relations that can be used to define alteration-mineralization zoning (Zürcher et al., 2008).
·
Complement the four U-Pb and one Re-Os dates already obtained (Zürcher, 2008a; Zürcher, L., 2008c) with radiogenic analyses of selected intrusive units (U-Pbzircon), alteration (Ar-Arhornblende and secondary biotite), and/or mineralization (Re-Osmolybdenite) to:
○
Confirm number of mineralizing event(s) and causative intrusive units;
○
The feldspar porphyry (originally thought to be associated with mineralization) is not 8.2 but 10.7Ma. At present, it is not known whether this altered intrusive phase caused any mineralization that predates the igneous and mineralizing episode dated at 8.2Ma and 7.84 with U-Pbzircon and Re-Osmolybdenite, respectively. Follow up with Ar-Ar on hornblende and secondary biotite from the quartz diorite host (10.6Ma) and the feldspar porphyry (10.7Ma) can potentially resolve whether there is an older 10.6Ma mineralizing event (Zürcher et al., 2008);
Los Azules Preliminary Assessment Technical Report
SE Project No. 8019-01
211
○
Additional U-Pb analyses of “crowded” feldspar porphyry and porphyritic diorite (thought to be the main mineralizer at Los Azules) should establish whether both of these porphyry units are unequivocally associated with the 8.2Ma mineralizing event;
○
Establish the potential presence of more than one dioritic host;
○
Four additional U-Pb dates on fine- to medium-grained equigranular quartz diorite from drill core in the western, eastern, northern, and southern portions of the deposit should provide information that should help in differentiating any intrusive hosts; and
○
Estimate age of supergene event with Ar-Ar analyses of secondary alunite (Zürcher, L., 2008c).
·
Analysis of samples for major and trace elements as needed (Zürcher, 2008a; Zürcher, 2008b) to:
○
Better characterize and classify any existing and newly identified units; and
○
If any fresh rock samples are collected, they should be analyzed routinely for major and trace elements (Zürcher et al., 2008).
·
Assessment of copper oxide potential (Zürcher, 2008a):
○
At present it is not known whether there is any copper oxide potential around Los Azules. However:
§
Much of the supergene blanket at Los Azules is well-developed (i.e., Cu was put into solution);
§
Iron sulfates bleed off the banks in the downstream section of the creek that flows to the west from the northern part of the deposit; and
§
The valley opens up at Embarrada, where more reduced and neutralizing rocks of the Choiyoi group have been identified.
○
In combination, the three observations above suggest that the presence of a significant exotic copper orebody cannot be precluded. Thus, it would be worthwhile examining this area as a potential copper oxide target initially with geological and geochemical vectoring. If found, sample and map the distribution of any ferricrete, manganese oxide, “green” copper, and sulfate mineral showings along the hydrologic gradient.
·
It is recommended that a sampling program consisting of a full static testing program (ABA, WRA, SPLP leach testing and petrographic analysis), as well as a kinetic cell program, be carried out on representative samples of the various combinations of lithologies, alteration overprints and sulfur contents in order to better understand any acid-generating and metals leaching potential of the mineralized material bodies waste rock materials. The majority of the samples could be gathered from the existing core for the project with some test pit samples.
Los Azules Preliminary Assessment Technical Report
SE Project No. 8019-01
212
22.2
Geotechnical
·
The estimated cost for the following items to be performed for the prefeasibility study is $290,000 (includes TP and drilling):
o
Geotechnical studies will be required to determine appropriate TSF and WRDF embankment geometry for site specific conditions and to ensure compliance with Argentine regulatory requirements;
o
Staging of the embankment should be looked at in more detail, on a yearly basis;
o
Future design work should incorporate allowances for site specific seismic conditions given the high seismic risk in the project area;
o
Geotechnical characteristics and hazard assessments should be included in studies of selected Mine Access Road alternatives;
o
Investigations are required to determine at what depth competent foundation materials exist, the environmental constraints and the required foundation treatment for the TSF and WRDF embankments; and
o
Investigations are required to locate construction borrow materials for all earthworks, aggregates, and sand for the construction of facilities.
22.3
Mining
·
The estimated cost for the following items to be performed for the prefeasibility study is $25,000:
o
A brief geotechnical review indicated a potential to increase pit slope angles 2-5° with the provision of adequate groundwater depressurization. A floating cone analysis of economic pit limits using 4° steeper slopes (32° in alluvium and 41° overall in bedrock) and base case recoveries, operating costs and a copper price of $1.50/lb indicated potential increases in contained ore-grade inferred mineral resources (+13% in tonnage) and an 18% reduction in stripping ratio. If the reduction in stripping ratio is applied to the mine production schedule, average waste stripping may be reduced by up to 27,000 tpd, or about 9.7 million tpy. Such a stripping reduction could also save about five haul trucks in the mining fleet at peak levels. Additional geotechnical drilling, mapping, rock strength testing and groundwater hydrology studies are recommended; and
o
Trade-off studies showed significant mine operating cost savings associated with having waste rock storage facilities and the primary crusher located near the northwest pit exit; therefore, this became the basis for the Preliminary Assessment and condemnation drilling is, therefore, recommended for these areas.
22.4
Reclamation and Mine Closure
·
The estimated cost for the following items is $50,000:
o
A risk assessment and closure plan will need to be developed during the prefeasibility study, in conjunction with development of post-closure sustainable land use strategies.
Los Azules Preliminary Assessment Technical Report
SE Project No. 8019-01
213
22.5
Sample Preparation, Analysis and Security
·
The estimated cost for the following items to be performed concurrently with further drilling is $6,500:
o
The blank material was not completely sterile and another source of blank material is recommended for future QA/QC programs. Landscape materials are often a good source for this use; and
o
More extensive density testing is recommended to further delineate the primary, supergene and oxide Minzones in future resource and reserve estimates.
22.6
Environmental
·
The estimated cost for the following items to be performed for the prefeasibility study is $180,000:
o
Further biological studies and an expansion of the study area are needed in order to appropriately assess direct and indirect areas of influence. A minimum of two biological evaluation outings during the year are required in order to determine seasonality in biological components. Furthermore, an evaluation of heavy metals in aquatic vertebrates (eg. Oncorhynchus mykiss) is recommended to assess contamination in aquatic ecosystems;
o
The long-term monitoring issues for the Los Azules project should involve water monitoring (superficial and groundwater) and weather monitoring. It will be necessary to include current climatic data from the project in order to determine exact climatic information. To this end, the climate may be monitored by installing a single continuous-recording weather station on site;
o
A network of water monitoring stations will support environmental impact assessments, operations management, and closure planning. A quarterly sampling and monitoring program should be conducted upstream and downstream of the site and include a sufficient number of stations to evaluate baseline conditions and water quality. Community representatives should be included in the sampling and monitoring phase in order for them to begin to understand the process, and appreciate and quantify the baseline conditions;
o
Preliminary data taken in this study must be complemented by further biotic evaluations to determine species diversity and relative abundance, and to confirm the presence of other endangered or endemic species. Biological studies also reveal diverse communities of plankton and benton in nearby streams and lakes, which must continue to be monitored in subsequent studies; and
o
Subsequent studies with estimates on climate and other parameters from the area are necessary. Long-term monitoring should be taken into consideration by installing a continuous-recording meteorological station in the project area, in such manner that the information obtained can be used in the baseline studies for the mining permits. Water and climate monitoring should begin immediately to ensure a minimum of one year’s worth of data prior to commencing the baseline studies and the environmental and social impact assessment (“ESIA”). Air modeling should also be considered in order to discard air pollution near small communities that are close to the site.
Los Azules Preliminary Assessment Technical Report
SE Project No. 8019-01
214
22.7
Hydrogeological and Hydrologic
·
The estimated cost for the following items to be performed for the prefeasibility study is $300,000 (includes drilling):
o
The preliminary estimation shown in Section 20.2.6.5 is based on the completion of all of the recommendations that are listed below and coordination in planning meetings for the 2009 work scheduling. 2 standpipe piezometers and 14 vibrating wire (“VW”) piezometers are proposed to be installed in 11 exploration and geotechnical boreholes. Packer tests are also proposed at 25 m intervals within each proposed piezometer borehole (142 tests);
o
Based on the review of hydrogeological and hydrologic information and communications with others associated with the project, the following investigations are recommended:
§
Evaluate the existing condition and potential yield of existing water rights in the downstream environment of the Salinas River valley and evaluate the availability of and requirements to obtain new water rights;
§
Perform a hydrogeological drilling and testing program within the pit and proposed tailings dam areas to characterize the hydrogeological characteristics including hydraulic properties, groundwater recharge and discharge, and influences of lithology and structure on groundwater flow. Pump tests should be conducted in the more permeable fracture zones to accurately characterize their hydraulic characteristics. Longer term monitoring of water levels in piezometers should be performed to assess groundwater recharge rates. The results would be used to evaluate pit dewatering requirements and expected pore pressures in the pit walls;
§
Evaluate the potential impacts of pit dewatering and tailing seepage on natural stream flows in the project area;
§
Conduct field investigations of the alluvial aquifer along the Rio Salinas to define aquifer thickness, permeability, specific yield, groundwater recharge and discharge rates, and interaction with the river;
§
Install a meteorological station on site in order to more accurately measure meteorological inputs to the site water balance; and
§
Conduct stream flow monitoring rounds and, if possible, establish one or more permanent flow monitoring stations to provide more site specific estimates of runoff conditions and baseflow.
Los Azules Preliminary Assessment Technical Report
SE Project No. 8019-01
215
22.8
Water Disposal Alternatives
·
The estimated cost for the following items for the prefeasibility study is $30,000:
o
The following studies are recommended for further evaluation of water disposal alternatives:
§
Evaluate land availability for water disposal near port site;
§
Design a field program for testing physical and chemical soil properties; and
§
Evaluate potential environmental impacts at water disposal site.
22.9
Social
General recommendations for social work in the area of influence of the Los Azules Project to be performed for the prefeasibility study are at an estimated cost of $200,000:
·
Prepare a Systematic and Integral Baseline Report, which includes aspects such as history, demography, education, health, economy, housing, social and political organization, government organizations and expectancies on the mining project, to complement the existing data. All of this based on reliable secondary sources, such as the National Census. In case said sources were not available, fieldwork would be needed, implementing qualitative and quantitative methodologies;
·
Compose stable professional groups for all the phases of the mining project, in order to develop work with the communities within the zones of influence of the project;
·
Include social specialists in the professional team: Social workers and sociologists; and
·
Include participation, evaluation and monitoring systems in the design and execution of the social development projects.
22.10
General Project Recommendations
The deposit requires further drilling to achieve the drill hole density required to support an indicated resource prior to a prefeasibility study at an estimated cost of $7,742,000.
Subsequent to this drill hole density program and dependant upon the successful conversion of the resource estimate to an inferred status, a preliminary feasibility study would be recommended at an estimated cost of $2,000,000. Additional work to investigate methods to lower capital and operating costs to improve project economics is recommended for the prefeasibility study.
Los Azules Preliminary Assessment Technical Report
SE Project No. 8019-01
216
23.0
References
Los Azules Preliminary Assessment Technical Report
SE Project No. 8019-01
217
23.1
References
Rojas, Nivaldo (February 2008), NI 43-101Technical Report on Los Azules Project, Andean Cordillera Region, Calingasta Department, San Juan Province, Argentina
Sayavedra, Jose Maria, January 14, 2009, Letter to Minera Andes Inc. in regard to a legal audit and title opinion for concessions held by MAI in Argentina.
SIEye, HGF & Asoc (September 2008), Preliminary Feasibility Study,Electric Energy Supply Study – Preliminary Report #2
Tschabrun, D. B., Sim, R., Davis, B. (Revised January 8, 2009), NI 43-101 Technical Report,Los Azules Copper Project, San Juan Province, Argentina
Zürcher, L., 2008a, Geology of the Los Azules Porphyry Copper Project, San Juan, Argentina (Preliminary Progress Report): August 3 (revised August 25), 2008 internal Minera Andes, Inc. report, ESMI, Tucson, AZ, 12 pages.
Zürcher, L., 2008b, Geochemistry of Rocks from the Los Azules Porphyry Deposit, San Juan, Argentina (Addendum to ESMI August 25, 2008 Report): October 27, 2008 internal Minera Andes, Inc. progress report, ESMI, Tucson, AZ, 14 pages.
Zürcher, L., 2008c, U-Pb Geochronology of Rocks from the Los Azules Porphyry Deposit, San Juan, Argentina (Addendum to ESMI August 25, 2008 Report): October 30, 2008 internal Minera Andes, Inc. progress report, ESMI, Tucson, AZ, 8 pages.
Zürcher, L., Hall, D., Gordillo, D., and Valle, N., 2008, Geology of the Los Azules Porphyry Copper Project, San Juan, Argentina (PowerPoint Presentation): October 14, 2008, internal Minera Andes, Inc. report, ESMI, Tucson, AZ, 18 pages.
23.2
Glossary
Acid-Base Accounting (ABA): Test methods and calculations that predict the balance between acid generating potential and acid neutralizing potential of materials, particularly mine waste materials.
Acid Generating Material (AGM): Materials that react with water and oxygen to form acids and to mobilize metals into the resulting solutions. An example is mine tailings containing sulfides (ex. Pyrite) that react to form sulfuric acid.
Acid Generating Potential (AGP): Test methods and calculations used to measure of the potential of material to become acid generating material.
Acid Neutralizing Potential (ANP): Test methods and calculations used to measure of the potential of material to neutralize acid generating material.
Acid Rock Drainage (ARD): A natural occurrence within some environments as part of the rock weathering process but is exacerbated by large-scale earth disturbances characteristic of mining and other large construction activities, usually within rocks containing an abundance of sulfide minerals. (SeeAcid Generating Material).
Los Azules Preliminary Assessment Technical Report
SE Project No. 8019-01
218
Allochthonous: An adjective for rocks, deposits, etc.; that are found in a place other than where they and their constituents were formed.
Anticline: A fold of rock layers that slope downward on both sides of a common crest. Anticlines form when rocks are compressed by plate-tectonic forces. They can be as small as a hill or as large as a mountain range.
Apophysis: A branch from a dike or vein.
ASTM: American Society for Testing and Materials.
Aqua Regia: a yellow, fuming liquid composed of one part nitric acid and three to four parts hydrochloric acid: used chiefly to dissolve metals as gold, platinum, or the like.
Batholith: A large mass of igneous rock that has intruded and melted surrounding strata at great depths. Batholiths usually have a surface area of over 100 km2 (38 mi2).
BCM: Bank Cubic Metre. One cubic metre of material as it lies in the natural state.
Bornite: (a.k.a. peacock ore) An important brownish-bronze, lustrous copper ore with the composition Cu5FeS4 that tarnishes to purple when exposed to air. The mineralogical abbreviation is bn.
Breccia: A rock composed of angular fragments embedded in a fine-grained matrix. Breccias form from explosive volcanic ejections, the compaction of talus, or plate tectonic processes. Breccias are different from conglomerates in that the fragments they contain are angular instead of rounded.
Chalcopyrite: A brassy yellow, metallic, tetragonal mineral, usually occurring as shapeless masses of grains. Chalcopyrite is found in igneous rocks and copper-rich shales, and it is an important ore of copper. Because of its shiny look and often yellow colour, it is sometimes mistaken for gold, and for this reason it is also called fool's gold. Chemical formula: CuFeS2. The mineralogical abbreviation is cp.
Colluvium: Loose earth material that has accumulated at the base of a hill, through the action of gravity, as piles oftalus, avalanche debris, and sheets of detritus moved by soil creep or frost action.
Comminution: To reduce to powder; pulverize.
Culvert: A drain or channel crossing under a road, sidewalk, etc.
Cyanidation: A highly controversial, though most commonly used, metallurgical technique for extracting gold from low-grade ore.
Dendrochronology: The science dealing with the study of the annual rings of trees in determining the dates and chronological order of past events.
Dip: The angle at which a stratum is inclined from the horizontal, measured perpendicular to thestrike and in the vertical plane.
Los Azules Preliminary Assessment Technical Report
SE Project No. 8019-01
219
Drill Hole: A circular hole made by drilling either to explore for minerals or to obtain geological information.
Epizone: The zone of metamorphism characterized by moderate temperature, low hydrostatic pressure, and powerful stress. The outer depth zone of metamorphic rocks.
En Echelon: Describing parallel or subparallel, closely-spaced, overlapping or step-like minor structural features in rock, such as faults and tension fractures, that are oblique to the overall structural trend.
Exploration: The search for economic mineral by geological surveys, prospecting or use of tunnels,drifts ordrill holes.
Facies: The appearance and characteristics of a sedimentary deposit, esp. as they reflect the conditions and environment of deposition and serve to distinguish the deposit from contiguous deposits.
Fault: A fracture in the continuity of a rock formation caused by a shifting or dislodging of the earth's crust, in which adjacent surfaces are displaced relative to one another and parallel to the plane of fracture.
Fluvial: Features created by the actions of a river. Also called “glaciofluvial” when originating from the meltwater rivers of a glacier.
FOB: The acronym for “free on board”. The FOB price is the sales price of product loaded in a vessel at the port and excludes freight or shipping cost.
Freeboard: The height of the watertight portion of a structure (ex. tailings dam) above a given level of water in a river, lake, etc.
Front End Loader: A tractor or wheeled type loader having a shovel or bucket that dumps at the end of an articulated arm located at the front of the vehicle.
Geophysical Log: A graphic record of the measured or computed physical characteristics of the rock section encountered by a probe or sonde in a drill hole, plotted as a continuous function of depth. Also commonly referred to as an e-log.
Geohazards: Naturally occurring destructive forces such as volcanoes, earthquakes, landslides, and avalanches.
Geotextiles: Permeable fabrics which, when used in association with soil, have the ability to separate, filter, reinforce, protect, or drain. Applications include roads, airfields, railroads, embankments, retaining structures, reservoirs, canals, dams, bank protection and coastal engineering.
Glacial Outburst Flood: a sudden and often catastrophic flood that may occur during a volcanic eruption, or when a lake contained by a glacier or a terminalmoraine dam fails. This can happen due to erosion, a buildup of water pressure, an avalanche of rock or heavy snow, an earthquake or cryoseism, or if a large enough portion of a glacier breaks off and massively displaces the waters in a glacial lake at its base.
Los Azules Preliminary Assessment Technical Report
SE Project No. 8019-01
220
Gossan: An exposed, oxidized portion of a mineral vein, especially a rust-coloured deposit of mineral matter at the outcrop of a vein or orebody containing iron-bearing materials.
Graben: A depressed block of land bordered by parallel faults.
Greenfield: A project which lacks any constraints imposed by prior work, with no need to demolish or remodel any existing structures (i.e. new construction).
Highwall: The unexcavated face of exposed overburden and ore in an opencast mine or the face or bank of the uphill side of a contour strip-mine excavation.
Imbrication: A sedimentary structure in which flat pebbles are uniformly tilted in the same direction.
Isopach: A line drawn on a map connecting all points of equal thickness of a particular geologic formation.
LCM: Loose Cubic Metre. One cubic metre of material as it lies in a post-disturbed state, such as a stockpile.
Lease: A contract between a landowner and a lessee, granting the lessee the right to search for and produce ore upon payment of an agreed rental, bonus and/or royalty.
Little Ice Age (LIA): The period from about 1400-1900 a.d., characterized by expansion of mountain glaciers and cooling of global temperatures, especially in the Alps, Scandinavia, Iceland, and Alaska. The Little Ice Age followed the Medieval Warm Period.
Mass Wasting: (SeeSlope Creep)
Mineable: Capable of being mined profitably under current mining technology, environmental, and legal restrictions, rules and regulations.
ML: Metal Leaching.
Molybdenite: A soft, lead-gray hexagonal mineral that is the principal ore of molybdenum. It occurs as sheetlike masses in pegmatites and in areas where contact metamorphism has taken place.
Moraine: A mass oftill (boulders, pebbles, sand, and mud) deposited by a glacier, often in the form of a long ridge. Moraines typically form because of the plowing effect of a moving glacier, which causes it to pick up rock fragments and sediments as it moves, and because of the periodic melting of the ice, which causes the glacier to deposit these materials during warmer intervals. A moraine deposited in front of a glacier is aterminal moraine. A moraine deposited along the side of a glacier is alateral moraine. A moraine deposited down the middle of a glacier is amedial moraine. Medial moraines are actually the combined lateral moraines of two glaciers that have merged.
NPAG: Non-Potentially Acid Generating
Los Azules Preliminary Assessment Technical Report
SE Project No. 8019-01
221
Ore: A mineral, rock, or natural product serving as a source of some metallic substance (ex. copper, gold, etc.), nonmetallic substance (ex. Sulfur), or a native metal, that can be mined at a profit.
Orography: The study of the physical geography of mountains and mountain ranges.
Outcrop: Economic mineral, which appears at or near the surface; the intersection of ore with the surface.
Overburden: Waste earth and rock covering a useful or economic mineral deposit.
PAG: Potentially Acid Generating.
Permeability: The capability of a porous rock or sediment to permit the flow of fluids through its pore spaces.
Preliminary Assessment (PA): A preliminary assessment study that includes an economic analysis of the potential viability of mineral resources taken at an early stage of the project prior to the completion of a prefeasibility study.
pH: The potential of hydrogen. Numerically, it is the logarithm of the reciprocal of hydrogen ion concentration in gram atoms per litre of solution. Qualitatively, this is a measure of the acidity or alkalinity of a solution, numerically equal to 7 for neutral solutions, increasing with increasing alkalinity and decreasing with increasing acidity. The pH scale commonly in use ranges from 0 (highly acidic) to 14 (highly alkaline, or basic).
Physiography: The study of the natural features of the earth's surface, especially in its current aspects, including land formation, climate, currents, and distribution of flora and fauna.
Porosity: The ratio, expressed as a percentage, of the volume of the pores or interstices of a substance, as a rock or rock stratum, to the total volume of the mass.
Porphyry: An igneous rock containing the large crystals known as phenocrysts embedded in a fine-grained matrix.
Pyrite: The mineral pyrite, or iron pyrite, is an iron sulfide with the formula FeS2. This mineral's metallic luster and pale-to-normal, brass-yellow hue have earned it the nickname fool's gold due to its resemblance to gold. Pyrite is the most common of the sulfide minerals. The mineralogical abbreviation is py.
Reaction Wood: Formed by a woody plant in response to mechanical stress, and helps to position newly formed parts of the plant in an optimal position. This stress may be the result of wind exposure, excess of snow, soil movement, avalanches, etc. The reaction wood appears as asymmetric growth. The cambium in the affected part of the trunk is more active on one side, leading to thicker growth rings.
Los Azules Preliminary Assessment Technical Report
SE Project No. 8019-01
222
Reclamation: The restoration of land at a mining site after the ore has been extracted. Reclamation operations are usually conducted as production operations are taking place elsewhere at the site. This process commonly includes re-contouring or reshaping the land to its approximate original appearance, restoring topsoil and planting native grasses, trees and ground covers.
Rotary Drill: A drill machine that rotates a rigid, tubular string of drill pipe and drill collars to which is attached a bit for cutting rock to produce boreholes.
Royalty: A share of the product or profit reserved by the owner for permitting another to use the property. A lease by which the owner or lessor grants to the lessee the privilege of mining and operating the land in consideration of the payment of a certain stipulated royalty on the mineral produced.Run-of-Mine (ROM): The ore produced from the mine before it is separated and any impurities removed.
Slope Creep: (a.k.a. Downhill creep, or commonly just creep) The slow downward progression of rock and soil down a low grade slope; it can also refer to slow deformation of such materials as a result of prolonged pressure and stress. Creep may appear to an observer to be continuous, but it really is the sum of numerous minute, discrete movements of slope material caused by the force of gravity. Friction being the primary force to resist gravity is produced when one body of material slides past another offering a mechanical resistance between the two which acts on holding objects (or slopes) in place. As slope on a hill increases, the gravitational force that is perpendicular to the slope decreases and results in less friction between the material that could cause the slope to slide.
Stockwork: A metalliferous deposit characterized by the impregnation of the mass of rock with many small veins or nests irregularly grouped. Such deposits are typically worked in floors or stories.
Strike: The direction of the line formed by the intersection of the bedding plane of a bed or stratum of sedimentary rock with a horizontal plane.
Strip Ratio: The overburden material (tonnes) that must be removed to provide a unit weight of ore (tonne). In general, the lower the strip ratio, the more likely an ore body is to be mined by open pit methods.
Surface Mining: Methods of mining at or near the surface. Includes mining and removing ore from open cuts with mechanical excavating and transportation equipment and the removal of capping overburden to uncover the ore.
Syncline: A fold of rock layers that slope upward on both sides of a common low point. Synclines form when rocks are compressed by plate-tectonic forces. They can be as small as the side of a cliff or as large as an entire valley.
Tailings: Waste that has been separated from the ore in the metallurgical processing plant.
Tailings Impoundment: a body of tailings confined within an enclosure or behind a dam.
Los Azules Preliminary Assessment Technical Report
SE Project No. 8019-01
223
Talus: Sharp, irregular rock fragments that have accumulated at the base of a cliff or slope. The concave slope formed by such an accumulation of rock fragments is called a talus slope.
Thrust Fault: A fault with a dip of 45 degrees or less over much of its extent, on which the hanging wall appears to have moved upward relative to the footwall.
Till: Unconsolidated, unstratified, and heterogeneous mixture of soil deposited by a glacier; consists of sand and clay and gravel and boulders mixed together.
Vug: A small cavity in a rock or vein, often with a mineral lining of different composition from that of the surrounding rock.
23.3
List of Abbreviations
| |
| Above mean sea level | amsl |
| Ampere | A |
| Annum (year) | a |
| Bank cubic metre | BCM |
| Copper | Cu |
| Cubic metre | m3 |
| Cubic metres per day | m3/d |
| Cubic metres per hour | m3/h |
| Day | d |
| Days per week | d/wk |
| Days per year (annum) | d/a |
| Degree | ° |
| Degrees | deg |
| Degrees Celsius | °C |
| Diametre | ø |
| Dry metric tonne | dmt |
| Gold | Au |
| Gram | g |
| Grams per cubic centimetre | g/cc |
| Grams per litre | g/L |
| Grams per tonne | g/t |
| Greater than | > |
| Hectare (10,000 m2) | ha |
| Hertz | Hz |
| Horsepower | hp |
| Hour | hr |
| Hours per day | h/d |
| Hours per week | h/wk |
| Hours per year | h/a |
| Inch | in |
| Joule (Newton-metre) | J |
| Kilometre | km |
| Kilowatt-hour | kWh |
| Kilowatt-hours per short ton (US) | kWh/st |
Los Azules Preliminary Assessment Technical Report
SE Project No. 8019-01
224
|
|
| Kilowatt-hours per tonne (metric tonne) | kWh/t |
| Kilowatt-hours per year | kWh/a |
| Kilowatts adjusted for motor efficiency | kWe |
| Lead | Pb |
| Less than | < |
| Litre | L |
| Litres per day | L/d |
| Litres per minute | L/m |
| Litres per second | L/s |
| Loose cubic metres | LCM |
| Megawatt | MW |
| Megabytes per second | Mb/s |
| Metre | m |
| Metres above sea level | masl |
| Metres per second | m/s |
| Metric tonne | t |
| Metric tonne | mt |
| Micrometre | micron |
| Microsiemens (electrical) | μS |
| Miles per hour | mph |
| Million | M |
| Million metric tonnes (megatonne) | mmt |
| Minute (plane angle) | ' |
| Minute (time) | min |
| Molybdenum | Mo |
| Month | mo |
| Newton | N |
| Ohm (electrical) | Ω |
| Ounce (troy) | ozt |
| Parts per billion | ppb |
| Parts per million | ppm |
| Pascal (newtons per square metre) | Pa |
| Pascals per second | Pa/s |
| Percent | % |
| Percent moisture (relative humidity) | %RH |
| Phase (electrical) | Ph |
| Potential of Hydrogen (i.e.acidity or alkalinity level) | pH |
| Pound (avoirdupois) | lb |
| Power factor | pF |
| Revolutions per minute | rpm |
| Second (plane angle) | " |
| Second (time) | s |
| Short ton (2,000 lb) | st |
| Short ton (US) | st |
| Short tons per day (US) | stpd |
| Short tons per hour (US) | stph |
| Short tons per year (US) | stpy |
| Silver | Ag |
| Specific gravity | SG |
| Square metre | m2 |
| Tonne (1,000 kg) | t |
Los Azules Preliminary Assessment Technical Report
SE Project No. 8019-01
225
| |
| Tonnes per annum | tpa |
| Tonnes per day | tpd |
| Tonnes per hour | tph |
| Total dissolved solids | TDS |
| Total suspended solids | TSS |
| Uranium | U |
| Volt | V |
| Volt-Ampere | VA |
| Watt (Joules per second) | W |
| Week | wk |
| Weight/weight | w/w |
| Wet metric ton | wmt |
| Yard | yd |
| Year (annum) | a |
| Year (US) | yr |
23.4
Measurement Units and Symbols
The reference conditions for gas volume are 0°C and 101.325 kPa, corresponding with a molar (ideal) gas volume of 22.414 m3/(kg-mol). This is shown as “m3 (normal)” or abbreviated to (non-SI) “Nm3.” The unit “t” rather than Mg, is used for 1,000 kg mass. The dimensionally independent SI base units are shown in Table 23.1.
| | |
Table 23.1
SI Base Units |
Quantity | Unit | Symbol |
Length | Meter | m |
Mass | Kilogram | kg |
Time | Second | s |
Electric Current | Ampere | A |
Thermodynamic Temperature | Kelvin | K |
Amount of Substance | Mole | mol |
Luminous Intensity | candela | cd |
| | | |
Table 23.2
Permitted Base Units |
Quantity | Unit | Symbol | Definition |
Time | Minute | min | 60 seconds |
Hour | h | 60 minutes |
Day | d | 24 hours |
Calendar Year | y | 365 days |
Mass | Metric Tonne | t | 1,000 kg |
Los Azules Preliminary Assessment Technical Report
SE Project No. 8019-01
226
SI prefixes, as listed in Table 23.3, are used only with SI base units. It is incorrect to use these prefixes with the permitted base units shown in Table 23.2.
| | | |
Table 23.3
SI Prefixes |
Power | Prefix | Symbol | Decimal Equivalent |
1024 | yotta- | Y | 1,000,000,000,000,000,000,000,000 |
1021 | zeta- | Z | 1,000,000,000,000,000,000,000 |
1018 | exa- | E | 1,000,000,000,000,000,000 |
1015 | peta- | P | 1,000,000,000,000,000 |
1012 | tera- | T | 1,000,000,000,000 |
109 | giga- | G | 1,000,000,000 |
106 | mega- | M | 1,000,000 |
103 | kilo- | k | 1,000 |
102 | hecto- | h | 100 |
101 | deca- | da | 10 |
100 | | | 1 |
10-1 | deci- | d | 0.1 |
10-2 | centi- | c | 0.01 |
10-3 | milli- | m | 0.001 |
10-6 | micro- | μ | 0.000 001 |
10-9 | nano- | n | 0.000 000 001 |
10-12 | pico- | p | 0.000 000 000 001 |
10-15 | femto- | f | 0.000 000 000 000 001 |
10-18 | atto- | a | 0.000 000 000 000 000 001 |
10-21 | zepto- | z | 0.000 000 000 000 000 000 001 |
10-24 | yocto- | y | 0.000 000 000 000 000 000 000 001 |
The prefixes and prefix symbols are used with the SI base and derived units – with the exception of kg. The base mass unit, kg, already has a prefix, and the SI prefixes are then applied to the unit gram (g). In this manner, the symbol for metric tonne is Mg, however in this report the permitted alternate, t as listed above, is used.
The ASTM permitted form Wh is used rather than W-h. Common SI units derived from combinations of base units and given special names are shown in Table 23.4.
Los Azules Preliminary Assessment Technical Report
SE Project No. 8019-01
227
| | | |
Table 23.4
Derived SI Units of Special Name |
Quantity | Unit | Symbol | Definition |
Frequency (periodic) | Hertz | Hz | s-1 |
Force | Newton | N | kg·m·s-2 |
Pressure, stress | Pascal | Pa | N·m-2 |
Energy, work, heat qty. | Joule | J | N·m |
Power, radiant flux | Watt | W | J·s-1 |
Quantity of electricity | Coulomb | C | A·s |
Electric potential, emf | Volt | V | W·A-1 |
Electric capacitance | Farad | F | C·V-1 |
Electric resistance | Ohm | Ω | V·A-1 |
Electric conductance | Siemens | S | A·V-1 |
Magnetic flux | Weber | Wb | V·s |
Magnetic flux density | Tesla | T | Wb·m-2 |
Inductance | Henry | H | Wb·A-1 |
Celsius temperature | degree Celsius | ºC | K – 273.15 |
Plane angle | Radian | rad | dimensionless |
Solid angle | Steradian | sr | dimensionless |
Luminous flux | Lumen | lm | cd·sr |
Illuminance | Lux | lx | lm·m-2 |
Activity (of a radionuclide) | Becquerel | Bq | s-1 |
Absorbed dose | Gray | Gy | J·kg-1 |
Dose equivalent | Sievert | Sv | J·kg-1 |
Units used in the Preliminary Assessment are shown in Table 23.5.
| | | |
Table 23.5
Units in Use |
Quantity | Unit | Symbol | Definition |
Plane angle rad | Degree | º | 1º = (π/180) |
Minute | ’ | 1’ = (1/60)º |
Second | ” | 1” = (1/60)’ |
Volume | Liter | L | 1 L = 10-3m3 |
Area | Hectare | ha | 1 ha = 104 m2 |
Energy (electrical) | Kilowatt-hour | kWh | 1 kWh = 3.6 MJ |
Los Azules Preliminary Assessment Technical Report
SE Project No. 8019-01
228
Common SI units derived from combinations of base units, but do not warrant special names are shown in Table 23.6.
| | |
Table 23.6
Common Derived Units (Select List Only) |
Quantity | Unit | Symbol |
Acceleration | meter per second squared | m/s² |
Angular acceleration | radian per second squared | rad/s² |
Angular velocity | radian per second | rad/s |
Area | square meter | m² |
Concentration | mol per cubic meter | mol/m³ |
Current density | ampere per square meter | A/m² |
Density (mass) | kilogram per cubic meter | kg/m³ |
Electric flux density | coulomb per square meter | C/m² |
Entropy | joule per Kelvin | J/K |
Heat capacity | joule per Kelvin | J/K |
Heat flux density | watt per square meter | W/m² |
Luminance | candela per square meter | cd/m² |
Magnetic field strength | ampere per meter | A/m |
Molar energy | joule per mole | J/mol |
Molar entropy | joule per mole Kelvin | J/(mol·K) |
Molar heat capacity | joule per mole Kelvin | J/(mol·K) |
Moment of force | Newton meter | N·m |
Permeability (magnetic) | Henry per meter | H/m |
Power density | watt per square meter | W/m² |
Specific heat capacity | joule per kilogram Kelvin | J/(kg·K) |
Specific energy | joule per kilogram | J/kg |
Specific entropy | joule per kilogram Kelvin | J/(kg·K) |
Specific volume | cubic meter per kilogram | m³/kg |
Surface tension | Newton per meter | N/m |
Thermal conductivity | watt per meter Kelvin | W/(m·K) |
Thermal conductance | watt per square meter Kelvin | W/(m²·K) |
Velocity | meter per second | m/s |
Viscosity, dynamic | Pascal second | Pa·s |
Viscosity, kinematic | square meter per second | m²/s |
Volume | cubic meter | m³ |
Abbreviations of other terms that may appear in this report are shown in Table 23.7.
Los Azules Preliminary Assessment Technical Report
SE Project No. 8019-01
229
| |
Table 23.7
Abbreviations of Other Terms |
Term | Abbreviation |
alternating current | ac |
barrel | bbl |
boiling point | bp |
cosine | cos |
cotangent | cot |
decibel | dB |
diameter | dia |
direct current | dc |
electromotive force | emf |
induced draft | ID |
inside diameter | i.dia |
maximum | maxm |
minimum | minm |
mole percent | mol % |
molecular mass (weight) | mol wt |
parts per billion | ppb |
parts per million | ppm |
part per million by volume | ppmv |
parts per million by mass (weight) | ppmw |
power factor | PF |
revolutions per minute | rpm |
revolutions per second | rps |
root mean square | rms |
sine | sin |
specific gravity | Sp Gr |
tangent | tan |
temperature | temp |
ultra high frequency | UHF |
very high frequency | VHF |
volume | vol |
volume percent | vol % |
weight (mass) | wt |
weight (mass) percent | wt % |
Los Azules Preliminary Assessment Technical Report
SE Project No. 8019-01
230
24.0
Date and Signature Page
Los Azules Preliminary Assessment Technical Report
SE Project No. 8019-01
231
This NI 43-101 Technical Report titled,“Canadian National Instrument 43-101 Technical Report in support of the Preliminary Assessment on the Development of the Los Azules Project, San Juan Province, Argentina” has an effective date of March 19, 2009.
| (Signed by) | | Randolph P. Schneider, MAusIMM | |
| Signature of Qualified Person | | Print Name of Qualified Person | |
| | | | |
| (Signed & Sealed by) | | Robert Sim, P.Geo | |
| Signature of Qualified Person | | Print Name of Qualified Person | |
| | | |
| (Signed by) | | Bruce M. Davis, Ph.D., FAusIMM | |
| Signature of Qualified Person | | Print Name of Qualified Person | |
| | | |
| (Signed & Sealed by) | | William L. Rose, P.E. | |
| Signature of Qualified Person | | Print Name of Qualified Person | |
| | | |
| (Signed & Sealed by) | | Scott C. Elfen, P.E. | |
| Signature of Qualified Person | | PrintNameofQualified Person | |
Los Azules Preliminary Assessment Technical Report
SE Project No. 8019-01
232
25.0
Additional Requirements for Technical Reports on Development Properties and Production Properties
Los Azules Preliminary Assessment Technical Report
SE Project No. 8019-01
233
25.1
Additional Information
At the time of printing, it is the opinion of the author that there is no other relevant data or information required to make the report understandable and not misleading.
Please reference Section 20 (Other Relevant Data and Information) for other pertinent information regarding the development of the Los Azules project.
Los Azules Preliminary Assessment Technical Report
SE Project No. 8019-01
234
26.0
Illustrations
3.1
Los Azules Preliminary Assessment Technical Report
SE Project No. 8019-01
235
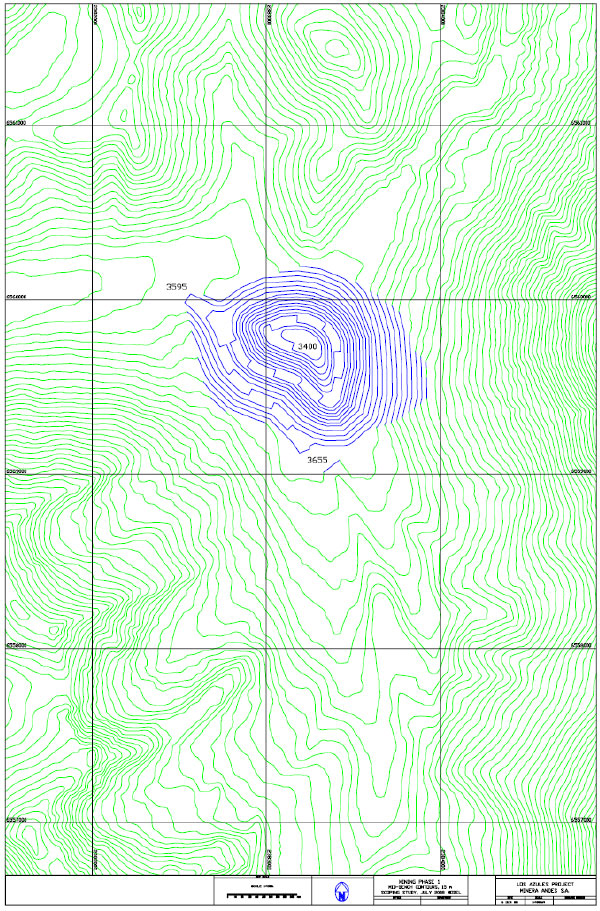
Figure 26.1 – Mining Phase 1
Los Azules Preliminary Assessment Technical Report
SE Project No. 8019-01
236
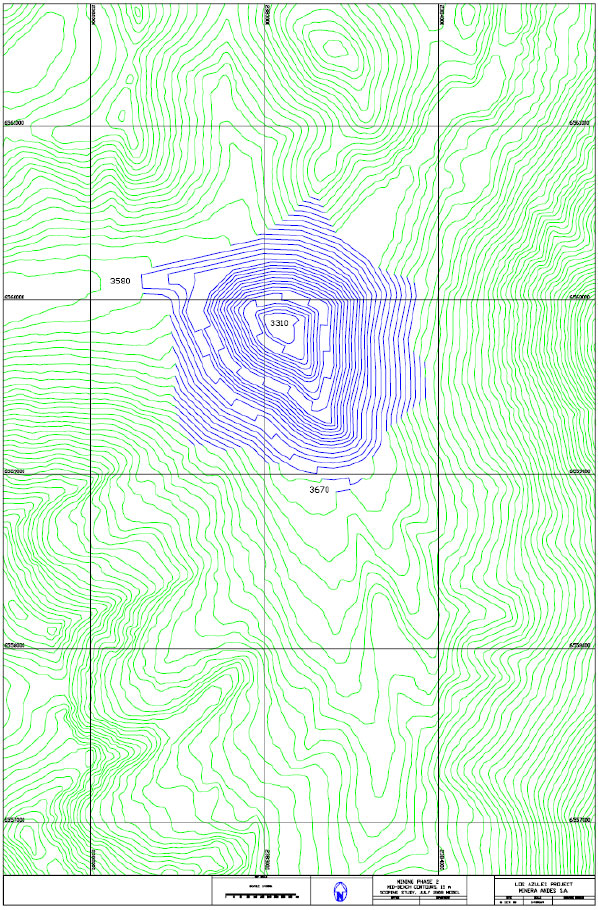
Figure 26.2 – Mining Phase 2
Los Azules Preliminary Assessment Technical Report
SE Project No. 8019-01
237
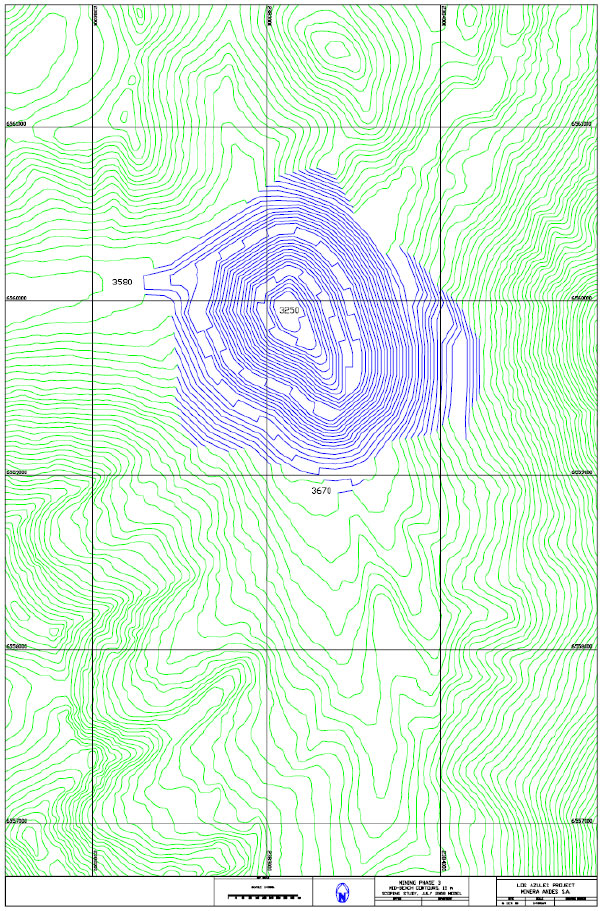
Figure 26.3 – Mining Phase 3
Los Azules Preliminary Assessment Technical Report
SE Project No. 8019-01
238
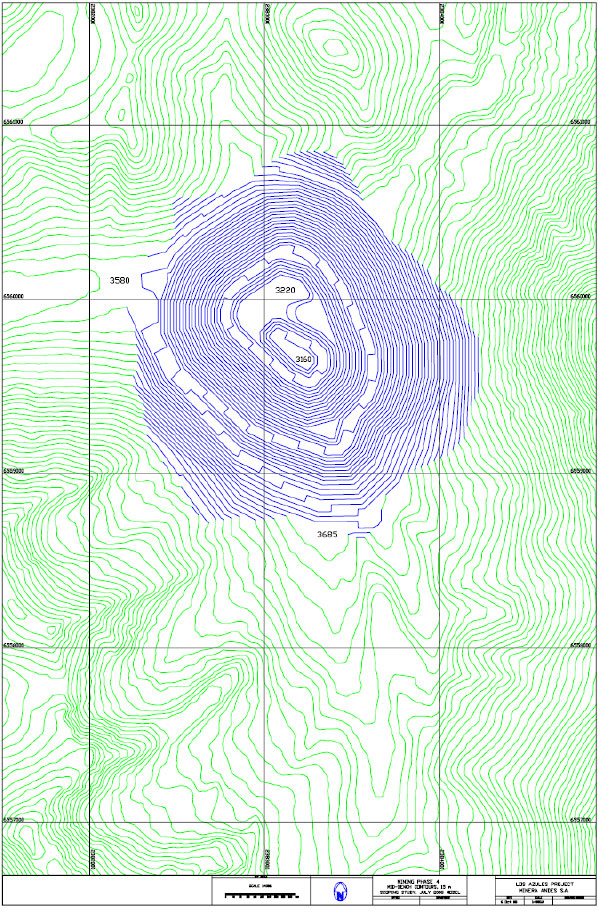
Figure 26.4 – Mining Phase 4
Los Azules Preliminary Assessment Technical Report
SE Project No. 8019-01
239
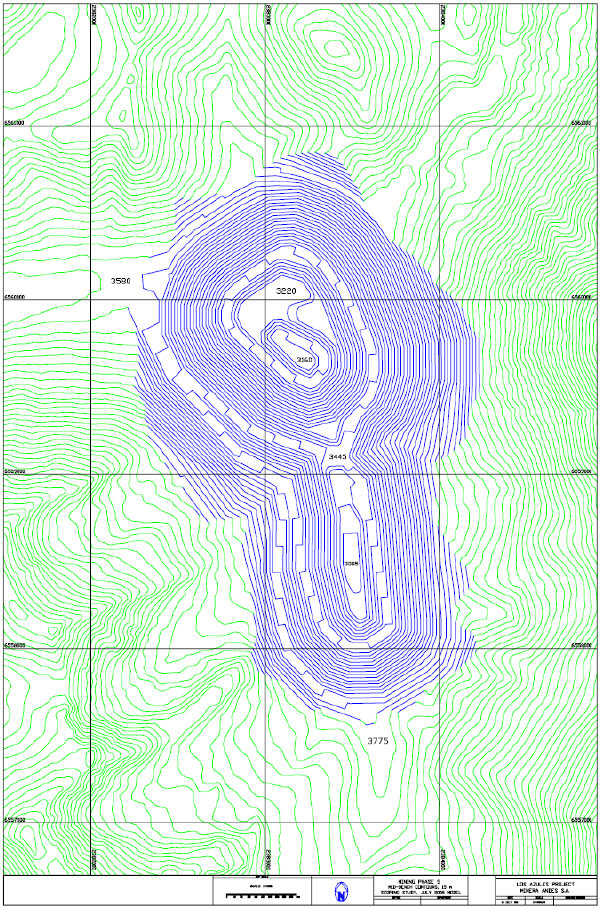
Figure 26.5 – Mining Phase 5
Los Azules Preliminary Assessment Technical Report
SE Project No. 8019-01
240
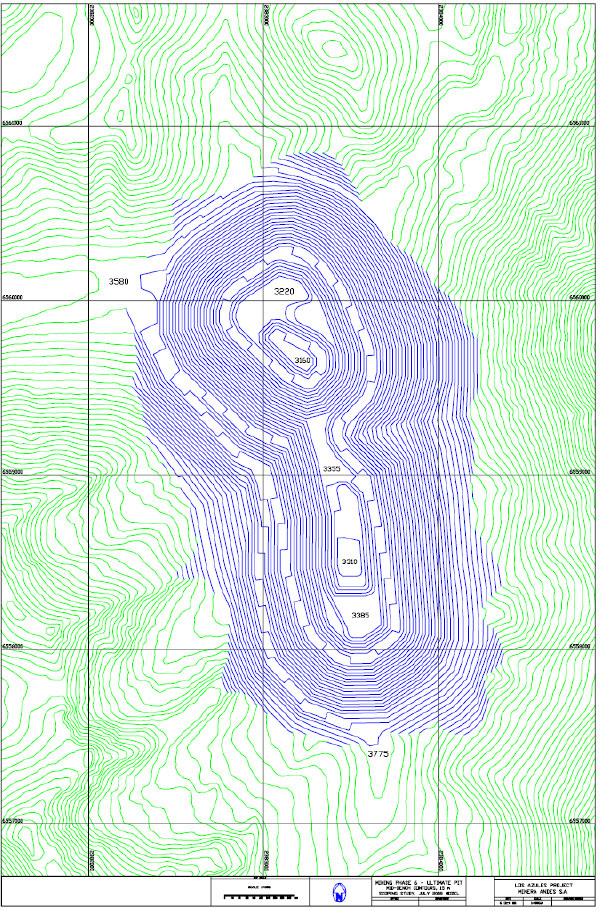
Figure 26.6 – Mining Phase 6 (Ultimate Pit)
Los Azules Preliminary Assessment Technical Report
SE Project No. 8019-01
241
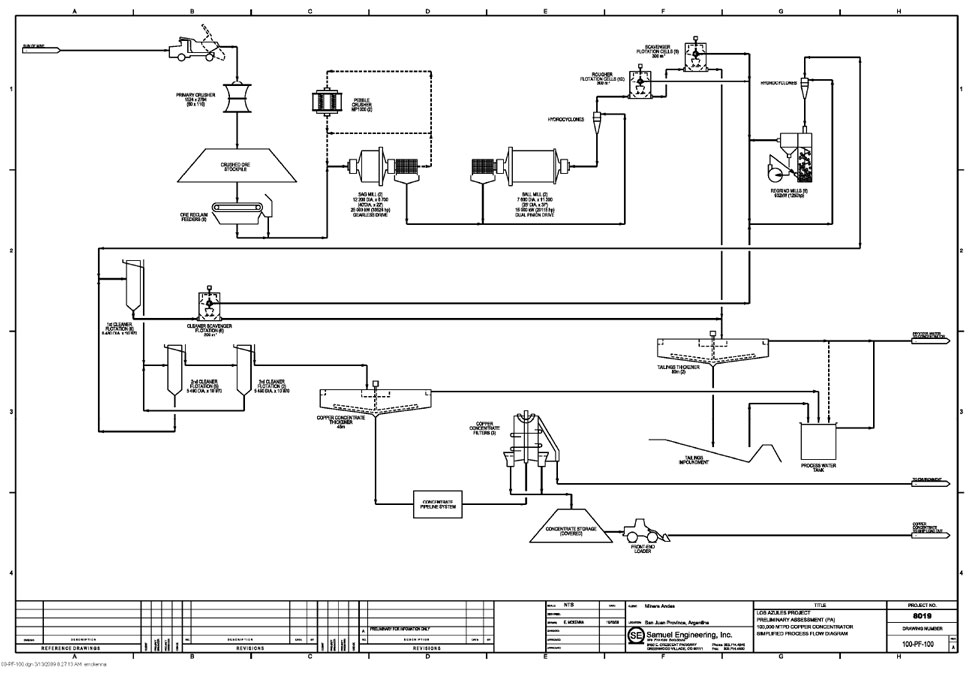
Figure 26.7 – Simplified Process Flow Diagram
Los Azules Preliminary Assessment Technical Report
SE Project No. 8019-01
242
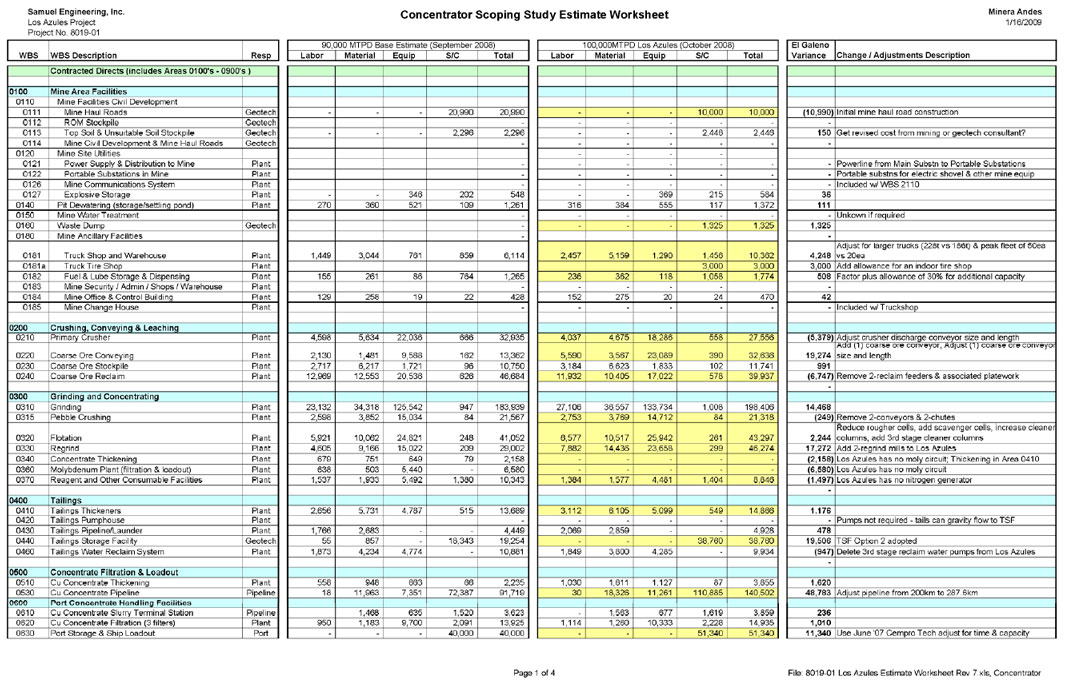
Figure 26.8 – Work Breakdown Structure (WBS) – Page 1
Los Azules Preliminary Assessment Technical Report
SE Project No. 8019-01
243
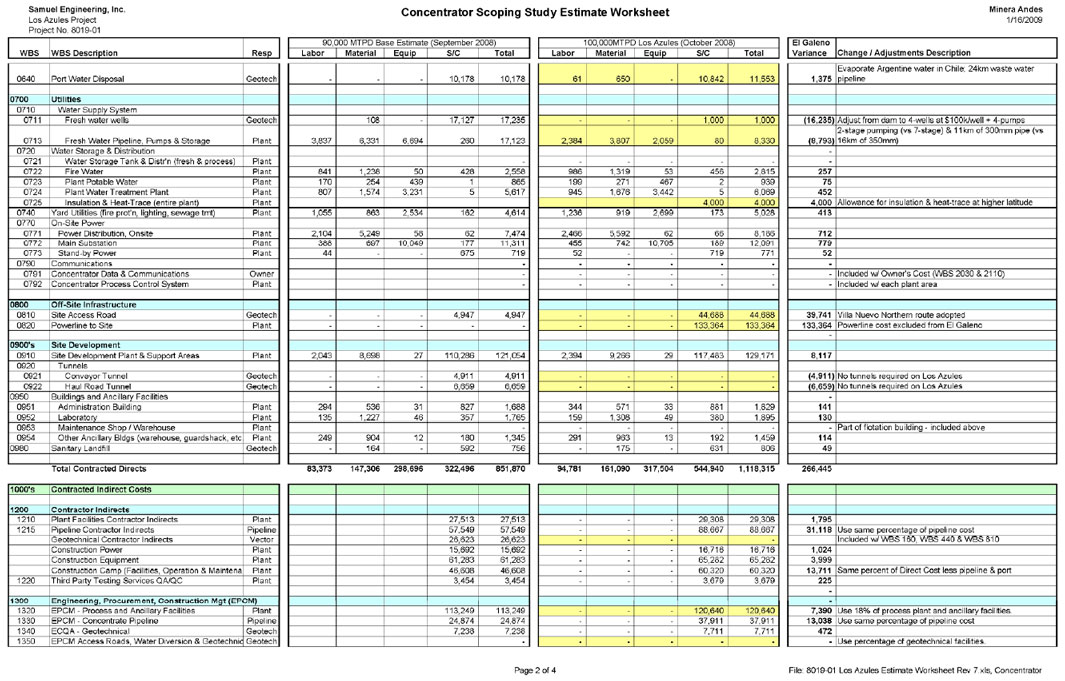
Figure 26.9 – Work Breakdown Structure (WBS) – Page 2
Los Azules Preliminary Assessment Technical Report
SE Project No. 8019-01
244
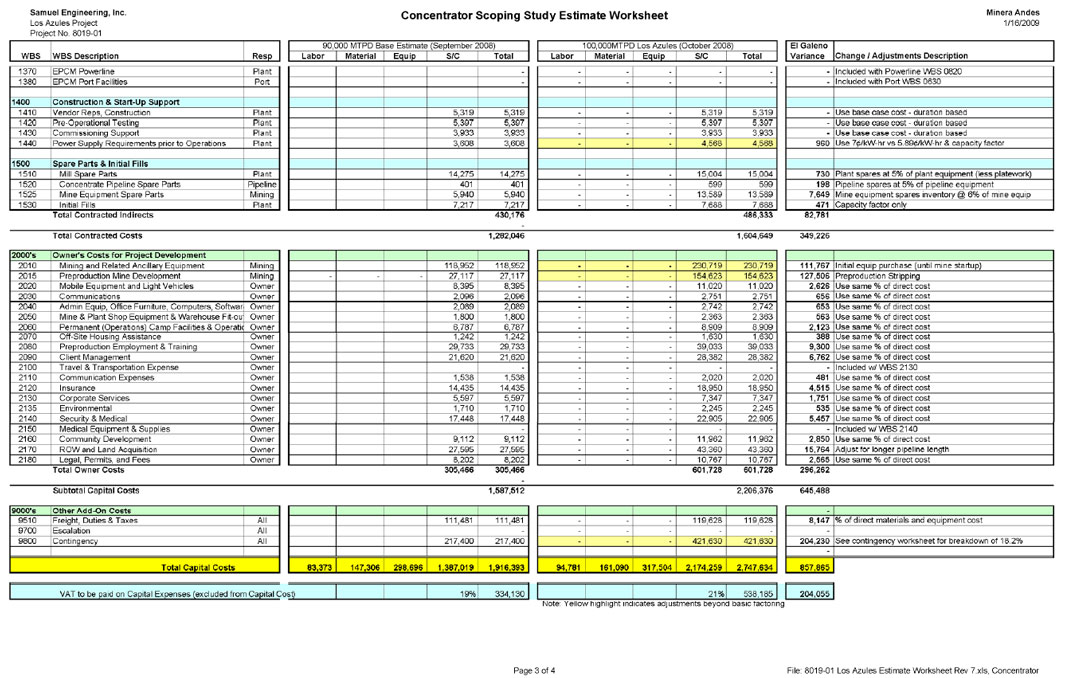
Figure 26.10 – Work Breakdown Structure (WBS) – Page 3
Los Azules Preliminary Assessment Technical Report
SE Project No. 8019-01
245
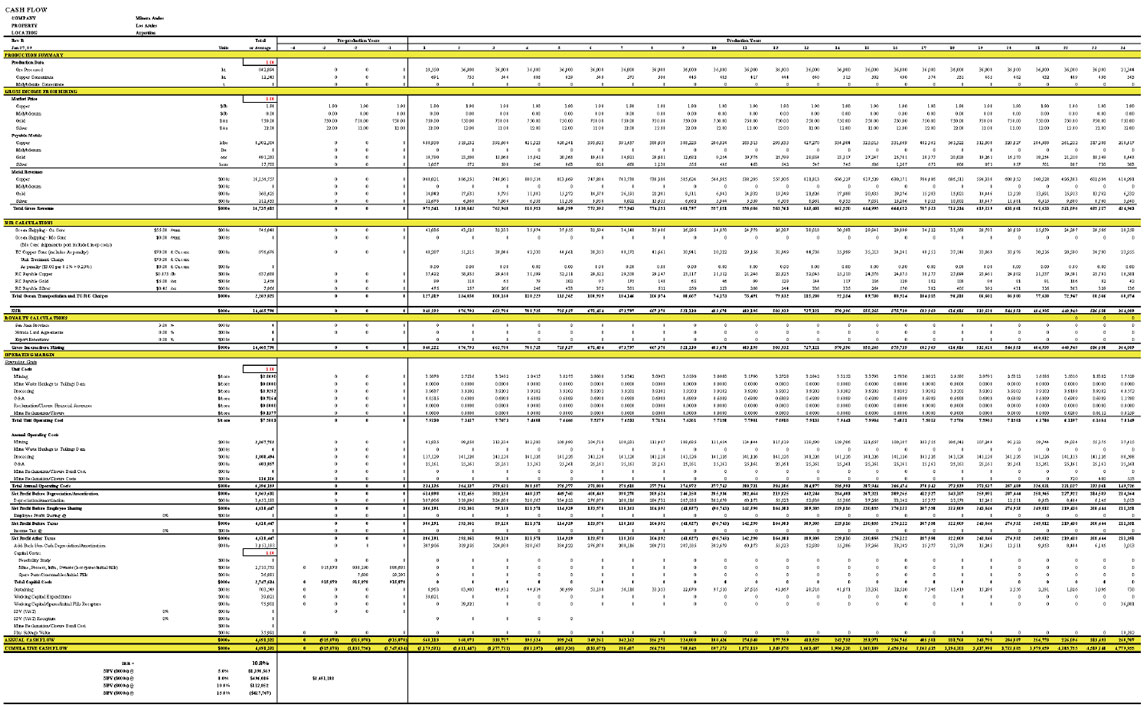
Figure 26.11 – Pro Forma Cash Flow
Los Azules Preliminary Assessment Technical Report
SE Project No. 8019-01
246