Exhibit 99.1
NI 43-101 Technical Report
Minera Andes Inc.
San José Silver-Gold Project
Santa Cruz, Argentina
Prepared for:
Minera Andes Inc.
111 East Magnesium Rd., Suite A
Spokane, WA 99208
United States
(509) 921-7322
SRK Project Number: 171602
Prepared by:

7175 W. Jefferson Ave.
Suite 3000
Lakewood, CO 80235
Effective Date: January 30, 2009
Report Date: May 29, 2009
Endorsed by QP’s:
Leah Mach, CPG, MSc
Chris Elliott, B.Eng.(Mining), MAusIMM
Exhibit 99.1
| |
Minera Andes Inc. | i |
San José Silver-Gold Project | NI 43-101 Technical Report |
Table of Contents
| | | | |
1 | INTRODUCTION (ITEM 4) | 1-1 |
| 1.1 | Terms of Reference and Purpose of the Technical Report | 1-1 |
| 1.2 | Reliance on Other Experts (Item 5) | 1-1 |
| | 1.2.1 | Sources of Information | 1-1 |
| 1.3 | Effective Date | 1-1 |
| 1.4 | Qualifications of Consultants (SRK) | 1-2 |
| | 1.4.1 | Site Visit | 1-3 |
2 | PROPERTY DESCRIPTION AND LOCATION (ITEM 6) | 2-1 |
| 2.1 | Property Location | 2-1 |
| 2.2 | Mineral Title in Argentina | 2-1 |
| 2.3 | Mineral Tenure for the San Jose Property | 2-3 |
| 2.4 | Location of Mineralization | 2-5 |
| 2.5 | Royalties, Agreements and Encumbrances | 2-5 |
| 2.6 | Environmental Liabilities and Permitting | 2-8 |
| | 2.6.1 | Environmental Liabilities | 2-8 |
| | 2.6.2 | Required Permits and Status | 2-8 |
3 | ACCESSIBILITY, CLIMATE, LOCAL RESOURCES, INFRASTRUCTURE AND PHYSIOGRAPHY (ITEM 7) | 3-1 |
| 3.1 | Topography, Elevation and Vegetation | 3-1 |
| 3.2 | Climate and Length of Operating Season | 3-1 |
| 3.3 | Physiography | 3-1 |
| 3.4 | Access to Property | 3-1 |
| 3.5 | Surface Rights | 3-1 |
| | 3.5.1 | Estancia Carmancita | 3-2 |
| | 3.5.2 | Estancia San José | 3-2 |
| 3.6 | Local Resources and Infrastructure | 3-2 |
| | 3.6.1 | Access Road and Transportation | 3-2 |
| | 3.6.2 | Power Supply | 3-3 |
| | 3.6.3 | Water Supply | 3-3 |
| | 3.6.4 | Camp Site, Buildings and Ancillary Facilities | 3-3 |
| | 3.6.5 | Waste Disposal Area | 3-4 |
| | 3.6.6 | Manpower | 3-4 |
4 | HISTORY (ITEM 8) | 4-1 |
| 4.1 | Ownership | 4-1 |
| 4.2 | Past Exploration and Development | 4-1 |
| 4.3 | Historic Mineral Resource and Reserve Estimates | 4-3 |
| 4.4 | Historic Production | 4-4 |
5 | GEOLOGIC SETTING (ITEM 9) | 5-1 |
| 5.1 | Regional Geology | 5-1 |
| 5.2 | San José Regional and Local Geology | 5-1 |
| | 5.2.1 | Bajo Pobre Formation (Upper Jurassic) | 5-1 |
| | 5.2.2 | Chon Aike/La Matilde Formation (Upper Jurassic) | 5-3 |
| | 5.2.3 | Castillo Formation (Cretaceous) | 5-5 |
| |
SRK Consulting (U.S.), Inc. | May 29, 2009 |
Exhibit 99.1
| |
Minera Andes Inc. | ii |
San José Silver-Gold Project | NI 43-101 Technical Report |
| | | | |
| | 5.2.4 | Alma Gaucha Formation (Tertiary) | 5-5 |
| | 5.2.5 | Fluvio-glacial Till Deposits | 5-6 |
| | 5.2.6 | Geology of the Saavedra West Zone | 5-6 |
| | 5.2.7 | Structure | 5-7 |
6 | DEPOSIT TYPE (ITEM 10) | 6-1 |
| 6.1 | Introduction | 6-1 |
| 6.2 | Some General Characteristics of Low Sulphidation Epithermal Gold Deposits | 6-1 |
7 | MINERALIZATION (ITEM 11) | 7-1 |
| 7.1 | Mineralized Zones | 7-1 |
| | 7.1.1 | Huevos Verdes | 7-1 |
| | 7.1.2 | Kospi | 7-2 |
| | 7.1.3 | Frea | 7-2 |
| | 7.1.4 | Odin and Ayelin | 7-2 |
| | 7.1.5 | Regional Exploration Targets | 7-2 |
| 7.2 | Surrounding Rock Types | 7-3 |
| 7.3 | Relevant Geological Controls | 7-3 |
| | 7.3.1 | Structural Model | 7-4 |
| 7.4 | Type, Character and Distribution of Mineralization | 7-5 |
8 | EXPLORATION (ITEM 12) | 8-1 |
| 8.1 | Surveys and Investigations | 8-1 |
| | 8.1.1 | Minera Andes | 8-1 |
| | 8.1.2 | MSC | 8-2 |
| 8.2 | Summary | 8-5 |
| 8.3 | Interpretation | 8-6 |
| 8.4 | Exploration Potential | 8-7 |
9 | | DRILLING (ITEM 13) | 9-1 |
| 9.1 | Type and Extent of Drilling | 9-1 |
| 9.2 | Procedures | 9-1 |
| 9.3 | Results | 9-3 |
10 | | SAMPLING METHOD AND APPROACH (ITEM 14) | 10-1 |
| 10.1 | Drilling Programs | 10-1 |
| | 10.1.1 | Minera Andes RC Drilling (1998 to 2000) | 10-1 |
| | 10.1.2 | Minera Andes Diamond Drilling (2000) | 10-1 |
| | 10.1.3 | MSC Core Drilling (2001) | 10-2 |
| | 10.1.4 | MSC Core Drilling (2002 to 2007) | 10-2 |
| 10.2 | Trenching | 10-3 |
| | 10.2.1 | Minera Andes Trenching (1997 to 2000) | 10-3 |
| | 10.2.2 | MSC Trenching (2002) | 10-3 |
| 10.3 | Underground Channel Chip Sampling (2004 to 2007) | 10-4 |
| 10.4 | 2008 Sampling | 10-4 |
| 10.5 | Factors Impacting Accuracy of Results | 10-5 |
| 10.6 | Sample Quality | 10-5 |
11 | | SAMPLE PREPARATION, ANALYSES AND SECURITY (ITEM 15) | 11-1 |
| 11.1 | Drilling Programs | 11-1 |
| | 11.1.1 | Minera Andes RC Drilling (1998 to 2000) | 11-1 |
| |
SRK Consulting (U.S.), Inc. | May 29, 2009 |
Exhibit 99.1
| |
Minera Andes Inc. | iii |
San José Silver-Gold Project | NI 43-101 Technical Report |
| | | | | |
| | 11.1.2 | Minera Andes Diamond Drilling (2000) | 11-1 |
| | 11.1.3 | MSC Core Drilling (2001) | 11-1 |
| | 11.1.4 | MSC Core Drilling (2002 to 2005) | 11-2 |
| | 11.1.5 | MSC Core Drilling (2006-2007) | 11-2 |
| 11.2 | Quality Assurance/Quality Control Programs | 11-2 |
| | 11.2.1 | Minera Andes RC and Core Drilling Programs (1998 to 2000) | 11-2 |
| | 11.2.2 | MSC Core Drilling Programs (2001 to 2003) | 11-2 |
| | 11.2.3 | MSC Core Drilling and Underground Programs (2004 to 2005) | 11-2 |
| | 11.2.4 | MSC Core Drilling and Underground Programs (2006-2007) | 11-5 |
| | 11.2.5 | AMEC Recommendations (2007) | 11-8 |
| 11.3 | MSC Analytical and QA/QC 2008 | 11-9 |
| 11.4 | Interpretation | 11-11 |
12 | DATA VERIFICATION (ITEM 16) | 12-1 |
| 12.1 | Verification | 12-1 |
| 12.2 | Limitations | 12-1 |
13 | ADJACENT PROPERTIES (ITEM 17) | 13-1 |
14 | MINERAL PROCESSING AND METALLURGICAL TESTING (ITEM 18) | 14-1 |
| 14.1 | Ore and Mineralogy Description | 14-1 |
| | 14.1.1 | Gold | 14-1 |
| | 14.1.2 | Silver | 14-1 |
| 14.2 | Metallurgical Test Programs | 14-2 |
| | 14.2.1 | Degerstrom – U.S. (1998-1999) | 14-2 |
| | 14.2.2 | Tecsup - Peru (2002) | 14-2 |
| | 14.2.3 | Plenge (2004) | 14-3 |
| | 14.2.4 | Lakefield/SGS - Canada (2004-2005) | 14-3 |
| | 14.2.5 | Gekko - Australia (2006-2007) | 14-4 |
| | 14.2.6 | Tecsup - Peru (2007) | 14-4 |
| 14.3 | Metallurgical Test Results | 14-5 |
| | 14.3.1 | Degerstrom – U.S. (1998-1999) | 14-5 |
| | 14.3.2 | Tecsup - Peru (2002) | 14-5 |
| | 14.3.3 | Plenge (2004) | 14-5 |
| | 14.3.4 | Lakefield/SGS - Canada (2004-2005) | 14-5 |
| | 14.3.5 | Gekko - Australia (2006-2007) | 14-6 |
| | 14.3.6 | Tecsup - Peru (2007) | 14-7 |
| | 14.3.7 | Summary of Metallurgical Test Results | 14-8 |
| 14.4 | Process Circuit Selection | 14-8 |
| | 14.4.1 | Metallurgical Basis for Process Circuit Selection | 14-9 |
15 | MINERAL RESOURCES AND MINERAL RESERVE ESTIMATES (ITEM 19) | 15-1 |
| 15.1 | Resource Estimation | 15-1 |
| | 15.1.1 | Database | 15-1 |
| | 15.1.2 | Geology | 15-1 |
| | 15.1.3 | Capping | 15-3 |
| | 15.1.4 | Compositing | 15-3 |
| | 15.1.5 | Specific Gravity | 15-4 |
| | 15.1.6 | Variogram Analysis and Modeling | 15-5 |
| | 15.1.7 | Grade Estimation | 15-5 |
| |
SRK Consulting (U.S.), Inc. | May 29, 2009 |
Exhibit 99.1
| |
Minera Andes Inc. | iv |
San José Silver-Gold Project | NI 43-101 Technical Report |
| | | | | |
| | 15.1.8 | Model Validation | 15-7 |
| | 15.1.9 | Resource Classification | 15-7 |
| | 15.1.10 | Mineral Resource Statement | 15-8 |
| | 15.1.11 | Mineral Resource Sensitivity | 15-8 |
| 15.2 | Reserve Estimation | 15-9 |
| | 15.2.1 | Contained Value Calculation | 15-10 |
| | 15.2.2 | Cut-off Value Estimate | 15-11 |
| | 15.2.3 | Mining Dilution | 15-12 |
| | 15.2.4 | Mining Recovery | 15-13 |
| | 15.2.5 | Comparison of Modifying Factors | 15-13 |
| | 15.2.6 | Reserve Estimate | 15-14 |
| | 15.2.7 | Conversion of Mineral Resources to Mineral Reserves | 15-14 |
16 | OTHER RELEVANT DATA AND INFORMATION (ITEM 20) | 16-1 |
| 16.1 | Depletion of Resources and Reserve | 16-1 |
| 16.2 | Comparison of Reserve Estimates | 16-1 |
| 16.3 | Material Occurrences in the Six Months to December 31, 2008 | 16-2 |
17 | ADDITIONAL REQUIREMENTS FOR DEVELOPMENT AND PRODUCTION PROPERTIES (ITEM 25) | 17-1 |
| 17.1 | Mining Operations | 17-1 |
| | 17.1.1 | Rock Mechanics | 17-2 |
| | 17.1.2 | Mine Access and Development | 17-3 |
| 17.2 | Mining Method | 17-4 |
| | 17.2.1 | Mining Equipment | 17-5 |
| | 17.2.2 | Services | 17-6 |
| | 17.2.3 | Mine Ventilation | 17-7 |
| | 17.2.4 | Waste Rock | 17-7 |
| | 17.2.5 | Mining Method Outlook | 17-7 |
| 17.3 | Processing | 17-8 |
| | 17.3.1 | Recoverability | 17-9 |
| 17.4 | Markets and Contracts | 17-10 |
| 17.5 | Environmental Considerations | 17-10 |
| 17.6 | Taxes and Royalties | 17-10 |
| 17.7 | Capital and Operating Costs | 17-12 |
| | 17.7.1 | Capital Costs | 17-12 |
| | 17.7.2 | Operating Costs | 17-12 |
| | 17.7.3 | Payback | 17-13 |
| 17.8 | Economic Analysis | 17-13 |
| | 17.8.1 | LoM Plan and Economics | 17-13 |
| | 17.8.2 | Sensitivity | 17-14 |
18 | INTERPRETATION AND CONCLUSIONS (ITEM 21) | 18-1 |
| 18.1 | Geology and Mineralization | 18-1 |
| 18.2 | Field Surveys | 18-1 |
| 18.3 | Analytical and Testing Data | 18-1 |
| 18.4 | Mineral Resources | 18-2 |
| 18.5 | Mineral Reserves | 18-2 |
| 18.6 | Economics | 18-2 |
| |
SRK Consulting (U.S.), Inc. | May 29, 2009 |
Exhibit 99.1
| |
Minera Andes Inc. | v |
San José Silver-Gold Project | NI 43-101 Technical Report |
| | | | |
| 18.7 | Other Relevant Information | 18-2 |
| | 18.7.1 | Mine Development and Production | 18-2 |
19 | RECOMMENDATIONS (ITEM 22) | 19-1 |
| 19.1 | Geology and Resources | 19-1 |
| 19.2 | Mining and Reserves | 19-1 |
| 19.3 | Metallurgy and Processing | 19-1 |
20 | REFERENCES (ITEM 23) | 20-1 |
21 | GLOSSARY | 21-1 |
| 21.1 | Mineral Resources and Reserves | 21-1 |
| | 21.1.1 | Mineral Resources | 21-1 |
| | 21.1.2 | Mineral Reserves | 21-1 |
| 21.2 | Glossary | 21-3 |
List of Tables
| |
Table 1: Mineral Resource Statement, Including Reserves* | IV |
Table 2: Mineral Resources, 49% Attributable to MAI, Including Reserves* | IV |
Table 3: Mineral Reserve Statement, June 30, 2008 | IV |
Table 4: Mineral Reserve Attributable to Minera Andes, June 30, 2008 | V |
Table 5: LoM Economic Results | VIII |
Table 6: Project NPV Sensitivity to discount rate(US$000’s) | VIII |
Table 2.3.1: San José Mineral Concessions | 2-4 |
Table 2.6.2.1: Permits, Applied for or Granted | 2-9 |
Table 4.2.1: General Exploration History of San José Property | 4-2 |
Table 4.3.1: San José - Mineral Resources, June 30, 2007* | 4-3 |
Table 4.3.2: Proven and Probable Mineral Reserves – June 30, 2007* | 4-4 |
Table 4.4.1: Mine Production, 2007 and 2008 | 4-4 |
Table 8.2.1: Surface Samples Collected at San José | 8-5 |
Table 8.2.2: Trenches and Trench Sample Summary | 8-6 |
Table 8.2.3: Geophysical Surveys Completed at San José | 8-6 |
Table 9.1.1: San José Exploration Yearly Drilling Summary | 9-1 |
Table 11.1.4.1: Analytical Methods | 11-2 |
Table 11.2.3.1: Summary of 2004 to 2005 QA/QC Program | 11-3 |
Table 11.2.4.1: Summary of 2006 QA/QC Program (Kospi Vein Core Drilling) | 11-5 |
Table 11.2.4.2: Duplicate Sample Evaluation, Kospi Vein | 11-6 |
Table 11.2.4.3: Summary of 2005-June 2007 QA/QC Programs* | 11-7 |
| |
SRK Consulting (U.S.), Inc. | May 29, 2009 |
Exhibit 99.1
| |
Minera Andes Inc. | vi |
San José Silver-Gold Project | NI 43-101 Technical Report |
| |
Table 11.2.4.4: Twin Sample Evaluation, Channel Samples | 11-8 |
Table 11.3.1: Standards in Use at San José | 11-9 |
Table 14.3.4.1: Metallurgical Results from Test Work | 14-6 |
Table 14.3.5.1: Summary Results of Gekko Test Program | 14-6 |
Table 14.3.5.2: Concentrate Leach Test Results for Gekko | 14-7 |
Table 14.3.6.1: Test Results for Initial Metallurgical Amenability | 14-7 |
Table 14.3.6.2: Test Results for Metallurgical Amenability Tests | 14-7 |
Table 14.4.1.1: Production Results for the San José Process Plant for 2008 | 14-11 |
Table 15.1.2.1: Summary of Geologic Sections | 15-2 |
Table 15.1.2.2: Statistics of Assays within Mineralized Zone, by Area | 15-2 |
Table 15.1.3.1: Gold and Silver Capping Values | 15-3 |
Table 15.1.4.1: Statistics of Composite Interval Lengths | 15-3 |
Table 15.1.4.2: Statistics of Uncapped and Capped Composites in Mineralized Zones | 15-4 |
Table 15.1.5.1: Density Measurements, Huevos Verdes, Frea and Kospi | 15-4 |
Table 15.1.6.1: Relative Variogram Parameters | 15-5 |
Table 15.1.7.1: Block Model Definition | 15-6 |
Table 15.1.7.2: Estimation Parameters by Area | 15-6 |
Table 15.1.8.1: Comparison of Kriged and Nearest Neighbor Block Grades | 15-7 |
Table 15.1.9.1: Resource Classification Criteria | 15-8 |
Table 15.1.10.1: Mineral Resource Statement, Including Reserves* | 15-8 |
Table 15.1.10.2: Mineral Resources, 49% Attributable to MAI, Including Reserves* | 15-8 |
Table 15.1.11.1: Mineral Resource Sensitivity, Measured and Indicated | 15-9 |
Table 15.1.11.2: Mineral Resource Sensitivity, Inferred | 15-9 |
Table 15.2.2.1: Calculation of Cut-off Value | 15-11 |
Table 15.2.5.1: Comparison of Modifying Factors | 15-13 |
Table 15.2.6.1: Mineral Reserve Statement, June 30, 2008 | 15-14 |
Table 15.2.6.2: Mineral Reserve Attributable to Minera Andes, June 30, 2008 | 15-14 |
Table 16.1.1: Summary of Depletion to December 31, 2008 | 16-1 |
Table 16.2.1: Comparison of Modifying Factors | 16-2 |
Table 17.2.1.1: Major Equipment Inventory | 17-6 |
Table 17.3.1.1: SRK’s LoM Production Forecast for San José | 17-10 |
Table 17.7.1.1: LoM Capital Cost Estimates for San José (US$000s) | 17-12 |
Table 17.7.2.1: LoM Operating Cost Estimates for San José | 17-13 |
| |
SRK Consulting (U.S.), Inc. | May 29, 2009 |
Exhibit 99.1
| |
Minera Andes Inc. | vii |
San José Silver-Gold Project | NI 43-101 Technical Report |
| |
Table 17.8.1.1: LoM: LoM Economic Results | 17-14 |
Table 17.8.2.1: Project Sensitivity (NPV8%, US$000’s) | 17-15 |
Table 17.8.2.2: Project NPV Sensitivity to discount rate (US$000’s) | 17-15 |
Table 21.2.1: Glossary | 21-3 |
Table 21.2.2: Abbreviations | 21-4 |
List of Figures
| |
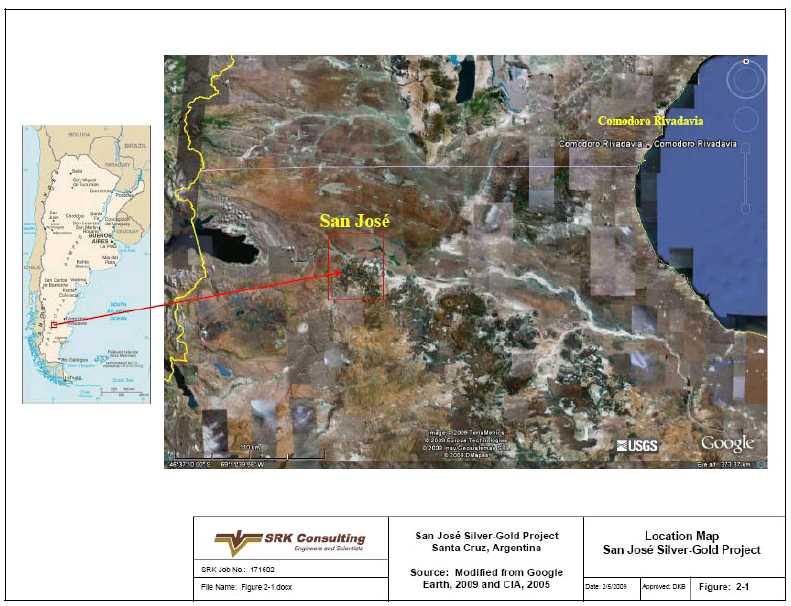
Figure 2-1: Location Map of the San José Silver-Gold Project | 2-10 |
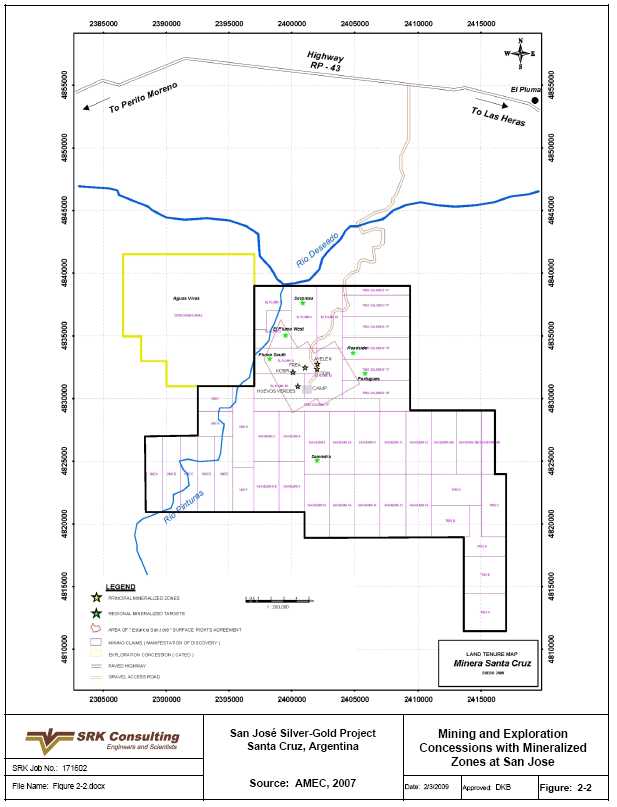
Figure 2-2: Mining and Exploration Concessions with Mineralized Zones at San José | 2-11 |
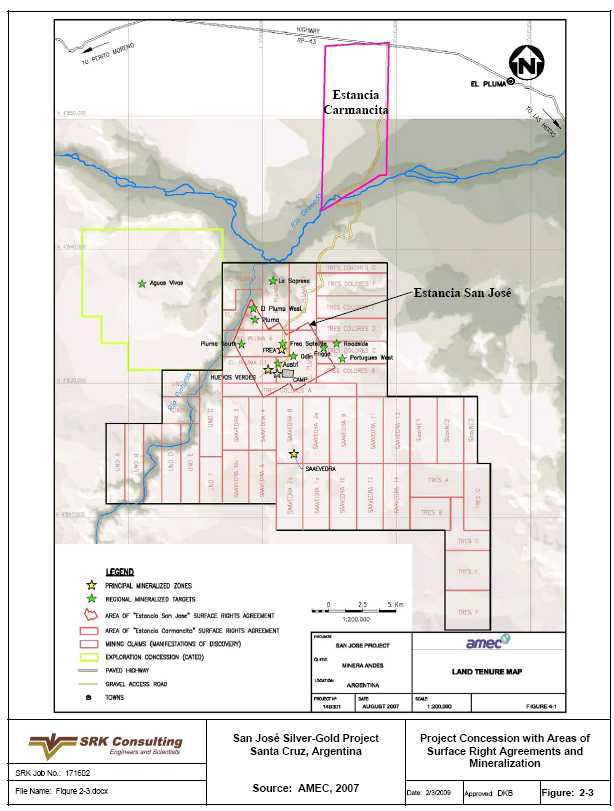
Figure 2-3: Project Concessions with Areas of Surface Right Agreements and Mineralization | 2-12 |
Figure 3-1: Mine Site Infrastructure Layout | 3-5 |
Figure 5-1: Regional Geology Map | 5-9 |
Figure 5-2: Local Geology Map | 5-10 |
Figure 5-3: Geology and Drilling at the Huevos Verdes, Frea and Kospi Zones | 5-11 |
Figure 5-4: Geology and Geophysical Anomalies, Saavedra West Target | 5-12 |
Figure 5-5: Principal Structural Lineaments | 5-13 |
Figure 7-1: San José Vein Zones In Plan View and Oblique View Looking Northwest | 7-6 |
Figure 7-2: Structural Formation of Veins at San José | 7-7 |
Figure 8-1: Chargeability Map Over Central Portion of the San José Property | 8-8 |
Figure 8-2: Resistivity Map Over Central Portion of the San José Property | 8-9 |
Figure 9-1: Drillhole Location Map at the San José Property | 9-5 |
Figure 11-1: Silver in Coarse Blank Samples, Underground Sampling | 11-13 |
Figure 14-1: Average Gekko Batch Leach Test Results | 14-12 |
Figure 15-1: Plan View Showing Drillholes, Vein Wireframes and Cross-section Lines | 15-16 |
Figure 15-2: Huevos Verdes South Cross Section A-A’ Drillholes and Vein | 15-17 |
Figure 15-3: Huevos Verdes North and Kospi Cross Section B-B’ Drillholes and Veins | 15-18 |
Figure 15-4: Frea, Odin, Ayelén Cross Section C – C’ Drillholes and Veins | 15-19 |
Figure 15-5: Huevos Verdes South Cross Section A-A’ Drillholes and Block Grades | 15-20 |
Figure 15-6: Huevos Verdes North and Kospi Cross Section B-B’ Drillholes and Block Grades | 15-21 |
Figure 15-7: Frea, Odin, Ayelén Cross Section C-C’ Drillholes and Block Grades | 15-22 |
Figure 15-8: Long Section – Huevos Verdes Showing Block Model and Location of Composites | 15-23 |
Figure 15-9: Long Section – Kospi Showing Block Grades and Location of Composites | 15-24 |
| |
SRK Consulting (U.S.), Inc. | May 29, 2009 |
Exhibit 99.1
| |
Minera Andes Inc. | viii |
San José Silver-Gold Project | NI 43-101 Technical Report |
| |
Figure 15-10: Long Section – Frea Showing Block Grades and Location of Composites | 15-25 |
Figure 15-11: Long Section – Odin Showing Block Grades and Location of Composites | 15-26 |
Figure 15-12: Long Section – Ayelén Showing Block Grades and Location of Composites | 15-27 |
Figure 15-13: Grade Tonnage Curves | 15-28 |
Figure 17-1: Schematic of Mining Sequence | 17-16 |
Figure 17-2: Simplified Flow Sheet - San José Process Plant | 17-17 |
List of Appendices
Appendix A
Certificates of Authors
| |
SRK Consulting (U.S.), Inc. | May 29, 2009 |
Exhibit 99.1
| |
Minera Andes Inc. | I |
San José Silver-Gold Project | NI 43-101 Technical Report |
Summary(Item 3)
Property Description and Location
The San José Silver-Gold Project (San José or the Project) is in southern Argentina in the Patagonian steppe, east of the Andes Mountains. The area is dominated by low rolling hills and incised valleys. Elevation ranges from 300 to 700masl. Vegetation is characteristic of arid to semi-arid steppes with tussock grasses and low growing bushes. The soil is poor, typical of harsh environments, and is not suitable for agriculture but supports sheep and cattle grazing.
The Project can be accessed from Buenos Aires by flying to the town of Comodoro Rivadavia, then driving 350km along paved and unpaved roads.
Ownership
Minera Santa Cruz S.A. (MSC) holds 100% interest in the Project. MSC is a joint venture between Minera Andes S.A. (MASA) (49%) and Hochschild Mining (Argentina) Corporation (HMC) (51%). MASA is an indirect wholly-owned subsidiary of Minera Andes Inc. (MAI). HMC is a wholly owned subsidiary of Hochschild Mining plc (HMP).
The Project covers 50,491ha, comprising 46 contiguous Mining Claims (eight “Minas” or approved mining claims; and 38 “Manifestations” or claims that are in the application process for mining claim status) and one exploration claim (Cateo). Mineral Reserves are hosted on “Minas” El Pluma E3 and El Pluma 4. The claims are all in good standing, with the appropriate annual holding costs paid. MSC holds the surface rights to the “San José Estancia,” where the mine and associated infrastructure are constructed and the “La Carmancita Estancia,” which provides right of way access between the mine and closest paved highway.
In Argentina, surface rights are not associated with minas or exploration claims and must be negotiated with landowners. MSC has agreements with two property owners for surface rights at the Project. These surface rights cover the main access route to San José from the highway and all required mine infrastructure, tailings, dumps and included compensation for exploration activities. The local landowners are the Beitía Family, who control the Estancia San José, from which the Project takes its name, and the Flores Family who own the Estancia Carmancita. The Estancia San José includes land over the mine and the Estancia Carmancita includes land between the Project and the highway. These surface rights are sufficient for access, mining and exploration activities.
Geology and Mineralization
The Project is located in the northwest corner of the Deseado massif in Southern Argentina. The massif consists of Paleozoic metamorphic rocks overlain by Jurassic volcanics which host several gold and silver bearing deposits such as Cerro Vanguardia, Martha, Manantial Espejo and San José.
The host rock of the San José deposit is the Jurassic Bajo Pobre Formation, the lowermost stratigraphic unit on the property which comprises a Lower Andesite Volcaniclastic Unit and an Upper Andesite Lava Flow Unit. The formation is approximately 120m in thickness. Andesitic volcanic rocks of the Bajo Pobre Formation are overlain by volcanic rocks of the Chon Aike Formation.
| |
SRK Consulting (U.S.), Inc. | May 29, 2009 |
Exhibit 99.1
| |
Minera Andes Inc. | II |
San José Silver-Gold Project | NI 43-101 Technical Report |
The main structural trend of faults and the majority of vein systems on the San José property is northwest to north–northwest. Less prominent are faults and mineralized features strike east and to a minor extent north to north–northeast.
The San José District is transected by two north–northeast-striking major lineaments. The Rio Pinturas lineament follows the Rio Pinturas valley and is one of the main structural features of the northwestern Deseado massif. This lineament can be traced over a distance of 100km. A second subparallel lineament is located approximately 2km east of the Rio Pinturas lineament.
There are currently five mineralized vein zones of economic interest on the San José property. These veins and their currently explored strike lengths from south to north are:
·
Huevos Verdes—2km long, striking 325º, average dip 75ºE (42ºE in the south);
·
Kospi—1.3km long, striking 307º, average dip 56ºW;
·
Frea—1km long, striking 312º, average dip 50ºE;
·
Odin—1.9km long, striking 291º, average dip 67ºW; and
·
Ayelin—1.6km long, striking 285º, average dip 60ºW.
All of the veins average 1 to 2m in thickness but can be up to 4m wide. They are found within a north-south trending mineralized belt approximately 2.5km in length. All five vein zones are hosted by the Bajo Pobre Formation, strike northwest and have similar metal zoning. Metal zoning is characterized by a decrease in Ag and Au grade and increasing base metal concentrations with depth. Huevos Verdes South (HVS) was exposed at surface, but all other veins were “blind” targets and discovered through drilling and geophysical surveys.
The vein systems at Huevos Verdes, and possibly also at Frea, developed along northwest-striking sinistral strike-slip faults that were possibly reactivated during a period of Triassic rifting.
The gold and silver mineralization on the San José property is considered to be typical of low-sulfidation (LS) epithermal-style deposits. The epithermal environment is typically shallow in depth, hosting deposits of Au, Ag, and base metals plus Hg, Sb, S, kaolinite, alunite and silica (Hedenquist et al., 2000). Historically, epithermal–hydrothermal deposits have been exploited for a wide variety of metal and minerals; however, many of the more economically significant deposits are mined for their precious metal contents.
Exploration
Most of the vein zones at San José are blind targets and require indirect exploration methods to identify favorable targets. MAI and subsequently MSC have used a combination of several techniques to successfully identify exploration targets. These have included various types of soil sampling and geophysical surveys. Once the target is identified, trenching and drilling are used to confirm mineralization. Drilling is further used to delineate resources and with additional detail, underground mining is started.
Because most of the targets at San José are blind, remote sensing has been an integral part of locating and defining the orebodies. Resistivity/IP surveys have been used to find many of the vein zones at San José.
| |
SRK Consulting (U.S.), Inc. | May 29, 2009 |
Exhibit 99.1
| |
Minera Andes Inc. | III |
San José Silver-Gold Project | NI 43-101 Technical Report |
A total of 702 RC and diamond drillholes in 124,556.34m have been drilled at San José between 1998 and June 2008. Drilling conducted by MAI between 1998 and 2000, included 85 RC holes and three diamond drillholes. Since 2001, all drilling has been conducted by MSC, and during this time, MSC has completed five RC holes and 609 diamond drillholes within the Project area The majority of drilling has been from surface but also includes underground drilling in the Kospi area. Exploration drilling has been used in conjunction with geophysical and geochemical surveys to identify potential mineralized zones. Since 2004, the majority of drilling has been focused in the Huevos Verdes, Frea and Kospi vein systems, to provide infill drilling for resource definition and delineation. Recently, MSC has conducted drilling programs at the Ayelen and Odin veins and has added those areas to its resource base.
MSC is conducting underground channel sampling and underground drilling for use in resource estimation and has an on-going exploration program to identify and drill new target areas.
Mineral Resources
The mineral resource estimates for the San José were prepared by employees of MSC and MHP, the majority owner and operator of MSC. The processes were reviewed and the results were audited by SRK.
The samples database contains information for drilling (RC and core), underground channel samples and surface trenches. Channel and trench samples are treated as drill samples in the database, with collars, bearing and inclination and sample intervals. The assay intervals are coded with a variable “ore” that denotes its presence in a structure. The coding is based on a minimum length of about 0.9m and a silver equivalent value based on US$600/oz gold and US$10.50/oz silver, without consideration to recovery. Vertical cross-sections were constructed perpendicular to the strike of the structures. Polygons were drawn on each cross-section to outline the mineralization. Wireframe solids were constructed from the polygons for each vein.
Log-normal probability plots of the raw assays were examined to determine capping limits for gold and silver. Assays were composited on 2m intervals using only the intercepts defined as “ore”, except Huevos Verdes where the interval length was 1m. The capping values were applied to the composites after the compositing run. Variography studies were completed using composites at Huevos Verdes, Frea and Kospi.
Six block models were created, one for each of the resource areas. The block models were oriented parallel to the strike of the mineralized zone with cell size of 10m x 10m x 10m. The block model contains variables for percent of block within the structure, thickness of the vein, diluted vein thickness, Ag, Au, number of composites used in estimation, distance to the nearest composite and number of drillholes used in estimation. The block grades at Huevos Verdes, Frea and Kospi were estimated with Ordinary Kriging within the vein structures and using composites which had been designated as “ore” as described above. The block grades of Huevos Verdes Ramal (HVR), Ayelén and Odin were estimated with the Inverse Distance Squared (ID2) algorithm. The resources were classified as measured, indicated, or inferred based on the distance to the nearest composite and the n umber of composites used in the estimation. The resources, including reserves, for the San José Project as of June 30, 2008 are presented in Table 1 and the 49% of the resources attributable to MAI is contained in Table 2.
| |
SRK Consulting (U.S.), Inc. | May 29, 2009 |
Exhibit 99.1
| |
Minera Andes Inc. | IV |
San José Silver-Gold Project | NI 43-101 Technical Report |
Table 1: Mineral Resource Statement, Including Reserves*
| | | | | | | | | | | | |
| Measured | Indicated | Measured and Indicated | Inferred |
Vein | kt | Ag
g/t | Au
g/t | kt | Ag
g/t | Au
g/t | kt | Ag
g/t | Au
g/t | kt | Ag
g/t | Au
g/t |
Huevos Verdes | 292 | 649 | 8.57 | 268 | 398 | 4.88 | 560 | 529 | 6.80 | 25 | 249 | 3.46 |
Frea | 446 | 415 | 8.77 | 299 | 312 | 7.63 | 745 | 374 | 8.31 | 113 | 181 | 4.27 |
Odin | 0 | 0 | 0.00 | 196 | 298 | 5.27 | 196 | 298 | 5.27 | 371 | 237 | 4.88 |
Kospi | 0 | 0 | 0.00 | 887 | 609 | 6.86 | 887 | 609 | 6.86 | 58 | 813 | 11.38 |
Ayelén | 0 | 0 | 0.00 | 79 | 466 | 6.22 | 79 | 466 | 6.22 | 334 | 476 | 5.31 |
HVR | 12 | 446 | 5.16 | 19 | 420 | 4.67 | 31 | 430 | 4.86 | 11 | 414 | 4.43 |
Total | 750 | 507 | 8.63 | 1,749 | 483 | 6.46 | 2,499 | 490 | 7.11 | 912 | 356 | 5.33 |
*June 30, 2008 at a cut-off of 181g/t AgEq
Table 2: Mineral Resources, 49% Attributable to MAI, Including Reserves*
| | | | | | | | | | | | |
Vein | Measured | Indicated | Measured and Indicated | Inferred |
kt | Ag g/t | Au g/t | kt | Ag g/t | Au g/t | kt | Ag g/t | Au g/t | kt | Ag g/t | Au g/t |
Huevos Verdes | 143 | 649 | 8.57 | 131 | 398 | 4.88 | 274 | 529 | 6.80 | 12 | 249 | 3.46 |
Frea | 218 | 415 | 8.77 | 147 | 312 | 7.63 | 365 | 374 | 8.31 | 55 | 181 | 4.27 |
Odin | 0 | 0 | 0.00 | 96 | 298 | 5.27 | 96 | 298 | 5.27 | 182 | 237 | 4.88 |
Kospi | 0 | 0 | 0.00 | 435 | 609 | 6.86 | 435 | 609 | 6.86 | 28 | 813 | 11.38 |
Ayelén | 0 | 0 | 0.00 | 39 | 466 | 6.22 | 39 | 466 | 6.22 | 163 | 476 | 5.31 |
HVR | 6 | 446 | 5.16 | 9 | 420 | 4.67 | 15 | 430 | 4.86 | 5 | 414 | 4.43 |
Total | 368 | 507 | 8.63 | 857 | 483 | 6.46 | 1,224 | 490 | 7.11 | 447 | 356 | 5.33 |
*June 30, 2008 at a cut-off of 181g/t AgEq
Mineral Reserves
Mineral reserves at the HVS, Huevos Verdes Central (HVC), Huevos Verdes North (HVN), Frea and Kospi veins were estimated by MSC staff and reviewed/adjusted by Christopher Elliott (MAusIMM) from SRK, as seen in Table 3. The estimate reported in the tables are in accordance with CIM Mineral Resource and Mineral Reserve Standards.
Table 3: Mineral Reserve Statement, June 30, 2008
| | | | | | |
Vein | Category | Tonnes (kt) | Ag (g/t) | Au (g/t) | Ag (koz) | Au (koz) |
Huevos Verdes | Proven | 249 | 470 | 6.43 | 3,768 | 52 |
Probable | 143 | 443 | 5.41 | 2,044 | 25 |
Proven & Probable | 393 | 460 | 6.06 | 5,812 | 77 |
Frea | Proven | 270 | 449 | 6.13 | 3,901 | 53 |
Probable | 254 | 264 | 9.82 | 2,157 | 80 |
Proven & Probable | 524 | 360 | 7.92 | 6,058 | 133 |
Kospi | Proven | - | - | - | - | - |
Probable | 698 | 596 | 6.55 | 13,361 | 147 |
Proven & Probable | 698 | 596 | 6.55 | 13,361 | 147 |
Total San José | Proven | 519 | 459 | 6.28 | 7,669 | 105 |
Probable | 1,095 | 499 | 7.16 | 17,563 | 252 |
Proven & Probable | 1,615 | 486 | 6.88 | 25,231 | 357 |
| |
SRK Consulting (U.S.), Inc. | May 29, 2009 |
Exhibit 99.1
| |
Minera Andes Inc. | V |
San José Silver-Gold Project | NI 43-101 Technical Report |
Table 4: Mineral Reserve Attributable to Minera Andes, June 30, 2008
| | | | | | |
Vein | Category | Tonnes (kt) | Ag (g/t) | Au (g/t) | Ag (koz) | Au (koz) |
Huevos Verdes | Proven | 122 | 470 | 6.43 | 1,846 | 25 |
Probable | 70 | 443 | 5.41 | 1,002 | 12 |
Proven & Probable | 193 | 460 | 6.06 | 2,848 | 38 |
Frea | Proven | 132 | 449 | 6.13 | 1,912 | 26 |
Probable | 124 | 264 | 9.82 | 1,057 | 39 |
Proven & Probable | 257 | 360 | 7.92 | 2,969 | 65 |
Kospi | Proven | - | - | - | - | - |
Probable | 342 | 596 | 6.55 | 6,547 | 72 |
Proven & Probable | 342 | 596 | 6.55 | 6,547 | 72 |
Total San José | Proven | 255 | 459 | 6.28 | 3,758 | 51 |
Probable | 537 | 499 | 7.16 | 8,606 | 124 |
Proven & Probable | 791 | 486 | 6.88 | 12,363 | 175 |
SRK modified the MSC reserve parameters in accordance with CIM standards and SRK's judgment.
The following parameters were applied by SRK to derive the reserve estimate.
·
Conventional Cut and Fill (CC&F) minimum mining width
0.8m
·
Mechanized Cut and Fill (MC&F) minimum mining width
2.0m
·
Planned dilution
0.2m HW + 0.2m FW
= 0.4m total
·
Unplanned dilution
5%
·
Economic stope outlines from BECOV
US$115/t
The mineral reserves are considered sufficient to support a four year mine life at an average mining rate of 1,500t/d for 2009 and 2010, 750t/d during 2011 and 500t/d during 2012.
Development and Operations
Precommissioning production commenced during the last half of 2007, and the mine formally entered into commercial production on January 1, 2008. During the first six months of 2008 the mill processed an average of 20,083t/m. There are a total of five separate production areas at the mine – HVS, HVC, HVN, Frea and Kospi.
According to the 2008 production plan, the target rate of 1,500t/d should have been achieved by September 2008, however delays with the Kospi decline prevented the necessary additional production areas from being brought into production. The Kospi vein will be intersected in early 2009, and initial production is expected to commence soon after, thus providing the additional working areas to achieve the mining rate of 1,500t/d.
The Huevos Verdes complex, Frea and Kospi are all accessed by separate decline systems. The adverse ground conditions encountered in the Kospi decline required the use of steel arched sets and shotcrete.
| |
SRK Consulting (U.S.), Inc. | May 29, 2009 |
Exhibit 99.1
| |
Minera Andes Inc. | VI |
San José Silver-Gold Project | NI 43-101 Technical Report |
The Huevos Verdes vein is the narrowest and is exploited mostly by the CC&F mining method. Frea is generally wider than 2m and utilizes the MC&F method. Kospi is planned to be mined by the MC&F method.
Mine dewatering is achieved with a combination of natural drainage, settling sumps and Grindex 50hp submersible pumps. Water pumped from underground is discharged to a surface settling pond. Fresh water for use underground is sourced from the surface settling pond.
Compressed air is required in the underground mines for the operation of hand-held drills, small water pumps, explosives loading apparatus (ANFO loader), small hoists and raise boring. There are air compressors located at each portal for that purpose.
Electrical power is currently sourced from diesel-fired power generators. An over-head power transmission line, connecting to the national power grid, is currently being installed and expected to be brought on line in the first quarter of 2009. The cost of electrical power will be reduced accordingly.
The primary ventilation at Huevos Verdes, Frea and Kospi all utilize the negative pressure system in which the main (primary) ventilation fan draws used air from the mine. Fresh air enters the mine through either the main access decline or a dedicated fresh air raise where it is directed to each of the working areas by a secondary ventilation system.
Waste rock from development is used as backfill in the cut and fill stopes. The development waste is usually hauled to a surface stockpile and then rehandled to waste passes when it is required underground. When the demand for backfill exceeds the supply from waste development, MSC will establish a borrow pit to quarry the local till.
MSC is currently exploring the possibility of implementing the long-hole stoping mining method with a view to improving operational efficiencies This is expected to reduce the mining cost with increased dilution and lower mining recovery.
Environmental
On March 1, 2006, MSC received approval of the Environmental Impact Assessment (EIA) for the Project. The approved EIA became the basis of a Declaration of Environmental Impact (DEI) for the Project which was issued March 16, 2006. In accordance with Argentinean law, the DEI must be renewed every two years. The 2008 updated report for the DEI was submitted in a timely manner.
In order to continue mining operations, an Environmental Quality Certificate (EQC) is required for the Project and must be renewed annually. Currently, MSC maintains a valid EQC for the Project. A valid EQC indicates compliance with primary environmental approvals associated with the DEI.
The estimated cost for reclamation and closure of the San José mine is US$3,300,000.
Economic Analysis
The SRK LoM plan and economics are based on the following:
·
Gold and silver prices of US$850/oz and US$12.50/oz respectively;
·
Reserves at June 30, 2008 (1.6Mt at an average grade of 6.88g/t-Au and 486g/t-Ag) were depleted for the production to December 31, 2008. Depletion is shown in Table 16.1.1. The economic model used the remaining reserves of 1.5Mt at an average grade of 6.94g/t-Au and 484g/t-Ag, containing a total of 339koz of gold and 23.7Moz of silver;
| |
SRK Consulting (U.S.), Inc. | May 29, 2009 |
Exhibit 99.1
| |
Minera Andes Inc. | VII |
San José Silver-Gold Project | NI 43-101 Technical Report |
·
A remaining mine life of four years, with 2009 and 2010 at 1500t/d 2011 at 750t/d and 2012 at 500t/d, at a total average rate of 375kt/y as of December 31, 2008;
·
An overall average metallurgical recovery rate of 86.4% for gold and 84.6% for silver, producing 142koz of gold in doré, 151koz gold in concentrate, and 9.8Moz of silver in doré and 10.2Moz silver in concentrate over the LoM;
·
A cash cost of US$156/ore-tonne;
·
Total capital costs of US$26.9 million are comprised of US$23.5 million for sustaining mining and process capital, US$2.1 million for on-going exploration and US$1.3 million for information technology; and
·
No provision has been made for salvage value.
Technical-economic analysis results, shown in Table 5, indicate a pre-tax Net Present Value (NPV) of US$205 million at an 8% discount rate.
| |
SRK Consulting (U.S.), Inc. | May 29, 2009 |
Exhibit 99.1
| |
Minera Andes Inc. | VIII |
San José Silver-Gold Project | NI 43-101 Technical Report |
Table 5: LoM Economic Results
| |
Description | LoM Value |
Ore | |
Ore Milled | 1.520kt |
Gold Grade | 6.94g/t |
Silver Grade | 483.7g/t |
Contained Gold | 339koz |
Contained Silver | 23.6Moz |
Gold Recovery Dore | 83.7% |
Silver Recovery Dore | 83.3% |
Gold Recovery Concentrate | 89.0% |
Silver Recovery Concentrate | 86.0% |
Doré Production | 10.2Moz |
Gold in Doré | 142koz |
Silver in Doré | 9.8Moz |
Gold in Concentrate | 151koz |
Silver in Concentrate | 10.2 Moz |
Total Gold | 293koz |
Total Silver | 20.0Moz |
Estimate of Cashflow (US$000s) | |
Gross Revenue | $499,205 |
Doré Treatment Charges | ($12,782) |
Concentrate Treatment Charges | ($39,560) |
Net Smelter Return(LoM average US$293.89/t-ore) | $446,863 |
Royalties | ($98) |
Gross Income From Mining | $446,765 |
Operating & Capital Cost | |
Mining and Geology | ($56,606) |
Plant | ($44,781) |
Infrastructure and G&A | ($84,177) |
Operating Costs | ($185,564) |
Cash Cost (US$/t-ore) | $156.40/t |
Cash Operating Margin (EBITDA) | $261,201 |
Capital Cost | |
Sustaining | ($23,451) |
On-going Exploration | ($2,140) |
Information Technology | ($1,300) |
Salvage | 0 |
Capital Costs | ($26,891) |
Cash Flow | $234,310 |
Cash Flow (NPV8%) | $205,058 |
NPV sensitivity to discount rate is shown in Table 6.
Table 6: Project NPV Sensitivity to discount rate(US$000’s)
| | | | |
0% | 5% | 8% Base Case | 10% | 15% |
$234,310 | $215,404 | $205,058 | $198,540 | $183,459 |
| |
SRK Consulting (U.S.), Inc. | May 29, 2009 |
Exhibit 99.1
| |
Minera Andes Inc. | IX |
San José Silver-Gold Project | NI 43-101 Technical Report |
Conclusions and Recommendations
1.
The standard of documentation for mineral reserve estimates needs to be improved. SRK had difficulty substantiating the MSC conversion of resources to reserves due to a paucity of supporting documentation.
2.
MSC have been overly optimistic with estimates of dilution in the C&F stopes. Moreover, the reconciliations undertaken by MSC are somewhat biased due to the nature of the stoping operation – although stopes are designed according to a grade cut-off, it appears that MSC generally manage the C&F stoping according to a lithological cut-off, taking all of the mineralization regardless of grade.
3.
The higher mining recovery factors used by MSC need to be substantiated with operational experience and thorough reconciliations.
4.
Based on the current understanding of the mineralization at San José, SRK recommends that MSC continue with planned exploration activities to extend the mine life beyond 2012. In 2008, both the Au and Ag recoveries in the San José process plant were very erratic on a monthly basis with Au varying from a low of 72.6% to a high of 89.6% and Ag varying from a low of 72.7% to a high of 88.8%. These wide variances in both Au and Ag recoveries suggests that there may be a problem in the monthly metallurgical balances for the San José process plant. SRK recommends that a metallurgical audit of the process plant be conducted by an independent third-party to determine the reason(s) for the wide variances in Au and Ag recoveries and the actual low Ag recovery versus the Gekko test results.
| |
SRK Consulting (U.S.), Inc. | May 29, 2009 |
Exhibit 99.1
| |
Minera Andes Inc. | 1-1 |
San José Silver-Gold Project | NI 43-101 Technical Report |
1
Introduction(Item 4)
SRK Consulting (U.S.), Inc. (SRK) was commissioned by Minera Andes Inc. (MAI) to prepare a Technical Report on the San José Silver-Gold Project (San José or the Project) located in the Province of Santa Cruz, Argentina, in accordance with the requirements of Canadian National Instrument 43-101 (NI 43-101) of the Canadian securities regulators. The Project is owned and operated by Minera Santa Cruz S.A. (MSC), a joint-venture company 49% owned by Minera Andes S.A. (MASA), a subsidiary of MAI, and 51% owned by Hochschild Mining plc (HMP).
1.1
Terms of Reference and Purpose of the Technical Report
This Technical Report is intended to provide MAI with an independent review of the resource and reserve estimate updated to June 30, 2008.
All measurements in this Technical Report are metric, and currency is expressed in United States dollars, unless stated otherwise. A conversion of US$0.3337/ARS1.00 (Argentine Peso) has been used for the purpose of this Technical Report. A glossary of terms and abbreviations are listed in Section 21.2 of this Technical Report.
Resource and reserve definitions are as set forth in the "Canadian Institute of Mining, Metallurgy and Petroleum – Definitions Adopted by CIM Council, December 11, 2005”.
1.2
Reliance on Other Experts(Item 5)
SRK’s opinion contained here is based on information provided to SRK by MAI and MSC throughout the course of SRK’s investigations.
SRK has not independently verified the legal status or ownership of the mineral rights in the Project area or underlying property agreements, but has relied on legal opinion supplied to MAI for this information.
SRK has not independently verified the surface rights, road access and permits and has relied on legal opinion supplied to MAI for this information.
1.2.1
Sources of Information
SRK’s opinion contained herein is based on information provided to SRK by MSC and MAI and their consultants throughout the course of SRK’s investigations, which in turn reflect various technical and economic conditions at the time of writing. The information so provided has been taken in good faith by SRK and SRK has checked and/or verified the information wherever possible.
This report includes technical information, which requires subsequent calculations to derive subtotals, totals and weighted averages. Such calculations inherently involve a degree of rounding and consequently introduce a margin of error. Where these occur, SRK does not consider them to be material.
1.3
Effective Date
The effective date of the resource estimation is June 30, 2008.
The effective date of the reserve estimation is June 30, 2008.
The effective date of this Technical Report is December 31, 2008.
| |
SRK Consulting (U.S.), Inc. | May 29, 2009 |
Exhibit 99.1
| |
Minera Andes Inc. | 1-2 |
San José Silver-Gold Project | NI 43-101 Technical Report |
1.4
Qualifications of Consultants (SRK)
The SRK Group is comprised of over 850 staff, offering expertise in a wide range of resource engineering disciplines. The SRK Group’s independence is ensured by the fact that it holds no equity in any project and that its ownership rests solely with its staff. This permits SRK to provide its clients with conflict-free and objective recommendations on crucial judgment issues. SRK has a demonstrated record of accomplishment in undertaking independent assessments of Mineral Resources and Mineral Reserves, project evaluations and audits, technical reports and independent evaluations to bankable standards on behalf of exploration and mining companies and financial institutions worldwide. The SRK Group has also worked with a large number of major international mining companies and their projects, providing mining industry consultancy service inputs.
This Technical Report has been prepared based on a technical and economic review by a team of consultants sourced principally from the SRK Group’s Denver, US office. These consultants are specialists in the fields of geology, exploration, mineral resource and mineral reserve estimation and classification, underground mining, mineral processing and mineral economics.
Neither SRK nor any of its employees and associates employed in the preparation of this Technical Report has any beneficial interest in MAI it subsidiaries or JV partners. SRK will be paid a fee for this work in accordance with normal professional consulting practice.
Listed below are the individuals who have provided input to this Technical Report:
·
Leah Mach, CPG, MSc;
·
Chris Elliott, B.Eng.(Mining), MAusIMM;
·
Patrick Hollenbeck, B.A. Geo.;
·
Joanna Poeck, B.Eng.;
·
Alva Kuestermeyer, MS Mineral Economics, CP, SME;
·
Dorinda Bair, BSc. Geo.;
·
Martin Raffield, P.Eng., PhD.; and
·
Dante Ramirez-Rodriguez, PhD.
Leah Mach is the QP responsible for the compilation and editing of Sections 2.1 through 2.3, 3.1 through 3.5, 4 through 13, 15.1, 18.1 through 18.4 and 19.1 of this Technical Report. By virtue of her education and relevant past experience, Ms. Mach a QP as this term is defined in NI 43-101. Ms. Mach is a Principal Resource Geologist in the SRK Denver office.
Chris Elliott is the QP responsible for the compilation and editing of Sections 1, 2.4 through 2.6, 3.6, 14, 15.2 through 17.8.2, 18.5 through 18.7 and 19.2 through 21of this Technical Report. By virtue of his education and relevant past experience, Mr. Elliott is a QP as this term is defined in NI 43-101. Mr. Elliott is a Principal Mining Engineer based in the SRK Vancouver office.
| |
SRK Consulting (U.S.), Inc. | May 29, 2009 |
Exhibit 99.1
| |
Minera Andes Inc. | 1-3 |
San José Silver-Gold Project | NI 43-101 Technical Report |
1.4.1
Site Visit
The key Project personnel contributing to this Technical Report are Leah Mach, Martin Raffield, Chris Elliott and Alva Kuestermeyer. Mr. Kuestermeyer visited the property from September 16 through 18, 2008, and visited the MSC head office in Buenos Aires on September 19, 2008. Leah Mach and Martin Raffield visited the property on September 29 through October 1, 2008 at which time Ms. Mach confirmed the site data, including access, drilling and sampling methods and drillhole locations, and examined geology, alteration and mineralization in field outcrops and drill core. Chris Elliott visited the property on January 28 through 30, 2009. The Certificate of Author forms are provided in Appendix A.
| |
SRK Consulting (U.S.), Inc. | May 29, 2009 |
Exhibit 99.1
| |
Minera Andes Inc. | 2-1 |
San José Silver-Gold Project | NI 43-101 Technical Report |
2
Property Description and Location(Item 6)
2.1
Property Location
San José is located in Perito Moreno District, Santa Cruz Province, Argentina within the Patagonia Region. The Project lies between latitude 46º41'S and 46º47'S and longitude 70º17'W and 70º00'W. This is approximately 4,810,000N, 2,415,500E and 4,840,500N, 2,385,000E in Gauss-Krüger coordinates Zone 2 (POSGAR 94). San José is 1,750km southeast of Buenos Aires by air, and 350km southwest of Comodoro Rivadavia by road. Comodoro Rivadavia is the largest city in Chubut Province and very close to the provincial boundary with Santa Cruz Province. Comodoro Rivadavia has the closest commercial airport to the Project with regularly scheduled flights to Buenos Aires. Comodoro Rivadavia is also an important port in southern Argentina. Project location is shown in Figure 2-1.
2.2
Mineral Title in Argentina
Argentina is a federal republic, composed of 23 provinces and one autonomous city, the capital Buenos Aires. Argentina has Federal, Provincial and Municipal governments each with input into mining regulation. The National Mining Code regulates mining activities in Argentina and is administered by the Federal government. In Santa Cruz province, all concessions are granted by an administrative action under the authority of the Provincial Mining Office according to Provincial Law No. 990 (Godoy, 2007). The following section discusses mining and exploration concessions specific to Santa Cruz Province, Argentina.
This section on Mineral Title in Argentina is summarized fromMinera Andes Inc. Management’s Discussion and Analysis of Financial Conditions and Plan of Operations, (Minera Andes, 2008).
The laws, procedures and terminology regarding mineral title in Argentina differ considerably from those in the United States and Canada. Mineral rights in Argentina are separate from surface ownership and are owned by the federal government and administered by the provinces. Mineral titles consist of:
·
Cateo: an exploration concession which does not permit mining but gives the owner a preferential right to a mining concession for the same area. Cateos are measured in 500ha units and cannot exceed 20 units. No person may hold more than 400 units in a single province. The term of a cateo is based on its area: 150 days for the first unit and an additional 50 days for each unit thereafter. After a period of 300 days, 50% of the area over four units must be dropped. At 700 days, 50% of the remaining area must be dropped. Cateos are awarded by the following process;
1.
Application for a cateo covering a designated area, including a minimum work program for exploration.
2.
Approval by the province and formal placement on the official map or register.
3.
Publication in the provincial official bulletin.
4.
A period following publication for third parties to oppose the claim.
5.
Awarding of the cateo.
| |
SRK Consulting (U.S.), Inc. | May 29, 2009 |
Exhibit 99.1
| |
Minera Andes Inc. | 2-2 |
San José Silver-Gold Project | NI 43-101 Technical Report |
The length of time required for this process varies and commonly takes up to two years. The cateo status is therefore divided into those that are in the application process and those that have been awarded. If two entities apply for cateos on the same land, the first to apply has the superior right. The first applicant has rights to any mineral discoveries made by third parties operating in the cateo without its prior consent during the application period. Applicants may be allowed to explore on the land pending formal award of the cateo, with the approval of the surface owner of the land. The term of the cateo begins 30 days after the cateo is formally awarded.
A “canon fee” or tax of AR$400 per unit is payable upon application for the cateo.
·
Mina: a mining concession which permits mining on a commercial basis. The area of a mina is measured in “pertenencias” and each mina may consist of two or more pertenencias. A “common” pertenencias consists of 6ha and a “disseminated” pertenencia consists of 100ha; the designation refers to discrete veins (common) or disseminated deposits (disseminated). The mining authority may determine the number of pertenencias required to cover the geologic extent of the mineral deposit in question. Minas have an indefinite term assuming exploration development or mining is in progress. Minas are awarded by the following process;
1.
A Declaration of Manifestation of Discovery in which a point within a cateo is nominated as a discovery point. The Minifestation is used as a basis for location of pertenencias. Within a period following designation of a Manifestation of Discovery, the claimant may do further exploration, if necessary, to determine the size and shape of the orebody.
2.
“Mensura”, or survey, of the mina. Following a publication and opposition period and approval by the province, a formal survey of the pertenencias is completed before granting of a mina. The status of a surveyed mina provides the highest degree of mineral land tenure and rights in Argentina.
A canon fee of AR$80 per pertenencia is payable to the province on an annual basis.
·
Estaca Minas: Extensions to surveyed minas, consisting of 6ha. New Estaca Minas were eliminated from the mining code in August 1996; and
·
Provincial Reserve Areas: provinces are allowed to withdraw areas from the normal cateo/mina process which are then held directly by the province or assigned to provincial companies for study or exploration and development.
All mineral rights are considered forms of real property and can be sold, leased or assigned to third parties on a commercial basis. Cateos and minas can be forfeited if minimum work requirements are not performed or if annual payments are not made.
Grants of mining rights, including water rights, are subject to the rights of prior users. The mining code also contains environmental and safety provisions administered by the provinces. Environmental Impact Reports (EIR) must be submitted to the provincial government prior to conducting mining operations. The EIR must describe the proposed operation and the methods that will be used to prevent undue environmental damage and must be updated biennially. Mine operators are liable for environmental damage and violators of environmental standards may be required to shut down mining operations (Minera Andes, Inc. 2007).
| |
SRK Consulting (U.S.), Inc. | May 29, 2009 |
Exhibit 99.1
| |
Minera Andes Inc. | 2-3 |
San José Silver-Gold Project | NI 43-101 Technical Report |
There are two additional types of exploration concession in Argentina. These are air survey and underground permits. These are considered expensive and ineffective and are seldom used in favor of cateos. Cateos are also referred to as ground survey permits (Godoy, 2007).
Exploration permits are essentially paper locations. Once an exploration permit is converted to a mina or mining concession, the land must be surveyed and monuments placed at the corners.
2.3
Mineral Tenure for the San Jose Property
The Project covers 50,491ha, comprising 46 contiguous Mining Claims (eight “Minas” or approved mining claims; and 38 “Manifestations” or claims that are in the application process for mining claim status) and one exploration claim (Cateo). Mineral Reserves are hosted on “Minas” El Pluma E3 and El Pluma 4. The claims are all in good standing, with the appropriate annual holding costs paid. MSC holds the surface rights to the “San José Estancia,” where the mine and associated infrastructure are constructed and the “La Carmancita Estancia,” which provides right of way access between the mine and closest paved highway. Of these, 46 mining concessions covering 40,498.69ha, and one cateo covering 9,992.5ha. Of the mining concessions, 17 are minas containing 15,450.5ha and 29 manifestations of discovery containing 25,048.19ha. The mining an d exploration concessions included in the Project are listed in Table 2.3.1 and shown in Figure 2-2.
| |
SRK Consulting (U.S.), Inc. | May 29, 2009 |
Exhibit 99.1
| |
Minera Andes Inc. | 2-4 |
San José Silver-Gold Project | NI 43-101 Technical Report |
Table 2.3.1: San José Mineral Concessions
| | | | | | | |
| | | Initial | Mina | Mina | Annual | Conversion |
| | Area | Application | Application | Approval | Holding Cost | to Mina |
Claim | File Number | (ha) | Date | Date | Date | (AR$)** | Status* |
Tres Colores A | 411.332/MA/99 | 1,000 | 8/4/1999 | 7/1/2005 | 8/9/2006 | 8,000 | 1 |
El Pluma E1 | 410.412/MA/99 | 1,000 | 4/16/1999 | 4/11/2005 | 8/9/2006 | 8,000 | 1 |
El Pluma E2 | 412.278/MA/99 | 1,000 | 11/22/1999 | 8/12/2005 | 8/9/2006 | 8,000 | 1 |
El Pluma 3 | 412.279/MA/99 | 750 | 11/22/1999 | 8/12/2005 | 10/18/2006 | 6,400 | 1 |
El Pluma 4 | 412.281/MA/99 | 1,000 | 11/22/1999 | 8/12/2005 | 10/18/2006 | 8,000 | 1 |
El Pluma E3 | 412.280/MA/99 | 800 | 11/22/1999 | 8/12/2005 | 10/18/2006 | 6,400 | 1 |
Saavedra 7a | 10.090/MA/99 | 1,000 | 3/10/1999 | 4/15/2002 | 7/26/2007 | 8,000 | 1 |
Saavedra 11 | 401.874/MA/01 | 1,000 | 8/2/2001 | 12/10/2004 | 12/11/2006 | 8,000 | 1 |
Saavedra 1a | 410.093/MA/99 | 1,000 | 3/10/1999 | 5/5/2004 | - | 8,000 | 2 |
Saavedra 2a | 410.091/MA/99 | 1,000 | 3/10/1999 | 5/5/2004 | 8/13/2007 | 8,000 | 2 |
Saavedra 5 | 410.089/MA/99 | 800 | 3/10/1999 | 10/30/2002 | 11/20/2007 | 6,400 | 2 |
Tres Colores G | 414.639/MA/00 | 397.5 | 9/1/2000 | 2/15/2006 | - | 3,200 | 2 |
Saavedra 8 | 410.092/MA/99 | 1,000 | 3/10/1999 | 2/15/2006 | 5/15/2008 | 8,000 | 3 |
Saavedra 9 | 413.396/MA/00 | 1,000 | 4/6/2000 | 12/10/2004 | - | 8,000 | 3 |
Saavedra 13 | 401.876/MA/01 | 1,000 | 8/2/2001 | 11/3/2005 | 9/13/2007 | 8,000 | 3 |
Tres Colores B | 411.331/MA/99 | 998.5 | 8/4/1999 | 7/1/2005 | - | 8,000 | 3 |
Tres Colores D | 414.640/MA/00 | 901 | 9/1/2000 | 4/17/2006 | 10/17/2007 | 7,200 | 3 |
Tres Colores E | 414.643/MA/00 | 901 | 9/1/2000 | 4/17/2006 | 10/1/2007 | 7,200 | 3 |
El Pluma 1 | 410.411/MA/99 | 750 | 4/16/1999 | 7/1/2005 | - | 6,400 | 4 |
El Pluma 2 | 412.277/MA/99 | 1,000 | 11/22/1999 | 8/12/2005 | 9/1/2008 | 8,000 | 4 |
Saavedra 3 | 410.096/MA/99 | 800 | 3/10/1999 | 7/1/2005 | - | 6,400 | 4 |
Saavedra 4 | 410.095/MA/99 | 800 | 3/10/1999 | 7/1/2005 | 8/29/2007 | 6,400 | 4 |
Saavedra 6b | 410.094/MA/99 | 800 | 3/10/1999 | 7/1/2005 | - | 6,400 | 4 |
Saavedra 10 | 413.395/MA/00 | 1,000 | 4/6/2000 | 12/10/2004 | - | 8,000 | 4 |
Saavedra 12 | 401.875/MA/01 | 1,000 | 8/2/2001 | 7/1/2005 | - | 8,000 | 4 |
SaavNE2 | 400.626/MA/01 | 1,000 | 3/21/2001 | 12/10/2004 | - | 8,000 | 4 |
SaavNE3 | 400.627/MA/01 | 500 | 3/24/2001 | 12/10/2004 | - | 4,000 | 4 |
SaavNEI | 400.625/MA/01 | 1,000 | 3/21/2001 | 12/10/2004 | - | 8,000 | 4 |
Tres E | 414.266/MA/00 | 999.93 | 6/24/2000 | 10/20/2005 | - | 8,000 | 4 |
Tres F | 414.267/MA/00 | 999.93 | 6/24/2000 | 12/12/2005 | - | 8,000 | 4 |
Tres Colores C | 414.642/MA/00 | 901 | 9/1/2000 | 3/29/2006 | 10/8/2007 | 7,200 | 4 |
Tres Colores F | 414.641/MA/00 | 901 | 9/1/2000 | 12/12/2005 | - | 7,200 | 4 |
Uno F | 400.764/MA/01 | 594 | 4/4/2001 | 5/17/2005 | - | 4,800 | 4 |
Uno G | 401.507/MA/01 | 1,103.70 | 6/20/2001 | 2/15/2006 | - | 9,600 | 4 |
Uno I | 401.509/MA/01 | 560.4 | 6/20/2001 | 12/10/2004 | - | 4,800 | 4 |
Uno D | 400.765/MA/01 | 840 | 4/4/2001 | 5/17/2005 | - | 7,200 | 5 |
Uno E | 400.766/MA/01 | 840 | 4/4/2001 | 12/10/2004 | - | 7,200 | 5 |
Uno H | 401.508/MA/01 | 560.4 | 6/20/2001 | 7/1/2005 | - | 4,800 | 5 |
Saavedra 14 | 401.877/MA/01 | 1,000 | 8/2/2001 | 7/1/2005 | - | 8,000 | 6 |
Tres A | 411.333/MA/99 | 1,000 | 8/4/1999 | 7/1/2005 | - | 8,000 | 6 |
Tres B | 411.334/MA/99 | 750 | 8/4/1999 | 8/12/2005 | - | 6,400 | 6 |
Tres C | 414.264/MA/00 | 980 | 7/24/2000 | 8/12/2005 | - | 8,000 | 6 |
Tres D | 414.265/MA/00 | 770.13 | 7/24/2000 | 2/15/2006 | - | 6,400 | 6 |
Uno A | 413.095/MA/00 | 840 | 3/6/2000 | 8/12/2005 | - | 7,200 | 6 |
Uno B | 413.096/MA/00 | 840 | 3/6/2000 | 8/12/2005 | - | 7,200 | 6 |
Uno C | 413.097/MA/00 | 820.2 | 3/6/2000 | 8/12/2005 | - | 7,200 | 6 |
Total of Manifestations and Minas | 40,498.69 | | | | 329,600 (US$109,988) | |
"Cateo" | 403.089/MSC/01 | 9,992.50 | 12/12/2001 | - | - | 8,000 | |
Total of All Claims | 50,491.19 | | | | 337,600 (US$112,670) | |
*Conversion to Mina Status:
1.
Conversion to Mina Finalized.
2.
Pending Finalization
3.
Pending Finalization, once April 16 observations have been removed
4.
Awaiting Approval
5.
Missing Plans
6.
Without Landowner approval to complete perimeter survey
**US$0.3337=AR$1.00
MSC’s annual canon payments for concession holding are divided between the first and second semesters and paid in February and June, respectively. Canon payments for all of the mining claims and cateos in 2007 were approximately US$103,000. The first semester 2008 holding cost payments were paid in February 2008 and were approximately US$55,000. The second semester payments were paid in June 2008 and totaled approximately US$55,000. The total paid in 2008 was approximately US$112,670.
| |
SRK Consulting (U.S.), Inc. | May 29, 2009 |
Exhibit 99.1
| |
Minera Andes Inc. | 2-5 |
San José Silver-Gold Project | NI 43-101 Technical Report |
2.4
Location of Mineralization
Project mineralization zones and targets are contained within the mine concession block in the following eight concessions:
·
El Pluma 2—La Sopresa regional mineralized target;
·
El Pluma 3—El Pluma West mineralized target;
·
El Pluma 4—Pluma South mineralized target and Ayelén, Frea, Kospi and Odin mineralized zones;
·
El Pluma E2—Ayelén and Odin mineralized zones;
·
El Pluma E3—Huevos Verdes mineralized zone;
·
Tres Colores C—Portugués mineralized zone;
·
Tres Colores D—Roadside mineralized zone;
·
Saavedra 8—Saavedra mineralized zone; and
·
Cateo—Agua Vivos.
These regional mineralized targets and mineralized zones are shown on Figure 2-2. Resources and reserves for the Project are contained in El Pluma E3 and El Pluma 4. Both of these have been converted from Manifestation of Discovery to minas.
2.5
Royalties, Agreements and Encumbrances
2.5.1
Joint Venture Agreement
Minera Santa Cruz S.A. (MSC) holds 100% interest in the Project. MSC is a joint venture between Minera Andes S.A. (MASA) (49%) and Hochschild Mining (Argentina) Corporation (HMC) (51%). MASA is an indirect wholly-owned subsidiary of Minera Andes Inc. (MAI). HMC is a wholly owned subsidiary of Hochschild Mining plc (HMP).
The joint venture is governed by an option and joint venture agreement dated March 15, 2001 between MASA and Hochschild (as amended by agreements dated May 14, 2002, August 27, 2002 and September 10, 2004) (the “OJVA”).
Under the OJVA, MASA transferred all of its rights in the San José Project to MSC, a newly formed corporation organized under the laws of Argentina and wholly owned by the Corporation. In July 2003, Hochschild earned a 51% ownership interest in MSC by expending a total of $3 million, including a minimum of $100,000 per year on exploration targets. Upon Hochschild acquiring a 51% ownership in MSC, Minera Andes elected to participate in the development of the San José Project on a pro-rata basis.
The remainder of Section 2.5.1 is quoted from MAI’s Annual Information Form (2008):
| |
SRK Consulting (U.S.), Inc. | May 29, 2009 |
Exhibit 99.1
| |
Minera Andes Inc. | 2-6 |
San José Silver-Gold Project | NI 43-101 Technical Report |
The OJVA and the by-laws of MSC provide, in relevant part, that:
i.
the Board of Directors of MSC shall, at all times, consist of three directors and that, in effect, two of such directors shall be nominated by Hochschild and one director shall be nominated by MASA;
ii.
the Board of Directors of MSC shall meet at least once every calendar quarter, without any stipulation that a nominee of each of Hochschild and MASA be present;
iii.
at any meeting of the Board of Directors of MSC, each of MASA and Hochschild shall have that number of votes equal to the number of directors it is entitled to appoint;
iv.
MSC shall finance its operations and activities from such sources as the Board of Directors of MSC sees fit;
v.
the only actions by MSC requiring unanimous approval of both MASA and Hochschild are (a) a sale of all or substantially all of the assets of MSC; (ii) any amendment to the articles of MSC that would have an adverse effect on the rights of any particular shareholder to receive its share of the profits of MSC; (c) entering into any new line of business; (d) acquiring real property or conducting exploration, development or mining outside of the property initially transferred to MSC for the purposes of establishing the joint venture; or (e) any merger or other corporate combination involving MSC; and
vi.
in the event of a disagreement between Hochschild as “majority owner” and MASA as “minority owner”, concerning any act of MSC that requires the unanimous approval of the Board of 13 Directors of MSC, Hochschild has the option to purchase all of the shares of MSC held by MASA for “fair value”.
The OJVA provides that MSC shall finance its operations from such sources as the Board of MSC shall determine, including by issuing additional shares. In such event, each shareholder of MSC has a pre-emptive right to subscribe for its pro rata share of the additional shares. Any shares not subscribed by a shareholder shall be offered to the other, participating, shareholder. As a result, full exercise of a shareholder’s pre-emptive right (assuming full exercise by other shareholder) maintains its shareholdings in MSC at current levels while a failure to exercise its pre-emptive rights, in full, may result in dilution (the extent of such dilution depending on whether the other shareholder exercises its pre-emptive right and to what extent and whether such shareholder also purchases shares not purchased by the first shareholder). A portion of the operating and capital costs of the San José Project have been f inanced by issuing additional shares of MSC.
The OJVA also provides that it shall be the policy of MSC to maintain excess distributable cash and that unless the Board of MSC unanimously decides otherwise, MSC shall distribute, on a semi-annual basis all cash not reasonably required for operations or expansion.
| |
SRK Consulting (U.S.), Inc. | May 29, 2009 |
Exhibit 99.1
| |
Minera Andes Inc. | 2-7 |
San José Silver-Gold Project | NI 43-101 Technical Report |
2.5.2
Surface Rights
MSC has negotiated surface rights agreements with two families, the Beitía Family and the Flores Family, for general and internal access and construction of mine infrastructure. The details of these agreements are discussed in below and summarized in Section 3.5. Figure 2-3 shows the areas where surface rights were negotiated.
Between 2002 and 2008, agreements were negotiated with MSC and the Beitía Family for a contiguous 2,875ha property within the Estancia San José for the construction of the San José Mine and associated infrastructure. MSC paid the Beitía Family US$353,400. This agreement was amended in 2005 and gives MSC surface rights for construction of the mine and its infrastructure, easement rights and use of all existing roads within Estancia San José. MSC does not compensate the Beitía Family for use of existing roads, but additional amendments in 2006 and 2008 requires the following compensation for road construction and widening of existing roads:
·
If MSC quarries material from Estancia San José for road construction or for any other mining operation, the owners of Estancia San José will be entitled to collect US$0.90 plus VAT/m3 of rock extracted from Estancia San José. During the first 12 months from the execution of the New Agreement (2006), the price will be decreased to US$0.40/m3 plus VAT;
·
If MSC performs exploration activities, compensation to the owners of Estancia San José will be paid as follows:
1.
Construction of Mining Road: US$150/km.
2.
Construction of roads: US$250/km.
3.
Construction of trenches: US$250/km.
·
A monthly payment of US$800 will be paid to the owners of the Estancia San José for the use of a house located in the Estancia San José. Payment of this price also entitles MSC to use roads connecting Estancia San José and the neighboring properties.
In September 2008, a new agreement was signed with the Beitía family. In this agreement, MSC agreed to compensate the Beitía family for wider access roads. The previous agreement was for 12m, but in some areas the access road was actually 24m. MSC compensated the Beitía family by building a 60m2 house and an additional bedroom at the San José ranch. In addition, MSC relocated some existing wire fences at the San José ranch (AMEC, 2007b).
In August of 2004, MSC signed an agreement with Mr. Roberto Flores that granted access rights from RP-43 across the Estancia Carmancita to San José. In addition to a US$56,000 cost for access, a payment of US$1,000 was to be paid monthly during the mine life. This agreement was replaced February 14, 2006 by a land purchase. The land was purchased by MSC and several members of the Flores Family from Mr. Roberto Flores. The purchase includes 5,543ha of contiguous land in the Estancia Carmancita. MSC now holds 66.66% of the surface rights and the Flores family holds 33.33%, which grants MSC free right of access. The price of US$74,009 has been paid to Mr. Roberto Flores and the new agreement replaces the previous agreement with Mr. Flores (AMEC, 2007b).
| |
SRK Consulting (U.S.), Inc. | May 29, 2009 |
Exhibit 99.1
| |
Minera Andes Inc. | 2-8 |
San José Silver-Gold Project | NI 43-101 Technical Report |
2.5.3
Royalty
The property is subject to a provincial royalty of 2.55% on the value of the concentrate and 1.85% on the value of the doré produced from the property.
2.6
Environmental Liabilities and Permitting
Mining activities in Argentina are regulated by the National and Provincial Governments through several legal instruments. The San José mine entered into full-scale commercial production on January 1, 2008. MSC obtained the necessary environmental approvals for the Project and maintained compliance with the primary environmental permits.
2.6.1
Environmental Liabilities
Known environmental liabilities for the San José mine include site reclamation and closure. These costs are described in Section 17.
2.6.2
Required Permits and Status
In order to commence mining, MSC prepared an Environmental Impact Assessment (EIA) for the Project. The Provincial Environmental Management Unit (PEMU) was responsible for review and approval of the EIA. The document was approved by the PEMU on March 1, 2006. The approved EIA became the basis of a Declaration of Environmental Impact (DEI) for the Project. In accordance with Argentinean law, the DEI must be renewed every two years. The 2008 updated report for the DEI was submitted in a timely manner.
Acceptable water, soil and air conditions are declared in the DEI. In order to continue with mining operations, an Environmental Quality Certificate (EQC) is required and must be renewed annually. MSC needs to prove its environmental performance that needs to be in accordance with the DEI. After the approval and an annual fee payment, the EQC is issued. Currently, MSC maintains a valid EQC for the Project. A valid EQC indicates compliance with primary environmental approvals associated with the DEI.
As reported in the NI 43-101 Technical Report (AMEC, 2007b), Table 2.6.2.1 presents the permits which have been applied for or granted.
| |
SRK Consulting (U.S.), Inc. | May 29, 2009 |
Exhibit 99.1
| |
Minera Andes Inc. | 2-9 |
San José Silver-Gold Project | NI 43-101 Technical Report |
Table 2.6.2.1: Permits, Applied for or Granted
| | |
Permit | Agency | Observation |
Exploration permit | Provincial Department of Mining Santa Cruz (DPM) | One Cateo |
Mining Claim (Mina) | DPM | Mina status for 17 claims (covers all areas of production) |
Mining Claim (Manifestations) | DPM | Remaining 29 Manifestations registered to MSC, awaiting final title |
Investment plan | DPM | Presented on February 15, 2005 for each of the 46 claims |
Mineral Producer Certificate | DPM | Registered since January 29, 2002 (403.305/02); renewed annually before March |
Environmental Impact Report | DPM | Approved by DPM on March 1, 2006. Biannual updated report filed with DPM on June 2008. |
Hazardous Waste Generator | Secretary of Environment (SMA) | Registered with the Provincial Environmental Department (SMA) since May 2, 2006 (Res. N° 046-SMA/06). Request of incorporation of Hazardous Waste corresponding to categories Y1 and Y33 has been submitted to SMA. |
EQC | DPM | EQC 2006 – issued, EQC 2007 issued, EQC 2008 in process of being issued. |
Explosives Use | National Arms Registry | “User that receives explosive services” Register Number RE7082, issued on August 2004. Registration was dropped on August 2008. “User that manipulate explosives” Renewed each year: Register Number 980007082, issued on May 2006. Extended up to August 2009. |
Explosives Storage | National Arms Registry | Issued on May 31, 2006 for 4 deposits Date of expiration: May 31, 2011 |
Water Use | Department of Water Resources (DRH) | Permit for water issued on July 7, 2006 (5 year period); water use fee paid to September 2008 – invoices not yet received by MSC beyond this; monthly reports, regularly submitted by MSC |
Registry of Importers and Exporters | Import/Export National Administration (Dirección General de Aduana) | Registered since January 28, 2004. Renewed on June 10, 2008. |
Radio Frequency use | National Committee of Communications (CNC) | Permit issued for use of the assigned frequency and equipment. |
Registry of Mining Investors | National Direction of Mining Investors (depending on National Mining Secretary) | Registered Since April 18, 2002 (Registry Number 422) |
Fiscal Stability Certificate | National Mining Secretary | Certificate issued May 15, 2006 (valid 30 years) |
Hydrocarbon storage permit | Secretary of Energy (National level) | Storage of hydrocarbons, tank Certification from Secretary of Energy was not requested yet. |
| |
SRK Consulting (U.S.), Inc. | May 29, 2009 |
Exhibit 99.1
| |
Minera Andes Inc. | 2-10 |
San José Silver-Gold Project | NI 43-101 Technical Report |
Figure 2-1: Location Map of the San José Silver-Gold Project
| |
SRK Consulting (U.S.), Inc. | May 29, 2009 |
Exhibit 99.1
| |
Minera Andes Inc. | 2-11 |
San José Silver-Gold Project | NI 43-101 Technical Report |
Figure 2-2: Mining and Exploration Concessions with Mineralized Zones at San José
| |
SRK Consulting (U.S.), Inc. | May 29, 2009 |
Exhibit 99.1
| |
Minera Andes Inc. | 2-12 |
San José Silver-Gold Project | NI 43-101 Technical Report |
Figure 2-3: Project Concessions with Areas of Surface Right Agreements and Mineralization
| |
SRK Consulting (U.S.), Inc. | May 29, 2009 |
Exhibit 99.1
| |
Minera Andes Inc. | 3-1 |
San José Silver-Gold Project | NI 43-101 Technical Report |
3
Accessibility, Climate, Local Resources, Infrastructure and Physiography(Item 7)
3.1
Topography, Elevation and Vegetation
San José is in southern Argentina in the Patagonian steppe, east of the Andes Mountains. The area is dominated by low rolling hills and incised valleys. Elevation ranges from 300 to 700masl. Vegetation is characteristic of arid to semi-arid steppes with tussock grasses and low growing bushes. The soil is poor, typical of harsh environments, and not suitable for agriculture but supports sheep and cattle grazing (AMEC, 2007b).
3.2
Climate and Length of Operating Season
San José is located in an area classified by the Köppen-Geiger classification system as a “cold arid steppe” (BSk) climate and is generally considered to be arid to semi-arid. MSC has maintained a weather station at the Project since January 2005. Climate data from this station has been supplemented with data from nearby weather stations located at Estancia Aguas Vivas for the years 1997 through 2005 and Gobernador Gregores for the years 1988 and 1989 (AMEC, 2007b).
The climate is marked by a short warm summer and longer cool winters. Average summer temperatures are above 10°C occurring between November and March. Winter temperatures are commonly below 0ºC but average 5ºC between June and August. The average temperature year-round is 8.9°C. Pervasive northwesterly winds occur year round with peak velocities of 12m/s in December. Annual rainfall is approximately 114mm and annual snowfall is 32.4mm (AMEC, 2007b). San José operates year round.
3.3
Physiography
The Project is located in northern Santa Cruz Province, Argentina in Patagonia Region. Patagonia Region is the southernmost part of Chile and Argentina and includes the Andes Mountains to the west and south and the plateau and low plains to the east. This region is bounded on the east by the Atlantic Ocean. San José is located immediately east of the Andes Mountains and south of the Río Deseado in an area of low rolling hills with a limited number of dissected valleys. This area is the central plateau of the Santa Cruz Province (AMEC, 2007b).
3.4
Access to Property
The Project can be accessed from Buenos Aires by flying to the town of Comodoro Rivadavia, then driving 350km along paved and unpaved roads. Directions to the property from Comodoro Rivadavia are as follows; Follow the national highway (RN) 3 south for 78km to Caleta Olivia, then 58km southwest on provincial highway (RP) 12 to Pico Truncado. From Pico Truncado, take RP-43 west through Las Heras. The Project access road is at 182km just beyond Las Heras. From here proceed south (left turn) on a gravel road. The Project is approximately 32km south from RP-43 on the access road (AMEC, 2007b).
3.5
Surface Rights
In Argentina, surface rights are not associated with minas or exploration permits and must be negotiated with landowners. MSC has agreements with two property owners for surface rights at the Project. This provides for the main access route to San José from RP-43 and surface rights for all required mine infrastructure, tailings and dump; the agreements also include compensation for exploration activities. The local landowners are the Beitía Family, who controls the Estancia San José, from which the Project takes its name, and the Flores Family who owns the Estancia Carmancita. The Estancia San José includes land over the mine and the Estancia Carmancita includes land between the Project and RP-43 (AMEC, 2007b). Collectively, these agreements grant surface rights for access, mining and exploration activities.
| |
SRK Consulting (U.S.), Inc. | May 29, 2009 |
Exhibit 99.1
| |
Minera Andes Inc. | 3-2 |
San José Silver-Gold Project | NI 43-101 Technical Report |
3.5.1
Estancia Carmancita
In August of 2004, MSC signed an agreement with Mr. Roberto Flores that granted access rights from RP-43 across the Estancia Carmancita to San José. In addition to a US$56,000 payment for access, a payment of US$1,000 was to be paid monthly during the mine life. This agreement was replaced February 14, 2006 by a land purchase pursuant to which, the land was purchased by MSC and several members of the Flores Family from Mr. Roberto Flores. The purchase includes 5,543ha of contiguous land in the Estancia Carmancita. As a result, MSC now holds 66.66% of the surface rights and the Flores family holds 33.33%, which grants MSC free right of access. The price of US$74,009 has been paid to Mr. Roberto Flores. This agreement replaces the previous right of access agreement with Mr. Roberto Flores(AMEC, 2007b).
3.5.2
Estancia San José
Between 2002 and 2008, agreements were negotiated with MSC and the Beitía Family for a contiguous 2,875ha property within the Estancia San José for the construction of the San José Mine and associated infrastructure. MSC paid the Beitía Family US$353,400. This agreement was amended in 2005 and gives MSC surface rights for construction of the mine and its infrastructure, easement rights and use of all existing roads within Estancia San José. Local Resources and Infrastructure
3.6
Local Resources and Infrastructure
The nearest towns to the Project Site are Las Heras, Pico Truncado, and Perito Moreno with populations ranging from 3,600 to 15,000. These towns provide labor for the local oil industry. Perito Moreno also has tourist and agricultural industries. Basic necessities such as food, accommodations, and labor are available in these towns, but more advanced needs must be obtained from Caleta Olivia, Comodoro Rivadavia, or Buenos Aires. Comodoro Rivadavia is a coastal city and the closest major city (population 140,000) to the Project. The City has a deep water port facility and provides support for the oil and mining industries. A second deep water port is located at Puerto Deseado approximately 400km east-southeast of San José (AMEC, 2007b)
3.6.1
Access Road and Transportation
The Project is 350km along paved and unpaved roads from Comodoro Rivadavia. The last 32km between RP-43 and San José is a maintained gravel road. Transportation of materials to and from the Project is by truck.
The main access road to the Project and key secondary roads around the site require regular maintenance to keep them in good condition. The mine haulage roads provide access from the mine portals to the ore stockpile at the process facility and temporary rock stockpile facilities. The roads handle haul truck traffic transporting both ore and waste, and general surface traffic such as personnel transport, maintenance, supplies and exploration personnel and equipment (AMEC, 2007b).
| |
SRK Consulting (U.S.), Inc. | May 29, 2009 |
Exhibit 99.1
| |
Minera Andes Inc. | 3-3 |
San José Silver-Gold Project | NI 43-101 Technical Report |
3.6.2
Power Supply
Due to the remote location of the Project, electrical power was initially provided by a diesel-fired generating station. In 2008, MSC commenced construction of a high-voltage transmission line to connect the property to the national power grid. At the time of SRK’s most recent site visit (January 2009), construction of the transmission line was nearing completion and was expected to become operational during first quarter of 2009. After the transmission line is connected to the grid, the diesel generators will remain on site to provide backup power.
The current cost of electrical power is about US$0.30/kWh and is expected to reduce to less than US$0.10/kWh with connection to the national power grid.
3.6.3
Water Supply
Water is available year round at San José from Huevos Verdes Zones in the both Deseado and Pinturas Rivers. MSC has adequate water for activities at San José. The Project also includes a freshwater storage pond (AMEC, 2007b).
Fresh water for the underground mine is sourced from the settling ponds.
3.6.4
Camp Site, Buildings and Ancillary Facilities
The overall site plan is shown in Figure 3-1. It identifies the principal existing and planned facilities including the surface tailings impoundment, camp, processing facility, support buildings and mine portals, camp and core shack (AMEC, 2007b).
Camp and Other Buildings
The San José camp facilities can accommodate approximately 438 MSC personnel and 223 contractors for a total of 661 beds. The majority of employees in the mine and the plant work rotating shifts, with approximately 50% of these employees being off-site at any given time. San José also has a medical clinic, security building, maintenance shop, change house, mine and process facility warehouses, core shack, an administration building and offices.
Fire Protection
A pump station connected to the fresh water storage pond is set up for fire protection. The primary pump is electric with a diesel-driven backup pump in case of electrical system failure. Water pressure for fighting fires is maintained at 825kPa (120psi) and was designed for a flow of 60L/s (1,000gal/min) at a test pressure of 1,380kPa (AMEC, 2007b).
Communications
MSC has installed a satellite-based telephone/data/internet communication system and has also equipped its pick-up trucks with two-way radios for communication within the mine area (AMEC, 2007b).
Security and Fencing
Because the terrain around the Project site is relatively flat, treeless, and easy to monitor, MSC has not fenced the entire Project area. Security fencing has been placed around key facilities and security personnel are stationed at key access points. In addition, security routinely performs vehicle patrols (AMEC, 2007b).Tailings Storage Area
| |
SRK Consulting (U.S.), Inc. | May 29, 2009 |
Exhibit 99.1
| |
Minera Andes Inc. | 3-4 |
San José Silver-Gold Project | NI 43-101 Technical Report |
The tailings impoundment is located adjacent to the mill.
3.6.5
Waste Disposal Area
There are four temporary waste rock storage facilities located on surface near backfill raises for ease of moving waste. The maximum anticipated volume of waste rock on the surface is approximately 250,000t, requiring an area of about 4.1ha for temporary storage. Waste rock is stacked a maximum of 10 to 15m at 37°, the angle of repose for the tailings, to provide stability to the pile. The short cycle time at surface is designed to minimize acid generation potential from rainfall infiltration (AMEC, 2007b).
3.6.6
Manpower
According to the Minera Andes 2008 Annual Information Form, filed March 31, 2008 on www.sedar.com, construction of the Project utilized approximately 1,100 employees on-site. At December 2008, the mine was staffed by approximately 450 personnel.
| |
SRK Consulting (U.S.), Inc. | May 29, 2009 |
Exhibit 99.1
| |
Minera Andes Inc. | 3-5 |
San José Silver-Gold Project | NI 43-101 Technical Report |
Figure 3-1: Mine Site Infrastructure Layout
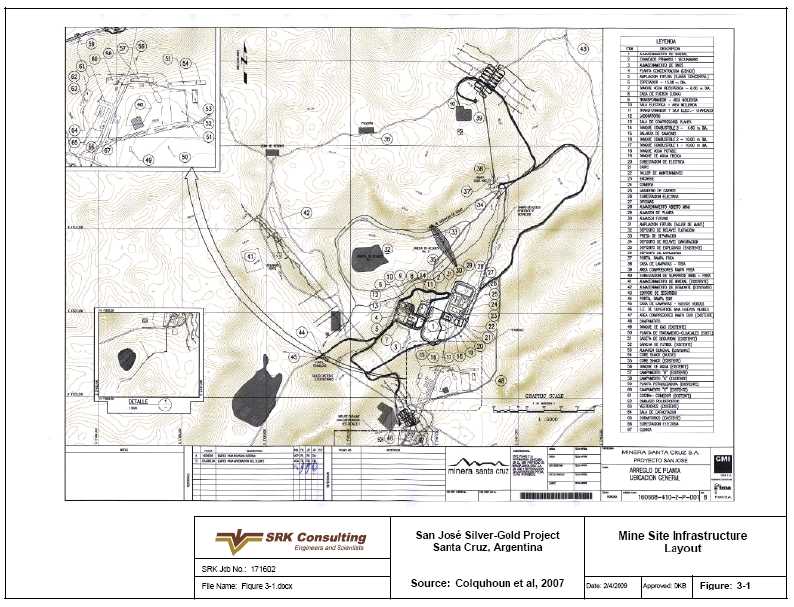
| |
SRK Consulting (U.S.), Inc. | May 29, 2009 |
Exhibit 99.1
| |
Minera Andes Inc. | 4-1 |
San José Silver-Gold Project | NI 43-101 Technical Report |
4
History(Item 8)
Sections 4.1 and 4.2 have been excerpted fromNI 43-101 Technical Report Update on the San José Property, Santa Cruz Province Argentina, (AMEC, 2007b). Changes to standardizations have been made to suit the format of this Technical Report. Edits to text are indicated with the use of brackets.
4.1
Ownership
The property is located in Santa Cruz Province, which until recently was designated as one of Argentina's most under-explored areas. Parts of the Province were reviewed during the 1970's as part of a joint Argentine government–United Nations regional exploration plan (Patagonia–Comahue). In the 1980's, Fomicruz, S.E., a state-owned company, completed Province-wide reconnaissance surveys to delineate mineral-prospective areas (Minera Andes, 2002).
As far as MSC is aware, the property had not previously been staked. There is no record of any previous sustained exploration, although portions of the area may have been sampled during at least one regional reconnaissance program.
4.2
Past Exploration and Development
The property was first acquired by Minera Andes in 1997, after a regional structural study and prospecting program uncovered areas of Landsat color anomalies, and coincident anomalous gold and silver values were returned from surface rock chip samples. Based on these results, Minera Andes embarked on an exploration program from 1997 to 2001, which led to the discovery of the Huevos Verdes and Saavedra West Zones.
In March 2001, Minera Andes signed an option and joint venture agreement with MHC. Exploration continued intermittently over the next two years (Table 4.2.1).
In late 2004, a major drilling program commenced on both the Huevos Verdes and Frea Zones as part of Feasibility Study activities. The drilling continued until May 2005, in conjunction with ongoing metallurgical, mine design, geotechnical and environmental studies. The Feasibility Study was completed in October 2005 by AMEC; results were reported in Cinits et al. (2005).
The Feasibility Study indicated a positive return from underground mining of the Frea, Huevos Verdes South (HVS), Huevos Verdes Central (HVC) and Huevos Verdes North (HVN) zones. Mining was planned as Mechanized Cut and Fill (MC&F) for the primary mining method, supplemented with Conventional Cut and Fill (CC&F) mining where the vein width was not sufficient to permit entry of the mechanized equipment. Waste rock from development was planned as backfill in the cut-and-fill mining.
San José ore was to be processed on-site using conventional crushing, grinding, flotation and concentrate cyanidation leach technology, with cyanide recovery and destruction. Gold and silver recovery was to be by standard Merrill Crowe zinc precipitation and refined to produce doré bars. The nominal milling rate was 750t/d at an average mill feed grade of 7.7g/t of gold and 406g/t of silver.
| |
SRK Consulting (U.S.), Inc. | May 29, 2009 |
Exhibit 99.1
| |
Minera Andes Inc. | 4-2 |
San José Silver-Gold Project | NI 43-101 Technical Report |
Table 4.2.1: General Exploration History of San José Property
| | |
Year | Company | Description |
1997 to 2001 | Minera Andes | Property first staked; 5 year program consisting of prospecting; soil sampling; stream sediment sampling; mapping and sampling; trenching and channel chip sampling; IP/Resistivity (74 line km), CSAMT (42 line km) and magnetic surveys (186 line km); diamond drilling (85 holes) and diamond drilling (3 holes); alteration studies (Portable Infrared Mineral Analyzer); metallurgical studies; discovery of Saavedra West and Huevos Verdes Zones, plus numerous prospects. |
2001 to 2003 | MSC | Joint Venture company created between Minera Andes and Hochschild; 2 year program consisting of surveying; IP/Resistivity (45 line km), and Real Section IP (20.25 line km) surveys; diamond drilling (30 holes); further definition of the Huevos Verdes Zone; resource estimates at Huevos Verdes and Saavedra West vein and breccia zones. |
2003 to 2004 | MSC | Hochschild vested at 51% ownership; 2 year program consisting of underground development at HVN and HVS; surface rights land purchasing; road construction; diamond drilling (39 holes); program further outlined the Huevos Verdes Zone and resulted in the discovery of the Frea Zone. |
2004 to 2005 | MSC | Definition-style diamond drilling (144 holes); initiation of Feasibility Study including resource and reserve estimates at Huevos Verdes and Frea, mine design, capital and operating cost estimation, metallurgical, geotechnical environmental EIA and social studies; continued underground development on 480 and 430 levels at HVN and HVS; IP/Resistivity (215 line km) surveys; additional 38 diamond drillholes to test regional targets. |
October 2005 | MSC | Completion of Feasibility Study |
November 2005 to June 2006 | MSC | Phase 1 and Phase 2 drilling at Kospi Vein (128 holes); EIA approved by DPM on March 1, 2006; continued underground development (ramp construction and drifting at HVS and Frea); Granting of Environmental Permit, production decision (March 28, 2006); change of metallurgical processing and recovery methodology to a Gekko system; supporting metallurgical test work; mine construction, permitting |
September 2007 | MSC | Preparation of a Technical Report by AMEC, including a resource and reserve estimation with effective date of December 31, 2006 |
July 2006 to September 2007 | MSC | Ongoing plant and infrastructure construction, continued mine development, resource/reserve estimation (Huevos Verdes, Frea, Kospi), continued metallurgical test work, official mine opening (June 26, 2007), continued drilling of regional prospects (31 holes as of September 30, 2007). |
October 2008 to June 2008 | MSC | Commercial production officially commenced on January 01, 2008. |
Estimated capital costs in the Feasibility Study were about US$61 million, whereas the average LoM operating costs per tonne of ore were estimated to be US$79.92 for a cash cost of US$200/oz gold-equivalent. Final capital costs exceeded those estimated by approximately 48% (US$90.6 million versus US$61 million) (AMEC, 2007b).
Since November 2005, underground development continued, together with construction of the processing plant and mine infrastructure. Limited pre-commissioning production commenced in the second half of 2007, and the start of commercial production was declared on January 1, 2008.
In September 2007, AMEC completed a Technical Report (AMEC, 2007b), which summarized the previous exploration. A 128 hole diamond (22,047m) drilling program during 2005 and 2006 at the newly discovered Kospi Vein was successful in outlining approximately 614,000t of Indicated Mineral Resources grading 7.25g/t Au and 601g/t Ag, plus 206,000t grading 8.91g/t Au and 614g/t Ag.
| |
SRK Consulting (U.S.), Inc. | May 29, 2009 |
Exhibit 99.1
| |
Minera Andes Inc. | 4-3 |
San José Silver-Gold Project | NI 43-101 Technical Report |
Numerous other high priority targets were identified on the property through early previous stage drilling and surface exploration programs. The main targets are Odin (A and B), Ayelén, Flor, Huevos Verdes West, Kospi 1, Kospi South, Lourdes, Frigga, Aguas Vivas, Roadside, and Portugues West, which added significant “upside potential” for the property. An exploration program was recommended, with a total cost of approximately US$3.9 million, including 145 drillholes (38,300m). At the time of AMEC’s Technical Report completion in October 2007, the exploration program had started, and 24 holes (5,858m) had been drilled, mainly in the northwest and southeast extensions of the Frea vein.
4.3
Historic Mineral Resource and Reserve Estimates
The 2007 Mineral Resource for the Huevos Verdes, Kospi and Frea Zones are summarized in Table 4.3.1. (AMEC, 2007b).
Table 4.3.1: San José - Mineral Resources, June 30, 2007*
| | | | | | |
Vein | Category | Tonnes | Ag | Au | Ag | Au |
(kt) | (g/t) | (g/t) | (koz) | (koz) |
Huevos Verdes | Measured | 290 | 691 | 9.04 | 6,447 | 84 |
Indicated | 325 | 368 | 5.26 | 3,849 | 55 |
Measured & Indicated | 616 | 520 | 7.04 | 10,296 | 139 |
Inferred | 37 | 348 | 5.66 | 411 | 7 |
Frea | Measured | 354 | 397 | 5.70 | 4,523 | 65 |
Indicated | 596 | 377 | 10.51 | 7,222 | 201 |
Measured & Indicated | 950 | 384 | 8.72 | 11,745 | 266 |
Inferred | 83 | 333 | 7.07 | 887 | 19 |
Kospi | Measured | - | - | - | - | - |
Indicated | 800 | 622 | 7.63 | 15,991 | 196 |
Measured & Indicated | 800 | 622 | 7.63 | 15,991 | 196 |
Inferred | 110 | 577 | 9.06 | 2,040 | 32 |
Total San José | Measured | 645 | 529 | 7.20 | 10,969 | 149 |
Indicated | 1,721 | 489 | 8.18 | 27,062 | 453 |
Measured & Indicated | 2,365 | 500 | 7.91 | 38,032 | 602 |
Inferred | 230 | 452 | 7.80 | 3,338 | 58 |
*Effective Date June 30, 2007, adjusted by E. Henry, MAusIMM (CP) – AMEC from A. Puerta, MAusIMM
The 2007 Mineral Reserves for the Huevos Verdes, Kospi and Frea Zones are summarized in Table 4.3.2. (AMEC, 2007b)
| |
SRK Consulting (U.S.), Inc. | May 29, 2009 |
Exhibit 99.1
| |
Minera Andes Inc. | 4-4 |
San José Silver-Gold Project | NI 43-101 Technical Report |
Table 4.3.2: Proven and Probable Mineral Reserves – June 30, 2007*
| | | | | | | | | |
Zone | Proven and Probable (t) | Au (g/t) | Ag (g/t) | Proven (t) | Au (g/t) | Ag (g/t) | Probable (t) | Au (g/t) | Ag (g/t) |
Huevos Verdes | | | | | | | | | |
HVS | 287,000 | 7.64 | 565 | 177,000 | 8.70 | 655 | 110,000 | 5.93 | 419 |
HVC | 78,000 | 3.90 | 214 | - | - | - | 78,000 | 3.90 | 214 |
HVN | 230,000 | 3.69 | 301 | 130,000 | 4.44 | 349 | 100,000 | 2.73 | 240 |
Total Huevos Verdes | 595,000 | 5.62 | 417 | 307,000 | 6.91 | 526 | 288,000 | 4.26 | 301 |
Frea | 937,000 | 7.77 | 343 | 350,000 | 4.84 | 344 | 587,000 | 9.52 | 342 |
Kospi | 854,000 | 6.52 | 536 | - | - | - | 854,000 | 6.52 | 536 |
Total All Zones | 2,386,000 | 6.79 | 430 | 657,000 | 5.80 | 429 | 1,729,000 | 7.16 | 431 |
*reviewed by P. Rocque, P.Eng., June 30, 2007
Note: Grades and tonnes may not tally exactly due to rounding
These resources and reserves were the subject of a NI 43-101 Report titled Technical Report Update on the San José Property, Santa Cruz Province, Argentina by AMEC 1007 and as such meet the requirements for reporting under NI 43-101 guidelines.
4.4
Historic Production
Limited pre-commissioning production commenced in the second half of 2007, and the start of commercial production was declared on January 1, 2008. Table 4.4.1 lists the production for 2007 and 2008.
Table 4.4.1: Mine Production, 2007 and 2008
| | |
Production | 2007* | 2008** |
Ore production (t) | 92,974 | 295,963 |
Average head grade Ag (g/t) | 538.39 | 559 |
Average head grade Ag (g/t) | 7.08 | 6.69 |
Ag produced (oz) | 92,000 | 4,380,000 |
Au produced (oz) | 14,950 | 54,260 |
*Source: HMP, 2007.
**Source: MAI, 2009.
| |
SRK Consulting (U.S.), Inc. | May 29, 2009 |
Exhibit 99.1
| |
Minera Andes Inc. | 5-1 |
San José Silver-Gold Project | NI 43-101 Technical Report |
5
Geologic Setting(Item 9)
Section 5 has been excerpted fromNI 43-101 Technical Report Update on the San José Property, Santa Cruz Province Argentina, (AMEC, 2007b). Changes to standardizations have been made to suit the format of this Technical Report. Edits to text are indicated with the use of brackets.
5.1
Regional Geology
The Project is located in the extreme northwest corner of the 60,000km2 Deseado massif, in Patagonia, Southern Argentina. Jurassic volcanic rocks in the massif host numerous widely-distributed clusters of gold- and silver-bearing quartz veins such as Cerro Vanguardia, Martha, Manantial Espejo and San José (Figure 5-1).
The Deseado massif consists of Paleozoic low-grade metamorphic basement rocks unconformably overlain by an extensive sequence of Middle to Upper Jurassic-aged andesitic to rhyolitic volcanic and volcaniclastic rocks. These in turn are overlain by Cretaceous sediments and Tertiary to Quaternary basalts.
The Jurassic rocks are divided into the Bajo Pobre Formation, predominantly of intermediate composition, and the felsic Bahia Laura Group, which discordantly overlies the Bajo Pobre Formation. The Bahia Laura Group is in turn subdivided into the Chon Aike Formation (dominantly ignimbrites) and the La Matilde Formation (dominantly volcaniclastic rocks). These units are overlain by Cretaceous-aged tuffs and siliciclastic sediments of the Castillo Formation, which were deposited in small fault-controlled basins concentrated along the northern and southern margins of the Deseado massif. Overlying these are Tertiary-aged flood basalts of the Alma Gaucha Formation, which are widespread and cover much of the northwestern and central portions of the massif (Figure 5-1).
The Jurassic volcanic rocks are mostly exposed in erosional windows through the Cretaceous and Tertiary units. The principal host rock for gold and silver mineralization in the San José District is the Bajo Pobre Formation, where veins are typically developed in competent andesite flows and to a lesser extent, in phyllic-altered volcaniclastic units.
5.2
San José Regional and Local Geology
The geology of the property is covered by the 1:250,000 scale Pluma topographic quadrangle mapsheet (4769-I; Cobos and Panza, 2001). The principal lithologies present in the Project area are described in the sections that follow. Most of the following descriptions of the stratigraphy are summarized from Dietrich et al. (2004).
Figure 5-2 shows the geology and selected principal target areas on the property, and Figure 5-3 shows the geology of area surrounding the Huevos Verdes and Frea Deposits.
5.2.1
Bajo Pobre Formation (Upper Jurassic)
The Bajo Pobre Formation is the lowermost stratigraphic unit on the property and is assumed to underlie the entire area. It comprises a Lower Andesite Volcaniclastic Unit, and an Upper Andesite Lava Flow Unit. A dacitic, hornblende-megacrystic lava flow of very restricted extent has also been identified; however, its stratigraphic position within the Formation is uncertain. The formation has a maximum thickness of 120m. It is the main host for gold and silver vein mineralization at the Huevos Verdes, Frea and Kospi deposits, as well as many of the regional prospects in the northern half of the property. This formation also hosts some of the mineralization at the Saavedra West Zone.
| |
SRK Consulting (U.S.), Inc. | May 29, 2009 |
Exhibit 99.1
| |
Minera Andes Inc. | 5-2 |
San José Silver-Gold Project | NI 43-101 Technical Report |
Age dating of the andesitic lava flow unit (sample 19454) within the Bajo Pobre Formation, by Dietrich et al. (2004) has yielded results ranging from 144.4±1.0 Ma to 144.7±0.3 Ma (40Ar/39Ar plateau ages). The volcaniclastic unit (sample 19402) has been dated at 150.6±4.1 Ma. This gives an Oxfordian-stage age-date for the volcaniclastics and a Kimmeridgian age for the lava flows, and indicates that there was a hiatus of around 5 Ma between two volcanic events. The hiatus could explain the appearance of an unconformity and the development of paleo-relief, including erosion of a paleo-valley along the present Rio Pinturas.
Volcaniclastic Andesite
The volcaniclastic andesites are typically light gray, and on surface form smoothly rounded “elephant back”-textured exposures, which are poorly consolidated and easily eroded. They consist of rounded to subangular heterolithic fragments set in a porphyritic, andesitic matrix. Although clast composition can be variable and consist of a variety of intermediate volcanic lithologies, in general they are fairly homogeneous. Other volcanic lithologies rarely exceed 10% of the clasts, which make up between 30% and 50% of the rock. The grain size distribution of the rocks is extremely variable, comprising a continuous range of grain sizes from millimeter to meter size.
The fine-grained tuffaceous groundmass between the clasts is medium to dark gray in color, and consists mainly of feldspar–hornblende–biotite phenocrysts. Hypidiomorphic feldspars are medium-grained and make up about 30% of the rock. Hornblende crystals are fine-to medium-grained and comprise between 5% to 20% of the rock volume. Fine-grained biotite is a minor constituent of the matrix (5%). Occasionally quartz phenocrysts have been observed and can contribute up to 5% of the rock.
Generally, an epiclastic environment is inferred for the volcaniclastic unit of the Bajo Pobre Formation. This is supported by the chaotic changes in facies, in which small flow channels and pockets, intercalated lenses or channels of silty, finely-bedded material have been identified. No evidence has been found that indicates a pyroclastic origin for these rocks.
The volcaniclastic unit is generally pervasively altered, and commonly has at least a propylitic overprint. Weathering within the altered portions of the unit contributes to the characteristic poor consolidation on surface and strongly permeable matrix.
Andesitic Lava Flows
The andesitic volcaniclastics are discordantly overlain by andesitic lava flows. Outcrops along the western flank of the Rio Pinturas valley indicate that the lava flows probably followed a paleo-valley of the Rio Pinturas.
The lava flows occur as dark, competent, cliff-forming beds, which overlie the smoothly-weathered, pale gray volcaniclastics. Vertical columnar jointing is developed locally. The lava flow unit has a thickness of up to 50m.
The composition of the flows is andesitic, and phenocrysts are mainly feldspar, hornblende or biotite. Feldspars make up about 30% of the rock and are small- to medium-grained and generally hypidiomorphic. A population of medium-grained white to greenish feldspar co-exists with a smaller population of fine-grained transparent feldspar. Amphiboles make up about 15% of the rock, and are fine-grained. Biotite is a minor constituent and only constitutes about 5% of the rock volume. Weak chloritization is often associated with the biotite and amphiboles. Quartz phenocrysts have been observed occasionally, but do not exceed 5% of the rock. The groundmass is greenish to brownish-gray in color.
| |
SRK Consulting (U.S.), Inc. | May 29, 2009 |
Exhibit 99.1
| |
Minera Andes Inc. | 5-3 |
San José Silver-Gold Project | NI 43-101 Technical Report |
The texture of the lava flow is generally massive; however, small-scale fine laminations are not uncommon. Auto-breccia textures, caused by cooling during flow of the lava, are also noted in areas where varying degrees of weathering and hydrothermal alteration affected the rock, and have highlighted these textures.
Hornblende-Megacrystic Dacite
A hornblende-megacrystic dacite lava flow of very restricted extent has been identified in the area between the Portugues West and Roadside Targets where the flow partially forms the host rock to vein-style mineralization. Another occurrence has been found to the south of the Pluma Sur Target. The unit consists of 20% to 25% medium- to coarse-grained amphibole phenocrysts (up to 1cm in length) along with 20% to 25% feldspar phenocrysts and 5% medium- to coarse-grained quartz phenocrysts.
Weathering of this unit is “smooth”, similar to the volcaniclastic unit. Even though the dacitic lava flow has been observed resting on top of the volcaniclastic andesite unit, its stratigraphic position with respect to the andesitic lava flows is not clear.
5.2.2
Chon Aike/La Matilde Formation (Upper Jurassic)
In the following text no separation has been made between the Chon Aike and La Matilde Formations, and for the purposes of this Technical Report both have been grouped together and referred to as the Chon Aike Formation.
Andesitic volcanic rocks of the Bajo Pobre Formation are discordantly overlain by volcanic rocks of the Chon Aike Formation. Where the Chon Aike formation is overlain by Cretaceous sedimentary rocks, the upper contact of the Chon Aike is concordant; however, this contact is discordant with the overlying Tertiary flood basalts.
Previously, outcrops of the Chon Aike Formation were thought to be restricted to geologically-mapped areas to the north of the Rio Pinturas valley, and in the Saavedra West area. However, recent mapping by Dietrich et al. (2004) indicates that a widespread tuffaceous unit overlies the Bajo Pobre Formation volcanics. This unit had been interpreted to belong to the Cretaceous-aged Castillo Formation; however, new evidence indicates that it may actually belong to the tuffaceous facies of either the Chon Aike or La Matilde Formations.
In the Saavedra West area, the thickness of this formation is around 80 to 100m; however, at Huevos Verdes, La Sorpresa and Rio Pinturas the thickness is only 15 to 20m. Similar to the Bajo Pobre Formation, pyroclastic rocks of the Chon Aike Formation are laterally extensive and occur in outcrop erosional windows over the entire mapped area. Lithologies of this unit are not resistant against erosion and are easily transformed into fertile soils; therefore, most of their potential exposures are covered by vegetation. In areas where the Chon Aike tuffs are overlain by thin exposures of Tertiary-aged flood basalts, eroded boulders of basalt generally cover the sporadic Chon Aike outcrops.
| |
SRK Consulting (U.S.), Inc. | May 29, 2009 |
Exhibit 99.1
| |
Minera Andes Inc. | 5-4 |
San José Silver-Gold Project | NI 43-101 Technical Report |
Age dating of a sample of rhyodacitic ignimbrite (sample 19415) within the Chon Aike Formation by Dietrich et al. (2004) has yielded results of 147.6±1.1Ma (40Ar/39Ar biotite plateau age), which overlaps with a bulk isochron age of 151.4±3.9Ma. An Upper Jurassic, Oxfordian-stage date is given for the Chon Aike Formation of the San José District, which is younger than the age of the volcaniclastic sequence but older than the andesitic lava flows of the Bajo Pobre Formation.
Paleo Surface Conglomerate
A conglomeratic horizon, characterized by the presence of hydrothermal quartz fragments and boulders, has traditionally been used to define the base of the Chon Aike Formation in drill core logging.
This unit consists of angular clasts of porphyritic rock and hydrothermal quartz set into a fine-grained matrix. Hydrothermal quartz and chalcedony are present as cross-cutting, irregular veinlets of centimeter-scale and to a minor extent as interstitial filling between clasts, and also as clasts. The breccia is interpreted to be colluvium at the paleo-surface of the Bajo Pobre Formation, where volcanic rocks and boulders of quartz were present as clasts.
Rhyodacitic Ash Flow Tuffs
Two isolated outcrops of rhyodacitic ignimbrite overlying exposures of the Bajo Pobre Formation have been identified in the northern Rio Pinturas valley. Their geometry suggests that these pyroclastic flows followed the paleo-valley of the Rio Pinturas.
Rhyodacitic pyroclastic flows are found intercalated with a predominantly tuffaceous sequence in the Saavedra West area. The composition of the pyroclastics is indicated by phenocryst assemblage of 10 to 15% quartz, 20% feldspar, and 10% biotite. Phenocrysts are small- to medium-grained and frequently broken. Lithoclasts of dark, dense, volcanic lithologies are angular to sub-rounded, and range from millimeter to centimeter scale, and make up some 5% to 30% of the rock.
Tuffaceous Deposits
Within the Saavedra West area, pyroclastic rhyodacitic flows occur intercalated with fine-grained tuffaceous deposits. Due to the presence of these pyroclastic flows, the units are considered to be correlates of the Chon Aike Formation. In the Huevos Verdes Zone, very similar tuffaceous deposits are found overlying andesitic volcanics of the Bajo Pobre Formation, and appear to be cross-cut by the Huevos Verdes vein in the Central area.
As a result of observations made by Dietrich et al. (2004), all tuffaceous rocks which overlay the Bajo Pobre Formation volcanics are considered to be members of the Chon Aike Formation. This contradicts the traditional interpretation of these tuffaceous deposits in the Huevos Verdes area as being Cretaceous in age, and in turn has implications for the interpretation of the alteration pattern around the Huevos Verdes veins. Representative outcrops of these tuffs are present in the La Sorpresa area, as well as in several locations within the Huevos Verdes erosional window.
The tuffaceous deposits range from quartz-rich crystal tuffs to fine-grained crystal-poor tuffs. Crystal tuffs contain up to 50% phenocrysts, mostly quartz and biotite, while feldspars are normally altered or weathered to argillic aggregates and are less obvious. Crystal-poor tuffs still contain some phenocrysts, most as biotite, but also contain glass shards which in fresh outcrops in the La Sorpresa area show an orange color. The unit has occasional fine bedding, and/or variable amounts of clasts and xenoclasts. The clasts are normally angular, of millimeter to centimeter scale, and comprise several volcanic but mostly tuffaceous lithologies.
| |
SRK Consulting (U.S.), Inc. | May 29, 2009 |
Exhibit 99.1
| |
Minera Andes Inc. | 5-5 |
San José Silver-Gold Project | NI 43-101 Technical Report |
Other tuffs of the sequence contain sub-rounded quartz and feldspar particles which make up to 20% of the rock. Redeposition of the tuffs with significant transport is inferred.
5.2.3
Castillo Formation (Cretaceous)
Sedimentary rocks of the Cretaceous-aged Castillo Formation are exposed in various portions of the property; however, some of the best exposures occur in the northern part, south of the Rio Deseado valley, where the Deseado massif passes into the San Jorge basin. Deposition was interpreted to be controlled by block faulting adjacent to the San Jorge basin, which created small, normal fault-controlled depressions.
Exposures of Cretaceous sedimentary rocks are also present in the La Sorpresa area, the Eastern Windows area, the north-eastern part of the Huevos Verdes window, in the surroundings of the Estancia San José, and in the Portugues West area.
The thickness of the Cretaceous unit varies throughout the property, but generally ranges between 5m to 80m and decreases towards the south.
The Cretaceous sedimentary sequence has been divided into two members:
·
A Lower Member consisting of fluvial channel deposits formed in a braided river environment. Rocks of this member are reddish conglomerates and sandstones (greywackes) that are intercalated with, and grading outwards to tuffaceous siltstones; and
·
An Upper Member formed in a predominantly lacustrine environment, consisting of banks of whitish tuffaceous siltstones with bioturbation, intercalated with coarser grained beds of sediment of probable fluvial origin.
Previously, a third and lowermost member of the Castillo Formation was defined (tuffaceous deposits); however, this is now considered to be part of the Chon Aike Formation and is described above in the Chon Aike Formation description.
5.2.4
Alma Gaucha Formation (Tertiary)
The north-western part of the Deseado massif is covered by an extensive area of Tertiary-aged flood basalts. At least two basaltic events are present in the San José area. The main flood basalts belong to the Alma Gaucha Formation. Another generation of basalts extruded from a source which is believed to be close to Cerro Portugues (approximately 16km west of the Huevos Verdes veins). The lava flows occur as distinct channels, rather than sheets, and can be easily recognized on satellite imagery.
Alma Gaucha Formation (Upper Oligocene)
The flood basalts of the Alma Gaucha Formation cover a significant portion of the property and occur as an extensive “meseta-like” cover, which extruded onto a peneplain. The source location of the basalts remains unknown; however, they principally occur as a uniform, flat-lying bed up to 30m in thickness, which straddles the Rio Pinturas valley.
| |
SRK Consulting (U.S.), Inc. | May 29, 2009 |
Exhibit 99.1
| |
Minera Andes Inc. | 5-6 |
San José Silver-Gold Project | NI 43-101 Technical Report |
A sample from the base of the sequence has been dated by Dietrich et al. (2004) at 24.5±0.3 Ma using40Ar/39Ar method. Based on this age, the flood basalts belong to the Upper Oligocene Alma Gaucha Formation, rather than the Eocene-aged Cerro del Doce Formation, as previously mapped in the El Pluma Quadrangle (Cobos and Panza, 2003).
The basalts have been subdivided into four units:
·
Basal Basalt: The lowermost portion of the basalt sequence is marked by a very fine-grained, dense basalt containing around 5% olivine phenocrysts and about 2% vesicles;
·
Eye Basalt: Stratigraphically above the basal basalt is a basalt that contains about 10% mm-sized round vesicles, which are partially filled by zeolites. Fine-grained plagioclase phenocrysts make up approximately 30% of the rock and small- to medium-grained olivine phenocrysts constitute about 5%;
·
Vesicular Basalt: The next unit in the stratigraphic sequence is characterized by approximately 40% irregularly-shaped vesicles to centimeter scale, which are also partially filled by zeolites. The remaining porosity is about 30%. This unit is about 10m thick, and due to its porosity, is strongly weathered and therefore not very prominent in outcrop exposure; and
·
Olivine-Porphyritic Basalt: The uppermost member of the flood basalt sequence contains around 15% fine-grained olivine phenocrysts set in a dense massive matrix. Pyroxene makes up approximately 10% of the rock, while fine-grained white to transparent laths of plagioclase comprise upwards of 20% of the rock volume. The thickness of the unit is between 2.5m to 10m.
Cerro Portugues Volcanic Centre Basalts
Basalt flows that originated from the Cerro Portugues volcanic centre can be observed in satellite imagery. The flows form channels around Cerro Portugues and appear to overlie the flood basalts. Some of these lava flow channels extend as far north as the modern Rio Deseado valley, a distance of about 20km. The basalts of Cerro Portugues have not been described or sampled; however, it is believed that they are Recent in age.
5.2.5
Fluvio-glacial Till Deposits
Glacially-derived and unconsolidated till deposits of up to 50m in thickness occur predominantly west of the Rio Pinturas valley, but are quite restricted on the eastern side of Rio Pinturas. This implies that the Rio Pinturas valley was possibly filled by a glacier during the Pleistocene, which transported the till towards the north.
5.2.6
Geology of the Saavedra West Zone
The Saavedra West Zone is located in the southern part of the property and differs slightly than that surrounding the Huevos Verdes, Frea and Kospi Veins. The geology at Saavedra West has previously been described by Setterfield (1999), as follows:
“The Bajo Pobre Formation is the oldest unit encountered, and dominates the eastern part of the Saavedra West area. It consists predominantly of massive andesitic flows, with lesser amounts of volcaniclastic material and minor dacite. This formation is presumed to underlie the Saavedra West area and form the local basement”.
| |
SRK Consulting (U.S.), Inc. | May 29, 2009 |
Exhibit 99.1
| |
Minera Andes Inc. | 5-7 |
San José Silver-Gold Project | NI 43-101 Technical Report |
“Ignimbrites and sediments tentatively correlated with the La Matilde Formation occur in a restricted area known as the Saavedra West basin. The ignimbrites are commonly white to light-green lapilli tuffs, and are characterized by containing biotite crystals, lithic schist clasts interpreted to have been derived from pre-Jurassic basement, clasts of carbonized wood up to 25cm across and up to 20% bipyramidal quartz crystals. Pumice clasts are rarely discernible.
Although typically a lapilli tuff, fine-grained versions of this unit are present locally. These may represent the fine, ash-rich upper parts of the ignimbrites, or slightly reworked material. The northeast part of the basin contains an enigmatic rock sequence which trends northwest, and is composed of interbedded green–brown, feldspar-rich wacke, yellow–brown, textureless clay, and black, carbon-rich sediments. The sequence is tentatively interpreted as sediments derived from the La Matilde Formation ignimbrites. The ignimbrite and the sedimentary sequence are both subhorizontal. Pebble dikes, varying in thickness from 1cm to 10m, are common in the southwest part of the basin, particularly in a zone from Discovery Hill to a large outcrop 400m to the west. The dikes contain white clasts of ignimbrite, rare schist clasts and clasts of quartz (of metamorphic origin?) in matrix of purple rock flour with minor quartz and biotite crystals. Most of the outcropping dikes cut La Matilde Formation ignimbrites, but several cut the La Matilde Formation sedimentary unit. Several small zones of hydrothermal breccia occur on Discovery Hill, as does an interpreted phraetomagmatic breccia.”
“Ignimbrites and minor rhyolites that may be part of the Chon Aike Formation are interpreted to be younger than the La Matilde Formation basin fill material. These are red-brown to white, with variable amounts of quartz and plagioclase crystals. Tuffs comprise the bulk of this unit, but lapilli tuffs and rare tuff breccias are locally present. This unit crops out discontinuously around the west part of the Saavedra West basin, most notably at El Domo, where it occurs as a complicated series of dikes interpreted to have intruded along a system of interconnected faults. Later dikes typically disrupt early dikes, and clasts of early dikes are incorporated into later ones. A thick, moderately dipping sequence of these ignimbrites occurs at Cerro Celular and at an isolated hill 800m to the south. It is possible that the intrusive ignimbrites at El Domo constitute feeder dikes to the extrusive ignimbrites at Cerro Celular.”
The area surrounding Saavedra West is interpreted to be a structural basin or graben which probably existed at the time of volcanism (Figure 5-4). This complexly-shaped graben was likely caused by synvolcanic subsidence, i.e., a caldera. The eastern bounding fault and the interconnected faults which bound the graben on the northwest can be traced on surface; however, the south and southwest boundaries are covered by late Tertiary basalt. The area to the north of the basin lacks outcrop, making it difficult to define the location of the boundary. Northwest-trending structures within the Saavedra West basin further complicate the surface geology.
In the northwest part of the basin, ignimbrite dykes, interpreted as correlative with the Chon Aike Formation, intrude along the bounding faults of the basin. These may or may not have been the vents for extrusive Chon Aike Formation ignimbrites preserved at Cerro Celular and to the south. The ignimbrites likely covered the entire map area at one point, but are only preserved where they have been strongly altered, or immediately adjacent to such alteration.
5.2.7
Structure
The main structural trend of faults and the majority of vein systems on the San José property is northwest to north–northwest. Less prominent are faults and mineralized features strike east, and to a minor extent north to north–northeast; however, since a large percentage of the Jurassic rocks in the area are covered by Cretaceous to Tertiary late cover, this may not represent an accurate description of the entire structural inventory (Dietrich et. al., 2004).
| |
SRK Consulting (U.S.), Inc. | May 29, 2009 |
Exhibit 99.1
| |
Minera Andes Inc. | 5-8 |
San José Silver-Gold Project | NI 43-101 Technical Report |
The San José mineralized district is transected by two north–northeast-striking major lineaments. The Rio Pinturas lineament follows the Rio Pinturas valley and is one of the main structural features of the northwestern Deseado massif. The lineament can be traced over a distance of 100km. A second subparallel lineament is located approximately 2km east of the Rio Pinturas lineament (Figure 5-5).
The vein systems at Huevos Verdes, and possibly also at Frea, developed along north-northwest-striking sinistral strike-slip faults that were possibly reactivated during a period of Triassic rifting (Dietrich et. al., 2004). The Huevos Verdes vein system is known to be composed of three main segments along strike. Bending of the vein from north-northwest towards an east–northeast strike occurs between individual segments. This geometry is interpreted to reflect formation of mineralized tension fissures with sinistral strike-slip displacement in between dextral master wrench faults (Dietrich et. al., 2004). Dextral wrench faulting is described to have occurred during mid to upper Jurassic times in the region, and would be related to early opening of the southern Atlantic (Uliana et al., 1989; Nullo, 1991; Sanders, 2000 in Dietrich et. al., 2004).
Contacts between Jurassic, Cretaceous and Tertiary rocks are present at variable elevations over the district, some of which may be attributed to paleo-topography; however, there may also be a component of post-mineral block faulting.
5.2.8
Alteration
Alteration noted within the property area is typical of a low-sulfidation (LS) epithermal-mineralized environment. Silicification accompanies all of the veins and fractures and occurs as a narrow alteration halo, generally surrounded by an extensive zone of intermediate argillic (often with an argillic overprint), mixed with phyllic alteration. A much more extensive zone of propylitic alteration surrounds the argillic zone.
In many locations, strong argillic alteration is interpreted to be a supergene overprint of the propylitic halo with disseminated pyrite.
| |
SRK Consulting (U.S.), Inc. | May 29, 2009 |
Exhibit 99.1
| |
Minera Andes Inc. | 5-9 |
San José Silver-Gold Project | NI 43-101 Technical Report |
Figure 5-1: Regional Geology Map
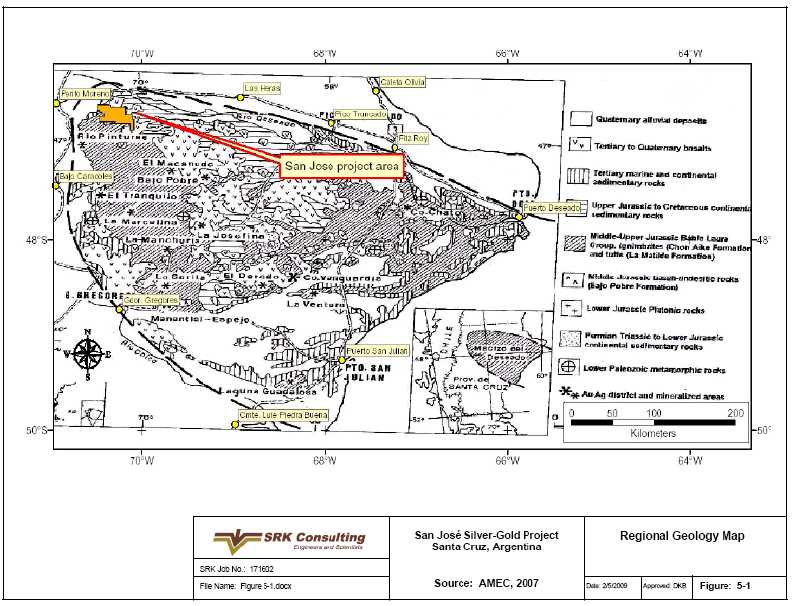
| |
SRK Consulting (U.S.), Inc. | May 29, 2009 |
Exhibit 99.1
| |
Minera Andes Inc. | 5-10 |
San José Silver-Gold Project | NI 43-101 Technical Report |
Figure 5-2: Local Geology Map

| |
SRK Consulting (U.S.), Inc. | May 29, 2009 |
Exhibit 99.1
| |
Minera Andes Inc. | 5-11 |
San José Silver-Gold Project | NI 43-101 Technical Report |
Figure 5-3: Geology and Drilling at the Huevos Verdes, Frea and Kospi Zones
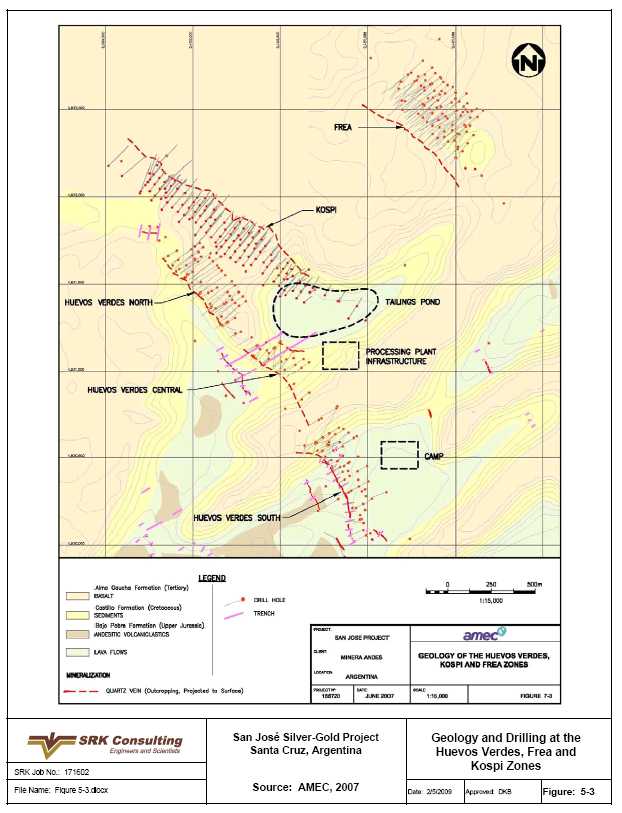
| |
SRK Consulting (U.S.), Inc. | May 29, 2009 |
Exhibit 99.1
| |
Minera Andes Inc. | 5-12 |
San José Silver-Gold Project | NI 43-101 Technical Report |
Figure 5-4: Geology and Geophysical Anomalies, Saavedra West Target
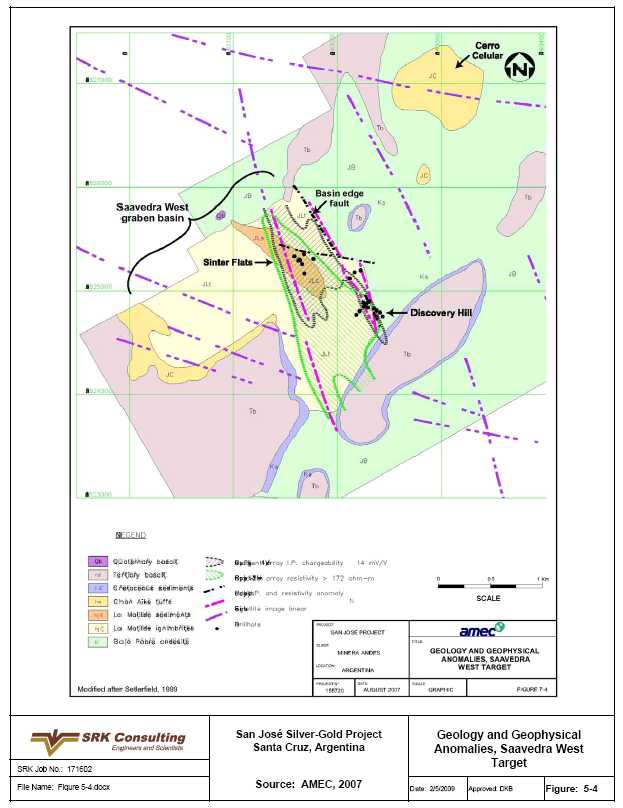
| |
SRK Consulting (U.S.), Inc. | May 29, 2009 |
Exhibit 99.1
| |
Minera Andes Inc. | 5-13 |
San José Silver-Gold Project | NI 43-101 Technical Report |
Figure 5-5: Principal Structural Lineaments

| |
SRK Consulting (U.S.), Inc. | May 29, 2009 |
Exhibit 99.1
| |
Minera Andes Inc. | 6-1 |
San José Silver-Gold Project | NI 43-101 Technical Report |
6
Deposit Type(Item 10)
Sections 6 has been excerpted fromNI 43-101 Technical Report Update on the San José Property, Santa Cruz Province Argentina, (AMEC, 2007b). Changes to standardizations have been made to suit the format of this Technical Report. Edits to text are indicated with the use of brackets.
6.1
Introduction
The gold and silver mineralization on the San José property is considered to be typical of LS epithermal-style deposits. The epithermal environment is typically shallow in depth, hosting deposits of Au, Ag, and base metals plus Hg, Sb, S, kaolinite, alunite and silica (Hedenquist et al., 2000). Historically, the epithermal–hydrothermal environment has been exploited for a wide variety of metal and minerals; however, many of the more economically significant deposits are mined for their precious metal contents.
Intermediate-sulfidation (IS) deposit types are considered to be a subset of the LS type. IS deposit types have an assemblage of pyrite-tetrahedrite/tennantite–chalcopyrite and low Fe sphalerite, and are Ag- and base metal-rich compared to the Au-rich end-member LS deposits (Hedenquist et al., 2000). Epithermal gold deposits generally form in shallow (<1km) levels of magma-related hydrothermal systems, most commonly in subaerial volcanic arcs (Cooke and Simmons, 2000). They are found worldwide, and are mainly associated with subaerial volcanism and intrusion of calc-alkalic magmas that range from basaltic andesite through andesite and dacite to rhyolite (Cooke and Simmons, 2000).
Examples of economically significant LS epithermal gold deposits are El Peñon in Chile, Cerro Vanguardia in Argentina, McLaughlin and Round Mountain in the USA, and Emperor in Fiji.
6.2
Some General Characteristics of Low Sulphidation Epithermal Gold Deposits
The following description of some general characteristics of LS epithermal gold deposits is mainly based on Hedenquist et al. (2000) and Cooke and Simmons (2000).
Geological Settings: LS are typically distant from contemporaneous central vents; however, they commonly occur within a dome setting, and most end-member LS deposits in Nevada, USA, are associated with rhyolite domes. A genetic relationship with porphyry and end-member LS epithermal mineralization has not been demonstrated, and in Nevada for example, it appears that they are mutually exclusive. By contrast, IS deposits occur in districts that also host deep porphyry deposits; a relationship between them is suspected.
Host Rocks: LS deposits are affiliated with a wide range of rock types, from alkalic to calk-alkalic. End-member LS deposits may be restricted to bimodal basalt–rhyolite settings in contrast to the andesite–rhyodacite setting noted for IS deposits in Nevada.
Form: The form of LS deposit can vary from gold-rich veins such as at Sleeper and Midas in Nevada, to stockwork at McLaughlin, California, to disseminated such as at Round Mountain, Nevada. Lattice textures (platy calcite and its pseudo morphs) are common textural characteristics as are crustiform and colloform bands particularly in veins.
Alteration: The alteration halos to the zone of mineralization, particularly in vein-controlled mineralization, include a variety of temperature-sensitive clay minerals. The areal extent of such clay alteration may be several orders of magnitude larger than the actual ore deposit. This is usually the case with shallow, lower-temperature alteration that mushrooms near surface owing to the intersection of an aquifer by basement feeder structures, the latter potentially being host to high-grade ore. Thus, even after a large alteration system is found, it may still be difficult to assess where the ore is located.
| |
SRK Consulting (U.S.), Inc. | May 29, 2009 |
Exhibit 99.1
| |
Minera Andes Inc. | 6-2 |
San José Silver-Gold Project | NI 43-101 Technical Report |
Wallrock assemblages include illite, chlorite, albite, epidote, zeolites and pyrite, in addition to quartz, adularia and calcite. These minerals reflect the near neutral-pH and reduced composition of the ore fluid. Interstratified illite–smectite and smectite clays plus kaolinite occur on the margins of the system, as well as within the ore zone, in some cases as supergene alteration products of hydrothermal sericite.
Mineralization: Gold mineralization in LS deposits is commonly associated with quartz and or chalcedony, plus lesser, but variable, amounts of adularia, calcite, K-feldspar (sericite or illite), rhodocrosite, chlorite and pyrite gangue. Gold typically occurs as electrum or more rarely as tellurides in association with acanthite, silver-sulfosalts, base metal sulfides and pyrite.
Ag ± base metal-rich deposits of Comstock Lode Nevada and Creede, Colorado, as well as Pachuca and Fresnillo in Mexico possess sulfide assemblages that indicate an IS state. The higher fluid salinity in IS deposits accounts for their high Ag and base metal concentrations. End-member LS deposits contain very minor base metal (Zn–Pb) sulfides, in contrast to IS deposits.
Tops of LS Deposits: The most distinctive paleosurface feature of LS systems is sinter, which forms finely laminated terraces of amorphous silica around neutral pH hot springs. Sinter aprons may extend in the direction of the drainage for several hundreds of meters. Finely laminated air-fall or lacustrine sediments that have been silicified, in many cases by an outflow of steam-heated water, may be mistaken for sinter. The presence of plant fragments, common in sinter, is not diagnostic; as such material also accumulates within a variety of finely-laminated sediments. The only diagnostic criterion is that of the vertical structures that form due to algal growth as well as evaporation.
Sides of LS Deposits: LS deposits grade outward, in some cases sharply, to argillic halos whose widths relate to the primary permeability of the host — narrow halos around structurally-focused ore, or wide areas in permeable rocks. The argillic assemblage is transitional outward to propylitic assemblages that may be district-wide.
Bottoms of LS Deposits: The vertical interval of LS mineralized zones typically averages approximately 300m, but may be as large as 600m to 800m for IS deposits, or in the case of high-grade end-member LS deposits, as little as 100 to 150m. Quartz veins may simply pinch out with increasing depth or change to narrow carbonate stringers, or may lose gold grade, resulting in sharp bottoms to high-grade ore. Some IS deposits may have roots rich in base metals, such as the Brad deposit in Romania, where a transition over several 100m towards higher base metal concentrations eventually leads to porphyry-style base metal mineralization.
| |
SRK Consulting (U.S.), Inc. | May 29, 2009 |
Exhibit 99.1
| |
Minera Andes Inc. | 7-1 |
San José Silver-Gold Project | NI 43-101 Technical Report |
7
Mineralization(Item 11)
At San José, mineralization is characteristic of LS epithermal systems. Mineralization occurs as quartz veins, breccia zones, and stockwork zones spatial related to normal–sinistral faults striking 330° to 340°, and conjugate dextral faults striking approximately 300°. Huevos Verdes and Frea vein zones dip between 42º and 75ºE while Kospi, Odin and Ayelin vein zones dip approximately 56º to 67ºW (AMEC, 2007b).
7.1
Mineralized Zones
There are currently five mineralized vein zones of economic interest on the San José property. These veins from south to north are:
·
Huevos Verdes—2km long, striking 325º, average dip 75ºE (42ºE in the south);
·
Kospi—1.3km long, striking 307º, average dip 56ºW;
·
Frea—1km long, striking 312º, average dip 50ºE;
·
Odin—1.9km long, striking 291º, average dip 67ºW; and
·
Ayelin—1.6km long, striking 285º, average dip 60ºW.
All of the veins average 1 to 2m in thickness but can be up to 4m wide. They are found within a north-south trending mineralized belt approximately 2.5km in length. All five vein zones are hosted by the Bajo Pobre Formation, strike northwest and have similar metal zoning. Metal zoning is characterized by a decrease in Ag and Au grade and increasing base metal concentrations with depth. HVS was exposed at surface, but all other veins were “blind” targets and discovered through drilling and geophysical surveys (AMEC, 2007b). Figure 7-1 shows the five vein zones of economic interest at San José in plan and in oblique views.
7.1.1
Huevos Verdes
The Huevos Verdes vein system consists of four zones; HVN, HVC, Huevos Verdes Ramal (HVR) and HVS.
HVN has low sulfide estimated at <1 to 5%. The primary sulfide is pyrite, but argentite and arsenopyrite are also present. There is strong argillic alteration with illite and minor propylitic and potassic alteration away from the vein. This zone includes the primary vein and two quartz veins up to 2m thick in the hangingwall. The richest zones of the primary vein have been traced 50 to 80m along strike and 150 to 200m vertically. The vein has been drilled to a depth of 240m below surface. Drilling has closed the vein zone in both the north and south ends and at depth, except in the north. HVN has the weakest mineralization of the three Huevos Verdes zones (AMEC, 2007b).
HVC vein zone is approximately 400m along strike, ranges between 0.5 to 5.0m thick and has a vertical extent of approximately 300m. The mineralized shoot is 40 to 70m along strike within this zone. Alteration and mineralization is similar to HVN. This vein is open at depth (AMEC, 2007b).
HVR vein zone is located between HVC and HVS. This vein zone is approximately 200m along an E-W strike and dips to the north. The vertical extent of HVR is approximately 250m and the width ranges 1 to 3m.
| |
SRK Consulting (U.S.), Inc. | May 29, 2009 |
Exhibit 99.1
| |
Minera Andes Inc. | 7-2 |
San José Silver-Gold Project | NI 43-101 Technical Report |
HVS has a strike length of approximately 520m is commonly 0.5 to 3m wide but has zones up to 5m. HVS is higher grade and has a higher percentage of sulfide minerals. HVS differs from the other two zones in that the dip is steeper near surface (75°) but flattens at depth (42°). The strike is also much more variable with a range of 100º to 190º. These differences have important implications for mineralization since this vein has the most ore shoots and highest grade of the three in this zone. There are four mineralized “shoots” ranging 50 to 80m long with vertical extents of 50 to 200m. These shoots have a regular spacing of 80 to 100m. Mineralization decreases with depth (AMEC, 2007b).
7.1.2
Kospi
The Kospi vein zone has been traced for approximately 1.3km on surface and has a vertical extent of approximately 150 to 220m. This vein has 10 to 80m of overburden at surface and was discovered drilling IP/Resistivity anomalies. It remains open to the southeast and at depth in a number of locations. It is well defined to the northwest. The vein has an average thickness of 3m. The vein is open in the southwest and some areas at depth (AMEC, 2007b).
7.1.3
Frea
Like Kospi, Frea was identified by drilling geophysical anomalies and is covered by 50 to 80m of sediments and basalt flows. Frea has been traced approximately 1km along strike and 200m vertically. This vein zone averages approximately 4m in thickness. Frea is structurally open in all directions, but economic mineralization is limited to a few zones that are only open at depth and along strike to the south (AMEC, 2007b).
7.1.4
Odin and Ayelin
Odin and Ayelin are the two northeastern most vein systems that have been systematically drilled. Odin has been traced approximately 1.9km and Ayelin has been trace for approximately 1.6km along strike. Both vein systems were discovered by drilling geophysical anomalies.
7.1.5
Regional Exploration Targets
There are 11 additional mineralized targets within the San José permit block. These are:
·
Aguas Vivas;
·
La Sopresa;
·
El Pluma West;
·
Pluma;
·
Pluma South;
·
Frea Satellite;
·
Austri;
·
Frigga;
·
Roadside;
·
Portugues; and
·
Saavedra.
| |
SRK Consulting (U.S.), Inc. | May 29, 2009 |
Exhibit 99.1
| |
Minera Andes Inc. | 7-3 |
San José Silver-Gold Project | NI 43-101 Technical Report |
These have been identified by using the structural and geochemical model combined with geophysical surveys and drilling. These are shown in Figure 2-3.
7.2
Surrounding Rock Types
At San José and other locations in the Deseado massif, mineralization is hosted primarily in the Bajo Pobre and Chon Aike Formations of Jurassic age. Veins have been found at surface in erosional windows in the Cretaceous sedimentary cover and Tertiary age basalt flows. Surface outcrops of veins are seldom hosted by Cretaceous and Tertiary age rocks. However, some vein zones are found in outcrops in Cretaceous Eastern Windows and Portugues West Target areas. These occurrences have been interpreted as a possible secondary mineralizing event (AMEC, 2007b).
7.3
Relevant Geological Controls
In 2004, Dietrich et al., (as cited in AMEC, 2007) identified structural controls and lithology, particularly stratigraphic contacts, as the two most important factors in the distribution and deposition of mineralization in vein zones at San José. Underground mapping in the Huevos Verdes vein system showed that there were variations of up to 60º in strike, and these variations could be correlated to zone thickness, mineralization style and silver-gold grades. These relationships are as follows:
·
Vein zone striking 320º to 305º—highest grades, best developed mineralization and vein width;
·
Vein zone striking 320º to 325º—intermediate grades; and
·
Vein zone striking >325º—in general do not exhibit significant mineralization, and are brecciated, contain fault gouge and may have late stage chalcedonic quartz (Dietrich et al., 2004 as cited in AMEC, 2007.
In Huevos Verdes, dilatancies form in a sinstral strike-slip fault with counter-clockwise bending. Clockwise bending results in compression with increased tectonic friction. This results in the formation of fault gouge and brecciation. These relationships are shown in Figure 7-2. Preferentially in a compressional setting along clockwise-rotated bends (Dietrich et al., 2004, as cited in AMEC, 2007).
At Huevos Verdes, the average strike of the vein zone system is 320º to 325º. Because of this, Dietrich et al., 2004 (as cited in AMEC, 2007) predict that the vein system will have intermediate grades overall.
Other factors that may affect mineralization are lithology and lithologic contacts. Mapping in other areas has identified more intense fracturing and alteration in andesitic flows than in the underlying volcaniclastic rocks. In Pluma vein zone, is well developed in the andesitic flows. However, at depth the veins are less well developed in volcaniclastic rocks (AMEC, 2007b).
According to AMEC (2007b), host lithology may be a factor which controls the depth potential of the mineralized shoots. MSC’s interpretations do not appear to consider this possible control and future studies should review this in detail.”
| |
SRK Consulting (U.S.), Inc. | May 29, 2009 |
Exhibit 99.1
| |
Minera Andes Inc. | 7-4 |
San José Silver-Gold Project | NI 43-101 Technical Report |
7.3.1
Structural Model
Section 7.3.1 has been excerpted fromNI 43-101 Technical Report Update on the San José Property, Santa Cruz Province Argentina, (AMEC, 2007b). Changes to standardizations have been made to suit the format of this Technical Report. Edits to text are indicated with the use of brackets.
A preliminary structural model for the Huevos Verdes vein system and the other parts of the property has been developed by Dietrich et al. (2004):
·
Early north–northwest-striking normal faults were established in the region due to rifting in Permo-Triassic times (Uliana et al., 1989; Sanders, 2000);
·
Dextral east–west to west–northwest-trending wrench faulting associated with mineralization in the Deseado massif occurs at 150 to 125Ma (Uliana et al. 1989, Nullo 1991, Sanders 2000);
·
The Huevos Verdes vein system is mineralized along a sinistral strike-slip fault of north–northwest strike; and
·
The Huevos Verdes vein system is discontinuous and shows counter-clockwise bending at the tips of mineralized segments.
The Huevos Verdes vein system formed as sinistral extension fissures or conjugates in an overall dextral wrench fault system of east–west to west–northwest strike (Dietrich et al., 2004). The north–northwest-trending faults related to Permo–Triassic rifting were reactivated and became hosts to mineralization.
Bending of Huevos Verdes vein segments indicates proximity to dextral east–west-trending master faults. East–west-trending lineaments are scarce, but present in the northwestern Deseado massif. The most prominent example of a west–northwest-trending lineament is the limit between the San Jorge basin in the North, and the Deseado massif.
Another important set of lineaments are the Rio Pinturas and the San José lineaments of north–northeast strike. The Rio Pinturas lineament follows the Rio Pinturas valley, and is clearly visible in satellite imagery. Field evidence for a sinistral movement has been observed. The San José lineament is a prominent fault corridor of north–northeast strike that stretches from the Rio Deseado valley over Estancia San José, Cerro Portugues, and Cerro Saavedra to the South. The characteristics of the San José lineament are still being investigated, but it is probably an important lineament, hosting volcanic centers (Cerro Portugues, Cerro Saavedra), and limiting the spread of flood basalts. The lineament appears to represent a stratigraphic high with respect to upper Jurassic rocks but a deposition centre for Cretaceous sediments. A sinistral strike-slip comp onent is suggested, equivalent to the parallel Rio Pinturas lineament.
The Rio Pinturas and San José lineaments limit the known occurrence of north–northwest striking, Huevos Verdes-type veins as present at Huevos Verdes, Huevos Verdes Este, Saavedra West, Pluma, and La Sorpresa (and likely Frea). No north–northwest-striking mineralization is known further to the east or west of this corridor. Mineralization at the Roadside and Portugues West targets consists of veins of north–south strike, younger in age (cross-cutting Cretaceous rocks), and probably related to the San José lineament. No evidence of significant mineralization was observed on the western slope of the Rio Pinturas valley, even though the outcrop exposure is good.
| |
SRK Consulting (U.S.), Inc. | May 29, 2009 |
Exhibit 99.1
| |
Minera Andes Inc. | 7-5 |
San José Silver-Gold Project | NI 43-101 Technical Report |
Interference of north–northeast-striking structures with north–northwest-striking veins is noted in the Pluma sector. The Rio Pinturas and the San José lineaments define the most prospective corridor for Huevos Verdes-type vein mineralization (Dietrich et. al., 2004).
7.4
Type, Character and Distribution of Mineralization
Mineralization occurs as quartz veins, breccia and stockwork zones with sulfide minerals in dissmentation, veinlets and open space fillings. Quartz veins, breccia and stockwork zones are associated with and spatial related to normal–sinistral faults striking 330º to 340º, and conjugate dextral faults striking approximately 300º (AMEC, 2007b).
Mineralization is described as high-grade, banded “ginguro” (black sulfidic material) quartz veins, containing irregular sulfide bands typical of “bonanza-type” epithermal systems. Mineralogy is composed of argentite, pyrite and arsenopyrite with lesser amounts of pyargerite-proustite (ruby silver) and native silver. Gangue minerals include quartz with carbonate replacement in places. The late-stage veining is characterized by milky quartz with disseminated sulfides. Small sulfide veinlets up to 10cm wide crosscut the mineralized zones and are associated with bonanza grades of Au and Ag. These veinlets are composed of argentite, pyrite, sphalerite and galena. The base metals zoning is seen as an increase of Zn, Cu, and Pb with depth and a corresponding decrease in Au and Ag concentrations (AMEC, 2007b).
| |
SRK Consulting (U.S.), Inc. | May 29, 2009 |
Exhibit 99.1
| |
Minera Andes Inc. | 7-6 |
San José Silver-Gold Project | NI 43-101 Technical Report |
Figure 7-1: San José Vein Zones In Plan View and Oblique View Looking Northwest
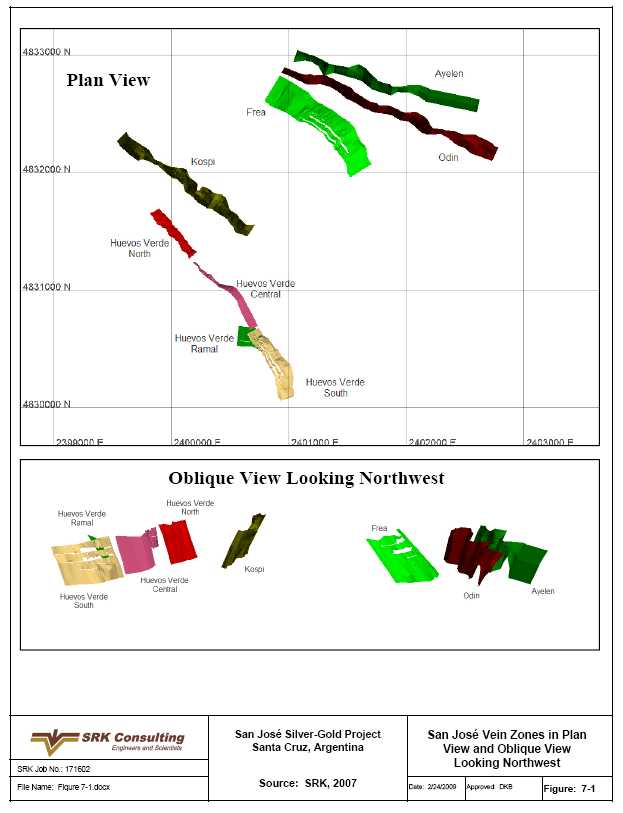
| |
SRK Consulting (U.S.), Inc. | May 29, 2009 |
Exhibit 99.1
| |
Minera Andes Inc. | 7-7 |
San José Silver-Gold Project | NI 43-101 Technical Report |
Figure 7-2: Structural Formation of Veins at San José
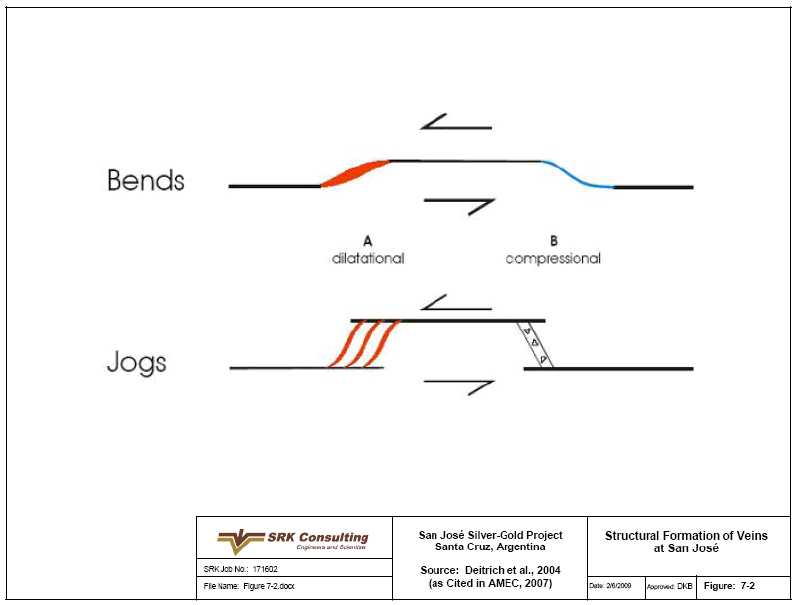
| |
SRK Consulting (U.S.), Inc. | May 29, 2009 |
Exhibit 99.1
| |
Minera Andes Inc. | 8-1 |
San José Silver-Gold Project | NI 43-101 Technical Report |
8
Exploration(Item 12)
MAI acquired San José in 1997 and explored the Project until 2001 when MAI entered in to a JV agreements with MHC forming MSC. Since 2001, all exploration activities at San José have been managed by MSC. Exploration at the Project includes terrain surveying and mapping, geological mapping, surface, soil and trench sampling, geophysical surveys, drilling (Diamond and reverse-circulation), alteration studies, aerial photograph analysis, petrography and mapping underground development (AMEC, 2007b). These activities are discussed by operator, year and activity. Drilling is discussed in greater detail in Section 9.
Sections 8.1 through 8.3 have been excerpted fromNI 43-101 Technical Report Update on the San José Property, Santa Cruz Province Argentina, (AMEC, 2007b). Changes to standardizations have been made to suit the format of this Technical Report. Edits to text are indicated with the use of brackets.
8.1
Surveys and Investigations
8.1.1
Minera Andes
Exploration (1997 to 2001)
Between 1997 and 2001, Minera Andes completed a multi-phase exploration program over various parts of the property. Work was concentrated over the northern third of the property, on the Huevos Verdes, Saavedra West, El Pluma West, La Sorpresa, Celular, and Saavedra Zones (Figure 2-3). The exploration work completed by Minera Andes consisted of the following:
·
Geological Mapping: 1:50,000 scale air photo/Landsat-based structural study, prospecting/geological reconnaissance mapping, which defined nine target areas for further work, detailed geological mapping at a scale of 1:1,000 at Huevos Verdes, Saavedra West, and Saavedra Targets;
·
Sampling: Soil sampling on grids at La Sorpresa, El Pluma West, Celular, Saavedra West and Saavedra (a total of 2,302 samples); enzyme leach soil survey was completed over part of the Huevos Verdes target; stream sediment sampling totaling 368 samples; grab and/or trench channel chip samples totaling 2,536 samples;
·
Trenching: A total of 25 backhoe trenches, totaling 2,550m, were excavated at Saavedra West (TrSaW-1 to TrSaW-25), and another 30 trenches, totaling 2,125m, were excavated at Huevos Verdes (TRHV-1 to TRHV-30). Most of these trenches were selectively channel chip sampled across 1 to 2m intervals in areas of strong alteration and/or mineralization;
·
Geophysics: Quantec Geofisica Argentina S.A. completed 42km of controlled-source audio magneto-tellurics (CSAMT) surveys, 74km of gradient-array IP surveying, and 3km of real-section IP surveying along selected lines. In addition, approximately 186 line km of magnetic data were collected at Huevos Verdes, Saavedra West, Celular and Saavedra. All geophysical contract work was completed by Quantec Geofisica Argentina S.A.;
·
Reverse Circulation Drilling: between 1998 and 2000 a total of 8,594m in 85 RC holes were drilled into the La Sorpresa, (3 holes totaling 270m), El Pluma West (8 holes totaling 872m), Saavedra West and Saavedra Zones (26 holes totaling 2,750m), HVN (30 holes totaling 2,799m), HVC (3 holes totaling 285m), and HVS (15 holes totaling 1,618m) (see Section 9 for details);
| |
SRK Consulting (U.S.), Inc. | May 29, 2009 |
Exhibit 99.1
| |
Minera Andes Inc. | 8-2 |
San José Silver-Gold Project | NI 43-101 Technical Report |
·
Diamond Drilling: a total of 705.2m in 3 diamond drillholes were drilled into the Saavedra West Zone (see Section 9 for details);
·
Alteration Studies: PIMA [Portable Infrared Mineral Analyzer] analysis, petrographic examination and fluid inclusion work were undertaken on selected samples; and
·
Metallurgical Studies: Minera Andes completed early-stage metallurgical-scoping test work on RC drillhole cuttings from EP-12 at Saavedra West, and on RC drillhole cuttings from 12 samples from 11 separate drillholes at HVN and HVS.
8.1.2
MSC
Exploration (2001 to February 2003)
Subsequent to signing a joint venture agreement with MHC in 2001, and the formation of MSC, the joint venture company, the property name was changed from El Pluma–Cerro Saavedra to San José. An extensive exploration program commenced, which included the following:
·
Surveying: A detailed topographic survey of 1,446ha of the property, tying the survey to regional reference points (POSGAR 94 network). This included the topographic surveying of all roads, verification of the grid locations and control points previously surveyed by Minera Andes, re-surveying of all Minera Andes drillholes, surface surveying of all deflection points along the main veins, and the construction of new grids. In total, 91 lines spaced approximately 50m apart were surveyed for those areas that required 5m contour interval accuracy, and 25m apart for the areas that required 1m contour interval accuracy;
·
Geophysics: 45km of gradient-array IP and 20.25km of real-section IP were completed by Quantec Geofisica Argentina S.A. The gradient-array IP covered the Pluma South and Pluma West areas;
·
Diamond Drilling: During 2001, a total of 5,110.3m in 30 holes (HD-1 to HD-30) were drilled into the Huevos Verdes Zone and its northern extensions. HVD-01 twinned Minera Andes’ reverse circulation hole EP-39. By early 2002, the Huevos Verdes vein system had been tested at an approximate drillhole spacing of 100m over a total strike length of 2.25km;
·
[Trenching: In late 2002, MSC constructed 142 trenches totaling 4,176m at Pluma, Sorpresa Saavedra and Huevos Verdes Zones, collecting 401 chip channel samples. Samples were 0.25m wide by 0.2m to 1.85m long with average sample lengths of 0.7m. The trenches ranged from 10m to 140m long. All trenches were mapped at 1;200 scale (AMEC, 2007b).]; and
·
Mineral Resource Estimates: In 2002, a mineral resource estimate, compliant with CIM requirements, was completed for the Huevos Verdes, Saavedra West Vein and Breccia Zones. This work was in Cinits et al. (2002), and is available through www.sedar.com. The Huevos Verdes mineral estimate is no longer considered relevant since it has seen significant amounts of new drilling since 2002 and been updated several times. The Saavedra West Vein and Breccia Zone resource estimates have not been updated by MSC and no new work is reported at this target, however, AMEC considers that additional core drilling which incorporates a thorough QA/QC program would be required to re-establish these mineral resources.
| |
SRK Consulting (U.S.), Inc. | May 29, 2009 |
Exhibit 99.1
| |
Minera Andes Inc. | 8-3 |
San José Silver-Gold Project | NI 43-101 Technical Report |
Exploration (May 2003 to February 2004)
On July 24, 2003 MSC announced that they were initiating a comprehensive exploration program, which would cover a 17-month period to November 2004 and consist of underground exploration/development, environmental studies, metallurgical studies, and the construction and commissioning of a pilot plant at the Huevos Verdes vein area. In addition, a program of geophysics, surface sampling and drilling was planned for several targets on the property, other than the Huevos Verdes vein system.
·
Land Purchasing: Land was purchased from private land owners and right-of-way agreements were obtained;
·
Road Construction: a 27km all-weather gravel road was constructed from the highway to the camp site;
·
Diamond Drilling: Between November 2002 and February 2003, 32 diamond drillholes (hole numbers SJD-1 to SJD-32) totaling 4,376.87m were completed by MSC. Early in 2004, an additional seven drillholes totaling 2,174.65m (SJD-33 to SJD-39) were drilled into Frea to follow-up on the results from the drilling in 2003; and
·
Underground Development: Two 45º angle decline shafts were sunk on the North and South veins at Huevos Verdes and underground development (drifting and raises) was started on the 480 and 430m levels.
Exploration (September 2004 to May 2005)
On June 29, 2004 MSC announced they had commissioned a feasibility study for the Project. The study was to be managed by MTB Project Management Professionals, Inc., of Denver, U.S.A. AMEC was retained to do a resource audit, mine engineering, metallurgical studies and to review capital and operating costs in September 2004, whereas Vector (Peru) S.A. and Vector Argentina were contracted to complete the geotechnical, environmental and social aspects of the study.
·
Surveying and Topography: Surveying completed during 2005 included topography (1m contour intervals) over the Huevos Verdes and Frea mineralized zones and the surrounding areas, including locations of planned access and infrastructure. This included the surveying of all existing roads, verification of the grid locations and control points previously surveyed by Minera Andes, surveying of all new drillholes including the re-surveying of all previous Minera Andes drillholes, surface surveying of all deflection points along the main veins, and the construction of new grids;
·
Geophysics: A total of approximately 215m of gradient-array IP was completed by Quantec during the first quarter of 2005, which extended the previous IP/resistivity surveys to the north and east. Surveying was done on 50 lines, spaced 200m apart and oriented at 60º and ranging in length between roughly 900m and 6,050m;
·
Diamond Drilling: In September 2004, six holes (HVD-31 to 37), totaling 695.8m, were drilled into the HVN and HVS Zones. Between December 2004 and May 2005, an additional 138 diamond drillholes (hole numbers SJD-40 to SJD-177), totaling approximately 32,409.6m, were completed by MSC. The holes were drilled into the HVN, HVC, and HVS Zones and the Frea Zone. Finally, an additional 38 widely spaced reconnaissance diamond drillholes (hole numbers SJD-178 to SJD-215), totaling approximately 8,995.68m, were completed by MSC;
| |
SRK Consulting (U.S.), Inc. | May 29, 2009 |
Exhibit 99.1
| |
Minera Andes Inc. | 8-4 |
San José Silver-Gold Project | NI 43-101 Technical Report |
·
Underground Development: During 2004 and 2005, underground development continued at HVN and HVS. By May 2005, a total of 2,545.23m of drifts on the 480m and 430m levels had been completed, as well as 410.51m of raises between the two levels and to surface, and 329.25m of declines. In addition, all levels were systematically channel chip sampled by hammer and chisel or by pneumatic hammer methods;
·
Geotechnical, Environmental, Social Studies: Various geotechnical, environmental (EIA), and social baseline studies were initiated by Vector; and
·
Colorado School of Mines Studies: In late 2003 an ongoing technical support program with Colorado School of Mines commenced. This program has consisted of regional geological mapping over 165km2 and detailed mapping at some of the main targets and underground exposures, petrographic studies, geochemical analyses, age dating, ore microscopy, fluid inclusion studies, Portable Infrared Mineral Analyzer analyses, remote sensing studies, and database reviews.
Exploration (June 2005 to September 2007)
Work during this period comprised completion of a Feasibility Study, plant development, and on-going exploration.
·
Feasibility Study: The Feasibility Study was completed in October 2005, and based on this a decision to proceed to production was made on March 28, 2006;
·
Diamond Drilling: Drilling during 2006 comprised 132 holes (HVD-38 to HVD-53 and SJD-216 to SJD-330), totaling 22,874.26m. The Kospi Vein was tested by 128 of these holes. The initial HVD holes were considered the discovery holes for Kospi. In addition, 46 underground holes, totaling 2,226.1m (holes SJM-29 to SJM-74) were drilled at the HVN and HVS Veins, plus one hole at the Frea Vein (refer to Section 11 for details on the drilling). MSC has continued to drill exploration holes starting in April 2007; as of September 30 2007, 31 holes (8,313m) had been completed on the Frea northwest and southeast extensions and in the Ayelén prospect (holes SJD-331 to SJD-361);
·
Underground Development: During 2005, 2006 and 2007, underground development continued at HVN, HVS, and Frea. By the end of the first quarter of 2007 a total of 9,628m of declines, drifts, crosscuts, stockades, raises, dumps and ramps have been excavated at these three zones. Two access ramps have been advanced: the Tehuelche Ramp at HVS and the Guer Aike at Frea. A third access ramp at the Kospi Vein has been initiated by MSC (approximately 100m at the time of the site visit, October 1 through 5, 2007). All underground development in mineralization has been systematically channel chip-sampled; and
·
Surveying and Topography: Surveying of the underground workings, drillholes and surrounding roads and infrastructure has continued through the rest of 2005 and 2006. Surveying was completed by MSC mine staff using a total station instrument.
| |
SRK Consulting (U.S.), Inc. | May 29, 2009 |
Exhibit 99.1
| |
Minera Andes Inc. | 8-5 |
San José Silver-Gold Project | NI 43-101 Technical Report |
Exploration (October 2007 through June 2008)
MSC continued exploration on the property with surface diamond core drilling and underground core drilling and channel sampling. Surface drilling was focused on the Ayelen and Odin veins.
8.2
Summary
Most of the vein zones at San José are blind targets and require indirect exploration methods to identify favorable targets. MAI and subsequently MSC have used a combination of several techniques to successfully identify exploration targets. These have included various types of soil sampling and geophysical surveys. Once the target is identified, trenching and drilling are used to confirm mineralization. Drilling is further used to delineate resources and with additional detail, exploration mining is started. Drilling is discussed in Section 9 and drillhole and underground channel sampling is discussed in Section 10.
Table 8.2.1 summarizes all surface sample information. No detail was available on soil, enzyme leach and stream sediment sample procedures and protocols.
Table 8.2.1: Surface Samples Collected at San José
| | | | |
Company | Year(s) | Sample Type | Location | # of Samples |
MAI | 1997-2001 | Soil | La Sorpresa, El Pluma West, Celular, Saavedra, Saavedra West | 2,302 |
MAI | 1997-2001 | Enzyme Leach Soil Survey | Huevos Verdes | unknown |
MAI | 1997-2001 | Stream Sediment | Regional | 368 |
MAI | 1997-2001 | Outcrop & Trench (Selective Chip Channel) | Saavedra West, Huevos Verdes | 2,536 |
MSC | 2002 | Trench (Chip Channel) | Pluma, Sorpresa Saavedra and Huevos Verdes Zones | 401 |
Data source: AMEC (2007b).
In addition to the trenching completed by MAI and MSC, six trenches were constructed on the Huevos Verdes Zone on or around 1997. According AMEC (2007b), it was not known who constructed these trenches. These six trenches range from 6m to 22m long and it is believed that 81 samples were collected at these locations.
Between 1997 and 2002, both MAI and MSC trenched at San José. Table 8.2.2 shows a summary of the trenches and trench samples with typical sample size. No detail was available on depth of the channel samples.
| |
SRK Consulting (U.S.), Inc. | May 29, 2009 |
Exhibit 99.1
| |
Minera Andes Inc. | 8-6 |
San José Silver-Gold Project | NI 43-101 Technical Report |
Table 8.2.2: Trenches and Trench Sample Summary
| | | | | | | | |
Company | Year(s) | # of Trenches | Location | Total Trenching Length | Typical Trench Dimensions | # of Samples | Average Sample Length | Sample Width |
Unknown | 1997? | 6 | Huevos Verdes | Unknown | 6 to 22m long | 81 | 0.1-1.6m | Unknown |
MAI | 1997 to 2001 | 25 | Saavedra West | 2,550m | 1.2m wide;
0.5 to 1.5m deep;
24-232m long | 1,889 | 1-2m | 0.25m |
MAI | 1997 to 2001 | 30 | HVS | 2,125m | 1.2m wide;
0.5 to 1.5m deep;
15-192m long | 566 | 1-1.5m | 0.25m |
MSC | 2002 | 142 | Pluma, Sorpresa, Saavedra, and Huevos Verdes | 4,176m | 10 to 140m long | 401 | .7m | 0.25m |
Data source: AMEC (2007b).
Because most of the targets at San José are blind, remote sensing has been an integral part of locating and defining the orebodies. Resistivity/IP surveys have been used to find many of the vein zones at San José. Table 8.2.3 summarizes the geophysical surveys completed at the Project. Details on line spacing, number of lines and data collection points were not available for all surveys.
Table 8.2.3: Geophysical Surveys Completed at San José
| | | | | |
Company | Year(s) | Survey Type | Approx. Distance Surveyed | Vein/Area Surveyed | Contractor |
MAI | 1997-2001 | Controlled-Source Audio Magneto-Tellurics (CSMAT) | 42km | Various | Quantec Geofisica Argentina |
MAI | 1997-2001 | Gradient-Array IP | 74km | Various | Quantec Geofisica Argentina |
MAI | 1997-2001 | Real-Section IP | 3km | Various | Quantec Geofisica Argentina |
MAI | 1997-2001 | Magnetic | 186km | Huevos Verdes | Quantec Geofisica Argentina |
MSC | 2001-2003 | Gradient-Array IP | 45km | Pluma South and
Pluma West | Quantec Geofisica Argentina |
MSC | 2001-2003 | Real-Section IP | 20.5km | Various | Quantec Geofisica Argentina |
MSC | 2004-2005 | Gradient-Array IP Oriented at 060º 50 lines at 200m spacing Line lengths=900m to 6,050m | 215km | Various, extended
existing lines north and E | Quantec Geofisica Argentina |
Data source: AMEC (2007b).
The IP and chargeability data have been successful tools for identifying geophysical anomalies that have resulted in new vein zone discoveries. This is shown in Figures 8-1 and 8-2, which superimposes vein zones on geophysical anomalies. These results show good correlation between vein zones and anomalies.
8.3
Interpretation
SRK has relied on the descriptions of exploration procedures and activities provided by AMEC (2007b) and by MSC during the SRK site visit. The data provided indicates that the exploration activities have followed a logical progression using appropriate techniques for the mineralization character and deposit type. MAI and MSC have selected exploration tools that help them to quickly target potential areas for more detailed exploration activities.
| |
SRK Consulting (U.S.), Inc. | May 29, 2009 |
Exhibit 99.1
| |
Minera Andes Inc. | 8-7 |
San José Silver-Gold Project | NI 43-101 Technical Report |
8.4
Exploration Potential
The strike lengths of the veins explored are not fully understood. In many cases the trend of the vein extensions have not been explored, and it is believed there is potential to extend the known mineralization. It may be that approximately 15% of the known vein trend has been identified.
| |
SRK Consulting (U.S.), Inc. | May 29, 2009 |
Exhibit 99.1
| |
Minera Andes Inc. | 8-8 |
San José Silver-Gold Project | NI 43-101 Technical Report |
Figure 8-1: Chargeability Map Over Central Portion of the San José Property
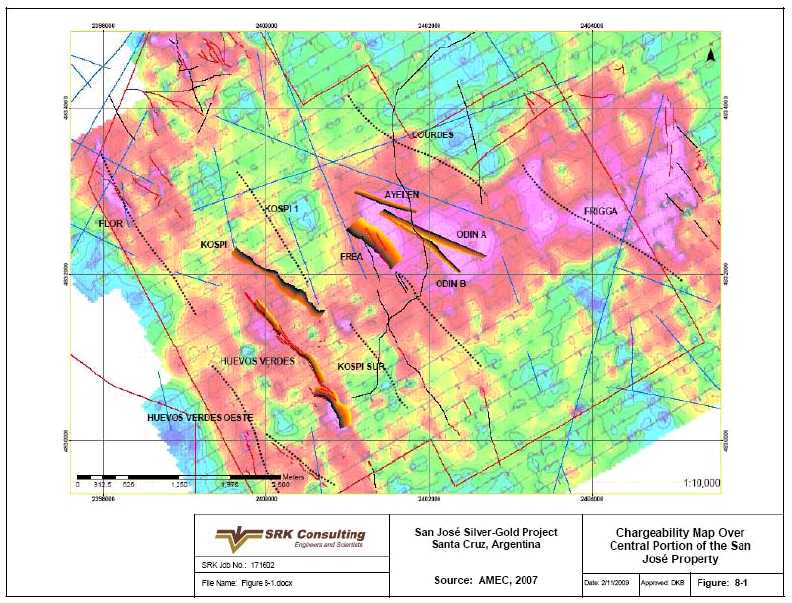
| |
SRK Consulting (U.S.), Inc. | May 29, 2009 |
Exhibit 99.1
| |
Minera Andes Inc. | 8-9 |
San José Silver-Gold Project | NI 43-101 Technical Report |
Figure 8-2: Resistivity Map Over Central Portion of the San José Property

| |
SRK Consulting (U.S.), Inc. | May 29, 2009 |
Exhibit 99.1
| |
Minera Andes Inc. | 9-1 |
San José Silver-Gold Project | NI 43-101 Technical Report |
9
Drilling(Item 13)
9.1
Type and Extent of Drilling
A total of 124,556m in 705 RC and diamond drillholes have been drilled at San José between 1998 and June 2008. Drilling conducted by MAI between 1998 and 2000, included 85 RC holes and three diamond drillholes. Since 2001, all drilling has been conducted by MSC, and during this time, MSC has completed five RC holes and 609 diamond drillholes within the Project area The majority of drilling has been from surface but also includes underground drilling in the Kospi area. Exploration drilling has been used in conjunction with geophysical and geochemical surveys to identify potential mineralized zones. Since 2004, the majority of drilling has been focused in the Huevos Verdes, Frea, and Kospi vein systems, to provide infill drilling for resource definition and delineation. MSC has also continued regional exploration drilling as well (AMEC, 2007b). Table 9.1.1 summarizes the drilling completed through June 2008. A drillhole location map is shown in Figure 9-1.
Table 9.1.1: San José Exploration Yearly Drilling Summary
| | | | | |
Company | Year | Drillhole Numbers | Total (holes) | Total (m) | Core or RC Drilling |
MAI | 1998 | EP-01 to 38 | 38 | 3,956.29 | RC |
MAI | 1999 | EP-39 to 59 | 21 | 1,648.00 | RC |
MAI | 2000 | EP- 60 to 85 | 26 | 2,989.86 | RC |
MAI | 2000 | EPD-01 to 03 | 3 | 708.21 | Core-HQ |
MSC | 2001 | HVD-1 to 30 | 30 | 5,113.24 | Core HQ |
MSC | 2002 and 2003 | SJD-1 to 32 | 32 | 4,376.97 | Core HQ |
MSC | 2004 | HVD-31 to 36 | 6 | 632.80 | Core HQ |
MSC | 2004 | SJD-33 to 39 | 7 | 2,174.65 | Core HQ |
MSC | 2005 | SJD-40 to 215 | 176 | 41,405.27 | Core HQ, NQ |
MSC | 2005 | SJM-1 to 28A | 30 | 1,834.25 | Core NQ, BQ) |
MSC | 2005 | MSC-4 to 8 | 5 | 499.00 | RC |
MSC | 2005 and 2006 | HVD 37 to 53 | 17 | 1,663.60 | Core HQ, NQ, BQ |
MSC | 2005 and 2006 | SJD-216 to 330 | 115 | 21,183.66 | Core HQ |
MSC | 2005 and 2006 | SJM 29 to 74 | 46 | 2,226.10 | Core HQ, BQ, NQ |
MSC | 2007 to June 2008 | SJD-331 to 463 | 133 | 32,922.74 | Core HQ |
MSC | 2007 to June 2008 | SJM-75 to 91 | 17 | 1,010.90 | Core HQ |
MSC | 2007 to June 2008 | SJM-95 to 97* | 3 | 210.80 | Core HQ |
Total | | | 705 | 124,556.34 | |
Table modified from AMEC, 2007.
9.2
Procedures
Reverse Circulation
Both MAI and MSC completed RC drilling at San José. Between the two companies, 90 RC drillholes were completed; 85 by MAI, and five by MSC. All RC drill holes were completed prior to AMEC’s review of the Project and AMEC (2007b) did not discuss the five RC drillholes completed by MSC. The 85 RC drill holes completed by MAI are as follows:
·
3 holes—La Sorpresa (270m) MAI;
·
8 holes—El Pluma West (872m) MAI;
·
2 holes—Saavedra (201m) MAI;
| |
SRK Consulting (U.S.), Inc. | May 29, 2009 |
Exhibit 99.1
| |
Minera Andes Inc. | 9-2 |
San José Silver-Gold Project | NI 43-101 Technical Report |
·
24 holes—Saavedra West (2,550m) MAI;
·
30 holes—HVN (2,850m) MAI;
·
4 holes—HVC (360m) MAI; and
·
14 holes—HVS (1,492m).
The five RC drill holes completed by MSC were drilled in the following areas:
·
1 hole—South of the Huevos Verdes zone;
·
1 hole—Kospi Zone;
·
1 hole—Northwest of the Kospi Zone;
·
1 hole—Frea Zone; and
·
1 hole—between Frea and Kospi zones.
The MAI RC drill holes were drilled at varying azimuths and dips and that the water table was encountered at approximately 20m in most holes. These holes have had location surveys but no downhole surveys. All RC holes drilled by MAI have been marked with cement monuments.
In general, AMEC (2007b) was of the opinion that MAI had followed industry best practices during the RC drilling program. However, AMEC (2007b) could not confirm logging procedures, sample chain of custody and the presence of a QA/QC program. Because of this, AMEC (2007b) had the following concerns:
·
Appropriateness of RC drilling technique for a narrow, high grade vein deposit;
·
Downhole “smearing” of precious metal grade;
·
No evaluation of decay and cyclicity of assay results;
·
Only one RC hole (EP-039) was twinned with a core hole (HVD-001); and
·
Lack of RC recovery data.
AMEC (2007b) commented that visual reviews of EP-39 and HVD-01 showed similar positions of mineralization in interval and dimension, but significant differences in grade. It was also AMEC’s observation that three RC drillholes (EP-70, EP-74, and EP-85) showed possible grade smearing. AMEC (2007b) recommended that these drillholes be twinned to confirm the analytical results. In the interim, AMEC recommended that reserve blocks related to these three drillholes be downgraded to indicated and/or inferred.
At the time of AMEC’s observations in 2007, RC holes made up 15% of the drillhole database. As of June 2008, this has been reduced to approximately 7% of the drillhole database. The three drillholes cited by AMEC (2007b) were drilled near the north end of the HVN mineralized zone
Diamond Drilling
Diamond drilling makes up the majority of all drilling at San José and includes both surface and underground drilling. Surface drilling was conducted to produce HQ diameter core, except in a few cases where the hole diameter was reduced to NQ due to drilling conditions. All underground drilling produced a core diameter of NQ reducing to BQ as necessary. There were some minor problems with recovery in faulted areas The average recovery was 90% or greater, and there was no evidence of difficult drilling or significant core loss during the drilling programs. All drillhole collar locations have been surveyed, and the majority of drillholes have downhole surveys. Downhole surveys were measured using a Sperrey Sun downhole survey instrument with measurements taken at approximately 50m intervals (AMEC, 2007b).
| |
SRK Consulting (U.S.), Inc. | May 29, 2009 |
Exhibit 99.1
| |
Minera Andes Inc. | 9-3 |
San José Silver-Gold Project | NI 43-101 Technical Report |
There are no downhole surveys for MAI RC or diamond drillholes nor MSC diamond drillholes prior to 2002 and the first 12 drillholes drilled during 2006. MSC began collecting downhole survey measurements for drillholes in 2002. However, magnetic minerals in the host rock have resulted in some erroneous measurements. Of the holes drilled and surveyed between 2002 and 2004, only five downhole survey measurements had acceptable results. In 2005, 57 holes had downhole surveys with significant deviation interpreted as resulting from magnetic interference with the survey instrument and mix-ups with data from the large number of drills operating at that time. The mix-ups have subsequently been corrected. After downhole surveys were resumed, AMEC reported that no inconsistencies were found. As of October 2007, only 12% of the drillholes exceeding 100m in depth were without downhole su rveys. SRK considers the unsurveyed holes to be acceptable for resource estimation purposes because the average amount of deviation in surveyed holes is low and the percentage of unsurveyed holes in the database is also relatively low.
Starting in 2001, the logging procedure included a graphic log, and a numeric log coded for lithology, alteration, quartz content, structure, sulfide/oxide content, rock quality designation (RQD), and recovery %. Assays were not included in the log. Logging procedures were not formalized until 2002, and has been used for all subsequent drilling programs. The protocols established include the following:
·
Logging is done in a well-lit, secure facility;
·
Technicians or geologists would log basic physical data, such as RQD, recovery %, and other geotechnical information;
·
More advanced geotechnical data would be logged by a geologist or geotechnical engineer;
·
A geologist would log the lithology, alteration, mineralization, structure, and mark assay intervals on the core;
·
Core photographs would be taken; and
·
Collars would be surveyed by the mine surveyors.
MSC did not initiate a QA/QC program until 2005. The QA/QC procedure is discussed in Section 11.
9.3
Results
AMEC (2007b) had concerns about the appropriateness of the RC drilling technique for a narrow high-grade vein deposit and the lack of a QA/QC program, recovery data and evaluation of decay and cyclicity of analytical results during RC drilling at the Project. Most of the RC drillholes from a depth of 20m were drilled wet and AMEC (2007b) could not confirm drilling and logging practices or sample custody during the RC drilling programs. AMEC (2007b) also identified three RC drillholes that appeared to show possible grade smearing. It was recommended that MSC, twin more of the RC drillholes with core drilling. At the time of AMEC’s observations in 2007, only one RC drillhole had been twinned and RC holes made up 15% of the drillhole database. As of June 2008, RC drillholes have been reduced to approximately 7% of the drillhole database. The three RC drillholes cited by AMEC (200 7b) (EP-70, EP-74 and EP85) were drilled in the area around HVN and are still in the resource database. These three RC drillholes represent less than 1% of the drillhole database.
| |
SRK Consulting (U.S.), Inc. | May 29, 2009 |
Exhibit 99.1
| |
Minera Andes Inc. | 9-4 |
San José Silver-Gold Project | NI 43-101 Technical Report |
SRK agrees with AMEC’s (2007b) concerns regarding RC drilling. However, MSC no longer uses RC drilling and RC drilling represents an increasingly low percentage of the database. Regarding the three RC holes with suspected smearing, SRK is of the opinion that these three holes currently represent a very small part of the database and will not have a large impact on resource estimation.
SRK is of the opinion that the current drilling program to be well run and that MSC was using industry best practices for drilling, logging and sample chain of custody.
Most core drilling generated HQ or NQ core and underground drilling generated NQ with reduction to BQ core in difficult ground. Because the mineralization occurrence at San José can contain void space and because of the possibility of localized concentrations of mineralization, it is important that a large, representative sample be collected for analysis. SRK recommends that core no smaller than NQ be drilled in the San José deposit in order to maximize the sample collected.
| |
SRK Consulting (U.S.), Inc. | May 29, 2009 |
Exhibit 99.1
| |
Minera Andes Inc. | 9-5 |
San José Silver-Gold Project | NI 43-101 Technical Report |
Figure 9-1: Drillhole Location Map at the San José Property
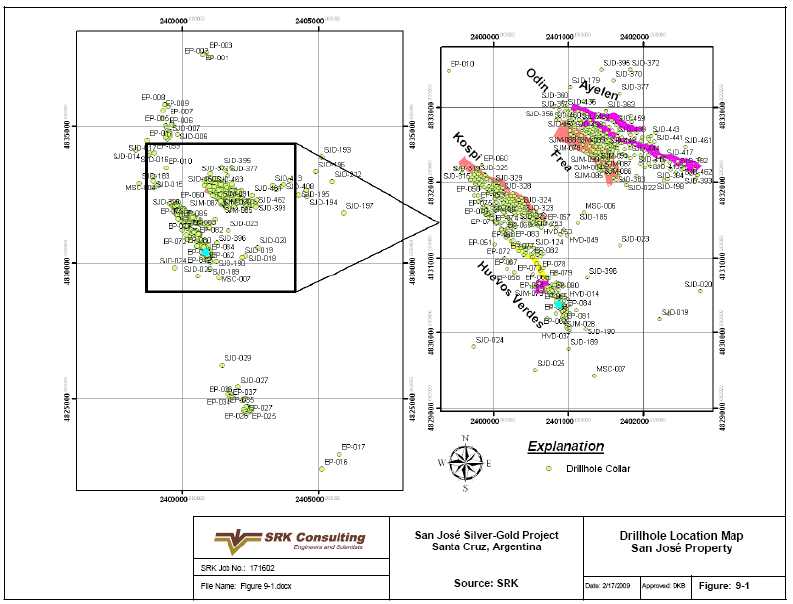
| |
SRK Consulting (U.S.), Inc. | May 29, 2009 |
Exhibit 99.1
| |
Minera Andes Inc. | 10-1 |
San José Silver-Gold Project | NI 43-101 Technical Report |
10
Sampling Method and Approach(Item 14)
Sections 10.1 through 10.3 have been excerpted fromNI 43-101 Technical Report Update on the San José Property, Santa Cruz Province Argentina, (AMEC, 2007b). Changes to standardizations have been made to suit the format of this Technical Report. Edits to text are indicated with the use of brackets.
10.1
Drilling Programs
10.1.1
Minera Andes RC Drilling (1998 to 2000)
The following is a short summary of the sampling protocols for the RC drilling program:
·
MAI RC drill hole samples were sampled and prepared on site at San José. Degerstrom drilling crews collected the samples; however, a Minera Andes geologist was on site to monitor the sample collection process;
·
Holes were continuously sampled over their entire length over approximate 1.0m to 1.5m intervals. Dry samples were split into two pans through a Gilson splitter set for a 50% split; in zones of poor recovery only one split was made. Equipment was cleaned with compressed air between samples. Samples were not weighted to estimate recovery;
·
The pan contents were transferred to cloth sample bags, and sealed with wire ties. One sample was sent to the laboratory for preparation and analysis, and the other sample, a duplicate split or reject, was retained on site;
·
Wet samples were run through the cyclone directly into a rotary wet splitter set to deliver 50% to each of two large micropore-cloth bags. One sample was sent to the laboratory for preparation and analysis, and the reject or duplicate split was retained on site. No attempt was made to collect or treat excess water overflow from the sample collecting bags;
·
An additional small sample was collected in chip trays for geological logging on site. There are also no descriptions of the security measures in place for the sampling program. AMEC made recommendations in Cinits et al. (2005) for sampling and security, which remain to be implemented;
·
All samples were shipped directly by a Geolab (now ALS Chemex) truck to their preparation lab in Mendoza. The pulps were flown to Degerstrom for analysis; and
·
When Degerstrom completed the sample, drilling and analytical work for Minera Andes, Degerstrom held an interest through shares in Minera Andes, and cannot be considered as an independent laboratory.
10.1.2
Minera Andes Diamond Drilling (2000)
AMEC did not receive documentation relating to sample collection protocols that were in place during the Minera Andes diamond drilling program (holes EPD-01 to EPD-03). Samples were presumably shipped to Geolab in Mendoza and then to Degerstrom for analysis using the same sample preparation and analytical protocols as described in Section 10.1.1.
| |
SRK Consulting (U.S.), Inc. | May 29, 2009 |
Exhibit 99.1
| |
Minera Andes Inc. | 10-2 |
San José Silver-Gold Project | NI 43-101 Technical Report |
10.1.3
MSC Core Drilling (2001)
AMEC was provided with only limited documentation regarding the sampling collection protocols used during the drilling of holes HVD-1 to HVD-30.
Core was marked at 0.1m to 3.4m intervals (average around 1.0m) of logged mineralization. Drill core was mechanically split. Half of the drill core was stored for reference, assay, or metallurgical samples; the other half of the drill core was placed in a pre-numbered and tagged sample bag.
Samples were transported to a secure central storage area at the completion of each day’s sampling, and loaded onto a truck when a sufficient number of samples were ready for shipment to the laboratory. All samples were shipped directly by a truck contracted by MSC to ALS Chemex Laboratories in Mendoza for preparation and analysis.
Sample preparation and analytical protocols were not made available to AMEC.
10.1.4
MSC Core Drilling (2002 to 2007)
AMEC reviewed the sampling, and sample preparation procedures in practice during three site visits undertaken between September 2004 and April 2005, and two site visits in May and September 2007. AMEC also reviewed the sample preparation and assaying procedures during a site visit to MSC’s principal laboratory (Alex Stewart) and a secondary laboratory preparation facility in Mendoza in 2005. AMEC did not observe any procedures in place prior to hole SJD-40. AMEC was of the opinion that the procedures in place had continually improved.
The following protocol was in place for the MSC drilling programs:
·
The Project geologist is responsible for ensuring procedures at the drill rigs are of an acceptable nature. This includes verifying core retrieval and assembly, core box orientation, core marker placement and mark-up, core transportation methodology and security, geotechnical logging procedures, recovery and photography;
·
The logging process comprises recording lithology, alteration, mineralogy and structure;
·
Sample intervals are marked on both the core and the core boxes. A core splitting line is marked on the core by the geologist. Zones with more friable core are taped prior to cutting to avoid core loss at the saw. Core sample intervals respect geological, mineralogical, and structural boundaries. AMEC recommended in 2005 that samples are not less than about 50cm, and preferably longer than 1.0m;
·
The core is then transported to the core-cutting area. The Project geologist ensures that the core is properly cut in half by a trained technician using a diamond saw. One half of the core is returned to the core box, while the other half is placed in a pre-numbered and tagged sample bag;
·
Disaggregated material is carefully handled to avoid, or minimize, sampling bias. A metallic wedge is used to force the separation of the fragmented core into two halves, and then all the material from one of the halves is completely sampled, including all fine material;
·
Once the sample is completed, the bag is immediately sealed. The sample bag has the sample number clearly written on both sides of the bag and the corresponding sample tag included in the bag with the sample. The individual sample tags have pre-assigned sample numbers to account for the insertion of blanks, duplicates and CRMs (certified reference material) that will be submitted along with each sample shipment. All samples are then entered in the database [The QA/QC program including blanks, duplicates and CRMs was started during 2005 and discussed in Section 11]; and
| |
SRK Consulting (U.S.), Inc. | May 29, 2009 |
Exhibit 99.1
| |
Minera Andes Inc. | 10-3 |
San José Silver-Gold Project | NI 43-101 Technical Report |
·
Samples were transported to a secure central storage area at the completion of each days sampling and loaded onto a truck when a sufficient number of samples were ready for shipment to the laboratory. All samples were shipped directly by a truck contracted by MSC to Alex Stewart Laboratories in Mendoza for preparation and analysis.
10.2
Trenching
10.2.1
Minera Andes Trenching (1997 to 2000)
A series of 30 trenches (TRHV-01 to TRHV-30), totaling 2,125m, were excavated and sampled by Minera Andes at HVS during 1997 and 2000. MSC collected 566 channel chip samples, nominally 25cm wide and ranging from 0.3m to 1.8m long (but generally 1.0m to 1.5m long) within the trenches. Typical trenches at HVS are about 1.2m in width, 0.5m to 1.5m in depth, and 15m to 192m in length.
An additional 6 trenches (HTHV-1 to HTHV-6) were also excavated over the Huevos Verdes vein, however, there is no documentation regarding who excavated these and when, and the protocols associated with the sampling. The trenches vary from approximately 6m to 22m in length, and a total of 81 samples were collected which range in length from 0.1m to 1.6m (average 1.0m).
Of the 30 trenches, 11 trenches were incorporated into previous versions of the resource estimates (TRHV-16, TRHV-18, TRHV-19, TRHV-21 to TRHV-25 and HTHV-1 to HTHV-6). Currently, one sample from TRHV-15 and two samples from TRHV-24 are incorporated into the estimates reported in Section 15 of this Technical Report. The trenches were visited by AMEC; however, no independent samples were collected as part of this current report. AMEC had previously reviewed and sampled a selection of these trenches in 2002 (Cinits et al., 2002).
The Saavedra West Target, approximately 6km to the south of HVS, is well-exposed, and Minera Andes completed 25 irregularly-spaced backhoe trenches (TrSaW-1 to TrSaW-25), totaling 2,550m while exploring this area during 1996 and 1997. Most trenches were selectively channel chip-sampled across 1m to 2m intervals in areas of strong alteration and/or mineralization. Typical trenches at Saavedra West are about 1.20m wide, 0.5m to 1.5m deep, and 24m to 232m in length.
10.2.2
MSC Trenching (2002)
An additional 142 trenches (T-1 to T-142), totaling approximately 4,176m, were reportedly excavated in the Pluma, Sorpresa, Saavedra and Huevos Verdes Zones in late 2002. The trenches range in length from approximately 10m to 140m. MSC collected 401 channel chip samples nominally 25cm wide and 0.2m to 1.85m long (averaging about 0.7m) within the trenches. AMEC has not visited any of these trenches and none have been incorporated into the resource estimates discussed in Section 15 of this Technical Report.
Trenches were systematically geologically mapped by MSC at a scale of 1:200.
| |
SRK Consulting (U.S.), Inc. | May 29, 2009 |
Exhibit 99.1
| |
Minera Andes Inc. | 10-4 |
San José Silver-Gold Project | NI 43-101 Technical Report |
10.3
Underground Channel Chip Sampling (2004 to 2007)
Until late 2004, underground channel sampling programs by MSC at HVN and HVS were taken using a hammer and chisel method. Individual samples ranged from 0.1m to 1.0m in length, but generally ranged between 0.2m to 0.5m. The samples were collected across the back of the drift in 0.20m to 0.25m wide sample lines, oriented perpendicularly to the strike of the vein. Sample lines were spaced approximately 2.0m apart. MSC collected approximately 3,670 underground channel chip-samples using this technique. During AMEC’s first site visit in September 2004, it was determined that the channel chip-sampling process was not done appropriately and was resulting in poor sampling precision (Cinits et al., 2005).
Subsequent to recommendations made by AMEC, MSC changed the sampling protocols and initiated channel sampling using a pneumatic drill in order to obtain a “representative sample” with a consistent fragment size, and a consistent overall sample size in relation to the sample length. AMEC also recommended that sample lengths be increased to a minimum of 0.3m. MSC then completed a program of re-sampling every second sample line (approximately every 4m throughout the mine, except in areas that could no longer be accessed due to timber being installed, or along the raises).
AMEC recommended that samples collected by the hammer and chisel method should not be included in resource estimates, or if they are used, the confidence level of blocks associated with them should be downgraded to lower confidence levels.
During the May 2007 site visit, AMEC reviewed the methodology of collecting and surveying channel lines at both the Huevos Verdes and Frea veins. No samples were being collected by MSC at the time of AMEC’s visit; however, MSC confirmed that the pneumatic hammer method continues to be used for all channel sample collection. Channel lines are painted in the top wall and surveyed at one extremity as a collar. Azimuth and from/to intervals are entered in the database and the channels are recorded as a drill hole.
AMEC noted that in some circumstances the sample lines do not extend across the entire drift to include the wall rock material adjacent to the vein (as separate samples). It is AMEC’s experience that sampling across the entire drift is good practice, even if the mineralized structure is much narrower. Collection of additional samples in the immediate well rock helps to provide information for dilution analysis, and can possibly identify additional zones of mineralization peripheral to the main vein that might not been visually evident.
During the September 2007 site visit AMEC observed the channel sampling procedure. The hammer and chisel method was used at the time, but the sampling surface was thoroughly sampled in small fragments (less than 3cm diameter). The sample weight was about 3kg.
10.4
2008 Sampling
Leah Mach, a QP of this Technical Report, visited the mine site in September 2008, and observed core drilling and sampling. There was no channel sampling in progress at the time and location of the visit to the underground workings. The methods described in the sections above were in use at the time of the site visit. There is currently a total of about 18,000 channel samples in the database that is used for resource estimation.
| |
SRK Consulting (U.S.), Inc. | May 29, 2009 |
Exhibit 99.1
| |
Minera Andes Inc. | 10-5 |
San José Silver-Gold Project | NI 43-101 Technical Report |
10.5
Factors Impacting Accuracy of Results
San José mineralization occurs in quartz veins, breccia zones and stockworks with sulfide minerals in dissmentation, veinlets and open space fillings. Because of void space and the possibility of localized concentrations of mineralization, it is important that a large, representative sample be collected for analysis.
Sample collection as described by AMEC (2007b) for both the RC and core drilling programs follows industry best practices, with the exception of a systematic QA/QC program prior to 2005. Since 2005, MSC has had a QA/QC program in place that includes the insertion of blanks, duplicates and site specific standards into the sample stream. Laboratory QA/QC is discussed in Section 11.
AMEC (2007b) observed that MSC collected underground channel samples only from the mineralized zones and that samples were not collected from the wallrock on either side of the zone. AMEC (2007b) was concerned that by not sampling into the wallrock on either side of the mineralized zone MSC was not collecting necessary information about dilution. AMEC (2007b) was also of the opinion that sampling across the entire drift could identify additional mineralized zones that are not “visually evident”.
During SRK’s site visit, SRK learned that MSC continues to collect underground channel samples only from the mineralized zones and does not include wallrock sampling in its program. SRK agrees with AMEC’s assessment that it is necessary to collect wallrock samples in order to quantify dilution.
10.6
Sample Quality
SRK is of the opinion that sample quality is good for those drill cores NQ or larger. Because of void space and the possibility of localized concentrations of mineralization in the deposit, SRK recommends NQ core be the minimum sized core drilled at the Project. SRK does not know the percentage of core drilled at BQ-size, but SRK recommends that drilling BQ-sized core be minimized or eliminated.
AMEC (2007b) stated that prior to 2004, all underground channel samples were collected using a hammer and chisel. After visiting the Project in 2004, AMEC made the following sample protocol recommendations for underground channel sampling:
·
Sample collection using a pneumatic drill; and
·
Minimum sample lengths of 0.3m.
These recommendations were made to produce consistent fragment size, and consistent overall sample size in relation to the sample length. Subsequent to these recommendations MSC re-sampled every second sample line throughout the mine, where sample lines were still accessible, using the new protocol. AMEC (2007b) did not discuss the results of this resampling program, but recommended that those resource blocks with only hammer and chisel samples should not be included the resource estimate or have a lower confidence level.
During the May 2007 site visit, AMEC (2007b) could not confirm the use of the pneumatic drill and during the September 2007 site visit, AMEC (2007b) observed underground channel sample collection with a hammer and chisel. AMEC (2007b) commented that the sampling surface was thoroughly sampled in small fragments (less than 3cm diameter). The sample weight was about 3kg.
| |
SRK Consulting (U.S.), Inc. | May 29, 2009 |
Exhibit 99.1
| |
Minera Andes Inc. | 10-6 |
San José Silver-Gold Project | NI 43-101 Technical Report |
It is difficult to collect channel samples that are unbiased. SRK recommends that steps be taken to minimize bias in underground channel sample collection by standardizing the method as much as possible. These steps should include marking both sample width and length on the rib prior to sampling as well as maintaining a constant sample depth. The use of equipment such as a pneumatic drill keeps sampling rate more constant and may reduce selective sampling.
| |
SRK Consulting (U.S.), Inc. | May 29, 2009 |
Exhibit 99.1
| |
Minera Andes Inc. | 11-1 |
San José Silver-Gold Project | NI 43-101 Technical Report |
11
Sample Preparation, Analyses and Security(Item 15)
Sections 11.1 through 11.2.4 have been excerpted fromNI 43-101 Technical Report Update on the San José Property, Santa Cruz Province Argentina, (AMEC, 2007b). Changes to standardizations have been made to suit the format of this Technical Report. Edits to text are indicated with the use of brackets.
11.1
Drilling Programs
11.1.1
Minera Andes RC Drilling (1998 to 2000)
All samples were prepared by Geolab (now ALS Chemex) at the Mendoza preparation lab. No details were provided to AMEC regarding the preparation protocols.
The sample pulps were then flown to Degerstrom for analysis. At the time that Degerstrom completed the sample and analytical work for Minera Andes, the company held an interest through shares in Minera Andes, and therefore cannot be considered as an independent laboratory for this drilling phase.
Degerstrom assayed each sample for gold by 30g fire assay fusion with a direct-coupled plasma (DCP) finish. Silver, Cu, Pb, Zn, As, and Bi were assayed by 1g aqua regia digestion and DCP–atomic emission spectroscopy. Mercury was analyzed by a 1g nitric acid digestion, cold vapor foil technique.
Pulps of any significant intervals were sent to Bondar Clegg laboratories (now ALS Chemex) in Vancouver for check analyses. Bondar Clegg reportedly completed 60g fire assay (FA) for Au with gravimetric finish and atomic absorption spectroscopy (AAS) finish for Ag less than 3ppm. Although this practice is useful for checking high-grade values, the data cannot be used to evaluate accuracy due to the partial selection bias. AMEC was not provided with this data for review.
Other than the check analyses discussed above, AMEC is not aware of any other external QA/QC program, such as submission of blank, duplicate and CRM samples, which was initiated by Minera Andes during the RC drilling program. Therefore AMEC (was) unable to comment on the accuracy or precision of the analytical results.
11.1.2
Minera Andes Diamond Drilling (2000)
AMEC understands that the same laboratories and sample preparation and analytical protocols were used for this program as those used for the RC drilling programs.
11.1.3
MSC Core Drilling (2001)
All samples from this phase of drilling were prepared and analyzed by ALS Chemex in Mendoza; however, the specific preparation and analytical protocols were not made available to AMEC.
Check analyses for gold and silver assays for MSC drill samples were performed by Alex Stewart Laboratories in Mendoza. The results of these check analyses were not provided to AMEC.
| |
SRK Consulting (U.S.), Inc. | May 29, 2009 |
Exhibit 99.1
| |
Minera Andes Inc. | 11-2 |
San José Silver-Gold Project | NI 43-101 Technical Report |
11.1.4
MSC Core Drilling (2002 to 2005)
The Alex Stewart Laboratory in Mendoza was used as the primary laboratory for this phase of drilling. The check assays were conducted at ALS Chemex, in La Serena (Chile), which is the secondary, or umpire laboratory for the Project. Samples were assayed at both laboratories for Au and Ag and a suite of 12 elements including Cu, Pb, Zn, and As by an ICP method. Details of the assay methods for Au and Ag are presented in Table 11.1.4.1. In February 2005, AMEC visited the Alex Stewart laboratory and ALS Chemex preparation facilities in Mendoza, and found equipment, assaying and QA/QC procedures to be appropriate.
Table 11.1.4.1: Analytical Methods
| | | |
Laboratory | Item | Au (ppm) | Ag (ppm) |
Alex Stewart | Method | Au 4 FA/AA (30g) | Ag FA/Grav (30g*) |
Detection Limit (ppm) | 0.01 | 1 |
ALS Chemex | Method | AA23 (FA 30g, AAS) | Ag-GRA21 (30g, FA, gravimetric finish) |
Detection Limit (ppm) | 0.005 | 5 |
Method | Au-GRA21 (FA 30g, gravimetric finish) (for values >10ppm) | |
*Hochschild switched from 50g FA to 30g FA early in the program.
11.1.5
MSC Core Drilling (2006-2007)
MSC reports that the same laboratories were used as the primary and secondary laboratories during the 2006-2007 drilling. Both laboratories employed the same sampling and analytical protocols as described in Section 11.1.4.
11.2
Quality Assurance/Quality Control Programs
11.2.1
Minera Andes RC and Core Drilling Programs (1998 to 2000)
AMEC is not aware of any QA/QC program that was initiated by Minera Andes (including the insertion of duplicate, blank, or CRM samples) during the RC or core drilling programs from 1998 to 2000. AMEC understands that original pulps and rejects are no longer available in order to initiate a re-sampling program, and to be able to comment on the accuracy and precision of this data.
11.2.2
MSC Core Drilling Programs (2001 to 2003)
AMEC understands that only very limited QA/QC methods were used by MSC for the core drilling programs from 2001 to 2003, and that original pulps and rejects are no longer available and only limited amounts of core are archived, as much of the core generated from this program has been previously re-sampled or used for metallurgical test work. The amount of remaining sample material is not sufficient to initiate a re-sampling program and therefore AMEC cannot assess the accuracy and precision of this data.
11.2.3
MSC Core Drilling and Underground Programs (2004 to 2005)
A QA/QC program was designed by AMEC in January 2005, and immediately implemented by MSC. The program, fully described in Cinits et al. (2005), commenced at drill hole SJD-40, and after approximately 3,670 underground channel chip-samples had been collected.
| |
SRK Consulting (U.S.), Inc. | May 29, 2009 |
Exhibit 99.1
| |
Minera Andes Inc. | 11-3 |
San José Silver-Gold Project | NI 43-101 Technical Report |
Core Drilling
Alex Stewart was used as the primary laboratory for this phase of drilling at HVN, HVC and HVS and at Frea. The check assays were conducted at ALS Chemex in La Serena.
Twin, duplicate, CRM and blank samples were inserted in the sample sequence with the normal core samples to monitor sampling and sub-sampling variances, laboratory precision and accuracy, to identify potential problems during the sampling, preparation and assaying practices, possible sample cross-contamination and swapping, and several other parameters. The approximate proportion of each sample type was 1 in 30, or 3%.
As part of the QA/QC program, 208 samples (185 check samples plus additional control samples for QA/QC) were also sent for external check assays to ALS Chemex in La Serena (Chile) and analyzed for Au and Ag by the methods shown in Table 11.1.4.1. In addition, granulometric tests on 10% of the check samples (20 samples) were conducted at ALS Chemex, to check the quality of pulverization at Alex Stewart. Only 65% of the samples (originally tested during February and March 2005) complied with the condition assumed by Alex Stewart (85% passing 200#). Since this poor adherence to sample preparation protocols could lead to lower analytical precisions, AMEC notified Alex Stewart of this in early April 2005. Alex Stewart then immediately adjusted their protocols, after which the preparation quality considerably improved.
Table 11.2.3.1 is a summary of control samples used for this phase of drilling.
Table 11.2.3.1: Summary of 2004 to 2005 QA/QC Program
| | |
Types of Sample | Description | Number of Samples |
Sampling | Total number of samples | 6,296 |
Number of control samples | 1,385 (22.0%) |
Of which: | |
Twin samples | 201 (3.2%) |
Coarse duplicates | 201 (3.2%) |
Pulp duplicates | 210 (3.3%) |
Coarse Blanks | 185 (2.9%) |
Pulp blanks | 186 (2.9%) |
CRMs | 248 (3.9%) |
Check samples | 185 (2.9%) |
Control samples in check sample batch | 30 (14.4%) |
Of which: | |
Pulp duplicates | 6 (2.9%) |
CRMs | 17 (8.2%) |
Pulp blanks | 7 (3.4%) |
Assaying | Number of assays (Au, Ag) | 12,592 |
Of which | |
Regular sample determinations | 9,822 |
Control sample determinations | 2,770 (22.0%) |
Granulometric checks in check sample batch | 20 (9.6% of the check samples) |
As a result of the 2005 QA/QC program, AMEC concluded that:
·
Sampling and sub-sampling variances were within acceptable limits;
·
Assay precision for Au and Ag at Alex Stewart and ALS Chemex was satisfactory;
·
Assay accuracy for Au and Ag at Alex Stewart and at ALS Chemex was satisfactory;
| |
SRK Consulting (U.S.), Inc. | May 29, 2009 |
Exhibit 99.1
| |
Minera Andes Inc. | 11-4 |
San José Silver-Gold Project | NI 43-101 Technical Report |
·
No significant cross-contamination was detected during preparation and assaying at Alex Stewart and during assaying at ALS Chemex;
·
Grinding quality at Alex Stewart was below declared specifications during the first two months of 2005 (February and March), but was later improved;
·
The Au and Ag assays of the 2005 drilling exploration campaign at San José are considered to be sufficiently precise and accurate to be used for Au and Ag resource and reserve estimation purposes; and
·
MSC should use commercial CRMs, or certified standards prepared in well-recognized laboratories. The standards should not be prepared in the primary or secondary laboratories.
Underground Sampling QA/QC Results
Ungrouped Samples
In an effort to twin the original hammer and chisel sampling, MSC attempted to accurately follow a number of original channel sample lines. Results were disappointing, primarily due to the fact that most of the original sample locations could not be identified. The twinning program was modified to twin only those locations which were adequately marked. The 51 resulting samples were called “remuestreos.” All the samples were assayed at Alex Stewart, and the corresponding submission batch included eight control samples (two coarse duplicates, two pulp duplicates, two CRMs and two blanks).
The QA/QC of re-sampling data indicated that:
·
Sampling and sub-sampling variances still exceeded the acceptable ranges, although an improvement was observed as compared to initial data;
·
Analytical precision and accuracy were within acceptable ranges; and
·
A certain degree of contamination was detected in pulp blanks, probably as a result of poor manipulation practices during sample re-bagging (at the mine) or assaying (at the laboratory).
AMEC recommended that:
·
Sampling procedures be further studied; and
·
Mine personnel involved in the preparation of the batches, and Alex Stewart personnel should be requested to improve the procedures for handling of pulps.
Grouped Samples
Following the procedure described above for the “ungrouped samples”, the same “remuestreos” were further processed as follows: the average Au and Ag values for each sample line were calculated, resulting in 19 twin sample average pairs. The twin sample average pairs were evaluated according to the “hyperbolic method.”
The QA/QC data of the twin sample versus “remuestreo” data indicates that:
·
Sampling variances still exceed the commonly accepted ranges;
| |
SRK Consulting (U.S.), Inc. | May 29, 2009 |
Exhibit 99.1
| |
Minera Andes Inc. | 11-5 |
San José Silver-Gold Project | NI 43-101 Technical Report |
·
However, compositing the individual samples considerably improves the sampling variance trend; and
·
“Remuestreo” data could be used for resource estimations for Au and for Ag; the latter with caution.
AMEC recommended that:
·
Channel sampling procedures are further improved; and
·
Individual sample lengths are increased to around 0.5m to 1.0m.
11.2.4
MSC Core Drilling and Underground Programs (2006-2007)
The vast majority of the sampling in 2006-2007 was related to the definition drilling program at the Kospi Vein, but between April and September 2007 additional drilling was conducted at the extensions of the Frea Vein. This drilling incorporated the same QA/QC program that was used for the previous drilling programs. A minor amount of underground channel chip sampling at HVS and Frea also took place during the period.
Kospi Vein Core Drilling
Alex Stewart was used as the primary laboratory for this phase of drilling. The check assays were conducted at ALS Chemex in La Serena.
Twin, duplicate, CRM and blank samples were inserted in the sample sequence with the normal core samples to monitor sampling and sub-sampling variances, laboratory precision and accuracy, to identify potential problems during the sampling, preparation and assaying practices, including possible sample cross-contamination and swapping, and several other parameters. The approximate proportion of each sample type is presented in Table 11.2.4.1.
AMEC is not aware of any program of external check assays (of previously analyzed pulps) as part of the QA/QC program. Furthermore AMEC is not aware of any granulometric tests that were completed during this phase of drilling to check the quality of pulverization at Alex Stewart.
Table 11.2.4.1: Summary of 2006 QA/QC Program (Kospi Vein Core Drilling)
| | | |
Types of Sample | Description | Number of Samples |
Sampling | Total number of samples | 4,176 |
Number of control samples | 862 (20.6%) |
Of which: | |
Twin samples | 164 (3.9%) |
Coarse duplicates | 156 (3.7%) |
Pulp duplicates | 175 (4.2%) |
Coarse Blanks | 108 (2.6%) |
Pulp blanks | 73 (1.7%) |
CRMs | 186 (4.5%) |
Check samples | 0 (0%) |
Assaying | Number of assays (Au, Ag) | 8,352 |
Of which: | |
Regular sample determinations | 6,628 (79.4%) |
Control sample determinations | 1,724 (20.6%) |
Granulometric checks in check sample batch | 0 (0% of the check samples) |
| |
SRK Consulting (U.S.), Inc. | May 29, 2009 |
Exhibit 99.1
| |
Minera Andes Inc. | 11-6 |
San José Silver-Gold Project | NI 43-101 Technical Report |
Analysis of the duplicate sampling is presented in Table 11.2.4.2. No outliers were detected for the coarse and pulp blanks.
Table 11.2.4.2: Duplicate Sample Evaluation, Kospi Vein
| | | | |
Sample Type | Number of Samples | Element | Number Failures | Failures (%) |
Twin Samples | 164 | Ag | 11 | 6.7 |
Au | 13 | 7.9 |
Coarse Duplicates | 156 | Ag | 8 | 5.1 |
Au | 18 | 11.5 |
Pulp Duplicates | 175 | Ag | 3 | 1.7 |
Au | 17 | 1.7 |
As a result of the 2006 Kospi drilling QA/QC program, AMEC concluded that:
·
Sampling and sub-sampling variances were within acceptable limits;
·
Assay precision for Au and Ag at Alex Stewart was satisfactory;
·
Assay accuracy for Au and Ag at Alex Stewart was satisfactory. Two of the gold CRMs (SJ10 and SJ32) are yielding excessive bias values of -10.1% and -14.8%, respectively, but in view of their low grades, well below the economic cut-off for the deposit, AMEC does not consider them as valid Au CRMs;
·
No significant cross-contamination was detected during preparation and assaying at Alex Stewart;
·
Grinding quality at Alex Stewart was not tested; and
·
No external check analyses were completed to assist in the evaluation of the assay accuracy.
Frea Extensions Core Drilling
AMEC did not receive the original QA/QC data obtained during the 2007 campaign. However, a report prepared by MSC (MSC, 2007) acknowledges that twin samples, coarse duplicates and pulp duplicates exhibit 90%, 44% and 10% relative errors for Au, respectively, at the 90th percentile in the cumulative frequency plot, well above the acceptable thresholds (30% and 20%, respectively for twin samples and coarse duplicates), even after excluding sample pairs below 0.2g/t Au. In the case of Ag, the corresponding figures are 80%, 13% and 20% relative errors, respectively, after excluding sample pairs below 5g/t Ag; therefore, twin samples and pulp duplicates exceed the acceptable thresholds (30% and 10%, respectively).
MSC (2007) presents control charts for six CRMs, one of them documented for Au, two for Ag, and three for both elements. The accuracy was not discussed, but from a visual inspection of the plots, AMEC is of the opinion that accuracy is in general within acceptable limits; however, outliers are relatively frequent, both for Au and Ag, which indicates poor reproducibility or frequent mix-ups.
Blanks have been inserted to monitor contamination, but it is not clear what kind of blanks have been used (coarse or pulp). Significant contamination has not been detected.
In summary, on the basis of the limited information received, AMEC is of the opinion that:
| |
SRK Consulting (U.S.), Inc. | May 29, 2009 |
Exhibit 99.1
| |
Minera Andes Inc. | 11-7 |
San José Silver-Gold Project | NI 43-101 Technical Report |
·
Au sampling and sub-sampling variances exceed the acceptable ranges;
·
Ag sampling and analytical variances exceed the acceptable ranges;
·
Au and Ag accuracy appear to be within acceptable ranges, but the presence of a relatively high proportion of outliers indicates poor reproducibility and/or frequent mix-ups; and
·
No contamination has been detected during preparation and assaying at the laboratory.
AMEC recommends that:
·
Sampling, preparation and analytical procedures be further studied; and
·
Mine personnel involved in the preparation of the batches, as well as Alex Stewart personnel, should be requested to improve the procedures for handling of pulps.
Underground Sampling QA/QC Results
Starting June 2005, MSC continued their program of underground channel chip sampling at HVS and Frea. As of June 30, 2007, a total of 1,774 samples had been submitted for assay, of which 1,573 were actual channel samples and 201 were control samples. The approximate proportion of each sample type is presented in Table 11.2.4.3. AMEC did not receive information for the underground sampling that was completed during the 3rd quarter of 2007.
Table 11.2.4.3: Summary of 2005-June 2007 QA/QC Programs*
| | |
Types of Sample | Description | Number of Samples |
Sampling | Total number of samples | 1,774 (100%) |
Number of control samples | 201 (11.3%) |
Of which: | |
Twin samples | 48 (2.7%) |
Coarse duplicates | 4 (0.2%) |
Pulp duplicates | 5 (0.3%) |
Coarse Blanks | 64 (3.7%) |
Pulp blanks | 5 (0.3%) |
CRMs | 70 (3.9%) |
Check samples | 0 (0%) |
Assaying | Number of assays (Au, Ag) | 3,548 |
Of which: | |
Regular sample determinations | 3,146 (79.4%) |
Control sample determinations | 402 (20.6%) |
Granulometric checks in check sample batch | 0 (0% of the check samples) |
*Underground Channel Sampling
AMEC has reviewed the results of 48 twin samples from the underground chip sampling program, representing a 2.7% of the total samples (Table 11.2.4.4) and identified 13 failures for Au (27.1%) and 14 failures for Ag (29.2%). AMEC is of the opinion that some of the failures may represent sample mix-ups, but still the failure rates are very high, and reflect poor sampling precision.
| |
SRK Consulting (U.S.), Inc. | May 29, 2009 |
Exhibit 99.1
| |
Minera Andes Inc. | 11-8 |
San José Silver-Gold Project | NI 43-101 Technical Report |
Table 11.2.4.4: Twin Sample Evaluation, Channel Samples
| | | | |
Sample Type | Number of Samples | Element | Number Failures | Failures (%) |
Twin Samples | 48 | Au | 13 | 27.1 |
Ag | 14 | 29.2 |
Evaluation of the CRMs for the channel sampling indicated that CRM SJ10 displayed a strong negative bias for gold, and due the average grade of the CRM being less than the economic cut-off for the deposit, the use of this CRM should be discontinued.
AMEC received the results of four coarse duplicates (0.2%) and five pulp duplicates (0.3%). AMEC processed these limited data, and obtained acceptable error rates for Ag in both cases (0%), and for Au in coarse duplicates (0%). The error rate for Au in pulp duplicates was very high (40%). However, AMEC is of the opinion that the coarse and pulp duplicate insertion rates are too low, and thus valid conclusions on the data cannot be made.
A review of the blank sampling for the underground program indicated that one sample assayed over the blank safe value for silver (Figure 11-1) in the coarse blank data set. Pulp blank samples for gold and silver, and coarse blank samples for gold were in control.
As a result of the 2005–June 30, 2007 San José underground QA/QC program, AMEC concluded that:
·
Sampling variances were very high, reflecting poor sampling precision;
·
Sub-sampling and analytical variance could not be properly assessed;
·
Assay accuracies for Au and Ag at Alex Stewart were satisfactory. One of the gold CRMs (SJ10) yielded an excessive bias of -21.5%), but in view of its relatively low-grade, well below the San José economic cut-off, AMEC does not consider this CRM as a valid Au CRM for this deposit;
·
No significant cross-contamination was detected during preparation and assaying at Alex Stewart;
·
Grinding quality at Alex Stewart was not tested; and
·
No external check analyses were completed to assist in the evaluation of the assay accuracy.
11.2.5
AMEC Recommendations (2007)
In 2007, AMEC recommended that MSC review the CRMs in use at San José and that MSC discontinue use of two low standards (SJ10 and SJ32). AMEC (2007b) expressed concern that the site specific standard was created by the labs performing the routine analysis. AMEC’s other recommendations included grinding quality checks after each crushing and grinding step to monitor preparation process quality and a check sample program for the secondary laboratory. This check sample program would include the insertion of a duplicate, standard and pulp blank each representing approximately 5% of the regular sample population sent to the secondary lab. As part of this check sample program, the secondary lab would also be asked to conduct additional sieve checks (AMEC, 2007b).
| |
SRK Consulting (U.S.), Inc. | May 29, 2009 |
Exhibit 99.1
| |
Minera Andes Inc. | 11-9 |
San José Silver-Gold Project | NI 43-101 Technical Report |
11.3
MSC Analytical and QA/QC 2008
Currently, the San José laboratory located at the Project is the primary laboratory for analysis while Alex Stewart in Medoza is the secondary laboratory used to analyze samples for the Project. SRK was not informed if any analytical techniques changed when MSC started using the mine laboratory as the primary lab.
SRK can confirm that MSC is no longer using standards SJ10 and SJ32, which AMEC (2007b) reported as being low-grade standards with values below the cut-off grade for San José. The standards currently include site specific standards created by Alex Stewart. The standards used by MSC are listed in Table 11.3.1.
Table 11.3.1: Standards in Use at San José
| | | | |
Range | Gold Standard | Au (g/t) | Silver Standard | Ag (g/t) |
High | ALTO | 8.35 | ALTO | 615.66 |
Medium | MEDIO | 7.36 | MEDIO | 564.69 |
Low | BAJO | 4.88 | BAJO | 465.58 |
In the QA/QC spreadsheets provided to SRK for both exploration and production, are references to Rocklabs CRMs SN16 and SP17. In the production data there is a spreadsheet that has information on Rocklabs CRMs SJ32, SN26, SP27 and SI25. However, the values reported for the standards with SN16 and SP17 do not match Rocklabs’ certificates for these materials, and in the actual database there is no reference to SJ32, SN26, SP27 and SI25. These six standards are no longer available from Rocklabs and SRK cannot confirm that the Rocklabs CRMs are being used at the site.
SRK was not provided with certificates for the site specific standards used at San José. SRK cannot confirm how the site specific standards were produced and whether the creation of these standards included round robins with multiple laboratories in addition to Alex Stewart. Because of this, SRK cannot comment on the site specific standards being used.
MSC currently has a QA/QC program, which SRK understands was provided by AMEC in 2005. However, SRK was unable to find a description of this program. SRK was provided with exploration QA/QC data for the months of May through August 2008 and monthly reports for this data from June to August 2008. The production QA/QC data provided was for January, February, July and August 2008 but no reports were provided and SRK was unable to open the spreadsheet for February. From the reports and data spreadsheets SRK was able to identify the general parameters of the QA/QC program used at San José.
The QA/QC program used at San José includes three standards, two types of blanks and three types of duplicates. The three standards are the high, medium and low standards listed in Table 11.3.1. Blanks include both a coarse and pulp blank and duplicates include a field duplicate and two preparation duplicates. The preparation duplicates include a coarse duplicate and a pulp duplicate. These QA/QC samples are used in both production and exploration programs.
During exploration drilling, control samples are inserted in every batch of 25 samples. This includes up to nine controls samples with the rest of the batch made up of regular samples. Control samples represented approximately 33% of the database for these four months (Hochschild Mining, 2008; 2008a; 2008b).
| |
SRK Consulting (U.S.), Inc. | May 29, 2009 |
Exhibit 99.1
| |
Minera Andes Inc. | 11-10 |
San José Silver-Gold Project | NI 43-101 Technical Report |
During the May to August 2008 period of exploration drilling, control samples appear to have been inserted into the sample stream at a semi-random frequency. This may reflect insertion based partly on mineralized material observed in the coreboxes in an effort to track potential problems from different mineralization types. In general, there is one standard per 25 sample batch and standards alternate between high, medium and low inserted at a frequency of approximately one every 23 samples. Blanks are inserted more frequently and more randomly. Some batches include five blanks while others include two. In places blanks alternate between fine and coarse and may be placed immediately adjacent in sequence or may be divided by up to 20 samples. In other areas, two of the same type of blank sample may be placed in sequence but not adjacent. This indicates that MSC is concerned abo ut cross contamination during sample preparation in certain areas of the sample sequence and may be placing the blank samples after intervals with coarse mineralization to detect any contamination issues. Duplicates are also placed semi-randomly. There is usually a field sample (core duplicate) and preparation duplicates alternating between coarse and pulp duplicate per 25 sample batch. However, one of each type of duplicate can also found within the same 25 sample batch (Hochschild Mining, 2008; 2008a; 2008b).
For the production QA/QC program during January, February, July and August of 2008, MSC submitted samples in 20 sample batches with four control samples per batch. These control samples include:
·
One standards alternating between high, medium and low:
·
One blank either coarse or fine alternating sample type every 40 samples;
·
One field duplicate; and
·
One preparation duplicate either coarse or fine, alternating sample type every 40 samples.
MSC monitored the results of both the exploration drilling and production QA/QC control samples, and control failures were re-assayed as part of the QA/QC protocol. Control samples were expected fall within the ranges listed below:
·
Field duplicates—permitted range was ±30%, 90% of the time;
·
Coarse preparation duplicates—permitted range was ±20%, 90% of the time;
·
Fine preparation duplicates (pulps)—permitted range was ±10%, 90% of the time;
·
Standards were considered to be acceptable if they fell within approximately 2 standard deviations (2σ), 95% of the time;
·
Coarse blanks were acceptable if the result was under 3x the laboratory detection limit; and
·
Fine blanks were acceptable if the result was under 2x the laboratory detection limit.
In the case of a control sample failure, re-analysis was required. Whether re-analysis of an individual sample or of a partial or entire batch was required was dependent on the situation and contamination observed. SRK was unsure of the decision making parameters behind re-analysis of a single sample versus a partial or entire batch, but suspect that it would depend on the nature of the failure.
| |
SRK Consulting (U.S.), Inc. | May 29, 2009 |
Exhibit 99.1
| |
Minera Andes Inc. | 11-11 |
San José Silver-Gold Project | NI 43-101 Technical Report |
SRK was provided with data for the 2008 exploration program for the months of May through August and three monthly reports for the months of June through August. During this period, the exploration program submitted 1,432 samples for analysis of which 356 were control samples. MSC observed one blank failure, which generated a re-analysis of part of a sample batch, and one standard failure, which resulted in a re-analysis of the failed standard. During that same time period, MSC observed that there were precision problems in gold and silver duplicates in the lower grade analysis range (approximately 1g/t Au and 100g/t Ag). By the end of August 2008, precision in this range had improved, but had not completely resolved and MSC was continuing to monitor the precision of sample in the low gold and silver range (Hochschild Mining, 2008b).
There were no reports generated for the production QA/QC data and SRK was unable to open all of the spreadsheets. Of the spreadsheets that SRK was able to review, the standards were within 2σ and in January 2008 there were no blank failures. There was no data on blanks for July or August 2008.
11.4
Interpretation
SRK was not informed if any analytical techniques changed when MSC started using the mine laboratory as the primary lab. The analytical techniques used previously are appropriate for the deposit.
SRK observed that the standards in general appeared to be performing high for both gold and silver. This should be monitored over time to determine if this is instrument drift or whether the standards need to be changed. SRK saw no certificates for the site specific standards in use. The QA/QC spreadsheets referenced the Rocklabs CRMs and SRK was unsure whether this was a spreadsheet template and the Rocklabs CRM had not been deleted, or this was the actual CRM. SRK suspected the former since the values in the spreadsheet for the standard in use did not match those for the Rocklabs CRMs listed.
The data was presented on a monthly basis, which is appropriate for monitoring a QA/QC program. It is recommended all of the data be placed into one spreadsheet and analyzed overtime to recongnize potential drift in the analytical results.
The QA/QC program in place appears to be industry best practice. Response to sample failures and analytical variances was appropriate during the June to August 2008 drilling program, QA/QC samples were monitored during the program and failures were re-analyzed to determine why the failure occurred.
It was not clear whether the production samples were from mining advance or channel samples. If the data was from mining advance and was being monitored on an ongoing basis, more data would be available and that QA/QC would be monitored over time periods greater than one month. Not all of the spreadsheets could be opened for review and there were no independent reports for this data. The three-month review showed no standard or blank failures.
Sampling of the surface and underground samples were/are conducted by employees of MAI and MSC as is the common procedure for exploration and mining companies. Once the samples were shipped to the sample preparation laboratory, they were not handled by employees, officers or directors of MAI or MSC, with the following exceptions:
·
Degerstrom completed sample and analytical work for MAI and at the time Degerstrom held an interest through shares in MAI; and
| |
SRK Consulting (U.S.), Inc. | May 29, 2009 |
Exhibit 99.1
| |
Minera Andes Inc. | 11-12 |
San José Silver-Gold Project | NI 43-101 Technical Report |
·
The San José laboratory is operated by MSC and samples are prepped and analyzed at that facility.
Laboratory Certification
·
ALS Chemex Mendoza – no certification;
·
ALS Chemex La Serena – El Instituto Nacional de Normalización – Laboratorio de Ensayo NCH-ISO 17025.0F2005;
·
Alex Stewart Mendoza – no certification;
·
Degerstrom – no certification; and
·
San José laboratory – no certificate.
ALS Chemex and Alex Stewart are international laboratories commonly used by exploration and mining companies. Both companies have QA/QC programs which meet industry standards. The Degerstrom lab used by MAI (1998-2000) was a small laboratory operated by Degerstrom and SRK does not know if or what type of QA/QC protocols were used. The samples analyzed by Degerstrom represent a very small portion of the total database.
| |
SRK Consulting (U.S.), Inc. | May 29, 2009 |
Exhibit 99.1
| |
Minera Andes Inc. | 11-13 |
San José Silver-Gold Project | NI 43-101 Technical Report |
Figure 11-1: Silver in Coarse Blank Samples, Underground Sampling
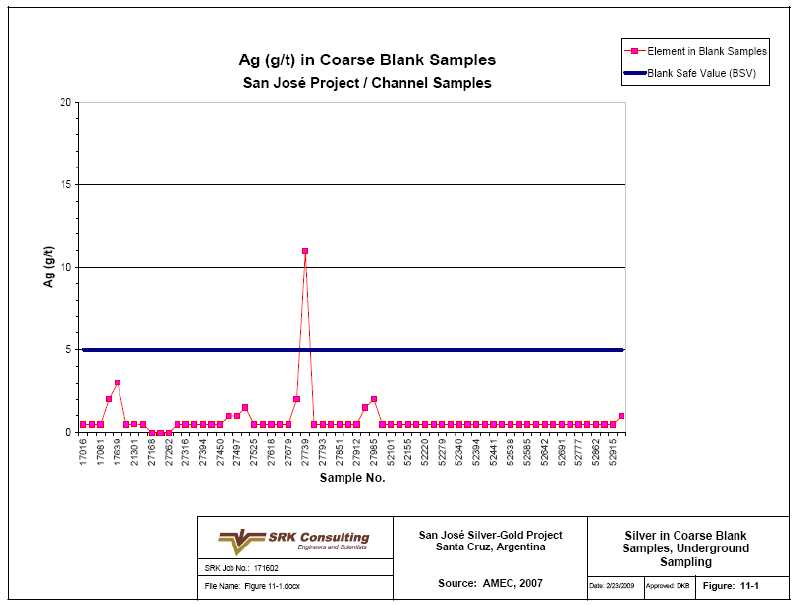
| |
SRK Consulting (U.S.), Inc. | May 29, 2009 |
Exhibit 99.1
| |
Minera Andes Inc. | 12-1 |
San José Silver-Gold Project | NI 43-101 Technical Report |
12
Data Verification(Item 16)
12.1
Verification
SRK personnel conducted a site visit to the Project at which time the following verification checks were conducted:
·
Visits to core storage and logging facility with examination of trenches, outcrops, and drill pads;
·
Examination of drill core and logging and sampling procedures;
·
Comparison of lithologic logs to database;
·
Comparison of assay certificates to 10% of the database, with no errors detected;
·
Review of cross-sections and geologic model; and
·
Review and analysis of laboratory QA/QC procedures and results.
SRK did not identify any errors in the database and found the drilling and logging procedures to meet industry standards.
12.2
Limitations
SRK did not independently collect and analyze samples from the San José property.
| |
SRK Consulting (U.S.), Inc. | May 29, 2009 |
Exhibit 99.1
| |
Minera Andes Inc. | 13-1 |
San José Silver-Gold Project | NI 43-101 Technical Report |
13
Adjacent Properties(Item 17)
There are mineral rights with operating mines adjacent to San Jose.
| |
SRK Consulting (U.S.), Inc. | May 29, 2009 |
Exhibit 99.1
| |
Minera Andes Inc. | 14-1 |
San José Silver-Gold Project | NI 43-101 Technical Report |
14
Mineral Processing and Metallurgical Testing(Item 18)
14.1
Ore and Mineralogy Description
Gold and silver mineralization in the Huevos Verdes and Frea ore zones are characterized as LS epithermal quartz veins, breccias and stock work systems. The highest-grade vein portions consist of banded and mottled “ginguro” quartz. Mineralization has been described as fine-grained argentite, acanthite, pyrite with some pyrargyrite and native Ag. Veinlets of pure sulfides associated with clay are found in some ore zones.
A complete mineralogical study was done on a master composite selected by AMEC. The master composite was prepared to complete flow sheet definition studies and was representative of the expected mill feed. The sample was subjected to X-Ray diffraction (XRD) to determine the bulk mineralogy and subjected to a microscopic study to determine mineralization.
The XRD examination indicated that quartz is the major crystalline mineral present, followed by altered feldspars. Sericite/muscovite, chlorite and clay minerals were present in minor amounts.
The sample for the microscope studies was prepared by subjecting the ground sample to a heavy liquid separation, followed by super-panning of the heavy liquid sinks. The heavy liquid floats; the super-panning concentrate and tails were examined under the microscope.
Pyrite was identified as the most abundant sulfide mineral followed by galena, sphalerite, argentite, chalcopyrite, covellite, bornite and arsenopyrite. Electrum and kustelite were identified as about 2% of the super-panning concentrate. The samples were scanned with the ADIS system for Au and Ag.
14.1.1
Gold
The majority of Au particles consisted of electrum and kustelite. Au grains range from 4µm to 113µm in size with half of the particles being 10-20µm in size. The other half is represented by grains in the range of 80-113µm. Au occurs as:
·
86% as free particles;
·
12% in association with argentite, mainly in rimming of the electrum; and
·
2% as minute inclusions in galena and pyrite.
14.1.2
Silver
The majority of the Ag mineralization is argentite. SEM microprobes revealed trace amounts of Ag chloride particles. The argentite grains range from 4 to 177µm in size with the majority being in the 10-40µm size. The Ag occurs as:
·
76% of the argentite as liberated particles;
·
13% attachments to gangue; and
·
9% as inclusions in pyrite, bornite, galena and sphalerite.
A complete substitution exists between Au and Ag. Beyond 20% Au the mineral is referred to as electrum. Below 20% of the mineral is referred to as kusterlite. Acanthite and argentite are identical in composition, Ag2S. The distinction is made on the basis of crystal structure (Dana 8th Edition). Acanthite is more responsive to cyanide dissolution although both are amenable. Argentite is more responsive to flotation because of its defined structure.
| |
SRK Consulting (U.S.), Inc. | May 29, 2009 |
Exhibit 99.1
| |
Minera Andes Inc. | 14-2 |
San José Silver-Gold Project | NI 43-101 Technical Report |
14.2
Metallurgical Test Programs
There have been seven bench-scale metallurgical test programs conducted on San José samples between 1998 and 2007 in laboratories in Canada, Peru and the U.S. In these test programs, various metallurgical variables were examined to determine the optimum design parameters for the processing plant design including:
·
Gravity separation;
·
Flotation (rougher and cleaner ‘lock cycle’);
·
Cyanidation of whole ore and concentrates;
·
Grinding size for liberation;
·
Crushing work index;
·
Ball mill index;
·
Concentrate settling rates;
·
Concentrate leaching using Gekko process;
·
Abrasion index; and
·
Cyanide destruction.
Metallurgical test programs were conducted on samples from the following four San José project areas:
·
HVS;
·
HVN;
·
Frea; and
·
Kospi.
The work programs for the individual metallurgical tests are described below.
14.2.1
Degerstrom – U.S. (1998-1999)
Degerstrom sampled and initially performed scoping-level tests on ores from the Cerro Saavedro pipe, a structure near the Huevos Verdes vein. Degerstrom later tested ores from the Huevos Verdes veins. The sample was from RC chips, reported being mostly from oxide ores. These tests were also scoping in nature. The tests included gravity, flotation and cyanidation. The results are not considered relevant as the samples were not representative of Huevos Verdes.
14.2.2
Tecsup - Peru (2002)
Tecsup thoroughly tested a sample from diamond drill cores from the Huevos Verdes vein. The cores samples were taken from a wide range of depths and strikes on the structure. The samples had good coverage of the reserve at the time, but still contained a higher percentage of oxide ores. Tecsup work included gravity/flotation/cyanidation of concentrates and gravity/cyanidation of gravity tails.
| |
SRK Consulting (U.S.), Inc. | May 29, 2009 |
Exhibit 99.1
| |
Minera Andes Inc. | 14-3 |
San José Silver-Gold Project | NI 43-101 Technical Report |
14.2.3
Plenge (2004)
Underground chip and rock samples were collected from the Huevos Verdes structures and composited into five rock types for testing at Plenge. The samples were spatially located in the North and South Huevos Verdes structures. Ore grades were higher than the Tecsup 2002 test work and contained little or no oxides.
Plenge conducted scoping metallurgical tests on the five types of underground chip and rock samples. Plenge conducted gravity, flotation with cyanidation of concentrates and whole ore cyanidation.
14.2.4
Lakefield/SGS - Canada (2004-2005)
Duplicate samples from the Plenge 2004 program were sent to SGS for the initial flow sheet development program. SGS prepared a master composite for Huevos Verdes, based on the Plenge samples with additions from the ongoing sampling program at the mine. The Master Composite was utilized for mineralogical studies and environmental testing. A series of mapping a variability samples were selected from the Huevos Verdes and Frea veins and tested against the flow sheets developed. A series of 46 composites based over 100 individual rock or chip samples. The Lakefield/SGS tests consisted of approximately 150 individual tests.
Comminution testing was performed on selected intervals for Frea and Huevos Verdes veins. Specific gravity tests were conducted on the Master Composite intervals.
SRK considers the sampling program in its entirety to be well done and representative of the Huevos Verdes orebody. The Frea reserve was expanded during the metallurgical test program and may be underrepresented in the new reserves. However, the new reserves were continuations of the tested ores.
The definitive test work for the process plant design was done at Lakefield/SGS. The program began with a flow sheet development on the Master Composite. The initial flow sheet was gravity followed by flotation and cyanidation of the flotation concentrate. Ultimately gravity separation was replaced by flash flotation in the flow sheet. Whole ore cyanidation was only briefly examined in the initial test work.
The Lakefield/SGS testing included Comminution Bond Ball and Rod Mill indices, abrasion index and a crushing index. Settling and filtration tests were conducted on representative samples. The specific gravity of the Huevos Verdes and Frea ore was determined to be 2.60.
Additional flow sheet development was done on variability samples of Frea and the North arm of Huevos Verdes. The flow sheets were then tested by a series of variability samples. Forty-six variability samples were selected from over 100 individual samples. The variability then was tested on one or both of the flow sheets. Not all of the variability samples were utilized. In total, 17 samples of the primary ores from Huevos Verdes and 6 samples from Frea were tested in the variability studies.
Cyanidation testing of flotation (including reground flash flotation) was done on 33 samples. Whole ore cyanidation testing was done on 15 samples. The cyanide leach solution from all of the tests was subjected to 33 element ICP scans. The ICP scans show very low levels of arsenic, antimony and copper (except Type 4 Huevos Verdes) in the solutions. The relatively high cyanide consumption in the whole ore dissolutions remains something of a mystery. Additional locked cycle flotation cleaner tests were done on select samples.
| |
SRK Consulting (U.S.), Inc. | May 29, 2009 |
Exhibit 99.1
| |
Minera Andes Inc. | 14-4 |
San José Silver-Gold Project | NI 43-101 Technical Report |
Comminution testing was performed on selected intervals for Frea and Huevos Verdes veins. Specific gravity tests were conducted on the Master Composite intervals.
14.2.5
Gekko - Australia (2006-2007)
In 2006 after the issuance of a Feasibility Study, MSC decided to examine the potential of using the Gekko process for the treatment of plant concentrates to produce a doré. Samples from San José were sent to the Gekko test facilities in Australia for testing. SRK’s review of these tests indicates that they are considered pre-feasibility level and not of sufficient detail for a Feasibility Level, as the test work was conducted on a single bulk sample that SRK does not consider representative because its sulfur analysis of 2.94% is about 50% higher than the average of the mine reserve. However, MSC made the decision to incorporate the Gekko process into the process plant flow sheet being comprised of crushing, grinding and a continuous Gekko process based on gravity/flotation (GF) concentration, Intensive Leach Reactor (ILR), leaching of the gravity and flotation concentrates and direc t electrowinning (EW) recovery of leach solution. Leach tailings are washed in a thickener wash circuit and a Gekko ion-exchange and a resin column scavenges the Au and Ag from the overflow wash solution. Wash thickener underflow will be detoxified by SO2-Air cyanide destruction. This flow sheet is based on a primary P80 grind size of 110μm.
Previous test work indicated that samples of higher sulfide content at San José will be expected to exhibit much better flotation metallurgy and recoveries than the average ore expected. The work consisted of three batch gravity-flotation tests at 75, 212 and 500μm grind sizes followed by batch concentrate intensive cyanidation tests. A single flotation-only test was done at a grind size of 75μm for comparative purposes. Impact crushing, abrasion and Bond ball mill work index tests were also conducted. In April and May 2006, MSC sent additional samples to Gekko for test work. The scope of the program included a more detailed assessment of recovery variability on a wider range of samples using the Gekko GFIL flow sheet, as well as direct EW and ion-exchange resin test work. This test work was conducted entirely at a primary grind size of 110µm. Twelve composite s amples were tested in this program being comprised of nine samples, three from each of Frea (2a), HVN (2b) and HVS (2c).
Twelve batch rougher/cleaner gravity tests, twelve combined batch gravity-rougher flotation tests, 25 batch rougher flotation optimization tests and 14 batch intensive leach tests at fixed conditions were conducted during this program and included ten batch direct EW tests.
14.2.6
Tecsup - Peru (2007)
In 2007, two composite samples from the Kospi vein were tested at the Tecsup laboratory in Peru for initial metallurgical amenability testing based on the proposed San José design parameters and flow sheet excluding the Gekko flow sheet. The two composite samples, labeled as C1 and C2, were designated as low grade and high grade, respectively. A third composite sample, termed C3, was created for testing by combining C1 and C2 in proportions to achieve the expected mine average grade for Kospi. The test program was comprised of single batch gravity table test, gravity centrifugal concentration of the table tails and a series of three flotation tests on the final gravity tailings. The test work was conducted at a grind size of P80 of about 53µm.
The second batch of samples were tested by Tecsup consisting of 120 kg of samples representing 112 individual core intervals from 31 holes. Similar to the previous composites, two composite samples, labeled as C1A and C2A, described respectively as low grade and high grade, and a third composite sample, C3A, was created by combining C1A and C2A in proportions to achieve the expected mine average grade. The metallurgical testing for the second batch of samples using intensive cyanide leaching of the concentrates between 2 and 24 hours. The test program consisted of two batch gravity table tests at a coarse grind of 100% minus 2.3 mm, gravity centrifugal concentration of the table tails at P80 grind sizes of 150 and 75μm, respectively, and a series of six rougher and cleaner flotation tests. A total of four intensive leach tests were conducted on both gravity table and gravity ce ntrigugal-flotation concentrates at grind sizes of 150 and 75μm respectively. A single additional cleaner flotation test was also conducted on bulk rougher-scavenger concentrate at 75μm to assess cleaner kinetics.
| |
SRK Consulting (U.S.), Inc. | May 29, 2009 |
Exhibit 99.1
| |
Minera Andes Inc. | 14-5 |
San José Silver-Gold Project | NI 43-101 Technical Report |
14.3
Metallurgical Test Results
14.3.1
Degerstrom – U.S. (1998-1999)
The test results from the Degerstrom program were not considered relevant as the samples were not representative of Huevos Verdes and were not used in the process plant design.
14.3.2
Tecsup - Peru (2002)
The Tecsup test work yielded gravity concentration recoveries of 41% Au and 19.2% Ag. Rougher flotation of gravity tails yielded overall recoveries of 90.2% Au and 91% Ag. Cyanidation of flotation concentrates yielded 96% Ag and 92% Ag recoveries for overall recoveries of 87% Au and 84% Ag. Cyanidation of gravity tailings yielded overall recoveries of 90% Au and 87% Ag. As the samples for the Tecsup work were only for the Huevos Verdes vein and contained high amounts of oxides, this test work was not considered as being representative for process plant design.
14.3.3
Plenge (2004)
Despite the high grade Huevos Verdes composite for the Plenge test program, gravity recoveries were low at only 8 to 19% for Au and 2% for Ag. Flotation produced recoveries of 92 to 95 Au and 93 to 96% Ag. Cyanidation of flotation concentrates produced recoveries of 87 to 92% Au and 83 to 91% Ag. Whole ore leaches yielded an average of 95.8% Au and 91.2% Ag. Similar to the Tecsup 2002 program, the Plenge test work was not considered as being representative for process plant design.
14.3.4
Lakefield/SGS - Canada (2004-2005)
From the Lakefield/SGS test work, a number of parameters were established which served as the basis for the AMEC 2005 Feasibility Study including:
·
A grind of p80 74µm is required for efficient flotation or cyanidation;
·
Cyanidation of flotation concentrates requires a minimum of 4g/L NaCN solution and excess oxygen for efficient dissolution;
·
Whole ore cyanidation requires 120 hours of dissolution time for maximum Ag recoveries;
·
Flotation is less effective in samples with less than 1% sulfide content;
·
Lead nitrate has little effect on the Ag leaching either in whole or concentrate leaching;
| |
SRK Consulting (U.S.), Inc. | May 29, 2009 |
Exhibit 99.1
| |
Minera Andes Inc. | 14-6 |
San José Silver-Gold Project | NI 43-101 Technical Report |
·
In direct comparison tests on two composites, flash flotation and flotation versus gravity concentration and flotation gave equivalent recoveries;
·
Au and Ag recoveries in flotation tests indicated that ore type is more dependent on rock type and mineralization than head grade;
·
Whole ore cyanidation versus flotation and cyanidation on the Frea and Huevos Verdes North and South composites gave the results shown in Table 14.3.4.1;
·
Variability testing on the flotation options gave recoveries ranging from 83% to 98% for Au and 80.9% to 97% for Ag. Variability testing on the whole ore cyanidation yielded recoveries ranging from 89.7 to 98.1% for Au and 80.6% to 97.5% for Ag. The whole ore tests did not include a gravity separation step;
·
Cyanidation of flotation concentrates gave Au recoveries ranging from 91.3% to 95.9% Au and 82.8% to 93.7% Ag;
·
Cyanide consumptions in concentrate leaching ranged from 3kg. to 30kg. per ton NaCN (equivalent to an average 1.7kg/t ore). Cyanide consumptions in whole ore cyanidation ranged from 1.4-6.0kg/t NaCN and averaged 2.8kg/t; and
·
Static thickening tests showed that flotation tailings and concentrates exhibited rapid settling rates and good underflow densities.
Table 14.3.4.1: Metallurgical Results from Test Work
| | | | |
| Au Recoveries (%) | Ag Recoveries (%) |
| Whole Ore | Flotation- | Whole Ore | Flotation- |
Ore Zone | Cyanidation | Cyanidation | Cyanidation | Cyanidation |
Frea | 96.8 | 92.7 | 94.0 | 90.9 |
Huevos Verde South | 93.8 | 87.9 | 89.7 | 88.0 |
Huevos Verde North | 95.0 | 82.9 | 92.8 | 86.1 |
14.3.5
Gekko - Australia (2006-2007)
Table 14.3.5.1 summarizes the test results from the Gekko test program. This table includes the test results of the amenability test work on a bulk sample at a grind of 74μm for comparison purposes as well as results (2a-2d) in the subsequent March 2007 test work. The primary grind size in all cases was 110µm. The test results from the Gekko test work indicates a slightly lower recovery than the initial amenability testing.
Table 14.3.5.1: Summary Results of Gekko Test Program
| | | | | | | | | | | | |
| Head Assay | Grind Size | Gravity Recovery (%) | Flotation Recovery (%) | Gravity+ Flotation (%) | Leach
48-hr (%) |
Sample | Au (g/t) | Ag (g/t) | S (%) | P80 (µm) | Au | Ag | Au | Ag | Au | Ag | Au | Ag |
1 Bulk Sample | 9.05 | 587 | 2.94 | 74 | 65.8 | 35.9 | 85.9 | 97.7 | 95.2 | 96.6 | 97.0 | 97.8 |
2a Frea | 7.62 | 422 | 1.14 | 110 | 61.0 | 42.2 | 75.1 | 88.3 | 90.3 | 93.3 | 94.7 | 96.3 |
2b HVN | 11.50 | 637 | 1.15 | 110 | 68.5 | 27.9 | 73.5 | 83.9 | 91.0 | 88.0 | 94.6 | 96.5 |
2c HVS | 9.10 | 905 | 1.10 | 110 | 33.9 | 16.0 | 71.4 | 83.3 | 80.7 | 85.9 | 95.6 | 96.9 |
2d Composite | 9.22 | 689 | 1.20 | 110 | 50.8 | 32.2 | 69.3 | 87.6 | 84.9 | 91.6 | 97.3 | 98.2 |
Gekko Estimate (1) | 9.36 | 683 | 1.15 | 110 | 53.0 | 29.6 | 72.3 | 85.8 | 86.7 | 89.7 | 95.6 | 97.0 |
(1) Average of 2a to 2d
| |
SRK Consulting (U.S.), Inc. | May 29, 2009 |
Exhibit 99.1
| |
Minera Andes Inc. | 14-7 |
San José Silver-Gold Project | NI 43-101 Technical Report |
The Gekko test work indicates that an overall recovery of about 83% for Au and 87% for Ag was achievable using a Gekko flow sheet versus 90% for Au and 89% for Ag in the AMEC Feasibility Study at the design primary grind of P80 75µm. The lower recoveries appear to be the result of lower gravity results. The concentrate leach test work averaged a 95.6% recovery for Au and 97.0% of the Ag as summarized in Table 14.3.5.2.
Table 14.3.5.2: Concentrate Leach Test Results for Gekko
| | | | | | | | |
Grind Size | Gravity (%) | Flotation (%) | Leach (%) | Total (%) |
(µm) | Au | Ag | Au | Au | Ag | Au | Au | Ag |
75 | 65.8 | 35.9 | 95.2 | 98.5 | 97.0 | 97.8 | 92.3 | 96.3 |
212 | 70.4 | 43.9 | 96.5 | 95.6 | 95.3 | 96.4 | 91.9 | 92.2 |
500 | 49.3 | 27.0 | 87.9 | 87.8 | 91.9 | 94.5 | 80.8 | 83.0 |
SRK is of the opinion that the lower recoveries are due to the differences in the design parameters from the AMEC Feasibility Study and the subsequent Gekko test work. Figure 14-1 shows the average Gekko batch leach test for extraction versus time.
14.3.6
Tecsup - Peru (2007)
The test results from the Tecsup 2007 program indicate that high Au and Ag recoveries can be achieved for Kospi ores on the order of 96.5% and 94.9%, respectively, for a gravity and flotation flow sheet as summarized in Table 14.3.6.1.
Table 14.3.6.1: Test Results for Initial Metallurgical Amenability
| | | | | |
| | Assays | Distribution (%) |
Product | Weight (%) | Au (g/t) | Ag (g/t) | Au | Ag |
Feed Sample | 100.0 | 6.22 | 515.00 | 100.00 | 100.00 |
Gravity Concentrate | 6.7 | 43.11 | 2,588.57 | 46.18 | 33.49 |
Flotation+Falcon Concentrate | 12.5 | 25.08 | 2.534.28 | 50.27 | 61.36 |
Gravity+Flotation+Falcon Concentrate | 19.1 | 31.36 | 2,553.19 | 96.45 | 94.85 |
Flotation Tailings | 80.9 | 0.27 | 32.77 | 3.55 | 5.15 |
The test results indicate that high Au and Ag recoveries can be achieved on the order of 95% and 93%, respectively, for a gravity concentrate and 93% and 87%, respectively, for gravity and flotation concentrates using intensive cyanide leaching at a 24-hour leach time as summarized in Table 14.3.6.2.
Table 14.3.6.2: Test Results for Metallurgical Amenability Tests
| | | | | | | | |
Method | Table Gravity Concentrate (Gekko Jig) | Falcon Gravity + Flotation Concentrate |
Test | PC1 | PC2 | PC3 | PC4 |
P80µm | 75 | 150 | 75 | 150 |
Leach Time, Hrs | Au | Ag | Au | Ag | Au | Ag | Au | Ag |
2 | 70.1 | 54.6 | 71.8 | 41.8 | 73.8 | 55.7 | 61.7 | 52.1 |
4 | 82.5 | 69.8 | 80.4 | 55.5 | 79.1 | 60.5 | 59.4 | 55.1 |
6 | 86.9 | 74.6 | 83.5 | 63.6 | 85.1 | 67.0 | 65.3 | 60.3 |
24 | 95.6 | 94.7 | 94.5 | 92.9 | 96.6 | 90.0 | 90.7 | 84.8 |
| |
SRK Consulting (U.S.), Inc. | May 29, 2009 |
Exhibit 99.1
| |
Minera Andes Inc. | 14-8 |
San José Silver-Gold Project | NI 43-101 Technical Report |
It should be noted that there exists a high variability in the Au and Ag recoveries as a function of the grind size and leach time and no work index testing was performed in the Kospi test programs. Analysis of the Kospi core and Tecsup’s composite indicate that is reasonable to expect similar metallurgical characteristics of the Kospi ore to the Frea and Huevos Verdes veins using the current process plant flow sheet. As mining from the Kospi veins occurs in the future, SRK recommends that additional metallurgical variability test work be completed.
At a 75µm particle size, the average gravity-flotation Au and Ag recovery of about 95% and 93%, respectively, at a 24-hour leach time which approximates the test work results for the Huevos Verdes and Frea veins. However, this is at a finer grind than the Gekko design of 110µm as well as a higher concentrate weight between 15-25% versus 12% for Gekko. The results also indicate moderate grind-recovery sensitivity to the Gekko gravity-flotation process in the grind size range 74µm to 150µm for both Au and Ag. The Gekko ILR design is based on a grind size of 110µm and a residence time of about 9 hours. Thus, the plant leach recoveries based on the Tecsup testo work indicates that lower Au and Ag recoveries of about 87% for Au and 73% for are potentially possible.
14.3.7
Summary of Metallurgical Test Results
The test results from the SGS/Lakefield program served as the basis for the AMEC Feasibility Study. A number of design parameters were established during the initial test programs for the process plant design; however, some major changes to the process flow sheet were necessary for the inclusion of the Gekko GFIL and resin-EW processes including:
·
Increasing the grind size from P80 74µm to P80 110µm; and
·
Concentrate leach time of 48 hours.
14.4
Process Circuit Selection
The AMEC October 2005 Feasibility Study selected a processing plant at 750t/d comprised of the following unit processes for the production of a gold-silver doré:
·
Two-stages of crushing;
·
Single-stage ball mill grinding;
·
Flash flotation;
·
Rougher flotation;
·
Flotation concentrate thickening – pre-aeration, filtering;
·
Concentrate leaching;
·
Merrill-Crowe-refining; and
·
Acidification-volatization-recovery (AVR).
In 2006, MSC examined its processing options for San José and determined that the most favorable processing route at this time was to utilize most circuits from the AMEC October 2005 Feasibility Study with the following changes based on the Gekko test work:
·
Elimination of the following circuits;
o
Flash flotation,
| |
SRK Consulting (U.S.), Inc. | May 29, 2009 |
Exhibit 99.1
| |
Minera Andes Inc. | 14-9 |
San José Silver-Gold Project | NI 43-101 Technical Report |
o
Flotation concentrate thickening – pre-aeration, filtering,
o
Concentrate leaching,
o
Merrill-Crowe-refining, and
o
AVR.
·
Additions of the following circuits per Gekko test work include;
o
Gekko in line gravity pressure jigs (rougher and cleaner) and centrifugal concentrator scavenging (Gekko in-line gravity jigs are no longer in service in the San José process plant),
o
Gravity concentrate regrind in an open circuit ball mill (gravity concentrate regrind is no longer in service in the San José process plant),
o
Cleaner flotation,
o
Gekko continuous in ILR intensive concentrate leaching,
o
Counter current decantation (CCD) washing of concentrate leach tailings with barren EW solution,
o
Direct EW of Gekko ILR leach solution,
o
Gekko resin column, resin stripping and strip solution EW, and
o
flotation tailings thickening.
Additionally, the following changes were made to the AMEC Feasibility plant design:
·
Use of a smaller, refurbished ball mill at a coarser primary grind of P80 110µm;
·
Application of SO2-Air cyanide destruction to treat concentrate leach tailings slurry instead of AVR on the MC barren bleed solutions; and
·
Doré bars as the final product.
14.4.1
Metallurgical Basis for Process Circuit Selection
The metallurgical test programs conducted at Lakefield/SGS in 2004-2005 served as the basis for the AMEC Feasibility Study. As previously noted, these programs were conducted on a Master Composite as well as a series of mapping a variability samples were selected from the Huevos Verdes and Frea veins. The tests examined various metallurgical parameters from Comminution through the thickening of flotation concentrates. As a result of MHC’s decision to modify the processing circuits, a new set of metallurgical tests were utilized to determine the processing circuit parameters based on the Gekko test work. The San José ores have been designed as oxides and sulfides based on the sulfur content with less than 1% sulfur as oxides and greater than 1% as sulfides. Over the production life, it was estimated 6.11% of ores are considered oxides from the Huevos Verdes and Frea deposits.
The flotation test work included examination of the following three flotation flow sheets:
·
Flash flotation;
·
Flotation without gravity concentration; and
·
Flotation with gravity concentration.
| |
SRK Consulting (U.S.), Inc. | May 29, 2009 |
Exhibit 99.1
| |
Minera Andes Inc. | 14-10 |
San José Silver-Gold Project | NI 43-101 Technical Report |
The results of these tests indicated that a finer grind gave higher gold and silver recoveries and an P80 74µm grind was determined to be the optimal grind size for flotation. As noted earlier, the primary grind size was increased to a P80 110µm pursuant to the Gekko test work.
As a point of comparison, the actual Au and Ag for year 2008 was 83.3% for Au and 82.4% for Ag as compared to the Gekko estimate of 83% for Au and 87% for Ag. The actual 2008 were both below the budgeted forecast by 2.47% and 3.42% for Au and Ag, respectively. The actual 2008 Au recovery is approximately that in the Gekko forecast; however, the Ag recovery is significantly lower. Table 14.4.1.1 summarizes the actual year results, by month, for the process plant.
| |
SRK Consulting (U.S.), Inc. | May 29, 2009 |
Exhibit 99.1
| |
Minera Andes Inc. | 14-11 |
San José Silver-Gold Project | NI 43-101 Technical Report |
Table 14.4.1.1: Production Results for the San José Process Plant for 2008
| | | | | | | | | | | | | | | | | | | | | | |
| | January | February | March | April | May | June | | | |
Description | Units | Actual | Budget | Variance | Actual | Budget | Variance | Actual | Budget | Variance | Actual | Budget | Variance | Actual | Budget | Variance | Actual | Budget | Variance | | | |
Ore Processed | t | 17,820 | 18,000 | (180) | 19,751 | 21,000 | (1,249) | 22,326 | 22,500 | (174) | 17,090 | 21,750 | (4,660) | 21,368 | 22,500 | (1,132) | 22,145 | 21,750 | 395 | | | |
Ore Grade: | | | | | | | | | | | | | | | | | | | | | | |
Gold | g/t | 6.36 | 7.14 | (0.78) | 7.29 | 6.67 | 0.62 | 7.53 | 6.43 | 1.10 | 7.85 | 8.41 | (0.56) | 7.69 | 8.36 | (0.67) | 7.20 | 8.41 | (1.21) | | | |
Silver | g/t | 539.74 | 538.75 | 0.99 | 655.13 | 519.37 | 135.76 | 664.00 | 504.08 | 159.92 | 712.64 | 533.13 | 179.51 | 669.05 | 531.95 | 137.10 | 667.28 | 533.13 | 134.15 | | | |
Doré Produced | kg | 871 | 5,912 | (5,041) | 6,908 | 6,647 | 261 | 9,014 | 6,911 | 2,103 | 8,334 | 7,087 | 1,247 | 7,998 | 7,315 | 683 | 7,991 | 7,087 | 904 | | | |
Gold | % | 1.03 | 1.45 | (0.42) | 1.22 | 1.41 | (0.19) | 1.16 | 1.40 | (0.24) | 1.09 | 1.72 | (0.63) | 1.15 | 1.72 | (0.57) | 1.04 | 1.72 | (0.68) | | | |
Silver | % | 94.48 | 88.55 | 5.93 | 96.55 | 88.59 | 7.96 | 96.11 | 88.60 | 7.51 | 96.27 | 88.28 | 7.99 | 95.78 | 95.78 | 0.00 | 96.75 | 88.28 | 8.47 | | | |
Ppt EW Produced | kg | 6,969 | 0 | 6,969 | 1,105 | 0 | 1,105 | 0 | 0 | 0 | 0 | 0 | 0 | 0 | 0 | 0 | 1,473 | 0 | 1,473 | | | |
Gold | % | 1.03 | 0 | 1.03 | 0.59 | 0 | 0.59 | 0 | 0 | 0 | 0 | 0 | 0 | 0 | 0 | 0 | 1.01 | 0.0 | 1.01 | | | |
Silver | % | 75.41 | 0 | 75.41 | 43.82 | 0 | 43.82 | 0 | 0 | 0 | 0 | 0 | 0 | 0 | 0 | 0 | 90.00 | 0.0 | 90.00 | | | |
Flotation Conc | t | 190 | 211 | (21) | 225 | 246 | (21) | 294 | 263 | 31 | 190 | 211 | (21) | 190 | 211 | (21) | 428 | 1,053 | (625) | | | |
Gold | g/t | 109.86 | 160.61 | (50.75) | 119.45 | 150.13 | (30.68) | 127.03 | 144.59 | (17.56) | 109.86 | 160.61 | (50.75) | 109.86 | 160.61 | (50.75) | 109.86 | 160.61 | (50.75) | | | |
Silver | g/t | 8,668.0 | 12,121.9 | (3,453.9) | 10,039.26 | 11,685.91 | (1,646.65) | 10,904.70 | 11,341.74 | (437.04) | 10,272.30 | 11,955.00 | (1,682.70) | 10,010.09 | 11,969.00 | (1,958.91) | 10,130.89 | 11,995.00 | (1,864.11) | | | |
Total Production | | | | | | | | | | | | | | | | | | | | | | |
Gold | oz | 3,270.55 | 3,476.17 | (205.62) | 3,793.69 | 3,790.96 | 2.73 | 4,549.12 | 3,911.86 | 637.26 | 3,793.48 | 4,947.00 | (1,153.52) | 4,203.82 | 5,091.72 | (887.90) | 4,265.32 | 4,946.92 | (681.60) | | | |
Silver | oz | 248,387.19 | 262,364.79 | (13,977.60) | 302,531.00 | 295,082.91 | 7,448.09 | 381,415.07 | 306,848.93 | 74,566.14 | 334,709.89 | 313,716.00 | 20,993.89 | 356,945.56 | 323,817.20 | 33,128.36 | 388,742.87 | 313,716.54 | 75,026.33 | | | |
Overall Recovery | | | | | | | | | | | | | | | | | | | | | | |
Gold | % | 89.76 | 84.15 | 5.61 | 81.92 | 84.15 | (2.23) | 84.17 | 84.15 | 0.02 | 87.95 | 84.15 | 3.80 | 79.56 | 84.15 | (4.59) | 83.21 | 84.15 | (0.94) | | | |
Silver | % | 80.36 | 84.15 | (3.79) | 72.72 | 84.15 | (11.43) | 85.48 | 84.15 | 1.33 | 85.48 | 84.15 | 1.33 | 77.66 | 84.15 | (6.49) | 81.83 | 84.15 | (2.32) | | | |
| | July | August | September | October | November | December | Year2008 |
Description | Units | Actual | Budget | Variance | Actual | Budget | Variance | Actual | Budget | Variance | Actual | Budget | Variance | Actual | Budget | Variance | Actual | Budget | Variance | Actual | Budget | Variance |
Ore Processed | t | 22,933 | 22,500 | 433 | 22,374 | 33,750 | (11,376) | 22,282 | 38,250 | (15,968) | 24,244 | 45,000 | (20,756) | 38,002 | 43,500 | (5,498) | 45,628 | 54,000 | (8,372) | 295,963 | 364,500 | (68,537) |
Ore Grade: | | | | | | | | | | | | | | | | | | | | | | |
Gold | g/t | 6.27 | 7.30 | (1.03) | 6.97 | 7.38 | (0.41) | 7.12 | 7.46 | (0.34) | 6.91 | 6.82 | 0.09 | 5.49 | 6.91 | (1.42) | 5.72 | 6.92 | (1.20) | 6.69 | 7.26 | (0.57) |
Silver | g/t | 577.24 | 550.00 | 27.24 | 519.81 | 460.15 | 59.66 | 542.90 | 442.90 | 100.00 | 507.31 | 388.07 | 119.24 | 439.77 | 391.13 | 48.64 | 457.77 | 385.78 | 71.99 | 559.11 | 458.88 | 100.23 |
Doré Produced | kg | 2,064 | 7,226 | (5,162) | 0 | 6,329 | (6,329) | 0 | 5,893 | (5,893) | 453 | 5,346 | (4,893) | 0 | 5,209 | (5,209) | 5,717 | 5,316 | 401 | 49,344 | 76,279 | (26,935) |
Gold | % | 0.96 | 1.72 | (0.76) | 0.00 | 1.75 | (1.75) | 0.00 | 1.84 | (1.84) | 1.17 | 1.92 | (0.75) | 0.00 | 1.93 | (1.93) | 1.34 | 1.96 | (0.62) | 1.15 | 1.38 | (0.23) |
Silver | % | 97.24 | 88.28 | 8.96 | 0.00 | 88.25 | (88.25) | 0.00 | 88.16 | (88.16) | 96.60 | 88.08 | 8.52 | 0.00 | 88.07 | (88.07) | 88.07 | 88.04 | 0.03 | 96.35 | 88.62 | 7.73 |
Ppt EW Produced | kg | 8,539 | 0 | 8,539 | 7,783 | 0 | 7,783 | 7,109 | 0 | 7,109 | 7,421 | 0 | 7,421 | 6,527 | 0 | 6,527 | 2,826 | 0 | 2,826 | 49,482 | 0 | 49,482 |
Gold | % | 0.97 | 0.00 | 0.97 | 1.18 | 0.00 | 1.18 | 1.21 | 0.00 | 1.21 | 1.21 | 0.00 | 1.21 | 1.17 | 0.00 | 1.17 | 1.29 | 0.00 | 1.29 | 1.12 | 0.00 | 1.12 |
Silver | % | 90.40 | 0.00 | 90.40 | 86.45 | 0.00 | 86.45 | 89.52 | 0.00 | 89.52 | 88.36 | 0.00 | 88.36 | 87.54 | 0.00 | 87.54 | 88.48 | 0.00 | 88.48 | 85.71 | 0.00 | 85.71 |
Flotation Conc | t | 248 | 263 | (15) | 285 | 658 | (373) | 311 | 833 | (522) | 428 | 1,053 | (625) | 976 | 1,017 | (41) | 1,138 | 1,368 | (230) | 4,970 | 6,720 | (1,750) |
Gold | g/t | 100.87 | 185.61 | (84.74) | 118.62 | 166.10 | (47.48) | 115.84 | 167.76 | (51.92) | 102.65 | 153.52 | (50.87) | 80.06 | 155.38 | (75.32) | 91.62 | 155.74 | (64.12) | 101.91 | 184.10 | (82.19) |
Silver | g/t | 8,138.53 | 11,825.74 | (3,687.21) | 7,749.18 | 10,353.27 | (2,604.09) | 7,784.85 | 9,965.02 | (2,180.17) | 7,059.27 | 8,731.64 | (1,672.37) | 6,487.22 | 8,800.47 | (2,313.25) | 7,060.95 | 8,679.97 | (1,619.02) | 8,049.05 | 11,181.08 | (3,132.03) |
Total Production | | | | | | | | | | | | | | | | | | | | | | |
Gold | oz | 4,101.56 | 4,443.76 | (342.20) | 4,030.90 | 6,896.72 | (2,865.82) | 3,931.52 | 7,947.32 | (4,015.80) | 4,470.31 | 8,595.46 | (4,125.15) | 4,871.28 | 8,409.83 | (3,538.55) | 6,992.60 | 10,522.38 | (3,529.78) | 52,274.15 | 72,980.09 | (20,705.94) |
Silver | oz | 377,631.42 | 334,803.56 | 42,827.86 | 287,313.36 | 429,895.40 | (142,582.04) | 282,510.32 | 472,067.79 | (189,557.47) | 321,936.38 | 488,884.85 | (166,948.47) | 379,679.13 | 476,322.84 | (96,643.71) | 516,724.05 | 586,459.73 | (69,735.68) | 4,178,526.24 | 4,603,980.54 | (425,454.30) |
Overall Recovery | | | | | | | | | | | | | | | | | | | | | | |
Gold | % | 88.79 | 84.15 | 4.64 | 80.41 | 84.15 | (3.74) | 77.08 | 84.15 | (7.07) | 83.00 | 84.15 | (1.15) | 72.60 | 87.08 | (14.48) | 83.37 | 87.56 | (4.19) | 83.29 | 85.76 | (2.47) |
Silver | % | 88.83 | 84.15 | 4.68 | 76.84 | 84.15 | (7.31) | 72.77 | 84.15 | (11.38) | 81.41 | 84.15 | (2.74) | 70.66 | 87.08 | (16.42) | 76.95 | 87.56 | (10.61) | 82.34 | 85.76 | (3.42) |
| |
SRK Consulting (U.S.), Inc. | May 29, 2009 |
Exhibit 99.1
| |
Minera Andes Inc. | 14-12 |
San José Silver-Gold Project | NI 43-101 Technical Report |
Figure 14-1: Average Gekko Batch Leach Test Results

| |
SRK Consulting (U.S.), Inc. | May 29, 2009 |
Exhibit 99.1
| |
Minera Andes Inc. | 15-1 |
San José Silver-Gold Project | NI 43-101 Technical Report |
15
Mineral Resources and Mineral Reserve Estimates(Item 19)
15.1
Resource Estimation
The mineral resource estimates for the Project were prepared by employees of MSC and MHP the majority owner and operator of MSC. MineSight® software was used for compositing, modeling the vein structures, and grade estimation. SRK received the drillhole and sample database and block model as text files and utilized Vulcan® software to evaluate the resource estimation. The resource estimation procedure is documented in a report by MSC dated June 2008, which was the basis for the following description of procedures and parameters that were employed to estimate the resources.
15.1.1
Database
The samples database contains information for drilling (RC and core), underground channel samples and surface trenches. Channel and trench samples are treated as drill samples in the database, with collars, bearing and inclination, and sample intervals. The database contains the following information:
·
Drillhole, trench, or channel sample name;
·
Collar coordinates;
·
Total length;
·
Survey, with bearing and inclination;
·
Grades – Silver and gold in g/t;
·
Codes for lithology (vein, andesite, breccia) and vein number; and
·
Sample number.
The database for the June 2008 resource for Huevos Verdes, Frea Kospi, Ayelén, and Odin consists of the following:
·
Trench samples – 8 trenches; 88 samples in 95.1m;
·
Drillholes – 593 holes; 17,470 samples in 12,140m; and
·
Channel Samples – 5,389 channels; 17,886 samples in 11,083.97m.
15.1.2
Geology
The assay intervals are coded with a variable “ore” that denotes its presence in a structure. The coding is based on a minimum length of about 0.9m and a silver equivalent value based on US$600/oz gold and US$10.50/oz silver, without consideration to recovery. The silver equivalency (AgEq) is calculated as Ag (g/t) + 57.14 x Au (g/t). The lithology of the “ore” intercepts is predominately coded as vein, but breccias and andesite may also be designated as “ore” if the grade is sufficiently high.
MSC constructed separate geologic models for each of the following structures:
·
HVS, HVC, HVN, and HVR;
| |
SRK Consulting (U.S.), Inc. | May 29, 2009 |
Exhibit 99.1
| |
Minera Andes Inc. | 15-2 |
San José Silver-Gold Project | NI 43-101 Technical Report |
·
Frea;
·
Kospi;
·
Odin; and
·
Ayelén.
The data used to produce the models include drilling, underground channel sampling (Huevos Verdes and Frea), and trenches (Huevos Verde). Figure 15-1 contains a drillhole location map for the San José property.
Vertical cross-sections were constructed perpendicular to the strike of the structures. For HVS, the vertical sections were transposed to horizontal plans. Table 15.1.2.1 lists the number of sections for each vein. Figures 15-2 through 15-4 present cross-sections through HVS, HVN and Kospi, and Frea, Odin and Ayelén, respectively.
Table 15.1.2.1: Summary of Geologic Sections
| | | | | | | | |
Section Orientation | HVS | HVC | HVN | HVR | Frea | Kospi | Ayelén | Odin |
Vertical | 33 | 37 | 122 | 6 | 66 | 70 | 57 | 49 |
Horizontal | 26 | 1 | 2 | 0 | 2 | 0 | 0 | 0 |
Polygons were drawn on each cross-section to outline the mineralization. Wireframe solids were constructed from the polygons for each vein. Areas that have been mined were removed from the wireframe. This practice makes it difficult to conduct mined to model reconciliations as the mined areas do not receive grades during the estimation process. SRK recommends that the wireframes be constructed for the entire vein structure so that a comparison can be made between model grades and mined grades.
Table 15.1.2.2 presents assay statistics by lithology for each area.
Table 15.1.2.2: Statistics of Assays within Mineralized Zone, by Area
| | | | | | | | |
Statistic | HVS | HVC | HVN | HVR | Frea | Kospi | Ayelén | Odin |
Ag | | | | | | | | |
Number of Drill Samples | 95 | 111 | 86 | 28 | 459 | 472 | 122 | 119 |
Number Channel Samples | 4618 | 148 | 1246 | 139 | 4830 | 0 | 0 | 0 |
Minimum | 0.5 | 0.5 | 0.5 | 2 | 0.5 | 0.5 | 1 | 0.5 |
Maximum | 59,959 | 13,636 | 22,653 | 6,564 | 21,865 | 20,999 | 17,642 | 4,152 |
Average | 1,216 | 260 | 432 | 497 | 553 | 712 | 625 | 228 |
Length WeightedAverage | 1,205 | 238 | 406 | 418 | 538 | 629 | 548 | 198 |
Standard Deviation | 3,073 | 998 | 1,403 | 877 | 1,213 | 2,068 | 2,067 | 500 |
Coefficient of Variation | 2.53 | 3.84 | 3.25 | 1.76 | 2.19 | 2.90 | 3.31 | 2.20 |
Au | | | | | | | | |
Number of Drill Samples | 95 | 111 | 86 | 28 | 459 | 472 | 122 | 119 |
Number Channel Samples | 4618 | 148 | 1246 | 139 | 4830 | 0 | 0 | 0 |
Minimum | 0.01 | 0.01 | 0 | 0.01 | 0.01 | 0.01 | 0.01 | 0.01 |
Maximum | 982.15 | 91.99 | 219.29 | 95.11 | 921.85 | 311.58 | 223.67 | 38.57 |
Average | 16.68 | 2.64 | 4.87 | 5.37 | 7.24 | 8.17 | 8.36 | 3.87 |
Length Weighted Average | 16.30 | 2.57 | 4.66 | 4.80 | 6.94 | 7.61 | 7.16 | 3.70 |
Standard Deviation | 42.64 | 7.67 | 13.74 | 13.32 | 23.97 | 22.22 | 30.59 | 6.56 |
Coefficient of Variation | 2.56 | 2.90 | 2.82 | 2.48 | 3.31 | 2.72 | 3.66 | 1.70 |
| |
SRK Consulting (U.S.), Inc. | May 29, 2009 |
Exhibit 99.1
| |
Minera Andes Inc. | 15-3 |
San José Silver-Gold Project | NI 43-101 Technical Report |
15.1.3
Capping
Log-normal probability plots of the raw assays were examined to determine capping limits for gold and silver. Table 15.1.3.1 presents the capping values for gold and silver by area.
Table 15.1.3.1: Gold and Silver Capping Values
| | | | | | | | |
Metal | HVS | HVC | HVN | HVR | Frea | Kospi | Ayelén | Odin |
Ag g/t | 10,000 | 1,000 | 6,000 | 2,000 | 4,000 | 3,800 | 4,800 | 2,000 |
Au g/t | 120 | 10 | 50 | 20 | 50 | 36 | 70 | 20 |
In comparison to the June 2007 resource estimate, the capping values for silver are all higher, while the values for gold are similar or only slightly higher.
MSC applied the capping values to the composites and not to the assays prior to compositing. SRK notes that the usual practice for capping is as follows:
·
Assays intervals of uniform length: create probability plots, select capping value and apply to assays prior to compositing; or
·
Assays of non-uniform length: composite assays into uniform lengths, create probability plots of the composites, select capping value and apply to the composites.
SRK has run checks on the effect of compositing first, then applying the capping value, and finds that the difference is slight.
15.1.4
Compositing
Assays were composited on 2m intervals using only the intercepts defined as “ore”, except Huevos Verdes where the interval length was 1m. Intervals less than one-half the nominal interval length were added to the adjacent interval if there was more than one composite in a drillhole or channel sample. Although the compositing was run on fixed interval lengths, because of the narrow width of the vein, the interval length is not uniform. Table 15.1.4.1 presents statistics of the composite lengths by area.
Table 15.1.4.1: Statistics of Composite Interval Lengths
| | | | | | |
Statistic | Huevos Verde | HVR | Frea | Kospi | Ayelén | Odin |
|
Mean | 0.92 | 0.97 | 1.75 | 1.65 | 1.40 | 1.29 |
Median | 1.00 | 1.00 | 1.90 | 1.98 | 1.26 | 1.17 |
Minimum | 0.17 | 0.35 | 0.30 | 0.30 | 0.30 | 0.30 |
Maximum | 1.50 | 1.50 | 3.00 | 2.97 | 2.95 | 2.80 |
Number | 4,063 | 106 | 1,782 | 175 | 58 | 63 |
The capping value discussed in Section 15.1.3 was applied to the composites after the compositing run. Table 15.1.4.2 presents statistics for the uncapped and capped composites.
| |
SRK Consulting (U.S.), Inc. | May 29, 2009 |
Exhibit 99.1
| |
Minera Andes Inc. | 15-4 |
San José Silver-Gold Project | NI 43-101 Technical Report |
Table 15.1.4.2: Statistics of Uncapped and Capped Composites in Mineralized Zones
| | | | | | | | | | | | |
| Huevos Verdes | Frea | Kospi | HVR | Ayelén | Odin |
Statistic | Ag (g/t) | Au (g/t) | Ag (g/t) | Au (g/t) | Ag (g/t) | Au (g/t) | Ag (g/t) | Au (g/t) | Ag (g/t) | Au (g/t) | Ag (g/t) | Au (g/t) |
Uncapped Composites | | | | | | | | | | | | |
Average | 947 | 12.58 | 533 | 7.00 | 547 | 6.51 | 423 | 5.48 | 435 | 5.57 | 185 | 3.82 |
Length Weighted Average | 981 | 13.06 | 562 | 7.36 | 629 | 7.61 | 418 | 4.80 | 548 | 7.16 | 206 | 4.27 |
Standard Deviation | 2,199 | 28.10 | 874 | 14.51 | 1,010 | 10.49 | 610 | 12.20 | 1,239 | 18.15 | 353 | 6.97 |
Minimum | 0.50 | 0 | 0.84 | 0 | 0.50 | 0 | 2.00 | 0 | 1.00 | 0 | 0.50 | 0 |
Maximum | 27,478 | 593.98 | 13,881 | 347.39 | 6,591 | 74.73 | 2,884 | 75.42 | 9,269 | 135.13 | 2,317 | 44.77 |
Number | 4,063 | 4,063 | 1,782 | 1,782 | 175 | 175 | 106 | 106 | 58 | 58 | 64 | 64 |
Coefficient of Variation | 2.32 | 2.23 | 1.64 | 2.07 | 1.85 | 1.61 | 1.44 | 2.23 | 2.85 | 3.26 | 1.91 | 1.83 |
Capped Composites | | | | | | | | | | | | |
Average | 869 | 11.57 | 507 | 6.43 | 511 | 6.04 | 404 | 3.82 | 358 | 4.45 | 170 | 3.03 |
Length Weighted Average | 899 | 12.16 | 562 | 7.36 | 581 | 6.98 | 400 | 3.70 | 438 | 5.55 | 193 | 3.57 |
Standard Deviation | 1,675 | 20.60 | 681 | 8.60 | 844 | 8.18 | 548 | 5.54 | 702 | 10.32 | 316 | 4.00 |
Minimum | 0.50 | 0 | 0.84 | 0 | 0.50 | 0 | 2.00 | 0 | 1.00 | 0 | 0.50 | 0 |
Maximum | 10,000 | 120.00 | 4,000 | 50.00 | 3,800 | 36.00 | 2,000 | 20.00 | 4,800 | 70.00 | 2,000 | 20.00 |
Number | 4,063 | 4,063 | 1,782 | 1,782 | 175 | 175 | 106 | 106 | 58 | 58 | 64 | 64 |
Coefficient of Variation | 1.93 | 1.05 | 1.34 | 1.14 | 1.65 | 1.16 | 1.36 | 0.97 | 1.96 | 1.25 | 1.86 | 1.18 |
Number of Cut Values | 54 | 52 | 24 | 20 | 5 | 7 | 4 | 7 | 1 | 1 | 1 | 1 |
15.1.5
Specific Gravity
In 2005, MSC conducted a program of density measurements for core samples at Huevos Verdes and Frea. A total of 267 samples from 31 holes at Huevos Verdes and 462 samples from 37 holes at Frea were sent to ALS Chemex for measurement by the water displacement method. The samples were about 10 to 15cm in length and were dried and coated with paraffin. SRK did not receive information on the method for determining the density at Kospi. The results are given in Table 15.1.5.1.
Table 15.1.5.1: Density Measurements, Huevos Verdes, Frea and Kospi
| | |
Area | Average | Number Samples |
Huevos Verdes | | |
Quartz Vein | 2.590 | 160 |
Breccia | 2.600 | 33 |
Average | 2.595 | 193 |
Andesite | 2.580 | 74 |
Frea | | |
Quartz Vein | 2.600 | 231 |
Breccia | 2.640 | 57 |
Average | 2.611 | 288 |
Andesite | 2.650 | 174 |
Kospi | | |
Quartz Vein | 2.620 | 92 |
Breccia | 2.655 | 5 |
Average | 2.621 | 97 |
Andesite | 2.614 | 72 |
Weight averaged density values for the quartz vein and breccias in the mineralized structure were used in the resource estimation. In addition, Ayelén and Odin were assigned the same density value as Frea and HVR was assigned the same value as Huevos Verdes. SRK recommends that density measurements be taken for Ayelén, Odin, and HVR.
| |
SRK Consulting (U.S.), Inc. | May 29, 2009 |
Exhibit 99.1
| |
Minera Andes Inc. | 15-5 |
San José Silver-Gold Project | NI 43-101 Technical Report |
15.1.6
Variogram Analysis and Modeling
MSC conducted variogram analysis of the composites at Huevos Verdes, Frea and Kospi.
Table 15.1.6.1: Relative Variogram Parameters
| | | |
Parameter | Zone |
Huevos Verdes | Frea | Kospi |
Ag | | | |
Nugget | 1.7 | 0.65 | 0.4 |
Model Type 1 | Spherical | Spherical | Spherical |
Sill Structure 1 | 0.5 | 0.2 | 0.2 |
X-Range 1 (m) | 33 | 57 | 75 |
Y-Range 1 (m) | 5 | 21 | 75 |
Rotation Convention 1 | MineSight | MineSight | MineSight |
First Rotation 1 (°) | 50 | 127 | 130 |
Second Rotation 1 (°) | -65 | 0 | 0 |
Third Rotation 1 (°) | 0 | 51 | -65 |
Model Type 2 | Spherical | Spherical | NA |
Sill Structure 2 | 1.603 | 0.642 | NA |
X-Range 2 (m) | 145 | 85 | NA |
Y-Range 2 (m) | 53 | 70 | NA |
Rotation Convention 2 | MineSight | MineSight | NA |
First Rotation 2 (°) | 50 | 127 | NA |
Second Rotation 2 (°) | -65 | 0 | NA |
Third Rotation 2 (°) | 0 | 51 | NA |
Au | | | |
Nugget-Effect | 1.2 | 0.2 | 0.4 |
Model Type 1 | Spherical | Spherical | Spherical |
Sill Structure 1 | 1.1 | 0.85 | 0.37 |
X-Range 1 (m) | 84 | 40 | 105 |
Y-Range 1 (m) | 20 | 55 | 80 |
Rotation Convention 1 | MineSight | MineSight | MineSight |
First Rotation 1 (°) | 50 | 127 | 130 |
Second Rotation 1 (°) | -65 | 0 | 0 |
Third Rotation 1 (°) | 0 | 51 | -65 |
Model Type 2 | Spherical | Spherical | Spherical |
Sill Structure 2 | 0.891 | 0.917 | 0.23 |
X-Range 2 (m) | 130 | 165 | 23 |
Y-Range 2 (m) | 58 | 77 | 50 |
Rotation Convention 2 | MineSight | MineSight | MineSight |
First Rotation 2 (°) | 50 | 127 | 130 |
Second Rotation 2 (°) | -65 | 0 | 0 |
Third Rotation 2 (°) | 0 | 51 | -65 |
15.1.7
Grade Estimation
Six block models were created, one for each of the resource areas. The block models were oriented parallel to the strike of the mineralized zone with cell size of 10m x 10m x 10m. The origin, orientation, and block dimension are presented in Table 15.1.7.1.
| |
SRK Consulting (U.S.), Inc. | May 29, 2009 |
Exhibit 99.1
| |
Minera Andes Inc. | 15-6 |
San José Silver-Gold Project | NI 43-101 Technical Report |
Table 15.1.7.1: Block Model Definition
| | | | | | | |
| Easting | Northing | Elevation | Orientation |
Zone | Origin | Length (m) | Origin | Length (m) | Origin | Length (m) | Azimuth |
Huevos Verdes | 2,400,906.25 | 400 | 4,829,936 | 2,150 | 250 | 330 | 325 |
HVR | 2,400,506 | 400 | 4,830,416 | 330 | 225 | 375 | 095 |
Frea | 2,401,504 | 500 | 4,831,841.5 | 1,300 | 220 | 330 | 315 |
Kospi | 2,399,505 | 1,400 | 4,832,218 | 250 | 250 | 350 | 125 |
Ayelén | 2,400,368 | 2,000 | 4,831,885 | 1,100 | 250 | 350 | 110 |
Odin | 2,401,063 | 1,850 | 4,831,731 | 650 | 200 | 400 | 109 |
The block model contains variables for percent of block within the structure, thickness of the vein, diluted vein thickness, Ag, Au, number of composites used in estimation, distance to the nearest composite, and number of drillholes used in estimation.
The block grades at Huevos Verdes, Frea and Kospi were estimated with Ordinary Kriging (OK) within the vein structures and using composites which had been designated as “ore” as described in Section 15.1.2. The block grades of HVR, Ayelén and Odin were estimated with the Inverse Distance Squared (ID2) algorithm. Table 15.1.7.2 presents the parameters that were used in the estimation.
Table 15.1.7.2: Estimation Parameters by Area
| | | | | | | | |
Estimation Parameter | HVS | HVC | HVN | Frea | Kospi | HVR | Ayelén | Odin |
Au | | | | | | | | |
Method of Estimation | OK | OK | OK | OK | OK | ID2 | ID2 | ID2 |
Minimum Composites | 1 | 1 | 1 | 1 | 1 | 1 | 1 | 1 |
Maximum Composites | 8 | 8 | 8 | 8 | 4 | 8 | 8 | 8 |
Length Major Axis | 60 | 35 | 60 | 55 | 90 | 60 | 55 | 60 |
Length Semi Major Axis | 55 | 40 | 55 | 45 | 60 | 55 | 45 | 55 |
Direction of Major Axis | 50 | 50 | 50 | 127 | 130 | 100 | 110 | 110 |
Plunge of the greater Axis | -65 | -65 | -65 | 0 | 0 | 0 | 0 | 0 |
Dip of the smaller Axis | 0 | 0 | 0 | 51 | -65 | 55 | -65 | -67 |
Search | Quadrant | Quadrant | Quadrant | Quadrant | Quadrant | Quadrant | Quadrant | Quadrant |
Maximum Samples/Quadrant | 2 | 2 | 2 | 1 | 1 | 2 | 2 | 2 |
Ag | | | | | | | | |
Method of Estimation | OK | OK | OK | OK | OK | ID2 | ID2 | ID2 |
Minimum Composites | 1 | 1 | 1 | 1 | 1 | 1 | 1 | 1 |
Maximum Composites | 8 | 8 | 8 | 8 | 4 | 8 | 8 | 8 |
Length Major Axis | 60 | 35 | 60 | 55 | 90 | 60 | 55 | 60 |
Length Semi Major Axis | 55 | 40 | 55 | 45 | 60 | 55 | 45 | 55 |
Direction of Major Axis | 50 | 50 | 50 | 127 | 130 | 100 | 110 | 110 |
Plunge of the greater Axis | -65 | -65 | -65 | 0 | 0 | 0 | 0 | 0 |
Dip of the smaller Axis | 0 | 0 | 0 | 51 | -65 | 55 | -65 | -67 |
Search | Quadrant | Quadrant | Quadrant | Quadrant | Quadrant | Quadrant | Quadrant | Quadrant |
Maximum Samples/Quadrant | 2 | 2 | 2 | 1 | 1 | 2 | 2 | 2 |
Figures 15-5 through 15-7 are cross-sections showing drillholes and block grades through HVS, HVN and Kospi, and Frea, Odin and Ayelén, respectively. Figures 15-8 through 15-12 are long sections through Huevos Verdes, Kospi, Frea, Odin and Ayelén, respectively.
| |
SRK Consulting (U.S.), Inc. | May 29, 2009 |
Exhibit 99.1
| |
Minera Andes Inc. | 15-7 |
San José Silver-Gold Project | NI 43-101 Technical Report |
15.1.8
Model Validation
SRK validated the block models for Huevos Verdes, Frea, Kospi, Ayelén, and Odin by the following methods:
·
Comparison of assay, composite and block grades;
·
Visual comparison of composite and block grades by cross-section; and
·
Comparison of kriged and nearest neighbor estimation grades.
SRK examined cross-sections of each vein looking at the following variables:
·
Au grades – block and composite;
·
Ag grades – block and composite; and
·
Percentage within vein – compared to vein wireframe.
The block grades looked reasonable compared to the composite grades. The areas with underground channel samples have a much closer sample spacing than areas with only drillhole samples. Because of the dense sampling the channel samples provide most of the data within the search ellipsoid.
Table 15.1.8.1 provides a comparison of kriged gold and silver grades to grades estimated by a nearest neighbor estimation. The results suggest that there is no bias in the grade estimation.
Table 15.1.8.1: Comparison of Kriged and Nearest Neighbor Block Grades
| | | | | | |
Vein | Gold (g/t) | Silver (g/t) |
Kriged | NN | Difference % | Kriged | NN | Difference % |
HVS | 6.26 | 6.02 | 4% | 435 | 404 | 7% |
HVC | 1.75 | 1.70 | 3% | 153 | 158 | -3% |
HVN | 3.52 | 3.42 | 3% | 304 | 295 | 3% |
Frea | 5.71 | 5.70 | 0% | 256 | 260 | -2% |
Kospi | 5.73 | 5.84 | -2% | 493 | 514 | -4% |
Ayelén | 3.55 | 4.00 | -13% | 313 | 348 | -11% |
Odin | 3.44 | 3.11 | 10% | 181 | 164 | 9% |
SRK also ran an independent estimations for HVS and Frea and the results were within 5% of MSC’s estimation, which is considered acceptable.
SRK’s compilation of resources from the block models provided by MSC were quite close to the table of resources provided by MSC and MSC’s table is considered a valid statement of the resources at San José.
15.1.9
Resource Classification
The resources were classified as measured, indicated, or inferred based on the distance to the nearest composite and the number of composites used in the estimation as shown in Table 15.1.9.1.
| |
SRK Consulting (U.S.), Inc. | May 29, 2009 |
Exhibit 99.1
| |
Minera Andes Inc. | 15-8 |
San José Silver-Gold Project | NI 43-101 Technical Report |
Table 15.1.9.1: Resource Classification Criteria
| | | | | |
Criteria | HV | Frea | Kospi | Ayelén | Odin |
Measured | | | | | |
Percentage of Variogram Range | 50% | 70% | 33% | 33% | 33% |
Distance (m) | 30 | 35 | 30 | 18 | 20 |
Minimum number of drillholes | 3 | 3 | 3 | 3 | 3 |
Indicated | | | | | |
Percentage of Variogram Range | 100% | 130% | 67% | 67% | 67% |
Distance (m) | 60 | 70 | 60 | 37 | 40 |
Minimum number of drillholes | 2 | 2 | 2 | 2 | 2 |
Inferred | | | | | |
Percentage of Variogram Range | 150% | 200% | 100% | 100% | 100% |
Distance (m) | 90 | 110 | 90 | 55 | 60 |
Minimum number of drillholes | 1 | 1 | 1 | 1 | 1 |
15.1.10
Mineral Resource Statement
The resources, including reserves, for the San José property as of June 30, 2008 are presented in Table 15.1.10.1 and the 49% attributable to MAI is shown in Table 15.1.10.2.
Table 15.1.10.1: Mineral Resource Statement, Including Reserves*
| | | | | | | | | | | | |
| Measured | Indicated | Measured and Indicated | Inferred |
Vein | kt | Ag
g/t | Au
g/t | kt | Ag
g/t | Au
g/t | kt | Ag
g/t | Au
g/t | kt | Ag
g/t | Au
g/t |
Huevos Verdes | 292 | 649 | 8.57 | 268 | 398 | 4.88 | 560 | 529 | 6.80 | 25 | 249 | 3.46 |
Frea | 446 | 415 | 8.77 | 299 | 312 | 7.63 | 745 | 374 | 8.31 | 113 | 181 | 4.27 |
Odin | 0 | 0 | 0.00 | 196 | 298 | 5.27 | 196 | 298 | 5.27 | 371 | 237 | 4.88 |
Kospi | 0 | 0 | 0.00 | 887 | 609 | 6.86 | 887 | 609 | 6.86 | 58 | 813 | 11.38 |
Ayelén | 0 | 0 | 0.00 | 79 | 466 | 6.22 | 79 | 466 | 6.22 | 334 | 476 | 5.31 |
HVR | 12 | 446 | 5.16 | 19 | 420 | 4.67 | 31 | 430 | 4.86 | 11 | 414 | 4.43 |
Total | 750 | 507 | 8.63 | 1,749 | 483 | 6.46 | 2,499 | 490 | 7.11 | 912 | 356 | 5.33 |
*June 30, 2008 at a cut-off of 181g/t AgEq
Table 15.1.10.2: Mineral Resources, 49% Attributable to MAI, Including Reserves*
| | | | | | | | | | | | |
Vein | Measured | Indicated | Measured and Indicated | Inferred |
kt | Ag g/t | Au g/t | kt | Ag g/t | Au g/t | kt | Ag g/t | Au g/t | kt | Ag g/t | Au g/t |
Huevos Verdes | 143 | 649 | 8.57 | 131 | 398 | 4.88 | 274 | 529 | 6.80 | 12 | 249 | 3.46 |
Frea | 218 | 415 | 8.77 | 147 | 312 | 7.63 | 365 | 374 | 8.31 | 55 | 181 | 4.27 |
Odin | 0 | 0 | 0.00 | 96 | 298 | 5.27 | 96 | 298 | 5.27 | 182 | 237 | 4.88 |
Kospi | 0 | 0 | 0.00 | 435 | 609 | 6.86 | 435 | 609 | 6.86 | 28 | 813 | 11.38 |
Ayelén | 0 | 0 | 0.00 | 39 | 466 | 6.22 | 39 | 466 | 6.22 | 163 | 476 | 5.31 |
HVR | 6 | 446 | 5.16 | 9 | 420 | 4.67 | 15 | 430 | 4.86 | 5 | 414 | 4.43 |
Total | 368 | 507 | 8.63 | 857 | 483 | 6.46 | 1,224 | 490 | 7.11 | 447 | 356 | 5.33 |
*June 30, 2008 at a cut-off of 181g/t AgEq
15.1.11
Mineral Resource Sensitivity
The mineral resource sensitivity at various cut-offs is presented in Tables 15.1.11.1 and 15.1.11.2 and Figure 15-13.
| |
SRK Consulting (U.S.), Inc. | May 29, 2009 |
Exhibit 99.1
| |
Minera Andes Inc. | 15-9 |
San José Silver-Gold Project | NI 43-101 Technical Report |
Table 15.1.11.1: Mineral Resource Sensitivity, Measured and Indicated
| | | | |
Cut-off | kt | AgEq (g/t) | Ag (g/t) | Au (g/t) |
50 | 3,076 | 752 | 410 | 6.0 |
100 | 2,839 | 808 | 441 | 6.4 |
150 | 2,610 | 868 | 475 | 6.9 |
200 | 2,448 | 914 | 500 | 7.2 |
250 | 2,262 | 971 | 532 | 7.7 |
300 | 2,089 | 1,028 | 566 | 8.1 |
350 | 1,928 | 1,087 | 600 | 8.5 |
400 | 1,794 | 1,140 | 631 | 8.9 |
450 | 1,677 | 1,190 | 660 | 9.3 |
500 | 1,548 | 1,250 | 696 | 9.7 |
Table 15.1.11.2: Mineral Resource Sensitivity, Inferred
| | | | |
Cut-off | kt | AgEq (g/t) | Ag (g/t) | Au (g/t) |
50 | 1,192 | 548 | 297 | 4.4 |
100 | 1,080 | 597 | 324 | 4.8 |
150 | 985 | 642 | 347 | 5.2 |
200 | 880 | 697 | 375 | 5.6 |
250 | 778 | 758 | 407 | 6.1 |
300 | 701 | 811 | 442 | 6.5 |
350 | 627 | 869 | 480 | 6.8 |
400 | 535 | 956 | 531 | 7.4 |
450 | 508 | 984 | 548 | 7.6 |
500 | 423 | 1,087 | 619 | 8.2 |
15.2
Reserve Estimation
The mineral reserve estimates at San José were prepared by MSC operations staff using the JORC guidelines. For the purpose of this Technical Report, the estimates were reviewed by Christopher Elliott (MAusIMM) from SRK using the CIM guidelines.
The mining plan provided by MSC is based on a minimum mining width of 0.8m for the CC&F stopes and 2.0m for the MC&F stopes.
In order to convert the mineral resources to mineral reserves, MSC has applied an average planned dilution of 12% and a mining recovery of 98%. These factors were different to those used in the Feasibility Study and the subsequent 2005 Technical Report (15% for dilution and 95% for recovery). Moreover, MSC did not apply any unplanned dilution, preferring to adjust the planned dilution according to the results gained from reconciliation of the stopes.
SRK carried out a visual inspection of the mining operation and found no basis to justify the rate of planned dilution, the mining recovery or the absence of unplanned dilution.
In the course of estimating the mineral reserves for San José, MSC calculated a “Marginal Cut-off Value (MCOV) and an Economic Cut-off Value (ECOV). The MCOV is based on the variable cost component of the total operating costs whereas the ECOV is based on the total (fixed and variable) operating cost. SRK reviewed the cut-off value (COV) methodology as described by MSC and made the following observations:
| |
SRK Consulting (U.S.), Inc. | May 29, 2009 |
Exhibit 99.1
| |
Minera Andes Inc. | 15-10 |
San José Silver-Gold Project | NI 43-101 Technical Report |
·
The MCOV and ECOV were first calculated for the Feasibility Study in 2005 as US$45/t mined (MCOV) and US$75/t mined (ECOV);
·
In June 2008, MSC updated the reserve estimate using the MCOV and ECOV from 2005;
·
The actual operating costs in the period January to June 2008 were higher than estimated in 2005 however MSC elected not to adjust the original cut-off value parameters to reflect the higher actual operating costs;
·
The June 2008 mineral reserve estimate included an allowance for the following items that were estimated by MSC;
o
Reduced operating (variable) unit costs as a result of connection to the national power grid, estimated as US$7/t mined, and
o
Reduced operating (fixed) unit costs as a result of increased mill throughput, estimated as approximately a 20% increase in total fixed costs (spread over 1500t/d), resulting in a savings of about US$28/t. SRK has estimated this saving at about US$20/t.
·
The COVs were derived from the summation of the unit costs for each of the major cost categories. Geology, Mining and G&A (General &Administration) were expressed as “$/t mined” whereas the unit cost for Processing was expressed as “$/t milled;”
·
The MCOV should be used to select the blocks in the resource model that would be used to form the mining stopes. The ECOV should then be used to select the stopes after dilution and mining recovery had been applied; and
·
MSC elected to use the MCOV to identify the stopes to be included in the mineral reserve estimate.
In SRK’s opinion, the reserve estimate should be primarily based on the ECOV and the MCOV should only be used to include blocks that do not carry the full cost of mining, processing and G&A. In the MSC methodology, using the MCOV, none of the blocks in the reserve estimate are required to carry the full cost of mining, processing and G&A. Nonetheless, about 85% of the reserve calculated by MSC is above the ECOV.
In SRK’s review, stopes with a grade less than the ECOV were included in the reserve estimate if it was necessary to develop through them in order to access other stopes.
SRK applied the 2008 costs (January to June) as the basis for revising the mineral reserve estimate.
The reserves do not include a 10m thick crown pillar that has been left in areas where the ore reached the surface.
SRK also notes that the metal prices used by MSC are considerably below the current (December 2008) long term forecast by industry analysts and the current market prices for silver and gold. The use of higher metal prices will have a positive material impact on reserves reported.
15.2.1
Contained Value Calculation
The following formula was used by MSC and SRK to calculate the ore value in the block model:
| |
SRK Consulting (U.S.), Inc. | May 29, 2009 |
Exhibit 99.1
| |
Minera Andes Inc. | 15-11 |
San José Silver-Gold Project | NI 43-101 Technical Report |
| | | | | |
| Value | = | Aud x PAu x RAu | + | Agd x PAg x RAg |
31.10348 | 31.10348 |
Where:
Aud = Diluted Au grade (g/t)
PAu= Price of Au (US$600/oz)
RAu= Metallurgical Au recovery (82.3%)
Agd= Diluted Ag grade (g/t)
PAg= Price of Ag (US$10.50/oz)
RAg= Metallurgical Ag recovery (84.7%)
15.2.2
Cut-off Value Estimate
At San José, the cut-off value is calculated as follows:
COV = CG + CM + CP + CG + CA
Where:
CG = Geology Cost
CM = Mining Cost
CP = Processing Cost
CG = General Services
CA = Administration Cost
SRK has taken the actual mining costs for the period January 2008 to June 2008 (as provided by MSC) and applied deductions for efficiencies of grid power and increased production rate to determine the cut-off value for the 1500t/d mining rate (Table 15.2.2.1).
Table 15.2.2.1: Calculation of Cut-off Value
| |
Category | Value (US$/t) |
Actual mining costs (January 2008 to June 2008) | |
Geology | 3.30 |
Mining | 33.10 |
Processing | 27.10 |
General Services | 30.14 |
Administration | 46.53 |
Total | 140.08 |
Deduction: National grid power (estimated savings) | 7.00 |
Deduction: Increased production rate (estimated savings) | 19.61 |
COV | 113.47 |
The introduction of national grid power is expected to realize a saving of about US$7.00/t. At the time of writing, the revised estimates for grid power savings were expected to be slightly greater than US$7.00/t.
| |
SRK Consulting (U.S.), Inc. | May 29, 2009 |
Exhibit 99.1
| |
Minera Andes Inc. | 15-12 |
San José Silver-Gold Project | NI 43-101 Technical Report |
According to MSC, total fixed costs are expected to increase by about 20% as a result of increasing the throughput of the processing plant from 750t/d to 1,500t/d. SRK calculated this expected saving as US$19.61/t mined. This is derived from the reported monthly operating costs for the period January to June 2008 and estimating a split between fixed and variable costs. During this period, the fixed costs had not stabilized and, as a result, SRK conservatively estimated fixed costs to be about 35% of total costs. The total fixed costs were increased by 20% and then converted to a unit rate (US$/t) applicable to 1500 t/d. A less conservative estimate of the proportion of fixed costs would have yielded a greater theoretical saving.
A “rounded” cut-off value of US$115/t was used for the reserve estimation.
15.2.3
Mining Dilution
The inefficiencies and limitations of the mining operation are recognized in the dilution and the mining recovery attributed to the reserve calculation.
Mining dilution is defined as the contamination of ore with barren waste rock. The waste rock can originate from the walls of the stoping area or from the backfill that is deliberately introduced to the stope to support the walls.
The amount of dilution that can occur is dependent upon several factors.
·
The mining method;
·
The strength or quality of the rock;
·
The variability (or continuity) of the ore zone; and
·
The width of the vein compared to the minimum mining width.
Mining dilution can be planned or unplanned. In cut and fill mining, the planned dilution occurs when the waste adjacent to a narrow high-grade zone is mined in order to achieve a minimum mining width (MMW). The MMW is determined by the size of the equipment that is being used; smaller equipment will have a smaller MMW and will incur less planned dilution than larger equipment in the same narrow vein.
Unplanned dilution results from the waste that occurs in addition to the planned dilution. For example, an unstable stope wall may deteriorate beyond the MMW and introduce additional waste into the ore stream. In the case of cut and fill mining, unplanned dilution may also occur when some of the (waste) backfill is inadvertently dug up by the loader and mixed with the broken ore.
MSC carried out a detailed calculation of planned dilution for a range of stoping widths and concluded that the average planned dilution factor of 12% to could be applied to all stopes, regardless of size. MSC has assigned zero grade to the planned dilution. MSC does not currently have sufficient data for the grades of the hangingwall and footwall lithologies to be able to accurately estimate a dilution grade.
In preparing this reserve estimate, SRK has calculated the planned dilution for each stoping area as a minimum of 0.2m of overbreak from each of the hangingwall and footwall of the stope, for a total of 0.4m of overbreak.
| |
SRK Consulting (U.S.), Inc. | May 29, 2009 |
Exhibit 99.1
| |
Minera Andes Inc. | 15-13 |
San José Silver-Gold Project | NI 43-101 Technical Report |
MSC has not incorporated any unplanned dilution in its reserve calculations on the basis that its management of the cut and fill mining method is sufficiently robust to ensure unplanned dilution does not occur.
SRK was able to visually assess the mining operation in Huevos Verdes and concluded that some unplanned dilution does occur as a result of local instabilities in both the hangingwall and footwall and also from inadvertent mining of the backfill. SRK has included a nominal 5% allowance for unplanned dilution.
MSC applied a “resue” technique in the Huevos Verdes stopes to reduce the amount of dilution. Resue mining is most effectively used in narrow, high grade veins where a significant amount of waste must be mined in addition to the ore in order to achieve the required minimum mining width. Resue mining attempts to mine the ore and the waste in two separate activities thus minimizing dilution. In the narrow Huevos Verdes stopes, the ore is drilled, blasted and mucked out in the first activity, followed by the waste. As a result of the duplication of drilling blasting and mucking activities, resue mining incurs a higher mining cost and lower dilution, however it is expected that the reduced processing cost generally offsets the higher mining cost. SRK has not seen any documented evidence of the savings realized from resue mining nor the impact on dilution.
15.2.4
Mining Recovery
Mining recovery is recognized in the reserve calculations as an allowance for ore that is not recovered during normal mining operations. This may occur for a variety of reasons, such as:
1.
Irregularities in the outlines of the vein that cannot be readily followed while mining.
2.
Broken ore that is not recovered from corners or from against the walls of the stope.
3.
Poor ground conditions that either prevent safe mucking of the ore or collapse onto the broken ore and thus prevent economic recovery of the broken ore.
4.
Fine fragmentation of the broken ore that carries coarse gold particles into the top layer of the backfill.
5.
Spillage or handling losses that may occur during transport of the broken ore.
MSC has applied a recovery factor of 98%, however AMEC (2007b) recognized that this factor underestimated the losses and subsequently applied a recovery of 95%. SRK is also of the opinion that 95% recovery is a more realistic factor based on visual observation in Huevos Verdes and SRK’s industry experience.
15.2.5
Comparison of Modifying Factors
The discussion in the previous sections highlights the fact that SRK has a somewhat different view on the modifying factors that were applied by MSC in the course of estimating the reserve. Table 15.2.5.1 summarizes those factors as applied by SRK and MSC.
Table 15.2.5.1: Comparison of Modifying Factors
| | |
Item | SRK | MSC |
Cut-off value | US$115/t | US$45/t |
Planned Dilution | 0.4m in addition to minimum vein width | 12% of stope tonnes |
Unplanned dilution | 5% | NIL |
Mining Recovery | 95% | 98% |
| |
SRK Consulting (U.S.), Inc. | May 29, 2009 |
Exhibit 99.1
| |
Minera Andes Inc. | 15-14 |
San José Silver-Gold Project | NI 43-101 Technical Report |
The methodology and modifying factors applied by SRK to the reserve estimate will yield a lower result than the reserve estimate that was estimated by MSC.
15.2.6
Reserve Estimate
SRK’s estimate of the mineral reserve for Huevos Verdes, Frea and Kospi are presented in Table 15.2.6.1 and the mineral reserve estimate attributable to Minera Andes is presented in Table 15.2.6.2.
Table 15.2.6.1: Mineral Reserve Statement, June 30, 2008
| | | | | | |
Vein | Category | Tonnes (kt) | Ag (g/t) | Au (g/t) | Ag (koz) | Au (koz) |
Huevos Verdes | Proven | 249 | 470 | 6.43 | 3,768 | 52 |
Probable | 143 | 443 | 5.41 | 2,044 | 25 |
Proven & Probable | 393 | 460 | 6.06 | 5,812 | 77 |
Frea | Proven | 270 | 449 | 6.13 | 3,901 | 53 |
Probable | 254 | 264 | 9.82 | 2,157 | 80 |
Proven & Probable | 524 | 360 | 7.92 | 6,058 | 133 |
Kospi | Proven | - | - | - | - | - |
Probable | 698 | 596 | 6.55 | 13,361 | 147 |
Proven & Probable | 698 | 596 | 6.55 | 13,361 | 147 |
Total San José | Proven | 519 | 459 | 6.28 | 7,669 | 105 |
Probable | 1,095 | 499 | 7.16 | 17,563 | 252 |
Proven & Probable | 1,615 | 486 | 6.88 | 25,231 | 357 |
Table 15.2.6.2: Mineral Reserve Attributable to Minera Andes, June 30, 2008
| | | | | | |
Vein | Category | Tonnes (kt) | Ag (g/t) | Au (g/t) | Ag (koz) | Au (koz) |
Huevos Verdes | Proven | 122 | 470 | 6.43 | 1,846 | 25 |
Probable | 70 | 443 | 5.41 | 1,002 | 12 |
Proven & Probable | 193 | 460 | 6.06 | 2,848 | 38 |
Frea | Proven | 132 | 449 | 6.13 | 1,912 | 26 |
Probable | 124 | 264 | 9.82 | 1,057 | 39 |
Proven & Probable | 257 | 360 | 7.92 | 2,969 | 65 |
Kospi | Proven | - | - | - | - | - |
Probable | 342 | 596 | 6.55 | 6,547 | 72 |
Proven & Probable | 342 | 596 | 6.55 | 6,547 | 72 |
Total San José | Proven | 255 | 459 | 6.28 | 3,758 | 51 |
Probable | 537 | 499 | 7.16 | 8,606 | 124 |
Proven & Probable | 791 | 486 | 6.88 | 12,363 | 175 |
15.2.7
Conversion of Mineral Resources to Mineral Reserves
The process of converting the mineral resource estimate to a mineral reserve estimate is carried out as follows:
·
All blocks reporting a vein width less than 0.8m are diluted to a MMW of 0.8m with waste at zero grade;
·
Sill pillars are positioned at about 50m vertical intervals;
·
Stoping blocks are identified;
·
Tonnes and grade are reported for each stoping block;
| |
SRK Consulting (U.S.), Inc. | May 29, 2009 |
Exhibit 99.1
| |
Minera Andes Inc. | 15-15 |
San José Silver-Gold Project | NI 43-101 Technical Report |
·
Planned dilution is applied;
·
Unplanned dilution is applied;
·
Mining recovery is applied; and
·
Reject the stopes that do not meet the US$115/t BECOV.
SRK has applied the following parameters to derive the mineral reserve estimate:
·
CC&F minimum mining width
0.8m
·
MC&F minimum mining width
2.0m
·
Planned dilution
0.2m HW + 0.2m FW = 0.4m total
·
Unplanned dilution
5%
·
Mining recovery
95%
·
Economic stope outlines from BECOV
US$115/t
There are no known environmental, permitting, legal, title, taxation, socio-economic, marketing, political or other relevant issues, other than those already discussed, that could have a material affect on the mineral resource and reserve estimate.;
| |
SRK Consulting (U.S.), Inc. | May 29, 2009 |
Exhibit 99.1
| |
Minera Andes Inc. | 15-16 |
San José Silver-Gold Project | NI 43-101 Technical Report |
Figure 15-1: Plan View Showing Drillholes, Vein Wireframes and Cross-section Lines
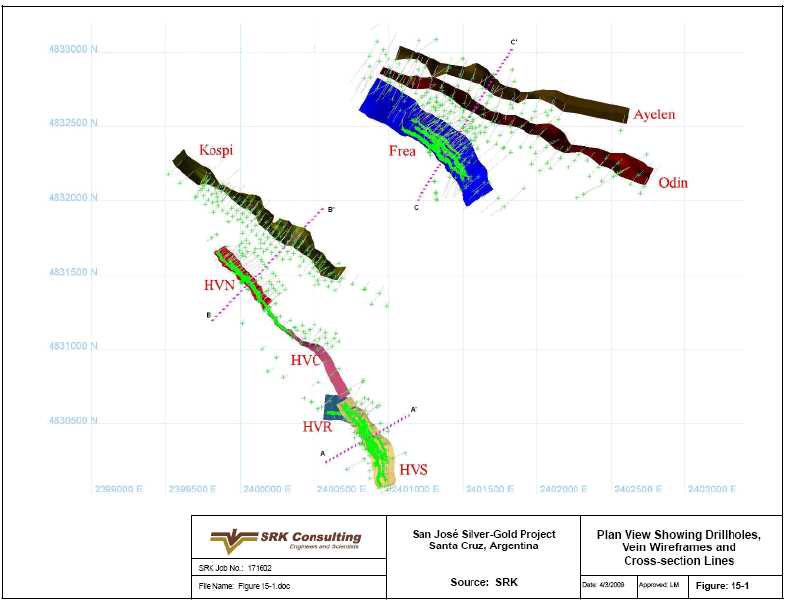
| |
SRK Consulting (U.S.), Inc. | May 29, 2009 |
Exhibit 99.1
| |
Minera Andes Inc. | 15-17 |
San José Silver-Gold Project | NI 43-101 Technical Report |
Figure 15-2: Huevos Verdes South Cross Section A-A’ Drillholes and Vein
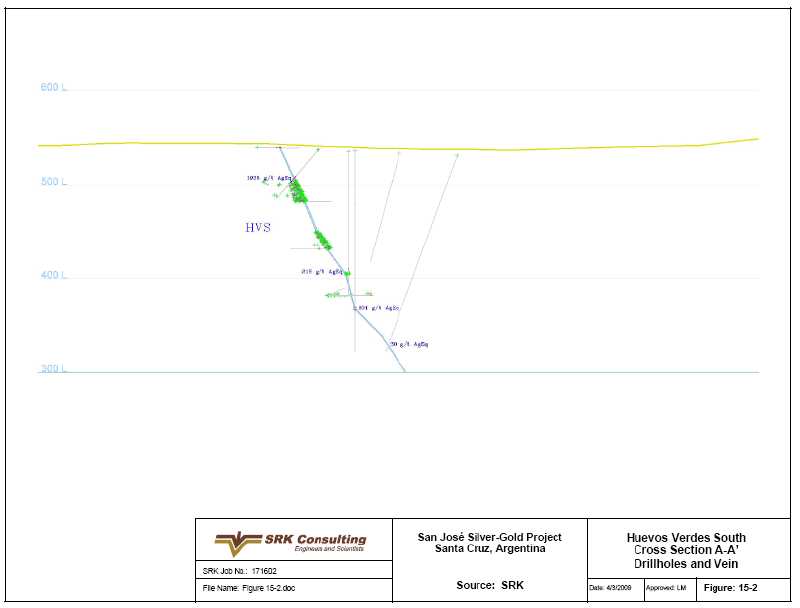
| |
SRK Consulting (U.S.), Inc. | May 29, 2009 |
Exhibit 99.1
| |
Minera Andes Inc. | 15-18 |
San José Silver-Gold Project | NI 43-101 Technical Report |
Figure 15-3: Huevos Verdes North and Kospi Cross Section B-B’ Drillholes and Veins

| |
SRK Consulting (U.S.), Inc. | May 29, 2009 |
Exhibit 99.1
| |
Minera Andes Inc. | 15-19 |
San José Silver-Gold Project | NI 43-101 Technical Report |
Figure 15-4: Frea, Odin, Ayelén Cross Section C – C’ Drillholes and Veins
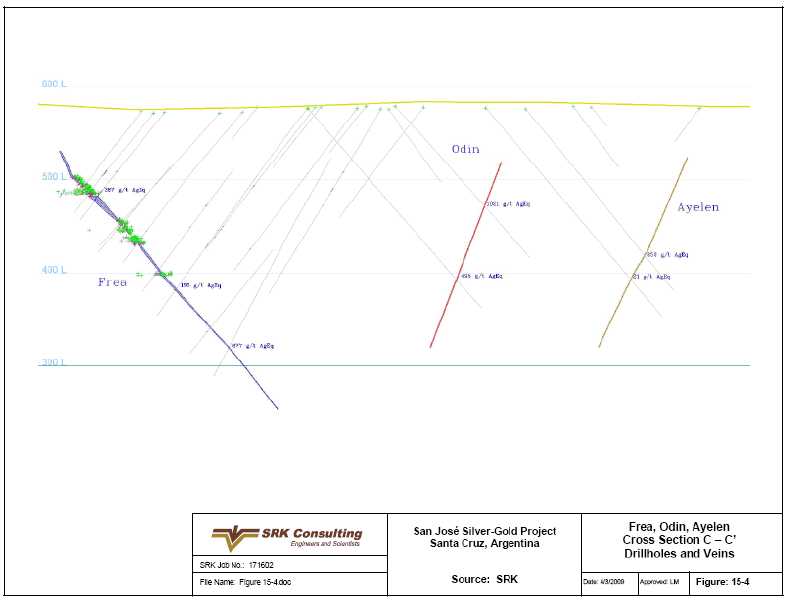
| |
SRK Consulting (U.S.), Inc. | May 29, 2009 |
Exhibit 99.1
| |
Minera Andes Inc. | 15-20 |
San José Silver-Gold Project | NI 43-101 Technical Report |
Figure 15-5: Huevos Verdes South Cross Section A-A’ Drillholes and Block Grades
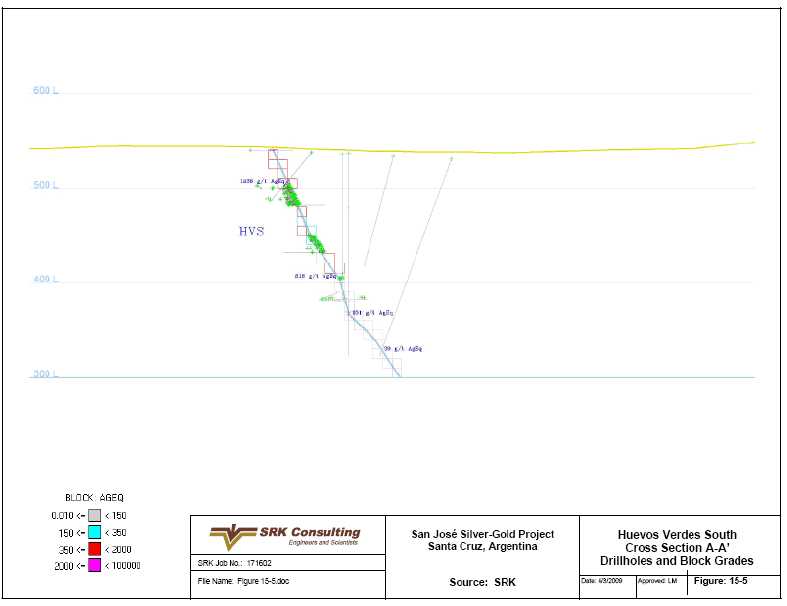
| |
SRK Consulting (U.S.), Inc. | May 29, 2009 |
Exhibit 99.1
| |
Minera Andes Inc. | 15-21 |
San José Silver-Gold Project | NI 43-101 Technical Report |
Figure 15-6: Huevos Verdes North and Kospi Cross Section B-B’ Drillholes and Block Grades

| |
SRK Consulting (U.S.), Inc. | May 29, 2009 |
Exhibit 99.1
| |
Minera Andes Inc. | 15-22 |
San José Silver-Gold Project | NI 43-101 Technical Report |
Figure 15-7: Frea, Odin, Ayelén Cross Section C-C’ Drillholes and Block Grades

| |
SRK Consulting (U.S.), Inc. | May 29, 2009 |
Exhibit 99.1
| |
Minera Andes Inc. | 15-23 |
San José Silver-Gold Project | NI 43-101 Technical Report |
Figure 15-8: Long Section – Huevos Verdes Showing Block Model and Location of Composites
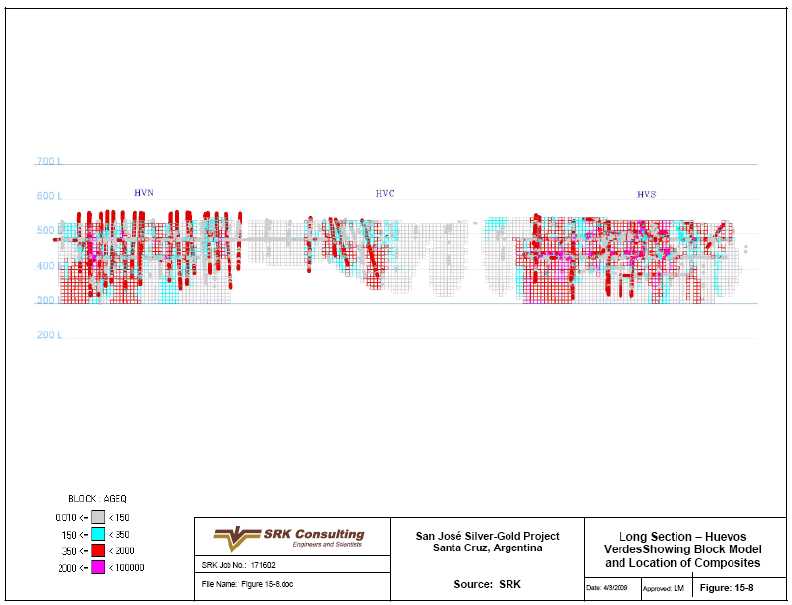
| |
SRK Consulting (U.S.), Inc. | May 29, 2009 |
Exhibit 99.1
| |
Minera Andes Inc. | 15-24 |
San José Silver-Gold Project | NI 43-101 Technical Report |
Figure 15-9: Long Section – Kospi Showing Block Grades and Location of Composites
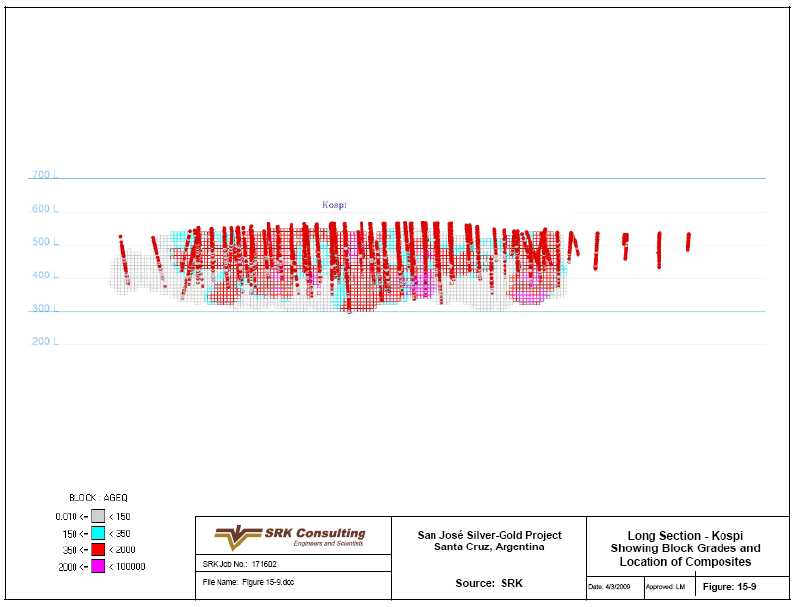
| |
SRK Consulting (U.S.), Inc. | May 29, 2009 |
Exhibit 99.1
| |
Minera Andes Inc. | 15-25 |
San José Silver-Gold Project | NI 43-101 Technical Report |
Figure 15-10: Long Section – Frea Showing Block Grades and Location of Composites
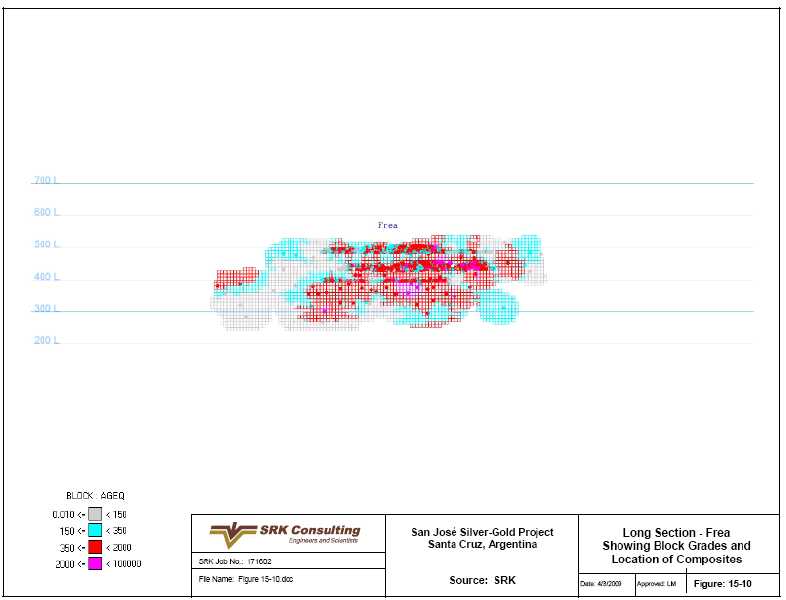
| |
SRK Consulting (U.S.), Inc. | May 29, 2009 |
Exhibit 99.1
| |
Minera Andes Inc. | 15-26 |
San José Silver-Gold Project | NI 43-101 Technical Report |
Figure 15-11: Long Section – Odin Showing Block Grades and Location of Composites
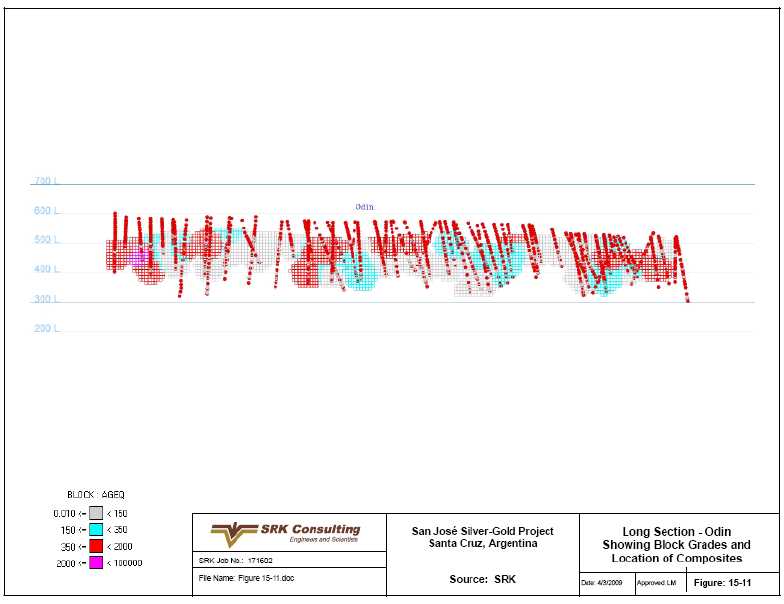
| |
SRK Consulting (U.S.), Inc. | May 29, 2009 |
Exhibit 99.1
| |
Minera Andes Inc. | 15-27 |
San José Silver-Gold Project | NI 43-101 Technical Report |
Figure 15-12: Long Section – Ayelén Showing Block Grades and Location of Composites
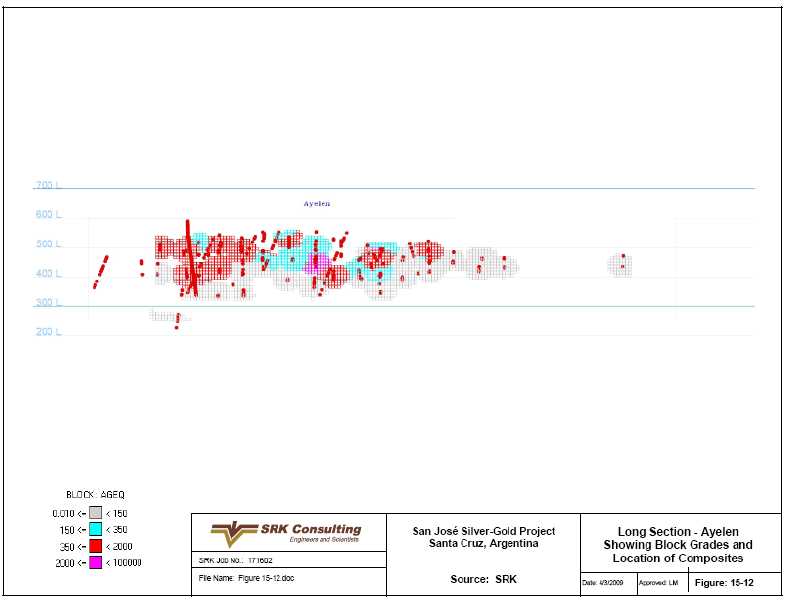
| |
SRK Consulting (U.S.), Inc. | May 29, 2009 |
Exhibit 99.1
| |
Minera Andes Inc. | 15-28 |
San José Silver-Gold Project | NI 43-101 Technical Report |
Figure 15-13: Grade Tonnage Curves
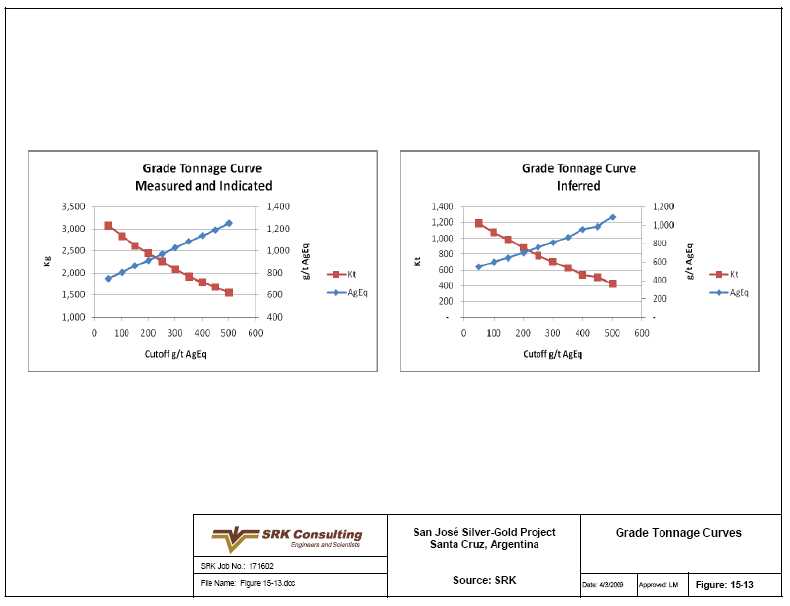
| |
SRK Consulting (U.S.), Inc. | May 29, 2009 |
Exhibit 99.1
| |
Minera Andes Inc. | 16-1 |
San José Silver-Gold Project | NI 43-101 Technical Report |
16
Other Relevant Data and Information(Item 20)
16.1
Depletion of Resources and Reserve
Resources
The resources stated in this report are effective June 30, 2008 and have not been depleted for the mining that has taken place between the effective date of the resources and the date of this report. The resources have not been depleted because SRK has not received the asbuilts for the mined areas and therefore cannot determine what has been mined from the resource area. Also, any increases to the resource through the on-going drilling program during that year are not known.
Reserves
The effective date for the reserve estimate is June 30, 2008. For the purpose of the LoM schedule, the reserves have been depleted by actual mine production for the six months to December 31, 2008. Ore reserve depletion is shown in Table 16.1.1. During this period, an additional 73,241t of ore was mined from areas that did not form part of the SRK reserve estimate. This may have occurred as a result of reinterpretation of the resource or by mining “MCOV” stopes.
Table 16.1.1: Summary of Depletion to December 31, 2008.
Table 16.1.1: Summary of Depletion to December 31, 2008
| | | | |
Vein | Category | Tonnes (kt) | Ag (g/t) | Au )g/t) |
Huevos Verdes | Proven | 21,253 | 526 | 8.03 |
Probable | 12,048 | 455 | 6.21 |
Proven & Probable | 33,302 | 7.37 | 500 |
Frea | Proven | 57,819 | 548 | 5.15 |
Probable | 3,068 | 314 | 3.23 |
Proven & Probable | 60,887 | 536 | 5.05 |
Kospi | Proven | NIL | | |
Probable | NIL | | |
Proven & Probable | NIL | | |
Total San José | Proven | 79,072 | 542 | 5.92 |
Probable | 15,116 | 426 | 5.60 |
Proven & Probable | 94,188 | 524 | 5.87 |
16.2
Comparison of Reserve Estimates
SRK has reviewed MSC’s reserve estimation methodology and concluded that some aspects of the methodology may produce an estimate that does not reflect the actual mining conditions. As a result, SRK has produced an independent reserve estimate utilizing their own methodology and assumptions. Table 16.2.1 compares the modifying factors that were used by SRK and MSC to produce the reserve estimate.
| |
SRK Consulting (U.S.), Inc. | May 29, 2009 |
Exhibit 99.1
| |
Minera Andes Inc. | 16-2 |
San José Silver-Gold Project | NI 43-101 Technical Report |
Table 16.2.1: Comparison of Modifying Factors
| | |
Item | SRK | MSC |
Cut-off grade | US$115/t | US$45/t |
Planned Dilution | 0.4m in addition to minimum vein width | 12% of stope tonnes |
Unplanned dilution | 5% | NIL |
Mining Recovery | 95% | 98% |
16.3
Material Occurrences in the Six Months to December 31, 2008
The realized mining costs continued to increase in the six months to December 31, 2008. This can be attributed, in part, to a general increase in costs in all areas, primarily salaries and wages, equipment and consumables.
The planned increase in production rate to 1,500t/d was not consistently achieved by year end.
| |
SRK Consulting (U.S.), Inc. | May 29, 2009 |
Exhibit 99.1
| |
Minera Andes Inc. | 17-1 |
San José Silver-Gold Project | NI 43-101 Technical Report |
17
Additional Requirements for Development and Production Properties(Item 25)
17.1
Mining Operations
Mining operations at San José are focused on three separate vein systems (Huevos Verdes, Frea and Kospi). The Huevos Verdes vein is the most important target on the property. It is comprised of three discontinuous zones – HVS, HVC and HVN. These five distinct mining areas are all exploited by underground mining methods. As at December 31, 2008, the estimated mine life is four years based on the June 30, 2008 reserves, depleted to December 31, 2008.
During the early exploration program, two small inclined shafts were developed to provide access to HVS and HVN. These have since been abandoned in favor of ramp access from the surface. The primary ramps are generally 4.0m wide by 4.3m high with a gradient of 12% on the straight sections and 10.5% on the curves. A smaller profile is used in areas where truck access is not required.
The inclined shafts are now used to supplement the primary ventilation circuit.
The Frea and Kospi veins are generally wider than 2.0m and are being mined by MC&F whereas the narrower Huevos Verdes system is being mined by the CC&F method. The MC&F stopes utilize a single-boom jumbo for both development and production drilling. Jacklegs and pneumatic rock drills are used in the CC&F stopes. Broken ore is removed from the stopes by LHDs ranging in size from 1.5yd3to 6.0yd3. A fleet of 20t trucks are used to haul the ore to the surface.
The San José veins are accessed from the following portals:
·
Tehuelche Portal:
HVS;
·
Kospi Portal:
HVN, HVC and Kospi; and
·
Güer Aike Portal:
Frea.
The primary ventilation at Huevos Verdes, Frea and Kospi all utilize the negative pressure system that is based on the main (primary) ventilation fan drawing the contaminated air from the mine. Fresh air enters the mine through either the main access decline or a dedicated fresh air raise where it is directed to each of the working areas via a secondary ventilation system.
Waste rock from development is used as backfill in the cut and fill stopes. The development waste is usually hauled to a surface stockpile and then rehandled to waste passes when it is required underground. When the demand for backfill exceeds the supply from waste development, MSC will establish a borrow pit to quarry the local till.
The underground production rate is gradually being increased from 750t/d (270,000t/y) to 1,500t/d (540,000t/y). MSC had originally planned to achieve 1,500t/d in October 2008, however, delayed access to the Kospi vein (due to difficult ground conditions encountered in the Kospi decline) has deferred the increased production rate. As at December 31, 2008, MSC had not consistently achieved 1,500t/d, however, MSC expects to achieve this in early 2009.
The MSC production schedule assumes that Huevos Verdes, Frea and Kospi will each be able to deliver ore at 500t/d, with each stoping area delivering about 100t/d.
| |
SRK Consulting (U.S.), Inc. | May 29, 2009 |
Exhibit 99.1
| |
Minera Andes Inc. | 17-2 |
San José Silver-Gold Project | NI 43-101 Technical Report |
MSC is currently exploring the possibility of implementing the long-hole stoping (LHOS) mining method. This is expected to reduce the total mining cost. LHOS incurs additional dilution and achieves lower mining recovery that C&F, however if the mining method can be successfully implemented and is properly managed, then the influence of these factors is expected to be minimal and could provide San José with an overall cost benefit.
17.1.1
Rock Mechanics
Rock Mass Classification
The following description is taken from AMEC (2007b).
Detailed characterization of the rock mass in the mineralized zones is based on geotechnical mapping of the underground workings, geotechnical logging of the available cores, and a review of previous studies, which included review of geomechanical logs of the exploration drilling. MSC is using the RMR system (Bienawski, 1989) to classify the rock mass into the following structural domains:
·
Ore domain II (RMR>61);
·
Ore domain IIIa-IIIb (41<RMR<60);
·
Ore domain IIIb-IVa (31<RMR<50);
·
Hangingwall domain IIIa-IIIb (41<RMR<60);
·
Hangingwall domain IIIb (41<RMR<50);
·
Footwall domain IIIb (41<RMR<50); and
·
Footwall domain IIIa (51<RMR<60).
According to the RMR classification system, both the HVN and HVS zones show Poor to Fair quality rock mass and the Frea zone ranges from Fair to Good. The most competent ground occurs in the ore body, then in the footwall, and finally in the hangingwall. Ground conditions tend to improve with increasing depth below surface. AMEC’s visual assessment underground in May 2007 corroborates this statement.
The main rocks associated with the Frea deposit are considered to be:
·
The mineralized structure;
·
The andesite that hosts the ore body;
·
The sedimentary lithologies overlying the andesites; and
·
The basalts overlying the sedimentary rock.
Basalts have a thickness that varies from 5m to 50m and the thickness of the sedimentary lithologies varies from 8m to 80m.
Ground Support
The underground working at Kospi and HVS were inspected by SRK. The ground support consisted of random bolting with occasional mesh; there was no evidence of systematic ground support in either ramp. SRK understands that the general ground support strategy employed by MSC is based on installing the ground support when the prevailing ground conditions sufficiently deteriorate. It appears that ground support is not installed as a preventative measure.
SRK supports the following opinion expressed by AMEC (2007b).
| |
SRK Consulting (U.S.), Inc. | May 29, 2009 |
Exhibit 99.1
| |
Minera Andes Inc. | 17-3 |
San José Silver-Gold Project | NI 43-101 Technical Report |
“A review of ground support requirements using a graph developed for the Q system (Barton, et al., 1977) shows that southern stopes at HVS and eastern stopes at HVN are borderline cases for unsupported backs, having a Q value of 0.3 and an Equivalent Dimension of 1 (De = Span/ESR = 3/3 = 1). A stability analysis using an empirical method (Pakalnis) concludes that a 3m span excavation is stable for RMR values exceeding 50. In AMEC’s opinion, excavations where back span exceeds 3m and where RMR value is less than 50 should be systematically bolted using a minimum 1.8m (effective length) bolt.”
SRK understands that systematic ground support, utilizing rock bolts and mesh, is applied systematically in the HVS stopes. Timber sets are also used in some Huevos Verdes areas.
17.1.2
Mine Access and Development
During the early exploration program, the veins at HVN and HVS were accessed from inclined shafts. These shafts have since been abandoned in favor of decline access. The inclined shafts are now used to supplement the primary ventilation circuit.
The main declines are generally 4.0m wide and 4.3m high with a gradient of 12% on the straight sections and 10.5% on the curves. A smaller profile is used in areas where truck access is not required. On average, the main ramps are located about 50m from the vein, depending on the dip of the reef. Cross-cuts to the ramp are centrally positioned on the vein and usually have an ore pass and a waste/backfill pass. The MSC development strategy is to have the development about two years ahead of production.
The San José veins are accessed from the following portals:
·
Tehuelche Portal: HVS—The Tehuelche portal and ramp were commenced in 2005 to provide access to the HVS veins. In July 2008, as a result of the poor ground conditions in the Kospi ramp, MSC commenced an extension of the Tehuelche ramp to intersect the HVC vein;
·
Kospi Portal: HVN, HVC and Kospi—The Kospi portal and ramp were commenced in May 2007 to provide access to HVC and Kospi. In February 2008, both branches encountered difficult ground conditions requiring the use of shotcrete, and steel sets in addition to the standard ground support. Despite the efforts of the experienced mining crews, MSC was unable to maintain the excavations in a safe condition. As a result, MSC decided to abandon them in May 2008 establishing a new alignment around the poor ground. The modified development plan for the Kospi ramp was commenced in July 2008. A new ramp alignment was started in better ground conditions, about 70m back from the poor ground. This ramp will now provide access to Kospi and HVN. The Kospi vein was intersected in early 2009 and initial production is expected to commence soon after; and
·
Güer Aike Portal: Frea—The Güer Aike portal was commenced in 2006 and provides the only access to the Frea vein. MSC is using a raiseborer to do most of the vertical development for ventilation raises, ore and waste passes, services ducts and emergency escapeways. The raiseborer is owned and operated by a Peruvian contractor.
| |
SRK Consulting (U.S.), Inc. | May 29, 2009 |
Exhibit 99.1
| |
Minera Andes Inc. | 17-4 |
San José Silver-Gold Project | NI 43-101 Technical Report |
17.2
Mining Method
All of the vein systems at Mina San José have a pinch-and-swell nature with numerous bends and jogs. Widths vary from less than 1m to around 15m, however the significant gold and silver mineralization is generally found in the 0.5m to 4.0m range. The average mining width across all of the vein systems is about 2m. The dip of the veins varies from 55º at Frea to 70º at Huevos Verdes.
The preferred mining method is overhand cut and fill, where the ore is removed in layers from above the drift and replaced by loose, uncemented waste rock (backfill) on the floor of the drift. This method sufficiently flexible to accommodate the variations in vein width and dip with minimal dilution while still providing the required amount of ground support.
The narrow stopes (less than 2m in width) utilize the CC&F method with hand-held equipment (jacklegs with pneumatic rock-drills). The stopes wider than 2m utilize MC&F with electro-hydraulic drill rigs mounted on diesel-powered carriers.
The majority of production ore is derived from the “uphole retreat” technique where a panel of about 50m in length is drilled with upholes and retreated along strike. “Breasting” (or tunneling) is only used on the initial lift in each stope.
In both methods, diesel power loaders (LHDs) are used to remove the broken ore from the stopes.
Production is derived from several stoping areas, each delivering approximately 100t/d, depending on the width. Stoping areas are separated by 3m high sill pillars. A schematic of the mining sequence is presented in Figure 17-1 and may be summarized as follows.
1.
Develop from decline to vein.
2.
Develop the sill cut along strike.
3.
Drill and blast the first production lift.
4.
Muck out the broken ore.
a.
In narrow, high grade stopes, the resue technique may be applied to reduce the amount of dilution.
i.
Drill, blast and muck out the ore.
ii. Drill, blast and muck out the waste.
5.
Backfill the stope (sill pillar).
a.
In narrow CC&F stopes, a timber flooring is placed on the sill prior to placing the development waste.
b.
In wide stopes, the first lift will be cemented backfill.
6.
Drill and blast the next production lift.
7.
Muck out the broken ore.
a.
In narrow, high grade stopes, the resue technique may be applied to reduce the amount of dilution.
i.
Drill, blast and muck out the ore.
| |
SRK Consulting (U.S.), Inc. | May 29, 2009 |
Exhibit 99.1
| |
Minera Andes Inc. | 17-5 |
San José Silver-Gold Project | NI 43-101 Technical Report |
ii. Drill, blast and muck out the waste.
8.
Backfill the stope with development waste.
9.
Repeat steps 6 to 8 as required.
In the CC&F stopes, the upholes are about 1.8m in length whereas in the MC&F stopes, the upholes are about 3.5m in length.
Waste rock from development is currently used as backfill in the cut and fill stopes. The development waste is usually hauled to a surface stockpile and then rehandled to waste passes when it is required underground. When the demand for backfill exceeds the supply from waste development, MSC will establish a borrow pit to quarry the local till. MSC is currently exploring opportunities for placing the mill tailings as backfill.
MSC apply a “resue” technique in the Huevos Verdes stopes to reduce the amount of dilution. Resue mining is most effectively used in narrow, high grade veins where a significant amount of waste must be mined in addition the ore in order to achieve the required minimum mining width. Resue mining attempts to mine the ore and the waste in two separate activities thus minimizing dilution. In the narrow Huevos Verdes stopes, the ore is drilled, blasted and mucked out in the first activity, followed by the waste. As a result of the duplication of drilling blasting and mucking activities, resue mining incurs a higher mining cost and lower dilution, however it is expected that the reduced processing cost generally offsets the higher mining cost. SRK has not seen any documented evidence of the savings realized from resue mining nor the impact on dilution.
In order to minimize surface disturbance in areas where the ore extends to the surface, MSC plans to leave a 10m thick crown pillar. SRK understands that there has been no detailed geotechnical assessment of this design. SRK agrees with AMEC (2007b) and recommends that a geotechnical evaluation be carried out to determine the optimum dimensions.
The underground production rate is gradually being increased from 750t/d (270,000t/y) to 1,500t/d (540,000t/y). MSC had originally planned to achieve 1,500t/d in October 2008, however, delayed access to the Kospi vein (due to difficult ground conditions encountered in the Kospi decline) has deferred the increased production rate. As at December 31, 2008, MSC had not consistently achieved 1,500t/d, however, MSC expects to achieve this in early 2009.
17.2.1
Mining Equipment
The mining equipment required for conventional and MC&F and the proposed long hole stoping mining consists of development and production drills, LHDs, haul trucks, service vehicles and personnel transport vehicles (small 4WD trucks). The equipment listed in Table 17.2.1.1 shows the fleets required for 1,500t/d. In SRK’s opinion, the listed fleets are sufficient to achieve the required production rates.
| |
SRK Consulting (U.S.), Inc. | May 29, 2009 |
Exhibit 99.1
| |
Minera Andes Inc. | 17-6 |
San José Silver-Gold Project | NI 43-101 Technical Report |
Table 17.2.1.1: Major Equipment Inventory
| | | |
Description | As at
June 30, 2008 | Required
for 1,500t/d | Comments |
LHD | | | |
EJC 65 | 3 | 3 | A fourth EJC65 is in maintenance |
Toro 151 | 2 | 2 | |
Toro 006 / LH307 | 3 | 6 | |
Toro 007 | 1 | 2 | |
Jumbo | | | |
Quasar NV / DD210 | 3 | 4 | Single boom jumbo |
Axera 5 | 1 | 2 | Single boom jumbo |
Simba | 0 | 1 | Long hole stoping |
Haul Trucks | | | |
Volvo FM440 (20t) | 3 | 7 | |
San José does not utilize a grader for road maintenance and, as a result, the main haulage roadways are in generally poor condition. Consequently, maintenance costs (and hence, operating costs) are likely to be higher than necessary with lower truck productivities.
17.2.2
Services
Dewatering
Ground water from the Huevos Verdes mining areas (HVS, HVC & HVN) is being produced at a consistent rate of about 8 to 10L/s. The ground water flow in the Frea mining area is significantly higher (up to 20L/s). It appears that the majority of the flow is from the ore zone overhead.
MSC has established similar dewatering arrangements at each of the veins. In general, floor gradients are constructed to assist the natural flow of water to the sumps. Mine water is pumped to the main underground sumps using Flygt 7hp (Type H) submersible pumps and 76mm HDPE pipelines. Grindex 50hp submersible pumps are used to pump the water to the surface settling ponds.
In response to the high water inflows at Frea, various settling sumps and pump stations were installed in the underground mine. The Frea underground pumps discharge the water to a settling pond that was recently constructed on the surface, close to the Guer Aike (Frea) portal. Clean water is pumped directly from the settling pond to the processing plant and the main water reservoir or returned to the mine for drilling etc.
Mine Water
Fresh water for use in the underground mine is sourced from the surface settling ponds.
Compressed Air
Compressed air is required in the underground mines for the operation of hand-held drills, small water pumps, explosives loading apparatus (ANFO loader), small hoists and raise boring.
Air compressors are located at each of the portals:
·
Tehuelche Portal : Atlas Copco 315 SD, delivers approximately 750ft3/min at 100psi;
·
Guer Aike Portal : Sullair 1900, delivers approximately 1,900ft3/min at 100psi; and
·
Kospi Portal : Sullair 1900, delivers approximately 1,900 ft3/min at 100psi.
| |
SRK Consulting (U.S.), Inc. | May 29, 2009 |
Exhibit 99.1
| |
Minera Andes Inc. | 17-7 |
San José Silver-Gold Project | NI 43-101 Technical Report |
In SRK’s opinion, the currently installed compressed air capacity is sufficient to sustain the target production rate of 1,500t/d. MSC has indicated that they can readily obtain additional air compressors should the need arise.
Electrical Power
Electrical power is currently provided by diesel-fired power generators located at a central powerhouse and supplemented by smaller diesel-fired power generators located at the each of the portals.
In 2008, MSC commenced construction of a high-voltage transmission line to connect the property to the national power grid. At the time of SRK’s most recent site visit (January 2009), construction of the transmission line was nearing completion and expected to become operational during Q1 2009.
17.2.3
Mine Ventilation
MSC has elected to conform to the Peruvian regulations for underground mine ventilation as these are more prescriptive than the Argentinean regulations and thus require a higher standard of ventilation. The ventilation in Huevos Verdes, Frea and the Kospi decline is designed to accommodate the fleet of diesel equipment as well as provide sufficient ventilation for ancillary activities.
The primary ventilation at Huevos Verdes, Frea and Kospi all utilize the negative pressure system in which the main (primary) ventilation fan draws the used air from the mine. Fresh air enters the mine through either the main access decline or a dedicated fresh air raise where it is directed to each of the working areas via secondary ventilation system.
The design guidelines used by MSC are based on a minimum ventilation requirement of ~0.07m3/s/kW. SRK has not reviewed the results most recent ventilation surveys and cannot comment on the actual ventilation flows being achieved. However, during the underground inspection at HVS, SRK noted that the ventilation appeared to be inadequate for the diesel fleet operating at that time. In addition, all persons entering the underground mine are issued with dust filter masks. This suggests that the ventilation objectives are not being achieved on a regular basis.
17.2.4
Waste Rock
Waste rock storage areas are located adjacent to each waste pass. According to MSC, the maximum waste storage on the surface will be about 250,000t. Due to the rapid cycle time of the stoping areas, acid generation will not be an issue.
MSC are currently reviewing the potential for utilizing tailings in the backfill program.
17.2.5
Mining Method Outlook
Although the cut and fill mining method is sufficiently flexible to accommodate the variations in stope geometry, it is one of the more expensive mining methods. MSC appear to have a good understanding of the behavior of the various vein systems and, as a result, are currently evaluating the merits of implementing the long hole stoping method. Long hole open stoping would provide a lower cost mining method but would also carry either a higher mining dilution or lower mining recovery. This occurs as a result of the longer down-dip single-pass drill lengths. The higher dilution and lower recovery will likely be an acceptable trade-off for the lower mining cost.
| |
SRK Consulting (U.S.), Inc. | May 29, 2009 |
Exhibit 99.1
| |
Minera Andes Inc. | 17-8 |
San José Silver-Gold Project | NI 43-101 Technical Report |
17.3
Processing
The original plan for the San José process plant was based on AMEC Feasibility Study for treating 750t/d of Au-Ag ore from the Huevos Verdes and Frea deposits. The annual ore throughput for the process plant after the initial commissioning process was estimated at 273,750t, according to the AMEC Feasibility Study. However, in the Gekko process design criteria, this was modified to 730t/d and an annual tonnage of 266,300t at an average ore grade of 7.7g/t of Au and 406g/t Ag. The San José process plant initiated its commissioning process during the third quarter of 2007. Prior to achieving its design capacity of 750t/d, MSC announced an expansion of the San José process plant to 1,500t/d. For the most part this capital expansion was completed by October 2008. By December 2008 mill throughput had increased to an average of 1,342 t/d, or 89% of the designed increased ca pacity. The San José process plant was designed to only produce one final product, doré. However, due to processing problems, it produced and sold three products in 2008 – doré, flotation concentrate and EW precipitate sludge (see Table 14.4.1.1). By the end of 2008, only about 35% of the sold Au and 31% of the sold Ag were contained in the doré with about 48% sold as Au and 50% sold as Ag in flotation concentrate. MSC is currently evaluating the potential of producing 100% of its Au and Ag in doré. MSC has contracted CH2M Hill to complete the basic engineering for this work which is expected to be completed during 2009. The current capital estimate for this project is US$11 million, of which MSC has already purchased about US$6 million to date -- primarily for equipment. For this analysis, SRK has assumed that Au and Ag production will be 50% as doré and 50% as flotation concentrate for the LoM as no firm decision has been made to date on this capital project.
The RoM ore is hauled from the mines to coarse ore stockpiles near the primary crusher at the process plant. The RoM ore is reclaimed by a front-end loader and dumped into a surge bin ahead of the primary crusher. The ore is crushed to a nominal -3/8in size and ground to P80 110µm in a ball mill, rougher and cleaner flotation and concentrate cyanide intensive leaching. Gold and silver are recovered by direct EW and a resin column and refined to produce doré bars. The final design for the process plant was done by Gekko, an Australian supplier of processing equipment. The complete plant after grinding was constructed and supplied in modules by Gekko or their sub-contractors.
The expansion to 1,500t/d included the installation of following mostly duplicating the existing 750t/d circuits:
·
A second line for secondary crushing;
·
Additional fine ore bin capacity;
·
A second ball milling circuit;
·
Additional rougher and cleaner flotation capacity; and
·
Additional flotation concentrate and tailings thickeners.
The processing plant is comprised of the following unit processes:
·
Two-stage crushing plant;
| |
SRK Consulting (U.S.), Inc. | May 29, 2009 |
Exhibit 99.1
| |
Minera Andes Inc. | 17-9 |
San José Silver-Gold Project | NI 43-101 Technical Report |
·
Ball mill grinding in closed circuit with primary gravity and cyclones;
·
Primary rougher and cleaner gravity concentration using Gekko In-Line Pressure Jigs;
·
Primary gravity concentrate open circuit with ball mill regrind;
·
Scavenger gravity concentration using centrifugal gravity concentrator;
·
Rougher and cleaner flotation;
·
Concentrate disc filtration;
·
Intensive cyanidation in Gekko continuous ILR units;
·
CCD washing of leach tailings slurry and solution recovery;
·
Direct EW of leach solutions;
·
Resin ion exchange column scavenging recovery from CCD wash solutions from stripping and EW;
·
SO2-Air cyanide destruction of CCD washed leach tailings;
·
Thickening of flotation tailings; and
·
Precious metal sludge retorting and smelting for doré production.
Figure 17-2 contains a simplified flows of the San José process plant.
17.3.1
Recoverability
The design Au and Ag recovery was estimated at 83% and 87%, respectively, based on the Gekko metallurgical work. For the production year 2008, the actual Au and Ag recoveries were 83.29% for Au and 82.24% for Ag, or about 2.47% and 3.42% below budget, respectively (see Table 14.4.1.1). In 2008, both the Au and Ag recoveries were erratic with Au varying from a low of 72.6% to a high of 89.6%, Ag varying from a low of 72.7% to a high of 88.83%; and in the months of November and December 2008, both Au and Ag recoveries were significantly below budget at around 78% and 74%, respectively.
SRK has estimated that the Au and Ag recoveries will average 83.7% and 83.3%, respectively, based on the available historic production data and forecast ore grades. The LoM Au and Ag production is estimated at 284.1koz and 19.7Moz respectively, in doré (50%) and flotation concentrate (50%) as summarized in Table 17.3.1.1.
| |
SRK Consulting (U.S.), Inc. | May 29, 2009 |
Exhibit 99.1
| |
Minera Andes Inc. | 17-10 |
San José Silver-Gold Project | NI 43-101 Technical Report |
Table 17.3.1.1: SRK’s LoM Production Forecast for San José
| | | | | | |
Description | Units | 2009 | 2010 | 2011 | 2012 | Totals |
Ore Processed | t | 529,934 | 540,309 | 270,072 | 180,200 | 1,520,515 |
Gold Grade | g/t | 6.94 | 7.14 | 6.72 | 6.68 | 6.94 |
Silver Grade | g/t | 436 | 475 | 578 | 510 | 484 |
Gold Recovery | % | 83.6 | 83.9 | 83.7 | 83.8 | 83.7 |
Silver Recovery | % | 82.6 | 82.7 | 84.8 | 84.0 | 83.3 |
Doré Production | oz | 3,179,422 | 3,542,492 | 2,206,803 | 1,288,161 | 10,216,879 |
Gold Production In Doré | oz | 49,437 | 51,994 | 24,416 | 16,199 | 142,046 |
Silver Production In Doré | oz | 3,063,373 | 3,413,191 | 2,126,255 | 1,241,143 | 9,843,963 |
Concentrate Production | t | 15,898 | 16,209 | 8,102 | 5,406 | 45,615 |
Gold Production In Conc | oz | 49,437 | 51,994 | 24,416 | 16,199 | 142,046 |
Silver Production In Conc | oz | 3,063,373 | 3,413,191 | 2,126,255 | 1,241,143 | 9,843,963 |
Total Gold Production | oz | 98,874 | 103,988 | 48,832 | 32,398 | 284,092 |
Total Silver Production | oz | 6,126,746 | 6,826,383 | 4,252,510 | 2,482,286 | 19,687,925 |
17.4
Markets and Contracts
In February 2008, MSC entered into a refining contract with Norddeutsche Affinerie (NA) where NA agreed to purchase concentrates from the Project.
On August 1, 2008, MSC entered into a refining contract with Argor-Heraeus (AH) of Switzerland where AH agreed to purchase all doré from the project.
17.5
Environmental Considerations
As reported in the NI 43-101 Technical Report (AMEC, 2007b), the conceptual reclamation and closure plan for the San José mine consists of:
·
Removal of all surface structures and installations except those necessary to support post-closure monitoring;
·
Backfill of remaining surface waste rock into the underground workings;
·
Closure of access ramps to reduce the risk of unauthorized access;
·
Conversion of water diversion channels for long-term performance; and
·
Post-closure monitoring in accordance with an approved program and participation by the authorities and community.
During the final year of operation, the flotation tails will be mixed with a higher cement content and spread over the entire tailings facility to provide an impermeable and physically strong engineered barrier with a minimum thickness of 1m.
The estimated constant dollar cost (AMEC, 2007b) for reclamation and closure of the San José mine is US$3,300,000.
17.6
Taxes and Royalties
In January 2008, the Argentinean Government reassessed regulations levying export duties on mining companies operating in the country, negatively affecting many operators. This change in governmental policy and practice in respect of export duties did not impact the Project as MSC is party to a fiscal stability agreement that specifically fixes the export duty for doré bars at 5% and at 10% for concentrates.
| |
SRK Consulting (U.S.), Inc. | May 29, 2009 |
Exhibit 99.1
| |
Minera Andes Inc. | 17-11 |
San José Silver-Gold Project | NI 43-101 Technical Report |
A new mining operation is entitled to national, provincial, and municipal tax exemptions for five years. The exemptions commence with the awarding of formal title to the mine. As discussed above, the Mining Investment Act has established a 30-year guarantee of fiscal stability for new mining projects and/or extension of existing projects which applies retroactively, once approved, to the date of presentation of the feasibility study for the project. The law allows for accelerated depreciation of capital goods, deductions in exploration costs, and access to machinery and equipment at international prices. Depreciation of infrastructure occurs over a three year time period (60% depreciation in the first year, 20% in the second and 20% in the third) while all other depreciation occurs in a straight line method of 33.33%.
The major taxes that affect the mining sector are National Income Tax (35%), Gross Revenue Tax (1% of revenue, depending on the province) and Mining Royalties (up to a maximum of 3% of the “mouth of mine” value of production, depending on the province).
Under the Mining Investment Act, Argentina’s mineral resources are subject to a provincial royalty capped at 3% of the “mouth of mine” (pit-head) value of production, which provinces are entitled to waive or reduce, provided the province on where the mineral resources are located adheres to said law.
The province of Santa Cruz, where the Project is located, adhered to the Mining Investment Act by provincial law nº 2332.
In accordance to the applicable regulations, the Province of Santa Cruz is entitled to impose different royalty tax rates after evaluating the economic and social benefits that each particular mine operation brings to the Province, provided, the royalty does not exceed the 3% cap determined by the Mining Investment Act.
In that respect, the Province of Santa Cruz has issued local regulations setting for a range of royalties rates up to a maximum rate of 3% of the “mouth of mine” value of production applicable to mineral exploitation in the province.
In the specific case of MSC, the Provincial Mining Authority has established that doré from the Project will be subjected to the 1.85% royalty rate and that concentrates and precipitates will be subjected to the 2.55% royalty rate.
Under the Mining Investment Act, MSC has been granted two tax stability certificates in relation to provincial and federal taxes in Argentina in respect of the Project that fixes the export duty for doré bars at 5% and 10% for concentrates. The stability certificates have a term of 30 years commencing on November 18, 2005 (date of filing of feasibility study).
Under this general framework, the mining royalties and export duties applicable to the Project can be summarized as following:
(i)
the mining royalty is fixed at 1.85% of the pit-head value for doré and 2.55% for mineral concentrates or precipitates; and
(ii)
the National Export Tax is fixed at 5% for doré and 10% for concentrates or precipitates although rebates are available if the final products are shipped from a Patagonian maritime port (depending on the port of exportation these rebates will be reduced to nil as from 2009 and 2010).
| |
SRK Consulting (U.S.), Inc. | May 29, 2009 |
Exhibit 99.1
| |
Minera Andes Inc. | 17-12 |
San José Silver-Gold Project | NI 43-101 Technical Report |
17.7
Capital and Operating Costs
17.7.1
Capital Costs
SRK reviewed the capital expenditure budget for 2009 as provided by MSC, found it to be reasonable, and incorporated it into the economic analysis. The capital expenditure budget for subsequent years was not available and as a result, SRK has made estimates where required. The LoM capital costs are estimated at US$26.9 million as detailed in Table 17.7.1.1. Of this total, about 86% is contained in the 2009 budget with the mining capital comprising US$18.4 million, or 80% of the 2009 budget.
Table 17.7.1.1: LoM Capital Cost Estimates for San José (US$000s)
| | | | | |
Description | 2009 | 2010 | 2011 | 2012 | Totals |
Sustaining-Operational Capital | | | | | |
Mine | 18,390 | 0 | 0 | 0 | 18,390 |
Chemical Laboratory | 62 | 60 | 30 | 8 | 160 |
Metallurgical Laboratory | 48 | 48 | 24 | 7 | 126 |
Plant | 357 | 360 | 180 | 59 | 956 |
Maintenance | 168 | 168 | 84 | 29 | 449 |
Geology | 378 | 0 | 0 | 0 | 378 |
Geotechnical | 6 | 6 | 3 | 1 | 17 |
Logistics | 61 | 60 | 30 | 10 | 161 |
Security | 247 | 240 | 120 | 37 | 643 |
Environmental | 252 | 240 | 120 | 43 | 655 |
Human Resources | 400 | 360 | 180 | 58 | 998 |
Systems | 198 | 192 | 96 | 33 | 518 |
Subtotal Sustaining-Op. | 20,567 | 1,734 | 868 | 283 | 23,451 |
Operational Exploration | 2,140 | 0 | 0 | 0 | 2,140 |
IT | 505 | 480 | 240 | 75 | 1,300 |
Total Capital Expenditures | 23,211 | 2,214 | 1,108 | 358 | 26,891 |
As previously noted, MSC is currently evaluating the possibility of converting the process plant to produce 100% doré. The total budget for this has been estimated at US$11 million, of which US$6 million has been spent mostly on equipment. The capital cost estimate in Table 17.7.1.1 does not include any allowance for the additional US$5 million as the final decision for this is on hold pending further review.
17.7.2
Operating Costs
The LoM operating costs are comprised of the following cost areas:
·
Geology and Mining;
·
Plant; and
·
Infrastructure and G&A.
LoM total operating and unit costs are shown in Table 17.7.2.1.
| |
SRK Consulting (U.S.), Inc. | May 29, 2009 |
Exhibit 99.1
| |
Minera Andes Inc. | 17-13 |
San José Silver-Gold Project | NI 43-101 Technical Report |
Table 17.7.2.1: LoM Operating Cost Estimates for San José
| | |
Description | LoM Cost (US$000s) | LoM Unit Costs (US$/t-processed) |
Geology and Mining | $56,606 | $37.23 |
Plant | $44,781 | $29.45 |
Infrastructure and G&A | $84,177 | $55.36 |
Operating Costs | $185,564 | $122.04 |
The LoM unit operating cost (US$/t) is higher than the ECOV as a result of increased operating costs incurred in years 2011 and 2012 when the production rate is 750t/d and 500t/d respectively.
17.7.3
Payback
Payback does not apply as this Project is an ongoing operation.
17.8
Economic Analysis
Technical-economic results summarized in this section are based upon work performed by SRK and are summarized in this section.
17.8.1
LoM Plan and Economics
The SRK LoM plan and economics are based on the following:
·
Gold and silver prices of US$850/oz and US$12.50/oz respectively;
·
Reserves at June 30, 2008 (1.6Mt at an average grade of 6.88g/t-Au and 486g/t-Ag) were depleted for the production to December 31, 2008. Depletion is shown in Table 16.1.1. The economic model used the remaining reserves of 1.5Mt at an average grade of 6.94g/t-Au and 484g/t-Ag, containing a total of 339koz of gold and 23.7Moz of silver;
·
A remaining mine life of four years, with 2009 and 2010 at 1500t/d 2011 at 750t/d and 2012 at 500t/d, at a total average rate of 375kt/y as of December 31, 2008. The production rates were reduced in 2011 and 2012 to reflect the reduced number of available working areas;
·
An overall average metallurgical recovery rate of 86.4% for gold and 84.6% for silver, producing 142koz of gold in doré, 151koz gold in concentrate, and 9.8Moz of silver in doré and 10.2Moz silver in concentrate over the LoM;
·
A cash cost of US$156/ore-tonne;
·
Total capital costs of US$26.9 million are comprised of US$23.5 million for sustaining mining and process capital, US$2.1 million for on-going exploration and US$1.3 million for information technology; and
·
No provision has been made for salvage value.
Technical-economic analysis results, shown in Table 5, indicate a pre-tax Net Present Value (NPV) of US$205 million at an 8% discount rate.
| |
SRK Consulting (U.S.), Inc. | May 29, 2009 |
Exhibit 99.1
| |
Minera Andes Inc. | 17-14 |
San José Silver-Gold Project | NI 43-101 Technical Report |
Table 17.8.1.1: LoM: LoM Economic Results
| |
Description | LoM Value |
Ore | |
Ore Milled | 1.520kt |
Gold Grade | 6.94g/t |
Silver Grade | 483.7g/t |
Contained Gold | 339koz |
Contained Silver | 23.6Moz |
Gold Recovery Dore | 83.7% |
Silver Recovery Dore | 83.3% |
Gold Recovery Concentrate | 89.0% |
Silver Recovery Concentrate | 86.0% |
Doré Production | 10.2Moz |
Gold in Doré | 142koz |
Silver in Doré | 9.8Moz |
Gold in Concentrate | 151koz |
Silver in Concentrate | 10.2 Moz |
Total Gold | 293koz |
Total Silver | 20.0Moz |
Estimate of Cashflow (US$000s) | |
Gross Revenue | $499,205 |
Doré Treatment Charges | ($12,782) |
Concentrate Treatment Charges | ($39,560) |
Net Smelter Return(LoM average US$293.89/t-ore) | $446,863 |
Royalties | ($98) |
Gross Income From Mining | $446,765 |
Operating & Capital Cost | |
Mining and Geology | ($56,606) |
Plant | ($44,781) |
Infrastructure and G&A | ($84,177) |
Operating Costs | ($185,564) |
Cash Cost (US$/t-ore) | $156.40/t |
Cash Operating Margin (EBITDA) | $261,201 |
Capital Cost | |
Sustaining | ($23,451) |
On-going Exploration | ($2,140) |
Information Technology | ($1,300) |
Salvage | 0 |
Capital Costs | ($26,891) |
Cash Flow | $234,310 |
Cash Flow (NPV8%) | $205,058 |
17.8.2
Sensitivity
Sensitivity analyses for key economic parameters are shown in Table 17.8.2.1. This analysis suggests that the Project is most sensitive to market price. The Project is least sensitive to capital costs, which is expected given the maturity of this Project.
| |
SRK Consulting (U.S.), Inc. | May 29, 2009 |
Exhibit 99.1
| |
Minera Andes Inc. | 17-15 |
San José Silver-Gold Project | NI 43-101 Technical Report |
Table 17.8.2.1: Project Sensitivity (NPV8%, US$000’s)
| | | | | |
Description | -10% | -5% | Base Case | +5% | +10% |
Market Price | $183,054 | $194,056 | - | $216,060 | $227,062 |
Operating Costs | $221,313 | $213,186 | $205,058 | $196,931 | $188,803 |
Capital Costs | $207,617 | $206,338 | - | $203,778 | $202,499 |
A sensitivity analysis for NPV is shown in Table 17.8.2.2
Table 17.8.2.2: Project NPV Sensitivity to discount rate (US$000’s)
| | | | |
0% | 5% | 8% Base Case | 10% | 15% |
$234,310 | $215,404 | $205,058 | $198,540 | $183,459 |
| |
SRK Consulting (U.S.), Inc. | May 29, 2009 |
Exhibit 99.1
| |
Minera Andes Inc. | 17-16 |
San José Silver-Gold Project | NI 43-101 Technical Report |
Figure 17-1: Schematic of Mining Sequence
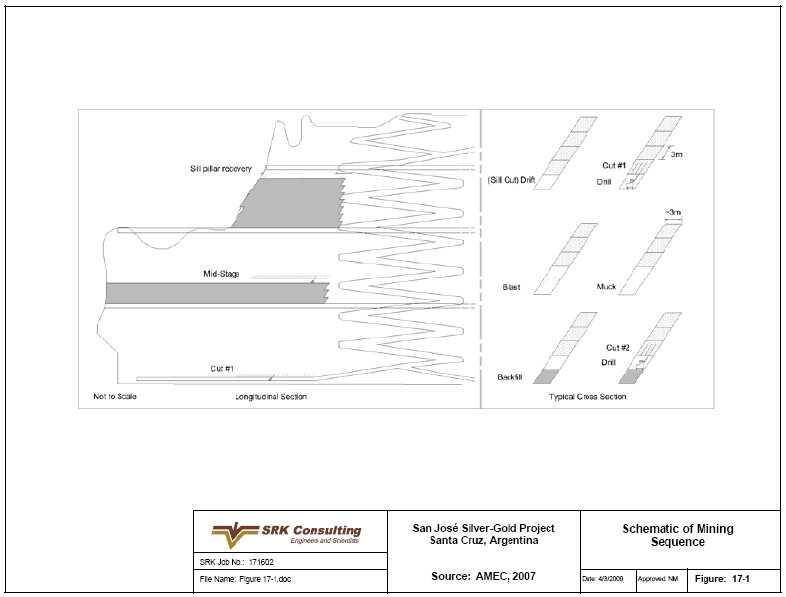
| |
SRK Consulting (U.S.), Inc. | May 29, 2009 |
Exhibit 99.1
| |
Minera Andes Inc. | 17-17 |
San José Silver-Gold Project | NI 43-101 Technical Report |
Figure 17-2: Simplified Flow Sheet - San José Process Plant
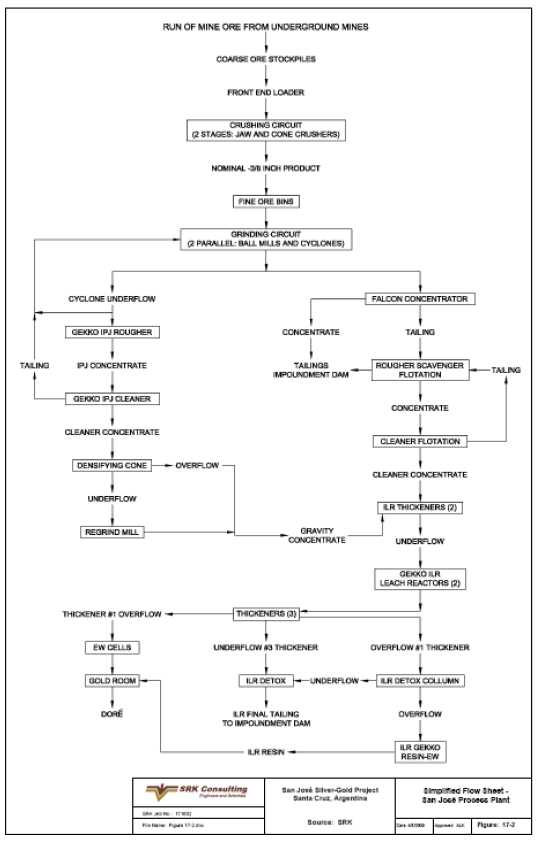
| |
SRK Consulting (U.S.), Inc. | May 29, 2009 |
Exhibit 99.1
| |
Minera Andes Inc. | 18-1 |
San José Silver-Gold Project | NI 43-101 Technical Report |
18
Interpretation and Conclusions(Item 21)
Over a period of five months, SRK reviewed the relevant geological, mining and metallurgical aspects from the Project to obtain a level of understanding that would be sufficient to assess the status of San José as of the effective date of this Technical Report.
The general conclusions obtained from this review are outlined in the following sections.
18.1
Geology and Mineralization
The San José mineralization is hosted by the Mid- to Upper Jurassic Bajo Pobre and Chon Aike volcanic rocks. Gold and silver occur in six separate vein structures that trend to the northwest and dip either northeast or southwest. Outcrops of the vein are rare.
Mineralization is LS epithermal quartz vein, breccias and stockwork systems The most important controls on mineralization appear to be regional normal-sinistral faulting and conjugate shear vaulting.
18.2
Field Surveys
MAI first acquired the San José property in 1997 and explored there until 2001 when it entered into a joint venture with HMC to form MSC. Since that time MSC has conducted property exploration. The exploration methods include:
·
Geological mapping;
·
Soil and stream sediment sampling;
·
Trenching and sampling;
·
CSAMT, IP and Magnetic Geophysical surveys;
·
Petrographic and fluid inclusion studies;
·
RC and core drilling; and
·
Underground channel sampling.
The exploration methods followed a natural progression of gathering regional to local data through mapping, soil and stream sediment sampling, geophysics, and trenching, followed by drilling. Geophysics continues to be a useful tool to identify additional targets.
The methods utilized by the companies involved in the Project follow industry standards.
18.3
Analytical and Testing Data
MAI and MSC have used Alex Stewart laboratory in Mendoza as the primary assay laboratory for most of the drilling. Check assaying has been done at ALS Chemex in la Serena, Chile. The mine is operating its own laboratory on site and that lab has been used for some of the samples produced in the last year.
SRK has reviewed the AMEC (2007b) report on QA/QC and various monthly reports to assess the QA/QC procedures and considers that the data is suitable for resource estimation.
| |
SRK Consulting (U.S.), Inc. | May 29, 2009 |
Exhibit 99.1
| |
Minera Andes Inc. | 18-2 |
San José Silver-Gold Project | NI 43-101 Technical Report |
18.4
Mineral Resources
The mineral resources for the San José property were estimated by MSC and HMP with input from geologists at the property. The resource estimation has followed industry standard practices of constructing wireframes for the vein structures, capping, compositing and kriging or inverse distance squared estimations. The classification requires a minimum of three drillholes for measured resources with the closest composite within 33 to 70% of the variogram range; a minimum of two drillholes with the closest composite within 67 to 130% of the variogram range for indicated resources; a minimum of one drillhole with the closest composite with 100 to 200% of the variogram range was required for inferred resources.
18.5
Mineral Reserves
SRK has reviewed MSC’s reserve estimation methodology and concluded that some aspects of the methodology may produce an estimate that does not reflect the actual mining conditions. As a result, SRK has produced an independent reserve estimate utilizing their own methodology and assumptions.
18.6
Economics
The economic analysis shows a positive cash flow that supports the resource and reserve estimate. The life of mine cash cost is US$156/t of ore and the remaining capital expenditure will be US$26.9 million.
The operating costs include all costs required to produce at a rate of 1,500t/d including all mine development (e.g. ramps, ventilation raises, etc) for the years 2009 to 2010 and then at a reduced rate of 750t/d in 2011 and 500t/d in 2012.
At an 8% discount rate the NPV US$205 million.
The sensitivity analysis was performed on the Base Case NPV (using an 8% discount rate) and the project is not particularly sensitive to capital cost but is sensitive to metal price.
18.7
Other Relevant Information
18.7.1
Mine Development and Production
The underground production rate is gradually being increased from 750t/d (270,000t/y) to 1,500t/d (540,000t/y). MSC had originally planned to achieve 1,500t/d in October 2008, however, delayed access to the Kospi vein (due to difficult ground conditions encountered in the Kospi decline) has deferred the increased production rate. The Kospi vein was intersected in early 2009. Initial production is expected to commence soon after, thus providing the additional working areas to achieve the mining rate of 1,500t/d.. At that time, there will be a total of five separate production areas at the mine – HVS, HVC, HVN, Frea and Kospi.
The Huevos Verdes complex, Frea and Kospi are all accessed by separate decline systems. The adverse ground conditions encountered in the Kospi decline required the use of steel arched sets and shotcrete.
The Huevos Verdes vein is the narrowest and is exploited mostly by the CC&F mining method. Frea is generally wider than 2m and utilizes the MC&F. The current resource data available for Kospi suggests that it will be mined by the MC&F method.
| |
SRK Consulting (U.S.), Inc. | May 29, 2009 |
Exhibit 99.1
| |
Minera Andes Inc. | 18-3 |
San José Silver-Gold Project | NI 43-101 Technical Report |
The MC&F stopes utilize a single-boom jumbo for both development and production drilling. Jacklegs and pneumatic rock drills are used in the CC&F stopes. Broken ore is removed from the stopes by LHDs ranging in size from 1.5yd3to 4.0yd3. A fleet of 20t trucks are used to haul the ore to the surface.
Mine dewatering is achieved with a combination of natural drainage, settling sumps and Grindex 50hp submersible pumps. Water pumped from underground is discharged to a surface settling pond. Fresh water for use underground is sourced from the surface settling pond.
Compressed air is required in the underground mines for the operation of hand-held drills, small water pumps, explosives loading apparatus (ANFO loader), small hoists and raise boring. There are air compressors located at each portal that will meet these needs.
Electrical power is currently sourced from diesel-fired power generators. An over-head power transmission line, connecting to the national power grid, is currently being installed and expected to be brought on line in Q1 2009. The cost of electrical power will reduce accordingly.
The primary ventilation at Huevos Verdes, Frea and Kospi all utilize the negative pressure system in which the main (primary) ventilation fan draws the used air from the mine. Fresh air enters the mine through either the main access decline or a dedicated fresh air raise where it is directed to each of the working areas via secondary ventilation system.
Waste rock from development is used as backfill in the cut and fill stopes. The development waste is usually hauled to a surface stockpile and then rehandled to waste passes when it is required underground. When the demand for backfill exceeds the supply from waste development, MSC will establish a borrow pit to quarry the local till.
MSC is currently exploring possibility of implementing the long-hole stoping mining method. This is expected to reduce the mining cost with increased dilution and lower mining recovery.
| |
SRK Consulting (U.S.), Inc. | May 29, 2009 |
Exhibit 99.1
| |
Minera Andes Inc. | 19-1 |
San José Silver-Gold Project | NI 43-101 Technical Report |
19
Recommendations(Item 22)
19.1
Geology and Resources
SRK recommends the following:
·
Investigation of oxidation and sulfide domains within the mineralogical zones;
·
Use of core no smaller than NQ to provide as large a sample as possible;
·
Standardization of channel sample collection;
·
Analysis of QA/QC data over time;
·
Density determinations for Ayelen, Odin and HVR;
·
Evaluate lithologic controls on vein mineralization; and
·
Inclusion of all mined areas in wireframes to facilitate reconciliation between mined and modeled tonnage and grades.
The estimated cost for the completion of the recommendations discussed above is US$15,000.
19.2
Mining and Reserves
SRK recommends the following:
·
Implement a more rigorous process for conversion of Mineral Resource to Mineral Reserves, specifying category, cut-off value, dilution and mining recovery parameters used for each stope;
·
Establish a system of ore reconciliation with the resource model and the processing plant with complete documentation;
·
Substantiate and document the mining recovery factors with operational experience and rigorous reconciliations;
·
Improve the standard of road maintenance. This will lead to increased truck cycle times, reduced truck maintenance costs and reduced operator fatigue;
·
Assess mining method alternatives for the recovery of sill pillars, which will likely encounter adverse ground conditions;
·
Excavations where back spans exceed 3m and where RMR value is less than 50 should be systematically bolted using a minimum 1.8m (effective length) bolt; and
·
Carry out an engineering evaluation of long hole open stoping as an alternative mining method. This should be fully documented.
The estimated cost for the completion of the recommendations discussed above is US$250,000.
19.3
Metallurgy and Processing
SRK recommends a metallurgical audit of the San José process plant by an independent third-party to examine the reason(s) for the very erratic Au and Ag recoveries observed on a month to month basis during 2008 and the low Ag recovery versus the Gekko test work.
The estimated cost for the completion of the recommendations discussed above is US$25,000.
| |
SRK Consulting (U.S.), Inc. | May 29, 2009 |
Exhibit 99.1
| |
Minera Andes Inc. | 20-1 |
San José Silver-Gold Project | NI 43-101 Technical Report |
20
References(Item 23)
AMEC, 2007a. NI 43-101 Technical Report on the San José Property, Santa Cruz Province Argentina, Prepared for Minera Andes, Incorporated by AMEC Americas, Ltd., June 30 2007
AMEC, 2007b. NI 43-101 Technical Report Update on the San José Property, Santa Cruz Province Argentina, Prepared for Minera Andes, Incorporated by AMEC Americas, Ltd., October 1, 2007CIM, 2004.CIM Definition Standards on Mineral Resources and Mineral Reserves, Prepared by the CIM Standing Committee on Reserve Definitions.
Degerstrom, 1998. Metallurgical Report, Testwork on Cerro Saavedra Samples, October 21, 1998.
Degerstrom, 1999. Metallurgical Report, Huevos Verdes/El Pluma Samples, Santa Cruz, Argentina,December 27, 1998.
Gaines, R.V., Skinner, H.C.W, Foord, E.E., Mason, B., Rosenzweig, A., 1997. Dana’s New Mineralogy: The System of Mineralogy of James Dwight Dana and Edward Salisbury Dana, John Wiley & Sons, Inc.
Gekko, 2007. Hochschild – San José Testwork Report version 1.0, In-house report prepared by Gekko Systems for Hochschild.
Godoy, B., 2007. Argentina: Mining Prospecting and Exploration Legal Framework-Guidelines for Foreign Investors, 02 January 2007, Environmental & Energy website accessed January 8, 2009, http://www.mondaq.com/article.asp?articleid=45028.
Hochschild Mining PLC, 2007. Annual Report & Accounts, pp. 131-133.
Hochschild Mining, 2008. Monthly QA/QC Report for June 2008, Unpublished Report, 10p.
Hochschild Mining, 2008a. Monthly QA/QC Report for July 2008, Unpublished Report, 15p.
Hochschild Mining, 2008b. Monthly QA/QC Report for August 2008, Unpublished Report, 14p.
Joint Ore Reserves Committee (JORC), 2004.Australasian Code for Exploration Results, Mineral Resources and Ore Reserves. Report of Reserves Committee of the Australasian Institute of Mining and Australian Institute of Geoscientists and Minerals Council of Australia.
Minera Andes, Inc., 2007. Minera Andes Inc. Management’s Discussion and Analysis of Financial Conditions and Plan of Operations, April 17, 2007.
Minera Andes, Inc., 2007. Minera Andes Inc. Management’s Discussion and Analysis of Financial Conditions and Plan of Operations, Published on System for Electronic Document Analysis (SEDAR), April 30, 2007, 31p.
Minera Andes, Inc., 2008. Minera Andes Inc. Management’s Discussion and Analysis of Financial Conditions and Plan of Operations, August 14, 2008.
Minera Andes, Inc., 2008. Minera Andes Inc. Management’s Discussion and Analysis of Financial Conditions and Plan of Operations, November 10, 2008.
| |
SRK Consulting (U.S.), Inc. | May 29, 2009 |
Exhibit 99.1
| |
Minera Andes Inc. | 20-2 |
San José Silver-Gold Project | NI 43-101 Technical Report |
Minera Andes, Inc., 2009. Form 6K—Material Change Report, Published on System for Electronic Document Analysis (SEDAR), January 29, 2009, 8p.
Minera Andes, Inc., 2009. Annual Information Form for the Year Ended December 31, 2008.
Minera Santa Cruz S.A., June 2008. Mineral Resources and Reserves Report, San José Project, Santa Cruz, Argentina.
SGS Lakefield Research Laboratory, 2005. An Investigation of Gold and Silver Recovery for San José Project Samples, prepared for Minera Santa Cruz.
Tecsup, November 2002. Applied Research Service for The Gravimetric Concentration, Flotation and Cyanidation of Ore from the San José Project, prepared for Cia. Minera Ares, S.A.
Tecsup, 2007. Pruebas Metallurgicas de Concentracion Gravimetrica y Flotacion del Mineral Argentifero Unidad San José, Veta Kospi, Muestra N°1, prepared for Cía. Minera Ares S.A.
| |
SRK Consulting (U.S.), Inc. | May 29, 2009 |
Exhibit 99.1
| |
Minera Andes Inc. | 21-1 |
San José Silver-Gold Project | NI 43-101 Technical Report |
21
Glossary
21.1
Mineral Resources and Reserves
21.1.1
Mineral Resources
The mineral resources and mineral reserves have been classified according to the “CIM Standards on Mineral Resources and Reserves: Definitions and Guidelines” (December 11, 2005). Accordingly, the Resources have been classified as Measured, Indicated or Inferred, the Reserves have been classified as Proven and Probable based on the Measured and Indicated Resources as defined below.
A Mineral Resource is a concentration or occurrence of natural, solid, inorganic or fossilized organic material in or on the Earth’s crust in such form and quantity and of such a grade or quality that it has reasonable prospects for economic extraction. The location, quantity, grade, geological characteristics and continuity of a Mineral Resource are known, estimated or interpreted from specific geological evidence and knowledge.
An ‘Inferred Mineral Resource’ is that part of a Mineral Resource for which quantity and grade or quality can be estimated on the basis of geological evidence and limited sampling and reasonably assumed, but not verified, geological and grade continuity. The estimate is based on limited information and sampling gathered through appropriate techniques from locations such as outcrops, trenches, pits, workings and drillholes.
An ‘Indicated Mineral Resource’ is that part of a Mineral Resource for which quantity, grade or quality, densities, shape and physical characteristics can be estimated with a level of confidence sufficient to allow the appropriate application of technical and economic parameters, to support mine planning and evaluation of the economic viability of the deposit. The estimate is based on detailed and reliable exploration and testing information gathered through appropriate techniques from locations such as outcrops, trenches, pits, workings and drillholes that are spaced closely enough for geological and grade continuity to be reasonably assumed.
A ‘Measured Mineral Resource’ is that part of a Mineral Resource for which quantity, grade or quality, densities, shape, physical characteristics are so well established that they can be estimated with confidence sufficient to allow the appropriate application of technical and economic parameters, to support production planning and evaluation of the economic viability of the deposit. The estimate is based on detailed and reliable exploration, sampling and testing information gathered through appropriate techniques from locations such as outcrops, trenches, pits, workings and drillholes that are spaced closely enough to confirm both geological and grade continuity.
21.1.2
Mineral Reserves
A Mineral Reserve is the economically mineable part of a Measured or Indicated Mineral Resource demonstrated by at least a Preliminary Feasibility Study. This Study must include adequate information on mining, processing, metallurgical, economic and other relevant factors that demonstrate, at the time of reporting, that economic extraction can be justified. A Mineral Reserve includes diluting materials and allowances for losses that may occur when the material is mined.
| |
SRK Consulting (U.S.), Inc. | May 29, 2009 |
Exhibit 99.1
| |
Minera Andes Inc. | 21-2 |
San José Silver-Gold Project | NI 43-101 Technical Report |
A ‘Probable Mineral Reserve’ is the economically mineable part of an Indicated and in some circumstances a Measured Mineral Resource demonstrated by at least a Preliminary Feasibility Study. This Study must include adequate information on mining, processing, metallurgical, economic and other relevant factors that demonstrate, at the time of reporting, that economic extraction can be justified.
A ‘Proven Mineral Reserve’ is the economically mineable part of a Measured Mineral Resource demonstrated by at least a Preliminary Feasibility Study. This Study must include adequate information on mining, processing, metallurgical, economic and other relevant factors that demonstrate, at the time of reporting, that economic extraction is justified.
| |
SRK Consulting (U.S.), Inc. | May 29, 2009 |
Exhibit 99.1
| |
Minera Andes Inc. | 21-3 |
San José Silver-Gold Project | NI 43-101 Technical Report |
21.2
Glossary
Table 21.2.1: Glossary
| |
Term | Definition |
Assay: | The chemical analysis of mineral samples to determine the metal content. |
Capital Expenditure: | All other expenditures not classified as operating costs. |
Composite: | Combining more than one sample result to give an average result over a larger distance. |
Concentrate: | A metal-rich product resulting from a mineral enrichment process such as gravity concentration or flotation, in which most of the desired mineral has been separated from the waste material in the ore. |
Crushing: | Initial process of reducing ore particle size to render it more amenable for further processing. |
Cut-off Grade (CoG): | The grade of mineralized rock, which determines as to whether or not it is economic to recover its gold content by further concentration. |
Dilution: | Waste, which is unavoidably mined with ore. |
Dip: | Angle of inclination of a geological feature/rock from the horizontal. |
Fault: | The surface of a fracture along which movement has occurred. |
Footwall: | The underlying side of an orebody or stope. |
Gangue: | Non-valuable components of the ore. |
Grade: | The measure of concentration of gold within mineralized rock. |
Hangingwall: | The overlying side of an orebody or slope. |
Haulage: | A horizontal underground excavation which is used to transport mined ore. |
Igneous: | Primary crystalline rock formed by the solidification of magma. |
Kriging: | An interpolation method of assigning values from samples to blocks that minimizes the estimation error. |
Level: | Horizontal tunnel the primary purpose is the transportation of personnel and materials. |
Lithological: | Geological description pertaining to different rock types. |
Material Properties: | Mine properties. |
Milling: | A general term used to describe the process in which the ore is crushed and ground and subjected to physical or chemical treatment to extract the valuable metals to a concentrate or finished product. |
Ore Reserve: | See Mineral Reserve. |
Pillar: | Rock left behind to help support the excavations in an underground mine. |
Sedimentary: | Pertaining to rocks formed by the accumulation of sediments, formed by the erosion of other rocks. |
Shaft: | An opening cut downwards from the surface for transporting personnel, equipment, supplies, ore and waste. |
Sill: | A thin, tabular, horizontal to sub-horizontal body of igneous rock formed by the injection of magma into planar zones of weakness. |
Smelting: | A high temperature pyrometallurgical operation conducted in a furnace, in which the valuable metal is collected to a molten matte or doré phase and separated from the gangue components that accumulate in a less dense molten slag phase. |
Stope: | Underground void created by mining. |
Stratigraphy: | The study of stratified rocks in terms of time and space. |
Strike: | Direction of line formed by the intersection of strata surfaces with the horizontal plane, always perpendicular to the dip direction. |
Sulfide: | A sulfur bearing mineral. |
Tailings: | Finely ground waste rock from which valuable minerals or metals have been extracted. |
Thickening: | The process of concentrating solid particles in suspension. |
Variogram: | A statistical representation of the characteristics (usually grade). |
| |
SRK Consulting (U.S.), Inc. | May 29, 2009 |
Exhibit 99.1
| |
Minera Andes Inc. | 21-4 |
San José Silver-Gold Project | NI 43-101 Technical Report |
Abbreviations
The metric system has been used throughout this Technical Report unless otherwise stated. All currency is in United States dollars. Market prices are reported in US$ per troy oz of gold and silver. Tonnes are metric of 1,000kg, or 2,204.6lbs. The abbreviations presented in Table 21.2.2 are general mining terms and may be used within the text of this Technical Report.
Table 21.2.2: Abbreviations
| |
Abbreviation | Unit or Term |
A | ampere |
AA | atomic absorption |
ARS | Argentinean Nuevo Pesos |
Ag | silver |
Au | gold |
ºC | degrees Centigrade |
CCD | counter-current decantation |
CC&F | Conventional Cut and Fill mining method |
CIL | carbon-in-leach |
CoG | cut-off grade |
cm | centimeter |
cm2 | square centimeter |
cm3 | cubic centimeter |
° | degree (degrees) |
EIS | Environmental Impact Statement |
EMP | Environmental Management Plan |
EW | electrowinning |
FA | fire assay |
ft | foot (feet) |
ft2 | square foot (feet) |
ft3 | cubic foot (feet) |
ft3/min | cubic foot (feet) per minute |
g | gram |
gal | gallon |
GF | gravity/flotation |
g/L | gram per liter |
g-mol | gram-mole |
g/t | grams per tonne |
ha | hectares |
HDPE | Height Density Polyethylene |
hp | horsepower |
HTW | horizontal true width |
ICP | induced couple plasma |
ID2 | inverse-distance squared |
ID3 | inverse-distance cubed |
IFC | International Finance Corporation |
ILR | Intensive Leach Reactor |
ILS | Intermediate Leach Solution |
IS | intermediate-sulfidation |
kA | kiloamperes |
kg | kilograms |
km | kilometer |
km2 | square kilometer |
koz | thousand troy ounce |
kt | thousand tonnes |
kt/d | thousand tonnes per day |
kt/y | thousand tonnes per year |
kV | kilovolt |
kW | kilowatt |
kWh | kilowatt-hour |
kWh/t | kilowatt-hour per metric tonne |
| |
SRK Consulting (U.S.), Inc. | May 29, 2009 |
Exhibit 99.1
| |
Minera Andes Inc. | 21-5 |
San José Silver-Gold Project | NI 43-101 Technical Report |
| |
Abbreviation | Unit or Term |
L | liter |
L/sec | liters per second |
L/sec/m | liters per second per meter |
lb | pound |
LHD | Long-Haul Dump truck |
LLDDP | Linear Low Density Polyethylene Plastic |
LOI | Loss On Ignition |
LoM | Life-of-Mine |
LS | low-sulfidation |
m | meter |
m2 | square meter |
m3 | cubic meter |
masl | meters above sea level |
MARN | Ministry of the Environment and Natural Resources |
MC&F | Mechanized Cut and Fill mining method |
MDA | Mine Development Associates |
mg/L | milligrams/liter |
mm | millimeter |
mm2 | square millimeter |
mm3 | cubic millimeter |
MME | Mine & Mill Engineering |
Moz | million troy ounces |
Mt | million tonnes |
MTW | measured true width |
MW | million watts |
m.y. | million years |
NGO | non-governmental organization |
NI 43-101 | Canadian National Instrument 43-101 |
OSC | Ontario Securities Commission |
oz | troy ounce |
% | percent |
PLC | Programmable Logic Controller |
PLS | Pregnant Leach Solution |
PMF | probable maximum flood |
ppb | parts per billion |
ppm | parts per million |
QA/QC | Quality Assurance/Quality Control |
QP | Qualified Person |
RC | rotary circulation drilling |
RoM | Run-of-Mine |
RQD | Rock Quality Description |
SEC | U.S. Securities & Exchange Commission |
sec | second |
SG | specific gravity |
SPT | standard penetration testing |
st | short ton (2,000 pounds) |
t | tonne (metric ton) (2,204.6 pounds) |
t/h | tonnes per hour |
t/d | tonnes per day |
t/y | tonnes per year |
TSF | tailings storage facility |
TSP | total suspended particulates |
µm | micron or microns, micrometer or micrometers |
US$ | United States dollar |
V | volts |
VFD | variable frequency drive |
W | watt |
XRD | x-ray diffraction |
y | year |
| |
SRK Consulting (U.S.), Inc. | May 29, 2009 |
Exhibit 99.1
Appendix A
Certificates of Authors
Exhibit 99.1
| |
| SRK Consulting (Canada) Inc. Suite 2200 – 1066 West Hastings Street Vancouver, B.C. V6E 3X2 Canada
vancouver@srk.com www.srk.com
Tel: 604.681.4196 Fax: 604.687.5532 |
CERTIFICATE of AUTHOR
I, Leah Mach, CPG, MSc do hereby certify that:
1.
I am currently employed as Principal Resource Geologist of:
SRK Consulting (U.S.), Inc.
7175 W. Jefferson Ave, Suite 3000
Denver, CO, USA, 80235
2.
This certificate relates to the “NI 43-101 Technical Report, Minera Andes Inc., San José Silver-Gold Project, Santa Cruz, Argentina” dated May 29, 2009, with an effective date of January 30, 2009 (the “Technical Report”).
3.
I graduated with a Master of Science degree in Geology from the University of Idaho in 1986.
4.
I am a member of the American Institute of Professional Geologists.
5.
I have worked as a Geologist for a total of 23 years since my graduation from the University of Idaho.
6.
I have read the definition of “qualified person” set out in National Instrument 43-101 (“NI 43-101”) and certify that by reason of my education, affiliation with a professional association (as defined in NI 43-101) and past relevant work experience, I fulfill the requirements to be a “qualified person” for the purposes of NI 43-101.
7.
I am responsible for Sections 2.1 through 2.3, 3.1 through 3.5, 4 through 13, 15.1, 18.1 through 18.4 and 19.1 of the Technical Report relating to the San José Silver-Gold property. I visited the San José property on September 29, 2008 for three days.
8.
I have not had prior involvement with the property that is the subject of the Technical Report.
9.
I am independent of the issuer applying all of the tests in section 1.4 of National Instrument 43-101.
10.
I have read National Instrument 43-101 and Form 43-101F1, and the Technical Report has been prepared in compliance with that instrument and form.
| | |
Australia | Denver | 303.985.1333 |
North America | Elko | 775.753.4151 |
Southern Africa | Reno | 775.828.6800 |
South America | Tucson | 520-544-3688 |
United Kingdom | Toronto | 416.601.1445 |
| Vancouver | 604.681.4196 |
| Yellowknife | 867-699-2430 |
Exhibit 99.1
| |
SRK Consulting (U.S.), Inc. | Page 2 of 2 |
11.
I consent to the filing of the Technical Report with any stock exchange and other regulatory authority and any publication by them for regulatory purposes, including electronic publication in the public company files on their websites accessible by the public, of the Technical Report.
12.
As of the date of this certificate, to the best of my knowledge, information and belief, the Technical Report contains all scientific and technical information that is required to be disclosed to make the Technical Report not misleading.
Dated this 29th Day of May, 2009.
__________”Signed”__________
“Sealed”
Leah Mach, CPG, MSc
CPG 10940
Exhibit 99.1
| |
| SRK Consulting (Canada) Inc. Suite 2200 – 1066 West Hastings Street Vancouver, B.C. V6E 3X2 Canada
vancouver@srk.com www.srk.com
Tel: 604.681.4196 Fax: 604.687.5532 |
CERTIFICATE of AUTHOR
I, Christopher Elliott, B.Eng.(Mining), MAusIMM do hereby certify that:
1.
I am currently employed as Principal Mining Consultant with:
SRK Consulting (Canada) Inc.
2200 – 1066 West Hastings Street
Vancouver BC, Canada V6E 3X2
2.
This certificate relates to the “NI 43-101 Technical Report, Minera Andes Inc., San José Silver-Gold Project, Santa Cruz, Argentina” dated May 29, 2009, with an effective date of January 30, 2009 (the “Technical Report”).
3.
I graduated with B.Eng. degree in Mining Engineering from the Ballarat College of Advanced Education in 1985, a Graduate Diploma in Geoscience from Macquarie University in 1993, a Graduate Diploma in Applied Finance & Investment from the Securities Institute of Australia in 2003 and a First Class Mine Manager’s Certificate of Competency from the Department of Minerals and Energy of WA in 1995.
4.
I am a member of the Australasian Institute of Mining and Metallurgy.
5.
I have worked as a Mining Engineer for a total of 24 years since my graduation from Ballarat College of Advanced Education.
6.
I have read the definition of “qualified person” set out in National Instrument 43-101 (“NI 43-101”) and certify that by reason of my education, affiliation with a professional association (as defined in NI 43-101) and past relevant work experience, I fulfill the requirements to be a “qualified person” for the purposes of NI 43-101.
7.
I am responsible for Sections 1, 2.4 through 2.6, 3.6, 14, 15.2 through 17.8.2, 18.5 through 18.7 and 19.2 through 21 of the Technical Report relating to the San José Silver-Gold property. I visited the San José property on January 28, 2009 for three days.
8.
I have not had prior involvement with the property that is the subject of the Technical Report.
9.
I am independent of the issuer applying all of the tests in section 1.4 of National Instrument 43-101.
10.
I have read National Instrument 43-101 and Form 43-101F1, and the Technical Report has been prepared in compliance with that instrument and form.
| | |
Australia | Denver | 303.985.1333 |
North America | Elko | 775.753.4151 |
Southern Africa | Reno | 775.828.6800 |
South America | Tucson | 520-544-3688 |
United Kingdom | Toronto | 416.601.1445 |
| Vancouver | 604.681.4196 |
| Yellowknife | 867-699-2430 |
Exhibit 99.1
| |
SRK Consulting (U.S.), Inc. | Page 2 of 2 |
11.
I consent to the filing of the Technical Report with any stock exchange and other regulatory authority and any publication by them for regulatory purposes, including electronic publication in the public company files on their websites accessible by the public, of the Technical Report.
12.
As of the date of this certificate, to the best of my knowledge, information and belief, the Technical Report contains all scientific and technical information that is required to be disclosed to make the Technical Report not misleading.
Dated this 29th Day of May, 2009.
__________”Signed”__________
Chris Elliott, B.Eng.(Mining), MAusIMM
Exhibit 99.1
NI 43-101 Technical Report, Minera Andes Inc., San José Silver-Gold Project, Santa Cruz, Argentina, effective as of the 30th day of January, 2009.
Dated this 29th day of May, 2009.
__________”Signed”__________
Leah Mach, CPG, MSc
__________”Signed”__________
Chris Elliott, B.Eng.(Mining), MAusIMM