Exhibit 99.1
UTStarcom Reports Unaudited Third Quarter 2012 Financial Results
BEIJING, China, November 15, 2012 — UTStarcom Holdings Corp. (“UTStarcom” or “the Company”) (NASDAQ: UTSI), a leading provider of media operational support services and broadband equipment products and services, today reported financial results for the third quarter ended September 30, 2012.
In a separate press release issued today, the Company also announced a strategic plan to transform UTStarcom into a higher growth, more profitable business focused on providing next generation media operational support services as well as higher value-added broadband equipment products and services that are targeted to a specific set of customers. The strategy builds on recently announced initiatives, such as the divestiture of the IPTV equipment business, acceleration of the media operational support services business, and appointment of new executive leadership. UTStarcom aims to be a Next Generation Media company and the new plan is expected to result in significant overall improvement in UTStarcom’s business performance over the long-term.
Third Quarter 2012 Highlights
· The Company successfully closed the divestiture of its IPTV business on August 31, 2012 as part of a plan to transition the Company into higher growth, more profitable areas. As of September 30, 2012, the Company did not meet the requirements to report results from the IPTV division separately as discontinued operations.
To enable a comparison of the year-to-date and future periods financial results the Company has prepared non-GAAP results. Included in this press release are quarterly and year-to-date non-GAAP comparisons that exclude financial results from the IPTV business and amortization of PHS deferred revenue. Our GAAP financial results and reconciliation with the non-GAAP numbers discussed in this release are at the end of this press release.
· Third quarter of 2012 non-GAAP net sales decreased 19.1% year over year to $37.0 million, compared to $45.8 million non-GAAP net sales in the third quarter of 2011.
· Third quarter of 2012 non-GAAP gross profit decreased 37.7% year over year to $12.7 million, compared to $20.5 million non-GAAP gross profit in the third quarter of 2011.
· Non-GAAP net loss attributable to UTStarcom’s shareholders was $0.2 million, or non-GAAP basic loss per share of $0.0, in the third quarter of 2012, compared to non-GAAP net income of $3.4 million, or non-GAAP basic income per share of $0.02, for the corresponding period of 2011.
· Cash, cash equivalents and short-term investments were $213.1 million as of September 30, 2012.
UTStarcom Chief Financial Officer Robert Pu stated, “During the third quarter we experienced changes to the mix of our product sales at the international level and this had an impact on sales and margins of our underlying business, excluding the divested IPTV portion. However, our balance sheet is stronger today than it has been in the past as our cash position remains robust, at above the $200M level, and we effectively shed a significant amount of liabilities via the IPTV divestiture. This said, we have more than sufficient working capital to support our broadband business and the funding of our new initiatives.”
UTStarcom President and Chief Executive Officer, William Wong, stated “We are pleased with the fact that our underlying business is still achieving relatively strong gross margins and given the IPTV divestiture we have created a leaner operating model. Nevertheless, the third quarter and year-to-date financial results do underscore the urgency of the transition that UTStarcom is undergoing to adapt to market conditions. We have now fully entered a transformation period that will enable us to strengthen the business in the long-term and our leadership team is excited for the direction that the ‘new’
4
UTStarcom will take as we build out our capabilities to become a Next Generation Media company.”
Third Quarter 2012 Financial Results
The Company successfully closed the divestiture of its IPTV business on August 31, 2012 as part of a plan to transition the Company into higher growth, more profitable areas. As of September 30, 2012, the Company did not meet the requirements to report results from the IPTV division separately as discontinued operations. To enable a comparison of the year-to-date and future periods financial results the Company has prepared non-GAAP results. Included below are quarterly and year-to-date non-GAAP comparisons that exclude financial results from the IPTV business and amortization of PHS deferred revenue. Our GAAP financial results and reconciliation with the non-GAAP numbers discussed in this release are at the end of this press release.
Total Revenues
UTStarcom’s total revenues for the third quarter of 2012 were $40.3 million, a decrease of 51.6% year-over-year from $83.3 million for the corresponding period of 2011. Total revenues for the nine months ended September 30, 2012 were $143.5 million, a decrease of 39.5% year-over-year from $237.1 million for the corresponding period of 2011.
UTStarcom’s non-GAAP total revenues for the third quarter of 2012 were $37.0 million, a decrease of 19.1% year-over-year from $45.8 million for the corresponding period of 2011. Non-GAAP total revenues for the nine months ended September 30, 2012 were $116.3 million, a decrease of 11.9% year-over-year from $132.0 million for the corresponding period of 2011.
Three months ended September 30, 2012 and 2011
· Non-GAAP net sales from equipment for the third quarter of 2012 were $32.1 million, a decrease of 17.2% year-over-year. The decrease was mainly caused by decreased sales of PTN products in Japan and GEPON products in China which was partially offset by increased sales of MSAN products in Japan.
· Non-GAAP net sales from equipment-based services for the third quarter of 2012 were $5.0 million, a decrease of 29.6% year-over-year. The decrease was primarily driven by fewer next generation network (“NGN”) products related services provided in the third quarter of 2012.
Nine months ended September 30, 2012 and 2011
· Non-GAAP net sales from equipment for the nine months ended September 30, 2012 were $99.1 million, a decrease of 7.9% year-over-year. The decrease was mainly driven by decreased sales of PTN products in Japan and GEPON products in China which was partially offset by increased sales of MSAN products in Japan. The $7.4 million of equipment revenue recognized from the Jersey Telecom Limited contract in the second quarter of 2011 also contributed to the year-over-year decrease.
· Non-GAAP net sales from equipment-based services for the nine months ended September 30, 2012 were $16.9 million, a decrease of 30.5% year-over-year. The decrease was mainly due to fewer NGN products related services provided in the third quarter of 2012. The $3.9 million of equipment-based service revenue recognized from the Jersey Telecom Limited contract in the second quarter of 2011 also contributed to the year-over-year decrease.
5
Gross Profit
UTStarcom’s gross profit was $14.3 million, or 35.5% of net sales, for the third quarter of 2012, compared to $31.9 million, or 38.4% of net sales, for the corresponding period of 2011. Gross profit was $54.5 million, or 38.0% of net sales, for the nine months ended September 30, 2012, compared to $85.8 million, or 36.2% of net sales, for the corresponding period of 2011.
UTStarcom’s non-GAAP gross profit was $12.7 million, or 34.4% of net sales, for the third quarter of 2012, compared to $20.5 million, or 44.7% of net sales, for the corresponding period of 2011. Non-GAAP gross profit was $40.7 million, or 35.0% of net sales, for the nine months ended September 30, 2012, compared to $56.6 million, or 42.9% of net sales, for the corresponding period of 2011.
Three months ended September 30, 2012 and 2011
· Non-GAAP gross profit for equipment sales for the third quarter of 2012 was $12.4 million, a decrease of 33.6% year-over-year. Non-GAAP gross margin for equipment sales for the third quarter of 2012 was 38.7%, compared to 48.2% for the corresponding period in 2011. The margin decrease was primarily due to increased sales of MSAN products with relatively lower gross margins compared to PTN products in the third quarter of 2012.
· Non-GAAP gross profit for equipment-based services for the third quarter of 2012 was $0.3 million, a decrease of 82.8% year-over-year. Gross margin for equipment-based services for the third quarter of 2012 was 6.6%, compared to 27.2% for the corresponding period of 2011. The margin decrease was primarily due to fixed services costs remaining relatively constant, despite fewer NGN products related services provided in 2012.
Nine months ended September 30, 2012 and 2011
· Non-GAAP gross profit for equipment sales for the nine months ended September 30, 2012 was $38.4 million, a decrease of 21.5% year-over-year. Gross margin for equipment sales for the nine months ended September 30, 2012 was 38.8%, compared to 45.5% for the corresponding period of 2011. The margin decrease was primarily due to higher equipment gross margin generated from $7.4 million equipment revenue recognized from the Jersey Telecom Limited contract in the second quarter of 2011 and from increased sales of relatively lower margin MSAN products compared to PTN products in 2012.
· Non-GAAP gross profit for equipment-based services for the nine months ended September 30, 2012 was $2.4 million, a decrease of 69.9% year-over-year. Gross margin for equipment-based services for the nine months ended September 30, 2012 was 13.9%, compared to 32.2% for the corresponding period of 2011. The margin decrease was primarily due to fewer NGN products related services provided in 2012, while fixed services costs remained relatively constant.
Operating Expenses
Operating expenses for the third quarter of 2012 were $40.2 million, an increase of 126.3% year-over-year, from $17.8 million for the corresponding period in 2011. Operating expenses for the nine months ended September 30, 2012 were $82.0 million, an increase of 12.2% year-over-year, from $73.0 million for the corresponding period of 2011.
Non-GAAP operating expenses for the third quarter of 2012 were $18.1 million, an increase of 66.7% year-over-year, from $10.8 million for the corresponding period in 2011. Non-GAAP operating expenses for the nine months ended September 30, 2012 were $49.5 million, a decrease of 1.0% year-over-year, from $50.1 million for the corresponding period of 2011.
6
Three months ended September 30, 2012 and 2011
· Non-GAAP SG&A expenses in the third quarter of 2012 were $12.6 million, an increase of 6.5% year-over-year. The increase was primarily due to an increase in settlement fee which partially offset by decrease in personnel costs as a result of restructuring efforts.
· Non-GAAP R&D expenses in the third quarter of 2012 were $6.0 million, an increase of 80.6% year-over-year. The increase was primarily due to an increase in consulting cost for several strategic outsourced design projects.
· Non-GAAP net gains on restructuring for the third quarter of 2012 were $0.2 million, compared to costs of $0.5 million for the corresponding period of 2011. The decrease was primarily the result of the latest restructuring plan in 2009 nearing completion. UTStarcom does not expect to incur additional significant restructuring charges for the remainder of 2012 related to the previous restructuring plans.
· Non-GAAP net gain on divestitures in the third quarter of 2012 was $0.4 million, compared to $4.2 million as a result of contingent gain realized in 2011 upon entering into a three-party assignment agreement to transfer and release all of the remaining obligations in connection with the sale of China PDSN assets in the third quarter of 2010.
Nine months ended September 30, 2012 and 2011
· Non-GAAP SG&A expenses for the nine months ended September 30, 2012 were $33.5 million, a decrease of 19.6% year-over-year. The decrease was primarily due to a decrease in personnel costs as a result of our restructuring efforts. The lower year-over-year SG&A expenses were also the result of recoveries from bad debt and expenses as a result of the relocation of Hangzhou office facility.
· Non-GAAP R&D expenses for the nine months ended September 30, 2012 were $16.2 million, an increase of 71.2% year-over-year. The increase was primarily due to an increase in consulting cost for several strategic outsourced design projects.
· Non-GAAP amortization of intangible assets for the nine months ended September 30, 2012 was approximately $0.4 million compared to $0.9 million for the corresponding period of 2011 as a result of the amortization of intangible assets acquired in the iTV Media investment, formerly Stage Smart. The Company deconsolidated iTV Media in the second quarter of 2012 and the amortization of intangible assets was terminated as of the end of that period.
· Non-GAAP restructuring costs for the nine months ended September 30, 2012 were approximately $0.4 million, a decrease of 83.5% year-over-year. The decrease was primarily the result of the latest restructuring plan in 2009 nearing completion.
· Non-GAAP net gain on divestitures for the nine months ended September 30, 2012 was $1.0 million which was the contingent gain realized in 2012 upon releasing of the remaining obligations in connection with the sale of China Packet Data Services Node (“PDSN”) assets in the third quarter of 2010.
Operating Loss
Operating loss for the third quarter of 2012 was $25.9 million, compared to operating income of $14.2 million for the corresponding period of 2011. Operating loss for the nine months ended September 30, 2012 was $27.5 million, compared to operating income of $12.7 million for the corresponding period of 2011.
7
Non-GAAP operating loss for the third quarter of 2012 was $5.3 million, compared to non-GAAP operating income of $9.6 million for the corresponding period of 2011. Non-GAAP operating loss for the nine months ended September 30, 2012 was $8.8 million, compared to non-GAAP operating income of $6.6 million for the corresponding period of 2011.
Other Income (Expense), Net
Three months ended September 30, 2012 and 2011
Net other income for the third quarter of 2012 was $5.4 million compared to net other expense of $7.3 million for the corresponding period of 2011. Net other income in the third quarter of 2012 primarily consisted of $6.1 million of foreign exchange gain as a result of appreciation in INR against USD in the quarter. Net other expense for the third quarter of 2011 primarily consisted of a $7.2 million foreign exchange loss attributed to the depreciation of INR against USD in the quarter.
Nine months ended September 30, 2012 and 2011
Net other income for the nine months ended September 30, 2012 was $0.8 million compared to net other expense of $3.2 million for the corresponding period in 2011. Net other income for the nine months ended September 30, 2012 primarily consisted of income of $1.5 million by release portion of the reserve related to tax liabilities provided to the buyers of our subsidiary in Korea due to expiration of the statute of limitation. Net other expense for the nine months ended September 30, 2011 primarily consisted of $3.5 million of foreign exchange loss attributed to the depreciation of INR against USD in the first nine months of 2011.
Net Income (Loss)
Net loss attributable to UTStarcom shareholders for the third quarter and the first nine months of 2012 was $20.8 million and $26.7 million, respectively. Net income attributable to UTStarcom shareholders for the third quarter and the first nine months of 2011 was $8.0 million and $9.3 million, respectively. Basic loss per share for the third quarter and the first nine months of 2012 amounted to $0.14 and $0.18, respectively. Basic income per share for the third quarter and the first nine months of 2011 was $0.05 and $0.06, respectively.
Non-GAAP net loss attributable to UTStarcom shareholders for the third quarter and the first nine months of 2012 was $0.2 million and $8.1 million, respectively. Non-GAAP net income attributable to UTStarcom shareholders for the third quarter and the first nine months of 2011 was $3.4 million and $3.1 million, respectively. Non-GAAP basic loss per share for the third quarter and the first nine months of 2012 amounted to $0.0 and $0.05, respectively. Non-GAAP basic and diluted income per share for the third quarter and the first nine months of 2011 was $0.02 and $0.02, respectively.
Cash Flow
· Net cash used by operating activities for the third quarter of 2012 was $7.5 million. The Company’s operating activities were impacted by a change in operating assets and liabilities of $7.0 million.
Non-GAAP net cash used by operating activities for the third quarter of 2012 was $1.8 million. The Company’s operating activities were impacted by a change in operating assets and liabilities of $4.4 million.
8
· Cash used by investing activities for the third quarter of 2012 was $56.0 million, primarily driven by the closing of IPTV divestiture.
Non-GAAP cash used by investing activities for the third quarter of 2012 was $2.9 million, primarily driven by the closing of IPTV divestiture.
· Cash used in financing activities for the third quarter of 2012 was $3.7 million for repurchasing shares of common stock of the Company.
As of September 30, 2012, UTStarcom had cash and cash equivalents and short-term investments of $213.1 million.
Business Outlook
The Company currently believes that fourth quarter trends will follow closely to what was experienced in the third quarter. The Company therefore currently anticipates it will achieve average gross margins of approximately 35% and will be slightly below operating cash flow breakeven in 2012.
Looking further ahead, the new strategic plan announced today is expected to in time result in a more predictable, recurring revenue stream based on an array of sources, including subscription fees, platform licensing fees, and fees on value added services as well as higher margins due to the increased profitability of these revenues. UTStarcom will be focusing its growth efforts in China and across Asia and, based on current plans, the Company expects to invest in and launch its TV over IP services in multiple countries during 2013. The Company anticipates revenue from the new TV over IP services to become the majority revenue contributor for UTStarcom by 2015, with gross margins in that line of the business exceeding 50% in that same timeframe.
Mr. Wong concluded, “We are very focused on the long-term opportunities that are before us and are looking forward to rolling out our new plan that we believe will deliver a more predictable revenue stream, higher margins, and increased profitability.”
About Non-GAAP Financial Measures
To supplement the Company’s consolidated financial results presented in accordance with United States Generally Accepted Accounting Principles (“GAAP”), the Company uses certain non-GAAP measures to present those GAAP metrics as if IPTV business and PHS-related deferred revenue amortization had been excluded prior to each time period reflected. The presentation of these non-GAAP financial measures is not intended to be considered in isolation or as a substitute for the financial information prepared and presented in accordance with GAAP. For more information on these non-GAAP financial measures, please see the table captioned “Reconciliation of GAAP and non-GAAP Financial Data” set forth at the end of this press release.
The Company believes that these non-GAAP financial measures provide meaningful supplemental information regarding its operating performance by excluding amortization of PHS net sales and IPTV related business that may not be indicative of its operating performance. The Company believes that both management and investors benefit from referring to these non-GAAP financial measures in assessing its operating performance and when planning and forecasting future periods. These non-GAAP financial measures also facilitate management’s internal comparisons to the Company’s historical performance. The Company computes its non-GAAP financial measures using the same consistent method from quarter to quarter. The Company believes these non-GAAP financial measures are useful to investors in allowing for greater transparency with respect to supplemental information used by management in its financial and operational decision making. These non-GAAP measures are among the information management
9
uses as a basis for our planning and forecasting of future periods. The presentation of this additional information is not meant to be considered in isolation or as a substitute for results prepared in accordance with GAAP.
Third Quarter 2012 Conference Call Details
UTStarcom’s management will host an earnings conference call at 7:30 a.m. U.S. Eastern Time on Thursday November 15, 2012 (8:30 p.m. Beijing/Hong Kong Time on November 15, 2012).
The conference call dial-in numbers are as follows:
United States: + 1-800-860-2442
International: + 1-412-858-4600
China: 10-800-712-2304
Hong Kong: 800-962475
The conference ID number is 10021309.
A replay of the call will be available one hour after the end of the conference until 9:00 a.m. U.S. Eastern Time on November 23, 2012.
The conference call replay numbers are as follows:
United States: + 1-877-344-7529
International: + 1-412-317-0088
The conference ID number for accessing the recording is 10021309.
Investors will also have the opportunity to listen to the live conference call and the replay over the Internet through the investor relations section of UTStarcom’s web site at: http://www.utstar.com.
About UTStarcom Holdings Corp
UTStarcom is focused on providing next generation media operational support services in the rapidly growing markets for TV over IP services and broadband equipment products and services. UTStarcom is committed to meeting the evolving needs of cable and broadband service providers to enable a more personalized entertainment experience. The Company sells its media operational support services and broadband equipment products and services to operators in both emerging and established broadband and cable markets around the world.
UTStarcom was founded in 1991 and listed on the NASDAQ in 2000. It has operational headquarters in Beijing, China and research and development operations in China and India. In year 2011, the Company deployed a revamped growth strategy that concentrates on providing media operation support services. For more information about UTStarcom, visit the Company’s Web site at http://www.utstar.com.
Forward-Looking Statements
This press release includes forward-looking statements, including statements regarding the Company’s expectations relating to the deployment and growth of its operational support services business, the sufficiency of its cash balance, the Company’s gross margin and cash flow expectations for 2012. These statements are forward-looking in nature and subject to risks and uncertainties that may cause actual results to differ materially and adversely from the Company’s current expectations. These include risks and uncertainties related to, among other things, changes in the financial condition and cash position of
10
the Company, changes in the composition of the Company’s management and their effect on the Company, the Company’s ability to realize anticipated results of operational improvements and benefits of the divestiture transaction, the ability to successfully identify and acquire appropriate technologies and businesses for inorganic growth and to integrate such acquisitions, the ability to internally innovate and develop new products, assumptions the Company makes regarding the growth of the market and the success of the Company’s offerings in the market, and the Company’s ability to execute its business plan and manage regulatory matters. The risks and uncertainties also include the risk factors identified in the Company’s latest Annual Report on Form 20-F and Current Reports on Form 6-K,as filed with the Securities and Exchange Commission. The Company is in a period of transition and the conduct of its business is exposed to additional risks as a result. All forward-looking statements included in this press release are based upon information available to the Company as of the date of this press release, which may change, and UTStarcom assumes no obligation to update any such forward-looking statement.
For investor and media inquiries, please contact:
Jing Ou-Yang
UTStarcom Holdings Corp.
Tel: +86-10-8520-5153
Email: jouyang@utstar.com
May Shen (Beijing)
Tel: +86-10-8591-1951
Email: May.Shen@fticonsulting.com
Daniel DelRe (Hong Kong)
Tel: +852-3768-4547
Email: Daniel.DelRe@fticonsulting.com
Eric Boyriven (New York)
Tel: +212-850-5671
Email: mailto:Eric.Boyriven@fticonsulting.com
11
UTStarcom Holdings Corp.
Unaudited Condensed Consolidated Balance Sheets
| | September 30, | | December 31, | |
| | 2012 | | 2011 | |
| | (In thousands, except par value) | |
ASSETS | | | | | |
Current assets: | | | | | |
Cash, cash equivalents and short-term investments | | $ | 213,091 | | $ | 303,998 | |
Accounts and notes receivable, net | | 12,348 | | 20,216 | |
Inventories and deferred costs | | 129,005 | | 137,484 | |
Prepaids and other current assets | | 52,888 | | 42,099 | |
Total current assets | | 407,332 | | 503,797 | |
Long-term assets: | | | | | |
Property, plant and equipment, net | | 10,580 | | 12,199 | |
Goodwill | | — | | 13,820 | |
Intangible assets, net | | — | | 3,625 | |
Long-term deferred costs | | 24,951 | | 39,741 | |
Other long-term assets | | 63,072 | | 27,758 | |
Total assets | | $ | 505,935 | | $ | 600,940 | |
| | | | | |
LIABILITIES AND EQUITY | | | | | |
Current liabilities: | | | | | |
Accounts payable | | $ | 22,836 | | $ | 23,530 | |
Customer advances | | 84,763 | | 82,589 | |
Deferred revenue | | 44,145 | | 64,989 | |
Other current liabilities | | 40,073 | | 52,679 | |
Total current liabilities | | 191,817 | | 223,787 | |
Long-term liabilities: | | | | | |
Long-term deferred revenue and other liabilities | | 87,474 | | 106,114 | |
Total liabilities | | 279,291 | | 329,901 | |
| | | | | |
Total equity | | 226,644 | | 271,039 | |
Total liabilities and equity | | $ | 505,935 | | $ | 600,940 | |
UTStarcom Holdings Corp.
Unaudited Condensed Consolidated Statements of Operations
| | Three months ended September 30, | | Nine months ended September 30, | |
| | 2012 | | 2011 | | 2012 | | 2011 | |
| | (in thousands, except per share data) | |
| | | | | | | | | |
Net sales | | $ | 40,328 | | $ | 83,297 | | $ | 143,454 | | $ | 237,110 | |
Cost of net sales | | 26,010 | | 51,352 | | 88,998 | | 151,326 | |
Gross profit | | 14,318 | | 31,945 | | 54,456 | | 85,784 | |
| | 35.5 | % | 38.4 | % | 38.0 | % | 36.2 | % |
Operating expenses: | | | | | | | | | |
Selling, general and administrative | | 13,988 | | 14,780 | | 39,738 | | 52,528 | |
Research and development | | 8,243 | | 7,327 | | 23,850 | | 21,591 | |
Amortization of intangible assets | | — | | 310 | | 516 | | 929 | |
Impairment of goodwill and other long-lived assets | | 854 | | — | | 854 | | — | |
Restructuring | | (191 | ) | (509 | ) | 358 | | 2,175 | |
Net loss (gain) on divestiture | | 17,297 | | (4,151 | ) | 16,640 | | (4,185 | ) |
Total operating expenses | | 40,191 | | 17,757 | | 81,956 | | 73,038 | |
| | | | | | | | | |
Operating income (loss) | | (25,873 | ) | 14,188 | | (27,500 | ) | 12,746 | |
| | | | | �� | | | | |
Interest income, net | | 363 | | 369 | | 1,556 | | 1,240 | |
Other income (expense), net | | 5,398 | | (7,305 | ) | 811 | | (3,214 | ) |
Income (loss) before income taxes | | (20,112 | ) | 7,252 | | (25,133 | ) | 10,772 | |
Income taxes benefit(expense) | | (649 | ) | 301 | | (2,806 | ) | (2,461 | ) |
Net income (loss) | | (20,761 | ) | 7,553 | | (27,939 | ) | 8,311 | |
| | | | | | | | | |
Net loss attributable to noncontrolling interest | | — | | 458 | | 1,195 | | 1,006 | |
Net income (loss) attributable to UTStarcom Holdings Corp. | | $ | (20,761 | ) | $ | 8,011 | | $ | (26,744 | ) | $ | 9,317 | |
| | | | | | | | | |
Net income (loss) per share attributable to UTStarcom Holdings Corp.—Basic | | $ | (0.14 | ) | $ | 0.05 | | $ | (0.18 | ) | $ | 0.06 | |
Weighted average shares outstanding—Basic | | 143,688 | | 155,516 | | 148,200 | | 155,106 | |
UTStarcom Holdings Corp.
Unaudited Condensed Consolidated Statements of Cash Flows
| | Three months ended September 30, | | Nine months ended September 30, | |
| | 2012 | | 2011 | | 2012 | | 2011 | |
| | (In thousands) | |
CASH FLOWS FROM OPERATING ACTIVITIES: | | | | | | | | | |
Net income (loss) | | (20,761 | ) | $ | 7,553 | | $ | (27,939 | ) | $ | 8,311 | |
Adjustments to reconcile net loss to net cash provided by (used in) operating activities: | | | | | | | | | |
Depreciation and amortization | | 796 | | 795 | | 3,078 | | 2,228 | |
Amortization of deferred gain on sale-leaseback | | — | | — | | — | | (625 | ) |
Provision for (recovery of) doubtful accounts | | 54 | | (270 | ) | (1,037 | ) | 3,479 | |
Stock-based compensation expense | | 1,175 | | 1,285 | | 2,415 | | 2,571 | |
Net loss (gain) on divestitures | | 17,314 | | (4,151 | ) | 16,657 | | (4,185 | ) |
Other-than-temporary impairment of equity investments | | 854 | | — | | 854 | | — | |
Deferred income taxes | | 100 | | 220 | | (120 | ) | 439 | |
Other | | 52 | | (229 | ) | (79 | ) | (396 | ) |
Changes in operating assets and liabilities: | | | | | | | | | |
Accounts receivable | | (4,847 | ) | 4,147 | | 3,457 | | 5,362 | |
Inventories and deferred costs | | 2,846 | | 28,998 | | 17,418 | | 67,619 | |
Other assets | | (3,679 | ) | 1,541 | | (4,672 | ) | 10,694 | |
Accounts payable | | (523 | ) | 1,208 | | 3,843 | | (7,256 | ) |
Income taxes payable | | 562 | | (1,151 | ) | 2,294 | | 3,106 | |
Customer advances | | 4,365 | | (12,706 | ) | 5,180 | | 3,319 | |
Deferred revenue | | (9,335 | ) | (33,058 | ) | (30,996 | ) | (99,224 | ) |
Other liabilities | | 3,576 | | (6,280 | ) | (9,608 | ) | (34,911 | ) |
| | | | | | | | | |
Net cash used in operating activities | | (7,451 | ) | (12,098 | ) | (19,255 | ) | (39,469 | ) |
| | | | | | | | | |
CASH FLOWS FROM INVESTING ACTIVITIES: | | | | | | | | | |
Additions to property, plant and equipment | | (2,217 | ) | (3,627 | ) | (5,165 | ) | (9,708 | ) |
Net proceeds from divestitures | | — | | — | | 135 | | 34 | |
Change in restricted cash | | (277 | ) | 5,863 | | 1,228 | | 4,243 | |
Purchase of an investment interest | | — | | (150 | ) | — | | (761 | ) |
Contribution of equity investment through a shareholder loan | | — | | | | — | | (7,119 | ) |
Deconsolidation of ITV | | — | | — | | (6,841 | ) | — | |
Payment for IPTV divestiture and convertible bond | | (52,965 | ) | — | | (52,965 | ) | — | |
Purchase of short-term investments | | (500 | ) | (1,578 | ) | (2,267 | ) | (7,291 | ) |
Proceeds from sale of short-term investments | | 44 | | 445 | | 3,878 | | 6,310 | |
Other | | (51 | ) | 216 | | 83 | | 586 | |
Net cash used in investing activities | | (55,966 | ) | 1,169 | | (61,914 | ) | (13,706 | ) |
| | | | | | | | | |
CASH FLOWS FROM FINANCING ACTIVITIES: | | | | | | | | | |
Issuance of ordinary share upon exercise of options | | — | | — | | — | | 124 | |
Repurchase of ordinary share | | (3,659 | ) | (1,500 | ) | (6,879 | ) | (1,500 | ) |
Net cash provided by (used in) financing activities | | (3,659 | ) | (1,500 | ) | (6,879 | ) | (1,376 | ) |
Effect of exchange rate changes on cash and cash equivalents | | 2,087 | | 761 | | (1,176 | ) | 4,933 | |
Net increase (decrease) in cash and cash equivalents | | (64,989 | ) | (11,668 | ) | (89,224 | ) | (49,618 | ) |
Cash and cash equivalents at beginning of period | | 277,391 | | 313,557 | | 301,626 | | 351,507 | |
Cash and cash equivalents at end of period | | $ | 212,402 | | $ | 301,889 | | $ | 212,402 | | $ | 301,889 | |
| | | | | | | | | | | | | |
UTSTARCOM HOLDINGS CORP.
November 15, 2012 Conference Call
RECONCILIATION OF GAAP AND NON-GAAP FINANCIAL DATA
(In thousands)
(Unaudited)
To supplement our condensed consolidated financial statements presented on a GAAP basis, UTStarcom uses certain non-GAAP measures which are adjusted to present those metrics as if PHS-related deferred revenue amortization and IPTV related business had been excluded in prior years comparatives. We believe this enables year over year comparisons to our recent financial results. These adjustments to our GAAP results are made with the intent of providing both management and investors a more complete understanding of UTStarcom’s underlying results and trends. In addition, these adjusted non-GAAP results are among the information management uses as a basis for our planning and forecasting of future periods. The presentation of this additional information is not meant to be considered in isolation or as a substitute for results prepared in accordance with generally accepted accounting principles in the United States.
| | Qtr ended | | Nine months ended | | Qtr ended | | Nine months ended | |
| | 30/Sep/11 | | 30/Sep/11 | | 30/Sep/12 | | 30/Sep/12 | |
Non-GAAP Revenue | | $ | 45,794 | | $ | 132,033 | | $ | 37,026 | | $ | 116,266 | |
| | | | | | | | | |
Non-GAAP Gross Profit | | $ | 20,456 | | $ | 56,643 | | $ | 12,734 | | $ | 40,699 | |
Non-GAAP Gross Margin % | | 44.7 | % | 42.9 | % | 34.4 | % | 35.0 | % |
| | | | | | | | | |
Non-GAAP Operating Income (Loss) | | $ | 9,618 | | $ | 6,573 | | $ | (5,335 | ) | $ | (8,845 | ) |
| | | | | | | | | |
Non-GAAP Net Income (Loss) attributable to UTStarcom | | $ | 3,441 | | $ | 3,144 | | $ | (223 | ) | $ | (8,089 | ) |
| | | | | | | | | |
Non-GAAP Net Income (Loss) per Share Attributable to UTStarcom Holdings Corp.—Basic | | $ | 0.02 | | $ | 0.02 | | $ | (0.00 | ) | $ | (0.05 | ) |
Please refer to the preceding reconciliation tables for the adjustments to GAAP Revenue, Gross Profit, Operating Income (Loss), Net Income (Loss) and EPS.
UTSTARCOM HOLDINGS CORP.
November 15, 2012 Conference Call
RECONCILIATION OF GAAP AND NON-GAAP FINANCIAL DATA
($ in thousand)
(Unaudited)
To supplement our condensed consolidated financial statements presented on a GAAP basis, UTStarcom uses certain non-GAAP measures which are adjusted to present those metrics as if PHS-related deferred revenue amortization and IPTV related business had been excluded in prior years comparatives. We believe this enables year over year comparisons to our recent financial results. These adjustments to our GAAP results are made with the intent of providing both management and investors a more complete understanding of UTStarcom’s underlying results and trends. In addition, these adjusted non-GAAP results are among the information management uses as a basis for our planning and forecasting of future periods. The presentation of this additional information is not meant to be considered in isolation or as a substitute for results prepared in accordance with generally accepted accounting principles in the United States.
| | Qtr ended | | Nine months ended | | Qtr ended | | Nine months ended | |
| | 30/Sep/11 | | 30/Sep/11 | | 30/Sep/12 | | 30/Sep/12 | |
GAAP Revenue (a) | | $ | 83,297 | | $ | 237,110 | | $ | 40,328 | | $ | 143,454 | |
| | | | | | | | | |
Less: Amortization of PHS Revenue | | $ | 24,011 | | $ | 71,378 | | — | | — | |
| | | | | | | | | |
Less: IPTV Revenue | | $ | 13,492 | | $ | 33,699 | | $ | 3,302 | | $ | 27,188 | |
| | | | | | | | | |
Non-GAAP Revenue | | $ | 45,794 | | $ | 132,033 | | $ | 37,026 | | $ | 116,266 | |
(a) GAAP Revenue for each period is the consolidated revenue as reported on Form 6-K, as applicable, for such period.
UTSTARCOM HOLDINGS CORP.
November 15, 2012 Conference Call
RECONCILIATION OF GAAP AND NON-GAAP FINANCIAL DATA
($ in thousand)
(Unaudited)
To supplement our condensed consolidated financial statements presented on a GAAP basis, UTStarcom uses certain non-GAAP measures which are adjusted to present those metrics as if PHS-related deferred revenue amortization and IPTV related business had been excluded in prior years comparatives. We believe this enables year over year comparisons to our recent financial results. These adjustments to our GAAP results are made with the intent of providing both management and investors a more complete understanding of UTStarcom’s underlying results and trends. In addition, these adjusted non-GAAP results are among the information management uses as a basis for our planning and forecasting of future periods. The presentation of this additional information is not meant to be considered in isolation or as a substitute for results prepared in accordance with generally accepted accounting principles in the United States.
| | Qtr ended | | Nine months ended | | Qtr ended | | Nine months ended | |
| | 30/Sep/11 | | 30/Sep/11 | | 30/Sep/12 | | 30/Sep/12 | |
GAAP Gross Profit (a) | | $ | 31,945 | | $ | 85,784 | | $ | 14,318 | | $ | 54,456 | |
GAAP Gross Margin % | | 38.4 | % | 36.2 | % | 35.5 | % | 38.0 | % |
| | | | | | | | | |
Less: Gross Profit from Amortization of PHS Revenue | | 8,349 | | 24,817 | | — | | — | |
| | | | | | | | | |
Less: Gross Profit from IPTV Revenue | | 3,140 | | 4,324 | | 1,584 | | 13,757 | |
| | | | | | | | | |
Non-GAAP Gross Profit | | $ | 20,456 | | $ | 56,643 | | $ | 12,734 | | $ | 40,699 | |
Non-GAAP Gross Margin % | | 44.7 | % | 42.9 | % | 34.4 | % | 35.0 | % |
(a) GAAP Gross Profit and GAAP Gross Margin % for each period is the consolidated gross profit and gross margin % as reported on Form 6-K, as applicable, for such period.
UTSTARCOM HOLDINGS CORP.
November 15, 2012 Conference Call
RECONCILIATION OF GAAP AND NON-GAAP FINANCIAL DATA
($ in thousand)
(Unaudited)
To supplement our condensed consolidated financial statements presented on a GAAP basis, UTStarcom uses certain non-GAAP measures which are adjusted to present those metrics as if PHS-related deferred revenue amortization and IPTV related business had been excluded in prior years comparatives. We believe this enables year over year comparisons to our recent financial results. These adjustments to our GAAP results are made with the intent of providing both management and investors a more complete understanding of UTStarcom’s underlying results and trends. In addition, these adjusted non-GAAP results are among the information management uses as a basis for our planning and forecasting of future periods. The presentation of this additional information is not meant to be considered in isolation or as a substitute for results prepared in accordance with generally accepted accounting principles in the United States.
| | Qtr ended | | Nine months ended | | Qtr ended | | Nine months ended | |
| | 30/Sep/11 | | 30/Sep/11 | | 30/Sep/12 | | 30/Sep/12 | |
GAAP Operating Expenses(a) | | $ | 17,757 | | $ | 73,038 | | $ | 40,191 | | $ | 81,956 | |
| | | | | | | | | |
Less: Operating Expenses directly related to IPTV | | $ | 6,919 | | $ | 22,968 | | $ | 22,122 | | $ | 32,412 | |
| | | | | | | | | |
Non-GAAP Operating Expenses | | $ | 10,838 | | $ | 50,070 | | $ | 18,069 | | $ | 49,544 | |
(a) GAAP Operating Expenses for each period is the consolidated Operating Expenses as reported on Form 6-K, as applicable, for such period.
UTSTARCOM HOLDINGS CORP.
November 15, 2012 Conference Call
RECONCILIATION OF GAAP AND NON-GAAP FINANCIAL DATA
($ in thousand)
(Unaudited)
To supplement our condensed consolidated financial statements presented on a GAAP basis, UTStarcom uses certain non-GAAP measures which are adjusted to present those metrics as if PHS-related deferred revenue amortization and IPTV related business had been excluded in prior years comparatives. We believe this enables year over year comparisons to our recent financial results. These adjustments to our GAAP results are made with the intent of providing both management and investors a more complete understanding of UTStarcom’s underlying results and trends. In addition, these adjusted non-GAAP results are among the information management uses as a basis for our planning and forecasting of future periods. The presentation of this additional information is not meant to be considered in isolation or as a substitute for results prepared in accordance with generally accepted accounting principles in the United States.
| | Qtr ended | | Nine months ended | | Qtr ended | | Nine months ended | |
| | 30/Sep/11 | | 30/Sep/11 | | 30/Sep/12 | | 30/Sep/12 | |
GAAP Operating Income (Loss) (a) | | $ | 14,188 | | $ | 12,746 | | $ | (25,873 | ) | $ | (27,500 | ) |
| | | | | | | | | |
Less: Profit from Amortization of PHS Revenue | | $ | 8,349 | | $ | 24,817 | | — | | — | |
| | | | | | | | | |
Less: Profit from IPTV Revenue | | $ | 3,140 | | $ | 4,324 | | $ | 1,584 | | $ | 13,757 | |
| | | | | | | | | |
Less: Operating Expenses directly related to IPTV | | $ | 6,919 | | $ | 22,968 | | $ | 22,122 | | $ | 32,412 | |
| | | | | | | | | |
Non-GAAP Operating Income (Loss) | | $ | 9,618 | | $ | 6,573 | | $ | (5,335 | ) | $ | (8,845 | ) |
(a) GAAP Operating Income (Loss) for each period is the consolidated operating loss as reported on Form 6-K, as applicable, for such period.
UTSTARCOM HOLDINGS CORP.
November 15, 2012 Conference Call
RECONCILIATION OF GAAP AND NON-GAAP FINANCIAL DATA
($ in thousand)
(Unaudited)
To supplement our condensed consolidated financial statements presented on a GAAP basis, UTStarcom uses certain non-GAAP measures which are adjusted to present those metrics as if PHS-related deferred revenue amortization and IPTV related business had been excluded in prior years comparatives. We believe this enables year over year comparisons to our recent financial results. These adjustments to our GAAP results are made with the intent of providing both management and investors a more complete understanding of UTStarcom’s underlying results and trends. In addition, these adjusted non-GAAP results are among the information management uses as a basis for our planning and forecasting of future periods. The presentation of this additional information is not meant to be considered in isolation or as a substitute for results prepared in accordance with generally accepted accounting principles in the United States.
| | Qtr ended | | Nine months ended | | Qtr ended | | Nine months ended | |
| | 30/Sep/11 | | 30/Sep/11 | | 30/Sep/12 | | 30/Sep/12 | |
GAAP Net Income (Loss) attributable to UTStarcom(a) | | $ | 8,011 | | $ | 9,317 | | $ | (20,761 | ) | $ | (26,744 | ) |
| | | | | | | | | |
Less: Profit from Amortization of PHS Revenue | | $ | 8,349 | | $ | 24,817 | | — | | — | |
| | | | | | | | | |
Less: Profit from IPTV Revenue | | $ | 3,140 | | $ | 4,324 | | $ | 1,584 | | $ | 13,757 | |
| | | | | | | | | |
Less: Operating Expenses directly related to IPTV | | $ | 6,919 | | $ | 22,968 | | $ | 22,122 | | $ | 32,412 | |
| | | | | | | | | |
Non-GAAP Net Income (Loss) attributable to UTStarcom | | $ | 3,441 | | $ | 3,144 | | $ | (223 | ) | $ | (8,089 | ) |
(a) GAAP Net Income (Loss) for each period is the consolidated net loss as reported on Form 6-K, as applicable, for such period.
UTSTARCOM HOLDINGS CORP.
November 15, 2012 Conference Call
RECONCILIATION OF GAAP AND NON-GAAP FINANCIAL DATA
(In thousands)
(Unaudited)
To supplement our condensed consolidated financial statements presented on a GAAP basis, UTStarcom uses certain non-GAAP measures which are adjusted to present those metrics as if PHS-related deferred revenue amortization and IPTV related business had been excluded in prior years comparatives. We believe this enables year over year comparisons to our recent financial results. These adjustments to our GAAP results are made with the intent of providing both management and investors a more complete understanding of UTStarcom’s underlying results and trends. In addition, these adjusted non-GAAP results are among the information management uses as a basis for our planning and forecasting of future periods. The presentation of this additional information is not meant to be considered in isolation or as a substitute for results prepared in accordance with generally accepted accounting principles in the United States.
| | Qtr ended | | Nine months ended | | Qtr ended | | Nine months ended | |
| | 30/Sep/11 | | 30/Sep/11 | | 30/Sep/12 | | 30/Sep/12 | |
GAAP Net Income (Loss) attributable to UTStarcom(a) | | $ | 8,011 | | $ | 9,317 | | $ | (20,761 | ) | $ | (26,744 | ) |
| | | | | | | | | |
Less: Profit from Amortization of PHS Revenue | | $ | 8,349 | | $ | 24,817 | | $ | 0 | | $ | 0 | |
| | | | | | | | | |
Less: Profit from IPTV Revenue | | $ | 3,140 | | $ | 4,324 | | $ | 1,584 | | $ | 13,757 | |
| | | | | | | | | |
Less: Operating Expenses from IPTV Related | | $ | 6,919 | | $ | 22,968 | | $ | 22,122 | | $ | 32,412 | |
| | | | | | | | | |
Non-GAAP Net Income (Loss) attributable to UTStarcom | | $ | 3,441 | | $ | 3,144 | | $ | (223 | ) | $ | (8,089 | ) |
| | | | | | | | | |
Weighted Average Shares Outstanding—Basic | | $ | 155,516 | | $ | 155,106 | | $ | 143,688 | | $ | 148,200 | |
| | | | | | | | | |
GAAP Net Income (Loss) per Share Attributable to UTStarcom Holdings Corp.—Basic | | 0.05 | | 0.06 | | (0.14 | ) | (0.18 | ) |
| | | | | | | | | |
Non-GAAP Net Income (Loss) per share attributable to UTStarcom Holdings Corp.—Basic | | 0.02 | | 0.02 | | (0.00 | ) | (0.05 | ) |
(a) GAAP Net Income (Loss) per share for each period is the consolidated net income (loss) as reported on Form 6-K, as applicable, for such period.
UTStarcom Holdings Corp.
Unaudited Condensed Consolidated Statements of Cash Flows
| | Three months ended September 30, | | Nine months ended September 30, | |
| | 2012 | | 2011 | | 2012 | | 2011 | |
| | (In thousands) | |
CASH FLOWS FROM OPERATING ACTIVITIES: | | | | | | | | | |
| | | | | | | | | |
GAAP Net cash used in operating activities | | (7,451 | ) | (12,098 | ) | (19,255 | ) | (39,469 | ) |
Less: Net cash provided by (used in) IPTV operating activities | | (5,602 | ) | 1,545 | | (14,241 | ) | (19,608 | ) |
Non-GAAP Net cash used in operating activities | | (1,849 | ) | (13,643 | ) | (5,014 | ) | (19,861 | ) |
| | | | | | | | | |
CASH FLOWS FROM INVESTING ACTIVITIES: | | | | | | | | | |
| | | | | | | | | |
GAAP Net cash provided by (used in) investing activities | | (55,966 | ) | 1,169 | | (61,914 | ) | (13,706 | ) |
Less: Net cash used in IPTV investing activities | | (53,062 | ) | (5 | ) | (53,444 | ) | (95 | ) |
Non-GAAP Net cash provided by (used in) investing activities | | (2,904 | ) | 1,174 | | (8,470 | ) | (13,611 | ) |
| | | | | | | | | |
CASH FLOWS FROM FINANCING ACTIVITIES: | | | | | | | | | |
| | | | | | | | | |
GAAP Net cash used in financing activities | | (3,659 | ) | (1,500 | ) | (6,879 | ) | (1,376 | ) |
Less: Net cash provided by (used in) IPTV financing activities | | — | | — | | — | | — | |
Non-GAAP Net cash used in financing activities | | (3,659 | ) | (1,500 | ) | (6,879 | ) | (1,376 | ) |
| | | | | | | | | |
Effect of exchange rate changes on cash and cash equivalents | | 2,087 | | 761 | | (1,176 | ) | 4,933 | |
Non-GAAP Net decrease in cash and cash equivalents in continuing operations | | (6,325 | ) | (13,208 | ) | (21,539 | ) | (29,915 | ) |
Non-GAAP Net increase (decrease) in cash and cash equivalents in IPTV disposed operation | | (58,664 | ) | 1,540 | | (67,685 | ) | (19,703 | ) |
| | | | | | | | | |
Cash and cash equivalents at beginning of period | | 277,391 | | 313,557 | | 301,626 | | 351,507 | |
Cash and cash equivalents at end of period | | $ | 212,402 | | $ | 301,889 | | $ | 212,402 | | $ | 301,889 | |
| | | | | | | | | | | | | |

| UTStarcom Holdings Corp. Third Quarter 2012 Results & New Strategy Discussion NASDAQ: UTSI November 2012 Mr. William Wong, CEO Mr. Robert Pu, CFO |
| 2 Disclosure & Forward Looking Statements This investor presentation contains forward-looking statements, including statements regarding the Company's expectation regarding its operational support services business, the divestiture of its IPTV equipment business and the Company’s performance in 2012. Forward-looking statements are based on current expectations, estimates, forecasts and projections about the Company, the Company’s future performance and the industries in which the Company operates as well as on the Company management's assumptions and beliefs. These forward-looking statements are only predictions and are subject to risks and uncertainties that may cause actual results to differ materially and adversely from the Company’s current expectations. These include risks and uncertainties related to, among other things, changes in the financial condition and cash position of the Company, changes in the composition of the Company’s management and their effect on the Company, the Company’s ability to realize anticipated results of operational improvements and benefits of the divestiture transaction, successfully operate and grow its services business, execute its business plan and manage regulatory matters, as well as the risk factors identified in the Company’s latest Annual Report on Form 20-F, and Current Reports on Form 6-K, as filed with the Securities and Exchange Commission. We undertake no obligation to update these forward-looking statements to reflect events or circumstances occurring after the date of this investor presentation. The Company is in a period of significant transition and the conduct of its business is exposed to additional risks as a result. This investor presentation also includes financial guidance and information about the Company previously disclosed during the Company's 2011 and first quarter 2012 earnings conference calls and other filings with the Securities and Exchange Commission. Such guidance and information reflects the Company’s information and expectations as of those dates and this presentation is not intended to confirm or update that information and expectations. |

| Agenda Third Quarter Financial Overview Introduction 3 2 Overview of New Strategy 1 |

| Agenda Introduction 1 |
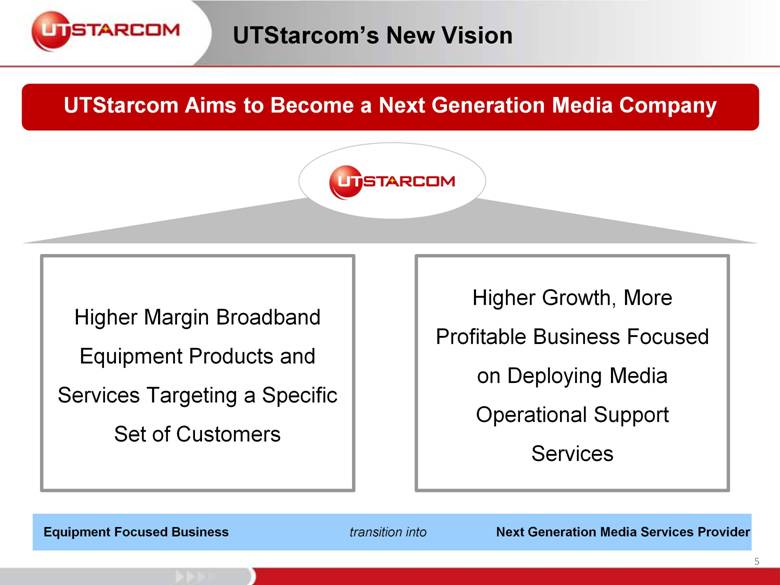
| UTStarcom’s New Vision UTStarcom Aims to Become a Next Generation Media Company Higher Margin Broadband Equipment Products and Services Targeting a Specific Set of Customers Higher Growth, More Profitable Business Focused on Deploying Media Operational Support Services Equipment Focused Business transition into Next Generation Media Services Provider 5 |

| Agenda Third Quarter Financial Overview 2 |
| 7 Third Quarter 2012 Financial Highlights The Company successfully closed the divestiture of its IPTV business on August 31, 2012 as part of a plan to transition the Company into higher growth, more profitable areas. As of September 30, 2012, the Company did not meet the requirements to report results from the IPTV division separately as discontinued operations. To enable a comparison of the year-to-date and future periods financial results the Company has prepared non-GAAP results. Included in this presentation are quarterly and year-to-date non-GAAP comparisons that exclude financial results from the IPTV business and amortization of PHS deferred revenue. Third quarter of 2012 non-GAAP net sales decreased 19.1% year over year to $37.0 million, compared to $45.8 million non-GAAP net sales in the third quarter of 2011. Third quarter of 2012 non-GAAP gross profit decreased 37.7% year over year to $12.7 million, compared to $20.5 million non-GAAP gross profit in the third quarter of 2011. Non-GAAP net loss attributable to UTStarcom’s shareholders was $0.2 million, or non-GAAP basic loss per share of $0.0, in the third quarter of 2012, compared to non-GAAP net income of $3.4 million, or non-GAAP basic income per share of $0.02, for the corresponding period of 2011. |
| 8 Non-GAAP Total Revenue Non-GAAP total revenues for the third quarter of 2012 were $37.0 million, a decrease of 19.1% year-over-year from $45.8 million for the corresponding period of 2011. Non-GAAP total revenues for the nine months ended September 30, 2012 were $116.3 million, a decrease of 11.9% year-over-year from $132.0 million for the corresponding period of 2011. US$(mm) US$(mm) |
| 9 Non-GAAP Gross Profit Non-GAAP Q3 2012 gross profit was $12.7 million vs. Q3 2011 gross profit of 20.5 million. Non-GAAP gross profit in the first nine months of 2012 was $40.7 million vs. first nine months 2011 gross profit of $56.6 million. US$(mm) US$(mm) |
| 10 Non-GAAP Gross Margin Non-GAAP Q3 2012 gross margin was 34.4% vs. Q3 2011 gross margin of 44.7%. Non-GAAP gross margin in the first nine months of 2012 was 35.0% vs. first nine months 2011 gross margin of 42.9%. |
| 11 US$ (mm) Non-GAAP Operating Expense The one–time gain on divestiture of $4.2 million in the third quarter of 2011 was due to contingent gain realized upon entering into a three-party assignment agreement. US$ (mm) |
| Non-GAAP Operating Result & Net Income/Loss US$ (mm) 12 Non-GAAP Operating Income/Loss Comparison Non-GAAP Net Income/Loss Comparison US$ (mm) |
| 13 Cash balance of $213.1 million in cash, cash equivalents, and short-term investment Zero debt Q3 2012 Cash Position Cash Distribution by Currency Cash Distribution by Region |
| 14 Quarterly non-GAAP net cash used by operating activities for the third quarter of 2012 was $1.8 million. Impact on cash balance due to IPTV divestiture $30M cash balance deconsolidation $20M convertible bond Share repurchase program update: The Company repurchased $3.5 million in ordinary shares in the third quarter of 2012 The cumulative total execution under the current program is $13.0 million Board extended the repurchase program for an additional six month through February 2013 Non-GAAP Cash Flow Analysis |

| Agenda Overview of New Strategy |
| Guiding Priorities and Objectives Focus on faster-growing, higher margin opportunities TV over IP Services for broadband and cable operators Exit from lower-margin equipment business to enhance overall profitability Divested the IPTV equipment business as the first step Grow existing higher margin broadband business with select strategic clients Generate a more predictable, subscriber-based recurring revenue stream Identify new business opportunities where UTStarcom has the potential to become the top one or two service provider 1 2 3 4 16 |

| Market Trends and Opportunities Monetization (Branding, Advertising, Digital Rights Management, Syndication, Subscription and Internet Based Content, etc.) Multiple Platforms (Content Management, Content Distribution, Content Publishing, etc.) Multiple Screens (Desktop, Mobile, Tablet, TV, etc.) PM Watch Live Shows on Mobile AM Watch News on TV PM Watch Videos on iPad For Content Providers Demand of Video Delivery Solutions For Consumers “Pull” Video Anytime/Anywhere 17 |
| The Components of Our Strategy Build Out Media Operational Support Services Offering by Creating and Building a TV over IP Services Platform 1 Build Out New Services through a Combination of Internal Development and Strategic Acquisitions 2 Design an Optimal Operating Structure to Maximize the Potential of Business Units, Maximize Efficiency in Operations, and Minimize Costs to Keep Underlying Business Strong 3 18 |
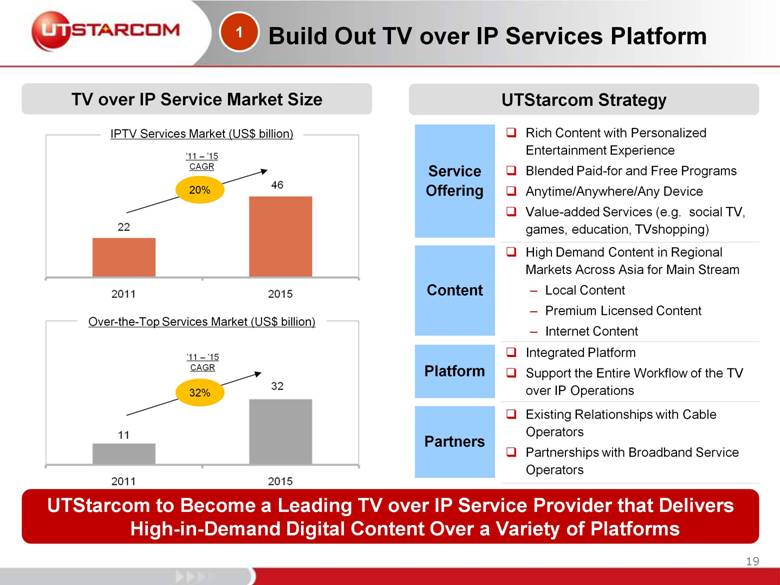
| Rich Content with Personalized Entertainment Experience Blended Paid-for and Free Programs Anytime/Anywhere/Any Device Value-added Services (e.g. social TV, games, education, TVshopping) High Demand Content in Regional Markets Across Asia for Main Stream Local Content Premium Licensed Content Internet Content Integrated Platform Support the Entire Workflow of the TV over IP Operations Existing Relationships with Cable Operators Partnerships with Broadband Service Operators Build Out TV over IP Services Platform TV over IP Service Market Size UTStarcom Strategy Service Offering UTStarcom to Become a Leading TV over IP Service Provider that Delivers High-in-Demand Digital Content Over a Variety of Platforms IPTV Services Market (US$ billion) ’11 – ’15 CAGR 20% Over-the-Top Services Market (US$ billion) ’11 – ’15 CAGR 32% Content Platform Partners 1 19 |

| Building New Services & Maximizing Potential Leverage strong technical expertise in UTStarcom launched video service cloud platform and the understanding and knowledge of broadband/IPTV equipment customers’ needs to develop new services Leverage existing relationships to establish partnerships with cable and broadband service providers to rapidly establish a subscriber base Acquire or take significant stakes in companies that have market leading media technologies which could help add UTStarcom’s services platform Structure the business in a way that aggregates and maximizes the potential of very strong business units Provide business units the flexibility to pursue opportunities while also aligning their interests with broader corporate goals and those of shareholders Maximize efficiencies and minimize costs to keep underlying business strong Build Out New Services Through Internal Development and Strategic Acquisitions Optimize Business Structure 2 3 20 |
| UTStarcom Competitive Advantages Strong brand recognition as a leading telecom equipment provider Widely deployed network system equipment Experienced in set top box technologies and product development Expertise with mobile terminals through the PHS business and mobile terminal business Expertise and know-how with IPTV and cable services providers’ business operating support systems (BOSS) Expertise in developing and selling broadband equipment and services Expertise in content aggregation and licensing through the investment in iTV Media Served a broad base of telecom and cable operators Long-standing relationships with leading cable and broadband service providers, including SoftBank and Chunghwa Telecom Strong cash position Zero debt Well-capitalized for investment Technology Expertise Well Regarded Brand Existing Relationship with Operators Strong Balance Sheet 21 |
| Timeline 2013 2015 Divested IPTV equipment business Reorganized company structure Restructured broadband business Redesigned management team and added new independent director to Board 2014 2012 Fully transition to new business model Invest in new product development Make strategic acquisitions and investments Full-scale commercial deployment of TV over IP service offerings in multiple countries Full-scale commercial deployment of value added services in TV over IP customer regions Grow subscriber count and increase ARPU Service business to become majority revenue contributor Overall gross margin of service business expected to reach more than 50% UTStarcom Strategy Timeline 22 |

| Agenda APPENDIX |
| 24 Appendix – GAAP Financial Statement September 30, December 31, 2012 2011 ASSETS Current assets: Cash, cash equivalents and short-term investments 213,091 $ 303,998 $ Accounts and notes receivable, net 12,348 20,216 Inventories and deferred costs 129,005 137,484 Prepaids and other current assets 52,888 42,099 Total current assets 407,332 503,797 Long-term assets: Property, plant and equipment, net 10,580 12,199 Goodwill - 13,820 Intangible assets, net - 3,625 Long-term deferred costs 24,951 39,741 Other long-term assets 63,072 27,758 Total assets 505,935 $ 600,940 $ LIABILITIES AND EQUITY Current liabilities: Accounts payable 22,836 $ 23,530 $ Customer advances 84,763 82,589 Deferred revenue 44,145 64,989 Other current liabilities 40,073 52,679 Total current liabilities 191,817 223,787 Long-term liabilities: Long-term deferred revenue and other liabilities 87,474 106,114 Total liabilities 279,291 329,901 Total equity 226,644 271,039 Total liabilities and equity 505,935 $ 600,940 $ UTStarcom Holdings Corp. Unaudited Condensed Consolidated Balance Sheets (In thousands, except par value) |
| 25 Appendix – GAAP Financial Statement 2012 2011 2012 2011 Net sales 40,328 $ 83,297 $ 143,454 $ 237,110 $ Cost of net sales 26,010 51,352 88,998 151,326 Gross profit 14,318 31,945 54,456 85,784 35.5 % 38.4 % 38.0 % 36.2 % Operating expenses: Selling, general and administrative 13,988 14,780 39,738 52,528 Research and development 8,243 7,327 23,850 21,591 Amortization of intangible assets - 310 516 929 Impairment of goodwill and other long-lived assets 854 - 854 - Restructuring (191) (509) 358 2,175 Net loss (gain) on divestiture 17,297 (4,151) 16,640 (4,185) Total operating expenses 40,191 17,757 81,956 73,038 Operating income (loss) (25,873) 14,188 (27,500) 12,746 Interest income, net 363 369 1,556 1,240 Other income (expense), net 5,398 (7,305) 811 (3,214) Income (loss) before income taxes (20,112) 7,252 (25,133) 10,772 Income taxes benefit(expense) (649) 301 (2,806) (2,461) Net income (loss) (20,761) 7,553 (27,939) 8,311 Net loss attributable to noncontrolling interest - 458 1,195 1,006 Net income (loss) attributable to UTStarcom Holdings Corp. (20,761) $ 8,011 $ (26,744) $ 9,317 $ Net income (loss) per share attributable to UTStarcom Holdings Corp.—Basic (0.14) $ 0.05 $ (0.18) $ 0.06 $ Weighted average shares outstanding—Basic 143,688 155,516 148,200 155,106 Three months ended September 30, Nine months ended September 30, UTStarcom Holdings Corp. Unaudited Condensed Consolidated Statements of Operations (in thousands, except per share data) |

| 26 Investor Relations Contacts UTStarcom Robert Pu Tel: + 86-10-8520-5153 Email: robert.pu@utstar.com Jing Ou-Yang Tel: + 8610 8520 5153 Email: jouyang@utstar.com FTI Consulting May Shen (China) Tel: +86-10-8591-1951 Email: may.shen@fticonsulting.com Daniel DelRe (Hong Kong) Tel: +852-3768-4547 Email: Daniel.DelRe@fticonsulting.com Eric Boyriven (U.S.) Tel: +1-212-850-5671 Email: eric.boyriven@fticonsulting.com |