Exhibit 99.(c)(3)
Presentation to the Board of Directors
Goldman, Sachs & Co.
November 5, 2006
Company Overview
- •
- Four Seasons was founded in Toronto, Canada over forty-five years ago by Isadore Sharp, its Chairman and Chief Executive Officer
- •
- Since its early beginnings, Four Seasons has expanded its portfolio of managed properties on virtually every continent
- •
- Four Seasons boasts a brand name that is synonymous with the highest levels of guest service in the international luxury hospitality industry
- •
- Over the past five years, Four Seasons has opened an average of five1 new hotels and resorts each year, for a total of 5,4601 new rooms, over the period
| Capitalization | | ||
|---|---|---|---|
| Current price as of 11/03/2006 | $ | 63.87 | |
| Total Shares Outstanding (mm) | 38.5 | ||
| Equity Market Cap | $ | 2,455.8 | |
| Net Debt3 | 89.6 | ||
| Enterprise Value (EV) | $ | 2,545.5 | |
| 2006E EBITDA Multiple4 | 34.1x | ||
| 2007E EBITDA Multiple4 | 27.3x | ||
| Projected Financials2 | ||||||
|---|---|---|---|---|---|---|
| | 2007E | 2008E | ||||
| Projected Number of Properties | 76 | 84 | ||||
| Revenues | $ | 235.8 | $ | 266.5 | ||
| Expenses | 149.2 | 152.8 | ||||
| EBITDA | $ | 86.6 | $ | 113.7 | ||
1 New additions only.
2 Source: Management estimates.
3 Comprised of total debt of $326.4 mm and cash of $236.8 mm.
4 Source: Wall Street research.
2
Premium Analysis
($ in millions, except per share data)
| | Proposed Purchase Price | ||||||
|---|---|---|---|---|---|---|---|
| | $82.00 | ||||||
| Premium to | |||||||
| Current as of 11/03/2006 | $ | 63.87 | 28.4% | ||||
| 52 Week High | 66.80 | 22.8% | |||||
| 52 Week Low | 47.70 | 71.9% | |||||
| 6 Month Average | 61.42 | 33.5% | |||||
| 52 Week Average | 57.26 | 43.2% | |||||
Shares (in millions) | 38.5 | ||||||
| Implied Equity Value | $ | 3,153.0 | |||||
| Net Debt & Sharp Change of Control Agreement | 405.3 | ||||||
| Implied Enterprise Value | $ | 3,558.3 | |||||
Multiple on 2007E EBITDA1 | $ | 86.6 | 41.1x | ||||
| Multiple on 2008E EBITDA1 | $ | 113.7 | 31.3x | ||||
1 Source: Management estimates.
3
Selected Transaction Premiums
Deals since 2003
| | Premiums Paid: | |||||
|---|---|---|---|---|---|---|
| | 1 Day Prior | 1 Week Prior | 4 Weeks Prior | |||
| Proposed $82 Transaction Price | 28.4% | 27.9% | 29.1% | |||
| Deals with Enterprise Values Between $1-$10 bn | 23.4% | 25.1% | 28.1% | |||
| Deals with Enterprise Values Between $3-$4 bn | 23.0% | 22.9% | 24.6% | |||
| Hotel and Lodging Deals | 12.8% | 15.8% | 16.8% | |||
4
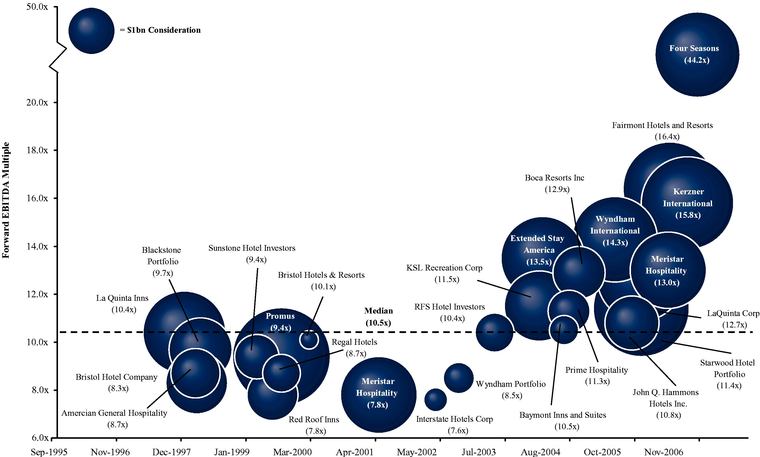
Hospitality Transactions
Selected Acquisitions — Multiple of Forward EBITDA
5
Comparison of Selected Lodging Companies
Sorted by 2007E EBITDA Multiple
($ in millions, except per share data)
| | | | | | | | | | EBITDA2 Multiples | EBITDA Growth | Calendarized P/E Multiples2 | ||||||||||||||||||||
|---|---|---|---|---|---|---|---|---|---|---|---|---|---|---|---|---|---|---|---|---|---|---|---|---|---|---|---|---|---|---|---|
| Company | Closing Price 11/03/06 | % of 52 Week High | Dividend Yield | Equity Market Cap1 | Net Debt | Enterprise Value | Net Debt/ Enterprise Value | Net Debt/ 2006E EBITDA | |||||||||||||||||||||||
| 2006 | 2007 | '06E-'07E | 2006 | 2007 | |||||||||||||||||||||||||||
| Four Seasons Hotels, Inc.3 | $ | 63.87 | 86.4 | % | 0.2 | % | $ | 2,456 | $ | 90 | $ | 2,545 | 3.5 | % | 1.2 | x | 34.1 | x | 27.3 | x | 24.9 | % | 38.7 | x | 29.8 | x | |||||
| Choice Hotels International Incorporated | 41.55 | 67.4 | 1.4 | 2,835 | 203 | 3,037 | 6.7 | 1.2 | 17.3 | 15.9 | 9.3 | 28.7 | 25.0 | ||||||||||||||||||
| Gaylord Entertainment Company | 45.41 | 94.6 | 0.0 | 1,907 | 585 | 2,492 | 23.5 | 4.1 | 17.3 | 14.5 | 18.9 | NM | NM | ||||||||||||||||||
| Marriott International | 41.95 | 99.4 | 0.6 | 18,272 | 1,197 | 19,469 | 6.1 | 0.9 | 14.2 | 12.9 | 10.3 | 25.9 | 22.4 | ||||||||||||||||||
| Orient Express Hotels Limited | 37.39 | 87.8 | 0.3 | 1,588 | 543 | 2,132 | 25.5 | 4.1 | 16.0 | 12.3 | 29.9 | 29.2 | 20.1 | ||||||||||||||||||
| Starwood Hotels & Resorts Worldwide | 58.30 | 85.2 | 4.3 | 13,289 | 2,514 | 15,828 | 15.9 | 1.9 | 12.2 | 11.6 | 5.3 | 22.9 | 23.6 | ||||||||||||||||||
| The Marcus Corporation | 23.84 | 94.6 | 1.3 | 740 | 135 | 876 | 15.4 | 1.9 | 12.3 | 10.9 | 13.4 | 29.0 | 25.8 | ||||||||||||||||||
| Great Wolf Resorts | 12.94 | 98.3 | 0.0 | 394 | 136 | 537 | 25.3 | 3.9 | 15.3 | 10.7 | 43.4 | NM | NM | ||||||||||||||||||
| Hilton Hotels Corporation | 28.56 | 97.2 | 0.6 | 11,942 | 8,254 | 20,196 | 40.9 | 4.7 | 11.6 | 10.2 | 13.4 | 26.0 | 21.2 | ||||||||||||||||||
| Interstate Hotels & Resorts | 8.71 | 77.8 | 0.0 | 273 | 77 | 351 | 21.9 | 1.5 | 6.8 | 7.0 | (3.0) | 13.0 | 13.7 | ||||||||||||||||||
| High | 99.4 | % | 4.3 | % | $ | 18,272 | $ | 8,254 | $ | 20,196 | 40.9 | % | 4.7 | x | 34.1 | x | 27.3 | x | 43.4 | % | 38.7 | x | 29.8 | x | |||||||
| Mean | 88.9 | % | 0.9 | % | $ | 5,370 | $ | 1,373 | $ | 6,746 | 18.5 | % | 2.5 | x | 15.7 | x | 13.3 | x | 16.6 | % | 26.7 | x | 22.7 | x | |||||||
| Median | 91.2 | % | 0.4 | % | $ | 2,181 | $ | 373 | $ | 2,519 | 18.9 | % | 1.9 | x | 14.8 | x | 11.9 | x | 13.4 | % | 27.3 | x | 23.0 | x | |||||||
| Low | 67.4 | % | 0.0 | % | $ | 273 | $ | 77 | $ | 351 | 3.5 | % | 0.9 | x | 6.8 | x | 7.0 | x | (3.0) | % | 13.0 | x | 13.7 | x | |||||||
1 Equity Market Cap based on diluted shares outstanding.
2 EBITDA and EPS estimates have been calendarized. Projected EBITDA and EPS source: IBES median estimates.
3 EBITDA and EPS estimates per report issued by CIBC World Markets research dated 08/11/2006.
6
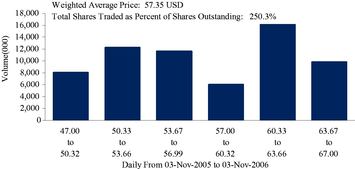
Shares Traded at Various Prices
Stock Price by Volume — Excludes Shares Held by Sharp/Triples and HRH1
| | | |
|---|---|---|
| 6-Month | 1-Year | |
 |  | |
3-Year | 5-Year | |
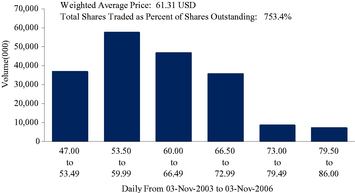 | 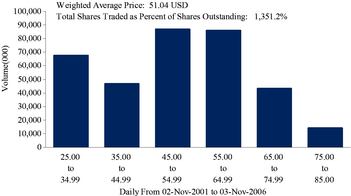 |
Source: Factset
1 Total shares traded as a percentage of outstanding shares based on limited voting shares only. Excludes shares held by Sharp/Triples and HRH.
7
Total Stock Return
5-Year
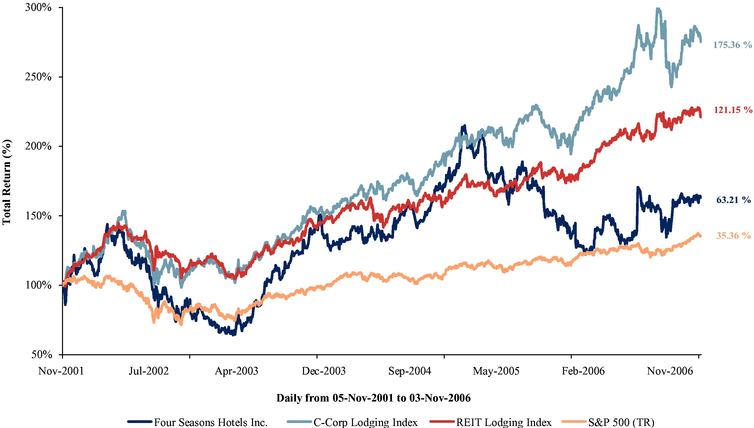
Source: Factset
Note: Total returns include dividends. C-Corp Lodging Index includes CHH, GET, OEH, MAR, HOT, MCS, WOLF, HLT, IHR. REIT Lodging Index includes LHO, HT, HST, HIH, EHP, ENN, SHO, FCH, DRH, WXH, AHT, BEE, LGY.U, HPT, KPA.
8
Price / Volume
5-Year
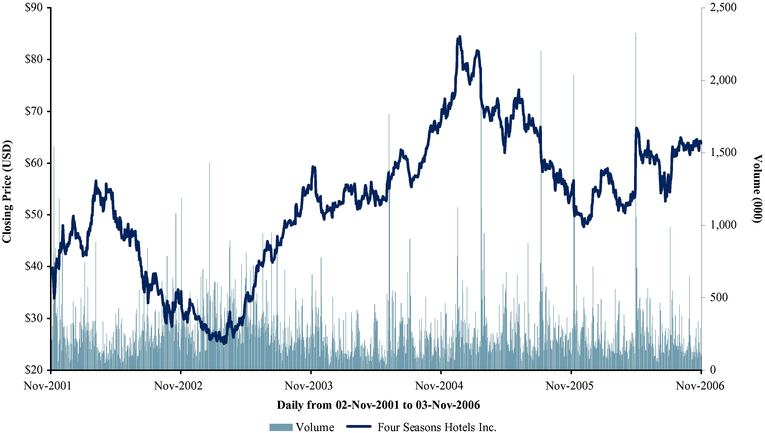
Source: Factset
9
Summary of Research Analysts' Ratings
| Bank | Stock Rating | Target Share Price | 2006E EPS | 2007E EPS | Date | ||||||||
|---|---|---|---|---|---|---|---|---|---|---|---|---|---|
| A.G. Edwards Inc. | Hold | — | $ | 1.38 | $ | 1.70 | 08/11/2006 | ||||||
| Banc of America Securities | Neutral | $ | 62.00 | $ | 1.50 | $ | 1.80 | 08/23/2006 | |||||
| Bear, Stearns & Company | Peer Perform | — | $ | 1.44 | $ | 1.75 | 08/10/2006 | ||||||
| BMO Capital Markets Corp. | Underperform | — | $ | 1.44 | — | 08/15/2006 | |||||||
| CIBC World Markets Corporation | Sector Performer | $ | 57.00 | $ | 1.41 | $ | 1.88 | 08/11/2006 | |||||
| Deutsche Bank Securities | Hold | $ | 60.00 | $ | 1.52 | $ | 1.85 | 08/10/2006 | |||||
| Goldman, Sachs & Co. | Neutral | $ | 69.00 | $ | 1.39 | — | 08/11/2006 | ||||||
| J.P. Morgan Securities Inc. | Neutral | — | $ | 1.36 | $ | 1.60 | 10/04/2006 | ||||||
| JMP Securities LLC | Market Perform | — | $ | 1.42 | $ | 1.76 | 10/17/2006 | ||||||
| Merrill Lynch & Co. | Neutral | — | $ | 1.45 | — | 08/10/2006 | |||||||
| Raymond James Ltd. | Market Perform | $ | 69.00 | $ | 1.30 | $ | 1.49 | 09/15/2006 | |||||
| RBC Capital Markets | Outperform | $ | 70.00 | — | — | 08/10/2006 | |||||||
| UBS Securities LLC | Buy | — | $ | 1.40 | — | 08/10/2006 | |||||||
| Average/Consensus | $ | 64.50 | $ | 1.42 | $ | 1.73 | |||||||
Source: As per SNL DataSource
10
Appendix A: Sources and Uses
11
Transaction Summary
- •
- The total transaction would be consummated for~$3.8 billion
- —
- 100% of the Limited Voting Shares currently owned by the public would be acquired for US$82.00 per share or~$2.7 billion
- —
- Mr. Sharp would be entitled to receive the proceeds due under the Sharp Change of Control Agreement
- —
- Sharp/Triples would continue to hold the Variable Multiple Voting Shares ("VMVS"), but the terms would be amended as follows:
- —
- 44% of the VMVS (valued at US$82.00 per share or~$130 mm) would be convertible into Limited Voting Shares on a 1:1 basis at the option of the holder, or upon other events
- —
- The remaining 56% of the VMVS (valued at~$170 mm) would be convertible into preferred shares, at the option of the holder, or upon other events, accruing dividends at a rate of 9.9% compounded annually
- •
- The acquisition will be funded in the following manner
- —
- Total New FS debt of~$750 mm, borrowed at the time of the transaction
- —
- Total New FS equity of~$2.7 billion, comprised of:
- —
- Roll-over of the Sharp/Triples Limited Voting Shares in an amount equal to~$130 mm or 5% of the New FS equity post-transaction
- —
- Roll-over of HRH existing Limited Voting Shares (23% of total Limited Voting Shares or~$620 mm)
- —
- HRH contributes new capital to New FS of~$650 mm to give HRH a total initial New FS equity ownership of 47.5%
- —
- Roll-over of Cascade's existing Limited Voting Shares (2% of total Limited Voting Shares or~$60 mm)
- —
- Cascade contributes new capital to New FS of~$1,200 mm to give Cascade a total initial New FS equity ownership of 47.5%
- —
- Use of available cash of~$230 mm to fund the remainder of the transaction
12
Sources and Uses
(in millions and US$)
Sources:
| | Amount | Rate | % of Total | |||||
|---|---|---|---|---|---|---|---|---|
| Senior Debt1 | $ | 750.0 | L+ 2.50% | 19.7% | ||||
| Sharp/Triples VMVS Convertible Preferred2 | 172.3 | 9.90% | 4.5% | |||||
Total Debt | $ | 922.3 | 24.2% | |||||
% of Equity | ||||||||
Sharp/Triples VMVS Convertible Equity3 | $ | 133.2 | 5.0% | |||||
HRH Existing Equity | 620.6 | 23.3% | ||||||
| HRH New Equity | 644.7 | 24.2% | ||||||
| Total HRH, (47.5%) of total | $ | 1,265.3 | 47.5% | |||||
| Cascade Existing Equity | $ | 58.7 | 2.2% | |||||
| Cascade New Equity | 1,206.6 | 45.3% | ||||||
| Total Cascade, (47.5%) of total | $ | 1,265.3 | 47.5% | |||||
Total Equity | $ | 2,663.7 | 69.8% | |||||
| Available Cash | $ | 230.0 | 6.0% | |||||
| Total Sources | $ | 3,816.0 | 100.0% | |||||
Uses:
| | Shares (mm) | Price (US$) | Amount | |||||
|---|---|---|---|---|---|---|---|---|
| VMV Shares | 3.73 | $ | 82.00 | $ | 305.5 | |||
| LV Shares | 33.08 | $ | 82.00 | 2,712.4 | ||||
| Options4 | 1.58 | $ | 82.00 | 129.8 | ||||
Total Equity Purchased | $ | 3,147.8 | ||||||
Convertible Debt Principal | $ | 250.0 | ||||||
| Convertible Premium | 36.1 | |||||||
| Make Whole Premium | 24.3 | |||||||
| Swaps Wind-down | 34.9 | |||||||
| Total Convertible Debt | $ | 345.4 | ||||||
1990 Sale of Control Payment | $ | 287.6 | ||||||
| Legal/Advisory/Other | 24.0 | |||||||
| Financing Fees | 11.3 | |||||||
| Total Deal Costs | $ | 35.3 | ||||||
| Total Uses | $ | 3,816.0 | ||||||
1 The interest rate on the Senior Debt is assumed to be LIBOR + 250 for illustrative purposes. Additionally, Senior Debt is assumed to be $750 mm.
2 Assumes 56% of the VMVS are converted into preferred shares for illustrative purposes.
3 Assumes 44% of the VMVS are converted into equity for illustrative purposes.
4 Includes phantom options and assumes the treasury stock method.
13