As filed with the Securities and Exchange Commission on December 12, 2013
Registration No. 333-
SECURITIES AND EXCHANGE COMMISSION
Washington, D.C. 20549
REGISTRATION STATEMENT UNDER SCHEDULE B
OF
THE SECURITIES ACT OF 1933
REPUBLIC OF THE PHILIPPINES
(Name of Registrant)
Name and Address of Authorized Representative in the United States:
Hon. Mario Lopez de Leon, Jr.
Consul General
Philippine Consulate General
556 Fifth Avenue
New York, New York 10036-5095
It is requested that copies of notices and communications from the Securities and Exchange Commission be sent to:
| | |
Jeffrey Cohen, Esq. Pamela Shores, Esq. Linklaters 10th Floor, Alexandra House 18 Chater Road Hong Kong SAR | | Sung K. Kang, Esq. Robert K. Williams, Esq. c/o Cleary Gottlieb Steen & Hamilton LLP 37th Floor, Hysan Place 500 Hennessy Road Hong Kong SAR |
Approximate date of commencement of proposed sale to the public: From time to time after the Registration Statement becomes effective.
The securities being registered herein are to be offered on a delayed or continuous basis pursuant to Release Nos. 33-6240 and 33-6424 under the Securities Act of 1933.
CALCULATION OF REGISTRATION FEE
| | | | | | | | | | | | | | | | |
| Title of each class of securities to be registered | | Amount to be registered | | | Proposed maximum
offering price (per Unit(1)) | | | Proposed maximum
aggregate offering
(Price(1)(2)) | | | Amount of
registration fee | |
Debt Securities and Warrants | | $ | 2,496,183,895 | | | | 100 | % | | $ | 2,496,183,895 | | | | (3 | ) |
Notes:
| (1) | Estimated for purpose of determining the registration fee. |
| (2) | Exclusive of accrued interest, if any. |
| (3) | This Registration Statement carries forward $2,496,183,895 aggregate principal amount of debt securities and/or warrants covered by the Registrant’s Registration Statement No. 333-183717 filed on October 18, 2012. |
The Registrant hereby amends this Registration Statement on such date or dates as may be necessary to delay its effective date until the Registrant shall file a further amendment which specifically states that this Registration Statement shall thereafter become effective in accordance with Section 8(a) of the Securities Act of 1933 or until the Registration Statement shall become effective on such date as the Commission, acting pursuant to said Section 8(a), may determine.
Pursuant to Rule 429 under the Securities Act of 1933, the prospectus contained herein relates to debt securities and/or warrants having an aggregate principal amount of $2,496,183,895 registered under the Registrant’s Registration Statement No. 333-183717 under Schedule B and not previously sold in the United States for which the Registrant paid a registration fee of $295,314. This Registration Statement, which is a new Registration Statement, also constitutes Post-Effective Amendment No. 1 to Registration Statement No. 333-183717, and such post-effective amendment shall hereafter become effective concurrently with the effectiveness of this Registration Statement and in accordance with Section 8(c) of the Securities Act of 1933.
The information in this prospectus is not complete and may be changed. The Republic may not issue the securities offered in this prospectus until the registration statement filed with the Securities and Exchange Commission is effective. This prospectus is not an offer to sell these securities and it is not soliciting an offer to buy these securities in any jurisdiction where the offer or sale is not permitted.
SUBJECT TO COMPLETION, DATED DECEMBER 12, 2013

Republic of the Philippines
$2,496,183,895
Debt Securities and/or
Warrants
The Republic will provide specific terms of these securities in supplements to this prospectus. You should read this prospectus and any supplement carefully before you invest. This prospectus may not be used to offer or sell securities unless accompanied by a supplement. The Republic may sell the securities directly, through agents designated from time to time or through underwriters. The names of any agents or underwriters will be provided in the applicable prospectus supplement.
You should not assume that information in this prospectus, any prospectus supplement or any document incorporated by reference in them is accurate as of any date other than its date.
Neither the Securities and Exchange Commission nor any state securities commission has approved or disapproved of these securities or determined if this prospectus is truthful or complete. Any representation to the contrary is a criminal offense.
This prospectus is dated .
TABLE OF CONTENTS
ii
CERTAIN DEFINED TERMS AND CONVENTIONS
Statistical information included in this prospectus is the latest official data publicly available at the date of this prospectus. Financial data provided in this prospectus may be subsequently revised in accordance with the Republic’s ongoing maintenance of its economic data, and that revised data will not be distributed by the Republic to any holder of the Republic’s securities. As used in this prospectus, the term “N/A” identifies statistical or financial data that is not available.
All references in this prospectus (a) to the “Republic” or the “Philippines” are to the Republic of the Philippines, (b) to the “Government” are to the national government of the Philippines and (c) to “Bangko Sentral” or “BSP” are to Bangko Sentral ng Pilipinas, the central bank of the Philippines.
“Government-owned corporations,” “Government-owned and controlled corporations” or “GOCCs” are corporations at least 51% of the capital stock of which is owned by the Government, directly or indirectly, through its instrumentalities.
The fiscal year of the Government commences on January 1 of each year and ends on December 31 of such year.
Unless otherwise indicated, all references in this prospectus to “Philippine Pesos,” “pesos” or “(Peso)” are to the lawful national currency of the Philippines, those to “dollars,” “U.S. dollars” or “$” are to the lawful currency of the United States of America, those to “euro” and “€” are to the currency introduced on January 1, 1999 at the start of the third stage on European Economic and Monetary Union and those to “Japanese yen,” “yen” or “JPY” are to the lawful national currency of Japan. References to “SDR” are to Special Drawing Rights of the International Monetary Fund.
This prospectus contains translations of some peso amounts into U.S. dollars for the convenience of the reader. Unless otherwise specified, the translations were made at the exchange rate as stated in the Bangko Sentral Reference Exchange Rate Bulletin published by the Treasury Department of Bangko Sentral on the relevant date. No representation is made that the peso amounts actually represent the U.S. dollar amounts or could have been converted into U.S. dollars at the rates indicated, at any particular rate or at all.
Economists show Gross Domestic Product (“GDP”) and Gross National Income (“GNI”) in both current and constant market prices. GDP and GNI at current market prices value a country’s output using the actual prices for each year, whereas GDP and GNI at constant market prices (also referred to as “real” GDP and GNI) value output using the prices from a base year, thereby eliminating the distorting effects of inflation and deflation. In the first quarter of 2011, the standards under the Philippine System of National Accounts (the “PSNA”) for the calculation of GDP and GNI (known as gross national product (“GNP”) prior to the 2011 revisions) were revised, changing the constant base year for these calculations from 1985 to 2000. The revision of the base year for GDP and GNI was part of a number of changes to the PSNA methodology, which also included changes to the Republic’s classification systems and the designation of economic categories and subcategories. See “Republic of the Philippines—GDP and Major Financial Indicators.” In this prospectus, unless otherwise specified, data has been presented on the basis of the PSNA standards as revised in 2011, and certain real GDP and GNI figures for years prior to the 2011 revisions have been restated based on the 2000 base year. As a result, these figures may be different from data previously reported by the Republic. Unless otherwise specified, GDP and GNI figures in this prospectus and any prospectus supplement are real GDP and GNI figures, respectively, using the year ended December 31, 2000 as the base year. Unless otherwise specified, growth figures for GDP and GNI in this prospectus and any prospectus supplement are period-on-period comparisons of real GDP and GNI, respectively, using the year ended December 31, 2000 as the base year.
The balance of payments statistics released by Bangko Sentral are based on the trade-in-goods statistics compiled by the National Statistics Office (the “NSO”). However, for purposes of inclusion in the overall balance of payments, the trade-in-goods statistics reported by the NSO are adjusted by Bangko Sentral to exclude
iii
temporary exports and imports and returned goods. This adjustment is intended to bring the balance of payments results in line with the fifth edition of the International Monetary Fund’s Balance of Payments Manual (“BPM5”). In March 2013, Bangko Sentral adopted the sixth edition of the International Monetary Fund’s Balance of Payments Manual (“BPM6”) framework covering balance of payments statistics for 2011 onwards, pursuant to which the property income and expense accounts have been revised. To enable a comparison of the balance of payments transaction categories under both the BPM5 and BPM6 frameworks, Bangko Sentral has published balance of payments statistics through 2012 on both a BPM5 and BPM6 basis. Bangko Sentral plans full implementation of the BPM6 framework by 2014. The key changes from the BPM5 methodology to the BPM6 methodology include (i) changes in the classification of certain financial instruments such as monetary gold, employee stock options and insurance, pension and standardized guarantee schemes, (ii) changes in the classification of institutional sectors such as monetary authorities, banks, non-financial corporations and non-profit institutions, (iii) changes in certain components that comprise the current account such as goods, services, income and current transfers, (iv) changes in certain components that comprise the capital account, and (v) changes in certain components that comprise the financial account.
Under BPM6, goods that are imported into the Philippines on a consignment basis for purposes of repair or improvement within the Philippines and then exported back to their country of origin such that no change in ownership occurs are recognized under the services account rather than the goods account. There have also been certain corresponding reclassifications of items from the services account to the goods account. The financial account under BPM6 is now stated on an asset and liability basis. Under BPM5, inflows and outflows to and from the financial account were recognized based on the residency of investors—non-residents investing within the Philippines or Philippine residents investing abroad. Under BPM6, Bangko Sentral reports the net acquisition of assets and net incurrence of liabilities.
Unless otherwise specified, balance of payments statistics for 2011 onwards presented in this prospectus and any prospectus supplement are presented on a BPM6 basis. As a result, these statistics may be different from data previously reported by the Republic.
In May 2013, the National Statistical Coordination Board (the “NSCB”) revised GNI and net primary income figures for 2010 to 2013. These revisions were part of the NSCB’s periodic updates of the Republic’s National Income Accounts in response to new data, in particular the latest data from the Philippine Overseas Employment Agency in relation to compensation inflow, which includes salaries from overseas foreign workers (“OFWs”). As a result, estimates of GNI and net primary income for 2010, 2011, 2012 and the first nine months of 2013 presented in this prospectus and any prospectus supplement are not presented on the same basis as GNI and net primary income figures for 2008 and 2009.
In July 2013, Bangko Sentral adopted a new system for compiling and reporting monetary statistics called the Standardized Report Forms (the “SRF”) format as part of Bangko Sentral’s adherence to international best practices in statistical compilation. The SRF is a unified international framework for reporting monetary and financial statistics to the International Monetary Fund (the “IMF”). Under the SRF, foreign and domestic assets reported by Bangko Sentral are no longer presented net of liabilities; rather, liabilities are reported separately. The presentation of general Government assets, however, remains net of liabilities. The adoption of the SRF system did not result in any change to overall monetary balances. However, Bangko Sentral has, in connection with the adoption of the SRF, also implemented certain recommendations from the IMF pertaining to the inclusion of unsecured subordinated debt and accrued interest expense, which has given rise to minor changes in amounts previously reported.
Any discrepancies in the tables included herein between the amounts listed and the totals thereof are due to rounding.
iv
FORWARD-LOOKING STATEMENTS
Some of the statements contained in this prospectus under “Republic of the Philippines” are forward looking. They include statements concerning, among others:
| | • | | the Republic’s economic, business and political conditions and prospects; |
| | • | | the Republic’s financial stability; |
| | • | | the depreciation or appreciation of the peso; |
| | • | | changes in interest rates; and |
| | • | | governmental, statutory, regulatory or administrative initiatives. |
Actual results may differ materially from those suggested by the forward-looking statements due to various factors. These factors include, but are not limited to:
| | • | | adverse external factors, such as high international interest rates and recession or low growth in the Republic’s trading partners. High international interest rates could increase the Republic’s current account deficit and budgetary expenditures. Recession or low growth in the Republic’s trading partners could lead to fewer exports from the Republic and, indirectly, lower growth in the Republic; |
| | • | | instability or volatility in the international financial markets. This could lead to domestic volatility, making it more difficult for the Government to achieve its macroeconomic goals. This could also lead to declines in foreign direct and portfolio investment inflows; |
| | • | | adverse domestic factors, such as a decline in domestic savings and investment, increases in domestic inflation, high domestic interest rates and exchange rate volatility. Each of these factors could lead to lower growth or lower international reserves; and |
| | • | | other adverse factors, such as climatic or seismic events, the recurrence of the outbreak of diseases such as severe acute respiratory syndrome and avian influenza and political uncertainty. |
DATA DISSEMINATION
The Republic is a subscriber to the International Monetary Fund’s Special Data Dissemination Standard (“SDDS”), which is designed to improve the timeliness and quality of information of subscribing member countries. The SDDS requires subscribing member countries to provide schedules indicating, in advance, the date on which data will be released or the so-called “Advance Release Calendar.” For the Philippines, precise dates or “no-later-than” dates for the release of data under the SDDS are disseminated three months in advance through the Advance Release Calendar, which is published on the Internet under the International Monetary Fund’s Dissemination Standards Bulletin Board. Summary methodologies of all metadata to enhance transparency of statistical compilation are also provided on the Internet under the Dissemination Standards Bulletin Board. The Internet website for the Philippines’ “Advance Release Calendar” and metadata is located at “http://dsbb.imf.org/Applications/web/sddsctycatarclist/?strcode=PHL.”
USE OF PROCEEDS
Unless otherwise specified in the applicable prospectus supplement, the net proceeds from sales of securities will be used for the general purposes of the Republic, including for budget support and to repay a portion of the Government’s borrowings.
v
RATINGS
Ratings included herein are not a recommendation to purchase, hold or sell securities and may be changed, suspended or withdrawn at any time. The Republic’s current credit ratings and rating outlooks are dependent upon economic conditions and other factors affecting credit risk that are outside the control of the Republic. Each rating should be evaluated independently of the others. Detailed explanations of the ratings may be obtained from the rating agencies. The Republic discloses these ratings because, though the Republic has no control over ratings, they are important to the Republic’s ability to obtain the financing that it needs on terms that are favorable to it. A decision by a rating agency to downgrade the Republic’s credit rating may have an adverse impact on its ability to access funding and may increase its borrowing costs, while an upgrade in its rating may improve its access to funding and reduce its borrowing costs.
vi
PROSPECTUS SUMMARY
REPUBLIC OF THE PHILIPPINES
General
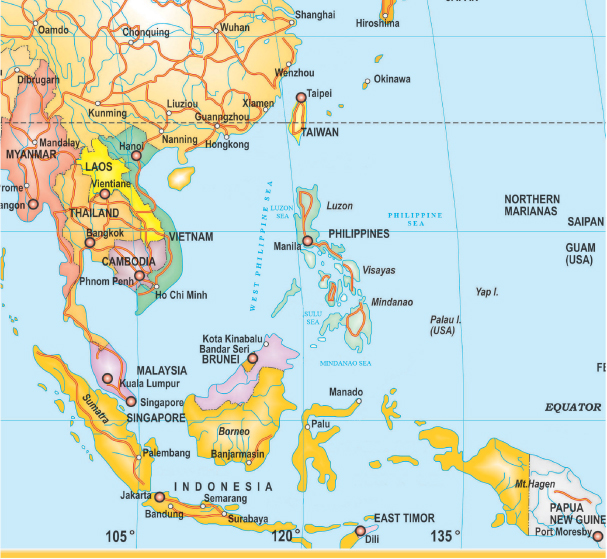
The Philippine archipelago has over 7,000 islands with a total land area of approximately 300,000 square kilometers. The islands are grouped into three geographic regions: Luzon, the largest island, in the north, covering an area of 141,395 square kilometers; Visayas in the central region, covering an area of 56,606 square kilometers; and Mindanao in the south, covering an area of 101,999 square kilometers. Manila is the Republic’s capital. As of the 2010 Census of Population and Housing (the “2010 Census”) conducted by the NSO, the Republic’s population was estimated at approximately 92.3 million.
Government and Politics
The Republic’s current constitution (the “Constitution”) was adopted by plebiscite in 1987. The ratification of the new Constitution in 1987 restored a presidential form of government consisting of three branches: executive, legislative and judiciary. Executive power is vested in the President, who is elected by direct popular vote and who may serve one term of six years. Legislative authority is vested in the Congress of the Philippines, which consists of the Senate and the House of Representatives. Judicial power is vested in the Supreme Court and in various lower courts.
President Benigno S. Aquino III was elected in May 2010, and he commenced serving his current six-year term on June 30, 2010. Mr. Aquino was a former member of the House of Representatives and the Senate prior to his election as President. President Aquino is the chairman of the Liberal Party.
On July 22, 2013, President Aquino delivered his fourth State of the Nation Address, during which the President discussed the nation’s progress in a number of areas, including agriculture, health, education, disaster preparedness, anti-corruption efforts and the ongoing peace process in Bangsamoro. In particular, the President pointed to the establishment of the Transition Commission to craft the Bangsamoro Basic Law and called on Congress to pass the Bangsamoro Basic Law before the end of 2014. The President also highlighted the success of the recent peaceful elections, particularly in the Autonomous Region in Muslim Mindanao (the “ARMM”), marking the first time ARMM elections have been held simultaneously with national elections.
President Aquino focused on his continued aim to increase Government efficiency and ensure the prudent management of Government-owned and controlled corporations (“GOCCs”). The President also highlighted certain of the nation’s economic achievements, including two consecutive 10 place jumps in the World Economic Forum’s global competitive index (from 87th place in 2009 to 59th place in 2013) and achieving investment-grade status from Standard & Poor’s Ratings Services (“Standard & Poor’s”) and Fitch Ratings Ltd. (“Fitch”). He also noted that the Government believes the Republic is still capable of realizing its goal of rice self-sufficiency, having reached 94% rice self-sufficiency by the end of 2012. In October 2013, Moody’s Investor Service, Inc. (“Moody’s”) also upgraded the Philippines to investment-grade status.
Economy
The Philippines has a mixed economy in which the Government is directly engaged in certain economic activities through GOCCs and Government financial institutions (“GFIs”). The Government actively encourages domestic and foreign private investment. The Philippines has undertaken liberalization of trade and investment in tandem with the deregulation of the financial system, foreign exchange liberalization, tax reforms, acceleration of privatization, enhancement of competition in the provision and operation of public utilities, and deregulation of the oil and power industries.
1
The three principal sectors of the Philippine economy are (i) service, (ii) industry and (iii) agriculture, hunting, forestry and fishing. The service sector accounted for 57.1% of GDP in 2012, including the subsectors of trade and repair of motor vehicles, motorcycles, personal and household goods (16.7% of GDP) and real estate, renting and business activities (10.9% of GDP). The industry sector accounted for 32.0% of GDP in 2012, including the subsectors of construction and mining and quarrying (5.4% and 1.1%, respectively, of GDP), and the agriculture, hunting, forestry and fishing sector accounted for 11.1%.
In 2012, GDP grew by 6.8%, compared with growth of 3.6% in 2011. The largest contributor to the increase in the rate of growth in 2012 was a reversal of the contraction in the construction subsector experienced in 2011 of 9.8% to growth of 15.7% in 2012. Growth in the trade and repair of motor vehicles, motorcycles, personal and household goods subsector also increased, from growth of 3.3% in 2011 to growth of 7.5% in 2012. The transport, storage and communications subsector grew by 8.1% in 2012, compared to growth of 4.3% in 2011, which was also a major contributor. Partially offsetting the performance of these subsectors was a decrease in growth in the mining and quarrying subsector, from growth of 7.0% in 2011 to growth of 2.2% in 2012. Growth in both the agriculture and forestry subsector and the real estate, renting and business activities subsector also decreased, from 4.4% and 8.4%, respectively, in 2011 to 3.6% and 7.5%, respectively, in 2012. GNI in 2012 grew by 6.5% compared to 2.8% in the prior year. The GNI growth rate was lower than the GDP growth rate due to the relatively lower growth in net primary income of 4.8% in 2012 compared to growth in GDP in 2012, though this represented an increase over the 1.6% growth in net primary income in 2011. Net primary income is a measure included in GNI but excluded from GDP.
Preliminary data indicate that GDP grew by 7.4% in the first nine months of 2013, compared with growth of 6.7% in the first nine months of 2012. The increase in growth in the first nine months of 2013 was primarily due to increased growth in the manufacturing subsector, from growth of 5.4% in the first nine months of 2012 to growth of 9.8% in the first nine months of 2013. An increase in growth in the financial intermediation (including banking institutions) subsector, from 8.0% in the first nine months of 2012 to growth of 13.3% in the first nine months of 2013, was also a significant contributor. Growth in construction also increased, from growth of 10.5% in the first nine months of 2012 to growth of 16.3% in the first nine months of 2013. Partially offsetting the performance of these subsectors was a decrease in growth in the transport, storage and communications subsector, from growth of 9.4% in the first nine months of 2012 to growth of 5.3% in the first nine months of 2013. Growth in the other services subsector also decreased to growth of 5.7% in the first nine months of 2013, from growth of 8.5% in the first nine months of 2012. GNI in the first nine months of 2013 increased by 7.3%, compared to 6.5% in the corresponding period in 2012. GNI growth was lower compared to GDP growth due to relatively lower growth in net primary income of 6.7% in the first nine months of 2013 compared to GDP growth in the same period, though this was an increase from the 5.5% growth in net primary income in the first nine months of 2012.
Foreign trade is important to the Philippine economy. In 2012, exports of goods as reported by the NSO were equal to 17.4% of the country’s GNI, and imports were equal to 20.8% of GNI. Total exports of goods on a BPM6 basis as reported by the NSO were $46.2 billion in 2012, of which manufactured goods accounted for 86.1%. Electronics, machinery and transport equipment and garments have historically been the Republic’s leading manufactured exports.
In the first six months of 2013, preliminary data indicate that the overall balance of payments position of the Republic on a BPM6 basis recorded a surplus of $2.6 billion, which was 95.8% higher than the surplus of $1.3 billion in the corresponding period of 2012, primarily as a result of an increased surplus in the current account as well as a substantially lower deficit in the net unclassified items account. The current account recorded a surplus of $5.6 billion in the first six months of 2013, which was substantially higher than the surplus of $2.7 billion recorded in the corresponding period of 2012. The net unclassified items account recorded a deficit of $3.9 billion in the first six months of 2013, which was 29.2% lower than the $5.5 billion deficit recorded in the corresponding period of 2012. These factors were partially offset by a substantially lower surplus in the capital and financial account of $850 million compared to $4.2 billion in the corresponding period of 2012.
2
On June 14, 2012, the Monetary Board of Bangko Sentral announced that it would maintain the overnight borrowing or reverse repurchase (“RRP”) and overnight lending or repurchase (“RP”) rates at 4.0% and 6.0%, respectively. However, on July 26, 2012, in response to the continued uncertainty in the global financial markets, the Monetary Board reduced both the RRP rate and the RP rate by 0.25% to 3.75% and 5.75%, respectively. On October 25, 2012, the Monetary Board again reduced both the RRP rate and the RP rate by 0.25% to 3.50% and 5.50%, respectively. The Monetary Board has maintained its policy rates at 3.50% for the RRP rate and 5.50% for the RP rate.
The average interest rates for 91-day Treasury bills in the first 11 months of 2013 decreased to 0.3% from an average of 1.6% in 2012, compared to 1.4% in 2011 and 3.7% in 2010.
In the first 11 months of 2013, the average exchange rate was (Peso)42.3 per U.S. dollar, compared to the full year averages of (Peso)42.2 in 2012, (Peso)43.3 in 2011 and (Peso)45.1 in 2010.
As of November 30, 2013, the Philippine Stock Exchange composite index closed at 6,208.8 compared to a close of 5,812.7 on December 28, 2012, 4,372.0 on December 29, 2011, 4,201.1 on December 30, 2010, 3,052.7 on December 29, 2009 and 1,872.9 on December 24, 2008.
As of June 30, 2013, the Republic’s outstanding external debt approved by or registered with Bangko Sentral was $58.0 billion, a 3.9% decrease from the $60.3 billion recorded as of December 31, 2012 and a 5.3% decrease from the $61.2 billion recorded as of June 30, 2012. The decrease was mainly due to loan repayments as well as negative foreign exchange revaluation adjustments as the U.S. dollar strengthened, particularly against the Japanese yen. Bangko Sentral is required to approve all public sector borrowings, subject to certain exceptions, in order to monitor the Republic’s external debt service burden and channel loan proceeds to priority projects in line with the Government’s development plans. As of December 31, 2012, the Republic’s external debt-to-GDP ratio was 24.1%, compared with an external debt-to-GDP ratio of 27.0% as of December 31, 2011.
As of June 30, 2013, approximately 29.5% of total Bangko Sentral-approved external debt (including short-term debt) was denominated in U.S. dollars while 12.2% was denominated in Japanese yen. Multi-currency loans from institutions such as the International Bank for Reconstruction and Development (the “World Bank”) and the Asian Development Bank (the “ADB”) accounted for 7.2% of total Bangko Sentral-approved external debt.
3
Summary Economic Information of the Republic of the Philippines
| | | | | | | | | | | | | | | | | | | | | | | | |
| | | 2008 | | | 2009 | | | 2010 | | | 2011 | | | 2012 | | | 2013(1) | |
| | | (Peso in billions, except as indicated) | |
GDP (at then-current market prices) | | | 7,720.9 | | | | 8,026.1 | | | | 9,003.5 | | | | 9,735.5 | | | | 10,564.9 | | | | 8,300.3 | |
GDP (at constant 2000 prices) | | | 5,237.1 | | | | 5,297.2 | | | | 5,701.5 | | | | 5,924.4 | | | | 6,311.7 | | | | 4,948.6 | |
GDP per capita (in $ at then-current market prices)(2) | | $ | 1,919 | | | $ | 1,851 | | | $ | 2,155 | | | $ | 2,395 | | | $ | 2,588 | | | | — | |
GDP growth rate (at constant 2000 prices) | | | 4.2 | % | | | 1.1 | % | | | 7.6 | % | | | 3.6 | % | | | 6.8 | % | | | 7.4 | %(3) |
Consumer Price Inflation rate(4) | | | 8.3 | % | | | 4.2 | % | | | 3.8 | % | | | 4.6 | % | | | 3.2 | % | | | 2.8 | %(5) |
Government surplus/(deficit) as % of GDP (at then-current market prices) | | | (0.9 | )% | | | (3.7 | )% | | | (3.5 | )% | | | (2.0 | )% | | | (2.3 | )% | | | (0.9 | )% |
Government debt at end of period as % of GDP (at then-current market prices) | | | 54.7 | % | | | 54.8 | % | | | 52.4 | % | | | 51.0 | % | | | 51.5 | % | | | 49.8 | % |
Public sector borrowing requirement(6) | | | (90.2 | ) | | | (329.8 | ) | | | (379.0 | ) | | | (220.1 | ) | | | (224.0 | ) | | | — | |
Consolidated public sector financial position(7) | | | 30.2 | | | | (240.1 | ) | | | (355.8 | ) | | | (175.1 | ) | | | (163.3 | ) | | | — | |
Current account surplus/(deficit) as % of GDP | | | 2.1 | % | | | 5.6 | % | | | 4.5 | % | | | 3.1 | % | | | 2.8 | % | | | 4.2 | % |
Overall balance of payments position at end of period as % of GDP(8) | | | 0.1 | % | | | 3.8 | % | | | 7.2 | % | | | 5.1 | % | | | 3.7 | % | | | 1.9 | % |
| | | | | | |
| | | 2008 | | | 2009 | | | 2010 | | | 2011 | | | 2012 | | | 2013(1) | |
| | | (Peso in billions, end of period; except as indicated) | |
Direct domestic debt of the Government(9) | | | 2,414.4 | | | | 2,470.0 | | | | 2,718.2 | | | | 2,873.4 | | | | 3,468.4 | | | | 5,609.7 | |
| Direct external debt of the Government ($ billion)(9)(10) | | $ | 38.1 | | | $ | 41.6 | | | $ | 45.6 | | | $ | 47.3 | | | $ | 47.9 | | | $ | 44.6 | |
Public sector domestic debt(11) | | | 2,328.3 | | | | 2,691.7 | | | | 3,783.1 | | | | 4,773.2 | | | | 5,219.9 | | | | 5,517.3 | |
Public sector external debt(10)(12) ($ billion) | | $ | 61.9 | | | $ | 64.7 | | | $ | 66.1 | | | $ | 64.2 | | | $ | 52.5 | | | $ | 50.6 | |
Public sector external debt(12) | | | 2,935.1 | | | | 2,998.0 | | | | 2,899.7 | | | | 2,820.2 | | | | 2,275.7 | | | | 2,217.5 | |
Unemployment rate (%) | | | 7.4 | | | | 7.5 | | | | 7.3 | | | | 7.0 | | | | 7.0 | | | | 7.3 | |
Gross international reserves ($ billion)(10)(13) | | $ | 37.6 | | | $ | 44.2 | | | $ | 62.4 | | | $ | 75.3 | | | $ | 83.8 | | | $ | 83.6 | (14) |
Sources: National Statistics Office; National Statistical Coordination Board; Bureau of the Treasury; Department of Finance, Bangko Sentral.
Notes:
| (1) | Preliminary data as of or for the first six months of 2013, unless otherwise indicated. |
| (2) | Amounts in pesos have been translated into U.S. dollars using the average Bangko Sentral reference exchange rates for the applicable period. |
| (3) | Preliminary data for the first nine months of 2013 compared to the first nine months of 2012. |
| (4) | The Government uses 2006 as the base year for CPI calculations. See “Republic of the Philippines—Prices, Employment and Wages—Inflation” for a more detailed discussion of CPI calculations. |
| (5) | Preliminary data for the first 11 months of 2013. |
| (6) | Represents the aggregate deficit or surplus of the Government, the Central Bank-Board of Liquidation (the “CB-BOL”), the Oil Price Stabilization Fund and the 14 major GOCCs, the debt of which comprises virtually all the debt incurred by GOCCs (the “14 major GOCCs”). |
| (7) | Comprises the aggregate deficit or surplus of the Government, the CB-BOL’s accounts, the 14 major GOCCs, the Social Security System, the Government Service Insurance System, Bangko Sentral, the GFIs and local government units. |
| (8) | Overall balance of payments has been revised to reflect late reports, post-audit adjustments and final data from companies. See “Republic of the Philippines—Balance of Payments—Revisions” for a more detailed discussion of recent and pending revisions to previously reported data. |
| (9) | Represents debt of the Government only, and does not include other public sector debt. Includes direct debt obligations of the Government, the proceeds of which are on-lent to GOCCs and other public sector entities, but excludes debt guaranteed by the Government and debt originally guaranteed by other public sector entities for which the guarantee has been assumed by the Government. |
| (10) | Amounts in original currencies were translated into U.S. dollars or pesos, as applicable, using the Bangko Sentral reference exchange rates at the end of each applicable period. |
| (11) | Represents debt of the Government, the 14 major GOCCs, the CB-BOL, Bangko Sentral and the GFIs. |
4
| (12) | Includes public sector debt, whether or not guaranteed by the Government. |
| (13) | Comprises the holdings by Bangko Sentral of gold reserves, foreign investments, foreign exchange and SDRs, including Bangko Sentral’s reserve position in the International Monetary Fund. |
| (14) | Preliminary data as of October 31, 2013. |
Typhoon “Yolanda” (“Haiyan”)
In November 2013, Typhoon “Yolanda” (also known as Typhoon “Haiyan”) made landfall in Eastern Samar. As of December 4, 2013, 5,719 people were reported dead from the storm, 1,779 persons were reported missing, 26,233 persons had been injured and 433 evacuation centers were still sheltering approximately 96,474 people. As of the same date, estimated damages had reached (Peso)34.4 billion, comprising an estimated (Peso)17.3 billion to infrastructure and (Peso)17.0 billion to agriculture in the regions affected by the storm.
Despite the damage and loss resulting from Typhoon “Yolanda,” as well as other calamities that struck the country in 2013, including a 7.2 magnitude earthquake in the Visayas region in October, in December 2013, the Development and Budget Coordination Committee (the “DBCC”) maintained their 6.0% to 7.0% GDP growth target for 2013 and their 6.5% to 7.5% GDP growth target for 2014. The DBCC also maintained their export and import growth targets of 10.0% and 12.0%, respectively, for 2013. However, for 2014, the DBCC reduced their export estimates from 11.0% to 6.0% and import estimates from 13.0% to 5.0%. The DBCC maintained their projection for the 2014 budget deficit of (Peso)266.2 billion, representing 2.0% of projected GDP for the year. See “Republic of the Philippines—Natural Disasters—Typhoons and Flooding—Typhoon “Yolanda” (“Haiyan”).”
5
REPUBLIC OF THE PHILIPPINES
History, Land and People
History
Spain governed the Philippines as a colony from 1521 until 1898. On June 12, 1898, during the Spanish-American War, the Filipinos declared their independence. The United States claimed sovereignty over the Philippines under the 1898 Treaty of Paris, which ended the Spanish-American War, and governed the Philippines as a colony until 1935, when the Philippines became a self-governing commonwealth. On July 4, 1946, the Philippines became an independent republic.
Geography and General Information
The Philippine archipelago, located in Southeast Asia, comprises over 7,000 islands and a total land area of approximately 300,000 square kilometers. The Republic groups the islands into three geographic regions: Luzon in the north, covering an area of 141,395 square kilometers, Visayas in the center, covering an area of 56,606 square kilometers, and Mindanao in the south, covering an area of 101,999 square kilometers. The Republic is also divided into 17 administrative regions.
6
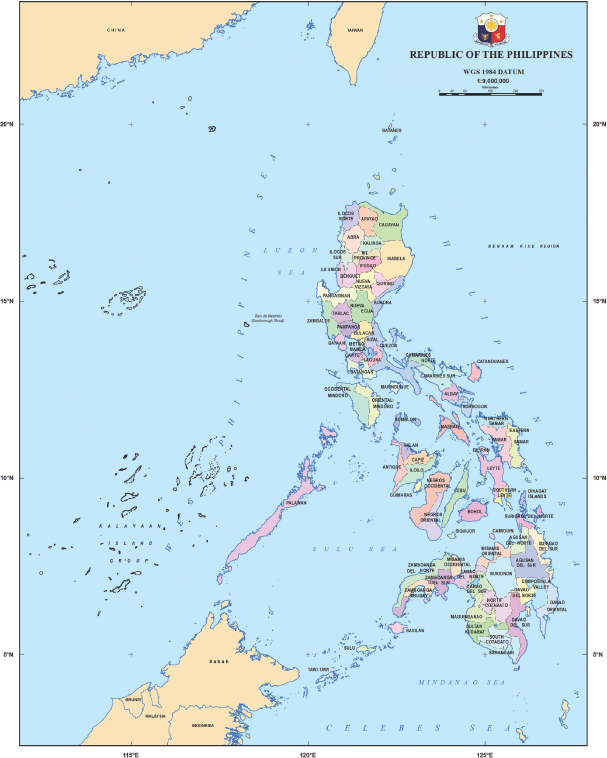
| Note: | For a discussion of territorial disputes over certain islands in the West Philippine Sea, see “—Government—Territorial Dispute over the West Philippine Sea.” |
7
In 2011, classified forest lands covered 15.1 million hectares or approximately 50.0% of the Philippines, and approximately 47.0% of the country was under agricultural cultivation. As of April 2013, approximately 30.9% of the workforce was employed in the agriculture sector. Agriculture, hunting, forestry and fishing provided approximately 6.8% of the Republic’s export earnings (including exports of agriculture-based products) in 2012. Although the Republic is a major exporter of certain agricultural products, manufactured goods comprise the most important category of the Republic’s exports, accounting for 85.9% of the Republic’s exports in 2012. Electronics, machinery and transport equipment and garments have historically been the Republic’s leading manufactured exports.
The Republic’s population was 92.3 million according to the 2010 Census. The Republic’s capital, Manila, located in Luzon, had an estimated population of 1.7 million in 2010. The cities of Manila, Pasay, Caloocan, Quezon, Mandaluyong, Las Piñas, Muntinlupa, Marikina, Pasig, Makati, Malabon, Valenzuela and Parañaque, together with four surrounding municipalities, make up the National Capital Region or Metro Manila. Metro Manila, the most populous of the administrative regions, had an estimated population of 11.9 million people in 2010, representing approximately 12.9% of the Republic’s population. The average growth rate of the population of the Republic from 1990 to 2010 was 2.1%. The growth rate from 1990 to 2000 was 2.3% and the corresponding figure for the period from 2000 to 2010 was 1.9%.
The Republic has a relatively young population, with more than 40% of the population under the age of 20 and a median age of 23.4, according to the 2010 Census. The following table shows the population of the Republic, by age group, according to the 2010 Census.
2010 HOUSEHOLD POPULATION BY AGE
| | | | | | | | |
Age group | | Total household
population | | | Percentage of total
population in age
group | |
Under 1 | | | 1,967,714 | | | | 2.1 | % |
1-4 | | | 8,263,934 | | | | 9.0 | % |
5-9 | | | 10,317,657 | | | | 11.2 | % |
10-14 | | | 10,168,219 | | | | 11.0 | % |
15-19 | | | 9,676,359 | | | | 10.5 | % |
20-24 | | | 8,370,398 | | | | 9.1 | % |
25-29 | | | 7,390,062 | | | | 8.0 | % |
30-34 | | | 6,744,028 | | | | 7.3 | % |
35-39 | | | 5,990,108 | | | | 6.5 | % |
40-44 | | | 5,450,679 | | | | 5.9 | % |
45-49 | | | 4,664,537 | | | | 5.1 | % |
50-54 | | | 3,883,630 | | | | 4.2 | % |
55-59 | | | 2,980,350 | | | | 3.2 | % |
60-64 | | | 2,224,105 | | | | 2.4 | % |
65-69 | | | 1,495,115 | | | | 1.6 | % |
70-74 | | | 1,140,951 | | | | 1.2 | % |
75-79 | | | 705,977 | | | | 0.8 | % |
80 and over | | | 664,155 | | | | 0.7 | % |
| | | | | | | | |
Total | | | 92,097,978 | | | | 100.0 | % |
| | | | | | | | |
| | |
Median Age | | | 23.4 | | | | | |
Source: National Statistics Office, 2010 Census.
8
The majority of Filipinos have Malay ethnic origins. Filipino culture also includes strong Spanish, Chinese and American influences. Filipino is the national language, but English is the primary language used in business, government and education. The population speaks over 80 other dialects and languages, including Chinese and Spanish. As of 2008, the Republic’s literacy rate was 95.6%, ranking among the highest in Asia.
Christianity, primarily Roman Catholicism, is the predominant religion in the Philippines. A significant Muslim minority lives in Mindanao.
Government
Governmental Structure
Since 1935, the Republic has had three constitutions. The country adopted the current Constitution by plebiscite in February 1987 after Ferdinand Marcos, who had ruled for 20 years, was ousted a year earlier in favor of Corazon Aquino (who opposed Marcos in the 1986 presidential election) following a people’s uprising. The new Constitution restored a presidential form of government composed of three branches: executive, legislative and judicial.
The principal features of each branch are as follows:
| | • | | Executive—The President, elected by popular vote for a single, six-year term, exercises executive power. If the President dies, becomes permanently disabled, is removed from office or resigns, the Vice President acts as President for the remainder of the term. If the Vice President cannot serve, the President of the Senate or, if he or she cannot serve, the Speaker of the House of Representatives acts as President until the election and qualification of a new President or Vice President. The person acting as President for any remaining term may, if elected, serve a six-year term as President. |
| | • | | Legislative—Congress, comprising the Senate and the House of Representatives, exercises the Republic’s legislative authority. The Constitution mandates a Senate of 24 members and a House of Representatives of not more than 250 members (excluding sectoral representatives), all elected by popular vote. Senators serve for a term of six years and members of the House of Representatives serve for a term of three years. Senate and House of Representatives seats are subject to two consecutive term and three consecutive term limits, respectively. The country held elections for 12 Senators and all members of the House of Representatives in May 2013. |
| | • | | Judicial—The Supreme Court and any lower courts established by law exercise the Republic’s judicial authority. The Republic’s court system is a multi-tiered system of courts of general jurisdiction that includes the Supreme Court and the Court of Appeals. Below these are the Regional Trial Courts, Metropolitan Trial Courts, Municipal Trial Courts and Municipal Circuit Trial Courts, which are all courts of original jurisdiction. |
Special or administrative tribunals and quasi-courts also exercise judicial functions. Included in this category are constitutional commissions, the Sandiganbayan (a special court with jurisdiction over criminal and civil cases involving graft and corruption in the Government), the Court of Tax Appeals, the Shari’ah courts (which handle matters governed by Islamic law) and administrative agencies that handle specialized areas such as labor relations and securities regulation.
A Chief Justice and 14 Associate Justices constitute the Supreme Court, which supervises all lower courts and related personnel. The Supreme Court and the Court of Appeals may review decisions and rulings of lower courts and quasi-judicial tribunals. The President appoints each Supreme Court or Court of Appeals justice and lower court judge from at least three candidates nominated by the Judicial and Bar Council.
National Elections and Recent Political Developments
In January 2001, Gloria Macapagal-Arroyo, who was then the Vice President, became president after former President Joseph Estrada was subject to allegations of corruption, which culminated in impeachment
9
proceedings, mass public protests in Manila, withdrawal of support by the military and his eventual resignation from office. Former President Estrada was arrested and charged with perjury and plunder and later sentenced to life imprisonment. In June 2004, Mrs. Arroyo and Noli de Castro began six-year terms as President-elect and Vice President-elect, respectively, in a controversial election in which President Arroyo was accused of vote-rigging. President Arroyo unconditionally pardoned Mr. Estrada in 2007.
On November 23, 2009, the Republic suffered its worst instance of election-related violence when 57 people were killed in the province of Maguindanao in the Mindanao region. Various human rights groups condemned the mass killing, and in response, on December 4, 2009, then President Arroyo issued Proclamation No. 1959 declaring martial law in the province of Maguindanao. Proclamation No. 1959 was recalled on December 12, 2009, lifting the declaration of martial law.
On May 10, 2010, national elections were held for the positions of President, Vice President, 12 Senators, all members of the House of Representatives and most local government posts. On June 30, 2010, Benigno S. Aquino III, the son of Senator Benigno Aquino Jr. and former President Corazon Aquino, assumed office as President of the Republic. Former Makati City mayor Jejomar Binay assumed office as Vice President of the Republic. President Aquino is the chairman of the Liberal Party. Following the national elections on May 13, 2013, members of the Liberal Party currently hold four of the 24 seats in the Senate and 111 of the 286 seats in the House of Representatives (including seats allotted for sectoral or partylist representatives), which together constitute the 16th Congress of the Republic. Members of the Lakas-KAMPI CMD party of former President Arroyo currently hold two of the 24 seats in the Senate and 14 of the 286 seats in the House of Representatives (including seats allotted for sectoral or partylist representatives). The next national elections will be held on May 9, 2016 for the positions of President, Vice President, 12 Senators, all members of the House of Representatives and most local government posts (including Regional Governor, Regional Vice Governor and Members of the Regional Legislative Assembly of the Autonomous Region in Muslim Mindanao (the “ARMM”)).
In January 2011, President Aquino ordered the Department of Justice to investigate allegations of corruption within the Armed Forces of the Philippines (the “AFP”) after retired Philippine Army Colonel George Rabusa testified in a Senate hearing that various AFP chiefs of staff had embezzled millions of pesos during their respective tenures. Colonel Rabusa specifically alleged that Angelo Reyes, former Chief of Staff of the AFP under former President Arroyo, illegally received (Peso)50 million as a “retirement gift” when he retired in 2001. These allegations followed earlier reports of military officials embezzling portions of soldiers’ salaries and a mutiny by a group of junior military officers in 2003 over alleged corruption in the AFP. Reyes committed suicide on February 8, 2011. On April 14, 2011, Colonel Rabusa filed complaints for plunder against three previous AFP chiefs of staff and two Major Generals. On January 5, 2012, the Department of Justice indorsed the case to the Office of the Ombudsman for review and approval; however, on April 13, 2013 the Office of the Ombudsman dismissed the charges due to a lack of evidence. The Government is currently reviewing its legal options in relation to the Ombudsman’s decision.
On November 18, 2011, former President Arroyo was arrested on charges of electoral sabotage related to the 2007 Senate elections. At the time of her arrest, Mrs. Arroyo had been admitted to a hospital, claiming a rare bone disease. On November 15, 2011, Mrs. Arroyo attempted to leave the Philippines to receive medical treatment abroad, citing the Supreme Court of the Philippines’ decision granting her the right to leave the country. However, Government officials, on the strength of a watch list order, prevented her from departing. An arrest warrant was issued on November 18, 2011 by a lower court after the Philippine Commission on Elections filed charges alleging Mrs. Arroyo had ordered large-scale tampering with official election returns in the 2007 Senate elections, which helped win a seat in the Senate for one of her supporters. Mrs. Arroyo had initially challenged the legality of the charges but the Supreme Court overruled the challenge on July 23, 2013. The Government’s case against Mrs. Arroyo for alleged electoral sabotage is now pending before the lower court. On July 16, 2012, Mrs. Arroyo was also charged with plunder by the Office of the Ombudsman for the alleged misuse of Philippine Charity Sweepstakes Office funds while serving as President. Mrs. Arroyo, who was released on bail on July 25, 2012, was elected to a second term as a member of the House of Representatives on May 13, 2013 despite the charges pending against her.
10
On December 12, 2011, the House of Representatives impeached Renato Corona, Chief Justice of the Supreme Court of the Philippines. The impeachment followed a series of decisions by the Supreme Court that hindered the Government’s efforts to prevent former President Arroyo from leaving the Philippines for medical care. The impeachment complaint accused Mr. Corona of, among other charges, improperly issuing decisions that favored Mrs. Arroyo, including the decision to allow Mrs. Arroyo to leave the Philippines. The complaint also accused Mr. Corona of failing to disclose all of his properties, in violation of the rules applicable to all public officers requiring the declaration of their assets, liabilities and net worth. On May 29, 2012, the Senate voted to convict Mr. Corona. On August 24, 2012, President Aquino appointed Associate Justice Maria Lourdes Sereno as the new Chief Justice. Chief Justice Sereno is the first woman appointed to the position and can hold office for 18 years until she reaches the retirement age of 70.
Truth Commission
On July 30, 2010, President Aquino signed Executive Order No. 1, creating a truth commission primarily to “seek and find the truth on, and toward this end, investigate reports of graft and corruption committed by public officers and employees, their co-principals, accomplices and accessories from the private sector, if any, during the previous administration; and thereafter recommend the appropriate action or measures to be taken thereon.” On August 12, 2010, various members of the House of Representatives petitioned the Supreme Court to declare the order a violation of the constitutional doctrine of separation of powers between the executive and judicial branches. The Supreme Court declared the order unconstitutional on December 7, 2010.
Administrative Organization
As of December 1, 2013, the Republic had 17 administrative regions and 43,740 local government units. Local government units included 80 provinces, 140 cities, 1,494 municipalities (subdivisions of provinces) and 42,026 barangays. Highly urbanized cities function independently of any province, while other cities are subject to the administrative supervision of the provinces in which they are located.
The Government is organized primarily around the various departments and department-equivalent agencies of the executive branch, which implement the various programs and projects of the Government. The departments and department-equivalent agencies are grouped into the following five sectors.
| | |
| Sector | | Major Departments |
| |
Social services | | Health; Education, Culture and Sports; Labor and Employment; Social Welfare and Development |
| |
Economic services | | Agriculture; Agrarian Reform; Energy; Environment and Natural Resources; Tourism; Trade and Industry; Public Works and Highways; Transportation and Communications; Science and Technology |
| |
Defense | | National Defense |
| |
General public services | | Foreign Affairs; Finance; Budget and Management; Interior and Local Government; Justice; National Economic and Development Authority; Office of the Press Secretary; Autonomous Region of Muslim Mindanao; Cordillera Administrative Region |
| |
Constitutional offices | | General Public Services (Elections, Audit, Civil Service, Public Order and Safety, Office of the Ombudsman); Social Services (Human Rights) |
On December 9, 2010, President Aquino issued Executive Order No. 18, abolishing and discontinuing the operations of 10 agencies under the Office of the President because of duplication of functions. These agencies
11
include the Mindanao Development Council, Office of the North Luzon Quadrangle Area, Office of External Affairs, Minerals Development Council, the Presidential Anti-Smuggling Group, Presidential Anti-Graft Commission, Luzon Urban Beltway Super Region, Bicol River Basin Watershed Management Project, Office of the Presidential Adviser on Global Warming and Climate Change and the Office of the Presidential Adviser on New Government Centers. The abolition of these agencies took effect on December 30, 2010.
Government Corporations
The Government owns or controls a number of corporations that provide essential goods and services to the public and work with the private sector to encourage economic growth and development. Originally restricted to basic public services and national monopolies, the number of Government corporations grew from 13 in the 1930s to 301 by 1984.
Presently there are approximately 90 Government-owned and/or Government-controlled corporations, including subsidiaries. The Government closely monitors 14 major non-financial Government corporations engaged in various major business activities by recording their individual contributions to the public sector deficit or surplus position and other financial indicators. These 14 corporations, referred to as the 14 major GOCCs, and their areas of activity are as follows:
| | |
| Government Corporation | | Business Activity |
| |
National Power Corporation (“NPC”)(1) | | off-grid and island grid power generation and transmission |
| |
National Transmission Corporation (“Transco”)(1) | | ownership of power transmission infrastructure |
| |
Power Sector Assets and Liabilities Management Corporation (“PSALM”)(1) | | power generation and privatization of legacy NPC assets |
| |
National Electrification Administration | | lending to electric cooperatives |
| |
Metropolitan Waterworks and Sewerage System | | water utilities (Metro Manila and neighboring provinces); regulation of private concessionaires |
| |
Local Water Utilities Administration | | lending to water utilities |
| |
Philippine Economic Zone Authority | | area development |
| |
National Food Authority | | agriculture |
| |
National Irrigation Administration | | agriculture |
| |
Philippine National Railways | | transportation |
| |
Light Rail Transit Authority | | transportation |
| |
Philippine Ports Authority | | transportation |
| |
National Development Company | | financing/investment |
| |
Philippine National Oil Company(2) | | energy exploration and development |
| |
National Housing Authority | | housing |
| |
Home Guaranty Corporation | | housing insurance |
Notes:
| (1) | In accordance with the Electric Power Industry Reform Act of 2001 (the “EPIRA”), the Government reorganized the power sector among NPC, and two new entities, PSALM and Transco. PSALM is in the process of privatizing the remaining NPC power generation assets. Transco, which is wholly owned by PSALM, is responsible for privatizing the electrical transmission system. For certain financial monitoring purposes, these three corporations are together treated as a single entity. See “Republic of the Philippines—Philippine Economy—Restructuring of the Electric Power Industry” for a more detailed discussion of the EPIRA and the privatization of NPC’s assets. |
| (2) | The Philippine National Oil Company includes its five subsidiaries: the PNOC Alternative Fules Corporation; the PNOC Energy Development Corporation; the PNOC Exploration Corporation; the PNOC Development and Management Corporation; and the PNOC Shipping and Transport Corporation. |
12
GOCCs currently account for a significant proportion of the public sector’s domestic and external debt. Based on audited financial statements, as of December 31, 2012, the 14 major GOCCs listed above had aggregate domestic and external liabilities of approximately (Peso)1.43 trillion, which represents the majority of the liabilities owed by Government corporations.
The Government has in recent years implemented a general policy to improve the corporate governance and financial performance of GOCCs by encouraging adequate contribution by these GOCCs to the Government’s fiscal consolidation efforts, integrity, efficient and effective delivery of public services, sustainability, transparency and accountability. Further to its privatization strategies, the Government has also sought decreased intervention in the business affairs of other GOCCs in view of its policy objective for GOCCs to be self-sustaining; however, in certain instances, the Government supports the transactions of such corporations by acting as guarantor for obligations and providing such other assistance as it deems necessary and as may be allowable under law.
On June 6, 2011, President Aquino signed into law Republic Act No. 10149, known as the GOCC Governance Act of 2011 (the “GOCC Act”), which provides, among other things, for the standardization and rationalization of salaries and benefits of officials and employees of GOCCs. One of the main provisions of the GOCC Act created a Governance Commission for GOCCs (the “GOCC Commission”), with five members appointed from relevant Government agencies and the private sector. One of the GOCC Commission’s primary functions is to review and determine which GOCCs should be reorganized, merged, streamlined, abolished or privatized. This review is currently ongoing. In addition to the creation of the GOCC Commission, the GOCC Act also applies stricter standards for the retention of directors, officials and employees of GOCCs, requiring all directors of GOCCs to serve under one-year renewable terms with “fit and proper” performance-based reviews conducted prior to each renewal. The GOCC Act prohibits GOCCs from performing regulatory functions.
The Government also currently closely monitors the contribution to the public sector deficit or surplus, and other financial indicators, of three Governmental financial institutions that provide credit to enterprises in support of public policies. These include two specialized Government banks—the Development Bank of the Philippines and the Land Bank of the Philippines. For a description of the Development Bank and the Land Bank, see “—The Philippine Financial System—Structure of the Financial System.” The third Government financial institution, the Trade and Investment Development Corporation of the Philippines (formerly Philippine Export and Foreign Loan Guarantee Corporation), guarantees foreign currency loans to exporters and contractors. Based on unaudited financial statements, as of December 31, 2012, the three monitored Governmental financial institutions had aggregate domestic and external liabilities of (Peso)928.6 billion.
Aquino Administration Policy
In his first State of the Nation Address on July 26, 2010, President Aquino announced his agenda for his six-year term in office. The President’s agenda includes the following goals:
| | • | | eliminating corruption in the Government by improving accountability and actively undertaking the prosecution of abuses and wrongdoings; |
| | • | | eliminating the wasteful use of Government funds by the enactment of a zero-based approach to the budget, where appropriation amounts for Government agencies are not merely re-enacted with additions from year-to-year; |
| | • | | creation of jobs through fostering growth in industries; |
| | • | | encouraging public-private partnerships for infrastructure and other projects; |
| | • | | expanding the Philippine basic education cycle from seven to 12 years; |
| | • | | improving the delivery of basic health services to the poorest Filipinos; |
| | • | | completing the peace negotiation process with rebel groups in the Philippines; and |
| | • | | promoting reconciliation among opposing political movements. |
13
Recent State of the Nation Addresses
On July 25, 2011, President Aquino delivered his second State of the Nation Address. President Aquino highlighted the current administration’s efforts against corruption and abuses of power by Government officials, noting that the number of wasteful Government projects had been reduced. The Republic also recorded a reduction in rice imports as a result of an increase in domestic rice production and the elimination of unnecessary stockpiling. Government programs also alleviated hunger and poverty among Filipino families in 2011; however, approximately 1.6 million impoverished families continue to receive Government assistance.
President Aquino also noted that, over the prior year, the Republic’s credit rating had been upgraded by Moody’s, Standard & Poor’s, Fitch and the Japan Credit Rating Agency. These upgrades enabled the Government to reduce its borrowing costs in 2011. President Aquino also noted that the Philippine Stock Exchange composite index had recorded seven record highs in the previous 12 months. In addition, increased investor confidence in the energy sector was reflected in the participation of 140 companies in the bidding process for oil and gas sites as part of the 2011 Philippine Energy Contracting Round, compared to only 35 companies participating in 2006.
On July 23, 2012, President Aquino delivered his third State of the Nation Address, during which President Aquino emphasized reforms that have cut wasteful spending on corrupt projects and held offenders accountable for their actions. He also noted the Republic’s eight recent upgrades in credit ratings and the 44 record highs of the Philippine Stock Exchange index. President Aquino highlighted improvements in poverty, healthcare and education and also noted the steadily declining unemployment rate. He noted that the decline had been driven by the creation of jobs in the BPO sector, which contributed $11 billion to the Philippine economy in 2011. Airport and road infrastructure improvement and tourism industry growth also contributed to the decline in unemployment. He emphasized that agricultural growth and development were priorities for the Republic. After reducing the shortage of rice from 1.3 million metric tons in 2010 to an anticipated 500,000 metric tons in 2012 year, the Republic aimed to become a net exporter of rice in 2013.
President Aquino also noted the falling crime rate in his third State of the Nation Address. In 2011, there were 246,958 crimes recorded compared to over 500,000 crimes recorded in 2009. President Aquino informed the public that the Government was in the process of procuring 74,600 firearms for the police force. Previously, 45% of the police force did not have firearms. The Government had also begun modernizing the national defense force with new equipment and implementing a housing program for military personnel. Further, the President highlighted progress in peace talks with the MILF.
On July 22, 2013, President Aquino delivered his fourth State of the Nation Address, during which the President discussed the nation’s progress in a number of areas, including agriculture, health, education, disaster preparedness, anti-corruption efforts and the ongoing peace process in Bangsamoro. In particular, the President pointed to the establishment of the Transition Commission to craft the Bangsamoro Basic Law and called on Congress to pass the Bangsamoro Basic Law before the end of 2014. The President also highlighted the success of the recent peaceful elections, particularly in the ARMM, marking the first time ARMM elections have been held simultaneously with national elections.
President Aquino focused on his continued aim to increase Government efficiency and ensure the prudent management of GOCCs. The President also highlighted certain of the nation’s economic achievements, including two consecutive 10 place jumps in the World Economic Forum’s global competitive index (from 87th place in 2009 to 59th place in 2013) and achieving investment-grade status from Standard & Poor’s and Fitch. He also noted that the Government believes the Republic is still capable of realizing its goal of rice self-sufficiency, having reached 94% rice self-sufficiency by the end of 2012. In October 2013, Moody’s also upgraded the Philippines to investment-grade status.
Philippine Development Plan
On May 28, 2011, the National Economic Development Authority (“NEDA”) unveiled the Government’s Philippine Development Plan for 2011 to 2016. The plan provides targets and strategies to build sustainable and
14
inclusive growth, focusing on five key result areas: good governance and anti-corruption; human development and poverty reduction; economic development; security, justice and peace; and climate change adaptation and mitigation. To achieve these results, the plan emphasizes investments in infrastructure, transparency in government and responsive governance, improved social services and social protection, enhanced competitiveness to generate employment and improved access to financing.
The Government has made progress towards realizing many of the plan’s policy objectives. In terms of increasing investment in infrastructure, in the first half of the Aquino administration (from June 30, 2010 to June 30, 2013), NEDA’s Investment Coordination Committee has approved 13 infrastructure projects totaling (Peso)222.8 billion to be developed through public-private partnerships and two infrastructure projects totaling (Peso)66.3 billion to be developed through so-called “hybrid” public-private partnerships in which a portion of the funding is provided through concessional loans from the Government. Further, the administration of President Aquino has agreed on a number of amendments to the implementing rules and regulations of the Build-Operate-and-Transfer Law to make the policy environment more conducive to potential private investors. To promote transparency, Congress passed the GOCC Act to require fiscal discipline of GOCCs.
The Government has also improved social services by undertaking initiatives to increase enrollment and completion rates in primary education, increasing the enrollment rate in the universal healthcare program from 82% in 2011 to 84% in 2012, increasing socialized housing provisions and undertaking programs aimed at eradicating poverty in the Philippines.
To increase the competitiveness of the Philippines in the agricultural sector, the Government has provided farming assistance through the provision of irrigation facilities, extension services, service centers and product marketing programs and has implemented a food staples sufficiency program that aims to attain sufficiency in major food staples by 2013. In the industry and services sector, the Government has established an enhanced business name registration system, a business permit and licensing system, a Philippine business registry facility and enhanced automated cargo transfer systems.
Finally, President Aquino’s administration has implemented several measures to improve access to financing in the Philippines, including multiple initiatives aimed at expanding the loans available to growing micro-enterprises and small businesses. Presently, NEDA is coordinating an update of the Philippine Development Plan to reflect the revised objectives for the remaining three years of President Aquino’s administration.
Internal Conflict with Rebel Groups
For over 40 years, various rebel groups in the Republic have periodically fought against Government forces. The purported objective of many of these rebel groups is to effect the separation of the traditionally Muslim portions of Mindanao from the Republic. However, other groups such as the Communist Party of the Philippines (the “CPP”) are ostensibly focused on ideological objectives rather than territorial ambitions.
The original Muslim separatist group, the Moro National Liberation Front (the “MNLF”), has existed since at least the early 1970s and has splintered twice, leading to the formation of the MILF in 1976 and the Abu Sayyaf in 1991. Despite this fragmentation, the original MNLF persists to this day.
In 2003, the AFP launched sustained military offensives against the MILF and the Abu Sayyaf guerrilla group, which the Government held responsible for a series of bombings and raids in the southern region of Mindanao and elsewhere. Leaders of the MILF, which is today the largest Muslim separatist group in the Philippines, condemned the attacks and denied that they target civilians. The United States and the United Kingdom have issued advisories against travel to Mindanao, where rebel groups are most active.
The Moro National Liberation Front
In 1996, the Government signed a Final Peace Agreement with the MNLF outlining a framework for the creation of the ARMM. On April 20, 2010, a Memorandum of Understanding to continue working on the
15
implementation of the 1996 Final Peace Agreement between the Government and the MNLF was signed in Tripoli, Libya, under which all the parties concerned agreed to undertake a process to monitor the implementation of the 1996 Peace Agreement and the security, governance and economic activities, including the delivery of social services, in the conflict-affected areas.
On June 2 and 3, 2010, exploratory talks between the Government and the MNLF concluded with the signing of the Declaration of Continuity for Peace Negotiation. The joint declaration contained major points on the continuing engagement by the Government and MNLF panels on the peace process with the goal of reaching a comprehensive compact. Meetings were held on February 22 and 23, 2011 in Saudi Arabia to explore ways of resolving the remaining issues blocking the full establishment of the ARMM. At meetings in Solo City, Indonesia in June 2012, the MNLF agreed to take part in the ARMM governance reforms of the Government.
In August 2012, the MNLF Chairman Nur Misuari unilaterally declared an Independent Bangsamoro Republik and appointed himself president, which contributed to rising tensions. Since the Solo City meetings until earlier this year, there has been sporadic violence in the ARMM involving the MNLF, which has been largely limited to clan wars. Despite these developments, the Government has continued to carry out its development programs in the region.
In August 2013, a series of bombings occurred in the cities of Cagayan de Oro and Cotabato City, as well as other areas in Maguindanao and North Cotabato provinces in Mindanao. While a faction of the MNLF claimed responsibility for certain of the bombings, authorities have not yet confirmed the identity of the perpetrators, nor have they determined the relationship, if any, between the bombing incidents.
On September 9, 2013, Chairman Misuari and his Commander Khabir Malik led a faction of the MNLF in attacks against Zamboanga City in Mindanao. Over the course of the incident, hundreds of civilians were taken hostage by MNLF forces. Government forces brought an end to the attack, and 195 hostages were rescued, 394 individuals displaced, at least 245 persons killed (including 13 civilians, 24 Government forces and 208 MNLF operatives), 426 persons wounded (including 72 civilians, 192 Government forces and 162 MNLF operatives), 236 firearms recovered, 24 Chairman Misuari loyalists surrendered and 269 other MNLF operatives captured or apprehended. The Government declared the crisis over on September 28, 2013, and following recommendations from local police and military officials, the Zamboanga City Crisis Management Committee approved the lifting of curfew hours on December 2, 2013.
The Government, through the Office of the Presidential Adviser on the Peace Process, remains committed to fulfilling its obligations under the 1996 Final Peace Agreement signed with the MNLF and has no intention of abrogating or abandoning it. The Government is currently working to complete a tripartite review of the implementation of the 1996 Final Peace Agreement to ensure that development of MNLF communities can move forward.
The Moro Islamic Liberation Front
Peace negotiations between the Government and the MILF continue. The Government and the MILF held the 12th round of exploratory talks, focusing on ancestral domain issues in Mindanao, on May 2 to 4, 2006 in Malaysia. The issue of the territorial definition of a proposed autonomous Bangsamoro (which is the historical name for the traditionally Muslim portions of Mindanao) remains a source of disagreement. In response to armed clashes between the Government and the MILF in late June and early July of 2006, representatives from the AFP, the Philippine National Police (the “PNP”) and the MILF entered into an agreement on July 11, 2006 establishing four demilitarized buffer zones in the Maguindanao province of southern Mindanao, to be jointly guarded by representatives from both the MILF and the Government.
Despite the ongoing peace talks between the Government and the MILF, there have been sporadic clashes in the southern part of the Philippines between Muslim fighters and Government armed forces. For example, on July 12, 2007, Islamic militants in Basilan, a province in Mindanao, killed 14 AFP marines, beheading ten of them.
16
On January 10, 2008, the Government announced its willingness to consider a constitutional amendment to adopt a federal system of government to address some of the MILF’s demands for greater autonomy for a Bangsamoro homeland. On July 16, 2008, the Government and the MILF drafted a Memorandum of Agreement on Ancestral Domains (“MOA-AD”), whereby a national plebiscite would be held six months after signing the MOA-AD to determine whether the Muslim regions in Mindanao would separate to form an autonomous state. Petitions were filed by various lawmakers in the Supreme Court to invalidate the MOA-AD on grounds of unconstitutionality, and on October 14, 2008, the Supreme Court rendered the MOA-AD null and void on the basis that it purports to be an amendment to the Constitution effected by persons who do not have the power to make constitutional amendments and usurps legislative powers that are vested in Congress.
In January 2009, then President Arroyo constituted a new Government panel to resume formal talks with the MILF, and also initiated informal discussions on the peace process with political leaders in Mindanao. On July 23, 2009, to expedite the resumption of formal discussions, the Government declared a suspension of all offensive military operations against the MILF, and on July 25, 2009, the MILF declared a similar suspension of military operations.
In September 2009, an International Contact Group, composed of representatives from the United Kingdom, Japan and Turkey, along with representatives of several non-governmental organizations, was formed to aid in brokering the resumption of talks between the MILF and the Government. On December 8 and 9, 2009, formal peace talks between the parties resumed in Kuala Lumpur, Malaysia, with members of the International Contact Group in attendance.
Upon his taking office in June 2010, President Aquino expressed his administration’s commitment to achieving a peaceful and just settlement of the ongoing conflicts in Mindanao. In July 2010, the administration of President Aquino constituted and appointed the Government Peace Negotiating Panel to continue the peace negotiations with the MILF. In addition, the administration has continued to utilize diplomatic channels to pursue negotiations through mediators such as the Government of Malaysia. Sporadic violence in the Mindanao region continues.
On January 1, 2011, a new AFP security plan called “Bayanihan” (meaning “spirit of unity”) took effect. Bayanihan replaced “Oplan Bantay Laya” (meaning “operation freedom watch”) launched in 2002. The new campaign focuses on non-combat operations targeted to eliminate poverty and other causes of rebellion, while pursuing peace talks with communist groups and the MILF. The plan is scheduled to remain in effect until 2016.
On January 14, 2011, the Government announced that formal peace talks with the MILF would resume for the first time since negotiations stalled in 2009. During those talks, held in February 2011 in Kuala Lumpur, the MILF submitted a “comprehensive compact” of proposals to the Government in an effort to conclude its demand for self-determination in Mindanao. Both sides agreed to retain an international peace monitoring team to uphold a ceasefire as negotiations continue. The Government and the MILF met again on August 22 and 23, 2011, during which meeting the Government submitted its counterproposal to the comprehensive compact submitted by the MILF. The MILF rejected this plan and stated that it would refuse to hold further direct talks with the Government until it agreed to discuss the MILF’s demand for an autonomous Muslim sub-state in the southern Philippines. On October 19, 2011, 19 AFP troops were killed in a firefight with MILF rebels in the southern province of Basilan. Despite this clash, the Government and the MILF resumed peace talks in early December 2011.
In April 2012, the Government and the MILF agreed to a set of principles to guide the substantive agenda of future negotiations and to work for the creation of a new autonomous political entity that will share power with the Government. On July 19, 2012, the Government concluded the 29th formal exploratory peace talks with the MILF. Over the course of the three days of talks, the two sides discussed the realization of a new autonomous political entity to replace the ARMM. Both sides agreed to hold further discussions in August 2012. In exploratory talks held from August 7 to 11, 2012, the Government and the MILF both organized their respective
17
technical working groups on power sharing and wealth sharing. The technical working groups reached consensus on certain issues relating to power sharing, revenue generation and wealth generation. Both parties noted progress in the discussion of a framework agreement and agreed to hold further discussions.
On October 7, 2012, the Government and the MILF concluded the 32nd formal exploratory peace talks with the release of a draft framework peace agreement (the “Framework Agreement”), which provides a framework for replacing the ARMM with Bangsamoro, a new autonomous political entity. The Framework Agreement defines the powers and structures of the new Bangsamoro entity and describes the principles, processes and mechanisms that will shape relations between the Government and Bangsamoro. The Framework Agreement provides that the new entity will, subject to certain limitations, have the power to levy taxes, borrow funds from foreign and domestic lenders and share in the revenues generated through the development of natural resources within its jurisdiction. The Framework Agreement reserves the powers of defense and security, foreign policy, monetary policy and coinage, citizenship, and naturalization to the Government. The Government and the MILF signed the Framework Agreement on October 15, 2012.
On December 17, 2012, President Aquino signed an executive order providing for the creation of the Transition Commission tasked with drafting the Bangsamoro Basic Law. In February 2013, during the course of the 35th round of exploratory peace talks between the Government and the MILF, the parties signed the “Annex on Transitional Arrangements and Modalities,” a document that outlines plans to create Bangsamoro.
Over the course of 2013, peace negotiations with the MILF have led to extending the tours of duty of the Malaysian-led International Monitoring Team until March 2014 and the Ad Hoc Joint Action Group until February 2014. The AFP believes it has successfully limited the capability of rogue MILF elements to perpetrate violence against civilians and communities, and most of the violence has been limited to clan wars in connection with land disputes. Most recently, the Government and the MILF held the 41st round of exploratory peace talks on October 31, 2013, in Kuala Lumpur, Malaysia, wherein substantial progress was made on the remaining aspects of the power-sharing arrangements in connection with the creation of Bangsamoro.
As a result of the Government’s ongoing engagement in the peace process with the MILF and the strict observance by both sides of the ceasefire agreement, 2013 has seen almost no armed encounters between Government and MILF forces.
Abu Sayyaf
In 2002, the United States and the European Union placed the Abu Sayyaf on their lists of “foreign terrorist organizations.” Moreover, the United States has in the past sent troops and military advisors to assist the AFP in its conflict with the Abu Sayyaf. In July 2002, the United States and the Republic entered into a sustained military cooperation agreement that provides for annual training exercises involving both Philippine and U.S. soldiers. In July 2005, U.S. and Philippine military forces launched a joint operation in Mindanao to capture the leader of the Abu Sayyaf. On December 6, 2007, 14 members of the Abu Sayyaf were convicted by a local court of the abductions of an American missionary couple and 18 others in a 2001 kidnapping during which an American missionary was killed.
In recent years, the Abu Sayyaf has appeared to abandon its ideological roots to become a purely criminal group engaged in kidnapping for ransom, extortion and other activities for financial gain. On September 29, 2009, two American soldiers and one Filipino soldier were killed in an explosion in the southern Philippine province of Sulu on Jolo Island in Mindanao, an area where the Abu Sayyaf has been active in the past. On January 12, 2011, four traveling merchants and a guide were killed when suspected Abu Sayyaf militants ambushed them in Basilan in Mindanao. The administration of President Aquino has reiterated the Government’s policy of not negotiating with terrorist organizations, including the Abu Sayyaf, and sustained AFP operations continue to weaken the organization. Over the course of 2011, joint AFP and PNP security efforts resulted in the neutralization of 106 Abu Sayyaf members, including 54 who were killed in combat, four who were caught in
18
combat and 48 who were apprehended at check points or otherwise served with arrest warrants. The Government supplements its military operations with social initiatives that aim to eradicate the Abu Sayyaf’s support network in areas where the group has traditionally found safe haven. These joint civil-military efforts have included programs such as the Army Literacy Patrol System and the Community Assistance and Rural Empowerment through Social Services and Army Concern on Community Organizing for Development initiatives.
Despite these successes, sporadic fighting between the AFP and the Abu Sayyaf has continued. For example, on January 18, 2012, one soldier was killed when Government forces clashed with Abu Sayyaf militants in Basilan. On July 12, 2012, six rubber tappers were killed and 27 others were wounded when they were ambushed by armed Abu Sayyaf militants in Tumahubong, Basilan. Further AFP operations against the Abu Sayyaf over the remainder of 2012 resulted in the neutralization of an additional 55 Abu Sayyaf militants. During the first half of 2013, the AFP neutralized a further 18 Abu Sayyaf militants, including on May 26, 2013, when several Philippine marines and Abu Sayyaf militants were killed during the course of an AFP-initiated rescue mission intended to save six captives kidnapped in 2012 and 2013.
In early September 2013, the AFP engaged militants from Abu Sayyaf and a faction of the MNLF known as the Bangsamoro Islamic Freedom Fighters in the village of Lamitan on Basilan. The conflict, which was not related to the contemporaneous attack on Zamboanga City by Chairman Misuari loyalists, involved about 150 militants and resulted in the death of three of the rebels. The Government has taken various actions to constrict Abu Sayyaf to a few isolated areas in Basilan and Sulu and to deny Abu Sayyaf sanctuary, freedom of passage or access to international support.
Communists and Affiliated Groups
The Philippines has experienced over 40 years of communist insurgency. In 2002, the United States and the European Union placed the CPP and the CPP’s armed affiliate, the New People’s Army (the “NPA”), on their lists of “foreign terrorist organizations.” As a result, the United States and European governments have frozen financial accounts linked to these groups and restricted travel of CPP and NPA members in the United States and the European Union. The Government and the National Democratic Front (the “NDF”), a political organization closely aligned with the CPP and the NPA, held three rounds of peace talks in Oslo, Norway, from February 2004 to August 2004. However, sporadic fighting between the NPA and the AFP continues.
Although formal peace talks with communist-affiliated groups have been suspended since August 2004, the peace process has nevertheless proceeded through “informal engagements” designed to allow both parties to speak informally and with no pre-agreed agenda. As a result of the informal talks that occurred from May 13 to 15, 2008 and November 28 to 30, 2008, the Government, the NDF and the NPA agreed to work towards the resumption of formal talks. The Government lifted the suspension of the Joint Agreement on Safety and Immunity Guarantees on July 17, 2009 to allow members of the NPA to prepare for meetings scheduled in August 2009 in Norway; however, these meetings were cancelled due to disagreements between the parties over additional NDF conditions to the resumption of talks.
On December 14, 2010, 10 soldiers from the AFP were killed in a raid by suspected members of the NPA in Northern Samar province. The AFP has also stated that NPA members fired at AFP troops on December 23, 2010 in violation of a ceasefire agreement that was to be effective between the Government and the NPA from December 16, 2010 to January 3, 2011. An NPA spokesperson refuted the AFP’s claim and accused AFP troops of launching their own attacks in violation of the ceasefire.
Despite these and other sporadic incidents involving the NPA, President Aquino’s administration resumed informal peace talks with the NPA and the CPP from February 15 to 21, 2011 in Oslo, Norway. Having resumed negotiations after more than six years of hostilities, the two sides announced that they had made progress in the meetings and had agreed to continue discussions and negotiations with the goal of achieving a formal peace
19
agreement by 2012. Negotiations again stalled in June 2011 due to the NDF’s unilateral refusal to engage in further talks until 13 of its agents are released from Government custody. Meanwhile, intermittent clashes have continued, including an explosion from a landmine allegedly laid by the NPA that killed three AFP soldiers in late October 2011 and a firefight on December 16, 2011 in which five AFP soldiers were killed.
On December 19, 2011, the CPP declared a ceasefire from December 31, 2011 to January 2, 2012, during which it pledged to refrain from further attacks on AFP soldiers. The Government had earlier declared a ceasefire from December 16, 2011 to January 2, 2012. In December 2012, the parties agreed to implement a ceasefire from December 20, 2012 to January 15, 2013.
On April 24, 2013, NPA guerrillas attacked an army convoy in Ifugao Province and killed at least 11 soldiers and one civilian. The Government has indicated that the NPA must cease hostilities before it will proceed with further negotiations.
Under the administration of President Aquino, the Government remains open to the possibility of resuming the formal negotiations with the NDF, the NPA and the CPP at the appropriate time. The Government Negotiating Panel for Peace Talks has been reconstituted; however, the Government has indicated that the release from custody of the 13 NDF agents, as requested by the NDF, is unacceptable as a condition to resuming talks.
The Government, through the Office of the Presidential Adviser on the Peace Process in coordination with concerned Government agencies, is simultaneously pursuing alternative modes of addressing the problems posed by rebel groups. These include: implementing peace and development projects in conflict-affected communities to address the root causes of the insurgency; addressing human rights violations in relation to the conflict; implementing a formal agenda with respect to indigenous peoples; addressing the situation of internally displaced persons; enhancing the re-integration program for rebels returning to society; and laying an administrative framework for good governance in the ARMM. The Government has recently constructed farm-to-market roads, school buildings and electrical and water facilities in an effort to improve conditions in many of the conflict-affected communities. The Government also launched the “AFP Guns for Peace Program” in April 2013, which allows former rebels to trade in their firearms for immediate cash assistance from local government units (“LGUs”) and the opportunity to participate in certain Government programs, such as the Technical Education and Skills Development Authority’s skills and livelihood programs.
Recently, CPP leader Joma Sison proposed a new approach to fast-track peace negotiations between the Government and the NDF, including an immediate ceasefire and the creation of a Committee for National Unity, Peace and Development; however, the NDF has since backtracked from their original position and issued more preconditions, including the abolition of the aforementioned peace and development programs, which are not acceptable to the Government.
International Relations
The Philippines places a high priority on expanding global trade through a multilateral framework of principles and rules that respect individual countries’ policy objectives and levels of economic development. The Republic’s participation in various international organizations, such as the World Trade Organization, the International Monetary Fund (the “IMF”), the World Bank and the ADB, allows it to encourage liberalized trade and investment and to discuss global issues that affect the Republic’s economy.
20
The following table shows the Republic’s capital participation in, and loans obtained from, major international financial organizations.
| | | | | | | | | | | | | | | | | | | | |
Membership in International Financial Organizations | |
Name of Organization | | Date of Admission | | | Subscribed | | | Capital
Share | | | Capital
Paid In | | | Loans
Outstanding | |
| | | (in millions, except for percentages) | |
International Monetary Fund(1) | | | December 27, 1945 | | | | SDR1,019.3 | | | | 0.43 | % | | | — | | | | — | |
International Bank for Reconstruction and Development(2) | | | December 27, 1945 | | | | $750.4 | | | | 0.43 | % | | | $45.0 | | | | $3,310.2 | |
Asian Development Bank(3) | | | December 22, 1966 | | | | $3,890.0 | | | | 2.38 | % | | | $194.4 | | |
| JPY35,867,3
SDR426,357.4
$3,503.6 |
|
| Sources: | The IMF, the World Bank, the ADB and the Bureau of the Treasury. |
Notes:
| (1) | As of December 31, 2012. |
| (2) | As of January 30, 2013. |
| (3) | As of September 30, 2013. |
The Philippines also promotes its economic interests through membership in the following regional organizations:
| | • | | The Association of Southeast Asian Nations (“ASEAN”); |
| | • | | South East Asia, New Zealand and Australia Central Banks; |
| | • | | South East Asian Central Banks; |
| | • | | Asia-Pacific Economic Cooperation (“APEC”); and |
| | • | | Executives Meeting of East Asia and Pacific Central Banks. |
Relationship with the IMF
The IMF historically maintained relations with the Republic within the context of a regular IMF program monitoring arrangement and a subsequent post-program monitoring arrangement. Under its regular program monitoring arrangement, the IMF was allowed to influence the Republic’s fiscal policies through stabilization and structural adjustment programs. In contrast, the post-program monitoring arrangement involves program assessments based on a regular review of economic developments and policies rather than the attainment of specific quantitative targets and does not include a financing component.
In June 2008, after a mission to the Republic, the IMF highlighted the twin challenges of a slowing global economy and escalating food and fuel prices that the Philippines faced along with its peer countries in Southeast Asia. The IMF noted that past fiscal and other reforms helped to mitigate the impact of these challenges on the economy, but stated that prudent macroeconomic policy management would be needed due to slower growth and the threat of high inflation, including measures to limit the deficit and increase tax revenue collections.
In February 2009, the IMF released its staff report on its Executive Board’s Article IV consultation with the Republic. Article IV consultations are annual bilateral discussions that the IMF holds with IMF member countries on economic developments and policies following a staff visit to collect economic and financial data. The discussions focused on the effects of the worsening economic environment and policies designed to manage associated near-term risks. The report noted that the Republic’s banks approached the crisis in a relatively strong position, but still faced significant challenges.
21
In November 2009, after a mission to the Republic, the IMF upgraded its growth forecast for the Republic’s GDP growth to 1.5% from a previous forecast of 1.0%. However, the IMF also expressed concern over the Republic’s inability to control spending and increase tax revenues, noting that the Republic’s budget deficit in 2009 was likely to breach projected levels.
In January 2010, the Executive Board of the IMF concluded its Article IV consultation with the Republic. In its report with respect to consultation, the IMF commended the Government for its sound economic policies in the face of the recent financial downturn, in particular citing the Government’s fiscal stimulus program in 2009 to address the economic crisis. The IMF expressed confidence that the Republic would continue on the path of economic recovery, mainly due to increasing private demand and expansion in OFW remittances. The IMF encouraged the Republic to further strengthen governance, the business environment and basic infrastructure to ensure continued economic growth.
In August 2010, the Republic commenced participation in the IMF’s Financial Transactions Plan, a currency exchange arrangement between the IMF and its members for the purpose of financing members’ borrowing needs. As of August 2011, six countries had drawn from funds IMF members, including the Republic, had contributed to the Plan. Approximately 54% of these funds were disbursed to European countries in an effort to address the financial crisis impacting the European economic zone.
In February 2011, the Executive Board of the IMF concluded its Article IV consultation with the Republic. In its report with respect to the consultation, the IMF found the Philippines’ overall economic environment to be positive, with economic growth in 2010 having been facilitated by supportive macroeconomic policies as well as strong private demand. The IMF found the near-term economic outlook to be generally positive, with growth expected to moderate slightly from the growth seen in 2010.
In July 2011, the IMF conducted a staff visit to the Republic in which IMF representatives met with local authorities and key local market players to discuss economic developments and identify areas of key risk and policy reform. The IMF found that the Republic continued to manage its recovery from the global financial crisis well, and that the near-term outlook for the Republic remained favorable. In July 2011, the Republic also increased its IMF SDR quota from SDR879.9 million to SDR1,019.3 million.
In October 2011, the Republic commenced participation in the IMF’s New Arrangements to Borrow, which is a set of credit arrangements between the IMF and member countries to be used by the IMF as its principal means to supplement its monetary resources. On October 6, 2011, the Monetary Board of Bangko Sentral approved a proposed call of SDR41.2 million (approximately $64.1 million) under the arrangements for the period from October to December 2011. No drawdowns have yet been made on Bangko Sentral’s commitment.
In December 2011, IMF staff visited the Republic. The visit included a series of technical meetings with Philippine authorities on policy issues, a site visit to Davao City as a sample locality to observe economic developments, and a conference on December 13, 2011, at which IMF staff discussed issues such as the effects of the global economy on the Republic and monetary policy.
In December 2011, the IMF also released the findings of a working paper it had commissioned to analyze the Republic’s GDP performance during the period from 1965 to 2008. The study revealed that the Philippines’ global ranking in terms of real GDP growth had risen to a high of 12th during the period from 1995 to 1999, but had since fallen to a low of 22nd during the period from 2005 to 2008. The IMF concluded that this decline resulted from a number of factors, including the lack of a sustained period of strong economic reforms, and that, in order to increase its real GDP growth relative to its East Asian counterparts, the Republic would need to maintain macroeconomic stability, expand its fiscal space and redirect public spending to agriculture, infrastructure and research and development.
22
In February 2012, the Executive Board of the IMF concluded its Article IV consultation with the Republic. In its report with respect to the consultation, the IMF found the Republic’s overall near-term economic environment to be broadly favorable, partially as a result of prudent policies that have helped facilitate a strong recovery and business confidence.
In July 2012, IMF staff again visited the Republic. The mission conducted a series of meetings with Government officials and private sector representatives and focused on recent economic developments. At the conclusion of the visit, IMF officials noted that macroeconomic conditions in the Republic remained generally sound.
In March 2013, the Executive Board of the IMF concluded its Article IV consultation with the Republic. In its report with respect to the consultation, the IMF commended the Republic’s policies, noting that they have delivered strong macroeconomic outcomes and set the stage for favorable economic prospects for the near term, notwithstanding the risks associated with global uncertainties, volatile capital inflows and the possibility of stretched asset prices.
The IMF staff most recently visited the Republic in September 2013. The visit included a number of meetings with Government officials and focused on the economic developments in the country in 2013 as well as the outlook for 2014. The IMF noted that the Philippine economy continued to grow in the first half of 2013 at 7.6%, up from 6.8% in 2012, largely due to robust domestic consumption and investment, which offset more subdued external demand. The IMF reported that it expects the Republic’s 2013 GDP growth to remain strong at 6.8% before easing to 6.0% in 2014. The IMF noted that risks to growth include failure to direct liquidity into productive sectors or to leverage the opportunity to expand the availability of credit to boost demand for real estate, which could potentially produce a strong procyclical effect on the economy.
The IMF also recognized the Republic’s strong macroeconomic fundamentals, including strong current account receipts, net creditor status, steady reductions in public debt and low participation in the Government securities market, which could help the country weather financial stability concerns associated with capital flow reversals brought about by expectations of the United States Federal Reserve’s tapering of its quantitative easing measures. At the same time, the IMF noted Bangko Sentral’s proactive approach to oversight of the banking sector, particularly the expanding focus on the real estate exposure of domestic banks.
World Bank Aid Package
On October 22, 2010, following the conclusion of the annual World Bank—IMF meetings for 2010 in Washington, D.C., World Bank Country Director for the Philippines Bert Hofman, citing initiatives of the Aquino administration for poverty alleviation, announced that the World Bank would double its planned assistance package for 2011 from $650 million to approximately $1.3 billion to $1.5 billion. In support of the Government’s Conditional Cash Transfer Program, the World Bank approved the Pantawid Pamilyang Pilipino Program for health grants to poor households with children up to 14 years old and/or pregnant women, as well as for education grants to poor households with children aged six to 14. The increased assistance package supported the first phase of the roll-out of this program, which aimed to cover approximately 360,000 households from 2009 to 2013.
The World Bank has further increased its assistance package to the Republic for 2013 to $2.0 billion aimed at six active projects. These World Bank-supported projects include support for reading and math skills, local communities in targeted poor municipalities and urban areas, land administration and management systems, increasing rural incomes and enhancing farm and fishery productivity, development policy loans and supplemental financing for post-typhoon recovery in the aftermath of Typhoon “Yolanda.”
23
For 2014, the World Bank is expected to disburse six loans with an amount exceeding $971 million, of which two are program loans amounting to $700 million, including supplemental financing for Typhoon “Yolanda” recovery and the third Development Policy Loan to foster inclusive growth. Four project loans are expected to amount to $271 million, including support for the national community-driven development project, the local government finance and fiscal decentralization reform program, increasing competitiveness for inclusive growth and other emergency needs.
Asian Development Bank Aid Package
In September 2010, the ADB approved a $400 million loan to the Republic, with the proceeds to be used by the Government to provide assistance to the poor. In addition, the ADB made further plans to lend the Republic $1.86 billion from 2012 to 2014.
In 2011, the ADB approved two loans to the Republic, a $300 million loan for a judicial reform program and a $62 million loan for a project in road sector improvement and institutional development. The ADB also provided a $3 million grant to support emergency relief operations in Northern Mindanao in the wake of tropical storm “Sendong.”
In December 2012, the ADB approved an additional two loans to the Republic, a $101 million loan for a natural resources and environmental management project and a $300 million loan for the introduction of energy efficient electric vehicles.
For 2014, the ADB has approved five pipeline loans to the Republic totaling $1.8 billion, including loans for K-12 education reform, assistance for inclusive growth and poverty reduction, the Philippines Development Plan, emergency support for areas affected by Typhoon “Yolanda,” and the national community-driven development project.
Chiang Mai Initiative Multilateralization
On March 24, 2010, the Chiang Mai Initiative Multilateralization (the “CMIM”), a reserve pooling arrangement designed to address short-term liquidity difficulties in the Southeast Asian region and supplement other existing international financing arrangements, came into effect. Under the CMIM, member countries of the ASEAN, as well as the People’s Republic of China (the “PRC”), the Hong Kong Special Administrative Region (“Hong Kong”), Japan and the Republic of Korea (together with ASEAN, the “ASEAN Plus Three”), are able to draw on the CMIM’s reserve pool up to a specified percentage of their contribution, with smaller countries able to draw higher proportionate amounts. The CMIM was originally conceptualized alongside the Chiang Mai Initiative, a bilateral currency swap arrangement established in 2000 to assist the ASEAN Plus Three in mitigating the impact of the 1997 Asian financial crisis and averting similar crises in the future. The total initial amount of the CMIM was $120.0 billion, with the PRC, Japan, the Republic of Korea and Hong Kong contributing approximately $96.0 billion and other members of ASEAN collectively contributing approximately $24.0 billion.
The 15th ASEAN Plus Three meeting was held in Manila on May 3, 2012, wherein the finance ministers of each of the ASEAN Plus Three nations approved a revised CMIM Agreement which provides for: (1) doubling the size of the CMIM reserve pool from $120.0 billion to $240.0 billion; (2) increasing the de-linked portion of the IMF’s contribution; (3) increasing the maturity periods; (4) introducing a crisis prevention loan facility for members countries called the “CMIM Precautionary Line”; and (5) including the central bank governors of each of the ASEAN Plus Three nations in the Ministerial Level Decision Making Body of the CMIM. The Republic, through Bangko Sentral, has contributed $9.1 billion to the CMIM. Under the CMIM, the Republic is able to borrow up to 2.5 times its contribution to the CMIM, or $22.8 billion.
24
Territorial Dispute over the West Philippine Sea
In the first eight months of 2011, tensions rose in relation to long-standing territorial disputes involving the Republic, other Southeast Asian nations (including Vietnam, Malaysia and Brunei) and China over certain islands in the West Philippine Sea, also known as the South China Sea. The increased tensions were brought about by allegations of more aggressive measures being taken by certain nations to assert their claims in these disputes. In July 2011, representatives of the claimant nations, along with other members of ASEAN, met in Bali, Indonesia to discuss how to advance the negotiations with respect to the competing claims. At this meeting, these nations, including China, agreed on basic guidelines for drafting the Code of Conduct to implement the 2002 ASEAN-China Declaration on the Conduct of Parties in the South China Sea. The Republic maintains that its claim over the disputed territories is supported by recognized principles of international law consistent with the United Nations Convention on the Law of the Sea.
The Republic reiterated its position in November 2011 during the ASEAN and East Asia summits in Bali, Indonesia, where China, the United States and representatives from a number of Asian countries were in attendance. The Republic also proposed a new peace plan for the disputed waters, which it labeled the “Zone of Peace, Freedom, Friendship and Cooperation.” The plan aims to clearly define the territorial claims of different countries in the region and then to cooperate in respecting those parts of the region where certain countries have undisputed claims, leaving the disputed territories for later resolution. No agreement has been reached to implement this plan.
On April 8, 2012, during one of its regular maritime patrols, a Philippine Navy surveillance aircraft identified eight Chinese fishing vessels anchored inside and around Bajo de Masinloc (Scarborough Shoal), an area in the Municipality of Masinloc, Province of Zambales that the Republic regards as an integral part of its territory. The area is located 124 nautical miles west of Zambales and is within the Republic’s 200 nautical-mile Exclusive Economic Zone and the Philippine Continental Shelf. On April 10, 2012, the BRP Gregorio del Pilar dispatched an inspection team that reported that large amounts of illegally collected coral, clams and sharks were found in the compartments of the fishing vessels. The arrival of Chinese maritime surveillance vessels resulted in a standoff.
On January 22, 2013, the Republic submitted a “Notification and State of Claim against China” to an arbitral tribunal in The Hague pursuant to Article 287 and Annex VII of the 1982 United Nations Convention on the Law of the Sea in order to achieve a peaceful solution to the dispute over the West Philippine Sea. Despite China’s decision not to participate in the proceedings, a five-member arbitral tribunal has been constituted. On August 27, 2013, the arbitral tribunal released its “Rules of Procedure and Procedural Order No. 1,” setting a timetable for the submission of written arguments by each of China and the Republic. The Republic intends to submit its written arguments by March 30, 2014, in which it plans to address matters relating to jurisdiction, admissibility and the merits of the disputes. The Republic views the arbitral proceedings as consistent with the foreign policy of President Aquino for a rules-based approach in resolving the dispute with China on the basis of international law, specifically the United Nations Convention on the Law of the Sea. The Republic will continue to pursue the conclusion of the Code of Conduct to implement the 2002 ASEAN-China Declaration on the Conduct of Parties in the South China Sea as a complementary approach to the arbitral proceedings.
On May 10, 2013, the Republic formally lodged a protest with China concerning vessels that arrived on or around May 8, 2013 escorting a fleet of 30 fishing boats in another disputed area—the Second Thomas Shoal. The Second Thomas Shoal is near the Spratly Islands, a chain of resource-rich islands, islets and reefs which are claimed in part or in whole by each of China, Brunei, Malaysia, the Philippines, Taiwan and Vietnam.
From May to August 2013, China unilaterally imposed a three-month fishing ban on the northern area of the West Philippine Sea, including Bajo de Masinloc, by placing makeshift barriers. In the first half of 2013, China Marine Surveillance and Fisheries Law Enforcement Command vessels maintained their presence in the area.
25
Beginning in August 2013, China also started deploying Chinese Coast Guard vessels in the South China Sea, including areas in the West Philippine Sea, after the formation of China’s Unified Coast Guard Agency in July 2013. The Chinese Coast Guard vessels took over the task of the China Marine Surveillance and Fisheries Law Enforcement Command to maintain Chinese presence in the area.
Should the territorial dispute in the West Philippine Sea escalate or continue, the Republic’s interests in fishing, trade and offshore drilling may be adversely affected. The Kalayaan Island Group, in the West Philippine Sea, is rich in marine and energy resources and serves as an important source of food, livelihood and foreign exchange earnings. The discovery of oil and natural gas in commercial quantities in the region has also been important in supporting the Republic’s energy needs. Out of the 33 oil and natural gas service contracts awarded by the Republic nationwide, 15 of them are found in this area. A total of approximately 11.9 million hectares, or about 47% of the total area covered by service contracts in the Republic, are located in the Kalayaan Island Group. In addition, the Malampaya Natural Gas-to-Power Project and the Recto (Reed) Bank service contract are aimed at developing an estimated 3.4 trillion cubic feet of natural gas in the Kalayaan Island Group. Malampaya gas now provides approximately 40% of the electric power requirements of Luzon, where most of the country’s economic activities are located.
In addition, should tensions with China escalate due to the dispute in the West Philippine Sea or other reasons, the volume of trade between the Republic and China may be adversely affected. The Republic meets a significant amount of its steel requirements from Chinese imports, thus the supply of steel available to the Republic may be reduced, which, among other things, may affect infrastructure development in the Republic. Exports to China accounted for 14.2% of the Republic’s total exports in 2012 and 11.8% in the first eight months of 2013, and imports from China accounted for 10.8% of the Republic’s total imports in 2012 and 12.8% in the first nine months of 2013.
The Republic is committed to resolving disputes in the West Philippine Sea through peaceful means and diplomatic solutions, without threat or use of force, and in accordance with international law, specifically the United Nations Convention on the Law of the Sea.
Manila Hostage Crisis
On August 23, 2010, 25 persons, mostly tourists from Hong Kong, were held hostage aboard a tour bus in Rizal Park in Manila by a dismissed officer of the PNP. The situation ended with the deaths of eight Hong Kong citizens in addition to the hostage-taker. In response to the incident, the Hong Kong government issued a “black” travel alert for the Philippines advising Hong Kong citizens to “avoid all travel,” which is the highest travel warning under the Hong Kong government’s travel warning system. The travel alert remains in effect as of the date of this prospectus.
On November 6, 2013, Hong Kong lawmakers passed a non-binding motion calling for economic sanctions against the Philippines in response to the refusal of the Aquino administration to issue a formal apology regarding the incident, to compensate the survivors and the families of the deceased and to hold accountable the officials involved in trying to free the hostages.
Natural Disasters
Typhoons and Flooding
Regional typhoons and intense rainfall, in part due to climate change, make regions of the Republic susceptible to flash floods and landslides. In urban areas such as Metro Manila, clogging and siltation of drainage laterals and waterways caused by improper disposal of solid waste, obstructions and the presence of informal settlements along open waterways contribute to flooding. Low lying urban and rural areas, which serve as catch basins of rain water within a watershed or river basin, also suffer from problems posed by unplanned and unregulated developments such as temporary housing and infrastructure projects and the presence of industrial operations along upstream waterways. Recent flooding, including as a result of Typhoon “Yolanda,” has affected
26
hundreds of thousands of Filipinos and resulted in numerous fatalities. In addition, flooding in the Philippines has resulted in and may continue to result in significant damage to rice and other agricultural production, infrastructure and private property. Flooding and other natural disasters continue to pose a threat to other sectors such as transportation and health, and the economy as a whole. In addition to direct damage, natural disasters also inhibit social and economic development because funds must be reallocated from existing programs to finance relief and reconstruction assistance.
The transportation sector is heavily affected by floods and other natural disasters that damage roads and bridges. If a natural disaster destroys critical transportation infrastructure, roads and bridges must be repaired before other disaster-related damage can be addressed. As a result, damage to transportation infrastructure can compound the effect that floods have on other sectors. For instance, the impact of flooding and other natural disasters on the health sector is mostly seen in the disruption of the delivery of health services. Damaged roads and bridges hinder the efficient transport of patients to hospitals and medical facilities in cities and reduce the capacity of the Government to deliver timely medical services to affected populations in rural areas.
Flooding also adversely affects agricultural production by damaging crops, livestock, poultry and fisheries, as well as destroying fishing boats, farming equipment, inventory and agricultural infrastructure such as irrigation channels, spillways and farm-to-market roads. In urban areas, the manufacturing, construction, wholesale and retail, restaurant and real estate industries are also impacted by the damage caused by flooding.
On September 26, 2009, Typhoon “Ketsana” made landfall in the Republic, resulting in severe flooding that, at its worst, submerged approximately 80% of Metro Manila. The storm also affected or displaced approximately 1.8 million people. Shortly after, on October 3, 2009, Typhoon “Parma” also made landfall in the northern provinces of the Republic, aggravating the flooding and damage already brought about by Ketsana and causing severe landslides, which rendered roads impassable and increased the number of displaced residents. According to the Republic’s National Disaster Risk Reduction and Management Council (formerly the National Disaster Coordinating Council), these two typhoons resulted in approximately (Peso)38 billion in damages. Local and international relief resources were deployed to the affected areas, and the Government implemented additional measures in 2009 and 2010, such as a supplemental budget allocation and other additional financings and aid options, to mitigate the damage caused by these storms.
In October 2010, Typhoon “Megi” made landfall on the northern portion of Luzon, resulting in power failures, water shortages and more than 20 deaths, as well as losses in the agriculture sector of approximately (Peso)7.6 billion, according to the National Disaster Risk Reduction and Management Council. The majority of the damage was to the Republic’s rice crop, estimated at (Peso)5.4 billion.
On December 16, 2011, Typhoon “Washi” passed over the island of Mindanao in the southern Philippines, causing widespread loss of life and damage. More than 1,200 people were killed as a result of the storm and subsequent flash floods and landslides, with additional missing and injured. The Government estimated that more than 698,000 people were affected by the storm. The National Disaster Risk Reduction and Management Council estimated that damages to infrastructure, agriculture and private property reached approximately (Peso)2.1 billion. A Government assessment indicated that the recovery and reconstruction needs attributable to the flooding caused by Typhoon “Washi” would cost the Government more than (Peso)26 billion, in addition to the (Peso)13 billion that the Republic had already suffered from direct damage and losses to the economy.
In late July 2012, heavy rainfall from Typhoon “Saola,” combined with a southwest monsoon, inundated the Philippines, causing widespread damage in various regions of the country, including Metro Manila. According to Government estimates, the typhoon and related flooding affected approximately 950,000 people and caused 53 deaths. The National Disaster Risk Reduction and Management Council estimated that damage to infrastructure, agriculture and private property amounted to approximately (Peso)411.9 million.
27
In October 2013, Typhoon “Santi” made landfall in Dingalan, Aurora, causing widespread damage and leading to 15 deaths. The National Disaster Risk Reduction and Management Council estimated that the storm damaged 59,000 homes, causing a total of (Peso)3.3 billion in damage to infrastructure and agriculture.
Typhoon “Yolanda” (“Haiyan”)
In November 2013, Typhoon “Yolanda” (also known as Typhoon “Haiyan”) made landfall in Eastern Samar, sustaining winds of 270 to 312 km/h while passing over the Philippines. A State of National Calamity was declared in Samar, Leyte, Cebu, Iloilo, Capiz, Aklan and Palawan, and as of December 4, 2013, 5,719 people were reported dead from the storm, 1,779 persons reported missing, 26,233 persons had been injured and 433 evacuation centers were sheltering approximately 96,474 people. As of the same date, estimated damages had reached (Peso)34.4 billion, comprising an estimated (Peso)17.3 billion to infrastructure and (Peso)17.0 billion to agriculture in the regions affected by the storm.
By the end of November 2013, all national roads in affected areas had been cleared. All airports and seaports affected were operational except Tacloban airport, which was limited to relief flights and Government operations. International relief efforts are ongoing, and as of December 4, 2013, (Peso)528.1 million of relief assistance had been provided to affected families. As of the same date, foreign nations and international organizations had pledged $484.0 million in cash and kind, $21.2 million of which had already been received. In addition, the ADB extended a $500.0 million emergency loan, and the World Bank assembled an aid package worth nearly $1.0 billion. The Republic has pledged (Peso)55.5 billion in the 2014 budget to support reconstruction efforts.
Typhoon “Yolanda” has resulted in losses to the agriculture, hunting, forestry and fishing sector. Rice production has been the most affected, with production losses estimated to amount to (Peso)9.1 billion, or approximately 54.5% of the total damage for 2013. The Government expects rice production in 2013 to decrease and the Government, through the National Food Authority, expects to import an additional 500,000 metric tons of rice to replenish the stocks depleted as a result of the ongoing relief efforts for Typhoon “Yolanda.” Given the extent of the damage, in particular in the Visayas region, the prices of basic commodities, including rice, are expected to increase. In order to provide for an orderly market and to control inflation in the aftermath of the storm, the Department of Trade and Industry imposed controls on the prices of basic goods and commodities for the affected areas and is coordinating, with the assistance of civil society organizations and the international community, the use of funds for rescue, recovery, relief and rehabilitation efforts. The Department of Agriculture has also taken actions intended to stabilize markets, provide seeds for early recovery of crops and support the municipal fishing sector. The Government is currently formulating a recovery and reconstruction plan that will outline the actions needed to assist the affected regions and rehabilitate and construct critical infrastructure.
Despite the damage and loss resulting from Typhoon “Yolanda,” as well as other calamities that struck the country in 2013, including a 7.2 magnitude earthquake in the Visayas region in October discussed below, in December 2013, the DBCC maintained their 6.0% to 7.0% GDP growth target for 2013 and their 6.5% to 7.5% GDP growth target for 2014. The DBCC also maintained their export and import growth targets of 10.0% and 12.0%, respectively, for 2013. However, for 2014, the DBCC reduced their export estimates from 11.0% to 6.0% and import estimates from 13.0% to 5.0%. The DBCC maintained their projection for the 2014 budget deficit of (Peso)266.2 billion, representing 2.0% of projected GDP for the year.
Earthquakes
The Philippines is located along a complex system of fault lines, which geologists refer to as the “Philippine Mobile Belt.” As a consequence, the Republic is susceptible to periodic seismic activity, such as the
28
magnitude 7.8 earthquake on Luzon Island in 1990. Most recently, on October 15, 2013, an earthquake with a magnitude of 7.2 struck Tagbilaran City, Bohol and Cebu City in the Visayas region. This seismic event caused the deaths of 218 people and injured an additional 768 individuals. As a result of the earthquake, 344,919 people were displaced and 68,486 homes were damaged. The National Disaster Risk Reduction and Management Council estimated that damage to infrastructure and buildings from the earthquake amounted to (Peso)2.2 billion.
Philippine Economy
Overview
Like many developing countries after World War II, the Philippines protected local industry from foreign competition through measures such as import tariffs and quotas, and hoped to replace imported finished goods with domestically produced goods over time. Successive administrations also intervened in domestic economic affairs by imposing quantitative trade barriers, price controls and subsidies. Initially, the economy grew rapidly, with GNI growing at an average rate of 5.7% per annum from 1970 to 1980, largely due to increased exports and Government investments. Infrastructure spending increased, and state ownership and nationalization of commercial enterprises became more prevalent. By the early 1980s, however, the Republic began to face increasing budget deficits, growing levels of foreign and domestic borrowing, rising inflation, climbing interest rates, a depreciating peso, declining investment capital and slowing economic growth or, at times, a contraction in GNI. The Republic’s unstable political situation during that period, highlighted by the assassination of opposition leader Benigno Aquino in 1983, exacerbated its economic problems.
The general optimism brought about by the peaceful removal of the unpopular Marcos administration in 1986 helped economic recovery. GNI grew by 3.4% in 1986, increasing to a growth of 6.8% in 1988 before reversing to a decline of 0.6% in 1991. The economic contraction in the early 1990s was caused principally by underlying macroeconomic imbalances, compounded by supply bottlenecks, natural disasters, political instability, a global recession and the Persian Gulf crisis of 1990 to 1991.
The government of President Corazon Aquino, who came to power in 1986, embarked on a stabilization program aimed at preventing an upsurge in inflation, controlling the fiscal deficit and improving the external current account position. The economy responded favorably to these measures, posting increases in GNI, investments, private consumption and imports in 1992. The Corazon Aquino administration also recognized that the Republic’s economic difficulties in large part resulted from its protectionist policies. The Corazon Aquino administration therefore initiated reforms to open the economy to market forces and reduce the size and role of the government in the Philippine economy. The government of President Fidel Ramos, who assumed office in 1992, accelerated the reform efforts initiated by the Corazon Aquino administration. Following a review of a number of the policies and programs initiated by previous administrations, the Estrada administration continued many of the financial policies and market-oriented reforms of the Corazon Aquino and Ramos administrations.
After the onset of the Asian economic crisis in mid-1997, the Philippines experienced economic turmoil characterized by currency depreciation, a decline in the performance of the banking sector, interest rate volatility, a significant decline in share prices on the local stock market and a reduction of foreign currency reserves. These factors led to a slowdown in the Philippine economy in 1997 and 1998. In response, the Government adopted a number of policies to address the effects of the Asian economic crisis by strengthening the country’s economic fundamentals.
The Philippines was not as severely affected by the Asian financial crisis as many of its neighbors, aided in part by remittances from OFWs. With the exception of 1998, when agricultural harvests were negatively impacted by poor weather and drought, the Republic has recorded positive real GDP growth every year since the Asian financial crisis. After a 0.6% decline in 1998, GDP growth increased to 3.1% in 1999 and 4.4% in 2000 before slowing down to 2.9% in 2001. The slowdown was largely due to global security concerns, domestic political uncertainty, and a global economic downturn that reduced demand for Philippine products by the United
29
States and Japan. In the early 2000s, the Government pursued economic strategies to improve infrastructure, implement changes to the tax system, support deregulation and privatization of the economy, and further develop trade ties within Asia. GDP growth increased to 3.7% in 2002 and 5.0% in 2003 notwithstanding the impact of the Iraq War, the SARS epidemic and credit ratings downgrades. GDP growth accelerated to 6.7% in 2004 before leveling off to 4.8% in 2005 and 5.2% in 2006.
Beginning in the second half of 2007, the short-term funding markets in the United States experienced credit issues, leading to liquidity disruption in various markets. In particular, subprime mortgage loans in the United States experienced increased rates of delinquency, foreclosure and loss. These and other related events had a significant adverse impact on the global credit and financial markets as a whole, which included the bankruptcy filings by, and the acquisition, restructuring and nationalization of, certain financial institutions. Regulators in the United States, Europe and Asia took steps in response to the unprecedented conditions facing financial institutions in their jurisdictions. Against the backdrop of the global financial crisis, the Republic has experienced limited exposure to subprime assets and bankrupt financial institutions. Nonetheless, in 2008, the Republic experienced slower growth rates, a weakening of equity prices, a lower exchange rate for the peso against major currencies and increasing inflation. In 2009, the Republic’s economy began to exhibit indications of a recovery, although certain of the Republic’s economic recovery policies had yet to result in positive effects. OFW remittance levels in 2009 exceeded the Republic’s forecasts and supported growth in the economy despite continuing slowdowns in other production sectors, while increased Government spending in an effort to stimulate the economy resulted in an increasing fiscal deficit.
In 2010, the Republic continued its recovery despite an erratic economic recovery globally. In the second quarter of 2010, certain European nations experienced widening yields on their debt securities, triggering widespread restructuring and necessitating a financial bailout from other nations in the region. The bailout failed to resolve the crisis, and in January 2012 Standard & Poor’s downgraded the sovereign credit ratings of some European countries. Fitch and Moody’s issued similar downgrades in February 2012. Along with most Asian and emerging markets, the Republic was largely spared from the substantive effects of these events due to minimal trade and financial linkages with the affected nations, but the situation in Europe further highlighted the need for fiscal consolidation and more effective risk management by the Republic. The threat of sovereign defaults in the European Union and the possible consequential effects on the international financial system, including the effects on global credit and liquidity, remain a systemic concern in the international markets. In light of this, the Republic has sought through its financial regulatory framework and monetary policy to mitigate the impact on the Republic of the European sovereign debt crisis and the resulting economic slowdown in Europe.
Based on a Bangko Sentral survey as of September 30, 2013, the Philippine banking system’s exposure to European entities amounted to $1.88 billion, representing 1.0% of the Philippine banking system’s total assets at that date. However, the Republic has certain trade and financial exposures to the European Union. Europe is one of the primary destinations of Philippine exports. According to data from the NSO, in 2012, the European Union accounted for approximately 11.4% of the Republic’s total exports. Between January and September 2013, total exports to the European Union amounted to $4.7 billion, or 11.6% of the Republic’s total exports of goods. During the first nine months of 2013, remittances from OFWs in Europe amounted to $3.0 billion, or 17.9%, of total OFW remittances. In 2011, Europe accounted for 10.9% of the Republic’s total receipts from the BPO sector. A prolonged or worsened European sovereign debt crisis, including further bailouts of countries in the European Union and uncertainties in the monetary union, may adversely affect the Philippine economy, resulting in, among other things, higher prices, job losses and weakened balance of payments performance. Benefits provided through the Philippine Social Security System and the Government Service Insurance System may be adversely affected due to a consequential rise in unemployment. In addition, the continuation of the European debt crisis could affect investor risk perception, which in turn could result in tighter global credit and reduced liquidity in the financial markets.
In 2013, notwithstanding improvements in the U.S. and Japanese economies, both significant trading partners of the Republic, the outlook for global growth remains uncertain. The latest IMF projections call for a
30
modest acceleration in global economic activity in the near term, resulting in 2.9% growth in world output for 2013 and 3.6% in 2014. Against this backdrop, Philippine export growth in the first nine months of 2013 declined by 0.1% to 7.1% from 7.2% in the same period in 2012. Real GDP growth for the first half of 2013 was 7.6%, largely due to increased domestic demand, particularly private consumption, Government spending and investment, even as overall exports declined by 7.0%.
The Republic believes that domestic liquidity remains adequate to meet the demand for financing to support economic growth in the Philippines; however, there can be no assurance that a contraction in liquidity in the international financial markets due to events in Europe or other causes will not adversely impact the financial condition of the Republic or of Philippine companies generally.
In 2013, Fitch, Standard & Poor’s and Moody’s upgraded the Republic to investment-grade status for the first time in the nation’s history. The ratings agencies cited the resilience of the economy, a persistent current account surplus, a strong policy framework and good governance as some of the key factors leading to their decision.
Recent Economic Indicators
The following table sets out the performance of certain of the Republic’s principal economic indicators for the specified periods.
| | | | | | | | | | | | | | | | | | | | | | | | |
| | | 2008 | | | 2009 | | | 2010 | | | 2011 | | | 2012 | | | 2013 | |
GDP growth (%) (at constant 1985 prices)(1) | | | 3.7 | | | | 1.1 | | | | 7.3 | | | | — | | | | — | | | | — | |
GDP growth (%) (at constant 2000 prices) | | | 4.2 | | | | 1.1 | | | | 7.6 | | | | 3.6 | | | | 6.8 | | | | 7.4 | (2) |
GNI growth (%) (at constant 1985 prices)(1)(3) | | | 6.4 | | | | 4.0 | | | | 7.2 | (4) | | | — | | | | — | | | | — | |
GNI growth (%) (at constant 2000 prices)(3) | | | 5.0 | | | | 6.1 | | | | 8.2 | (4) | | | 2.8 | | | | 6.5 | | | | 7.3 | (2) |
Inflation rate (%)(5) | | | 8.3 | | | | 4.2 | | | | 3.8 | | | | 4.6 | | | | 3.2 | | | | 2.8 | (6) |
Unemployment rate | | | 7.4 | | | | 7.5 | | | | 7.4 | | | | 7.1 | | | | 7.0 | | | | 7.3 | (7) |
91-day T-bill rate (%) | | | 5.4 | | | | 4.2 | | | | 3.7 | | | | 1.4 | | | | 1.6 | | | | 0.3 | (8) |
External position(9) | | | | | | | | | | | | | | | | | | | | | | | | |
Balance of payments ($ million) | | | 89 | | | | 6,421 | | | | 14,308 | | | | 11,400 | | | | 9,236 | | | | 3,829 | (10) |
Export growth (%) | | | (2.8 | ) | | | (21.7 | ) | | | 34.0 | | | | (6.2 | ) | | | 8.9 | | | | 7.0 | (2) |
Import growth (%) | | | 2.3 | | | | (24.1 | ) | | | 27.5 | | | | 10.1 | | | | 5.3 | | | | 0.7 | (2) |
External debt ($ billion) | | | 54.3 | | | | 54.9 | | | | 60.0 | | | | 60.4 | | | | 60.3 | | | | 59.0 | (10) |
International reserves | | | | | | | | | | | | | | | | | | | | | | | | |
Gross ($ billion) | | | 37.6 | | | | 44.2 | | | | 62.4 | | | | 75.3 | | | | 83.8 | | | | 84.0 | (11) |
Net ($ billion) | | | 36.0 | | | | 44.2 | | | | 62.4 | | | | 75.3 | | | | 83.8 | | | | 84.0 | (11) |
Months of retained imports(12) | | | 6.0 | | | | 8.7 | | | | 9.5 | | | | 11.3 | | | | 11.7 | | | | 12.0 | (11) |
Domestic credit growth (%) | | | 13.7 | | | | 8.4 | | | | 8.9 | | | | 12.7 | | | | 6.5 | | | | 11.6 | (13) |
Sources: National Statistical Coordination Board, Bangko Sentral.
Notes:
| (1) | The table above provides comparative GDP and GNI growth rates for 2008, 2009 and 2010, as determined using both the previously reported calculations based on constant 1985 prices and the revised calculations based on constant 2000 prices. The period-on-period discussion of the economy that follows in the sections below uses data under the revised PSNA, based on the 2000 base year. |
| (2) | Preliminary data for the first nine months of 2013 compared to the first nine months of 2012. |
| (3) | In May 2013, the NSCB revised GNI and net primary income figures for 2010 to 2013 to reflect updated data, particularly in relation to salaries of OFWs. As a result, estimates of GNI growth presented in this table for 2011, 2012 and the first nine months of 2013 are not presented on the same basis as GNI growth figures for 2008 and 2009. |
| (4) | The growth figures for GNI for 2010 represent year-on-year comparisons of the 2010 GNI figures reported prior to the May 2013 revision and thus are not presented on the same basis as the 2010 GNI figure. |
| (5) | The Government began using 2006 as a base year for CPI calculations in July 2011, and data for previous periods has been restated. |
| (6) | Preliminary data for the first 11 months of 2013. |
| (7) | As of July 31, 2013 according to Labor Force Survey figures of the NSO. |
| (8) | Average of the first 11 months of 2013. |
31
| (9) | Includes Bangko Sentral obligations, public sector debt, whether or not guaranteed by the Government, and private sector debt registered and approved by Bangko Sentral. Does not include inter-company accounts of Philippine branches of foreign banks, private sector debt not registered with Bangko Sentral or private sector obligations under capital lease arrangements. Figures reflect the change in treatment of offshore banking units from non-resident to resident entities, pursuant to the fifth edition of the IMF Balance of Payments Manual (“BPM5”). Figures also reflect the change in treatment of the property income and expense accounts pursuant to the sixth edition of the IMF Balance of Payments Manual (“BPM6”). |
| (10) | Preliminary data for the first nine months of 2013. |
| (11) | Preliminary data as of November 30, 2013. |
| (12) | Number of months of average imports of goods and payments of services and income that can be financed by reserves. |
| (13) | Growth from October 31, 2012 to October 31, 2013. |
Restructuring of the Electric Power Industry
The EPIRA, which became effective on June 28, 2001, provided the legal framework for the restructuring of the electric power industry, the privatization of NPC and the establishment of various open market devices to promote free and fair competition.
Pursuant to the EPIRA, the power industry was restructured to comprise four sectors: generation, transmission, distribution and supply. To allow the industry to adjust to a market-oriented setting and to help mitigate adverse economic consequences of the restructuring, the EPIRA also contains transition mechanisms dealing with, among other issues, transition supply contracts, independent power producer (“IPP”) contracts, and “stranded costs and debts” that NPC will not be able to dispose of or settle subsequent to its privatization.
To reorganize NPC’s assets and liabilities, two entities were created pursuant to the EPIRA:
| | • | | PSALM, which took ownership of all of NPC’s then existing generation assets, liabilities, real estate, and other disposable assets, as well as certain IPP contracts; and |
| | • | | Transco, an entity wholly owned by PSALM, which assumed NPC’s electricity transmission assets. In January 2009, following an action for the right to operate Transco’s nationwide electrical transmission system under a 50-year franchise agreement, PSALM transferred the management and operation of Transco’s transmission system to the National Grid Corporation of the Philippines, which was formed by a consortium of Monte Oro Grid Corporation, Calaca High Power Corporation and State Grid Corporation of China; however, Transco retains ownership of its assets under the arrangement. |
Since the passage of the EPIRA, NPC’s operations have been limited to subsidized off-grid and island grid electrification projects in remote areas, referred to as “missionary electrification.”
Privatization of NPC’s Assets
PSALM has been privatizing NPC’s generation assets through public bidding processes since the last quarter of 2003. As of October 31, 2013, PSALM had sold 30 of these generation assets with 13 remaining for privatization (including two decommissioned power plants) with a total generation capacity of approximately 1,913.2 MW. PSALM has also begun to transfer to private entities (known as IPP administrators) the management and control of the energy output of NPC power plants covered by IPP contracts. As of October 31, 2013, PSALM had successfully bid out aggregate contracted capacities totaling 3,593.9 MW, or approximately 76.9% of the contracted capacity of the IPP contracts for Luzon and Visayas, exceeding the 70% required as one of the conditions to open access.
Having met the preconditions for the implementation of retail competition and open access, which include, among others, the privatization of at least 70% of the total capacity of NPC’s generating assets, and the transfer to IPP administrators of the management and control of at least 70% of the total energy output of plants under contract with NPC in Luzon and Visayas, the ERC issued a resolution declaring the EPIRA’s compliance with
32
the preconditions and the commencement of retail competition and open access for Luzon and Visayas on December 26, 2011. However, upon consultation by the Philippine Department of Energy with various stakeholders, the implementation of retail competition and open access was deferred pending the promulgation of retail market rules, the development of the Central Registration Body’s IT Systems and Processes, the approval of the Distribution Utilities’ Business Separation Unbundling Plan and the Accounting and Cost Allocation Manual and the conclusion of a stakeholders’ readiness assessment and information and education campaign for all stakeholders. Open access will permit electricity suppliers to compete freely on the open market by allowing consumers to choose from which ERC-authorized entity to purchase electricity supplied over a common transmission network.
The total sales price for the asset sales that have been completed as of October 31, 2013, including the concession fee from the privatization of Transco’s management and operations, was approximately $21.0 billion. Out of this amount, actual collection had amounted to approximately $8.1 billion.
In July 2011, PSALM commenced a new round of bidding for the appointment of an IPP administrator to manage the contracted capacity of the Naga Power Plant Complex. The Naga Power Plant Complex, located in Naga, Cebu, consists of two coal-fired thermal power plants with an aggregate capacity of 109.3 MW, and a 43.8 MW diesel power plant. However, its privatization was deferred by PSALM in response to the request of the Joint Congressional Power Commission to conduct a further review on one of the provisions of the land lease agreement covering property adjacent to the Plant Complex.
The Naga Power Plant Complex was operated under a Rehabilitate-Operate-Maintain-and-Manage Agreement and Energy Conversion Agreement between KEPCO Salcon Corporation and NPC that expired in March 2012. Prior to privatization of the Complex, PSALM has to procure, through public bidding, an Operation and Maintenance Service Contract for the Naga Power Plant Complex. Because no bids were submitted in the initial round of bidding held on February 27, 2012, PSALM negotiated a six-month contract with SPC Power Corporation (“SPC”) pending the outcome of a second round of bidding for a one-year contract. PSALM held the second round of bidding on June 21, 2012 but the procurement failed after the sole bidder failed to meet the bidding document requirements. Following the failed round of bidding in June, PSALM extended SPC’s contract for six months to March 2013 and then for an additional six months to September 2013. After September 25, 2013, the contract could not be extended further due to the one-year limit for extensions, as prescribed in Government Procurement Policy Board guidelines. Therefore, a negotiated procurement of at least six months from September 25, 2013 to March 25, 2014 was awarded to SPC.
In May 2012, the bidding process for four of SPC’s generation assets—Power Barges 101, 102, 103 (located in Visayas) and 104 (located in Mindanao)—failed after only one of the seven pre-qualified bidders submitted a bid before the scheduled deadline. PSALM commenced a second round of bidding for the power barges in August 2012; however, the bidding process, which took place on August 17, 2012, was again declared a failure after only one bidder out of the four qualified bidders submitted a proposal. Following the authority given by the PSALM Board, PSALM exercised its option to enter into a negotiated sale with the sole bidder. The negotiations ended after the bidder was unable to meet the reserve price set for the power facilities by the PSALM Board. On October 30, 2013, PSALM held a further round of bidding, in which SPC Island Power Corporation was awarded Power Barges 101, 102 and 103 for (Peso)546.0 million, while bidding in respect of Power Barge 104 was unsuccessful due to the failure of bidders to meet the reserve price set for the asset.
Cost Adjustments Relating to GRAM and ICERA
Historically, NPC has employed an automatic cost adjustment mechanism that allowed it to pass on costs associated with its IPP contracts to power consumers. However, in 2002, then President Arroyo issued a presidential directive ordering NPC to reduce the adjustments. Identifying problems with how these adjustments were calculated, the Energy Regulatory Commission (“ERC”) promulgated two new price adjustment mechanisms, the Generation Rate Adjustment Mechanism (“GRAM”), which allowed for the recovery of incremental fuel and purchased power costs due to changes in fuel prices and cost of purchased power from IPPs,
33
and the Incremental Currency Exchange Rate Adjustments (“ICERA”), which allowed for the recovery of incremental costs incurred as a result of foreign currency exchange rate fluctuations. The implementing guidelines for GRAM and ICERA, which allowed for quarterly adjustments in generation rates, were approved in February 2003.
On March 26 and August 15, 2012, ERC rendered its decisions authorizing PSALM to recover (Peso)35.9 billion under the GRAM and (Peso)8.9 billion under ICERA, respectively.
In September 2013, NPC filed a petition with ERC to recover its fuel, purchased power and foreign exchange costs. In its petition, NPC asked the ERC to allow it to recover (Peso)4.2 billion under GRAM. NPC said that its GRAM recovery would translate to an increase in the power rates in small power utilities group areas amounting to (Peso)1.4769 per kWh in Luzon, (Peso)1.4695 per kWh in the Visayas and (Peso)1.7971 per kWh in Mindanao. NPC also asked ERC to recover (Peso)14.5 million equivalent to (Peso)1.4767 per kWh for a 12 month period under ICERA, mainly for foreign exchange fluctuations. NPC’s two separate applications cover the billing period from January to December 2012.
Cost Adjustments Relating to the Automatic Recovery Mechanism
On August 14, 2008, PSALM submitted proposed rules for the automatic recovery of NPC and PSALM’s generation assets��� monthly fuel, purchased power and foreign exchange-related costs to the ERC. On August 3, 2009, ERC approved a resolution adopting the rules for the automatic recovery mechanism. This mechanism replaced GRAM and ICERA methodology and has been in effect since the March 2010 billing period.
The automatic recovery entails a monthly adjustment in fuel, purchased power costs and foreign exchange-related costs. Using the movement of approved indices as a proxy, any incremental changes attributable to fluctuations in fuel prices, costs of power purchased from IPPs or fluctuations in exchange rates are automatically passed on to customers on a monthly basis. According to ERC rules, every 12 months PSALM is required to calculate adjustments on the monthly automatic recovery mechanism in order to reflect the difference from the actual allowable costs and the amounts already billed from NPC regular customers through the automatic recovery mechanism.
The first automatic cost recovery mechanism adjustment was filed by PSALM on August 18, 2011, covering March 2010 to February 2011 and seeking to recover (Peso)4.2 billion. The second adjustment was filed by PSALM on April 31, 2012, covering March 2011 to December 2011 and seeking to recover (Peso)2.11 billion. The third adjustment was filed on May 2, 2013, covering January 2012 to December 2012 and seeking to recover (Peso)1.66 billion.
On average, for the period from March 2010 to October 2013, the implementation of the monthly automatic cost recovery mechanism allowed PSALM to bill (Peso)0.5194 per kWh for Luzon, (Peso)0.2495 per kWh for Visayas and (Peso)0.0813 for Mindanao.
Issues Relating to the Universal Charge
Under the EPIRA, a “Universal Charge” may be imposed on all end-users of electricity, including non-NPC customers. The Universal Charge is imposed to pay for NPC’s remaining debt and contract obligations that will not be liquidated by proceeds from NPC’s privatization (referred to as “stranded debt”), stranded contract costs of NPC with its eligible IPP contracts, the cost of missionary electrification projects, an environmental charge for the rehabilitation and maintenance of watershed areas and a subsidy for indigenous and renewable sources of energy. After a challenge to the constitutionality of the Universal Charge by various consumer and environmentalist groups claiming it was an undue delegation of legislative power, the Supreme Court upheld the constitutionality of the Universal Charge in July 2007.
34
In August 2009, the ERC issued a resolution granting provisional authority for Transco and other distribution utilities to collect a Universal Charge of (Peso)0.0978 per kWh for the purpose of subsidizing missionary electrification. This charge was intended to cover subsidies of approximately (Peso)5.7 billion given to NPC’s small power utilities group for its expenses in 2009 associated with missionary electrification.
In 2010, the ERC reduced the Universal Charge for missionary electrification to (Peso)0.0454 per kWh from (Peso)0.0978 per kWh. However, it allowed the small power utilities group to collect an additional (Peso)0.0709 per kWh adjustment to cover the group’s efforts over the period of 2003 to 2009. Recently, the small power utilities group has filed another petition to increase the Universal Charge for missionary electrification to (Peso)0.1962 per kWh for 2012, (Peso)0.2262 per kWh for 2013, (Peso)0.3293 per kWh for 2014, (Peso)0.3318 per kWh for 2015 and (Peso)0.2256 per kWh for 2016, with an additional (Peso)0.0851 adjustment to be imposed for 12 months to recover the budgetary shortfall arising from the group’s efforts at missionary electrification in 2011.
On June 28, 2011, PSALM filed a petition with the ERC to impose a Universal Charge of (Peso)0.0313 for stranded debt and (Peso)0.3666 (for four years) for stranded contract costs. To reduce the impact on consumers, PSALM also proposed that the Universal Charge for stranded contract costs be assessed over a period of 15 years. The ERC held various hearings related to the petitions in July 2012 but has yet to issue its final decision.
On January 28, 2013, the ERC approved PSALM’s petition for the recovery of the NPC stranded contract costs portion of the Universal Charge for 2007 to 2010, authorizing PSALM to recover (Peso)53.85 billion.
The petition for NPC’s stranded contract cost portion of the Universal Charge for 2011 and 2012 was filed by PSALM before the ERC on July 31, 2013, seeking ERC’s provisional approval to collect (Peso)17.69 billion. The Petition for true-up adjustments for NPC’s stranded debt portion of the Universal Charge for 2011 and 2012 was filed by PSALM before the ERC on September 30, 2013, seeking ERC’s provisional approval to collect (Peso)41.14 billion.
As of October 31, 2013, PSALM had collected (Peso)38.83 billion from the Universal Charge for missionary electrification, environmental charges and NPC stranded contract costs, (Peso)31.69 billion of which was disbursed to NPC for missionary electrification and (Peso)714 million of which was disbursed to NPC for watershed rehabilitation and management in accordance with provisions in the EPIRA. Pursuant to PSALM’s board guidelines, (Peso)5.81 billion of the universal charge collections was transferred to PSALM’s stranded contract costs special fund account.
Government Financing of NPC
NPC’s capital expenditures were historically financed through borrowings from multilateral organizations, export credit agreements and internal cash generation. Under the EPIRA, the Government was obligated to assume (Peso)200 billion of NPC’s debt, and the Government assumed $3.4 billion and €500 million (amounting to approximately (Peso)200 billion) of NPC’s debt in March 2005. In addition, under the EPIRA, PSALM was tasked with the management and liquidation of NPC’s assets and liabilities. Through its privatization of NPC’s assets, PSALM has generated revenue that it has utilized for the management and servicing of NPC’s liabilities, which, pursuant to the EPIRA, PSALM assumed on October 1, 2008. Following the transfer of substantially all of NPC’s assets and liabilities to PSALM as required under the EPIRA, PSALM raised approximately $4.4 billion in Government-guaranteed borrowings from 2008 to 2011 to address its general funding and debt servicing requirements.
Prepayment of NPC Debts
On December 5, 2007, PSALM announced plans to maximize the use of proceeds from its privatization efforts in 2007 by pre-paying a portion of NPC’s outstanding debts. In the first nine months of 2008, PSALM’s prepayments of NPC debt amounted to approximately $1.3 billion in aggregate, which helped lower NPC’s outstanding debt to approximately $18.1 billion as of October 1, 2008. PSALM identified an additional
35
$1.1 billion of NPC debt it intended to prepay in the last quarter of 2008 and 2009. However, in the last quarter of 2008, PSALM suspended its prepayments program as a result of the international credit crisis. On December 2, 2009, PSALM completed an exchange offer through which $600 million of bonds originally issued by NPC and due in 2010 and 2011 were exchanged for longer-termed PSALM bonds due in 2019 and 2024.
In May 2011, PSALM announced that it had paid an aggregate of approximately $18 billion of the debt of NPC pursuant to its mandate under the EPIRA to manage the assets and liabilities of NPC. NPC’s debt stood at $16.4 billion when the EPIRA was enacted in 2001, but increased considerably between 2001 and 2010 due to NPC’s sustained operating losses. PSALM aims to reduce these liabilities to an indicative amount of $3.8 billion by the expiry of its statutory mandate in 2026. Under the EPIRA, upon the expiry of PSALM’s statutory mandate, its debts will be assumed by the Government. In 2012, as part of the Government’s liability management, the Government borrowed approximately $1.3 billion that was lent onward to PSALM. As of June 2013, PSALM’s Government-guaranteed debt was $7.0 billion, while outstanding Government advances to PSALM were $292 million.
PSALM Investigations
On July 27, 2010, Energy Secretary Rene Almendras commenced an investigation into alleged anomalies concerning the recovery of approximately (Peso)471 billion in debt of PSALM and NPC through the Universal Charge component of electricity charges to consumers. A number of senators also called for investigations into the matter, alleging that various PSALM costs and expenses relating to consultancy fees, employee bonuses and other remuneration were inappropriately included in PSALM’s Universal Charge application with the ERC. PSALM has denied these allegations, and explained that it was guided by and complied with the ERC resolution on the rules for recovery of NPC stranded contract costs and stranded debts portion of the Universal Charge, which does not allow the inclusion of PSALM’s costs. The Commission on Audit has also stated that no such components were included in PSALM’s Universal Charge applications.
Aviation Liberalization Policies
On March 14, 2011, President Aquino issued Executive Orders No. 28 and No. 29, creating the Philippine Air Negotiating Panel and the Philippine Air Consultation Panel, and authorizing the Civil Aeronautics Board to explore discussions with foreign air carriers regarding the aviation liberalization policies commonly known as “open skies.” Open skies generally allows operating and traffic rights to be granted to foreign air carriers without restrictions on capacity, frequency or type of aircraft. In line with this policy, these executive orders also seek to liberalize civil aviation in the Philippines through specific initiatives aimed at granting increased air service rights to foreign air carriers, particularly with respect to airports other than Ninoy Aquino International Airport in Manila, with the goal of advancing tourism in the Philippines. The orders also seek to promote a more liberalized general aviation policy for the expansion of cargo direct air services to secondary gateways outside Manila. On May 2, 2011, the Civil Aviation Board adopted the implementing rules and regulations for Executive Order No. 29 after public consultation with aviation stakeholders.
PEACe Bonds Dispute
In October 2011, the Supreme Court of the Philippines issued a temporary restraining order on the Government’s taxation of its Poverty Eradication and Alleviation Certificates. These bonds were issued in 2001, and interest income on the bonds was initially determined by the Bureau of Internal Revenue (the “BIR”) to be tax-exempt. The BIR reversed its position in 2004 and declared interest income on the bonds to be taxable. When the bonds matured in 2011, the Department of Finance affirmed the 2004 BIR ruling, and the Bureau of the Treasury (the “BTr”) announced that it would withhold (Peso)5 billion in taxes from the interest income paid on the bonds.
A number of banks that held the bonds prior to maturity filed suit against the Government, and the Supreme Court issued the October 2011 temporary restraining order enjoining the BIR and the BTr from withholding taxes on the bonds. In November 2011, the Supreme Court issued a show-cause order after the BIR and the BTr failed
36
to comply with the temporary restraining order, requiring the agencies to show cause why they should not be held in contempt. The BIR and the BTr responded to the show-cause order on December 2, 2011, arguing that they were given insufficient time to comply with the temporary restraining order before the interest on the bonds was paid and the taxes were withheld. The Supreme Court has yet to issue any further orders, and the dispute is ongoing.
GDP and Major Financial Indicators
In the first quarter of 2011, the standards under the PSNA for the calculation of GDP and GNI (known as GNP prior to the 2011 revisions) were revised, changing the constant base year for these calculations from 1985 to 2000. This revision was in response to observations from various sectors that the use of 1985 as the base year to calculate constant prices and economic weights was outdated and led to inaccurate measures of current economic growth, mainly as a result of significant changes in the structure of the Philippine economy since 1985. The revision of the base year for GDP and GNI growth was part of a number of changes to the PSNA methodology. Other significant changes included the use of new data sources, an improved estimation methodology, adoption of new classification systems (such as the 1994 Philippine Standard Industrial Classification to classify economic activities/industries, the 2004 Philippine Standard Commodity Classification to classify commodities, and the 2009 Philippine Classification of Individual Consumption Expenditure According to Purpose to classify household final consumption expenditure), as well as the reporting of certain key commodities and industries. Other changes in the Republic’s designation of economic categories and subcategories are summarized in the table below.
| | |
Previous Name | | New Name |
Net Factor Income from Abroad | | Net Primary Income |
| |
Agriculture, Fishery and Forestry | | Agriculture, Hunting, Forestry and Fishing |
| |
Wholesale and Retail Trade | | Trade and Repair of Motor Vehicles, Motorcycles, Personal and Household Goods |
| |
Finance | | Financial Intermediation |
| |
Ownership of Dwellings and Real Estate | | Real Estate, Renting and Business Activities |
| |
Government Services | | Public Administration and Defense and Compulsory Social Security |
| |
Private Services | | Other Services |
| |
Personal Consumption Expenditure | | Household Final Consumption Expenditure |
Gross Domestic Product
Gross domestic product, or GDP, measures the market value of all final goods and services produced within a country during a given period and is indicative of whether the country’s productive output rises or falls over time. By comparison, gross national income, or GNI, measures the market value of all final goods and services produced by a country’s citizens during a given period, whether or not the production occurred within the country.
Economists show GDP and GNI in both current and constant market prices. GDP and GNI at current market prices value a country’s output using the actual prices of each year, whereas GDP and GNI at constant market prices (also referred to as “real” GDP and GNI) value output using the prices from a base year, thereby eliminating the distorting effects of inflation and deflation. Growth figures for GDP and GNI in this prospectus are period-on-period comparisons of real GDP and GNI, respectively. The Government began using 2000 as a base year for GDP and GNI calculations in 2011. Unless otherwise specified, real GDP and GNI figures included in this prospectus and any prospectus supplement are based on 2000 prices.
37
In 2009, GDP grew by 1.2% compared to growth of 4.2% in 2008. The decrease in the GDP growth rate was due mainly to the global economic crisis, which affected the Republic’s exports, as well as typhoons that affected the Republic in the second half of 2009. GDP growth in 2009 was attributable mainly to growth in other services, real estate, renting and business activities, construction and financial intermediation subsectors, which grew by 6.5%, 4.1%, 6.8% and 5.5%, respectively. In 2009, GNI grew by 6.1% compared to growth of 5.0% in 2008. The primary factor that caused GNI growth to exceed GDP growth was the continued strong growth in net primary income, which registered 25.0% growth in 2009, compared to 8.4% growth in 2008. The increased rate of growth of net primary income was due mainly to increased OFW remittances, which was partially offset by a decline in property income.
In 2010, GDP grew by 7.6%, compared to growth of 1.1% in 2009. The increase in GDP growth was primarily attributable to the global economic recovery, improved business and consumer confidence, expansion in manufacturing and capital formation and the continued growth in OFW remittances. Consumer spending grew by 3.4%, while Government expenditures grew by 4.0% in 2010, compared to growth of 2.3% and 10.9%, respectively, in 2009. With respect to production, GDP growth in 2010 was driven primarily by the manufacturing, trade and repair of motor vehicles, motorcycles, personal and household goods, other services, real estate, renting and business activities, construction and financial intermediation subsectors. Growth in these subsectors was partially offset by the impact of the El Niño phenomenon on the agriculture, hunting, forestry and fishing sector.
In 2011, GDP grew by 3.6%, a significant decrease from growth of 7.6% in 2010. The slower growth in GDP resulted partially from the slowing of the global economic recovery, the credit crisis in Europe, the tsunami and related incidents in Japan, floods in Thailand that disrupted global supply chains and lower spending by the Government. The largest contributor to the lower growth rate in 2011 was a significant contraction in the construction subsector, which, after growing by 17.5% in 2010, decreased by 8.4% in 2011. Growth in the manufacturing subsector also decreased to growth of 4.7% in 2011, compared to growth of 11.2% in 2010. Finally, growth in the trade and repair of motor vehicles, motorcycles, personal and the household goods subsectors also decreased, from growth of 8.4% in 2010 to growth of 3.3% in 2011. The only subsectors that experienced an increased rate of growth in 2011 were agriculture, hunting and forestry; transport, storage and communications; and real estate, renting and business activities, which grew by 4.4%, 4.3% and 8.4%, respectively, in 2011, compared with a contraction of 0.1%, growth of 1.0% and growth of 7.5%, respectively, in 2010. GNI in 2011 grew by 2.8%. The primary factor that caused the GNI growth rate to be lower than the GDP growth rate was the relatively lower rate of growth in net primary income, compared to the growth in GDP.
In 2012, GDP grew by 6.8%, compared with growth of 3.6% in 2011. The largest contributor to the increase in the rate of growth in 2012 was a reversal of the contraction in the construction subsector experienced in 2011 of 9.8% to growth of 15.7% in 2012. Growth in the trade and repair of motor vehicles, motorcycles, personal and household goods subsector also increased, from growth of 3.3% in 2011 to growth of 7.5% in 2012. The transport, storage and communications subsector grew by 8.1% in 2012, compared to growth of 4.3% in 2011, which was also a major contributor. Partially offsetting the performance of these subsectors was a decrease in growth in the mining and quarrying subsector, from growth of 7.0% in 2011 to growth of 2.2% in 2012. Growth in both the agriculture and forestry subsector and the real estate, renting and business activities subsector also decreased, from 4.4% and 8.4%, respectively, in 2011 to 3.6% and 7.5%, respectively, in 2012. GNI in 2012 grew by 6.5% compared to 2.8% in the prior year. The GNI growth rate was lower than the GDP growth rate due to the relatively lower growth in net primary income of 4.8% in 2012 compared to growth in GDP in 2012, though this represented an increase over the 1.6% growth in net primary income in 2011.
Preliminary data indicate that GDP grew by 7.4% in the first nine months of 2013, compared with growth of 6.7% in the first nine months of 2012. The increase in growth in the first nine months of 2013 was primarily due to increased growth in the manufacturing subsector, from growth of 5.4% in the first nine months of 2012 to growth of 9.8% in the first nine months of 2013. An increase in growth in the financial intermediation (including banking institutions) subsector, from 8.0% in the first nine months of 2012 to growth of 13.3% in the first
38
nine months of 2013, was also a significant contributor. Growth in construction also increased, from growth of 10.5% in the first nine months of 2012 to growth of 16.3% in the first nine months of 2013. Partially offsetting the performance of these subsectors was a decrease in growth in the transport, storage and communications subsector, from growth of 9.4% in the first nine months of 2012 to growth of 5.3% in the first nine months of 2013. Growth in the other services subsector also decreased to growth of 5.7% in the first nine months of 2013, from growth of 8.5% in the first nine months of 2012. GNI in the first nine months of 2013 increased by 7.3% compared to 6.5% in the corresponding period in 2012. GNI growth was lower compared to GDP growth due to relatively lower growth in net primary income of 6.7% in the first nine months of 2013 compared to GDP growth in the same period, though this was an increase from the 5.5% growth in net primary income in the first nine months of 2012.
The following table shows GDP by sector, net primary income and GNI at current market prices for the specified periods.
| | | | | | | | | | | | | | | | | | | | | | | | | | | | | | | | |
| | | Gross Domestic Product by Major Sector
(at current market prices) | | | Percentage of GDP | |
| | | 2008 | | | 2009 | | | 2010 | | | 2011 | | | 2012 | | | 2013(1) | | | 2008 | | | 2012 | |
| | | (Peso in millions, except as indicated) | | | (%) | |
Agriculture, hunting, forestry and fishing sector(2) | | | | | | | | | | | | | | | | | | | | | | | | | | | | | | | | |
Agriculture, hunting and forestry | | | 844,438 | | | | 871,012 | | | | 928,588 | | | | 1,052,167 | | | | 1,056,964 | | | | 742,596 | | | | 10.9 | | | | 10.0 | |
Fishing | | | 178,077 | | | | 178,862 | | | | 180,130 | | | | 182,845 | | | | 193,652 | | | | 148,685 | | | | 2.3 | | | | 1.8 | |
| | | | | | | | | | | | | | | | | | | | | | | | | | | | | | | | |
Total | | | 1,022,515 | | | | 1,049,874 | | | | 1,108,718 | | | | 1,235,012 | | | | 1,250,616 | | | | 891,282 | | | | 13.2 | | | | 11.8 | |
Industry sector | | | | | | | | | | | | | | | | | | | | | | | | | | | | | | | | |
Mining and quarrying | | | 95,410 | | | | 106,396 | | | | 128,727 | | | | 143,027 | | | | 121,435 | | | | 87,438 | | | | 1.2 | | | | 1.1 | |
Manufacturing | | | 1,760,890 | | | | 1,706,391 | | | | 1,930,778 | | | | 2,047,718 | | | | 2,170,918 | | | | 1,607,541 | | | | 22.8 | | | | 20.5 | |
Construction | | | 419,403 | | | | 460,426 | | | | 551,230 | | | | 520,969 | | | | 618,077 | | | | 530,766 | | | | 5.4 | | | | 5.9 | |
Electricity, gas and water supply | | | 262,757 | | | | 271,893 | | | | 321,543 | | | | 330,345 | | | | 374,077 | | | | 315,558 | | | | 3.4 | | | | 3.5 | |
| | | | | | | | | | | | | | | | | | | | | | | | | | | | | | | | |
Total | | | 2,538,461 | | | | 2,545,104 | | | | 2,932,279 | | | | 3,042,060 | | | | 3,284,508 | | | | 2,541,309 | | | | 32.9 | | | | 31.1 | |
Service sector | | | | | | | | | | | | | | | | | | | | | | | | | | | | | | | | |
Transport, storage and communications | | | 548,856 | | | | 561,093 | | | | 586,197 | | | | 627,255 | | | | 685,251 | | | | 544,889 | | | | 7.1 | | | | 6.5 | |
Trade and repair of motor vehicles, motorcycles, personal and household goods(3) | | | 1,316,070 | | | | 1,359,500 | | | | 1,563,786 | | | | 1,695,908 | | | | 1,868,423 | | | | 1,457,470 | | | | 17.0 | | | | 17.7 | |
Financial intermediation(4) | | | 499,925 | | | | 544,526 | | | | 622,404 | | | | 684,088 | | | | 763,669 | | | | 664,112 | | | | 6.5 | | | | 7.2 | |
Real estate, renting and business activities(5) | | | 816,548 | | | | 884,131 | | | | 979,129 | | | | 1,105,120 | | | | 1,236,489 | | | | 1,029,628 | | | | 10.6 | | | | 11.7 | |
Public administration and defense, compulsory social security(6) | | | 285,860 | | | | 323,605 | | | | 372,304 | | | | 404,323 | | | | 455,476 | | | | 361,413 | | | | 3.7 | | | | 4.3 | |
Other services(7) | | | 692,669 | | | | 758,310 | | | | 838,663 | | | | 912,502 | | | | 1,020,455 | | | | 810,197 | | | | 9.0 | | | | 9.7 | |
| | | | | | | | | | | | | | | | | | | | | | | | | | | | | | | | |
Total | | | 4,159,928 | | | | 4,431,165 | | | | 4,962,483 | | | | 5,429,196 | | | | 6,029,762 | | | | 4,867,709 | | | | 53.9 | | | | 57.1 | |
| | | | | | | | | | | | | | | | | | | | | | | | | | | | | | | | |
Total GDP | | | 7,720,903 | | | | 8,026,143 | | | | 9,003,480 | | | | 9,706,268 | | | | 10,564,886 | | | | 8,300,295 | | | | 100.0 | | | | 100.0 | |
| | | | | | | | | | | | | | | | | | | | | | | | | | | | | | | | |
Net primary income(8) | | | 2,055,282 | | | | 2,626,323 | | | | 1,848,952 | | | | 1,891,937 | | | | 2,043,843 | | | | 1,643,170 | | | | | | | | | |
Total GNI(8) | | | 9,776,186 | | | | 10,652,466 | | | | 10,852,432 | | | | 11,598,205 | | | | 12,608,730 | | | | 9,943,484 | | | | | | | | | |
Total GDP ($ millions)(9) | | | 173,601 | | | | 168,485 | | | | 199,589 | | | | 224,096 | | | | 250,181 | | | | — | | | | | | | | | |
Per capita GDP ($)(9) | | | 1,919 | | | | 1,851 | | | | 2,155 | | | | 2,365 | | | | 2,588 | | | | — | | | | | | | | | |
Source: National Statistical Coordination Board.
Notes:
| (1) | Preliminary data for the first nine months of 2013. |
| (2) | The subsectors of the agriculture, hunting, forestry and fishing sector prior to the rebasing to 2000 prices were (1) agriculture and fisheries and (2) forestry. With the rebasing, the subsectors were revised to (1) agriculture, hunting and forestry and (2) fishing. |
39
| (3) | Formerly known as the “Wholesale and Retail Trade” subsector, the subsector has been designated the “Trade and Repair of Motor Vehicles, Motorcycles, Personal and Household Goods” subsector since 2011. |
| (4) | Formerly known as the “Finance” subsector, the subsector has been designated the “Financial Intermediation” subsector since 2011. |
| (5) | Formerly known as the “Ownership of Dwellings and Real Estate” subsector, the subsector has been designated the “Real Estate, Renting and Business Activities” subsector since 2011. |
| (6) | Formerly known as the “Government Services” subsector, the subsector has been designated the “Public Administration and Defense, Compulsory Social Security” subsector since 2011. |
| (7) | Formerly known as the “Private Services” subsector, the subsector has been designated the “Other Services” subsector since 2011. It consists of production from education; health and social work; hotels and restaurants; sewage and refuse disposal sanitation and similar activities; recreational, cultural and sporting activities; and other service activities. |
| (8) | In May 2013, the NSCB revised GNI and net primary income figures for 2010 to 2013 to reflect updated data, particularly in relation to salaries of OFWs. As a result, estimates of GNI and net primary income for 2010, 2011, 2012 and the first nine months of 2013 presented in this table are not presented on the same basis as GNI and net primary income figures for 2008 and 2009. |
| (9) | Calculated using the average exchange rate for the period indicated. See “—Monetary System—Foreign Exchange System.” |
The following table shows GDP by sector, net primary income and GNI at constant market prices for the specified periods.
| | | | | | | | | | | | | | | | | | | | | | | | | | | | | | | | |
| | | Gross Domestic Product by Major Sector
(at constant market prices)(1) | | | Percentage of GDP | |
| | | 2008 | | | 2009 | | | 2010 | | | 2011 | | | 2012 | | | 2013(2) | | | 2008 | | | 2012 | |
| | | (Peso in millions, except as indicated) | | | (%) | |
Agriculture, hunting, forestry and fishing sector | | | | | | | | | | | | | | | | | | | | | | | | | | | | | | | | |
Agriculture, hunting and forestry | | | 535,462 | | | | 526,622 | | | | 526,238 | | | | 549,306 | | | | 568,905 | | | | 406,922 | | | | 10.2 | | | | 9.0 | |
Fishing | | | 133,088 | | | | 137,122 | | | | 136,427 | | | | 130,529 | | | | 130,032 | | | | 91,781 | | | | 2.5 | | | | 2.1 | |
| | | | | | | | | | | | | | | | | | | | | | | | | | | | | | | | |
Total | | | 668,550 | | | | 663,744 | | | | 662,665 | | | | 679,835 | | | | 698,937 | | | | 498,703 | | | | 12.8 | | | | 11.1 | |
Industry sector | | | | | | | | | | | | | | | | | | | | | | | | | | | | | | | | |
Mining and quarrying | | | 50,926 | | | | 59,130 | | | | 65,898 | | | | 70,509 | | | | 72,047 | | | | 57,954 | | | | 1.0 | | | | 1.1 | |
Manufacturing | | | 1,194,921 | | | | 1,137,534 | | | | 1,264,523 | | | | 1,324,330 | | | | 1,395,711 | | | | 1,102,984 | | | | 22.8 | | | | 22.1 | |
Construction | | | 266,751 | | | | 284,994 | | | | 325,820 | | | | 293,870 | | | | 339,921 | | | | 277,048 | | | | 5.1 | | | | 5.4 | |
Electricity, gas and water supply | | | 186,572 | | | | 184,943 | | | | 203,274 | | | | 204,547 | | | | 214,944 | | | | 171,269 | | | | 3.6 | | | | 3.4 | |
| | | | | | | | | | | | | | | | | | | | | | | | | | | | | | | | |
Total | | | 1,699,171 | | | | 1,666,601 | | | | 1,859,515 | | | | 1,893,256 | | | | 2,022,623 | | | | 1,609,255 | | | | 32.4 | | | | 32.0 | |
Service sector | | | | | | | | | | | | | | | | | | | | | | | | | | | | | | | | |
Transport, storage and communications | | | 423,952 | | | | 423,398 | | | | 427,766 | | | | 446,026 | | | | 482,095 | | | | 377,274 | | | | 8.1 | | | | 7.6 | |
Trade and repair of motor vehicles, motorcycles, personal and
household goods(3) | | | 863,732 | | | | 875,616 | | | | 948,743 | | | | 980,514 | | | | 1,054,392 | | | | 800,767 | | | | 16.5 | | | | 16.7 | |
Financial intermediation(4) | | | 322,672 | | | | 340,329 | | | | 374,716 | | | | 394,371 | | | | 426,787 | | | | 361,906 | | | | 6.2 | | | | 6.8 | |
Real estate, renting and business activities(5) | | | 526,116 | | | | 547,866 | | | | 588,946 | | | | 643,458 | | | | 686,430 | | | | 558,888 | | | | 10.0 | | | | 10.9 | |
Public administration and defense, compulsory social security(6) | | | 227,223 | | | | 241,009 | | | | 255,087 | | | | 259,962 | | | | 275,835 | | | | 221,743 | | | | 4.3 | | | | 4.4 | |
Other services(7) | | | 505,683 | | | | 538,677 | | | | 584,100 | | | | 616,791 | | | | 664,573 | | | | 520,084 | | | | 9.7 | | | | 10.5 | |
| | | | | | | | | | | | | | | | | | | | | | | | | | | | | | | | |
Total | | | 2,869,379 | | | | 2,966,895 | | | | 3,179,359 | | | | 3,335,909 | | | | 3,590,111 | | | | 2,840,662 | | | | 54.8 | | | | 56.9 | |
| | | | | | | | | | | | | | | | | | | | | | | | | | | | | | | | |
Total GDP | | | 5,237,101 | | | | 5,297,240 | | | | 5,701,539 | | | | 5,909,000 | | | | 6,311,671 | | | | 4,948,621 | | | | 100.0 | | | | 100.0 | |
| | | | | | | | | | | | | | | | | | | | | | | | | | | | | | | | |
Net primary income(8) | | | 1,352,909 | | | | 1,691,527 | | | | 1,149,599 | | | | 1,130,948 | | | | 1,184,875 | | | | 935,857 | | | | | | | | | |
Total GNI(8) | | | 6,590,009 | | | | 6,988,767 | | | | 6,851,138 | | | | 7,039,948 | | | | 7,496,546 | | | | 5,884,478 | | | | | | | | | |
Yearly growth in GDP | | | 4.2 | | | | 1.2 | | | | 7.6 | | | | 3.6 | | | | 6.8 | | | | 7.4 | (9) | | | | | | | | |
Yearly growth in GNI(8) | | | 5.0 | | | | 6.1 | | | | 8.2 | (10) | | | 2.8 | | | | 6.5 | | | | 7.3 | (9) | | | | | | | | |
40
Source: National Statistical Coordination Board.
Notes:
| (1) | Based on constant 2000 prices. |
| (2) | Preliminary data for the first nine months of 2013. |
| (3) | Formerly known as the “Wholesale and Retail Trade” subsector, the subsector has been designated the “Trade and Repair of Motor Vehicles, Motorcycles, Personal and Household Goods” subsector since 2011. |
| (4) | Formerly known as the “Finance” subsector, the subsector has been designated the “Financial Intermediation” subsector since 2011. |
| (5) | Formerly known as the “Ownership of Dwellings and Real Estate” subsector, the subsector has been designated the “Real Estate, Renting and Business Activities” subsector since 2011. |
| (6) | Formerly known as the “Government Services” subsector, the subsector has been designated the “Public Administration and Defense, Compulsory Social Security” subsector since 2011. |
| (7) | Formerly known as the “Private Services” subsector, the subsector has been designated the “Other Services” subsector since 2011. It consists of production from education; health and social work; hotels and restaurants; sewage and refuse disposal sanitation and similar activities; recreational, cultural and sporting activities; and other service activities. |
| (8) | In May 2013, the NSCB revised GNI and net primary income figures for 2010 to 2013 to reflect updated data, particularly in relation to salaries of OFWs. As a result, estimates of GNI and net primary income presented in this table for 2010, 2011, 2012 and the first nine months of 2013 are not presented on the same basis as GNI and net primary income figures for 2008 and 2009. |
| (9) | Growth figures for GDP and GNI for the first nine months of 2013 represent period-on-period comparisons to the first nine months of 2012. |
| (10) | The growth figure for GNI for 2010 represents a year-on-year comparison of the 2010 GNI figure reported prior to the May 2013 revision and thus is not presented on the same basis as the 2010 GNI figure. |
The following table shows the percentage distribution of the Republic’s GNI by expenditure at constant 2000 prices.
| | | | | | | | | | | | | | | | | | | | | | | | |
| | | Distribution of Gross National
Income by Expenditure
(at constant market prices)(1) | |
| | | 2008 | | | 2009 | | | 2010 | | | 2011 | | | 2012 | | | 2013(2) | |
| | | (%) | |
Household final consumption expenditure | | | 56.6 | | | | 54.6 | | | | 57.6 | | | | 59.2 | | | | 59.3 | | | | 57.1 | |
Government consumption | | | 7.5 | | | | 7.8 | | | | 8.3 | | | | 8.3 | | | | 8.7 | | | | 9.8 | |
Capital formation | | | | | | | | | | | | | | | | | | | | | | | | |
Fixed capital | | | 15.3 | | | | 14.2 | | | | 17.3 | | | | 16.5 | | | | 15.6 | | | | 17.8 | |
Changes in inventories | | | (0.4) | | | | (1.3) | | | | 0 | | | | 0.6 | | | | 1.5 | | | | 1.3 | |
| | | | | | | | | | | | | | | | | | | | | | | | |
Total capital formation | | | 14.9 | | | | 12.9 | | | | 17.3 | | | | 17.1 | | | | 17.1 | | | | 16.5 | |
Exports | | | 39.3 | | | | 34.1 | | | | 42.1 | | | | 39.8 | | | | 40.7 | | | | 40.6 | |
Imports | | | 38.9 | | | | 33.7 | | | | 42.1 | | | | 40.5 | | | | 40.1 | | | | 40.4 | |
Statistical discrepancy | | | 0 | | | | 0 | | | | 0 | | | | 0 | | | | 0 | | | | 0 | |
| | | | | | | | | | | | | | | | | | | | | | | | |
Total | | | 100.0 | | | | 100.0 | | | | 100.0 | | | | 100.0 | | | | 100.0 | | | | 100.0 | |
| | | | | | | | | | | | | | | | | | | | | | | | |
Source: National Statistical Coordination Board.
Notes:
| (1) | Based on constant 2000 prices. |
| (2) | Preliminary data for the first nine months of 2013. |
Periodic Revisions to Philippine National Accounts
The National Statistical Coordination Board (the “NSCB”) releases quarterly data on the Republic’s national accounts, which include GDP and GNI data. Under NSCB policy, GDP and GNI data for a particular quarter are revised the following quarter, while annual data are released together with first quarter data and are revised thereafter in May of each year. GDP and GNI estimates are considered “final” after three years. However, the NSCB may still revise the “final” estimates whenever it undertakes an overall revision of the national accounts.
41
Revisions in the Republic’s national accounts are normally due to the availability of new or more complete data, receipt of revised data from original sources, and inclusion or exclusion of emerging or closed industries. The NSCB has traditionally followed the 1968 revision of the United Nations System of National Accounts. Currently, the Republic’s national accounts incorporate to a large extent the recommendations of the most recent 2008 revision.
In May 2013, the NSCB revised GNI and net primary income figures for 2010 to 2013. These revisions were part of the NSCB’s periodic updates of the Republic’s National Income Accounts in response to new data, in particular the latest data from the Philippine Overseas Employment Agency in relation to compensation inflow, which include salaries from OFWs. As a result, estimates of GNI and net primary income for 2010, 2011, 2012 and the first nine months of 2013 presented in this prospectus and any prospectus supplement are not presented on the same basis as GNI and net primary income figures for 2008 and 2009.
Principal Sectors of the Economy
Agriculture, Hunting, Forestry and Fishing Sector
The agriculture, hunting, forestry and fishing sector contributed approximately 11.1% to GDP in 2012 compared to approximately 12.8% to GDP in 2008, at constant market prices.
The Republic’s principal agricultural products include cereals, such as rice and corn, both of which are cultivated primarily for domestic use, and other crops, such as coconuts, sugar cane and bananas, produced for both the domestic market and export. The Philippines’ diverse agricultural system contains many coconut plantations farmed by agricultural tenants and workers, sugar haciendas farmed either under labor administration or by tenants, and large “agro-business” plantations devoted mainly to crops for export such as bananas and pineapples. Rice, corn and coconuts each accounts for approximately a quarter of the country’s cultivated area. Fishing production is divided into commercial, municipal and aquaculture fishing.
The country’s forests, one of the Philippines’ main natural resources, contain a large quantity of hardwood trees. Over the years, population growth, shifting cultivation, illegal logging and inadequate reforestation have depleted the forests, leading to a Government-imposed ban in 1991 on nearly all logging activity in virgin forests.
In 2009, the agriculture, hunting, forestry and fishing sector contracted by 0.7%, compared to growth of 3.2% in the previous year. Increases in fishing, poultry, livestock, banana, corn and coconut production were offset by decreases in the production of rice, other crops, sugarcane and forestry. The decreases in the production of agricultural crops, particularly rice, were due mainly to unfavorable weather conditions as a result of a tropical storm and typhoons.
Production in the agriculture, hunting, forestry and fishing sector contracted by 0.2% in 2010, compared with a decline of 0.7% in 2009. The contraction was due mainly to contractions in the production of rice, corn and sugar, which offset growth in other crops, poultry and livestock. Rice production declined by 2.4% in 2010, compared to a 1.2% contraction in 2009. The decline in rice production in 2010 was due to unfavorable weather conditions in certain major rice producing regions. As a result of El Niño, corn production declined by 8.9% in 2010, compared to a 1.4% growth in 2009. The fishing subsector contracted by 0.5% in 2010, a reversal from the 3.0% growth in 2009.
Production in the agriculture, hunting, forestry and fishing sector, which comprised approximately 11.5% of total GDP in 2011, grew by 2.6% in 2011, compared with a contraction of 0.2% in 2010. This reversal was due mainly to increased production of rice, sugarcane and corn. Rice production increased by 5.9% in 2011, compared to a contraction of 2.4% in 2010, due to the expansion and recovery of harvest areas from the adverse effects of the El Niño phenomenon in 2010. Sugarcane production increased by 59.7% in 2011, compared to a contraction of 15.7% in 2010, due to increased milling operations, demand for centrifugal sugar and
42
improvements in the area harvested. These higher levels of production were partially offset by a 4.1% contraction in the fishing subsector in 2011, compared to a contraction of 0.5% in 2010, due to lower production of commercial and municipal fisheries products as a result of poor weather conditions in certain regions and higher fuel costs. Coconut production also declined by 1.7% in 2011, compared to a contraction of 0.6% in 2010, as a result of lower harvests. Forestry production grew by 40.5% in 2011, compared to a contraction of 31.3% in 2010.
Production in the agriculture, hunting, forestry and fishing sector grew by 2.8% in 2012, compared with growth of 2.6% in 2011. The increased growth in 2012 was largely the result of an increase in growth in rice production to 8.0% in 2012 compared to 5.9% in 2011. The contraction in coconut production of 1.7% in 2011 was reversed to 3.9% growth in 2012. Similarly, the contraction in other crops of 3.9% in 2011 was reversed to 1.5% growth in 2012. Growth in pineapple production also increased to 7.1% in 2012 compared to 3.2% growth in 2011. These increases were partially offset by a decrease in sugarcane production, from growth in 2011 of 59.7% to a contraction in 2012 of 8.7%. Growth in corn production also decreased from growth of 9.5% in 2011 to 6.3% growth in 2012.
Preliminary data indicate that growth in production in the agriculture, hunting, forestry and fishing sector decreased to 1.1% growth during the first nine months of 2013, compared to 2.0% growth during the first nine months of 2012. The lower growth was largely due to a contraction in rice production of 1.1% during the first nine months of 2013, a reversal of the 6.9% growth in the first nine months of 2012. Banana production decreased from 1.9% growth in the first nine months of 2012 to a 7.9% contraction during the same period in 2013. Growth in corn production also decreased from 7.5% growth in the first nine months of 2012 to 0.4% growth in the first nine months of 2013. Partially offsetting these trends was a partial recovery in sugarcane production, from a contraction of 18.0% in the first nine months of 2012 to a contraction of 6.9% in the first nine months of 2013. Growth in other crops also increased, from 1.1% in the first nine months of 2012 to 2.4% in the first nine months of 2013.
Industry Sector
The industry sector consists of the mining and quarrying, manufacturing, construction, and electricity, gas and water supply subsectors. The industry sector contributed approximately 32.0% to GDP in 2012, compared to approximately 32.4% in 2008, at constant market prices.
In 2009, the industry sector contracted by 1.9%, compared to growth of 4.8% in 2008, due mainly to contractions in the manufacturing and the electricity, gas and water supply subsectors. The manufacturing subsector contracted by 4.8% in 2009, compared to growth of 4.3% in 2008, due mainly to a contraction in the manufacture of petroleum products. The production of petroleum products decreased largely due to weak external and domestic demand largely as a result of the global financial crisis. The electricity, gas and water supply subsector contracted by 0.9% in 2009, compared to growth of 6.8% in 2008, primarily due to a contraction in power consumption of the industrial sector reflecting the continued impact of the global financial crisis on the operations of companies in the manufacturing subsector. Contractions in these subsectors of the industry sector in 2009 were partially offset by growth in the construction and mining and quarrying subsectors. The construction subsector grew by 6.8% in 2009, compared to 7.0% growth in 2008, primarily due to the implementation of the fiscal stimulus program by the Government, which resulted in increased public construction spending in the first half of the year. The mining and quarrying subsector grew by 16.1% in 2009, compared to a contraction of 1.4% in 2008, primarily due to a global increase in demand for metals and minerals, a corresponding increase in prices for metals in the international market and the completion of six new mining projects in the second half of 2009.
In 2010, the industry sector grew by 11.6%, a reversal from a contraction of 1.9% in 2009, due mainly to strong growth in the manufacturing subsector. The manufacturing subsector grew by 11.2% in 2010, compared to a contraction of 4.8% in 2009, largely as a result of increased production of radio, television and communications
43
equipment, food products, chemical products, electrical machinery, petroleum and coal products and other miscellaneous manufactured products. As major economies began to recover from the global financial crisis, increased demand for semiconductors bolstered the Republic’s exports. Domestic improvements in private consumption, consumer confidence and OFW remittances also contributed to growth in the manufacturing subsector. The construction subsector grew by 14.3% in 2010, compared to growth of 6.8% in 2009. The continued growth in the construction subsector in 2010 was mainly the result of increases in private construction brought about by renewed investor confidence, which resulted in increased infrastructure projects. The electricity, gas and water supply subsector grew by 9.9% in 2010, compared to a contraction of 0.9% in 2009, as a result of stable consumption and strong demand from commercial users. The mining and quarrying subsector grew by 11.4% in 2010, compared to growth of 16.1% in 2009. This continued growth was due to increased production of nickel and non-metallic minerals. This increased production was largely due to the commencement of commercial operations of several metallic mines and increased production of existing mines in response to higher prices of metals and minerals in the global market.
In 2011, the industry sector, which comprised approximately 32.0% of total GDP in 2011, grew by 1.8%, compared with growth of 11.6% in 2010. The slower rate of growth was primarily attributable to a decline in public construction in the first three quarters of 2011 because of delays in the implementation of key infrastructure projects due to stricter project reviews and policy reforms, along with slower growth in private construction compared to the increased rate of growth in 2010. These factors resulted in a 9.8% contraction in construction in 2011 compared to growth of 14.3% in 2010. The manufacturing subsector grew by 4.7% in 2011, compared to growth of 11.2% in 2010. Growth in the manufacturing subsector was primarily the result of growth in the production of beverages, chemical and chemical products, paper and paper products and rubber and plastic products, which was partially offset by contractions in the production of tobacco, footwear, leather and leather products. The electricity, gas and water supply subsector grew by 0.6% in 2011, compared to growth of 9.9% in 2010, as a result of decreases in electricity, water and geothermal energy production. Production in electricity, water and geothermal energy decreased because of supply constraints and a maintenance-related shutdown of the Malampaya natural gas pipeline in October 2011. The mining and quarrying subsector grew by 7.0% in 2011, compared to growth of 11.4% in 2010. The growth in the subsector was largely due to an increase in production in the mining and production of other metals, crude oil, natural gas and condensate, which was partially offset by a contraction in stone quarrying and sand pits production. The increase in production of other metals, crude oil, natural gas and condensate was largely due to the commencement of operations of new mining projects.
In 2012, the industry sector grew by 6.8%, compared with growth of 1.8% in 2011. The growth in the industry sector was primarily due to the reversal of the contraction in the construction subsector, from a 9.8% contraction in 2011 to growth of 15.7% in 2012. Growth in construction was primarily due to an increase in the rate of private construction, including residential and non-residential. The increase was also due to growth in public construction. Public construction increased due to early budget releases to various departments of the Government in response to the efforts of the Government to accelerate the implementation of infrastructure projects. The rate of growth in manufacturing also increased to 5.4% in 2012, from growth of 4.7% in 2011. Growth in the manufacturing subsector was largely attributable to an increase of 7.6% in the production of food products as well as several export-oriented products such as an increase of 35.7% in furniture and fixtures, 41.4% in wearing apparel and 15.2% in non-metallic mineral products. These factors were partially offset by an 18.9% contraction in basic metal industries as well as a 1.7% contraction in radio, television and communication equipment and apparatus. Growth in the electricity, gas and water supply subsector increased to 5.1% in 2012 from growth of 2.6% in 2011. This increased rate of growth was largely due to an increase of 4.8% in electricity generation as well as a 7.2% increase in water production. Production in these areas increased because of higher demand from households, industrial processing zones and business processing outsourcing centers. In addition, accelerated capital spending of the Maynilad Water Company resulted in a significant expansion of coverage that led to an increase in the gross billed volume of water. The increased growth in the industry sector was partially offset by lower growth in the mining and quarrying subsector, from 11.1% in 2011 to 2.2% in 2012. Growth in mining and quarrying was due primarily to contractions in gold mining and crude oil, natural gas and condensate.
44
Preliminary data indicate that the industry sector grew by 9.8% in the first nine months of 2013, compared with growth of 6.1% in the first nine months of 2012. The increase was mainly due to growth in the manufacturing subsector of 9.8% in the first nine months of 2013 compared with growth of 5.4% in the first nine months of 2012. The increased growth in manufacturing was primarily due to increased growth in the chemical and chemical products subsector, which grew at 84.8% in the first nine months of 2013 compared to 4.6% in the first nine months of 2012. Radio, television and communication equipment and apparatus and basic metal industries both reversed contractions of 5.7% and 27.0%, respectively, in the first nine months of 2012 to growth of 11.3% and 64.0%, respectively, in the first nine months of 2013. Growth in the construction subsector also increased to 16.3% in the first nine months of 2013 from 10.5% in the first nine months of 2012. This increase was primarily due to growth in private construction, including residential and non-residential, as well as growth in public construction. The increases in construction and manufacturing were partially offset by a contraction of 2.0% in the mining and quarrying subsector in the first nine months of 2012 compared to 2.0% growth in the first nine months of 2013, as well as lower growth in the electricity, gas and water production subsector of 4.4% in the first nine months of 2013, compared to 5.6% in the first nine months of 2012.
Manufacturing Subsector
The Republic’s manufacturing subsector comprises three major industry groups:
| | • | | consumer goods, including the food, footwear and garment industries; |
| | • | | intermediate goods, including the petroleum, chemical and chemical product industries; and |
| | • | | capital goods, including the electrical machinery and electronics industries. |
The following table presents, at constant 2000 market prices, the gross value added, which equals the value of sales minus the cost of raw material and service inputs, for the manufacturing sector by industry or industry group.
| | | | | | | | | | | | | | | | | | | | | | | | |
| | | Gross Value Added in Manufacturing by Industry Group
(at constant market prices)(1) | |
| | | 2008 | | | 2009 | | | 2010 | | | 2011 | | | 2012 | | | 2013(2) | |
| | | (Peso in millions) | |
Food manufacturing | | | 447,843 | | | | 467,301 | | | | 479,445 | | | | 494,349 | | | | 531,704 | | | | 388,023 | |
Beverage industries | | | 50,102 | | | | 46,051 | | | | 50,133 | | | | 58,743 | | | | 60,303 | | | | 40,853 | |
Tobacco manufacturing | | | 10,861 | | | | 10,952 | | | | 5,968 | | | | 4,844 | | | | 4,675 | | | | 3,107 | |
Textile manufacturing | | | 35,392 | | | | 29,199 | | | | 31,472 | | | | 30,763 | | | | 30,102 | | | | 20,805 | |
Wearing apparel | | | 37,227 | | | | 29,346 | | | | 26,465 | | | | 27,976 | | | | 39,554 | | | | 25,242 | |
Footwear and leather and leather products | | | 7,795 | | | | 6,036 | | | | 5,634 | | | | 5,388 | | | | 6,269 | | | | 3,519 | |
Wood, bamboo, cane and rattan articles | | | 16,336 | | | | 13,984 | | | | 14,009 | | | | 12,788 | | | | 14,316 | | | | 8,164 | |
Paper and paper products | | | 11,215 | | | | 10,389 | | | | 12,347 | | | | 14,147 | | | | 13,592 | | | | 10,016 | |
Publishing and printing | | | 8,890 | | | | 8,470 | | | | 8,623 | | | | 8,140 | | | | 8,509 | | | | 5,138 | |
Petroleum and other fuel products | | | 59,751 | | | | 48,614 | | | | 55,869 | | | | 50,806 | | | | 48,790 | | | | 31,722 | |
Chemical and chemical products | | | 71,466 | | | | 67,851 | | | | 77,406 | | | | 91,401 | | | | 95,267 | | | | 116,831 | |
Rubber and plastic products | | | 16,385 | | | | 18,399 | | | | 20,297 | | | | 21,845 | | | | 22,516 | | | | 18,311 | |
Non-metallic mineral products | | | 27,196 | | | | 29,190 | | | | 32,058 | | | | 32,991 | | | | 38,010 | | | | 30,435 | |
Basic metal industries | | | 28,154 | | | | 23,252 | | | | 26,024 | | | | 25,869 | | | | 20,983 | | | | 25,616 | |
Fabricated metal products | | | 13,528 | | | | 11,983 | | | | 13,488 | | | | 14,391 | | | | 13,961 | | | | 10,274 | |
Machinery and equipment except electrical | | | 18,425 | | | | 16,291 | | | | 19,752 | | | | 19,908 | | | | 20,271 | | | | 16,274 | |
Office, accounting and computing machinery | | | 17,492 | | | | 15,821 | | | | 16,539 | | | | 17,362 | | | | 20,940 | | | | 15,987 | |
Electrical machinery and apparatus | | | 24,575 | | | | 22,932 | | | | 30,399 | | | | 32,515 | | | | 35,749 | | | | 25,987 | |
Radio, television and communication equipment and apparatus | | | 216,505 | | | | 186,810 | | | | 243,646 | | | | 242,616 | | | | 238,396 | | | | 214,124 | |
Transport equipment | | | 22,094 | | | | 24,554 | | | | 31,580 | | | | 29,565 | | | | 33,285 | | | | 18,023 | |
Furniture and fixtures | | | 18,937 | | | | 16,875 | | | | 20,185 | | | | 39,326 | | | | 53,346 | | | | 43,021 | |
| | | | | | | | | | | | | | | | | | | | | | | | |
Miscellaneous manufacturing | | | 34,753 | | | | 33,235 | | | | 43,186 | | | | 48,599 | | | | 45,176 | | | | 31,512 | |
| | | | | | | | | | | | | | | | | | | | | | | | |
Gross value added in manufacturing | | | 1,194,921 | | | | 1,137,534 | | | | 1,264,523 | | | | 1,324,330 | | | | 1,395,711 | | | | 1,102,984 | |
| | | | | | | | | | | | | | | | | | | | | | | | |
Sources: Economic and Social Statistics Office; National Statistical Coordination Board.
45
Notes:
| (1) | Based on constant 2000 prices. |
| (2) | Preliminary data for the first nine months of 2013. |
In 2009, the manufacturing subsector contracted by 4.8%, compared to growth of 4.3% in 2008. The reversal was mainly attributable to sluggish demand for manufactured exports as a result of the slowdown in the economic activities of the Republic’s trading partners.
The manufacturing subsector grew by 11.2% in 2010, compared to a contraction of 4.8% in 2009, as a result of stronger external trade and improvement in the domestic economy. Major contributors to manufacturing growth in 2010 were radio, television and communication equipment and apparatus, food manufacturing, chemical and chemical products, electrical machinery and apparatus, petroleum and other fuel products and miscellaneous manufacturing.
In 2011, the manufacturing subsector grew by 4.7%, compared to growth of 11.2% in 2010, primarily as a result of a 94.8% increase in furniture and fixtures, an 18.1% increase in chemical and chemical products, a 3.1% increase in food manufacturing and a 17.2% increase in beverage industries. These increases were partially offset by a 9.1% contraction in petroleum and other fuel products and a 6.4% contraction in transport equipment.
In 2012, the manufacturing subsector grew by 5.4%, compared with growth of 4.7% in 2011, primarily due to a 7.6% increase in food manufacturing, a 35.7% increase in furniture and fixtures, a 41.4% increase in wearing apparel and a 15.2% increase in non-metallic mineral products. These increases were partially offset by an 18.9% contraction in basic metal industries, a 1.7% contraction in radio, television and communication equipment and apparatus and a 7.0% contraction in miscellaneous manufacturing.
Preliminary data indicate that the manufacturing subsector grew by 9.8% in the first nine months of 2013, compared to growth of 5.4% in the first nine months of 2012, primarily as a result of an 84.8% increase in chemical and chemical products, an 11.3% increase in radio, television and communication equipment and apparatus and a 64.0% growth in basic metal industries. These increases were partially offset by a 12.0% contraction in wearing apparel and a 25.8% contraction in transport equipment.
Service Sector
The service sector includes the transport, storage and communications; trade and repair of motor vehicles, motorcycles, personal and household goods; financial intermediation; real estate, renting and business activities; public administration and defense, compulsory social security; and other services subsectors. The service sector remains the largest contributor to GDP, having contributed 57.1% to GDP at constant market prices in 2012, an increase from 55.9% in 2008.
In 2009, the service sector grew by 3.4% compared to 4.0% growth in 2008, largely as a result of the impact of the global financial crisis. The slower growth was primarily the result of a contraction in the transport, storage and communications subsector and slower growth in the real estate, renting and business activities subsector. The real estate, renting and business activities subsector grew by 4.1% in 2009, compared to growth of 9.0% in 2008. The slower growth rate in 2009 was primarily due to an 8.2% decline in the real gross value added of real estate. The real gross added value of real estate declined due to reduced business activities as a result of the global financial crisis. The transport, storage and communications subsector contracted by 0.1% in 2009, compared to 3.9% growth in 2008. The contraction in this subsector was attributable to the decline in the growth of water transport by 20.0%, which also affected the other services subsector. Growth in the service sector in 2009 was attributable principally to growth in the other services, real estate, renting and business activities, financial intermediation and public administration and defense, compulsory social security subsectors. The other services subsector grew by 6.5% in 2009, compared to growth of 6.0% in 2008, due to growth in recreational, cultural and sporting activities. The financial intermediation
46
subsector grew by 5.5% in 2009, compared to 1.8% growth in 2008, driven mainly by increased bank lending supported by lower interest rates in the Republic. The public administration and defense, compulsory social security subsector grew by 6.1% in 2009, compared to 2.0% growth in 2008, primarily due to the stimulus program implemented by the Government in response to the global financial crisis.
The service sector grew by 7.2% in 2010, compared with growth of 3.4% in 2009, due mainly to growth in the trade and repair of motor vehicles, motorcycles, personal and household goods, other services, real estate, renting and business activities and financial intermediation subsectors. The trade and repair of motor vehicles, motorcycles, personal and household goods subsector grew by 8.4% in 2010, compared to growth of 1.4% in 2009, due mainly to growth in retail and wholesale trade. The other services subsector grew by 8.4% in 2010, compared to growth of 6.5% in 2009, due mainly to growth in recreational services, which include the broadcast media. Hotel and restaurant services, education, health and social work services also contributed to growth in the other services subsector. The real estate, renting and business activities subsector grew by 7.5% in 2010, compared to growth of 4.1% in 2009, primarily due to growth in renting and other business activities. The financial intermediation subsector grew by 10.1% in 2010, compared to growth of 5.5% in 2009. The increased rate of growth in these subsectors was partially offset by a slower growth rate in the public administration and defense, compulsory social security subsector, which grew by 5.8% in 2010, compared to growth of 6.1% in 2009. The slower growth in the public administration and defense, compulsory social security subsector in 2010 was due to the Government’s adoption of expenditure control mechanisms to manage the deficit.
The service sector grew by 4.9% in 2011, compared with growth of 7.2% in 2010. The lower growth was due mainly to lower growth in the trade and repair of motor vehicles, motorcycles, personal and household goods, financial intermediation and public administration and defense, compulsory social security subsectors. The real estate, renting and business activities subsector grew by 8.4% in 2011, compared with growth of 7.5% in 2010, mainly due to the continued expansion of real estate and renting activities. The transport, storage and communication subsector grew by 4.3% in 2011, compared to growth of 1.0% in 2010, due mainly to growth in communication services, storage services and land transport. Growth in these subsectors was partially offset by slower growth of 3.3% in the trade and repair of motor vehicles, motorcycles, personal and household goods subsector in 2011, compared with growth of 8.4% in 2010, as a result of a contraction in wholesale trade and in the maintenance and repair of motor vehicles, motorcycles, personal and household goods. Production in the wholesale trade and in the maintenance and repair of motor vehicles, motorcycles, personal and household goods subsectors contracted as a result of reduced demand for exports and imports. The financial intermediation subsector also experienced a slower growth rate of 5.2% in 2011, compared to growth of 10.1% in 2010. The slower growth rate was primarily the result of slower growth in banking institutions of 1.7% in 2011 compared with 11.6% growth in 2010. The growth of banking institutions slowed due to sustained industry consolidations. In addition, the public administration and defense, compulsory social security subsector only grew by 1.9% in 2011, compared to growth of 5.8% in 2010. This slower rate of growth was primarily due to increases in maintenance and operations expenditures and the release of the third tranche of salary increases mandated by the Salary Standardization Law III.
The service sector grew by 7.6% in 2012, compared to growth of 4.9% in 2011. The increased growth was due mainly to increased production in the trade and repair of motor vehicles, motorcycles, personal and household goods, transportation, storage and communication and other services subsectors. The trade and repair of motor vehicles, motorcycles, personal and household goods subsector grew by 7.5% in 2012, an increase from growth of 3.4% in 2011, mainly due to growth of 7.8% in retail trade and, to a lesser extent, growth of 6.2% and 7.3%, respectively, in wholesale trade and maintenance and repair of motor vehicles, motorcycles, personal and household goods. Growth in the transportation, storage and communication subsector increased to 8.1% in 2012, compared to 4.3% in 2011. Increased growth was due primarily to an 8.0% increase in communication services, as well as an 8.2% growth in land transport and storage. The other services subsector grew by 7.7% in 2012, compared to growth of 5.6% in 2011, due mainly to increased growth in recreational, cultural and sporting activities and other service activities to 16.6% and 18.6%, respectively, in 2012, compared to 6.0% and 0.4%, respectively, in 2011. These trends were offset in part by lower growth in education of 1.7% in 2012, compared
47
to 4.2% in 2011. The increased growth in the other services subsector was partially offset by lower growth in the real estate, renting and business activities subsector, to 7.5% in 2012, compared with growth of 8.4% in 2011.
Preliminary data indicate that the service sector grew by 7.3% in the first nine months of 2013, which was lower than the 8.0% growth in the first nine months of 2012. The lower growth was largely due to a decrease in growth in the transportation, storage and communication subsector from 9.4% in the first nine months of 2012 to 5.3% in the first nine months of 2013, as well as lower growth in the other services subsector of 5.7% in the first nine months of 2013, compared to 8.5% in the first nine months of 2012. The decrease growth in the transportation, storage and communication subsector was primarily driven by contractions in both water and air transport and storage, while the lower growth in other services was due primarily to lower growth of 10.0% in recreational, cultural and sporting activities in the first nine months of 2013, compared to 20.2% in the first nine months of 2012. Growth in health and social work also decreased to 3.2% in the first nine months of 2013, compared to growth of 12.9% in the first nine months of 2012. These factors were largely offset by increased growth in the financial intermediation and real estate, renting and business activities subsectors to 13.3% and 9.3%, respectively, in the first nine months of 2013 from 8.0% and 7.9%, respectively, in the first nine months of 2012.
Transport, Storage and Communications Subsector
The geographically diverse nature of the Philippines makes it important to have well developed road, air and sea transportation systems. The Government has encouraged the private sector to provide basic transportation services and strengthen inter-regional and urban links. During the term of then President Arroyo, significant transportation projects included the Metro Rail Transit Project, the Metro Manila Skyway Project, the Manila-Cavite Expressway Project, the South Luzon Expressway Extension, the opening of the Iloilo International Airport and the opening of the Subic Bay Port.
The Philippine road network is the most important transportation system in the nation, spanning more than 220,000 kilometers. Over 7.1 million vehicles use the road network, including over 3.9 million vehicles for public use, principally in Metro Manila. Traffic remains congested in the National Capital Region, despite traffic management and various engineering measures. To ease traffic congestion, the Government has built and continues to promote alternative road networks and mass rapid urban-transit-rail.
Use of Philippine rail facilities has declined largely because of the outdated facilities of the Philippine National Railways. To promote the use of rail facilities, the Government has constructed a three line light-rail transit system in Metro Manila, financed by a build, lease and transfer arrangement, and has plans to construct additional lines and extensions of existing lines.
Ten international airports and over 70 other facilities throughout the Republic help meet the Republic’s air transport needs. The Government plans to upgrade several major airports to international standards and generally to modernize air navigation and communications operations in the Republic.
The regulatory policy during the past decade has been to open the industry to competition, ensuring lower cargo passage rates and improving the quality of service. Among the significant transportation projects pursuant to President Aquino’s Public-Private Partnership program, 10 transportation projects were identified as priority projects which were implemented beginning in 2011. These include, among others: the NAIA Expressway (Phase II), which will link the Metro Manila Skyway and the Manila-Cavite Coastal Expressway; the LRT Line 2 East Extension; the MRT/LRT Expansion Program; the Bohol Airport project; and the upgrade to international standards of the existing Puerto Princesa Airport.
Faced with historical shortages of telephone lines and long waits for basic telephone service, especially outside Metro Manila, the Government liberalized the telecommunications industry in 1993 to intensify competition with the goal of substantially increasing the number of telephone lines and interconnections. The Government has continued to implement programs designed to provide telephone lines, exchanges and transmission facilities to underserved regions of the country.
48
Net Primary Income
Net primary income, known as “net factor income from abroad” prior to 2011, is a component of GNI but is not included in GDP. Net primary income is a significant factor in the Philippine economy, largely driven by OFW remittances. Net primary income includes estimates of the amount of compensation of OFWs, as well as investment income of OFWs from their properties. According to the latest figures from the National Statistical Coordination Board for years 2008, 2009, 2010, 2011 and 2012 and for the first nine months of 2013, net primary income accounted for 14.4%, 17.2%, 16.8%, 16.1%, 15.8%, and 15.9% of GNI, respectively.
In 2009, net primary income grew by 25.0%, compared to growth of 8.4% in 2008. The increased rate of growth of net primary income was due mainly to increased OFW remittances, which was partially offset by a decline in property income.
In 2010, net primary income grew by 10.0% compared to 25.0% growth in 2009. The decreased rate of growth was primarily due to decreased growth in compensation of 8.8%, compared to growth of 24.8% in 2009. This was partially offset by a contraction in property expenses by 8.4%, compared to growth of 3.7% in 2009.
In 2011, net primary income contracted by 1.6%, compared to growth of 4.2% in 2010. The contraction was the result of a decrease in compensation combined with the 12.2% growth in property expense, which more than offset increases in property income in 2011.
In 2012, net primary income grew 4.8%, compared to a contraction of 1.6% in 2011, due to an increase in inflows, mainly a 6.9% increase in compensation, partially offset by 16.8% growth in property expense.
Preliminary data indicate that in the first nine months of 2013, net primary income grew by 6.7%, compared to growth of 5.5% in the first nine months of 2012. This increase was primarily due to a contraction of 18.1% in property expense during the first nine months of 2013.
Prices, Employment and Wages
Inflation
The Philippines reports inflation as the annual percentage change in the consumer price index (“CPI”), which measures the average price of a standard “basket” of goods and services used by a typical consumer. The NSO conducts a nationwide Family Income and Expenditure Survey every three years. Although the Government previously reported inflation figures based on both the 2000 CPI basket and the 2006 CPI basket, the 2006 CPI basket has been the official measure for inflation since January 2012.
The following table sets out the principal components of the 2006 CPI basket and their weights.
Principal Components of the 2006 CPI Basket
| | | | |
Category | | 2006
CPI Basket | |
Food and non-alcoholic beverages, total | | | 39.0 | % |
Rice | | | 8.9 | % |
Alcoholic beverages and tobacco, total | | | 2.0 | % |
Non-food, total | | | 59.0 | % |
Clothing and footwear | | | 3.0 | % |
Housing, water, electricity, gas and other fuels | | | 22.5 | % |
Furnishings, household equipment and routine maintenance of the house | | | 3.2 | % |
Health | | | 3.0 | % |
Transport | | | 7.8 | % |
Communication | | | 2.3 | % |
Recreation and culture | | | 1.9 | % |
Education | | | 3.4 | % |
Restaurants and miscellaneous goods and services | | | 12.0 | % |
49
The following table sets out the CPI (based on the 2006 CPI basket) and the manufacturing sector’s equivalent, the producer price index (“PPI”), as well as the annual percentage changes in each index.
Changes in Consumer and Producer Price Index
| | | | | | | | | | | | | | | | | | | | | | | | |
| | | 2008 | | | 2009 | | | 2010 | | | 2011 | | | 2012 | | | 2013(1) | |
Consumer price index | | | 111.4 | | | | 116.1 | | | | 120.5 | | | | 126.1 | | | | 130.1 | | | | 135.0 | |
Inflation rate | | | 8.3 | % | | | 4.2 | % | | | 3.8 | % | | | 4.6 | % | | | 3.2 | % | | | 2.8 | %(2) |
Producer price index for manufacturing(3) | | | 175.2 | | | | 172.9 | | | | 164.3 | | | | 165.9 | | | | 164.9 | | | | 151.3 | |
Inflation rate | | | 4.1 | % | | | (1.4 | )% | | | (4.9 | )% | | | 0.9 | % | | | 0.9 | % | | | (8.3 | )% |
Source: National Statistics Office.
Notes:
| (1) | As of or for the nine months ended September 30, 2013, unless otherwise indicated. |
| (2) | For the 10 months ended October 31, 2013. |
| (3) | Based on the 2000 CPI basket. |
The average inflation rate for 2009 was 4.2%, lower than the average inflation rate of 8.3% in 2008. In 2009, inflation among food items was lower than it was in the prior year as a result of improvement in global and domestic supply conditions. Additionally, price gains among domestic petroleum products were more limited than those that occurred in 2008.
The average inflation rate for 2010 was 3.8%, lower than the average inflation rate of 4.2% in 2009. The primary inflationary pressures in 2010 were increases in the prices of housing, water, electricity, gas and other fuels and transport, mainly due to increases in the prices of petroleum-related products.
The average inflation rate for 2011 was 4.6%, higher than the average inflation rate of 3.8% in 2010. All major commodity groups, except health and communications, registered higher annual prices. Additionally, as a result of weather-related disturbances in September and October of 2011, prices of food items also increased.
The average inflation rate for 2012 was 3.2%, lower than the average inflation rate of 4.6% in 2011. The lower average rate of inflation in 2012 was mainly due to limited increases in the prices of food and non-alcoholic beverages and health as compared with 2011. Adequate domestic food supply was largely responsible for moderating increases in food prices.
The average inflation rate in the first 10 months of 2013 was 2.8%, which was lower than the 3.2% recorded in the same period in 2012. This decrease was mainly due to lower production of consumer goods, such as non-food items, particularly oil and energy.
The PPI for the manufacturing sector was 151.3 as of September 30, 2013, compared to 164.9 at the end of 2012, driven by deceleration of producer prices in the majority of economic sectors, including food, furniture and fixtures, and metals and machineries.
50
Employment and Wages
The following table presents selected employment information for various sectors of the economy.
| | | | | | | | | | | | | | | | | | | | | | | | |
| | | Selected Employment Information | |
| | | 2008 | | | 2009 | | | 2010 | | | 2011 | | | 2012(1) | | | 2013(1)(2) | |
| | | (all figures in percentages except as indicated) | |
Labor force (in thousands)(3)(4) | | | 36,805 | | | | 37,891 | | | | 38,893 | | | | 39,691 | | | | 40,643 | | | | 41,178 | |
Unemployment rate | | | 7.4 | | | | 7.5 | | | | 7.3 | | | | 7.1 | | | | 7.0 | | | | 7.3 | |
Employment share by sector: | | | | | | | | | | | | | | | | | | | | | | | | |
Agriculture, hunting, forestry and fishing sector | | | 35.3 | | | | 34.3 | | | | 33.2 | | | | 33.0 | | | | 33.6 | | | | 31.3 | |
Industry sector | | | | | | | | | | | | | | | | | | | | | | | | |
Mining and quarrying | | | 0.5 | | | | 0.5 | | | | 0.6 | | | | 0.6 | | | | 0.7 | | | | 0.7 | |
Manufacturing | | | 8.6 | | | | 8.3 | | | | 8.4 | | | | 8.3 | | | | 8.3 | | | | 8.4 | |
Construction | | | 5.4 | | | | 5.4 | | | | 5.6 | | | | 5.6 | | | | 6.1 | | | | 6.6 | |
Electricity, gas and water supply | | | 0.4 | | | | 0.4 | | | | 0.4 | | | | 0.4 | | | | 0.2 | | | | 0.2 | |
| | | | | | | | | | | | | | | | | | | | | | | | |
Total industry sector | | | 14.8 | | | | 14.5 | | | | 15.0 | | | | 14.9 | | | | 15.5 | | | | 16.1 | |
Service sector | | | | | | | | | | | | | | | | | | | | | | | | |
Transport, storage and communications | | | 7.6 | | | | 7.6 | | | | 7.6 | | | | 7.5 | | | | 16.8 | | | | 7.2 | |
Trade and repair of motor vehicles, personal and household goods | | | 18.9 | | | | 19.2 | | | | 19.5 | | | | 19.9 | | | | 18.6 | | | | 18.2 | |
Finance and housing(5) | | | 3.9 | | | | 4.1 | | | | 4.3 | | | | 4.6 | | | | 6.7 | | | | 6.8 | |
Other services | | | 19.5 | | | | 20.2 | | | | 20.5 | | | | 20.2 | | | | 19.5 | | | | 20.4 | |
| | | | | | | | | | | | | | | | | | | | | | | | |
Total service sector | | | 49.9 | | | | 51.1 | | | | 51.8 | | | | 52.1 | | | | 51.6 | | | | 52.6 | |
| | | | | | | | | | | | | | | | | | | | | | | | |
Total employed | | | 100.0 | | | | 100.0 | | | | 100.0 | | | | 100.0 | | | | 100.0 | | | | 100.0 | |
| | | | | | | | | | | | | | | | | | | | | | | | |
Sources: Bureau of Labor and Employment Statistics—Current Labor Statistics; National Statistics Office—Labor Force Survey.
Notes:
| (1) | Employment figures by sector in 2012 and 2013 are not directly comparable to those of prior years since the NSO adopted the 2009 Philippine Standard Industry Classification beginning in the January 2012 round of the Labor Force Survey, which differs from previous surveys that used the 1994 standard. |
| (2) | Figures represent the result of the July 2013 round of the Labor Force Survey. |
| (3) | Does not include OFWs. |
| (4) | Figures generated using population projections based on the 2000 Census of Population and Housing. |
| (5) | Sum of financial intermediation, real estate, renting and business activities and public administration and defense, compulsory social security subsectors. |
As of July 2013, the labor force in the Republic, not including OFWs, totaled 41.2 million people. Workers in the Republic are employed primarily in the service sector, such as wholesale and retail trade and repair of motor vehicles, motorcycles and personal and household goods, comprising 53.4% of the total employed as of July 2013. As of the same date, Filipino workers in the agriculture, hunting, forestry and fishing sector comprised 30.9% of the total employed while the industry sector comprised 15.6% of the total employed. Most Filipinos employed in the industry sector worked in the manufacturing subsector, constituting approximately 52.6% of the total labor force.
Regional tripartite bodies consisting of representatives of Government, businesses and workers establish minimum wage adjustments, which vary based on region and industry. Under Philippine law, minimum wage adjustments may only be increased once in any 12-month period. The minimum wages for workers in Metro
51
Manila and the surrounding areas are the highest in the country. Currently, the minimum wage for non-agricultural workers in the Republic’s National Capital Region, which includes Metro Manila, is (Peso)466 per day, while for agricultural workers, the minimum wage is (Peso)429 per day. In other regions of the Republic, the minimum wage for non-agricultural workers ranges from (Peso)205 to (Peso)350 per day, while for agricultural workers the minimum wage ranges from (Peso)215 to (Peso)325 per day.
The Government defines unemployment to include all persons at least 15 years old without work who are seeking work and are also immediately available for work (excluding, for example, students seeking work who would not be able to immediately take on new employment).
The average rate of unemployment in 2009 was 7.5%, an increase from the 7.4% average unemployment rate in 2008. The service sector continued to employ the highest number of persons in 2009, accounting for 51.1% of the total workforce of approximately 37.9 million (excluding OFWs), followed by the 34.3% employed in the agriculture, hunting, forestry and fishing sector and 14.5% in the industrial sector. In the National Capital Region, the unemployment rate increased to 12.9% in 2009 from 12.2% in 2008, significantly higher than the national average.
In 2010, the labor force in the Republic, excluding OFWs, totaled approximately 38.9 million people. Workers in the service sector comprised 51.8% of the total workforce in the Republic, followed by the agriculture, hunting, forestry and fishing sector, which comprised 33.2% of the total workforce, and the industry sector, which comprised 15.0%. The average rate of unemployment in the Republic in 2010 was 7.3%, a decline from the 7.5% rate recorded in 2009.
In 2011, the labor force in the Republic, excluding OFWs, totaled approximately 39.7 million people. The average rate of unemployment in 2011 was 7.1%, a decrease from the 7.3% rate recorded in 2010. Workers in the Republic remained employed primarily in the service industries, such as wholesale and retail trade and repair of motor vehicles, motorcycles and personal and household goods. Workers in the service sector comprised 52.1% of the total employed in the Republic, followed by the agriculture, hunting, forestry and fishing sector, which comprised 33.0% of the total employed, and the industry sector, which comprised 14.9% of the total employed.
In 2012, the average unemployment rate decreased to 7.0%, compared to 7.1% in 2011. The total labor force in the Republic, excluding OFWs, in 2012 was estimated at 40.6 million people. As in previous years, the largest portion of the labor force was employed in the service sector, representing 51.6% of the total employed in the Republic. The largest subsectors in terms of employment included other services, which employed 19.5% of the labor force, and trade and repair of motor vehicles, personal and household goods, which employed 18.6% of the labor force. The agriculture, hunting, forestry and fishing sector and industry sector comprised 33.6% and 15.5%, respectively, of the total employed.
The total labor force in the Republic, excluding OFWs, was estimated at 41.2 million as of July 2013. The unemployment rate as of July 2013 had increased to 7.3%, compared to 7.0% as of the end of 2012. The largest portion of the labor force as of July 2013 remained employed in the service sector, which represented 53.4% of the total employed in the Republic. The largest subsectors in terms of employment included wholesale and retail trade or trade and repair of motor vehicles and motorcycles, which employed 35.2% of the labor force. The agriculture, hunting, forestry and fishing sector and industry sector comprised 30.9% and 15.6%, respectively, of the total employed.
As of July 2013, the proportion of those persons who were already working but still wanted additional work decreased slightly to 19.2% from 22.8% in July 2012, or approximately 7.3 million employed persons (approximately 8.57 million employed persons in July 2012).
52
The following table presents employment information in the Republic by gender and age group:
| | | | | | | | | | | | | | | | |
| | | Percentage Distribution of Household Population 15 Years Old and
over by Employment Status, by Gender and Age Group | |
| | | July 2013 | | | July 2012 | |
| Gender and Age Group | | Employed | | | Unemployed | | | Employed | | | Unemployed | |
Both sexes | | | | | | | | | | | | | | | | |
15 – 24 | | | 19.0 | % | | | 48.9 | % | | | 18.9 | % | | | 51.1 | % |
25 – 34 | | | 26.5 | % | | | 29.4 | % | | | 26.5 | % | | | 28.2 | % |
35 – 44 | | | 22.9 | % | | | 11.7 | % | | | 23.0 | % | | | 10.1 | % |
45 – 54 | | | 17.9 | % | | | 6.0 | % | | | 17.8 | % | | | 6.3 | % |
55 – 64 | | | 9.6 | % | | | 3.5 | % | | | 9.7 | % | | | 3.6 | % |
65 and over | | | 4.1 | % | | | 0.5 | % | | | 4.1 | % | | | 0.7 | % |
| | | | | | | | | | | | | | | | |
Total for all ages | | | 100.0 | % | | | 100.0 | % | | | 100.0 | % | | | 100.0 | % |
Male | | | | | | | | | | | | | | | | |
15 – 24 | | | 12.0 | % | | | 28.4 | % | | | 11.9 | % | | | 29.3 | % |
25 – 34 | | | 16.8 | % | | | 17.5 | % | | | 16.6 | % | | | 18.4 | % |
35 – 44 | | | 13.9 | % | | | 7.7 | % | | | 13.8 | % | | | 6.8 | % |
45 – 54 | | | 10.4 | % | | | 4.7 | % | | | 10.3 | % | | | 4.6 | % |
55 – 64 | | | 5.5 | % | | | 2.8 | % | | | 5.5 | % | | | 2.6 | % |
65 and over | | | 2.3 | % | | | 0.4 | % | | | 2.3 | % | | | 0.4 | % |
| | | | | | | | | | | | | | | | |
Total for all ages | | | 60.9 | % | | | 61.4 | % | | | 60.4 | % | | | 62.1 | % |
Female | | | | | | | | | | | | | | | | |
15 – 24 | | | 7.0 | % | | | 20.5 | % | | | 7.0 | % | | | 21.9 | % |
25 – 34 | | | 9.7 | % | | | 11.9 | % | | | 9.9 | % | | | 9.7 | % |
35 – 44 | | | 9.0 | % | | | 4.0 | % | | | 9.2 | % | | | 3.2 | % |
45 – 54 | | | 7.5 | % | | | 1.3 | % | | | 7.5 | % | | | 1.7 | % |
55 – 64 | | | 4.1 | % | | | 0.7 | % | | | 4.2 | % | | | 1.1 | % |
65 and over | | | 1.7 | % | | | 0.2 | % | | | 1.8 | % | | | 0.3 | % |
| | | | | | | | | | | | | | | | |
Total for all ages | | | 39.1 | % | | | 38.7 | % | | | 39.6 | % | | | 37.9 | % |
Source: National Statistics Office
As of July 2013, 48.9% of the total unemployed population consisted of young people aged 15 to 24 years old, lower than the 51.1% recorded as of July 2012. In terms of gender, the female population represented 39.1% and 38.7% of the employed and unemployed workforce, respectively, as of July 2013, whereas the male population represented 60.4% and 62.1% of the employed and unemployed workforce, respectively, as of July 2013.
The NSCB publishes statistics on poverty in the Republic measured in terms of a Government-determined per capita poverty threshold, which is the minimum income required for a family or individual to meet basic food and non-food requirements and a per capita subsistence threshold, which is the minimum income required for a family or individual to meet basic food requirements. According to the NSCB, the proportion of families with per capita income below the per capita poverty threshold decreased from 21.0% in 2006 to 20.5% in 2009 to 19.7% in 2012. The proportion of families with per capita income below the per capita subsistence threshold decreased from 8.8% in 2006 to 7.9% in 2009 to 7.5% in 2012. Among the factors contributing to income levels of families and individuals in the Republic falling below the poverty or subsistence thresholds during this period were rice price increases in 2008, the damage caused by Typhoons “Ketsana” and “Parma” in 2009, “Washi” in 2011 and “Bopha” in 2012 and the job losses and reduced wages caused by the global financial crisis in 2008 and 2009.
53
Overseas Employment
Global demand for Filipino workers continues to be strong. For the first seven months of 2013, approved job orders reached 495,304 jobs, of which 37.0% consisted of processed job orders for service, production, and professional, technical and related workers. The majority of processed job orders were intended for labor markets in Saudi Arabia, United Arab Emirates, Qatar, Kuwait and Taiwan.
Social Security System and Government Service Insurance System
The Republic does not pay any unemployment compensation or make any general welfare payments other than through the Social Security System and the Government Service Insurance System. The Social Security System provides private sector employees, including self-employed persons and their families, with protection against decreases in income due to disability, sickness, old age and death. Monthly contributions by covered employees and their employers, and investment income of the Social Security System, fund the system. The Social Security System invests its funds in Government securities and in domestic equity securities.
The Government Service Insurance System administers social security benefits for Government employees, including retirement benefits, life insurance, medical care and sickness and disability benefits. It also administers the self-insurance program for Government properties, such as buildings and equipment. The Government Service Insurance System also oversees loan programs, including housing loans for Government employees. Monthly contributions by covered employees and their employers fund the system. Government agencies must include in their annual appropriations the amounts needed to cover their share of the contributions and any additional premium required based on the hazardous nature of the work. The Government Service Insurance System invests its funds in a manner similar to the Social Security System.
Savings
The following table sets out gross national savings, total investment and the savings-investment gap as a percentage of GDP, as of December 31, 2010, 2011 and 2012.
| | | | | | | | | | | | |
| | | National Savings and Investments | |
Item | | 2010 | | | 2011 | | | 2012 | |
Gross national savings | | | 39.5 | % | | | 36.9 | % | | | 35.1 | % |
Gross domestic savings | | | 20.5 | % | | | 20.5 | % | | | 18.5 | % |
Foreign savings | | | 18.9 | % | | | 16.4 | % | | | 16.6 | % |
Investment | | | 20.5 | % | | | 20.5 | % | | | 18.5 | % |
Savings-investment gap | | | 18.9 | % | | | 16.4 | % | | | 16.6 | % |
Sources: National Statistical Coordination Board.
Balance of Payments
Overview
Balance of payments figures measure the relative flow of goods, services and capital into and out of the country as represented in the current account and the capital and financial account. The current account tracks a country’s trade-in-goods, services, income and current transfer transactions. The capital and financial account includes the capital account, which covers all transactions involving capital transfers and acquisition or disposal of non-produced, non-financial assets, and the financial account, which covers all transactions associated with changes of ownership in the foreign financial assets and liabilities of an economy. A balance of payments surplus indicates a net inflow of foreign currencies, thereby increasing demand for and strengthening the local currency. A balance of payments deficit indicates a net outflow of foreign currencies, thereby decreasing demand for and weakening the local currency.
54
Revisions
In the case of import data, revisions to data for 2009 were made in accordance with the recommendations of the Inter-agency Committee on Trade Statistics (which consists of representatives from Bangko Sentral, the NSO, NEDA, the Bureau of Customs, the Department of Trade and Industry, the Philippine Economic Zone Authority, and the NSCB), and included valuation adjustments of imports under consignment arrangements, particularly for electronics and garments, and other imports not covered in the foreign trade statistics of the NSO, such as remittances in kind. These adjustments resulted in a wider trade deficit that consequently reduced the current account balance. In the case of remittances, OFW remittance statistics for 2003 were revised to categorize OFWs into residents and non-residents in accordance with the one-year residency rule recommended in the IMF’s BPM5. Under the BPM5 methodology, the residency of seasonal workers, such as OFWs, is classified according to the length of their intended stay in the host country. Generally, OFWs who are expected to be working abroad for less than one year are classified as Philippine residents and their gross earnings are reflected under the income account. On the other hand, OFWs who are expected to be working abroad for one year or more are classified as non-residents and their remittances are reflected under the current transfers account. Moreover, the new estimation methodology takes into account cash remittances made by OFWs through informal channels, as well as remittances-in-kind. Calculation of these cash remittances and remittances-in-kind are based on data from the NSO’s Survey of Overseas Filipinos. Trade credits are based on surveys and external debt reports, rather than the previous method of deriving trade receivables and payables from data on goods shipments and payments. Other changes involve the use of new databases, such as administrative records of Government regulatory agencies, as well as records of international agencies.
The balance of payments statistics released by Bangko Sentral are based on the trade-in-goods statistics compiled by the NSO. However, for purposes of inclusion in the overall balance of payments, the trade-in-goods statistics reported by the NSO are adjusted by Bangko Sentral to exclude temporary exports and imports and returned goods. This adjustment is intended to bring the balance of payments results in line with the IMF’s BPM5. In March 2013, Bangko Sentral adopted the IMF’s BPM6 framework covering balance of payments statistics for 2011 onwards, pursuant to which the property income and expense accounts have been revised. To enable a comparison of the balance of payments transaction categories under both the BPM5 and BPM6 frameworks, Bangko Sentral has published balance of payments statistics through 2012 on both a BPM5 and BPM6 basis. Bangko Sentral plans full implementation of the BPM6 framework by 2014. The key changes from the BPM5 methodology to the BPM6 methodology include (i) changes in the classification of certain financial instruments such as monetary gold, employee stock options and insurance, pension and standardized guarantee schemes, (ii) changes in the classification of institutional sectors such as monetary authorities, banks, non-financial corporations and non-profit institutions, (iii) changes in certain components that comprise the current account such as goods, services, income and current transfers, (iv) changes in certain components that comprise the capital account and (v) changes in certain components that comprise the financial account.
Under BPM6, goods that are imported into the Philippines on a consignment basis for purposes of repair or improvement within the Philippines and then exported back to their country of origin such that no change in ownership occurs are recognized under the services account rather than the goods account. There have also been certain corresponding reclassifications of items from the services account to the goods account. The financial account under BPM6 is now stated on an asset and liability basis. Under BPM5, inflows and outflows to and from the financial account were recognized based on the residency of investors – non-residents investing within the Philippines or Philippine residents investing abroad. Under BPM6, Bangko Sentral reports the net acquisition of assets and net incurrence of liabilities.
In September 2009, along with the balance of payments data for the first half of 2009, Bangko Sentral released revisions to the balance of payments data for 2008. The revisions mainly consist of: (i) revision of the goods import and export figures to reflect adjustments made by the NSO; (ii) revision of investment income under the income account; and (iii) revision of portfolio investment and other investment assets to reflect the revised results of the Coordinated Portfolio Investment Survey. As a result of the revisions, goods exports
55
increased to $48.3 billion in 2008 from the $48.2 billion originally reported. Goods imports increased to $61.1 billion from the $60.8 billion originally reported. The deficit in investment income grew to $4.0 billion from the $3.9 billion deficit originally reported. The asset deficit under the portfolio investments decreased to a deficit of $789 million from a deficit of $1.0 billion originally reported; while the asset deficit under the other investment account increased from a deficit of $3.8 billion to $4.3 billion.
In September 2010, along with the balance of payments data for the first half of 2010, Bangko Sentral released revisions to the balance of payments data for 2009. The revisions consisted mainly of: (i) revision of goods import and export figures to reflect adjustments made by the NSO; (ii) revision of disbursements under the income account; (iii) revision of receipts and payments under the current transfers account; and (iv) revision of portfolio investment and other investment assets and liabilities to reflect the revised results of the Coordinated Portfolio Investment Survey. As a result of the revisions, goods exports increased to $37.6 billion in 2009 from the $37.5 billion originally reported, while goods imports increased to $46.5 billion from the $46.3 billion originally reported. Disbursements under the income account increased to $5.9 billion from the $5.8 billion originally reported. Receipts under the current transfers account increased to $16.7 billion from the $16.6 billion originally reported, while disbursements under the current transfers account decreased to $623 million from the $677 billion originally reported. Assets under the portfolio investments account increased to $1.8 billion from the $0.9 billion originally reported, while liabilities under the portfolio investments account decreased to $2.1 billion from the $2.3 billion originally reported. Assets under the other investments account decreased to $2.0 billion from the $3.1 billion originally reported, while liabilities under the other investments account decreased to a deficit of $925 million from the deficit of $2.1 billion originally reported.
In March 2011, along with the balance of payments data for 2010, Bangko Sentral released revisions to the balance of payments data for 2009. These revisions consisted mainly of: (i) revisions of goods import figures to reflect adjustments made by Bangko Sentral’s International Operations Department; (ii) revisions of services export, import and net figures to reflect updates from the Civil Aeronautics Board, the Department of Tourism, the Insurance Commission and Bangko Sentral’s Department of Economic Statistics; (iii) revisions of payments under the income account to reflect final data from the International Operations Department and the Department of Economic Statistics; (iv) revisions of current transfers export, import and net figures to reflect data updates on grants to the Republic by the Organization for Economic Cooperation and Development (the “OECD”) and updates from the Insurance Commission; (v) revisions of direct investments (liabilities) to reflect revised data from the International Operations Department, the Department of Economic Statistics, Bangko Sentral’s Central Point of Contact Department and Integrated Supervision Department and the Philippine Stock Exchange; (vi) revisions of portfolio investments assets, liabilities and net figures to reflect final data from the Department of Economic Statistics and International Operations Department; and (vii) revisions of other investments assets, liabilities and net figures to reflect updates from the Bank for International Settlements and final data from the International Operations Department. As a result of the revisions, goods import decreased from $46.5 billion to $46.4 billion, services exports, imports and net increased from $10.2 billion, $8.7 billion and $1.5 billion, respectively, to $11.0 billion, $8.9 billion and $2.1 billion, respectively, payments under the income account increased from $5.7 billion to $5.9 billion, current transfers export, import and net increased from $16.7 billion, $623 million and $16.1 billion, respectively, to $16.9 billion, $631 million and $16.3 billion, respectively, direct investments (liabilities) increased from $1.9 billion to $2.0 billion, portfolio investments assets increased from $1.9 billion to $2.7 billion and portfolio liabilities and net decreased from $2.2 billion and $290 million, respectively, to $2.1 billion and $(625) billion, respectively, and other investments assets decreased from $2.2 billion to $2.0 billion and other investments liabilities and net increased from $(925) million and $(3.1) billion, respectively, to $(775) million and $(2.7) billion, respectively.
In September 2011, along with the balance of payments data for the first half of 2011, Bangko Sentral released revisions to the balance of payments data for 2010. These revisions consisted mainly of: (i) revisions of the current account, including total as a percentage of GNI and GDP to reflect revisions in the trade in goods, services, income and current transfers accounts; (ii) revisions of goods export and import figures to reflect updates from the NSO; (iii) revisions of services export, import and net figures to reflect updates from the
56
Department of Tourism, updated estimates concerning the BPO sector, updates concerning trade statistics from the NSO and updates on expenditures of resident OFWs; (iv) revisions of income receipt, payment and net to reflect revised treatment of hybrid tier 1 capital of banks and certain post-audit adjustments to investment income; (v) revisions of current transfers export, import and net figures to reflect data updates from the Department of Economic Statistics; (vi) revisions of portfolio investments assets, liabilities and net figures to reflect certain changes in data sources from Bangko Sentral to the Philippine Stock Exchange; and (vii) revisions of other investments assets, liabilities and net figures to reflect certain post-audit adjustments. As a result of the revisions, the current account increased from $8.5 billion to $8.9 billion, goods export increased from $50.7 billion to $50.8 billion and goods import and net decreased from $61.1 billion and $(10.4) billion, respectively, to $61.7 billion and $(11.0) billion, respectively, services export, import and net increased from $13.2 billion, $11.3 billion and $1.9 billion, respectively, to $14.4 billion, $11.4 billion and $2.9 billion, respectively, income payments decreased from $5.8 billion to $5.7 billion, current transfers receipts, payments and net experienced slight revisions, portfolio investments assets, liabilities and net increased from $3.4 billion, $7.5 billion and $4.0 billion, respectively, to $3.5 billion, $7.6 billion and $4.1 billion, respectively, and other investments assets and liabilities increased from $2.3 billion and $5.0 billion, respectively, to $3.0 billion and $5.1 billion, respectively.
In March 2012, along with the balance of payments data for 2011, Bangko Sentral released further revisions to the balance of payments data for 2010. These revisions consisted mainly of: (i) revisions of the current account, including total as a percentage of GNI and GDP to reflect revisions in the trade in services, income and current transfers accounts; (ii) revisions of services export, import and net figures to reflect certain post-audit adjustments and updated estimates from the BPO; (iii) revisions of payments under the income account to reflect additional data from financial statements of corporations, final data from the International Operations Department and reconciliation of data from the Philippine Stock Exchange; (iv) revisions of current transfers import figures to reflect data updates on grants to the Republic by the OECD and revised estimates of OFW remittances; (v) revisions of direct investments assets, liabilities and net to reflect additional data from financial statements of corporations and updates from the International Operations Department; (vi) revisions of portfolio investments assets, liabilities and net figures to reflect updated data from the Coordinated Portfolio Investment Survey and the International Operations Department; and (vii) revisions of other investments assets, liabilities and net figures to reflect updates from the Bank for International Settlements, certain post-audit adjustments in currency and deposits and final data from International Operations Department. As a result of the revisions, services exports, imports and net decreased from $14.4 billion, $11.4 billion and $3.0 billion, respectively, to $14.1 billion, $11.3 billion and $2.7 billion, respectively, payments under the income account decreased from $5.7 billion to $5.6 billion, current transfers export increased from $17.4 billion to $17.5 billion, direct investments assets increased from $487 million to $616 million and liabilities and net decreased from $1.7 billion and $1.2 billion, respectively, to $1.3 billion and $683 million, respectively, portfolio investments assets and liabilities decreased from $3.5 billion and $7.6 billion, respectively, to $2.9 billion and $7.2 billion, respectively, and portfolio investments net increased from $4.1 billion to $4.4 billion and other investments assets decreased from $3.0 billion to $2.8 billion and other investments liabilities and net increased from $5.1 billion and $2.1 billion, respectively, to $5.2 billion and $2.4 billion, respectively.
In March 2013, along with the balance of payments data for 2012, Bangko Sentral released revisions to the balance of payments data for 2011. These revisions consisted mainly of: (i) revisions of the current account to reflect revisions in the trade in goods, services, income and current transfers accounts; (ii) revisions of goods export, import and net figures to reflect certain post-audit adjustments; (iii) revisions of services export, import and net figures to reflect certain post-audit adjustments and updated estimates from the BPO; (iv) revisions of payments, receipts and net under the income account to reflect certain post-audit adjustments and updates from the International Operations Department; (v) revisions of current transfers import, export and net figures to reflect data updates on grants to the Republic by the OECD and certain post-audit adjustments; (vi) revisions of capital account receipts, payments and net figures to reflect updated estimates from the OECD’s report and certain post-audit adjustments; (vii) revisions of direct investments assets, liabilities and net to reflect additional data from financial statements of corporations, updates from the Coordinated Direct Investments Survey, updates
57
from the International Operations Department and certain other post-audit adjustments; (viii) revisions of portfolio investments assets, liabilities and net figures to reflect updates from the Coordinated Portfolio Investments Survey and changes in methodology for compiling equity securities of local banks; (ix) revisions of other investments assets, liabilities and net figures to reflect updates from the Bank for International Settlements, certain post-audit adjustments and final data from International Operations Department; and (x) revisions of the overall balance of payments position to reflect updated data based on revised accounting policies and methodology in the computation of foreign exchange gains and losses. As a result of the revisions, the current account increased from $7.0 billion to $7.1 billion, goods export and import increased from $4.7 billion and $63.0 billion, respectively, to $4.8 billion and $63.2 billion, respectively, and goods net decreased from $(15.5) billion to $(15.7) billion, services exports, imports and net increased from $15.4 billion, $11.9 billion and $3.6 billion, respectively, to $16.5 billion, $12.4 billion and $4.2 billion, respectively, receipts and payments under the income account increased from $7.0 billion and $5.7 billion, respectively, to $7.2 billion and $7.0 billion, respectively, and the income account net decreased from $1.3 billion to $237 million, current transfers imports decreased from $861 million to $472 million and current transfers export and net increased from $18.5 billion and $17.6 billion, respectively, to $18.9 billion and $18.4 billion, respectively, capital account payments increased from $99 million to $118 million and capital account receipts and net decreased from $270 million and $171 million, respectively, to $265 million and $147 million, respectively, direct investments assets, liabilities and net increased from $9 million, $1.3 billion and $1.3 billion, respectively, to $339 million, $1.9 billion and $1.5 billion, respectively, portfolio investments assets increased from $(395) million to $(277) million and portfolio investments liabilities and net decreased from $5.1 billion and $5.5 billion, respectively, to $4.1 billion and $4.4 billion, respectively, other investments assets decreased from $3.3 billion to $1.7 billion and other investments liabilities and net increased from $530 million and $(2.7) billion, respectively, to $653 million and $(1.1) billion, respectively, net unclassified items increased from $(2.0) billion to $(1.9) billion and the overall balance of payments position increased from $10.2 billion to $11.4 billion.
58
The following table sets out balance of payments of the Republic for 2008 to 2012, and preliminary data for the first six months of 2013. On September 23, 2010, Bangko Sentral revised the balance of payments statistics from 2009 onwards to reflect the revised treatment of SDR allocation. Prior to the adoption of the revised treatment, the allocation of SDRs was considered a non-transaction item, and therefore was not recorded in the balance of payments. With the implementation of the revised treatment, the SDR allocation is now treated as a transaction, particularly as a long-term liability of the monetary authority. As a result, the data included in this table may be different from previously reported data. For convenience, this table presents balance of payments statistics for 2011 and 2012 pursuant to both the BPM5 and BPM6 frameworks, while the statistics for the first six months of 2013 are only presented on a BPM6 basis.
| | | | | | | | | | | | | | | | | | | | | | | | | | | | | | | | |
| | | Balance of Payments | |
| | | 2008(1) | | | 2009(1) | | | 2010(1)(2) | | | 2011(1)(2) | | | 2011(3) | | | 2012(1)(2)(4) | | | 2012(3)(4) | | | 2013(3)(5) | |
| | | ($ in millions) | |
Current account(6) | | | 3,627 | | | | 9,358 | | | | 8,922 | | | | 7,125 | | | | 6,970 | | | | 7,177 | | | | 7,126 | | | | 5,623 | |
| | | | | | | | | | | | | | | | | | | | | | | | | | | | | | | | |
Goods and services | | | (11,725 | ) | | | (6,728 | ) | | | (8,231 | ) | | | (11,492 | ) | | | (11,690 | ) | | | (11,124 | ) | | | (11,300 | ) | | | (3,284 | ) |
Total exports | | | 57,970 | | | | 48,624 | | | | 64,843 | | | | 64,104 | | | | 56,134 | | | | 69,721 | | | | 64,884 | | | | 33,328 | |
Total imports | | | 69,695 | | | | 55,352 | | | | 73,074 | | | | 75,596 | | | | 67,824 | | | | 80,845 | | | | 76,184 | | | | 36,612 | |
Goods | | | (12,885 | ) | | | (8,842 | ) | | | (10,966 | ) | | | (15,652 | ) | | | (16,973 | ) | | | (14,818 | ) | | | (15,205 | ) | | | (5,178 | ) |
Exports | | | 48,253 | | | | 37,610 | | | | 50,748 | | | | 47,571 | | | | 38,276 | | | | 51,630 | | | | 46,284 | | | | 23,990 | |
Imports | | | 61,138 | | | | 46,452 | | | | 61,714 | | | | 63,223 | | | | 55,249 | | | | 66,448 | | | | 61,489 | | | | 29,168 | |
Services | | | 1,160 | | | | 2,114 | | | | 2,735 | | | | 4,160 | | | | 5,283 | | | | 3,694 | | | | 3,905 | | | | 1,895 | |
Exports | | | 9,717 | | | | 11,014 | | | | 14,095 | | | | 16,533 | | | | 17,858 | | | | 18,091 | | | | 18,600 | | | | 9,338 | |
Imports | | | 8,557 | | | | 8,900 | | | | 11,360 | | | | 12,373 | | | | 12,575 | | | | 14,397 | | | | 14,695 | | | | 7,444 | |
Income | | | 105 | | | | (193 | ) | | | 505 | | | | 237 | | | | 280 | | | | (871 | ) | | | (746 | ) | | | (624 | ) |
Receipts | | | 5,973 | | | | 5,712 | | | | 6,093 | | | | 7,188 | | | | 7,203 | | | | 7,732 | | | | 7,774 | | | | 3,885 | |
Payments | | | 5,868 | | | | 5,905 | | | | 5,588 | | | | 6,951 | | | | 6,923 | | | | 8,603 | | | | 8,520 | | | | 4,509 | |
Current transfers | | | 15,247 | | | | 16,279 | | | | 16,648 | | | | 18,380 | | | | 18,380 | | | | 19,172 | | | | 19,172 | | | | 9,531 | |
Receipts | | | 15,780 | | | | 16,910 | | | | 17,478 | | | | 18,852 | | | | 18,852 | | | | 19,718 | | | | 19,718 | | | | 9,831 | |
Payments | | | 533 | | | | 631 | | | | 830 | | | | 472 | | | | 472 | | | | 546 | | | | 546 | | | | 300 | |
Capital and financial account | | | (1,649 | ) | | | (1,627 | ) | | | 7,388 | | | | 5,993 | | | | 5,740 | | | | 5,701 | | | | 6,267 | | | | 850 | |
| | | | | | | | | | | | | | | | | | | | | | | | | | | | | | | | |
Capital account | | | 53 | | | | 104 | | | | 98 | | | | 147 | | | | 130 | | | | 181 | | | | 136 | | | | 46 | |
Receipts | | | 114 | | | | 166 | | | | 170 | | | | 265 | | | | 169 | | | | 258 | | | | 152 | | | | 56 | |
Payments | | | 61 | | | | 62 | | | | 72 | | | | 118 | | | | 39 | | | | 77 | | | | 16 | | | | 10 | |
Financial account | | | (1,702 | ) | | | (1,731 | ) | | | 7,290 | | | | 5,846 | | | | 5,610 | | | | 5,520 | | | | 6,131 | | | | 804 | |
Direct investment | | | 1,285 | | | | 1,604 | | | | 682 | | | | 1,513 | | | | 1,277 | | | | 341 | | | | 952 | | | | 1,417 | |
Assets, residents’ investments abroad | | | 259 | | | | 359 | | | | 616 | | | | 339 | | | | 539 | | | | 1,692 | | | | 1,845 | | | | 771 | |
Liabilities, non-residents’ investments in the Philippines | | | 1,544 | | | | 1,963 | | | | 1,298 | | | | 1,852 | | | | 1,816 | | | | 2,033 | | | | 2,797 | | | | 2,188 | |
Portfolio investment | | | (3,627 | ) | | | (625 | ) | | | 4,365 | | | | 4,390 | | | | 4,390 | | | | 3,523 | | | | 3,523 | | | | 2,091 | |
Assets, residents’ investments abroad | | | (789 | ) | | | 2,715 | | | | 2,872 | | | | (277 | ) | | | (277 | ) | | | 1,204 | | | | 1,204 | | | | (681 | ) |
Liabilities, non-residents’ investments in the Philippines | | | (4,416 | ) | | | 2,090 | | | | 7,237 | | | | 4,113 | | | | 4,113 | | | | 4,727 | | | | 4,727 | | | | 1,410 | |
Financial derivatives | | | (113 | ) | | | 32 | | | | (191 | ) | | | 1,002 | | | | 1,002 | | | | 13 | | | | 13 | | | | (23 | ) |
Assets, residents’ investments abroad | | | (541 | ) | | | (403 | ) | | | (429 | ) | | | (1,541 | ) | | | (1,541 | ) | | | (276 | ) | | | (276 | ) | | | (125 | ) |
Liabilities, non-residents’ investments in the Philippines | | | (654 | ) | | | (371 | ) | | | (620 | ) | | | (539 | ) | | | (539 | ) | | | (263 | ) | | | (263 | ) | | | (147 | ) |
Other investment | | | 753 | | | | (2,742 | ) | | | 2,434 | | | | (1,059 | ) | | | (1,059 | ) | | | 1,643 | | | | 1,643 | | | | (2,681 | ) |
Assets, residents’ investments abroad | | | (4,305 | ) | | | 1,967 | | | | 2,773 | | | | 1,712 | | | | 1,712 | | | | 1,361 | | | | 1,361 | | | | 1,278 | |
Liabilities, non-residents’ investments in the Philippines | | | (3,552 | ) | | | (775 | ) | | | 5,207 | | | | 653 | | | | 653 | | | | 3,004 | | | | 3,004 | | | | (1,404 | ) |
Net unclassified items(7) | | | (1,889 | ) | | | (1,310 | ) | | | (2,002 | ) | | | (1,718 | ) | | | (1,310 | ) | | | (3,642 | ) | | | (4,157 | ) | | | (3,897 | ) |
| | | | | | | | | | | | | | | | | | | | | | | | | | | | | | | | |
Overall balance of payments position(8) | | | 89 | | | | 6,421 | | | | 14,308 | | | | 11,400 | | | | 11,400 | | | | 9,236 | | | | 9,236 | | | | 2,577 | |
| | | | | | | | | | | | | | | | | | | | | | | | | | | | | | | | |
Source: Department of Economic Statistics, Bangko Sentral.
| (1) | Figures reported pursuant to BPM5. |
| (2) | Revised to reflect: (a) late reports; (b) post-audit adjustments; and (c) final data from companies. |
| (3) | Figures reported pursuant to BPM6. |
59
| (5) | Preliminary data for the first six months of 2013. |
| (6) | Derived by deducting debit entries from credit entries excluding reserves. |
| (7) | Offsetting account to the overstatement or understatement in either receipts or payments of the recorded balance of payments components relative to the overall balance of payments position. |
| (8) | The overall balance of payments position is determined by deducting change in reserve liabilities from change in reserve assets. |
Overall Balance of Payments Performance
In 2009, the overall balance of payments position of the Republic on a BPM5 basis recorded a surplus of $6.4 billion, which was considerably higher than the $89 million overall surplus recorded in 2008. This higher balance of payments surplus was mainly attributable to the higher surplus in the current account of $9.4 billion for 2009, which was substantially higher than the $3.6 billion surplus recorded in 2008 due primarily to a 42.6% decrease in the trade-in-goods deficit. The capital and financial account recorded a deficit of $1.6 billion in 2009, in line with the deficit of $1.6 billion recorded in 2008.
In 2010, the overall balance of payments position of the Republic on a BPM5 basis recorded a surplus of $14.3 billion, substantially higher than the $6.4 billion surplus recorded in 2009. The higher surplus was primarily the result of the reversal in the capital and financial account from a net outflow to a net inflow, despite a lower surplus in the current account. The capital and financial account recorded net inflows of $7.4 billion in 2010, compared to a $1.6 billion net outflow in 2009. The current account recorded a surplus of $8.9 billion in 2010, compared to a $9.4 billion surplus in 2009. These surpluses were partially offset by an outflow of $2.0 billion in net unclassified items in 2010, compared to a net outflow of $1.3 billion in 2009.
In 2011, the overall balance of payments position of the Republic on a BPM5 basis recorded a surplus of $11.4 billion, which was 20.3% lower than the $14.3 billion surplus recorded in 2010, reflecting the weaker performance of both the current and capital and financial accounts. The capital and financial account recorded a net inflow of $6.0 billion in 2011, representing a decrease of 18.9% from the $7.4 billion surplus recorded in 2010. The current account recorded a $7.1 billion surplus in 2011, a 20.1% reduction from the $8.9 billion surplus in 2010 due to resilient remittances, strong revenues from BPO services and higher income receipts, which partially offset a higher trade-in-goods deficit.
In 2012, the overall balance of payments position of the Republic on a BPM6 basis recorded a surplus of $9.2 billion which was 19.0% lower than the surplus of $11.4 billion in 2011, primarily as a result of a higher deficit in the net unclassified items account. The net unclassified items account recorded a deficit of $4.2 billion in 2012, which was significantly higher than the $1.3 billion deficit recorded in 2011. The higher deficit in the net unclassified items account in 2012 was partially offset by a the higher surplus in the capital and financial account of $6.3 billion, which was 9.2% higher than the $5.7 billion surplus recorded in 2011. The current account also recorded a higher surplus of $7.1 billion in 2012, which was 2.2% higher than the $7.0 billion surplus recorded in 2011.
In the first six months of 2013, preliminary data indicate that the overall balance of payments position of the Republic on a BPM6 basis recorded a surplus of $2.6 billion, which was 95.8% higher than the surplus of $1.3 billion in the corresponding period of 2012, primarily as a result of an increased surplus in the current account as well as a substantially lower deficit in the net unclassified items account. The current account recorded a surplus of $5.6 billion in the first six months of 2013, which was substantially higher than the surplus of $2.7 billion recorded in the corresponding period of 2012. The net unclassified items account recorded a deficit of $3.9 billion in the first six months of 2013, which was 29.2% lower than the $5.5 billion deficit recorded in the corresponding period of 2012. These factors were partially offset by a substantially lower surplus in the capital and financial account of $850 million compared to $4.2 billion in the corresponding period of 2012.
60
Current Account
In 2009, the current account on a BPM5 basis recorded a surplus of $9.4 billion, a significant increase from the $3.6 billion surplus recorded in 2008. The higher surplus was mainly the result of higher net receipts from current transfers, which increased 6.8% to $16.3 billion in 2009 from $15.2 billion in 2008 as a result of higher OFW remittances, a lower trade-in-goods deficit, which decreased 31.4% to $8.8 billion in 2009 from $12.9 billion in 2008, and a higher trade-in-services surplus, which substantially increased to $2.1 billion in 2009 from $1.2 billion in 2008. These developments were partially offset by the $193 million deficit recorded in the income account in 2009, a decrease from the surplus of $105 million recorded in 2008.
In 2010, the current account on a BPM5 basis recorded a surplus of $8.9 billion, 4.7% lower than the $9.4 billion surplus recorded in 2009. The lower surplus was primarily the result of a higher trade-in-goods deficit, which was partially offset by a higher trade-in-services surplus and a reversal in the income account from net payments to net receipts. In 2010, the trade-in-goods deficit increased by 24.0% to $11.0 billion from a deficit of $8.8 billion recorded in 2009. The trade-in-services surplus grew by 29.4% to $2.7 billion in 2010 from a surplus of $2.1 billion recorded in 2009. Net receipts from current transfers increased by 2.3% to $16.6 billion in 2010 from the $16.3 billion recorded in 2009. In 2010, the net income account recorded a surplus of $505 million, a reversal of the $193 million deficit recorded in 2009.
In 2011, the current account on a BPM5 basis recorded a surplus of $7.1 billion, 20.1% lower than the $8.9 billion surplus recorded in 2010. The lower surplus was primarily the result of a higher trade-in-goods deficit, which was partially offset by higher positive balances in the services and current transfers accounts. In 2011, the trade-in-goods deficit increased to $15.7 billion, 42.7% higher than the $11.0 billion deficit recorded in 2010. The trade-in-services surplus increased by 52.1% to $4.2 billion in 2011, from a surplus of $2.7 billion recorded in 2010. Net receipts from current transfers increased by 10.4% to $18.4 billion in 2011, from the $16.6 billion recorded in 2010. The net income account recorded a surplus of $237 million in 2011, 53.1% lower than the $505 million surplus recorded in 2010.
In 2012, the current account on a BPM6 basis recorded a $7.1 billion surplus, a 2.2% increase from the $7.0 billion surplus recorded in 2011. The surplus in the current account was sustained by the increase of 4.6% in current transfers from $18.4 billion in 2011 to $19.2 billion in 2012, which largely offset the reversal of the $280 million surplus in the income account in 2011 to a deficit of $746 million in 2012. The goods and services account also recorded a lower deficit of $11.3 billion in 2012, a 3.3% decrease from the $11.7 billion deficit recorded in 2011.
Preliminary data indicate that in the first six months of 2013 the current account on a BPM6 basis recorded a surplus of $5.6 billion, which was higher than the surplus of $2.7 billion recorded in the corresponding period in 2012. The increased surplus in the current account was mainly due to higher surpluses in the secondary income and services accounts, a reduction in the trade-in goods deficit and a 5.6% growth in remittances of OFWs, which increased to $10.7 billion in the first six months of 2013.
Goods Trade
Trading in goods significantly affects the Philippine economy. From 2008 to 2012, exports and imports of goods on a BPM5 basis averaged 23.8% and 27.5% of the country’s GDP, respectively. A significant proportion of exports depends on imported raw materials or other inputs, rendering the country’s exports vulnerable to any import decline resulting from a peso depreciation. See “—Monetary System—Foreign Exchange System.”
In 2009, the trade-in-goods deficit on a BPM5 basis decreased to $8.9 billion, a 31.4% decrease from the $12.9 billion deficit recorded in 2008. The lower deficit was due mainly to the decrease in imports exceeding the decrease in exports in 2009 as a result of the global trade. Exports of goods decreased by 22.1% in 2009
61
compared to 2008 levels, as all major export commodities, except sugar and related products, declined. Imports of goods decreased by 24.0% in 2009 compared to 2008 levels, as all major import commodities contracted as a result of lower global prices for most commodities. The negative trade performance in 2009 resulted from the decline of world trade following the global economic and financial crisis.
In 2010, the trade-in-goods deficit on a BPM5 basis increased to $11.0 billion, a 24.0% increase from the $8.8 billion deficit recorded in 2009. The increased deficit resulted mainly from a 32.9% increase in imports compared to 2009 levels, which was partially offset by a 34.9% increase in exports, with imports of all major commodity groups increasing in 2010.
In 2011, the trade-in-goods deficit on a BPM5 basis increased to $15.7 billion, a 42.7% increase from the $11.0 billion deficit recorded in 2010. The increased deficit was due largely to a contraction in the level of exports combined with continued expansion in the country’s purchases of foreign goods. Exports of goods decreased by 6.3% in 2011, compared to 2010 levels, while imports of goods increased by 2.4% in 2011 as compared to 2010 levels. The country’s merchandise exports in 2011 declined largely due to the general slowdown of the global economy and the supply chain disruptions caused by the earthquake in Japan and flooding in Thailand.
In 2012, the trade-in-goods deficit on a BPM6 basis was $15.2 billion, 10.4% lower than the trade-in-goods deficit of $17.0 billion in 2011. The lower deficit was largely due to growth in exports, which increased by 20.9% to $46.3 billion in 2012 from $38.3 billion in 2011. Higher export growth was mainly due to increased overseas sales of manufactured goods, particularly electronic products, wood manufactures, machinery and transport equipment and processed food and beverages.
In the first half of 2013, the trade-in-goods deficit on a BPM6 basis declined by 30.8% to $5.2 billion from $7.5 billion in the comparable period in 2012. The lower deficit was largely due to sustained growth in exports of goods, which increased by 4.2% compared to the prior period, combined with a 4.4% decrease in imports of goods as compared to the prior period.
62
Exports of Goods
The following tables set out the Republic’s exports of goods by major commodity group and destination, as reported by the NSO and adjusted by Bangko Sentral.
| | | | | | | | | | | | | | | | | | | | | | | | | | | | | | | | | | | | | | | | | | | | | | | | | | | | |
| | | Exports by Major Commodity Groups | |
| | | Annual | | | Growth
Rates | | | January-June | | | Growth
Rates | | | Percentage of
Total Exports | |
Commodities | | 2008(1) | | | 2009(1) | | | 2010(1) | | | 2011(1)(2) | | | 2011(2)(3) | | | 2012(1)(2) | | | 2012(2)(3) | | | 2012(2)(3) | | | 2012(2)(3) | | | 2013(2)(3) | | | 2013(3)(4) | | | 2008(1) | | | 2012(1)(2) | |
| | | ($ in millions, except percentages) | |
Agricultural products | | | | | | | | | | | | | | | | | | | | | | | | | | | | | | | | | | | | | | | | | | | | | | | | | | | | |
Coconut products | | | 1,348 | | | | 801 | | | | 1,508 | | | | 1,784 | | | | 1,784 | | | | 1,364 | | | | 1,364 | | | | (23.5 | )% | | | 705 | | | | 775 | | | | 9.8 | % | | | 2.8 | % | | | 2.6 | % |
Sugar and sugar products | | | 80 | | | | 112 | | | | 52 | | | | 390 | | | | 390 | | | | 177 | | | | 177 | | | | (54.6 | ) | | | 98 | | | | 165 | | | | 71.6 | | | | 0.2 | | | | 0.3 | |
Fruits and vegetables | | | 735 | | | | 701 | | | | 654 | | | | 991 | | | | 991 | | | | 1,205 | | | | 1,205 | | | | 21.6 | | | | 558 | | | | 734 | | | | 31.4 | | | | 1.5 | | | | 2.3 | |
Other agro-based products | | | 612 | | | | 529 | | | | 708 | | | | 854 | | | | 854 | | | | 807 | | | | 807 | | | | (5.5 | ) | | | 426 | | | | 480 | | | | 12.9 | | | | 1.3 | | | | 1.6 | |
| | | | | | | | | | | | | | | | | | | | | | | | | | | | | | | | | | | | | | | | | | | | | | | | | | | | |
Total agricultural based products | | | 2,775 | | | | 2,143 | | | | 2,922 | | | | 4,019 | | | | 4,019 | | | | 3,553 | | | | 3,553 | | | | (11.6 | ) | | | 1,787 | | | | 2,154 | | | | 20.5 | | | | 5.8 | | | | 6.9 | |
| | | | | | | | | | | | | | | | | | | | | | | | | | | | | | | | | | | | | | | | | | | | | | | | | | | | |
Forest products | | | 34 | | | | 33 | | | | 28 | | | | 50 | | | | 50 | | | | 59 | | | | 59 | | | | 18 | | | | 22 | | | | 58 | | | | 161.0 | | | | 0.1 | | | | 0.1 | |
Mineral products | | | 2,498 | | | | 1,470 | | | | 1,929 | | | | 2,840 | | | | 2,840 | | | | 2,265 | | | | 2,265 | | | | (20.2 | ) | | | 1,069 | | | | 1,587 | | | | 48.4 | | | | 5.2 | | | | 4.4 | |
Petroleum products | | | 1,240 | | | | 293 | | | | 371 | | | | 648 | | | | 648 | | | | 465 | | | | 465 | | | | (28.2 | ) | | | 209 | | | | 425 | | | | 103.4 | | | | 2.6 | | | | 0.9 | |
Manufacturing | | | | | | | | | | | | | | | | | | | | | | | | | | | | | | | | | | | | | | | | | | | | | | | | | | | | |
Electronic products | | | 28,502 | | | | 22,182 | | | | 31,080 | | | | 23,795 | | | | 15,601 | | | | 22,557 | | | | 17,789 | | | | 14.0 | | | | 9,075 | | | | 8,717 | | | | (3.9 | ) | | | 59.1 | | | | 43.7 | |
Other electronics | | | 1,426 | | | | 1,417 | | | | 1,473 | | | | 1,448 | | | | 1,448 | | | | 2,433 | | | | 2,433 | | | | 68.0 | | | | 1,115 | | | | 1,201 | | | | 7.8 | | | | 3.0 | | | | 4.7 | |
Garments | | | 1,952 | | | | 1,541 | | | | 1,722 | | | | 1,912 | | | | 1,419 | | | | 1,594 | | | | 1,400 | | | | (1.3 | ) | | | 790 | | | | 754 | | | | (4.5 | ) | | | 4.0 | | | | 3.1 | |
Textile yarns/fabrics | | | 194 | | | | 147 | | | | 169 | | | | 184 | | | | 184 | | | | 170 | | | | 170 | | | | (7.6 | ) | | | 90 | | | | 87 | | | | (3.4 | ) | | | 0.4 | | | | 0.3 | |
Footwear | | | 31 | | | | 22 | | | | 9 | | | | 13 | | | | 13 | | | | 16 | | | | 16 | | | | 23.1 | | | | 6 | | | | 10 | | | | 56.6 | | | | 0.1 | | | | 0.0 | |
Travel goods and handbags | | | 95 | | | | 66 | | | | 71 | | | | 40 | | | | 40 | | | | 60 | | | | 60 | | | | 50.0 | | | | 31 | | | | 65 | | | | 106.1 | | | | 0.2 | | | | 0.1 | |
Wood manufacturing | | | 918 | | | | 821 | | | | 1,029 | | | | 1,683 | | | | 1,683 | | | | 2,159 | | | | 2,159 | | | | 28.3 | | | | 884 | | | | 1,496 | | | | 69.2 | | | | 1.9 | | | | 4.2 | |
Furniture and fixtures | | | 221 | | | | 138 | | | | 152 | | | | 165 | | | | 165 | | | | 180 | | | | 180 | | | | 9.1 | | | | 93 | | | | 112 | | | | 20.1 | | | | 0.5 | | | | 0.3 | |
Chemicals | | | 1,130 | | | | 978 | | | | 1,577 | | | | 1,939 | | | | 1,939 | | | | 1,943 | | | | 1,943 | | | | 0.2 | | | | 1,067 | | | | 1,319 | | | | 23.6 | | | | 2.3 | | | | 3.8 | |
Non-metallic mineral manufacturing | | | 211 | | | | 156 | | | | 162 | | | | 177 | | | | 177 | | | | 145 | | | | 145 | | | | (18.1 | ) | | | 78 | | | | 98 | | | | 25.7 | | | | 0.4 | | | | 0.3 | |
Machinery and transport equipment | | | 2,116 | | | | 1,950 | | | | 2,574 | | | | 2,811 | | | | 2,811 | | | | 5,314 | | | | 5,314 | | | | 89.0 | | | | 2,593 | | | | 2,155 | | | | (16.9 | ) | | | 4.4 | | | | 10.3 | |
Processed food and beverages | | | 943 | | | | 987 | | | | 1,098 | | | | 1,191 | | | | 1,191 | | | | 1,447 | | | | 1,447 | | | | 21.5 | | | | 665 | | | | 1,117 | | | | 67.7 | | | | 2.0 | | | | 2.8 | |
Iron and steel | | | 263 | | | | 124 | | | | 163 | | | | 202 | | | | 202 | | | | 253 | | | | 253 | | | | 25.2 | | | | 125 | | | | 110 | | | | (11.6 | ) | | | 0.5 | | | | 0.5 | |
Baby carriages, toys, games and sporting goods | | | 143 | | | | 128 | | | | 168 | | | | 188 | | | | 188 | | | | 239 | | | | 239 | | | | 27.1 | | | | 101 | | | | 143 | | | | 42.1 | | | | 0.3 | | | | 0.5 | |
Basketwork, wickerwork, and other articles of plaiting materials | | | 42 | | | | 38 | | | | 43 | | | | 46 | | | | 46 | | | | 43 | | | | 43 | | | | (6.5 | ) | | | 25 | | | | 30 | | | | 19.2 | | | | 0.1 | | | | 0.1 | |
Miscellaneous | | | 331 | | | | 291 | | | | 337 | | | | 423 | | | | 423 | | | | 1,534 | | | | 1,534 | | | | 262.6 | | | | 707 | | | | 259 | | | | (63.5 | ) | | | 0.7 | | | | 3.0 | |
Others | | | 2,480 | | | | 2,618 | | | | 3,584 | | | | 3,622 | | | | 3,072 | | | | 4,979 | | | | 4,641 | | | | 51.1 | | | | 2,384 | | | | 2,046 | | | | (14.2 | ) | | | 5.1 | | | | 9.6 | |
| | | | | | | | | | | | | | | | | | | | | | | | | | | | | | | | | | | | | | | | | | | | | | | | | | | | |
Total Manufacturing | | | 40,999 | | | | 33,605 | | | | 45,411 | | | | 39,838 | | | | 30,602 | | | | 45,067 | | | | 39,766 | | | | 29.9 | | | | 19,830 | | | | 19,719 | | | | (0.6 | ) | | | 85.0 | | | | 87.3 | |
Special transactions | | | 1,530 | | | | 890 | | | | 835 | | | | 909 | | | | 83 | | | | 587 | | | | 90 | | | | 8.4 | | | | 73 | | | | 6 | | | | (91.7 | ) | | | 3.2 | | | | 0.2 | |
| | | | | | | | | | | | | | | | | | | | | | | | | | | | | | | | | | | | | | | | | | | | | | | | | | | | |
Total exports (per NSO) | | | 49,077 | | | | 38,436 | | | | 51,496 | | | | 48,305 | | | | 38,242 | | | | 51,995 | | | | 46,198 | | | | 20.8 | | | | 22,993 | | | | 23,949 | | | | 4.2 | | | | 101.7 | % | | | 100.7 | % |
Less adjustments (coverage and conceptual) | | | (824 | ) | | | (826 | ) | | | (748 | ) | | | (734 | ) | | | 34 | | | | (365 | ) | | | 86 | | | | 152.9 | | | | 38 | | | | 42 | | | | 9.8 | | | | (1.7 | ) | | | (0.7 | ) |
| | | | | | | | | | | | | | | | | | | | | | | | | | | | | | | | | | | | | | | | | | | | | | | | | | | | |
Total exports | | | 48,253 | | | | 37,610 | | | | 50,748 | | | | 47,571 | | | | 38,276 | | | | 51,630 | | | | 46,284 | | | | 20.9 | | | | 23,031 | | | | 23,990 | | | | 4.2 | | | | 100.0 | % | | | 100.0 | % |
| | | | | | | | | | | | | | | | | | | | | | | | | | | | | | | | | | | | | | | | | | | | | | | | | | | | |
Source: Department of Economic Statistics, Bangko Sentral.
Notes:
| (1) | Figures reported pursuant to BPM5. |
63
| (3) | Figures reported pursuant to BPM6. |
| (4) | Preliminary data for the first six months of 2013. |
| | | | | | | | | | | | | | | | | | | | | | | | | | | | | | | | |
| | | Export of Goods by Destination | |
| | | | | | | | | | | | | | | | | | | | | Percentage of
Total Exports | |
Country | | 2008 | | | 2009 | | | 2010 | | | 2011 | | | 2012(1) | | | 2013(2) | | | 2008 | | | 2012(1) | |
| | | ($ in millions, except percentages) | |
United States | | | 8,207 | | | | 6,789 | | | | 7,559 | | | | 7,102 | | | | 7,417 | | | | 4,746 | | | | 16.7 | % | | | 14.2 | % |
European Union(3) | | | 8,500 | | | | 7,949 | | | | 7,401 | | | | 5,950 | | | | 5,928 | | | | 4,150 | | | | 17.3 | | | | 11.4 | |
Japan | | | 7,706 | | | | 6,207 | | | | 7,840 | | | | 8,885 | | | | 9,880 | | | | 7,107 | | | | 15.7 | | | | 19.0 | |
PRC. | | | 5,469 | | | | 2,934 | | | | 5,724 | | | | 6,237 | | | | 6,169 | | | | 4,152 | | | | 11.1 | | | | 11.8 | |
Hong Kong | | | 4,987 | | | | 3,213 | | | | 4,336 | | | | 3,701 | | | | 4,776 | | | | 2,709 | | | | 10.2 | | | | 9.2 | |
South Korea, | | | 2,523 | | | | 1,828 | | | | 2,243 | | | | 2,237 | | | | 2,862 | | | | 2,332 | | | | 5.1 | | | | 5.5 | |
Singapore | | | 2,607 | | | | 2,477 | | | | 7,319 | | | | 4,279 | | | | 4,867 | | | | 2,578 | | | | 5.3 | | | | 9.3 | |
Republic of China (Taiwan) | | | 1,862 | | | | 1,325 | | | | 1,752 | | | | 1,993 | | | | 1,943 | | | | 1,121 | | | | 3.8 | | | | 3.7 | |
South East Asia(4) | | | 4,477 | | | | 3,358 | | | | 4,217 | | | | 4,405 | | | | 4,925 | | | | 3,225 | | | | 9.1 | | | | 9.5 | |
Others | | | 2,739 | | | | 2,356 | | | | 3,105 | | | | 3,516 | | | | 3,313 | | | | 2,883 | | | | 5.6 | | | | 6.4 | |
| | | | | | | | | | | | | | | | | | | | | | | | | | | | | | | | |
Total | | | 49,077 | | | | 38,436 | | | | 51,496 | | | | 48,305 | | | | 52,100 | | | | 35,003 | | | | 100.0 | % | | | 100.0 | % |
| | | | | | | | | | | | | | | | | | | | | | | | | | | | | | | | |
Source: National Statistics Office.
Notes:
| (2) | Preliminary data for the first eight months of 2013. |
| (3) | Includes Austria, Belgium, Bulgaria, Cyprus, Czech Republic, Denmark, Estonia, Finland, France, Germany, Greece, Hungary, Ireland, Italy, Latvia, Lithuania, Luxembourg, Malta, Netherlands, Poland, Portugal, Romania, Slovakia, Slovenia, Spain, Sweden, Latvia and the United Kingdom. |
| (4) | Includes Malaysia, Indonesia, Thailand, Brunei, Vietnam, Myanmar and Laos. |
Exports of goods on a BPM5 basis, as reported by the NSO, decreased by 2.8% in 2008 and 21.7% in 2009, increased by 34.0% in 2010 and decreased by 6.7% in 2011. Exports of goods on a BPM6 basis, as reported by the NSO, increased by 20.8% in 2012. As a percentage of total exports, manufactured goods on a BPM5 basis, as reported by the NSO, decreased from 83.5% in 2008 to 82.5% in 2011. As a percentage of total exports, manufactured goods on a BPM6 basis, as reported by NSO, increased from 80.0% in 2011 to 86.1% in 2012. This increase was primarily a result of an increase in exports of machinery and transport equipment as a proportion of total exports from 7.3% in 2011 to 11.5% in 2012 and an increase in exports of other commodities as a proportion of total exports from 8.0% in 2011 to 10.0% in 2012. Exports of miscellaneous commodities, wood manufacturing and other electronics, each as a proportion of total exports, also increased from 1.1%, 4.4% and 3.8%, respectively, in 2011 to 3.3%, 4.7% and 5.3%, respectively, in 2012. These increases were partially offset by a decrease as a percentage of total exports in electronic products from 40.8% in 2011 to 38.4% in 2012.
The United States accounted for, on average, 15.6% of total exports from 2008 to 2012. Japan accounted for, on average, 16.8% of total exports over the same period. In 2008, exports to the United States and Japan accounted for 16.7% and 15.7% of total exports, respectively. In 2012, exports to Japan increased to 19.0% of total exports, while exports to the United States decreased to 14.2% of total exports. The Republic aims to diversify its export markets and increase its exports to other countries, particularly ASEAN countries. The Republic is a party to the ASEAN Free Trade Agreement, which provides for reduced tariffs among ASEAN nations as well as plans for intra-regional investments, industrial linkages and banking and financial integration.
In 2009, according to NSO data, total exports of goods on a BPM5 basis decreased by 21.7% to $38.4 billion from the $49.1 billion recorded in 2008, as exports of all major export commodities declined except
64
sugar and related products. The decrease was mainly attributable to an 18.0% decline in total exports of manufactured products to $33.6 billion in 2009 from the $41.0 billion recorded in 2008. Manufactured goods comprised 89.3% of total exports in 2009. Total electronics exports, which comprised the majority of manufactured products exports, were $23.6 billion in 2009, a decrease of 21.2% from the $29.9 billion recorded in 2008, due mainly to the weaker demand for electronic products as result of the global economic crisis. The declines in exports of petroleum products, mineral products, other agricultural products, coconut products and fruits and vegetables, due mainly to the global economic crisis, also contributed to the decrease of total exports of goods in 2009.
In 2010, according to NSO data, total exports of goods on a BPM5 basis increased 34.0% to $51.5 billion, from the $38.4 billion recorded in 2009. The increase was attributable mainly to increased revenues from the export of manufactured products. Exports of manufactured products increased by 35.1% to $45.4 billion in 2010, from the $33.6 billion recorded in 2009, primarily as a result of higher shipments of electronic products, which increased 40.1% from $22.2 billion in 2009 to $31.1 billion in 2010. Increases in exports of coconut products and mineral products, among others, also contributed to the increase in total export of goods in 2010.
In 2011, according to NSO data, total exports of goods on a BPM5 basis contracted by 6.2% to $48.3 billion, compared to the $51.5 billion recorded in 2010. This decrease was mainly attributable to decreased exports of manufactured goods. Exports of manufactured goods, which comprised 82.5% of total exports, contracted 12.3% to $39.8 billion in 2011, compared to growth of 35.1% in 2010, reflecting lower demand for electronic products. Total electronics exports decreased 23.4% from $31.1 billion in 2010 to $23.8 billion in 2011. Increases in exports of mineral products, petroleum products and coconut products partially offset the declines in exports of manufactured products.
In 2012, according to NSO data, total exports of goods on a BPM6 basis increased by 20.8% to $46.3 billion, as compared to $38.3 billion in 2011. This increase was driven primarily by an increase in exports of manufactured goods. Exports of manufactured goods, which comprised 86.1% of total exports, increased to $39.8 billion in 2012, an increase of 29.9% over the $30.6 billion recorded in 2011. The increase in manufacturing exports was largely driven by an 89.0% increase in machinery and transport equipment exports, from $2.8 billion in 2011 to $5.3 billion in 2012. Exports of electronic products also increased by 14.0% to $17.8 billion in 2012 from $15.6 billion in 2011. Exports of other manufactured goods increased by 51.1% to $4.6 billion in 2012 from $3.1 billion in 2011. Exports of miscellaneous goods increased to $1.5 billion in 2012 from $423 million in 2011. These increases were partially offset by a decrease in exports of mineral products, which decreased by 20.2% to $2.3 billion in 2012 from $2.8 billion in 2011, as well as a decrease in exports of agricultural based products, which decreased by 11.6% to $3.6 billion in 2012 from $4.0 billion in 2011.
In the first half of 2013, according to NSO data, total exports of goods on a BPM6 basis increased by 4.2% to $23.9 billion, compared to $23.0 billion in the first half of 2012. This increase was due primarily to the 48.5% increase in exports of mineral products, from $1.1 billion in the first half of 2012 to $1.6 billion in the first half of 2013. Exports of agricultural based products also increased by 20.5%, from $1.8 billion in the first half of 2012 to $2.2 billion in the first half of 2013. These increases were partially offset by a decline in exports of manufactured products, which decreased by 0.6% in the first half of 2013 compared to the first half of 2012.
65
Imports of Goods
The following tables set out the sources of the Philippines’ imports of goods by commodity group and by country.
| | | | | | | | | | | | | | | | | | | | | | | | | | | | | | | | | | | | | | | | | | | | | | | | | | | | |
| | | Imports of Goods by Commodity Group | |
| | | Annual | | | Growth
Rates | | | January-June | | | Growth
Rate | | | Percentage of
Total Imports | |
Commodities | | 2008(1)(2) | | | 2009(2) | | | 2010(2) | | | 2011(2) | | | 2011(3) | | | 2012(2)(4) | | | 2012(3)(4) | | | 2012(3)(4) | | | 2012(3)(4) | | | 2013(3)(4) | | | 2013(3)(5) | | | 2008(1)(2) | | | 2012(2)(4) | |
| | | ($ in millions, except percentages) | |
Capital goods | | | 9,309 | | | | 7,675 | | | | 9,646 | | | | 9,978 | | | | 9,974 | | | | 11,751 | | | | 11,748 | | | | 17.8 | % | | | 5,822 | | | | 5,703 | | | | (2.0 | )% | | | 15.2 | % | | | 17.7 | % |
Raw materials and intermediate goods | | | | | | | | | | | | | | | | | | | | | | | | | | | | | | | | | | | | | | | | | | | | | | | | | | | | |
Unprocessed raw materials | | | 1,911 | | | | 2,366 | | | | 2,530 | | | | 2,728 | | | | 2,729 | | | | 2,772 | | | | 2,768 | | | | 1.4 | | | | 1,141 | | | | 1,313 | | | | 15.1 | | | | 3.1 | | | | 4.2 | |
Semi-processed raw materials | | | 29,607 | | | | 22,888 | | | | 31,122 | | | | 29,334 | | | | 21,419 | | | | 27,404 | | | | 22,554 | | | | 5.3 | | | | 11,458 | | | | 10,689 | | | | (6.7 | ) | | | 48.4 | | | | 41.2 | |
| | | | | | | | | | | | | | | | | | | | | | | | | | | | | | | | | | | | | | | | | | | | | | | | | | | | |
Raw materials and intermediate goods | | | 31,517 | | | | 25,254 | | | | 33,652 | | | | 32,062 | | | | 24,150 | | | | 30,176 | | | | 25,323 | | | | 4.9 | | | | 12,599 | | | | 12,002 | | | | (4.7 | ) | | | 51.6 | | | | 45.4 | |
| | | | | | | | | | | | | | | | | | | | | | | | | | | | | | | | | | | | | | | | | | | | | | | | | | | | |
Mineral fuels and lubricants | | | 12,395 | | | | 7,361 | | | | 9,589 | | | | 12,552 | | | | 12,552 | | | | 13,666 | | | | 13,665 | | | | 8.9 | | | | 7,029 | | | | 6,704 | | | | (4.6 | ) | | | 20.3 | | | | 20.6 | |
Consumer goods | | | | | | | | | | | | | | | | | | | | | | | | | | | | | | | | | | | | | | | | | | | | | | | | | | | | |
Durable | | | 2,393 | | | | 2,332 | | | | 2,957 | | | | 3,210 | | | | 3,212 | | | | 3,683 | | | | 3,683 | | | | 14.7 | | | | 1,708 | | | | 1,860 | | | | 8.9 | | | | 3.9 | | | | 5.5 | |
Non-durable | | | 4,223 | | | | 3,091 | | | | 4,452 | | | | 3,775 | | | | 3,776 | | | | 4,010 | | | | 4,010 | | | | 6.2 | | | | 1,908 | | | | 1,963 | | | | 2.9 | | | | 6.9 | | | | 6.0 | |
| | | | | | | | | | | | | | | | | | | | | | | | | | | | | | | | | | | | | | | | | | | | | | | | | | | | |
Total consumer goods | | | 6,615 | | | | 5,423 | | | | 7,409 | | | | 6,985 | | | | 6,989 | | | | 7,695 | | | | 7,694 | | | | 10.1 | | | | 3,616 | | | | 3,824 | | | | 5.7 | | | | 10.8 | | | | 11.6 | |
| | | | | | | | | | | | | | | | | | | | | | | | | | | | | | | | | | | | | | | | | | | | | | | | | | | | |
Special transactions(6) | | | 719 | | | | 586 | | | | 865 | | | | 862 | | | | 6 | | | | 638 | | | | 100 | | | | 1,566.7 | | | | 25 | | | | 16 | | | | (34.2 | )% | | | 1.2 | | | | 1.0 | |
| | | | | | | | | | | | | | | | | | | | | | | | | | | | | | | | | | | | | | | | | | | | | | | | | | | | |
Total imports (per NSO)(7) | | | 60,555 | | | | 46,300 | | | | 61,159 | | | | 62,439 | | | | 53,671 | | | | 63,926 | | | | 58,530 | | | | 9.1 | % | | | 29,091 | | | | 28,250 | | | | (2.9 | )% | | | 99.0 | % | | | 96.2 | % |
| | | | | | | | | | | | | | | | | | | | | | | | | | | | | | | | | | | | | | | | | | | | | | | | | | | | |
Conceptual and coverage adjustments(8) | | | 583 | | | | 152 | | | | 555 | | | | 784 | | | | 1,578 | | | | 2,522 | | | | 2,959 | | | | 87.5 | % | | | 1,423 | | | | 918 | | | | (35.5 | )% | | | 1.0 | % | | | 3.8 | % |
| | | | | | | | | | | | | | | | | | | | | | | | | | | | | | | | | | | | | | | | | | | | | | | | | | | | |
Total imports | | | 61,138 | | | | 46,452 | | | | 61,714 | | | | 63,223 | | | | 55,249 | | | | 66,448 | | | | 61,489 | | | | 11.3 | % | | | 30,514 | | | | 29,168 | | | | (4.4 | )% | | | 100.0 | % | | | 100.0 | % |
| | | | | | | | | | | | | | | | | | | | | | | | | | | | | | | | | | | | | | | | | | | | | | | | | | | | |
Source: Bangko Sentral.
| (1) | The import data for 2008 have been revised by the NSO. Please see “Balance of Payments—Revisions” for a more detailed discussion of recent and pending revisions to previously reported data for 2008. |
| (2) | Figures reported pursuant to BPM5. |
| (3) | Figures reported pursuant to BPM6. |
| (5) | Preliminary data for the first six months of 2013. |
| (6) | Excludes value of goods that do not involve change in ownership such as consigned, returned/replacement and temporarily imported goods. |
| (7) | Includes valuation adjustments to NSO data. |
| (8) | Conceptual adjustments reflect the exclusion of returned goods and temporary exports, in accordance with the IMF’s BPM5, while coverage adjustments reflect the inclusion of exports of goods that are not captured in the data sourced from the NSO’s foreign trade statistics. |
66
| | | | | | | | | | | | | | | | | | | | | | | | | | | | | | | | |
| | | Imports of Goods by Source | |
| | | | | | | | | | | | | | | | | | | | | Percentage of
Total Imports | |
Country | | 2008 | | | 2009(1) | | | 2010 | | | 2011 | | | 2012 | | | 2013(2) | | | 2008 | | | 2012 | |
| | | ($ in millions, except percentages) | |
Japan | | | 6,604 | | | | 5,351 | | | | 6,744 | | | | 6,516 | | | | 6,470 | | | | 3,479 | | | | 11.6 | % | | | 10.4 | % |
United States | | | 7,221 | | | | 5,113 | | | | 5,887 | | | | 6,536 | | | | 7,124 | | | | 4,456 | | | | 12.7 | | | | 11.5 | |
Southeast Asia(3) | | | 8,433 | | | | 7,235 | | | | 10,303 | | | | 9,437 | | | | 9,801 | | | | 5,838 | | | | 14.9 | | | | 15.8 | |
Hong Kong | | | 1,958 | | | | 1,457 | | | | 1,470 | | | | 1,510 | | | | 1,466 | | | | 868 | | | | 3.5 | | | | 2.4 | |
Saudi Arabia | | | 5,032 | | | | 1,531 | | | | 2,408 | | | | 3,224 | | | | 3,439 | | | | 1,826 | | | | 8.9 | | | | 5.5 | |
Taiwan | | | 3,835 | | | | 3,014 | | | | 3,676 | | | | 4,209 | | | | 4,855 | | | | 3,236 | | | | 6.8 | | | | 7.8 | |
Republic of Korea | | | 2,962 | | | | 3,005 | | | | 3,833 | | | | 4,420 | | | | 4,526 | | | | 3,230 | | | | 5.2 | | | | 7.3 | |
Australia | | | 902 | | | | 732 | | | | 839 | | | | 1,071 | | | | 1,347 | | | | 740 | | | | 1.6 | | | | 2.2 | |
Federal Republic of Germany | | | 1,064 | | | | 954 | | | | 1,112 | | | | 1,419 | | | | 1,472 | | | | 1,394 | | | | 1.9 | | | | 2.4 | |
PRC | | | 4,246 | | | | 3,807 | | | | 4,628 | | | | 6,085 | | | | 6,680 | | | | 5,294 | | | | 7.5 | | | | 10.8 | |
Others(4) | | | 14,489 | | | | 10,893 | | | | 14,032 | | | | 16,068 | | | | 14,950 | | | | 10,287 | | | | 25.5 | | | | 24.1 | |
| | | | | | | | | | | | | | | | | | | | | | | | | | | | | | | | |
Total(5) | | | 56,746 | | | | 43,092 | | | | 54,932 | | | | 60,496 | | | | 62,129 | | | | 40,648 | | | | 100.0 | % | | | 100.0 | % |
| | | | | | | | | | | | | | | | | | | | | | | | | | | | | | | | |
Source: National Statistics Office.
| (1) | Total import figures for 2009 were revised in September 2010. Please see “Balance of Payments—Revisions” for a more detailed discussion of recent and pending revisions to previously reported data. |
| (2) | Preliminary data for the first eight months of 2013. |
| (3) | Includes only Malaysia, Indonesia, Thailand, Brunei, Vietnam, Myanmar and Laos. |
| (4) | Includes over 160 other countries from which the Republic imports goods, including Singapore, the United Arab Emirates, the Russian Federation, France, India, New Zealand, Canada, Belgium, Qatar and the Netherlands. |
| (5) | Total imports as reported by the NSO differ from those reported by Bangko Sentral because the two departments use different measurement standards. Since 1999, the NSO’s import data have been adjusted to exclude goods shipped without change in ownership, to include valuation adjustment in raw material imports for electronics and garments exports and to include other imported goods. |
In 2009, according to NSO data, imports of goods on a BPM5 basis decreased by 23.5% to $46.3 billion from the $60.6 billion recorded in 2008, as imports of all major import commodities contracted as a result of weak international prices for most commodities. In particular, imports of semi-processed raw materials decreased by 22.7% to $22.9 billion in 2009 from the $29.6 billion recorded in 2008, due mainly to a decline in imports of raw materials needed for the manufacture of electronics goods as a consequence of diminished global demand for electronic products in 2009. Imports of mineral fuels and lubricants also decreased by 40.6% to $7.4 billion in 2009 from the $12.4 billion recorded in 2008, due mainly to the decline in the volume and price of petroleum crude imports.
In 2010, according to NSO data, total imports of goods on a BPM5 basis increased by 32.1% to $61.2 billion, compared to the $46.3 billion recorded in 2009. The increase was mainly driven by a 36.0% increase in imports of semi-processed raw materials to $31.1 billion in 2010 from $22.9 billion in 2009 largely reflecting imported materials for electronics manufacturers. Additionally, imports of mineral fuels and lubricants increased by 30.3% to $9.6 billion in 2010, compared with $7.4 billion in 2009.
In 2011, according to NSO data, total imports of goods on a BPM5 basis increased by 2.1% to $62.4 billion, compared to the $61.2 billion recorded in 2010. This increase was primarily attributable to an increase in imports of mineral fuels and lubricants. Imports of mineral fuels and lubricants increased 30.0% to $12.5 billion in 2011, compared to the $9.6 billion recorded in 2010, primarily as a result of increased imports of crude petroleum, coal, coke, and other mineral fuels and lubricants. Imports of capital goods also increased 3.4% to $10.0 billion in 2011, compared to $9.6 billion in 2010, primarily as a result of increased imports of telecommunication equipment and electrical machinery, power generating equipment and specialized machinery. These increases offset decreases in the imports of raw materials and intermediate goods and total consumer goods.
67
In 2012, according to NSO data, total imports of goods on a BPM6 basis increased by 9.1%, to $58.5 billion compared to the $53.7 billion recorded in 2011. This increase was primarily due to increased imports of capital goods, raw materials and intermediate goods and mineral fuels and lubricants. Imports of capital goods increased by 17.8% to $11.8 billion in 2012 from $10.0 billion in 2011 due to increases in professional, scientific and controlling instruments and photographic equipment and optical goods. Imports of raw materials and intermediate goods increased by 4.9% to $25.3 billion in 2012 from $24.2 billion in 2011 due to increases in both unprocessed raw materials and semi-processed raw materials. Imports of mineral fuels and lubricants increased by 8.9% to $13.7 billion in 2012 from $12.6 billion in 2011 due to higher imports of coal, coke and other mineral fuels and lubricants.
For the first half of 2013, according to NSO data, total imports of goods on a BPM6 basis decreased by 2.9% to $28.3 billion from $29.1 billion in the corresponding period in 2012. This decrease was mainly due to declines in payments for all major commodity groups, except consumer goods. In particular, in the first half of 2013 payments for raw materials and intermediate goods, mineral fuels and lubricants and capital goods declined by 4.7%, 4.6% and 2.0%, respectively, as compared to the first half of 2012. These declines were largely due to declines in imports of office machines, semi-processed raw materials and petroleum products.
Services Trade
The following table sets out the Republic’s services trade by sector for the periods indicated.
| | | | | | | | | | | | | | | | | | | | | | | | | | | | | | | | |
| | | Services Trade | |
| | | 2008(1) | | | 2009(1) | | | 2010(1)(2) | | | 2011(1) | | | 2011(3) | | | 2012(1)(4) | | | 2012(3)(4) | | | 2013(3)(5) | |
| | | ($ in millions) | |
Total services trade | | | 1,160 | | | | 2,114 | | | | 2,735 | | | | 4,160 | | | | 5,283 | | | | 3,694 | | | | 3,905 | | | | 1,895 | |
| | | | | | | | | | | | | | | | | | | | | | | | | | | | | | | | |
Exports | | | 9,717 | | | | 11,014 | | | | 14,095 | | | | 16,533 | | | | 17,858 | | | | 18,091 | | | | 18,600 | | | | 9.338 | |
Imports | | | 8,557 | | | | 8,900 | | | | 11,360 | | | | 12,373 | | | | 12,575 | | | | 14,397 | | | | 14,695 | | | | 7,444 | |
Maintenance and repair services(6) | | | — | | | | — | | | | — | | | | — | | | | (31 | ) | | | — | | | | (27 | ) | | | (66 | ) |
Exports(6) | | | — | | | | — | | | | — | | | | — | | | | 59 | | | | — | | | | 88 | | | | 31 | |
Imports(6) | | | — | | | | — | | | | — | | | | — | | | | 90 | | | | — | | | | 115 | | | | 97 | |
Transportation | | | (2,914 | ) | | | (2,508 | ) | | | (3,614 | ) | | | (2,841 | ) | | | (2,839 | ) | | | (3,328 | ) | | | (3,325 | ) | | | (1,539 | ) |
| | | | | | | | | | | | | | | | | | | | | | | | | | | | | | | | |
Exports | | | 1,295 | | | | 1,153 | | | | 1,351 | | | | 1,489 | | | | 1,495 | | | | 1,574 | | | | 1,577 | | | | 801 | |
Imports | | | 4,209 | | | | 3,661 | | | | 4,965 | | | | 4,330 | | | | 4,334 | | | | 4,902 | | | | 4,902 | | | | 2,340 | |
of which: Passenger | | | 29 | | | | (30 | ) | | | (180 | ) | | | 397 | | | | 397 | | | | 294 | | | | 294 | | | | 120 | |
Exports | | | 525 | | | | 523 | | | | 598 | | | | 836 | | | | 836 | | | | 886 | | | | 886 | | | | 449 | |
Imports | | | 496 | | | | 553 | | | | 778 | | | | 439 | | | | 439 | | | | 592 | | | | 592 | | | | 320 | |
of which: Freight | | | (2,939 | ) | | | (2,258 | ) | | | (2,921 | ) | | | (3,004 | ) | | | (3,004 | ) | | | (3,257 | ) | | | (3,257 | ) | | | (1,520 | ) |
Exports | | | 482 | | | | 374 | | | | 507 | | | | 475 | | | | 475 | | | | 505 | | | | 505 | | | | 255 | |
Imports | | | 3,421 | | | | 2,632 | | | | 3,428 | | | | 3,479 | | | | 3,479 | | | | 3,762 | | | | 3,762 | | | | 1,775 | |
of which: Other | | | (4 | ) | | | (220 | ) | | | (513 | ) | | | (234 | ) | | | (232 | ) | | | (365 | ) | | | (362 | ) | | | (138 | ) |
Exports | | | 288 | | | | 256 | | | | 246 | | | | 178 | | | | 184 | | | | 183 | | | | 186 | | | | 98 | |
Imports | | | 292 | | | | 476 | | | | 759 | | | | 412 | | | | 416 | | | | 548 | | | | 548 | | | | 236 | |
Travel | | | 442 | | | | (368 | ) | | | (786 | ) | | | (2,178 | ) | | | (2,178 | ) | | | (2,233 | ) | | | (2,233 | ) | | | (644 | ) |
| | | | | | | | | | | | | | | | | | | | | | | | | | | | | | | | |
Exports | | | 2,499 | | | | 2,330 | | | | 2,630 | | | | 3,190 | | | | 3,190 | | | | 4,014 | | | | 4,014 | | | | 2,438 | |
Imports | | | 2,057 | | | | 2,698 | | | | 3,416 | | | | 5,365 | | | | 5,368 | | | | 6,247 | | | | 6,247 | | | | 3,082 | |
Communication services(7) | | | 257 | | | | 231 | | | | 151 | | | | 242 | | | | 240 | | | | 293 | | | | 290 | | | | 158 | |
| | | | | | | | | | | | | | | | | | | | | | | | | | | | | | | | |
Exports(7) | | | 404 | | | | 354 | | | | 305 | | | | 395 | | | | 389 | | | | 486 | | | | 483 | | | | 250 | |
Imports(7) | | | 147 | | | | 123 | | | | 154 | | | | 153 | | | | 149 | | | | 193 | | | | 193 | | | | 91 | |
Construction services | | | 57 | | | | 58 | | | | 100 | | | | (4 | ) | | | (4 | ) | | | 69 | | | | 69 | | | | 13 | |
| | | | | | | | | | | | | | | | | | | | | | | | | | | | | | | | |
Exports | | | 90 | | | | 78 | | | | 121 | | | | 46 | | | | 46 | | | | 111 | | | | 111 | | | | 50 | |
Imports | | | 33 | | | | 20 | | | | 21 | | | | 50 | | | | 50 | | | | 42 | | | | 42 | | | | 37 | |
68
| | | | | | | | | | | | | | | | | | | | | | | | | | | | | | | | |
| | | Services Trade | |
| | | 2008(1) | | | 2009(1) | | | 2010(1)(2) | | | 2011(1) | | | 2011(3) | | | 2012(1)(4) | | | 2012(3)(4) | | | 2013(3)(5) | |
| | | ($ in millions) | |
Insurance and pension services(8) | | | (243 | ) | | | (176 | ) | | | (234 | ) | | | (267 | ) | | | (267 | ) | | | (274 | ) | | | (274 | ) | | | (127 | ) |
| | | | | | | | | | | | | | | | | | | | | | | | | | | | | | | | |
Exports(8) | | | 19 | | | | 59 | | | | 77 | | | | 73 | | | | 73 | | | | 90 | | | | 90 | | | | 45 | |
Imports(8) | | | 262 | | | | 235 | | | | 311 | | | | 340 | | | | 340 | | | | 364 | | | | 364 | | | | 172 | |
Financial services | | | (23 | ) | | | (55 | ) | | | (36 | ) | | | (92 | ) | | | (135 | ) | | | (70 | ) | | | (196 | ) | | | (109 | ) |
| | | | | | | | | | | | | | | | | | | | | | | | | | | | | | | | |
Exports | | | 59 | | | | 70 | | | | 38 | | | | 40 | | | | 115 | | | | 43 | | | | 107 | | | | 51 | |
Imports | | | 82 | | | | 125 | | | | 74 | | | | 132 | | | | 250 | | | | 113 | | | | 303 | | | | 160 | |
Computer and information services(7) | | | 1,068 | | | | 1,657 | | | | 1,819 | | | | 2,188 | | | | 2,188 | | | | 1,878 | | | | 1,878 | | | | 950 | |
| | | | | | | | | | | | | | | | | | | | | | | | | | | | | | | | |
Exports(7) | | | 1,148 | | | | 1,748 | | | | 1,928 | | | | 2,381 | | | | 2,381 | | | | 2,036 | | | | 2,036 | | | | 1,081 | |
Imports(7) | | | 80 | | | | 91 | | | | 109 | | | | 193 | | | | 193 | | | | 158 | | | | 158 | | | | 131 | |
Charges for the use of intellectual property(9) | | | (382 | ) | | | (419 | ) | | | (441 | ) | | | (437 | ) | | | (437 | ) | | | (496 | ) | | | (496 | ) | | | (278 | ) |
| | | | | | | | | | | | | | | | | | | | | | | | | | | | | | | | |
Exports(9) | | | 0 | | | | 2 | | | | 4 | | | | 5 | | | | 5 | | | | 8 | | | | 8 | | | | 1 | |
Imports(9) | | | 382 | | | | 421 | | | | 445 | | | | 442 | | | | 442 | | | | 504 | | | | 504 | | | | 279 | |
Other business services | | | 3,112 | | | | 3,923 | | | | 6,025 | | | | 7,816 | | | | 9,013 | | | | 8,095 | | | | 8,459 | | | | 3,627 | |
| | | | | | | | | | | | | | | | | | | | | | | | | | | | | | | | |
Exports | | | 4,182 | | | | 5,186 | | | | 7,600 | | | | 8,842 | | | | 10,033 | | | | 9,638 | | | | 9,995 | | | | 4,539 | |
Imports | | | 1,070 | | | | 1,263 | | | | 1,575 | | | | 1,026 | | | | 1,020 | | | | 1,543 | | | | 1,536 | | | | 912 | |
Personal, cultural and recreational services | | | (5 | ) | | | (8 | ) | | | (18 | ) | | | 22 | | | | 22 | | | | 45 | | | | 45 | | | | 25 | |
| | | | | | | | | | | | | | | | | | | | | | | | | | | | | | | | |
Exports | | | 21 | | | | 34 | | | | 41 | | | | 60 | | | | 60 | | | | 79 | | | | 79 | | | | 46 | |
Imports | | | 26 | | | | 42 | | | | 59 | | | | 38 | | | | 38 | | | | 34 | | | | 34 | | | | 21 | |
Audio-Visual and related services | | | (9 | ) | | | 0 | | | | (13 | ) | | | 12 | | | | 12 | | | | 26 | | | | 26 | | | | 17 | |
| | | | | | | | | | | | | | | | | | | | | | | | | | | | | | | | |
Exports | | | 8 | | | | 25 | | | | 27 | | | | 31 | | | | 31 | | | | 47 | | | | 47 | | | | 28 | |
Imports | | | 17 | | | | 25 | | | | 40 | | | | 19 | | | | 19 | | | | 21 | | | | 21 | | | | 11 | |
Other personal, cultural and recreational services | | | 4 | | | | (8 | ) | | | (5 | ) | | | 10 | | | | 10 | | | | 19 | | | | 19 | | | | 8 | |
| | | | | | | | | | | | | | | | | | | | | | | | | | | | | | | | |
Exports | | | 13 | | | | 9 | | | | 14 | | | | 29 | | | | 29 | | | | 32 | | | | 32 | | | | 17 | |
Imports | | | 9 | | | | 17 | | | | 19 | | | | 19 | | | | 19 | | | | 13 | | | | 13 | | | | 10 | |
Government services | | | (209 | ) | | | (221 | ) | | | (231 | ) | | | (289 | ) | | | (289 | ) | | | (285 | ) | | | (285 | ) | | | (116 | ) |
| | | | | | | | | | | | | | | | | | | | | | | | | | | | | | | | |
Exports | | | 0 | | | | 0 | | | | 0 | | | | 12 | | | | 12 | | | | 12 | | | | 12 | | | | 6 | |
Imports | | | 209 | | | | 221 | | | | 231 | | | | 301 | | | | 301 | | | | 297 | | | | 297 | | | | 122 | |
Source: Bangko Sentral.
Notes:
| (1) | Figures reported pursuant to BPM5. |
| (2) | Revised to reflect data updates from official sources. |
| (3) | Figures reported pursuant to BPM6. |
| (5) | Preliminary data for the first six months of 2013. |
| (6) | Under the revised BPM6 reporting methodology, goods that are imported into the Philippines on a consignment basis for purposes of repair or improvement within the Philippines and then exported back to their country of origin such that no change in ownership occurs are recognized under the services account rather than the goods account. There have also been certain corresponding reclassifications of items from the services account to the goods account. |
| (7) | Under the revised BPM6 reporting methodology, communication services has been renamed telecommunication services and is combined with the computer and information services account, which is reported as the telecommunications, computer and information services account. Telecommunication services is presented here on a stand-alone basis for convenience. |
69
| (8) | Under the revised BPM6 reporting methodology, insurance services has been renamed insurance and pension services. |
| (9) | Under the revised BPM6 reporting methodology, royalties and license fees has been renamed charges for the use of intellectual property. |
In 2009, the trade-in-services account on a BPM5 basis recorded a surplus of $2.1 billion, an 82.2% increase from the $1.2 billion surplus recorded in 2008. This higher surplus was mainly attributable to higher net receipts from the other business services account, which increased 26.0% to $3.9 billion in 2009 from $3.1 billion in 2008, in addition to increased outflows in computer and information services and construction services. Lower net outflows from transportation services also contributed to the increase in the trade-in services surplus.
In 2010, the trade-in-services account on a BPM5 basis recorded a surplus of $2.7 billion, a 29.4% increase from the $2.1 billion surplus recorded in 2009. The higher surplus was mainly attributable to significantly higher net inflows in other business services, which increased to $6.0 billion in 2010 from $3.9 billion in 2009 and high net inflows from computer and information services and construction services, partially due to continued growth in the export of BPO-related services, as outsourcing operations continued to expand, particularly in the animation industry. The surplus was partially offset by higher outflows in transportation services to $3.6 billion in 2010 from $2.5 billion in 2009.
In 2011, the trade-in-services account on a BPM5 basis recorded a surplus of $4.2 billion, a 52.1% increase from the $2.7 billion surplus recorded in 2010. This increase resulted mainly from higher net receipts in technical, trade-related and other business services, which increased by 27.3% to $8.0 billion in 2011 from $6.3 billion in 2010. Also contributing to the increase in surplus was net receipts for other business services, which increased by 29.7% to $7.8 billion in 2011 from $6.0 billion in 2010. Lower net payments for transportation, travel and royalties and license fees also contributed to the surplus.
In 2012, the trade-in-services account on a BPM6 basis recorded a surplus of $3.9 billion, a 26.1% decrease from the $5.3 billion surplus recorded in 2011. This decrease was mainly attributable to lower net receipts in other business services, which decreased by 6.1% to $8.5 billion in 2012 from $9.0 billion in 2011, as well as higher net payments in transportation, which increased by 17.1% to $3.3 billion in 2012 from $2.8 billion in 2011. Lower net receipts in computer and information services of $1.9 billion in 2012, a decrease of 14.2% from $2.2 billion in 2011 also contributed to the decline in the surplus.
In the first six months of 2013, the surplus in the trade-in-services account on a BPM6 basis increased by 12.3% to $1.9 billion from the $1.7 billion recorded in the same period in 2012. This increase was mainly attributable to lower net payments in transportation, which decreased 9.4% to $1.5 billion in the first six months of 2013 from $1.7 billion in the same period in 2012, as well as lower net payments for the use of intellectual property, which decreased 36.4% to $278 million in the first six months of 2013 from $437 million in the same period in 2012. The increase in the surplus in the trade-in-services account was partially offset by a substantial increase in net payments for maintenance and repair services to $66 million in the first six months of 2013 from $6 million in the same period in 2012.
Income
The following table sets out the Republic’s income for the periods indicated. Entries with “zero” balances indicate either that there were no relevant transactions during the period or that the Republic had not yet begun to track and record the relevant entry. Under the BPM5, the residency of seasonal workers, such as OFWs, is classified according to the length of their intended stay in the host country. Generally, OFWs who are expected to be working abroad for less than one year are classified as Philippine residents and their gross earnings are reflected under the income account. On the other hand, OFWs who are expected to be working abroad for one year or more are classified as non-residents and their remittances are reflected under the current transfers account. Under the BPM6, Bangko Sentral applies the same OFW residency standard as under the BPM5; however, BPM6 adds a supplementary personal remittances account that aggregates all OFW remittances irrespective of OFWs’ intended stay in the host country in order to facilitate analysis of all transfers from households outside the Philippines to those within the Philippines without the need to add the resident and non-resident OFW remittances accounts. Figures from 2011 onward also reflect the change in treatment of the property income and expense accounts pursuant to BPM6.
70
| | | | | | | | | | | | | | | | | | | | | | | | | | | | | | | | |
| | | Income | |
| | | 2008(1) | | | 2009(1) | | | 2010(1) | | | 2011(1) | | | 2011(2) | | | 2012(1)(3) | | | 2012(2)(3) | | | 2013(2)(4) | |
| | | ($ in millions) | |
Total Income | | | 105 | | | | (193 | ) | | | 505 | | | | 237 | | | | 280 | | | | (871 | ) | | | (746 | ) | | | (624 | ) |
| | | | | | | | | | | | | | | | | | | | | | | | | | | | | | | | |
Receipts | | | 5,973 | | | | 5,712 | | | | 6,093 | | | | 7,188 | | | | 7,203 | | | | 7,732 | | | | 7,774 | | | | 3,885 | |
Payments | | | 5,868 | | | | 5,905 | | | | 5,588 | | | | 6,951 | | | | 6,923 | | | | 8,603 | | | | 8,520 | | | | 4,509 | |
Compensation of employees | | | 4,092 | | | | 4,585 | | | | 5,127 | | | | 5,757 | | | | 5,757 | | | | 6,414 | | | | 6,414 | | | | 3,322 | |
| | | | | | | | | | | | | | | | | | | | | | | | | | | | | | | | |
Receipts | | | 4,092 | | | | 4,585 | | | | 5,127 | | | | 5,858 | | | | 5,858 | | | | 6,530 | | | | 6,530 | | | | 3,404 | |
Payments | | | 0 | | | | 0 | | | | 0 | | | | 101 | | | | 101 | | | | 116 | | | | 116 | | | | 83 | |
Investment income | | | (3,987 | ) | | | (4,778 | ) | | | (4,622 | ) | | | (5,520 | ) | | | (5,477 | ) | | | (7,285 | ) | | | (7,160 | ) | | | (3,946 | ) |
| | | | | | | | | | | | | | | | | | | | | | | | | | | | | | | | |
Receipts | | | 1,881 | | | | 1,127 | | | | 966 | | | | 1,330 | | | | 1,345 | | | | 1,202 | | | | 1,244 | | | | 480 | |
Payments | | | 5,868 | | | | 5,905 | | | | 5,588 | | | | 6,850 | | | | 6,822 | | | | 8,487 | | | | 8,404 | | | | 4,426 | |
Direct investment income | | | (1,643 | ) | | | (2,078 | ) | | | (2,009 | ) | | | (2,823 | ) | | | (2,817 | ) | | | (4,166 | ) | | | (4,162 | ) | | | (2,009 | ) |
Receipts | | | 32 | | | | 72 | | | | 116 | | | | 108 | | | | 108 | | | | 75 | | | | 75 | | | | 42 | |
Payments | | | 1,675 | | | | 2,150 | | | | 2,125 | | | | 2,931 | | | | 2,925 | | | | 4,241 | | | | 4,237 | | | | 2,051 | |
Income on equity | | | (1,543 | ) | | | (2,025 | ) | | | (1,931 | ) | | | (2,768 | ) | | | (2,768 | ) | | | (4,109 | ) | | | (4,109 | ) | | | (1,999 | ) |
Receipts | | | 28 | | | | 70 | | | | 116 | | | | 105 | | | | 105 | | | | 70 | | | | 70 | | | | 36 | |
Payments | | | 1,571 | | | | 2,095 | | | | 2,047 | | | | 2,873 | | | | 2,873 | | | | 4,179 | | | | 4,179 | | | | 2,035 | |
Dividends and distributed branch profits | | | (1,490 | ) | | | (1,870 | ) | | | (1,749 | ) | | | (1,786 | ) | | | (1,786 | ) | | | (3,049 | ) | | | (3,049 | ) | | | (1,613 | ) |
Receipts | | | 28 | | | | 70 | | | | 116 | | | | 104 | | | | 104 | | | | 69 | | | | 69 | | | | 36 | |
Payments | | | 1,518 | | | | 1,940 | | | | 1,865 | | | | 1,890 | | | | 1,890 | | | | 3,118 | | | | 3,118 | | | | 1,649 | |
Reinvested earnings and undistributed branch profits | | | (53 | ) | | | (155 | ) | | | (182 | ) | | | (982 | ) | | | (982 | ) | | | (1,060 | ) | | | (1,060 | ) | | | (386 | ) |
Receipts | | | 0 | | | | 0 | | | | 0 | | | | 1 | | | | 1 | | | | 1 | | | | 1 | | | | 0 | |
Payments | | | 53 | | | | 155 | | | | 182 | | | | 983 | | | | 983 | | | | 1,061 | | | | 1,061 | | | | 386 | |
Income on debt (interest) | | | (100 | ) | | | (53 | ) | | | (78 | ) | | | (55 | ) | | | (49 | ) | | | (57 | ) | | | (53 | ) | | | (10 | ) |
Receipts | | | 4 | | | | 2 | | | | 0 | | | | 3 | | | | 3 | | | | 5 | | | | 5 | | | | 6 | |
Payments | | | 104 | | | | 55 | | | | 78 | | | | 58 | | | | 52 | | | | 62 | | | | 58 | | | | 16 | |
Portfolio investment income | | | (1,321 | ) | | | (1,738 | ) | | | (1,938 | ) | | | (2,028 | ) | | | (2,789 | ) | | | (2,377 | ) | | | (3,093 | ) | | | (2,029 | ) |
Receipts | | | 1,259 | | | | 887 | | | | 688 | | | | 872 | | | | 111 | | | | 829 | | | | 113 | | | | 55 | |
Payments | | | 2,580 | | | | 2,625 | | | | 2,626 | | | | 2,900 | | | | 2,900 | | | | 3,206 | | | | 3,206 | | | | 2,085 | |
Income on equity (dividends) | | | (952 | ) | | | (1,049 | ) | | | (915 | ) | | | (861 | ) | | | (861 | ) | | | (1,011 | ) | | | (1,011 | ) | | | (998 | ) |
Receipts | | | 9 | | | | 0 | | | | 0 | | | | 0 | | | | 0 | | | | 0 | | | | 0 | | | | 1 | |
Payments | | | 961 | | | | 1,049 | | | | 915 | | | | 861 | | | | 861 | | | | 1,011 | | | | 1,011 | | | | 999 | |
Banks | | | (109 | ) | | | (92 | ) | | | (103 | ) | | | (102 | ) | | | (102 | ) | | | (111 | ) | | | (111 | ) | | | (108 | ) |
Other sectors | | | (843 | ) | | | (957 | ) | | | (812 | ) | | | (759 | ) | | | (759 | ) | | | (900 | ) | | | (900 | ) | | | (890 | ) |
Receipts | | | 9 | | | | 0 | | | | 0 | | | | 0 | | | | 0 | | | | 0 | | | | 0 | | | | 0 | |
Payments | | | 852 | | | | 957 | | | | 812 | | | | 759 | | | | 759 | | | | 900 | | | | 900 | | | | 891 | |
Income on debt (interest) | | | (369 | ) | | | (689 | ) | | | (1,023 | ) | | | (1,167 | ) | | | (1,928 | ) | | | (1,366 | ) | | | (2,082 | ) | | | (1,031 | ) |
Receipts | | | 1,250 | | | | 887 | | | | 688 | | | | 872 | | | | 111 | | | | 829 | | | | 113 | | | | 55 | |
Payments | | | 1,619 | | | | 1,576 | | | | 1,711 | | | | 2,039 | | | | 2,039 | | | | 2,195 | | | | 2,195 | | | | 1,086 | |
Bonds and notes | | | (370 | ) | | | (690 | ) | | | (1,023 | ) | | | (929 | ) | | | (1,690 | ) | | | (1,067 | ) | | | (1,783 | ) | | | (836 | ) |
Receipts | | | 1,249 | | | | 886 | | | | 688 | | | | 871 | | | | 110 | | | | 829 | | | | 113 | | | | 54 | |
Payments | | | 1,619 | | | | 1,576 | | | | 1,711 | | | | 1,800 | | | | 1,800 | | | | 1,896 | | | | 1,896 | | | | 890 | |
Monetary authorities | | | 923 | | | | 734 | | | | 556 | | | | 740 | | | | (21 | ) | | | 696 | | | | (20 | ) | | | (7 | ) |
Receipts | | | 954 | | | | 767 | | | | 582 | | | | 761 | | | | 0 | | | | 716 | | | | 0 | | | | 0 | |
Payments | | | 31 | | | | 33 | | | | 26 | | | | 21 | | | | 21 | | | | 20 | | | | 20 | | | | 7 | |
General government | | | (1,140 | ) | | | (1,108 | ) | | | (1,241 | ) | | | (1,271 | ) | | | (1,271 | ) | | | (1,381 | ) | | | (1,381 | ) | | | (638 | ) |
Banks | | | (68 | ) | | | (50 | ) | | | (31 | ) | | | (47 | ) | | | (47 | ) | | | (60 | ) | | | (60 | ) | | | (35 | ) |
71
| | | | | | | | | | | | | | | | | | | | | | | | | | | | | | | | |
| | | Income | |
| | | 2008(1) | | | 2009(1) | | | 2010(1) | | | 2011(1) | | | 2011(2) | | | 2012(1)(3) | | | 2012(2)(3) | | | 2013(2)(4) | |
| | | ($ in millions) | |
Other sectors | | | (85 | ) | | | (266 | ) | | | (307 | ) | | | (351 | ) | | | (351 | ) | | | (322 | ) | | | (322 | ) | | | (156 | ) |
Receipts | | | 295 | | | | 119 | | | | 106 | | | | 110 | | | | 110 | | | | 113 | | | | 113 | | | | 54 | |
Payments | | | 380 | | | | 385 | | | | 413 | | | | 461 | | | | 461 | | | | 435 | | | | 435 | | | | 210 | |
Money market instruments | | | 1 | | | | 1 | | | | 0 | | | | (238 | ) | | | (238 | ) | | | (299 | ) | | | (299 | ) | | | (196 | ) |
Receipts | | | 1 | | | | 1 | | | | 0 | | | | 1 | | | | 1 | | | | 0 | | | | 0 | | | | 0 | |
Payments | | | 0 | | | | 0 | | | | 0 | | | | 239 | | | | 239 | | | | 299 | | | | 299 | | | | 196 | |
General government | | | 0 | | | | 0 | | | | 0 | | | | (239 | ) | | | (239 | ) | | | (299 | ) | | | (299 | ) | | | (196 | ) |
Other sectors | | | 1 | | | | 1 | | | | 0 | | | | 1 | | | | 1 | | | | 0 | | | | 0 | | | | 0 | |
Receipts | | | 1 | | | | 1 | | | | 0 | | | | 1 | | | | 1 | | | | 0 | | | | 0 | | | | 0 | |
Payments | | | 0 | | | | 0 | | | | 0 | | | | 0 | | | | 0 | | | | 0 | | | | 0 | | | | 0 | |
Other investment income | | | (1,023 | ) | | | (962 | ) | | | (675 | ) | | | (669 | ) | | | (670 | ) | | | (742 | ) | | | (634 | ) | | | (204 | ) |
Receipts | | | 590 | | | | 168 | | | | 162 | | | | 350 | | | | 327 | | | | 298 | | | | 327 | | | | 87 | |
Payments | | | 1,613 | | | | 1,130 | | | | 837 | | | | 1,019 | | | | 997 | | | | 1,040 | | | | 961 | | | | 291 | |
Monetary authorities | | | 194 | | | | 26 | | | | 61 | | | | 32 | | | | (6 | ) | | | 11 | | | | (2 | ) | | | 0 | |
Receipts | | | 206 | | | | 56 | | | | 63 | | | | 38 | | | | 0 | | | | 13 | | | | 0 | | | | 0 | |
Payments | | | 12 | | | | 30 | | | | 2 | | | | 6 | | | | 6 | | | | 2 | | | | 2 | | | | 0 | |
General government | | | (463 | ) | | | (437 | ) | | | (413 | ) | | | (405 | ) | | | (377 | ) | | | (368 | ) | | | (335 | ) | | | (115 | ) |
Banks | | | (125 | ) | | | (50 | ) | | | 17 | | | | 11 | | | | (59 | ) | | | (89 | ) | | | (123 | ) | | | (52 | ) |
Receipts | | | 339 | | | | 70 | | | | 59 | | | | 281 | | | | 250 | | | | 236 | | | | 202 | | | | 36 | |
Payments | | | 464 | | | | 120 | | | | 42 | | | | 270 | | | | 309 | | | | 325 | | | | 325 | | | | 88 | |
Other sectors | | | (629 | ) | | | (501 | ) | | | (340 | ) | | | (307 | ) | | | (228 | ) | | | (296 | ) | | | (174 | ) | | | (36 | ) |
Receipts | | | 45 | | | | 42 | | | | 40 | | | | 31 | | | | 77 | | | | 49 | | | | 125 | | | | 51 | |
Payments | | | 674 | | | | 543 | | | | 380 | | | | 338 | | | | 305 | | | | 345 | | | | 299 | | | | 87 | |
Source: Bangko Sentral.
Notes:
| (1) | Figures reported pursuant to BPM5. |
| (2) | Figures reported pursuant to BPM6. |
| (4) | Preliminary data for first six months of 2013. |
In 2009, the income account on a BPM5 basis recorded a deficit of $193 million, compared with the $105 million surplus recorded in the previous year. The main contributor to the deficit was the $4.8 billion net outflow in investment income, compared with a $4.0 billion outflow in 2008. The deficit was partially offset by a $4.6 billion surplus in the compensation of employees in 2009, compared with a surplus of $4.1 billion in the prior year.
In 2010, the income account on a BPM5 basis recorded a surplus of $505 million, compared with the $193 million deficit recorded in 2009. The stronger performance of the income account was primarily the result of an 11.8% increase in compensation of employees to $5.1 billion in 2010, compared to the $4.6 billion surplus recorded in 2009. This surplus was partially offset by a $4.6 billion deficit in investment income in 2010, compared with a deficit of $4.8 billion in the prior year.
In 2011, the income account on a BPM5 basis recorded a surplus of $237 million, a decrease from the $505 million surplus recorded in 2010. The lower surplus was primarily the result of a higher deficit in investment income, which increased by 19.4% to a deficit of $5.5 billion in 2011, compared to a deficit of $4.6 billion in 2010. This deficit was offset in part by a 12.3% increase in compensation of employees to $5.8 billion in 2011 from the $5.1 billion recorded in 2010.
72
In 2012, the income account on a BPM6 basis recorded a deficit of $746 million compared with a surplus of $280 million in 2011. The deficit was mainly due to the $7.2 billion net outflows in investment income compared with the $5.5 billion outflow in 2011. The deficit was partially offset by an 11.4% increase in the compensation earnings of resident OFWs to $6.4 billion in 2012 from the $5.8 billion recorded in 2011.
In the first six months of 2013, the income account on a BPM6 basis recorded a deficit of $624 million from a deficit of $603 million in the same period in 2012. The deficit was mainly due to higher net payments in investment income, which were only partially offset by the increase in remittances from resident OFWs.
Current Transfers
The following table sets out the Republic’s current transfers for the periods indicated. Current transfers primarily include OFW remittances, as well as private and institutional gifts, donations and grants. As described above under “—Income,” under the BPM5, the residency of seasonal workers such as OFWs is classified according to the intended length of their stay in the host country while BPM6 adds a supplementary personal transfers account that aggregates all remittances, including those from non-OFW permanent migrants abroad. Figures from 2011 onward also reflect the change in treatment of the property income and expense accounts pursuant to BPM6.
| | | | | | | | | | | | | | | | | | | | | | | | | | | | | | | | |
| | | Current Transfers | |
| | | 2008(1) | | | 2009(1) | | | 2010(1) | | | 2011(1) | | | 2011(2) | | | 2012(1)(3) | | | 2012(2)(3) | | | 2013(2)(4) | |
| | | ($ in millions) | |
Total current transfers(5) | | | 15,247 | | | | 16,279 | | | | 16,648 | | | | 18,380 | | | | 18,380 | | | | 19,172 | | | | 19,172 | | | | 9,531 | |
| | | | | | | | | | | | | | | | | | | | | | | | | | | | | | | | |
Receipts | | | 15,780 | | | | 16,910 | | | | 17,478 | | | | 18,852 | | | | 18,852 | | | | 19,718 | | | | 19,718 | | | | 9,831 | |
Payments | | | 533 | | | | 631 | | | | 830 | | | | 472 | | | | 472 | | | | 546 | | | | 546 | | | | 300 | |
| | | | | | | | | | | | | | | | | | | | | | | | | | | | | | | | |
General Government | | | 302 | | | | 454 | | | | 247 | | | | 614 | | | | 614 | | | | 593 | | | | 593 | | | | 258 | |
Receipts | | | 451 | | | | 640 | | | | 350 | | | | 655 | | | | 655 | | | | 643 | | | | 643 | | | | 290 | |
Payments | | | 149 | | | | 186 | | | | 103 | | | | 41 | | | | 41 | | | | 50 | | | | 50 | | | | 33 | |
| | | | | | | | | | | | | | | | | | | | | | | | | | | | | | | | |
Other sectors | | | 14,945 | | | | 15,825 | | | | 16,401 | | | | 17,766 | | | | 17,766 | | | | 18,579 | | | | 18,579 | | | | 9,273 | |
Receipts | | | 15,329 | | | | 16,270 | | | | 17,128 | | | | 18,197 | | | | 18,197 | | | | 19,075 | | | | 19,075 | | | | 9,541 | |
Payments | | | 384 | | | | 445 | | | | 727 | | | | 431 | | | | 431 | | | | 496 | | | | 496 | | | | 267 | |
| | | | | | | | | | | | | | | | | | | | | | | | | | | | | | | | |
Personal transfers(6) | | | 14,536 | | | | 15,141 | | | | 16,242 | | | | 17,138 | | | | 17,168 | | | | 17,979 | | | | 18,065 | | | | 9,046 | |
Receipts | | | 14,536 | | | | 15,141 | | | | 16,242 | | | | 17,138 | | | | 17,200 | | | | 17,979 | | | | 18,111 | | | | 9,071 | |
Payments | | | 0 | | | | 0 | | | | 0 | | | | 0 | | | | 32 | | | | 0 | | | | 46 | | | | 26 | |
| | | | | | | | | | | | | | | | | | | | | | | | | | | | | | | | |
Other transfers(6) | | | 409 | | | | 684 | | | | 159 | | | | 628 | | | | 598 | | | | 600 | | | | 514 | | | | 227 | |
Receipts | | | 793 | | | | 1,129 | | | | 886 | | | | 1,059 | | | | 997 | | | | 1,096 | | | | 964 | | | | 469 | |
Payments | | | 384 | | | | 445 | | | | 727 | | | | 431 | | | | 399 | | | | 496 | | | | 450 | | | | (242 | ) |
Source: Bangko Sentral.
Notes:
| (1) | Figures reported pursuant to BPM5. |
| (2) | Figures reported pursuant to BPM6. |
| (4) | Preliminary data for the first six months of 2013. |
| (5) | Under the revised BPM6 reporting methodology, current transfers has been renamed secondary income. |
| (6) | Under the BPM5 reporting methodology, the personal transfers account is known as “workers’ remittances” and comprises solely remittances from OFWs. Under the BPM6 reporting methodology, personal transfers includes all transfers from households outside the Philippines to those within the Philippines, including transfers from non-OFW permanent migrants abroad. Under the BPM5 reporting methodology, transfers from permanent migrants appear under the other transfers account. |
73
In 2009, the current transfers account on a BPM5 basis recorded a surplus of $16.3 billion, 6.8% higher than the $15.2 billion surplus recorded in 2008, due mainly to the strong inflow of remittances from non-resident OFWs, notwithstanding the global economic slowdown. Remittances from non-resident OFWs reached $15.1 billion in 2009, representing a 4.2% increase from remittances of $14.5 billion recorded in 2008.
In 2010, the current transfers account on a BPM5 basis recorded a surplus of $16.6 billion, a 2.3% increase from the $16.3 billion surplus recorded in 2009. This higher surplus was primarily the result of a 7.3% increase in non-resident OFW remittances to $16.2 billion in 2010, compared to the $15.1 billion recorded in 2009.
The current transfers account on a BPM5 basis recorded a surplus of $18.4 billion in 2011, 10.4% higher than the $16.6 billion surplus recorded in 2010. The increased surplus was due mainly to a 5.5% increase in remittances of non-resident OFWs to $17.1 billion in 2011 compared to $16.2 billion in 2010.
In 2012, the current transfers account on a BPM6 basis recorded a surplus of $19.2 billion, a 4.3% increase from the $18.4 billion surplus recorded in 2011. The increased surplus was due mainly to higher remittances from non-resident OFWs, which increased by 4.9% to $18 billion in 2012 from $17.1 billion in 2011.
In the first half of 2013, the current transfers account on a BPM6 basis recorded a surplus of $9.5 billion, a 5.1% increase from the $9.1 billion surplus recorded in the comparable period in 2012. The increased surplus was due mainly to a 5.1% increase in remittances recorded from non-resident OFWs amounting to $8.4 billion.
Financial Account
The financial account is divided into four categories: direct investments, portfolio investments, financial derivative investments and other investments.
The following table sets out the Republic’s direct investments for the periods indicated.
| | | | | | | | | | | | | | | | | | | | | | | | | | | | | | | | |
| | | Direct Investments | |
| | | 2008(1) | | | 2009(1) | | | 2010(1) | | | 2011(1) | | | 2011(2) | | | 2012(1)(3) | | | 2012(2)(3) | | | 2013(2)(4) | |
| | | ($ in millions) | |
Total direct investment | | | 1,285 | | | | 1,604 | | | | 682 | | | | 1,513 | | | | 1,277 | | | | 341 | | | | 952 | | | | 1,417 | |
| | | | | | | | | | | | | | | | | | | | | | | | | | | | | | | | |
Assets: Residents’ investments abroad | | | 259 | | | | 359 | | | | 616 | | | | 339 | | | | 539 | | | | 1,692 | | | | 1,845 | | | | 771 | |
| | | | | | | | | | | | | | | | | | | | | | | | | | | | | | | | |
Equity capital | | | 259 | | | | 359 | | | | 616 | | | | 228 | | | | 228 | | | | 1,189 | | | | 1,189 | | | | 439 | |
Placements | | | 259 | | | | 359 | | �� | | 616 | | | | 228 | | | | 279 | | | | 1,189 | | | | 1,232 | | | | 471 | |
Withdrawals | | | — | | | | — | | | | — | | | | — | | | | 51 | | | | — | | | | 43 | | | | 32 | |
Reinvested earnings | | | — | | | | — | | | | — | | | | 1 | | | | 1 | | | | 1 | | | | 1 | | | | — | |
Other capital | | | — | | | | — | | | | — | | | | 110 | | | | 310 | | | | 502 | | | | 655 | | | | 332 | |
Claims on affiliated enterprises | | | — | | | | — | | | | — | | | | 310 | | | | 310 | | | | 655 | | | | 655 | | | | 332 | |
Liabilities to affiliated enterprises | | | — | | | | — | | | | — | | | | 200 | | | | — | | | | 153 | | | | — | | | | — | |
Liabilities: Non-residents’ investments in the Philippines | | | 1,544 | | | | 1,963 | | | | 1,298 | | | | 1,852 | | | | 1,816 | | | | 2,033 | | | | 2,797 | | | | 2,188 | |
| | | | | | | | | | | | | | | | | | | | | | | | | | | | | | | | |
Equity capital | | | 1,235 | | | | 1,731 | | | | (396 | ) | | | 558 | | | | 1,541 | | | | 1,345 | | | | 2,406 | | | | 1,024 | |
Liabilities to direct investors | | | 1,235 | | | | 1,731 | | | | (396 | ) | | | 558 | | | | 558 | | | | 1,345 | | | | 1,345 | | | | 638 | |
Placements | | | 1,458 | | | | 2,008 | | | | 1,235 | | | | 1,021 | | | | 1,021 | | | | 1,635 | | | | 1,635 | | | | 1,954 | |
Withdrawals | | | 223 | | | | 277 | | | | 1,631 | | | | 463 | | | | 463 | | | | 290 | | | | 290 | | | | 1,316 | |
Reinvested earnings | | | 53 | | | | 155 | | | | 182 | | | | 983 | | | | 983 | | | | 1,061 | | | | 1,061 | | | | 386 | |
Other capital | | | 256 | | | | 77 | | | | 1,512 | | | | 311 | | | | 275 | | | | (373 | ) | | | 391 | | | | 1,165 | |
Claims on direct investors | | | (108 | ) | | | 749 | | | | 337 | | | | 400 | | | | 75 | | | | 406 | | | | 238 | | | | 465 | |
Liabilities to direct investors | | | 148 | | | | 826 | | | | 1,849 | | | | 711 | | | | 200 | | | | 33 | | | | 153 | | | | 700 | |
Source: Bangko Sentral.
74
Notes:
| (1) | Figures reported pursuant to BPM5. |
| (2) | Figures reported pursuant to BPM6. |
| (4) | Preliminary data for the first six months of 2013. |
The following table sets out the Republic’s portfolio investments for the periods indicated.
| | | | | | | | | | | | | | | | | | | | | | | | | | | | | | | | |
| | | Portfolio Investments | |
| | | 2008(1) | | | 2009(1) | | | 2010(1) | | | 2011(1) | | | 2011(2) | | | 2012(1)(3) | | | 2012(2)(3) | | | 2013(2)(4) | |
| | | ($ in millions) | |
Portfolio Investment | | | (3,627 | ) | | | (625 | ) | | | 4,365 | | | | 4,390 | | | | 4,390 | | | | 3,523 | | | | 3,523 | | | | 2,091 | |
| | | | | | | | | | | | | | | | | | | | | | | | | | | | | | | | |
Assets: Residents’ investments abroad | | | (789 | ) | | | 2,715 | | | | 2,872 | | | | (277 | ) | | | (277 | ) | | | 1,204 | | | | 1,204 | | | | (681 | ) |
| | | | | | | | | | | | | | | | | | | | | | | | | | | | | | | | |
Equity securities | | | (75 | ) | | | 44 | | | | 2 | | | | 37 | | | | 37 | | | | 200 | | | | 200 | | | | 155 | |
Banks | | | (14 | ) | | | 8 | | | | (9 | ) | | | 18 | | | | 18 | | | | 6 | | | | 6 | | | | 4 | |
Other sectors | | | (61 | ) | | | 36 | | | | 11 | | | | 19 | | | | 19 | | | | 194 | | | | 194 | | | | 152 | |
Debt securities | | | (714 | ) | | | 2,671 | | | | 2,870 | | | | (314 | ) | | | (314 | ) | | | 1,004 | | | | 1,004 | | | | (836 | ) |
Bonds | | | (160 | ) | | | 2,089 | | | | 2,889 | | | | (130 | ) | | | (130 | ) | | | 111 | | | | 111 | | | | (1,162 | ) |
Banks | | | (625 | ) | | | 465 | | | | 1,423 | | | | (205 | ) | | | (205 | ) | | | 198 | | | | 198 | | | | (907 | ) |
Other sectors | | | 465 | | | | 1,624 | | | | 1,466 | | | | 75 | | | | 75 | | | | (87 | ) | | | (87 | ) | | | (255 | ) |
Money-market instruments | | | (554 | ) | | | 582 | | | | (19 | ) | | | (184 | ) | | | (184 | ) | | | 893 | | | | 893 | | | | 326 | |
Banks | | | (605 | ) | | | 254 | | | | (593 | ) | | | (133 | ) | | | (133 | ) | | | 836 | | | | 836 | | | | (1 | ) |
Other sectors | | | 51 | | | | 328 | | | | 574 | | | | (51 | ) | | | (51 | ) | | | 57 | | | | 57 | | | | 327 | |
Liabilities: Non-residents’ Investments in the Philippines | | | (4,416 | ) | | | 2,090 | | | | 7,237 | | | | 4,113 | | | | 4,113 | | | | 4,727 | | | | 4,727 | | | | 1,410 | |
| | | | | | | | | | | | | | | | | | | | | | | | | | | | | | | | |
Equity securities | | | (1,289 | ) | | | (1,096 | ) | | | 503 | | | | 1,046 | | | | 1,046 | | | | 1,728 | | | | 1,728 | | | | 206 | |
Banks | | | (48 | ) | | | 18 | | | | 162 | | | | 38 | | | | 38 | | | | 126 | | | | 126 | | | | (129 | ) |
Other sectors | | | (1,241 | ) | | | (1,114 | ) | | | 341 | | | | 1,008 | | | | 1,008 | | | | 1,602 | | | | 1,602 | | | | 334 | |
Debt securities | | | (3,127 | ) | | | 3,186 | | | | 6,734 | | | | 3,067 | | | | 3,067 | | | | 2,999 | | | | 2,999 | | | | 1,204 | |
Bonds | | | (3,126 | ) | | | 3,139 | | | | 6,733 | | | | 1,029 | | | | 1,029 | | | | 2,269 | | | | 2,269 | | | | 479 | |
Monetary authorities | | | (34 | ) | | | (102 | ) | | | (200 | ) | | | (2 | ) | | | (2 | ) | | | (13 | ) | | | (13 | ) | | | 9 | |
General government | | | (1,068 | ) | | | 2,846 | | | | 6,005 | | | | (355 | ) | | | (355 | ) | | | 883 | | | | 883 | | | | (716 | ) |
Banks | | | (182 | ) | | | 49 | | | | 778 | | | | 1,249 | | | | 1,249 | | | | 886 | | | | 886 | | | | 303 | |
Other sectors | | | (1,842 | ) | | | 346 | | | | 150 | | | | 137 | | | | 137 | | | | 513 | | | | 513 | | | | 883 | |
Money-market instruments | | | (1 | ) | | | 47 | | | | 1 | | | | 2,038 | | | | 2,038 | | | | 730 | | | | 730 | | | | 724 | |
General government | | | 0 | | | | 0 | | | | 0 | | | | 2,031 | | | | 2,031 | | | | 1,090 | | | | 1,090 | | | | 725 | |
Other sectors | | | (1 | ) | | | 47 | | | | 1 | | | | 7 | | | | 7 | | | | (360 | ) | | | (360 | ) | | | (1 | ) |
Source: Bangko Sentral.
Notes:
| (1) | Figures reported pursuant to BPM5. |
| (2) | Figures reported pursuant to BPM6. |
| (4) | Preliminary data for the first six months of 2013. |
75
The following table sets out the Republic’s financial derivative investments for the periods indicated.
| | | | | | | | | | | | | | | | | | | | | | | | | | | | | | | | |
| | | Financial Derivative Investments | |
| | | 2008(1) | | | 2009(1) | | | 2010(1) | | | 2011(1) | | | 2011(2) | | | 2012(1)(3) | | | 2012(2)(3) | | | 2013(2)(4) | |
| | | ($ in millions) | |
Total financial derivatives | | | (113 | ) | | | 32 | | | | (191 | ) | | | 1,002 | | | | 1,002 | | | | 13 | | | | 13 | | | | 23 | |
| | | | | | | | | | | | | | | | | | | | | | | | | | | | | | | | |
Assets | | | (541 | ) | | | (403 | ) | | | (429 | ) | | | (1,541 | ) | | | (1,541 | ) | | | (276 | ) | | | (276 | ) | | | (125 | ) |
| | | | | | | | | | | | | | | | | | | | | | | | | | | | | | | | |
Banks | | | (439 | ) | | | (234 | ) | | | (385 | ) | | | (1,529 | ) | | | (1,529 | ) | | | (267 | ) | | | (267 | ) | | | (117 | ) |
Other sectors(5) | | | (102 | ) | | | (169 | ) | | | (44 | ) | | | (12 | ) | | | (12 | ) | | | (9 | ) | | | (9 | ) | | | (8 | ) |
Liabilities | | | (654 | ) | | | (371 | ) | | | (620 | ) | | | (539 | ) | | | (539 | ) | | | (263 | ) | | | (263 | ) | | | (147 | ) |
| | | | | | | | | | | | | | | | | | | | | | | | | | | | | | | | |
Banks | | | (353 | ) | | | (204 | ) | | | (569 | ) | | | (516 | ) | | | (516 | ) | | | (261 | ) | | | (261 | ) | | | (139 | ) |
Other sectors(5) | | | (301 | ) | | | (167 | ) | | | (51 | ) | | | (23 | ) | | | (23 | ) | | | (2 | ) | | | (2 | ) | | | (9 | ) |
Source: Bangko Sentral.
Notes:
| (1) | Figures reported pursuant to BPM5. |
| (2) | Figures reported pursuant to BPM6. |
| (4) | Preliminary data for the first six months of 2013. |
| (5) | Includes financial institutions with quasi-banking licenses. |
From 2008 to October 2013, the Government did not engage in derivative transactions for either hedging or speculative purposes. However, Bangko Sentral occasionally engages in derivative instrument transactions such as options, forwards and swaps for purposes of managing risk and enhancing yield.
76
The following table sets out the Republic’s other investments for the periods indicated. Bangko Sentral revised the Republic’s other investment numbers for 2011; therefore, the data included in this table may be different from previously reported data.
| | | | | | | | | | | | | | | | | | | | | | | | | | | | | | | | |
| | | Other Investments | |
| | | 2008(1) | | | 2009(1) | | | 2010(1)(2) | | | 2011(1) | | | 2011(3) | | | 2012(1)(4) | | | 2012(3)(4) | | | 2013(3)(5) | |
| | | ($ in millions) | |
Total other investment | | | 753 | | | | (2,742 | ) | | | 2,434 | | | | (1,059 | ) | | | (1,059 | ) | | | 1,643 | | | | 1,643 | | | | (2,681 | ) |
| | | | | | | | | | | | | | | | | | | | | | | | | | | | | | | | |
Assets: Residents’ Investments Abroad | | | (4,305 | ) | | | 1,967 | | | | 2,773 | | | | 1,712 | | | | 1,712 | | | | 1,361 | | | | 1,361 | | | | 1,278 | |
| | | | | | | | | | | | | | | | | | | | | | | | | | | | | | | | |
Trade credits(6) | | | 8 | | | | 6 | | | | 4 | | | | (2 | ) | | | (2 | ) | | | (7 | ) | | | (7 | ) | | | 0 | |
Loans | | | (3,197 | ) | | | 1,600 | | | | (2,960 | ) | | | (1,991 | ) | | | (1,991 | ) | | | 219 | | | | 219 | | | | (236 | ) |
Banks | | | (1,378 | ) | | | 2,183 | | | | (2,942 | ) | | | (1,991 | ) | | | (1,991 | ) | | | 219 | | | | 219 | | | | (236 | ) |
Other sectors | | | (1,819 | ) | | | (583 | ) | | | (18 | ) | | | 0 | | | | 0 | | | | 0 | | | | 0 | | | | 0 | |
Currency and deposits | | | 3,600 | | | | (4,551 | ) | | | 2,153 | | | | 3,582 | | | | 3,582 | | | | 1,419 | | | | 1,419 | | | | 1,462 | |
Banks | | | 3,688 | | | | (5,733 | ) | | | (2,242 | ) | | | 355 | | | | 355 | | | | (256 | ) | | | (256 | ) | | | 454 | |
Other sectors | | | (88 | ) | | | 1,182 | | | | 4,395 | | | | 3,227 | | | | 3,227 | | | | 1,675 | | | | 1,675 | | | | 1,008 | |
Other assets | | | (4,716 | ) | | | 4,912 | | | | 3,576 | | | | 123 | | | | 123 | | | | (270 | ) | | | (270 | ) | | | 51 | |
Banks | | | (4,712 | ) | | | 4,919 | | | | 3,575 | | | | 123 | | | | 123 | | | | (270 | ) | | | (270 | ) | | | 51 | |
Other sectors | | | (4 | ) | | | (7 | ) | | | 1 | | | | 0 | | | | 0 | | | | 0 | | | | 0 | | | | 0 | |
Liabilities: Non-residents’ investments in the Philippines | | | (3,552 | ) | | | (775 | ) | | | 5,207 | | | | 653 | | | | 653 | | | | 3,004 | | | | 3,004 | | | | (1,404 | ) |
| | | | | | | | | | | | | | | | | | | | | | | | | | | | | | | | |
Trade credits | | | (668 | ) | | | 3 | | | | 1,047 | | | | (45 | ) | | | (45 | ) | | | 380 | | | | 380 | | | | (57 | ) |
Loans | | | (3,326 | ) | | | (757 | ) | | | 1,953 | | | | (517 | ) | | | (517 | ) | | | (447 | ) | | | (447 | ) | | | 312 | |
General government | | | 58 | | | | 957 | | | | (73 | ) | | | 177 | | | | 177 | | | | (136 | ) | | | (136 | ) | | | (755 | ) |
Long-term drawings | | | 1,253 | | | | 2,218 | | | | 1,359 | | | | 1,737 | | | | 1,737 | | | | 1,407 | | | | 1,407 | | | | 252 | |
Long-term repayments | | | 1,195 | | | | 1,261 | | | | 1,432 | | | | 1,560 | | | | 1,560 | | | | 1,543 | | | | 1,543 | | | | 1,007 | |
Banks | | | (883 | ) | | | (1,009 | ) | | | 1,209 | | | | (574 | ) | | | (574 | ) | | | 378 | | | | 378 | | | | (234 | ) |
Long-term | | | (1,396 | ) | | | (579 | ) | | | 1,271 | | | | (604 | ) | | | (604 | ) | | | 427 | | | | 427 | | | | (236 | ) |
Drawings | | | 818 | | | | 302 | | | | 1,491 | | | | 1,151 | | | | 1,151 | | | | 961 | | | | 961 | | | | 610 | |
Repayments | | | 2,214 | | | | 881 | | | | 220 | | | | 1,755 | | | | 1,755 | | | | 534 | | | | 534 | | | | 846 | |
Short-term | | | 513 | | | | (430 | ) | | | (62 | ) | | | 30 | | | | 30 | | | | (49 | ) | | | (49 | ) | | | 2 | |
Other sectors | | | (2,501 | ) | | | (705 | ) | | | 817 | | | | (120 | ) | | | (120 | ) | | | (689 | ) | | | (689 | ) | | | 1,301 | |
Long-term | | | (829 | ) | | | (585 | ) | | | 919 | | | | (223 | ) | | | (223 | ) | | | (666 | ) | | | (666 | ) | | | 1,301 | |
Drawings | | | 1,941 | | | | 1,442 | | | | 2,966 | | | | 1,924 | | | | 1,924 | | | | 1,442 | | | | 1,442 | | | | 2,984 | |
Repayments | | | 2,770 | | | | 2,027 | | | | 2,047 | | | | 2,147 | | | | 2,147 | | | | 2,108 | | | | 2,108 | | | | 1,683 | |
Short-term | | | (1,672 | ) | | | (120 | ) | | | (102 | ) | | | 103 | | | | 103 | | | | (23 | ) | | | (23 | ) | | | (1 | ) |
Currency and deposits | | | (140 | ) | | | (530 | ) | | | 1,876 | | | | 1,170 | | | | 1,170 | | | | 2,891 | | | | 2,891 | | | | (1,396 | ) |
Banks | | | (358 | ) | | | (126 | ) | | | 1,908 | | | | 1,170 | | | | 1,170 | | | | 2,891 | | | | 2,891 | | | | (1,396 | ) |
Other sectors | | | 218 | | | | (404 | ) | | | (32 | ) | | | 0 | | | | 0 | | | | 0 | | | | 0 | | | | 0 | |
Other accounts payable | | | 582 | | | | 509 | | | | 331 | | | | 45 | | | | 45 | | | | 180 | | | | 180 | | | | (261 | ) |
Monetary authorities | | | 0 | | | | 1,126 | | | | 0 | | | | 0 | | | | 0 | | | | 0 | | | | 0 | | | | 0 | |
Banks(7) | | | 594 | | | | (596 | ) | | | 333 | | | | 45 | | | | 45 | | | | 180 | | | | 180 | | | | (261 | ) |
Other sectors(7) | | | (12 | ) | | | (21 | ) | | | (2 | ) | | | 0 | | | | 0 | | | | 0 | | | | 0 | | | | 0 | |
Source: Bangko Sentral.
Notes:
| (1) | Figures reported pursuant to BPM5. |
| (2) | Revised to reflect late reports, post-audit adjustments and final data from companies. Please see “—Balance of Payments—Revisions” for a more detailed discussion of recent and pending revisions to previously reported data. |
| (3) | Figures reported pursuant to BPM6. |
77
| (5) | Preliminary data for the first six months of 2013. |
| (6) | All trade credits are short-term credits in non-governmental sectors. |
| (7) | Short-term liabilities. |
In 2009, the financial account on a BPM5 basis recorded a net outflow of $1.7 billion, approximately the same level of net outflow recorded in 2008. The stable level of net outflow resulted from two largely offsetting changes. The other investment account recorded net outflow of $2.7 billion compared with an inflow of $753 million in 2008, while the portfolio investments account recorded net outflow of $625 million, significantly less than the net outflow of $3.6 billion recorded in 2008. The net outflow in the other investment account was also offset by inflows in the direct investments account, which recorded a net inflow of $1.6 billion in 2009, a 24.8% increase from the net inflow of $1.3 billion recorded in 2008.
In 2010, the financial account on a BPM5 basis recorded a net inflow of $7.3 billion, a reversal from the $1.7 billion net outflow recorded in 2009. The reversal was primarily attributable to reversals during 2010 of the net outflows in portfolio and other investments as a result of increased investments from abroad. The portfolio investment account in 2010 recorded a net inflow of $4.4 billion, a reversal from the $625 million net outflow recorded in 2009, and the other investment account recorded a net inflow of $2.4 billion in 2010, a reversal from the $2.7 billion net outflow recorded in 2009.
In 2011, the financial account on a BPM5 basis recorded a net inflow of $5.8 billion, a decrease of 19.8% from the net inflow of $7.3 billion recorded in 2010. The decrease was mainly due to a $1.1 billion net outflow of other investments in 2011, compared to a $2.4 billion net inflow in 2010. The decrease was partially mitigated by a $1.0 billion net inflow of financial derivatives in 2011, compared with a $191 million net outflow in 2010 and a $1.5 billion net inflow in direct investment in 2011, compared to a $682 million net inflow in 2010.
In 2012, the financial account on a BPM6 basis recorded a net inflow of $6.1 billion, an increase of 9.3% from the net inflow of $5.6 billion recorded in 2011. This increase was primarily the result of a reversal in other investment, which recorded net inflow of $1.6 billion in 2012 compared to net outflow of $1.1 billion in 2011. Partially offsetting this reversal was a substantial decrease in net inflow in financial derivatives of $13 million in 2012 compared to $1.0 billion in 2011.
The financial account recorded a net outflow of $2.0 billion in the first six months of 2013, a decline of 51.2% from the $4.1 billion net outflow recorded in the same period in 2012. This decline was primarily the result of a significant increase in other investments, mainly due to a $5.7 billion increase in investments in currency and deposits, which was partially offset by a $2.1 billion decline in investments in loans.
Foreign Direct Investment
Domestic macroeconomic policies and structural reforms have significantly affected the flow of foreign investment into the Philippines. The Foreign Investment Act of 1991, as amended, introduced a more favorable investment environment to the Philippines. The act permits foreigners to own 100% of Philippine enterprises, except in certain specified areas included in a “negative list” with respect to which the Constitution or applicable statute limits foreign ownership, generally to a maximum of 40% of the enterprise’s equity capital. The Constitution also prohibits foreign ownership in certain sectors, such as the media.
In March 2000, the Retail Trade Liberalization Act was enacted. The law aims to promote efficiency and competition among domestic industries and foreign competitors and better service and lower prices for consumers. Prior to its enactment, only citizens of the Philippines and corporations wholly owned by Filipino citizens could own a retail business in the Philippines. Under the law, a foreigner is allowed to own 100% of a retail business in the Philippines, provided it makes an investment of at least $7.5 million in the Philippines. If a foreigner makes an investment of between $2.5 million to $7.5 million, the foreigner is allowed to own up to 60% of the retail business in the Philippines for the first two years.
78
The Republic’s Board of Investments coordinates with national agencies and local governments on investment policies and procedures and establishes and administers annual investment priority plans to promote certain sectors of the economy by providing special investment incentives to specific industries. The latest plan by the Board of Investments, the Government’s 2012 Investment Priorities Plan, established 13 preferred areas for investment incentives, including (i) agriculture, herbal and fishery products and related activities (such as irrigation, post-harvest and fertilizer production, (ii) creative industries and knowledge-based services, (iii) shipbuilding, (iv) the development of low-cost mass housing, (v) basic iron and steel products, (vi) exploration, development and/or utilization of energy sources adopting environmentally friendly technologies, (vii) infrastructure (including transport, water, logistics, waste management and physical infrastructure), (viii) research and development through the establishment of “Centers of Excellence” and technical vocational education and training institutions, (ix) green projects such as the establishment of energy efficiency-related facilities and the minimization and prevention of pollution, (x) the manufacture and assembly of motor vehicles, (xi) strategic products with high social economic returns, (xii) the establishment and operation of primary and secondary hospitals and (xiii) disaster prevention, mitigation and recovery projects.
In addition to the preferred list of investment priorities, certain activities are required by law to be included in the Government’s Investment Priorities Plans. These include (i) industrial tree plantations, (ii) exploration, mining, quarrying and processing of minerals, (iii) publication or printing of books and textbooks, (iv) refining, storage, marketing and distribution of petroleum products, (v) ecological solid waste management, (vi) clean water projects, (vii) rehabilitation, self-development and self-reliance of persons with disabilities, (viii) renewably energy and (ix) tourism. Finally, the ARMM maintains a Regional Board of Investments, which identifies a local list of priority investment areas in the ARMM. These include (i) export activities, (ii) agriculture, agribusiness and fisheries, (iii) basic industries, (iv) consumer manufacturing, (v) infrastructure and services, (vi) industrial service facilities, (vii) engineering industries, (viii) logistics, (ix) BIMP-EAGA Trade and Investment Enterprises (which covers enterprises located or having their base of operation in Brunei, Sabah and Sarawak in Malaysia, Maluku, Sulawesi, Kalimantan and Iringaya in Indonesia, and Mindanao and Palawan in the Philippines), (x) tourism, (xi) health and education services and facilities and (xii) Halal industries.
The following table sets out foreign direct investments in the Philippines by sector. The data is presented using the 1994 Philippine Standard Industrial Classification.
| | | | | | | | | | | | | | | | | | | | | | | | |
| | | Net Foreign Direct Investment by Sector(1) | |
Sector | | 2008 | | | 2009 | | | 2010(2) | | | 2011(2) | | | 2012(2) | | | 2013(3) | |
| | | ($ in millions) | |
Total equity | | | 1,235.0 | | | | 1,731 | | | | (396.0 | ) | | | 558.0 | | | | 1,345.0 | | | | 581.1 | |
Agriculture, hunting, forestry and fishing | | | 0.7 | | | | 0.2 | | | | 2.4 | | | | 4.0 | | | | 0.9 | | | | 16.3 | |
Mining and quarrying | | | 154.9 | | | | 6.2 | | | | 282.1 | | | | (240.4 | ) | | | 34.4 | | | | 17.0 | |
Manufacturing | | | 311.9 | | | | 887.8 | | | | (1,275.2 | ) | | | 119.4 | | | | 1,032.6 | | | | 208.7 | |
Electricity, gas and water(4) | | | 224.7 | | | | 389.6 | | | | (14.8 | ) | | | (22.4 | ) | | | (23.2 | ) | | | 1.8 | |
Construction | | | 171.9 | | | | 79.2 | | | | (1.6 | ) | | | 28.1 | | | | 8.8 | | | | 1.3 | |
Trade/Commerce | | | 22.2 | | | | 4.2 | | | | 32.4 | | | | 30.6 | | | | 92.3 | | | | 16.6 | |
Hotels and restaurants | | | 5.7 | | | | 14.9 | | | | 105.7 | | | | 3.1 | | | | 2.6 | | | | 0.5 | |
Transport, storage and communications(5) | | | (27.0 | ) | | | 7.3 | | | | 106.3 | | | | 1.0 | | | | (9.6 | ) | | | 1.1 | |
Financial intermediation (including insurance) | | | 215.7 | | | | 237.5 | | | | 59.6 | | | | 222.2 | | | | 38.2 | | | | (304.2 | ) |
Real estate | | | 158.3 | | | | 89.1 | | | | 181.5 | | | | 135.2 | | | | 163.5 | | | | 13.1 | |
Services(6) | | | (11.5 | ) | | | 18.0 | | | | 112.3 | | | | 284.9 | | | | 28.7 | | | | 178.0 | |
Others, not elsewhere classified | | | 7.7 | | | | (2.8 | ) | | | 13.3 | | | | 5.9 | | | | (7.82 | ) | | | 431.0 | |
Reinvested earnings | | | 53.0 | | | | 155.0 | | | | 182.0 | | | | 983.0 | | | | 1,061.0 | | | | 492.0 | |
Inter-company loans | | | 256.0 | | | | 77.0 | | | | 1,512.0 | | | | 311.0 | | | | (373.0 | ) | | | 1,684.9 | |
| | | | | | | | | | | | | | | | | | | | | | | | |
Total | | | 1,544.0 | | | | 1,963.0 | | | | 1,298.0 | | | | 1,852.0 | | | | 2,033.0 | | | | 2,757.9 | |
| | | | | | | | | | | | | | | | | | | | | | | | |
79
Sources: Department of Economic Statistics, Bangko Sentral.
Notes:
| (1) | Balance of payments net foreign direct investment flows refer to non-resident placements less non-resident withdrawals, reinvested earnings and net inter-company loans. |
| (2) | Revised to reflect: (i) late reports; (ii) post-audit adjustments; and (iii) final data from companies. |
| (3) | Preliminary data for the first eight months of 2013. |
| (4) | Commencing in 2011, includes electricity, gas, steam and air conditioning supply. |
| (5) | Commencing in 2011, includes only transportation and storage. |
| (6) | Commencing in 2011, includes information and communication, professional, scientific, technical, administrative, and support services activities, public administration, defense, compulsory social security, arts, entertainment, recreation, and other service activities. |
In 2009, net inflows of foreign direct investments totaled $1,963.0 million, 27.1% higher than the $1,544.0 million recorded in 2008. The higher inflows were mainly due to higher investment inflows in manufacturing, which increased from $311.9 million in 2008 to $887.8 million in 2009.
In 2010, net inflows of foreign direct investments totaled $1,298.0 million, 33.9% lower than the $1,963.0 million recorded in 2009. The lower inflows were mainly due to net outflows in the manufacturing and the electricity, gas and water sectors. The manufacturing sector registered an outflow of $1,275.2 million in 2010, compared with a $887.8 million inflow in 2009. The electricity, gas and water sector registered an outflow of $14.8 million in 2010, compared with an inflow of $389.6 million in 2009. The outflows in the manufacturing and electricity, gas and water sectors were largely offset by an increase in the inflows from inter-company loans, which had an inflow of $1,512.0 million in 2010 compared to a $77.0 million inflow in 2009.
In 2011, net inflows of foreign direct investments totaled $1,852.0 million, 42.7% higher than the $1,298.0 million recorded in 2010. The higher inflows were mainly due to the reversal of the $1,275.2 million of net outflows in the manufacturing sector in 2010, compared to $119.4 million in net inflows in 2011. Similarly, net inflows from reinvested earnings increased to $983.0 million in 2011 from $182.0 million in 2010. The inflows in the manufacturing sector and from reinvested earnings were partially offset by a reduction in net inflows from inter-company loans, from $1,512.0 million in 2010 to $311.0 million in 2011.
In 2012, net inflows of foreign direct investments totaled $2,033.0 million, a 9.8% increase over the $1,852.0 billion recorded in 2011. The higher inflows were mainly due to higher net inflows in the manufacturing sector and a reversal of the net outflows in the mining and quarrying sector in 2011. The manufacturing sector had an inflow of $1,032.6 million in 2012, compared to a $119.4 million inflow in 2011. The mining and quarrying sector had an inflow of $34.4 million in 2012, compared to an outflow of $240.4 million in 2011.
In the first eight months of 2013, net inflows of foreign direct investments were $2.8 billion, an increase of 25.4% over the $2.2 billion recorded in the same period in 2012. This was due mainly to increased investments by non-residents in debt instruments issued by local affiliates.
80
International Reserves
The following table sets out the gross international reserves of Bangko Sentral, compiled in a manner consistent with the revised balance of payments framework and the treatment of IMF accounts in the depository corporations survey published in the IMF’s International Financial Statistics.
| | | | | | | | | | | | | | | | | | | | | | | | |
| | | Gross International Reserves of Bangko Sentral | |
| | | As of December 31, | | | | |
Sector | | 2008 | | | 2009 | | | 2010 | | | 2011 | | | 2012 | | | 2013(1) | |
| | | ($ in millions, except months and percentages) | |
Gold | | | 4,358 | | | | 5,460 | | | | 7,010 | | | | 8,013 | | | | 10,353 | | | | 7,747 | |
SDRs | | | 11 | | | | 1,141 | | | | 1,121 | | | | 1,118 | | | | 1,288 | | | | 1,296 | |
Foreign investments | | | 32,066 | | | | 36,655 | | | | 53,441 | | | | 65,276 | | | | 70,728 | | | | 72,893 | |
Foreign exchange(2) | | | 981 | | | | 849 | | | | 551 | | | | 424 | | | | 927 | | | | 1,499 | |
Reserve position in the IMF(3) | | | 135 | | | | 138 | | | | 251 | | | | 472 | | | | 534 | | | | 591 | |
| | | | | | | | | | | | | | | | | | | | | | | | |
Total | | | 37,551 | | | | 44,243 | | | | 62,373 | | | | 75,302 | | | | 83,831 | | | | 84,025 | |
| | | | | | | | | | | | | | | | | | | | | | | | |
Total as number of months of imports of goods and services | | | 6.0 | | | | 8.7 | | | | 9.5 | | | | 12.1 | | | | 11.9 | | | | 12.0 | |
Total as a % of short-term debt(4) | | | | | | | | | | | | | | | | | | | | | | | | |
Original maturity | | | 536.4 | | | | 1,105.5 | | | | 990.8 | | | | 1,073.8 | | | | 988 | | | | 900 | |
Residual maturity | | | 331.7 | | | | 503.9 | | | | 554.6 | | | | 719.6 | | | | 651.5 | | | | 595.9 | |
| Sources: | Department of Economic Statistics, Bangko Sentral. |
Notes:
| (1) | Preliminary data as of November 30, 2013. |
| (2) | Consists of time deposits, investments in securities issued or guaranteed by Government or international organizations and repurchase agreements. |
| (3) | The reserve position in the IMF refers to the country’s claim on the IMF’s General Resources Account. It is an asset of the Government but is treated as part of the gross international reserves. |
| (4) | Short-term debt based on residual maturity refers to outstanding short-term external debt on original maturity plus principal payments on medium- and long-term loans of the public and private sectors due within the next 12 months. |
The gross international reserves controlled by Bangko Sentral constitute substantially all of the Philippines’ official international reserves. Bangko Sentral occasionally enters into options with respect to gold, foreign exchange and foreign securities for purposes of managing yield or market risk. It also enters into financial swap contracts to optimize yield on its gold reserves.
As of December 31, 2009, gross international reserves were $44.2 billion, an increase from the $37.6 billion at the end of 2008. Gross international reserves at the end of 2009 were sufficient to cover 8.7 months’ worth of imports of goods and payment of services and income. In terms of short-term debt coverage, the reserve level was 11.1 times the amount of the Republic’s short-term external liabilities based on original maturity and 5.0 times based on residual maturity. Net international reserves at the end of 2009 were $44.2 billion.
As of December 31, 2010, gross international reserves of the Republic were $62.4 billion, an increase from the $44.2 billion recorded as of December 31, 2009. The increase was due mainly to investments abroad by Bangko Sentral and revaluation gains on Bangko Sentral’s gold holdings. In terms of short-term debt coverage, the reserve level was 9.9 times the amount of the Republic’s short-term external liabilities based on original maturity and 5.5 times based on residual maturity. Net international reserves at the end of 2010 were $62.4 billion.
81
As of December 31, 2011, gross international reserves of the Republic were $75.3 billion, an increase from the $62.4 billion recorded as of December 31, 2010. The increase was due mainly to income from foreign investments by Bangko Sentral and revaluation gains on Bangko Sentral’s gold holdings. The level of gross international reserves as of December 31, 2011 was sufficient to cover approximately 11.3 months of imports of goods and payments of services and income, and was equivalent to 10.7 times the Republic’s short-term debt based on original maturity and 7.0 times based on residual maturity. Net international reserves at the end of 2011 were $75.3 billion.
As of December 31, 2012, gross international reserves were $83.8 billion, an increase of 11.3% over the $75.3 billion recorded as of December 31, 2011. The increase was due mainly to a $5.5 billion increase in foreign investments and a $2.3 billion increase in gold reserves over the same period. The level of gross international reserves as of December 31, 2012 was sufficient to cover approximately 11.9 months of imports of goods and payments of services and income, and was equivalent to 9.9 times the Republic’s short-term debt based on original maturity and 6.5 times based on residual maturity. Net international reserves at the end of December 2012 were $83.8 billion.
Gross international reserves were $84.0 billion as of November 30, 2013, an increase of 0.1% over the $83.9 billion recorded as of November 30, 2012 and an increase of 0.2% over the $83.8 billion recorded as of December 31, 2012. The increase in the first 11 months of 2013 was mainly due to an increase of $2.2 billion in foreign investments and of $572 million in foreign exchange, which were largely offset by a decrease of $2.6 billion in gold. The level of gross international reserves as of November 30, 2013 was sufficient to cover approximately 12.0 months of imports of goods and payments of services and income, and was equivalent to 9.0 times the Republic’s short-term debt based on original maturity and 6.0 times based on residual maturity. Net international reserves at the end of November 2013 were $84.0 billion.
Monetary System
Monetary Policy
In 1993, the Government established Bangko Sentral, the Republic’s central bank, pursuant to the New Central Bank Act. Bangko Sentral replaced the old Central Bank of the Philippines. Bangko Sentral functions as an independent central monetary authority responsible for policies in the areas of money, banking and credit, as authorized under the New Central Bank Act. The New Central Bank Act prohibits Bangko Sentral from engaging in quasi-fiscal activities, commercial banking or development banking or financing, all of which had contributed to substantial deficits at the old Central Bank of the Philippines.
Bangko Sentral’s primary objectives are to maintain price stability, monetary stability and the convertibility of the peso. To achieve its price stability objective, Bangko Sentral undertakes monetary management mainly through adjustments to policy rates and the conduct of open market operations, including the purchase and sale of Government securities, rediscounting transactions and adjustments in reserve requirements.
Bangko Sentral’s functions include:
| | • | | conducting monetary policy; |
| | • | | issuing the national currency; |
| | • | | managing foreign currency reserves; |
| | • | | acting as depository for the Government, its political subdivisions and instrumentalities and Government-owned corporations; and |
| | • | | regulating banks and quasi-banks in the Philippines. |
82
The Government owns all of the capital stock of Bangko Sentral. A seven-member Monetary Board consisting of Bangko Sentral’s Governor, a member of the Cabinet designated by the President, and five full-time private sector representatives governs Bangko Sentral. The President appoints each of the seven Monetary Board members, except the Cabinet representative, to six-year terms.
Philippine law requires Bangko Sentral to maintain international reserves adequate to meet any foreseeable net demands for foreign currencies. As of December 31, 2012, Bangko Sentral had total assets of (Peso)3,975.9 billion, of which international reserves accounted for (Peso)3,424.3 billion. Bangko Sentral’s remaining assets consist mainly of peso-denominated financial assets including investment securities and loans and advances, and its liabilities consist mainly of deposits of banks and quasi-banks, currency in circulation, government deposits and securities sold under agreements to repurchase.
Money Supply
The following table presents certain information regarding the Philippines’ money supply. In July 2013, Bangko Sentral adopted a new system for compiling and reporting monetary statistics called the Standardized Report Forms (the “SRF”) format as part of Bangko Sentral’s adherence to international best practices in statistical compilation. The SRF is a unified international framework for reporting monetary and financial statistics to the IMF. Under the SRF, foreign and domestic assets reported by Bangko Sentral are no longer presented net of liabilities; rather, liabilities are reported separately. The presentation of general Government assets, however, remains net of liabilities. The adoption of the SRF system did not result in any change to overall monetary balances. However, Bangko Sentral has, in connection with the adoption of the SRF, also implemented certain recommendations from the IMF pertaining to the inclusion of unsecured subordinated debt and accrued interest expense, which has given rise to minor changes in amounts previously reported.
| | | | | | | | | | | | | | | | | | | | | | | | |
| | | Money Supply (SRF-based)
As of December 31, | | | | |
| | | 2008 | | | 2009 | | | 2010 | | | 2011 | | | 2012 | | | 2013(1) | |
| | | (Peso in billions, except percentages) | |
M1(2) | | | | | | | | | | | | | | | | | | | | | | | | |
Currency in circulation | | | 429.6 | | | | 456.4 | | | | 480.1 | | | | 514.9 | | | | 558.8 | | | | 551.3 | |
Current account deposits | | | 631.5 | | | | 761.2 | | | | 868.4 | | | | 979.8 | | | | 1,048.0 | | | | 1,311.7 | |
Total | | | 1,061.1 | | | | 1,217.7 | | | | 1,348.5 | | | | 1,494.7 | | | | 1,606.8 | | | | 1,863.0 | |
percentage increase(3) | | | 15.5 | % | | | 14.8 | % | | | 10.7 | % | | | 10.8 | % | | | 7.5 | % | | | 27.2 | % |
M2(4) | | | 3,539.7 | | | | 3,881.0 | | | | 4,283.9 | | | | 4,582.4 | | | | 5,008.2 | | | | 6,038.2 | |
percentage increase(3) | | | 6.8 | % | | | 9.6 | % | | | 10.4 | % | | | 7.0 | % | | | 9.3 | % | | | 33.2 | % |
M3(5) | | | 3,711.7 | | | | 4,077.5 | | | | 4,483.3 | | | | 4,802.4 | | | | 5,227.5 | | | | 6,258.6 | |
percentage increase(3) | | | 10.1 | % | | | 9.9 | % | | | 10.0 | % | | | 7.1 | % | | | 8.9 | % | | | 32.5 | % |
Sources: Bangko Sentral, Department of Economic Statistics.
Notes:
| (1) | Preliminary data as of October 31, 2013. |
| (2) | Consists of currency in circulation and demand deposits. |
| (4) | Consists of M1, savings deposits and time deposits. |
| (5) | Consists of M2 and deposit substitutes. |
As of December 31, 2009, the Republic’s money supply (M3) was (Peso)4.1 trillion, a 9.9% increase from the level recorded as of December 31, 2008. The increase was attributable to growth in net foreign assets, which grew by 19.5% for the year. Growth in net foreign assets was due primarily to an expansion in foreign assets held by Bangko Sentral. Net domestic assets also grew by 8.4% in 2009 due mainly to the expansion of claims on other sectors as well as net claims on the Government.
83
As of December 31, 2010, the Republic’s money supply (M3) was (Peso)4.5 trillion, a 10.0% increase from the level recorded as of December 31, 2009. The increase in liquidity as of December 31, 2010 was primarily attributable to growth in net foreign assets, which grew by 18.4% compared to the level as of December 31, 2009. The increase in net foreign assets was due mainly to the continued expansion of Bangko Sentral’s investment in foreign assets, which grew by 34.9% from the level recorded as of December 31, 2009. As of December 31, 2010, net domestic assets grew by 8.9% from the level recorded as of December 31, 2009. Growth in net domestic assets was due primarily to the 10.4% growth in claims on other sectors, largely driven by the 10.2% increase in claims on the private sector. Net claims on the Government also increased by 4.6% compared to the level recorded as of December 31, 2009.
As of December 31, 2011, the Republic’s money supply (M3) was (Peso)4.8 trillion, an increase of 7.1% from the (Peso)4.5 trillion recorded as of December 31, 2010. The increase in liquidity as of December 31, 2011 compared to the prior year was primarily attributable to growth in base money supply, which grew by 10.8% compared to the level as of December 31, 2010. Money supply growth was largely driven by domestic claims, which grew by 12.7% compared to the prior year. This growth was driven primarily by claims on other sectors, particularly claims on public non-financial corporations, which increased by 65.3% compared to the prior year. Net foreign assets also increased by 13.6% compared to the prior year. Bangko Sentral’s net foreign asset position increased by 21.7% over the period, which was partially offset by a decrease of 2.4% in the net foreign asset position of other depository corporations.
As of December 31, 2012, the Republic’s money supply (M3) was (Peso)5.2 trillion, an increase of 8.9% from the (Peso)4.8 trillion recorded as of December 31, 2011. The increase in liquidity as of December 31, 2012 compared to the prior year was primarily attributable to domestic claims, which increased by 6.5% compared to the prior year. The increase was driven primarily by claims on other sectors, particularly claims on the private sector, which grew by 14.1% compared to the prior year. The increase in claims on other sectors was partially offset by a decrease of 18.0% in net claims on the Government, resulting from a substantial increase in liabilities to the Government. Bangko Sentral’s net foreign asset position increased by 4.6% over the period, which was largely offset by a decline in the net foreign asset position of other depository corporations.
As of October 31, 2013, the Republic’s money supply (M3) was (Peso)6.3 trillion, an increase of 32.5% from the (Peso)4.7 trillion recorded as of October 31, 2012 and an increase of 19.7% from the (Peso)5.2 trillion recorded as of December 31, 2012. The growth in money supply in 2013 has been driven mainly by the sustained expansion in domestic claims or credits to the domestic economy. This reflects the faster growth in bank lending to the private sector. At the same time, steady foreign exchange inflows from OFW remittances, business process outsourcing receipts and portfolio investments also continued to boost domestic liquidity growth.
The growth in money supply (M3) in the third quarter of 2013 has also been due in part to the operational adjustments in Bangko Sentral’s Special Deposit Account Facility. The adjustments to the facility are aimed at encouraging financial institutions to deploy funds in the domestic financial market to facilitate credit and investment, thereby supporting domestic economic activity.
The following table presents information regarding domestic interest and deposit rates.
| | | | | | | | | | | | | | | | | | | | | | | | |
| | | Domestic Interest and Deposit Rates | |
| | | 2008 | | | 2009 | | | 2010 | | | 2011 | | | 2012 | | | 2013(1) | |
| | | (weighted averages per period) | |
91-day Treasury bill rates | | | 5.4 | % | | | 4.2 | % | | | 3.7 | % | | | 1.4 | % | | | 1.6 | % | | | 0.4 | % |
90-day Manila reference rate(2) | | | 7.5 | % | | | 7.3 | % | | | 6.9 | % | | | 6.7 | % | | | 5.3 | % | | | 1.4 | % |
Bank average lending rates | | | 8.8 | % | | | 8.5 | % | | | 7.7 | % | | | 6.6 | % | | | 5.7 | % | | | 5.8 | % |
Source: Bangko Sentral.
84
Notes:
| (1) | Preliminary data for the first 10 months of 2013. |
| (2) | Based on promissory notes and time deposit transactions of sample commercial banks. |
Monetary Regulation
On July 9, 2009, in response to the continued global economic downturn, the Monetary Board set policy interest rates at 4.0% for the RRP rate and 6.0% for the RP rate. The lowering of key interest rates in July 2009 was set after six prior decisions of the Monetary Board to cut rates since December 2008 as part of Bangko Sentral’s efforts to support the financial markets and real economy of the Republic. The Monetary Board based its decisions mainly on expected lower inflation in 2009 and 2010, which would support lower policy interest rates. From an RRP rate of 6.0% and an RP rate of 8.0% in early December 2008, the Monetary Board lowered the RRP and RP rates by 0.5% on December 18, 2008 and again on January 29, 2009. Subsequently, the Monetary Board lowered the RRP and RP rates by 0.25% on each of March 5, 2009, April 16, 2009 and May 28, 2009.
On November 18, 2010, based on the assessment that the then-current monetary policy was appropriate and given the favorable inflation outlook, the Monetary Board decided to maintain its policy interest rates at 4.0% for the RRP rate and at 6.0% for the RP rate. The interest rates on term RRP and RP facilities as well as special deposit accounts were also maintained.
In its meeting on March 23, 2011, the Monetary Board increased the RRP rate from 4.0% to 4.25% and increased the RP rate from 6.0% to 6.25%. The Monetary Board’s decision was based on signs of increased inflationary pressures and associated increase in inflationary risks, particularly related to international food and oil prices.
On May 5, 2011, the Monetary Board again increased the RRP rate and the RP rate to 4.5% and 6.5%, respectively. The Monetary Board’s decision to further increase these rates was based on indications that the 3% to 5% inflation target for 2011 remained at risk due to inflationary pressures, primarily as a result of continued strong global demand for oil and associated concerns about reduced supply.
On both June 24, 2011 and August 5, 2011, the Monetary Board increased by 1% the reserve requirements on bank deposits and non-bank deposit substitutes. Increasing reserve requirements was used as a tool to subdue inflationary pressures during the period and to moderate inflows of foreign capital in the country.
On January 29, 2012, the Monetary Board reduced the RRP rate and the RP to 4.25% and 6.25%, respectively. On March 1, 2012, the Monetary Board reduced the RRP rate and the RP rate again to 4.0% and 6.0%, respectively.
In its meeting on June 14, 2012, the Monetary Board decided to maintain its policy rates at 4.0% for the RRP rate and 6.0% for the RP rate following expectations of a favorable inflation environment. Reserve requirements were also maintained at the levels previously announced. The Monetary Board noted that sufficient liquidity and strong bank lending, as supported by existing low interest rates, should help sustain domestic real sector activity in the upcoming months. However, on July 26, 2012, in response to the continued uncertainty in the global financial markets, the Monetary Board reduced both the RRP rate and RP rate by 0.25% to 3.75% and 5.75%, respectively. On October 25, 2012, the Monetary Board again reduced both the RRP rate and RP rate by 0.25% to 3.50% and 5.50%, respectively The Monetary Board has maintained its policy rates at 3.50% for the RRP rate and 5.50% for the RP rate. The Monetary Board monitors emerging price and output conditions to ensure that monetary policy remains consistent with price stability while being supportive of economic growth.
85
Commercial bank lending rates over the past five years were an average range of 7.5% to 9.5% in 2008, 7.3% to 9.3% in 2009, 6.6% to 8.7% in 2010, 5.6% to 7.8% in 2011 and 5.3% to 6.6% in 2012. In the first eight months of 2013, the average range of lending was 5.4% to 6.2%, compared to the first eight months of 2012, when the average range of lending was 5.4% to 6.6%.
Foreign Exchange System
The Republic maintains a floating exchange rate system under which market forces determine the exchange rate for the peso. Bangko Sentral may, however, intervene in the market to maintain orderly market conditions and limit sharp fluctuations in the exchange rate.
The following table sets out exchange rate information between the peso and the U.S. dollar.
| | | | | | | | |
| | | Exchange Rates of
Peso per U.S. Dollar | |
Year | | Period
End | | | Period
Average(1) | |
2008 | | | 47.485 | | | | 44.475 | |
2009 | | | 46.356 | | | | 47.637 | |
2010 | | | 43.885 | | | | 45.110 | |
2011 | | | 43.928 | | | | 43.313 | |
2012 | | | 41.192 | | | | 42.229 | |
2013(2) | | | 43.736 | | | | 42.295 | |
Sources: Reference Exchange Rate Bulletin, Treasury Department, Bangko Sentral.
Notes:
| (1) | The average of the monthly average exchange rates for each month of the applicable period. |
| (2) | Data for the first 11 months of 2013. |
Foreign exchange may be freely sold and purchased outside the banking system and deposited in foreign currency accounts. Both residents and non-residents may maintain foreign currency deposit accounts with authorized banks in the Philippines, and residents may maintain deposits overseas without restriction. However, foreign exchange may not be purchased from the domestic banking system for deposit in these overseas accounts.
Payments related to foreign loans registered with Bangko Sentral and foreign investments approved by or registered with Bangko Sentral may be serviced with foreign exchange purchased from authorized agent banks in the Philippines. Bangko Sentral must approve and register all outgoing investments by residents exceeding $6 million per investor per year if the funds will be sourced from the Philippine banking system. For a discussion of Bangko Sentral’s loan approval regime, see “The Philippine Financial System—Foreign Currency Loans.”
While the Government imposes no currency requirements for outgoing payments, all exchange proceeds from exports, services and investments must be obtained in any of 22 prescribed currencies. Authorized agent banks may convert the acceptable currencies to pesos.
Individual or corporate non-residents may open peso bank accounts without Bangko Sentral’s approval. The export or electronic transfer out of the Philippines of peso amounts exceeding (Peso)10,000 requires prior authorization from Bangko Sentral.
86
In 2009, the average exchange rate was (Peso)47.637 per U.S. dollar, compared to (Peso)44.475 per U.S. dollar in 2008. The weakening of the peso was attributable to concerns over the sovereign debt problem in Europe and the Republic’s deteriorating fiscal position. These trends were offset in part by a revival of capital inflows in Asia, sustained foreign exchange inflows from OFW remittances, foreign direct and other investments, and the general weakening of the U.S. dollar against Asian currencies.
In 2010, the average exchange rate was (Peso)45.110 per U.S. dollar, compared to (Peso)47.637 per U.S. dollar in 2009. The strengthening of the peso was attributable to the country’s favorable external payments position, which was driven by strong export performance, robust inflow of OFW remittances, solid BPO revenues and tourist receipts, and the weakening of the U.S. dollar.
In 2011, the average exchange rate was (Peso)43.313 per U.S. dollar, compared to (Peso)45.110 per U.S. dollar in 2010. The general strengthening of the peso against the U.S. dollar was attributable to a revival of capital inflows into Asia, sustained foreign exchange inflows from OFW remittances, portfolio investments, foreign direct and other investments, and the general weakening of the U.S. dollar against Asian currencies. These trends were offset in part by concerns over the sovereign debt situation in Europe and the Republic’s fiscal position.
In 2012, the average exchange rate was (Peso)42.229 per U.S. dollar, compared to (Peso)43.313 per U.S. dollar in 2011. The strengthening of the peso against the U.S. dollar was attributable to sustained inflows of foreign exchange from OFW remittances, export receipts, portfolio investments and foreign direct investments. Further, the slow growth in advanced economies and the U.S. Federal Reserve’s announcement of a new round of monetary stimulus, along with speculation that Japan would implement monetary easing, fuelled demand for assets in the Republic, and contributed to appreciation of the peso. These trends were partially offset by faltering global economic growth and lingering concerns over the sovereign debt situation in Europe, which created volatility in the global financial markets.
In the first 11 months of 2013, the peso depreciated against the U.S. dollar by 6.2% as measured on November 30, 2013, closing at (Peso)43.736 per U.S. dollar. During 2013, the performance of the peso against the U.S. dollar was generally in line with that of other Asian currencies, except the Korean won and Chinese yuan. The weakening of the peso was due to concerns over the normalization of monetary policy in the United States and the lowering of growth forecasts for several Asian economies, including China. Nonetheless, the high level of the Republic’s gross international reserves provided broad stability for the peso. Gross international reserves were $84.0 billion as of November 30, 2013, compared to $83.6 billion as of October 31, 2013.
On December 11, 2013, the peso-U.S. dollar exchange rate was (Peso)44.262 per U.S. dollar.
Stabilization of the Peso
Since it allowed the peso to float on July 11, 1997, Bangko Sentral has intervened minimally in the foreign exchange market. It has, however, adopted measures related to foreign exchange trading aimed to reduce currency speculation and combat money laundering. Since 2008, these measures have included the following:
| | • | | On January 15, 2009, the Monetary Board approved the third phase of reforms in the foreign exchange regulatory framework and the release of the new Manual of Regulations on Foreign Exchange Transactions. The third phase of reforms, which also consolidates all the provisions in the first and second phases of reforms, includes the liberalization and streamlining of rules on foreign borrowings of private banks for relending purposes and registration of inward foreign portfolio investments; and provisions intended to improve monitoring of foreign exchange flows and to formalize and clarify existing practices. |
| | • | | On April 23, 2009, the Monetary Board approved the streamlining of the documentation requirements and other reforms on the sale of foreign exchange by foreign exchange dealers and money changers, making it possible for residents with foreign loans/foreign currency loans as well as foreign investors |
87
| | that chose not to seek Bangko Sentral approval and/or registration of the loans/investments to source their foreign exchange requirements from foreign exchange dealers and money changers without necessarily compromising compliance with anti-money laundering regulations. |
| | • | | On October 28, 2010, the Monetary Board approved certain amendments to the Manual of Regulations on Foreign Exchange Transactions. The measures increased the limit on non-trade current account transactions without supporting documents from $30,000 to $60,000; increased the limit on the sale of foreign currency for advance payment of imports without prior Bangko Sentral approval from $100,000 to $1 million; and increased the amount of foreign currency that may be purchased by residents from authorized agent banks and authorized agent bank-forex corporations without prior Bangko Sentral approval for outward investments from $30 million to $60 million per investor per year or, in the case of qualified investors, per fund. |
| | • | | In November 2011, the Monetary Board amended existing foreign exchange regulations to make transactions within the banking system easier for the general public. The Monetary Board also imposed higher capital charges for foreign exchange exposures. |
| | • | | On October 28, 2011, the Monetary Board increased the market risk weight of Non-Deliverable Forwards (“NDFs”) to reflect the potential systemic risk from NDF transactions as a result of the increased volatility in the foreign exchange markets. NDFs were assigned a higher risk weight equivalent to a compound annual return of 15.0% (previously 10.0%) effective on January 1, 2012. |
| | • | | On July 7, 2012, the Monetary Board announced that it would require banks and their trust departments to restrict investment in its short-term special deposit instruments from non-residents in order to help address speculation that could heighten volatility in the foreign exchange market. |
The Philippine Financial System
Composition
The following table sets out the total assets of the Philippine financial system by category of financial institution.
| | | | | | | | | | | | | | | | | | | | | | | | |
| | | Total Assets of the Financial System(1)
As of December 31, | | | | |
| | | 2008 | | | 2009 | | | 2010 | | | 2011 | | | 2012 | | | 2013(2) | |
| | | (Peso in billions) | |
Banks | | | | | | | | | | | | | | | | | | | | | | | | |
Universal/Commercial banks | | | 5,282.6 | | | | 5,779.1 | | | | 6,423.7 | | | | 6833.0 | | | | 7,486.7 | | | | 8,322.5 | |
Thrift banks | | | 499.9 | | | | 554.6 | | | | 626.4 | | | | 623.6 | | | | 681.6 | | | | 763.8 | |
Rural and cooperative banks | | | 163.9 | | | | 178.2 | | | | 180.1 | | | | 186.8 | | | | 190.1 | (3) | | | 190.1 | (3) |
| | | | | | | | | | | | | | | | | | | | | | | | |
Total banks | | | 5,946.3 | | | | 6,511.8 | | | | 7,230.2 | | | | 7,643.4 | | | | 8,358.3 | | | | 9,276.5 | |
| | | | | | | | | | | | | | | | | | | | | | | | |
Non-bank financial institutions | | | 1,438.0 | | | | 1,689.8 | | | | 1,816.1 | | | | 2,002.2 | | | | 2,157.8 | | | | 2,256.2 | |
| | | | | | | | | | | | | | | | | | | | | | | | |
Total assets | | | 7,384.4 | | | | 8,201.6 | | | | 9,046.3 | | | | 9,645.6 | | | | 10,516.2 | (4) | | | 11,532.7 | (4) |
| | | | | | | | | | | | | | | | | | | | | | | | |
Source: Bangko Sentral.
Notes:
| (1) | Excludes assets of Bangko Sentral. |
| (2) | Preliminary data as of August 31, 2013, unless otherwise indicated. |
| (3) | As of September 30, 2012. |
| (4) | Total assets as of December 31, 2012 and August 31, 2013 are both derived using the total assets of rural and cooperative banks as of September 30, 2012, the most recent date at which such figure is available. |
88
The Philippine financial system consists of banks and non-bank financial institutions. Banks include all financial institutions that lend funds obtained from the public primarily through the receipt of deposits and deposit substitutes. Non-banks include financial institutions other than banks which lend, invest or place funds, or at which evidences of indebtedness or equity are deposited with or acquired by them, either for their own account or for the account of others. Non-bank financial institutions may have quasi-banking functions. Quasi-banking functions include borrowing money to relend or purchase receivables and other obligations by issuing, endorsing or accepting debt or other instruments or by entering into repurchase agreements with 20 or more lenders at any one time.
Bangko Sentral, through its supervision and examination sector, supervises all banks and non-banks with quasi-banking functions or those with trust authorities such as investment management activities. This includes subsidiaries and affiliates of banks and quasi-banks engaged in related activities and those non-bank financial institutions placed under the effective supervision of Bangko Sentral through special laws such as pawnshops and non-stock savings and loan associations. The Monetary Board serves as the main policy-making body and has the ultimate supervisory authority.
Structure of the Financial System
The Philippine financial system consists of universal banks, commercial banks, thrift banks, rural and cooperative banks and non-bank financial institutions. Each type of bank participates in distinct business activities and geographic markets.
Commercial banks may:
| | • | | issue letters of credit, discounting and negotiating promissory notes, drafts, bills of exchange and other evidences of indebtedness; |
| | • | | receive deposits and deposit substitutes; |
| | • | | buy and sell foreign exchange and gold and silver bullion; |
| | • | | acquire marketable bonds; and |
| | • | | lend money on a secured or unsecured basis. |
Expanded commercial banks, otherwise known as universal banks, in addition to regular commercial banking activities, may also engage in investment banking activities, invest in non-allied enterprises and own up to 100% of the equity in a thrift bank, a rural bank, a financial allied enterprise or a non-financial allied enterprise. In the case of a publicly listed universal bank, it may also own up to 100% of the voting stock of only one other universal bank or commercial bank. As of June 30, 2013, the Republic had 36 operating universal and commercial banks, with a total of 5,198 branches.
89
The following table sets out the outstanding loans of universal and commercial banks classified by sector.
| | | | | | | | | | | | | | | | | | | | | | | | | | | | | | | | | | | | | | | | | | | | | | | | |
| | | Universal and Commercial Banks’ Outstanding Loans by Sector(1)
As of December 31, | | | | | | | |
| | | 2008 | | | 2009 | | | 2010 | | | 2011 | | | 2012 | | | 2013(2) | |
| | | (Peso in millions, except percentages) | |
Total | | | 2,519,636 | | | | 100.0 | % | | | 2,745,986 | | | | 100.0 | % | | | 2,825,455 | | | | 100.0 | % | | | 3,252,378 | | | | 100 | % | | | 3,650,760 | | | | 100 | % | | | 3,926,527 | | | | 100.0 | % |
Agriculture, hunting and forestry | | | 281,867 | | | | 11.2 | % | | | 305,159 | | | | 11.1 | % | | | 347,996 | | | | 12.3 | % | | | 161,242 | | | | 5.0 | % | | | 136,709 | | | | 3.7 | % | | | 131,035 | | | | 3.3 | % |
Fishing | | | 3,969 | | | | 0.2 | % | | | 3,460 | | | | 0.1 | % | | | 3,718 | | | | 0.1 | % | | | 6,791 | | | | 0.2 | % | | | 8,117 | | | | 0.2 | % | | | 8,681 | | | | 0.2 | % |
Mining and quarrying | | | 9,180 | | | | 0.4 | % | | | 5,237 | | | | 0.2 | % | | | 15,783 | | | | 0.6 | % | | | 24,955 | | | | 0.8 | % | | | 14,135 | | | | 0.4 | % | | | 18,316 | | | | 0.5 | % |
Manufacturing | | | 403,251 | | | | 16.0 | % | | | 327,389 | | | | 11.9 | % | | | 387,726 | | | | 13.7 | % | | | 541,117 | | | | 16.6 | % | | | 558,796 | | | | 15.3 | % | | | 555,688 | | | | 14.2 | % |
Electricity, gas and water supply | | | 138,767 | | | | 5.5 | % | | | 144,245 | | | | 5.3 | % | | | 166,602 | | | | 5.9 | % | | | 258,207 | | | | 7.9 | % | | | 283,140 | | | | 7.8 | % | | | 359,532 | | | | 9.2 | % |
Construction | | | 34,682 | | | | 1.4 | % | | | 25,307 | | | | 0.9 | % | | | 29,147 | | | | 1.0 | % | | | 37,408 | | | | 1.2 | % | | | 53,565 | | | | 1.5 | % | | | 73,128 | | | | 1.9 | % |
Wholesale, retail, trade, and repair of motor vehicles, motorcycles, personal and household goods | | | 228,766 | | | | 9.1 | % | | | 240,964 | | | | 8.8 | % | | | 255,842 | | | | 9.1 | % | | | 416,409 | | | | 12.8 | % | | | 475,602 | | | | 13.0 | % | | | 510,249 | | | | 13.0 | % |
Hotel and restaurant | | | 21,274 | | | | 0.8 | % | | | 28,279 | | | | 1.0 | % | | | 34,147 | | | | 1.2 | % | | | 37,028 | | | | 1.1 | % | | | 42,732 | | | | 1.2 | % | | | 57,456 | | | | 1.5 | % |
Transportation, storage and communication | | | 112,635 | | | | 4.5 | % | | | 150,046 | | | | 5.5 | % | | | 144,690 | | | | 5.1 | % | | | 174,501 | | | | 5.4 | % | | | 238,518 | | | | 6.5 | % | | | 225,331 | | | | 5.7 | % |
Financial intermediation(3) | | | 585,205 | | | | 23.2 | % | | | 779,499 | | | | 28.4 | % | | | 671,983 | | | | 23.8 | % | | | 635,549 | | | | 19.5 | % | | | 710,180 | | | | 19.5 | % | | | 714,435 | | | | 18.2 | % |
Real estate, renting and business activities | | | 281,749 | | | | 11.2 | % | | | 319,468 | | | | 11.6 | % | | | 356,678 | | | | 12,6 | % | | | 455,710 | | | | 14.0 | % | | | 578,928 | | | | 15.9 | % | | | 653,379 | | | | 16.6 | % |
Public administration and defense; compulsory social security | | | 54,101 | | | | 2.2 | % | | | 66,314 | | | | 2.4 | % | | | 67,420 | | | | 2,4 | % | | | 96,748 | | | | 3.0 | % | | | 106,241 | | | | 2.9 | % | | | 105,104 | | | | 2.7 | % |
Education | | | 10,868 | | | | 0.4 | % | | | 9,825 | | | | 0.4 | % | | | 9,912 | | | | 0,4 | % | | | 10,620 | | | | 0.3 | % | | | 11,908 | | | | 0.3 | % | | | 11,899 | | | | 0.3 | % |
Health and social work | | | 8,970 | | | | 0.4 | % | | | 10,527 | | | | 0.4 | % | | | 10,631 | | | | 0,4 | % | | | 12,080 | | | | 0.4 | % | | | 14,599 | | | | 0.4 | % | | | 19,620 | | | | 0.5 | % |
Other community, social and personal services | | | 95,391 | | | | 3.8 | % | | | 71,544 | | | | 2.6 | % | | | 63,612 | | | | 2,3 | % | | | 88,067 | | | | 2.7 | % | | | 89,388 | | | | 2.5 | % | | | 85,725 | | | | 2.2 | % |
Undifferentiated production activities of private households | | | 37,799 | | | | 1.5 | % | | | 28,629 | | | | 1.0 | % | | | 30,883 | | | | 1,1 | % | | | 37,269 | | | | 1.2 | % | | | 39,240 | | | | 1.1 | % | | | 42,585 | | | | 1.1 | % |
Others(4) | | | 211,162 | | | | 8.4 | % | | | 230,092 | | | | 8.4 | % | | | 228,686 | | | | 8,1 | % | | | 258,678 | | | | 8.0 | % | | | 288,962 | | | | 7.9 | % | | | 354,365 | | | | 9.0 | % |
Source: Bangko Sentral.
Note:
| (2) | Preliminary data as of October 31, 2013. |
| (3) | Includes interbank loans receivable, loans to Bangko Sentral and loans and receivables arising from repurchase agreements, certificates of assignment/participation with recourse, and securities lending and borrowing transactions. |
| (4) | Includes loans to individuals for consumption purposes and loans to non-residents. |
Thrift banks invest their capital and the savings of depositors in:
| | • | | financings for homebuilding and home development; |
| | • | | readily marketable debt securities; |
| | • | | commercial papers and accounts receivables, drafts, bills of exchange, acceptances or notes arising out of commercial transactions; or |
| | • | | short-term working capital and medium and long-term loans to small and medium-sized businesses and individuals engaged in agriculture, services, industry, housing and other financial and allied services in its market. |
As of June 30, 2013, the Republic had 70 operating thrift banks (including microfinance-oriented banks), with a total of 1,662 branches.
Rural and cooperative banks extend credit in the rural areas on reasonable terms to meet the normal credit needs of farmers, fishermen, cooperatives and merchants and, in general, the people in the rural communities. As of June 30, 2013, the Republic had 577 operating rural and cooperative banks with a total of 2,647 branches.
90
As of June 30, 2013, there were 191 thrift and rural banks that are considered microfinance oriented banks, with more than 50% of their operations dedicated to lending amounts as low as (Peso)5,000.
The specialized Government banks are the Development Bank of the Philippines, the Land Bank of the Philippines and the Al-Amanah Islamic Investment Bank of the Philippines. The Development Bank generally provides banking services to meet the medium and long-term needs of small- and medium-sized agricultural and industrial enterprises, particularly in rural areas. The Land Bank primarily provides financial support for agriculture and all phases of the Republic’s agrarian reform program. The Development Bank and the Land Bank also operate as universal banks. The Al-Amanah Islamic Investment Bank promotes the development of the ARMM by offering banking, financing and investment services based on Islamic banking principles and rulings.
Non-bank financial institutions are primarily long-term financing institutions, though they also facilitate short-term placements in other financial institutions. As of June 30, 2013, Bangko Sentral regulated or supervised 13 non-bank financial institutions with quasi-banking functions. Bangko Sentral also supervised or regulated 6,306 non-bank financial institutions without quasi-banking functions.
Recent Financial System Developments
In the third quarter of 2013, the Philippine banking system grew 14% in total loan portfolio, 28.4% in deposit liabilities and 11.5% in capital accounts, compared with the same period in 2012. Despite the difficult global financial environment, the Philippine banks registered net profit of (Peso)126.9 billion for the nine months ended September 30, 2013, which represented a 41.4% increase over net profit of (Peso)89.7 billion for the same period in 2012. Annualized return-on-equity stood at 23.2% for the second quarter of 2013, up from 16.6% for the same period in 2012, and annualized return-on-assets was up 2.7%, compared with 1.9% for the same period in 2012. As of September 30, 2013, the non-performing asset ratio declined to 3.0%, compared to 3.1% as of September 30, 2012. As of March 31, 2013, the universal and commercial banks’ capital adequacy ratio, on a consolidated basis, stood at 18.9%, and the net-tier-1 capital ratio was at 15.9%. Liquidity increased, as the liquid assets-to-deposits ratio increased to 58.8% as of September 30, 2013 from 57.5% as of September 30, 2012.
91
Non-Performing Loans
The following table provides information regarding non-performing loans (“NPL”) for universal and commercial banks for the periods indicated.
| | | | | | | | | | | | | | | | | | | | | | | | |
| | | Total Loans (Gross) and Non-Performing Loans by type of Bank | |
| | | As of December 31, | | | 2013(1) | |
| | | 2008 | | | 2009 | | | 2010 | | | 2011 | | | 2012 | | |
| | | (Peso in billions, except percentages) | |
Expanded commercial/Universal banks(2) | | | | | | | | | | | | | | | | | | | | | | | | |
Total loans | | | 1,619.7 | | | | 1,817.8 | | | | 1,855.9 | | | | 2,193.8 | | | | 2,581.7 | | | | 2,732.0 | |
Total non-performing loans | | | 63.5 | | | | 56.3 | | | | 55.2 | | | | 46.1 | | | | 44.5 | | | | 73.6 | |
Ratio of non-performing loans to total loans | | | 3.9 | % | | | 3.1 | % | | | 3.0 | % | | | 2.1 | % | | | 1.7 | % | | | 2.7 | % |
Non-expanded/Commercial banks(2) | | | | | | | | | | | | | | | | | | | | | | | | |
Total loans | | | 180.9 | | | | 187.0 | | | | 199.5 | | | | 229.0 | | | | 172.9 | | | | 195.0 | |
Total non-performing loans | | | 11.4 | | | | 12.3 | | | | 11.7 | | | | 12.3 | | | | 9.2 | | | | 9.7 | |
Ratio of non-performing loans to total loans | | | 6.3 | % | | | 6.6 | % | | | 5.9 | % | | | 5.4 | % | | | 5.3 | % | | | 5.0 | % |
Government banks(3) | | | | | | | | | | | | | | | | | | | | | | | | |
Total loans | | | 361.9 | | | | 351.6 | | | | 341.7 | | | | 449.5 | | | | 443.2 | | | | 432.1 | |
Total non-performing loans | | | 8.2 | | | | 8.3 | | | | 10.3 | | | | 10.2 | | | | 10.5 | | | | 14.9 | |
Ratio of non-performing loans to total loans | | | 2.3 | % | | | 2.4 | % | | | 3.0 | % | | | 2.3 | % | | | 2.4 | % | | | 3.5 | % |
Foreign banks(4) | | | | | | | | | | | | | | | | | | | | | | | | |
Total loans | | | 339.8 | | | | 368.4 | | | | 404.5 | | | | 349.5 | | | | 419.9 | | | | 401.7 | |
Total non-performing loans | | | 5.1 | | | | 4.1 | | | | 3.0 | | | | 3.4 | | | | 3.4 | | | | 2.7 | |
Ratio of non-performing loans to total loans | | | 1.5 | % | | | 1.1 | % | | | 0.7 | % | | | 1.0 | % | | | 0.8 | % | | | 0.7 | % |
Total loans | | | 2,502.3 | | | | 2,724.9 | | | | 2,801.7 | | | | 3,221.8 | | | | 3,617.7 | | | | 3,760.9 | |
Total non-performing loans | | | 88.2 | | | | 80.9 | | | | 80.2 | | | | 71.9 | | | | 67.5 | | | | 100.9 | |
Ratio of non-performing loans to total loans | | | 3.5 | % | | | 3.0 | % | | | 2.9 | % | | | 2.2 | % | | | 1.9 | % | | | 2.7 | % |
Source: Bangko Sentral.
Notes:
| (1) | Preliminary data as of June 30, 2013. |
| (2) | Includes ING Bank and excludes Land Bank of the Philippines and Development Bank of the Philippines. |
| (3) | Consists of Land Bank, Development Bank and Al-Amanah Islamic Investment Bank. |
| (4) | Consists of 14 foreign banks; excludes four foreign bank subsidiaries. |
As of December 31, 2009, the ratio of non-performing loans to total loans was 3.0%, which was 0.5% lower than the 3.5% recorded as of December 31, 2008. This improvement in the non-performing loan ratio was due mainly to an 8.3% decline in non-performing loans from (Peso)88.2 billion in 2008 to (Peso)80.9 billion in 2009, combined with an 8.9% expansion in the total loan portfolio from its 2008 levels.
As of December 31, 2010, the ratio of non-performing loans to total loans was 2.9%, which was 0.1% lower than the 3.0% recorded as of December 31, 2009. This reduction primarily resulted from a 2.8% expansion in the total loan portfolio from the levels recorded as of December 31, 2009, and a 0.9% decrease in non-performing loans from (Peso)80.9 billion as of December 31, 2009 to (Peso)80.2 billion as of December 31, 2010.
As of December 31, 2011, the ratio of non-performing loans to total loans was 2.2%, compared with the ratio of 2.9% recorded as of December 31, 2010. While non-performing loans decreased by 10.3% to (Peso)71.9 billion as of December 31, 2011 from the (Peso)80.2 billion recorded as of December 31, 2010, the total loan portfolio increased by 15.0% to (Peso)3,221.8 billion recorded as of December 31, 2011 from (Peso)2,801.7 billion as of December 31, 2010.
92
As of December 31, 2012, the ratio of non-performing loans to total loans was 1.9%, compared with the ratio of 2.2% recorded as of December 31, 2011. While non-performing loans decreased by 4.4% to (Peso)67.5 billion as of December 31, 2012 from the (Peso)71.9 billion recorded as of December 31, 2011, the total loan portfolio increased by 12.3% to (Peso)3,617.7 billion recorded as of December 31, 2012 from (Peso)3,221.8 billion as of December 31, 2011.
As of June 30, 2013, the ratio of non-performing loans to total loans was 2.7% compared to 1.9% as of December 31, 2012. Starting in January 2013, Bangko Sentral adopted a new definition for non-performing loans. Under the old definition, non-performing loans were reported net of loans considered a “loss” but fully provisioned. Following the change in definition, gross non-performing loans represent the actual level of non-performing loans, without any adjustment for loans treated as a “loss” and fully provisioned.
Financial Sector Reforms
The Government has undertaken a number of reforms in the financial sector intended to reduce bank holdings of non-performing assets and improve the health of the banking industry in general. Certain of these reforms are discussed below.
On December 19, 2005, the Monetary Board partially lifted a moratorium on the establishment of bank branches and other banking offices that had been in place since 1999. This action was aimed primarily at increasing competition among banks and improving banking services and accessibility in underserved areas. Under the Monetary Board’s new guidelines, banks that meet certain qualification requirements may establish branches anywhere in the Philippines, except in selected areas of Metro Manila that are to be opened to increased competition in phases through June 2014. On May 30, 2012, the Monetary Board also removed the limit on the number of branches for which banks may apply.
Bangko Sentral has supported amendments to its charter to strengthen regulation of the banking sector. The proposed amendments, which have been recommended for approval by the Committee on Banks and Financial Intermediaries and have been referred to the Department of Budget and Management and the Department of Finance for position papers, would relax bank secrecy rules, give Bangko Sentral more flexibility to order consolidations in the banking industry, clarify the grounds for closing problem banks or declaring them insolvent and strengthen legal protections for bank supervisors acting in their official capacity. As of the date of this prospectus, the proposed legislative bills amending the Bangko Sentral Charter are currently pending in both houses of Congress.
On August 22, 2008, the Personal Equity and Retirement Account Law was signed into law. The law aims to improve the Republic’s savings rate and support the development of the domestic capital markets by setting up a personal savings plan for employees similar to the 401(k) pension scheme adopted in the United States.
On October 31, 2008, the Credit Information System Act was signed into law. The act aims to establish a comprehensive credit information system in the Republic, and also seeks to improve access to credit, lower the cost of credit to borrowers and reduce reliance on collateral-based lending.
On June 30, 2009, Republic Act No. 9648, or the Documentary Stamp Tax Law, was signed into law. The law exempts the sale, barter or exchange of shares of stock listed and traded through the Philippine Stock Exchange from documentary stamp taxes. The law is intended to stimulate trading in the local capital markets.
On December 17, 2009, Republic Act No. 9856, or An Act Providing the Legal Framework for Real Estate Investment Trusts and Other Purposes became law as then President Arroyo neither signed nor vetoed the enrolled bill approved by Congress. The law, which aims to further develop the capital markets in the Republic, governs the operation of real estate investment trusts (“REITs”) that employ the pooled capital of investors to acquire and manage income from mortgage loans. Under the law, REITs are listed stock corporations that will
93
provide small and large investors with options to participate directly in the ownership, financing and management of large-scale real estate projects at affordable rates of investment. REITs will be in the form of a corporation that is mandated to distribute at least 90% of its net income as dividends to shareholders while the corporate tax of 30% will be imposed on the remainder of the net income. The law also grants various tax incentives to eligible REITs.
On July 26, 2011, the BIR implemented revised tax rules on companies that qualify as REITs. These implementing rules permit companies that qualify as REITs to deduct dividends paid to their shareholders from their gross income for the purposes of determining the REIT’s income tax liability. Income payments by REITs are also subject to a preferential withholding rate of 1% (as opposed to the rate of 6% for ordinary corporations), and the stamp taxes and registration fees that REITs pay on the sale or transfer of real estate property are to be reduced by 50%.
On January 10, 2011, Bangko Sentral started the process of integrating Philippine banking practices with Basel III standards. Basel III, which is the most recent update to the Basel Accord establishing a global risk-based capital adequacy framework issued by the Basel Committee on Banking Supervision, states that a majority of a bank’s capital base must be in the form of common equity elements and sets out minimum criteria for instruments to qualify in each of the agreement’s sub-categories of capital. Bangko Sentral has issued guidelines on using non-common equity components in a bank’s capital base as a basis for determining capital instruments that could be counted as regulatory capital by Philippine banks. These guidelines apply to capital instruments issued on or after January 1, 2011.
On January 3, 2012, Bangko Sentral issued a Basel III implementation roadmap and on January 10, 2012 defined qualifying capital instruments in accordance with Basel III. Bangko Sentral has also announced the country’s adoption of Basel III standards for risk-based capital covering universal and commercial banks by January 2014, four years ahead of the deadline given by the Basel Committee.
Bangko Sentral has also implemented regulatory measures to strengthen the framework of banks’ corporate governance, imposed higher capital charges to curb speculative foreign exchange transactions, implemented an internal capital adequacy assessment process framework for foreign bank branches, issued guidelines for the early adoption of the Philippine Financial Reporting Standard 9, increased the minimum capital requirement for thrift banks and allowed them to invest in readily marketable foreign currency- denominated debt instruments.
94
Foreign Currency Loans
Bangko Sentral imposes a combination of prior approval, registration and reporting requirements on all non-peso denominated loans. The regime is as follows:
| | |
Type of Loan | | Requirements |
Private sector loans: • guaranteed by a public sector entity or a local commercial bank; | | Prior approval, subsequent registration and reporting requirements. |
| |
• granted by foreign currency deposit units that are specifically or directly funded from, or collateralized by, offshore loans or deposits; | | |
| |
• obtained by banks and financial institutions with a term exceeding one year which will be re-lent to public and private enterprises; or | | |
| |
• serviced using foreign exchange purchased from the banking system, unless specifically exempted from the prior approval requirement. | | |
| |
• Private sector loans which are specifically exempted from the prior approval requirement and which will be serviced with foreign exchange purchased from the banking system. | | Subsequent registration and reporting requirements. |
| |
• All private sector loans to be serviced with foreign exchange not purchased from the banking system. | | Reporting requirements. |
| |
Public sector offshore loans except: • short-term foreign currency deposit loans for trade financing and | | Prior approval and reporting requirements. |
| |
• short-term interbank borrowings. | | |
The Philippine Securities Markets
History and Development
The securities industry in the Philippines began with the opening of the Manila Stock Exchange in 1927. In 1936, the Government established the Philippine SEC to oversee the industry and protect investors. Subsequently, the Makati Stock Exchange opened in 1963 and merged with the Manila Stock Exchange to form the Philippine Stock Exchange in 1994.
On June 29, 1998, the Philippine SEC granted the Philippine Stock Exchange self-regulatory organization status, empowering it to supervise and discipline its members, including by examining a member’s books of account and conducting audits.
To broaden the range of securities eligible for listing, the Philippine Stock Exchange established a board for small- and medium-sized enterprises with an authorized capital of (Peso)20.0 million to (Peso)99.9 million of which at least 25% must be subscribed and fully paid.
In August 2001, the Philippine Stock Exchange completed its conversion to a publicly held stock corporation. As its first shareholders, each of the 184 member-brokers subscribed and fully paid for 50,000 shares. The listing of its shares on the Philippine Stock Exchange took effect in December 2003 and 40% of the unissued shares were sold through a private placement in February 2004.
95
As of November 30, 2013, the Philippine Stock Exchange had 256 listed companies and 135 active trading participants.
As of November 30, 2013, the Philippine Stock Exchange composite index closed at 6,208.8 compared to a close of 5,812.7 on December 28, 2012, 4,372.0 on December 29, 2011, 4,201.1 on December 30, 2010, 3,052.7 on December 29, 2009 and 1,872.9 on December 24, 2008.
In 2012, the average of the Philippine Stock Exchange composite index was 5,169.0, compared to the average index level of 4,185.7 in 2011, 3,521.6 in 2010, 2,469.8 in 2009 and 2,631.0 in 2008.
In addition to the Philippine Stock Exchange, the Philippine Dealing and Exchange Corporation (“PDEX”), which deals mainly with trading of foreign exchange and fixed-income securities, was granted self-regulatory organization status by the Philippine SEC in 2006. The Corporation registered a trading volume of (Peso)4,198 billion of both government and corporate securities in the first half of 2013, an increase of 126.3% from the (Peso)1,855 billion registered during the same period in 2012.
Government Securities Market
The Bureau of the Treasury currently conducts weekly public offerings of treasury bills with maturities of 91 days, 182 days and 364 days, as well as treasury bonds with maturities ranging from two years to 25 years.
As of December 31, 2008, outstanding Government securities amounted to (Peso)2.5 trillion, 59.1% of which were regular issuances of treasury bills and FXTBs. The remaining 40.9% of Government issued debt securities were benchmark bonds, special bond issuances, other notes and bonds and Government-guaranteed corporate debt. The increase in Bangko Sentral’s borrowing and lending rates by 0.25% on August 28, 2008, following a combined increase of 0.75% in June and July 2008, translated into an increase in the cost of borrowing of banks from Bangko Sentral.
As of December 31, 2009, outstanding Government securities amounted to (Peso)2.5 trillion, 50.5% of which were issuances of treasury bills and FXTBs. The remaining issuances of Government securities consisted of RTBs, progress bonds, foreign exchange promissory notes and Government-guaranteed debt, among others. On January 27, 2009, the Republic completed a domestic bond exchange whereby approximately (Peso)144.5 billion in aggregate principal amount of five- and seven-year treasury bonds were issued in exchange for approximately (Peso)136.6 billion in aggregate principal amount of bonds maturing between 2009 and 2016.
As of December 31, 2010, outstanding Government securities amounted to (Peso)2.8 trillion, 49.7% of which were issuances of treasury bills and FXTBs. The remaining issuances of Government securities consisted of RTBs, progress bonds, foreign exchange promissory notes, zero coupon treasury bonds, multicurrency RTBs and Government-guaranteed debt, among others. On August 19, 2010, the Government raised (Peso)97.5 billion from the sale of five-, seven- and ten-year RTBs. On December 8, 2010, the Government raised (Peso)199.5 billion from the sale of 10- and 25-year bonds.
As of December 31, 2011, outstanding Government securities amounted to (Peso)2.9 trillion, 45.5% of which were issuances of treasury bills and FXTBs. The remaining issuances of Government securities consisted of RTBs, progress bonds, foreign exchange promissory notes, zero coupon treasury bonds, multicurrency RTBs and Government-guaranteed debt, among others. On October 20, 2011, the Government raised (Peso)110.1 billion from the sale of 10- and 15-year RTBs. On July 19, 2011, the Government issued (Peso)323.5 billion and redeemed (Peso)292.5 billion as part of the Domestic Debt Consolidation Program. On March 1, 2012, the Government raised (Peso)179.8 billion from the sale of two- and 15-year RTBs.
As of December 31, 2012, outstanding Government securities amounted to (Peso)3.5 trillion, 74.0% of which were issuances of treasury bills and FXTBs. The remaining issuances of Government securities consisted of RTBs, progress bonds, foreign exchange promissory notes, zero coupon treasury bonds, multicurrency RTBs and Government-guaranteed debt, among others.
96
As of September 30, 2013, outstanding Government securities amounted to (Peso)3.7 trillion, 72.8% of which were issuances of treasury bills and FXTBs. The remaining issuances of Government securities consisted of RTBs, progress bonds, foreign exchange promissory notes, zero coupon treasury bonds, multicurrency RTBs and Government-guaranteed debt, among others.
Public Finance
The Consolidated Financial Position
The consolidated public sector financial position measures the overall financial standing of the Republic’s public sector. It consists of the public sector borrowing requirement and the aggregate deficit or surplus of the Social Security System and the Government Service Insurance System, Bangko Sentral, the Government financial institutions and the local government units. The public sector borrowing requirement reflects the aggregate deficit or surplus of the Government, the Central Bank-Board of Liquidation’s accounts, the Oil Price Stabilization Fund and the 14 major GOCCs.
The following table sets out the consolidated financial position on a cash basis for the periods indicated.
| | | | | | | | | | | | | | | | | | | | |
| | | Consolidated Public Sector Financial
Position of the Republic | |
| | | As of December 31, | |
| | | 2008 | | | 2009 | | | 2010 | | | 2011 | | | 2012 | |
| | | (Peso in billions, except percentages) | |
Public sector borrowing requirement: | | | | | | | | | | | | | | | | | | | | |
National Government | | | (68.1 | ) | | | (298.5 | ) | | | (314.5 | ) | | | (197.8 | ) | | | (279.1 | ) |
CB Restructuring | | | (8.8 | ) | | | (8.8 | ) | | | (7.7 | ) | | | (3.5 | ) | | | (3.4 | ) |
Monitored Government-owned corporations | | | (27.2 | ) | | | (19.3 | ) | | | (66.9 | ) | | | (23.7 | ) | | | (32.0 | ) |
Adjustment of net lending and equity to GOCCs | | | 13.8 | | | | (3.3 | ) | | | 9.9 | | | | 1.0 | | | | 0.0 | |
Other adjustments | | | 0.1 | | | | 0.0 | | | | 0.1 | | | | 0.0 | | | | 0.0 | |
| | | | | | | | | | | | | | | | | | | | |
Total public sector borrowing requirement | | | (90.2 | ) | | | (329.8 | ) | | | (379.0 | ) | | | (223.9 | ) | | | (314.5 | ) |
| | | | | | | | | | | | | | | | | | | | |
As a percentage of GDP | | | (1.2 | )% | | | (4.1 | )% | | | (4.2 | )% | | | (2.3 | )% | | | (2.9 | )% |
Other public sector: | | | | | | | | | | | | | | | | | | | | |
Social Security System and Government Service Insurance System | | | 66.7 | | | | 39.0 | | | | 40.1 | | | | 48.0 | | | | 66.8 | |
Bangko Sentral(1) | | | 9.4 | | | | (7.6 | ) | | | (63.7 | ) | | | (47.4 | ) | | | 1.0 | |
Government financial institutions | | | 7.5 | | | | 10.0 | | | | 9.5 | | | | 9.9 | | | | 9.3 | |
Local government units | | | 35.6 | | | | 31.8 | | | | 34.1 | | | | 34.7 | | | | 23.5 | |
Timing adjustment of interest payments to Bangko Sentral | | | 2.2 | | | | (0.3 | ) | | | 0.4 | | | | 0.0 | | | | 0.0 | |
Other adjustments | | | 0.0 | | | | 0.2 | | | | 2.9 | | | | 0.0 | | | | 0.0 | |
| | | | | | | | | | | | | | | | | | | | |
Total other public sector | | | 121.4 | | | | 88.4 | | | | 23.2 | | | | 45.2 | | | | 100.6 | |
| | | | | | | | | | | | | | | | | | | | |
Consolidated public sector financial position | | | 31.2 | | | | (241.4 | ) | | | (355.8 | ) | | | (178.7 | ) | | | (213.9 | ) |
| | | | | | | | | | | | | | | | | | | | |
As a percentage of GDP | | | 0.4 | % | | | (3.1 | )% | | | (4.0 | )% | | | (1.8 | )% | | | (2.0 | )% |
Source: Fiscal Policy and Planning Office, Department of Finance.
Note:
| (1) | Amounts are net of interest rebates, dividends and other amounts remitted to the Government and the Central Bank-Board of Liquidation. |
In 2009, the consolidated financial position of the Republic recorded a deficit of (Peso)241.4 billion, a reversal from the surplus of (Peso)31.2 billion recorded in 2008. The change in consolidated financial position was primarily due to increased borrowing by the Government, which increased from (Peso)68.1 billion in 2008 to (Peso)298.5 billion in
97
2009. Borrowing increased in order to compensate for reduced revenue collection resulting from the global economic crisis. Borrowing requirements for GOCCs decreased from a deficit of (Peso)27.2 billion in 2008 to a deficit of (Peso)19.3 billion in 2009 due to a substantial reduction of the National Food Authority’s deficit from (Peso)61.3 billion in 2008 to (Peso)27.0 billion in 2009. However, the reduction in the National Food Authority’s deficit was offset by a lower surplus of NPC, PSALM and Transco and the deficit of the Philippine National Oil Company (from a surplus in 2008) due to lower privatization proceeds.
In 2010, the consolidated financial position of the Republic recorded a deficit of (Peso)355.8 billion, an increase from the deficit of (Peso)241.4 billion in 2009, but lower than the Government’s program deficit for the year of (Peso)314.5 billion. The increase in the public sector deficit was largely due to an increase in the deficits recorded by Bangko Sentral and the 14 monitored GOCCs. Borrowing requirements for GOCCs increased from a deficit of (Peso)19.3 billion in 2009 to a deficit of (Peso)66.9 billion in 2010 due to lower privatization proceeds and sales from NPC, Transco and PSALM, and increased investment in irrigation by the National Irrigation Authority.
In 2011, the consolidated financial position of the Republic recorded a deficit of (Peso)178.7 billion, a substantial decrease from the deficit of (Peso)355.8 billion recorded in 2010. The lower deficit level was primarily the result of a lower deficit of the Government, which decreased from (Peso)314.5 billion in 2010 to (Peso)197.8 billion in 2011, as higher aggregate revenue collections, particularly from the BIR, more than offset the higher level of expenditures for the period. The higher level of revenue collections was nevertheless lower than the Government’s program target for the year, mainly as a result of lower revenues due to both lower average tariff rates and lower imports in 2011. A decrease in the borrowing requirements for GOCCs from a deficit of (Peso)66.9 billion in 2010 to a deficit of (Peso)23.7 billion in 2011 primarily due to the National Food Authority’s reduced importation requirements in 2011 as compared with its imports in 2010 also contributed to the lower consolidated deficit. While the deficit attributable to PSALM increased slightly in 2011 as compared with 2010 due to the exhaustion of privatization proceeds, this increase was offset by decreases in the deficits of the National Housing Authority, the Local Water Utilities Administration, the National Electrification Administration and the National Irrigation Administration. The consolidated deficit was equivalent to 1.8% of the Republic’s GDP in 2011.
In 2012, the consolidated fiscal position of the Republic recorded a deficit of (Peso)213.9 billion, an increase from the deficit of (Peso)178.7 billion in 2011, largely due to a 41.1% increase in Government borrowing requirements. However the recorded deficit was lower than the Government’s program deficit for the year of (Peso)286 billion.
98
Government Revenues and Expenditures
The following table sets out Government revenues and expenditures for the periods indicated.
| | | | | | | | | | | | | | | | | | | | | | | | | | | | | | | | |
| | | Government Revenues and Expenditures | |
| | | Actual | | | Budget | |
| | | 2008 | | | 2009 | | | 2010 | | | 2011 | | | 2012 | | | 2013(1) | | | 2012(2) | | | 2013 | |
| | | (Peso in billions, except percentages) | |
Cash Revenues | | | | | | | | | | | | | | | | | | | | | | | | | | | | | | | | |
Tax revenues: | | | | | | | | | | | | | | | | | | | | | | | | | | | | | | | | |
Bureau of Internal Revenue | | | 778.6 | | | | 750.3 | | | | 822.6 | | | | 924.1 | | | | 1,057.9 | | | | 898.0 | | | | 1,066.1 | | | | 1,253.7 | |
Bureau of Customs | | | 260.2 | | | | 220.3 | | | | 259.2 | | | | 265.1 | | | | 289.9 | | | | 224.6 | | | | 347.1 | | | | 340.0 | |
Others Government offices(3) | | | 10.4 | | | | 11.0 | | | | 11.8 | | | | 12.8 | | | | 13.3 | | | | 11.5 | | | | 14.2 | | | | 14.2 | |
| | | | | | | | | | | | | | | | | | | | | | | | | | | | | | | | |
Total tax revenues | | | 1,049.2 | | | | 981.6 | | | | 1,093.6 | | | | 1,202.1 | | | | 1,361.1 | | | | 1,134.1 | | | | 1,427.4 | | | | 1,607.9 | |
As a percentage of GDP | | | 13.6 | % | | | 12.2 | % | | | 12.1 | % | | | 12.3 | % | | | 12.9 | % | | | 10.1 | % | | | 13.3 | % | | | 13.5 | % |
Non-tax revenues: | | | | | | | | | | | | | | | | | | | | | | | | | | | | | | | | |
Bureau of the Treasury income(4) | | | 63.7 | | | | 69.9 | | | | 54.3 | | | | 75.2 | | | | 84.1 | | | | 68.1 | | | | 61.8 | | | | 57.7 | |
Fees and charges(5) | | | 6.8 | | | | 19.3 | | | | 22.8 | | | | 26.0 | | | | 27.8 | | | | 21.6 | | | | | | | | | |
Privatizations(6) | | | 31.3 | | | | 1.4 | | | | 0.9 | | | | 0.9 | | | | 8.3 | | | | 0.2 | | | | 2.0 | | | | 2.0 | |
Foreign grants | | | 0.1 | | | | 0.2 | | | | 0.4 | | | | 0.2 | | | | 0.1 | | | | 0.1 | | | | | | | | | |
Others | | | 51.8 | | | | 50.8 | | | | 35.8 | | | | 55.5 | | | | 53.5 | | | | 42.4 | | | | 69.4 | | | | 78.2 | |
| | | | | | | | | | | | | | | | | | | | | | | | | | | | | | | | |
Total non-tax revenues | | | 153.7 | | | | 141.6 | | | | 114.2 | | | | 157.9 | | | | 173.8 | | | | 132.4 | | | | 133.2 | | | | 137.9 | |
| | | | | | | | | | | | | | | | | | | | | | | | | | | | | | | | |
Total cash revenues | | | 1,174.2 | | | | 1,071.3 | | | | 1,160.8 | | | | 1,326.5 | | | | 1,496.8 | | | | 1,249.1 | | | | 1,526.4 | | | | 1,718.9 | |
Total cash revenue as a percentage of GDP | | | 14.8 | % | | | 13.3 | % | | | 12.9 | % | | | 13.6 | % | | | 14.2 | % | | | 11.1 | % | | | 14.2 | % | | | 14.4 | % |
Total non-cash Revenues | | | 58.7 | | | | 51.9 | | | | 47.0 | | | | 33.5 | | | | 38.1 | | | | 17.4 | | | | 34.2 | | | | 26.9 | |
| | | | | | | | | | | | | | | | | | | | | | | | | | | | | | | | |
Total revenues | | | 1,202.9 | | | | 1,123.2 | | | | 1,207.9 | | | | 1,359.9 | | | | 1,534.9 | | | | 1,266.5 | | | | 1,560.6 | | | | 1,745.8 | |
| | | | | | | | | | | | | | | | | | | | | | | | | | | | | | | | |
Cash Expenditures | | | | | | | | | | | | | | | | | | | | | | | | | | | | | | | | |
Personnel services | | | 374.7 | | | | 414.0 | | | | 469.4 | | | | 500.4 | | | | 542.6 | | | | 424.3 | | | | 585.7 | | | | 624.4 | |
Maintenance and other operating expense | | | 138.7 | | | | 176.4 | | | | 182.1 | | | | 201.2 | | | | 256.7 | | | | 211.0 | | | | 254.6 | | | | 317.9 | |
Interest payments | | | | | | | | | | | | | | | | | | | | | | | | | | | | | | | | |
Foreign | | | 101.7 | | | | 114.2 | | | | 111.6 | | | | 108.5 | | | | 111.6 | | | | 86.0 | | | | 109.5 | | | | 104.6 | |
Domestic | | | 170.5 | | | | 164.7 | | | | 146.9 | | | | 170.5 | | | | 201.2 | | | | 172.0 | | | | 208.1 | | | | 227.6 | |
| | | | | | | | | | | | | | | | | | | | | | | | | | | | | | | | |
Total interest payments | | | 272.2 | | | | 278.9 | | | | 294.2 | | | | 279.0 | | | | 312.8 | | | | 258.0 | | | | 317.6 | | | | 332.2 | |
Subsidies to Government corporation | | | 17.0 | | | | 17.4 | | | | 21.0 | | | | 45.8 | | | | 42.1 | | | | 35.4 | | | | 31.8 | | | | 45.0 | |
Allotment to local government units | | | 170.6 | | | | 203.2 | | | | 216.1 | | | | 229.6 | | | | 218.6 | | | | 181.4 | | | | 218.7 | | | | 241.8 | |
Comprehensive agrarian reform program (land acquisition and credit) | | | 4.1 | | | | — | | | | — | | | | 7.9 | | | | — | | | | — | | | | 2.5 | | | | — | |
Infrastructure and other capital outlays | | | 172.2 | | | | 216.5 | | | | 223.0 | | | | 159.1 | | | | 250.8 | | | | 182.6 | | | | 298.2 | | | | 303.4 | |
Capital transfers to local government units | | | 46.7 | | | | 56.9 | | | | 58.1 | | | | 70.3 | | | | 67.2 | | | | 54.8 | | | | 71.3 | | | | 76.3 | |
| | | | | | | | | | | | | | | | | | | | | | | | | | | | | | | | |
Equity and net lending | | | 16.1 | | | | 6.4 | | | | 11.4 | | | | 30.9 | | | | 48.7 | | | | 2.8 | | | | 25.1 | | | | 15.8 | |
| | | | | | | | | | | | | | | | | | | | | | | | | | | | | | | | |
Total cash expenditures | | | 1,212.3 | | | | 1,369.8 | | | | 1,475.4 | | | | 1,524.2 | | | | 1,739.6 | | | | 1,350.3 | | | | 1,805.5 | | | | 1,956.9 | |
| | | | | | | | | | | | | | | | | | | | | | | | | | | | | | | | |
As a percentage of GNI (at current prices) | | | 12.4 | % | | | 12.9 | % | | | 12.3 | % | | | 13.1 | % | | | 13.8 | % | | | 13.6 | % | | | 12.6 | % | | | 13.8 | % |
Tax expenditures | | | 58.7 | | | | 51.9 | | | | 47.0 | | | | 33.5 | | | | 38.1 | | | | 17.4 | | | | 34.2 | | | | 26.9 | |
| | | | | | | | | | | | | | | | | | | | | | | | | | | | | | | | |
Total expenditures | | | 1,271.0 | | | | 1,421.7 | | | | 1,522.4 | | | | 1,557.0 | | | | 1,777.7 | | | | 1,367.7 | | | | 1,839.7 | | | | 1,983.8 | |
| | | | | | | | | | | | | | | | | | | | | | | | | | | | | | | | |
Surplus/(Deficit) | | | (68.1 | ) | | | (298.5 | ) | | | (314.5 | ) | | | (197.8 | ) | | | (242.8 | ) | | | (101.2 | ) | | | (279.1 | ) | | | (238.0 | ) |
Financing | | | | | | | | | | | | | | | | | | | | | | | | | | | | | | | | |
Gross domestic borrowings | | | 429.3 | | | | 321.9 | | | | 489.8 | | | | 364.7 | | | | 282.6 | | | | 449.9 | | | | 500.0 | | | | 630.7 | |
Net domestic borrowings | | | 169.3 | | | | 77.4 | | | | 218.6 | | | | 64.1 | | | | 101.4 | | | | 341.9 | | | | 183.7 | | | | 303.3 | |
Non-budgetary accounts | | | (44.5 | ) | | | 2.7 | | | | (0.02 | ) | | | 2.8 | | | | 1.1 | | | | (118.9 | ) | | | (3.5 | ) | | | 953.9 | |
Use of cash balances | | | 47.5 | | | | (66.0 | ) | | | 37.2 | | | | (79.7 | ) | | | 149.9 | | | | 45.8 | | | | | | | | | |
Net foreign borrowings | | | (9.2 | ) | | | 152.5 | | | | 133.0 | | | | 51.2 | | | | 70.2 | | | | (76.0 | ) | | | 105.2 | | | | (3.4 | ) |
| | | | | | | | | | | | | | | | | | | | | | | | | | | | | | | | |
Total net financing requirement | | | 160.6 | | | | 229.8 | | | | 351.6 | | | | 115.3 | | | | 171.6 | | | | 265.9 | | | | 288.9 | | | | 299.9 | |
| | | | | | | | | | | | | | | | | | | | | | | | | | | | | | | | |
Sources: Department of Finance; Department of Budget and Management.
99
Notes:
| (1) | Preliminary data for the first nine months of 2013. |
| (2) | As adjusted in accordance with the Government’s periodic review of the budget and financing program. |
| (3) | Represents tax revenues of the Department of Environment and Natural Resources, Bureau of Immigration and Deportation, Land Transportation Office and other Government entities. |
| (4) | Represents interest on deposits, interest on advances to Government-owned corporations, interest on securities, dividends from Government-owned corporations, earnings received from the Philippine Amusement and Gaming Corporation, earnings and terminal fees received from Ninoy Aquino International Airport, guarantee fees and others. |
| (5) | Represents receipts from the Land Transportation Office, Department of Foreign Affairs and other Government agencies. |
| (6) | Represents remittances to the Government from the sale of interests in Government-owned corporations, Government financial institutions and other Government-owned assets and from the sale of assets by the Presidential Commission on Good Government and the Asset Privatization Trust. |
Revenues
Sources
The Government derives its revenues from both tax and non-tax sources. The main sources of revenue include income taxes, value-added taxes (“VAT”), excise taxes and customs duties. The main sources of non-tax revenue consist of interest on deposits, amounts earned from Government-owned corporations and privatization receipts.
Since 2006, the BIR has implemented the following tax administration improvements:
| | • | | settlement of delinquent accounts or disputed assessments which are either being litigated in the courts or being challenged by taxpayers; |
| | • | | a lateral attrition law, which provides incentives for revenue agencies which exceed their revenue targets for given periods and penalties if they fall short of their targets; |
| | • | | specialized programs aimed at identification and prosecution of tax evaders, such as the Run After Tax Evaders (“RATES”) program of the BIR and the Run After The Smugglers (“RATS”) program of the Bureau of Customs (the “BOC”); |
| | • | | use of electronic documentary stamp metering machines to accurately assess and monitor documentary stamp taxes; |
| | • | | broadening the tax base to increase the number of registered taxpayers, specifically by matching BIR taxpayer records with those of other Government agencies such as the Philippine SEC; |
| | • | | issuance of revenue regulations regarding automobiles which are subject to excise tax; and |
| | • | | implementing a ceiling on deductible representation expenses as mandated by the Tax Code of 1997. |
The BIR’s RATES program’s general goal is to effectively raise tax revenues; it is also intended to enhance voluntary taxpayer compliance with the law, provide a deterrent to tax evaders and promote public confidence in the tax collection system. The RATES program seeks to achieve these goals by providing the infrastructure, policy framework and information systems necessary to investigate possible cases of tax evasion and determine instances where prosecution is necessary.
The BOC RATS program focuses on detecting and prosecuting smugglers and other violators of customs and tariff laws that are not detected and acted upon during initial and secondary reviews and screenings by existing BOC programs. The RATS program seeks to achieve its policy objectives by improving external infrastructure and information systems that are used to monitor customs collections, while at the same time internally reviewing the BOC’s organizational integrity to improve its performance as well as public confidence in the customs tax collection system.
100
Total Government revenues in 2009 were (Peso)1,123.2 billion, compared to the (Peso)1,202.9 billion recorded in 2008, reflecting a 6.6% decrease. Total revenues in 2009 were below the program target of (Peso)1,239.2 billion, primarily due to collection shortfalls across all Government offices compared to their target collections for 2009. BIR collections in 2009 were (Peso)750.3 billion (of which (Peso)720.5 billion were cash revenues) compared to (Peso)778.6 billion (of which (Peso)761.9 billion were cash revenues) recorded in 2008, reflecting a 3.6% decrease. The Government’s program target for BIR collections in 2009 was (Peso)798.5 billion (of which (Peso)778.5 billion was targeted to be in cash). BOC collections were (Peso)220.3 billion in 2009 (of which (Peso)198.2 billion were cash revenues) compared to (Peso)260.2 billion (of which (Peso)218.2 billion were cash revenues) recorded in 2008, reflecting a 15.3% decrease. 2009 program target for collections for the BOC was (Peso)273.3 billion, of which (Peso)238.0 billion was targeted in cash. Revenues from other Government offices were (Peso)11.0 billion in 2009, compared to revenues of (Peso)10.4 billion recorded in 2008, reflecting a 5.8% increase. The revenues derived from other offices were below the 2009 program target. These shortfalls offset income from the BTr, which was (Peso)69.9 billion in 2009, compared to income of (Peso)63.7 billion recorded in 2008, representing a 9.8% increase. The figure is also above the (Peso)60.1 billion program target for 2009.
Total Government revenues in 2010 were (Peso)1,207.9 billion, a 7.5% increase over the (Peso)1,123.2 billion recorded in 2009. Total revenues for 2010 were (Peso)86.5 billion, or 6.7%, lower than the (Peso)1,294.4 billion program target for the year. This shortfall in revenue was the result of shortfalls of 4.4%, 7.6% and 23.1% in actual collections by the BIR, the BOC and other Government offices against their respective program targets. BIR collections in 2010 were (Peso)822.6 billion ((Peso)807.1 billion of which were cash revenues), reflecting a 9.6% increase from BIR collections of (Peso)750.3 billion ((Peso)720.5 billion of which were cash revenues) recorded in 2009. BOC collections were (Peso)259.2 billion ((Peso)227.5 billion of which were cash revenues) in 2010, compared to (Peso)220.3 billion recorded in 2009 ((Peso)198.2 billion of which were cash revenues), reflecting a 17.7% increase. Revenues from other Government offices were (Peso)11.8 billion in 2010, an increase of 7.3% from the (Peso)11.0 billion of revenues from other Government offices recorded in 2009. Income from the BTr was (Peso)54.3 billion in 2010, compared to income of (Peso)69.9 billion recorded in 2009, representing a 22.3% decrease.
Total Government revenues in 2011 were (Peso)1,359.9 billion, a 12.6% increase over the (Peso)1,207.9 billion recorded in 2010. Total Government revenues in 2011 were (Peso)51.4 billion, or 3.8%, lower than the (Peso)1,411.3 billion program target for the year. This shortfall in revenue was the result in shortfalls of 1.7%, 17.2% and 3.0% in actual collections by the BIR, the BOC and other Government offices against their respective program targets. During 2011, BIR collections were (Peso)924.1 billion ((Peso)900.0 billion of which were cash revenues), an increase of 12.3% from the (Peso)822.6 billion recorded in the same period in 2010. The BOC recorded collections of (Peso)265.1 billion ((Peso)255.7 billion of which were cash revenues) in 2011, a 2.3% increase from the (Peso)259.2 billion recorded in the same period in 2010. Revenues from the BTr were (Peso)75.2 billion in 2011, a 38.5% increase from the (Peso)54.3 billion recorded in 2010.
Total Government revenues in 2012 were (Peso)1,534.9 billion, a 12.9% increase over the (Peso)1,359.9 billion recorded in 2011. Total Government revenues in 2012 were (Peso)1,534.9 billion, or 1.6%, lower than the (Peso)1,560.6 billion target for the year due to a tax revenue short fall of $66.3 billion or 4.6%, offset by $34.3 billion higher collections in non-tax revenues or 26.1%. In 2012, BIR collections, which account for approximately 77.7% of total taxes, were (Peso)1,057.9 billion, a 14.5% increase over the previous year, and BOC collections were (Peso)289.9 billion, which was 9.4% higher than the previous year.
Total Government revenues in the first nine months of 2013 were (Peso)1,267 billion, a 13.2% increase over the (Peso)1,119 billion recorded in the same period in 2012. In the first nine months of 2013, BIR collections were (Peso)898.0 billion and BOC collections were (Peso)224.6 billion.
Expenditures
Total Government spending in 2009 was (Peso)1,421.7 billion, an 11.9% increase from the 2008 level of (Peso)1,271.0 billion. The increase in disbursements was intended to counter the effects of the global economic crisis
101
and to provide for Government support for the areas affected by Typhoons “Ondoy” and “Pepeng.” Maintenance expenditures (27.2% or (Peso)37.8 billion) and capital outlays (25.7% or (Peso)44.3 billion) increased, largely resulting from the stimulus spending undertaken early in the year and the provision for the 2010 national automated elections, anti-poverty programs such as conditional cash transfers and scholarship programs, and faster settlement of prior years’ payables. Personal services also increased substantially, by (Peso)39.4 billion or 10.5% from 2008 levels, mainly because of the implementation of the Salary Standardization Law III. Interest payments went up by (Peso)6.6 billion, or 2.4%, from 2008 levels to (Peso)278.9 billion, due to the depreciation of the peso, which was partially tempered by a decline in interest rates.
Total Government expenditures in 2010 amounted to (Peso)1,522.4 billion, a 7.1% increase from the (Peso)1,421.7 billion recorded in 2009, but (Peso)97.1 billion, or 6.0%, lower than program total expenditures of (Peso)1,619.4 billion for 2010. Total expenditures were below programmed levels, mainly because interest payments of (Peso)294.2 billion in 2010 were (Peso)32.8 billion, or 10%, lower than the expected 2010 interest payments of (Peso)327.0 billion.
Total Government expenditures in 2011 were (Peso)1,557.0 billion, 2.3% greater than the (Peso)1,522.4 billion recorded in 2010. Total Government expenditures in 2011 were (Peso)154.3 billion, or 9.0%, lower than the (Peso)1,711.3 billion program target for the year. The Disbursement Acceleration Program implemented in the latter part of 2011 reallocated funds to fast moving and high impact programs and projects, thus allowing government resources to be used more efficiently.
Total Government expenditures in 2012 were (Peso)1,777.7 billion, 14.2% higher than the (Peso)1,557.0 billion of total Government expenditures in 2011. Maintenance expenditures and capital outlays increased in 2012 relative to 2011. Maintenance expenditures increased by 27.6% to (Peso)256.7 billion for 2012 compared to 2011 due to a higher provision for various developmental and social protection projects of the Government. Given the significantly higher allocations for various infrastructure and civil works projects of the Department of Public Works and Highways as well as irrigation projects of the Department of Agriculture, spending on infrastructure and other capital outlays for 2012 increased by 57.7% compared to 2011.
Total Government expenditures in the first nine months of 2013 were (Peso)1,367.7 billion, 11.8% higher than the same period in 2012. The growth in expenditures was largely driven by non-interest expenditures, which grew by 13.5% during the first nine months of 2013 over the same period in 2012, while interest payments increased by only 5.2%. Maintenance expenditures and capital outlays increased by (Peso)82.4 billion, or 26.5%, in the first nine months of 2013 relative to the same period in 2012, as the Government released additional funds to finance its anti-poverty programs. Personnel services increased by 9.7% over the same period in 2012, due to salary increases of Government employees and financing newly created teaching and non-teaching positions at the Department of Education.
President Aquino’s administration has undertaken a number of initiatives to sustain spending momentum going forward, including regular meetings between the Department of Budget and Management and certain Government agencies that have had trouble meeting spending objectives in the past and the creation of account management teams at select departments. In addition, the Government has identified certain key issues and bottlenecks, which include procurement delays due to incorrect technical specifications, poor targeting or weak assumptions and a lack of coordination among the various groups in a department in terms of submission of their spending programs. The Aquino administration proposed a number of initiatives in its 2013 Budget while simultaneously working with the affected departments to ensure these bottlenecks are addressed. For instance, the Government has directed agencies to put their infrastructure projects up for bidding immediately after national evaluation protocol submission. The Government remains committed to the acceleration of the implementation of critical programs and projects to achieve its targets.
102
The Government Budget
The Budget Process
The Administrative Code of 1987 requires the Government to formulate and implement a national budget. The President submits the budget to Congress within 30 days of the opening of each regular session of Congress, which occurs on the fourth Monday of each July. The House of Representatives reviews the budget and transforms it into a general appropriations bill. The Senate then reviews the budget. A conference committee composed of members of both houses of Congress then formulates a common version of the bill. Once both houses approve the budget, the bill goes to the President for signing as a general appropriations act.
2013 Budget
On December 28, 2012, President Aquino signed into law Republic Act No. 10352 or the General Appropriations Act for 2013. The 2013 budget increased expenditures by 11.6% to (Peso)2.0 trillion, from the (Peso)1.8 trillion budgeted in 2012. The Department of Education received the highest allocation in the 2013 budget, with (Peso)251.4 billion, a 15.6% increase from the (Peso)217.4 billion allocated in 2012. President Aquino has stated that this allocation reflects the Government’s policy of increasing expanding critical educational inputs. The Department of Public Works and Highways’ 2013 allocation increased by 34.7% from its allocation in 2012, mainly due to the Aquino Administration’s emphasis on creating an environment conducive to growth and private business activities.
The 10 Government agencies with the highest allocations under the 2013 budget compared to their corresponding allocations under the 2012 budget are listed below.
| | | | | | | | | | | | |
Agency | | 2013
Allocation | | | 2012
Allocation | | | 2013 Increase
from 2012 | |
| | | (Peso in billions) | |
Department of Education | | | 251.4 | | | | 217.4 | | | | 15.6 | % |
Department of Public Works and Highways | | | 169.3 | | | | 125.7 | | | | 34.7 | % |
Department of Interior and Local Government | | | 92.3 | | | | 76.3 | | | | 21.0 | % |
Department of National Defense | | | 80.6 | | | | 72.7 | | | | 10.9 | % |
Department of Agriculture | | | 65.1 | | | | 53.3 | | | | 22.1 | % |
Department of Social Welfare and Development | | | 56.4 | | | | 48.8 | | | | 15.6 | % |
Department of Health | | | 51.9 | | | | 43.5 | | | | 19.3 | % |
Department of Transportation and Communications | | | 35.7 | | | | 34.1 | | | | 4.7 | % |
Department of Finance | | | 30.8 | | | | 23.2 | | | | 32.8 | % |
Department of Environment and Natural Resources | | | 23.7 | | | | 17.5 | | | | 35.4 | % |
The 2013 budget anticipates a (Peso)238.0 billion budget deficit, or approximately 2.0% of the Republic’s expected GDP for 2013. The deficit is expected to be financed by approximately (Peso)300.0 billion in net Government borrowings.
2014 Budget
The Aquino administration submitted its proposed 2014 national budget to the House of Representatives on July 23, 2013. The proposed 2014 budget of (Peso)2.27 trillion represents a 13.5% increase over the 2013 budget of (Peso)2.0 trillion. The proposed 2014 budget is equivalent to 17.1% of GDP, which is higher than the 16.7% of GDP represented by the 2013 budget. The Government has adopted a deficit target of 2.0% of GDP in 2014, or (Peso)266.2 billion in absolute terms. This target is the same as the current deficit outlook for 2013, which is (Peso)238.0 billion, or 2.0% of GDP.
103
The 2014 budget reflects President Aquino’s policy of increasing investments in basic services such as education, healthcare and social protection. The Department of Education, the Department of Public Works and Highways and the Department of the Interior and Local Government received the highest allocations in the 2014 budget. In line with President Aquino’s policy to increase the opportunities of the economically disadvantaged, social services was allocated (Peso)842.8 billion, or 37.2% of the 2014 budget, which is an increase from the approximately 34.9% of the budget that social services represented in 2013.
In the proposed 2014 budget, (Peso)353.0 billion is designated for payment of the Republic’s debt service obligations in 2014, an increase of 6.3% from the (Peso)332.0 billion allocated in 2013. The proposed debt service allocation for 2014 includes (Peso)248.0 billion for domestic obligations and (Peso)104.0 billion for foreign obligations.
On December 4, 2013, the Senate approved a (Peso)14.6 billion supplemental budget, sourced from the unused Priority Development Assistance Fund, to augment funds for rehabilitation of areas affected by Typhoon “Yolanda” and other recent calamities.
The 10 Government agencies with the highest allocations under the proposed 2014 budget compared to their corresponding allocations under the 2013 budget are listed below.
| | | | | | | | | | | | |
Agency | | 2014
Allocation | | | 2013
Allocation | | | 2014 Increase
from 2013 | |
| | | (Peso in billions) | |
Department of Education | | | 336.9 | | | | 251.4 | | | | 34.0 | % |
Department of Public Works and Highways | | | 213.5 | | | | 169.3 | | | | 26.1 | % |
Department of Interior and Local Government | | | 135.4 | | | | 92.3 | | | | 46.7 | % |
Department of National Defense | | | 123.1 | | | | 80.6 | | | | 52.7 | % |
Department of Health | | | 87.1 | | | | 51.9 | | | | 67.8 | % |
Department of Agriculture | | | 80.7 | | | | 65.1 | | | | 24.0 | % |
Department of Social Welfare and Development | | | 79.0 | | | | 56.4 | | | | 40.1 | % |
Department of Transportation and Communications | | | 48.7 | | | | 35.7 | | | | 36.4 | % |
Department of Environment and Natural Resources | | | 23.9 | | | | 23.7 | | | | 0.8 | % |
Department of Agrarian Reform | | | 20.4 | | | | 21.4 | | | | (4.7 | )% |
The proposed 2014 budget anticipates a (Peso)266.2 billion budget deficit, or approximately 2.0% of the Republic’s expected GDP for 2014. The deficit is expected to be financed by (Peso)269.0 billion in net domestic borrowings and (Peso)5.0 billion in net foreign borrowings.
Debt
External Debt
For foreign borrowings by the private sector, Bangko Sentral approval is required if the loans (i) are guaranteed by the public sector; (ii) will be serviced with foreign exchange from the Philippine banking system; or (iii) the loans will be obtained by banks for the purpose of re-lending and have maturities of more than one year.
104
The following table sets out the total outstanding Bangko Sentral-approved and registered external debt.
| | | | | | | | | | | | | | | | | | | | | | | | |
| | | Bangko Sentral Approved External Debt
| |
| | | As of December 31, | | | | |
| | | 2008 | | | 2009 | | | 2010 | | | 2011 | | | 2012 | | | 2013(1) | |
| | | ($ in millions, except percentages) | |
By Maturity: | | | | | | | | | | | | | | | | | | | | | | | | |
Short-term(2) | | | 7,001 | | | | 4,002 | | | | 6,295 | | | | 7,013 | | | | 8,483 | | | | 9,549 | |
Medium and long-term | | | 47,327 | | | | 50,853 | | | | 53,753 | | | | 53,429 | | | | 51,855 | | | | 48,460 | |
| | | | | | | | | | | | | | | | | | | | | | | | |
Total | | | 54,328 | | | | 54,856 | | | | 60,048 | | | | 60,442 | | | | 60,337 | | | | 58,009 | |
| | | | | | | | | | | | | | | | | | | | | | | | |
By Debtor:(3) | | | | | | | | | | | | | | | | | | | | | | | | |
Banking system | | | 8,602 | | | | 6,646 | | | | 8,186 | | | | 9,276 | | | | 10,537 | | | | 11,398 | |
Public sector(4) | | | 35,466 | | | | 38,647 | | | | 41,542 | | | | 41,531 | | | | 40,385 | | | | 37,477 | |
Private sector(5) | | | 10,260 | | | | 9,562 | | | | 10,320 | | | | 9,635 | | | | 9,415 | | | | 9,133 | |
| | | | | | | | | | | | | | | | | | | | | | | | |
Total | | | 54,328 | | | | 54,856 | | | | 60,048 | | | | 60,442 | | | | 60,337 | | | | 58,009 | |
| | | | | | | | | | | | | | | | | | | | | | | | |
By Creditor Type: | | | | | | | | | | | | | | | | | | | | | | | | |
Multilateral | | | 9,082 | | | | 10,939 | | | | 10,908 | | | | 11,581 | | | | 11,698 | | | | 10,720 | |
Bilateral | | | 15,418 | | | | 14,717 | | | | 15,888 | | | | 15,642 | | | | 13,717 | | | | 12,067 | |
Banks and financial institutions | | | 9,040 | | | | 6,511 | | | | 7,183 | | | | 7,743 | | | | 8,963 | | | | 9,757 | |
Bond holders/note holders | | | 17,611 | | | | 19,769 | | | | 21,861 | | | | 21,298 | | | | 21,859 | | | | 21,149 | |
Supplies and Others | | | 3,177 | | | | 2,921 | | | | 4,208 | | | | 4,179 | | | | 4,100 | | | | 4,316 | |
| | | | | | | | | | | | | | | | | | | | | | | | |
Total | | | 54,328 | | | | 54,856 | | | | 60,048 | | | | 60,442 | | | | 60,337 | | | | 58,009 | |
| | | | | | | | | | | | | | | | | | | | | | | | |
Ratios: | | | | | | | | | | | | | | | | | | | | | | | | |
Debt service burden to exports of goods and services(6) | | | 9.7 | % | | | 10.4 | % | | | 8.7 | % | | | 8.9 | % | | | 7.4 | % | | | 8.5 | %(7) |
Debt service burden to GNI | | | 3.4 | % | | | 3.1 | % | | | 2.8 | % | | | 2.5 | % | | | 2.2 | % | | | 2.4 | %(7) |
External debt to GNI | | | 24.7 | % | | | 24.5 | % | | | 22.6 | % | | | 20.8 | % | | | 20.2 | % | | | 18.3 | %(8) |
Source: Bangko Sentral.
Notes:
| (1) | Data as of June 30, 2013. |
| (2) | Debt with original maturity of one year or less. |
| (3) | Classification by debtor is based on the primary obligor under the relevant loan or rescheduling documentation. |
| (4) | Includes public sector debt whether or not guaranteed by the Government; does not include public banks. |
| (5) | Excludes private banks. |
| (6) | In 2000, Bangko Sentral adopted the BPM5 framework for the compilation of its balance of payments statistics starting with the 1999 series. In March 2013, Bangko Sentral shifted to the BPM6 framework, covering balance of payment data for 2011 and 2012. |
| (7) | Data for the first six months of 2013. |
| (8) | Based on annualized GNI. |
As of December 31, 2008, outstanding external debt of the Republic approved by or registered with Bangko Sentral was $54.3 billion. Transactions during the year resulted in net repayments of $4.3 billion, but the impact of this was substantially offset by upward foreign exchange revaluation adjustments of $3.2 billion, representing the increase in the U.S. dollar value of yen-denominated obligations due to the yen’s appreciation against the U.S. dollar. As a result, the debt stock showed a decline of only $1.1 billion from the previous year’s $55.5 billion figure. Without the upward revaluation adjustments, external debt would have decreased by $4.3 billion during the year.
105
As of December 31, 2009, outstanding external debt of the Republic approved by or registered with Bangko Sentral was $54.9 billion. The increase in external debt was mainly due to an increase in net borrowings of the public sector.
As of December 31, 2010, the Republic’s outstanding external debt approved by or registered with Bangko Sentral was $60.0 billion, a 9.5% increase from the $54.9 billion recorded as of December 31, 2009. The increase in external debt in 2010 was due mainly to increases in net borrowings of the banking sector and both the private and public sectors. As of December 31, 2010, Bangko Sentral-approved medium- and long-term external debt amounted to $53.8 billion, while Bangko Sentral-approved short-term external debt amounted to $6.3 billion. Approximately 47.8% of total Bangko Sentral-approved external debt (including short-term debt) was denominated in U.S. dollars, 29.3% was denominated in Japanese yen, and 10.5% was denominated U.S. dollar multi-currency loans from international financial institutions, and 12.4% was denominated in other currencies, including SDRs.
As of December 31, 2011, the Republic’s outstanding external debt approved by or registered with Bangko Sentral was $60.4 billion, a 0.7% increase from the $60.0 billion recorded as of December 31, 2010. The increase was mainly due to foreign exchange revaluation adjustments of $800 million due to general weakening of the U.S. dollar, particularly in the third quarter of 2011, net availments of $473 million, increased investments by non-residents in Philippine debt papers of $340 million, and audit adjustments of $50 million. Approximately 47.4% of the Republic’s Bangko Sentral-approved external debt was denominated in U.S. dollars, while 27.0% was denominated in Japanese yen. Multi-currency loans from the World Bank and the ADB accounted for 11.5% of total Bangko Sentral-approved external debt, while 14.0% was denominated in other currencies.
As of December 31, 2012, the Republic’s outstanding external debt approved by or registered with Bangko Sentral was $60.3 billion, a 0.2% decrease from the $60.4 billion recorded as of December 31, 2011. The decrease was mainly due to foreign exchange revaluation adjustments and decline in non-residents’ holdings of Philippine debt papers that were traded in the secondary market.
As of June 30, 2013, the Republic’s outstanding external debt approved by or registered with Bangko Sentral was $58.0 billion, a 3.9% decrease from the $60.3 billion recorded as of December 31, 2012 and a 5.3% decrease from the $61.2 billion recorded as of June 30, 2012. The year-on-year decrease was mainly due to loan repayments as well as negative foreign exchange revaluation adjustments as the U.S. dollar strengthened, particularly against the Japanese yen, partially offset by an increase in non-residents’ investments in Philippine debt of $120 million.
106
Government Financing Initiatives
The following are the major program loans approved by creditor agencies or availed of by the Government from January 2008 to December 2013.
| | | | | | | | | | | | |
Program Loan | | Creditor | | | Amount | | | Date Signed | |
| | | | | | ($) | | | | |
Development Policy Support Program | | | ADB | | | | 250 million | | | | September 2008 | |
Philippines National Roads Improvement and Management Program | | | WB | | | | 232 million | | | | May 2008 | |
Governance in Justice Sector Reform Program | | | ADB | | | | 300 million | | | | December 2008 | |
Global Food Crisis Response Program Development Policy Operation Project | | | WB | | | | 200 million | | | | December 2008 | |
Development Policy Support Program II | | | ADB/JICA | | | | 100 million | | | | March 2009 | |
Local Government Financing and Budget Reform Program | | | ADB | | | | 225 million | | | | November 2009 | |
Social Welfare and Development Reform Project | | | WB | | | | 400 million | | | | February 2010 | |
Local Government Financing and Budget Reform Program, Phase 1 | | | AFD | | | | 187 million | | | | February 2010 | |
Development Policy Support Program III | | | ADB/JICA | | | | 100 million | | | | March 2010 | |
Emergency Budget Support Japanese ODA Loan | | | JICA | | | | 150 million | | | | March 2010 | |
Social Protection Support Project | | | ADB | | | | 400 million | | | | September 2010 | |
Financial Market Regulation and Intermediation Program Sub. 2 | | | ADB | | | | 200 million | | | | February 2011 | |
First Development Policy Loan | | | WB | | | | 250 million | | | | June 2011 | |
Disaster Risk Management Development Program (CAT-DDO) | | | WB | | | | 500 million | | | | September 2011 | |
Governance and Justice Sector Reform Program 2 | | | ADB | | | | 300 million | | | | January 2012 | |
Increasing Competitiveness for Inclusive Growth Program, Subprogram 1 | | | ADB | | | | 350 million | | | | June 2012 | |
Development Policy Support Program—Investment Climate | | | ADB/JICA | | | | 100 million | | | | October 2012 | |
Social Welfare and Development Reform Project Additional Financing | | | WB | | | | 100 million | | | | December 2012 | |
Second Development Policy Loan | | | WB | | | | 300 million | | | | March 2013 | |
Source: International Finance Group, Department of Finance
107
Public Sector Debt
The following table presents the Republic’s consolidated public sector debt as of the dates indicated.
| | | | | | | | | | | | | | | | | | | | |
| | | Outstanding Consolidated Public Sector Debt(1)
As of December 31, | |
| | | 2008 | | | 2009 | | | 2010 | | | 2011 | | | 2012 | |
| | | (Peso in billions) | |
Consolidated non-financial public sector debt: | | | | | | | | | | | | | | | | | | | | |
Domestic | | | 1,863.3 | | | | 1.918.9 | | | | 2,265.6 | | | | 2,743.4 | | | | 3,483.5 | |
Foreign | | | 2,628.5 | | | | 2,739.3 | | | | 2,667.6 | | | | 2,623.8 | | | | 2,109.8 | |
| | | | | | | | | | | | | | | | | | | | |
Total | | | 4,491.8 | | | | 4,658.2 | | | | 4,933.2 | | | | 5,367.2 | | | | 5,593.3 | |
| | | | | | | | | | | | | | | | | | | | |
Financial public corporations | | | | | | | | | | | | | | | | | | | | |
Bangko Sentral: | | | | | | | | | | | | | | | | | | | | |
Domestic(2) | | | 1,640.4 | | | | 1,906.0 | | | | 2,702.1 | | | | 3,304.6 | | | | 3,516.9 | |
Foreign | | | 162.7 | | | | 122.6 | | | | 86.3 | | | | 80.5 | | | | 81.4 | |
| | | | | | | | | | | | | | | | | | | | |
Total | | | 1,803.1 | | | | 2,028.6 | | | | 2,788.4 | | | | 3,385.1 | | | | 3,516 | |
| | | | | | | | | | | | | | | | | | | | |
GFIs: | | | | | | | | | | | | | | | | | | | | |
Domestic(3) | | | 11.1 | | | | 7.8 | | | | 23.2 | | | | 20.7 | | | | 7.7 | |
Foreign | | | 166.6 | | | | 168.0 | | | | 171.1 | | | | 161.9 | | | | 135.9 | |
| | | | | | | | | | | | | | | | | | | | |
Total | | | 177.7 | | | | 175.8 | | | | 194.2 | | | | 182.6 | | | | 143.6 | |
| | | | | | | | | | | | | | | | | | | | |
Domestic | | | 1,651.5 | | | | 1,913.8 | | | | 2,725.3 | | | | 3,325.3 | | | | 3,443.2 | |
Foreign | | | 329.3 | | | | 290.6 | | | | 257.4 | | | | 242.4 | | | | 217.3 | |
| | | | | | | | | | | | | | | | | | | | |
Total | | | 1,980.8 | | | | 2,204.4 | | | | 2,982.7 | | | | 3,567.7 | | | | 3,660.5 | |
| | | | | | | | | | | | | | | | | | | | |
Less: Intrasector-debt holdings | | | | | | | | | | | | | | | | | | | | |
Domestic: | | | | | | | | | | | | | | | | | | | | |
Government securities held by GFIs and BSP | | | 447.4 | | | | 398.6 | | | | 412.6 | | | | 393.8 | | | | 418.6 | |
Government deposits at BSP | | | 141.9 | | | | 143.8 | | | | 110.1 | | | | 60.1 | | | | 340.9 | |
Government/GOCCs deposits at GFIs | | | 262.6 | | | | 291.8 | | | | 333.6 | | | | 425.4 | | | | 461.3 | |
GFIs deposits at BSP | | | 168.3 | | | | 126.7 | | | | 163.0 | | | | 192.2 | | | | 247.5 | |
GOCC deposits at BSP | | | 2.0 | | | | 27.0 | | | | 19.9 | | | | 0.1 | | | | 20.6 | |
GOCC loans/other debt held by GFIs | | | 50.8 | | | | 33.4 | | | | 40.1 | | | | 100.4 | | | | 93.1 | |
GFIs loans/other debt held by BSP | | | 72.6 | | | | 72.7 | | | | 72.7 | | | | 66.7 | | | | 66.7 | |
Local governments debt held by GFIs | | | 40.9 | | | | 47.1 | | | | 55.6 | | | | 56.8 | | | | 58.2 | |
| | | | | | | | | | | | | | | | | | | | |
Total | | | 1,186.5 | | | | 1,141.0 | | | | 1,207.8 | | | | 1,295.5 | | | | 1,706.8 | |
| | | | | | | | | | | | | | | | | | | | |
Foreign: | | | | | | | | | | | | | | | | | | | | |
Governments securities held by BSP | | | 22.7 | | | | 29.4 | | | | 25.2 | | | | 46.0 | | | | 51.4 | |
| | | | | | | | | | | | | | | | | | | | |
Total | | | 1,209.2 | | | | 1,172.8 | | | | 1,233.0 | | | | 1,341.5 | | | | 1,758.2 | |
| | | | | | | | | | | | | | | | | | | | |
Total public sector: | | | | | | | | | | | | | | | | | | | | |
Domestic | | | 2,691.7 | | | | 2,691.7 | | | | 3,783.1 | | | | 4,773.2 | | | | 5,219.9 | |
Foreign | | | 2,935.1 | | | | 2,998.0 | | | | 2,899.7 | | | | 2,820.2 | | | | 2,275.7 | |
| | | | | | | | | | | | | | | | | | | | |
Total | | | 5,263.4 | | | | 5,689.7 | | | | 6,682.8 | | | | 7,593.4 | | | | 7,495.6 | |
| | | | | | | | | | | | | | | | | | | | |
Sources: Fiscal Policy and Planning Office, Department of Finance.
108
Notes:
| (1) | The consolidated public sector comprises the general government sector, non-financial public corporations, and financial public corporations, after elimination of intra-debt holdings among these sectors. |
| (2) | Comprises all liabilities of Bangko Sentral (including currency issues) except for allocation of SDRs and revaluation of international reserves. |
| (3) | Comprises all liabilities of Development Bank of the Philippines, Land Bank of Philippines and Trade & Investment Development Corporation. |
The following table presents the Republic’s consolidated non-financial public sector debt as of the dates indicated.
| | | | | | | | | | | | | | | | | | | | |
| | | Outstanding Consolidated Non-financial Public Sector Debt(1)
As of December 31, | |
| | | 2008 | | | 2009 | | | 2010 | | | 2011 | | | 2012 | |
| | | (Peso in billions, except percentages) | |
Total(2) | | | 4,491.8 | | | | 4,658.2 | | | | 4,933.2 | | | | 5,367.2 | | | | 5,593.3 | |
Domestic | | | 1,863.3 | | | | 1,918.9 | | | | 2,265.6 | | | | 2,743.4 | | | | 3,483.5 | |
Foreign | | | 2,628.5 | | | | 2,739.3 | | | | 2,667.6 | | | | 2,623.6 | | | | 2,109.8 | |
National Government | | | 4,220.9 | | | | 4,396.6 | | | | 4,718.2 | | | | 4,951.2 | | | | 5,437.1 | |
Domestic | | | 2,414.4 | | | | 2,470.0 | | | | 2,718.2 | | | | 2,873.4 | | | | 3,468.4 | |
Foreign | | | 1,806.5 | | | | 1,926.6 | | | | 2,000.0 | | | | 2,077.8 | | | | 1,968.7 | |
Non-financial public corporations (14 GOCCs) | | | 1,308.2 | | | | 1,314.2 | | | | 1,239.4 | | | | 1,546.9 | | | | 1,508.7 | |
Domestic | | | 480.6 | | | | 494.4 | | | | 568.2 | | | | 938.1 | | | | 1,287.6 | |
Foreign | | | 827.7 | | | | 819.8 | | | | 671.1 | | | | 608.8 | | | | 221.1 | |
CB-BOL | | | 1.7 | | | | 1.2 | | | | 0.8 | | | | 0.3 | | | | 0 | |
Domestic | | | 0 | | | | 0 | | | | 0 | | | | 0 | | | | 0 | |
Foreign | | | 1.7 | | | | 1.2 | | | | 0.8 | | | | 0.3 | | | | 0 | |
Local government units | | | 51.9 | | | | 58.2 | | | | 69.0 | | | | 70.4 | | | | 73.4 | |
Domestic | | | 51.9 | | | | 58.2 | | | | 69.0 | | | | 70.4 | | | | 73.4 | |
Foreign | | | 0 | | | | 0 | | | | 0 | | | | 0 | | | | 0 | |
Less: Government debt held by Bond Sinking Fund(3) | | | 615.8 | | | | 619.8 | | | | 559.8 | | | | 588.7 | | | | 764.9 | |
Domestic | | | 613.0 | | | | 615.9 | | | | 559.8 | | | | 529.9 | | | | 688.9 | |
Foreign | | | 2.8 | | | | 3.9 | | | | 0.0 | | | | 58.8 | | | | 76.0 | |
Intra-sector debt holdings (domestic) | | | 466.9 | | | | 484.5 | | | | 526.9 | | | | 412.8 | | | | 456.9 | |
Government debt held by SSIs | | | 248.6 | | | | 277.2 | | | | 311.8 | | | | 409.6 | | | | 453.7 | |
Government debt held by LGUs | | | 0 | | | | 0 | | | | 0 | | | | 0.2 | | | | 0.1 | |
Government debt held by GOCCs | | | 145.7 | | | | 140.2 | | | | 148.1 | | | | 3.0 | | | | 3.0 | |
Onlending from National Government to GOCCs | | | 72.6 | | | | 67.1 | | | | 67.0 | | | | 65.2 | | | | 51.2 | |
Intra-sector debt holdings (external) | | | 4.6 | | | | 4.5 | | | | 4.3 | | | | 4.3 | | | | 4.0 | |
GOCCs debt held by National Government | | | 4.6 | | | | 4.5 | | | | 4.3 | | | | 4.3 | | | | 4.0 | |
Total (as % of GDP) | | | 58.2 | % | | | 58.0 | % | | | 54.8 | % | | | 55.3 | % | | | 52.9 | % |
Domestic (as % of GDP) | | | 24.1 | % | | | 23.9 | % | | | 25.2 | % | | | 28.3 | % | | | 33.0 | % |
Foreign (as % of GDP) | | | 34.0 | % | | | 34.1 | % | | | 29.6 | % | | | 27.0 | % | | | 20.0 | % |
Source: Fiscal Policy and Planning Office, Department of Finance.
Notes:
| (1) | The consolidated non-financial public sector comprises the general government sector and non-financial public corporations. The consolidated non-financial public sector does not include financial public corporations. |
| (2) | Government debt under the revised methodology excludes contingent obligations. |
| (3) | Including Securities Stabilization Fund and adjustment in the Government debt held by the Bond Sinking Fund. |
109
As of December 31, 2009, the outstanding consolidated public sector debt was (Peso)5.7 trillion, equivalent to 70.9% of the Republic’s GDP compared with a public sector debt-to-GDP ratio of 68.2% as of December 31, 2008. As of December 31, 2009, the total outstanding consolidated Government debt was (Peso)4.4 trillion, an increase of 4.2% from the (Peso)4.2 trillion as of December 31, 2008. Total domestic debt remained constant at (Peso)2.7 trillion as of December 31, 2008 and December 31, 2009. Total foreign debt increased by 2.1% from (Peso)2.9 trillion as of December 31, 2008 to (Peso)3.0 trillion as of December 31, 2009.
As of December 31, 2010, the outstanding consolidated public sector debt was (Peso)6.7 trillion, equivalent to 74.2% of the Republic’s GDP compared with a public sector debt-to-GDP ratio of 73.7% as of December 31, 2009. As of December 31, 2010, total outstanding consolidated Government debt was (Peso)4.7 trillion, an increase of 7.3% from the (Peso)4.4 trillion recorded as of December 31, 2009. Total domestic debt increased 40.5% to (Peso)3.8 trillion, from the (Peso)2.7 trillion recorded as of December 31, 2009. Total foreign debt decreased 3.3% to (Peso)2.9 trillion on December 31, 2010 from the $3.0 trillion recorded on December 31, 2009. The overall increase in Government debt is attributable to net borrowings made by the Government in 2010, as well as issuances of Government securities during the same period.
As of December 31, 2011, the outstanding consolidated public sector debt was (Peso)7.6 trillion, equivalent to 78.6% of the Republic’s GDP compared with a public sector debt-to-GDP ratio of 74.2% as of December 31, 2010. Total consolidated public sector domestic debt increased 26.2% to (Peso)4.8 trillion, from the (Peso)3.8 trillion recorded as of December 31, 2010. Consolidated public sector foreign debt remained at (Peso)2.9 trillion on December 31, 2011 and on December 31, 2010. As of December 31, 2011, total outstanding consolidated Government debt was (Peso)5.0 trillion, reflecting a 4.9% increase over the (Peso)4.7 trillion recorded as of December 31, 2010. The overall increase in Government debt was attributable to new borrowings made by the Government to finance the deficit for the period between December 31, 2010 and December 31, 2011, as well as the upward revaluation of outstanding foreign debt due to net depreciation of the peso against the U.S. dollar and the euro. These results more than offset net repayments made on the Republic’s obligations.
As of December 31, 2012, the outstanding consolidated public sector debt was (Peso)7.5 trillion, equivalent to 70.9% of the Republic’s GDP, compared with a public sector-debt-to-GDP ratio of 78.2% as of December 2011. As of December 31, 2012, total outstanding consolidated Government debt was (Peso)5.4 trillion, reflecting a 9.8% increase over the (Peso)5.0 trillion recorded as of December 31, 2011. Total domestic debt increased by 9.4% to (Peso)5.2 trillion on December 31, 2012 from (Peso)4.8 trillion on December 31, 2011. Foreign debt decreased by 19.3% to (Peso)2.3 trillion on December 31, 2012 from (Peso)2.8 trillion on December 31, 2011. The increase in domestic debt resulted from the Government’s expansion of domestic borrowing to reduce foreign exposure. The overall increase in Government debt was attributable to an increase in borrowings and issuances of securities by the Government during the period from December 31, 2011 to December 31, 2012.
110
Direct Debt of the Republic
The following table summarizes the outstanding direct debt of the Republic as of the dates indicated.
| | | | | | | | | | | | | | | | | | | | | | | | |
| | | Outstanding Direct Debt of the Republic(1)(2)
As of December 31, | | | | |
| | | 2008 | | | 2009 | | | 2010 | | | 2011 | | | 2012 | | | 2013(3) | |
| | | (Peso in millions, except as otherwise indicated) | |
Medium/long-term debt(4) | | | | | | | | | | | | | | | | | | | | | | | | |
Domestic | | | 1,667,980 | | | | 1,847,782 | | | | 2,190,790 | | | | 2,578,288 | | | | 3,193,509 | | | | 3,677,057 | |
External ($ in millions) | | | 38,111 | | | | 41,566 | | | | 45,609 | | | | 47,277 | | | | 47,901 | | | | 44,570 | |
Short-term debt(5) | | | | | | | | | | | | | | | | | | | | | | | | |
Domestic | | | 770,335 | | | | 622,258 | | | | 527,412 | | | | 295,069 | | | | 274,866 | | | | 309,913 | |
| | | | | | | | | | | | | | | | | | | | | | | | |
Total debt | | | 4,220,903 | | | | 4,396,640 | | | | 4,718,171 | | | | 4,951,188 | | | | 5,437,104 | | | | 5,609,665 | |
| | | | | | | | | | | | | | | | | | | | | | | | |
Source: Bureau of the Treasury, Department of Finance.
Notes:
| (1) | Includes Government debt that is on-lent to Government-owned corporations and other public sector entities. Excludes debt guaranteed by the Government and debt originally guaranteed by other public sector entities for which the guarantee has been assumed by the Government. The table reflects debt of the Government only and does not include any other public sector debt. |
| (2) | Amounts in original currencies were translated into U.S. dollars or pesos, as applicable, using Bangko Sentral’s reference exchange rates at the end of each period. |
| (3) | Preliminary data as of September 30, 2013. |
| (4) | Debt with original maturities of one year or longer. |
| (5) | Debt with original maturities of less than one year. |
Direct Domestic Debt of the Republic
The following table summarizes the outstanding direct domestic debt of the Republic as of the dates indicated.
| | | | | | | | | | | | | | | | | | | | | | | | |
| | | Outstanding Direct Domestic Debt of the Republic(1)(2)
As of December 31, | | | | |
| | | 2008 | | | 2009 | | | 2010 | | | 2011 | | | 2012 | | | 2013(3) | |
| | | (Peso in millions) | |
Loans | | | | | | | | | | | | | | | | | | | | | | | | |
Direct | | | 13,586 | | | | 6,955 | | | | 6,807 | | | | 6,799 | | | | 156 | | | | 156 | |
Assumed | | | 2,294 | | | | 2,294 | | | | 2,294 | | | | 2,294 | | | | 2,294 | | | | 442 | |
| | | | | | | | | | | | | | | | | | | | | | | | |
Total loans | | | 15,880 | | | | 9,249 | | | | 9,101 | | | | 9,093 | | | | 2,450 | | | | 599 | |
Securities | | | | | | | | | | | | | | | | | | | | | | | | |
Treasury bills | | | 770,335 | | | | 662,258 | | | | 527,412 | | | | 295,069 | | | | 274,866 | | | | 309,913 | |
Treasury notes/bonds | | | 1,628,214 | | | | 1,838,533 | | | | 2,181,689 | | | | 2,569,195 | | | | 3,191,059 | | | | 3,367,057 | |
| | | | | | | | | | | | | | | | | | | | | | | | |
Total securities | | | 2,398,548 | | | | 2,460,791 | | | | 2,709,101 | | | | 2,864,264 | | | | 3,465,924 | | | | 3,676,970 | |
| | | | | | | | | | | | | | | | | | | | | | | | |
Total debt | | | 2,414,428 | | | | 2,470,040 | | | | 2,718,202 | | | | 2,873,357 | | | | 3,468,375 | | | | 3,677,569 | |
| | | | | | | | | | | | | | | | | | | | | | | | |
Source: Bureau of the Treasury, Department of Finance.
Notes:
| (1) | Includes Government debt that is on-lent to Government-owned corporations and other public sector entities. Excludes debt guaranteed by the Government and debt originally guaranteed by other public sector entities for which the guarantee has been assumed by the Government. The table reflects debt of the Government only, and does not include any other public sector debt. |
111
| (2) | Amounts in original currencies were translated into U.S. dollars or pesos, as applicable, using Bangko Sentral’s reference exchange rates at the end of each period. |
| (3) | Preliminary data as of September 30, 2013. |
The following table sets out the direct domestic debt service requirements of the Republic for the years indicated.
| | | | | | | | | | | | | | | | |
| | | Direct Domestic Debt Service Requirements of the Republic(1) | |
Year | | Principal
Repayments | | | Interest
Payments | | | Total(2) | |
| | | (Peso in millions) | | | (Peso in millions) | | | ($ in millions) | |
2008 | | | 264,666 | | | | 183,690 | | | | 448,356 | | | | 9,963 | |
2009 | | | 290,031 | | | | 188,557 | | | | 478,588 | | | | 9,767 | |
2010 | | | 271,486 | | | | 221,230 | | | | 492,716 | | | | 10,055 | |
2011 | | | 270,377 | | | | 255,994 | | | | 526,371 | | | | 10,742 | |
2012 | | | 330,401 | | | | 201,215 | | | | 531,616 | | | | 12,592 | |
2013(3) | | | 327,403 | | | | 227,613 | | | | 555,016 | | | | 12,907 | |
2014(3) | | | 350,937 | | | | 251,666 | | | | 602,603 | | | | 14,014 | |
Source: Bureau of the Treasury, Department of Finance.
Notes:
| (1) | Excludes debt service in respect of Government debt that is on-lent to Government-owned corporations and other public sector entities guaranteed by the Government and debt originally guaranteed by other public sector entities for which the guarantee has been assumed by the Government. The table reflects debt of the Government only, and does not include any other public sector debt. |
| (2) | Amounts in pesos were translated into U.S. dollars using the applicable Bangko Sentral reference exchange rates at the end of each period. For 2013 and 2014, amounts in Pesos were translated into U.S. dollars using an exchange rate of (Peso)42.00 per U.S. dollar. |
| (3) | Projected based on debt outstanding as of June 30, 2013. |
Direct External Debt of the Republic
The following table summarizes the outstanding direct external debt of the Republic as of the dates indicated.
| | | | | | | | | | | | | | | | | | | | | | | | |
| | | Outstanding Direct External Debt of the Republic(1)(2) | |
| | | As of December 31, | | | | |
| | | 2008 | | | 2009 | | | 2010 | | | 2011 | | | 2012 | | | 2013(3) | |
| | | ($ in billions) | |
Loans: | | | | | | | | | | | | | | | | | | | | | | | | |
Multilateral | | | 5,855 | | | | 7,246 | | | | 7,315 | | | | 8,135 | | | | 8,672 | | | | 8,084 | |
Bilateral | | | 10,069 | | | | 9,646 | | | | 10,808 | | | | 11,392 | | | | 9,862 | | | | 8,246 | |
Commercial | | | 818 | | | | 945 | | | | 776 | | | | 122 | | | | 71 | | | | 37 | |
| | | | | | | | | | | | | | | | | | | | | | | | |
Total loans | | | 16,741 | | | | 17,836 | | | | 18,899 | | | | 19,648 | | | | 18,605 | | | | 16,367 | |
Securities: | | | | | | | | | | | | | | | | | | | | | | | | |
Eurobonds | | | 907 | | | | 935 | | | | 0 | | | | 0 | | | | 0 | | | | 0 | |
Yen Bonds | | | 550 | | | | 546 | | | | 1,837 | | | | 1,284 | | | | 1,162 | | | | 1,018 | |
Global Bonds | | | 19,213 | | | | 22,250 | | | | 24,874 | | | | 26,345 | | | | 28,134 | | | | 27,185 | |
| | | | | | | | | | | | | | | | | | | | | | | | |
Total securities | | | 21,370 | | | | 23,730 | | | | 26,710 | | | | 27,629 | | | | 29,296 | | | | 28,203 | |
| | | | | | | | | | | | | | | | | | | | | | | | |
Total | | | 38,111 | | | | 41,566 | | | | 45,609 | | | | 47,277 | | | | 47,901 | | | | 44,570 | |
| | | | | | | | | | | | | | | | | | | | | | | | |
Source: Bureau of the Treasury, Department of Finance.
112
Notes:
| (1) | Includes Government debt that is on-lent to Government-owned corporations and other public sector entities. Excludes debt guaranteed by the Government and debt originally guaranteed by other public sector entities for which the guarantee has been assumed by the Government. The table reflects debt of the Government only, and does not include any other public sector debt. |
| (2) | Amounts in original currencies were translated into U.S. dollars using the applicable Bangko Sentral reference exchange rates at the end of each period. |
| (3) | Preliminary data as of September 30, 2013. |
The following table sets out, by designated currency and the equivalent amount in U.S. dollars, the outstanding direct external debt of the Republic as of September 30, 2013.
| | | | | | | | | | | | |
| | | Summary of Outstanding Direct External Debt of
the Republic by Currency(1)
as of December 31, 2012 | |
| | | Amount in
Original
Currency | | | Equivalent
Amount in $(2) | | | % of Total | |
| | | (in millions, unless otherwise indicated, except percentages) | |
U.S. dollar | | | 30,935 | | | | 30,935 | | | | 69.4 | % |
Japanese yen | | | 801,067 | | | | 8,154 | | | | 18.3 | % |
Euro | | | 1,033 | | | | 1,397 | | | | 3.1 | % |
Philippine Peso (GPN) | | | 129,679 | | | | 2,991 | | | | 6.7 | % |
Other currencies | | | — | | | | 1,092 | | | | 2.4 | % |
| | | | | | | | | | | | |
Total | | | | | | | 44,569 | | | | 100.0 | % |
| | | | | | | | | | | | |
Source: Bureau of the Treasury, Department of Finance.
Notes:
| (1) | Includes Government debt that is on-lent to Government-owned corporations and other public sector entities. Excludes debt guaranteed by the Government and debt originally guaranteed by other public sector entities for which the guarantee has been assumed by the Government. The table reflects debt of the Government only and does not include any other public sector debt. |
| (2) | Amounts in original currencies were translated into U.S. dollars using the applicable Bangko Sentral reference exchange rates as of September 30, 2013. |
The following table sets out the direct external debt service requirements of the Republic for the years indicated.
| | | | | | | | | | | | |
| | | Direct External Debt Service
Requirements of the Republic(1)(2)(3) | |
Year | | Principal
Repayments | | | Interest
Payments | | | Total | |
| | | ($ in millions) | |
2008 | | | 1,807 | | | | 2,365 | | | | 4,171 | |
2009 | | | 2,068 | | | | 2,504 | | | | 4,572 | |
2010 | | | 2,732 | | | | 2,440 | | | | 5,173 | |
2011 | | | 3,431 | | | | 2,345 | | | | 5,776 | |
2012 | | | 2,051 | | | | 2,643 | | | | 4,693 | |
2013(4) | | | 2,507 | | | | 2,432 | | | | 4,939 | |
2014(4) | | | 2,069 | | | | 2,348 | | | | 4,418 | |
Source: Bureau of the Treasury, Department of Finance.
Notes:
| (1) | Excludes debt service in respect of Government debt that is on-lent to Government-owned corporations and other public sector entities or guaranteed by the Government, other than debt originally guaranteed by other public sector entities for which the guarantee has been assumed by the Government. The table reflects debt of the Government only and does not include any other public sector debt. |
113
| (2) | Amounts in original currencies were translated into Pesos using the applicable Bangko Sentral reference exchange rates prevailing on the date of payment. |
| (3) | Amounts in Pesos were translated into U.S. dollars using the applicable average Bangko Sentral reference exchange rates for each applicable period. For 2013 and 2014, amounts in Pesos were translated into U.S. dollars using an exchange rate of (Peso)42.00 per U.S. dollar. |
| (4) | Projected based on debt outstanding as of June 30, 2013. |
Government-Guaranteed Debt
The following table sets out all Republic guarantees of indebtedness, including guarantees assumed by the Government, as of the dates indicated.
| | | | | | | | | | | | | | | | | | | | | | | | |
| | | Summary of Outstanding Guarantees of
the Republic(1)(2)
As of December 31, | | | | |
| | | 2008 | | | 2009 | | | 2010 | | | 2011 | | | 2012 | | | 2013(3) | |
| | | (in billions, unless otherwise indicated) | |
Domestic ((Peso)) | | | 72.9 | | | | 79.5 | | | | 100.4 | | | | 157.6 | | | | 144.2 | | | | 143.6 | |
External ($) | | | 10.0 | | | | 11.5 | | | | 10.2 | | | | 9.5 | | | | 8.7 | | | | 7.9 | |
Source: Bureau of the Treasury, Department of Finance.
Notes:
| (1) | Includes debt originally guaranteed by the Government and debt guaranteed by other public sector entities for which the guarantee has been assumed by the Government. |
| (2) | Amounts in original currencies were translated into U.S. dollars or pesos, as applicable, using Bangko Sentral’s reference exchange rates at the end of each period. |
| (3) | Preliminary data as of September 30, 2013. |
Payment History of Foreign Debt
The Government decided not to avail itself of the July 1994 rescheduling agreement to accelerate the country’s graduation from rescheduling country status. As of June 30, 1999, the Republic’s rescheduled obligations with its bilateral creditors amounted to $2.2 billion, with Japan at $1.2 billion and the United States at $506 million having the largest exposures.
The Republic has engaged in debt restructuring, as well as debt buyback, debt-to-equity, debt-for-debt, debt-for-nature and other debt reduction arrangements to reduce its debt. The Republic intends to maintain various efforts to manage its debt portfolio to improve yield and maturity profiles. The Republic may utilize proceeds from debt issues for the purpose of repurchasing outstanding debt through a variety of methods, including public auctions and repurchases of debt securities in the open markets.
While there have been a number of reschedulings of the Republic’s debt to its bilateral creditors in the past few years, the Republic has not defaulted on, and has not attempted to restructure, the payment of principal or interest on any of its external securities in the last 20 years.
On October 6, 2010, the Republic completed an exchange offer of: (i) its 8.375% Bonds due 2011, 9.0% Bonds due 2013, 8.25% Bonds due 2014, 8.875% Bonds due 2015, 8.0% Bonds due January 2016, 8.75% Bonds due October 2016 and 9.375% Bonds due 2017 for newly issued U.S. dollar-denominated Global Bonds due 2021 (“New 2021 Bonds”) or reopened 6.375% Global Bonds due 2034 (“Reopened 2034 Bonds”), and (ii) its 9.875% Bonds due January 2019, 8.375% Bonds due June 2019, 7.5% Bonds due September 2024, 9.5% Bonds due October 2024, 10.625% Bonds due 2025, 9.5% Bonds due 2030 and 7.75% Bonds due 2031 for Reopened 2034 Bonds. In addition, the Republic also offered $200 million of New 2021 Bonds for cash. The Republic issued approximately $1.9 billion in aggregate principal amount of New 2021 Bonds and approximately $947 million in aggregate principal amount of Reopened 2034 Bonds.
114
The Republic has approximately $798 million in outstanding principal amount of 9.375% Global Bonds due 2017 (the “2017 Bonds”), which contain an early redemption option that granted the holders the option to require the Republic to redeem the bonds on January 18, 2012. The early redemption option was set at a redemption price equal to 100% of the principal amount of the bond. According to broker quotes, as of January 18, 2012, the 2017 Bonds were trading substantially above par. Under the terms of the 2017 Bonds, the Republic was required to send a notice of the early redemption option to the holders by November 17, 2011. Holders of the 2017 Bonds would then have 30 days to elect to redeem their bonds. The Republic did not deliver a notice of the redemption option to the holders of the 2017 Bonds on November 17, 2011 as required. While this failure constituted a breach of one of the covenants of the 2017 Bonds, the Republic issued a notice of the redemption option on January 4, 2012 to holders of the 2017 Bonds in order to give holders an opportunity to redeem the 2017 Bonds. The redemption period offered to the bond holders has expired. None of the holders of the 2017 Bonds issued a notice of default against the Republic.
The following table sets out the foreign currency bonds issued by the Republic.
| | | | | | | | |
| | | Foreign Currency Bonds Issued by
the Republic | |
| | | Outstanding
Balance as of
Issue Date | | | Outstanding
Balance as of
September 30, 2013(1) | |
| | | ($ in millions) | |
Brady Bonds | | | 3,348 | | | | 0 | |
Global bonds | | | 26,181 | | | | 27,185 | |
Notes | | | 1,010 | | | | 0 | |
T-Bills/bonds/notes | | | 950 | | | | 0 | |
Euro bonds(2) | | | 2,461 | | | | 0 | |
Japanese yen bonds(2) | | | 2,755 | | | | 1,018 | |
| | | | | | | | |
Total foreign bonds | | | 36,705 | | | | 28,203 | |
| | | | | | | | |
Source: Bureau of the Treasury, Department of Finance.
Notes:
| (2) | Yen- and euro-denominated bonds were translated into U.S. dollars using the applicable Bangko Sentral reference exchange rate as of September 30, 2013. |
115
DESCRIPTION OF THE SECURITIES
Description of the Debt Securities
The Republic may issue debt securities in separate series at various times. Each series of the debt securities will be issued pursuant to a fiscal agency agreement (each, as applicable to a series of debt securities, the “Fiscal Agency Agreement”). The description below summarizes the material provisions of the debt securities that are common to all series and the Fiscal Agency Agreement. Since it is only a summary, the description may not contain all of the information that is important to you as a potential investor in the debt securities. Therefore, the Republic urges you to read the form of the Fiscal Agency Agreement and the form of the global bond before deciding whether to invest in the debt securities. The Republic has filed a copy of these documents with the Securities and Exchange Commission as exhibits to the registration statement of which this prospectus is a part. You should refer to such exhibits for more complete information.
The financial terms and other specific terms of your debt securities are described in the prospectus supplement relating to your debt securities. The description in the prospectus supplement will supplement this description or, to the extent inconsistent with this description, replace it.
You can find the definitions of certain capitalized terms in the subsection titled “Glossary of Certain Defined Terms” located at the end of this section.
General Terms of the Bonds
The prospectus supplement that relates to your debt securities will specify the following terms:
| | • | | The aggregate principal amount and the designation; |
| | • | | The currency or currencies or composite currencies of denomination and payment; |
| | • | | Any limitation on principal amount and authorized denominations; |
| | • | | The percentage of their principal amount at which the debt securities will be issued; |
| | • | | The maturity date or dates; |
| | • | | The interest rate or rates, if any, for the debt securities and, if variable, the method by which the interest rate or rates will be calculated; |
| | • | | Whether any amount payable in respect of the debt securities will be determined based on an index or formula, and how any such amount will be determined; |
| | • | | The dates from which interest, if any, will accrue for payment of interest and the record dates for any such interest payments; |
| | • | | Where and how the Republic will pay principal and interest; |
| | • | | Whether and in what circumstances the debt securities may be redeemed before maturity; |
| | • | | Any sinking fund or similar provision; |
| | • | | Whether any part or all of the debt securities will be in the form of a global security and the circumstances in which a global security is exchangeable for certificated securities; |
| | • | | If issued in certificated form, whether the debt securities will be in bearer form with interest coupons, if any, or in registered form without interest coupons, or both forms, and any restrictions on exchanges from one form to the other; and |
| | • | | Whether the debt securities will be designated “Collective Action Securities” (as described below under “Collective Action Securities”). |
116
If the Republic issues debt securities at an original issue discount, in bearer form or payable in a currency other than the U.S. dollar, the prospectus supplement relating to the debt securities will also describe applicable U.S. federal income tax and other considerations additional to the disclosure in this prospectus.
Payments of Principal, Premium and Interest
On every payment date specified in the relevant prospectus supplement, the Republic will pay the principal, premium and/or interest due on that date to the registered holder of the relevant debt security at the close of business on the related record date. The record date will be specified in the applicable prospectus supplement. The Republic will make all payments at the place and in the currency set out in the prospectus supplement. Unless otherwise specified in the relevant prospectus supplement or the debt securities, the Republic will make payments in U.S. dollars at the New York office of the fiscal agent or, outside the United States, at the office of any paying agent. Unless otherwise specified in the applicable prospectus supplement, the Republic will pay interest by check, payable to the registered holder.
If the relevant debt security has joint holders, the check will be payable to all of them or to the person designated by the joint holders at least three business days before payment. The Republic will mail the check to the address of the registered holder in the bond register and, in the case of joint holders, to the address of the joint holder named first in the bond register.
The Republic will make any payment on debt securities in bearer form at the designated offices or agencies of the fiscal agent, or any other paying agent, outside of the United States. At the option of the holder of debt securities, the Republic will pay by check or by transfer to an account maintained by the payee with a bank located outside of the United States. The Republic will not make payments on bearer securities at the corporate trust office of the fiscal agent in the United States or at any other paying agency in the United States. In addition, the Republic will not make any payment by mail to an address in the United States or by transfer to an account with a bank in the United States. Nevertheless, the Republic will make payments on a bearer security denominated and payable in U.S. dollars at an office or agency in the United States if:
| | • | | payment outside the United States is illegal or effectively precluded by exchange controls or other similar restrictions; and |
| | • | | the payment is then permitted under United States law, without material adverse consequences to the Republic. |
If the Republic issues bearer securities, it will designate the offices of at least one paying agent outside the United States as the location for payment.
Repayment of Funds; Prescription
If no one claims money paid by the Republic to the fiscal agent for the payment of principal or interest for two years after the payment was due and payable, the fiscal agent or paying agent will repay the money to the Republic. After such repayment, the fiscal agent or paying agent will not be liable with respect to the amounts so repaid. However, the Republic’s obligations to pay the principal of, and interest on, the debt securities as they become due will not be affected by such repayment.
You will not be permitted to submit a claim to the Republic for payment of principal or interest on any series of debt securities unless made within ten years, in the case of principal, and five years, in the case of interest, from the date on which payment was due.
Global Securities
The prospectus supplement relating to a series of debt securities will indicate whether any of that series of debt securities will be represented by a global security. The prospectus supplement will also describe any unique
117
specific terms of the depositary arrangement with respect to that series. Unless otherwise specified in the prospectus supplement, the Republic anticipates that the following provisions will apply to depositary arrangements.
Registered Ownership of the Global Security
The global security will be registered in the name of a depositary identified in the prospectus supplement, or its nominee, and will be deposited with the depositary, its nominee or a custodian. The depositary, or its nominee, will therefore be considered the sole owner or holder of debt securities represented by the global security for all purposes under the Fiscal Agency Agreement. Except as specified below or in the applicable prospectus supplement, beneficial owners:
| | • | | will not be entitled to have any of the debt securities represented by the global security registered in their names; |
| | • | | will not receive physical delivery of any debt securities in definitive form; |
| | • | | will not be considered the owners or holders of the debt securities; |
| | • | | must rely on the procedures of the depositary and, if applicable, any participants (institutions that have accounts with the depositary or a nominee of the depositary, such as securities brokers and dealers) to exercise any rights of a holder of the debt securities; and |
| | • | | will receive payments of principal and interest from the depositary or its participants rather than directly from the Republic. |
The Republic understands that, under existing industry practice, the depositary and participants will allow beneficial owners to take all actions required of, and exercise all rights granted to, the registered holders of the debt securities.
The Republic will issue certificated securities and register debt securities in the name of a person other than the depositary or its nominee only if:
| | • | | the depositary for a series of debt securities is unwilling or unable to continue as depositary or ceases to be a clearing agency registered under the Securities Exchange Act of 1934 and the Republic does not appoint a successor depositary within 90 days; |
| | • | | the Republic determines, in its sole discretion, not to have a series of debt securities represented by a global security; or |
| | • | | a default occurs that entitles the holders of the debt securities to accelerate the maturity date and such default has not been cured. |
In these circumstances, an owner of a beneficial interest in a global security will be entitled to registration of a principal amount of debt securities equal to its beneficial interest in its name and to physical delivery of the debt securities in definitive form. Definitive debt securities in bearer form will not be issued in respect of a global security in registered form.
Beneficial Interests in and Payments on a Global Security
Only participants, and persons that may hold beneficial interests through participants, can own a beneficial interest in the global security. The depositary keeps records of the ownership and transfer of beneficial interests in the global security by its participants. In turn, participants keep records of the ownership and transfer of beneficial interests in the global security by other persons (such as their customers). No other records of the ownership and transfer of beneficial interests in the global security will be kept.
118
All payments on a global security will be made to the depositary or its nominee. When the depositary receives payment of principal or interest on the global security, the Republic expects the depositary to credit its participants’ accounts with amounts that correspond to their respective beneficial interests in the global security.
The Republic also expects that, after the participants’ accounts are credited, the participants will credit the accounts of the owners of beneficial interests in the global security with amounts that correspond to the owners’ respective beneficial interests in the global security.
The depositary and its participants establish policies and procedures governing payments, transfers, exchanges and other important matters that affect owners of beneficial interests in a global security. The depositary and its participants may change these policies and procedures from time to time. The Republic has no responsibility or liability for the records of ownership of beneficial interests in the global security, or for payments made or not made to owners of such beneficial interests. The Republic also has no responsibility or liability for any aspect of the relationship between the depositary and its participants or for any aspect of the relationship between participants and owners of beneficial interests in the global security.
Bearer Securities
The Republic may issue debt securities of a series in the form of one or more bearer global debt securities deposited with a common depositary for the Euroclear System and Clearstream Banking, société anonyme, or with a nominee identified in the applicable prospectus supplement. The specific terms and procedures, including the specific terms of the depositary arrangement, with respect to any portion of a series of debt securities to be represented by a bearer global security will be described in the applicable prospectus supplement.
Additional Amounts
The Republic will make all payments on the debt securities without withholding or deducting any present or future taxes imposed by the Republic or any of its political subdivisions, unless required by law. If Philippine law requires the Republic to deduct or withhold taxes, it will pay the holders of the debt securities such additional amounts as are necessary to ensure that they receive the same amount as they would have received without such withholding or deduction.
The Republic will not pay, however, any additional amounts if the holder of the debt securities is liable for Philippine tax because:
| | • | | the holder of the debt securities is connected with the Republic other than by merely owning the debt security or receiving income or payments on the bond; or |
| | • | | the holder of the debt securities failed to comply with any reasonable certification, identification or other reporting requirement concerning the holder’s nationality, residence, identity or connection with the Republic, if compliance with such requirement is required by any statute or regulation of the Republic as a precondition to exemption from withholding or deduction of taxes; or |
| | • | | the holder of the debt securities failed to present its debt security for payment within 30 days of when the payment is due or when the Republic makes available to the holder of the debt securities or the relevant fiscal or paying agent a payment of principal or interest, whichever is later. Nevertheless, the Republic will pay additional amounts to the extent the holder would have been entitled to such amounts had it presented its debt security for payment on the last day of the 30 day period. |
Status of Bonds
While outstanding, the debt securities will:
| | • | | constitute direct, unconditional and unsecured obligations of the Republic; |
119
| | • | | rank at least equally in right of payment with all of the Republic’s other unsecured and unsubordinated External Indebtedness, except as described below; and |
| | • | | continue to be backed by the full faith and credit of the Republic. |
Under Philippine law, unsecured debt (including guarantees of debt) of a borrower in insolvency or liquidation that is documented by a public instrument, as provided in Article 2244(14) of the Civil Code of the Republic, ranks ahead of unsecured debt that is not so documented. Debt is treated as documented by a public instrument if it is acknowledged before a notary or any person authorized to administer oaths in the Republic. The Government maintains that debt of the Republic is not subject to the preferences granted under Article 2244(14) or cannot be documented by a public instrument without acknowledgment of the Republic as debtor. The Philippine courts have never addressed this matter, however, and it is uncertain whether a document evidencing the Republic’s Peso or non-Peso denominated debt (including External Indebtedness), notarized without the Republic’s participation, would be considered documented by a public instrument. If such debt were considered documented by a public instrument, it would rank ahead of the debt securities if the Republic could not meet its debt obligations.
The Republic has represented that it has not prepared, executed or filed any public instrument, as provided in Article 2244(14) of the Civil Code of the Philippines, relating to any External Indebtedness. It also has not consented or assisted in the preparation or filing of any such public instrument. The Republic also agreed that it will not create any preference or priority in respect of any External Public Indebtedness pursuant to Article 2244(14) of the Civil Code of the Philippines unless its grants equal and ratable preference or priority to amounts payable under the debt securities.
Negative Pledge Covenant
If any debt securities are outstanding, the Republic will not create or permit any Liens on its assets or revenues as security for any of its External Public Indebtedness, unless the Lien also secures the Republic’s obligations under the debt securities. In addition, the Republic will not create any preference or priority for any of its External Public Indebtedness pursuant to Article 2244(14) of the Civil Code of the Philippines, or any successor law, unless it grants equal and ratable preference or priority to amounts due under the debt securities.
The Republic may create or permit a Lien:
| | • | | on any property or asset (or any interest in such property or asset) incurred when the property or asset was purchased, improved, constructed, developed or redeveloped to secure payment of the cost of the activity; |
| | • | | securing Refinanced External Public Indebtedness; |
| | • | | arising out of the extension, renewal or replacement of any External Public Indebtedness that is permitted to be subject to a Lien pursuant to either of the previous two bullet points, as long as the principal amount of the External Public Indebtedness so secured is not increased; |
| | • | | arising in the ordinary course of banking transactions to secure External Public Indebtedness with a maturity not exceeding one year; |
| | • | | existing on any property or asset at the time it was purchased, or arising after the acquisition under a contract entered into before and not in contemplation of the acquisition, and any extension and renewal of that Lien which is limited to the original property or asset and secures any extension or renewal of the original secured financing; |
(A) arises pursuant to any legal process in connection with court proceedings so long as the enforcement of the Lien is stayed and the Republic is contesting the claims secured in good faith; or
120
(B) secures the reimbursement obligation under any surety given in connection with the release of any Lien referred to in (A) above;
if it is released or discharged within one year of imposition; or
| | • | | arising by operation of law, provided that any such Lien is not created or permitted to be created by the Republic for the purpose of securing any External Public Indebtedness. |
The international reserves of Bangko Sentral represent substantially all of the official gross international reserves of the Republic. Because Bangko Sentral is an independent entity, the Republic and Bangko Sentral believe that the debt securities’ negative pledge covenant does not apply to Bangko Sentral’s international reserves. Bangko Sentral could therefore incur External Indebtedness secured by international reserves without securing amounts payable under the debt securities.
Events of Default
The following description does not apply to any series of debt securities that has been designated Collective Action Securities. See “Collective Action Securities—Events of Default” below for a description of the corresponding terms of Collective Action Securities.
Each of the following constitutes an event of default with respect to any series of debt securities:
(1) Non-Payment: the Republic does not pay principal or interest on any debt securities of such series when due and such failure continues for 30 days;
(2) Breach of Other Obligations: the Republic fails to observe or perform any of the covenants in the series of debt securities (other than non-payment) for 60 days after written notice of the default is delivered by any holder of debt securities to the Republic at the corporate trust office of the fiscal agent in New York City;
(3) Cross Default and Cross Acceleration:
| | (a) | the Republic fails to make a payment of principal, premium, prepayment charge or interest when due on any External Public Indebtedness with a principal amount equal to or greater than $25,000,000 or its equivalent, and this failure continues beyond the applicable grace period; or |
| | (b) | any External Public Indebtedness of the Republic or the central monetary authority in principal amount equal to or greater than $25,000,000 is accelerated, other than by optional or mandatory prepayment or redemption. |
For the purposes of this event of default, the U.S. dollar equivalent for non-U.S. dollar debt will be computed using the middle spot rate for the relevant currency against the U.S. dollar as quoted by The Bank of New York Mellon (as successor in interest to JPMorgan Chase Bank, N.A.) on the date of determination;
(4) Moratorium: the Republic declares a general moratorium on the payment of its or the central monetary authority’s External Indebtedness;
(5) Validity:
| | (a) | the Republic, or any governmental body with the legal power and authority to declare such series of debt securities and the related Fiscal Agency Agreement invalid or unenforceable, challenges the validity of such series of debt securities or the related Fiscal Agency Agreement; |
| | (b) | the Republic denies any of its obligations under such series of debt securities or the related Fiscal Agency Agreement; or |
| | (c) | any legislative, executive or constitutional measure or final judicial decision renders any material provision of such series of debt securities or the related Fiscal Agency Agreement invalid or unenforceable or prevents or delays the performance of the Republic’s obligations under such series of debt securities or the related Fiscal Agency Agreement; |
121
(6) Failure of Authorizations: any legislative, executive or constitutional authorization necessary for the Republic to perform its material obligations under the series of debt securities or the related Fiscal Agency Agreement ceases to be in full force and effect or is modified in a manner materially prejudicial to the holders of the debt securities;
(7) Control of Assets: the Republic or the central monetary authority does not at all times exercise full control over the Republic’s International Monetary Assets; or
(8) IMF Membership: the Republic ceases to be a member of the IMF or loses its eligibility to use the general resources of the IMF.
The events described in paragraphs 2, 4, 5 and 6 will be events of default only if they materially prejudice the interests of holders of the debt securities.
If any of the above events of default occurs and is continuing, holders of the debt securities representing at least 25% in principal amount of the debt securities of that series then outstanding may declare all of the debt securities of the series to be due and payable immediately by written notice to the Republic and the fiscal agent. In the case of an event of default described in paragraphs 1 or 4 above, any holder of the debt securities may declare the principal amount of debt securities that it holds to be immediately due and payable by written notice to the Republic and the fiscal agent.
Investors should note that:
| | • | | despite the procedure described above, no debt securities may be declared due and payable if the Republic cures the applicable event of default before it receives the written notice from the holder of the debt securities; |
| | • | | the Republic is not required to provide periodic evidence of the absence of defaults; and |
| | • | | the Fiscal Agency Agreement does not require the Republic to notify holders of the debt securities of an event of default or grant any holder of the debt securities a right to examine the bond register. |
Modifications and Amendments; Bondholders’ Meetings
The following description does not apply to any series of debt securities that has been designated Collective Action Securities. See “Collective Action Securities—Modifications and Amendments; Bondholders’ Meetings” for a description of the corresponding terms of Collective Action Securities.
Each holder of a series of debt securities must consent to any amendment or modification of the terms of that series of debt securities or the Fiscal Agency Agreement that would:
| | • | | change the stated maturity of the principal of the debt securities or any installment of interest; |
| | • | | reduce the principal amount of such series of debt securities or the portion of the principal amount payable upon acceleration of such debt securities; |
| | • | | change the debt securities’ interest rate; |
| | • | | change the currency of payment of principal or interest; |
| | • | | change the obligation of the Republic to pay additional amounts on account of withholding taxes or deductions; or |
| | • | | reduce the percentage of the outstanding principal amount needed to modify or amend the related Fiscal Agency Agreement or the terms of such series of debt securities. |
With respect to other types of amendment or modification, the Republic may, with the consent of the holders of at least a majority in principal amount of the debt securities of a series that are outstanding, modify and amend that series of debt securities or, to the extent the modification or amendment affects that series of debt securities, the Fiscal Agency Agreement.
122
The Republic may at any time call a meeting of the holders of a series of debt securities to seek the holders’ approval of the modification, or amendment, or obtain a waiver, of any provision of that series of debt securities. The meeting will be held at the time and place in the Borough of Manhattan in New York City as determined by the Republic. The notice calling the meeting must be given at least 30 days and not more than 60 days prior to the meeting.
While an event of default with respect to a series of debt securities is continuing, holders of at least 10% of the aggregate principal amount of that series of debt securities may compel the fiscal agent to call a meeting of all holders of debt securities of that series.
The persons entitled to vote a majority in principal amount of the debt securities of the series that are outstanding at the time will constitute a quorum at a meeting of the holders of the debt securities. To vote at a meeting, a person must either hold outstanding debt securities of the relevant series or be duly appointed as a proxy for a holder of the debt securities. The fiscal agent will make all rules governing the conduct of any meeting.
The Fiscal Agency Agreement and a series of debt securities may be modified or amended, without the consent of the holders of the debt securities, to:
| | • | | add covenants of the Republic that benefit holders of the debt securities; |
| | • | | surrender any right or power given to the Republic; |
| | • | | secure the debt securities; or |
| | • | | cure any ambiguity or correct or supplement any defective provision in the Fiscal Agency Agreement or the debt securities, without materially and adversely affecting the interests of the holders of the debt securities. |
Replacement of Debt Securities
If a debt security becomes mutilated, defaced, destroyed, lost or stolen, the Republic may issue, and the fiscal agent will authenticate and deliver, a substitute debt security. The Republic and the fiscal agent will require proof of any claim that a debt security was destroyed, lost or stolen.
The applicant for a substitute debt security must indemnify the Republic, the fiscal agent and any other agent for any losses they may suffer relating to the debt security that was destroyed, lost or stolen. The applicant will be required to pay all expenses and reasonable charges associated with the replacement of the mutilated, defaced, destroyed, lost or stolen debt security.
Fiscal Agent
The Republic will appoint a fiscal agent or agents in connection with each series of the debt securities whose duties will be governed by the related Fiscal Agency Agreement. Different fiscal agents may be appointed for different series of debt securities. The Republic may maintain bank accounts and a banking relationship with each fiscal agent. Each fiscal agent is the agent of the Republic and does not act as a trustee for the holders of the debt securities.
Notices
All notices will be mailed to the registered holders of a series of debt securities. If a depositary is the registered holder of global securities, each beneficial holder must rely on the procedures of the depositary and its participants to receive notices, subject to any statutory or regulatory requirements.
123
If the Republic lists a series of debt securities on the Luxembourg Stock Exchange, and the rules of that exchange so require, all notices to holders of that series of debt securities will be published in a daily newspaper of general circulation in Luxembourg. The Republic expects that the Luxemburger Wort will be the newspaper. If notice cannot be published in an appropriate newspaper, notice will be considered validly given if made pursuant to the rules of the Luxembourg Stock Exchange.
Governing Law
The Fiscal Agency Agreement and the debt securities will be governed by the laws of the State of New York without regard to any principles of New York law requiring the application of the laws of another jurisdiction. Nevertheless, all matters governing the authorization, execution and delivery of the debt securities and the Fiscal Agency Agreement by the Republic will be governed by the laws of the Republic.
Further Issues of Debt Securities
The following description does not apply to any series of debt securities that has been designated Collective Action Securities. See “Collective Action Securities—Further Issues of Debt Securities” for a description of the corresponding terms of Collective Action Securities.
The Republic may, without the consent of the holders of the debt securities, create and issue additional debt securities with the same terms and conditions as any series of bonds (or that are the same in all respects except for the amount of the first interest payment and for the interest paid on the series of debt securities prior to the issuance of the additional debt securities). The Republic may consolidate such additional debt securities with the outstanding debt securities to form a single series. Any further debt securities forming a single series with the outstanding debt securities of any series constituted by a Fiscal Agency Agreement shall be constituted by an agreement supplemental to such relevant Fiscal Agency Agreement.
Jurisdiction and Enforceability
The Republic is a foreign sovereign government and your ability to collect on judgments of U.S. courts against the Republic may be limited.
The Republic will irrevocably appoint the Philippine Consul General in New York, New York as its authorized agent to receive service of process in any suit based on any series of debt securities which any holder of the debt securities may bring in any state or federal court in New York City. The Republic submits to the jurisdiction of any state or federal court in New York City or any competent court in the Republic in such action. The Republic waives, to the extent permitted by law, any objection to proceedings in such courts. The Republic also waives irrevocably any immunity from jurisdiction to which it might otherwise be entitled in any suit based on any series of debt securities.
Because of its waiver of immunity, the Republic would be subject to suit in competent courts in the Republic. A judgment against the Republic in state or federal court in New York City would be recognized and enforced by the courts of the Republic in any enforcement action without re-examining the issues if:
| | • | | such judgment was not obtained by collusion or fraud; |
| | • | | the foreign court rendering such judgment had jurisdiction over the case; |
| | • | | the Republic had proper notice of the proceedings before the foreign court; and |
| | • | | such judgment was not based upon a clear mistake of law or fact. |
124
Notwithstanding any of the above, the Philippine Consul General is not the agent for receipt of service for suits under the U.S. federal or state securities laws, and the Republic’s waiver of immunity does not extend to those actions. In addition, the Republic does not waive immunity relating to its:
| | • | | properties and assets used by a diplomatic or consular mission; |
| | • | | properties and assets under the control of its military authority or defense agency; and |
| | • | | properties and assets located in the Republic and dedicated to public or governmental use. |
If you bring a suit against the Republic under U.S. federal or state securities laws, unless the Republic waives immunity, you would be able to obtain a United States judgment against the Republic only if a court determined that the Republic is not entitled to sovereign immunity under the United States Foreign Sovereign Immunities Act. Even if you obtained a United States judgment in any such suit, you may not be able to enforce the judgment in the Republic. Moreover, you may not be able to enforce a judgment obtained under the Foreign Sovereign Immunities Act against the Republic’s property located in the United States except under the limited circumstances specified in the act.
Glossary of Certain Defined Terms
Certain definitions used in the Fiscal Agency Agreement are set forth below. For a full explanation of all of these terms or any capitalized terms used in this section you should refer to the Fiscal Agency Agreement.
“External Indebtedness” means Indebtedness denominated or payable by its terms, or at the option of the holder, in a currency or currencies other than that of the Republic.
“External Public Indebtedness” means any External Indebtedness in the form of bonds, debentures, notes or other similar instruments or other securities which is, or is eligible to be, quoted, listed or ordinarily purchased and sold on any stock exchange, automated trading system or over-the-counter or other securities market.
“Indebtedness” means any indebtedness for money borrowed or any guarantee of indebtedness for money borrowed.
“International Monetary Assets” means all (i) gold, (ii) Special Drawing Rights, (iii) Reserve Positions in the Fund and (iv) Foreign Exchange.
“Lien” means any mortgage, deed of trust, charge, pledge, lien or other encumbrance or preferential arrangement which has the practical effect of constituting a security interest.
“Refinanced External Public Indebtedness” means the U.S.$130,760,000 Series A Interest Reduction Bonds due 2007 issued by the Republic on December 1, 1992, the U.S.$626,616,000 Series B Interest Reduction Bonds due 2008 issued by the Republic on December 1, 1992, the U.S.$153,490,000 Series A Principal Collateralized Interest Reduction Bonds due 2018 issued by the Republic on December 1, 1992 and the U.S.$1,740,600,000 Series B Collateralized Interest Reduction Bonds due 2017 issued by the Republic on December 1, 1992.
“Special Drawing Rights,” “Reserve Positions in the Fund” and “Foreign Exchange,” have, as to the type of assets included, the meanings given to them in the IMF’s publication entitled “International Financial Statistics” or any other meaning formally adopted by the IMF from time to time.
Description of the Warrants
Each series of warrants will be issued under a warrant agreement (each, as applicable to a series of warrants, the “Warrant Agreement”) to be entered into between the Republic and a bank or trust company as warrant agent. The description below summarizes some of the provisions of warrants for the purchase of bonds that the
125
Republic may issue from time to time and of the Warrant Agreement. Copies of the forms of warrants and the Warrant Agreement are or will be filed as exhibits to the registration statement of which this prospectus is a part. Since it is only a summary, the description may not contain all of the information that is important to you as a potential investor in the warrants.
The description of the warrants that will be contained in the prospectus supplement will supplement this description and, to the extent inconsistent with this description, replace it.
General Terms of the Warrants
The prospectus supplement relating to the series of warrants will set forth:
| | • | | The terms of the bonds purchasable upon exercise of the warrants, as described above under “Description of the Debt Securities—General Terms of the Bonds”; |
| | • | | The principal amount of bonds purchasable upon exercise of one warrant and the exercise price; |
| | • | | The procedures and conditions for the exercise of the warrants; |
| | • | | The dates on which the right to exercise the warrants begins and expires; |
| | • | | Whether and under what conditions the warrants and any bonds issued with the warrants will be separately transferable; |
| | • | | Whether the warrants will be issued in certificated or global form and, if in global form, information with respect to applicable depositary arrangements; |
| | • | | If issued in certificated form, whether the warrants will be issued in registered or bearer form, whether they will be exchangeable between such forms, and, if issued in registered form, where they may be transferred and registered; and |
| | • | | Other specific provisions. |
The warrants will be subject to the provisions set forth under “Description of the Securities—Description of the Debt Securities,” “—Governing Law” and “—Jurisdiction and Enforceability.”
Limitations on Issuance of Bearer Debt Securities
Bearer securities will not be offered, sold or delivered in the United States or its possessions or to a United States person, except in certain circumstances permitted by United States tax regulations. Bearer securities will initially be represented by temporary global securities (without interest coupons) deposited with a common depositary in London for the Euroclear System for credit to designated accounts. Unless otherwise indicated in the applicable prospectus supplement:
| | • | | each temporary global security will be exchangeable for definitive bearer securities on or after the date that is 40 days after issuance only upon receipt of certification of non-United States beneficial ownership of the temporary global security as provided in United States tax regulations, provided that no bearer security will be mailed or otherwise delivered to any location in the United States in connection with the exchange; and |
| | • | | any interest payable on any portion of a temporary global security with respect to any interest payment date occurring prior to the issuance of definitive bearer securities will be paid only upon receipt of certification of non-United States beneficial ownership of the temporary global security as provided in United States tax regulations. |
Bearer securities (other than temporary global debt securities) and any related coupons will bear the following legend: “Any United States person who holds this obligation will be subject to limitations under the United States federal income tax laws, including the limitations provided in Sections 165(j) and 1287(a) of the
126
Internal Revenue Code.” The sections referred to in the legend provide that, with certain exceptions, a United States person who holds a bearer security or coupon will not be allowed to deduct any loss realized on the disposition of the bearer security, and any gain (which might otherwise be characterized as capital gain) recognized on the disposition will be treated as ordinary income.
For the purposes of this section, “United States person” means:
| | • | | an individual citizen or resident of the United States; |
| | • | | a corporation, partnership or other entity created or organized in or under the laws of the United States or any political subdivision thereof; |
| | • | | an estate the income of which is subject to United States federal income taxation regardless of its source; or |
| | • | | a trust if a United States court is able to exercise primary supervision over the trust’s administration and one or more United States persons have the authority to control all of the trust’s substantial decisions. |
For the purposes of this section, “United States” means the United States of America (including the States and the District of Columbia), its territories, its possessions and other areas subject to its jurisdiction.
127
COLLECTIVE ACTION SECURITIES
The Republic may designate a particular series of debt securities to be “Collective Action Securities,” the specific terms of which will be described in the prospectus supplement relating to such series of debt securities. Collective Action Securities will have the same terms and conditions as the securities described under the heading “Description of the Debt Securities” above, except that such Collective Action Securities shall contain different provisions relating to certain aspects of default, acceleration, voting on amendments, modifications, changes or waivers and further issues of debt securities as follows:
Events of Default
Each of the following constitutes an event of default with respect to any series of debt securities:
(1) Non-Payment: the Republic does not pay principal or interest on any debt securities of such series when due and such failure continues for 30 days;
(2) Breach of Other Obligations: the Republic fails to observe or perform any of the covenants in the series of debt securities (other than non-payment) for 60 days after written notice of the default is delivered by any holder of debt securities to the Republic at the corporate trust office of the fiscal agent in New York City;
(3) Cross Default and Cross Acceleration:
| | (a) | the Republic fails to make a payment of principal, premium, prepayment charge or interest when due on any External Public Indebtedness with a principal amount equal to or greater than $25,000,000 or its equivalent, and this failure continues beyond the applicable grace period; or |
| | (b) | any External Public Indebtedness of the Republic or the central bank of the Republic in principal amount equal to or greater than $25,000,000 is accelerated, other than by optional or mandatory prepayment or redemption. |
For the purposes of this event of default, the U.S. dollar equivalent for non-U.S. dollar debt will be computed using the middle spot rate for the relevant currency against the U.S. dollar as quoted by The Bank of New York Mellon (as successor in interest to JPMorgan Chase Bank, N.A.) on the date of determination;
(4) Moratorium: the Republic declares a general moratorium on the payment of its or the central monetary authority’s External Indebtedness;
(5) Validity:
| | (a) | the Republic, or any governmental body with the legal power and authority to declare such series of debt securities and the related Fiscal Agency Agreement invalid or unenforceable, challenges the validity of such series of debt securities or the related Fiscal Agency Agreement; |
| | (b) | the Republic denies any of its obligations under such series of debt securities or the related Fiscal Agency Agreement; or |
| | (c) | any legislative, executive or constitutional measure or final judicial decision renders any material provision of such series of debt securities or the related Fiscal Agency Agreement invalid or unenforceable or prevents or delays the performance of the Republic’s obligations under such series of debt securities or the related Fiscal Agency Agreement; |
(6) Failure of Authorizations: any legislative, executive or constitutional authorization necessary for the Republic to perform its material obligations under the series of debt securities or the related Fiscal Agency Agreement ceases to be in full force and effect or is modified in a manner materially prejudicial to the holders of the debt securities;
(7) Control of Assets: the Republic or the central bank of the Republic does not at all times exercise full control over the Republic’s International Monetary Assets; or
128
(8) IMF Membership: the Republic ceases to be a member of the IMF or loses its eligibility to use the general resources of the IMF.
The events described in paragraphs 2, 4, 5 and 6 will be events of default only if they materially prejudice the interests of holders of the debt securities.
If any of the above events of default occurs and is continuing, holders of the debt securities representing at least 25% in principal amount of the debt securities of that series then outstanding may declare all of the debt securities of the series to be due and payable immediately by written notice to the Republic and the fiscal agent. The holders of more than 50% of the aggregate principal amount of the outstanding debt securities of the affected series may rescind a declaration of acceleration if the event or events of default giving rise to the declaration have been cured or waived.
Investors should note that:
| | • | | despite the procedure described above, no debt securities may be declared due and payable if the Republic cures the applicable event of default before it receives the written notice from the holders of the debt securities; |
| | • | | the Republic is not required to provide periodic evidence of the absence of defaults; and |
| | • | | the Fiscal Agency Agreement does not require the Republic to notify holders of the debt securities of an event of default or grant any holder of the debt securities a right to examine the bond register. |
Modifications and Amendments; Bondholders’ Meetings
The Republic and the fiscal agent may, with the consent of the holders of not less than 75% of the aggregate principal amount of the outstanding debt securities, voting at a meeting or by written consent, make any amendment, modification, change or waiver with respect to the debt securities or the Fiscal Agency Agreement that would:
| | • | | change the stated maturity of the principal of the debt securities or the due date of any installment of interest; |
| | • | | reduce the principal amount of such series of debt securities or the portion of the principal amount payable upon acceleration of such debt securities; |
| | • | | change the debt securities’ interest rate; |
| | • | | change the currency of payment of principal or interest; |
| | • | | change the obligation of the Republic to pay any additional amounts on account of withholding taxes or deductions; |
| | • | | reduce the percentage of the outstanding principal amount needed to modify or amend the related Fiscal Agency Agreement, any amendment or supplement thereto, or the terms of such series of debt securities; |
| | • | | change the definition of “outstanding” with respect to the debt securities of such series; |
| | • | | permit early redemption of the debt securities of the series or, if early redemption is already permitted, set a redemption date earlier than the date previously specified or reduce the redemption price; |
| | • | | change the governing law provision of the debt securities of that series; |
| | • | | change the courts to the jurisdiction to which the Republic has submitted, the Republic’s obligation to appoint and maintain an agent for service of process in the Borough of Manhattan, The City of New York, or the Republic’s waiver of immunity, in respect of actions or proceedings brought by any holder based upon the debt securities of that series; |
129
| | • | | in connection with an exchange offer for the debt securities of that series, amend any event of default under the debt securities of that series; or |
| | • | | change the pari passu ranking of the debt securities. |
We refer to the above subjects as “reserved matters.” A change to a reserved matter, including the payment terms of the debt securities, can be made without the holder’s consent, as long as a supermajority of the holders (that is, the holders of at least 75% of the aggregate principal amount of the outstanding debt securities) agrees to the change.
With respect to other types of amendment or modification, the Republic may, with the consent of the holders of at least 66 2/3% in principal amount of the debt securities that are outstanding, modify and amend the debt securities or, to the extent the modification or amendment affects the debt securities, the Fiscal Agency Agreement or any amendment or supplement thereto.
The Republic may at any time call a meeting of the holders of debt securities to seek the holders’ approval of the modification or amendment, or to obtain a waiver, of any provision of the debt securities. The meeting will be held at the time and place in the Borough of Manhattan in New York City as determined by the Republic. The notice calling the meeting must be given at least 30 days and not more than 60 days prior to the meeting.
The holders of at least 10% of the aggregate principal amount of the debt securities that are outstanding may compel the fiscal agent to call a meeting of all holders of the debt securities.
For purposes of a meeting of the holders of the debt securities that does not propose to discuss reserved matters, the persons entitled to vote a majority in principal amount of the debt securities that are outstanding at the time will constitute a quorum. However, if such a meeting is adjourned for a lack of a quorum, then holders or proxies representing 25% of the outstanding principal amount will constitute a quorum when the meeting is rescheduled. For purposes of any meeting of holders that proposes to discuss reserved matters, as specified above, holders or proxies representing 75% of the aggregate principal amount of the outstanding notes will constitute a quorum. To vote at a meeting, a person must either hold outstanding debt securities or be duly appointed as a proxy for a holder of the debt securities. The fiscal agent will make all rules governing the conduct of any meeting.
The Fiscal Agency Agreement and the debt securities may be modified or amended, without the consent of the holders of the debt securities, to:
| | • | | add covenants of the Republic that benefit holders of the debt securities; |
| | • | | surrender any right or power given to the Republic; |
| | • | | secure the debt securities; or |
| | • | | cure any ambiguity or correct or supplement any defective provision in the Fiscal Agency Agreement or the debt securities, without materially and adversely affecting the interests of the holders of the debt securities. |
For purposes of determining whether the required percentage of holders of the debt securities of a series has approved any amendment, modification or change to, or waiver of, the debt securities or the Fiscal Agency Agreement, or whether the required percentage of holders has delivered a notice of acceleration of the debt securities of that series, debt securities owned, directly or indirectly, by the Republic or any public sector instrumentality of the Republic will be disregarded and deemed not to be outstanding (except that in determining whether the fiscal agent shall be protected in relying upon any amendment, modification, change or waiver, or any notice from holders, only debt securities that the fiscal agent knows to be so owned shall be so disregarded). As used in this paragraph, “public sector instrumentality” means Bangko Sentral, any department, ministry or agency of the Republic or any corporation, trust, financial institution or other entity owned or controlled by the
130
Republic or any of the foregoing, and “control” means the power, directly or indirectly, through the ownership of voting securities or other ownership interests or otherwise, to direct the management of or elect or appoint a majority of the board of directors or other persons performing similar functions in lieu of, or in addition to, the board of directors of a corporation, trust, financial institution or other entity.
Further Issues of Debt Securities
The Republic may, without the consent of the holders of the debt securities, create and issue additional debt securities with the same terms and conditions as any series of bonds (or that are the same in all respects except for the amount of the first interest payment and for the interest paid on the series of debt securities prior to the issuance of the additional debt securities) provided, however, that such additional notes do not have a greater amount of original issue discount for U.S. federal tax purposes than the outstanding notes have as of the date of the issue of such additional notes. The Republic may consolidate such additional debt securities with the outstanding debt securities to form a single series. Any further debt securities forming a single series with the outstanding debt securities of any series constituted by a Fiscal Agency Agreement shall be constituted by a supplement to such relevant Fiscal Agency Agreement.
131
TAXATION
The following discussion summarizes certain Philippine and U.S. federal income tax considerations that may be relevant to you if you invest in debt securities of the Republic. This summary is based on laws, regulations, rulings and decisions now in effect, all of which may change. Any change could apply retroactively and could affect the continued validity of this summary.
This summary does not describe all of the tax considerations that may be relevant to you or your situation, particularly if you are subject to special tax rules. You should consult your tax advisor about the tax consequences of holding debt securities, including the relevance to your particular situation of the considerations discussed below, as well as of state, local or other tax laws.
Philippine Taxation
The following is a summary of certain Philippine tax consequences that may be relevant to non-Philippine holders of the debt securities in connection with the holding and disposition of the debt securities. The Republic uses the term “non-Philippine holders” to refer to (i) non-residents of the Philippines who are neither citizens of the Philippines nor are engaged in trade or business within the Philippines or (ii) non-Philippine corporations not engaged in trade or business in the Philippines.
This summary is based on Philippine laws, rules, and regulations in effect as of the date of this prospectus, all of which are subject to change and may apply retroactively. It is not intended to constitute a complete analysis of the tax consequences under Philippine law of the receipt, ownership, or disposition of the debt securities, in each case by non-Philippine holders, nor to describe any of the tax consequences that may be applicable to citizens or residents of the Republic. If you are not a non-Philippine holder, you should consult your tax advisor about the consequences of holding these debt securities.
Effect of Holding Global Bonds
Payments by the Republic of principal of and interest on the debt securities to a non-Philippine holder will not subject such non-Philippine holder to taxation in the Philippines by reason solely of the holding of the debt securities or the receipt of principal or interest in respect thereof.
Taxation of Interest on the Global Bonds
When the Republic makes payments of principal and interest to you on the debt securities, no amount will be withheld from such payments for, or on account of, any taxes of any kind imposed, levied, withheld or assessed by the Philippines or any political subdivision or taxing authority thereof or therein.
Taxation of Capital Gains
Non-Philippine holders of the debt security will not be subject to Philippine income or withholding tax in connection with the sale, exchange, or retirement of a debt security if such sale, exchange or retirement is made outside the Philippines or an exemption is available under an applicable tax treaty in force between the Philippines and the country of domicile of the non-Philippine holder. If the debt securities have a maturity of more than five years from the date of issuance, any gains realized by a holder of the debt security will not, under the Philippine Tax Code, be subject to Philippine income tax.
Documentary Stamp Taxes
No documentary stamp tax is imposed upon the transfer of the debt securities. A documentary stamp tax at the rate of (Peso)1.00 for every (Peso)200.00 of the issue value of the debt securities is payable upon the issuance of the debt securities and will be for the account of the Republic.
132
Estate and Donor’s Taxes
The transfer of a debt security by way of succession upon the death of a non-Philippine holder will be subject to Philippine estate tax at progressive rates ranging from 5% to 20% if the value of the net estate of properties located in the Philippines is over (Peso)200,000.
The transfer of a debt security by gift to an individual who is related to the non-Philippine holder will generally be subject to a Philippine donor’s tax at progressive rates ranging from 2% to 15% if the value of the net gifts of properties located in the Philippines exceeds (Peso)100,000 during the relevant calendar year. Gifts to unrelated donees are generally subject to tax at a flat rate of 30%. An unrelated donee is a person who is not a (i) brother, sister (whether by whole or half blood), spouse, ancestor, or lineal descendant or (ii) relative by consanguinity in the collateral line within the fourth degree of relationship.
The foregoing apply even if the holder is a non-Philippine holder. However, the Republic will not collect estate and donor’s taxes on the transfer of the debt securities by gift or succession if the deceased at the time of death, or the donor at the time of donation, was a citizen and resident of a foreign country that provides certain reciprocal rights to citizens of the Philippines (a “Reciprocating Jurisdiction”). For these purposes, a Reciprocating Jurisdiction is a foreign country which at the time of death or donation (i) did not impose a transfer tax of any character in respect of intangible personal property of citizens of the Philippines not residing in that foreign country or (ii) allowed a similar exemption from transfer or death taxes of every character or description in respect of intangible personal property owned by citizens of the Philippines not residing in that foreign country.
United States Tax Considerations
The following discussion summarizes material U.S. federal income tax consequences that may be relevant to you if you invest in debt securities. This summary is based on the Internal Revenue Code of 1986, as amended (the “Code”), applicable U.S. Treasury Regulations, published rulings, administrative pronouncements, and court decisions in effect on the date of this prospectus, all of which are subject to change, possibly with retroactive effect. Any such change could affect the tax consequences described below. This summary deals only with initial purchasers that hold debt securities as capital assets. The discussion does not address state, local, foreign or other tax laws. It also does not address considerations that may be relevant to you if you are an investor that is subject to special tax rules, such as a financial institution, real estate investment trust, regulated investment company, insurance company, dealer in securities or currencies, trader in securities or commodities that elects mark to market treatment, an investor subject to the alternative minimum tax or the net investment income tax, a person that will hold debt securities in an individual retirement account or other tax deferred account, as a hedge against currency risk or as a position in a “straddle” or conversion transaction, a tax exempt organization or a U.S. holder whose “functional currency” is not the U.S. dollar.
You will be a U.S. holder if you are for U.S. income tax purposes (i) an individual who is a citizen or resident of the United States, (ii) a corporation created or organized in or under the laws of the United States or any state thereof (including the District of Columbia), (iii) an estate the income of which is subject to U.S. federal income taxation regardless of its source or (iv) a trust if a court within the United States is able to execute primary supervision over its administration and one or more U.S. persons have the authority to control all the substantial decisions of such trust. Notwithstanding the preceding sentence, to the extent provided in U.S. Treasury Regulations, certain trusts in existence on August 20, 1996, treated as United States persons prior to such date, and that have a valid election in effect to be treated as a United States person, shall also be considered U.S. holders.
If you are a partner in an entity treated as a partnership for U.S. federal income tax purposes that holds debt securities, the tax consequences of an investment in debt securities will generally depend on the status of the partners and the activities of the partnership. Prospective purchasers that are entities treated as partnerships for U.S. federal income tax purposes should consult their tax advisors concerning the U.S. federal income tax consequences to their partners of the acquisition, ownership and disposition of debt securities by the partnership.
133
You should consult your own tax advisor concerning the particular U.S. federal income tax consequences to you of ownership and disposition of debt securities, as well as the consequences to you arising under state and local tax laws, and the laws of any other taxing jurisdiction, and possible changes in tax law.
Bearer debt securities are not being offered to U.S. holders. A U.S. holder who owns a bearer debt security may be subject to limitations under U.S. income tax laws, including the limitations provided in sections 165(j) and 1287(a) of the Code.
United States Holders
Payments or Accruals of Interest
Payments or accruals of “qualified stated interest” (as defined below) on a debt security will be taxable to you as ordinary interest income at the time that you receive or accrue such amounts (in accordance with your regular method of tax accounting). If you use the cash method of tax accounting and you receive payments of interest pursuant to the terms of a debt security in a currency other than U.S. dollars (a “foreign currency”), the amount of interest income you will realize will be the U.S. dollar value of the foreign currency payment based on the exchange rate in effect on the date you receive the payment regardless of whether you convert the payment into U.S. dollars. If you are an accrual basis U.S. holder, the amount of interest income you will realize will be based on the average exchange rate in effect during the interest accrual period (or with respect to an interest accrual period that spans two taxable years, at the average exchange rate for the partial period within the taxable year). Alternatively, as an accrual basis U.S. holder, you may elect to translate all interest income on foreign currency denominated debt securities at the spot rate of exchange on the last day of the accrual period (or the last day of the taxable year, in the case of an accrual period that spans more than one taxable year) or on the date that you receive the interest payment if that date is within five business days of the end of the accrual period. If you make this election you must apply it consistently to all debt instruments from year to year and you cannot change the election without the consent of the Internal Revenue Service (the “IRS”). If you use the accrual method of accounting for tax purposes you will recognize foreign currency gain or loss on the receipt of a foreign currency interest payment if the exchange rate in effect on the date the payment is received differs from the rate applicable to a previous accrual of that interest income regardless of whether the payment is in fact converted into U.S. dollars. This foreign currency gain or loss will be treated as U.S. source ordinary income or loss.
Payments of interest on the debt securities and original issue discount, if any, accrued with respect to the debt securities will be treated as foreign source income for the purposes of calculating that holder’s foreign tax credit limitation. The limitation on foreign taxes eligible for the U.S. foreign tax credit is calculated separately with respect to specific classes of income. The rules relating to foreign tax credits and the timing thereof are complex. You should consult your own tax advisors regarding the availability of a foreign tax credit under your particular situation.
The Purchase, Sale, and Retirement of Debt Securities
You will generally recognize gain or loss on the sale or retirement of debt securities equal to the difference between the amount realized on the sale or retirement and the tax basis of the debt securities. Your tax basis in a debt security generally will equal the cost of the debt security to you increased by any amounts that you are required to include in income under the rules governing original issue discount and market discount and will decrease by the amount of any amortized premium and any payments other than qualified stated interest made on the debt security. The rules for determining these amounts are discussed below. If you purchase a debt security that is denominated in a foreign currency, the cost to you (and therefore, generally, your initial tax basis) will be the U.S. dollar value of the foreign currency purchase price on the date of purchase calculated at (i) the exchange rate in effect on that date or (ii) if the foreign currency debt security is traded on an established securities market and you are a cash basis taxpayer, or if you are an accrual basis taxpayer that makes a special election, the spot rate of exchange on the settlement date of your purchase. The amount of any subsequent adjustments to your tax
134
basis in a debt security in respect of foreign currency denominated original issue discount, market discount and premium will be determined in the manner described below. If you convert U.S. dollars into a foreign currency and then immediately use that foreign currency to purchase a debt security, you generally will not have any taxable gain or loss as a result of the conversion or purchase.
When you sell or exchange a debt security, or if a debt security is retired, you generally will recognize gain or loss equal to the difference between the amount you realize on the transaction (less any accrued but unpaid interest not previously included in income, which will be subject to tax in the manner described above under “Payments or Accruals of Interest”) and your tax basis in the debt security. If you sell or exchange a debt security for a foreign currency, or receive foreign currency on the retirement of a debt security, the amount you will realize for U.S. tax purposes generally will be the U.S. dollar value of the foreign currency that you receive calculated at (i) the exchange rate in effect on the date the foreign currency debt security is disposed of or retired or (ii) if you dispose of a foreign currency debt security that is traded on an established securities market and you are a cash basis U.S. holder, or if you are an accrual basis holder that makes a special election, the spot rate of exchange on the settlement date of the sale, exchange or retirement.
The special election available to you if you are an accrual basis taxpayer in respect of the purchase and sale of foreign currency debt securities traded on an established securities market, which is discussed in the two preceding paragraphs, must be applied consistently to all debt instruments from year to year and cannot be changed without the consent of the IRS.
Except as discussed below with respect to market discount, short-term debt securities and foreign currency gain or loss, the gain or loss that you recognize on the sale, exchange or retirement of a debt security generally will be capital gain or loss, and will be long-term capital gain or loss if you have held the debt security for more than one year. The Code provides preferential treatment under certain circumstances for net long-term capital gains recognized by individual non-corporate investors. Capital gain or loss, if any, recognized by a U.S. holder generally will be treated as U.S. source income or loss for U.S. foreign tax credit purposes. The ability of U.S. holders to offset capital losses against income is limited.
Despite the foregoing, the gain or loss that you recognize on the sale, exchange or retirement of a foreign currency debt security generally will be treated as ordinary income or loss to the extent that the gain or loss is attributable to changes in exchange rates during the period in which you held the debt security. This foreign currency gain or loss will not be treated as an adjustment to interest income that you receive on the debt security.
Original Issue Discount
If the Republic issues debt securities at a discount from their stated redemption price at maturity, and the discount is equal to or more than the product of one-fourth of one per cent (0.25%) of the stated redemption price at maturity of the debt securities multiplied by the number of full years to their maturity, the debt securities will be “OID debt securities.” The difference between the issue price and the stated redemption price at maturity of the debt securities will be the “original issue discount” or “OID.” The “issue price” of the debt securities will be the first price at which a substantial amount of the debt securities are sold to the public (i.e., excluding sales of debt securities to underwriters, placement agents, wholesalers or similar persons). The “stated redemption price at maturity” will include all payments under the debt securities other than payments of qualified stated interest. The term “qualified stated interest” generally means stated interest that is unconditionally payable in cash or property (other than debt instruments issued by the Republic) at least annually during the entire term of a debt security at a single fixed interest rate or, subject to certain conditions, based on one or more variable rates. A debt security that provides for the payment of amounts other than qualified stated interest before maturity (an “installment obligation”) will be treated as an OID debt security if the excess of its stated redemption price at maturity over its issue price is equal to or greater than 0.25% of its stated redemption price at maturity multiplied by the weighted average maturity of the debt security. The weighted average maturity is the sum of the following amounts determined for each payment on a debt security (other than a payment of qualified stated
135
interest): (i) the number of complete years from the issue date until the payment is made multiplied by (ii) a fraction, the numerator of which is the amount of the payment and the denominator of which is the debt security’s stated redemption price at maturity.
If you invest in OID debt securities you generally will be subject to the special tax accounting rules for OID obligations provided by the Code and certain U.S. Treasury Regulations. You should be aware that, as described in greater detail below, if you invest in an OID debt security you generally will be required to include OID in ordinary gross income for U.S. federal income tax purposes as it accrues, although you may not yet have received the cash attributable to that income.
In general, and regardless of whether you use the cash or the accrual method of tax accounting, if you are the holder of an OID debt security with a maturity greater than one year, you will be required to include in ordinary gross income the sum of the “daily portions” of OID on that debt security for all days during the taxable year that you own the debt security. The daily portions of OID on an OID debt security are determined by allocating to each day in any accrual period a ratable portion of the OID allocable to that period. Accrual periods may be any length and may vary in length over the term of an OID debt security, so long as no accrual period is longer than one year and each scheduled payment of principal or interest occurs on the first or last day of an accrual period. If you are the initial holder of the debt security, the amount of OID on an OID debt security allocable to each accrual period is determined by:
(i) multiplying the “adjusted issue price” (as defined below) of the debt security at the beginning of the accrual period by a fraction, the numerator of which is the annual yield to maturity of the debt security and the denominator of which is the number of accrual periods in a year; and
(ii) subtracting from that product the amount (if any) of qualified stated interest payments allocable to that accrual period.
An OID debt security that is a floating rate debt security will be subject to special rules. Generally, if a floating rate debt security qualifies as a “variable rate debt instrument” (as defined in applicable U.S. Treasury Regulations), then (i) all stated interest with respect to such floating rate debt security will be qualified stated interest and hence included in a U.S. holder’s income in accordance with such U.S. holder’s normal method of accounting for U.S. federal income tax purposes, and (ii) the amount of OID, if any, will be determined under the general OID rules (as described above) by assuming that the variable rate is a fixed rate equal, in general, to the value, as of the issue date, of the floating rate.
If a floating rate debt security does not qualify as a “variable rate debt instrument,” such floating rate debt security will be classified as a contingent payment debt instrument and will be subject to special rules for calculating the accrual of stated interest and original issue discount.
Any special considerations with respect to the tax consequences of holding a floating rate debt security will be provided in the applicable prospectus supplement.
The “adjusted issue price” of an OID debt security at the beginning of any accrual period will generally be the sum of the debt security’s issue price and the amount of OID previously includable in the gross income of the holder, reduced by the amount of all payments other than any qualified stated interest payments on the debt security in all prior accrual periods. All payments on an OID debt security, other than qualified stated interest, generally will be viewed first as payments of previously accrued OID (to the extent of the previously accrued discount), with payments considered made from the earliest accrual periods first, and then as a payment of principal. The “annual yield to maturity” of a debt security is the discount rate (appropriately adjusted to reflect the length of accrual periods) that causes the present value on the issue date of all payments on the debt security to equal the issue price. As a result of this “constant yield” method of including OID income, you will generally be required to include in your gross income increasingly greater amounts of OID over the life of OID debt security.
136
You generally may make an irrevocable election to include in income your entire return on a debt security (i.e., the excess of all remaining payments to be received on the debt security, including payments of qualified stated interest, over the amount you paid for the debt security) under the constant yield method described above. This election will generally apply only to the debt security with respect to which it is made and may not be revoked without the consent of the IRS. For debt securities purchased at a premium or bearing market discount in your hands, if you make this election you will also be deemed to have made the election (discussed below under the caption “Premium and Market Discount”) to amortize premium or to accrue market discount in income currently on a constant yield basis and such election would apply to all debt instruments with market discount acquired by the electing U.S. holder on or after the first day of the first taxable year to which the election applies. U.S. holders should consult their tax advisors concerning the propriety and consequences of this election.
In the case of an OID debt security that is also a foreign currency debt security, you should determine the U.S. dollar amount includable as OID for each accrual period by (i) calculating the amount of OID allocable to each accrual period in the foreign currency using the constant yield method, and (ii) translating the foreign currency amount so determined at the average exchange rate in effect during that accrual period (or, with respect to an interest accrual period that spans two taxable years, at the average exchange rate for the partial period within the taxable year). Alternatively, you may translate the foreign currency amount so determined at the spot rate of exchange on the last day of the accrual period (or the last day of the taxable year, for an accrual period that spans two taxable years) or at the spot rate of exchange on the date of receipt, if that date is within five business days of the last day of the accrual period, provided that you have made the election described under the caption “Payments or Accruals of Interest” above. Because exchange rates may fluctuate, if you are the holder of an OID debt security that is also a foreign currency debt security you may recognize a different amount of OID income in each accrual period than would be the case if you were the holder of an otherwise similar OID debt security denominated in U.S. dollars. Upon the receipt of an amount attributable to OID (whether in connection with a payment of an amount that is not qualified stated interest or the sale or retirement of the OID debt security), you may recognize ordinary income or loss measured by the difference between the amount received, translated into U.S. dollars at the exchange rate in effect on the date of receipt or on the date of disposition of the OID debt security, as the case may be, and the amount accrued, using the exchange rate applicable to such previous accrual.
If you purchase an OID debt security outside of the initial offering at a cost less than its “remaining redemption amount” or if you purchase an OID debt security in the initial offering at a price other than the debt security’s issue price, you will also generally be required to include in gross income the daily portions of OID, calculated as described above. However, if you acquire an OID debt security at a price (i) less than or equal to the remaining redemption amount but (ii) greater than its adjusted issue price, you will be entitled to reduce your periodic inclusions to reflect the premium paid over the adjusted issue price. (As discussed under “Premium and Market Discount” below, if you purchase an OID debt security at a price greater than its remaining redemption amount, the OID rules described in this section will not apply.) The “remaining redemption amount” for an OID debt security is the total of all future payments to be made on the debt security other than qualified stated interest.
Certain of the OID debt securities may be redeemed prior to maturity, either at the option of the Republic or at the option of the holder, or may have special repayment or interest rate reset features as indicated in the pricing supplement. OID debt securities containing these features may be subject to rules that differ from the general rules discussed above. If you purchase OID debt securities with these features, you should carefully examine the pricing supplement and consult your tax advisor about their treatment since the tax consequences of OID will depend, in part, on the particular terms and features of the debt securities.
OID accrued with respect to an OID debt security will be treated as foreign source income for the purposes of calculating that holder’s foreign tax credit limitation. The limitation on foreign taxes eligible for the U.S. foreign tax credit is calculated separately with respect to specific classes of income. The rules relating to foreign tax credits and the timing thereof are complex. You should consult your own tax advisor regarding the availability of a foreign tax credit under your particular situation.
137
Short-Term Debt Securities
Special rules may apply to a debt security with a maturity of one year or less (“a short-term debt security”). If you are an accrual basis holder, you will be required to accrue OID on the short-term debt security on either a straight line basis or, at the election of the holder, under a constant yield method (based on daily compounding). No interest payments on a short-term debt security will be qualified stated interest. Consequently, such interest payments are included in the short-term debt security’s stated redemption price at maturity. Since the amount of OID is calculated in the same manner as described above under “Original Issue Discount,” such interest payments may give rise to OID (or acquisition discount, as defined below) even if the short-term debt securities are not actually issued at a discount. If you are a cash basis holder and do not elect to include OID in income as it accrues, you will not be required to include OID in income until you actually receive payments on the debt security. However, you will be required to treat any gain upon the sale, exchange or retirement of the debt security as ordinary income to the extent of the accrued OID on the debt security that you have not yet taken into income at the time of the sale. Also, if you borrow money (or do not repay outstanding debt) to acquire or hold the debt security, you may not be allowed to deduct interest on the borrowing that corresponds to accrued OID on the debt security until you include the OID in your income.
Alternatively, regardless of whether you are a cash basis or accrual basis holder, you can elect to accrue any “acquisition discount” with respect to the short-term debt security on a current basis. Acquisition discount is the excess of the stated redemption price at maturity of the debt security over the purchase price. Acquisition discount will be treated as accruing ratably or, at the election of the holder, under a constant yield method (based on daily compounding). If you elect to accrue acquisition discount, the OID rules will not apply. U.S. holders should consult their own tax advisors as to the application of these rules.
As described above, certain of the debt securities may be subject to special redemption features. These features may affect the determination of whether a debt security has a maturity of one year or less and thus is a short-term debt security. If you purchase a debt security, you should carefully examine the pricing supplement and consult your tax advisor about these features.
Fungibility of Debt Securities
The Republic may, without the consent of the holders of outstanding debt securities, issue additional debt securities with identical terms. These additional debt securities, even if they are treated for non-tax purposes as part of the same series as the original debt securities, in some cases may be treated as a separate series for U.S. federal income tax purposes. In such a case, the additional debt securities may be considered to have been issued with OID even if the original debt securities had no OID, or the additional debt securities may have a greater amount of OID than the original debt securities. These differences may affect the market value of the original debt securities if the additional debt securities are not otherwise distinguishable from the original debt securities.
Premium and Market Discount
If you purchase a debt security at a cost greater than the debt security’s remaining redemption amount, you will be considered to have purchased the debt security at a premium, and you may elect to amortize the premium as an offset to interest income, using a constant yield method, over the remaining term of the debt security. If you make this election, it generally will apply to all debt instruments that you hold at the time of the election, as well as any debt instruments that you subsequently acquire. In addition, you may not revoke the election without the consent of the IRS. If you elect to amortize the premium you will be required to reduce your tax basis in the debt security by the amount of the premium amortized during your holding period. In the case of premium on a foreign currency debt security, you should calculate the amortization of the premium in the foreign currency. Amortization deductions attributable to a period reduce interest payments (or OID) in respect of that period, and therefore are translated into U.S. dollars at the rate that you use for those interest payments (or OID). Exchange
138
gain or loss will be realized with respect to amortized premium on a foreign currency debt security based on the difference between the exchange rate computed on the date or dates the premium is amortized against interest payments (or OID) on the debt security and the exchange rate on the date when the holder acquired the debt security. For a U.S. holder that does not elect to amortize premium, the amount of premium will be included in your tax basis when the debt security matures or is disposed of. Therefore, if you do not elect to amortize premium and you hold the debt security to maturity, you generally will be required to treat the premium as capital loss when the debt security matures.
A debt security, other than a short-term debt security, will be treated as purchased at a market discount (a “market discount debt security”) if the debt security’s stated redemption price at maturity or, in the case of OID debt security, the debt security’s “revised issue price,” exceeds the amount for which the U.S. holder purchased the debt security by at least one-fourth of one per cent (0.25%) of such debt security’s stated redemption price at maturity or revised issue price, respectively, multiplied by the number of complete years from the date acquired by the U.S. holder to the debt security’s maturity. For these purposes, the “revised issue price” of a debt security generally equals its issue price, increased by the amount of any OID that has accrued on the debt security and reduced by the amount of any payments previously made that were not qualified stated interests.
Any gain recognized on the maturity or disposition of a market discount debt security will be treated as ordinary income to the extent that such gain does not exceed the accrued market discount on such debt security. Alternatively, a U.S. holder of a market discount debt security may elect to include market discount in income currently over the life of the debt security. Such an election shall apply to all debt instruments with market discount acquired by the electing U.S. holder on or after the first day of the first taxable year to which the election applies. This election may not be revoked without the consent of the IRS.
Market discount on a market discount debt security will accrue on a straight line basis unless the U.S. holder elects to accrue such market discount on a constant yield method. Such an election shall apply only to the debt security with respect to which it is made and may not be revoked. A U.S. holder of a market discount debt security that does not elect to include market discount in income currently, generally will be required to defer deductions for interest on borrowings allocable to such debt security in an amount not exceeding the accrued market discount on such debt security until the maturity or disposition of such debt security. Any accrued market discount on a foreign currency debt security that is currently includable in income will generally be translated into U.S. dollars at the average rate for the accrual periods (or portion thereof within the holder’s taxable year). Upon the receipt of an amount attributable to accrued market discount, the U.S. Holder may recognize U.S. source exchange gain or loss (which will be taxable as ordinary income or loss) determined in the same manner as for accrued interest or OID. A U.S. Holder that does not elect to include market discount in income currently will recognize, upon the disposition or maturity of the debt securities, the U.S. dollar value of the amount accrued, calculated at the spot rate on that date, and no part of this accrued market discount will be treated as exchange gain or loss.
Disposition of Foreign Currency
Foreign currency received as interest on a debt security or on the sale or retirement of a debt security will have a tax basis equal to its U.S. dollar value at the time the foreign currency is received. Foreign currency that is purchased will generally have a tax basis equal to the U.S. dollar value of the foreign currency on the date of purchase. Any gain or loss recognized on a sale or other disposition of a foreign currency (including its use to purchase debt securities or upon exchange for U.S. dollars) will be U.S. source ordinary income or loss.
Warrants
A description of the tax consequences of an investment in warrants will be provided in the applicable prospectus supplement.
139
Indexed Debt Securities and Other Debt Securities Providing for Contingent Payments
Special rules govern the tax treatment of debt obligations that provide for contingent payments (“contingent debt obligations”). These rules generally require accrual of interest income on a constant yield basis in respect of contingent debt obligations at a yield determined at the time of issuance of the obligation, and may require adjustments to these accruals when any contingent payments are made. In addition, special rules may apply to floating rate debt securities if the interest payable on the debt securities is based on more than one interest rate index. We will provide a detailed description of the tax considerations relevant to U.S. holders of any debt securities that are subject to the special rules discussed in this paragraph in the relevant prospectus supplement.
Non-U.S. Holders
The following summary applies to you if you are not a U.S. holder, as defined above.
Subject to the discussion below under the caption “Information Reporting and Backup Withholding,” the interest income that you derive in respect of the debt securities generally will be exempt from U.S. federal income taxes, including U.S. withholding tax on payments of interest (including OID) unless such income is effectively connected with the conduct of a trade or business within the United States. Further, any gain you realize on a sale or exchange of debt securities generally will be exempt from U.S. federal income tax, including U.S. withholding tax, unless:
| | • | | your gain is effectively connected with the conduct of a trade or business within the United States; or |
| | • | | you are an individual holder and are present in the United States for 183 days or more in the taxable year of the sale, and either (i) your gain is attributable to an office or other fixed place of business that you maintain in the United States or (ii) you have a tax home in the United States. |
Information Reporting and Backup Withholding
In general, information reporting requirements may apply to certain payments of principal, interest and accruals of OID made within the United States on a debt security, including payments made by the U.S. office of a paying agent, broker or other intermediary, and to proceeds of a sale, exchange, or retirement of debt security effected at the U.S. office of a U.S. or foreign broker. “Backup withholding” may apply to such payments or proceeds if the beneficial owner fails to provide a correct taxpayer identification number or fails to otherwise comply with the applicable backup withholding rules. Certain persons (including, among others, corporations) and non-U.S. holders which provide an appropriate certification or otherwise qualify for exemption are not subject to the backup withholding and information reporting requirements.
Backup withholding is not an additional tax. Amounts withheld under the backup withholding rules from a payment made to a U.S. holder generally may be claimed as a credit against such holder’s U.S. federal income tax liability provided the appropriate information is furnished to the IRS.
Reportable Transactions
A U.S. taxpayer that participates in a “reportable transaction” will be required to disclose its participation to the IRS. Under the relevant rules, if the debt securities are denominated in a foreign currency, a U.S. holder may be required to treat a foreign currency exchange loss from the debt securities as a reportable transaction if this loss exceeds the relevant threshold in the regulations ($50,000 in a single taxable year, if the U.S. holder is an individual or trust, or higher amounts for other non-individual U.S. holders), and to disclose its investment by filing Form 8886 with the IRS. A penalty in the amount of $10,000 in the case of a natural person and $50,000 in all other cases is generally imposed on any taxpayer that fails to timely file an information return with the IRS with respect to a transaction resulting in a loss that is treated as a reportable transaction. Prospective purchasers are urged to consult their tax advisors regarding the application of these rules.
140
Foreign Financial Asset Reporting
Certain U.S. holders are subject to reporting requirements on the holding of certain foreign financial assets, including debt of foreign entities, if the aggregate value of all of these assets exceeds $50,000 at the end of the taxable year or $75,000 at any time during the taxable year. The thresholds are higher certain for individuals living outside of the United States and for married couples filing jointly. The debt securities are expected to constitute foreign financial assets subject to these requirements unless they are held in an account at a financial institution (in which case the account may be reportable if maintained by a foreign financial institution). U.S. holders should consult their tax advisors regarding the application of the rules relating to foreign financial asset reporting.
141
PLAN OF DISTRIBUTION
The Republic may sell the debt securities or warrants in any of three ways:
| | • | | through underwriters or dealers; |
| | • | | directly to one or more purchasers; or |
The prospectus supplement relating to a particular series of debt securities or warrants will set out:
| | • | | the names of any underwriters or agents; |
| | • | | the purchase price of the securities; |
| | • | | the proceeds to the Republic from the sale; |
| | • | | any underwriting discounts and other compensation; |
| | • | | the initial public offering price; |
| | • | | any discounts or concessions allowed, reallowed or paid to dealers; and |
| | • | | any securities exchanges on which the securities will be listed. |
Any underwriter involved in the sale of securities will acquire the securities for its own account. The underwriters may resell the securities from time to time in one or more transactions, including negotiated transactions, at a fixed public offering price or at varying prices to be determined at the time of sale. The securities may be offered to the public either by underwriting syndicates represented by managing underwriters or by underwriters without a syndicate. Unless the prospectus supplement states otherwise, the underwriters will benefit from certain conditions that must be satisfied before they are obligated to purchase such securities and they will be obligated to purchase all of the securities if any are purchased. The underwriters may change any initial public offering price and any discounts or concessions allowed or reallowed or paid to dealers. The underwriters or certain of their affiliates may purchase securities and be allocated securities for asset management and/or proprietary purposes but not with a view to distribution.
If the Republic sells debt securities or warrants through agents, the prospectus supplement will identify the agent and indicate any commissions payable by the Republic. Unless the prospectus supplement states otherwise, all agents will act on a best efforts basis.
The Republic may authorize agents, underwriters or dealers to solicit offers by certain specified entities to purchase the securities from the Republic at the public offering price set forth in a prospectus supplement pursuant to delayed delivery contracts. The prospectus supplement will set out the conditions of the delayed delivery contracts and the commission receivable by the agents, underwriters or dealers for soliciting the contracts.
The Republic may offer securities as full, partial or alternative consideration for the purchase of other securities of the Republic, either in connection with a publicly announced tender, exchange or other offer for such securities or in privately negotiated transactions. The offer may be in addition to or in lieu of sales of securities directly or through underwriters or agents.
Agents and underwriters may be entitled to indemnification by the Republic against certain liabilities, including liabilities under the Securities Act of 1933, or to contribution from the Republic with respect to certain payments which the agents or underwriters may be required to make. Agents and underwriters may be customers of, engage in transactions with, or perform services (including commercial and investment banking services) for, the Republic in the ordinary course of business.
142
In compliance with Financial Industry Regulatory Authority guidelines, the maximum compensation to any underwriters or agents in connection with the sale of any securities pursuant to the prospectus and applicable prospectus supplements will not exceed 8% of the aggregate total offering price to the public of such securities as set forth on the cover page of the applicable prospectus supplement; however, it is anticipated that the maximum compensation paid will be significantly less than 8%.
Unless otherwise specified in the applicable prospectus supplement, if the Republic offers and sells securities outside the United States, each underwriter or dealer will acknowledge that:
| | • | | the securities offered have not been and will not be registered under the Securities Act of 1933; and |
| | • | | the securities may not be offered or sold in the United States except pursuant to an exemption from, or in a transaction not subject to, the registration requirements of the Securities Act of 1933. Each participating underwriter or dealer will agree that it has not offered or sold, and will not offer or sell, any debt securities constituting part of its allotment in the United States except in accordance with Rule 903 of Regulation S under the Securities Act of 1933. Accordingly, each underwriter or dealer will agree that neither the underwriter nor dealer nor its affiliates nor any persons acting on its or their behalf have engaged or will engage in any directed selling efforts with respect to the securities. |
143
VALIDITY OF THE SECURITIES
The Secretary of the Department of Justice of the Republic will provide an opinion on behalf of the Republic as to the validity of the securities under Philippine law. Linklaters, United States counsel for the Republic, will provide an opinion on behalf of the Republic as to the validity of the securities under U.S. and New York State law. U.S. and Philippine counsel named in the applicable prospectus supplement will provide an opinion as to certain legal matters on behalf of the underwriters named in the applicable prospectus supplement.
AUTHORIZED REPRESENTATIVE IN THE UNITED STATES
The authorized agent of the Republic in the United States is Hon. Mario Lopez de Leon, Jr., Consul General, the Philippine Consulate General, 556 Fifth Avenue, New York, New York 10036-5095.
EXPERTS; OFFICIAL STATEMENTS AND DOCUMENTS
Information contained herein that is identified as being derived from a publication of the Republic or one of its agencies or instrumentalities is included herein on the authority of such publication as an official public document of the Republic. All other information contained herein is included as an official public statement made on the authority of Rosalia de Leon, the National Treasurer of the Republic.
FURTHER INFORMATION
The Republic filed a registration statement with respect to the securities with the Securities and Exchange Commission under the Securities Act of 1933 and its related rules and regulations. You can find additional information concerning the Republic and the securities in the registration statement and any pre- or post-effective amendment, including its various exhibits, which may be inspected at the public reference room maintained by the Commission at 100 F Street, N.E., Washington, D.C. 20549. Please call the Commission at 1-800-SEC-0330 for further information on the operation of the public reference room. In addition, the Commission maintains an Internet site at http://www.sec.gov that contains information regarding issuers that file electronically with the Commission.
144
DEBT TABLES OF THE REPUBLIC OF THE PHILIPPINES
T-1
GUARANTEED EXTERNAL DEBT OF THE REPUBLIC OF THE PHILIPPINES(1)
AS OF SEPTEMBER 30, 2013
(In millions)
| | | | | | | | | | | | | | | | | | | | | | | | | | | | | | |
Currency | | Interest Rate Basis | | Interest Rate +
Spread/
Service Charge
(Per Annum) | | | | | | | | | Original Amount
Contracted | | | Outstanding Balance
as of September 30,
2013 | |
| | | | Year
Contracted | | | Year of
Maturity | | | (in Original
Currency) | | | (in US
Dollars)(2) | | | (in Original
Currency) | | | (in US
Dollars)(2) | |
GRAND TOTAL | | | | 11,874.06 | | | | | | | | 7,916.18 | |
| | | | | | | | | | | | | | | | | | | | | | | | | | | | | | |
I. NATIONAL GOVERNMENT DIRECT GUARANTEE ON GOCC LOANS | | | | 11,788.40 | | | | | | | | 7,830.52 | |
| | | | | | | | | | | | | | | | | | | | | | | | | | | | | | |
A. LOANS | | | | 7,427.70 | | | | | | | | 3,800.80 | |
| | | | | | | | | | | | | | | | | | | | | | | | | | | | | | |
EURO | | | | 367.53 | | | | 497.01 | | | | 221.81 | | | | 299.95 | |
| | | | | | | | | | | | | | | | | | | | | | | | | | | | | | |
| | | | | | | | |
| | | | | | | | | | | | | | | | | 3.43 | | | | 4.64 | | | | 1.30 | | | | 1.76 | |
| | | | | | | | | | | | | | | | | | | | | | | | | | | | | | |
| | FIXED | | | 3.00 | | | | 1990 | | | | 2020 | | | | | | | | | | | | 0.25 | | | | 0.34 | |
| | FIXED | | | 3.00 | | | | 1990 | | | | 2020 | | | | | | | | | | | | 0.09 | | | | 0.12 | |
| | FIXED | | | 3.00 | | | | 1990 | | | | 2020 | | | | | | | | | | | | 0.08 | | | | 0.11 | |
| | FIXED | | | 3.00 | | | | 1990 | | | | 2021 | | | | | | | | | | | | 0.36 | | | | 0.48 | |
| | FIXED | | | 3.00 | | | | 1990 | | | | 2021 | | | | | | | | | | | | 0.09 | | | | 0.12 | |
| | FIXED | | | 3.00 | | | | 1990 | | | | 2021 | | | | | | | | | | | | 0.30 | | | | 0.40 | |
| | FIXED | | | 3.00 | | | | 1990 | | | | 2021 | | | | | | | | | | | | 0.11 | | | | 0.15 | |
| | FIXED | | | 3.00 | | | | 1990 | | | | 2022 | | | | | | | | | | | | 0.03 | | | | 0.04 | |
| | | | | | | | |
| | | | | | | | | | | | | | | | | 1.83 | | | | 2.47 | | | | 0.77 | | | | 1.04 | |
| | | | | | | | | | | | | | | | | | | | | | | | | | | | | | |
| | FIXED | | | 3.00 | | | | 1990 | | | | 2020 | | | | | | | | | | | | 0.13 | | | | 0.17 | |
| | FIXED | | | 3.00 | | | | 1990 | | | | 2021 | | | | | | | | | | | | 0.03 | | | | 0.04 | |
| | FIXED | | | 3.00 | | | | 1990 | | | | 2021 | | | | | | | | | | | | 0.02 | | | | 0.03 | |
| | FIXED | | | 3.00 | | | | 1990 | | | | 2022 | | | | | | | | | | | | 0.40 | | | | 0.54 | |
| | FIXED | | | 3.00 | | | | 1990 | | | | 2022 | | | | | | | | | | | | 0.08 | | | | 0.11 | |
| | FIXED | | | 3.00 | | | | 1990 | | | | 2022 | | | | | | | | | | | | 0.05 | | | | 0.07 | |
| | FIXED | | | 3.00 | | | | 1990 | | | | 2023 | | | | | | | | | | | | 0.06 | | | | 0.08 | |
| | FIXED | | | 5.45 | | | | 1990 | | | | 2016 | | | | 18.29 | | | | 24.74 | | | | 3.20 | | | | 4.33 | |
| | | | | | | | | | | | | | | | | 2.21 | | | | 2.99 | | | | 0.99 | | | | 1.34 | |
| | | | | | | | | | | | | | | | | | | | | | | | | | | | | | |
| | FIXED | | | 2.50 | | | | 1991 | | | | 2021 | | | | | | | | | | | | 0.52 | | | | 0.71 | |
| | FIXED | | | 2.50 | | | | 1991 | | | | 2022 | | | | | | | | | | | | 0.47 | | | | 0.63 | |
| | FIXED | | | 5.45 | | | | 1991 | | | | 2019 | | | | 4.57 | | | | 6.18 | | | | 1.28 | | | | 1.73 | |
| | | | | | | | | | | | | | | | | 7.62 | | | | 10.31 | | | | 2.16 | | | | 2.92 | |
| | | | | | | | | | | | | | | | | | | | | | | | | | | | | | |
| | FIXED | | | 3.00 | | | | 1988 | | | | 2019 | | | | | | | | | | | | 1.58 | | | | 2.13 | |
| | FIXED | | | 3.00 | | | | 1988 | | | | 2019 | | | | | | | | | | | | 0.38 | | | | 0.51 | |
| | FIXED | | | 3.00 | | | | 1988 | | | | 2020 | | | | | | | | | | | | 0.20 | | | | 0.28 | |
| | | | | | | | |
| | | | | | | | | | | | | | | | | 1.18 | | | | 1.60 | | | | 0.13 | | | | 0.17 | |
| | | | | | | | | | | | | | | | | | | | | | | | | | | | | | |
| | FIXED | | | 3.30 | | | | 1994 | | | | 2014 | | | | | | | | | | | | 0.02 | | | | 0.03 | |
| | FIXED | | | 3.30 | | | | 1994 | | | | 2015 | | | | | | | | | | | | 0.11 | | | | 0.15 | |
| | | | | | | | |
| | | | | | | | | | | | | | | | | 1.51 | | | | 2.04 | | | | 0.22 | | | | 0.30 | |
| | | | | | | | | | | | | | | | | | | | | | | | | | | | | | |
| | FIXED | | | 3.10 | | | | 1994 | | | | 2014 | | | | | | | | | | | | 0.03 | | | | 0.04 | |
| | FIXED | | | 3.10 | | | | 1994 | | | | 2015 | | | | | | | | | | | | 0.13 | | | | 0.17 | |
| | FIXED | | | 3.10 | | | | 1994 | | | | 2015 | | | | | | | | | | | | 0.01 | | | | 0.01 | |
| | FIXED | | | 3.10 | | | | 1994 | | | | 2016 | | | | | | | | | | | | 0.03 | | | | 0.03 | |
| | FIXED | | | 3.10 | | | | 1994 | | | | 2016 | | | | | | | | | | | | 0.00 | | | | 0.01 | |
| | FIXED | | | 3.10 | | | | 1994 | | | | 2016 | | | | | | | | | | | | 0.03 | | | | 0.04 | |
| | | | | | | | |
| | | | | | | | | | | | | | | | | 1.54 | | | | 2.08 | | | | 0.23 | | | | 0.31 | |
| | | | | | | | | | | | | | | | | | | | | | | | | | | | | | |
| | FIXED | | | 3.10 | | | | 1994 | | | | 2014 | | | | | | | | | | | | 0.03 | | | | 0.04 | |
| | FIXED | | | 3.10 | | | | 1994 | | | | 2015 | | | | | | | | | | | | 0.13 | | | | 0.17 | |
| | FIXED | | | 3.10 | | | | 1994 | | | | 2015 | | | | | | | | | | | | 0.01 | | | | 0.01 | |
| | FIXED | | | 3.10 | | | | 1994 | | | | 2016 | | | | | | | | | | | | 0.03 | | | | 0.04 | |
| | FIXED | | | 3.10 | | | | 1994 | | | | 2016 | | | | | | | | | | | | 0.00 | | | | 0.01 | |
| | FIXED | | | 3.10 | | | | 1994 | | | | 2016 | | | | | | | | | | | | 0.03 | | | | 0.04 | |
| | | | | | | | |
| | | | | | | | | | | | | | | | | 6.59 | | | | 8.91 | | | | 1.23 | | | | 1.66 | |
| | | | | | | | | | | | | | | | | | | | | | | | | | | | | | |
| | FIXED | | | 3.30 | | | | 1994 | | | | 2014 | | | | | | | | | | | | 0.14 | | | | 0.19 | |
| | FIXED | | | 3.30 | | | | 1994 | | | | 2016 | | | | | | | | | | | | 0.39 | | | | 0.52 | |
| | FIXED | | | 3.30 | | | | 1994 | | | | 2016 | | | | | | | | | | | | 0.30 | | | | 0.40 | |
| | FIXED | | | 3.30 | | | | 1994 | | | | 2016 | | | | | | | | | | | | 0.04 | | | | 0.05 | |
| | FIXED | | | 3.30 | | | | 1994 | | | | 2017 | | | | | | | | | | | | 0.01 | | | | 0.01 | |
| | FIXED | | | 3.30 | | | | 1994 | | | | 2017 | | | | | | | | | | | | 0.09 | | | | 0.13 | |
| | FIXED | | | 3.30 | | | | 1994 | | | | 2017 | | | | | | | | | | | | 0.01 | | | | 0.01 | |
| | FIXED | | | 3.30 | | | | 1994 | | | | 2018 | | | | | | | | | | | | 0.26 | | | | 0.35 | |
| | | | | | | | |
| | | | | | | | | | | | | | | | | 5.16 | | | | 6.98 | | | | 2.56 | | | | 3.46 | |
| | | | | | | | | | | | | | | | | | | | | | | | | | | | | | |
T-2
GUARANTEED EXTERNAL DEBT OF THE REPUBLIC OF THE PHILIPPINES(1)
AS OF SEPTEMBER 30, 2013
(In millions)
| | | | | | | | | | | | | | | | | | | | | | | | | | | | | | |
Currency | | Interest Rate Basis | | Interest Rate +
Spread/
Service Charge
(Per Annum) | | | | | | | | | Original Amount
Contracted | | | Outstanding Balance
as of September 30,
2013 | |
| | | | Year
Contracted | | | Year of
Maturity | | | (in Original
Currency) | | | (in US
Dollars)(2) | | | (in Original
Currency) | | | (in US
Dollars)(2) | |
| | FIXED | | | 1.50 | | | | 1996 | | | | 2021 | | | | | | | | | | | | 0.58 | | | | 0.78 | |
| | FIXED | | | 1.50 | | | | 1996 | | | | 2022 | | | | | | | | | | | | 0.32 | | | | 0.44 | |
| | FIXED | | | 1.50 | | | | 1996 | | | | 2023 | | | | | | | | | | | | 0.57 | | | | 0.77 | |
| | FIXED | | | 1.50 | | | | 1996 | | | | 2023 | | | | | | | | | | | | 0.84 | | | | 1.13 | |
| | FIXED | | | 1.50 | | | | 1996 | | | | 2024 | | | | | | | | | | | | 0.25 | | | | 0.34 | |
| | | | | | | | |
| | | | | | | | | | | | | | | | | 10.50 | | | | 14.20 | | | | 10.50 | | | | 14.20 | |
| | | | | | | | | | | | | | | | | | | | | | | | | | | | | | |
| | FIXED | | | 0.40 | | | | 2006 | | | | 2032 | | | | | | | | | | | | 3.33 | | | | 4.50 | |
| | FIXED | | | 0.40 | | | | 2006 | | | | 2032 | | | | | | | | | | | | 0.10 | | | | 0.13 | |
| | FIXED | | | 0.40 | | | | 2006 | | | | 2033 | | | | | | | | | | | | 0.87 | | | | 1.18 | |
| | FIXED | | | 0.40 | | | | 2006 | | | | 2033 | | | | | | | | | | | | 1.59 | | | | 2.16 | |
| | FIXED | | | 0.40 | | | | 2006 | | | | 2033 | | | | | | | | | | | | 1.63 | | | | 2.21 | |
| | FIXED | | | 0.40 | | | | 2006 | | | | 2033 | | | | | | | | | | | | 0.47 | | | | 0.63 | |
| | FIXED | | | 0.40 | | | | 2006 | | | | 2034 | | | | | | | | | | | | 0.87 | | | | 1.17 | |
| | FIXED | | | 0.40 | | | | 2006 | | | | 2034 | | | | | | | | | | | | 0.21 | | | | 0.28 | |
| | FIXED | | | 0.40 | | | | 2006 | | | | 2034 | | | | | | | | | | | | 0.33 | | | | 0.44 | |
| | FIXED | | | 0.40 | | | | 2006 | | | | 2034 | | | | | | | | | | | | 0.30 | | | | 0.40 | |
| | FIXED | | | 0.40 | | | | 2006 | | | | 2035 | | | | | | | | | | | | 0.81 | | | | 1.09 | |
| | | | | | | | |
| | FIXED | | | 5.09 | | | | 2006 | | | | 2019 | | | | 7.80 | | | | 10.55 | | | | 4.68 | | | | 6.33 | |
| | LIBOR 6 MONTHS | | | 2.00 | | | | 2000 | | | | 2018 | | | | 7.81 | | | | 10.56 | | | | 2.60 | | | | 3.52 | |
| | FIXED | | | 2.99 | | | | 2007 | | | | 2025 | | | | 2.54 | | | | 3.43 | | | | 2.33 | | | | 3.15 | |
| | FIXED | | | 2.00 | | | | 1979 | | | | 2015 | | | | 18.30 | | | | 24.75 | | | | 0.68 | | | | 0.91 | |
| | FIXED | | | 2.00 | | | | 1981 | | | | 2015 | | | | 7.93 | | | | 10.72 | | | | 0.26 | | | | 0.35 | |
| | FIXED | | | 2.00 | | | | 1988 | | | | 2018 | | | | 23.52 | | | | 31.81 | | | | 5.88 | | | | 7.95 | |
| | | | | | | | |
| | | | | | | | | | | | | | | | | 37.22 | | | | 50.34 | | | | 24.06 | | | | 32.53 | |
| | | | | | | | | | | | | | | | | | | | | | | | | | | | | | |
| | FIXED | | | 0.75 | | | | 1992 | | | | 2032 | | | | | | | | | | | | 19.12 | | | | 25.85 | |
| | FIXED | | | 0.75 | | | | 1992 | | | | 2036 | | | | | | | | | | | | 4.94 | | | | 6.68 | |
| | | | | | | | |
| | FIXED | | | 0.75 | | | | 1991 | | | | 2031 | | | | 8.82 | | | | 11.93 | | | | 0.85 | | | | 1.15 | |
| | FIXED | | | 2.00 | | | | 1993 | | | | 2023 | | | | 15.54 | | | | 21.02 | | | | 9.14 | | | | 12.37 | |
| | FIXED | | | 0.75 | | | | 1993 | | | | 2033 | | | | 30.68 | | | | 41.49 | | | | 22.73 | | | | 30.73 | |
| | | | | | | | |
| | | | | | | | | | | | | | | | | 25.61 | | | | 34.64 | | | | 19.77 | | | | 26.74 | |
| | | | | | | | | | | | | | | | | | | | | | | | | | | | | | |
| | FIXED | | | 2.00 | | | | 1995 | | | | 2025 | | | | | | | | | | | | 0.04 | | | | 0.05 | |
| | FIXED | | | 0.75 | | | | 1995 | | | | 2035 | | | | | | | | | | | | 19.74 | | | | 26.69 | |
| | | | | | | | |
| | FIXED | | | 0.75 | | | | 1999 | | | | 2039 | | | | 25.56 | | | | 34.57 | | | | 11.29 | | | | 15.27 | |
| | FIXED | | | 0.75 | | | | 1996 | | | | 2036 | | | | 4.70 | | | | 6.36 | | | | 3.69 | | | | 4.99 | |
| | FIXED | | | 0.75 | | | | 1995 | | | | 2035 | | | | 13.65 | | | | 18.46 | | | | 10.60 | | | | 14.33 | |
| | FIXED | | | 0.75 | | | | 2004 | | | | 2044 | | | | 5.11 | | | | 6.91 | | | | 5.11 | | | | 6.91 | |
| | FIXED | | | 0.75 | | | | 2004 | | | | 2045 | | | | 5.29 | | | | 7.15 | | | | 5.29 | | | | 7.15 | |
| | FIXED | | | 0.75 | | | | 1999 | | | | 2039 | | | | 14.70 | | | | 19.88 | | | | 12.90 | | | | 17.44 | |
| | FIXED | | | 0.75 | | | | 2011 | | | | 2049 | | | | 10.20 | | | | 13.79 | | | | 0.62 | | | | 0.83 | |
| | FIXED | | | 0.75 | | | | 2000 | | | | 2040 | | | | 9.36 | | | | 12.65 | | | | 8.58 | | | | 11.60 | |
| | FIXED | | | 0.75 | | | | 2004 | | | | 2043 | | | | 7.50 | | | | 10.14 | | | | 7.50 | | | | 10.14 | |
| | FIXED | | | 0.75 | | | | 2005 | | | | 2045 | | | | 11.70 | | | | 15.82 | | | | 11.70 | | | | 15.82 | |
| | FIXED | | | 0.75 | | | | 2005 | | | | 2045 | | | | 15.00 | | | | 20.28 | | | | 15.00 | | | | 20.28 | |
| | FIXED | | | 0.75 | | | | 2007 | | | | 2047 | | | | 4.74 | | | | 6.41 | | | | 4.74 | | | | 6.41 | |
| | FIXED | | | 0.75 | | | | 2010 | | | | 2050 | | | | 7.00 | | | | 9.47 | | | | 6.93 | | | | 9.37 | |
| | | | | | | |
KOREAN WON | | | | | | | | | | | | | | | 53,156.00 | | | | 49.49 | | | | 37,441.83 | | | | 34.86 | |
| | | | | | | | | | | | | | | | | | | | | | | | | | | | | | |
| | FIXED | | | 3.50 | | | | 1995 | | | | 2017 | | | | 8,645.00 | | | | 8.05 | | | | 2,077.17 | | | | 1.93 | |
| | FIXED | | | 3.50 | | | | 1995 | | | | 2018 | | | | 11,322.00 | | | | 10.54 | | | | 2,181.50 | | | | 2.03 | |
| | FIXED | | | 2.50 | | | | 2004 | | | | 2034 | | | | 33,189.00 | | | | 30.90 | | | | 33,183.16 | | | | 30.89 | |
| | | | | | | |
JAPANESE YEN | | | | | | | | | | | | | | | 517,052.49 | | | | 5,263.08 | | | | 291,333.82 | | | | 2,965.49 | |
| | | | | | | | | | | | | | | | | | | | | | | | | | | | | | |
T-3
GUARANTEED EXTERNAL DEBT OF THE REPUBLIC OF THE PHILIPPINES(1)
AS OF SEPTEMBER 30, 2013
(In millions)
| | | | | | | | | | | | | | | | | | | | | | | | | | | | | | |
Currency | | Interest Rate Basis | | Interest Rate +
Spread/
Service Charge
(Per Annum) | | | | | | | | | Original Amount
Contracted | | | Outstanding Balance
as of September 30,
2013 | |
| | | | Year
Contracted | | | Year of
Maturity | | | (in Original
Currency) | | | (in US
Dollars)(2) | | | (in Original
Currency) | | | (in US
Dollars)(2) | |
| | TOKYO FLOATING RATE | | | 1.41 | | | | 2001 | | | | 2020 | | | | 2,400.00 | | | | 24.43 | | | | 1,120.00 | | | | 11.40 | |
| | | | | | | | |
| | | | | | | | | | | | | | | | | 4,117.25 | | | | 41.91 | | | | 3,220.88 | | | | 32.79 | |
| | | | | | | | | | | | | | | | | | | | | | | | | | | | | | |
| | FIXED | | | 2.57 | | | | 2004 | | | | 2022 | | | | | | | | | | | | 296.44 | | | | 3.02 | |
| | FIXED | | | 2.28 | | | | 2004 | | | | 2022 | | | | | | | | | | | | 413.61 | | | | 4.21 | |
| | FIXED | | | 2.30 | | | | 2004 | | | | 2023 | | | | | | | | | | | | 318.78 | | | | 3.24 | |
| | FIXED | | | 2.18 | | | | 2004 | | | | 2023 | | | | | | | | | | | | 268.25 | | | | 2.73 | |
| | FIXED | | | 1.95 | | | | 2004 | | | | 2023 | | | | | | | | | | | | 317.03 | | | | 3.23 | |
| | FIXED | | | 2.03 | | | | 2004 | | | | 2023 | | | | | | | | | | | | 1,383.67 | | | | 14.08 | |
| | EIBOR | | | 6.94 | | | | 2004 | | | | 2018 | | | | | | | | | | | | 223.11 | | | | 2.27 | |
| | ADB FLOATING RATE | | | 1.94 | | | | 1989 | | | | 2014 | | | | 9,378.63 | | | | 95.47 | | | | 1,940.43 | | | | 19.75 | |
| | ADB FLOATING RATE | | | 1.94 | | | | 1992 | | | | 2016 | | | | 947.44 | | | | 9.64 | | | | 381.44 | | | | 3.88 | |
| | LIBOR 6 MONTHS | | | 1.54 | | | | 2000 | | | | 2015 | | | | 2,166.70 | | | | 22.05 | | | | 270.36 | | | | 2.75 | |
| | LIBOR 6 MONTHS | | | 0.69 | | | | 2000 | | | | 2014 | | | | 314.75 | | | | 3.20 | | | | 7.85 | | | | 0.08 | |
| | LIBOR 6 MONTHS | | | 0.44 | | | | 2002 | | | | 2026 | | | | 3,676.05 | | | | 37.42 | | | | 1,808.76 | | | | 18.41 | |
| | LIBOR 6 MONTHS | | | 1.76 | | | | 2003 | | | | 2035 | | | | 3,318.55 | | | | 33.78 | | | | 1,816.24 | | | | 18.49 | |
| | LIBOR 6 MONTHS | | | 0.37 | | | | 2005 | | | | 2024 | | | | 2,746.63 | | | | 27.96 | | | | 2,105.87 | | | | 21.44 | |
| | LIBOR 6 MONTHS | | | 0.24 | | | | 2009 | | | | 2024 | | | | 4,520.78 | | | | 46.02 | | | | 823.74 | | | | 8.38 | |
| | JAPAN PRIME RATE | | | 0.52 | | | | 1996 | | | | 2016 | | | | 9,090.40 | | | | 92.53 | | | | 715.17 | | | | 7.28 | |
| | | | | | | | |
| | | | | | | | | | | | | | | | | 3,717.90 | | | | 37.84 | | | | 564.77 | | | | 5.75 | |
| | | | | | | | | | | | | | | | | | | | | | | | | | | | | | |
| | FIXED | | | 1.87 | | | | 2001 | | | | 2021 | | | | | | | | | | | | 24.78 | | | | 0.25 | |
| | FIXED | | | 1.75 | | | | 2001 | | | | 2021 | | | | | | | | | | | | 37.11 | | | | 0.38 | |
| | FIXED | | | 2.31 | | | | 2001 | | | | 2021 | | | | | | | | | | | | 40.96 | | | | 0.42 | |
| | FIXED | | | 1.76 | | | | 2001 | | | | 2021 | | | | | | | | | | | | 44.01 | | | | 0.45 | |
| | FIXED | | | 1.82 | | | | 2001 | | | | 2021 | | | | | | | | | | | | 49.81 | | | | 0.51 | |
| | FIXED | | | 1.98 | | | | 2001 | | | | 2021 | | | | | | | | | | | | 18.64 | | | | 0.19 | |
| | FIXED | | | 2.34 | | | | 2001 | | | | 2021 | | | | | | | | | | | | 52.18 | | | | 0.53 | |
| | FIXED | | | 2.08 | | | | 2001 | | | | 2021 | | | | | | | | | | | | 40.17 | | | | 0.41 | |
| | FIXED | | | 2.23 | | | | 2001 | | | | 2021 | | | | | | | | | | | | 120.58 | | | | 1.23 | |
| | FIXED | | | 1.82 | | | | 2001 | | | | 2021 | | | | | | | | | | | | 83.60 | | | | 0.85 | |
| | FIXED | | | 1.96 | | | | 2001 | | | | 2021 | | | | | | | | | | | | 35.12 | | | | 0.36 | |
| | FIXED | | | 1.45 | | | | 2001 | | | | 2021 | | | | | | | | | | | | 12.21 | | | | 0.12 | |
| | FIXED | | | 1.51 | | | | 2001 | | | | 2021 | | | | | | | | | | | | 5.61 | | | | 0.06 | |
| | | | | | | | |
| | | | | | | | | | | | | | | | | 1,188.20 | | | | 12.09 | | | | 990.01 | | | | 10.08 | |
| | | | | | | | | | | | | | | | | | | | | | | | | | | | | | |
| | FIXED | | | 2.66 | | | | 2003 | | | | 2023 | | | | | | | | | | | | 9.90 | | | | 0.10 | |
| | FIXED | | | 2.11 | | | | 2003 | | | | 2023 | | | | | | | | | | | | 107.48 | | | | 1.09 | |
| | FIXED | | | 2.42 | | | | 2003 | | | | 2023 | | | | | | | | | | | | 73.78 | | | | 0.75 | |
| | FIXED | | | 2.16 | | | | 2003 | | | | 2023 | | | | | | | | | | | | 204.24 | | | | 2.08 | |
| | FIXED | | | 2.30 | | | | 2003 | | | | 2023 | | | | | | | | | | | | 251.36 | | | | 2.56 | |
| | FIXED | | | 2.16 | | | | 2003 | | | | 2023 | | | | | | | | | | | | 67.58 | | | | 0.69 | |
| | FIXED | | | 2.26 | | | | 2003 | | | | 2023 | | | | | | | | | | | | 136.94 | | | | 1.39 | |
| | FIXED | | | 1.73 | | | | 2003 | | | | 2023 | | | | | | | | | | | | 132.14 | | | | 1.35 | |
| | FIXED | | | 1.84 | | | | 2003 | | | | 2023 | | | | | | | | | | | | 6.59 | | | | 0.07 | |
| | LIBOR 6 MONTHS | | | 0.77 | | | | 2005 | | | | 2022 | | | | 6,592.00 | | | | 67.10 | | | | 3,061.22 | | | | 31.16 | |
| | LIBOR 6 MONTHS | | | 0.75 | | | | 2006 | | | | 2026 | | | | 11,710.00 | | | | 119.20 | | | | 7,119.31 | | | | 72.47 | |
| | | | | | | | |
| | | | | | | | | | | | | | | | | 3,572.30 | | | | 36.36 | | | | 1,227.57 | | | | 12.50 | |
| | | | | | | | | | | | | | | | | | | | | | | | | | | | | | |
| | FIXED | | | 3.23 | | | | 2009 | | | | 2033 | | | | | | | | | | | | 366.93 | | | | 3.73 | |
| | FIXED | | | 2.95 | | | | 2009 | | | | 2033 | | | | | | | | | | | | 212.58 | | | | 2.16 | |
| | FIXED | | | 3.10 | | | | 2009 | | | | 2033 | | | | | | | | | | | | 42.66 | | | | 0.43 | |
| | FIXED | | | 2.95 | | | | 2009 | | | | 2033 | | | | | | | | | | | | 121.56 | | | | 1.24 | |
| | FIXED | | | 2.80 | | | | 2009 | | | | 2033 | | | | | | | | | | | | 304.47 | | | | 3.10 | |
| | FIXED | | | 2.59 | | | | 2009 | | | | 2033 | | | | | | | | | | | | 152.78 | | | | 1.56 | |
| | FIXED | | | 2.79 | | | | 2009 | | | | 2033 | | | | | | | | | | | | 26.59 | | | | 0.27 | |
| | LIBOR 6 MONTHS | | | 1.37 | | | | 2011 | | | | 2027 | | | | 3,842.60 | | | | 39.11 | | | | 9.61 | | | | 0.10 | |
| | FIXED | | | 2.50 | | | | 1991 | | | | 2021 | | | | 30,084.00 | | | | 306.23 | | | | 11,740.10 | | | | 119.50 | |
| | FIXED | | | 2.50 | | | | 1992 | | | | 2022 | | | | 6,686.00 | | | | 68.06 | | | | 2,772.24 | | | | 28.22 | |
| | FIXED | | | 3.00 | | | | 1994 | | | | 2024 | | | | 22,500.00 | | | | 229.03 | | | | 12,621.92 | | | | 128.48 | |
| | FIXED | | | 3.00 | | | | 1994 | | | | 2024 | | | | 15,000.00 | | | | 152.69 | | | | 7,124.25 | | | | 72.52 | |
| | | | | | | | |
| | | | | | | | | | | | | | | | | 6,131.00 | | | | 62.41 | | | | 1,122.31 | | | | 11.42 | |
| | | | | | | | | | | | | | | | | | | | | | | | | | | | | | |
T-4
GUARANTEED EXTERNAL DEBT OF THE REPUBLIC OF THE PHILIPPINES(1)
AS OF SEPTEMBER 30, 2013
(In millions)
| | | | | | | | | | | | | | | | | | | | | | | | | | | | | | |
Currency | | Interest Rate Basis | | Interest Rate +
Spread/
Service Charge
(Per Annum) | | | | | | | | | Original Amount
Contracted | | | Outstanding Balance
as of September 30,
2013 | |
| | | | Year
Contracted | | | Year of
Maturity | | | (in Original
Currency) | | | (in US
Dollars)(2) | | | (in Original
Currency) | | | (in US
Dollars)(2) | |
| | FIXED | | | 2.50 | | | | 1995 | | | | 2025 | | | | | | | | | | | | 805.78 | | | | 8.20 | |
| | FIXED | | | 2.10 | | | | 1995 | | | | 2025 | | | | | | | | | | | | 316.54 | | | | 3.22 | |
| | | | | | | | |
| | | | | | | | | | | | | | | | | 1,352.00 | | | | 13.76 | | | | 790.49 | | | | 8.05 | |
| | | | | | | | | | | | | | | | | | | | | | | | | | | | | | |
| | FIXED | | | 2.50 | | | | 1995 | | | | 2025 | | | | | | | | | | | | 598.06 | | | | 6.09 | |
| | FIXED | | | 2.10 | | | | 1995 | | | | 2025 | | | | | | | | | | | | 192.43 | | | | 1.96 | |
| | | | | | | | |
| | | | | | | | | | | | | | | | | 12,315.00 | | | | 125.35 | | | | 7,195.20 | | | | 73.24 | |
| | | | | | | | | | | | | | | | | | | | | | | | | | | | | | |
| | FIXED | | | 2.70 | | | | 1995 | | | | 2025 | | | | | | | | | | | | 6,369.74 | | | | 64.84 | |
| | FIXED | | | 2.10 | | | | 1995 | | | | 2025 | | | | | | | | | | | | 825.46 | | | | 8.40 | |
| | | | | | | | |
| | | | | | | | | | | | | | | | | 24,712.00 | | | | 251.54 | | | | 12,552.63 | | | | 127.77 | |
| | | | | | | | | | | | | | | | | | | | | | | | | | | | | | |
| | FIXED | | | 2.70 | | | | 1996 | | | | 2026 | | | | | | | | | | | | 8,922.35 | | | | 90.82 | |
| | FIXED | | | 2.30 | | | | 1996 | | | | 2026 | | | | | | | | | | | | 3,630.28 | | | | 36.95 | |
| | | | | | | | |
| | | | | | | | | | | | | | | | | 10,494.00 | | | | 106.82 | | | | 6,396.35 | | | | 65.11 | |
| | | | | | | | | | | | | | | | | | | | | | | | | | | | | | |
| | FIXED | | | 2.70 | | | | 1996 | | | | 2026 | | | | | | | | | | | | 6,243.90 | | | | 63.56 | |
| | FIXED | | | 2.30 | | | | 1996 | | | | 2026 | | | | | | | | | | | | 152.45 | | | | 1.55 | |
| | | | | | | | |
| | | | | | | | | | | | | | | | | 5,158.00 | | | | 52.50 | | | | 3,084.38 | | | | 31.40 | |
| | | | | | | | | | | | | | | | | | | | | | | | | | | | | | |
| | FIXED | | | 2.50 | | | | 1996 | | | | 2026 | | | | | | | | | | | | 2,988.08 | | | | 30.42 | |
| | FIXED | | | 2.10 | | | | 1996 | | | | 2026 | | | | | | | | | | | | 96.30 | | | | 0.98 | |
| | FIXED | | | 2.30 | | | | 1997 | | | | 2027 | | | | 876.00 | | | | 8.92 | | | | 331.13 | | | | 3.37 | |
| | | | | | | | |
| | | | | | | | | | | | | | | | | 7,228.00 | | | | 73.57 | | | | 2,780.70 | | | | 28.30 | |
| | | | | | | | | | | | | | | | | | | | | | | | | | | | | | |
| | FIXED | | | 2.50 | | | | 1997 | | | | 2027 | | | | | | | | | | | | 1,840.32 | | | | 18.73 | |
| | FIXED | | | 2.10 | | | | 1997 | | | | 2027 | | | | | | | | | | | | 940.38 | | | | 9.57 | |
| | | | | | | | |
| | | | | | | | | | | | | | | | | 1,034.00 | | | | 10.53 | | | | 525.37 | | | | 5.35 | |
| | | | | | | | | | | | | | | | | | | | | | | | | | | | | | |
| | FIXED | | | 2.50 | | | | 1997 | | | | 2027 | | | | | | | | | | | | 192.21 | | | | 1.96 | |
| | FIXED | | | 2.10 | | | | 1997 | | | | 2027 | | | | | | | | | | | | 333.15 | | | | 3.39 | |
| | | | | | | | |
| | | | | | | | | | | | | | | | | 2,746.00 | | | | 27.95 | | | | 352.11 | | | | 3.58 | |
| | | | | | | | | | | | | | | | | | | | | | | | | | | | | | |
| | FIXED | | | 2.50 | | | | 1997 | | | | 2027 | | | | | | | | | | | | 233.20 | | | | 2.37 | |
| | FIXED | | | 2.10 | | | | 1997 | | | | 2027 | | | | | | | | | | | | 118.91 | | | | 1.21 | |
| | | | | | | | |
| | | | | | | | | | | | | | | | | 14,555.00 | | | | 148.16 | | | | 10,553.14 | | | | 107.42 | |
| | | | | | | | | | | | | | | | | | | | | | | | | | | | | | |
| | FIXED | | | 2.20 | | | | 1998 | | | | 2028 | | | | | | | | | | | | 9,716.49 | | | | 98.90 | |
| | FIXED | | | 0.75 | | | | 1998 | | | | 2038 | | | | | | | | | | | | 836.65 | | | | 8.52 | |
| | | | | | | | |
| | | | | | | | | | | | | | | | | 19,990.00 | | | | 203.48 | | | | 14,219.02 | | | | 144.74 | |
| | | | | | | | | | | | | | | | | | | | | | | | | | | | | | |
| | FIXED | | | 2.20 | | | | 1998 | | | | 2028 | | | | | | | | | | | | 13,882.92 | | | | 141.31 | |
| | FIXED | | | 0.75 | | | | 1998 | | | | 2038 | | | | | | | | | | | | 336.10 | | | | 3.42 | |
| | | | | | | | |
| | | | | | | | | | | | | | | | | 6,072.00 | | | | 61.81 | | | | 4,621.33 | | | | 47.04 | |
| | | | | | | | | | | | | | | | | | | | | | | | | | | | | | |
| | FIXED | | | 2.20 | | | | 1998 | | | | 2028 | | | | | | | | | | | | 362.58 | | | | 3.69 | |
| | FIXED | | | 1.70 | | | | 1998 | | | | 2028 | | | | | | | | | | | | 2,569.65 | | | | 26.16 | |
| | FIXED | | | 0.75 | | | | 1998 | | | | 2038 | | | | | | | | | | | | 1,689.10 | | | | 17.19 | |
| | FIXED | | | 0.75 | | | | 1999 | | | | 2039 | | | | 35,350.00 | | | | 359.83 | | | | 30,635.91 | | | | 311.84 | |
| | FIXED | | | 0.75 | | | | 1999 | | | | 2039 | | | | 20,529.00 | | | | 208.96 | | | | 17,836.57 | | | | 181.56 | |
| | | | | | | | |
| | | | | | | | | | | | | | | | | 16,450.00 | | | | 167.44 | | | | 13,872.06 | | | | 141.20 | |
| | | | | | | | | | | | | | | | | | | | | | | | | | | | | | |
| | FIXED | | | 0.95 | | | | 2000 | | | | 2040 | | | | | | | | | | | | 12,576.87 | | | | 128.02 | |
| | FIXED | | | 0.75 | | | | 2000 | | | | 2040 | | | | | | | | | | | | 1,295.19 | | | | 13.18 | |
| | | | | | | | |
| | | | | | | | | | | | | | | | | 59,037.00 | | | | 600.94 | | | | 53,372.87 | | | | 543.28 | |
| | | | | | | | | | | | | | | | | | | | | | | | | | | | | | |
| | FIXED | | | 0.95 | | | | 2001 | | | | 2041 | | | | | | | | | | | | 50,287.05 | | | | 511.87 | |
| | FIXED | | | 0.75 | | | | 2001 | | | | 2041 | | | | | | | | | | | | 3,085.82 | | | | 31.41 | |
| | | | | | | | |
| | | | | | | | | | | | | | | | | 24,846.00 | | | | 252.91 | | | | 8,652.22 | | | | 88.07 | |
| | | | | | | | | | | | | | | | | | | | | | | | | | | | | | |
| | FIXED | | | 1.40 | | | | 2008 | | | | 2038 | | | | | | | | | | | | 2,243.73 | | | | 22.84 | |
| | FIXED | | | 0.65 | | | | 2008 | | | | 2048 | | | | | | | | | | | | 6,335.23 | | | | 64.49 | |
| | FIXED | | | 0.01 | | | | 2008 | | | | 2048 | | | | | | | | | | | | 73.26 | | | | 0.75 | |
| | | | | | | | |
| | | | | | | | | | | | | | | | | 14,608.00 | | | | 148.69 | | | | 8,748.85 | | | | 89.05 | |
| | | | | | | | | | | | | | | | | | | | | | | | | | | | | | |
T-5
GUARANTEED EXTERNAL DEBT OF THE REPUBLIC OF THE PHILIPPINES(1)
AS OF SEPTEMBER 30, 2013
(In millions)
| | | | | | | | | | | | | | | | | | | | | | | | | | | | | | |
Currency | | Interest Rate Basis | | Interest Rate +
Spread/
Service Charge
(Per Annum) | | | | | | | | | Original Amount
Contracted | | | Outstanding Balance
as of September 30,
2013 | |
| | | | Year
Contracted | | | Year of
Maturity | | | (in Original
Currency) | | | (in US
Dollars)(2) | | | (in Original
Currency) | | | (in US
Dollars)(2) | |
| | FIXED | | | 1.40 | | | | 2009 | | | | 2039 | | | | | | | | | | | | 2,285.55 | | | | 23.26 | |
| | FIXED | | | 0.65 | | | | 2009 | | | | 2049 | | | | | | | | | | | | 6,290.14 | | | | 64.03 | |
| | FIXED | | | 0.01 | | | | 2009 | | | | 2049 | | | | | | | | | | | | 173.16 | | | | 1.76 | |
| | | | | | | | |
| | | | | | | | | | | | | | | | | 30,380.00 | | | | 309.24 | | | | 16,122.21 | | | | 164.11 | |
| | | | | | | | | | | | | | | | | | | | | | | | | | | | | | |
| | FIXED | | | 1.40 | | | | 2009 | | | | 2039 | | | | | | | | | | | | 16,088.25 | | | | 163.76 | |
| | FIXED | | | 0.01 | | | | 2009 | | | | 2039 | | | | | | | | | | | | 33.96 | | | | 0.35 | |
| | FIXED | | | 3.50 | | | | 1994 | | | | 2014 | | | | 6,100.00 | | | | 62.09 | | | | 380.80 | | | | 3.88 | |
| | JAPAN PRIME RATE | | | 1.96 | | | | 1999 | | | | 2014 | | | | 26,000.00 | | | | 264.65 | | | | 1,952.55 | | | | 19.88 | |
| | JAPAN PRIME RATE | | | 2.73 | | | | 2003 | | | | 2022 | | | | 5,000.00 | | | | 50.90 | | | | 2,188.30 | | | | 22.27 | |
| | FIXED | | | 3.69 | | | | 2004 | | | | 2015 | | | | 6,768.41 | | | | 68.90 | | | | 1,518.06 | | | | 15.45 | |
| | JAPAN PRIME RATE | | | 1.54 | | | | 2008 | | | | 2028 | | | | 10,000.00 | | | | 101.79 | | | | 6,000.00 | | | | 61.07 | |
| | FIXED | | | 2.39 | | | | 2007 | | | | 2022 | | | | 5,593.50 | | | | 56.94 | | | | 4,087.56 | | | | 41.61 | |
| | | | |
SPECIAL DRAWING RIGHTS | | | | 15.50 | | | | 23.76 | | | | 4.09 | | | | 6.27 | |
| | | | | | | | | | | | | | | | | | | | | | | | | | | | | | |
| | FIXED | | | 0.75 | | | | 1995 | | | | 2034 | | | | 3.50 | | | | 5.36 | | | | 2.88 | | | | 4.41 | |
| | FIXED | | | 2.71 | | | | 1995 | | | | 2014 | | | | 7.00 | | | | 10.73 | | | | 0.70 | | | | 1.07 | |
| | FIXED | | | 0.75 | | | | 1998 | | | | 2038 | | | | 5.00 | | | | 7.66 | | | | 0.51 | | | | 0.78 | |
| | | | |
UNITED STATES DOLLAR | | | | 1,594.37 | | | | 1,594.37 | | | | 494.24 | | | | 494.24 | |
| | | | | | | | | | | | | | | | | | | | | | | | | | | | | | |
| | FIXED | | | 1.25 | | | | 1993 | | | | 2023 | | | | 24.50 | | | | 24.50 | | | | 11.95 | | | | 11.95 | |
| | LIBOR 6 MONTHS | | | 1.70 | | | | 2000 | | | | 2018 | | | | 7.51 | | | | 7.51 | | | | 2.50 | | | | 2.50 | |
| | FIXED | | | 7.84 | | | | 2004 | | | | 2020 | | | | 15.42 | | | | 15.42 | | | | 10.82 | | | | 10.82 | |
| | LIBOR 6 MONTHS | | | 4.11 | | | | 2008 | | | | 2018 | | | | 90.00 | | | | 90.00 | | | | 62.30 | | | | 62.30 | |
| | FIXED | | | 3.00 | | | | 2010 | | | | 2034 | | | | 116.60 | | | | 116.60 | | | | 105.99 | | | | 105.99 | |
| | ADB FLOATING RATE | | | 4.95 | | | | 1993 | | | | 2018 | | | | 43.20 | | | | 43.20 | | | | 9.14 | | | | 9.14 | |
| | ADB FLOATING RATE | | | 4.95 | | | | 1995 | | | | 2020 | | | | 92.00 | | | | 92.00 | | | | 49.73 | | | | 49.73 | |
| | ADB FLOATING RATE | | | 4.95 | | | | 1997 | | | | 2021 | | | | 13.51 | | | | 13.51 | | | | 4.93 | | | | 4.93 | |
| | LIBOR 6 MONTHS | | | 0.67 | | | | 2002 | | | | 2021 | | | | 36.49 | | | | 36.49 | | | | 10.72 | | | | 10.72 | |
| | LIBOR 6 MONTHS | | | 0.65 | | | | 2003 | | | | 2022 | | | | 40.00 | | | | 40.00 | | | | 28.93 | | | | 28.93 | |
| | COST QUA. BOR. IBRD 6M | | | 7.29 | | | | 1994 | | | | 2014 | | | | 127.35 | | | | 127.35 | | | | 6.82 | | | | 6.82 | |
| | LIBOR 6 MONTHS | | | 0.71 | | | | 1994 | | | | 2014 | | | | 19.65 | | | | 19.65 | | | | 0.67 | | | | 0.67 | |
| | COST QUA. BOR. IBRD 6M | | | 4.88 | | | | 1994 | | | | 2014 | | | | 40.00 | | | | 40.00 | | | | 3.95 | | | | 3.95 | |
| | COST QUA. BOR. IBRD 6M | | | 4.85 | | | | 1994 | | | | 2014 | | | | 88.85 | | | | 88.85 | | | | 9.32 | | | | 9.32 | |
| | LIBOR 6 MONTHS | | | 0.69 | | | | 1994 | | | | 2014 | | | | 24.15 | | | | 24.15 | | | | 1.06 | | | | 1.06 | |
| | COST QUA. BOR. IBRD 6M | | | 1.32 | | | | 1995 | | | | 2015 | | | | 24.07 | | | | 24.07 | | | | 4.83 | | | | 4.83 | |
| | LIBOR 6 MONTHS | | | 0.69 | | | | 1995 | | | | 2015 | | | | 25.93 | | | | 25.93 | | | | 5.21 | | | | 5.21 | |
| | LIBOR 6 MONTHS | | | 0.69 | | | | 1995 | | | | 2015 | | | | 50.00 | | | | 50.00 | | | | 6.71 | | | | 6.71 | |
| | COST QUA. BOR. IBRD 6M | | | 7.29 | | | | 1996 | | | | 2016 | | | | 33.90 | | | | 33.90 | | | | 8.31 | | | | 8.31 | |
| | COST QUA. BOR. IBRD 6M | | | 0.71 | | | | 1996 | | | | 2016 | | | | 150.00 | | | | 150.00 | | | | 26.08 | | | | 26.08 | |
| | COST QUA. BOR. IBRD 6M | | | 7.29 | | | | 1996 | | | | 2016 | | | | 57.00 | | | | 57.00 | | | | 9.64 | | | | 9.64 | |
| | LIBOR 6 MONTHS | | | 0.75 | | | | 1997 | | | | 2017 | | | | 60.00 | | | | 60.00 | | | | 7.79 | | | | 7.79 | |
| | LIBOR 6 MONTHS | | | 0.77 | | | | 1998 | | | | 2018 | | | | 150.00 | | | | 150.00 | | | | 69.11 | | | | 69.11 | |
| | LIBOR 6 MONTHS | | | 0.69 | | | | 1999 | | | | 2017 | | | | 36.30 | | | | 36.30 | | | | 4.76 | | | | 4.76 | |
| | LIBOR 6 MONTHS | | | 0.51 | | | | 2008 | | | | 2025 | | | | 12.94 | | | | 12.94 | | | | 11.40 | | | | 11.40 | |
| | FIXED | | | 4.00 | | | | 1995 | | | | 2016 | | | | 10.00 | | | | 10.00 | | | | 1.87 | | | | 1.87 | |
| | FIXED | | | 4.00 | | | | 1995 | | | | 2017 | | | | 5.00 | | | | 5.00 | | | | 1.25 | | | | 1.25 | |
| | U.S. PRIME RATE | | | 2.07 | | | | 1999 | | | | 2014 | | | | 200.00 | | | | 200.00 | | | | 18.46 | | | | 18.46 | |
| | | | | | | |
B. BONDS | | | | | | | | | | | | | | | | | | | 4,360.70 | | | | | | | | 4,029.72 | |
| | | | | | | | | | | | | | | | | | | | | | | | | | | | | | |
| | | | | | | |
UNITED STATES DOLLAR | | | | | | | | | | | | | | | 3,610.00 | | | | 3,610.00 | | | | 3,279.02 | | | | 3,279.02 | |
| | FIXED | | | 8.40 | | | | 1996 | | | | 2016 | | | | 360.00 | | | | 360.00 | | | | 160.00 | | | | 160.00 | |
| | FIXED | | | 9.63 | | | | 1998 | | | | 2028 | | | | 300.00 | | | | 300.00 | | | | 300.00 | | | | 300.00 | |
| | FIXED | | | 5.40 | | | | 2003 | | | | 2018 | | | | 250.00 | | | | 250.00 | | | | 119.04 | | | | 119.04 | |
| | FIXED | | | 6.88 | | | | 2006 | | | | 2016 | | | | 500.00 | | | | 500.00 | | | | 500.00 | | | | 500.00 | |
| | FIXED | | | 7.25 | | | | 2009 | | | | 2019 | | | | 1,000.00 | | | | 1,000.00 | | | | 1,000.00 | | | | 1,000.00 | |
| | FIXED | | | 7.39 | | | | 2009 | | | | 2024 | | | | 600.00 | | | | 600.00 | | | | 600.00 | | | | 600.00 | |
| | FIXED | | | 7.25 | | | | 2009 | | | | 2019 | | | | 20.99 | | | | 20.99 | | | | 20.98 | | | | 20.98 | |
| | FIXED | | | 7.39 | | | | 2009 | | | | 2024 | | | | 579.01 | | | | 579.01 | | | | 579.00 | | | | 579.00 | |
| | | | | | | |
JAPANESE YEN | | | | | | | | | | | | | | | 73,750.00 | | | | 750.70 | | | | 73,750.00 | | | | 750.70 | |
| | | | | | | | | | | | | | | | | | | | | | | | | | | | | | |
| | FIXED | | | 4.65 | | | | 1995 | | | | 2015 | | | | 12,000.00 | | | | 122.15 | | | | 12,000.00 | | | | 122.15 | |
| | FIXED | | | 3.20 | | | | 2002 | | | | 2020 | | | | 24,750.00 | | | | 251.93 | | | | 24,750.00 | | | | 251.93 | |
| | FIXED | | | 3.50 | | | | 2002 | | | | 2022 | | | | 37,000.00 | | | | 376.62 | | | | 37,000.00 | | | | 376.62 | |
T-6
GUARANTEED EXTERNAL DEBT OF THE REPUBLIC OF THE PHILIPPINES(1)
AS OF SEPTEMBER 30, 2013
(In millions)
| | | | | | | | | | | | | | | | | | | | | | | | | | |
Currency | | Interest Rate Basis | | Interest Rate +
Spread/
Service Charge
(Per Annum) | | | | | | | Original Amount
Contracted | | | Outstanding Balance
as of September 30,
2013 | |
| | | | Year
Contracted | | | Year of
Maturity | | (in Original
Currency) | | | (in US
Dollars)(2) | | | (in Original
Currency) | | | (in US
Dollars)(2) | |
| | | |
II. GFI GUARANTEE ASSUMED BY NATIONAL GOVERNMENT | | | | 85.66 | | | | | | | | 85.65 | |
| | | | | | | | | | | | | | | | | | | | | | | | | | |
| | | | | | | |
SAUDI RIAL | | | | | | | | | | | 27.34 | | | | 7.29 | | | | 27.34 | | | | 7.29 | |
| | | | | | | | | | | | | | | | | | | | | | | | | | |
| | INTEREST FREE | | | | | 1986 | | | Upon
Demand | | | 5.92 | | | | 1.58 | | | | 5.92 | | | | 1.58 | |
| | INTEREST FREE | | | | | 1986 | | | Upon
Demand | | | 18.46 | | | | 4.92 | | | | 18.46 | | | | 4.92 | |
| | INTEREST FREE | | | | | 1986 | | | Upon
Demand | | | 2.96 | | | | 0.79 | | | | 2.96 | | | | 0.79 | |
| | | | | | | |
UNITED STATES DOLLAR | | | | | | | | | | | 77.64 | | | | 77.64 | | | | 77.64 | | | | 77.64 | |
| | | | | | | | | | | | | | | | | | | | | | | | | | |
| | | | | | | | | | | | | | | | | | | | | | | | | | |
| | INTEREST FREE | | | | | 1986 | | | Upon
Demand | | | 7.51 | | | | 7.51 | | | | 7.51 | | | | 7.51 | |
| | INTEREST FREE | | | | | 1986 | | | Upon
Demand | | | 0.72 | | | | 0.72 | | | | 0.72 | | | | 0.72 | |
| | INTEREST FREE | | | | | 1986 | | | Upon
Demand | | | 2.18 | | | | 2.18 | | | | 2.18 | | | | 2.18 | |
| | INTEREST FREE | | | | | 1986 | | | Upon
Demand | | | 33.09 | | | | 33.09 | | | | 33.09 | | | | 33.09 | |
| | INTEREST FREE | | | | | 1986 | | | Upon
Demand | | | 18.60 | | | | 18.60 | | | | 18.60 | | | | 18.60 | |
| | INTEREST FREE | | | | | 1986 | | | Upon
Demand | | | 0.51 | | | | 0.51 | | | | 0.51 | | | | 0.51 | |
| | INTEREST FREE | | | | | 1986 | | | Upon
Demand | | | 5.22 | | | | 5.22 | | | | 5.22 | | | | 5.22 | |
| | INTEREST FREE | | | | | 1986 | | | Upon
Demand | | | 8.33 | | | | 8.33 | | | | 8.33 | | | | 8.33 | |
| | INTEREST FREE | | | | | 1986 | | | Upon
Demand | | | 0.97 | | | | 0.97 | | | | 0.97 | | | | 0.97 | |
| | INTEREST FREE | | | | | 1986 | | | Upon
Demand | | | 0.52 | | | | 0.52 | | | | 0.52 | | | | 0.52 | |
| | | | | | | |
POUNDS STERLING | | | | | | | | | | | | | | | | | | | | | | | | |
| | INTEREST FREE | | | | | 1986 | | | Upon
Demand | | | 0.00 | | | | 0.00 | | | | 0.00 | | | | 0.00 | |
| | | | | | | |
EURO | | | | | | | | | | | | | | | | | | | | | | | | |
| | INTEREST FREE | | | | | 1986 | | | Upon
Demand | | | 0.33 | | | | 0.45 | | | | 0.33 | | | | 0.44 | |
| | | | | | | |
CANADIAN DOLLAR | | | | | | | | | | | | | | | | | | | | | | | | |
| | INTEREST FREE | | | | | 1986 | | | Upon
Demand | | | 0.27 | | | | 0.26 | | | | 0.27 | | | | 0.26 | |
| | | | | | | |
JAPANESE YEN | | | | | | | | | | | | | | | | | | | | | | | | |
| | INTEREST FREE | | | | | 1986 | | | Upon
Demand | | | 2.74 | | | | 0.03 | | | | 2.74 | | | | 0.03 | |
| (1) | Includes Government guarantee on GOCC (loans and bonds) and GFI guarantee assumed by the Government per Proc. 50. |
| (2) | Amount in original currencies were converted to US Dollars using BSP reference rates on September 30, 2013. |
T-7
EXTERNAL DEBT OF THE REPUBLIC OF THE PHILIPPINES(1)
As of September 30, 2013
(In millions)
| | | | | | | | | | | | | | | | | | | | | | | | | | | | | | |
Currency | | Interest Rate Basis | | Interest Rate +
Spread/
Service Charge
(Per Annum) | | | | | | | | | Original Amount
Contracted | | | Outstanding Balance
as of September 30,
2013 | |
| | | | Year
Contracted | | | Year of
Maturity | | | (In Original
Currency) | | | (In US
Dollars)(2) | | | (In Original
Currency) | | | (In US
Dollars)(2) | |
GRAND TOTAL | | | | | | | | | | | | | | | | | | | 65,783.37 | | | | | | | | 44,569.70 | |
| | | | | | | | | | | | | | | | | | | | | | | | | | | | | | |
I. DIRECT LOANS | | | | | | | | | | | | | | | | | | | 32,768.52 | | | | | | | | 16,366.96 | |
| | | | | | | | | | | | | | | | | | | | | | | | | | | | | | |
A. AVAILED OF BY GOVERNMENT AGENCIES | | | | | | | | 30,478.47 | | | | | | | | 15,392.70 | |
| | | | | | | | | | | | | | | | | | | | | | | | | | | | | | |
| | | | | | | |
CANADIAN DOLLARS | | | | | | | | | | | | | | | 6.33 | | | | 6.15 | | | | 1.07 | | | | 1.04 | |
| | | | | | | | | | | | | | | | | | | | | | | | | | | | | | |
| | INTEREST FREE | | | | | | | 1974 | | | | 2024 | | | | 6.33 | | | | 6.15 | | | | 1.07 | | | | 1.04 | |
| | | | | | | |
SWISS FRANCS | | | | | | | | | | | | | | | 94.89 | | | | 104.79 | | | | 9.37 | | | | 10.35 | |
| | | | | | | | | | | | | | | | | | | | | | | | | | | | | | |
| | SWITZERLAND PRIME RATE | | | 0.74 | | | | 2001 | | | | 2014 | | | | 94.89 | | | | 104.79 | | | | 9.37 | | | | 10.35 | |
| | | | | | | |
CHINA YUAN | | | | | | | | | | | | | | | 1,200.00 | | | | 196.07 | | | | 1,026.01 | | | | 167.64 | |
| | | | | | | | | | | | | | | | | | | | | | | | | | | | | | |
| | FIXED | | | 2.00 | | | | 2006 | | | | 2026 | | | | 400.00 | | | | 65.36 | | | | 332.68 | | | | 54.36 | |
| | FIXED | | | 2.00 | | | | 2007 | | | | 2027 | | | | 800.00 | | | | 130.71 | | | | 693.33 | | | | 113.29 | |
| | | | | | | | |
EURO | | | | | | | | | | | | | | | | | 730.42 | | | | 987.75 | | | | 503.86 | | | | 681.37 | |
| | | | | | | | | | | | | | | | | | | | | | | | | | | | | | |
| | FIXED | | | 2.00 | | | | 1984 | | | | 2014 | | | | 6.90 | | | | 9.33 | | | | 0.51 | | | | 0.68 | |
| | FIXED | | | 2.00 | | | | 1984 | | | | 2014 | | | | 8.44 | | | | 11.41 | | | | 0.62 | | | | 0.84 | |
| | FIXED | | | 2.00 | | | | 1990 | | | | 2020 | | | | 3.37 | | | | 4.56 | | | | 1.27 | | | | 1.71 | |
| | FIXED | | | 0.75 | | | | 2002 | | | | 2042 | | | | 7.39 | | | | 9.99 | | | | 6.50 | | | | 8.78 | |
| | FIXED | | | 0.75 | | | | 2002 | | | | 2042 | | | | 7.46 | | | | 10.09 | | | | 7.14 | | | | 9.65 | |
| | FIXED | | | 6.10 | | | | 2002 | | | | 2014 | | | | 5.83 | | | | 7.88 | | | | 0.87 | | | | 1.18 | |
| | FIXED | | | 0.75 | | | | 2007 | | | | 2047 | | | | 10.00 | | | | 13.52 | | | | 5.63 | | | | 7.62 | |
| | FIXED | | | 0.75 | | | | 2008 | | | | 2048 | | | | 4.00 | | | | 5.41 | | | | 2.81 | | | | 3.80 | |
| | FIXED | | | 1.50 | | | | 1995 | | | | 2015 | | | | 8.12 | | | | 10.97 | | | | 1.62 | | | | 2.19 | |
| | FIXED | | | 4.00 | | | | 1997 | | | | 2013 | | | | 14.52 | | | | 19.64 | | | | 0.00 | | | | 0.00 | |
| | FIXED | | | 4.50 | | | | 1998 | | | | 2019 | | | | 15.06 | | | | 20.37 | | | | 7.53 | | | | 10.18 | |
| | FIXED | | | 4.50 | | | | 1999 | | | | 2022 | | | | 58.69 | | | | 79.37 | | | | 53.10 | | | | 71.81 | |
| | INTEREST FREE | | | | | | | 2000 | | | | 2016 | | | | 8.48 | | | | 11.47 | | | | 1.57 | | | | 2.12 | |
| | FIXED | | | 4.00 | | | | 2000 | | | | 2023 | | | | 31.25 | | | | 42.26 | | | | 26.04 | | | | 35.22 | |
| | FIXED | | | 4.40 | | | | 2001 | | | | 2024 | | | | 23.99 | | | | 32.44 | | | | 22.99 | | | | 31.09 | |
| | FIXED | | | 3.65 | | | | 2002 | | | | 2024 | | | | 24.19 | | | | 32.71 | | | | 23.18 | | | | 31.34 | |
| | FIXED | | | 1.00 | | | | 2012 | | | | 2031 | | | | 20.49 | | | | 27.71 | | | | 17.12 | | | | 23.16 | |
| | FIXED | | | 3.45 | | | | 2002 | | | | 2024 | | | | 18.17 | | | | 24.57 | | | | 18.17 | | | | 24.57 | |
| | EIBOR | | | 0.97 | | | | 2002 | | | | 2016 | | | | 14.60 | | | | 19.74 | | | | 4.38 | | | | 5.92 | |
| | FIXED | | | 3.00 | | | | 1988 | | | | 2020 | | | | 4.34 | | | | 5.88 | | | | 1.63 | | | | 2.20 | |
| | FIXED | | | 3.00 | | | | 1988 | | | | 2019 | | | | 1.45 | | | | 1.96 | | | | 0.49 | | | | 0.66 | |
| | FIXED | | | 2.50 | | | | 1990 | | | | 2021 | | | | 4.43 | | | | 5.99 | | | | 2.02 | | | | 2.73 | |
| | FIXED | | | 2.50 | | | | 1990 | | | | 2021 | | | | 4.15 | | | | 5.62 | | | | 1.94 | | | | 2.62 | |
| | FIXED | | | 2.50 | | | | 1990 | | | | 2021 | | | | 2.65 | | | | 3.59 | | | | 1.23 | | | | 1.66 | |
| | FIXED | | | 2.50 | | | | 1992 | | | | 2022 | | | | 1.02 | | | | 1.38 | | | | 0.53 | | | | 0.71 | |
| | FIXED | | | 2.00 | | | | 1990 | | | | 2022 | | | | 10.52 | | | | 14.22 | | | | 5.28 | | | | 7.14 | |
| | FIXED | | | 2.00 | | | | 1990 | | | | 2022 | | | | 0.73 | | | | 0.99 | | | | 0.37 | | | | 0.50 | |
| | FIXED | | | 2.00 | | | | 1990 | | | | 2022 | | | | 2.88 | | | | 3.90 | | | | 1.45 | | | | 1.96 | |
| | FIXED | | | 2.00 | | | | 1990 | | | | 2022 | | | | 0.76 | | | | 1.03 | | | | 0.36 | | | | 0.49 | |
| | FIXED | | | 2.00 | | | | 1990 | | | | 2022 | | | | 2.17 | | | | 2.93 | | | | 1.11 | | | | 1.50 | |
| | FIXED | | | 3.30 | | | | 1991 | | | | 2013 | | | | 11.19 | | | | 15.14 | | | | 1.23 | | | | 1.66 | |
| | FIXED | | | 3.30 | | | | 1991 | | | | 2014 | | | | 2.81 | | | | 3.79 | | | | 0.25 | | | | 0.34 | |
| | FIXED | | | 3.30 | | | | 1991 | | | | 2014 | | | | 1.59 | | | | 2.14 | | | | 0.12 | | | | 0.16 | |
| | FIXED | | | 3.50 | | | | 1992 | | | | 2015 | | | | 2.29 | | | | 3.09 | | | | 0.38 | | | | 0.52 | |
| | FIXED | | | 3.50 | | | | 1992 | | | | 2016 | | | | 0.76 | | | | 1.03 | | | | 0.16 | | | | 0.22 | |
| | FIXED | | | 3.50 | | | | 1992 | | | | 2017 | | | | 7.58 | | | | 10.25 | | | | 0.26 | | | | 0.35 | |
| | FIXED | | | 3.10 | | | | 1993 | | | | 2014 | | | | 6.46 | | | | 8.74 | | | | 0.86 | | | | 1.16 | |
| | FIXED | | | 3.10 | | | | 1993 | | | | 2014 | | | | 12.20 | | | | 16.49 | | | | 1.80 | | | | 2.44 | |
| | FIXED | | | 3.10 | | | | 1993 | | | | 2015 | | | | 1.22 | | | | 1.64 | | | | 0.22 | | | | 0.29 | |
| | FIXED | | | 1.40 | | | | 1994 | | | | 2022 | | | | 2.69 | | | | 3.64 | | | | 1.35 | | | | 1.82 | |
| | FIXED | | | 1.40 | | | | 1994 | | | | 2021 | | | | 15.57 | | | | 21.05 | | | | 7.89 | | | | 10.67 | |
| | FIXED | | | 1.50 | | | | 1995 | | | | 2022 | | | | 1.92 | | | | 2.60 | | | | 0.91 | | | | 1.23 | |
| | FIXED | | | 1.50 | | | | 1995 | | | | 2023 | | | | 0.74 | | | | 1.01 | | | | 0.39 | | | | 0.53 | |
| | FIXED | | | 1.50 | | | | 1995 | | | | 2022 | | | | 3.66 | | | | 4.95 | | | | 1.85 | | | | 2.51 | |
| | FIXED | | | 6.67 | | | | 1995 | | | | 2014 | | | | 2.07 | | | | 2.79 | | | | 0.03 | | | | 0.04 | |
| | FIXED | | | 1.50 | | | | 1995 | | | | 2022 | | | | 3.10 | | | | 4.19 | | | | 2.09 | | | | 2.83 | |
| | FIXED | | | 1.50 | | | | 1997 | | | | 2023 | | | | 5.50 | | | | 7.43 | | | | 3.12 | | | | 4.22 | |
| | FIXED | | | 1.50 | | | | 1997 | | | | 2023 | | | | 9.14 | | | | 12.37 | | | | 4.20 | | | | 5.68 | |
| | FIXED | | | 0.47 | | | | 1998 | | | | 2029 | | | | 3.30 | | | | 4.46 | | | | 2.91 | | | | 3.93 | |
| | FIXED | | | 4.94 | | | | 1998 | | | | 2010 | | | | 0.77 | | | | 1.05 | | | | 0.00 | | | | 0.00 | |
| | FIXED | | | 0.47 | | | | 1998 | | | | 2029 | | | | 0.74 | | | | 1.00 | | | | 0.63 | | | | 0.86 | |
T-8
EXTERNAL DEBT OF THE REPUBLIC OF THE PHILIPPINES(1)
As of September 30, 2013
(In millions)
| | | | | | | | | | | | | | | | | | | | | | | | | | | | | | |
Currency | | Interest Rate Basis | | Interest Rate +
Spread/
Service Charge
(Per Annum) | | | | | | | | | Original Amount
Contracted | | | Outstanding Balance
as of September 30,
2013 | |
| | | | Year
Contracted | | | Year of
Maturity | | | (In Original
Currency) | | | (In US
Dollars)(2) | | | (In Original
Currency) | | | (In US
Dollars)(2) | |
| | INTEREST FREE | | | | | | | 2007 | | | | 2024 | | | | 5.39 | | | | 7.28 | | | | 4.94 | | | | 6.68 | |
| | EIBOR | | | 0.77 | | | | 2008 | | | | 2021 | | | | 12.51 | | | | 16.92 | | | | 9.68 | | | | 13.09 | |
| | FIXED | | | 5.12 | | | | 2008 | | | | 2015 | | | | 2.92 | | | | 3.94 | | | | 1.46 | | | | 1.97 | |
| | FIXED | | | 5.06 | | | | 2008 | | | | 2015 | | | | 0.97 | | | | 1.31 | | | | 0.49 | | | | 0.66 | |
| | INTEREST FREE | | | | | | | 2008 | | | | 2022 | | | | 11.35 | | | | 15.35 | | | | 8.63 | | | | 11.67 | |
| | FIXED | | | 5.14 | | | | 2008 | | | | 2020 | | | | 30.17 | | | | 40.80 | | | | 19.61 | | | | 26.52 | |
| | FIXED | | | 5.14 | | | | 2008 | | | | 2020 | | | | 38.16 | | | | 51.60 | | | | 27.33 | | | | 36.96 | |
| | FIXED | | | 0.30 | | | | 2009 | | | | 2040 | | | | 15.71 | | | | 21.24 | | | | 15.62 | | | | 21.13 | |
| | FIXED | | | 4.74 | | | | 2009 | | | | 2020 | | | | 15.71 | | | | 21.24 | | | | 11.43 | | | | 15.46 | |
| | EIBOR | | | 1.40 | | | | 2010 | | | | 2029 | | | | 150.00 | | | | 202.85 | | | | 150.00 | | | | 202.85 | |
| | FIXED | | | 0.15 | | | | 2011 | | | | 2034 | | | | 26.19 | | | | 35.42 | | | | 6.59 | | | | 8.92 | |
| | | | | | | |
POUNDS STERLING | | | | | | | | | | | | | | | 16.25 | | | | 26.23 | | | | 0.00 | | | | 0.00 | |
| | | | | | | | | | | | | | | | | | | | | | | | | | | | | | |
| | FIXED | | | 6.74 | | | | 2001 | | | | 2013 | | | | 16.25 | | | | 26.23 | | | | 0.00 | | | | 0.00 | |
| | | | | | | |
JAPANESE YEN | | | | | | | | | | | | | | | 1,638,518.07 | | | | 16,678.48 | | | | 619,427.93 | | | | 6,305.16 | |
| | | | | | | | | | | | | | | | | | | | | | | | | | | | | | |
| | ADB FLOATING RATE | | | 1.17 | | | | 1986 | | | | 2016 | | | | 1,697.21 | | | | 17.28 | | | | 611.33 | | | | 6.22 | |
| | ADB FLOATING RATE | | | 1.17 | | | | 1990 | | | | 2015 | | | | 664.57 | | | | 6.76 | | | | 208.48 | | | | 2.12 | |
| | ADB FLOATING RATE | | | 1.17 | | | | 1990 | | | | 2020 | | | | 3,173.24 | | | | 32.30 | | | | 1,939.80 | | | | 19.75 | |
| | ADB FLOATING RATE | | | 1.17 | | | | 1991 | | | | 2015 | | | | 11,989.38 | | | | 122.04 | | | | 3,079.22 | | | | 31.34 | |
| | LIBOR BASE | | | 0.45 | | | | 2008 | | | | 2022 | | | | 34,253.10 | | | | 348.66 | | | | 29,998.86 | | | | 305.36 | |
| | FIXED | | | 3.00 | | | | 1987 | | | | 2012 | | | | 30,000.00 | | | | 305.37 | | | | 0.00 | | | | 0.00 | |
| | FIXED | | | 2.70 | | | | 1988 | | | | 2013 | | | | 15,000.00 | | | | 152.69 | | | | 405.41 | | | | 4.13 | |
| | FIXED | | | 2.70 | | | | 1988 | | | | 2013 | | | | 25,000.00 | | | | 254.48 | | | | 675.68 | | | | 6.88 | |
| | FIXED | | | 2.70 | | | | 1988 | | | | 2013 | | | | 12,500.00 | | | | 127.24 | | | | 337.84 | | | | 3.44 | |
| | FIXED | | | 2.70 | | | | 1989 | | | | 2014 | | | | 40,000.00 | | | | 407.16 | | | | 3,243.24 | | | | 33.01 | |
| | FIXED | | | 2.70 | | | | 1990 | | | | 2020 | | | | 28,200.00 | | | | 287.05 | | | | 10,317.06 | | | | 105.02 | |
| | FIXED | | | 2.70 | | | | 1991 | | | | 2016 | | | | 10,575.00 | | | | 107.64 | | | | 1,429.05 | | | | 14.55 | |
| | FIXED | | | 2.70 | | | | 1991 | | | | 2016 | | | | 13,219.00 | | | | 134.56 | | | | 1,786.35 | | | | 18.18 | |
| | FIXED | | | 2.70 | | | | 1991 | | | | 2016 | | | | 13,219.00 | | | | 134.56 | | | | 2,143.62 | | | | 21.82 | |
| | FIXED | | | 3.00 | | | | 1992 | | | | 2017 | | | | 25,380.00 | | | | 258.34 | | | | 5,487.56 | | | | 55.86 | |
| | FIXED | | | 0.75 | | | | 1999 | | | | 2039 | | | | 36,300.00 | | | | 369.50 | | | | 30,349.13 | | | | 308.92 | |
| | FIXED | | | 1.40 | | | | 2009 | | | | 2039 | | | | 9,293.00 | | | | 94.59 | | | | 9,293.00 | | | | 94.59 | |
| | FIXED | | | 1.40 | | | | 2010 | | | | 2040 | | | | 9,220.00 | | | | 93.85 | | | | 9,220.00 | | | | 93.85 | |
| | LIBOR BASE | | | 0.27 | | | | 2010 | | | | 2025 | | | | 13,830.00 | | | | 140.78 | | | | 12,723.60 | | | | 129.51 | |
| | FIXED | | | 1.40 | | | | 2012 | | | | 2042 | | | | 7,775.00 | | | | 79.14 | | | | 7,775.00 | | | | 79.14 | |
| | FIXED | | | 3.00 | | | | 1983 | | | | 2013 | | | | 9,900.00 | | | | 100.77 | | | | 0.00 | | | | 0.00 | |
| | FIXED | | | 3.00 | | | | 1983 | | | | 2013 | | | | 6,300.00 | | | | 64.13 | | | | 0.00 | | | | 0.00 | |
| | FIXED | | | 3.00 | | | | 1983 | | | | 2013 | | | | 5,400.00 | | | | 54.97 | | | | 0.00 | | | | 0.00 | |
| | FIXED | | | 3.00 | | | | 1983 | | | | 2013 | | | | 1,140.00 | | | | 11.60 | | | | 0.00 | | | | 0.00 | |
| | FIXED | | | 3.00 | | | | 1983 | | | | 2013 | | | | 4,600.00 | | | | 46.82 | | | | 0.00 | | | | 0.00 | |
| | FIXED | | | 4.00 | | | | 1983 | | | | 2013 | | | | 9,600.00 | | | | 97.72 | | | | 0.00 | | | | 0.00 | |
| | FIXED | | | 3.50 | | | | 1984 | | | | 2014 | | | | 3,012.00 | | | | 30.66 | | | | 146.19 | | | | 1.49 | |
| | FIXED | | | 3.50 | | | | 1984 | | | | 2014 | | | | 1,381.00 | | | | 14.06 | | | | 27.36 | | | | 0.28 | |
| | FIXED | | | 3.50 | | | | 1986 | | | | 2016 | | | | 148.00 | | | | 1.51 | | | | 14.93 | | | | 0.15 | |
| | FIXED | | | 3.50 | | | | 1986 | | | | 2016 | | | | 705.00 | | | | 7.18 | | | | 66.93 | | | | 0.68 | |
| | FIXED | | | 3.50 | | | | 1986 | | | | 2016 | | | | 7,595.00 | | | | 77.31 | | | | 1,068.82 | | | | 10.88 | |
| | FIXED | | | 3.50 | | | | 1986 | | | | 2016 | | | | 3,988.00 | | | | 40.59 | | | | 582.36 | | | | 5.93 | |
| | FIXED | | | 3.50 | | | | 1986 | | | | 2016 | | | | 1,439.00 | | | | 14.65 | | | | 141.10 | | | | 1.44 | |
| | FIXED | | | 3.50 | | | | 1986 | | | | 2016 | | | | 2,555.00 | | | | 26.01 | | | | 213.31 | | | | 2.17 | |
| | FIXED | | | 4.00 | | | | 1987 | | | | 2017 | | | | 40,400.00 | | | | 411.23 | | | | 7,496.55 | | | | 76.31 | |
| | FIXED | | | 3.00 | | | | 1988 | | | | 2018 | | | | 2,254.00 | | | | 22.94 | | | | 34.77 | | | | 0.35 | |
| | FIXED | | | 3.00 | | | | 1988 | | | | 2018 | | | | 4,837.00 | | | | 49.24 | | | | 976.13 | | | | 9.94 | |
| | FIXED | | | 3.00 | | | | 1988 | | | | 2018 | | | | 10,818.00 | | | | 110.12 | | | | 1,978.76 | | | | 20.14 | |
| | FIXED | | | 3.00 | | | | 1988 | | | | 2018 | | | | 2,090.00 | | | | 21.27 | | | | 449.17 | | | | 4.57 | |
| | FIXED | | | 3.00 | | | | 1988 | | | | 2018 | | | | 5,735.00 | | | | 58.38 | | | | 1,249.16 | | | | 12.72 | |
| | FIXED | | | 3.00 | | | | 1988 | | | | 2018 | | | | 3,193.00 | | | | 32.50 | | | | 594.40 | | | | 6.05 | |
| | FIXED | | | 3.00 | | | | 1988 | | | | 2018 | | | | 4,611.00 | | | | 46.94 | | | | 986.33 | | | | 10.04 | |
| | FIXED | | | 3.00 | | | | 1988 | | | | 2018 | | | | 3,372.00 | | | | 34.32 | | | | 596.67 | | | | 6.07 | |
| | FIXED | | | 3.00 | | | | 1988 | | | | 2018 | | | | 2,000.00 | | | | 20.36 | | | | 307.11 | | | | 3.13 | |
| | FIXED | | | 3.00 | | | | 1988 | | | | 2018 | | | | 707.00 | | | | 7.20 | | | | 132.70 | | | | 1.35 | |
| | FIXED | | | 3.00 | | | | 1988 | | | | 2018 | | | | 326.00 | | | | 3.32 | | | | 68.90 | | | | 0.70 | |
| | FIXED | | | 3.00 | | | | 1988 | | | | 2018 | | | | 308.00 | | | | 3.14 | | | | 65.94 | | | | 0.67 | |
| | FIXED | | | 3.00 | | | | 1988 | | | | 2018 | | | | 14,003.00 | | | | 142.54 | | | | 3,400.98 | | | | 34.62 | |
| | FIXED | | | 2.70 | | | | 1989 | | | | 2019 | | | | 2,063.00 | | | | 21.00 | | | | 593.33 | | | | 6.04 | |
| | FIXED | | | 2.70 | | | | 1989 | | | | 2019 | | | | 4,776.00 | | | | 48.61 | | | | 964.73 | | | | 9.82 | |
| | FIXED | | | 2.70 | | | | 1989 | | | | 2019 | | | | 2,500.00 | | | | 25.45 | | | | 731.70 | | | | 7.45 | |
T-9
EXTERNAL DEBT OF THE REPUBLIC OF THE PHILIPPINES(1)
As of September 30, 2013
(In millions)
| | | | | | | | | | | | | | | | | | | | | | | | | | | | | | |
Currency | | Interest Rate Basis | | Interest Rate +
Spread/
Service Charge
(Per Annum) | | | | | | | | | Original Amount
Contracted | | | Outstanding Balance
as of September 30,
2013 | |
| | | | Year
Contracted | | | Year of
Maturity | | | (In Original
Currency) | | | (In US
Dollars)(2) | | | (In Original
Currency) | | | (In US
Dollars)(2) | |
| | FIXED | | | 2.70 | | | | 1989 | | | | 2019 | | | | 2,633.00 | | | | 26.80 | | | | 571.94 | | | | 5.82 | |
| | FIXED | | | 2.70 | | | | 1989 | | | | 2019 | | | | 5,500.00 | | | | 55.98 | | | | 1,475.40 | | | | 15.02 | |
| | FIXED | | | 2.70 | | | | 1989 | | | | 2019 | | | | 6,300.00 | | | | 64.13 | | | | 1,454.04 | | | | 14.80 | |
| | FIXED | | | 2.70 | | | | 1989 | | | | 2019 | | | | 2,169.00 | | | | 22.08 | | | | 623.52 | | | | 6.35 | |
| | FIXED | | | 2.70 | | | | 1990 | | | | 2020 | | | | 2,304.00 | | | | 23.45 | | | | 721.58 | | | | 7.34 | |
| | FIXED | | | 2.70 | | | | 1990 | | | | 2020 | | | | 4,238.00 | | | | 43.14 | | | | 1,158.76 | | | | 11.79 | |
| | FIXED | | | 2.70 | | | | 1990 | | | | 2020 | | | | 2,079.00 | | | | 21.16 | | | | 640.54 | | | | 6.52 | |
| | FIXED | | | 2.70 | | | | 1990 | | | | 2020 | | | | 5,708.00 | | | | 58.10 | | | | 1,705.29 | | | | 17.36 | |
| | FIXED | | | 2.70 | | | | 1990 | | | | 2020 | | | | 8,634.00 | | | | 87.89 | | | | 2,352.22 | | | | 23.94 | |
| | FIXED | | | 2.70 | | | | 1990 | | | | 2020 | | | | 454.00 | | | | 4.62 | | | | 100.27 | | | | 1.02 | |
| | FIXED | | | 2.70 | | | | 1990 | | | | 2020 | | | | 4,986.00 | | | | 50.75 | | | | 1,576.20 | | | | 16.04 | |
| | FIXED | | | 2.70 | | | | 1990 | | | | 2020 | | | | 5,080.00 | | | | 51.71 | | | | 1,006.94 | | | | 10.25 | |
| | FIXED | | | 2.70 | | | | 1990 | | | | 2020 | | | | 10,560.00 | | | | 107.49 | | | | 1,991.18 | | | | 20.27 | |
| | FIXED | | | 2.70 | | | | 1990 | | | | 2020 | | | | 21,752.00 | | | | 221.41 | | | | 5,182.84 | | | | 52.76 | |
| | FIXED | | | 2.70 | | | | 1990 | | | | 2020 | | | | 4,867.00 | | | | 49.54 | | | | 1,426.35 | | | | 14.52 | |
| | FIXED | | | 2.70 | | | | 1990 | | | | 2020 | | | | 4,301.00 | | | | 43.78 | | | | 1,363.57 | | | | 13.88 | |
| | FIXED | | | 2.70 | | | | 1990 | | | | 2020 | | | | 5,066.00 | | | | 51.57 | | | | 1,689.60 | | | | 17.20 | |
| | FIXED | | | 2.70 | | | | 1991 | | | | 2021 | | | | 2,065.00 | | | | 21.02 | | | | 708.45 | | | | 7.21 | |
| | FIXED | | | 2.70 | | | | 1991 | | | | 2021 | | | | 1,663.00 | | | | 16.93 | | | | 590.05 | | | | 6.01 | |
| | FIXED | | | 2.70 | | | | 1991 | | | | 2021 | | | | 1,795.00 | | | | 18.27 | | | | 491.01 | | | | 5.00 | |
| | FIXED | | | 2.70 | | | | 1991 | | | | 2021 | | | | 5,266.00 | | | | 53.60 | | | | 1,883.63 | | | | 19.17 | |
| | FIXED | | | 2.70 | | | | 1991 | | | | 2021 | | | | 10,790.00 | | | | 109.83 | | | | 4,128.03 | | | | 42.02 | |
| | FIXED | | | 2.70 | | | | 1991 | | | | 2021 | | | | 3,516.00 | | | | 35.79 | | | | 1,360.61 | | | | 13.85 | |
| | FIXED | | | 2.70 | | | | 1991 | | | | 2021 | | | | 9,427.00 | | | | 95.96 | | | | 3,626.45 | | | | 36.91 | |
| | FIXED | | | 2.70 | | | | 1991 | | | | 2021 | | | | 8,283.00 | | | | 84.31 | | | | 2,893.26 | | | | 29.45 | |
| | FIXED | | | 2.70 | | | | 1992 | | | | 2022 | | | | 7,655.00 | | | | 77.92 | | | | 1,932.05 | | | | 19.67 | |
| | FIXED | | | 2.70 | | | | 1991 | | | | 2021 | | | | 4,028.00 | | | | 41.00 | | | | 1,305.38 | | | | 13.29 | |
| | FIXED | | | 2.70 | | | | 1991 | | | | 2021 | | | | 20,020.00 | | | | 203.78 | | | | 7,812.66 | | | | 79.53 | |
| | FIXED | | | 3.00 | | | | 1993 | | | | 2023 | | | | 3,653.00 | | | | 37.18 | | | | 1,462.41 | | | | 14.89 | |
| | FIXED | | | 3.00 | | | | 1993 | | | | 2023 | | | | 6,112.00 | | | | 62.21 | | | | 1,384.23 | | | | 14.09 | |
| | FIXED | | | 3.00 | | | | 1993 | | | | 2023 | | | | 6,872.00 | | | | 69.95 | | | | 3,251.62 | | | | 33.10 | |
| | FIXED | | | 3.00 | | | | 1993 | | | | 2023 | | | | 4,633.00 | | | | 47.16 | | | | 1,935.48 | | | | 19.70 | |
| | FIXED | | | 3.00 | | | | 1993 | | | | 2023 | | | | 3,803.00 | | | | 38.71 | | | | 1,735.22 | | | | 17.66 | |
| | FIXED | | | 3.00 | | | | 1993 | | | | 2023 | | | | 3,055.00 | | | | 31.10 | | | | 1,490.22 | | | | 15.17 | |
| | FIXED | | | 3.00 | | | | 1993 | | | | 2023 | | | | 9,294.00 | | | | 94.60 | | | | 2,799.48 | | | | 28.50 | |
| | FIXED | | | 3.00 | | | | 1994 | | | | 2024 | | | | 7,056.00 | | | | 71.82 | | | | 3,565.85 | | | | 36.30 | |
| | FIXED | | | 3.00 | | | | 1994 | | | | 2024 | | | | 6,630.00 | | | | 67.49 | | | | 3,122.69 | | | | 31.79 | |
| | FIXED | | | 3.00 | | | | 1994 | | | | 2024 | | | | 5,513.00 | | | | 56.12 | | | | 2,896.87 | | | | 29.49 | |
| | FIXED | | | 3.00 | | | | 1994 | | | | 2024 | | | | 10,756.00 | | | | 109.49 | | | | 179.56 | | | | 1.83 | |
| | FIXED | | | 3.00 | | | | 1994 | | | | 2024 | | | | 2,896.00 | | | | 29.48 | | | | 683.81 | | | | 6.96 | |
| | FIXED | | | 3.00 | | | | 1994 | | | | 2024 | | | | 457.00 | | | | 4.65 | | | | 119.97 | | | | 1.22 | |
| | FIXED | | | 3.00 | | | | 1994 | | | | 2024 | | | | 9,620.00 | | | | 97.92 | | | | 5,361.37 | | | | 54.57 | |
| | FIXED | | | 3.00 | | | | 1994 | | | | 2024 | | | | 4,616.00 | | | | 46.99 | | | | 2,425.35 | | | | 24.69 | |
| | FIXED | | | 3.00 | | | | 1994 | | | | 2024 | | | | 11,754.00 | | | | 119.64 | | | | 6,593.62 | | | | 67.12 | |
| | | | | | | | |
| | FIXED | | | | | | | 1995 | | | | 2025 | | | | 6,151.00 | | | | 62.61 | | | | 3,404.50 | | | | 34.65 | |
| | | | | | | | | | | | | | | | | | | | | | | | | | | | | | |
| | FIXED | | | 2.70 | | | | 1995 | | | | 2025 | | | | | | | | | | | | 2,944.44 | | | | 29.97 | |
| | FIXED | | | 2.30 | | | | 1995 | | | | 2025 | | | | | | | | | | | | 460.06 | | | | 4.68 | |
| | | | | | | | |
| | FIXED | | | | | | | 1995 | | | | 2025 | | | | 4,040.00 | | | | 41.12 | | | | 2,278.15 | | | | 23.19 | |
| | | | | | | | | | | | | | | | | | | | | | | | | | | | | | |
| | FIXED | | | 2.70 | | | | 1995 | | | | 2025 | | | | | | | | | | | | 1,936.70 | | | | 19.71 | |
| | FIXED | | | 2.30 | | | | 1995 | | | | 2025 | | | | | | | | | | | | 341.45 | | | | 3.48 | |
| | | | | | | | |
| | FIXED | | | | | | | 1995 | | | | 2025 | | | | 8,312.00 | | | | 84.61 | | | | 4,851.62 | | | | 49.38 | |
| | | | | | | | | | | | | | | | | | | | | | | | | | | | | | |
| | FIXED | | | 2.50 | | | | 1995 | | | | 2025 | | | | | | | | | | | | 4,364.18 | | | | 44.42 | |
| | FIXED | | | 2.10 | | | | 1995 | | | | 2025 | | | | | | | | | | | | 487.44 | | | | 4.96 | |
| | | | | | | | |
| | FIXED | | | | | | | 1995 | | | | 2025 | | | | 18,391.00 | | | | 187.20 | | | | 10,757.02 | | | | 109.50 | |
| | | | | | | | | | | | | | | | | | | | | | | | | | | | | | |
| | FIXED | | | 2.70 | | | | 1995 | | | | 2025 | | | | | | | | | | | | 9,364.78 | | | | 95.32 | |
| | FIXED | | | 2.30 | | | | 1995 | | | | 2025 | | | | | | | | | | | | 1,392.24 | | | | 14.17 | |
| | FIXED | | | | | | | 1995 | | | | 2025 | | | | 5,579.00 | | | | 56.79 | | | | 3,080.47 | | | | 31.36 | |
| | | | | | | | | | | | | | | | | | | | | | | | | | | | | | |
| | FIXED | | | 2.70 | | | | 1995 | | | | 2025 | | | | | | | | | | | | 2,747.50 | | | | 27.97 | |
| | FIXED | | | 2.30 | | | | 1995 | | | | 2025 | | | | | | | | | | | | 332.98 | | | | 3.39 | |
| | | | | | | | |
| | FIXED | | | | | | | 1995 | | | | 2025 | | | | 6,386.00 | | | | 65.00 | | | | 3,631.06 | | | | 36.96 | |
| | | | | | | | | | | | | | | | | | | | | | | | | | | | | | |
| | FIXED | | | 2.70 | | | | 1995 | | | | 2025 | | | | | | | | | | | | 3,079.99 | | | | 31.35 | |
T-10
EXTERNAL DEBT OF THE REPUBLIC OF THE PHILIPPINES(1)
As of September 30, 2013
(In millions)
| | | | | | | | | | | | | | | | | | | | | | | | | | | | | | |
Currency | | Interest Rate Basis | | Interest Rate +
Spread/
Service Charge
(Per Annum) | | | | | | | | | Original Amount
Contracted | | | Outstanding Balance
as of September 30,
2013 | |
| | | | Year
Contracted | | | Year of
Maturity | | | (In Original
Currency) | | | (In US
Dollars)(2) | | | (In Original
Currency) | | | (In US
Dollars)(2) | |
| | FIXED | | | 2.30 | | | | 1995 | | | | 2025 | | | | | | | | | | | | 551.06 | | | | 5.61 | |
| | | | | | | | |
| | FIXED | | | | | | | 1995 | | | | 2025 | | | | 12,895.00 | | | | 131.26 | | | | 7,313.66 | | | | 74.45 | |
| | | | | | | | | | | | | | | | | | | | | | | | | | | | | | |
| | FIXED | | | 2.70 | | | | 1995 | | | | 2025 | | | | | | | | | | | | 6,143.64 | | | | 62.54 | |
| | FIXED | | | 2.30 | | | | 1995 | | | | 2025 | | | | | | | | | | | | 1,170.02 | | | | 11.91 | |
| | | | | | | | |
| | FIXED | | | | | | | 1995 | | | | 2025 | | | | 4,765.00 | | | | 48.50 | | | | 2,249.88 | | | | 22.90 | |
| | | | | | | | | | | | | | | | | | | | | | | | | | | | | | |
| | FIXED | | | 2.70 | | | | 1995 | | | | 2025 | | | | | | | | | | | | 1,983.29 | | | | 20.19 | |
| | FIXED | | | 2.30 | | | | 1995 | | | | 2025 | | | | | | | | | | | | 266.59 | | | | 2.71 | |
| | | | | | | | |
| | FIXED | | | | | | | 1995 | | | | 2025 | | | | 9,551.00 | | | | 97.22 | | | | 5,227.20 | | | | 53.21 | |
| | | | | | | | | | | | | | | | | | | | | | | | | | | | | | |
| | FIXED | | | 2.70 | | | | 1995 | | | | 2025 | | | | | | | | | | | | 3,804.12 | | | | 38.72 | |
| | FIXED | | | 2.30 | | | | 1995 | | | | 2025 | | | | | | | | | | | | 1,423.08 | | | | 14.49 | |
| | | | | | | | |
| | FIXED | | | | | | | 1995 | | | | 2025 | | | | 2,872.00 | | | | 29.23 | | | | 1,062.84 | | | | 10.82 | |
| | | | | | | | | | | | | | | | | | | | | | | | | | | | | | |
| | FIXED | | | 2.70 | | | | 1995 | | | | 2025 | | | | | | | | | | | | 735.60 | | | | 7.49 | |
| | FIXED | | | 2.30 | | | | 1995 | | | | 2025 | | | | | | | | | | | | 327.24 | | | | 3.33 | |
| | | | | | | | |
| | FIXED | | | | | | | 1996 | | | | 2026 | | | | 6,911.00 | | | | 70.35 | | | | 4,213.85 | | | | 42.89 | |
| | | | | | | | | | | | | | | | | | | | | | | | | | | | | | |
| | FIXED | | | 2.50 | | | | 1996 | | | | 2026 | | | | | | | | | | | | 3,631.70 | | | | 36.97 | |
| | FIXED | | | 2.10 | | | | 1996 | | | | 2026 | | | | | | | | | | | | 582.15 | | | | 5.93 | |
| | FIXED | | | 2.30 | | | | 1996 | | | | 2026 | | | | 305.00 | | | | 3.10 | | | | 138.53 | | | | 1.41 | |
| | | | | | | | |
| | FIXED | | | | | | | 1997 | | | | 2027 | | | | 5,746.00 | | | | 58.49 | | | | 2,718.79 | | | | 27.67 | |
| | | | | | | | | | | | | | | | | | | | | | | | | | | | | | |
| | FIXED | | | 2.70 | | | | 1997 | | | | 2027 | | | | | | | | | | | | 2,231.31 | | | | 22.71 | |
| | FIXED | | | 2.30 | | | | 1997 | | | | 2027 | | | | | | | | | | | | 487.49 | | | | 4.96 | |
| | | | | | | | |
| | FIXED | | | | | | | 1997 | | | | 2027 | | | | 7,683.00 | | | | 78.21 | | | | 4,912.92 | | | | 50.01 | |
| | | | | | | | | | | | | | | | | | | | | | | | | | | | | | |
| | | | | | | | | | | | | | | | | | | | | | | | | | | | | | |
| | FIXED | | | 2.70 | | | | 1997 | | | | 2027 | | | | | | | | | | | | 4,102.41 | | | | 41.76 | |
| | FIXED | | | 2.30 | | | | 1997 | | | | 2027 | | | | | | | | | | | | 810.51 | | | | 8.25 | |
| | | | | | | | |
| | FIXED | | | | | | | 1997 | | | | 2027 | | | | 6,593.00 | | | | 67.11 | | | | 4,174.98 | | | | 42.50 | |
| | | | | | | | | | | | | | | | | | | | | | | | | | | | | | |
| | FIXED | | | 2.70 | | | | 1997 | | | | 2027 | | | | | | | | | | | | 3,798.23 | | | | 38.66 | |
| | FIXED | | | 2.30 | | | | 1997 | | | | 2027 | | | | | | | | | | | | 376.76 | | | | 3.84 | |
| | | | | | | | |
| | FIXED | | | | | | | 1997 | | | | 2027 | | | | 9,411.00 | | | | 95.79 | | | | 5,876.06 | | | | 59.81 | |
| | | | | | | | | | | | | | | | | | | | | | | | | | | | | | |
| | FIXED | | | 2.50 | | | | 1997 | | | | 2027 | | | | | | | | | | | | 5,282.01 | | | | 53.77 | |
| | FIXED | | | 2.10 | | | | 1997 | | | | 2027 | | | | | | | | | | | | 594.05 | | | | 6.05 | |
| | | | | | | | |
| | FIXED | | | | | | | 1997 | | | | 2027 | | | | 7,979.00 | | | | 81.22 | | | | 4,807.76 | | | | 48.94 | |
| | | | | | | | | | | | | | | | | | | | | | | | | | | | | | |
| | FIXED | | | 2.50 | | | | 1997 | | | | 2027 | | | | | | | | | | | | 4,093.25 | | | | 41.67 | |
| | FIXED | | | 2.10 | | | | 1997 | | | | 2027 | | | | | | | | | | | | 714.50 | | | | 7.27 | |
| | | | | | | | |
| | FIXED | | | | | | | 1997 | | | | 2027 | | | | 11,122.00 | | | | 113.21 | | | | 6,296.27 | | | | 64.09 | |
| | | | | | | | | | | | | | | | | | | | | | | | | | | | | | |
| | FIXED | | | 2.70 | | | | 1997 | | | | 2027 | | | | | | | | | | | | 4,585.25 | | | | 46.67 | |
| | FIXED | | | 2.30 | | | | 1997 | | | | 2027 | | | | | | | | | | | | 1,711.02 | | | | 17.42 | |
| | | | | | | | |
| | FIXED | | | | | | | 1998 | | | | 2028 | | | | 5,849.00 | | | | 59.54 | | | | 3,806.58 | | | | 38.75 | |
| | | | | | | | | | | | | | | | | | | | | | | | | | | | | | |
| | FIXED | | | 2.20 | | | | 1998 | | | | 2028 | | | | | | | | | | | | 3,082.08 | | | | 31.37 | |
| | FIXED | | | 0.75 | | | | 1998 | | | | 2038 | | | | | | | | | | | | 724.50 | | | | 7.37 | |
| | | | | | | | |
| | FIXED | | | | | | | 1998 | | | | 2028 | | | | 13,564.00 | | | | 138.07 | | | | 8,788.33 | | | | 89.46 | |
| | | | | | | | | | | | | | | | | | | | | | | | | | | | | | |
| | FIXED | | | 2.20 | | | | 1998 | | | | 2028 | | | | | | | | | | | | 7,156.68 | | | | 72.85 | |
| | FIXED | | | 0.75 | | | | 1998 | | | | 2038 | | | | | | | | | | | | 1,631.65 | | | | 16.61 | |
| | | | | | | | |
| | FIXED | | | | | | | 1998 | | | | 2028 | | | | 5,728.00 | | | | 58.31 | | | | 1,750.16 | | | | 17.81 | |
| | | | | | | | | | | | | | | | | | | | | | | | | | | | | | |
| | FIXED | | | 2.20 | | | | 1998 | | | | 2028 | | | | | | | | | | | | 1,358.91 | | | | 13.83 | |
| | FIXED | | | 0.75 | | | | 1998 | | | | 2038 | | | | | | | | | | | | 391.25 | | | | 3.98 | |
| | | | | | | | |
| | FIXED | | | | | | | 1998 | | | | 2028 | | | | 4,328.00 | | | | 44.05 | | | | 2,233.44 | | | | 22.73 | |
| | | | | | | | | | | | | | | | | | | | | | | | | | | | | | |
| | FIXED | | | 2.20 | | | | 1998 | | | | 2028 | | | | | | | | | | | | 1,727.04 | | | | 17.58 | |
| | FIXED | | | 0.75 | | | | 1998 | | | | 2038 | | | | | | | | | | | | 506.40 | | | | 5.15 | |
| | | | | | | | |
| | FIXED | | | | | | | 1998 | | | | 2028 | | | | 458.00 | | | | 4.66 | | | | 275.27 | | | | 2.80 | |
| | | | | | | | | | | | | | | | | | | | | | | | | | | | | | |
| | FIXED | | | 1.70 | | | | 1998 | | | | 2028 | | | | | | | | | | | | 19.17 | | | | 0.20 | |
| | FIXED | | | 0.75 | | | | 1998 | | | | 2038 | | | | | | | | | | | | 256.10 | | | | 2.61 | |
| | | | | | | | |
| | FIXED | | | | | | | 1998 | | | | 2028 | | | | 6,734.00 | | | | 68.55 | | | | 4,702.80 | | | | 47.87 | |
| | | | | | | | | | | | | | | | | | | | | | | | | | | | | | |
T-11
EXTERNAL DEBT OF THE REPUBLIC OF THE PHILIPPINES(1)
As of September 30, 2013
(In millions)
| | | | | | | | | | | | | | | | | | | | | | | | | | | | | | |
Currency | | Interest Rate Basis | | Interest Rate +
Spread/
Service Charge
(Per Annum) | | | | | | | | | Original Amount
Contracted | | | Outstanding Balance
as of September 30,
2013 | |
| | | | Year
Contracted | | | Year of
Maturity | | | (In Original
Currency) | | | (In US
Dollars)(2) | | | (In Original
Currency) | | | (In US
Dollars)(2) | |
| | FIXED | | | 1.70 | | | | 1998 | | | | 2028 | | | | | | | | | | | | 3,624.15 | | | | 36.89 | |
| | FIXED | | | 0.75 | | | | 1998 | | | | 2038 | | | | | | | | | | | | 1,078.65 | | | | 10.98 | |
| | | | | | | | |
| | FIXED | | | | | | | 1998 | | | | 2028 | | | | 3,201.00 | | | | 32.58 | | | | 1,824.17 | | | | 18.57 | |
| | | | | | | | | | | | | | | | | | | | | | | | | | | | | | |
| | FIXED | | | 1.70 | | | | 1998 | | | | 2028 | | | | | | | | | | | | 26.52 | | | | 0.27 | |
| | FIXED | | | 0.75 | | | | 1998 | | | | 2038 | | | | | | | | | | | | 1,797.65 | | | | 18.30 | |
| | FIXED | | | | | | | 1998 | | | | 2028 | | | | 14,136.00 | | | | 143.89 | | | | 8,564.89 | | | | 87.18 | |
| | | | | | | | | | | | | | | | | | | | | | | | | | | | | | |
| | FIXED | | | 2.20 | | | | 1998 | | | | 2028 | | | | | | | | | | | | 7,391.34 | | | | 75.24 | |
| | FIXED | | | 0.75 | | | | 1998 | | | | 2038 | | | | | | | | | | | | 1,173.55 | | | | 11.95 | |
| | | | | | | | |
| | FIXED | | | | | | | 1998 | | | | 2028 | | | | 2,428.00 | | | | 24.71 | | | | 1,127.67 | | | | 11.48 | |
| | | | | | | | | | | | | | | | | | | | | | | | | | | | | | |
| | FIXED | | | 1.70 | | | | 1998 | | | | 2028 | | | | | | | | | | | | 815.67 | | | | 8.30 | |
| | FIXED | | | 0.75 | | | | 1998 | | | | 2038 | | | | | | | | | | | | 312.00 | | | | 3.18 | |
| | | | | | | | |
| | FIXED | | | | | | | 1999 | | | | 2029 | | | | 7,210.00 | | | | 73.39 | | | | 5,310.28 | | | | 54.05 | |
| | | | | | | | | | | | | | | | | | | | | | | | | | | | | | |
| | FIXED | | | 1.80 | | | | 1999 | | | | 2029 | | | | | | | | | | | | 3,976.01 | | | | 40.47 | |
| | FIXED | | | 0.75 | | | | 1999 | | | | 2039 | | | | | | | | | | | | 1,334.28 | | | | 13.58 | |
| | | | | | | | |
| | FIXED | | | | | | | 1999 | | | | 2029 | | | | 951.00 | | | | 9.68 | | | | 396.23 | | | | 4.03 | |
| | | | | | | | | | | | | | | | | | | | | | | | | | | | | | |
| | FIXED | | | 1.30 | | | | 1999 | | | | 2029 | | | | | | | | | | | | 98.74 | | | | 1.01 | |
| | FIXED | | | 0.75 | | | | 1999 | | | | 2039 | | | | | | | | | | | | 297.49 | | | | 3.03 | |
| | | | | | | | |
| | FIXED | | | | | | | 1999 | | | | 2029 | | | | 6,078.00 | | | | 61.87 | | | | 4,877.49 | | | | 49.65 | |
| | | | | | | | | | | | | | | | | | | | | | | | | | | | | | |
| | FIXED | | | 1.80 | | | | 1999 | | | | 2029 | | | | | | | | | | | | 4,372.14 | | | | 44.50 | |
| | FIXED | | | 0.75 | | | | 1999 | | | | 2039 | | | | | | | | | | | | 505.36 | | | | 5.14 | |
| | | | | | | | |
| | FIXED | | | | | | | 1999 | | | | 2029 | | | | 16,990.00 | | | | 172.94 | | | | 10,014.69 | | | | 101.94 | |
| | | | | | | | | | | | | | | | | | | | | | | | | | | | | | |
| | FIXED | | | 1.80 | | | | 1999 | | | | 2029 | | | | | | | | | | | | 8,650.75 | | | | 88.06 | |
| | FIXED | | | 1.30 | | | | 1999 | | | | 2029 | | | | | | | | | | | | 174.14 | | | | 1.77 | |
| | FIXED | | | 0.75 | | | | 1999 | | | | 2039 | | | | | | | | | | | | 1,189.80 | | | | 12.11 | |
| | | | | | | | |
| | FIXED | | | | | | | 1999 | | | | 2029 | | | | 15,384.00 | | | | 156.59 | | | | 12,409.62 | | | | 126.32 | |
| | | | | | | | | | | | | | | | | | | | | | | | | | | | | | |
| | FIXED | | | 1.80 | | | | 1999 | | | | 2029 | | | | | | | | | | | | 10,583.13 | | | | 107.73 | |
| | FIXED | | | 0.75 | | | | 1999 | | | | 2039 | | | | | | | | | | | | 1,826.49 | | | | 18.59 | |
| | | | | | | | |
| | FIXED | | | | | | | 1999 | | | | 2029 | | | | 5,852.00 | | | | 59.57 | | | | 4,499.69 | | | | 45.80 | |
| | | | | | | | | | | | | | | | | | | | | | | | | | | | | | |
| | FIXED | | | 1.80 | | | | 1999 | | | | 2029 | | | | | | | | | | | | 3,747.51 | | | | 38.15 | |
| | FIXED | | | 0.75 | | | | 1999 | | | | 2039 | | | | | | | | | | | | 752.18 | | | | 7.66 | |
| | | | | | | | |
| | FIXED | | | | | | | 1999 | | | | 2029 | | | | 7,434.00 | | | | 75.67 | | | | 6,036.73 | | | | 61.45 | |
| | | | | | | | | | | | | | | | | | | | | | | | | | | | | | |
| | FIXED | | | 1.80 | | | | 1999 | | | | 2029 | | | | | | | | | | | | 5,302.57 | | | | 53.97 | |
| | FIXED | | | 0.75 | | | | 1999 | | | | 2039 | | | | | | | | | | | | 734.16 | | | | 7.47 | |
| | | | | | | | |
| | FIXED | | | | | | | 1999 | | | | 2029 | | | | 5,068.00 | | | | 51.59 | | | | 3,088.32 | | | | 31.44 | |
| | | | | | | | | | | | | | | | | | | | | | | | | | | | | | |
| | FIXED | | | 1.80 | | | | 1999 | | | | 2029 | | | | | | | | | | | | 2,525.46 | | | | 25.71 | |
| | FIXED | | | 0.75 | | | | 1999 | | | | 2039 | | | | | | | | | | | | 562.86 | | | | 5.73 | |
| | FIXED | | | 0.75 | | | | 1999 | | | | 2039 | | | | 4,714.00 | | | | 47.98 | | | | 218.31 | | | | 2.22 | |
| | | | | | | | |
| | FIXED | | | | | | | 1999 | | | | 2029 | | | | 9,013.00 | | | | 91.74 | | | | 6,200.92 | | | | 63.12 | |
| | | | | | | | | | | | | | | | | | | | | | | | | | | | | | |
| | FIXED | | | 1.30 | | | | 1999 | | | | 2029 | | | | | | | | | | | | 5,421.34 | | | | 55.18 | |
| | FIXED | | | 0.75 | | | | 1999 | | | | 2039 | | | | | | | | | | | | 779.58 | | | | 7.94 | |
| | FIXED | | | 0.75 | | | | 1999 | | | | 2039 | | | | 1,167.00 | | | | 11.88 | | | | 838.62 | | | | 8.54 | |
| | | | | | | | |
| | FIXED | | | | | | | 2000 | | | | 2040 | | | | 8,929.00 | | | | 90.89 | | | | 7,777.73 | | | | 79.17 | |
| | | | | | | | | | | | | | | | | | | | | | | | | | | | | | |
| | FIXED | | | 1.00 | | | | 2000 | | | | 2040 | | | | | | | | | | | | 6,785.86 | | | | 69.07 | |
| | FIXED | | | 0.75 | | | | 2000 | | | | 2040 | | | | | | | | | | | | 991.87 | | | | 10.10 | |
| | | | | | | | |
| | FIXED | | | | | | | 2000 | | | | 2040 | | | | 14,724.00 | | | | 149.88 | | | | 12,678.55 | | | | 129.05 | |
| | | | | | | | | | | | | | | | | | | | | | | | | | | | | | |
| | FIXED | | | 0.95 | | | | 2000 | | | | 2040 | | | | | | | | | | | | 11,401.34 | | | | 116.05 | |
| | FIXED | | | 0.75 | | | | 2000 | | | | 2040 | | | | | | | | | | | | 1,277.21 | | | | 13.00 | |
| | | | | | | | |
| | FIXED | | | | | | | 2000 | | | | 2040 | | | | 3,549.00 | | | | 36.13 | | | | 3,103.81 | | | | 31.59 | |
| | | | | | | | | | | | | | | | | | | | | | | | | | | | | | |
| | FIXED | | | 0.95 | | | | 2000 | | | | 2040 | | | | | | | | | | | | 2,608.74 | | | | 26.55 | |
| | FIXED | | | 0.75 | | | | 2000 | | | | 2040 | | | | | | | | | | | | 495.07 | | | | 5.04 | |
| | | | | | | | |
| | FIXED | | | | | | | 2001 | | | | 2031 | | | | 8,294.00 | | | | 84.42 | | | | 6,885.24 | | | | 70.08 | |
| | | | | | | | | | | | | | | | | | | | | | | | | | | | | | |
| | FIXED | | | 2.20 | | | | 2001 | | | | 2031 | | | | | | | | | | | | 5,497.96 | | | | 55.96 | |
| | FIXED | | | 0.75 | | | | 2001 | | | | 2041 | | | | | | | | | | | | 1,387.29 | | | | 14.12 | |
T-12
EXTERNAL DEBT OF THE REPUBLIC OF THE PHILIPPINES(1)
As of September 30, 2013
(In millions)
| | | | | | | | | | | | | | | | | | | | | | | | | | | | | | |
Currency | | Interest Rate Basis | | Interest Rate +
Spread/
Service Charge
(Per Annum) | | | | | | | | | Original Amount
Contracted | | | Outstanding Balance
as of September 30,
2013 | |
| | | | Year
Contracted | | | Year of
Maturity | | | (In Original
Currency) | | | (In US
Dollars)(2) | | | (In Original
Currency) | | | (In US
Dollars)(2) | |
| | FIXED | | | 0.75 | | | | 2001 | | | | 2041 | | | | 5,543.00 | | | | 56.42 | | | | 263.65 | | | | 2.68 | |
| | | | | | | | |
| | FIXED | | | | | | | 2001 | | | | 2031 | | | | 11,743.00 | | | | 119.53 | | | | 5,546.25 | | | | 56.46 | |
| | | | | | | | | | | | | | | | | | | | | | | | | | | | | | |
| | FIXED | | | 2.20 | | | | 2001 | | | | 2031 | | | | | | | | | | | | 4,989.28 | | | | 50.79 | |
| | FIXED | | | 0.75 | | | | 2001 | | | | 2041 | | | | | | | | | | | | 556.98 | | | | 5.67 | |
| | | | | | | | |
| | FIXED | | | | | | | 2001 | | | | 2031 | | | | 6,205.00 | | | | 63.16 | | | | 3,953.30 | | | | 40.24 | |
| | | | | | | | | | | | | | | | | | | | | | | | | | | | | | |
| | FIXED | | | 2.20 | | | | 2001 | | | | 2031 | | | | | | | | | | | | 3,001.86 | | | | 30.56 | |
| | FIXED | | | 0.75 | | | | 2001 | | | | 2041 | | | | | | | | | | | | 951.44 | | | | 9.68 | |
| | | | | | | | |
| | FIXED | | | | | | | 2001 | | | | 2031 | | | | 5,210.00 | | | | 53.03 | | | | 3,365.70 | | | | 34.26 | |
| | | | | | | | | | | | | | | | | | | | | | | | | | | | | | |
| | FIXED | | | 2.20 | | | | 2001 | | | | 2031 | | | | | | | | | | | | 2,545.52 | | | | 25.91 | |
| | FIXED | | | 0.75 | | | | 2001 | | | | 2041 | | | | | | | | | | | | 820.18 | | | | 8.35 | |
| | | | | | | | |
| | FIXED | | | | | | | 2001 | | | | 2031 | | | | 6,515.00 | | | | 66.32 | | | | 5,130.01 | | | | 52.22 | |
| | | | | | | | | | | | | | | | | | | | | | | | | | | | | | |
| | FIXED | | | 2.20 | | | | 2001 | | | | 2031 | | | | | | | | | | | | 4,225.00 | | | | 43.01 | |
| | FIXED | | | 0.75 | | | | 2001 | | | | 2041 | | | | | | | | | | | | 905.02 | | | | 9.21 | |
| | | | | | | | |
| | FIXED | | | | | | | 2001 | | | | 2031 | | | | 2,789.00 | | | | 28.39 | | | | 2,443.72 | | | | 24.87 | |
| | | | | | | | | | | | | | | | | | | | | | | | | | | | | | |
| | FIXED | | | 1.70 | | | | 2001 | | | | 2031 | | | | | | | | | | | | 2,308.14 | | | | 23.49 | |
| | FIXED | | | 0.75 | | | | 2001 | | | | 2041 | | | | | | | | | | | | 135.58 | | | | 1.38 | |
| | | | | | | | |
| | FIXED | | | | | | | 2001 | | | | 2031 | | | | 6,309.00 | | | | 64.22 | | | | 5,572.94 | | | | 56.73 | |
| | | | | | | | | | | | | | | | | | | | | | | | | | | | | | |
| | FIXED | | | 1.70 | | | | 2001 | | | | 2031 | | | | | | | | | | | | 4,542.88 | | | | 46.24 | |
| | FIXED | | | 0.75 | | | | 2001 | | | | 2041 | | | | | | | | | | | | 1,030.06 | | | | 10.49 | |
| | FIXED | | | 0.75 | | | | 2001 | | | | 2041 | | | | 2,034.00 | | | | 20.70 | | | | 1,795.30 | | | | 18.27 | |
| | | | | | | | |
| | FIXED | | | | | | | 2002 | | | | 2032 | | | | 6,723.00 | | | | 68.43 | | | | 6,003.29 | | | | 61.11 | |
| | | | | | | | | | | | | | | | | | | | | | | | | | | | | | |
| | FIXED | | | 2.20 | | | | 2002 | | | | 2032 | | | | | | | | | | | | 5,257.33 | | | | 53.51 | |
| | FIXED | | | 0.75 | | | | 2002 | | | | 2042 | | | | | | | | | | | | 745.96 | | | | 7.59 | |
| | | | | | | | |
| | FIXED | | | | | | | 2002 | | | | 2032 | | | | 22,049.00 | | | | 224.44 | | | | 2,011.26 | | | | 20.47 | |
| | | | | | | | | | | | | | | | | | | | | | | | | | | | | | |
| | FIXED | | | 2.20 | | | | 2002 | | | | 2032 | | | | | | | | | | | | 921.95 | | | | 9.38 | |
| | FIXED | | | 1.80 | | | | 2002 | | | | 2032 | | | | | | | | | | | | 1,089.31 | | | | 11.09 | |
| | | | | | | | |
| | FIXED | | | | | | | 2002 | | | | 2032 | | | | 3,224.00 | | | | 32.82 | | | | 2,720.03 | | | | 27.69 | |
| | | | | | | | | | | | | | | | | | | | | | | | | | | | | | |
| | FIXED | | | 2.20 | | | | 2002 | | | | 2032 | | | | | | | | | | | | 2,077.81 | | | | 21.15 | |
| | FIXED | | | 0.75 | | | | 2002 | | | | 2042 | | | | | | | | | | | | 642.22 | | | | 6.54 | |
| | | | | | | | |
| | FIXED | | | | | | | 2002 | | | | 2032 | | | | 6,790.00 | | | | 69.12 | | | | 6,115.10 | | | | 62.25 | |
| | | | | | | | | | | | | | | | | | | | | | | | | | | | | | |
| | FIXED | | | 1.70 | | | | 2002 | | | | 2032 | | | | | | | | | | | | 4,859.73 | | | | 49.47 | |
| | FIXED | | | 0.75 | | | | 2002 | | | | 2042 | | | | | | | | | | | | 1,255.37 | | | | 12.78 | |
| | | | | | | | |
| | FIXED | | | | | | | 2002 | | | | 2042 | | | | 18,488.00 | | | | 188.19 | | | | 17,130.04 | | | | 174.37 | |
| | | | | | | | | | | | | | | | | | | | | | | | | | | | | | |
| | FIXED | | | 0.95 | | | | 2002 | | | | 2042 | | | | | | | | | | | | 15,235.25 | | | | 155.08 | |
| | FIXED | | | 0.75 | | | | 2002 | | | | 2042 | | | | | | | | | | | | 1,894.79 | | | | 19.29 | |
| | FIXED | | | 2.20 | | | | 2003 | | | | 2033 | | | | 2,470.00 | | | | 25.14 | | | | 2,365.10 | | | | 24.07 | |
| | FIXED | | | 2.20 | | | | 2004 | | | | 2034 | | | | 6,223.00 | | | | 63.34 | | | | 4,129.84 | | | | 42.04 | |
| | FIXED | | | 2.20 | | | | 2003 | | | | 2033 | | | | 3,717.00 | | | | 37.84 | | | | 3,165.75 | | | | 32.22 | |
| | FIXED | | | 0.75 | | | | 2007 | | | | 2047 | | | | 8,529.00 | | | | 86.82 | | | | 8,481.14 | | | | 86.33 | |
| | | | | | | | |
| | FIXED | | | | | | | 2007 | | | | 2037 | | | | 7,604.00 | | | | 77.40 | | | | 6,292.64 | | | | 64.05 | |
| | | | | | | | | | | | | | | | | | | | | | | | | | | | | | |
| | FIXED | | | 1.50 | | | | 2007 | | | | 2037 | | | | | | | | | | | | 5,349.02 | | | | 54.45 | |
| | FIXED | | | 0.01 | | | | 2007 | | | | 2037 | | | | | | | | | | | | 943.62 | | | | 9.61 | |
| | | | | | | | |
| | FIXED | | | | | | | 2007 | | | | 2037 | | | | 11,802.00 | | | | 120.13 | | | | 7,974.85 | | | | 81.18 | |
| | | | | | | | | | | | | | | | | | | | | | | | | | | | | | |
| | FIXED | | | 1.50 | | | | 2007 | | | | 2037 | | | | | | | | | | | | 6,800.87 | | | | 69.23 | |
| | FIXED | | | 0.75 | | | | 2007 | | | | 2047 | | | | | | | | | | | | 162.59 | | | | 1.66 | |
| | FIXED | | | 0.01 | | | | 2007 | | | | 2037 | | | | | | | | | | | | 1,011.39 | | | | 10.29 | |
| | FIXED | | | 0.01 | | | | 2010 | | | | 2050 | | | | 9,912.00 | | | | 100.89 | | | | 8,134.03 | | | | 82.80 | |
| | | | | | | | |
| | FIXED | | | 1.40 | | | | 2011 | | | | 2036 | | | | 40,847.00 | | | | 415.78 | | | | 1,645.42 | | | | 16.75 | |
| | | | | | | | | | | | | | | | | | | | | | | | | | | | | | |
| | FIXED | | | 0.01 | | | | 2011 | | | | 2036 | | | | | | | | | | | | 1,151.48 | | | | 11.72 | |
| | FIXED | | | 0.01 | | | | 2011 | | | | 2036 | | | | | | | | | | | | 493.94 | | | | 5.03 | |
| | FIXED | | | 0.30 | | | | 2052 | | | | 2012 | | | | 9,244.00 | | | | 94.09 | | | | 211.68 | | | | 2.15 | |
| | FIXED | | | 0.01 | | | | 2012 | | | | 2042 | | | | 4,591.00 | | | | 46.73 | | | | 40.06 | | | | 0.41 | |
| | FIXED | | | 1.40 | | | | 2012 | | | | 2042 | | | | 6,063.00 | | | | 61.72 | | | | 580.00 | | | | 5.90 | |
T-13
EXTERNAL DEBT OF THE REPUBLIC OF THE PHILIPPINES(1)
As of September 30, 2013
(In millions)
| | | | | | | | | | | | | | | | | | | | | | | | | | | | | | |
Currency | | Interest Rate Basis | | Interest Rate +
Spread/
Service Charge
(Per Annum) | | | | | | | | | Original Amount
Contracted | | | Outstanding Balance
as of September 30,
2013 | |
| | | | Year
Contracted | | | Year of
Maturity | | | (In Original
Currency) | | | (In US
Dollars)(2) | | | (In Original
Currency) | | | (In US
Dollars)(2) | |
| | FIXED | | | 1.40 | | | | 2012 | | | | 2042 | | | | 6,187.00 | | | | 62.98 | | | | 143.20 | | | | 1.46 | |
| | | | | | | | |
| | FIXED | | | | | | | 1993 | | | | 2013 | | | | 25,000.00 | | | | 254.48 | | | | 0.00 | | | | 0.00 | |
| | | | | | | | | | | | | | | | | | | | | | | | | | | | | | |
| | FIXED | | | 4.70 | | | | 1993 | | | | 2013 | | | | | | | | | | | | 0.00 | | | | 0.00 | |
| | FIXED | | | 3.40 | | | | 1993 | | | | 2013 | | | | | | | | | | | | 0.00 | | | | 0.00 | |
| | | | | | | | |
| | FIXED | | | | | | | 1997 | | | | 2021 | | | | 20,800.00 | | | | 211.72 | | | | 6,887.21 | | | | 70.10 | |
| | | | | | | | | | | | | | | | | | | | | | | | | | | | | | |
| | FIXED | | | 2.00 | | | | 1997 | | | | 2021 | | | | | | | | | | | | 716.05 | | | | 7.29 | |
| | FIXED | | | 2.00 | | | | 1997 | | | | 2021 | | | | | | | | | | | | 369.25 | | | | 3.76 | |
| | FIXED | | | 1.35 | | | | 1997 | | | | 2021 | | | | | | | | | | | | 647.42 | | | | 6.59 | |
| | FIXED | | | 1.50 | | | | 1997 | | | | 2021 | | | | | | | | | | | | 241.77 | | | | 2.46 | |
| | FIXED | | | 1.90 | | | | 1997 | | | | 2021 | | | | | | | | | | | | 383.04 | | | | 3.90 | |
| | FIXED | | | 1.75 | | | | 1997 | | | | 2021 | | | | | | | | | | | | 315.43 | | | | 3.21 | |
| | FIXED | | | 1.45 | | | | 1997 | | | | 2021 | | | | | | | | | | | | 433.07 | | | | 4.41 | |
| | FIXED | | | 1.30 | | | | 1997 | | | | 2021 | | | | | | | | | | | | 451.29 | | | | 4.59 | |
| | FIXED | | | 1.30 | | | | 1997 | | | | 2021 | | | | | | | | | | | | 369.10 | | | | 3.76 | |
| | FIXED | | | 1.50 | | | | 1997 | | | | 2021 | | | | | | | | | | | | 302.40 | | | | 3.08 | |
| | FIXED | | | 1.50 | | | | 1997 | | | | 2021 | | | | | | | | | | | | 302.12 | | | | 3.08 | |
| | FIXED | | | 1.80 | | | | 1997 | | | | 2021 | | | | | | | | | | | | 407.45 | | | | 4.15 | |
| | FIXED | | | 1.50 | | | | 1997 | | | | 2021 | | | | | | | | | | | | 457.50 | | | | 4.66 | |
| | FIXED | | | 1.50 | | | | 1997 | | | | 2021 | | | | | | | | | | | | 332.76 | | | | 3.39 | |
| | FIXED | | | 1.60 | | | | 1997 | | | | 2021 | | | | | | | | | | | | 572.31 | | | | 5.83 | |
| | FIXED | | | 2.30 | | | | 1997 | | | | 2021 | | | | | | | | | | | | 586.25 | | | | 5.97 | |
| | FIXED | | | 2.40 | | | | 1999 | | | | 2018 | | | | 43,800.00 | | | | 445.84 | | | | 4,026.66 | | | | 40.99 | |
| | | | | | | | |
| | FIXED | | | | | | | 1999 | | | | 2013 | | | | 43,800.00 | | | | 445.84 | | | | 0.00 | | | | 0.00 | |
| | | | | | | | | | | | | | | | | | | | | | | | | | | | | | |
| | FIXED | | | 2.40 | | | | 1999 | | | | 2013 | | | | | | | | | | | | 0.00 | | | | 0.00 | |
| | FIXED | | | 1.80 | | | | 1999 | | | | 2013 | | | | | | | | | | | | 0.00 | | | | 0.00 | |
| | FIXED | | | 1.40 | | | | 1999 | | | | 2013 | | | | | | | | | | | | 0.00 | | | | 0.00 | |
| | FIXED | | | 2.16 | | | | 2007 | | | | 2021 | | | | 39,000.00 | | | | 396.98 | | | | 24,650.00 | | | | 250.91 | |
| | FIXED | | | 1.95 | | | | 2000 | | | | 2013 | | | | 16,660.00 | | | | 169.58 | | | | 833.00 | | | | 8.48 | |
| | | | | | | | |
| | FIXED | | | | | | | 2001 | | | | 2047 | | | | 20,308.18 | | | | 206.72 | | | | 823.92 | | | | 8.39 | |
| | | | | | | | | | | | | | | | | | | | | | | | | | | | | | |
| | FIXED | | | 1.40 | | | | 2001 | | | | 2013 | | | | | | | | | | | | 0.00 | | | | 0.00 | |
| | FIXED | | | 1.59 | | | | 2001 | | | | 2015 | | | | | | | | | | | | 823.92 | | | | 8.39 | |
| | FIXED | | | 1.89 | | | | 2005 | | | | 2014 | | | | 16,640.13 | | | | 169.38 | | | | 188.13 | | | | 1.91 | |
| | FIXED | | | 2.69 | | | | 2006 | | | | 2020 | | | | 19,113.66 | | | | 194.56 | | | | 2,452.78 | | | | 24.97 | |
| | JAPAN LIBOR | | | 2.40 | | | | 2008 | | | | 2013 | | | | 4,130.78 | | | | 42.05 | | | | 0.00 | | | | 0.00 | |
| | FIXED | | | 2.49 | | | | 2008 | | | | 2017 | | | | 23,407.76 | | | | 238.27 | | | | 13,545.01 | | | | 137.87 | |
| | FIXED | | | 2.35 | | | | 2008 | | | | 2021 | | | | 33,963.31 | | | | 345.71 | | | | 17,049.76 | | | | 173.55 | |
| | JAPAN LIBOR | | | 3.18 | | | | 2008 | | | | 2013 | | | | 5,993.53 | | | | 61.01 | | | | 0.00 | | | | 0.00 | |
| | FIXED | | | 3.03 | | | | 2009 | | | | 2022 | | | | 23,554.52 | | | | 239.76 | | | | 4,236.72 | | | | 43.13 | |
| | JAPAN LIBOR | | | 3.96 | | | | 2009 | | | | 2014 | | | | 4,156.68 | | | | 42.31 | | | | 423.28 | | | | 4.31 | |
| | | | |
KOREAN WON | | | | 182,093.73 | | | | 169.53 | | | | 58,643.70 | | | | 54.60 | |
| | | | | | | | | | | | | | | | | | | | | | | | | | | | | | |
| | FIXED | | | 2.50 | | | | 1998 | | | | 2030 | | | | 21,172.00 | | | | 19.71 | | | | 2,118.15 | | | | 1.97 | |
| | FIXED | | | 2.50 | | | | 2007 | | | | 2030 | | | | 28,724.00 | | | | 26.74 | | | | 18,591.26 | | | | 17.31 | |
| | FIXED | | | 1.50 | | | | 2005 | | | | 2035 | | | | 23,041.00 | | | | 21.45 | | | | 22,613.84 | | | | 21.05 | |
| | | | | | | | | 2009 | | | | 2049 | | | | 14,953.00 | | | | 13.92 | | | | 6,926.22 | | | | 6.45 | |
| | INTEREST FREE | | | | | | | 2009 | | | | 2049 | | | | | | | | | | | | 863.01 | | | | 0.80 | |
| | FIXED | | | 0.10 | | | | 2009 | | | | 2049 | | | | | | | | | | | | 6,063.21 | | | | 5.64 | |
| | FIXED | | | | | | | 2009 | | | | 2049 | | | | 2,961.29 | | | | 2.76 | | | | 0.00 | | | | 0.00 | |
| | INTEREST FREE | | | | | | | 2009 | | | | 2049 | | | | 0.00 | | | | 0.00 | | | | 1,766.77 | | | | 1.64 | |
| | FIXED | | | 0.10 | | | | 2009 | | | | 2049 | | | | 0.00 | | | | 0.00 | | | | 4,665.54 | | | | 4.34 | |
| | INTEREST FREE | | | | | | | 2012 | | | | 2052 | | | | 76,919.44 | | | | 71.61 | | | | 1,111.06 | | | | 1.03 | |
| | FIXED | | | 0.15 | | | | 2011 | | | | 2051 | | | | 14,323.00 | | | | 13.33 | | | | 850.86 | | | | 0.79 | |
| | | | |
KUWAIT DINAR | | | | 6.15 | | | | 21.29 | | | | 1.82 | | | | 6.29 | |
| | | | | | | | | | | | | | | | | | | | | | | | | | | | | | |
| | FIXED | | | 4.00 | | | | 1998 | | | | 2018 | | | | 6.15 | | | | 21.29 | | | | 1.82 | | | | 6.29 | |
| | | | |
SAUDI RIAL | | | | 75.00 | | | | 20.00 | | | | 3.66 | | | | 0.98 | |
| | | | | | | | | | | | | | | | | | | | | | | | | | | | | | |
| | FIXED | | | 2.00 | | | | 2005 | | | | 2030 | | | | 75.00 | | | | 20.00 | | | | 3.66 | | | | 0.98 | |
| | | | |
SPECIAL DRAWING RIGHT | | | | 765.74 | | | | 1,173.60 | | | | 530.72 | | | | 813.39 | |
| | | | | | | | | | | | | | | | | | | | | | | | | | | | | | |
| | FIXED | | | 1.00 | | | | 1978 | | | | 2018 | | | | 5.92 | | | | 9.08 | | | | 3.26 | | | | 4.99 | |
| | FIXED | | | 1.00 | | | | 1980 | | | | 2020 | | | | 5.33 | | | | 8.16 | | | | 3.24 | | | | 4.97 | |
T-14
EXTERNAL DEBT OF THE REPUBLIC OF THE PHILIPPINES(1)
As of September 30, 2013
(In millions)
| | | | | | | | | | | | | | | | | | | | | | | | | | | | | | |
Currency | | Interest Rate Basis | | Interest Rate +
Spread/
Service Charge
(Per Annum) | | | | | | | | | Original Amount
Contracted | | | Outstanding Balance
as of September 30,
2013 | |
| | | | Year
Contracted | | | Year of
Maturity | | | (In Original
Currency) | | | (In US
Dollars)(2) | | | (In Original
Currency) | | | (In US
Dollars)(2) | |
| | FIXED | | | 1.00 | | | | 1981 | | | | 2021 | | | | 5.84 | | | | 8.95 | | | | 3.74 | | | | 5.73 | |
| | FIXED | | | 1.00 | | | | 1986 | | | | 2026 | | | | 39.81 | | | | 61.01 | | | | 29.57 | | | | 45.32 | |
| | FIXED | | | 1.00 | | | | 1988 | | | | 2023 | | | | 8.25 | | | | 12.64 | | | | 5.01 | | | | 7.67 | |
| | FIXED | | | 1.00 | | | | 1988 | | | | 2023 | | | | 34.24 | | | | 52.48 | | | | 22.43 | | | | 34.38 | |
| | FIXED | | | 1.00 | | | | 1988 | | | | 2023 | | | | 36.13 | | | | 55.38 | | | | 23.67 | | | | 36.28 | |
| | FIXED | | | 1.00 | | | | 1988 | | | | 2023 | | | | 12.21 | | | | 18.71 | | | | 8.14 | | | | 12.47 | |
| | FIXED | | | 1.00 | | | | 1988 | | | | 2023 | | | | 2.63 | | | | 4.04 | | | | 2.63 | | | | 4.04 | |
| | FIXED | | | 1.00 | | | | 1989 | | | | 2023 | | | | 18.69 | | | | 28.64 | | | | 12.46 | | | | 19.10 | |
| | FIXED | | | 1.00 | | | | 1989 | | | | 2023 | | | | 11.42 | | | | 17.51 | | | | 7.62 | | | | 11.67 | |
| | FIXED | | | 1.00 | | | | 1990 | | | | 2025 | | | | 14.63 | | | | 22.42 | | | | 10.22 | | | | 15.66 | |
| | FIXED | | | 1.00 | | | | 1989 | | | | 2024 | | | | 12.44 | | | | 19.06 | | | | 8.83 | | | | 13.53 | |
| | FIXED | | | 1.00 | | | | 1990 | | | | 2025 | | | | 62.73 | | | | 96.14 | | | | 43.81 | | | | 67.15 | |
| | FIXED | | | 1.00 | | | | 1991 | | | | 2025 | | | | 22.50 | | | | 34.49 | | | | 15.71 | | | | 24.09 | |
| | FIXED | | | 1.00 | | | | 1989 | | | | 2024 | | | | 38.17 | | | | 58.50 | | | | 25.03 | | | | 38.36 | |
| | FIXED | | | 1.00 | | | | 1990 | | | | 2025 | | | | 36.70 | | | | 56.24 | | | | 27.52 | | | | 42.18 | |
| | FIXED | | | 1.00 | | | | 1990 | | | | 2025 | | | | 10.91 | | | | 16.73 | | | | 8.19 | | | | 12.54 | |
| | FIXED | | | 1.00 | | | | 1990 | | | | 2025 | | | | 10.46 | | | | 16.04 | | | | 7.31 | | | | 11.20 | |
| | FIXED | | | 1.00 | | | | 1991 | | | | 2026 | | | | 25.89 | | | | 39.68 | | | | 20.40 | | | | 31.26 | |
| | FIXED | | | 1.00 | | | | 1991 | | | | 2026 | | | | 19.45 | | | | 29.81 | | | | 15.33 | | | | 23.49 | |
| | FIXED | | | 1.00 | | | | 1992 | | | | 2026 | | | | 20.25 | | | | 31.04 | | | | 15.96 | | | | 24.45 | |
| | FIXED | | | 1.00 | | | | 1992 | | | | 2027 | | | | 9.13 | | | | 14.00 | | | | 9.13 | | | | 14.00 | |
| | FIXED | | | 1.00 | | | | 1993 | | | | 2028 | | | | 13.48 | | | | 20.66 | | | | 11.52 | | | | 17.66 | |
| | FIXED | | | 1.00 | | | | 1995 | | | | 2029 | | | | 20.38 | | | | 31.23 | | | | 17.55 | | | | 26.90 | |
| | FIXED | | | 1.00 | | | | 1995 | | | | 2029 | | | | 6.49 | | | | 9.94 | | | | 5.59 | | | | 8.56 | |
| | FIXED | | | 1.00 | | | | 1996 | | | | 2030 | | | | 4.76 | | | | 7.30 | | | | 4.05 | | | | 6.20 | |
| | FIXED | | | 1.00 | | | | 1995 | | | | 2030 | | | | 8.51 | | | | 13.05 | | | | 7.35 | | | | 11.26 | |
| | FIXED | | | 1.00 | | | | 1995 | | | | 2030 | | | | 12.12 | | | | 18.58 | | | | 10.46 | | | | 16.04 | |
| | FIXED | | | 1.00 | | | | 1997 | | | | 2031 | | | | 6.77 | | | | 10.37 | | | | 5.76 | | | | 8.83 | |
| | FIXED | | | 1.00 | | | | 1997 | | | | 2031 | | | | 1.97 | | | | 3.01 | | | | 1.70 | | | | 2.61 | |
| | FIXED | | | 1.00 | | | | 1998 | | | | 2032 | | | | 9.27 | | | | 14.21 | | | | 7.95 | | | | 12.18 | |
| | FIXED | | | 1.00 | | | | 1998 | | | | 2032 | | | | 5.62 | | | | 8.61 | | | | 4.90 | | | | 7.51 | |
| | FIXED | | | 0.75 | | | | 1991 | | | | 2026 | | | | 50.00 | | | | 76.63 | | | | 31.25 | | | | 47.89 | |
| | FIXED | | | 0.75 | | | | 1992 | | | | 2027 | | | | 26.40 | | | | 40.46 | | | | 17.08 | | | | 26.17 | |
| | FIXED | | | 0.75 | | | | 1993 | | | | 2028 | | | | 50.50 | | | | 77.40 | | | | 18.96 | | | | 29.06 | |
| | FIXED | | | 0.75 | | | | 1996 | | | | 2035 | | | | 6.15 | | | | 9.43 | | | | 2.89 | | | | 4.42 | |
| | FIXED | | | 0.75 | | | | 1998 | | | | 2038 | | | | 11.00 | | | | 16.86 | | | | 8.03 | | | | 12.30 | |
| | FIXED | | | 0.75 | | | | 2002 | | | | 2041 | | | | 11.60 | | | | 17.78 | | | | 8.81 | | | | 13.51 | |
| | FIXED | | | 0.75 | | | | 2005 | | | | 2045 | | | | 12.35 | | | | 18.93 | | | | 11.74 | | | | 18.00 | |
| | FIXED | | | 0.75 | | | | 2008 | | | | 2048 | | | | 16.15 | | | | 24.75 | | | | 3.93 | | | | 6.03 | |
| | LIBOR BASE | | | 0.43 | | | | 2009 | | | | 2028 | | | | 10.69 | | | | 16.38 | | | | 9.95 | | | | 15.25 | |
| | FIXED | | | 0.75 | | | | 2000 | | | | 2040 | | | | 6.00 | | | | 9.20 | | | | 4.67 | | | | 7.16 | |
| | FIXED | | | 0.75 | | | | 2000 | | | | 2040 | | | | 4.50 | | | | 6.90 | | | | 4.01 | | | | 6.15 | |
| | FIXED | | | 1.00 | | | | 1974 | | | | 2014 | | | | 2.15 | | | | 3.30 | | | | 0.54 | | | | 0.83 | |
| | FIXED | | | 1.00 | | | | 1979 | | | | 2019 | | | | 5.15 | | | | 7.89 | | | | 2.83 | | | | 4.34 | |
| | | | |
UNITED STATES DOLLAR | | | | 11,094.59 | | | | 11,094.59 | | | | 7,351.88 | | | | 7,351.88 | |
| | | | | | | | | | | | | | | | | | | | | | | | | | | | | | |
| | LIBOR BASE | | | 1.04 | | | | 1995 | | | | 2020 | | | | 30.00 | | | | 30.00 | | | | 1.72 | | | | 1.72 | |
| | LIBOR BASE | | | 1.04 | | | | 1996 | | | | 2022 | | | | 9.50 | | | | 9.50 | | | | 1.92 | | | | 1.92 | |
| | LIBOR BASE | | | 1.03 | | | | 1995 | | | | 2022 | | | | 15.00 | | | | 15.00 | | | | 3.68 | | | | 3.68 | |
| | LIBOR BASE | | | 1.04 | | | | 1997 | | | | 2021 | | | | 18.50 | | | | 18.50 | | | | 0.86 | | | | 0.86 | |
| | LIBOR BASE | | | 1.03 | | | | 1997 | | | | 2021 | | | | 167.00 | | | | 167.00 | | | | 53.33 | | | | 53.33 | |
| | LIBOR BASE | | | 1.06 | | | | 1998 | | | | 2022 | | | | 93.00 | | | | 93.00 | | | | 1.38 | | | | 1.38 | |
| | LIBOR BASE | | | 1.06 | | | | 1998 | | | | 2022 | | | | 20.22 | | | | 20.22 | | | | 2.19 | | | | 2.19 | |
| | LIBOR BASE | | | 1.03 | | | | 1998 | | | | 2022 | | | | 15.70 | | | | 15.70 | | | | 6.64 | | | | 6.64 | |
| | LIBOR BASE | | | 1.07 | | | | 1998 | | | | 2022 | | | | 71.00 | | | | 71.00 | | | | 15.47 | | | | 15.47 | |
| | LIBOR BASE | | | 1.24 | | | | 1999 | | | | 2025 | | | | 53.00 | | | | 53.00 | | | | 24.18 | | | | 24.18 | |
| | LIBOR BASE | | | 1.02 | | | | 1999 | | | | 2023 | | | | 24.30 | | | | 24.30 | | | | 0.95 | | | | 0.95 | |
| | LIBOR BASE | | | 1.01 | | | | 1999 | | | | 2023 | | | | 93.16 | | | | 93.16 | | | | 42.53 | | | | 42.53 | |
| | LIBOR BASE | | | 1.06 | | | | 1999 | | | | 2023 | | | | 60.00 | | | | 60.00 | | | | 32.54 | | | | 32.54 | |
| | LIBOR BASE | | | 1.06 | | | | 2000 | | | | 2024 | | | | 75.00 | | | | 75.00 | | | | 1.35 | | | | 1.35 | |
| | LIBOR BASE | | | 1.06 | | | | 2000 | | | | 2015 | | | | 100.00 | | | | 100.00 | | | | 12.10 | | | | 12.10 | |
| | LIBOR BASE | | | 1.06 | | | | 2000 | | | | 2025 | | | | 75.00 | | | | 75.00 | | | | 50.17 | | | | 50.17 | |
| | LIBOR BASE | | | 1.06 | | | | 2000 | | | | 2025 | | | | 25.00 | | | | 25.00 | | | | 14.15 | | | | 14.15 | |
| | LIBOR BASE | | | 1.04 | | | | 2001 | | | | 2025 | | | | 75.00 | | | | 75.00 | | | | 49.24 | | | | 49.24 | |
| | LIBOR BASE | | | 1.06 | | | | 2001 | | | | 2016 | | | | 75.00 | | | | 75.00 | | | | 27.58 | | | | 27.58 | |
| | LIBOR BASE | | | 1.06 | | | | 2003 | | | | 2018 | | | | 150.00 | | | | 150.00 | | | | 83.93 | | | | 83.93 | |
| | LIBOR BASE | | | 1.03 | | | | 2005 | | | | 2019 | | | | 200.00 | | | | 200.00 | | | | 136.14 | | | | 136.14 | |
T-15
EXTERNAL DEBT OF THE REPUBLIC OF THE PHILIPPINES(1)
As of September 30, 2013
(In millions)
| | | | | | | | | | | | | | | | | | | | | | | | | | | | | | |
Currency | | Interest Rate Basis | | Interest Rate +
Spread/
Service Charge
(Per Annum) | | | | | | | | | Original Amount
Contracted | | | Outstanding Balance
as of September 30,
2013 | |
| | | | Year
Contracted | | | Year of
Maturity | | | (In Original
Currency) | | | (In US
Dollars)(2) | | | (In Original
Currency) | | | (In US
Dollars)(2) | |
| | LIBOR BASE | | | 1.03 | | | | 2005 | | | | 2030 | | | | 13.00 | | | | 13.00 | | | | 12.11 | | | | 12.11 | |
| | LIBOR BASE | | | 1.64 | | | | 2005 | | | | 2020 | | | | 150.00 | | | | 150.00 | | | | 124.94 | | | | 124.94 | |
| | LIBOR BASE | | | 1.03 | | | | 2006 | | | | 2021 | | | | 200.00 | | | | 200.00 | | | | 163.40 | | | | 163.40 | |
| | LIBOR BASE | | | 1.03 | | | | 2006 | | | | 2021 | | | | 450.00 | | | | 450.00 | | | | 367.65 | | | | 367.65 | |
| | LIBOR BASE | | | 5.77 | | | | 2007 | | | | 2022 | | | | 250.00 | | | | 250.00 | | | | 204.25 | | | | 204.25 | |
| | LIBOR BASE | | | 1.03 | | | | 2007 | | | | 2025 | | | | 33.80 | | | | 33.80 | | | | 15.93 | | | | 15.93 | |
| | LIBOR BASE | | | 0.64 | | | | 2008 | | | | 2023 | | | | 250.00 | | | | 250.00 | | | | 236.89 | | | | 236.89 | |
| | LIBOR BASE | | | 0.63 | | | | 2008 | | | | 2027 | | | | 70.00 | | | | 70.00 | | | | 10.71 | | | | 10.71 | |
| | LIBOR BASE | | | 0.61 | | | | 2008 | | | | 2023 | | | | 300.00 | | | | 300.00 | | | | 278.75 | | | | 278.75 | |
| | LIBOR BASE | | | 0.66 | | | | 2009 | | | | 2033 | | | | 31.10 | | | | 31.10 | | | | 22.79 | | | | 22.79 | |
| | LIBOR BASE | | | 0.66 | | | | 2009 | | | | 2024 | | | | 250.00 | | | | 250.00 | | | | 238.48 | | | | 238.48 | |
| | LIBOR BASE | | | 0.63 | | | | 2009 | | | | 2024 | | | | 225.00 | | | | 225.00 | | | | 219.94 | | | | 219.94 | |
| | LIBOR BASE | | | 0.66 | | | | 2010 | | | | 2035 | | | | 400.00 | | | | 400.00 | | | | 192.61 | | | | 192.61 | |
| | LIBOR BASE | | | 0.62 | | | | 2011 | | | | 2025 | | | | 200.00 | | | | 200.00 | | | | 200.00 | | | | 200.00 | |
| | LIBOR BASE | | | 0.62 | | | | 2012 | | | | 2026 | | | | 300.00 | | | | 300.00 | | | | 300.00 | | | | 300.00 | |
| | LIBOR BASE | | | 0.64 | | | | 2012 | | | | 2027 | | | | 350.00 | | | | 350.00 | | | | 350.00 | | | | 350.00 | |
| | LIBOR BASE | | | 0.62 | | | | 2012 | | | | 2036 | | | | 62.00 | | | | 62.00 | | | | 1.05 | | | | 1.05 | |
| | LIBOR BASE | | | 0.66 | | | | 2013 | | | | 2032 | | | | 100.00 | | | | 100.00 | | | | 0.04 | | | | 0.04 | |
| | COST QUA. BOR. IBRD 6M | | | 5.06 | | | | 1995 | | | | 2015 | | | | 18.00 | | | | 18.00 | | | | 0.26 | | | | 0.26 | |
| | LIBOR BASE | | | 0.86 | | | | 1995 | | | | 2015 | | | | 16.70 | | | | 16.70 | | | | 2.01 | | | | 2.01 | |
| | LIBOR BASE | | | 0.99 | | | | 1996 | | | | 2017 | | | | 113.40 | | | | 113.40 | | | | 24.97 | | | | 24.97 | |
| | LIBOR BASE | | | 0.99 | | | | 1996 | | | | 2017 | | | | 50.00 | | | | 50.00 | | | | 15.77 | | | | 15.77 | |
| | LIBOR BASE | | | 0.99 | | | | 1996 | | | | 2017 | | | | 58.00 | | | | 58.00 | | | | 12.12 | | | | 12.12 | |
| | LIBOR BASE | | | 0.66 | | | | 1998 | | | | 2018 | | | | 50.00 | | | | 50.00 | | | | 15.16 | | | | 15.16 | |
| | LIBOR BASE | | | 0.66 | | | | 1998 | | | | 2018 | | | | 10.00 | | | | 10.00 | | | | 4.30 | | | | 4.30 | |
| | LIBOR BASE | | | 0.66 | | | | 1998 | | | | 2018 | | | | 19.00 | | | | 19.00 | | | | 7.43 | | | | 7.43 | |
| | LIBOR BASE | | | 0.94 | | | | 1998 | | | | 2018 | | | | 300.00 | | | | 300.00 | | | | 43.51 | | | | 43.51 | |
| | LIBOR BASE | | | 0.66 | | | | 1999 | | | | 2019 | | | | 27.50 | | | | 27.50 | | | | 10.71 | | | | 10.71 | |
| | LIBOR BASE | | | 0.93 | | | | 1999 | | | | 2019 | | | | 100.00 | | | | 100.00 | | | | 29.16 | | | | 29.16 | |
| | LIBOR BASE | | | 0.87 | | | | 2000 | | | | 2020 | | | | 100.00 | | | | 100.00 | | | | 58.19 | | | | 58.19 | |
| | LIBOR BASE | | | 1.01 | | | | 2000 | | | | 2020 | | | | 150.00 | | | | 150.00 | | | | 71.87 | | | | 71.87 | |
| | LIBOR BASE | | | 1.01 | | | | 2000 | | | | 2020 | | | | 4.79 | | | | 4.79 | | | | 2.04 | | | | 2.04 | |
| | LIBOR BASE | | | 0.98 | | | | 2001 | | | | 2021 | | | | 60.00 | | | | 60.00 | | | | 32.97 | | | | 32.97 | |
| | LIBOR BASE | | | 0.70 | | | | 2010 | | | | 2034 | | | | 405.00 | | | | 405.00 | | | | 324.70 | | | | 324.70 | |
| | FIXED | | | 5.54 | | | | 2007 | | | | 2026 | | | | 250.00 | | | | 250.00 | | | | 250.00 | | | | 250.00 | |
| | FIXED | | | 0.96 | | | | 2013 | | | | 2037 | | | | 100.00 | | | | 100.00 | | | | 0.25 | | | | 0.25 | |
| | LIBOR BASE | | | 0.87 | | | | 2013 | | | | 2037 | | | | 300.00 | | | | 300.00 | | | | 300.00 | | | | 300.00 | |
| | | | | | | | |
| | | | | | | | | 2007 | | | | 2027 | | | | 50.00 | | | | 50.00 | | | | 49.84 | | | | 49.84 | |
| | | | | | | | | | | | | | | | | | | | | | | | | | | | | | |
| | FIXED | | | 5.16 | | | | 2007 | | | | 2027 | | | | | | | | | | | | 2.50 | | | | 2.50 | |
| | FIXED | | | 4.69 | | | | 2007 | | | | 2027 | | | | | | | | | | | | 1.50 | | | | 1.50 | |
| | FIXED | | | 3.98 | | | | 2007 | | | | 2027 | | | | | | | | | | | | 1.00 | | | | 1.00 | |
| | FIXED | | | 4.41 | | | | 2007 | | | | 2027 | | | | | | | | | | | | 5.35 | | | | 5.35 | |
| | FIXED | | | 4.35 | | | | 2007 | | | | 2027 | | | | | | | | | | | | 2.51 | | | | 2.51 | |
| | FIXED | | | 3.60 | | | | 2007 | | | | 2027 | | | | | | | | | | | | 2.41 | | | | 2.41 | |
| | FIXED | | | 3.85 | | | | 2007 | | | | 2027 | | | | | | | | | | | | 5.00 | | | | 5.00 | |
| | FIXED | | | 2.83 | | | | 2007 | | | | 2027 | | | | | | | | | | | | 0.74 | | | | 0.74 | |
| | FIXED | | | 2.60 | | | | 2007 | | | | 2027 | | | | | | | | | | | | 4.25 | | | | 4.25 | |
| | FIXED | | | 1.23 | | | | 2007 | | | | 2027 | | | | | | | | | | | | 14.23 | | | | 14.23 | |
| | FIXED | | | 2.28 | | | | 2007 | | | | 2027 | | | | | | | | | | | | 7.48 | | | | 7.48 | |
| | FIXED | | | 0.93 | | | | 2007 | | | | 2027 | | | | | | | | | | | | 2.88 | | | | 2.88 | |
| | LIBOR BASE | | | 0.73 | | | | 2008 | | | | 2033 | | | | 200.00 | | | | 200.00 | | | | 200.00 | | | | 200.00 | |
| | | | | | | | |
| | | | | | | | | 2008 | | | | 2032 | | | | 232.00 | | | | 232.00 | | | | 75.74 | | | | 75.74 | |
| | | | | | | | | | | | | | | | | | | | | | | | | | | | | | |
| | FIXED | | | 3.67 | | | | 2008 | | | | 2032 | | | | | | | | | | | | 0.58 | | | | 0.58 | |
| | FIXED | | | 4.17 | | | | 2008 | | | | 2032 | | | | | | | | | | | | 3.00 | | | | 3.00 | |
| | FIXED | | | 4.14 | | | | 2008 | | | | 2032 | | | | | | | | | | | | 0.04 | | | | 0.04 | |
| | FIXED | | | 3.51 | | | | 2008 | | | | 2032 | | | | | | | | | | | | 1.98 | | | | 1.98 | |
| | FIXED | | | 3.73 | | | | 2008 | | | | 2032 | | | | | | | | | | | | 6.84 | | | | 6.84 | |
| | FIXED | | | 2.66 | | | | 2008 | | | | 2032 | | | | | | | | | | | | 6.06 | | | | 6.06 | |
| | FIXED | | | 2.47 | | | | 2008 | | | | 2032 | | | | | | | | | | | | 9.30 | | | | 9.30 | |
| | FIXED | | | 0.78 | | | | 2008 | | | | 2032 | | | | | | | | | | | | 12.79 | | | | 12.79 | |
| | FIXED | | | 0.57 | | | | 2008 | | | | 2032 | | | | | | | | | | | | 35.15 | | | | 35.15 | |
| | FIXED | | | 1.89 | | | | 2009 | | | | 2033 | | | | 10.00 | | | | 10.00 | | | | 8.97 | | | | 8.97 | |
| | | | | | | | |
| | | | | | | | | 2005 | | | | 2025 | | | | 16.00 | | | | 16.00 | | | | 8.94 | | | | 8.94 | |
| | | | | | | | | | | | | | | | | | | | | | | | | | | | | | |
T-16
EXTERNAL DEBT OF THE REPUBLIC OF THE PHILIPPINES(1)
As of September 30, 2013
(In millions)
| | | | | | | | | | | | | | | | | | | | | | | | | | | | | | |
Currency | | Interest Rate Basis | | Interest Rate +
Spread/
Service Charge
(Per Annum) | | | | | | | | | Original Amount
Contracted | | | Outstanding Balance
as of September 30,
2013 | |
| | | | Year
Contracted | | | Year of
Maturity | | | (In Original
Currency) | | | (In US
Dollars)(2) | | | (In Original
Currency) | | | (In US
Dollars)(2) | |
| | FIXED | | | 6.06 | | | | 2005 | | | | 2025 | | | | | | | | | | | | 0.38 | | | | 0.38 | |
| | FIXED | | | 5.89 | | | | 2005 | | | | 2025 | | | | | | | | | | | | 0.04 | | | | 0.04 | |
| | FIXED | | | 5.85 | | | | 2005 | | | | 2025 | | | | | | | | | | | | 0.01 | | | | 0.01 | |
| | FIXED | | | 5.88 | | | | 2005 | | | | 2025 | | | | | | | | | | | | 0.09 | | | | 0.09 | |
| | FIXED | | | 4.73 | | | | 2005 | | | | 2025 | | | | | | | | | | | | 0.21 | | | | 0.21 | |
| | FIXED | | | 5.02 | | | | 2005 | | | | 2025 | | | | | | | | | | | | 0.14 | | | | 0.14 | |
| | FIXED | | | 3.84 | | | | 2005 | | | | 2025 | | | | | | | | | | | | 0.40 | | | | 0.40 | |
| | FIXED | | | 4.07 | | | | 2005 | | | | 2025 | | | | | | | | | | | | 0.67 | | | | 0.67 | |
| | FIXED | | | 4.38 | | | | 2005 | | | | 2025 | | | | | | | | | | | | 0.37 | | | | 0.37 | |
| | FIXED | | | 3.02 | | | | 2005 | | | | 2025 | | | | | | | | | | | | 0.52 | | | | 0.52 | |
| | FIXED | | | 3.68 | | | | 2005 | | | | 2025 | | | | | | | | | | | | 1.48 | | | | 1.48 | |
| | FIXED | | | 2.46 | | | | 2005 | | | | 2025 | | | | | | | | | | | | 0.89 | | | | 0.89 | |
| | FIXED | | | 0.84 | | | | 2005 | | | | 2025 | | | | | | | | | | | | 1.74 | | | | 1.74 | |
| | FIXED | | | 0.85 | | | | 2005 | | | | 2025 | | | | | | | | | | | | 1.02 | | | | 1.02 | |
| | FIXED | | | 2.19 | | | | 2005 | | | | 2025 | | | | | | | | | | | | 0.61 | | | | 0.61 | |
| | FIXED | | | 0.94 | | | | 2005 | | | | 2025 | | | | | | | | | | | | 0.37 | | | | 0.37 | |
| | | | | | | | |
| | | | | | | | | 2004 | | | | 2023 | | | | 5.00 | | | | 5.00 | | | | 3.79 | | | | 3.79 | |
| | | | | | | | | | | | | | | | | | | | | | | | | | | | | | |
| | FIXED | | | 5.56 | | | | 2004 | | | | 2023 | | | | | | | | | | | | 0.04 | | | | 0.04 | |
| | FIXED | | | 5.87 | | | | 2004 | | | | 2023 | | | | | | | | | | | | 0.25 | | | | 0.25 | |
| | FIXED | | | 5.83 | | | | 2004 | | | | 2023 | | | | | | | | | | | | 0.19 | | | | 0.19 | |
| | FIXED | | | 5.84 | | | | 2004 | | | | 2023 | | | | | | | | | | | | 0.04 | | | | 0.04 | |
| | FIXED | | | 4.62 | | | | 2004 | | | | 2023 | | | | | | | | | | | | 0.44 | | | | 0.44 | |
| | FIXED | | | 4.98 | | | | 2004 | | | | 2023 | | | | | | | | | | | | 0.63 | | | | 0.63 | |
| | FIXED | | | 3.74 | | | | 2004 | | | | 2023 | | | | | | | | | | | | 0.40 | | | | 0.40 | |
| | FIXED | | | 3.92 | | | | 2004 | | | | 2023 | | | | | | | | | | | | 0.32 | | | | 0.32 | |
| | FIXED | | | 4.17 | | | | 2004 | | | | 2023 | | | | | | | | | | | | 0.40 | | | | 0.40 | |
| | FIXED | | | 2.82 | | | | 2004 | | | | 2023 | | | | | | | | | | | | 0.46 | | | | 0.46 | |
| | FIXED | | | 3.71 | | | | 2004 | | | | 2023 | | | | | | | | | | | | 0.45 | | | | 0.45 | |
| | FIXED | | | 2.56 | | | | 2004 | | | | 2023 | | | | | | | | | | | | 0.17 | | | | 0.17 | |
| | | | | | | | |
| | | | | | | | | 2002 | | | | 2019 | | | | 100.00 | | | | 100.00 | | | | 85.99 | | | | 85.99 | |
| | | | | | | | | | | | | | | | | | | | | | | | | | | | | | |
| | FIXED | | | 5.33 | | | | 2002 | | | | 2019 | | | | | | | | | | | | 8.65 | | | | 8.65 | |
| | FIXED | | | 5.52 | | | | 2002 | | | | 2019 | | | | | | | | | | | | 12.49 | | | | 12.49 | |
| | FIXED | | | 5.51 | | | | 2002 | | | | 2019 | | | | | | | | | | | | 10.59 | | | | 10.59 | |
| | FIXED | | | 5.29 | | | | 2002 | | | | 2019 | | | | | | | | | | | | 10.13 | | | | 10.13 | |
| | FIXED | | | 5.45 | | | | 2002 | | | | 2019 | | | | | | | | | | | | 8.32 | | | | 8.32 | |
| | FIXED | | | 5.57 | | | | 2002 | | | | 2019 | | | | | | | | | | | | 11.33 | | | | 11.33 | |
| | FIXED | | | 6.07 | | | | 2002 | | | | 2019 | | | | | | | | | | | | 5.01 | | | | 5.01 | |
| | FIXED | | | 5.90 | | | | 2002 | | | | 2019 | | | | | | | | | | | | 13.47 | | | | 13.47 | |
| | FIXED | | | 5.83 | | | | 2002 | | | | 2019 | | | | | | | | | | | | 1.79 | | | | 1.79 | |
| | FIXED | | | 5.84 | | | | 2002 | | | | 2019 | | | | | | | | | | | | 4.22 | | | | 4.22 | |
| | | | | | | | |
| | | | | | | | | 2007 | | | | 2026 | | | | 11.00 | | | | 11.00 | | | | 6.52 | | | | 6.52 | |
| | | | | | | | | | | | | | | | | | | | | | | | | | | | | | |
| | FIXED | | | 5.63 | | | | 2007 | | | | 2026 | | | | | | | | | | | | 0.10 | | | | 0.10 | |
| | FIXED | | | 5.14 | | | | 2007 | | | | 2026 | | | | | | | | | | | | 0.25 | | | | 0.25 | |
| | FIXED | | | 4.68 | | | | 2007 | | | | 2026 | | | | | | | | | | | | 0.05 | | | | 0.05 | |
| | FIXED | | | 3.96 | | | | 2007 | | | | 2026 | | | | | | | | | | | | 0.04 | | | | 0.04 | |
| | FIXED | | | 4.37 | | | | 2007 | | | | 2026 | | | | | | | | | | | | 0.12 | | | | 0.12 | |
| | FIXED | | | 4.31 | | | | 2007 | | | | 2026 | | | | | | | | | | | | 0.50 | | | | 0.50 | |
| | FIXED | | | 3.54 | | | | 2007 | | | | 2026 | | | | | | | | | | | | 0.63 | | | | 0.63 | |
| | FIXED | | | 3.79 | | | | 2007 | | | | 2026 | | | | | | | | | | | | 0.31 | | | | 0.31 | |
| | FIXED | | | 2.78 | | | | 2007 | | | | 2026 | | | | | | | | | | | | 1.14 | | | | 1.14 | |
| | FIXED | | | 0.91 | | | | 2007 | | | | 2026 | | | | | | | | | | | | 0.39 | | | | 0.39 | |
| | FIXED | | | 0.98 | | | | 2007 | | | | 2026 | | | | | | | | | | | | 1.10 | | | | 1.10 | |
| | FIXED | | | 2.22 | | | | 2007 | | | | 2026 | | | | | | | | | | | | 1.36 | | | | 1.36 | |
| | FIXED | | | 0.75 | | | | 2007 | | | | 2026 | | | | | | | | | | | | 0.53 | | | | 0.53 | |
| | | | | | | | |
| | | | | | | | | 2007 | | | | 2026 | | | | 83.75 | | | | 83.75 | | | | 59.48 | | | | 59.48 | |
| | | | | | | | | | | | | | | | | | | | | | | | | | | | | | |
| | FIXED | | | 5.63 | | | | 2007 | | | | 2026 | | | | | | | | | | | | 0.50 | | | | 0.50 | |
| | FIXED | | | 5.14 | | | | 2007 | | | | 2026 | | | | | | | | | | | | 2.00 | | | | 2.00 | |
| | FIXED | | | 4.68 | | | | 2007 | | | | 2026 | | | | | | | | | | | | 0.35 | | | | 0.35 | |
| | FIXED | | | 3.96 | | | | 2007 | | | | 2026 | | | | | | | | | | | | 1.69 | | | | 1.69 | |
| | FIXED | | | 4.37 | | | | 2007 | | | | 2026 | | | | | | | | | | | | 2.87 | | | | 2.87 | |
| | FIXED | | | 4.31 | | | | 2007 | | | | 2026 | | | | | | | | | | | | 2.44 | | | | 2.44 | |
| | FIXED | | | 3.54 | | | | 2007 | | | | 2026 | | | | | | | | | | | | 2.09 | | | | 2.09 | |
| | FIXED | | | 3.79 | | | | 2007 | | | | 2026 | | | | | | | | | | | | 4.56 | | | | 4.56 | |
T-17
EXTERNAL DEBT OF THE REPUBLIC OF THE PHILIPPINES(1)
As of September 30, 2013
(In millions)
| | | | | | | | | | | | | | | | | | | | | | | | | | | | | | |
Currency | | Interest Rate Basis | | Interest Rate +
Spread/
Service Charge
(Per Annum) | | | | | | | | | Original Amount
Contracted | | | Outstanding Balance
as of September 30,
2013 | |
| | | | Year
Contracted | | | Year of
Maturity | | | (In Original
Currency) | | | (In US
Dollars)(2) | | | (In Original
Currency) | | | (In US
Dollars)(2) | |
| | FIXED | | | 2.78 | | | | 2007 | | | | 2026 | | | | | | | | | | | | 4.61 | | | | 4.61 | |
| | FIXED | | | 2.55 | | | | 2007 | | | | 2026 | | | | | | | | | | | | 8.65 | | | | 8.65 | |
| | FIXED | | | 1.23 | | | | 2007 | | | | 2026 | | | | | | | | | | | | 9.33 | | | | 9.33 | |
| | FIXED | | | 2.22 | | | | 2007 | | | | 2026 | | | | | | | | | | | | 11.79 | | | | 11.79 | |
| | FIXED | | | 0.68 | | | | 2007 | | | | 2026 | | | | | | | | | | | | 8.60 | | | | 8.60 | |
| | | | | | | | |
| | | | | | | | | 2002 | | | | 2022 | | | | 100.00 | | | | 100.00 | | | | 73.43 | | | | 73.43 | |
| | | | | | | | | | | | | | | | | | | | | | | | | | | | | | |
| | FIXED | | | 5.30 | | | | 2002 | | | | 2022 | | | | | | | | | | | | 2.25 | | | | 2.25 | |
| | FIXED | | | 5.50 | | | | 2002 | | | | 2022 | | | | | | | | | | | | 1.11 | | | | 1.11 | |
| | FIXED | | | 5.50 | | | | 2002 | | | | 2022 | | | | | | | | | | | | 2.28 | | | | 2.28 | |
| | FIXED | | | 5.27 | | | | 2002 | | | | 2022 | | | | | | | | | | | | 3.58 | | | | 3.58 | |
| | FIXED | | | 5.45 | | | | 2002 | | | | 2022 | | | | | | | | | | | | 1.63 | | | | 1.63 | |
| | FIXED | | | 5.57 | | | | 2002 | | | | 2022 | | | | | | | | | | | | 4.60 | | | | 4.60 | |
| | FIXED | | | 6.07 | | | | 2002 | | | | 2022 | | | | | | | | | | | | 6.49 | | | | 6.49 | |
| | FIXED | | | 5.90 | | | | 2002 | | | | 2022 | | | | | | | | | | | | 3.76 | | | | 3.76 | |
| | FIXED | | | 5.85 | | | | 2002 | | | | 2022 | | | | | | | | | | | | 9.96 | | | | 9.96 | |
| | FIXED | | | 5.85 | | | | 2002 | | | | 2022 | | | | | | | | | | | | 4.60 | | | | 4.60 | |
| | FIXED | | | 4.54 | | | | 2002 | | | | 2022 | | | | | | | | | | | | 5.92 | | | | 5.92 | |
| | FIXED | | | 4.97 | | | | 2002 | | | | 2022 | | | | | | | | | | | | 5.93 | | | | 5.93 | |
| | FIXED | | | 3.67 | | | | 2002 | | | | 2022 | | | | | | | | | | | | 10.22 | | | | 10.22 | |
| | FIXED | | | 3.81 | | | | 2002 | | | | 2022 | | | | | | | | | | | | 5.42 | | | | 5.42 | |
| | FIXED | | | 2.69 | | | | 2002 | | | | 2022 | | | | | | | | | | | | 0.26 | | | | 0.26 | |
| | FIXED | | | 3.57 | | | | 2002 | | | | 2022 | | | | | | | | | | | | 3.22 | | | | 3.22 | |
| | FIXED | | | 2.46 | | | | 2002 | | | | 2022 | | | | | | | | | | | | 2.20 | | | | 2.20 | |
| | | | | | | | |
| | | | | | | | | 2003 | | | | 2022 | | | | 50.00 | | | | 50.00 | | | | 39.40 | | | | 39.40 | |
| | | | | | | | | | | | | | | | | | | | | | | | | | | | | | |
| | FIXED | | | 5.49 | | | | 2003 | | | | 2022 | | | | | | | | | | | | 1.19 | | | | 1.19 | |
| | FIXED | | | 5.49 | | | | 2003 | | | | 2022 | | | | | | | | | | | | 0.21 | | | | 0.21 | |
| | FIXED | | | 5.25 | | | | 2003 | | | | 2022 | | | | | | | | | | | | 0.45 | | | | 0.45 | |
| | FIXED | | | 5.42 | | | | 2003 | | | | 2022 | | | | | | | | | | | | 2.02 | | | | 2.02 | |
| | FIXED | | | 5.53 | | | | 2003 | | | | 2022 | | | | | | | | | | | | 1.99 | | | | 1.99 | |
| | FIXED | | | 6.03 | | | | 2003 | | | | 2022 | | | | | | | | | | | | 2.59 | | | | 2.59 | |
| | FIXED | | | 5.86 | | | | 2003 | | | | 2022 | | | | | | | | | | | | 3.99 | | | | 3.99 | |
| | FIXED | | | 5.81 | | | | 2003 | | | | 2022 | | | | | | | | | | | | 6.61 | | | | 6.61 | |
| | FIXED | | | 5.81 | | | | 2003 | | | | 2022 | | | | | | | | | | | | 5.39 | | | | 5.39 | |
| | FIXED | | | 4.53 | | | | 2003 | | | | 2022 | | | | | | | | | | | | 5.03 | | | | 5.03 | |
| | FIXED | | | 4.94 | | | | 2003 | | | | 2022 | | | | | | | | | | | | 3.25 | | | | 3.25 | |
| | FIXED | | | 3.66 | | | | 2003 | | | | 2022 | | | | | | | | | | | | 3.49 | | | | 3.49 | |
| | FIXED | | | 3.81 | | | | 2003 | | | | 2022 | | | | | | | | | | | | 2.74 | | | | 2.74 | |
| | FIXED | | | 4.04 | | | | 2003 | | | | 2022 | | | | | | | | | | | | 0.32 | | | | 0.32 | |
| | FIXED | | | 3.58 | | | | 2003 | | | | 2022 | | | | | | | | | | | | 0.13 | | | | 0.13 | |
| | | | | | | | |
| | | | | | | | | 2003 | | | | 2022 | | | | 33.60 | | | | 33.60 | | | | 25.05 | | | | 25.05 | |
| | | | | | | | | | | | | | | | | | | | | | | | | | | | | | |
| | FIXED | | | 5.49 | | | | 2003 | | | | 2022 | | | | | | | | | | | | 1.06 | | | | 1.06 | |
| | FIXED | | | 5.49 | | | | 2003 | | | | 2022 | | | | | | | | | | | | 0.59 | | | | 0.59 | |
| | FIXED | | | 5.25 | | | | 2003 | | | | 2022 | | | | | | | | | | | | 0.68 | | | | 0.68 | |
| | FIXED | | | 5.42 | | | | 2003 | | | | 2022 | | | | | | | | | | | | 0.72 | | | | 0.72 | |
| | FIXED | | | 5.53 | | | | 2003 | | | | 2022 | | | | | | | | | | | | 2.81 | | | | 2.81 | |
| | FIXED | | | 6.03 | | | | 2003 | | | | 2022 | | | | | | | | | | | | 3.00 | | | | 3.00 | |
| | FIXED | | | 5.86 | | | | 2003 | | | | 2022 | | | | | | | | | | | | 2.24 | | | | 2.24 | |
| | FIXED | | | 5.81 | | | | 2003 | | | | 2022 | | | | | | | | | | | | 5.54 | | | | 5.54 | |
| | FIXED | | | 5.81 | | | | 2003 | | | | 2022 | | | | | | | | | | | | 1.92 | | | | 1.92 | |
| | FIXED | | | 4.53 | | | | 2003 | | | | 2022 | | | | | | | | | | | | 2.72 | | | | 2.72 | |
| | FIXED | | | 4.94 | | | | 2003 | | | | 2022 | | | | | | | | | | | | 2.02 | | | | 2.02 | |
| | FIXED | | | 3.66 | | | | 2003 | | | | 2022 | | | | | | | | | | | | 1.30 | | | | 1.30 | |
| | FIXED | | | 3.81 | | | | 2003 | | | | 2022 | | | | | | | | | | | | 0.45 | | | | 0.45 | |
| | | | | | | | |
| | | | | | | | | 2003 | | | | 2023 | | | | 21.90 | | | | 21.90 | | | | 17.59 | | | | 17.59 | |
| | | | | | | | | | | | | | | | | | | | | | | | | | | | | | |
| | FIXED | | | 5.52 | | | | 2003 | | | | 2023 | | | | | | | | | | | | 0.22 | | | | 0.22 | |
| | FIXED | | | 5.28 | | | | 2003 | | | | 2023 | | | | | | | | | | | | 0.35 | | | | 0.35 | |
| | FIXED | | | 5.44 | | | | 2003 | | | | 2023 | | | | | | | | | | | | 0.42 | | | | 0.42 | |
| | FIXED | | | 5.54 | | | | 2003 | | | | 2023 | | | | | | | | | | | | 0.14 | | | | 0.14 | |
| | FIXED | | | 6.04 | | | | 2003 | | | | 2023 | | | | | | | | | | | | 0.81 | | | | 0.81 | |
| | FIXED | | | 5.87 | | | | 2003 | | | | 2023 | | | | | | | | | | | | 1.14 | | | | 1.14 | |
| | FIXED | | | 5.82 | | | | 2003 | | | | 2023 | | | | | | | | | | | | 2.19 | | | | 2.19 | |
| | FIXED | | | 5.83 | | | | 2003 | | | | 2023 | | | | | | | | | | | | 1.61 | | | | 1.61 | |
| | FIXED | | | 4.57 | | | | 2003 | | | | 2023 | | | | | | | | | | | | 0.88 | | | | 0.88 | |
T-18
EXTERNAL DEBT OF THE REPUBLIC OF THE PHILIPPINES(1)
As of September 30, 2013
(In millions)
| | | | | | | | | | | | | | | | | | | | | | | | | | | | | | |
Currency | | Interest Rate Basis | | Interest Rate +
Spread/
Service Charge
(Per Annum) | | | | | | | | | Original Amount
Contracted | | | Outstanding Balance
as of September 30,
2013 | |
| | | | Year
Contracted | | | Year of
Maturity | | | (In Original
Currency) | | | (In US
Dollars)(2) | | | (In Original
Currency) | | | (In US
Dollars)(2) | |
| | FIXED | | | 4.96 | | | | 2003 | | | | 2023 | | | | | | | | | | | | 0.25 | | | | 0.25 | |
| | FIXED | | | 3.70 | | | | 2003 | | | | 2023 | | | | | | | | | | | | 0.98 | | | | 0.98 | |
| | FIXED | | | 3.86 | | | | 2003 | | | | 2023 | | | | | | | | | | | | 0.60 | | | | 0.60 | |
| | FIXED | | | 4.11 | | | | 2003 | | | | 2023 | | | | | | | | | | | | 0.59 | | | | 0.59 | |
| | FIXED | | | 2.76 | | | | 2003 | | | | 2023 | | | | | | | | | | | | 0.11 | | | | 0.11 | |
| | FIXED | | | 3.65 | | | | 2003 | | | | 2023 | | | | | | | | | | | | 0.66 | | | | 0.66 | |
| | FIXED | | | 2.51 | | | | 2003 | | | | 2023 | | | | | | | | | | | | 1.90 | | | | 1.90 | |
| | FIXED | | | 2.32 | | | | 2003 | | | | 2023 | | | | | | | | | | | | 1.89 | | | | 1.89 | |
| | FIXED | | | 1.23 | | | | 2003 | | | | 2023 | | | | | | | | | | | | 2.53 | | | | 2.53 | |
| | FIXED | | | 1.23 | | | | 2003 | | | | 2023 | | | | | | | | | | | | 0.32 | | | | 0.32 | |
| | | | | | | | |
| | | | | | | | | 2004 | | | | 2024 | | | | 60.00 | | | | 60.00 | | | | 22.84 | | | | 22.84 | |
| | | | | | | | | | | | | | | | | | | | | | | | | | | | | | |
| | FIXED | | | 5.47 | | | | 2004 | | | | 2024 | | | | | | | | | | | | 0.69 | | | | 0.69 | |
| | FIXED | | | 5.56 | | | | 2004 | | | | 2024 | | | | | | | | | | | | 0.46 | | | | 0.46 | |
| | FIXED | | | 6.05 | | | | 2004 | | | | 2024 | | | | | | | | | | | | 0.71 | | | | 0.71 | |
| | FIXED | | | 5.88 | | | | 2004 | | | | 2024 | | | | | | | | | | | | 2.02 | | | | 2.02 | |
| | FIXED | | | 5.84 | | | | 2004 | | | | 2024 | | | | | | | | | | | | 0.82 | | | | 0.82 | |
| | FIXED | | | 5.86 | | | | 2004 | | | | 2024 | | | | | | | | | | | | 0.10 | | | | 0.10 | |
| | FIXED | | | 4.66 | | | | 2004 | | | | 2024 | | | | | | | | | | | | 9.52 | | | | 9.52 | |
| | FIXED | | | 4.99 | | | | 2004 | | | | 2024 | | | | | | | | | | | | 8.52 | | | | 8.52 | |
| | | | | | | | |
| | | | | | | | | 2005 | | | | 2024 | | | | 19.00 | | | | 19.00 | | | | 14.72 | | | | 14.72 | |
| | | | | | | | | | | | | | | | | | | | | | | | | | | | | | |
| | FIXED | | | 5.68 | | | | 2005 | | | | 2024 | | | | | | | | | | | | 0.09 | | | | 0.09 | |
| | FIXED | | | 6.09 | | | | 2005 | | | | 2024 | | | | | | | | | | | | 0.72 | | | | 0.72 | |
| | FIXED | | | 5.60 | | | | 2005 | | | | 2024 | | | | | | | | | | | | 0.35 | | | | 0.35 | |
| | FIXED | | | 6.41 | | | | 2005 | | | | 2024 | | | | | | | | | | | | 0.45 | | | | 0.45 | |
| | FIXED | | | 5.39 | | | | 2005 | | | | 2024 | | | | | | | | | | | | 0.92 | | | | 0.92 | |
| | FIXED | | | 5.43 | | | | 2005 | | | | 2024 | | | | | | | | | | | | 1.06 | | | | 1.06 | |
| | FIXED | | | 3.47 | | | | 2005 | | | | 2024 | | | | | | | | | | | | 0.91 | | | | 0.91 | |
| | FIXED | | | 4.89 | | | | 2005 | | | | 2024 | | | | | | | | | | | | 1.32 | | | | 1.32 | |
| | FIXED | | | 4.25 | | | | 2005 | | | | 2024 | | | | | | | | | | | | 1.91 | | | | 1.91 | |
| | FIXED | | | 3.89 | | | | 2005 | | | | 2024 | | | | | | | | | | | | 1.55 | | | | 1.55 | |
| | FIXED | | | 3.77 | | | | 2005 | | | | 2024 | | | | | | | | | | | | 2.87 | | | | 2.87 | |
| | FIXED | | | 3.34 | | | | 2005 | | | | 2024 | | | | | | | | | | | | 1.61 | | | | 1.61 | |
| | FIXED | | | 2.57 | | | | 2005 | | | | 2024 | | | | | | | | | | | | 0.76 | | | | 0.76 | |
| | FIXED | | | 1.27 | | | | 2005 | | | | 2024 | | | | | | | | | | | | 0.19 | | | | 0.19 | |
| | | | | | | | |
| | | | | | | | | 2006 | | | | 2026 | | | | 200.00 | | | | 200.00 | | | | 200.00 | | | | 200.00 | |
| | | | | | | | | | | | | | | | | | | | | | | | | | | | | | |
| | FIXED | | | 6.43 | | | | 2006 | | | | 2026 | | | | | | | | | | | | 2.53 | | | | 2.53 | |
| | FIXED | | | 5.45 | | | | 2006 | | | | 2026 | | | | | | | | | | | | 9.08 | | | | 9.08 | |
| | FIXED | | | 5.49 | | | | 2006 | | | | 2026 | | | | | | | | | | | | 36.12 | | | | 36.12 | |
| | FIXED | | | 3.49 | | | | 2006 | | | | 2026 | | | | | | | | | | | | 24.33 | | | | 24.33 | |
| | FIXED | | | 5.00 | | | | 2006 | | | | 2026 | | | | | | | | | | | | 8.81 | | | | 8.81 | |
| | FIXED | | | 4.42 | | | | 2006 | | | | 2026 | | | | | | | | | | | | 28.51 | | | | 28.51 | |
| | FIXED | | | 4.05 | | | | 2006 | | | | 2026 | | | | | | | | | | | | 26.64 | | | | 26.64 | |
| | FIXED | | | 3.98 | | | | 2006 | | | | 2026 | | | | | | | | | | | | 18.46 | | | | 18.46 | |
| | FIXED | | | 3.56 | | | | 2006 | | | | 2026 | | | | | | | | | | | | 3.02 | | | | 3.02 | |
| | FIXED | | | 2.71 | | | | 2006 | | | | 2026 | | | | | | | | | | | | 28.93 | | | | 28.93 | |
| | FIXED | | | 1.02 | | | | 2006 | | | | 2026 | | | | | | | | | | | | 0.79 | | | | 0.79 | |
| | FIXED | | | 0.86 | | | | 2006 | | | | 2026 | | | | | | | | | | | | 9.34 | | | | 9.34 | |
| | FIXED | | | 0.86 | | | | 2006 | | | | 2026 | | | | | | | | | | | | 0.90 | | | | 0.90 | |
| | FIXED | | | 2.20 | | | | 2006 | | | | 2026 | | | | | | | | | | | | 2.54 | | | | 2.54 | |
| | | | | | | | |
| | | | | | | | | 2006 | | | | 2026 | | | | 110.00 | | | | 110.00 | | | | 104.72 | | | | 104.72 | |
| | | | | | | | | | | | | | | | | | | | | | | | | | | | | | |
| | FIXED | | | 6.43 | | | | 2006 | | | | 2026 | | | | | | | | | | | | 0.28 | | | | 0.28 | |
| | FIXED | | | 5.45 | | | | 2006 | | | | 2026 | | | | | | | | | | | | 6.41 | | | | 6.41 | |
| | FIXED | | | 3.49 | | | | 2006 | | | | 2026 | | | | | | | | | | | | 11.64 | | | | 11.64 | |
| | FIXED | | | 4.42 | | | | 2006 | | | | 2026 | | | | | | | | | | | | 19.65 | | | | 19.65 | |
| | FIXED | | | 3.98 | | | | 2006 | | | | 2026 | | | | | | | | | | | | 0.39 | | | | 0.39 | |
| | FIXED | | | 3.31 | | | | 2006 | | | | 2026 | | | | | | | | | | | | 31.82 | | | | 31.82 | |
| | FIXED | | | 0.99 | | | | 2006 | | | | 2026 | | | | | | | | | | | | 30.92 | | | | 30.92 | |
| | FIXED | | | 1.95 | | | | 2006 | | | | 2026 | | | | | | | | | | | | 3.62 | | | | 3.62 | |
| | LIBOR BASE | | | 0.69 | | | | 2010 | | | | 2035 | | | | 250.00 | | | | 250.00 | | | | 250.00 | | | | 250.00 | |
| | FIXED | | | 0.69 | | | | 2010 | | | | 2035 | | | | 30.00 | | | | 30.00 | | | | 27.22 | | | | 27.22 | |
| | FIXED | | | 1.63 | | | | 2009 | | | | 2034 | | | | 70.36 | | | | 70.36 | | | | 23.04 | | | | 23.04 | |
| | LIBOR BASE | | | 0.89 | | | | 2010 | | | | 2035 | | | | 59.12 | | | | 59.12 | | | | 55.49 | | | | 55.49 | |
T-19
EXTERNAL DEBT OF THE REPUBLIC OF THE PHILIPPINES(1)
As of September 30, 2013
(In millions)
| | | | | | | | | | | | | | | | | | | | | | | | | | | | | | |
Currency | | Interest Rate Basis | | Interest Rate +
Spread/
Service Charge
(Per Annum) | | | | | | | | | Original Amount
Contracted | | | Outstanding Balance
as of September 30,
2013 | |
| | | | Year
Contracted | | | Year of
Maturity | | | (In Original
Currency) | | | (In US
Dollars)(2) | | | (In Original
Currency) | | | (In US
Dollars)(2) | |
| | LIBOR BASE | | | 0.97 | | | | 2011 | | | | 2036 | | | | 10.00 | | | | 10.00 | | | | 1.31 | | | | 1.31 | |
| | LIBOR BASE | | | 0.90 | | | | 2011 | | | | 2036 | | | | 250.00 | | | | 250.00 | | | | 250.00 | | | | 250.00 | |
| | FIXED | | | 0.90 | | | | 2011 | | | | 2037 | | | | 500.00 | | | | 500.00 | | | | 500.00 | | | | 500.00 | |
| | FIXED | | | 3.00 | | | | 1980 | | | | 2021 | | | | 5.70 | | | | 5.70 | | | | 1.82 | | | | 1.82 | |
| | FIXED | | | 3.00 | | | | 1982 | | | | 2023 | | | | 9.90 | | | | 9.90 | | | | 2.37 | | | | 2.37 | |
| | FIXED | | | 3.00 | | | | 1984 | | | | 2021 | | | | 3.20 | | | | 3.20 | | | | 0.02 | | | | 0.02 | |
| | FIXED | | | 3.00 | | | | 1975 | | | | 2017 | | | | 15.00 | | | | 15.00 | | | | 2.82 | | | | 2.82 | |
| | FIXED | | | 3.00 | | | | 1975 | | | | 2017 | | | | 5.00 | | | | 5.00 | | | | 0.91 | | | | 0.91 | |
| | FIXED | | | 3.00 | | | | 1974 | | | | 2016 | | | | 2.00 | | | | 2.00 | | | | 0.23 | | | | 0.23 | |
| | FIXED | | | 3.00 | | | | 1976 | | | | 2017 | | | | 10.00 | | | | 10.00 | | | | 1.67 | | | | 1.67 | |
| | FIXED | | | 3.00 | | | | 1977 | | | | 2018 | | | | 3.00 | | | | 3.00 | | | | 0.68 | | | | 0.68 | |
| | FIXED | | | 3.00 | | | | 1978 | | | | 2019 | | | | 5.00 | | | | 5.00 | | | | 1.25 | | | | 1.25 | |
| | FIXED | | | 3.00 | | | | 1978 | | | | 2018 | | | | 2.25 | | | | 2.25 | | | | 0.37 | | | | 0.37 | |
| | FIXED | | | 3.00 | | | | 1978 | | | | 2018 | | | | 0.21 | | | | 0.21 | | | | 0.18 | | | | 0.18 | |
| | FIXED | | | 3.00 | | | | 1979 | | | | 2020 | | | | 10.62 | | | | 10.62 | | | | 3.35 | | | | 3.35 | |
| | FIXED | | | 3.00 | | | | 1980 | | | | 2021 | | | | 6.38 | | | | 6.38 | | | | 2.13 | | | | 2.13 | |
| | FIXED | | | 3.00 | | | | 1979 | | | | 2021 | | | | 4.40 | | | | 4.40 | | | | 1.47 | | | | 1.47 | |
| | FIXED | | | 3.00 | | | | 1979 | | | | 2020 | | | | 5.00 | | | | 5.00 | | | | 1.14 | | | | 1.14 | |
| | FIXED | | | 3.00 | | | | 1981 | | | | 2021 | | | | 10.12 | | | | 10.12 | | | | 3.61 | | | | 3.61 | |
| | FIXED | | | 3.00 | | | | 1981 | | | | 2022 | | | | 1.00 | | | | 1.00 | | | | 0.36 | | | | 0.36 | |
| | FIXED | | | 3.00 | | | | 1980 | | | | 2021 | | | | 2.30 | | | | 2.30 | | | | 0.74 | | | | 0.74 | |
| | FIXED | | | 3.00 | | | | 1980 | | | | 2021 | | | | 2.70 | | | | 2.70 | | | | 0.84 | | | | 0.84 | |
| | FIXED | | | 3.00 | | | | 1981 | | | | 2022 | | | | 1.60 | | | | 1.60 | | | | 0.32 | | | | 0.32 | |
| | FIXED | | | 3.00 | | | | 1982 | | | | 2023 | | | | 4.50 | | | | 4.50 | | | | 0.35 | | | | 0.35 | |
| | FIXED | | | 3.00 | | | | 1982 | | | | 2023 | | | | 8.30 | | | | 8.30 | | | | 0.09 | | | | 0.09 | |
| | FIXED | | | 3.00 | | | | 1984 | | | | 2023 | | | | 7.00 | | | | 7.00 | | | | 0.02 | | | | 0.02 | |
| | FIXED | | | 3.00 | | | | 1983 | | | | 2024 | | | | 13.50 | | | | 13.50 | | | | 0.09 | | | | 0.09 | |
| | FIXED | | | 3.00 | | | | 1979 | | | | 2021 | | | | 2.50 | | | | 2.50 | | | | 0.35 | | | | 0.35 | |
| | FIXED | | | 3.00 | | | | 1980 | | | | 2023 | | | | 7.50 | | | | 7.50 | | | | 1.68 | | | | 1.68 | |
| | FIXED | | | 3.00 | | | | 1980 | | | | 2023 | | | | 9.20 | | | | 9.20 | | | | 0.23 | | | | 0.23 | |
| | FIXED | | | 3.00 | | | | 1982 | | | | 2023 | | | | 2.90 | | | | 2.90 | | | | 0.13 | | | | 0.13 | |
| | FIXED | | | 3.00 | | | | 1983 | | | | 2025 | | | | 7.80 | | | | 7.80 | | | | 0.50 | | | | 0.50 | |
| | FIXED | | | 3.00 | | | | 1983 | | | | 2024 | | | | 1.00 | | | | 1.00 | | | | 0.03 | | | | 0.03 | |
| | FIXED | | | 3.00 | | | | 1984 | | | | 2024 | | | | 2.30 | | | | 2.30 | | | | 0.17 | | | | 0.17 | |
| | FIXED | | | 3.00 | | | | 1979 | | | | 2022 | | | | 1.60 | | | | 1.60 | | | | 0.30 | | | | 0.30 | |
| | FIXED | | | 3.00 | | | | 1980 | | | | 2023 | | | | 3.30 | | | | 3.30 | | | | 0.95 | | | | 0.95 | |
| | FIXED | | | 3.00 | | | | 2002 | | | | 2016 | | | | 41.25 | | | | 41.25 | | | | 5.35 | | | | 5.35 | |
| | FIXED | | | 3.00 | | | | 1975 | | | | 2017 | | | | 3.50 | | | | 3.50 | | | | 0.58 | | | | 0.58 | |
| | FIXED | | | 3.00 | | | | 1978 | | | | 2021 | | | | 5.00 | | | | 5.00 | | | | 1.41 | | | | 1.41 | |
| | FIXED | | | 3.00 | | | | 1979 | | | | 2022 | | | | 2.62 | | | | 2.62 | | | | 0.31 | | | | 0.31 | |
| | FIXED | | | 3.00 | | | | 1978 | | | | 2024 | | | | 0.88 | | | | 0.88 | | | | 0.20 | | | | 0.20 | |
| | FIXED | | | 3.00 | | | | 1980 | | | | 2021 | | | | 1.50 | | | | 1.50 | | | | 0.15 | | | | 0.15 | |
| | FIXED | | | 3.00 | | | | 1981 | | | | 2022 | | | | 7.10 | | | | 7.10 | | | | 1.14 | | | | 1.14 | |
| | FIXED | | | 3.00 | | | | 1985 | | | | 2015 | | | | 40.00 | | | | 40.00 | | | | 4.61 | | | | 4.61 | |
| | FIXED | | | 3.00 | | | | 1986 | | | | 2016 | | | | 40.00 | | | | 40.00 | | | | 4.92 | | | | 4.92 | |
| | FIXED | | | 3.00 | | | | 1988 | | | | 2018 | | | | 30.00 | | | | 30.00 | | | | 5.77 | | | | 5.77 | |
| | FIXED | | | 3.00 | | | | 1990 | | | | 2020 | | | | 21.00 | | | | 21.00 | | | | 6.46 | | | | 6.46 | |
| | FIXED | | | 4.00 | | | | 1991 | | | | 2021 | | | | 15.00 | | | | 15.00 | | | | 5.62 | | | | 5.62 | |
| | FIXED | | | 4.00 | | | | 1992 | | | | 2022 | | | | 20.00 | | | | 20.00 | | | | 7.50 | | | | 7.50 | |
| | FIXED | | | 3.00 | | | | 1993 | | | | 2023 | | | | 20.00 | | | | 20.00 | | | | 9.17 | | | | 9.17 | |
| | FIXED | | | 3.00 | | | | 1994 | | | | 2019 | | | | 15.00 | | | | 15.00 | | | | 4.99 | | | | 4.99 | |
| | FIXED | | | 4.00 | | | | 1998 | | | | 2018 | | �� | | 10.00 | | | | 10.00 | | | | 3.75 | | | | 3.75 | |
| | FIXED | | | 2.00 | | | | 1999 | | | | 2019 | | | | 30.00 | | | | 30.00 | | | | 13.12 | | | | 13.12 | |
| | FIXED | | | 2.00 | | | | 2000 | | | | 2020 | | | | 40.00 | | | | 40.00 | | | | 20.00 | | | | 20.00 | |
| | FIXED | | | 1.00 | | | | 2001 | | | | 2031 | | | | 40.00 | | | | 40.00 | | | | 29.03 | | | | 29.03 | |
| | FIXED | | | 1.00 | | | | 2002 | | | | 2032 | | | | 20.00 | | | | 20.00 | | | | 15.37 | | | | 15.37 | |
| | FIXED | | | 1.00 | | | | 2003 | | | | 2033 | | | | 40.00 | | | | 40.00 | | | | 32.31 | | | | 32.31 | |
| | FIXED | | | 1.00 | | | | 2004 | | | | 2034 | | | | 20.00 | | | | 20.00 | | | | 16.92 | | | | 16.92 | |
| | FIXED | | | 1.00 | | | | 2005 | | | | 2036 | | | | 20.00 | | | | 20.00 | | | | 17.18 | | | | 17.18 | |
| | FIXED | | | 1.00 | | | | 2006 | | | | 2037 | | | | 20.00 | | | | 20.00 | | | | 19.13 | | | | 19.13 | |
| | FIXED | | | 0.75 | | | | 1973 | | | | 2022 | | | | 12.70 | | | | 12.70 | | | | 3.43 | | | | 3.43 | |
| | FIXED | | | 0.75 | | | | 1978 | | | | 2027 | | | | 28.00 | | | | 28.00 | | | | 9.36 | | | | 9.36 | |
| | FIXED | | | 0.75 | | | | 1979 | | | | 2029 | | | | 40.00 | | | | 40.00 | | | | 15.47 | | | | 15.47 | |
| | FIXED | | | 4.25 | | | | 1997 | | | | 2014 | | | | 10.00 | | | | 10.00 | | | | 0.05 | | | | 0.05 | |
| | FIXED | | | 2.75 | | | | 2000 | | | | 2016 | | | | 10.00 | | | | 10.00 | | | | 2.10 | | | | 2.10 | |
| | FIXED | | | 3.00 | | | | 2001 | | | | 2021 | | | | 7.00 | | | | 7.00 | | | | 2.97 | | | | 2.97 | |
| | FIXED | | | 4.00 | | | | 2008 | | | | 2028 | | | | 30.00 | | | | 30.00 | | | | 1.47 | | | | 1.47 | |
T-20
EXTERNAL DEBT OF THE REPUBLIC OF THE PHILIPPINES(1)
As of September 30, 2013
(In millions)
| | | | | | | | | | | | | | | | | | | | | | | | | | | | | | |
Currency | | Interest Rate Basis | | Interest Rate +
Spread/
Service Charge
(Per Annum) | | | | | | | | | Original Amount
Contracted | | | Outstanding Balance
as of September 30,
2013 | |
| | | | Year
Contracted | | | Year of
Maturity | | | (In Original
Currency) | | | (In US
Dollars)(2) | | | (In Original
Currency) | | | (In US
Dollars)(2) | |
| | FIXED | | | 4.00 | | | | 2008 | | | | 2028 | | | | 10.00 | | | | 10.00 | | | | 1.37 | | | | 1.37 | |
| | LIBOR BASE | | | 0.47 | | | | 1992 | | | | 2022 | | | | 20.00 | | | | 20.00 | | | | 8.50 | | | | 8.50 | |
| | LIBOR BASE | | | 0.27 | | | | 1994 | | | | 2024 | | | | 15.00 | | | | 15.00 | | | | 8.25 | | | | 8.25 | |
| | FIXED | | | 1.50 | | | | 1996 | | | | 2027 | | | | 25.75 | | | | 25.75 | | | | 16.96 | | | | 16.96 | |
| | FIXED | | | 2.50 | | | | 1996 | | | | 2013 | | | | 9.48 | | | | 9.48 | | | | 0.56 | | | | 0.56 | |
| | FIXED | | | 3.40 | | | | 1996 | | | | 2012 | | | | 22.95 | | | | 22.95 | | | | 0.00 | | | | 0.00 | |
| | FIXED | | | 3.40 | | | | 1997 | | | | 2014 | | | | 28.02 | | | | 28.02 | | | | 2.78 | | | | 2.78 | |
| | FIXED | | | 1.95 | | | | 1998 | | | | 2014 | | | | 38.51 | | | | 38.51 | | | | 3.85 | | | | 3.85 | |
| | | | | | | | |
| | | | | | | | | 1995 | | | | 2015 | | | | 26.50 | | | | 26.50 | | | | 3.81 | | | | 3.81 | |
| | | | | | | | | | | | | | | | | | | | | | | | | | | | | | |
| | FIXED | | | 6.97 | | | | 1995 | | | | 2015 | | | | | | | | | | | | 0.36 | | | | 0.36 | |
| | FIXED | | | 7.33 | | | | 1995 | | | | 2015 | | | | | | | | | | | | 0.37 | | | | 0.37 | |
| | FIXED | | | 5.98 | | | | 1995 | | | | 2015 | | | | | | | | | | | | 0.56 | | | | 0.56 | |
| | FIXED | | | 5.96 | | | | 1995 | | | | 2015 | | | | | | | | | | | | 0.53 | | | | 0.53 | |
| | FIXED | | | 5.96 | | | | 1995 | | | | 2015 | | | | | | | | | | | | 0.58 | | | | 0.58 | |
| | FIXED | | | 5.94 | | | | 1995 | | | | 2015 | | | | | | | | | | | | 0.61 | | | | 0.61 | |
| | FIXED | | | 3.46 | | | | 1995 | | | | 2015 | | | | | | | | | | | | 0.80 | | | | 0.80 | |
| | LIBOR BASE | | | 2.74 | | | | 2007 | | | | 2022 | | | | 62.75 | | | | 62.75 | | | | 54.00 | | | | 54.00 | |
| | FIXED | | | 1.00 | | | | 2000 | | | | 2031 | | | | 7.01 | | | | 7.01 | | | | 5.99 | | | | 5.99 | |
| | FIXED | | | 0.30 | | | | 2002 | | | | 2032 | | | | 4.40 | | | | 4.40 | | | | 4.08 | | | | 4.08 | |
| | FIXED | | | 0.30 | | | | 2002 | | | | 2032 | | | | 6.78 | | | | 6.78 | | | | 6.28 | | | | 6.28 | |
| | FIXED | | | 0.30 | | | | 2002 | | | | 2032 | | | | 18.56 | | | | 18.56 | | | | 17.20 | | | | 17.20 | |
| | FIXED | | | 5.30 | | | | 2002 | | | | 2012 | | | | 18.56 | | | | 18.56 | | | | 0.00 | | | | 0.00 | |
| | FIXED | | | 0.30 | | | | 2002 | | | | 2033 | | | | 12.94 | | | | 12.94 | | | | 12.31 | | | | 12.31 | |
| | FIXED | | | 3.00 | | | | 2001 | | | | 2013 | | | | 34.98 | | | | 34.98 | | | | 0.00 | | | | 0.00 | |
| | FIXED | | | 3.00 | | | | 2003 | | | | 2015 | | | | 24.99 | | | | 24.99 | | | | 4.69 | | | | 4.69 | |
| | FIXED | | | 0.20 | | | | 2006 | | | | 2042 | | | | 13.50 | | | | 13.50 | | | | 13.50 | | | | 13.50 | |
| | FIXED | | | 4.98 | | | | 2006 | | | | 2015 | | | | 13.50 | | | | 13.50 | | | | 3.86 | | | | 3.86 | |
| | FIXED | | | 3.00 | | | | 2009 | | | | 2029 | | | | 89.15 | | | | 89.15 | | | | 75.57 | | | | 75.57 | |
| | FIXED | | | 10.50 | | | | 1983 | | | | 2013 | | | | 67.40 | | | | 67.40 | | | | 2.01 | | | | 2.01 | |
| | FIXED | | | 0.75 | | | | 1974 | | | | 2024 | | | | 9.50 | | | | 9.50 | | | | 3.14 | | | | 3.14 | |
| | FIXED | | | 2.00 | | | | 1988 | | | | 2016 | | | | 10.00 | | | | 10.00 | | | | 0.69 | | | | 0.69 | |
| | FIXED | | | 2.00 | | | | 1989 | | | | 2017 | | | | 2.63 | | | | 2.63 | | | | 0.40 | | | | 0.40 | |
| | | | | | | |
| B. RELENT TO GOCCs/GFIs | | | | | | | | | | | | | | | | | | | 2,290.06 | | | | | | | | 974.26 | |
| | | | | | | | | | | | | | | | | | | | | | | | | | | | | | |
| | | | | | | | | | | | | | | | | | | | | | | | | | | | | | |
| EURO | | | | | | | | | | | | | | | | | 85.61 | | | | 115.77 | | | | 29.29 | | | | 39.61 | |
| | | | | | | | | | | | | | | | | | | | | | | | | | | | | | |
| | INTEREST FREE | | | | | | | 1982 | | | | 2012 | | | | 1.86 | | | | 2.51 | | | | 0.00 | | | | 0.00 | |
| | INTEREST FREE | | | | | | | 1983 | | | | 2013 | | | | 1.86 | | | | 2.51 | | | | 0.11 | | | | 0.14 | |
| | INTEREST FREE | | | | | | | 1992 | | | | 2022 | | | | 3.72 | | | | 5.03 | | | | 1.86 | | | | 2.51 | |
| | INTEREST FREE | | | | | | | 1996 | | | | 2025 | | | | 3.26 | | | | 4.41 | | | | 2.13 | | | | 2.88 | |
| | INTEREST FREE | | | | | | | 2004 | | | | 2038 | | | | 6.31 | | | | 8.54 | | | | 6.27 | | | | 8.47 | |
| | FIXED | | | 2.00 | | | | 1981 | | | | 2015 | | | | 8.18 | | | | 11.06 | | | | 0.04 | | | | 0.05 | |
| | FIXED | | | 2.00 | | | | 1982 | | | | 2012 | | | | 5.11 | | | | 6.91 | | | | 0.00 | | | | 0.00 | |
| | FIXED | | | 2.00 | | | | 1989 | | | | 2019 | | | | 32.11 | | | | 43.42 | | | | 10.63 | | | | 14.38 | |
| | FIXED | | | 2.00 | | | | 1989 | | | | 2019 | | | | 9.20 | | | | 12.45 | | | | 2.92 | | | | 3.95 | |
| | FIXED | | | 2.00 | | | | 1989 | | | | 2019 | | | | 7.36 | | | | 9.96 | | | | 2.34 | | | | 3.16 | |
| | FIXED | | | 5.02 | | | | 2004 | | | | 2017 | | | | 6.63 | | | | 8.96 | | | | 3.00 | | | | 4.06 | |
| | | | | | | |
JAPANESE YEN | | | | | | | | | | | | | | | 160,825.70 | | | | 1,637.04 | | | | 81,638.73 | | | | 831.00 | |
| | | | | | | | | | | | | | | | | | | | | | | | | | | | | | |
| | FIXED | | | 3.00 | | | | 1982 | | | | 2012 | | | | 670.00 | | | | 6.82 | | | | 0.00 | | | | 0.00 | |
| | FIXED | | | 3.00 | | | | 1982 | | | | 2012 | | | | 490.00 | | | | 4.99 | | | | 0.00 | | | | 0.00 | |
| | FIXED | | | 3.00 | | | | 1983 | | | | 2013 | | | | 4,500.00 | | | | 45.81 | | | | 0.00 | | | | 0.00 | |
| | FIXED | | | 3.00 | | | | 1983 | | | | 2013 | | | | 240.00 | | | | 2.44 | | | | 0.00 | | | | 0.00 | |
| | FIXED | | | 3.50 | | | | 1984 | | | | 2014 | | | | 2,905.00 | | | | 29.57 | | | | 141.49 | | | | 1.44 | |
| | FIXED | | | 3.50 | | | | 1986 | | | | 2016 | | | | 175.00 | | | | 1.78 | | | | 20.89 | | | | 0.21 | |
| | FIXED | | | 3.00 | | | | 1988 | | | | 2018 | | | | 1,272.00 | | | | 12.95 | | | | 207.50 | | | | 2.11 | |
| | FIXED | | | 3.00 | | | | 1988 | | | | 2018 | | | | 6,015.00 | | | | 61.23 | | | | 1,302.72 | | | | 13.26 | |
| | FIXED | | | 3.00 | | | | 1988 | | | | 2018 | | | | 2,478.00 | | | | 25.22 | | | | 13.47 | | | | 0.14 | |
| | FIXED | | | 3.00 | | | | 1988 | | | | 2018 | | | | 192.00 | | | | 1.95 | | | | 37.12 | | | | 0.38 | |
| | FIXED | | | 2.70 | | | | 1989 | | | | 2019 | | | | 5,054.00 | | | | 51.44 | | | | 1,474.14 | | | | 15.01 | |
| | FIXED | | | 2.70 | | | | 1991 | | | | 2021 | | | | 2,005.00 | | | | 20.41 | | | | 723.76 | | | | 7.37 | |
| | FIXED | | | 2.70 | | | | 1991 | | | | 2021 | | | | 5,788.00 | | | | 58.92 | | | | 2,145.17 | | | | 21.84 | |
| | FIXED | | | 3.00 | | | | 1993 | | | | 2023 | | | | 18,120.00 | | | | 184.44 | | | | 8,787.38 | | | | 89.45 | |
| | FIXED | | | 3.00 | | | | 1993 | | | | 2023 | | | | 1,259.00 | | | | 12.82 | | | | 583.32 | | | | 5.94 | |
| | FIXED | | | 2.70 | | | | 1992 | | | | 2022 | | | | 1,094.00 | | | | 11.14 | | | | 346.21 | | | | 3.52 | |
T-21
EXTERNAL DEBT OF THE REPUBLIC OF THE PHILIPPINES(1)
As of September 30, 2013
(In millions)
| | | | | | | | | | | | | | | | | | | | | | | | | | | | | | |
Currency | | Interest Rate Basis | | Interest Rate +
Spread/
Service Charge
(Per Annum) | | | | | | | | | Original Amount
Contracted | | | Outstanding Balance
as of September 30,
2013 | |
| | | | Year
Contracted | | | Year of
Maturity | | | (In Original
Currency) | | | (In US
Dollars)(2) | | | (In Original
Currency) | | | (In US
Dollars)(2) | |
| | FIXED | | | 3.00 | | | | 1994 | | | | 2024 | | | | 11,433.00 | | | | 116.38 | | | | 5,226.21 | | | | 53.20 | |
| | FIXED | | | 3.00 | | | | 1994 | | | | 2024 | | | | 9,795.00 | | | | 99.70 | | | | 5,231.07 | | | | 53.25 | |
| | FIXED | | | 3.00 | | | | 1994 | | | | 2024 | | | | 6,212.00 | | | | 63.23 | | | | 1,305.69 | | | | 13.29 | |
| | | | | | | | |
| | FIXED | | | | | | | 1997 | | | | 2027 | | | | 26,344.00 | | | | 268.16 | | | | 17,192.49 | | | | 175.00 | |
| | | | | | | | | | | | | | | | | | | | | | | | | | | | | | |
| | FIXED | | | 2.70 | | | | 1997 | | | | 2027 | | | | | | | | | | | | 16,930.92 | | | | 172.34 | |
| | FIXED | | | 2.30 | | | | 1997 | | | | 2027 | | | | | | | | | | | | 261.58 | | | | 2.66 | |
| | FIXED | | | 0.75 | | | | 1998 | | | | 2038 | | | | 23,668.00 | | | | 240.92 | | | | 11,046.10 | | | | 112.44 | |
| | | | | | | | |
| | FIXED | | | 1.00 | | | | 2000 | | | | 2040 | | | | 22,262.00 | | | | 226.60 | | | | 18,183.15 | | | | 185.09 | |
| | | | | | | | | | | | | | | | | | | | | | | | | | | | | | |
| | FIXED | | | 1.00 | | | | 2000 | | | | 2040 | | | | | | | | | | | | 16,561.10 | | | | 168.58 | |
| | FIXED | | | 0.75 | | | | 2000 | | | | 2040 | | | | | | | | | | | | 1,622.05 | | | | 16.51 | |
| | FIXED | | | 1.00 | | | | 2000 | | | | 2040 | | | | 8,266.00 | | | | 84.14 | | | | 7,316.46 | | | | 74.47 | |
| | | | | | | | | | | | | | | | | | | | | | | | | | | | | | |
| | FIXED | | | 1.00 | | | | 2000 | | | | 2040 | | | | | | | | | | | | 6,581.57 | | | | 66.99 | |
| | FIXED | | | 0.75 | | | | 2000 | | | | 2040 | | | | | | | | | | | | 734.89 | | | | 7.48 | |
| | FIXED | | | 3.00 | | | | 1995 | | | | 2025 | | | | 545.40 | | | | 5.55 | | | | 324.81 | | | | 3.31 | |
| | ADB FLOATING RATE | | | 1.17 | | | | 1991 | | | | 2014 | | | | 43.30 | | | | 0.44 | | | | 29.58 | | | | 0.30 | |
| | | | | | | |
SPECIAL DRAWING RIGHT | | | | | | | | | | | | | | | 28.01 | | | | 42.92 | | | | 24.35 | | | | 37.32 | |
| | | | | | | | | | | | | | | | | | | | | | | | | | | | | | |
| | FIXED | | | 0.75 | | | | 1996 | | | | 2036 | | | | 10.15 | | | | 15.56 | | | | 7.39 | | | | 11.32 | |
| | FIXED | | | 1.00 | | | | 1991 | | | | 2025 | | | | 6.54 | | | | 10.03 | | | | 6.00 | | | | 9.19 | |
| | FIXED | | | 1.00 | | | | 1996 | | | | 2031 | | | | 11.31 | | | | 17.34 | | | | 10.96 | | | | 16.80 | |
| | | | | | | |
UNITED STATES DOLLAR | | | | | | | | | | | | | | | 494.32 | | | | 494.32 | | | | 66.34 | | | | 66.34 | |
| | | | | | | | | | | | | | | | | | | | | | | | | | | | | | |
| | | | | | | | | | | | | | | | | | | | | | | | | | | | | | |
| | FIXED | | | 3.00 | | | | 2004 | | | | 2024 | | | | 400.00 | | | | 400.00 | | | | 45.20 | | | | 45.20 | |
| | LIBOR BASE | | | 0.69 | | | | 1999 | | | | 2017 | | | | 2.30 | | | | 2.30 | | | | 0.70 | | | | 0.70 | |
| | FIXED | | | 3.00 | | | | 1975 | | | | 2016 | | | | 20.00 | | | | 20.00 | | | | 2.39 | | | | 2.39 | |
| | FIXED | | | 3.00 | | | | 1976 | | | | 2017 | | | | 20.00 | | | | 20.00 | | | | 2.81 | | | | 2.81 | |
| | FIXED | | | 3.00 | | | | 1976 | | | | 2017 | | | | 20.00 | | | | 20.00 | | | | 3.75 | | | | 3.75 | |
| | FIXED | | | 0.75 | | | | 1979 | | | | 2029 | | | | 22.00 | | | | 22.00 | | | | 8.94 | | | | 8.94 | |
| | FIXED | | | 0.75 | | | | 1972 | | | | 2022 | | | | 10.02 | | | | 10.02 | | | | 2.55 | | | | 2.55 | |
| | | | | | | |
II. NG ASSUMED (REAL) LOAN | | | | | | | | | | | | | | | | | | | 1.68 | | | | 0.03 | | | | 0.04 | |
| | | | | | | | | | | | | | | | | | | | | | | | | | | | | | |
| EURO | | | | | | | | | | | | | | | | | 1.24 | | | | 1.68 | | | | 0.03 | | | | 0.04 | |
| | | | | | | | | | | | | | | | | | | | | | | | | | | | | | |
| | INTEREST FREE | | | 0.00 | | | | 1987 | | | | 2012 | | | | 0.62 | | | | 0.84 | | | | 0.00 | | | | 0.00 | |
| | INTEREST FREE | | | 0.00 | | | | 1987 | | | | 2013 | | | | 0.62 | | | | 0.84 | | | | 0.03 | | | | 0.04 | |
| | | | | | | |
III. NG ISSUED DEBT SECURITIES | | | | | | | | | | | | | | | | | | | 33,013.17 | | | | | | | | 28,202.70 | |
| | | | | | | | | | | | | | | | | | | | | | | | | | | | | | |
| | | | | | | | |
| EURO | | | | | | | | | | | | | | | | | 500.00 | | | | 676.15 | | | | 500.00 | | | | 676.15 | |
| | | | | | | | | | | | | | | | | | | | | | | | | | | | | | |
| | FIXED | | | 6.25 | | | | 2006 | | | | 2016 | | | | 500.00 | | | | 676.15 | | | | 500.00 | | | | 676.15 | |
| | | | | | | |
JAPANESE YEN BONDS | | | | | | | | | | | | | | | 100,000.00 | | | | 1,017.90 | | | | 100,000.00 | | | | 1,017.90 | |
| | | | | | | | | | | | | | | | | | | | | | | | | | | | | | |
| | FIXED | | | 2.32 | | | | 2010 | | | | 2020 | | | | 100,000.00 | | | | 1,017.90 | | | | 100,000.00 | | | | 1,017.90 | |
| | | | | | | | |
| PHP | | | | | | | | | | | | | | | | | 129,679.00 | | | | 2,991.44 | | | | 129,679.00 | | | | 2,991.44 | |
| | | | | | | | | | | | | | | | | | | | | | | | | | | | | | |
| | FIXED | | | 4.95 | | | | 2010 | | | | 2021 | | | | 44,109.00 | | | | 1,017.51 | | | | 44,109.00 | | | | 1,017.51 | |
| | FIXED | | | 6.25 | | | | 2011 | | | | 2036 | | | | 54,770.00 | | | | 1,263.44 | | | | 54,770.00 | | | | 1,263.44 | |
| | FIXED | | | 3.90 | | | | 2012 | | | | 2022 | | | | 30,800.00 | | | | 710.50 | | | | 30,800.00 | | | | 710.50 | |
| | | | | | | |
UNITED STATED DOLLAR | | | | | | | | | | | | | | | 28,327.68 | | | | 28,327.68 | | | | 23,517.21 | | | | 23,517.21 | |
| | | | | | | | | | | | | | | | | | | | | | | | | | | | | | |
| | FIXED | | | 8.75 | | | | 1996 | | | | 2016 | | | | 690.00 | | | | 690.00 | | | | 526.09 | | | | 526.09 | |
| | FIXED | | | 9.88 | | | | 1999 | | | | 2019 | | | | 500.00 | | | | 500.00 | | | | 261.23 | | | | 261.23 | |
| | FIXED | | | 9.88 | | | | 1999 | | | | 2019 | | | | 200.00 | | | | 200.00 | | | | 200.00 | | | | 200.00 | |
| | FIXED | | | 9.50 | | | | 1999 | | | | 2024 | | | | 1,006.29 | | | | 1,006.29 | | | | 480.41 | | | | 480.41 | |
| | FIXED | | | 9.88 | | | | 1999 | | | | 2019 | | | | 400.00 | | | | 400.00 | | | | 400.00 | | | | 400.00 | |
| | FIXED | | | 10.63 | | | | 2000 | | | | 2025 | | | | 1,000.00 | | | | 1,000.00 | | | | 632.89 | | | | 632.89 | |
| | FIXED | | | 9.38 | | | | 2002 | | | | 2017 | | | | 750.00 | | | | 750.00 | | | | 547.21 | | | | 547.21 | |
| | FIXED | | | 9.00 | | | | 2002 | | | | 2013 | | | | 500.00 | | | | 500.00 | | | | 0.00 | | | | 0.00 | |
| | FIXED | | | 9.00 | | | | 2003 | | | | 2013 | | | | 500.00 | | | | 500.00 | | | | 0.00 | | | | 0.00 | |
| | FIXED | | | 8.25 | | | | 2003 | | | | 2014 | | | | 750.00 | | | | 750.00 | | | | 0.00 | | | | 0.00 | |
| | FIXED | | | 8.25 | | | | 2003 | | | | 2014 | | | | 750.00 | | | | 750.00 | | | | 744.69 | | | | 744.69 | |
| | FIXED | | | 10.63 | | | | 2003 | | | | 2025 | | | | 300.00 | | | | 300.00 | | | | 300.00 | | | | 300.00 | |
| | FIXED | | | 8.88 | | | | 2004 | | | | 2015 | | | | 500.00 | | | | 500.00 | | | | 0.00 | | | | 0.00 | |
T-22
EXTERNAL DEBT OF THE REPUBLIC OF THE PHILIPPINES(1)
As of September 30, 2013
(In millions)
| | | | | | | | | | | | | | | | | | | | | | | | | | | | | | |
Currency | | Interest Rate Basis | | Interest Rate +
Spread/
Service Charge
(Per Annum) | | | | | | | | | Original Amount
Contracted | | | Outstanding Balance
as of September 30,
2013 | |
| | | | Year
Contracted | | | Year of
Maturity | | | (In Original
Currency) | | | (In US
Dollars)(2) | | | (In Original
Currency) | | | (In US
Dollars)(2) | |
| | FIXED | | | 8.25 | | | | 2004 | | | | 2014 | | | | 200.00 | | | | 200.00 | | | | 200.00 | | | | 200.00 | |
| | FIXED | | | 9.38 | | | | 2004 | | | | 2017 | | | | 250.00 | | | | 250.00 | | | | 250.00 | | | | 250.00 | |
| | FIXED | | | 8.88 | | | | 2004 | | | | 2015 | | | | 300.00 | | | | 300.00 | | | | 290.01 | | | | 290.01 | |
| | FIXED | | | 10.63 | | | | 2004 | | | | 2025 | | | | 700.00 | | | | 700.00 | | | | 700.00 | | | | 700.00 | |
| | FIXED | | | 9.50 | | | | 2005 | | | | 2030 | | | | 1,500.00 | | | | 1,500.00 | | | | 1,500.00 | | | | 1,500.00 | |
| | FIXED | | | 8.88 | | | | 2005 | | | | 2015 | | | | 250.00 | | | | 250.00 | | | | 250.00 | | | | 250.00 | |
| | FIXED | | | 9.50 | | | | 2005 | | | | 2030 | | | | 500.00 | | | | 500.00 | | | | 500.00 | | | | 500.00 | |
| | FIXED | | | 8.00 | | | | 2005 | | | | 2016 | | | | 1,000.00 | | | | 1,000.00 | | | | 215.55 | | | | 215.55 | |
| | FIXED | | | 7.75 | | | | 2006 | | | | 2031 | | | | 1,500.00 | | | | 1,500.00 | | | | 1,500.00 | | | | 1,500.00 | |
| | FIXED | | | 7.75 | | | | 2006 | | | | 2031 | | | | 450.00 | | | | 450.00 | | | | 450.00 | | | | 450.00 | |
| | FIXED | | | 8.00 | | | | 2006 | | | | 2016 | | | | 300.00 | | | | 300.00 | | | | 300.00 | | | | 300.00 | |
| | FIXED | | | 7.75 | | | | 2006 | | | | 2031 | | | | 434.51 | | | | 434.51 | | | | 434.51 | | | | 434.51 | |
| | FIXED | | | 7.50 | | | | 2006 | | | | 2024 | | | | 774.20 | | | | 774.20 | | | | 774.20 | | | | 774.20 | |
| | FIXED | | | 6.38 | | | | 2007 | | | | 2032 | | | | 1,000.00 | | | | 1,000.00 | | | | 1,000.00 | | | | 1,000.00 | |
| | FIXED | | | 6.38 | | | | 2008 | | | | 2032 | | | | 500.00 | | | | 500.00 | | | | 500.00 | | | | 500.00 | |
| | FIXED | | | 8.38 | | | | 2009 | | | | 2019 | | | | 1,500.00 | | | | 1,500.00 | | | | 1,237.75 | | | | 1,237.75 | |
| | FIXED | | | 6.50 | | | | 2009 | | | | 2020 | | | | 750.00 | | | | 750.00 | | | | 750.00 | | | | 750.00 | |
| | FIXED | | | 6.38 | | | | 2009 | | | | 2034 | | | | 1,000.00 | | | | 1,000.00 | | | | 1,000.00 | | | | 1,000.00 | |
| | FIXED | | | 6.50 | | | | 2010 | | | | 2020 | | | | 650.00 | | | | 650.00 | | | | 650.00 | | | | 650.00 | |
| | FIXED | | | 6.38 | | | | 2010 | | | | 2034 | | | | 850.00 | | | | 850.00 | | | | 850.00 | | | | 850.00 | |
| | FIXED | | | 4.00 | | | | 2010 | | | | 2021 | | | | 2,075.87 | | | | 2,075.87 | | | | 2,075.87 | | | | 2,075.87 | |
| | FIXED | | | 6.38 | | | | 2010 | | | | 2034 | | | | 946.81 | | | | 946.81 | | | | 946.81 | | | | 946.81 | |
| | FIXED | | | 5.50 | | | | 2011 | | | | 2026 | | | | 1,500.00 | | | | 1,500.00 | | | | 1,500.00 | | | | 1,500.00 | |
| | FIXED | | | 6.38 | | | | 2011 | | | | 2034 | | | | 50.00 | | | | 50.00 | | | | 50.00 | | | | 50.00 | |
| | FIXED | | | 5.00 | | | | 2012 | | | | 2037 | | | | 1,500.00 | | | | 1,500.00 | | | | 1,500.00 | | | | 1,500.00 | |
| (1) | Excludes External Debt Guaranteed by the Republic. |
| (2) | Amounts in original currencies were translated to US Dollars using BSP reference rates prevailing on September 30, 2013. |
T-23
DOMESTIC GOVERNMENT SECURITIES(1)
As of September 30, 2013
(In million Pesos)
| | | | | | | | | | | | | | | | | | | | |
Interest Rate Basis | | Interest Rate
(Per Annum) | | | Year
Contracted | | | Year of
Maturity | | | Original
Amount | | | Outstanding
as of
September 30, 2013 | |
TOTAL (I + I I) | | | | | | | | | | | | | | | | | | | 3,745,790.12 | |
| | | | | | | | | | | | | | | | | | | | |
I. ACTUAL OBLIGATIONS | | | | | | | | | | | | | | | | | | | 3,676,970.12 | |
| | | | | | | | | | | | | | | | | | | | |
A. TREASURY BILLS | | | | | | | | | | | | | | | | | | | 309,913.30 | |
| | | | | | | | | | | | | | | | | | | | |
AUCTION | | | Various | | | | | | | | 2013-2014 | | | | | | | | 135,345.00 | |
CB-BOL | | | Various | | | | | | | | 2013-2014 | | | | | | | | 174,568.30 | |
| | | | | |
B. BONDS | | | | | | | | | | | | | | | 50,097.05 | | | | 55,220.54 | |
| | | | | | | | | | | | | | | | | | | | |
28.5 Yr FXTB | | | | | | | | | | | | | | | 97.05 | | | | 97.05 | |
| | | | | | | | | | | | | | | | | | | | |
Fixed Rate | | | 12.8400 | % | | | 1996 | | | | 2025 | | | | 97.05 | | | | 97.05 | |
| | | | | |
Treasury Bonds (CB-BoL) | | | Floating Rate | | | | 1993 | | | | 2018 | | | | 50,000.00 | | | | 50,000.00 | |
| | | | | | | | | | | | | | | | | | | | |
| | | | | |
Agrarian Reform Bonds | | | Floating Rate | | | | | | | | | | | | | | | | 5,123.49 | |
| | | | | | | | | | | | | | | | | | | | |
| | | | | |
C. FIXED RATE T/BONDS | | | | | | | | | | | | | | | 1,774,622.56 | | | | 1,582,719.90 | |
| | | | | | | | | | | | | | | | | | | | |
3 Yr FXTB | | | | | | | | | | | | | | | 65,000.00 | | | | 65,000.00 | |
| | | | | | | | | | | | | | | | | | | | |
AUCTION | | | | | | | | | | | | | | | 60,000.00 | | | | 60,000.00 | |
| | | | | | | | | | | | | | | | | | | | |
Fixed Rate | | | 1.6250 | % | | | 2013 | | | | 2016 | | | | 60,000.00 | | | | 60,000.00 | |
| | | | | |
OTC-GOCC | | | | | | | | | | | | | | | 5,000.00 | | | | 5,000.00 | |
| | | | | | | | | | | | | | | | | | | | |
Fixed Rate | | | 1.6250 | % | | | 2013 | | | | 2016 | | | | 5,000.00 | | | | 5,000.00 | |
| | | | | |
4 Yr FXTB | | | | | | | | | | | | | | | 9,000.00 | | | | 9,000.00 | |
| | | | | | | | | | | | | | | | | | | | |
AUCTION | | | | | | | | | | | | | | | 9,000.00 | | | | 9,000.00 | |
| | | | | | | | | | | | | | | | | | | | |
Fixed Rate | | | 4.8750 | % | | | 2011 | | | | 2015 | | | | 9,000.00 | | | | 9,000.00 | |
| | | | | |
5 Yr FXTB | | | | | | | | | | | | | | | 167,894.50 | | | | 163,385.60 | |
| | | | | | | | | | | | | | | | | | | | |
AUCTION | | | | | | | | | | | | | | | 102,025.00 | | | | 97,516.10 | |
| | | | | | | | | | | | | | | | | | | | |
Fixed Rate | | | 4.6250 | % | | | 2010 | | | | 2015 | | | | 8,000.00 | | | | 3,951.09 | |
Fixed Rate | | | 4.6250 | % | | | 2011 | | | | 2015 | | | | 7,025.00 | | | | 7,025.00 | |
Fixed Rate | | | 6.3750 | % | | | 2011 | | | | 2015 | | | | 9,000.00 | | | | 8,540.01 | |
Fixed Rate | | | 4.6250 | % | | | 2012 | | | | 2017 | | | | 9,000.00 | | | | 9,000.00 | |
Fixed Rate | | | 4.1250 | % | | | 2012 | | | | 2017 | | | | 9,000.00 | | | | 9,000.00 | |
Fixed Rate | | | 2.1250 | % | | | 2013 | | | | 2018 | | | | 60,000.00 | | | | 60,000.00 | |
| | | | | |
OTC-GOCC | | | | | | | | | | | | | | | 61,075.10 | | | | 61,075.10 | |
| | | | | | | | | | | | | | | | | | | | |
Fixed Rate | | | 6.3750 | % | | | 2010 | | | | 2015 | | | | 9,909.60 | | | | 9,909.60 | |
Fixed Rate | | | 4.6250 | % | | | 2010 | | | | 2015 | | | | 1,820.90 | | | | 1,820.90 | |
Fixed Rate | | | 6.3750 | % | | | 2011 | | | | 2015 | | | | 4,960.50 | | | | 4,960.50 | |
Fixed Rate | | | 4.6250 | % | | | 2012 | | | | 2017 | | | | 43,689.30 | | | | 43,689.30 | |
Fixed Rate | | | 4.1250 | % | | | 2012 | | | | 2017 | | | | 34.60 | | | | 34.60 | |
Fixed Rate | | | 2.1250 | % | | | 2013 | | | | 2018 | | | | 660.20 | | | | 660.20 | |
| | | | | |
OTC-TEI | | | | | | | | | | | | | | | 4,794.40 | | | | 4,794.40 | |
| | | | | | | | | | | | | | | | | | | | |
Fixed Rate | | | 6.3750 | % | | | 2010 | | | | 2015 | | | | 3,853.10 | | | | 3,853.10 | |
Fixed Rate | | | 4.6250 | % | | | 2011 | | | | 2015 | | | | 401.60 | | | | 401.60 | |
Fixed Rate | | | 4.6250 | % | | | 2012 | | | | 2017 | | | | 513.60 | | | | 513.60 | |
Fixed Rate | | | 2.1250 | % | | | 2013 | | | | 2018 | | | | 26.10 | | | | 26.10 | |
T-24
DOMESTIC GOVERNMENT SECURITIES(1)
As of September 30, 2013
(In million Pesos)
| | | | | | | | | | | | | | | | | | | | |
Interest Rate Basis | | Interest Rate
(Per Annum) | | | Year
Contracted | | | Year of
Maturity | | | Original
Amount | | | Outstanding
as of
September 30, 2013 | |
| | | | | |
7 Yr FXTB | | | | | | | | | | | | | | | 441,034.75 | | | | 385,088.46 | |
| | | | | | | | | | | | | | | | | | | | |
| | | | | |
AUCTION | | | | | | | | | | | | | | | 237,701.00 | | | | 181,758.31 | |
| | | | | | | | | | | | | | | | | | | | |
Fixed Rate | | | 7.1250 | % | | | 2006 | | | | 2013 | | | | 8,000.00 | | | | 3,641.77 | |
Fixed Rate | | | 6.5000 | % | | | 2007 | | | | 2014 | | | | 12,700.00 | | | | 2,954.94 | |
Fixed Rate | | | 8.3750 | % | | | 2008 | | | | 2015 | | | | 21,000.00 | | | | 5,002.00 | |
Fixed Rate | | | 7.1250 | % | | | 2008 | | | | 2013 | | | | 2,900.00 | | | | 2,900.00 | |
Fixed Rate | | | 6.5000 | % | | | 2010 | | | | 2014 | | | | 12,871.00 | | | | 8,500.00 | |
Fixed Rate | | | 7.0000 | % | | | 2010 | | | | 2017 | | | | 33,710.00 | | | | 14,502.22 | |
Fixed Rate | | | 5.3750 | % | | | 2010 | | | | 2017 | | | | 8,000.00 | | | | 5,737.38 | |
Fixed Rate | | | 5.0000 | % | | | 2011 | | | | 2018 | | | | 43,820.00 | | | | 43,820.00 | |
Fixed Rate | | | 7.0000 | % | | | 2012 | | | | 2017 | | | | 9,000.00 | | | | 9,000.00 | |
Fixed Rate | | | 5.0000 | % | | | 2012 | | | | 2019 | | | | 3,700.00 | | | | 3,700.00 | |
Fixed Rate | | | 4.7500 | % | | | 2012 | | | | 2019 | | | | 18,000.00 | | | | 18,000.00 | |
Fixed Rate | | | 3.8750 | % | | | 2012 | | | | 2019 | | | | 64,000.00 | | | | 64,000.00 | |
| | | | | |
TAP | | | | | | | | | | | | | | | 9,250.00 | | | | 9,250.00 | |
| | | | | | | | | | | | | | | | | | | | |
Fixed Rate | | | 5.0000 | % | | | 2012 | | | | 2018 | | | | 9,250.00 | | | | 9,250.00 | |
| | | | | |
OTC-GOCC | | | | | | | | | | | | | | | 140,747.80 | | | | 140,747.80 | |
| | | | | | | | | | | | | | | | | | | | |
Fixed Rate | | | 7.1250 | % | | | 2006 | | | | 2013 | | | | 6,617.50 | | | | 6,873.80 | |
Fixed Rate | | | 6.5000 | % | | | 2007 | | | | 2014 | | | | 3,285.80 | | | | 3,285.80 | |
Fixed Rate | | | 8.3750 | % | | | 2008 | | | | 2015 | | | | 13,708.70 | | | | 13,708.70 | |
Fixed Rate | | | 7.1250 | % | | | 2008 | | | | 2013 | | | | 340.40 | | | | 84.10 | |
Fixed Rate | | | 6.5000 | % | | | 2010 | | | | 2014 | | | | 67.30 | | | | 67.30 | |
Fixed Rate | | | 7.0000 | % | | | 2010 | | | | 2017 | | | | 22,318.70 | | | | 22,318.70 | |
Fixed Rate | | | 5.3750 | % | | | 2010 | | | | 2017 | | | | 508.40 | | | | 508.40 | |
Fixed Rate | | | 5.0000 | % | | | 2011 | | | | 2018 | | | | 19,818.80 | | | | 19,818.80 | |
Fixed Rate | | | 5.3750 | % | | | 2012 | | | | 2017 | | | | 1,633.70 | | | | 1,633.70 | |
Fixed Rate | | | 5.0000 | % | | | 2012 | | | | 2018 | | | | 13,695.70 | | | | 13,695.70 | |
Fixed Rate | | | 5.0000 | % | | | 2012 | | | | 2019 | | | | 24,525.70 | | | | 24,525.70 | |
Fixed Rate | | | 4.7500 | % | | | 2012 | | | | 2019 | | | | 26,065.30 | | | | 26,065.30 | |
Fixed Rate | | | 3.8750 | % | | | 2012 | | | | 2019 | | | | 8,161.80 | | | | 8,161.80 | |
| | | | | |
OTC-TEI | | | | | | | | | | | | | | | 53,335.95 | | | | 53,332.35 | |
| | | | | | | | | | | | | | | | | | | | |
Fixed Rate | | | 6.5000 | % | | | 2007 | | | | 2014 | | | | 626.55 | | | | 626.55 | |
Fixed Rate | | | 6.5000 | % | | | 2010 | | | | 2014 | | | | 989.40 | | | | 985.80 | |
Fixed Rate | | | 8.3750 | % | | | 2008 | | | | 2015 | | | | 11,725.20 | | | | 11,725.20 | |
Fixed Rate | | | 7.0000 | % | | | 2010 | | | | 2017 | | | | 13,118.60 | | | | 13,118.60 | |
Fixed Rate | | | 5.3750 | % | | | 2010 | | | | 2017 | | | | 508.90 | | | | 508.90 | |
Fixed Rate | | | 5.0000 | % | | | 2011 | | | | 2018 | | | | 89.00 | | | | 89.00 | |
Fixed Rate | | | 5.3750 | % | | | 2012 | | | | 2017 | | | | 2,063.80 | | | | 2,063.80 | |
Fixed Rate | | | 5.0000 | % | | | 2012 | | | | 2018 | | | | 7,191.20 | | | | 7,191.20 | |
Fixed Rate | | | 5.0000 | % | | | 2012 | | | | 2019 | | | | 3,381.70 | | | | 3,381.70 | |
Fixed Rate | | | 4.7500 | % | | | 2012 | | | | 2019 | | | | 4,966.60 | | | | 4,966.60 | |
Fixed Rate | | | 3.8750 | % | | | 2013 | | | | 2019 | | | | 8,675.00 | | | | 8,675.00 | |
| | | | | |
10 Yr FXTB | | | | | | | | | | | | | | | 558,862.20 | | | | 467,795.68 | |
| | | | | | | | | | | | | | | | | | | | |
| | | | | |
AUCTION | | | | | | | | | | | | | | | 281,977.00 | | | | 202,259.95 | |
| | | | | | | | | | | | | | | | | | | | |
Fixed Rate | | | 11.0000 | % | | | 2003 | | | | 2013 | | | | 3,000.00 | | | | 2,121.75 | |
Fixed Rate | | | 12.7500 | % | | | 2004 | | | | 2014 | | | | 4,500.00 | | | | 2,659.44 | |
Fixed Rate | | | 12.3750 | % | | | 2005 | | | | 2015 | | | | 12,000.00 | | | | 5,479.18 | |
Fixed Rate | | | 10.1250 | % | | | 2005 | | | | 2015 | | | | 4,000.00 | | | | 1,669.33 | |
T-25
DOMESTIC GOVERNMENT SECURITIES(1)
As of September 30, 2013
(In million Pesos)
| | | | | | | | | | | | | | | | | | | | |
Interest Rate Basis | | Interest Rate
(Per Annum) | | | Year
Contracted | | | Year of
Maturity | | | Original
Amount | | | Outstanding
as of
September 30, 2013 | |
Fixed Rate | | | 9.2500 | % | | | 2006 | | | | 2016 | | | | 8,000.00 | | | | 2,884.39 | |
Fixed Rate | | | 7.5000 | % | | | 2006 | | | | 2016 | | | | 2,000.00 | | | | 1,215.53 | |
Fixed Rate | | | 7.0000 | % | | | 2006 | | | | 2016 | | | | 3,315.00 | | | | 2,332.09 | |
Fixed Rate | | | 6.2500 | % | | | 2006 | | | | 2016 | | | | 6,000.00 | | | | 2,597.64 | |
Fixed Rate | | | 7.7500 | % | | | 2008 | | | | 2017 | | | | 4,500.00 | | | | 2,943.58 | |
Fixed Rate | | | 7.8750 | % | | | 2009 | | | | 2019 | | | | 30,900.00 | | | | 12,109.65 | |
Fixed Rate | | | 7.7500 | % | | | 2010 | | | | 2020 | | | | 22,862.00 | | | | 8,478.86 | |
Fixed Rate | | | 6.1250 | % | | | 2010 | | | | 2020 | | | | 8,000.00 | | | | 4,389.85 | |
Fixed Rate | | | 6.1250 | % | | | 2011 | | | | 2020 | | | | 5,400.00 | | | | 5,400.00 | |
Fixed Rate | | | 5.8750 | % | | | 2011 | | | | 2018 | | | | 43,500.00 | | | | 34,716.96 | |
Fixed Rate | | | 6.5000 | % | | | 2011 | | | | 2021 | | | | 36,000.00 | | | | 25,261.72 | |
Fixed Rate | | | 5.7500 | % | | | 2011 | | | | 2021 | | | | 9,000.00 | | | | 9,000.00 | |
Fixed Rate | | | 5.7500 | % | | | 2012 | | | | 2021 | | | | 27,000.00 | | | | 27,000.00 | |
Fixed Rate | | | 4.8750 | % | | | 2012 | | | | 2022 | | | | 9,000.00 | | | | 9,000.00 | |
Fixed Rate | | | 4.7500 | % | | | 2012 | | | | 2022 | | | | 9,000.00 | | | | 9,000.00 | |
Fixed Rate | | | 4.0000 | % | | | 2012 | | | | 2022 | | | | 9,000.00 | | | | 9,000.00 | |
Fixed Rate | | | 4.0000 | % | | | 2013 | | | | 2022 | | | | 25,000.00 | | | | 25,000.00 | |
| | | | | |
TAP | | | | | | | | | | | | | | | 999.00 | | | | 999.00 | |
| | | | | | | | | | | | | | | | | | | | |
Fixed Rate | | | 7.7500 | % | | | 2010 | | | | 2020 | | | | 179.00 | | | | 179.00 | |
Fixed Rate | | | 6.5000 | % | | | 2011 | | | | 2021 | | | | 820.00 | | | | 820.00 | |
| | | | | |
OTC-GOCC | | | | | | | | | | | | | | | 157,825.50 | | | | 154,108.99 | |
| | | | | | | | | | | | | | | | | | | | |
Fixed Rate | | | 11.0000 | % | | | 2003 | | | | 2013 | | | | 50.30 | | | | 50.30 | |
Fixed Rate | | | 12.3750 | % | | | 2004 | | | | 2014 | | | | 13,783.00 | | | | 10,074.69 | |
Fixed Rate | | | 12.7500 | % | | | 2004 | | | | 2014 | | | | 936.90 | | | | 936.90 | |
Fixed Rate | | | 12.3750 | % | | | 2005 | | | | 2015 | | | | 727.90 | | | | 727.90 | |
Fixed Rate | | | 11.8750 | % | | | 2005 | | | | 2015 | | | | 330.40 | | | | 330.40 | |
Fixed Rate | | | 10.1250 | % | | | 2005 | | | | 2015 | | | | 40.10 | | | | 40.10 | |
Fixed Rate | | | 9.2500 | % | | | 2006 | | | | 2016 | | | | 828.30 | | | | 828.30 | |
Fixed Rate | | | 7.5000 | % | | | 2006 | | | | 2016 | | | | 8,528.80 | | | | 8,528.80 | |
Fixed Rate | | | 7.7500 | % | | | 2007 | | | | 2017 | | | | 14,770.30 | | | | 14,762.10 | |
Fixed Rate | | | 7.7500 | % | | | 2008 | | | | 2017 | | | | 8.20 | | | | 8.20 | |
Fixed Rate | | | 8.8750 | % | | | 2008 | | | | 2018 | | | | 5,607.70 | | | | 5,607.70 | |
Fixed Rate | | | 7.8750 | % | | | 2009 | | | | 2019 | | | | 17,429.30 | | | | 17,429.30 | |
Fixed Rate | | | 7.8750 | % | | | 2010 | | | | 2019 | | | | 107.40 | | | | 107.40 | |
Fixed Rate | | | 7.7500 | % | | | 2010 | | | | 2020 | | | | 6,316.60 | | | | 6,316.60 | |
Fixed Rate | | | 6.1250 | % | | | 2010 | | | | 2020 | | | | 4,932.90 | | | | 4,932.90 | |
Fixed Rate | | | 6.2500 | % | | | 2011 | | | | 2016 | | | | 236.40 | | | | 236.40 | |
Fixed Rate | | | 5.8750 | % | | | 2011 | | | | 2018 | | | | 522.20 | | | | 522.20 | |
Fixed Rate | | | 7.8750 | % | | | 2011 | | | | 2019 | | | | 628.90 | | | | 628.90 | |
Fixed Rate | | | 6.1250 | % | | | 2011 | | | | 2020 | | | | 26.30 | | | | 26.30 | |
Fixed Rate | | | 6.5000 | % | | | 2011 | | | | 2021 | | | | 10,506.40 | | | | 10,506.40 | |
Fixed Rate | | | 5.7500 | % | | | 2011 | | | | 2021 | | | | 5,930.70 | | | | 5,930.70 | |
Fixed Rate | | | 4.8750 | % | | | 2012 | | | | 2022 | | | | 19,458.70 | | | | 19,458.70 | |
Fixed Rate | | | 4.7500 | % | | | 2012 | | | | 2022 | | | | 15,849.80 | | | | 15,849.80 | |
Fixed Rate | | | 4.0000 | % | | | 2012 | | | | 2022 | | | | 30,268.00 | | | | 30,268.00 | |
| | | | | |
OTC-TEI | | | | | | | | | | | | | | | 118,060.70 | | | | 110,427.75 | |
| | | | | | | | | | | | | | | | | | | | |
Fixed Rate | | | 9.9000 | % | | | 2003 | | | | 2013 | | | | 10.30 | | | | 10.30 | |
Fixed Rate | | | 12.3750 | % | | | 2004 | | | | 2014 | | | | 0.80 | | | | 0.80 | |
Fixed Rate | | | 11.1375 | % | | | 2004 | | | | 2014 | | | | 446.50 | | | | 446.50 | |
Fixed Rate | | | 12.7500 | % | | | 2004 | | | | 2014 | | | | 200.00 | | | | 200.00 | |
Fixed Rate | | | 11.4750 | % | | | 2004 | | | | 2014 | | | | 1,739.90 | | | | 1,739.90 | |
T-26
DOMESTIC GOVERNMENT SECURITIES(1)
As of September 30, 2013
(In million Pesos)
| | | | | | | | | | | | | | | | | | | | |
Interest Rate Basis | | Interest Rate
(Per Annum) | | | Year
Contracted | | | Year of
Maturity | | | Original
Amount | | | Outstanding
as of
September 30, 2013 | |
Fixed Rate | | | 12.3750 | % | | | 2005 | | | | 2015 | | | | 3,526.30 | | | | 3,526.30 | |
Fixed Rate | | | 11.1375 | % | | | 2005 | | | | 2015 | | | | 3,409.50 | | | | 3,409.50 | |
Fixed Rate | | | 11.8750 | % | | | 2005 | | | | 2015 | | | | 8,246.40 | | | | 6,639.15 | |
Fixed Rate | | | 10.8750 | % | | | 2005 | | | | 2015 | | | | 587.90 | | | | 587.90 | |
Fixed Rate | | | 9.1125 | % | | | 2005 | | | | 2015 | | | | 38.00 | | | | 38.00 | |
Fixed Rate | | | 9.2500 | % | | | 2006 | | | | 2016 | | | | 987.20 | | | | 987.20 | |
Fixed Rate | | | 8.3250 | % | | | 2006 | | | | 2016 | | | | 110.00 | | | | 110.00 | |
Fixed Rate | | | 7.5000 | % | | | 2006 | | | | 2016 | | | | 126.80 | | | | 126.80 | |
Fixed Rate | | | 7.7500 | % | | | 2007 | | | | 2017 | | | | 1,039.60 | | | | 365.20 | |
Fixed Rate | | | 7.7500 | % | | | 2008 | | | | 2017 | | | | 3,055.50 | | | | 3,729.90 | |
Fixed Rate | | | 5.8750 | % | | | 2008 | | | | 2018 | | | | 50.00 | | | | 50.00 | |
Fixed Rate | | | 8.8750 | % | | | 2008 | | | | 2018 | | | | 7,327.50 | | | | 1,301.80 | |
Fixed Rate | | | 7.8750 | % | | | 2009 | | | | 2019 | | | | 43,176.10 | | | | 43,176.10 | |
Fixed Rate | | | 7.7500 | % | | | 2010 | | | | 2020 | | | | 5,644.30 | | | | 5,644.30 | |
Fixed Rate | | | 6.1250 | % | | | 2010 | | | | 2020 | | | | 10,726.00 | | | | 10,726.00 | |
Fixed Rate | | | 7.7500 | % | | | 2011 | | | | 2020 | | | | 1,586.50 | | | | 1,586.50 | |
Fixed Rate | | | 6.2500 | % | | | 2011 | | | | 2016 | | | | 2,232.00 | | | | 2,232.00 | |
Fixed Rate | | | 5.8750 | % | | | 2011 | | | | 2018 | | | | 5,608.10 | | | | 5,608.10 | |
Fixed Rate | | | 6.5000 | % | | | 2011 | | | | 2021 | | | | 8,942.60 | | | | 8,942.60 | |
Fixed Rate | | | 4.8750 | % | | | 2012 | | | | 2022 | | | | 324.40 | | | | 324.40 | |
Fixed Rate | | | 4.7500 | % | | | 2012 | | | | 2022 | | | | 7,225.50 | | | | 7,225.50 | |
Fixed Rate | | | 4.0000 | % | | | 2012 | | | | 2022 | | | | 68.00 | | | | 68.00 | |
Fixed Rate | | | 4.0000 | % | | | 2013 | | | | 2022 | | | | 1,625.00 | | | | 1,625.00 | |
| | | | | |
20 Yr FXTB | | | | | | | | | | | | | | | 297,454.71 | | | | 261,865.31 | |
| | | | | | | | | | | | | | | | | | | | |
| | | | | |
AUCTION | | | | | | | | | | | | | | | 143,395.00 | | | | 107,755.60 | |
| | | | | | | | | | | | | | | | | | | | |
Fixed Rate | | | 14.3750 | % | | | 1997 | | | | 2017 | | | | 2,000.00 | | | | 1,625.88 | |
Fixed Rate | | | 15.0000 | % | | | 2002 | | | | 2022 | | | | 4,000.00 | | | | 3,637.40 | |
Fixed Rate | | | 12.7500 | % | | | 2002 | | | | 2022 | | | | 1,000.00 | | | | 760.00 | |
Fixed Rate | | | 13.0000 | % | | | 2003 | | | | 2023 | | | | 4,500.00 | | | | 2,862.99 | |
Fixed Rate | | | 11.8750 | % | | | 2003 | | | | 2023 | | | | 6,972.00 | | | | 4,818.49 | |
Fixed Rate | | | 11.3750 | % | | | 2003 | | | | 2023 | | | | 3,000.00 | | | | 1,441.12 | |
Fixed Rate | | | 12.3750 | % | | | 2004 | | | | 2024 | | | | 3,252.00 | | | | 2,530.54 | |
Fixed Rate | | | 12.8750 | % | | | 2004 | | | | 2024 | | | | 2,948.00 | | | | 2,269.02 | |
Fixed Rate | | | 13.7500 | % | | | 2004 | | | | 2024 | | | | 3,330.00 | | | | 2,493.00 | |
Fixed Rate | | | 12.1250 | % | | | 2005 | | | | 2025 | | | | 8,500.00 | | | | 4,994.75 | |
Fixed Rate | | | 10.2500 | % | | | 2006 | | | | 2026 | | | | 13,578.00 | | | | 8,028.51 | |
Fixed Rate | | | 8.0000 | % | | | 2006 | | | | 2026 | | | | 4,322.00 | | | | 2,268.44 | |
Fixed Rate | | | 8.6250 | % | | | 2007 | | | | 2027 | | | | 5,925.00 | | | | 1,225.83 | |
Fixed Rate | | | 9.5000 | % | | | 2008 | | | | 2028 | | | | 4,918.00 | | | | 3,562.18 | |
Fixed Rate | | | 9.5000 | % | | | 2009 | | | | 2028 | | | | 8,500.00 | | | | 8,500.00 | |
Fixed Rate | | | 8.7500 | % | | | 2010 | | | | 2030 | | | | 17,000.00 | | | | 7,087.45 | |
Fixed Rate | | | 5.8750 | % | | | 2012 | | | | 2032 | | | | 15,650.00 | | | | 15,650.00 | |
Fixed Rate | | | 5.7500 | % | | | 2012 | | | | 2032 | | | | 9,000.00 | | | | 9,000.00 | |
Fixed Rate | | | 3.6250 | % | | | 2013 | | | | 2033 | | | | 25,000.00 | | | | 25,000.00 | |
| | | | | |
TAP | | | | | | | | | | | | | | | 37,769.90 | | | | 37,769.90 | |
| | | | | | | | | | | | | | | | | | | | |
Fixed Rate | | | 14.3750 | % | | | 1997 | | | | 2017 | | | | 3,804.90 | | | | 3,804.90 | |
Fixed Rate | | | 13.0000 | % | | | 2003 | | | | 2023 | | | | 1,900.00 | | | | 1,900.00 | |
Fixed Rate | | | 11.3750 | % | | | 2003 | | | | 2023 | | | | 670.00 | | | | 670.00 | |
Fixed Rate | | | 8.6250 | % | | | 2007 | | | | 2027 | | | | 1,895.00 | | | | 1,895.00 | |
Fixed Rate | | | 8.6250 | % | | | 2008 | | | | 2027 | | | | 3,500.00 | | | | 3,500.00 | |
Fixed Rate | | | 8.7500 | % | | | 2010 | | | | 2030 | | | | 17,000.00 | | | | 17,000.00 | |
Fixed Rate | | | 5.8750 | % | | | 2012 | | | | 2032 | | | | 9,000.00 | | | | 9,000.00 | |
T-27
DOMESTIC GOVERNMENT SECURITIES(1)
As of September 30, 2013
(In million Pesos)
| | | | | | | | | | | | | | | | | | | | |
Interest Rate Basis | | Interest Rate
(Per Annum) | | | Year
Contracted | | | Year of
Maturity | | | Original
Amount | | | Outstanding
as of
September 30, 2013 | |
| | | | | |
OTC-GOCC | | | | | | | | | | | | | | | 42,129.11 | | | | 42,129.11 | |
| | | | | | | | | | | | | | | | | | | | |
Fixed Rate | | | 14.3750 | % | | | 1997 | | | | 2017 | | | | 4,020.10 | | | | 4,020.11 | |
Fixed Rate | | | 12.8400 | % | | | 1998 | | | | 2018 | | | | 10.45 | | | | 10.45 | |
Fixed Rate | | | 12.8400 | % | | | 1999 | | | | 2019 | | | | 6.52 | | | | 6.52 | |
Fixed Rate | | | 12.8400 | % | | | 2000 | | | | 2020 | | | | 2.20 | | | | 2.20 | |
Fixed Rate | | | 12.8400 | % | | | 2001 | | | | 2021 | | | | 2.42 | | | | 2.42 | |
Fixed Rate | | | 12.8400 | % | | | 2002 | | | | 2022 | | | | 2.67 | | | | 2.67 | |
Fixed Rate | | | 15.0000 | % | | | 2002 | | | | 2022 | | | | 3,116.10 | | | | 3,116.10 | |
Fixed Rate | | | 12.8400 | % | | | 2003 | | | | 2023 | | | | 2.95 | | | | 2.95 | |
Fixed Rate | | | 13.0000 | % | | | 2003 | | | | 2023 | | | | 5.40 | | | | 5.40 | |
Fixed Rate | | | 11.8750 | % | | | 2003 | | | | 2023 | | | | 14.50 | | | | 14.50 | |
Fixed Rate | | | 11.3750 | % | | | 2003 | | | | 2023 | | | | 1.80 | | | | 1.80 | |
Fixed Rate | | | 12.3750 | % | | | 2004 | | | | 2024 | | | | 0.80 | | | | 0.80 | |
Fixed Rate | | | 12.8750 | % | | | 2004 | | | | 2024 | | | | 276.80 | | | | 276.80 | |
Fixed Rate | | | 13.7500 | % | | | 2004 | | | | 2024 | | | | 863.80 | | | | 863.80 | |
Fixed Rate | | | 12.1250 | % | | | 2005 | | | | 2025 | | | | 276.90 | | | | 276.90 | |
Fixed Rate | | | 10.2500 | % | | | 2006 | | | | 2026 | | | | 2.70 | | | | 2.70 | |
Fixed Rate | | | 8.6250 | % | | | 2007 | | | | 2027 | | | | 162.50 | | | | 162.50 | |
Fixed Rate | | | 9.5000 | % | | | 2008 | | | | 2028 | | | | 4,162.70 | | | | 4,162.70 | |
Fixed Rate | | | 8.7500 | % | | | 2010 | | | | 2030 | | | | 8,914.70 | | | | 8,914.70 | |
Fixed Rate | | | 8.0000 | % | | | 2011 | | | | 2026 | | | | 437.80 | | | | 437.80 | |
Fixed Rate | | | 8.6250 | % | | | 2011 | | | | 2027 | | | | 0.80 | | | | 0.80 | |
Fixed Rate | | | 8.7500 | % | | | 2011 | | | | 2030 | | | | 2,592.20 | | | | 2,592.20 | |
Fixed Rate | | | 5.8750 | % | | | 2012 | | | | 2032 | | | | 2,007.80 | | | | 2,007.80 | |
Fixed Rate | | | 5.7500 | % | | | 2012 | | | | 2032 | | | | 10,006.00 | | | | 10,006.00 | |
Fixed Rate | | | 3.6250 | % | | | 2013 | | | | 2033 | | | | 5,238.50 | | | | 5,238.50 | |
| | | | | |
OTC-TEI | | | | | | | | | | | | | | | 74,160.70 | | | | 74,210.70 | |
| | | | | | | | | | | | | | | | | | | | |
Fixed Rate | | | 13.5000 | % | | | 2002 | | | | 2022 | | | | 35.00 | | | | 35.00 | |
Fixed Rate | | | 13.0000 | % | | | 2003 | | | | 2023 | | | | 900.00 | | | | 900.00 | |
Fixed Rate | | | 11.7000 | % | | | 2003 | | | | 2023 | | | | 287.00 | | | | 287.00 | |
Fixed Rate | | | 11.1375 | % | | | 2004 | | | | 2024 | | | | 258.30 | | | | 258.30 | |
Fixed Rate | | | 11.5875 | % | | | 2004 | | | | 2024 | | | | 60.00 | | | | 60.00 | |
Fixed Rate | | | 12.3750 | % | | | 2004 | | | | 2024 | | | | 15.90 | | | | 15.90 | |
Fixed Rate | | | 10.9125 | % | | | 2005 | | | | 2025 | | | | 119.00 | | | | 119.00 | |
Fixed Rate | | | 12.1250 | % | | | 2005 | | | | 2025 | | | | 453.10 | | | | 453.10 | |
Fixed Rate | | | 10.2500 | % | | | 2006 | | | | 2026 | | | | 1,163.90 | | | | 1,163.90 | |
Fixed Rate | | | 8.6250 | % | | | 2007 | | | | 2027 | | | | 1,015.80 | | | | 1,015.80 | |
Fixed Rate | | | 9.5000 | % | | | 2008 | | | | 2028 | | | | 107.50 | | | | 107.50 | |
Fixed Rate | | | 9.5000 | % | | | 2009 | | | | 2028 | | | | 1,253.10 | | | | 1,253.10 | |
Fixed Rate | | | 8.7500 | % | | | 2010 | | | | 2030 | | | | 37,815.40 | | | | 37,815.40 | |
Fixed Rate | | | 8.0000 | % | | | 2011 | | | | 2026 | | | | 9,479.10 | | | | 9,529.10 | |
Fixed Rate | | | 8.6250 | % | | | 2011 | | | | 2027 | | | | 50.00 | | | | 50.00 | |
Fixed Rate | | | 5.8750 | % | | | 2012 | | | | 2032 | | | | 11,366.40 | | | | 11,366.40 | |
Fixed Rate | | | 5.7500 | % | | | 2012 | | | | 2032 | | | | 1,473.70 | | | | 1,473.70 | |
Fixed Rate | | | 3.6250 | % | | | 2013 | | | | 2033 | | | | 8,307.50 | | | | 8,307.50 | |
| | | | | |
25 Yr FXTB | | | | | | | | | | | | | | | 235,376.40 | | | | 230,584.84 | |
| | | | | | | | | | | | | | | | | | | | |
| | | | | |
AUCTION | | | | | | | | | | | | | | | 92,011.00 | | | | 87,220.14 | |
| | | | | | | | | | | | | | | | | | | | |
Fixed Rate | | | 18.2500 | % | | | 2000 | | | | 2025 | | | | 5,286.00 | | | | 3,837.36 | |
Fixed Rate | | | 12.5000 | % | | | 2005 | | | | 2030 | | | | 4,000.00 | | | | 2,822.80 | |
Fixed Rate | | | 11.2500 | % | | | 2006 | | | | 2031 | | | | 3,104.00 | | | | 2,406.69 | |
T-28
DOMESTIC GOVERNMENT SECURITIES(1)
As of September 30, 2013
(In million Pesos)
| | | | | | | | | | | | | | | | | | | | |
Interest Rate Basis | | Interest Rate
(Per Annum) | | | Year
Contracted | | | Year of
Maturity | | | Original
Amount | | | Outstanding
as of
September 30, 2013 | |
Fixed Rate | | | 9.3750 | % | | | 2006 | | | | 2031 | | | | 8,000.00 | | | | 7,832.54 | |
Fixed Rate | | | 8.5000 | % | | | 2007 | | | | 2032 | | | | 7,000.00 | | | | 5,699.76 | |
Fixed Rate | | | 9.2500 | % | | | 2009 | | | | 2034 | | | | 13,000.00 | | | | 13,000.00 | |
Fixed Rate | | | 8.0000 | % | | | 2010 | | | | 2035 | | | | 8,500.00 | | | | 8,500.00 | |
Fixed Rate | | | 11.2500 | % | | | 2011 | | | | 2031 | | | | 4,121.00 | | | | 4,121.00 | |
Fixed Rate | | | 8.0000 | % | | | 2011 | | | | 2035 | | | | 3,000.00 | | | | 3,000.00 | |
Fixed Rate | | | 7.6250 | % | | | 2011 | | | | 2036 | | | | 27,000.00 | | | | 27,000.00 | |
Fixed Rate | | | 5.7500 | % | | | 2012 | | | | 2037 | | | | 9,000.00 | | | | 9,000.00 | |
| | | | | |
TAP | | | | | | | | | | | | | | | 11,151.00 | | | | 11,151.00 | |
| | | | | | | | | | | | | | | | | | | | |
Fixed Rate | | | 18.2500 | % | | | 2000 | | | | 2025 | | | | 2,320.00 | | | | 2,320.00 | |
Fixed Rate | | | 12.5000 | % | | | 2005 | | | | 2030 | | | | 3,000.00 | | | | 3,000.00 | |
Fixed Rate | | | 8.5000 | % | | | 2007 | | | | 2032 | | | | 4,064.00 | | | | 4,064.00 | |
Fixed Rate | | | 8.5000 | % | | | 2008 | | | | 2032 | | | | 967.00 | | | | 967.00 | |
Fixed Rate | | | 7.6250 | % | | | 2011 | | | | 2036 | | | | 800.00 | | | | 800.00 | |
| | | | | |
OTC-GOCC | | | | | | | | | | | | | | | 72,053.20 | | | | 72,052.50 | |
| | | | | | | | | | | | | | | | | | | | |
Fixed Rate | | | 18.2500 | % | | | 2000 | | | | 2025 | | | | 96.10 | | | | 96.10 | |
Fixed Rate | | | 12.5000 | % | | | 2005 | | | | 2030 | | | | 57.50 | | | | 57.50 | |
Fixed Rate | | | 11.2500 | % | | | 2006 | | | | 2031 | | | | 70.60 | | | | 69.90 | |
Fixed Rate | | | 8.5000 | % | | | 2007 | | | | 2032 | | | | 10,359.20 | | | | 10,359.20 | |
Fixed Rate | | | 9.2500 | % | | | 2009 | | | | 2034 | | | | 7,857.20 | | | | 7,857.20 | |
Fixed Rate | | | 8.0000 | % | | | 2010 | | | | 2035 | | | | 43,447.10 | | | | 43,447.10 | |
Fixed Rate | | | 8.5000 | % | | | 2011 | | | | 2032 | | | | 88.20 | | | | 88.20 | |
Fixed Rate | | | 8.0000 | % | | | 2011 | | | | 2035 | | | | 73.50 | | | | 73.50 | |
Fixed Rate | | | 7.6250 | % | | | 2011 | | | | 2036 | | | | 5,003.80 | | | | 5,003.80 | |
Fixed Rate | | | 5.7500 | % | | | 2012 | | | | 2037 | | | | 5,000.00 | | | | 5,000.00 | |
| | | | | |
OTC-TEI | | | | | | | | | | | | | | | 60,161.20 | | | | 60,161.20 | |
| | | | | | | | | | | | | | | | | | | | |
Fixed Rate | | | 18.2500 | % | | | 2000 | | | | 2025 | | | | 500.00 | | | | 500.00 | |
Fixed Rate | | | 11.2500 | % | | | 2005 | | | | 2030 | | | | 100.20 | | | | 100.20 | |
Fixed Rate | | | 11.2500 | % | | | 2006 | | | | 2031 | | | | 2,855.40 | | | | 2,855.40 | |
Fixed Rate | | | 10.1250 | % | | | 2006 | | | | 2031 | | | | 255.00 | | | | 255.00 | |
Fixed Rate | | | 8.5000 | % | | | 2007 | | | | 2032 | | | | 1,040.00 | | | | 1,040.00 | |
Fixed Rate | | | 9.2500 | % | | | 2009 | | | | 2034 | | | | 9,984.90 | | | | 9,984.90 | |
Fixed Rate | | | 8.0000 | % | | | 2010 | | | | 2035 | | | | 8,991.00 | | | | 8,991.00 | |
Fixed Rate | | | 11.2500 | % | | | 2011 | | | | 2031 | | | | 2,088.20 | | | | 2,088.20 | |
Fixed Rate | | | 8.5000 | % | | | 2011 | | | | 2032 | | | | 26,870.80 | | | | 26,870.80 | |
Fixed Rate | | | 7.6250 | % | | | 2011 | | | | 2036 | | | | 888.30 | | | | 888.30 | |
Fixed Rate | | | 5.7500 | % | | | 2012 | | | | 2037 | | | | 6,587.40 | | | | 6,587.40 | |
| | | | | |
D. Retail Treasury Bonds | | | | | | | | | | | | | | | 924,218.91 | | | | 860,169.16 | |
| | | | | | | | | | | | | | | | | | | | |
5 Yr RTB | | | | | | | | | | | | | | | 124,224.79 | | | | 96,321.95 | |
| | | | | | | | | | | | | | | | | | | | |
AUCTION/IPO | | | | | | | | | | | | | | | 103,205.79 | | | | 75,302.95 | |
| | | | | | | | | | | | | | | | | | | | |
Fixed Rate | | | 6.2500 | % | | | 2009 | | | | 2014 | | | | 50,185.79 | | | | 31,105.72 | |
Fixed Rate | | | 5.8750 | % | | | 2010 | | | | 2015 | | | | 30,014.00 | | | | 25,296.64 | |
Fixed Rate | | | 6.0000 | % | | | 2011 | | | | 2016 | | | | 23,006.00 | | | | 18,900.58 | |
| | | | | |
OTC-GOCC | | | | | | | | | | | | | | | 16,219.00 | | | | 16,219.00 | |
| | | | | | | | | | | | | | | | | | | | |
Fixed Rate | | | 6.2500 | % | | | 2009 | | | | 2014 | | | | 5,800.00 | | | | 5,800.00 | |
Fixed Rate | | | 5.8750 | % | | | 2010 | | | | 2015 | | | | 416.00 | | | | 416.00 | |
Fixed Rate | | | 6.0000 | % | | | 2011 | | | | 2016 | | | | 10,003.00 | | | | 10,003.00 | |
T-29
DOMESTIC GOVERNMENT SECURITIES(1)
As of September 30, 2013
(In million Pesos)
| | | | | | | | | | | | | | | | | | | | |
Interest Rate Basis | | Interest Rate
(Per Annum) | | | Year
Contracted | | | Year of
Maturity | | | Original
Amount | | | Outstanding
as of
September 30, 2013 | |
| | | | | |
OTC-TEI | | | | | | | | | | | | | | | 4,800.00 | | | | 4,800.00 | |
| | | | | | | | | | | | | | | | | | | | |
Fixed Rate | | | 6.2500 | % | | | 2009 | | | | 2014 | | | | 3,500.00 | | | | 3,500.00 | |
Fixed Rate | | | 5.8750 | % | | | 2010 | | | | 2015 | | | | 1,300.00 | | | | 1,300.00 | |
| | | | | |
7 Yr RTB | | | | | | | | | | | | | | | 69,380.88 | | | | 53,048.39 | |
| | | | | | | | | | | | | | | | | | | | |
AUCTION/IPO | | | | | | | | | | | | | | | 58,723.88 | | | | 42,391.39 | |
| | | | | | | | | | | | | | | | | | | | |
Fixed Rate | | | 7.0000 | % | | | 2009 | | | | 2016 | | | | 29,372.88 | | | | 18,763.25 | |
Fixed Rate | | | 6.6250 | % | | | 2010 | | | | 2017 | | | | 29,351.00 | | | | 23,628.14 | |
| | | | | |
OTC-GOCC | | | | | | | | | | | | | | | 5,357.00 | | | | 5,357.00 | |
| | | | | | | | | | | | | | | | | | | | |
Fixed Rate | | | 7.0000 | % | | | 2009 | | | | 2016 | | | | 5,000.00 | | | | 5,000.00 | |
Fixed Rate | | | 6.6250 | % | | | 2010 | | | | 2017 | | | | 357.00 | | | | 357.00 | |
| | | | | |
OTC-TEI | | | | | | | | | | | | | | | 5,300.00 | | | | 5,300.00 | |
| | | | | | | | | | | | | | | | | | | | |
Fixed Rate | | | 7.0000 | % | | | 2009 | | | | 2016 | | | | 1,000.00 | | | | 1,000.00 | |
Fixed Rate | | | 6.6250 | % | | | 2010 | | | | 2017 | | | | 4,300.00 | | | | 4,300.00 | |
| | | | | |
10 Yr RTB | | | | | | | | | | | | | | | 102,720.00 | | | | 82,905.58 | |
| | | | | | | | | | | | | | | | | | | | |
| | | | | |
AUCTION/IPO | | | | | | | | | | | | | | | 61,608.00 | | | | 41,793.58 | |
| | | | | | | | | | | | | | | | | | | | |
Fixed Rate | | | 7.2500 | % | | | 2010 | | | | 2020 | | | | 25,635.00 | | | | 13,098.23 | |
Fixed Rate | | | 7.3750 | % | | | 2011 | | | | 2021 | | | | 35,973.00 | | | | 28,695.35 | |
| | | | | |
OTC-GOCC | | | | | | | | | | | | | | | 13,036.00 | | | | 13,036.00 | |
| | | | | | | | | | | | | | | | | | | | |
Fixed Rate | | | 7.2500 | % | | | 2010 | | | | 2020 | | | | 1,897.00 | | | | 1,897.00 | |
Fixed Rate | | | 7.3750 | % | | | 2011 | | | | 2021 | | | | 11,139.00 | | | | 11,139.00 | |
| | | | | |
OTC-TEI | | | | | | | | | | | | | | | 28,076.00 | | | | 28,076.00 | |
| | | | | | | | | | | | | | | | | | | | |
Fixed Rate | | | 7.2500 | % | | | 2010 | | | | 2020 | | | | 4,230.00 | | | | 4,230.00 | |
Fixed Rate | | | 7.3750 | % | | | 2011 | | | | 2021 | | | | 23,846.00 | | | | 23,846.00 | |
| | | | | |
10 Yr RTB2 | | | | | | | | | | | | | | | 204,953.06 | | | | 204,953.06 | |
| | | | | | | | | | | | | | | | | | | | |
| | | | | |
AUCTION/IPO | | | | | | | | | | | | | | | 172,403.06 | | | | 172,403.06 | |
| | | | | | | | | | | | | | | | | | | | |
Fixed Rate | | | 5.7500 | % | | | 2011 | | | | 2021 | | | | 22,403.06 | | | | 22,403.06 | |
Fixed Rate | | | 3.2500 | % | | | 2013 | | | | 2023 | | | | 150,000.00 | | | | 150,000.00 | |
| | | | | |
OTC-GOCC | | | | | | | | | | | | | | | 29,050.00 | | | | 29,050.00 | |
| | | | | | | | | | | | | | | | | | | | |
Fixed Rate | | | 5.7500 | % | | | 2011 | | | | 2021 | | | | 506.60 | | | | 506.60 | |
Fixed Rate | | | 5.7500 | % | | | 2011 | | | | 2021 | | | | 28,543.40 | | | | 28,543.40 | |
| | | | | |
OTC-TEI | | | | | | | | | | | | | | | 3,500.00 | | | | 3,500.00 | |
| | | | | | | | | | | | | | | | | | | | |
Fixed Rate | | | 5.7500 | % | | | 2011 | | | | 2021 | | | | 3,500.00 | | | | 3,500.00 | |
| | | | | |
15 Yr RTB | | | | | | | | | | | | | | | 99,281.43 | | | | 99,281.43 | |
| | | | | | | | | | | | | | | | | | | | |
| | | | | |
AUCTION/IPO | | | | | | | | | | | | | | | 64,284.43 | | | | 64,284.43 | |
| | | | | | | | | | | | | | | | | | | | |
Fixed Rate | | | 6.2500 | % | | | 2011 | | | | 2026 | | | | 29,053.96 | | | | 29,053.96 | |
Fixed Rate | | | 5.3750 | % | | | 2012 | | | | 2027 | | | | 35,230.47 | | | | 35,230.47 | |
| | | | | |
OTC-GOCC | | | | | | | | | | | | | | | 28,497.00 | | | | 28,497.00 | |
| | | | | | | | | | | | | | | | | | | | |
Fixed Rate | | | 6.2500 | % | | | 2011 | | | | 2026 | | | | 90.00 | | | | 90.00 | |
Fixed Rate | | | 6.2500 | % | | | 2011 | | | | 2026 | | | | 24,500.00 | | | | 24,500.00 | |
Fixed Rate | | | 5.3750 | % | | | 2012 | | | | 2027 | | | | 3,730.00 | | | | 3,730.00 | |
Fixed Rate | | | 5.3750 | % | | | 2012 | | | | 2027 | | | | 177.00 | | | | 177.00 | |
T-30
DOMESTIC GOVERNMENT SECURITIES(1)
As of September 30, 2013
(In million Pesos)
| | | | | | | | | | | | | | | | | | | | |
Interest Rate Basis | | Interest Rate
(Per Annum) | | | Year
Contracted | | | Year of
Maturity | | | Original
Amount | | | Outstanding
as of
September 30, 2013 | |
| | | | | |
OTC-TEI | | | | | | | | | | | | | | | 6,500.00 | | | | 6,500.00 | |
| | | | | | | | | | | | | | | | | | | | |
Fixed Rate | | | 6.2500 | % | | | 2011 | | | | 2026 | | | | 500.00 | | | | 500.00 | |
Fixed Rate | | | 6.2500 | % | | | 2011 | | | | 2026 | | | | 1,000.00 | | | | 1,000.00 | |
Fixed Rate | | | 5.3750 | % | | | 2012 | | | | 2027 | | | | 5,000.00 | | | | 5,000.00 | |
| | | | | |
20 Yr RTB | | | | | | | | | | | | | | | 135,658.75 | | | | 135,658.75 | |
| | | | | | | | | | | | | | | | | | | | |
| | | | | |
AUCTION/IPO | | | | | | | | | | | | | | | 129,573.75 | | | | 129,573.75 | |
| | | | | | | | | | | | | | | | | | | | |
Fixed Rate | | | 5.8750 | % | | | 2012 | | | | 2032 | | | | 129,573.75 | | | | 129,573.75 | |
| | | | | |
OTC-GOCC | | | | | | | | | | | | | | | 85.00 | | | | 85.00 | |
| | | | | | | | | | | | | | | | | | | | |
Fixed Rate | | | 5.8750 | % | | | 2012 | | | | 2032 | | | | 85.00 | | | | 85.00 | |
| | | | | |
OTC-TEI | | | | | | | | | | | | | | | 6,000.00 | | | | 6,000.00 | |
| | | | | | | | | | | | | | | | | | | | |
Fixed Rate | | | 5.8750 | % | | | 2012 | | | | 2032 | | | | 6,000.00 | | | | 6,000.00 | |
| | | | | |
25 Yr RTB | | | | | | | | | | | | | | | 188,000.00 | | | | 188,000.00 | |
| | | | | | | | | | | | | | | | | | | | |
| | | | | |
AUCTION/IPO | | | | | | | | | | | | | | | 188,000.00 | | | | 188,000.00 | |
| | | | | | | | | | | | | | | | | | | | |
Fixed Rate | | | 6.1250 | % | | | 2012 | | | | 2037 | | | | 188,000.00 | | | | 188,000.00 | |
| | | | | |
E. 10 Yr Special Purpose T/Bonds for CARP | | | | | | | | | | | | | | | 7,000.00 | | | | 7,000.00 | |
| | | | | | | | | | | | | | | | | | | | |
AUCTION | | | | | | | | | | | | | | | 4,000.00 | | | | 4,000.00 | |
| | | | | | | | | | | | | | | | | | | | |
Fixed Rate | | | 12.2500 | % | | | 2004 | | | | 2014 | | | | 4,000.00 | | | | 4,000.00 | |
| | | | | |
TAP | | | | | | | | | | | | | | | 3,000.00 | | | | 3,000.00 | |
| | | | | | | | | | | | | | | | | | | | |
Fixed Rate | | | 12.2500 | % | | | 2004 | | | | 2014 | | | | 3,000.00 | | | | 3,000.00 | |
| | | | | |
F. BENCHMARK BONDS | | | | | | | | | | | | | | | 946,552.85 | | | | 834,133.64 | |
| | | | | | | | | | | | | | | | | | | | |
| | | | | |
5 Yr | | | | | | | | | | | | | | | 151,710.72 | | | | 107,925.53 | |
| | | | | | | | | | | | | | | | | | | | |
REGULAR/SWITCH AUCTION | | | | | | | | | | | | | | | 97,730.92 | | | | 53,945.73 | |
| | | | | | | | | | | | | | | | | | | | |
Fixed Rate | | | 6.250 | % | | | 2009 | | | | 2014 | | | | 97,730.92 | | | | 53,945.73 | |
| | | | | |
OTC-GOCC | | | | | | | | | | | | | | | 27,194.80 | | | | 27,194.80 | |
| | | | | | | | | | | | | | | | | | | | |
Fixed Rate | | | 6.250 | % | | | 2009 | | | | 2014 | | | | 27,194.80 | | | | 27,194.80 | |
| | | | | |
OTC-TEI | | | | | | | | | | | | | | | 26,785.00 | | | | 26,785.00 | |
| | | | | | | | | | | | | | | | | | | | |
Fixed Rate | | | 6.250 | % | | | 2009 | | | | 2014 | | | | 26,785.00 | | | | 26,785.00 | |
| | | | | |
7 Yr | | | | | | | | | | | | | | | 158,924.93 | | | | 136,771.27 | |
| | | | | | | | | | | | | | | | | | | | |
REGULAR/SWITCH AUCTION | | | | | | | | | | | | | | | 85,983.63 | | | | 30,312.57 | |
| | | | | | | | | | | | | | | | | | | | |
Fixed Rate | | | 7.000 | % | | | 2009 | | | | 2016 | | | | 85,983.63 | | | | 30,312.57 | |
| | | | | |
OTC-GOCC | | | | | | | | | | | | | | | 11,849.40 | | | | 41,498.80 | |
| | | | | | | | | | | | | | | | | | | | |
Fixed Rate | | | 7.000 | % | | | 2009 | | | | 2016 | | | | 11,849.40 | | | | 41,498.80 | |
| | | | | |
OTC-TEI | | | | | | | | | | | | | | | 61,091.90 | | | | 64,959.90 | |
| | | | | | | | | | | | | | | | | | | | |
Fixed Rate | | | 7.000 | % | | | 2009 | | | | 2016 | | | | 61,091.90 | | | | 64,959.90 | |
T-31
DOMESTIC GOVERNMENT SECURITIES(1)
As of September 30, 2013
(In million Pesos)
| | | | | | | | | | | | | | | | | | | | |
Interest Rate Basis | | Interest Rate
(Per Annum) | | | Year
Contracted | | | Year of
Maturity | | | Original
Amount | | | Outstanding
as of
September 30, 2013 | |
| | | | | |
10 Yr | | | | | | | | | | | | | | | 146,443.17 | | | | 99,962.81 | |
| | | | | | | | | | | | | | | | | | | | |
REGULAR/SWITCH AUCTION | | | | | | | | | | | | | | | 83,631.65 | | | | 48,574.36 | |
| | | | | | | | | | | | | | | | | | | | |
Fixed Rate | | | 9.125 | % | | | 2006 | | | | 2016 | | | | 65,631.65 | | | | 30,574.36 | |
Fixed Rate | | | 9.125 | % | | | 2007 | | | | 2016 | | | | 18,000.00 | | | | 18,000.00 | |
| | | | | |
OTC-GOCC | | | | | | | | | | | | | | | 2,928.50 | | | | 2,928.50 | |
| | | | | | | | | | | | | | | | | | | | |
Fixed Rate | | | 9.125 | % | | | 2006 | | | | 2016 | | | | 37.40 | | | | 37.40 | |
Fixed Rate | | | 9.125 | % | | | 2007 | | | | 2016 | | | | 392.10 | | | | 392.10 | |
Fixed Rate | | | 9.125 | % | | | 2008 | | | | 2016 | | | | 2,492.70 | | | | 2,492.70 | |
Fixed Rate | | | 9.125 | % | | | 2009 | | | | 2016 | | | | 6.30 | | | | 6.30 | |
| | | | | |
OTC-TEI | | | | | | | | | | | | | | | 15,366.90 | | | | 15,366.90 | |
| | | | | | | | | | | | | | | | | | | | |
Fixed Rate | | | 9.125 | % | | | 2006 | | | | 2016 | | | | 47.50 | | | | 47.50 | |
Fixed Rate | | | 9.125 | % | | | 2007 | | | | 2016 | | | | 180.20 | | | | 180.20 | |
Fixed Rate | | | 9.125 | % | | | 2008 | | | | 2016 | | | | 14,940.80 | | | | 14,940.80 | |
Fixed Rate | | | 9.125 | % | | | 2009 | | | | 2016 | | | | 198.40 | | | | 198.40 | |
| | | | | |
SWITCH AUCTION | | | | | | | | | | | | | | | 33,452.93 | | | | 22,029.85 | |
| | | | | | | | | | | | | | | | | | | | |
Fixed Rate | | | 5.875 | % | | | 2010 | | | | 2020 | | | | 33,452.93 | | | | 22,029.85 | |
| | | | | |
OTC-GOCC | | | | | | | | | | | | | | | 1,472.90 | | | | 1,472.90 | |
| | | | | | | | | | | | | | | | | | | | |
Fixed Rate | | | 5.875 | % | | | 2011 | | | | 2020 | | | | 517.60 | | | | 517.60 | |
Fixed Rate | | | 5.875 | % | | | 2011 | | | | 2020 | | | | 955.30 | | | | 955.30 | |
| | | | | |
OTC-TEI | | | | | | | | | | | | | | | 9,590.30 | | | | 9,590.30 | |
| | | | | | | | | | | | | | | | | | | | |
Fixed Rate | | | 5.875 | % | | | 2011 | | | | 2020 | | | | 280.10 | | | | 280.10 | |
Fixed Rate | | | 5.875 | % | | | 2011 | | | | 2020 | | | | 207.00 | | | | 207.00 | |
Fixed Rate | | | 5.875 | % | | | 2011 | | | | 2020 | | | | 9,103.20 | | | | 9,103.20 | |
| | | | | |
10.5 Yr | | | | | | | | | | | | | | | 67,626.83 | | | | 67,626.83 | |
| | | | | | | | | | | | | | | | | | | | |
| | | | | |
SWITCH AUCTION | | | | | | | | | | | | | | | 67,616.83 | | | | 67,616.83 | |
| | | | | | | | | | | | | | | | | | | | |
Fixed Rate | | | 6.375 | % | | | 2011 | | | | 2022 | | | | 67,616.83 | | | | 67,616.83 | |
| | | | | |
OTC-TEI | | | | | | | | | | | | | | | 10.00 | | | | 10.00 | |
| | | | | | | | | | | | | | | | | | | | |
Fixed Rate | | | 6.375 | % | | | 2011 | | | | 2022 | | | | 10.00 | | | | 10.00 | |
| | | | | |
20 Yr | | | | | | | | | | | | | | | 255,837.15 | | | | 255,837.15 | |
| | | | | | | | | | | | | | | | | | | | |
| | | | | |
SWITCH AUCTION | | | | | | | | | | | | | | | 255,837.15 | | | | 255,837.15 | |
| | | | | | | | | | | | | | | | | | | | |
Fixed Rate | | | 8.000 | % | | | 2011 | | | | 2031 | | | | 255,837.15 | | | | 255,837.15 | |
| | | | | |
25 Yr | | | | | | | | | | | | | | | 166,010.04 | | | | 166,010.04 | |
| | | | | | | | | | | | | | | | | | | | |
| | | | | |
SWITCH AUCTION | | | | | | | | | | | | | | | 166,010.04 | | | | 166,010.04 | |
| | | | | | | | | | | | | | | | | | | | |
Fixed Rate | | | 8.125 | % | | | 2010 | | | | 2035 | | | | 166,010.04 | | | | 166,010.04 | |
| | | | | |
G. MULTICURRENCY RTBs (2) | | | | | | | | | | | | | | | | | | | 6,138.58 | |
| | | | | | | | | | | | | | | | | | | | |
| | | | | |
a. USDollar RTBs | | | | | | | | | | | | | | | 6,147.11 | | | | 5,824.64 | |
| | | | | | | | | | | | | | | | | | | | |
5 Yr Fixed Rate | | | 4.125 | % | | | 2010 | | | | 2015 | | | | 6,147.11 | | | | 5,824.64 | |
| | | | | |
b. EURO RTBs | | | | | | | | | | | | | | | 320.33 | | | | 313.95 | |
| | | | | | | | | | | | | | | | | | | | |
5 Yr Fixed Rate | | | 4.125 | % | | | 2010 | | | | 2015 | | | | 320.33 | | | | 313.95 | |
T-32
DOMESTIC GOVERNMENT SECURITIES(1)
As of September 30, 2013
(In million Pesos)
| | | | | | | | | | | | | | | | | | | | |
Interest Rate Basis | | Interest Rate
(Per Annum) | | | Year
Contracted | | | Year of
Maturity | | | Original
Amount | | | Outstanding
as of
September 30, 2013 | |
| | | | | |
H. ONSHORE DOLLAR BONDS (2) | | | | | | | | | | | | | | | 20,450.00 | | | | 21,675.00 | |
| | | | | | | | | | | | | | | | | | | | |
10.5 Yr Fixed Rate | | | 2.750 | % | | | 2012 | | | | 2023 | | | | 20,450.00 | | | | 21,675.00 | |
| | | | | |
II. NG GUARANTEED Government Securities (3) | | | | | | | | | | | | | | | | | | | 68,820.00 | |
| | | | | | | | | | | | | | | | | | | | |
| | | | | |
A. NDC (Agri-Agra Bonds) | | | | | | | | | | | | | | | 3,500.00 | | | | 3,500.00 | |
| | | | | | | | | | | | | | | | | | | | |
5 Yr Fixed Rate | | | 5.125 | % | | | 2009 | | | | 2014 | | | | 3,500.00 | | | | 3,500.00 | |
| | | | | |
B. HGC ZERO COUPON BOND | | | | | | | | | | | | | | | 12,000.00 | | | | 12,000.00 | |
| | | | | | | | | | | | | | | | | | | | |
7 Yr | | | | | | | 2006 | | | | 2013 | | | | 12,000.00 | | | | 12,000.00 | |
| | | | | |
C. NFA Fixed Rate Coupon Bond | | | | | | | | | | | | | | | 17,000.00 | | | | 17,000.00 | |
| | | | | | | | | | | | | | | | | | | | |
10 Yr Fixed Rate | | | 6.750 | % | | | 2008 | | | | 2018 | | | | 8,000.00 | | | | 8,000.00 | |
10 Yr Fixed Rate | | | 6.375 | % | | | 2009 | | | | 2019 | | | | 9,000.00 | | | | 9,000.00 | |
| | | | | |
D. NPC Fixed Rate COUPON BOND | | | | | | | | | | | | | | | 6,320.00 | | | | 6,320.00 | |
| | | | | | | | | | | | | | | | | | | | |
10 Yr Fixed Rate | | | 5.875 | % | | | 2006 | | | | 2016 | | | | 6,320.00 | | | | 6,320.00 | |
| | | | | |
E. PSALM Fixed Rate RTB | | | | | | | | | | | | | | | 30,000.00 | | | | 30,000.00 | |
| | | | | | | | | | | | | | | | | | | | |
5 Yr Fixed Rate | | | 6.875 | % | | | 2010 | | | | 2015 | | | | 11,322.00 | | | | 11,322.00 | |
7 Yr Fixed Rate | | | 7.750 | % | | | 2010 | | | | 2017 | | | | 18,678.00 | | | | 18,678.00 | |
| (1) | Excludes Government securities issued offshore by the Republic. |
| (2) | Multicurrency RTBs and Onshore Dollar Bonds converted to Pesos using BSP reference rate as of September 30, 2013: |
| | | | |
| 1 USD = (Peso)43.35 | | 1 EUR = 1.3523 USD | | |
| (3) | Excludes HGC guranteed PAG-IBIG Housing Bonds amounting to (Peso)12.0B. |
T-33
DOMESTIC DEBT OF THE REPUBLIC OF THE PHILIPPINES (OTHER THAN SECURITIES)(1)
As of September 30, 2013
(In million Pesos)
| | | | | | | | | | | | | | | | | | | | | | | | | | |
Interest Rate Basis | | Interest Rate +
Spread (Per Annum) | | Year
Contracted | | | Year of
Maturity | | | Original
Amount Contracted | | | Outstanding Balance as
of September 30,
2013
| |
| | | | | In Original
Currency | | | In Philippine
Peso | | | In Original
Currency | | | In Philippine
Peso | |
TOTAL | | | | | | | | | | | | | | | | | 444 | | | | | | | | 600 | |
| | | | | | | | | | | | | | | | | | | | | | | | | | |
DIRECT LOANS | | | | | | | | | | | | | | | | | 0 | | | | | | | | 156 | |
| | | | | | | | | | | | | | | | | | | | | | | | | | |
AGENCIES | | | | | | | | | | | | | | | | | 0 | | | | 156 | | | | 156 | |
| | | | | | | | | | | | | | | | | | | | | | | | | | |
PHILIPPINE PESOS | | | | | | | | | | | | | | | | | | | | | 156 | | | | 156 | |
INTEREST FREE | | | | | 1953 | | | | Upon Demand | | | | | | | | | | | | 79 | | | | 79 | |
INTEREST FREE | | | | | 1953 | | | | Upon Demand | | | | | | | | | | | | 48 | | | | 48 | |
INTEREST FREE | | | | | 1953 | | | | Upon Demand | | | | | | | | | | | | 29 | | | | 29 | |
| | | | | | | |
ASSUMED LOANS (REAL) | | | | | | | | | | | | | 444 | | | | 444 | | | | 444 | | | | 444 | |
| | | | | | | | | | | | | | | | | | | | | | | | | | |
PHILIPPINE PESOS | | | | | | | | | | | | | 444 | | | | 444 | | | | 444 | | | | 444 | |
| | | | | | | | | | | | | | | | | | | | | | | | | | |
INTEREST FREE | | | | | 1986 | | | | Upon Demand | | | | 120 | | | | 120 | | | | 120 | | | | 120 | |
INTEREST FREE | | | | | 1986 | | | | Upon Demand | | | | 72 | | | | 72 | | | | 72 | | | | 72 | |
INTEREST FREE | | | | | 1986 | | | | Upon Demand | | | | 50 | | | | 50 | | | | 50 | | | | 50 | |
INTEREST FREE | | | | | 1986 | | | | Upon Demand | | | | 200 | | | | 200 | | | | 200 | | | | 200 | |
INTEREST FREE | | | | | 1986 | | | | Upon Demand | | | | 1 | | | | 1 | | | | 1 | | | | 1 | |
| (1) | Excludes Government securities and debt guaranteed by the Republic. |
T-34
GUARANTEED DOMESTIC DEBT OF THE REPUBLIC OF THE PHILIPPINES (OTHER THAN SECURITIES)(1)
As of September 30, 2013
(In million Pesos)
| | | | | | | | | | | | | | | | | | | | | | | | | | | | |
Interest Rate Basis | | Interest Rate +
Spread (Per Annum) | | | Year
Contracted | | | Year of
Maturity | | | Original Amount
Contracted | | | Outstanding Balance as of
September 30,
2013 | |
| | | | | In Original
Currency | | | In Philippine
Peso | | | In Original
Currency | | | In Philippine
Peso | |
TOTAL | | | | | | | | | | | | | | | 74,882 | | | | 74,882 | | | | 74,882 | | | | 74,799 | |
| | | | |
GFI GUARANTEE ASSUMED BY THE GOVERNMENT PER PROC. 50. | | | | 220 | | | | 220 | | | | 220 | | | | 136 | |
| | | | | | | |
INTEREST FREE | | | 0.0000 | % | | | 1986 | | | | Upon Demand | | | | 7 | | | | 7 | | | | 7 | | | | 7 | |
INTEREST FREE | | | 0.0000 | % | | | 1986 | | | | Upon Demand | | | | 30 | | | | 30 | | | | 30 | | | | 30 | |
INTEREST FREE | | | 0.0000 | % | | | 1986 | | | | Upon Demand | | | | 12 | | | | 12 | | | | 12 | | | | 12 | |
INTEREST FREE | | | 0.0000 | % | | | 1986 | | | | Upon Demand | | | | 17 | | | | 17 | | | | 17 | | | | 17 | |
INTEREST FREE | | | 0.0000 | % | | | 1986 | | | | Upon Demand | | | | 35 | | | | 35 | | | | 35 | | | | 15 | |
INTEREST FREE | | | 0.0000 | % | | | 1986 | | | | Upon Demand | | | | 7 | | | | 7 | | | | 7 | | | | 7 | |
INTEREST FREE | | | 0.0000 | % | | | 1986 | | | | Upon Demand | | | | 6 | | | | 6 | | | | 6 | | | | 6 | |
INTEREST FREE | | | 0.0000 | % | | | 1986 | | | | Upon Demand | | | | 5 | | | | 5 | | | | 5 | | | | 5 | |
INTEREST FREE | | | 0.0000 | % | | | 1986 | | | | Upon Demand | | | | 3 | | | | 3 | | | | 3 | | | | 3 | |
INTEREST FREE | | | 0.0000 | % | | | 1986 | | | | Upon Demand | | | | 1 | | | | 1 | | | | 1 | | | | 1 | |
INTEREST FREE | | | 0.0000 | % | | | 1986 | | | | Upon Demand | | | | 19 | | | | 19 | | | | 19 | | | | 19 | |
INTEREST FREE | | | 0.0000 | % | | | 1986 | | | | Upon Demand | | | | 32 | | | | 32 | | | | 32 | | | | 1 | |
INTEREST FREE | | | 0.0000 | % | | | 1986 | | | | Upon Demand | | | | 32 | | | | 32 | | | | 32 | | | | 5 | |
INTEREST FREE | | | 0.0000 | % | | | 1986 | | | | Upon Demand | | | | 8 | | | | 8 | | | | 8 | | | | 3 | |
INTEREST FREE | | | 0.0000 | % | | | 1986 | | | | Upon Demand | | | | 4 | | | | 4 | | | | 4 | | | | 4 | |
| | | | | | |
NG DIRECT GUARANTEE ON GOCC LOANS | | | | | | | | | | | | 74,663 | | | | 74,663 | | | | 74,663 | | | | 74,663 | |
| | | | | | | |
FLOATING RATE | | | 3.7500 | % | | | 2012 | | | | 2013 | | | | 1,350 | | | | 1,350 | | | | 1,350 | | | | 1,350 | |
FLOATING RATE | | | 4.0000 | % | | | 2011 | | | | 2021 | | | | 73,313 | | | | 73,313 | | | | 73,313 | | | | 73,313 | |
| (1) | Excludes securities issued by GOCCs. |
T-35
PART II
(as required by Items (11), (13) and (14) of Schedule B of the Securities Act of 1933.)
Item 11. Estimated Expenses
It is estimated that the expenses in connection with the sale of the debt securities hereunder, exclusive of compensation payable to underwriters and agents, will be as follows:
| | | | |
| | | ($) | |
SEC Registration Fee | | | — | |
Printing Costs* | | | 30,000 | |
Legal Fees and Expenses* | | | 100,000 | |
Fiscal Agent Fees and Expenses* | | | 33,775 | |
Miscellaneous* | | | 700,000 | |
| | | | |
Total | | | 863,775 | |
| | | | |
Undertakings
The undersigned Registrant hereby undertakes:
| | (1) | to file, during any period in which offers or sales are being made, a post-effective amendment to this Registration Statement: |
| | (i) | to include any prospectus required by Section 10(a)(3) of the Securities Act of 1933 (the “Act”); |
| | (ii) | to reflect in the prospectus any facts or events arising after the effective date of this Registration Statement (or the most recent post-effective amendment thereto) which, individually or in the aggregate, represent a fundamental change in the information set forth in this Registration Statement; and |
| | (iii) | to include any material information with respect to the plan of distribution not previously disclosed in this Registration Statement or any material change to such information in this Registration Statement; |
| | (2) | that, for the purpose of determining any liability under the Act, each such post-effective amendment that contains a form of prospectus shall be deemed to be a new registration statement relating to the securities covered thereby, and the offering of such securities at that time shall be deemed to be the initial bona fide offering thereof; and |
| | (3) | to remove from registration by means of a post-effective amendment any of the securities being registered which remain unsold at the termination of the offering. |
| | (4) | For purposes of determining any liability under the Act, the information omitted from the form of prospectus filed as part of this Registration Statement in reliance upon Rule 430A and contained in a form of prospectus filed by the Registrant pursuant to Rule 424(b)(1) or (4) or 497(h) under the Act shall be deemed to be part of this Registration Statement as of the time it was declared effective. |
II-1
Contents
This Registration Statement consists of:
| | |
1 | | Facing sheet. |
| |
2 | | Part I consisting of the Prospectus. |
| |
3 | | Part II consisting of pages numbered II-1 through II-5. |
| |
4 | | The following exhibits: |
| |
| | A. Fiscal Agency Agreement.1 |
| |
| | B. Form of Debt Securities (attached to the form of Fiscal Agency Agreement under A above).1 |
| |
| | C. Form of Warrant Agreement.2 |
| |
| | D. Form of Underwriting Agreement.3 |
| |
| | E. Opinion of the Secretary of the Department of Justice, the Republic of the Philippines, as to the legality of the Debt Securities.4 |
| |
| | F. Opinion of Linklaters, U.S. counsel to the Republic of the Philippines, as to the legality of the Debt Securities.4 |
| |
| | G. Consent of the Secretary of the Department of Justice of the Republic of the Philippines (included in Exhibit (E)).4 |
| |
| | H. Consent of Linklaters (included in Exhibit (F)).4 |
| |
| | I. Consent of Rosalia de Leon, National Treasurer, Republic of the Philippines (included on signature page). |
| |
| | J. Form of Supplement No. 1 to the Fiscal Agency Agreement (including form of Debt Securities).5 |
| |
| | K. Form of Supplement No. 2 to the Fiscal Agency Agreement (including form of Registered Security).6 |
Notes:
| (1) | Incorporated by reference to Registration Statement No. 333-10960. |
| (2) | To be filed concurrently with the applicable prospectus supplement in a post-effective amendment to this Registration Statement relating to a particular issue of debt securities or warrants. |
| (3) | Incorporated by reference to Registration Statement No. 333-183717 |
| (5) | Incorporated by reference to Registration Statement No. 333-108310. |
| (6) | Incorporated by reference to Post-Effective Amendment No. 1 to the Registration Statement No. 333-163671. |
II-2
Signature of the Republic of the Philippines
Pursuant to the requirements of the Securities Act of 1933, the Republic of the Philippines has duly caused this Registration Statement or amendment thereto to be signed on its behalf by the undersigned, thereunto duly authorized, in the city of Manila, Republic of the Philippines on the 12th day of December, 2013.
| | |
| REPUBLIC OF THE PHILIPPINES |
| |
| By | | /s/ ROSALIA DE LEON |
| | Rosalia de Leon1 Treasurer of the Philippines |
Note:
| (1) | Consent is hereby given to use of her name in connection with the information specified in this Registration Statement or amendment thereto to have been supplied by her and stated on her authority. |
II-3
Signature of Authorized Representative of the Republic of the Philippines
Pursuant to the Securities Act of 1933, the undersigned, a duly authorized representative of the Republic of the Philippines in the United States, has signed this Registration Statement or amendment thereto in The City of New York, New York on the 12th day of December, 2013.
| | |
| REPUBLIC OF THE PHILIPPINES |
| |
| By | | /s/ MARIO LOPEZ DE LEON, JR. |
| | Name: Mario Lopez de Leon, Jr. Title: Consul General |
II-4
Exhibit Index
| | | | |
Exhibit | | | Description |
| |
| | A. | | | Fiscal Agency Agreement.1 |
| |
| | B. | | | Form of Debt Securities (attached to the form of Fiscal Agency Agreement under A above).1 |
| |
| | C. | | | Form of Warrant Agreement.2 |
| |
| | D. | | | Form of Underwriting Agreement.3 |
| |
| | E. | | | Opinion of the Secretary of the Department of Justice, the Republic of the Philippines, as to the legality of the Debt Securities.4 |
| |
| | F. | | | Opinion of Linklaters, U.S. counsel to the Republic of the Philippines, as to the legality of the Debt Securities.4 |
| |
| | G. | | | Consent of the Secretary of the Department of Justice of the Republic of the Philippines (included in Exhibit (E)).4 |
| |
| | H. | | | Consent of Linklaters (included in Exhibit (F)).4 |
| |
| | I. | | | Consent of Rosalia de Leon, National Treasurer, Republic of the Philippines (included on signature page). |
| |
| | J. | | | Form of Supplement No. 1 to the Fiscal Agency Agreement (including form of Debt Securities).5 |
| |
| | K. | | | Form of Supplement No. 2 to the Fiscal Agency Agreement (including form of Registered Security).6 |
Notes:
| (1) | Incorporated by reference to Registration Statement No. 333-10960. |
| (2) | To be filed concurrently with the applicable prospectus supplement in a post-effective amendment to this Registration Statement relating to a particular issue of debt securities or warrants. |
| (3) | Incorporated by reference to Registration Statement No. 333-183717. |
| (5) | Incorporated by reference to Registration Statement No. 333-108310. |
| (6) | Incorporated by reference to Post-Effective Amendment No. 1 to Registration Statement No. 333-163671. |
II-5