Q3 Fiscal 2016 Investor Review TRR Jim Stephenson SVP Corp. Development & Planning Houlihan Lokey Global Industrials Conference New York, NY May 19, 2016
Safe Harbor Statement 2 Certain statements in this presentation may be forward-looking statements within the meaning of Section 27A of the Securities Act of 1933 and Section 21E of the Securities Exchange Act of 1934. You can identify these statements by forward-looking words such as "may," "expects," "plans," "anticipates," "believes," "estimates," or other words of similar import. You should consider statements that contain these words carefully because they discuss TRC’s future expectations, contain projections of the Company’s future results of operations or of its financial condition, or state other "forward-looking" information. TRC believes that it is important to communicate its future expectations to its investors. However, there may be events in the future that the Company is not able to accurately predict or control and that may cause its actual results to differ materially from the expectations described in its forward-looking statements. Investors are cautioned that all forward-looking statements involve risks and uncertainties, and actual results may differ materially from those discussed as a result of various factors, including, but not limited to, the uncertainty of TRC’s operational and growth strategies; circumstances which could create large cash outflows, such as contract losses, litigation, uncollectible receivables and income tax assessments; regulatory uncertainty; the availability of funding for government projects; the level of demand for TRC’s services; product acceptance; industry-wide competitive factors; the ability to continue to attract and retain highly skilled and qualified personnel; the availability and adequacy of insurance; and general political or economic conditions. Furthermore, market trends are subject to changes which could adversely affect future results. See the risk factors and additional discussion in TRC’s Annual Report on Form 10-K for the fiscal year ended June 30, 2015, Quarterly Reports on Form 10-Q, and other factors detailed from time to time in the Company’s other filings with the Securities and Exchange Commission. Also, this presentation contains references to non-GAAP metrics such as EBITDA, gross margin, adjusted EPS and free cash flow. A reconciliation of GAAP to non-GAAP metrics can be found on slides 27-35.
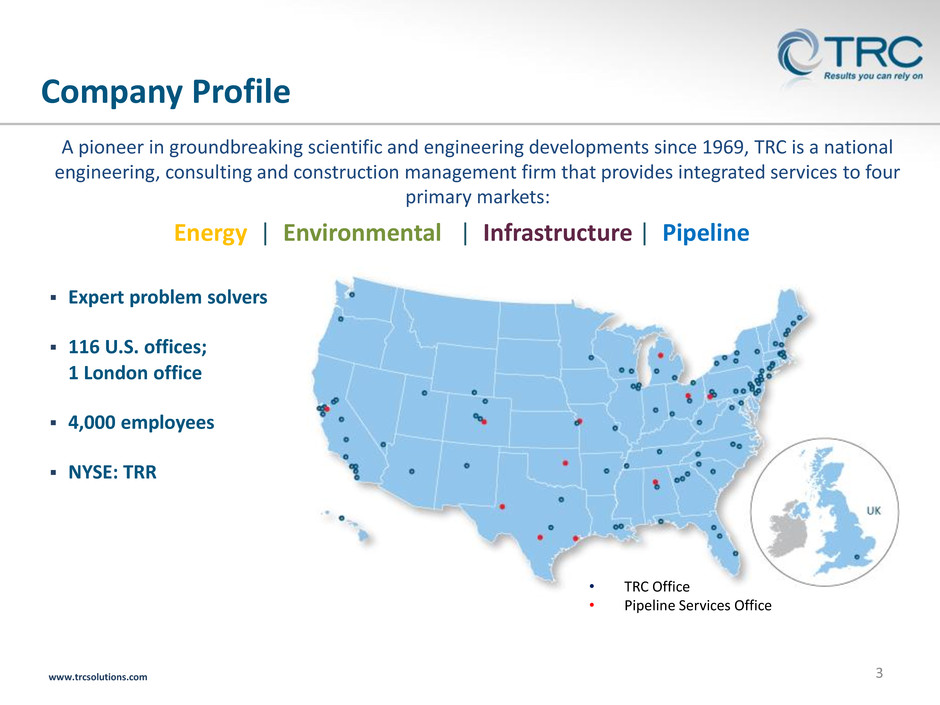
3 Company Profile www.trcsolutions.com • TRC Office • Pipeline Services Office Expert problem solvers 116 U.S. offices; 1 London office 4,000 employees NYSE: TRR Energy | Environmental | Infrastructure | Pipeline A pioneer in groundbreaking scientific and engineering developments since 1969, TRC is a national engineering, consulting and construction management firm that provides integrated services to four primary markets:

Highly Ranked in Our Industry 4 Total Annual Revenue Hazardous Waste Power Pure Design #13 #10 #14 #30 Rankings according to ENR magazine, May 2, 2016 and May 11, 2015 2016 2015 #15 #11 #15 #32

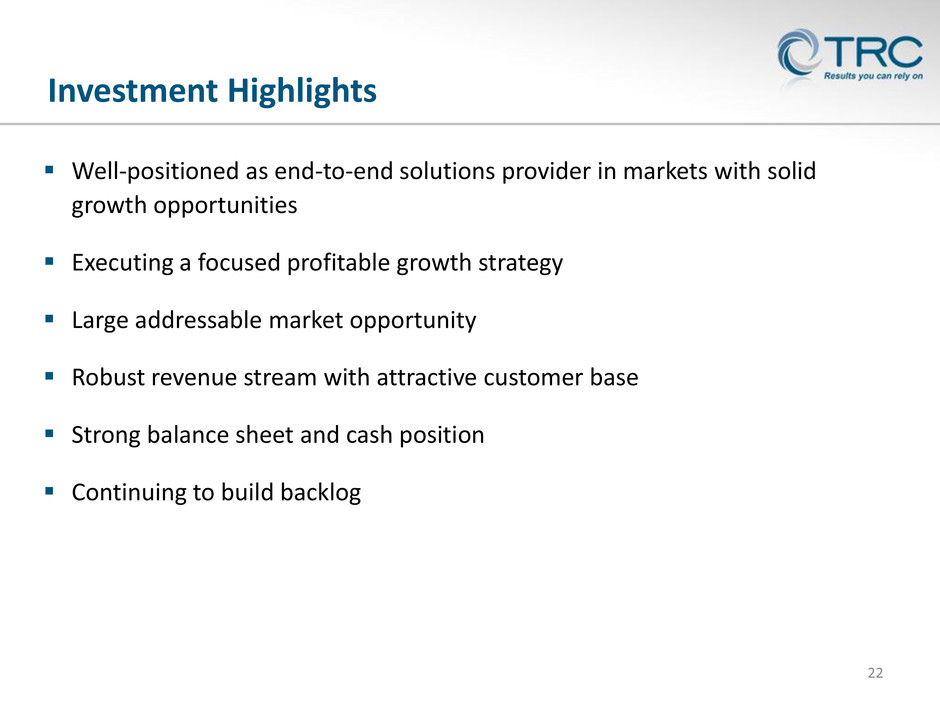
Investment Highlights 5 Well-positioned as end-to-end solutions provider in markets with solid growth opportunities Executing a focused profitable growth strategy Large addressable market opportunity Robust revenue stream with attractive customer base Strong balance sheet and cash position Continuing to build backlog
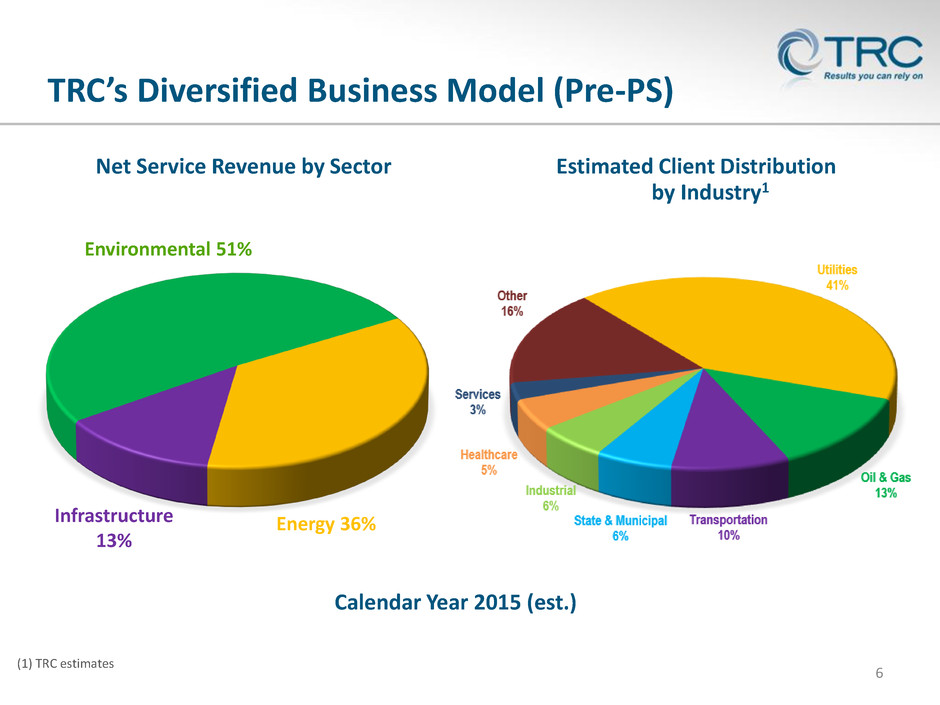
TRC’s Diversified Business Model (Pre-PS) 6 Net Service Revenue by Sector Calendar Year 2015 (est.) Infrastructure 13% Environmental 51% Energy 36% Estimated Client Distribution by Industry1 (1) TRC estimates
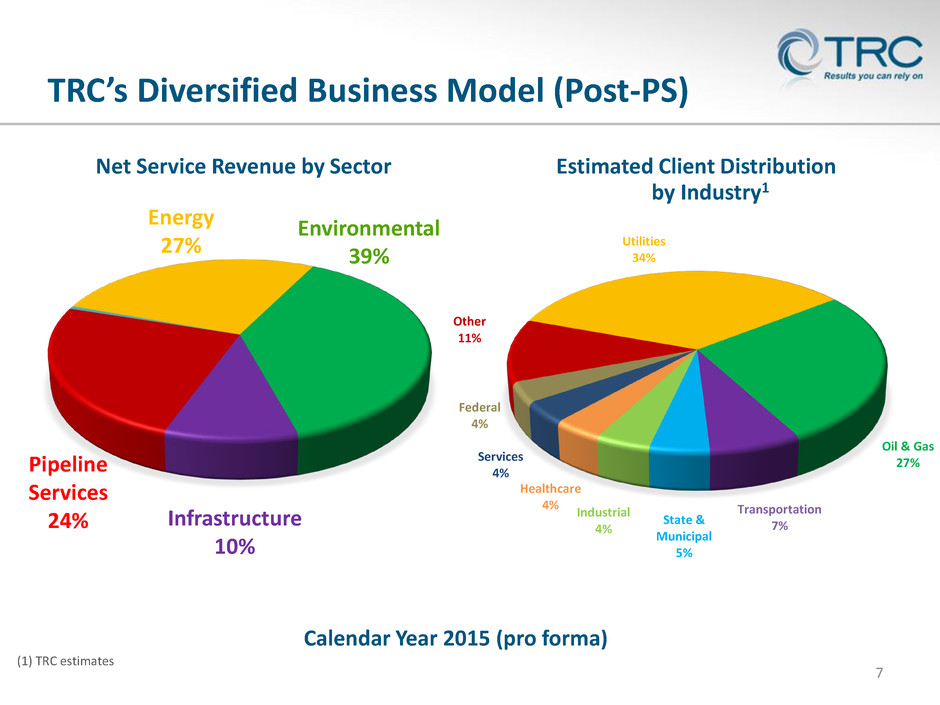
TRC’s Diversified Business Model (Post-PS) 7 Net Service Revenue by Sector Calendar Year 2015 (pro forma) Infrastructure 10% Energy 27% (1) TRC estimates Pipeline Services 24% Environmental 39% Utilities 34% Oil & Gas 27% Transportation 7%State & Municipal 5% Industrial 4% Healthcare 4% Services 4% Federal 4% Other 11% Estimated Client Distribution by Industry1

Private 92% Federal 4% State / Muni 4% TRC’s Revenue by Client Type 8 Calendar Year 2015 (est.) (1) TRC estimates Private 93% Federal 1% State / Muni 6% TRC Pre - WPS TRC Post - WPS

High-Profile Private Sector Clients 9
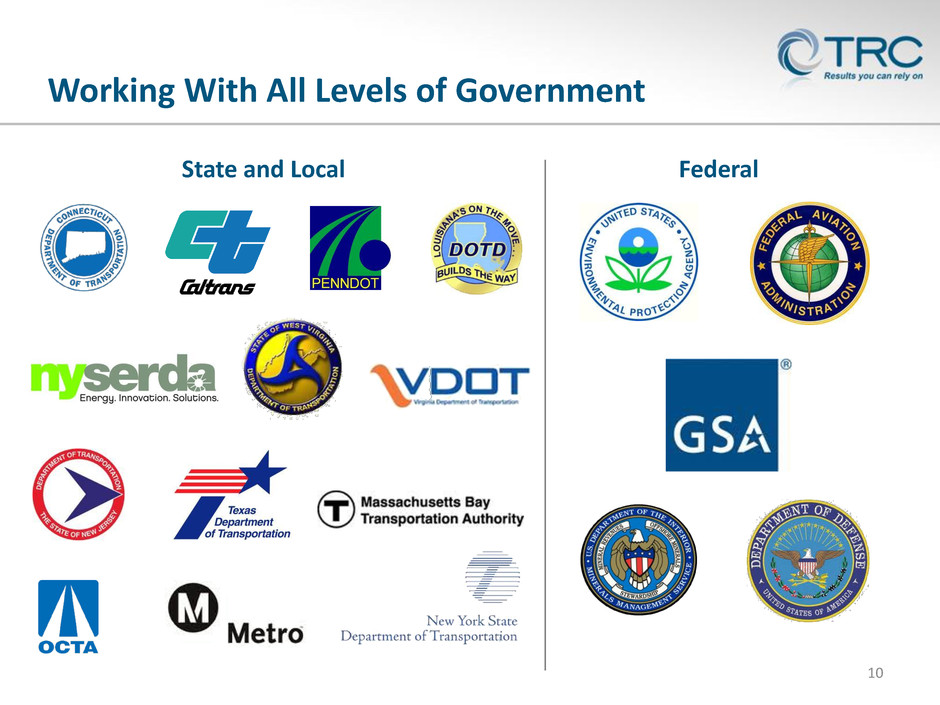
Working With All Levels of Government 10 State and Local Federal
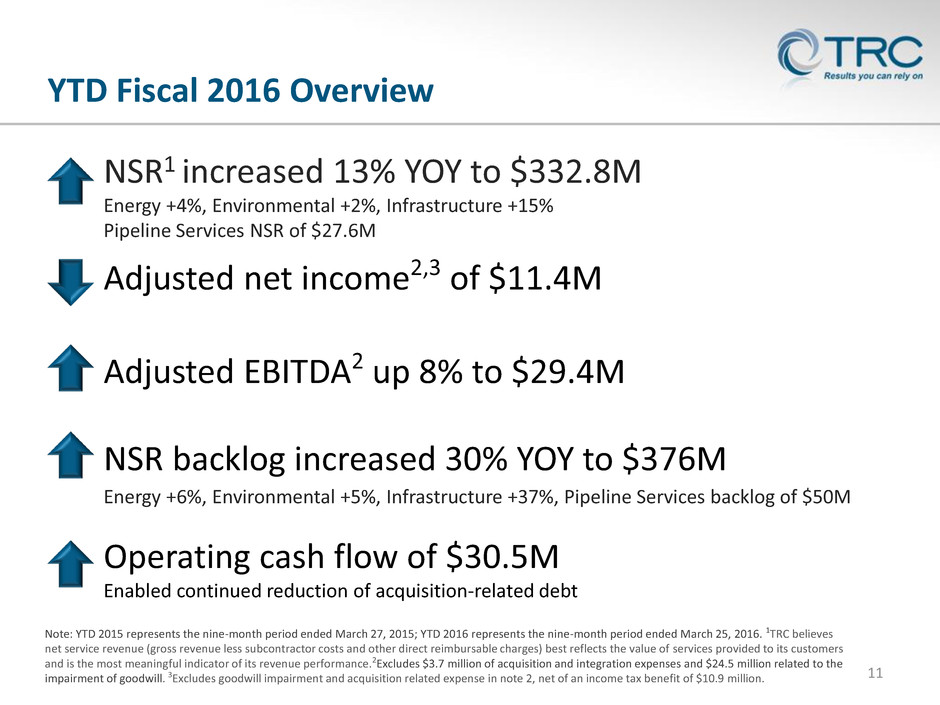
YTD Fiscal 2016 Overview 11 NSR1 increased 13% YOY to $332.8M Energy +4%, Environmental +2%, Infrastructure +15% Pipeline Services NSR of $27.6M Adjusted net income2,3 of $11.4M Energy +6%, Environmental +5%, Infrastructure +37%, Pipeline Services backlog of $50M Note: YTD 2015 represents the nine-month period ended March 27, 2015; YTD 2016 represents the nine-month period ended March 25, 2016. 1TRC believes net service revenue (gross revenue less subcontractor costs and other direct reimbursable charges) best reflects the value of services provided to its customers and is the most meaningful indicator of its revenue performance.2Excludes $3.7 million of acquisition and integration expenses and $24.5 million related to the impairment of goodwill. 3Excludes goodwill impairment and acquisition related expense in note 2, net of an income tax benefit of $10.9 million. NSR backlog increased 30% YOY to $376M Adjusted EBITDA2 up 8% to $29.4M Operating cash flow of $30.5M Enabled continued reduction of acquisition-related debt
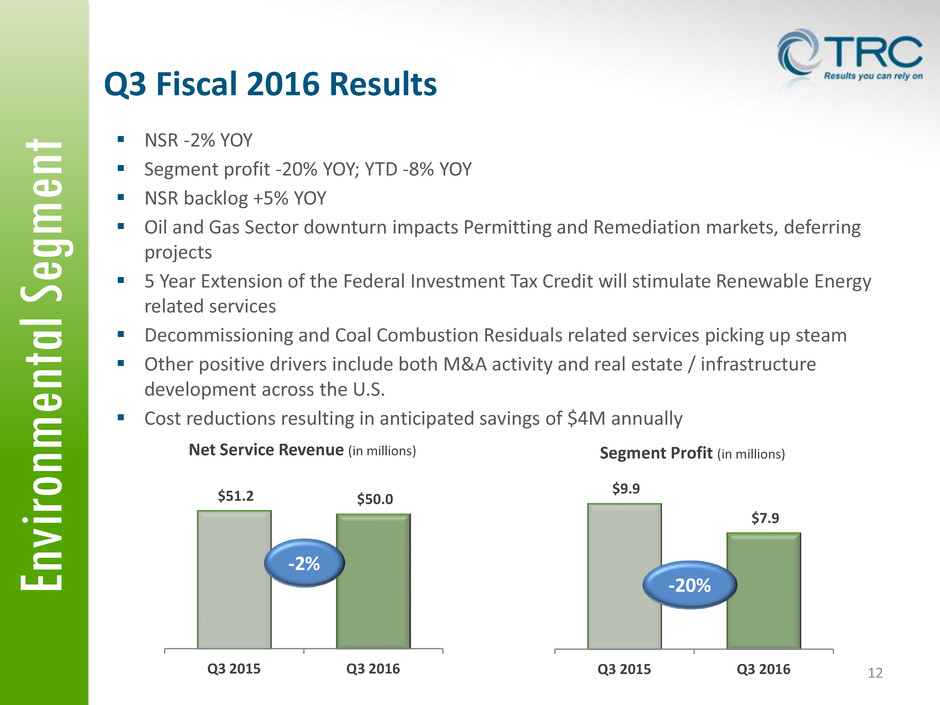
En vi ronmen tal S egmen t 12 $51.2 $50.0 Q3 2015 Q3 2016 Net Service Revenue (in millions) $9.9 $7.9 Q3 2015 Q3 2016 Segment Profit (in millions) -2% -20% NSR -2% YOY Segment profit -20% YOY; YTD -8% YOY NSR backlog +5% YOY Oil and Gas Sector downturn impacts Permitting and Remediation markets, deferring projects 5 Year Extension of the Federal Investment Tax Credit will stimulate Renewable Energy related services Decommissioning and Coal Combustion Residuals related services picking up steam Other positive drivers include both M&A activity and real estate / infrastructure development across the U.S. Cost reductions resulting in anticipated savings of $4M annually Q3 Fiscal 2016 Results

Ene rgy S egmen t 13 $37.1 $36.0 Q3 2015 Q3 2016 Net Service Revenue (in millions) $8.8 $8.0 Q3 2015 Q3 2016 Segment Profit (in millions) -9% -3% Q3 Fiscal 2016 Results NSR -3% YOY Segment profit -9% YOY; YTD +11% YOY NSR backlog +6% YOY Delays on significant new awards and timing of receipt of change orders Increased demand for services from investments in $50B electric power transmission and distribution market (EEI, October 2015) Extension of incentives for renewable generation and transitioning of coal generation to natural gas Energy efficiency resource standards in 30+ states; approximately $8B per year in funding (Edison Foundation, November 2015)

Inf rastruct ur e S egmen t 14 $11.9 $13.0 Q3 2015 Q3 2016 Net Service Revenue (in millions) $2.7 $2.6 Q3 2015 Q3 2016 Segment Profit (in millions) +10% -4% Q3 Fiscal 2016 Results NSR +10% YOY Segment profit -4% YOY due to prior-year change order; YTD +33% YOY NSR backlog +37% YOY Transportation market strengthening via FAST Act long-term funding ($305B) through FY 2020, in addition to enhanced state and local funding Increased private investment in expanded PPP programs / legislation Political will to improve aging infrastructure

Pipe line Services S egmen t 15 NSR $21.5 million Segment loss of $(3.1) million, including intangible asset amortization of $2.5 million and depreciation of $0.5 million NSR backlog $50 million Oil and Gas Sector downturn caused capital projects to be canceled or deferred PHMSA Regulations will drive significant expenditures related to Integrity Services Combination of U.S. Energy independence, net exporter of both Oil and Natural Gas and transitioning of source energy for Power Generation will bolster marketplace turnaround Cost reductions for anticipated savings of $15M annually $21.5 Q3 2016 Net Service Revenue (in millions) Q3 Fiscal 2016 Results $(3.1) Q3 2016 Segment Profit (in millions)

$70 $100 $96 $86 $88 $91 $133 $125 $139 $50 Q3 2015 Q2 2016 Q3 2016 Organic Segment NSR Backlog $376 NSR Backlog & New Project Wins 16 (in millions) $289 $313 Energy • Confidential Utility Client - $20M for cross cutting services for transmission re-conductoring • First Energy – up to $24M for testing & commissioning for transmission reliability excellence Environmental • Connecticut DOT – $12M for compliance, soil and groundwater services • Confidential Utility Client -- $4.2M for construction support for coal ash pond closures Infrastructure •NYC Dept. of Parks and Rec – $6M for construction project management • Capital Southeast Connector JPA (Calif.) – $1.7M for engineering and design Pipeline Services • PSNC Energy (N.C.) – $12.4M for pipeline project • Columbia Pipeline Group (Ohio) -- $1.2M for pipeline replacement Recent Project Awards
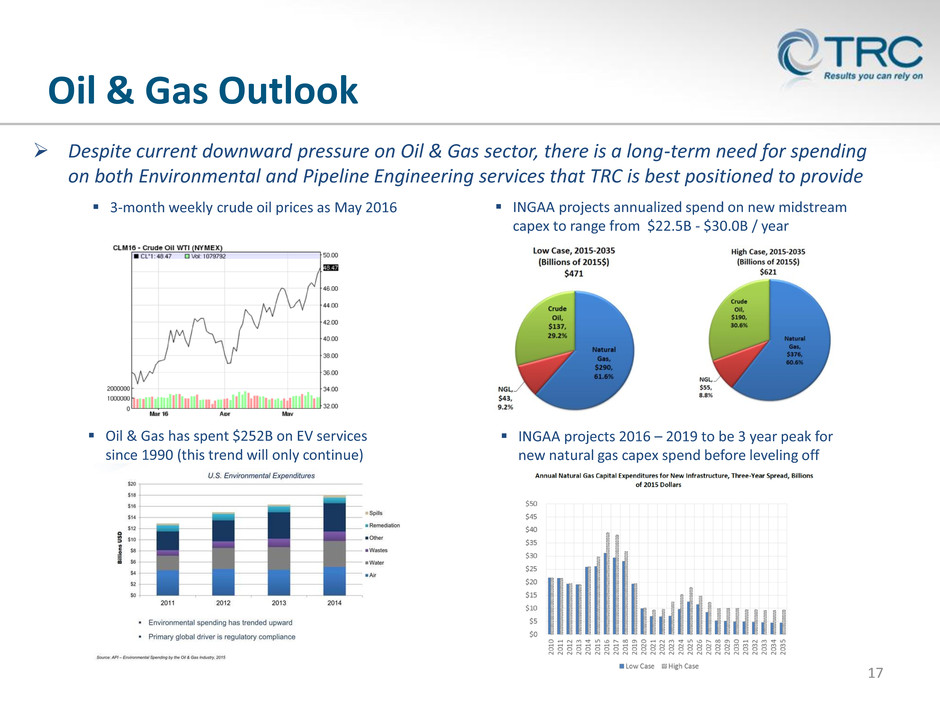
Oil & Gas Outlook 17 Despite current downward pressure on Oil & Gas sector, there is a long-term need for spending on both Environmental and Pipeline Engineering services that TRC is best positioned to provide Oil & Gas has spent $252B on EV services since 1990 (this trend will only continue) 3-month weekly crude oil prices as May 2016 INGAA projects annualized spend on new midstream capex to range from $22.5B - $30.0B / year INGAA projects 2016 – 2019 to be 3 year peak for new natural gas capex spend before leveling off

Business Synergy - End to End Solutions 18 Environment Field Services Engineering & EPC CM & PM Testing Commission Integrity & Maintenance Significant business synergy opportunities through verticalization of environmental and pipeline services Business Synergies – proven history of integrating acquisitions and improving margins Model similar to TRC’s Energy segment Significant opportunity for larger projects and to build backlog Client demands for providing seamless environmental and engineering services Remediation Permitting / FERC Air Quality Transactional Advisory ROW GIS Feasibility Modelling Routing Pipeline Facility Tanks Terminals Gas Processing Pipeline Facilities Data
Key TRC Strategies and Initiatives 19 Invest in organic growth opportunities Increase focus on Strategic markets: Utility / Power – continued investment to modernize gas and electric systems, including energy efficiency programs; regulatory drivers for significant renewable generation investment Transportation – FAST transportation bill supports capital expansion and P3 projects Oil & Gas – changing midstream market dynamics – focusing on repair, upgrade and integrity of existing assets impact of PHMSA legislation Build program management capabilities Pursue acquisitions to provide enhanced technical capabilities and geographic expansion Capture scale based synergies and continue to emphasize margin improvement
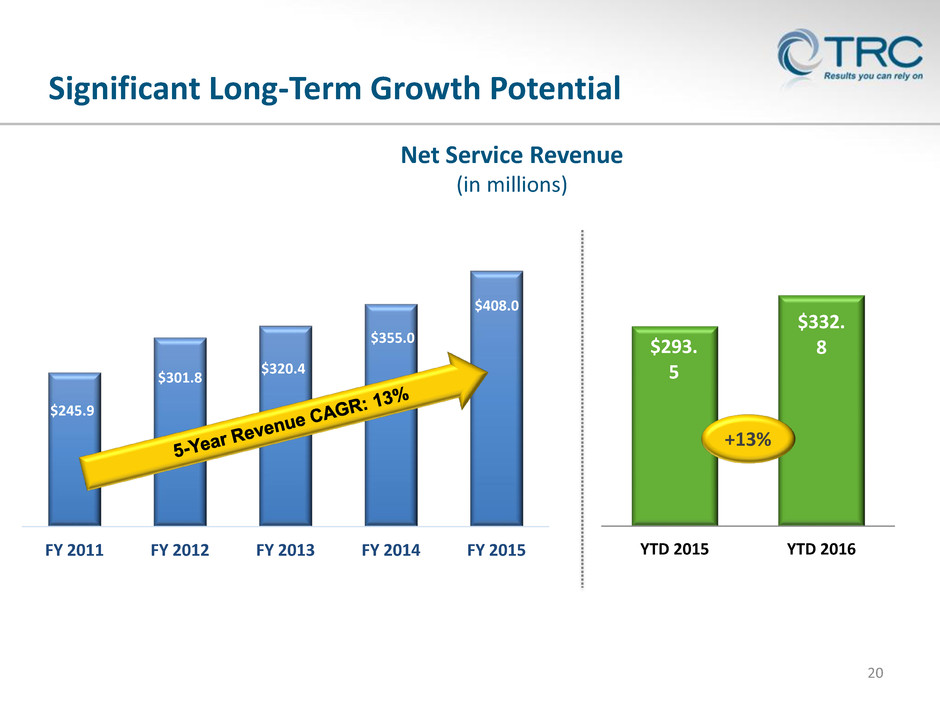
20 $293. 5 $332. 8 YTD 2015 YTD 2016 Net Service Revenue (in millions) Significant Long-Term Growth Potential +13% $245.9 $301.8 $320.4 $355.0 $408.0 FY 2011 FY 2012 FY 2013 FY 2014 FY 2015
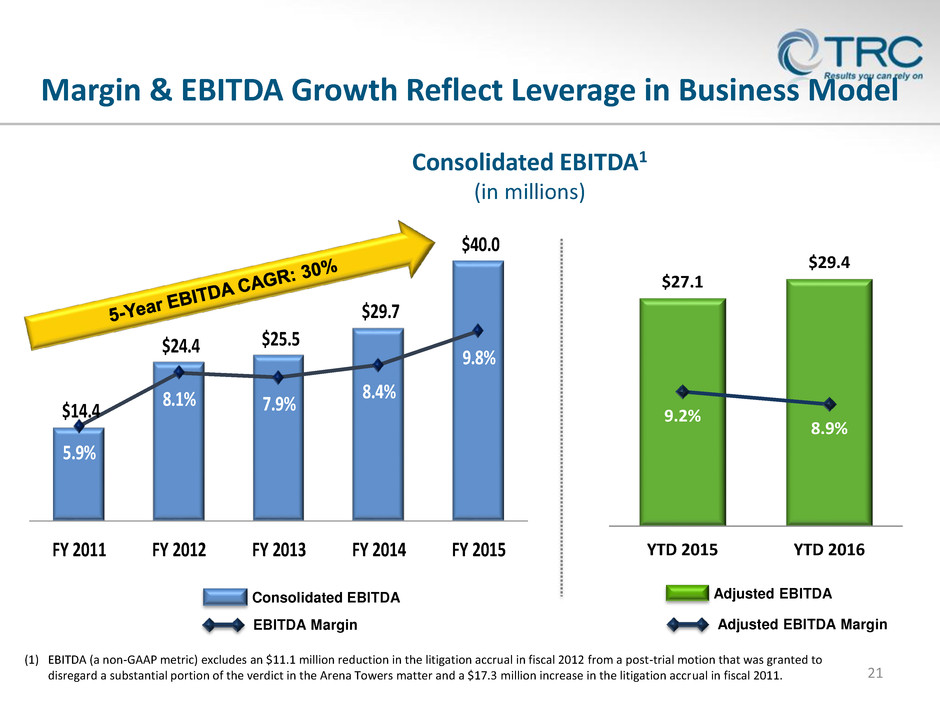
$14.4 $24.4 $25.5 $29.7 $40.0 5.9% 8.1% 7.9% 8.4% 9.8% FY 2011 FY 2012 FY 2013 FY 2014 FY 2015 Margin & EBITDA Growth Reflect Leverage in Business Model 21 Consolidated EBITDA (1) EBITDA (a non-GAAP metric) excludes an $11.1 million reduction in the litigation accrual in fiscal 2012 from a post-trial motion that was granted to disregard a substantial portion of the verdict in the Arena Towers matter and a $17.3 million increase in the litigation accrual in fiscal 2011. $27.1 $29.4 9.2% 8.9% YTD 2015 YTD 2016 Consolidated EBITDA1 (in millions) Adjusted EBITDA Adjusted EBITDA Margin EBITDA Margin
Investment Highlights 22 Well-positioned as end-to-end solutions provider in markets with solid growth opportunities Executing a focused profitable growth strategy Large addressable market opportunity Robust revenue stream with attractive customer base Strong balance sheet and cash position Continuing to build backlog
23 Appendix
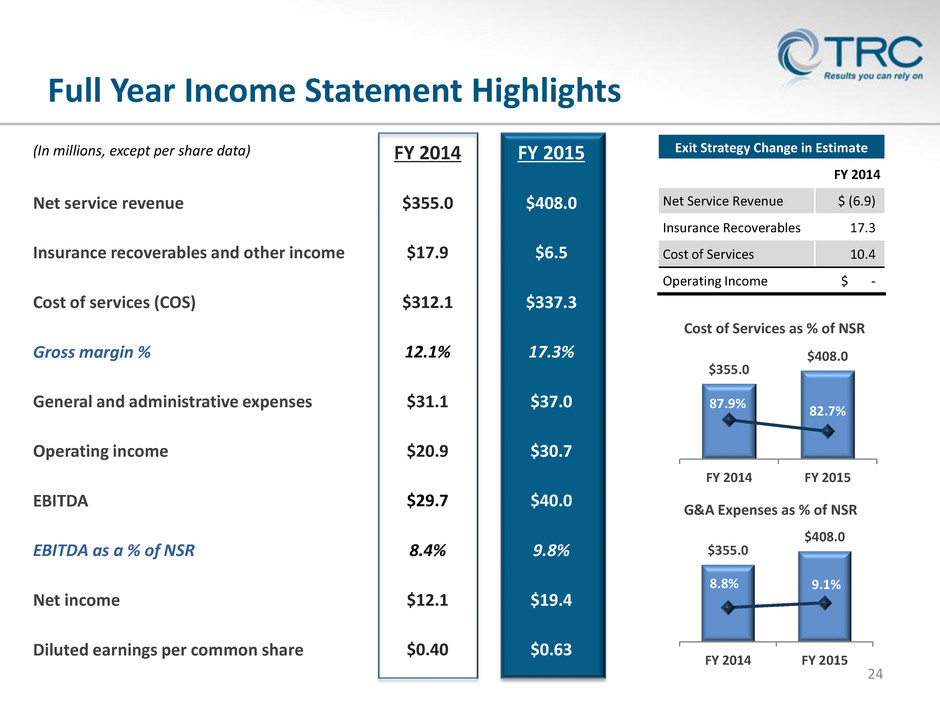
FY 2014 $355.0 $17.9 $312.1 12.1% $31.1 $20.9 $29.7 8.4% $12.1 $0.40 FY 2015 $408.0 $6.5 $337.3 17.3% $37.0 $30.7 $40.0 9.8% $19.4 $0.63 24 (In millions, except per share data) Full Year Income Statement Highlights $355.0 $408.0 87.9% 82.7% FY 2014 FY 2015 Cost of Services as % of NSR $355.0 $408.0 8.8% 9.1% FY 2014 FY 2015 G&A Expenses as % of NSR Exit Strategy Change in Estimate FY 2014 Net Service Revenue $ (6.9) Insurance Recoverables 17.3 Cost of Services 10.4 Operating Income $ - Net service revenue Insurance recoverables and other income Cost of services (COS) Gross margin % General and administrative expenses Operating income EBITDA EBITDA as a % of NSR Net income Diluted earnings per common share

YTD 2015 $293.5 $247.3 15.7% $25.4 8.7% -- -- $20.0 $20.0 $27.1 9.2% $27.1 9.2% $12.7 $12.7 $0.41 $0.41 YTD 2015 $192.5 $5.5 $163.8 14.9% $16.4 $12.9 $17.8 9.2% $7.5 $0.25 25 (In millions, except per share data) YTD Income Statement Highlights 84.3% 84.3% YTD 2015 YTD 2016 Cost of Services as % of NSR 8.7% 7.4% YTD 2015 YTD 2016 G&A Expenses as % of NSR Note: YTD 2015 represents the nine-month period ended March 27, 2015; YTD 2016 represents the nine-month period ended March 25, 2016. 1Excludes $3.7 million of acquisition and integration expenses and $24.5 million related to the impairment of goodwill. 2Excludes goodwill impairment and acquisition related expense in note 1, net of an income tax benefit of $10.9 million. Net service revenue Cost of services (COS) Gross margin % General and administrative expenses G&A as % of NSR Acquisition and integration expense Goodwill impairment Operating income / (loss) Adjusted operating income1 EBITDA EBITDA as a % of NSR Adjusted EBITDA1 Adjusted EBITDA as a % of NSR Net income / (loss) Adjusted net income1,2 Diluted earnings / (loss) per common share Adjusted diluted earnings per common share1, 2 YTD 2016 $332.8 $280.7 15.7% $24.7 7.4% $3.7 $24.5 $(8.9) $19.3 $1.2 0.4% $29.4 8.9% $(5.9) $11.4 $(0.19) $0.36
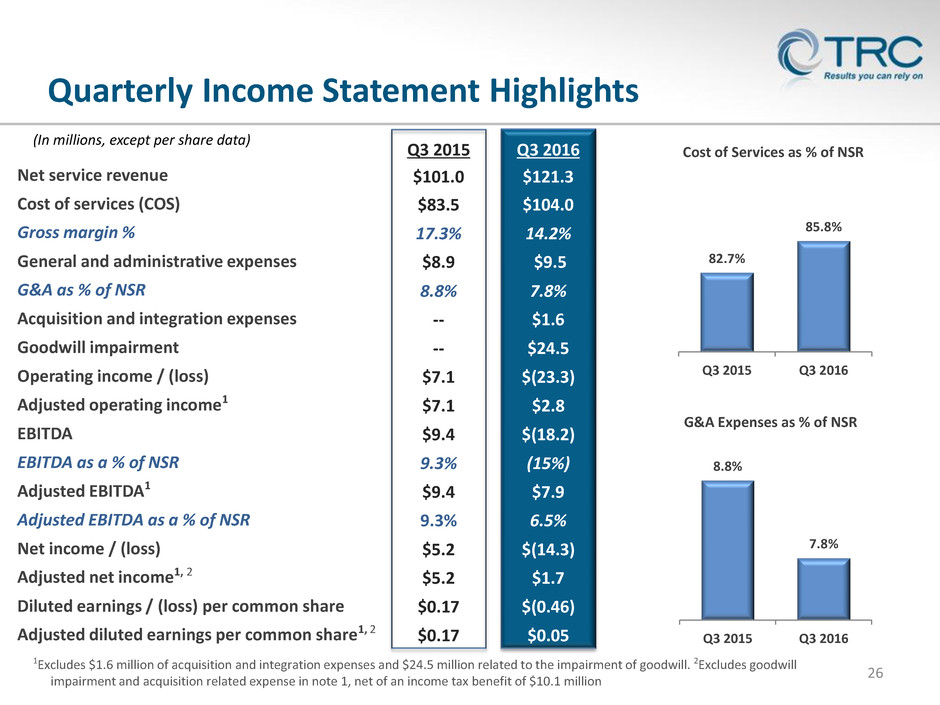
Q3 2015 $101.0 $83.5 17.3% $8.9 8.8% -- -- $7.1 $7.1 $9.4 9.3% $9.4 9.3% $5.2 $5.2 $0.17 $0.17 Q3 2016 $121.3 $104.0 14.2% $9.5 7.8% $1.6 $24.5 $(23.3) $2.8 $(18.2) (15%) $7.9 6.5% $(14.3) $1.7 $(0.46) $0.05 26 (In millions, except per share data) Quarterly Income Statement Highlights 82.7% 85.8% Q3 2015 Q3 2016 Cost of Services as % of NSR 8.8% 7.8% Q3 2015 Q3 2016 G&A Expenses as % of NSR Net service revenue Cost of services (COS) Gross margin % General and administrative expenses G&A as % of NSR Acquisition and integration expenses Goodwill impairment Operating income / (loss) Adjusted operating income1 EBITDA EBITDA as a % of NSR Adjusted EBITDA1 Adjusted EBITDA as a % of NSR Net income / (loss) Adjusted net income1, 2 Diluted earnings / (loss) per common share Adjusted diluted earnings per common share1, 2 1Excludes $1.6 million of acquisition and integration expenses and $24.5 million related to the impairment of goodwill. 2Excludes goodwill impairment and acquisition related expense in note 1, net of an income tax benefit of $10.1 million
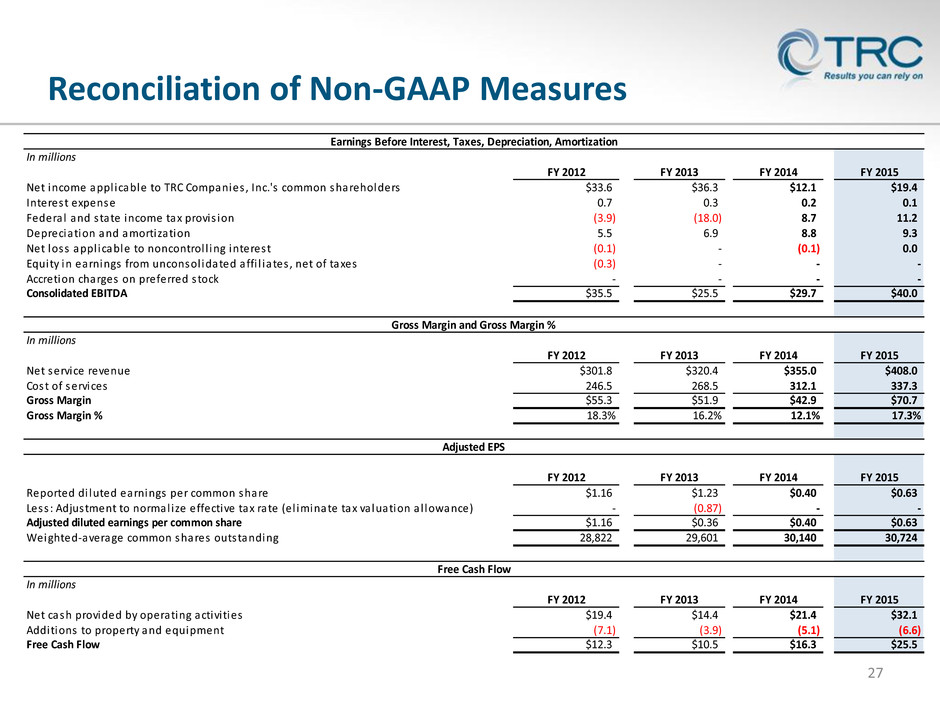
Reconciliation of Non-GAAP Measures 27 In millions FY 2012 FY 2013 FY 2014 FY 2015 Net income appl icable to TRC Companies , Inc.'s common shareholders $33.6 $36.3 $12.1 $19.4 Interest expense 0.7 0.3 0.2 0.1 Federal and s tate income tax provis ion (3.9) (18.0) 8.7 11.2 Depreciation and amortization 5.5 6.9 8.8 9.3 Net loss appl icable to noncontrol l ing interest (0.1) - (0.1) 0.0 Equity in earnings from unconsol idated affi l iates , net of taxes (0.3) - - - Accretion charges on preferred s tock - - - - Consolidated EBITDA $35.5 $25.5 $29.7 $40.0 In millions FY 2012 FY 2013 FY 2014 FY 2015 Net service revenue $301.8 $320.4 $355.0 $408.0 Cost of services 246.5 268.5 312.1 337.3 Gross Margin $55.3 $51.9 $42.9 $70.7 Gross Margin % 18.3% 16.2% 12.1% 17.3% FY 2012 FY 2013 FY 2014 FY 2015 Reported di luted earnings per common share $1.16 $1.23 $0.40 $0.63 Less : Adjustment to normal ize effective tax rate (el iminate tax va luation a l lowance) - (0.87) - - Adjusted diluted earnings per common share $1.16 $0.36 $0.40 $0.63 Weighted-average common shares outstanding 28,822 29,601 30,140 30,724 In millions FY 2012 FY 2013 FY 2014 FY 2015 Net cash provided by operating activi ties $19.4 $14.4 $21.4 $32.1 Additions to property and equipment (7.1) (3.9) (5.1) (6.6) Free Cash Flow $12.3 $10.5 $16.3 $25.5 Gross Margin and Gross Margin % Free Cash Flow Earnings Before Interest, Taxes, Depreciation, Amortization Adjusted EPS
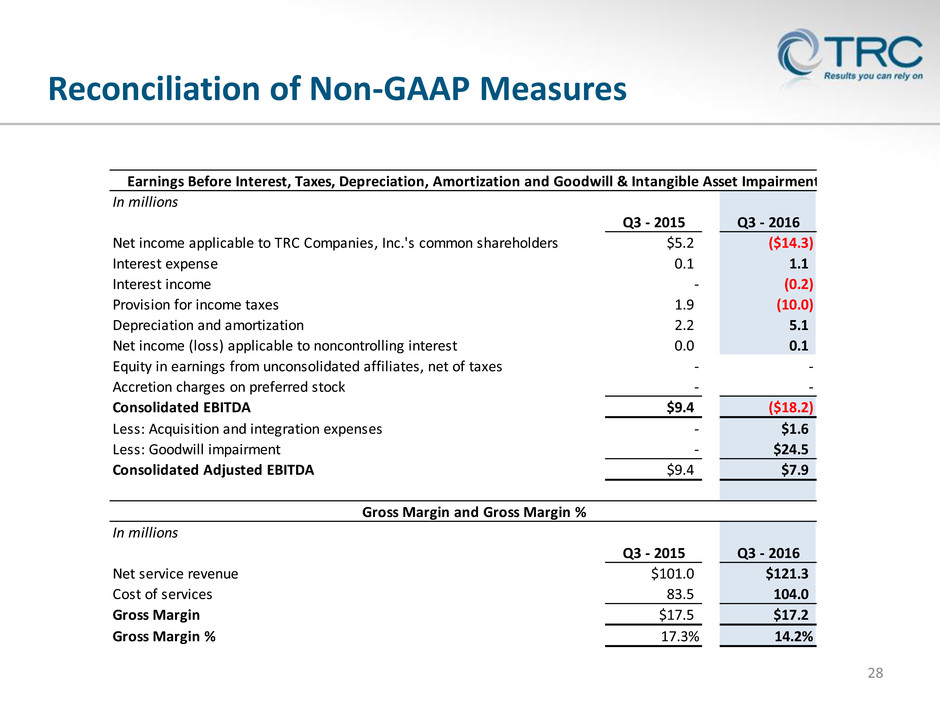
Reconciliation of Non-GAAP Measures 28 In millions Q3 - 2015 Q3 - 2016 Net income applicable to TRC Companies, Inc.'s common shareholders $5.2 ($14.3) Interest expense 0.1 1.1 Interest income - (0.2) Provision for income taxes 1.9 (10.0) Depreciation and amortization 2.2 5.1 Net income (loss) applicable to noncontrolling interest 0.0 0.1 Equity in earnings from unconsolidated affiliates, net of taxes - - Accretion charges on preferred stock - - Consolidated EBITDA $9.4 ($18.2) Less: Acquisition and integration expenses - $1.6 Less: Goodwill impairment - $24.5 Consolidated Adjusted EBITDA $9.4 $7.9 In millions Q3 - 2015 Q3 - 2016 Net service revenue $101.0 $121.3 Cost of services 83.5 104.0 Gross Margin $17.5 $17.2 Gross Margin % 17.3% 14.2% Earnings Before Interest, Taxes, Depreciation, Amortization and Goodwill & Intangible Asset Impairment Gross Margin and Gross Margin %
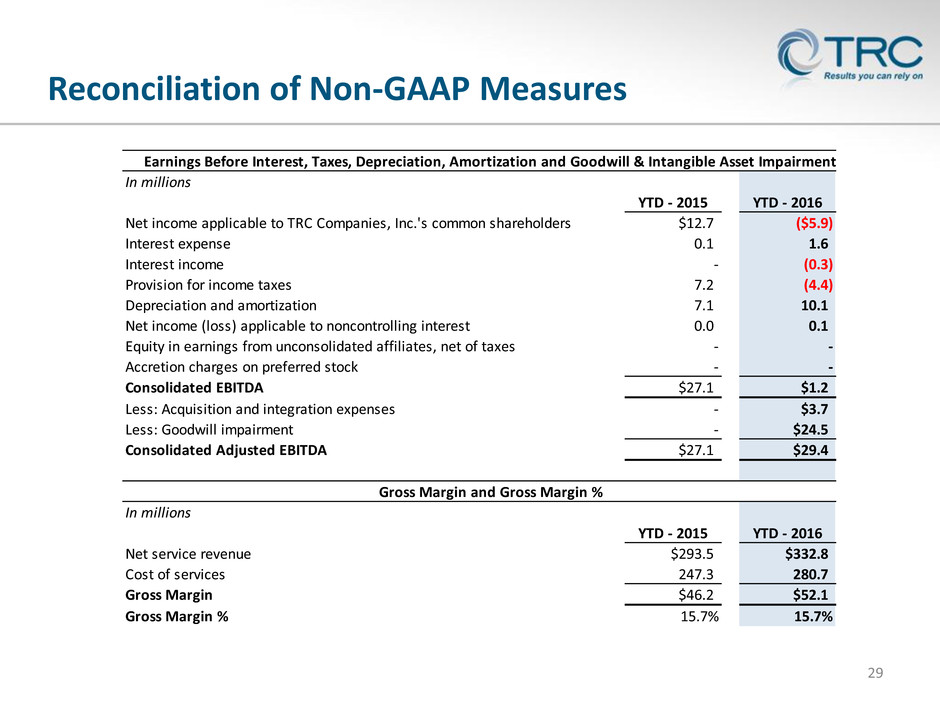
Reconciliation of Non-GAAP Measures 29 In millions YTD - 2015 YTD - 2016 Net income applicable to TRC Companies, Inc.'s common shareholders $12.7 ($5.9) Interest expense 0.1 1.6 Interest income - (0.3) Provision for income taxes 7.2 (4.4) Depreciation and amortization 7.1 10.1 Net income (loss) applicable to noncontrolling interest 0.0 0.1 Equity in earnings from unconsolidated affiliates, net of taxes - - Accretion charges on preferred stock - - Consolidated EBITDA $27.1 $1.2 Less: Acquisition and integration expenses - $3.7 Less: Goodwill impairment - $24.5 Consolidated Adjusted EBITDA $27.1 $29.4 In millions YTD - 2015 YTD - 2016 Net service revenue $293.5 $332.8 Cost of services 247.3 280.7 Gross Margin $46.2 $52.1 Gross Margin % 15.7% 15.7% Earnings Before Interest, Taxes, Depreciation, Amortization and Goodwill & Intangible Asset Impairment Gross Margin and Gross Margin %
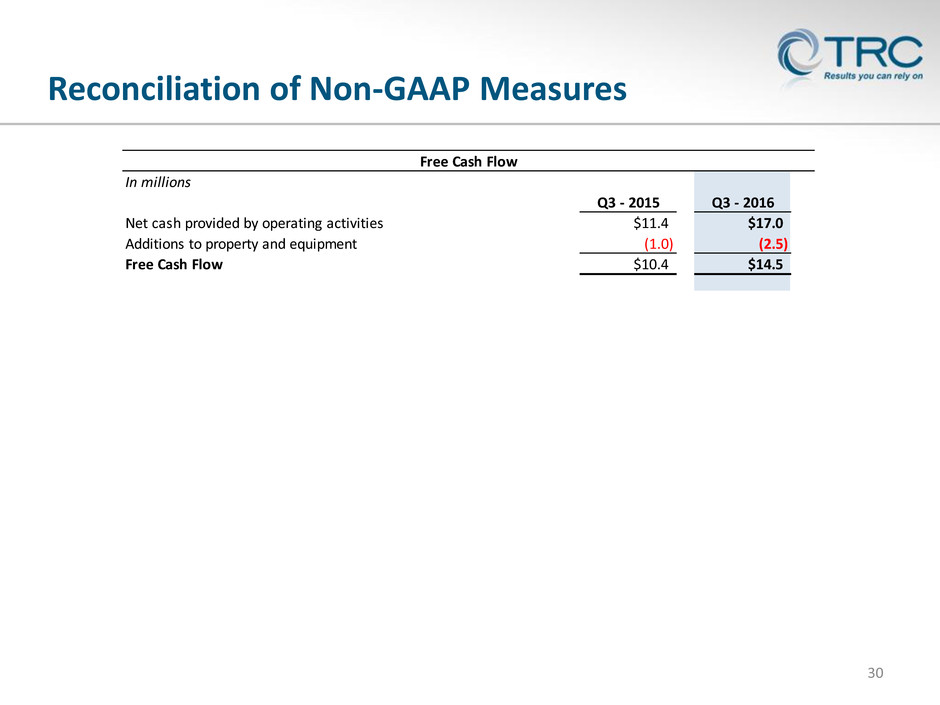
Reconciliation of Non-GAAP Measures 30 In millions Q3 - 2015 Q3 - 2016 Net cash provided by operating activities $11.4 $17.0 Additions to property and equipment (1.0) (2.5) Free Cash Flow $10.4 $14.5 Free Cash Flow
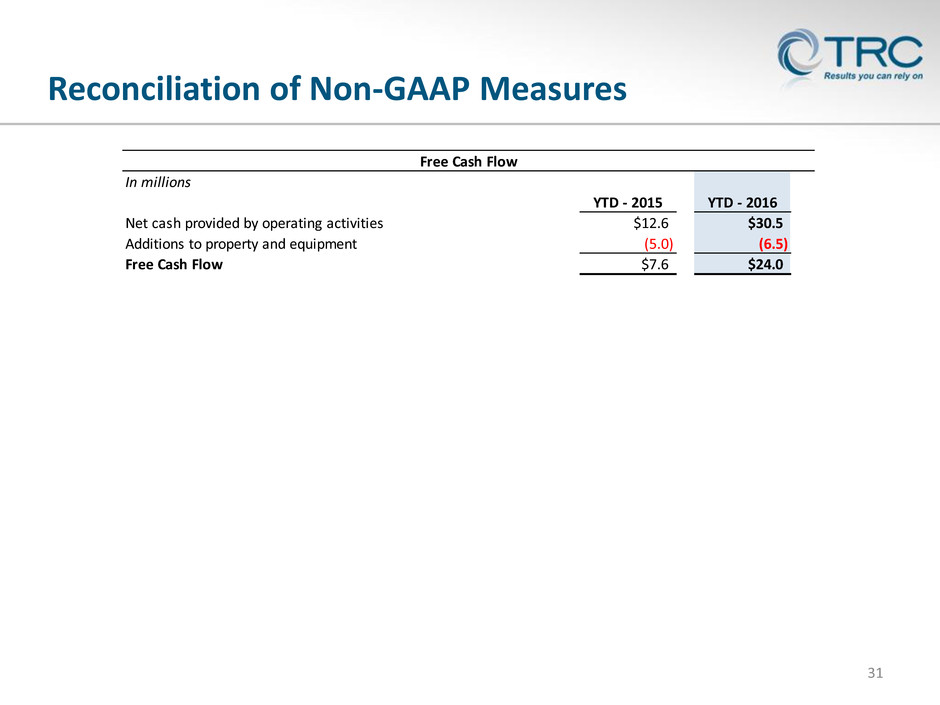
Reconciliation of Non-GAAP Measures 31 In millions YTD - 2015 YTD - 2016 Net cash provided by operating activities $12.6 $30.5 Additions to property and equipment (5.0) (6.5) Free Cash Flow $7.6 $24.0 Free Cash Flow
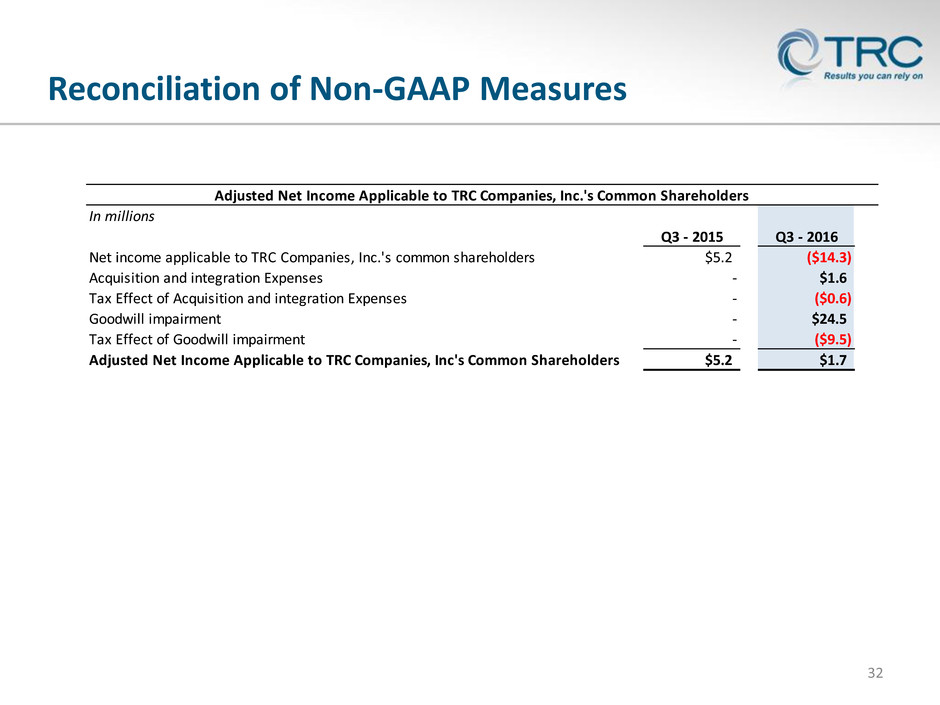
Reconciliation of Non-GAAP Measures 32 In millions Q3 - 2015 Q3 - 2016 Net income applicable to TRC Companies, Inc.'s common shareholders $5.2 ($14.3) Acquisition and integration Expenses - $1.6 Tax Effect of Acquisition and integration Expenses - ($0.6) Goodwill impairment - $24.5 Tax Effect of Goodwill impairment - ($9.5) Adjusted Net Income Applicable to TRC Companies, Inc's Common Shareholders $5.2 $1.7 Adjusted Net Income Applicable to TRC Companies, Inc.'s Common Shareholders

Reconciliation of Non-GAAP Measures 33 In millions YTD - 2015 YTD - 2016 Net income applicable to TRC Companies, Inc.'s common shareholders $12.7 ($5.9) Acquisition and integration Expenses - $3.7 Tax Effect of Acquisition and integration Expenses - ($1.5) Goodwill impairment - $24.5 Tax Effect of Goodwill impairment - ($9.5) Adjusted Net Income Applicable to TRC Companies, Inc's Common Shareholders $12.7 $11.4 Adjusted Net Income Applicable to TRC Companies, Inc.'s Common Shareholders
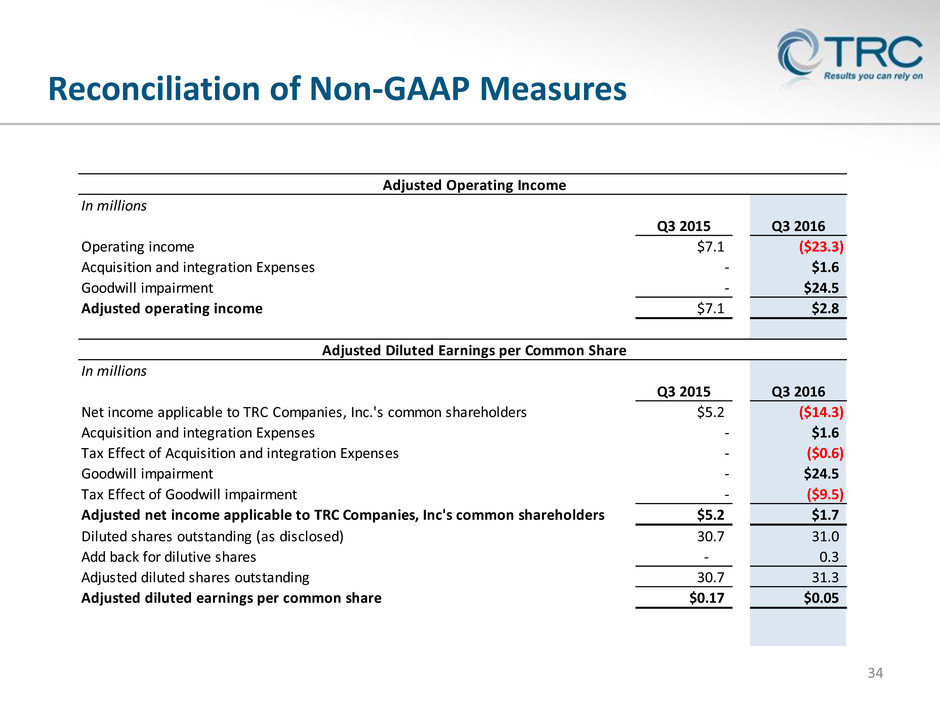
Reconciliation of Non-GAAP Measures 34 In millions Q3 2015 Q3 2016 Operating income $7.1 ($23.3) Acquisition and integration Expenses - $1.6 Goodwill impairment - $24.5 Adjusted operating income $7.1 $2.8 In millions Q3 2015 Q3 2016 Net income applicable to TRC Companies, Inc.'s common shareholders $5.2 ($14.3) Acquisition and integration Expenses - $1.6 Tax Effect of Acquisition and integration Expenses - ($0.6) Goodwill impairment - $24.5 Tax Effect of Goodwill impairment - ($9.5) Adjusted net income applicable to TRC Companies, Inc's common shareholders $5.2 $1.7 D luted shares outstanding (as disclosed) 30.7 31.0 Add back for dilutive shares - 0.3 Adjusted diluted shares outstanding 30.7 31.3 Adjusted diluted earnings per common share $0.17 $0.05 Adjusted Diluted Earnings per Common Share Adjusted Operating Income
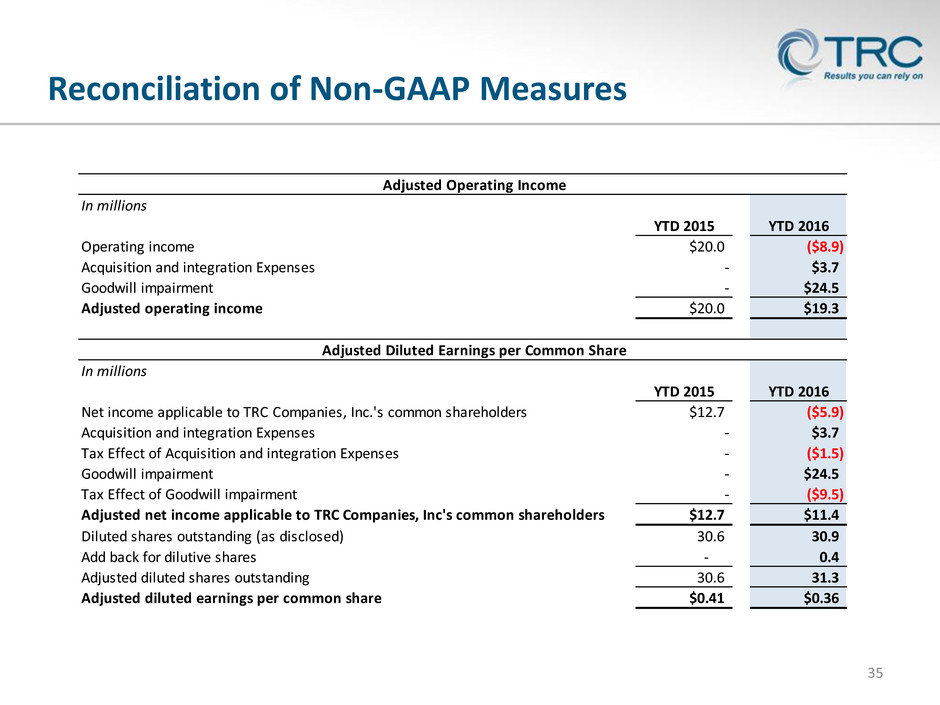
Reconciliation of Non-GAAP Measures 35 In millions YTD 2015 YTD 2016 Operating income $20.0 ($8.9) Acquisition and integration Expenses - $3.7 Goodwill impairment - $24.5 Adjusted operating income $20.0 $19.3 In millions YTD 2015 YTD 2016 Net income applicable to TRC Companies, Inc.'s common shareholders $12.7 ($5.9) Acquisition and integration Expenses - $3.7 Tax Effect of Acquisition and integration Expenses - ($1.5) Goodwill impairment - $24.5 T x Effect of Goodwill impairment - ($9.5) Adjusted net income applicable to TRC Companies, Inc's common shareholders $12.7 $11.4 Diluted shares outstanding (as disclosed) 30.6 30.9 Add back for dilutive shares - 0.4 Adjusted diluted shares outstanding 30.6 31.3 Adjusted diluted earnings per common share $0.41 $0.36 Adjusted Diluted Earnings per Common Share Adjusted Operating Income

Definitions for Non-GAAP Measures 36 Earnings Before Interest, Taxes, Depreciation, Amortization (EBITDA) The Company presents EBITDA because it believes that it is a useful tool for the Company, its lenders and its investors to measure the Company’s ability to meet debt service, capital expenditure and working capital requirements. As used in the presentation, EBITDA is operating income plus depreciation and amortization. Adjusted Earnings Before Interest, Taxes, Depreciation, Amortization (Adjusted EBITDA) As used in the presentation, Adjusted EBITDA is defined as EBITDA plus acquisition and integration expenses and the amount of the goodwill impairment. Gross Margin and Gross Margin % The Company presents Gross Margin and Gross Margin % to allow investors to better evaluate short-term and long-term profitability trends. The definition of Gross Margin is equal to Net Service Revenue less Cost of Services. Gross Margin % is equal to Gross Margin Divided by Net Service Revenue. Free Cash Flow The Company presents free cash flow, and ratios based on it, to conduct and evaluate its business because, although it is similar to cash flow from operations, the Company believes it is a useful measure of cash flows since purchases of fixed assets are a necessary component of ongoing operations. The definition of Free Cash Flow is equal to net cash provided by (used in) operating activities plus additions to property and equipment.

Definitions for Non-GAAP Measures 37 Adjusted Operating Income The Company presents Adjusted Operating Income because it believes that it is a useful tool for the Company, its lenders and its investors to measure the Company’s underlying operating performance. As used in the presentation, Adjusted Operating Income is defined as operating income plus acquisition and integration expenses and the amount of the goodwill impairment. Adjusted Net Income The Company presents Adjusted Net Income because it believes that it is a useful tool for the Company, its lenders and its investors to measure the Company’s financial performance. As used in the presentation, Adjusted Net Income is defined as net income applicable to TRC Companies, Inc. plus the tax effected acquisition and integration expenses and the amount of the goodwill impairment. The Company utilizes its effective tax rate for the period in calculating the tax effect. Adjusted Diluted Earnings Per Share (Adjusted Diluted EPS) The Company presents Adjusted Diluted EPS because it believes that it is a useful tool for the Company, its lenders and its investors to measure the Company’s financial performance. As used in the presentation, Adjusted Diluted EPS is defined as Adjusted Net Income divided by diluted weighted average shares outstanding.


