UNITED STATES
SECURITIES AND EXCHANGE COMMISSION
Washington, D.C. 20549
CERTIFIED SHAREHOLDER REPORT OF REGISTERED MANAGEMENT INVESTMENT COMPANIES
Investment Company Act file number 811-08043
The Berkshire Funds
(Exact name of registrant as specified in charter)
475 Milan Drive, Suite #103 San Jose, CA 95134-2453
(Address of principal executive offices) (Zip code)
Malcolm R. Fobes III
475 Milan Drive, Suite #103
San Jose, CA 95134-2453
(Name and address of agent for service) |
1-408-526-0707
Registrant's telephone number, including area code
Date of fiscal year end: December 31, 2011
Date of reporting period: June 30, 2011
Item 1. Reports to Stockholders.
The Berkshire Funds
2011 Semi-Annual Report
This report is provided for the general information of the Berkshire Funds shareholders. It is not authorized for distribution unless preceded or accompanied by an effective Prospectus, which contains more complete information about the Berkshire Funds. Please read it carefully before you invest.
In recent years, returns have sustained significant gains and losses due to market volatility in the technology sector. Due to market volatility, current performance may be lower than the figures shown. Call 1-877-526-0707 or visit berkshirefunds.com for more current performance information. Past performance is no guarantee of future results and investment results and principal value will fluctuate so that shares, when redeemed, may be worth more or less than their original cost. The returns shown do not reflect the deduction of taxes that a shareholder would pay on Fund distributions or the redemption of Fund shares. Total return includes reinvestment of dividends and capital gain distributions.
The Dow Jones Industrial Average is a measurement of general market price movement for 30 widely-held stocks primarily listed on the New York Stock Exchange. The S&P 500® Index is a registered trademark of Standard & Poor’s Corporation and is a market-weighted index of common stock prices for 500 large U.S. companies. The Nasdaq Composite Index is a capitalization-weighted index of over 5,000 common stocks listed on the Nasdaq Stock Market. Each index represents an unmanaged, broad-based basket of stocks. These indices are typically used as benchmarks for overall market performance.
Portfolio composition is subject to change at any time and references to specific securities, industries and sectors are not recommendations to purchase or sell any particular security.
FUND OVERVIEW – BERKSHIRE FOCUS FUND
June 30, 2011 (unaudited)
PERFORMANCE COMPARISON (Average annual total returns as of 6/30/11)
| | | YTD | (1) | 1 Year | | 3 Year | | 5 Year | | 10 Year | | Since Inception | (2) |
| |
| Berkshire Focus Fund | | 6.19 | % | 51.47 | % | 15.95 | % | 13.46 | % | –1.21 | % | 2.71 | % |
| |
| Dow Jones Industrial Average | | 8.58 | % | 30.37 | % | 6.10 | % | 4.97 | % | 4.19 | % | 5.81 | % |
| S&P 500® Index | | 6.02 | % | 30.69 | % | 3.34 | % | 2.94 | % | 2.72 | % | 4.72 | % |
| Nasdaq Composite Index | | 5.01 | % | 32.87 | % | 7.63 | % | 5.97 | % | 3.28 | % | 5.42 | % |
| NET ASSETS | | | |
| 6/30/11 | $37.60 Million | |
| |
| |
| TOP TEN HOLDINGS(3) | | |
| Apple, Inc. | | 16.65 | % |
| Amazon.com, Inc. | | 8.04 | % |
| Chipotle Mexican Grill, Inc. (Class A) | 8.01 | % |
| Fortinet, Inc. | | 7.07 | % |
| Priceline.com, Inc. | | 7.01 | % |
| Baidu, Inc. – ADR | | 4.97 | % |
| VMware, Inc. (Class A) | | 4.96 | % |
| Riverbed Technology, Inc. | | 4.95 | % |
| Salesforce.com, Inc. | | 4.94 | % |
| Netflix, Inc. | | 4.92 | % |
| |
| SECTOR ALLOCATION(5) | | |
| Internet Software & Services | 29.88 | % |
| Software | | 23.46 | % |
| Computer Hardware | | 16.65 | % |
| Restaurants | | 8.01 | % |
| Networking & Telecom Equipment | 7.00 | % |
| Storage Devices | | 4.88 | % |
| Communications Equipment | 4.82 | % |
| Exchang Traded Funds | | 2.13 | % |
| Semiconductors | | 2.00 | % |
| Business Software & Services | 0.45 | % |
NET ASSET VALUE
Net Asset Value Per Share $13.39
| (1) | Not annualized for periods of less than one full year. |
| |
| (2) | The Fund’s inception date was July 1, 1997. |
| |
| (3) | Stated as a percentage of total net assets as of 6/30/11. The holdings information provided should not be construed as a recommendation to purchase or sell a particular security and may not be representative of the Fund’s current or future investments. |
| |
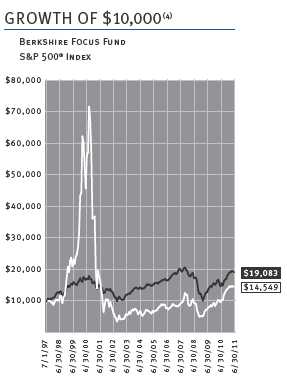
| (4) | This chart assumes an initial investment of $10,000 made on July 1, 1997 (inception). Past performance does not guarantee future results. Investment return and principal value will fluctuate so that shares, when redeemed, may be worth more or less than their original cost. All returns reflect reinvested dividends but do not reflect the impact of taxes. |
| |
| (5) | Stated as a percentage of total net assets as of 6/30/11. The holdings by sector are presented to illustrate examples of the sectors in which the Fund has bought securities and may not be representative of the Fund’s current or future investments. |
| |
| | This Fund concentrates its investments in the technology industry. As a result, the Fund is subject to greater risk than more diversified funds because of its concentration of investments in fewer companies and certain segments of a single industry. |
| |
1
Berkshire Focus Fund
Performance and Portfolio Discussion
6/30/2011
2
LETTER TO THE SHAREHOLDERS

Dear Fellow Shareholders,
For the six-month period ended June 30, 2011, the Berkshire Focus Fund outperformed its primary benchmark index. The Berkshire Focus Fund generated a total return of +6.19% while the S&P 500® Index – which we consider to be the Fund’s primary benchmark index – had a total return of +6.02% over the same period. For comparative purposes, the Dow Jones Industrial Average posted a return of +8.58% and the Nasdaq Composite Index generated a return of +5.01% for the period ended June 30, 2011. Please see the Fund Overview section and the accompanying financial statements for more detailed information about the Fund’s longer-term performance. All return data includes reinvested dividends but do not reflect the impact of taxes.
U. S. equity markets turned in a strong performance during the first half of 2011. Fueling the stock market’s advance were better-than-expected earnings reports coupled with corporate profit margins running at near multi-decade highs. During the period, companies also began to deploy massive amounts of cash on their balance sheets towards dividend increases, share buy-backs and increased capital spending projects. Meanwhile, the Federal Reserve’s second round of quantitative easing (QE2) and a commitment to maintaining low interest rates for an indefinite period of time, provided a favorable backdrop for U.S. equity markets. Geopolitical unrest in the Middle East and the natural disaster in Japan took center stage midway through the period. This one-two punch weighed heavily on investor confidence after a strong start to the year. The financial markets were jolted in early March after a powerful earthquake and tsunami in Japan caused a number of nuclear accidents at the Fukushima Nuclear Power Plant complex. Worries over reduced demand from the world’s third largest economy and a disruption of supply chains for technology companies were immediate concerns. Also contributing to market uncertainty until the end of the period was ongoing weakness in U.S. housing markets, stubbornly high unemployment, higher oil prices, the federal budget controversy, sovereign debt risk in Europe and slowing growth in China. However, despite this maelstrom of negativity, equity markets rebounded to finish the first half of the year higher.
Turning to the portfolio, some of the Fund’s biggest percentage gainers year-to-date were in Amazon.com (AMZN), Baidu (BIDU), Netflix (NFLX) and Priceline.com (PCLN). Other contributors to the Fund’s results were Chipotle Mexican Grill (CMG), QUALCOMM (QCOM), Salesforce.com (CRM) and VMware (VMW). Detracting from the Fund during the period were F5 Networks (FFIV) and Google (GOOG). Some new additions to the portfolio during the second half of the year included Altera (ALTR), Cognizant Technology Solutions (CTSH), Fortinet (FTNT), Informatica (INFA) and TIBCO Software (TIBX).
Looking ahead, we remain very optimistic about the long-term prospects for the equity markets – especially the technology sector. As a result, you can expect us to remain committed to our goal of investing in high-quality growth companies that can deliver superior returns in a variety of market conditions. We thank you for your confidence and continued investment in the Berkshire Focus Fund.

Malcolm R. Fobes III
Chairman and Chief Investment Officer |
3
Financial Statements
(unaudited)
6/30/2011
4
PORTFOLIO OF INVESTMENTS – BERKSHIRE FOCUS FUND
June 30, 2011 (unaudited)
| Shares | | | Value |
| |
| | COMMON STOCKS - 97.15% | $ | 36,526,632 |
| | (Cost $35,021,259) | | |
| |
| | BUSINESS SOFTWARE & SERVICES - 0.45% | | 167,582 |
| 2,285 | Cognizant Technology Solutions Corp. (Class A)* | | 167,582 |
| |
| | COMMUNICATIONS EQUIPMENT - 4.82% | | 1,811,885 |
| 31,905 | QUALCOMM, Inc. | | 1,811,885 |
| |
| | COMPUTER HARDWARE - 16.65% | | 6,261,922 |
| 18,655 | Apple, Inc.* | | 6,261,922 |
| |
| | INTERNET SOFTWARE & SERVICES - 29.88% | | 11,234,273 |
| 14,785 | Amazon.com, Inc.* | | 3,023,384 |
| 13,330 | Baidu, Inc. - ADR* | | 1,867,933 |
| 5 | Google, Inc. (Class A)* | | 2,532 |
| 7,035 | Netflix, Inc.* | | 1,848,023 |
| 5 | OpenTable, Inc.* | | 416 |
| 5,150 | Priceline.com, Inc.* | | 2,636,439 |
| 12,455 | Salesforce.com, Inc.* | | 1,855,546 |
| |
| | NETWORKING & TELECOM EQUIPMENT - 7.00% | | 2,630,460 |
| 5,275 | Acme Packet, Inc.* | | 369,936 |
| 5 | Aruba Networks, Inc.* | | 148 |
| 25 | Juniper Networks, Inc.* | | 788 |
| 6,200 | Polycom, Inc.* | | 398,660 |
| 47,005 | Riverbed Technology, Inc.* | | 1,860,928 |
| |
| | RESTAURANTS - 8.01% | | 3,012,556 |
| 9,775 | Chipotle Mexican Grill, Inc. (Class A)* | | 3,012,556 |
| |
| | SEMICONDUCTORS - 2.00% | | 751,207 |
| 16,200 | Altera Corp.* | | 750,870 |
| 10 | Broadcom Corp. (Class A)* | | 337 |
| |
| | SOFTWARE - 23.46% | | 8,820,907 |
| 12,860 | CommVault Systems, Inc.* | | 571,627 |
| 10 | F5 Networks, Inc.* | | 1,103 |
| 97,440 | Fortinet, Inc.* | | 2,659,137 |
| 30,070 | Informatica Corp.* | | 1,756,990 |
| 5,705 | Oracle Corp. | | 187,751 |
| 61,355 | TIBCO Software, Inc.* | | 1,780,522 |
| 18,595 | VMware, Inc. (Class A)* | | 1,863,777 |
| |
| | STORAGE DEVICES - 4.88% | | 1,835,840 |
| 5 | EMC Corp.* | | 138 |
| 3,035 | Fusion-io Inc.* | | 91,323 |
| 33,050 | NetApp, Inc.* | | 1,744,379 |
| |
| | EXCHANGE TRADED FUNDS - 2.13% | | 802,693 |
| | (Cost $795,758) | | |
| 14,070 | PowerShares QQQ | | 802,693 |
| |
| | TOTAL INVESTMENT SECURITIES - 99.28% | | 37,329,325 |
| | (Cost $35,817,017) | | |
| |
| | OTHER ASSETS IN EXCESS OF LIABILITIES - 0.72% | | 269,535 |
| |
| | NET ASSETS - 100.00% | $ | 37,598,860 |
| | Equivalent to $13.39 per share | | |
| | *Non-income producing | | |
| | ADR – American depositary receipt | | |
| | (see accompanying notes to financial statements) | | |
5
STATEMENT OF ASSETS AND LIABILITIES – BERKSHIRE FOCUS FUND
June 30, 2011 (unaudited)
| ASSETS | | | |
| Investment securities: | | | |
| At cost | $ | 35,817,017 | |
| At value | $ | 37,329,325 | |
| Cash | | 89,127 | |
| Receivable for securities sold | | 1,723,468 | |
| Receivable for capital shares sold | | 42,779 | |
| Total Assets | | 39,184,699 | |
| |
| |
| LIABILITIES | | | |
| Payable for securities purchased | | 1,487,011 | |
| Payable for capital shares redeemed | | 36,784 | |
| Payable to affiliate (Note 5) | | 60,493 | |
| Accrued expenses | | 1,551 | |
| Total Liabilities | | 1,585,839 | |
| |
| |
| NET ASSETS | $ | 37,598,860 | |
| |
| |
| Net assets consist of: | | | |
| Paid in capital | $ | 52,647,867 | |
| Accumulated net realized losses from security transactions | | (16,561,315 | ) |
| Net unrealized appreciation on investments | | 1,512,308 | |
| Net Assets | $ | 37,598,860 | |
| |
| Shares of beneficial interest issued and outstanding | | | |
| (unlimited number of shares authorized, without par value) | | 2,807,975 | |
| |
| Net asset value and offering price per share | $ | 13.39 | |
| |
| Minimum redemption price per share* | $ | 13.12 | |
*The fund will impose a 2.00% redemption fee on shares redeemed within 90 calendar days of purchase.
(see accompanying notes to financial statements)
6
STATEMENT OF OPERATIONS – BERKSHIRE FOCUS FUND
For the Six Months Ended June 30, 2011 (unaudited)
| INVESTMENT INCOME | | | |
| Dividends | $ | 41,608 | |
| Total Investment Income | | 41,608 | |
| |
| EXPENSES | | | |
| Investment advisory fees (Note 5) | | 324,993 | |
| Administrative fees (Note 5) | | 108,331 | |
| Interest expense | | 3,165 | |
| Total Expenses | | 436,489 | |
| |
| NET INVESTMENT LOSS | | (394,881 | ) |
| |
| |
| REALIZED AND UNREALIZED | | | |
| GAINS ON INVESTMENTS | | | |
| Net realized gains from security transactions | | 390,316 | |
| Net change in unrealized appreciation (depreciation) on investments | | 896,692 | |
| |
| NET REALIZED AND UNREALIZED | | | |
| GAIN ON INVESTMENTS | | 1,287,008 | |
| |
| NET INCREASE IN NET ASSETS | | | |
| FROM OPERATIONS | $ | 892,127 | |
| |
| |
| (see accompanying notes to financial statements) | | | |
7
STATEMENTS OF CHANGES IN NET ASSETS – BERKSHIRE FOCUS FUND
For the Periods Ended June 30, 2011 (unaudited) and December 31, 2010
| | | Six Months | | | | | Year | |
| | | Ended | | | | | Ended | |
| | | 6/30/11 | | | | | 12/31/10 | |
| FROM OPERATIONS: | | | | | | | | |
| Net investment loss | $ | (394,881 | ) | $ | | | (349,128 | ) |
| Net realized gains from security transactions | | 390,316 | | | | | 7,270,597 | |
| Net change in unrealized appreciation | | | | | | | | |
| (depreciation) on investments | | 896,692 | | | | | (133,474 | ) |
| Net increase in net assets from operations | | 892,127 | | | | | 6,787,995 | |
| |
| |
| FROM CAPITAL SHARE TRANSACTIONS: | | | | | | | | |
| Proceeds from shares sold | | 28,592,161 | | | | | 12,466,562 | |
| Proceeds from redemption fees (Note 6) | | 118,849 | | | | | 8,782 | |
| Payments for shares redeemed | | (22,566,753 | ) | | | | (7,520,048 | ) |
| Net increase in net assets from capital share transactions | | 6,144,257 | | | | | 4,955,296 | |
| |
| |
| TOTAL INCREASE IN NET ASSETS | | 7,036,384 | | | | | 11,743,291 | |
| |
| |
| NET ASSETS: | | | | | | | | |
| Beginning of period | | 30,562,476 | | | | | 18,819,185 | |
| End of period | $ | 37,598,860 | | $ | 30,562,476 | |
| |
| |
| CAPITAL SHARE ACTIVITY: | | | | | | | | |
| Shares sold | | 2,126,875 | | | | | 1,042,110 | |
| Shares redeemed | | (1,742,375 | ) | | | | (791,112 | ) |
| Net increase in shares outstanding | | 384,500 | | | | | 250,998 | |
| Shares outstanding, beginning of period | | 2,423,475 | | | | | 2,172,477 | |
| Shares outstanding, end of period | | 2,807,975 | | | | | 2,423,475 | |
| |
| |
| (see accompanying notes to financial statements) | | | | | | | | |
8
FINANCIAL HIGHLIGHTS – BERKSHIRE FOCUS FUND
Selected Per Share Data and Ratios for a Share Outstanding Throughout Each Period
| | | Six Months | Year | | | Year | | | Year | | | Year | | | Year | |
| | | Ended | | | | Ended | | | Ended | | | Ended | | | Ended | | | Ended | |
| | | 6/30/11 | | | 12/31/10 | | | 12/31/09 | | | 12/31/08 | | | 12/31/07 | | | 12/31/06 | |
| | | (unaudited) | | | | | | | | | | | | | | | | | |
| NET ASSET VALUE, | | | | | | | | | | | | | | | | | | | | |
| BEGINNING OF PERIOD | $ | 12.61 | | $ | 8.66 | | $ | 4.71 | | $ | 11.03 | | $ | 7.93 | | $ | 7.61 | |
| |
| INCOME FROM INVESTMENT OPERATIONS: | | | | | | | | | | | | | | | | | | | | |
| Net investment loss(a) | | | (0.14 | ) | | | (0.14 | ) | | (0.09 | ) | | (0.16 | ) | | (0.15 | ) | | (0.02 | ) |
| Net realized and unrealized gains | | | | | | | | | | | | | | | | | | | | |
| (losses) on investments | | | 0.88 | | | | 4.09 | | | 4.03 | | | (6.17 | ) | | 3.25 | | | 0.34 | |
| Total from investment operations | | | 0.74 | | | | 3.95 | | | 3.94 | | | (6.33 | ) | | 3.10 | | | 0.32 | |
| Proceeds from redemption fees | | | .0.04 | | | | 0.00 | (b) | | 0.01 | | | 0.01 | | | – | | | .– | |
| |
| NET ASSET VALUE, | | | | | | | | | | | | | | | | | | | | |
| END OF PERIOD | $ | 13.39 | | $ | 12.61 | | $ | 8.66 | | $ | 4.71 | | $ | 11.03 | | $ | 7.93 | |
| |
| |
| TOTAL RETURN(c) | | | 6.19 | %(z) | | | 45.61 | % | | 83.86 | % | | (57.30 | %) | | 39.09 | % | | 4.20 | % |
| |
| |
| SUPPLEMENTAL DATA AND RATIOS: | | | | | | | | | | | | | | | | | | | | |
| Net assets at end of period (thousands) | $ | | 37,599 | | $ | | 30,562 | | $ | 18,819 | | $ | 7,404 | | $ | 21,525 | | $ | 14,431 | |
| |
| Ratio of expenses to average net assets | | 2.00 | %(i)(y) | | | 2.00 | %(h) | | 2.00 | %(g) | | 2.00 | %(f) | | 2.00 | %(e) | | 2.00 | %(d) |
| |
| Ratio of net investment loss to | | | | | | | | | | | | | | | | | | | | |
| average net assets | | (1.83 | %)(y) | | | (1.87 | %) | | (1.50 | %) | | (1.68 | %) | | (1.94 | %) | | (0.21 | %) |
| |
| Portfolio turnover rate | | 408.6 | %(z) | | | 950.5 | % | | 833.0 | % | | 539.9 | % | | 446.6 | % | | 386.2 | % |
(a) Net investment loss per share is calculated using ending balances prior to consideration or adjustment for permanent book and tax differences.
(b) Amount is less than $0.01 per share.
(c) Total return represents the rate that the investor would have earned or (lost) on an investment in the fund assuming reinvestment of dividends.
(d) For the year ended December 31, 2006 the ratio of expenses to average net assets excludes interest expense. The ratio including interest expense would be 2.02%.
(e) For the year ended December 31, 2007 the ratio of expenses to average net assets excludes interest expense. The ratio including interest expense would be 2.01%.
(f) For the year ended December 31, 2008 the ratio of expenses to average net assets excludes interest expense. The ratio including interest expense would be 2.01%.
(g) For the year ended December 31, 2009 the ratio of expenses to average net assets excludes interest expense. The ratio including interest expense would be 2.00%.
(h) For the year ended December 31, 2010 the ratio of expenses to average net assets excludes interest expense. The ratio including interest expense would be 2.00%.
(i) For the six months ended June 30, 2011 the ratio of expenses to average net assets excludes interest expense. The ratio including interest expense would be 2.01%.
(x) Portfolio turnover is greater than most funds due to the investment style of the fund.
(y) Annualized for periods of less than one full year.
(z) Not annualized for periods of less than one full year.
(see accompanying notes to financial statements)
9
NOTES TO FINANCIAL STATEMENTS
June 30, 2011 (unaudited)
1. Organization
The Berkshire Focus Fund (the “Fund”) is a non-diversified series of The Berkshire Funds (the “Trust”), an open-end management investment company registered under the Investment Company Act of 1940, as amended (the “1940 Act”). The Trust was organized as a Delaware business trust on November 25, 1996. The Fund commenced operations on July 1, 1997. The Fund’s investment objective is to seek long-term capital appreciation through investments in equity securities.
2. Significant Accounting Policies
The following is a summary of the Trust’s significant accounting policies:
Securities valuation — The Fund’s portfolio securities are valued as of the close of the regular session of trading on the New York Stock Exchange (the “NYSE”), normally 4:00 p.m., Eastern time. Securities which are traded on stock exchanges or are quoted by Nasdaq are valued at the last reported sale price as of the close of the regular session of trading on the NYSE, or, if not traded, at the most recent bid price. Securities which are traded in the over-the-counter market, and which are not quoted by Nasdaq, are valued at the most recent bid price, as obtained from one or more of the major market makers for such securities. Securities for which market quotations are not readily available are valued at their fair value as determined in good faith in accordance with consistently applied procedures established by and under the general supervision of the Board of Trustees.
In accordance with U.S. generally accepted accounting principles (“GAAP”), fair value is defined as the price that the Fund would receive to sell an investment or pay to transfer a liability in an orderly transaction with an independent buyer in the principal market, or in the absence of a principal market the most advantageous market for the investment or liability. GAAP establishes a three-tier hierarchy to distinguish between (1) inputs that reflect the assumptions market participants would use in pricing an asset or liability developed based on market data obtained from sources independent of the reporting entity (observable inputs) and (2) inputs that reflect the reporting entity’s own assumptions about the assumptions market participants would use in pricing an asset or liability developed based on the best information available in the circumstances (unobservable inputs) and to establish classification of fair value measurements for disclosure purposes. Various inputs are used in determining the value of the Fund’s investments. The inputs are summarized in the three broad levels listed below:
Level 1 – quoted prices in active markets for identical investments.
Level 2 – other significant observable inputs (including quoted prices for similar investments, interest rates, prepayment speeds, credit risk, etc.).
Level 3 – significant unobservable inputs (including the Fund’s own assumptions in determining the fair value of investments).
The inputs or methodology used for valuing securities are not necessarily an indication of the risk associated with investing in those securities.
10
NOTES TO FINANCIAL STATEMENTS
June 30, 2011 (unaudited)
The following table summarizes the valuation of the Fund’s investments by the above fair value hierarchy levels as of June 30, 2011:
| | | Level 1 | Level 2 | Level 3 | | Total |
| Common Stocks | | | | | | |
| Internet Software & Services | $ | 11,234,273 | – | – | $ | 11,234,273 |
| Software | | 8,820,907 | – | – | | 8,820,907 |
| Computer Hardware | | 6,261,922 | – | – | | 6,261,922 |
| Restaurants | | 3,012,556 | – | – | | 3,012,556 |
| Networking & Telecom Equipment | | 2,630,460 | – | – | | 2,630,460 |
| Storage Devices | | 1,835,840 | – | – | | 1,835,840 |
| Communications Equipment | | 1,811,885 | – | – | | 1,811,885 |
| Semiconductors | | 751,207 | – | – | | 751,207 |
| Business Software & Services | | 167,582 | – | – | | 167,582 |
| Total Common Stocks | | 36,526,632 | – | – | | 36,526,632 |
| Exchange Traded Funds | | 802,693 | – | – | | 802,693 |
| Total Investments | $ | 37,329,325 | – | – | $ | 37,329,325 |
Recent accounting pronouncement — In January 2010, FASB issued Accounting Standards Update No. 2010-06, Improving Disclosures about Fair Value Measurements (ASU 2010-06). ASU 2010-06 requires new disclosures regarding transfers in and out of Levels 1 and 2 (effective for interim and annual periods beginning after December 15, 2009), as well as additional details regarding Level 3 transaction activity (effective for interim and annual periods beginning after December 15, 2010). There were no significant transfers into or out of Level 1, Level 2 or Level 3 fair value measurements during the reporting period, as compared to their classification from the prior annual report. It is the Fund’s policy to consider transfers into or out of Level 1, Level 2 or Level 3 as of the end of the reporting period.
In May 2011, the FASB issued ASU No. 2011-04 “Amendments to Achieve Common Fair Value Measurement and Disclosure Requirements” in GAAP and the International Financial Reporting Standards (“IFRSs”). ASU No. 2011-04 amends FASB ASC Topic 820, Fair Value Measurements and Disclosures, to establish common requirements for measuring fair value and for disclosing information about fair value measurements in accordance with GAAP and IFRSs. ASU No. 2011-04 is effective for fiscal years beginning after December 15, 2011 and for interim periods within those fiscal years. Management is currently evaluating the impact of these amendments and does not believe they will have a material impact on the Company’s financial statements.
Investment income — Dividend income is recorded on the ex-dividend date. Interest income is accrued as earned.
Distributions to shareholders — Distributions to shareholders arising from net investment income and net realized capital gains, if any, are distributed at least once each year. Distributions to shareholders are recorded on the ex-dividend date. Dividends from net investment income and capital gain distributions are determined in accordance with income tax regulations, which may differ from GAAP.
Security transactions — Security transactions are accounted for on the trade date. Securities sold are determined on a specific identification basis.
11
NOTES TO FINANCIAL STATEMENTS
June 30, 2011 (unaudited)
Estimates — The preparation of financial statements in conformity with GAAP requires management to make estimates and assumptions that affect the reported amounts of assets and liabilities and disclosure of contingent assets and liabilities at the date of the financial statements and the reported amounts of income and expenses during the reporting period. Actual results could differ from those estimates.
Federal income tax — The Fund intends to comply with the requirements of Subchapter M of the Internal Revenue Code (the “Code”) necessary to qualify as a regulated investment company. As provided therein, in any fiscal year in which the Fund so qualifies and distributes at least 90% of its taxable net income, the Fund (but not the shareholders) will be relieved of federal income tax on the income distributed. Accordingly, no provision for income taxes has been made.
As of and during the year ended December 31, 2010 the Fund did not have a liability for any unrecognized tax benefits. The Fund recognizes interest and penalties, if any, related to unrecognized tax benefits as other expense on the statement of operations. During the year, the Fund did not incur any tax-related interest or penalties. The Fund is not subject to examination by U.S. federal tax authorities for tax years before 2007.
In order to avoid imposition of the excise tax applicable to regulated investment companies, it is also the Fund’s intention to declare as dividends in each calendar year at least 98% of its net investment income and 98% of its net realized capital gains plus undistributed amounts from prior years.
Other — The treatment for financial reporting purposes of distributions made to shareholders during the year from net investment income or net realized capital gains may differ from their ultimate treatment for federal income tax purposes. These differences are caused primarily by differences in the timing of the recognition of certain components of income, expense or realized capital gain for federal income tax purposes. Where such differences are permanent in nature, they are reclassified in the components of the net assets based on their ultimate characterization for federal income tax purposes. Any such reclassifications will have no effect on net assets, results of operations or net asset value per share of the Fund.
3. Investment Transactions
Purchases and sales of investment securities (excluding short-term instruments) for the six months ended June 30, 2011 were $179,313,334 and $173,715,090, respectively. There were no purchases or sales of U.S. Government securities for the Fund.
4. Tax Information
As of December 31, 2010, the components of accumulated earnings (deficit) on a tax basis were as follows:
| Federal income tax cost | $ | 29,831,612 | |
| Gross unrealized appreciation | $ | 1,069,068 | |
| Gross unrealized depreciation | | | (456,607 | ) |
| Net unrealized appreciation | | | 612,461 | |
| Undistributed ordinary income | | | – | |
| Accumulated losses | | | (16,948,476 | ) |
| Total accumulated losses | $ | | (16,336,015 | ) |
12
NOTES TO FINANCIAL STATEMENTS
June 30, 2011 (unaudited)
The cost basis of investments for tax and financial reporting purposes differs primarily due to the deferral of capital losses from wash sales.
There were no distributions paid during the six months ended June 30, 2011 or the year ended December 31, 2010.
At December 31, 2010, the Fund had the following capital loss carryforwards for tax purposes:
| | Capital Loss Carryforward | Date of Expiration |
| $ | 5,953,640 | | 12/31/16 |
| $ | 542,380 | | 12/31/12 |
| $ | 10,452,456 | | 12/31/11 |
To the extent these loss carryforwards are used to offset future capital gains, it is probable that the amount, which is offset, will not be distributed to shareholders.
5. Related Party Transactions, Investment Advisory and Administrative Fees
Certain Officers and Trustees of the Trust are also Officers and Directors of Berkshire Capital Holdings, Inc. (“Berkshire Capital”). The non-interested Trustees of the Fund were not paid any Trustee fees and expenses directly by Berkshire Capital during the six months ended June 30, 2011.
The Fund has an Investment Advisory Agreement (the “Advisory Agreement”) and a separate Administration Agreement with Berkshire Capital. Under the Advisory Agreement, Berkshire Capital will determine what securities will be purchased, retained or sold by the Fund on the basis of a continuous review of the portfolio. For the services it provides under the Advisory Agreement, Berkshire Capital receives a fee accrued each calendar day (including weekends and holidays) at a rate of 1.50% per annum of the daily net assets of the Fund. Under the Administration Agreement, Berkshire Capital renders all administrative and supervisory services of the Fund, as well as facilities furnished and expenses assumed. For these services, Berkshire Capital receives a fee at the annual rate of 0.50% of the Fund’s average daily net assets up to $50 million, 0.45% of average net assets from $50 million to $200 million, 0.40% of average net assets from $200 million to $500 million, 0.35% of average net assets from $500 million to $1 billion and 0.30% of average net assets in excess of $1 billion. Such fee is computed as a percentage of the Fund’s daily net assets and is accrued each calendar day (including weekends and holidays). For the six months ended June 30, 2011, Berkshire Capital was paid an investment advisory fee of $324,993 and an administration fee of $108,331 from the Fund. The amount due to Berkshire Capital for these fees at June 30, 2011 totaled $60,493.
6. Redemption Fee
On October 12, 2006 the Board of Trustees unanimously approved a redemption fee of 2.00% on shares held for 90 days or less, to become effective January 1, 2008, or thereafter as reasonably practical. For the six months ended June 30, 2011, proceeds from redemption fees were $118,849.
13
NOTES TO FINANCIAL STATEMENTS
June 30, 2011 (unaudited)
7. Beneficial Ownership
The beneficial ownership, either directly or indirectly, of more than 25% of the voting securities of a fund creates a presumption of control of the Fund, under Section 2(a)(9) of the Investment Company Act of 1940. At June 30, 2011, National Financial Services Corp. and Charles Schwab & Co. owned 29.67% and 29.38% of the Fund, respectively.
8. The RIC Modernization Act
On December 22, 2010, the Regulated Investment Company Modernization Act of 2010 (the “Modernization Act”) was signed by the President. The Modernization Act is the first major piece of legislation affecting Regulated Investment Companies (“RICs”) since 1986 and it modernizes several of the federal income and excise tax provisions related to RICs. Some highlights of the enacted provisions are as follows:
New capital losses may now be carried forward indefinitely, and retain the character of the original loss. Under pre-enactment law, capital losses could be carried forward for eight years, and carried forward as short-term capital, irrespective of the character of the original loss. New indefinite capital losses must be used before older capital losses with expiration dates.
The Modernization Act contains simplification provisions, which are aimed at preventing disqualification of a RIC for “inadvertent” failures of the asset diversification and/or qualifying income tests. Additionally, the Modernization Act exempts RICs from the preferential dividend rule, and repealed the 60-day designation requirement for certain types of pay-through income and gains.
Finally, the Modernization Act contains several provisions aimed at preserving the character of distributions made by a fiscal year RIC during the portion of its taxable year ending after October 31 or December 31, reducing the circumstances under which a RIC might be required to file amended Forms 1099 to restate previously reported distributions.
Except for the simplification provisions related to RIC qualification, the Modernization Act is effective for taxable years beginning after December 22, 2010. The provisions related to RIC qualification are effective for taxable years for which the extended due date of the tax return is after December 22, 2010.
14
ADDITIONAL INFORMATION
(unaudited) |
As a shareholder of the Fund, you incur two types of costs: (1) transaction costs, and (2) ongoing costs, including advisory fees, administrative fees and interest expense. This Example is intended to help you understand your ongoing costs (in dollars) of investing in the Fund and to compare these costs with the ongoing costs of investing in other mutual funds. The Example is based on an investment of $1,000 invested in the Fund on January 1, 2011 and held through June 30, 2011.
Actual Expenses
The first line of the table on the following page provides information about actual account values and actual expenses. Although the Fund charges no sales load or transaction fees, you will be assessed fees for outgoing wire transfers, returned checks and stop payment orders at prevailing rates charged by Mutual Shareholder Services, LLC, the Fund’s transfer agent. If you request that a redemption be made by wire transfer, currently a $20.00 fee is charged by the Fund’s transfer agent. IRA accounts will be charged an $8.00 annual maintenance fee. To the extent the Fund invests in shares of other investment companies as part of its investment strategy, you will indirectly bear your proportionate share of any fees and expenses charged by the underlying funds in which the Fund invests in addition to the expenses of the Fund. Actual expenses of the underlying funds are expected to vary among the various underlying funds. These expenses are not included in the example. The example includes advisory fees, administrative fees and interest expense. However, the example does not include portfolio trading commissions and related expenses and other extraordinary expenses as determined under generally accepted accounting principles. You may use the information in this line, together with the amount you invested, to estimate the expenses that you paid over the period. Simply divide your account value by $1,000 (for example, an $8,600 account value divided by $1,000 = 8.6), then multiply the result by the number in the first line under the heading entitled “Expenses Paid During Period” to estimate the expenses you paid on your account during this period.
Hypothetical Example for Comparison Purposes
The second line of the table provides information about hypothetical account values and hypothetical expenses based on the Fund’s actual expense ratio and an assumed rate of return of 5% per year before expenses, which is not the Fund's actual return. The hypothetical account values and expenses may not be used to estimate the actual ending account balance or expenses you paid for the period. You may use this information to compare the ongoing costs of investing in the Fund and other funds. To do so, compare this 5% hypothetical example with the 5%
15
ADDITIONAL INFORMATION
(unaudited) |
hypothetical examples that appear in the shareholder reports of the other funds. Please note that the expenses shown in the table are meant to highlight your ongoing costs only and do not reflect any transactional costs. Therefore, the second line of the table is useful in comparing ongoing costs only, and will not help you determine the relative total costs of owning different funds. In addition, if these transactional costs were included, your costs would have been higher.
| | | | | | | Expenses Paid |
| | | Beginning | | Ending | | During the Period* |
| | | Account Value | | Account Value | | January 1, 2011 to |
| | | January 1, 2011 | | June 30, 2011 | | June 30, 2011 |
| Actual | $ | 1,000.00 | $ | 1,061.90 | $ | 10.28 |
| |
| Hypothetical | $ | 1,000.00 | $ | 1,014.83 | $ | 10.04 |
| (5% annual return | | | | | | |
| before expenses) | | | | | | |
*Expenses are equal to the Fund’s annualized expense ratio of 2.01%, multiplied by the average account value over the period, multiplied by 181/365 to reflect the one-half year period.
Proxy Voting Guidelines
Berkshire Capital Holdings, Inc., the Fund’s Adviser, is responsible for exercising the voting rights associated with the securities held by the Fund. A description of the policies and procedures used by the Adviser in fulfilling this responsibility and a record of the Fund’s proxy votes for the most recent twelve month period ended June 30, are available without charge, upon request, by calling toll free 1-877-526-0707. They are also available on the Securities and Exchange Commission’s (“SEC”) website at http://www.sec.gov.
Quarterly Filing of Portfolio Holdings
The Fund files its complete schedule of portfolio holdings with the SEC for the first and third quarters of each fiscal year on Form N-Q. The Fund’s Forms N-Q are available on the SEC’s website at http://www.sec.gov. The Fund’s Forms N-Q may also be reviewed and copied at the SEC’s Public Reference Room in Washington, DC. Information on the operation of the Public Reference Room may be obtained by calling 1-202-551-8090 (direct) or 1-800-SEC-0330 (general SEC number).
16
The Berkshire Funds
475 Milan Drive
Suite #103
San Jose, CA 95134
(Toll-Free) 1-877-526-0707
Board of Trustees
Malcolm R. Fobes III, Chairman
Leland F. Smith
Andrew W. Broer
Investment Adviser
Berkshire Capital Holdings, Inc.
475 Milan Drive
Suite #103
San Jose, CA 95134
Counsel
Thompson Hine LLP
312 Walnut Street
14th Floor
Cincinnati, OH 45202
Independent Registered
Public Accounting Firm
Cohen Fund Audit Services, Ltd.
800 Westpoint Parkway
Suite #1100
Westlake, OH 44145
Transfer Agent
Mutual Shareholder Services, LLC
8000 Town Centre Drive
Suite #400
Broadview Heights, OH 44147
Custodian
U.S. Bank, N.A.
1555 North River Center Drive
Suite #302
Milwaukee, WI 53212
Website
www.berkshirefunds.com |
Item 2. Code of Ethics.
Not applicable for semi-annual reports.
Item 3. Audit Committee Financial Expert.
Not applicable for semi-annual reports.
Item 4. Principal Accountant Fees and Services.
Not applicable for semi-annual reports.
Item 5. Audit Committee of Listed Registrants.
Not applicable to registrants who are not listed issuers (as defined in Rule 10A-3 under the Securities Exchange Act of 1934).
Item 6. Investments.
Schedule of Investments is included as part of the report to shareholders filed under Item 1 of this Form.
Item 7. Disclosure of Proxy Voting Policies and Procedures for Closed-End Management Investment Companies.
Not applicable to open-end investment companies.
Item 8. Portfolio Managers of Closed-End Management Investment Companies.
Not applicable to open-end investment companies.
Item 9. Purchases of Equity Securities by Closed-End Management Investment Company and Affiliated Purchasers.
Not applicable to open-end investment companies.
Item 10. Submission of Matters to a Vote of Security Holders.
Not applicable.
Item 11. Controls and Procedures.
| (a) | The Registrant’s President, Treasurer and Chief Financial Officer has reviewed the Registrant's disclosure controls and procedures (as defined in Rule 30a-3(c) under the Investment Company Act of 1940 (the “Act”)) as of a date within 90 days of the filing of this |
| |
| | report, as required by Rule 30a-3(b) under the Act and Rules 13a-15(b) or 15d-15(b) under the Securities Exchange Act of 1934. Based on this review, such officer has concluded that the disclosure controls and procedures are effective in ensuring that information required to be disclosed in this report is appropriately recorded, processed, summarized and reported and made known to them by others within the Registrant and by the Registrant’s service provider. |
| |
| (b) | There were no changes in the Registrant's internal control over financial reporting (as defined in Rule 30a-3(d) under the Act) that occurred during the second fiscal quarter of the period covered by this report that have materially affected, or are reasonably likely to materially affect, the Registrant's internal control over financial reporting. |
| |
| (a) | (1) Any code of ethics or amendment thereto, that is the subject of the disclosure required by Item 2, to the extent that the registrant intends to satisfy Item 2 requirements through filing an exhibit. Not Applicable. |
| |
| | (2) | A separate certification for each principal executive and principal financial officer pursuant to Section 302 of the Sarbanes-Oxley Act of 2002. Filed herewith. |
| |
| | (3) | Any written solicitation to purchase securities under Rule 23c-1 under the Act sent or given during the period covered by the report by or on behalf of the registrant to 10 or more persons. Not applicable to open-end investment companies. |
| |
| (b) | Certifications pursuant to Section 906 of the Sarbanes-Oxley Act of 2002. Furnished herewith. |
| |
SIGNATURES
Pursuant to the requirements of the Securities Exchange Act of 1934 and the Investment Company Act of 1940, the Registrant has duly caused this report to be signed on its behalf by the undersigned, thereunto duly authorized.
| The Berkshire Funds | |
| |
| |
| By /s/ Malcolm R. Fobes III |
| Malcolm R. Fobes III | |
| President, Treasurer and Chief Financial Officer | |
| |
| |
| Date 9/7/11 |
Pursuant to the requirements of the Securities Exchange Act of 1934 and the Investment Company Act of 1940, this report has been signed below by the following person on behalf of the Registrant and in the capacities and on the date indicated.
| By /s/ Malcolm R. Fobes III |
| Malcolm R. Fobes III | |
| President, Treasurer and Chief Financial Officer | |
| |
| |
| Date 9/7/11 |